DB2 pureScale: Best Practices for Performance and Monitoring
43
© 2012 IBM Corporation DB2 for Linux, UNIX, and Windows Best Practices DB2 pureScale: Best Practices for Performance and Monitoring Steve Rees [email protected]
-
Upload
khangminh22 -
Category
Documents
-
view
0 -
download
0
Transcript of DB2 pureScale: Best Practices for Performance and Monitoring

© 2012 IBM Corporation
DB2 for Linux, UNIX, and Windows
Best Practices
DB2 pureScale: Best Practices for Performance and MonitoringSteve [email protected]

© 2012 IBM Corporation2
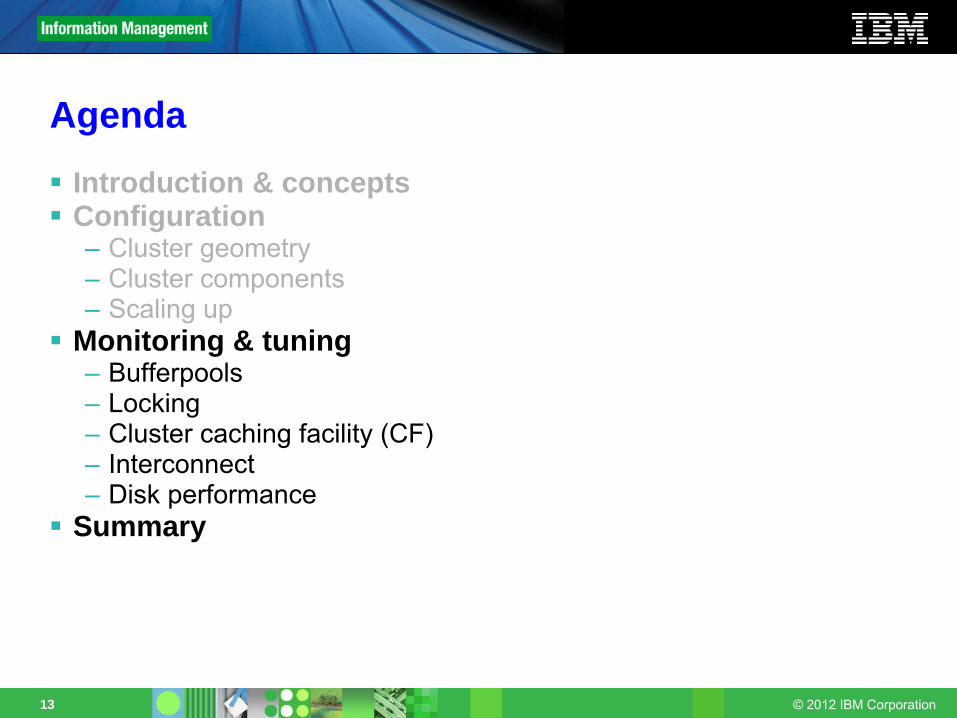
Agenda
Introduction & conceptsConfiguration–
Cluster geometry–
Cluster components–
Scaling upMonitoring & tuning–
Bufferpools–
Locking–
Cluster caching facility (CF)–
Interconnect–
Disk performanceSummary
Mbr
Database
Log
CS
2nd Log Log Log PriCS CS
Mbr
CS
Mbr
CS
Mbr
CS
© 2012 IBM Corporation3
Helpful high-level stuff to remember about pureScale
The CF is the 'hub' of the pureScale cluster–
Center of communication & coordination between members–
CF performance is a main factor in overall cluster performance–
All significant communication is between members & the CF–
Low-latency interconnect like Infiniband makes this perform!pureScale is shared data technology–
Different members share (and sometimes contend for) access to different rows on the same page
–
Hello, page locks!Inserts/Updates/Deletes drive more cluster activity than Selects–
So "read/write ratio" of SQL statements often comes up as an important workload characteristic in configuring and tuning pureScale
pureScale introduces a two-tier bufferpool at the members & CF–
Like DB2 ESE, bufferpool size(s) have a big impact on performance–
Local (member) bufferpools are similar to ESE–
Group (CF) bufferpool contains modified pages cached for all members
© 2012 IBM Corporation4
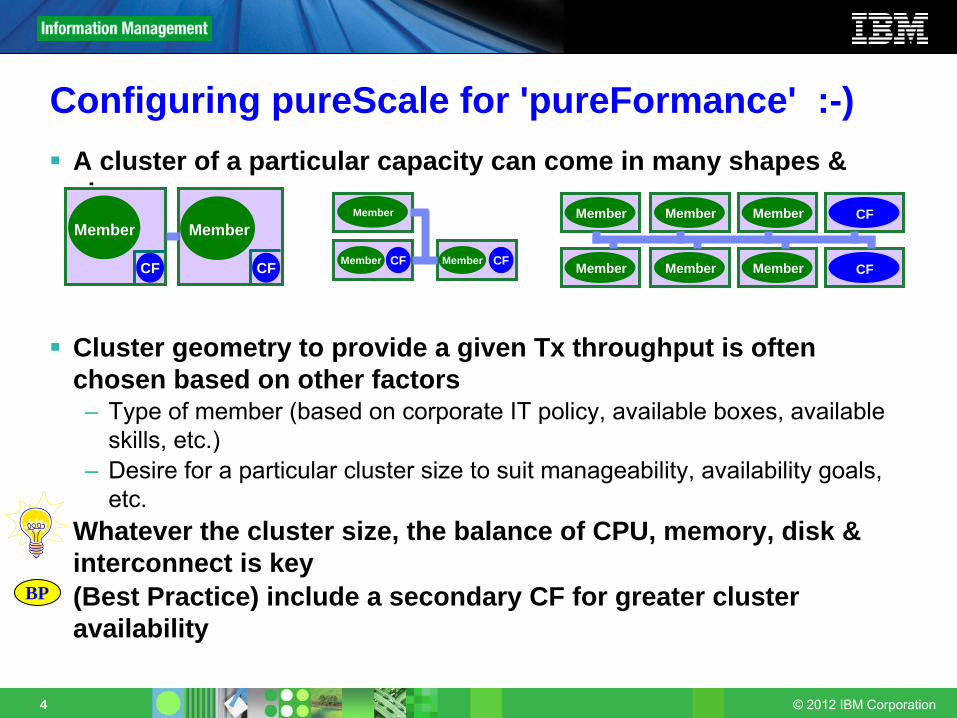
A cluster of a particular capacity can come in many shapes & sizes
Cluster geometry to provide a given Tx throughput is often chosen based on other factors–
Type of member (based on corporate IT policy, available boxes, available skills, etc.)
–
Desire for a particular cluster size to suit manageability, availability goals, etc.
Whatever the cluster size, the balance of CPU, memory, disk & interconnect is key(Best Practice) include a secondary CF for greater cluster availability
Configuring pureScale for 'pureFormance' :-)
Member MemberMember
MemberCF CF CF CF
Member Member Member
Member Member Member
CF
CF
BP
Member

© 2012 IBM Corporation5
Typically the sum of cores across all pureScale members is 6x-12x more than the CF–
6x for relatively write-heavy workloads (e.g. 2 each for the CFs, 12 total for the members)
–
12x for very read-heavy workloads (e.g. 2 each for the CFs, 24 total for the members)
NB – you don't pay to license the CF functionality, only the membersThe CF can get extremely busy!–
Responses in 10s of microseconds only possible if CF worker threads have exclusive use of their CPUsvmstat showing 100% cpu
utilization on the CF is normalWe strongly advise dedicated cores for the CF•
Shared processor LPARs
are fine for members if needed–
We advise at least one physical core for the CF•
Performance may suffer on if run on just processor logical threadsSome advantage in recovery time may be found with at least two physical CF cores, and 2 CPU threads left unused by CF processing
Collocating the CF & a member only reasonable if each
one is 'pinned' to their own cores• taskset on Linux (automatically configured during install)• rset on AIX (much better done by LPARs
though!)
How many cores does the CF need?
CF
BP
Tip
BP
Tip

© 2012 IBM Corporation6
General GBP size RoT for clusters with 3+ membersGBP size = 35-40% of (sum of Local Bufferpool (LBP) sizes across members)•
e.g. 4 member cluster, LBP size = 1M 4k pages →
CF_GBP_SZ = ~1.5M pages–
For higher read workloads (e.g. 85-95% SELECT), the required size decreases since there are fewer modified pages in the systemShould consider 25% a minimum, even for very read-heavy workloads•
What about 2 members? About 40-50%, depending on R/W ratioCF memory is dominated by the Group Bufferpool (GBP)
CF_DB_MEM_SZ (CF memory for one active database) should be about 25% bigger than CF_GBP_SZ to allow for other consumers
–
The GBP only stores modified pages, so the higher the read ratio, the less memory required by the CF
–
NB –
the GBP is always allocated in 4K pages, regardless of the bufferpool page size(s) at the members
Impact of multiple databases on CF memory discussed later
How much memory does the CF need?
Tip
BP
Tip

© 2012 IBM Corporation7
Low-latency RDMA between members and CF is key to great pureScale performanceTypical configurations use one Infiniband host channel adapter card (HCA) per CF and per member–
Can be in separate physical machines, or assigned to LPARs
by Hypervisor on AIX
The CF HCA handles the combined message traffic from all members
The CF supports multiple HCAs
for added capacity / redundancy–
In very round figures: 1 CF HCA supports up to about 6-8 CF cores, depending on the workload
–
Note –
using both ports on one HCA hasn't shown much performance benefit in the lab
Can an HCA be shared between member & CF partitions residing on one machine?
Yes –
but be wary of overloading the HCA (see the section on monitoring)–
Very roughly: # of CF cores + (# of local member cores / 4) should be less than 8
What about the cluster interconnect?

© 2012 IBM Corporation8
0102030405060708090
100110
% o
f RoC
E av
erag
e TP
S
tps
Normalized Average Throughput (Linux)
RoCEQDR IB
Infiniband vs. Ethernet?pureScale supports Infiniband and RoCE EthernetRoCE on AIX new in DB2 10For raw bandwidth, current IB beats current RoCE hands down
… but for pureScale, small message response time is more important
Even so, in-cluster performance of the two is fairly similar –
Throughput with RoCE
in our tests is generally within 5-15% of Infiniband
(your mileage may vary)
AdapterAdapter BandwidthBandwidthMellanox QDR Infiniband 40 Gb/sIBM DDR Infiniband 20 Gb/sMellanox RoCE Ethernet 10 Gb/s
0
25
50
75
100
% o
f RoC
EM
essa
ge
resp
tim
e
Read Write Lock
Normalized Median CF Message Response time
RoCEQDR IB
Lower is better
Higher is better

© 2012 IBM Corporation9
Like EE, pureScale needs adequate IO bandwidth to keep response times low when the system is under heavy load–
pureScale members may need to flush their logs more often than EE, so log performance is importantSolid-state disks (SSDs) can be very useful in minimizing IO times•
A relatively small SSD investment can make a big difference in a
log-bound system where the storage write cache can't keep up
•
Also makes a huge difference in random tablespace read timesOptimal member recovery times require the SAN to support SCSI-3 Persistent Reserve–
Quickly isolates shared storage from failing member so recovery can begin–
E.g. IBM V7000, DS3000, DS5000, DS8000, etc.GPFS configuration
We recommend separate filesystems for logs & tablespaces–
db2cluster command automatically performs core GPFS tuning at install•
Enabling Direct IO, setting 1 MB block size
What about disk storage?
Tip
BP
© 2012 IBM Corporation10
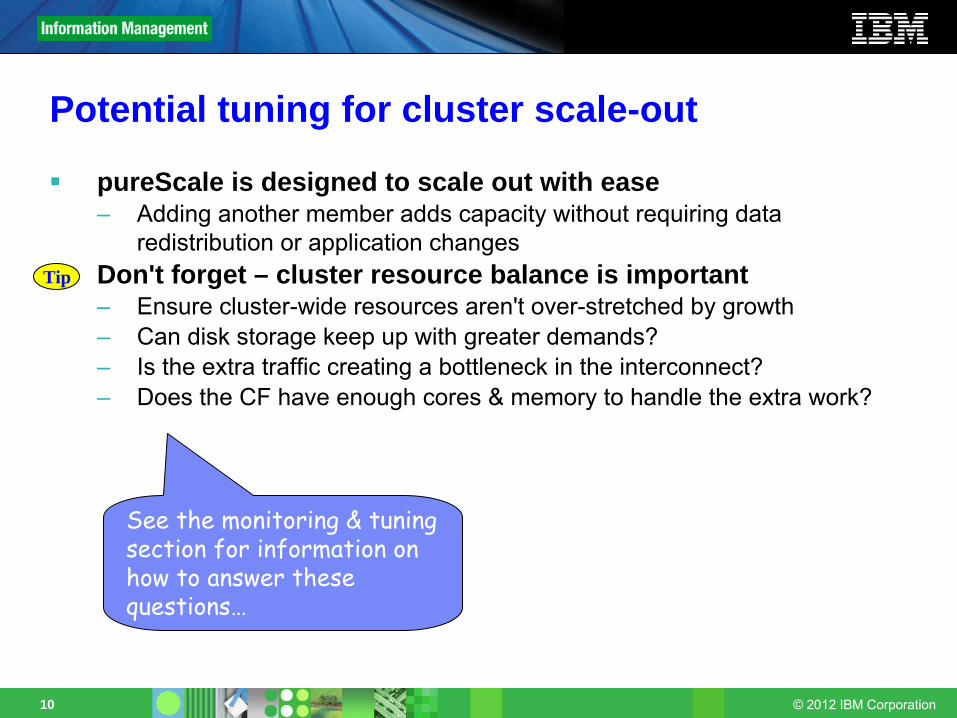
Potential tuning for cluster scale-out
pureScale is designed to scale out with ease–
Adding another member adds capacity without requiring data redistribution or application changes
Don't forget – cluster resource balance is important–
Ensure cluster-wide resources aren't over-stretched by growth–
Can disk storage keep up with greater demands?–
Is the extra traffic creating a bottleneck in the interconnect?–
Does the CF have enough cores & memory to handle the extra work?
See the monitoring & tuning section for information on how to answer these questions…
Tip

© 2012 IBM Corporation11
Sizing up the initial DB2 configuration Larger extent sizes tend to perform better than small ones–
Some operations require CF communication & other processing each
time a new extent is created
–
Larger extents mean fewer CF messages–
Default of 32-page extent size usually works well
Smaller DB2 page sizes tend to perform better than large ones–
Typical pureScale workloads drive random rather than sequential access–
Smaller pages mean•
Less data flow between member and CF, member and disk, etc.–
Use the smallest page size that accommodates the rows you'll keep there•
Smaller 'footprint' in both the local and group bufferpools
SEQUENCEs and IDENTITY columns should use a large cache and avoid the ORDER keyword–
Obtaining new batches of numbers requires CF communication and a
log flush in pureScale
–
Larger cache size (100 or more –
best to tune) means fewer refills & better performance
BP
BP
BP

© 2012 IBM Corporation12
Sizing up the initial DB2 configuration
pureScale can have a greater LOCKLIST requirement than EE–
LOCKLIST may fill more quickly in pureScale during long transactions due to physical locks, resulting in SQL0912N rc
1–
Lock escalation and/or LOCKSIZE TABLE can reduce row lock requirements and reduce overall lock list consumptionIn more extreme cases, setting LOCKLIST to 6% or more of LBP size should provide sufficient space for physical locks
pureScale in DB2 10 supports range partitioned tables–
Natural fit for inflow / processing / outflow of data in 'chunks' of time –
weeks, months, years
–
Also useful for breaking up data over key ranges in heavy concurrent insert cases
Multiple table partitions with local indexes tend to experience less contention & may achieve better performance. Also check out CURRENT MEMBER, below.
Tip
Tip
© 2012 IBM Corporation13
Agenda
Introduction & conceptsConfiguration–
Cluster geometry–
Cluster components–
Scaling upMonitoring & tuning–
Bufferpools–
Locking–
Cluster caching facility (CF)–
Interconnect–
Disk performanceSummary

© 2012 IBM Corporation14
A primer on two-level page buffering in pureScale•
The local bufferpool (LBP) at each member caches both read-only and updated pages for that member
•
The shared group bufferpool (GBP) at the CF contains references to every page in all LBPs
across the cluster–
References ensure consistency across members –
who’s interested in which pages, in case the pages are updated
•
The GBP also contains copies of all updated pages from the LBPs–
Sent from the member at transaction commit time, etc.–
Stored in the GBP & available to other members on demand–
Saves going to disk!–
30 µs page read request over Infiniband from the GBP can be more than 100x faster than reading from disk
•
Statistics are kept for tuning–
Found in LBP vs. found in GBP vs. read from disk–
Useful in tuning GBP / LBP sizes
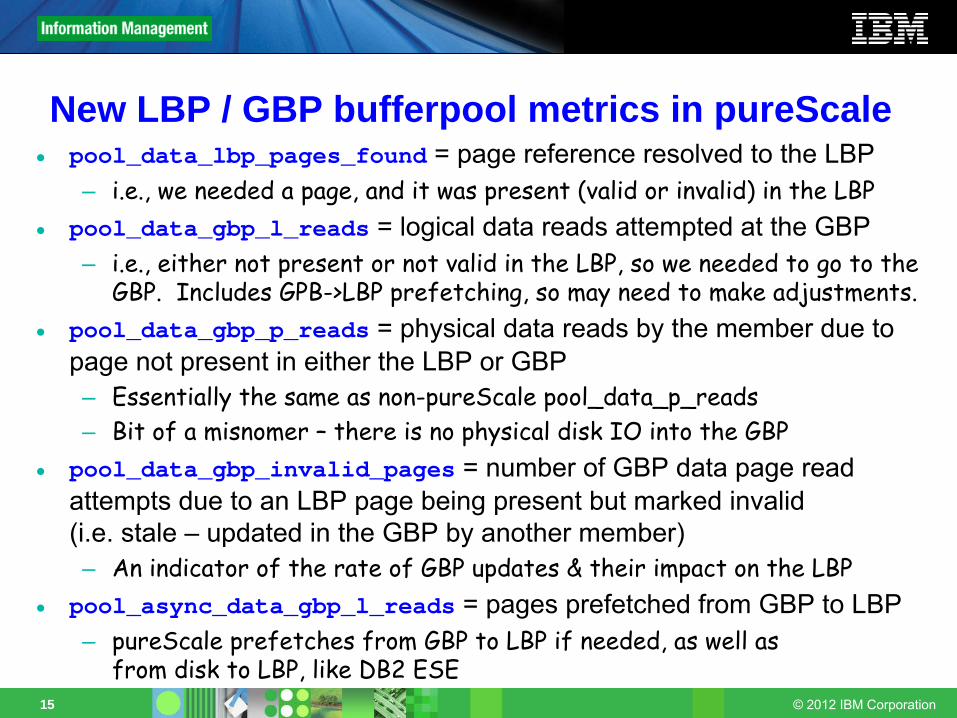
© 2012 IBM Corporation15
New LBP / GBP bufferpool metrics in pureScale• pool_data_lbp_pages_found = page reference resolved to the LBP
–
i.e., we needed a page, and it was present (valid or invalid) in
the LBP• pool_data_gbp_l_reads = logical data reads attempted at the GBP
–
i.e., either not present or not valid in the LBP, so we needed to go to the GBP. Includes GPB->LBP prefetching, so may need to make adjustments.
• pool_data_gbp_p_reads = physical data reads by the member due to page not present in either the LBP or GBP–
Essentially the same as non-pureScale pool_data_p_reads–
Bit of a misnomer –
there is no physical disk IO into the GBP• pool_data_gbp_invalid_pages = number of GBP data page read
attempts due to an LBP page being present but marked invalid (i.e. stale –
updated in the GBP by another member)–
An indicator of the rate of GBP updates & their impact on the LBP• pool_async_data_gbp_l_reads = pages prefetched
from GBP to LBP–
pureScale prefetches
from GBP to LBP if needed, as well as from disk to LBP, like DB2 ESE

© 2012 IBM Corporation16
Accounting for pureScale bufferpool operations
CF
Member
X
CF
Member
GBP GBP
LBP LBP
CF
Member
GBP
LBP
CF
Member
GBP
LBP
Pool_data_l_reads
Pool_data_lbp_pages_found
Pool_data_gbp_l_reads
Pool_data_gbp_invalid_pages
Pool_data_gbp_p_reads
Pool_data_p_reads
Agent Agent Agent Agent
+1
+1
+1
+1
+1
+1
+1
+1
+1
+1
+1
+1
Found in Found in LBPLBP
Invalid in Invalid in LBP, found LBP, found
in GBPin GBP
Not in LBP, Not in LBP, found in found in
GBPGBP
Not in LBP or GBP,Not in LBP or GBP, found on diskfound on disk
Page FoundWhere?
Metricsaffected

© 2012 IBM Corporation17
pureScale bufferpool monitoring•
Overall (and non-pureScale) hit ratio
–
Great values: 95% for index, 90% for data–
Good values: 80-90% for index, 75-85% for data
•
LBP hit ratio
Generally lower than the overall hit ratio, since it excludes GBP hits• Note that invalid pages are still counted as a 'hit'
• If invalids were a 'miss' –
we might be tempted to increase LBP to compensate… but a larger LBP won't decrease the number of invalidated pages!
(pool_data_l_reads – (pool_data_p_reads – pool_async_data_reads)) / pool_data_l_reads
(pool_data_lbp_pages_found - pool_async_data_lbp_pages_found) / pool_data_l_reads * 100%

© 2012 IBM Corporation18
•
GBP hit ratio
–
A hit here is a read of a previously modified page, so hit ratios are typically quite low
•
An overall (LBP+GBP) H/R in the high 90's can correspond to a GBP H/R in the low 80's
Decreases with greater portion of read activity•
Why? Less dependency on the GBP
pureScale bufferpool monitoring
(pool_data_gbp_l_reads – pool_data_gbp_p_reads) / pool_data_gbp_l_reads

© 2012 IBM Corporation19
pureScale bufferpool monitoring
•
"Group bufferpool full" conditions
• Occur when there are no free locations in the GBP to host incoming pages from the members
• Causes a 'stall' condition where dirty pages are written synchronously to create more space
• Not generally member specific, so we SUM() across all to get a cluster-wide averageSimilar to "dirty steal" in DB2 ESE …
10000.0 * sum(mggb.num_gbp_full) / sum(commit_sql_stmts) from table(mon_get_group_bufferpool(-2)) as mggb, sysibmadm.snapdb
New in DB2 10

© 2012 IBM Corporation20
pureScale bufferpool tuning
Step 1: monitor the overall BP hit ratio as usual• Meets your goals? If yes, then done!
Step 2: check LBP hit ratio • Great values: 90% for index, 85% for data• Good values: 70-80% for index, 65-80% for data• Increasing LBP size can help increase LBP hit ratio
•
But -
for each 8 extra LBP pages, the GBP needs 1 extra page for registrations
•
Without appropriate GBP increase, big LBP increases can hurt GBP
hit ratio
ReadsLogical) Found Pages LBPAsync Found PagesLBP( −
ReadsLogical) Reads PhysicalsSynchronou ReadsLogical( −

© 2012 IBM Corporation21
Step 3: check GBP hit ratio• Great values: 90% for index, 80% for data• Good values: 65-80% for index, 60-75% for data• Is
pool_data_l_reads > 10 x pool_data_gbp_l_reads?•
This indicates low GBP dependence, and may mean tuning GBP size in this case is less valuable
• Is
pool_data_gbp_invalid_pages > 25% of pool_data_gbp_l_reads ?
•
This means the GBP is really helping out, and could benefit from extra pages
i.e. less than 10% of page reads go to GBP?
i.e. more than 25% of GBP reads are due to invalidated LBP pages
pureScale bufferpool tuning
ReadsLogical GBP Reads) PhysicalGBP Reads LogicalGBP( −
© 2012 IBM Corporation22
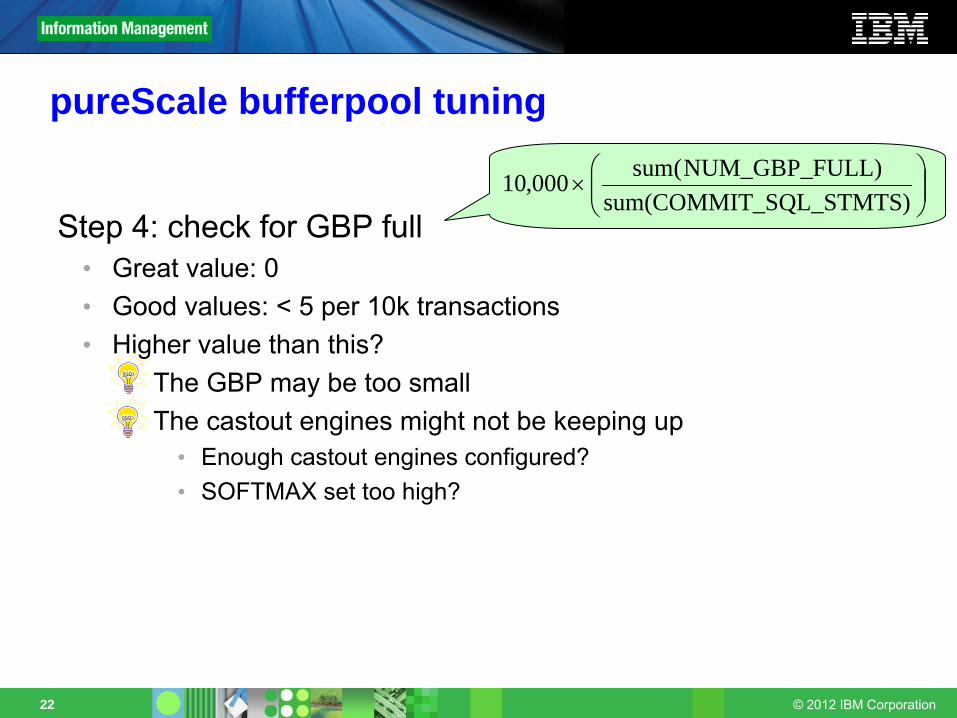
Step 4: check for GBP full• Great value: 0• Good values: < 5 per 10k transactions• Higher value than this?
The GBP may be too smallThe castout engines might not be keeping up
• Enough castout engines configured?• SOFTMAX set too high?
pureScale bufferpool tuning
⎟⎟⎠
⎞⎜⎜⎝
⎛×
)_SQL_STMTSsum(COMMITLL)NUM_GBP_FU(sum000,10

© 2012 IBM Corporation23
•
Or, Psst! Hey buddy, can you pass me that page?• pureScale page locks are physical locks, indicating which member
currently ‘owns’
the page. Picture the following:•
Member A : acquires a page P and modifies a row on it, and continues with its transaction. ‘A’
holds an exclusive page lock on page P until ‘A’
commits
•
Member B : wants to modify a different row on the same page P. What now?
• ‘B’ doesn’t have to wait until ‘A’ commits & frees the page lock•
The CF will negotiate the page back from ‘A’
in the middle of ‘A’s transaction, on ‘B’s behalf
•
Provides far better concurrency & performance than needing to wait for a page lock until the holder commits.
Log P P
pureScale page negotiation (or 'reclaims')
P P
Member AMember B
LogP ?P !
CF
GLM
Px : A: B

© 2012 IBM Corporation24
Monitoring page reclaims
Page reclaims help eliminate page lock waits, but they're not cheapExcessive reclaims can cause contention –
low CPU usage, reduced throughput, etc.
mon_get_page_access_info gives very useful reclaim stats
Schema name
Is 12,641 excessive? Maybe –
it depends how long these accumulated. RoT: more than 1 reclaim per 10 Tx
is worth looking into
© 2012 IBM Corporation25
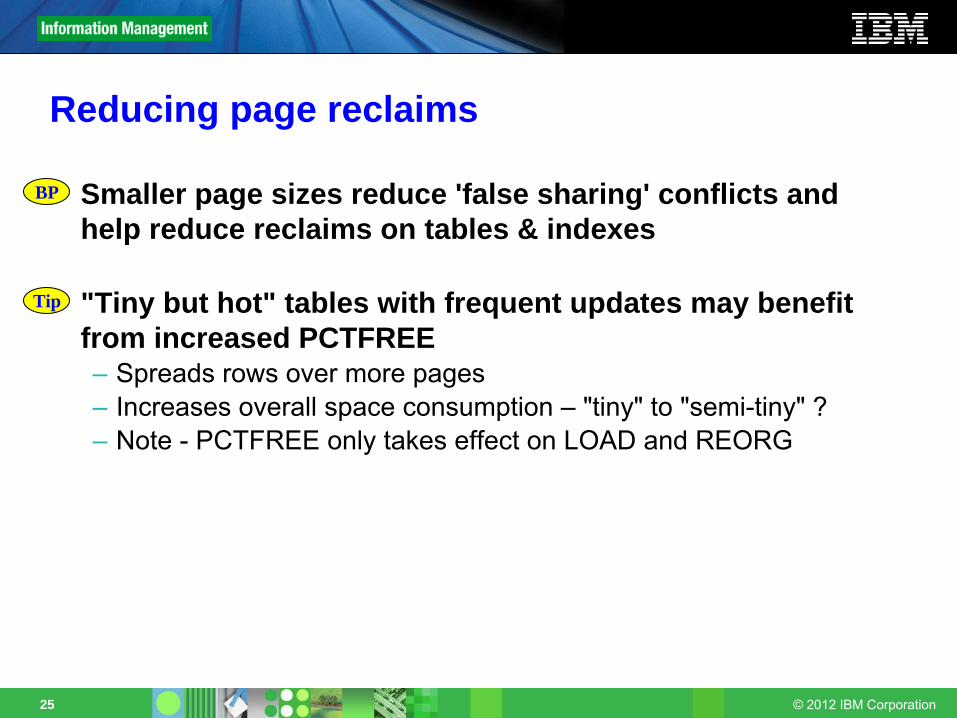
Reducing page reclaims
Smaller page sizes reduce 'false sharing' conflicts and help reduce reclaims on tables & indexes
"Tiny but hot" tables with frequent updates may benefit from increased PCTFREE–
Spreads rows over more pages–
Increases overall space consumption –
"tiny" to "semi-tiny" ?–
Note -
PCTFREE only takes effect on LOAD and REORG
Tip
BP

© 2012 IBM Corporation26
CURRENT MEMBER default column reduces contention
Case 1: frequent inserts of increasing numeric values, timestamps, etc.–
This can cause a 'hot spot' at the high end of the index, as the
page getting all the new keys gets reclaimed between members
–
We can add a hidden CURRENT MEMBER leading column to separate ranges of keys –
so each member tends to insert into a different page
Case 2: low-cardinality indexes – e.g. GENDER, STATE, etc.–
Here, the 'hot spots' are the (relatively few) unique keys where
new RIDs
are added
–
We can transparently increase the cardinality (and separate new key values by member) by adding a trailing CURRENT MEMBER column to the index
alter table orders add column curmem smallintdefault current member implicitly hidden;
create index seqindex on ordernumber (curmem, seqnumber);
New in DB2 10
alter table customer add column curmem smallintdefault current member implicitly hidden;
create index stateidx on customer (state, curmem);
Note: DB2 10 Jump Scan makes this unconventional index work…
© 2012 IBM Corporation27
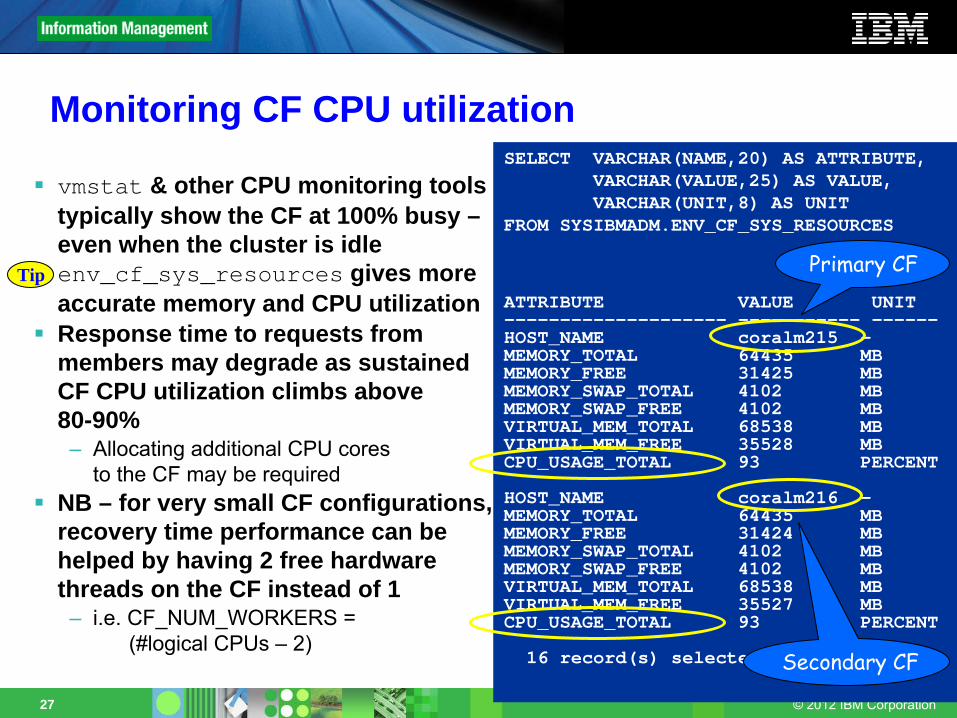
vmstat & other CPU monitoring toolstypically show the CF at 100% busy –even when the cluster is idleenv_cf_sys_resources gives more accurate memory and CPU utilizationResponse time to requests from members may degrade as sustained CF CPU utilization climbs above 80-90%
–
Allocating additional CPU cores
to the CF may be required
NB – for very small CF configurations,recovery time performance can be helped by having 2 free hardwarethreads on the CF instead of 1
–
i.e. CF_NUM_WORKERS = (#logical CPUs –
2)
Monitoring CF CPU utilizationSELECT VARCHAR(NAME,20) AS ATTRIBUTE,
VARCHAR(VALUE,25) AS VALUE, VARCHAR(UNIT,8) AS UNIT
FROM SYSIBMADM.ENV_CF_SYS_RESOURCES
ATTRIBUTE VALUE UNIT-------------------- ----------- ------HOST_NAME coralm215 -MEMORY_TOTAL 64435 MBMEMORY_FREE 31425 MBMEMORY_SWAP_TOTAL 4102 MBMEMORY_SWAP_FREE 4102 MBVIRTUAL_MEM_TOTAL 68538 MBVIRTUAL_MEM_FREE 35528 MBCPU_USAGE_TOTAL 93 PERCENT
HOST_NAME coralm216 -MEMORY_TOTAL 64435 MBMEMORY_FREE 31424 MBMEMORY_SWAP_TOTAL 4102 MBMEMORY_SWAP_FREE 4102 MBVIRTUAL_MEM_TOTAL 68538 MBVIRTUAL_MEM_FREE 35527 MBCPU_USAGE_TOTAL 93 PERCENT
16 record(s) selected.
Primary CF
Secondary CF
Tip

© 2012 IBM Corporation28
AUTOMATIC CF memory: simple case – 1 active database
Total CF memory allocation is controlled by DBM config parameter CF_MEM_SZDefault AUTOMATIC settings provide reasonable initial calculations (but no self tuning)–
CF_MEM_SZ set to 70-90% of physical memory–
CF_DB_MEM_SZ defaults to CF_MEM_SZ (for single DB)
–
CF_SCA_SZ = 5-20% of CF_DB_MEM_SZ•
Metadata space for table control blocks, etc.–
CF_LOCK_SZ = 15% of CF_DB_MEM_SZ–
CF_GBP_SZ = remainder of CF_DB_MEM_SZ
CF_MEM_SZ (Instance)CF_DB_MEM_SZ (DB 1)
CF_GBP_SZ
CF_SCA_SZ
CF_LOCK_SZ

© 2012 IBM Corporation29
AUTOMATIC CF memory & multiple active databases
Important: when using multiple databases and AUTOMATIC CF memory parameters, set the registry variable DB2_DATABASE_CF_MEMORY–
Ensures first database to activate doesn't consume all CF memory
If set to -1–
cf_db_mem_sz
= cf_mem_sz
/ numdbIf set to a percentage P (e.g. 33)–
cf_db_mem_sz
= (P/100)
* cf_mem_szDefaults support a single active DB–
DB2_DATABASE_CF_MEMORY = 100–
NUMDB = 32
CF_MEM_SZ (Instance)
CF_DB_MEM_SZ (DB 2)
CF_GBP_SZ
CF_LOCK_SZCF_SCA_SZ
Tip
CF_DB_MEM_SZ (DB 3)
CF_GBP_SZ
CF_LOCK_SZCF_SCA_SZ
CF_DB_MEM_SZ (DB 1)
CF_GBP_SZ
CF_LOCK_SZCF_SCA_SZ

© 2012 IBM Corporation30
Infiniband is not infinite…Typical ratio is 1 CF HCA per 6-8 CF coresMain symptoms of interconnect bottleneck–
Poor cluster throughput with CPU capacity remaining on CF–
High CF response time–
Increased member CPU timeHow to measure CF response time?–
CF_WAITS –
approximately the number of CF calls (mostly dependent on the workload rather than the tuning)
–
CF_WAIT_TIME –
time accumulated when communicating with the CF •
note –
CF_WAIT_TIME does NOT include reclaim time or lock wait time–
RECLAIM_WAIT_TIME –
time spent waiting on reclaimsThese metrics are available at the statement level in mon_get_pkg_cache_stmt, or at the agent level in mon_get_workload, etc. (more useful for overall tuning)
Detecting an interconnect bottleneck
Tip
© 2012 IBM Corporation31
TRECV
TCMD
TSEND
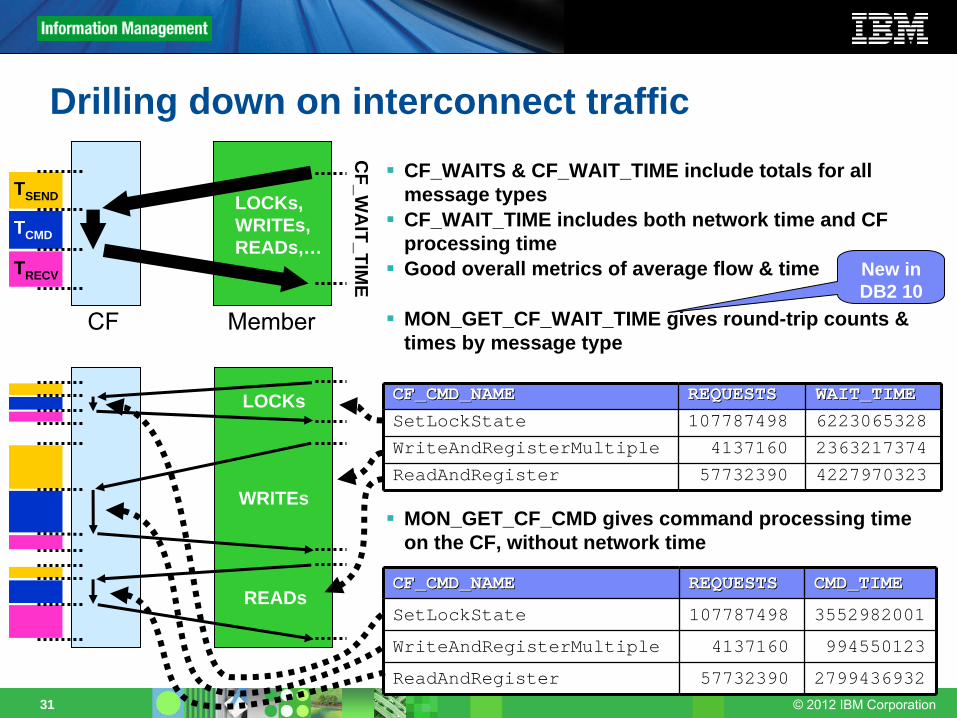
CF_WAITS & CF_WAIT_TIME include totals for all message typesCF_WAIT_TIME includes both network time and CF processing timeGood overall metrics of average flow & time
MON_GET_CF_WAIT_TIME gives round-trip counts & times by message type
MON_GET_CF_CMD gives command processing time on the CF, without network time
MemberCF
CF_W
AIT_TIM
E
LOCKs,WRITEs,READs,…
LOCKs
WRITEs
READs
CF_CMD_NAMECF_CMD_NAME REQUESTSREQUESTS WAIT_TIMEWAIT_TIMESetLockState 107787498 6223065328WriteAndRegisterMultiple 4137160 2363217374ReadAndRegister 57732390 4227970323
CF_CMD_NAMECF_CMD_NAME REQUESTSREQUESTS CMD_TIMECMD_TIME
SetLockState 107787498 3552982001WriteAndRegisterMultiple 4137160 994550123ReadAndRegister 57732390 2799436932
New in DB2 10
Drilling down on interconnect traffic
© 2012 IBM Corporation32
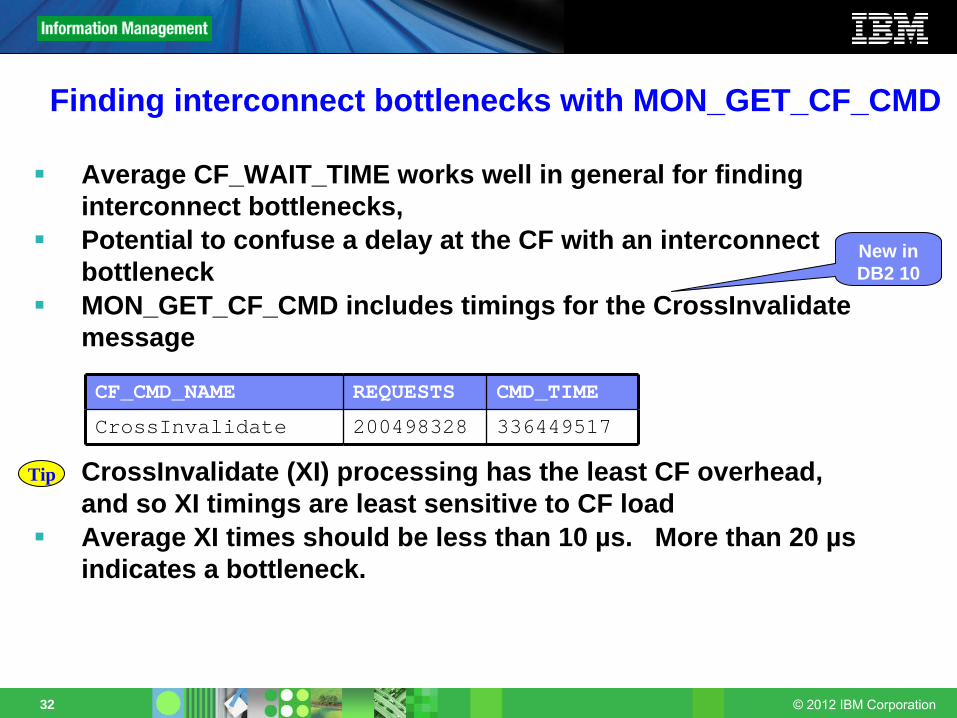
Finding interconnect bottlenecks with MON_GET_CF_CMD
Average CF_WAIT_TIME works well in general for finding interconnect bottlenecks, Potential to confuse a delay at the CF with an interconnect bottleneckMON_GET_CF_CMD includes timings for the CrossInvalidatemessage
CrossInvalidate (XI) processing has the least CF overhead, and so XI timings are least sensitive to CF loadAverage XI times should be less than 10 µs. More than 20 µs indicates a bottleneck.
CF_CMD_NAME REQUESTS CMD_TIME
CrossInvalidate 200498328 336449517
Tip
New in DB2 10

© 2012 IBM Corporation33
Situation: very busy pureScale cluster running SAP workloadCF with two Infiniband HCAsCF_WAIT_TIME / CF_WAITS gives us a rough idea of average interconnect network time per CF call–
Important –
this is an average over all CF callsBest way to judge good or bad numbers –
look for a change from what's normal for your system
Average per call CF_WAIT_TIME with 2 CF HCAs – 630 µs–
This is very high –
even a very busy system should be less than 200 µs –
CF CPU utilization about 75% -
high, but not so high to cause this major slowdown
–
RECLAIM_WAIT_TIME very high as well
Interconnect bottleneck example
Tip

© 2012 IBM Corporation34
And good things happened!
Large & widespread benefit indicates how much of a bottleneck the interconnect was–
Individual activities improved–
Reclaim wait time improved almost 10x!
CF sec
CF pri
Add another CF HCA
MetricMetric 2 CF 2 CF HCAsHCAs 3 CF 3 CF HCAsHCAs
Average CF_WAIT_TIME 630 µs 145 µsActivity time of key INSERT statement 15.6 ms 4.2 msActivity wait time of key INSERT 8 ms 1.5 ms
Mbr
1Mbr
3Mbr
2Mbr
4CF sec
CF pri
Mbr
1Mbr
3Mbr
2Mbr
4

© 2012 IBM Corporation35
Bad news – netstat does not provide useful information on IB throughputGood news – there are other ways of finding out how busy the IB network is
perfquery on Linux reports flow of packets & data (32bit words)•
Primarily interested in packets per second
•
perfquery –r; sleep 10; perfquery resets, and collects the count after only 10s to avoid the count overflowing
•
300-400,000 packets/s in-
or out-bound is a good upper limit for these
For AIX or Linux, you can also get packet counts directly from the IB switch management port• ismportcounters on QLogic• show fabric pm on Mellanox•
Need to know which IB port is connected to the CF…•
NB –
packet counts on QLogic
appear higher than on Mellanox
for same amount of pureScale work
–
~ 1.4M packets/s in or output as useful limit
Low-level interconnect diagnostics
# Port counters: Lid 19 port 1:XmtData:..................1230543RcvData:..................3879575XmtPkts:..................20055RcvPkts:..................23721
Tip
Tip
© 2012 IBM Corporation36
pureScale disk IO
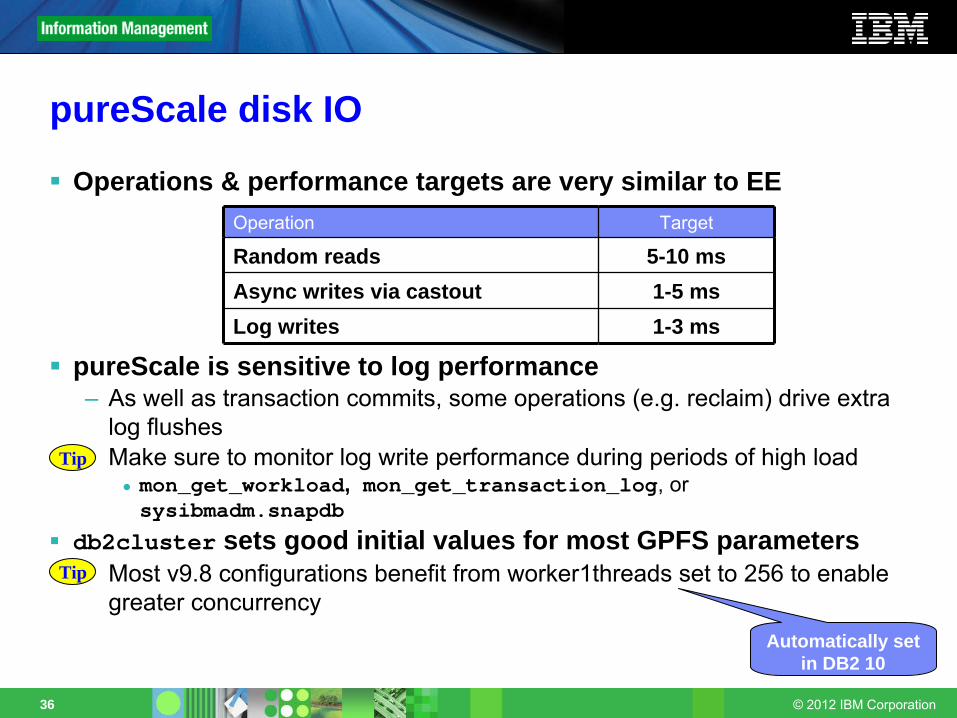
Operations & performance targets are very similar to EE
pureScale is sensitive to log performance–
As well as transaction commits, some operations (e.g. reclaim) drive extra log flushesMake sure to monitor log write performance during periods of high load
• mon_get_workload, mon_get_transaction_log, or sysibmadm.snapdb
db2cluster sets good initial values for most GPFS parametersMost v9.8 configurations benefit from worker1threads set to 256 to enable greater concurrency
Operation Target
Random reads 5-10 msAsync writes via castout 1-5 msLog writes 1-3 ms
Tip
Tip
Automatically set in DB2 10
© 2012 IBM Corporation37
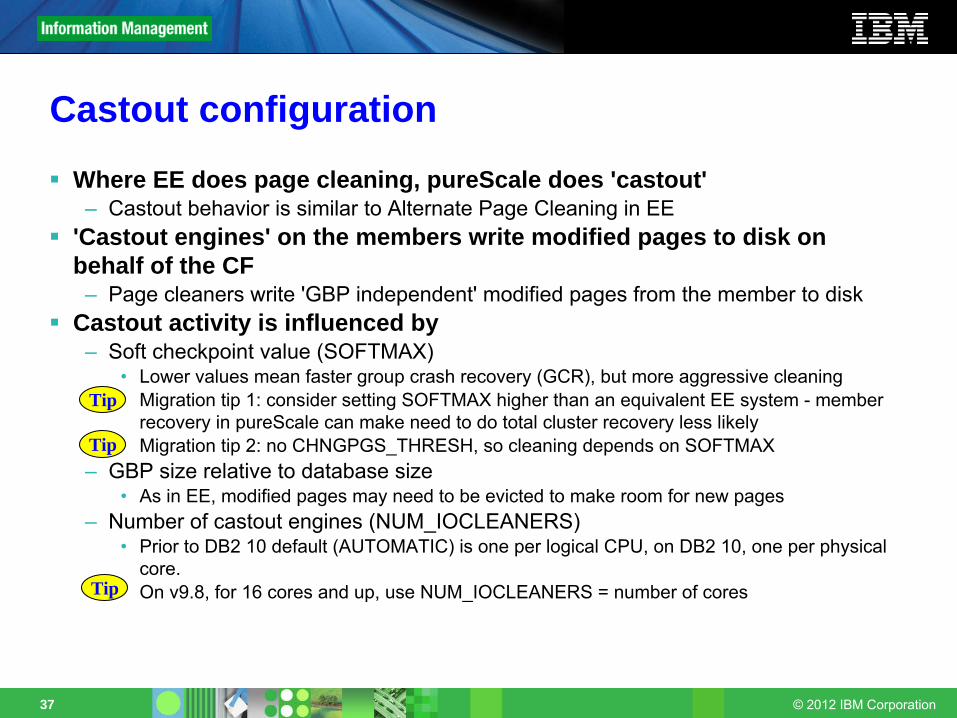
Castout configuration
Where EE does page cleaning, pureScale does 'castout'–
Castout behavior is similar to Alternate Page Cleaning in EE'Castout engines' on the members write modified pages to disk onbehalf of the CF
–
Page cleaners write 'GBP independent' modified pages from the member to diskCastout activity is influenced by
–
Soft checkpoint value (SOFTMAX)•
Lower values mean faster group crash recovery (GCR), but more aggressive cleaningMigration tip 1: consider setting SOFTMAX higher than an equivalent EE system -
member recovery in pureScale can make need to do total cluster recovery
less likelyMigration tip 2: no CHNGPGS_THRESH, so cleaning depends on SOFTMAX
–
GBP size relative to database size•
As in EE, modified pages may need to be evicted to make room for
new pages–
Number of castout engines (NUM_IOCLEANERS)•
Prior to DB2 10 default (AUTOMATIC) is one per logical CPU, on DB2 10, one per physical core.On v9.8, for 16 cores and up, use NUM_IOCLEANERS = number of cores
Tip
Tip
Tip

© 2012 IBM Corporation38
Castout monitoringEasy! The basics are unchanged from monitoring EE page cleaningCalculate writes per transaction and time per write from metrics in snapshot (old!) or new table functions (e.g. mon_get_bufferpool)
Also monitor write times from the O/S level via iostat & nmon'bursty' write activity may be a sign of SOFTMAX being too high
•
Looking for 'smooth' level of writes, matching overall system activity–
Accompanied by long write times (> 10ms or so) the IO subsystem
may not be able to keep up.
selectcurrent timestamp as "Time",case when sum(w.TOTAL_APP_COMMITS) < 100 then null else
cast( float(sum(b.POOL_DATA_WRITES+b.POOL_INDEX_WRITES))/ sum(w.TOTAL_APP_COMMITS) as decimal(6,1)) end
as "BP wrt / UOW",case when sum(b.POOL_DATA_WRITES+b.POOL_INDEX_WRITES) < 1000 then null else
cast( float(sum(b.POOL_WRITE_TIME))/ sum(b.POOL_DATA_WRITES+b.POOL_INDEX_WRITES) as decimal(5,1)) end
as "ms / BP wrt"from table(mon_get_workload(null,null)) as w,
table(mon_get_bufferpool(null,null)) as b;
Tip

© 2012 IBM Corporation39
Optim Performance Manager and DB2 pureScale Monitoring
OPM 4.1.1 introduced global monitoring for DB2 pureScale–
Per-member and cluster-wide monitoring–
CF CPU and memory utilization–
Group Bufferpool (GBP) Hit Ratio at the database level–
Cluster Caching Facility (CF) lock timeouts, lock escalations, and transaction lock wait time per database
OPM 5.1 adds further pureScale metrics–
GBP Hit Ratio per connection, statement, buffer pool, or table space–
CF requests/time on connection or statement level–
Global Lock Manager information–
Page reclaim rate & time–
CF configuration parameters in database and database manager reports
New for DB2 10 in OPM 5.1.1–
Average cross invalidation (XI) time –
Number of XI requests–
Performance alerts on GBP hit ratio, page reclaim rate, CF

© 2012 IBM Corporation40
SummaryMany of the performance principles on pureScale are very similar to those on EE
configuration parameters–
Same or similar
monitoring techniquesdesired or problematic metric ranges
Keeping the key architectural differences in mind helps simplify the differences in performance practice–
CF providing the hub of cooperation & consistency between members
–
Very low latency communication over RDMA between members and CF
–
Two-layer bufferpool with GBP caching modified pages–
Page locks & lock negotiation (reclaim) between members

© 2012 IBM Corporation41
Summary cont'dStart with EE-based monitoring & tuning techniques–
Core monitoring tools & techniques apply directly to pureScale–
Exploit AUTOMATIC in most cases, and tune from there–
BP tuning based on hit ratio and IO time•
LBP basics, then GBP–
IO tuning based on minimizing IO bottlenecks in logging and BP read/write times
Progress to key pureScale areas–
CF resource allocation–
CF response time & CPU / interconnect saturation–
Page negotiation (reclaim) frequency and impact
DB2 10 brings great performance and monitoring improvements–
CURRENT MEMBER–
More monitoring information–
Jump Scan and other core DB2 engine improvements–
Broader support in Optim
Performance Manager 5.1.1
© 2012 IBM Corporation
DB2 for Linux, UNIX, and Windows Best Practices ���®
Discover more DB2 best practices at:
http://www.ibm.com/developerworks/data/bestpractices/db2luw/
© 2012 IBM Corporation
DB2 for Linux, UNIX, and Windows Best Practices ���®
THE INFORMATION CONTAINED IN THIS DOCUMENT HAS NOT BEEN SUBMITTED TO ANY FORMAL IBM TEST AND IS DISTRIBUTED AS IS. THE USE OF THIS INFORMATION OR THE IMPLEMENTATION OF ANY OF THESE TECHNIQUES IS A CUSTOMER RESPONSIBILITY AND DEPENDS ON THE CUSTOMER’S ABILITY TO EVALUATE AND INTEGRATE THEM INTO THE CUSTOMER’S OPERATIONAL ENVIRONMENT. WHILE IBM MAY HAVE REVIEWED EACH ITEM FOR ACCURACY IN A SPECIFIC SITUATION, THERE IS NO GUARANTEE THAT THE SAME OR SIMILAR RESULTS WILL BE OBTAINED ELSEWHERE. ANYONE ATTEMPTING TO ADAPT THESE TECHNIQUES TO THEIR OWN ENVIRONMENTS DO SO AT THEIR OWN RISK. ANY PERFORMANCE DATA CONTAINED IN THIS DOCUMENT WERE DETERMINED IN VARIOUS CONTROLLED LABORATORY ENVIRONMENTS AND ARE FOR REFERENCE PURPOSES ONLY. CUSTOMERS SHOULD NOT ADAPT THESE PERFORMANCE NUMBERS TO THEIR OWN ENVIRONMENTS AS SYSTEM PERFORMANCE STANDARDS. THE RESULTS THAT MAY BE OBTAINED IN OTHER OPERATING ENVIRONMENTS MAY VARY SIGNIFICANTLY. USERS OF THIS DOCUMENT SHOULD VERIFY THE APPLICABLE DATA FOR THEIR SPECIFIC ENVIRONMENT.
TrademarksIBM, the IBM logo, and ibm.com
are trademarks or registered trademarks of International Business Machines Corp., registered in many jurisdictions worldwide. Other product and service names
might be trademarks of IBM or other companies. A current list of IBM trademarks is available on the Web at “Copyright and trademark information”
at www.ibm.com/legal/copytrade.shtml
Disclaimer/Trademarks