
Best Business Practices in Energy Efficiency
14
solutions + + + + From Shop Floor to Top Floor: Best Business Practices by William R. Prindle ICF I NTERNATIONAL in Energy Efficiency
-
Upload
khangminh22 -
Category
Documents
-
view
1 -
download
0
Transcript of Best Business Practices in Energy Efficiency
solutions+
+
+
+
From Shop Floor to Top Floor:
Best Business Practices
by
William R. PrindleICF In t ernat I onal
in Energy Efficiency

+
+
+ Pew Center on Global Climate Change
72
Energy Efficiency Strategy Overview
Energy is a small cost for most companies—the 48 respondents to the survey conducted for this project
(see Appendix A in main report for details) reported energy costs averaging less than 5 percent of revenues. For Dow
Chemical, nothing about energy has ever been small. About half of every dollar the company spends goes toward
energy, mostly in the form of natural gas and natural gas liquids, which are the energy feedstock for the company. Not
all of that energy is used to power Dow’s operations; in fact, two-thirds of the energy molecules Dow buys are used as
feedstock, transformed via chemical processes into myriad products. That still leaves 30 percent of Dow’s costs as
energy to run its plants, making it one of the world’s most energy-intensive companies. Dow’s energy intensive nature,
coupled with its continuous-processing, 24-7 operating mode, makes its energy efficiency strategy somewhat different
than some of the other companies studied in this report that use relatively moderate amounts of energy. While certain
aspects of Dow’s strategy are more applicable to other energy-intensive companies, many elements will hold relevance
CASE STUDYDow Chemical Company
Integrated Approaches
Headquarters: Midland, MI
CEO: Andrew Liveris
Revenues (2007): $54 billion
Energy Costs (2007): $27 billion
Energy Savings Target:
20 percent reduction in energy used per pound of product, 1996–2005. 25 percent further reduction in energy used per pound of product, 2006–2015.
Key Efficiency Strategy Successes:
• Since 1994, Dow’s energy efficiency strategy has saved 1,600 trillion British Thermal Units (BTUs) of energy—enough to power all the residential houses in California for one year. These energy savings also led to $8.6 billion dollars in cost savings and prevented 86 million metric tons of carbon dioxide equivalents (CO2e) from entering the atmosphere;
• Sustaining savings over a ten-year period, and then strengthening the target for the next ten years;
• Finding significant energy savings in an already efficiency-oriented, energy-intensive primary manufacturer;
• Leveraging the company’s energy business unit to provide a wide range of energy efficiency and related technology and operations services.

+
+
+73
From Shop Floor to Top Floor: BestBusinessPractices in Energy Efficiency
+ DOW UTC IBM TOYOTA PEPSICO BEST BUY
for a broad range of companies. These include Dow’s efforts to organize an effective program, set up a detailed
reporting system, and gain cooperation across business units to meet ambitious energy savings goals.
Everything about Dow’s energy operations is large in scale. The company’s energy purchases (feedstock
included) roughly equal Australia’s entire energy bill, and are equivalent to 10 percent of all the oil the United States
imports. Dow’s Freeport Texas site is nothing if not large, taking up several square miles along the Gulf Coast and
accounting for over one percent of all the energy consumed in the state.
Energy is so big it constitutes its own business unit at Dow. The energy business sells electricity, steam,
and natural gas to other business units. It is also a major player in world, national, and state energy markets, selling
as well as buying energy on a wholesale basis. At the Freeport Texas site, Dow operates some 1,000 Megawatts of
electricity generation, as much as the largest utility powerplants. From its high-tech control center with its panorama
of brightly-colored display screens and switch-studded control panels, Dow buys and sells power among its
production units, and with the Texas power grid operator, The Electric Reliability Council of Texas (ERCOT). Dow’s
power generation is fully interconnected with ERCOT, allowing it to behave like other large generators on the system.
Operators monitor market conditions and Dow operations minute to minute, making decisions on dispatching power
flows. On relatively rare occasions, when ERCOT prices are high enough, Dow will elect to shut down one or more
production units for short periods, and sell power into the grid, because it is more profitable to sell electricity than to
make chemicals under those conditions.
This kind of sophistication in its energy business, driven by the essential role of energy at Dow, flows to
the end-use level as well. When energy is such a huge part of production costs, reducing the energy needed to
make a pound of product is a matter of competitive survival. It’s not surprising then that Dow was among the first
companies to set quantitative, measured energy savings goals. In 1995, the company set a goal of cutting energy
use per pound of product 20 percent by 2005. Dow beat that goal, realizing 22 percent savings as of 2005. But
from 2002 to 2007, Dow’s energy bill rose from $8 billion to $27 billion as natural gas prices skyrocketed. While
these price effects offset the energy intensity improvement, Dow saved almost $8 billion compared to the energy
bills it would have paid without the efficiency strategy.
Against the backdrop of sustained high energy prices, in 2006 CEO Andrew Liveris raised the bar,
increasing the goal by pledging to slice another 25 percent off the energy needed to make a pound of product.
Dow’s energy efficiency goal is represented in British Thermal Units (BTUs) per pound of product produced, so
natural gas used as feedstock (which does not emit greenhouse gases in the production process) is not included
+
+
+ Pew Center on Global Climate Change
74
+ DOW UTC IBM TOYOTA PEPSICO BEST BUY
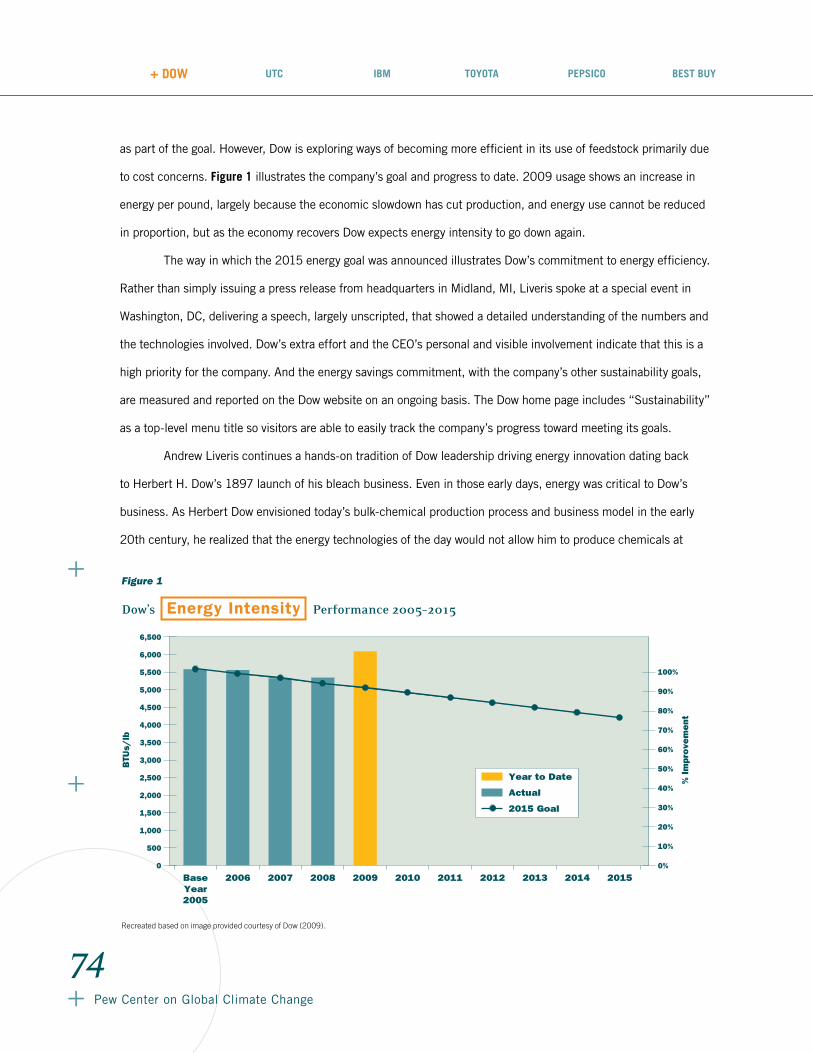
as part of the goal. However, Dow is exploring ways of becoming more efficient in its use of feedstock primarily due
to cost concerns. Figure 1 illustrates the company’s goal and progress to date. 2009 usage shows an increase in
energy per pound, largely because the economic slowdown has cut production, and energy use cannot be reduced
in proportion, but as the economy recovers Dow expects energy intensity to go down again.
The way in which the 2015 energy goal was announced illustrates Dow’s commitment to energy efficiency.
Rather than simply issuing a press release from headquarters in Midland, MI, Liveris spoke at a special event in
Washington, DC, delivering a speech, largely unscripted, that showed a detailed understanding of the numbers and
the technologies involved. Dow’s extra effort and the CEO’s personal and visible involvement indicate that this is a
high priority for the company. And the energy savings commitment, with the company’s other sustainability goals,
are measured and reported on the Dow website on an ongoing basis. The Dow home page includes “Sustainability”
as a top-level menu title so visitors are able to easily track the company’s progress toward meeting its goals.
Andrew Liveris continues a hands-on tradition of Dow leadership driving energy innovation dating back
to Herbert H. Dow’s 1897 launch of his bleach business. Even in those early days, energy was critical to Dow’s
business. As Herbert Dow envisioned today’s bulk-chemical production process and business model in the early
20th century, he realized that the energy technologies of the day would not allow him to produce chemicals at
Figure 1
Dow’s Energy Intensity Performance 2005–2015
0%
20%
30%
40%
10%
50%
60%
70%
80%
90%
100%
0
1,000
1,500
2,000
500
2,500
3,000
3,500
4,000
4,500
5,000
5,500
6,000
6,500
BaseYear2005
2006 2008 2010 20122007 2009 2011 2013 2014 2015
BTU
s/lb
% I
mpr
ove
me
nt
Year to Date
Actual
2015 Goal
Recreated based on image provided courtesy of Dow (2009).
+
+
+75
From Shop Floor to Top Floor: BestBusinessPractices in Energy Efficiency
+ DOW UTC IBM TOYOTA PEPSICO BEST BUY
the scale he needed. George Westinghouse, pioneer of the gas power generation turbine among other energy
technologies, worked in partnership with Dow to create the specialized electricity and steam technologies that
enabled the Dow business model to advance. The fact that Dow leadership and employees remember and tell this
story a century later reflects a deep appreciation for the role that energy innovation plays at Dow.
Energy Efficiency and Dow’s Climate Strategy
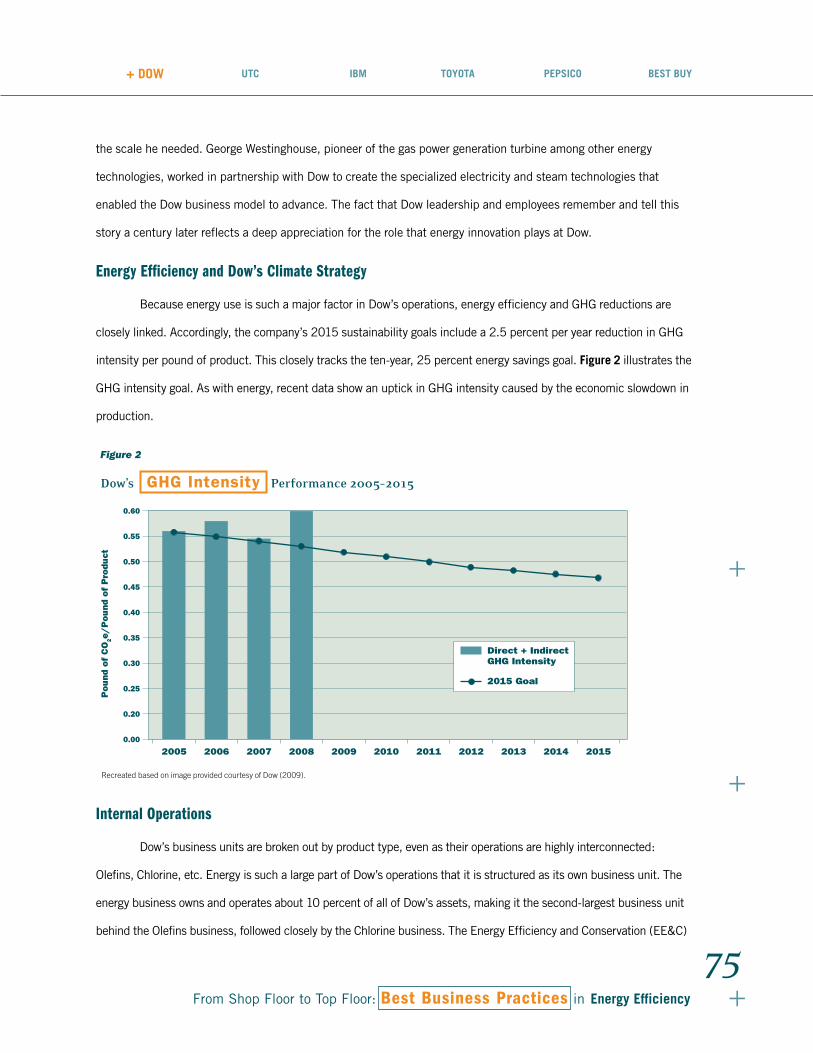
Because energy use is such a major factor in Dow’s operations, energy efficiency and GHG reductions are
closely linked. Accordingly, the company’s 2015 sustainability goals include a 2.5 percent per year reduction in GHG
intensity per pound of product. This closely tracks the ten-year, 25 percent energy savings goal. Figure 2 illustrates the
GHG intensity goal. As with energy, recent data show an uptick in GHG intensity caused by the economic slowdown in
production.
Internal Operations
Dow’s business units are broken out by product type, even as their operations are highly interconnected:
Olefins, Chlorine, etc. Energy is such a large part of Dow’s operations that it is structured as its own business unit. The
energy business owns and operates about 10 percent of all of Dow’s assets, making it the second-largest business unit
behind the Olefins business, followed closely by the Chlorine business. The Energy Efficiency and Conservation (EE&C)
Figure 2
Dow’s GHG Intensity Performance 2005–2015
0.00
0.20
0.25
0.30
0.35
0.40
0.45
0.50
0.55
0.60
2005 2006 2008 2010 20122007 2009 2011 2013 2014 2015
Po
und
of
CO
2e
/P
ou
nd o
f P
rodu
ct
Direct + IndirectGHG Intensity
2015 Goal
Recreated based on image provided courtesy of Dow (2009).
+
+
+ Pew Center on Global Climate Change
76
+ DOW UTC IBM TOYOTA PEPSICO BEST BUY
program leadership team operates from the energy business, engaging some 40 roles overall, about 26 leads in the
various business units, plus 14 site leaders, and some individuals at larger individual plants. Like many companies,
Dow does not have many people with a full-time energy efficiency job title—that distinction goes to corporate energy
manager Joe Almaguer. As Almaguer explains it, the matrixed nature of the EE&C team makes estimating total labor
effort involved in the company’s energy efficiency efforts an “all and none” paradox. Most EE&C members work on
a number of issues including energy; energy might take up all their time some days and little or none on others. The
amount of time spent on energy is driven partly by the EE&C team’s regular meeting and reporting cycles, and partly by
specific actions undertaken at given plants or sites in response to operational changes or project investments.
How the EE&C Program Operates
A note on Dow’s terminology for its operating units helps in understanding the EE&C operation. Because of
the large scale of Dow’s manufacturing, and the many different chemical products involved, its manufacturing centers
are termed “sites,” within which it operates several individual “plants.” A plant is typically defined by its product; so a
site might hold an olefin plant, a chlorine plant, a power plant, and others. The Texas site, for example, contains some
75 individual plants of the 328 total U.S. plants Dow operates.
Since 95 percent of Dow’s energy use flows through its 14 largest sites, the 14 site leaders play an
important role, especially when it comes to energy efficiency opportunities that cut across different plants. For
example, all the major sites have extensive steam systems with miles of piping; at the Texas site, one pipe moves
steam four miles from the powerplant to a remote production plant. Steam systems need regular maintenance,
especially for steam traps, the valvelike devices that remove condensed steam from the line while keeping the live
steam flowing. A site EE&C lead will typically develop a site-wide steam trap maintenance contract; plants can opt
out, but typically don’t because of the cost-efficiency of the larger contract and the operating efficiency benefits.
Site leaders also play an important role in the company culture, building relationships with plant operators, providing
them help and information, and leaning on them as needed to achieve energy goals.
As in most of the successful energy efficiency programs examined in this report, energy efficiency team
members faced challenges in gaining the active cooperation of production plant operators and other site-based
staff. Getting participation in the company’s data reporting system was not as big a challenge, in that Dow already
possessed in most cases the metering and billing information, based on the way the energy business is structured.
The company had long used a centralized reporting system, and was able to build the new energy reporting elements

+
+
+77
From Shop Floor to Top Floor: BestBusinessPractices in Energy Efficiency
+ DOW UTC IBM TOYOTA PEPSICO BEST BUY
into it. More detailed monitoring systems and data reporting occur within each business unit and each operating
plant. The energy metrics thus act as a high-level indicator with centralized information; finer-grained information is
kept decentralized at individual business units and sites. Since the energy business is a functional unit like others in
Dow, it has had the core data it needs to track performance at a high level; setting aggressive energy performance
targets motivated business unit and plant site staff to look harder at their finer-grained operating data to look for
ways to meet the targets. Other companies with more numerous and disparate operations, such as IBM and UTC,
had to go through a longer and more complex process to establish and achieve compliance with the data reporting
system. Each company seeks the right balance of centralized and decentralized data.
But Dow shares with other companies the challenge of persuading production managers to consider changes
in operating practices and technologies. Production staff are focused on product quality, production volume,
and reliability of equipment and systems. Energy improvements, be they changes in operating or maintenance
procedures or new technologies, pose potential risks to these ironclad principles. Dow addresses the potential
conflicting interests of the energy team and the production plants partly through its Tech Centers. Each business
unit has a Tech Center, with experts on its particular production technology, and with one or more EE&C experts.
These Tech Centers each have a director reporting to the business leadership. As a result, the Tech Centers create
focused teams that not only develop technology and operating solutions, they also build trust relationships that help
the EE&C team gain the cooperation of product staff. The involvement of Tech Center staff in developing, testing,
verifying, and then instituting new practices and technologies is key in this respect, as is the highly interactive nature
of the EE&C team. Regular conference calls, webinars, email exchanges, and site visits build trust and help spread
technical information.
Dow’s EE&C team is part of the larger Dow Sustainability Team, as illustrated in Figure 3. EE&C includes team
members from each business unit, and each large site. Having an EE&C team member at each large site allows for
coordinated and collaborative efforts among the many plants operated by different business units within a given site.
Drilling deeper into the EE&C structure, Figure 4 shows how EE&C works within a given business unit. Each
business’s EE&C team leader is sponsored by the respective business Tech Center Leader. The team leader works
with people at the individual plants in the business. For example, each olefin plant has a person assigned to work with
the olefin plant’s EE&C team leader. The Tech Center’s role is to provide engineering and technology support for the
business, developing new specifications for production equipment and ancillary equipment, and working with plant
operators to advance and sustain operating practices.

+
+
+ Pew Center on Global Climate Change
78
+ DOW UTC IBM TOYOTA PEPSICO BEST BUY
Figure 3
Dow’s Energy Team
Senior VP Hydrocarbons& Base Plastics
CEO
Chief Sustainability Of�cerDow Business
Leaders
VP Energy &Climate Change
VP EHS & SustainabilityLarge SiteLeadership
Energy Business Technology& Manufacturing Leader
Program DirectorClimate Change
Global EE&C Program Leader
Large SiteEE&C Leaders
BusinessEE&C Leaders
Dow’sSustainability
Team
Recreated based on image provided courtesy of Dow (2009).
Figure 4
Business EE&C Team Structure
Plant/UnitFocal Point
Plant/UnitFocal Point
Business EE&CTeam Leader
SponsorTech Center
Plant/UnitFocal Point
Plant/UnitFocal Point
Recreated based on image provided courtesy of Dow (2009).
+
+
+79
From Shop Floor to Top Floor: BestBusinessPractices in Energy Efficiency
+ DOW UTC IBM TOYOTA PEPSICO BEST BUY
Data Collection and Reporting: The Global Asset Utilization Reporting System
A key element of Dow’s EE&C program is the energy data collecting, reporting, and accountability system
built around the company’s Global Asset Utilization Reporting (GAUR) system. GAUR collects energy data from the
numerous metering and submetering points at each plant, aggregates them up to a total BTU number, and reports the
BTU total along with pounds of product per plant. A typical GAUR report consists of rows for each reporting facility,
and includes its energy use, production, and energy use per pound of product. The columns show this information by
quarter and year, allowing quick visual comparison of performance over time. Plant operators, business unit leaders,
EE&C staff, and corporate staff all have access to this information.
GAUR reports look deceptively simple. Developing the calculations needed to produce the BTU totals in
GAUR was not simple. A longtime Dow engineer painstakingly developed methods to convert the various flows
of energy commodities, and intermediate energy flows in Dow’s complicated operations, to a standardized set of
BTU equivalents (calculating GHG equivalents added another layer of computational complexity). Dow uses lots
of primary (raw) energy, but also converts it into intermediate forms like steam and electricity. Accounting for
the conversion and distribution losses, and the energy content of various energy streams as they are delivered to
each plant, involves complex calculations, which led Dow to institute a formal, documented procedure to ensure
consistency and quality of information across the company.
Because natural gas is the dominant source in Dow’s energy purchases, all energy forms consumed are
translated to equivalent BTUs of natural gas and adjusted to reflect real-world efficiencies and losses associated with
energy conversion. This method allows staff across the company to use a common currency, in terms of how much
natural gas has been or would have to be used to produce the energy consumed at a given plant. This methodology
also reflects the ability of each energy form to do real work and not just theoretical work. It therefore estimates how
many BTUs of natural gas equivalent would be saved from a given energy saving opportunity. This gives the EE&C
team a consistent way to make realistic calculations of primary energy impacts and thus derive better estimates of
expected energy cost savings. The company knows the price of natural gas, so turning everything into equivalent
natural gas units makes it possible to compare energy performance and energy savings across plants, sites, and
energy markets.
+
+
+ Pew Center on Global Climate Change
80
+ DOW UTC IBM TOYOTA PEPSICO BEST BUY
GAUR reports roll up to business unit and corporate levels, and form the basis of the energy and production
numbers in quarterly sustainability reports, which are posted on the Dow website. But GAUR numbers are also
used to produce internal reports with much more detail. In addition to the basic energy and production numbers,
the internal reports assess actual vs. target performance, discuss issues that explain performance numbers, and
suggest action items to correct any sub-par performance levels. These reports go to business unit leadership as well
as to plant operators and site leaders, and often become the focus of extended discussions and followup actions.
How Dow Achieves Energy Savings
Dow achieves its energy savings goals somewhat differently than other companies. While all of the case study
companies focus on low-cost operating improvements, Dow is much more capital-intensive, and less labor-intensive,
than most. One can drive around a Dow site for some time without seeing a human being, whereas in a Toyota or IBM
facility, as in most companies, people are everywhere. Dow also typically operates in a continuous processing mode—
the chemical plants normally run 24-7. This reduces the opportunities to apply downtime shutdown strategies that
companies like IBM and Toyota have used to great advantage to gain “free” energy savings.
Dow plant operators rely on the continuous flow of data they get on energy and other performance indicators
to determine whether their operations are on track. This may occasionally include operating adjustments or
maintenance actions, but most big efficiency improvements come from process technology changes. For example,
Dow’s Light Hydrocarbon (LHC)-7 plant at the Freeport Texas site won a 2008 American Chemistry Council (ACC)
Responsible Care® Energy Efficiency Award in 2009 for replacement and upgrade of its ethylene furnace capacity.
Dow replaced the existing 10 furnaces with five new, larger state-of-the-art furnaces with significantly higher
energy efficiency. Interestingly, this investment was initiated for compliance with NOx emissions regulations, but
the additional benefits in energy savings, yield improvements, corporate sustainability, and extended lifetime of the
facility made the business case very strong. This investment has improved LHC-7 plant energy efficiency by more
than 10 percent, producing energy savings of over 2,000,000 MMBTU/yr, equivalent to the annual electricity use of
more than 17,000 homes, and cutting CO2 emissions by 105,000 metric tons annually.
Across the Atlantic in Antwerp, Belgium, Dow and its partner BASF in 2009 opened the world’s first
commercial-scale propylene oxide (PO) plant based on the innovative hydrogen peroxide to propylene oxide (HPPO)
technology the two companies jointly developed. Producing up to 300,000 metric tons of PO per year for the
polyurethane industry, the new Antwerp plant reduces energy use by 35 percent and wastewater by up to 80 percent.

+
+
+81
From Shop Floor to Top Floor: BestBusinessPractices in Energy Efficiency
+ DOW UTC IBM TOYOTA PEPSICO BEST BUY
Finding the Funding for Energy Projects
While these projects represent major efficiency gains and provide several streams of business benefits,
the capital for such projects is hard to come by, even for a large company like Dow, and especially in the current
economic downturn. According to its corporate financial report, Dow spent approximately $2.28 billion in total capital
investment in 2008, up from about $1.78 billion in 2006. However, in 2009 capital expenditures will be drastically
lower due to the current economic conditions. While even $1 billion is nothing to sneeze at, it gets competition from all
the company’s investment needs. For context, $1 billion is less than two percent of Dow’s total revenue, and less than
four percent of total energy costs.
Dow’s capital budget must serve many priorities, and meeting energy goals is just one of them. Dow applies
various financial criteria to project investment opportunities; including discounted cash flow, net present value,
and internal rate of return. Business units use their own analysis and prioritization methods, driven by competitive
forces and the norms of their businesses. In many cases, investments that are seen as critical to maintaining or
improving competitiveness are moved to the fore; this forces the EE&C team to make a broader business case for
energy-related investments, documenting the co-benefits in competitiveness terms. For example, a given efficiency
investment might not meet a simple payback criterion; but if it keeps the company competitive in a specific market
and avoids the loss of a specific customer or a certain share of the market, such considerations can help justify the
investment.
In one sense, energy has long been a key issue for Dow, so energy efficiency competes relatively well when
the numbers are compelling. Dow expects to ultimately factor in carbon price expectations in assessing energy
projects. But because it does not expect carbon prices to appear in energy markets for several years, except in
Europe, carbon prices only have a material effect on larger capital projects, and these tend to be major process
changes that involve more than energy as driving forces. Dow does have facilities that are regulated under the
European Union’s Emissions Trading System. The carbon price created by the trading system is an added cost that
Dow incorporates into the evaluation of energy efficiency projects.
Dow has looked at trying to leverage outside capital through performance contracting, but like other case
study companies it has found the performance contracting business model hard to match to its own operating
models. Energy service companies typically require long-term agreements to make their financing structures work,
and most corporations are not inclined to enter such long-term contracts. Performance contracts also tend to require
+
+
+ Pew Center on Global Climate Change
82
+ DOW UTC IBM TOYOTA PEPSICO BEST BUY
long repayment terms to enable energy savings to exceed payments, because they must roll all of the development
costs, interest costs, and other “overhead” factors into debt service payments on top of direct capital costs.
Moreover, in a complex industrial operation like Dow’s, establishing the critical baseline energy use calculations on
which savings are based can be too difficult and uncertain to build into long-term agreements. Dow uses companies
like Johnson Controls, which has a large performance contracting business, but tends to use them for more specific
technology and service contracts on a traditional sales or fee basis.
Pursuing Operational Improvements vs. Capital Investments
The challenge of raising capital for efficiency investments turns the focus back to operating improvements.
Dow works hard at this on an ongoing basis, but EE&C team members also know that the sheer scale of energy
and product flows in a continuous processing environment limits the relative impact of operating changes. Using
the engineering talent in the Tech Centers and other EE&C team members, Dow sometimes uses Pinch analysis, a
methodology evolved in industrial circles in the last three decades. The Pinch method is designed to minimize energy
consumption in chemical processes by calculating technically feasible energy targets, and then achieving them by
optimizing heat recovery systems, energy supply methods and process operating conditions. In a Pinch analysis,
process data is typically represented as a set of energy flows as a function of heat load against temperature. These
data are combined for all the energy flows in the plant to give composite curves, one for hot flow and one for cold flow.
The point of closest approach between the hot and cold composite curves is called the pinch temperature or pinch
point. By finding this point, various heat recovery or transfer solutions can be developed.
Dow engineers constantly use their creativity combined with the variety of energy and material streams
in their plants to find new efficiency ideas. For example, at the Texas site, hydrogen occurs as a byproduct in one
process. EE&C staff have experimented with blending this available hydrogen with natural gas fuel in their power
turbines, taking the mix up to the limits that the turbines will tolerate.
For its efforts, the EE&C team also seeks outside input to find new ways to save energy. It maintains a panel
of outside energy and environmental experts to provide technical and strategic input. Dow also participates in national
programs: it won a 2008 ENERGY STAR Partner of the Year award from the U.S. EPA, and invited energy auditors
from the U.S. Department of Energy’s (DOE) Save Energy Now1 program to review its large US-based facilities. The
1 For more information on DOE’s Save Energy Now program, go to: http://www1.eere.energy.gov/industry/saveenergynow/.

+
+
+83
From Shop Floor to Top Floor: BestBusinessPractices in Energy Efficiency
+ DOW UTC IBM TOYOTA PEPSICO BEST BUY
Save Energy Now team found several productive ideas, including innovative ways to load pumping systems that
enabled Dow to shut down one pump station. In one instance, the potential savings the DOE review identified totaled
about 11 percent of plant energy use. Dow in turn supports DOE by participating in several of its sponsored programs
and initiatives, such as the development of the ISO 50001, international standard for industrial energy management.
Supply Chain
Dow sits near the top of the energy supply chain; it purchases raw materials and transforms them into bulk
materials, and in some business units produces products for business or consumer markets. In this context, there
is little energy efficiency opportunity for Dow to exert with its suppliers; its efficiency strategy focuses primarily on
internal operations, where most of its footprint occurs. Dow has not conducted a formal analysis of its suppliers’
energy or carbon footprint. In the energy arena, with 60 percent of the company’s costs incurred as energy and most
of that as natural gas, the supply footprint is relatively small compared to the footprint created by the conversion of
that energy in Dow’s processes.
Dow does, however, focus on supply chain issues in its broader sustainability commitments. In its
Sustainable Chemistry commitment, for example, the company works to reduce its impact on water resources,
and seeks renewable sources of natural gas, such as landfill gas or sugarcane. The Antwerp HPPO plant described
earlier, for example, saves even more water than energy on a percentage basis. The company is using landfill gas at
its Dalton, GA facility.
Products and Services
Dow estimates that its products and services have a smaller overall energy and carbon footprint than its internal
operations. Nonetheless, it continues to innovate efficient products and other solutions for its customers. Dow’s insulation
products, mostly sold under the STYROFOAM™ brand, are used to reduce energy use in homes and businesses. One
square foot of one-inch thick Dow STYROFOAM™ insulation will save one ton of CO2 emissions over the average life of a
house. Dow building insulation material saves hundreds of millions of metric tons of CO2 each year. Dow actively supports
programs and policies that encourage energy efficiency, in buildings, industry, transportation, and utilities.

+
+
+ Pew Center on Global Climate Change
84
+ DOW UTC IBM TOYOTA PEPSICO BEST BUY
Conclusions
Dow is one of the few companies that has not only set and met a 10-year efficiency target, but has gone on to
set another, more aggressive 10-year target. This “in it for the long haul” demonstration of commitment is one of the
hallmarks of a successful sustainability program. Dow has also set and met its goals in a manufacturing environment
where energy has long been a critical factor of production, so the company had been paying attention to energy issues
since Herbert Dow pioneered bulk chemical manufacturing a century ago. This means energy savings were not as
easily found as they might be in companies where energy has only recently become an issue. Dow has made effective
use of its energy efficiency team from its energy business unit, reaching across business units and functional lines to
create teams of experts and local site leaders to keep the efficiency program moving forward.
Key lessons learned from Dow’s energy efficiency successes, include the importance of:
• Corporate leadership commitment. In Dow’s case, the CEO has made a very clear and public
commitment to achieving the company’s energy savings goals.
• Building the appropriate organizational structure to institutionalize and lead the program. This
includes cross-functional teams with clear lines of accountability.
• Robust measurement, tracking, and reporting systems so that management can monitor progress
and identify potential problems.
• Establishing clear goals and objectives, and then revising them over time as the initial targets are met.
• Communicating the importance of energy efficiency as a core company value to both internal and
external stakeholders.
• Recognizing success by rewarding employees and business units for energy saving innovations.