PTC System Monitor
14
PTC System Monitor
-
Upload
khangminh22 -
Category
Documents
-
view
0 -
download
0
Transcript of PTC System Monitor

PTC System Monitor

2
Customer Challenges – Visibility into System Health
– Time To Resolution
– High customer effort for diagnosing issues
Q2 FY12 – Debut of The Windchill System Performance
Monitoring Tool for Windchill 9.1 & 10.0
powered by dynaTrace
Q3 FY12 – Debut for PTC System Monitor for Integrity
10 powered by dynaTrace
Increasing Enterprise Support Demand & Complexity
Diagnostics & Troubleshooting Tools based on Customer & TS Requirements
© 2011 PTC

3
Detection (set thresholds and detect problems) – Slow performing URL e.g. View a Part, Check in a Document
– Unresponsive, Dead Method Servers, Memory Abuse, Partial failures
Diagnosis (viewing tools and automation of data collection) – Transaction profile (avoid need for reproducing errors)
– Integrated log viewing, gather save and send (Windchill Release 10)
Repair, Recovery and Validation (integration with WC environment)
Planning and Reporting (analyze trends, measure availability) – Reporting on serviceability metrics
– Trending and correlation through time
Interoperability (fit within IT management) – Integration with traditional Network and Systems Management Infrastructures
Introduction
Key Use Scenarios
© 2009 PTC
3

4
PTC System Monitor Overview
Windchill 9.1 or 10.0 Web Server Windchill Arbortext Integrity DBMS
Always On
Health Dashboards
Easy to install
Configurable at
Runtime
.Net Java
Flight Data Recorder

5
PTC System Monitor Capabilities
Product Features
Reporting
Sensors
Dashboards Reporting
Sensors
Dashboards Reporting
Sensors
Monitoring
© 2011 PTC

6
<Cust> Sees Dramatic Reduction in Diagnosis Time
<Cust> DBA – Reports serious performance
degradation in WF process history
– <Cust> started using PTC System
Monitor as early adopter in January
Darrin Swenson, PTC Engineer – Darrin calls DBA and starts WebEx
– Within 5 minutes they isolate root cause
– Missing index on a table
Client and PTC Benefits – No need to setup WC Profiler
– No impact on production system
– No need to reproduce incident
– No need setup environment to isolate
cluster node
– No delays in starting diagnosis!
Poor Performing SQL Query Found in Minutes
<Cust> goes
from detecting
incident to root
cause in 5
minutes with
PTC System
Monitor
7
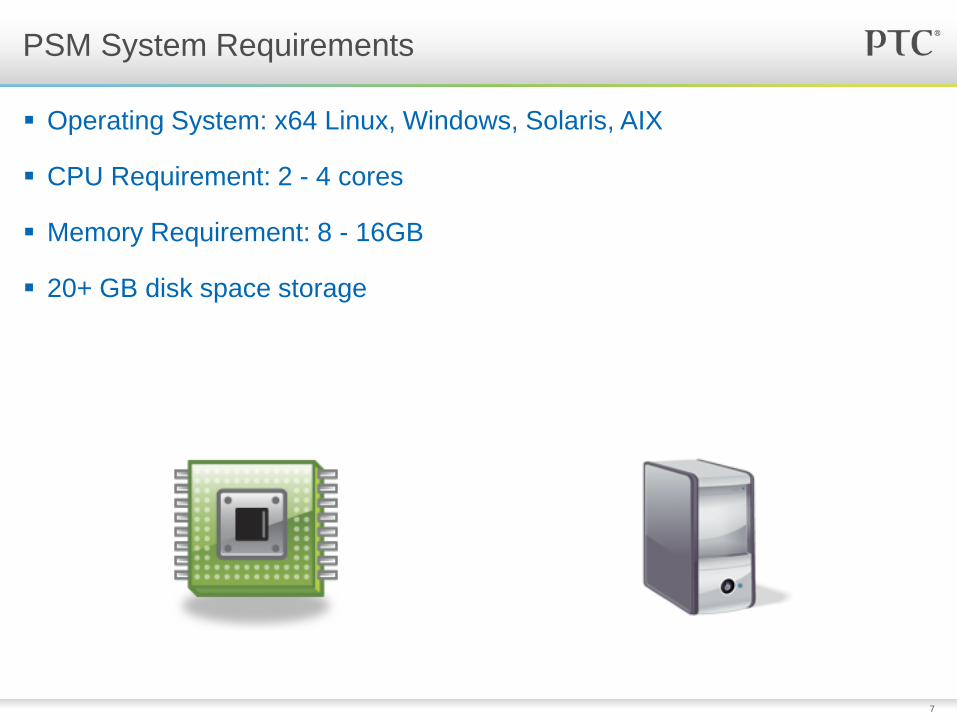
Operating System: x64 Linux, Windows, Solaris, AIX
CPU Requirement: 2 - 4 cores
Memory Requirement: 8 - 16GB
20+ GB disk space storage
PSM System Requirements

8
PSM Release Timeline
March 2011
dynaTrace contract
signed
Nov – January
2011
Early Access 3
PSM 1.0 M030
+10 - 15 customers
deployed PSM in
test/production
environments
February 2012
Production
Release
PSM 1.0 M040
Available to all
maintenance
customers Windchill
9.1 and 10.0
May 2012
Production
Release
PSM 2.0 F000
Available to all
maintenance
customers Windchill
9.1 and 10.0
June – July 2011
Early Access 1
PSM 1.0 M010
2 customers given
access to PSM
August – Nov 2011
Early Access 2
PSM 1.0 M020
+12 customers
deployed PSM in
test environments
Powered by dynaTrace 3.5
Powered by dynaTrace 4.0
Powered by dynaTrace 4.1
© 2011 PTC
Available to all customers

9
When can I get the PTC System Monitor? – PSM was released February 2012
– Available through the PTC Software Download catalog
What PTC applications does PSM support? – Windchill 9.1 and 10.0 server components.
– MKS Integrity product
Is there any cost to PSM? – It’s free
– PSM will be available to maintenance-paying PTC customers of PTC PDS server software
– There will be options to expand the PSM with dynaTrace add-on modules
What type of hardware will I need? – A separate monitoring server (64 bit) is required
Frequently Asked Questions

10
Is there training available from PTC? – Yes, through PTC University
Does PSM monitor browser performance? – No. The PSM is based on dynaTrace’s Production Edition and is focused on server
performance only.
Does PSM support Creo? – Not directly. PSM monitors server-side interactions of Creo with Windchill. For example
workspace operations can be monitored in Windchill that are driven by Creo.
Can PSM replace enterprise system monitors: Nagios, OpenView, Tivoli? – Yes and No. PTC System Monitor is not an enterprise monitoring solution, but rather it is an
application monitoring solution that traces transactions across application components rather
than monitoring just the hardware.
Frequently Asked Questions (continued)

11
Simple View Into the System
24 metrics consolidated into an easy to absorb health indicators
System throughput
© 2011 PTC

12
Drill Down Capabilities
Identify which server in cluster running into issue
Unprecedented view into End-user actions
© 2011 PTC

13
Transaction Based Dashboards
Transaction based metrics
SLAs defined on business transactions
© 2011 PTC

14
Powerful Diagnostic Capabilities
Code path execution
© 2011 PTC