Android Home Monitor System for Post Cardiosurgery Patients
117
Android Home Monitor System for Post Cardiosurgery Patients PROKOPIS PROKOPIOU ΠΑΝΕΠΙΣΗΜΙΟ ΚΤΠΡΟΤ ΣΜΗΜΑ ΠΛΗΡΟΦΟΡΙΚΗ
-
Upload
khangminh22 -
Category
Documents
-
view
4 -
download
0
Transcript of Android Home Monitor System for Post Cardiosurgery Patients
Android Home Monitor
System for Post
Cardiosurgery Patients
PROKOPIS PROKOPIOU
ΠΑΝΕΠΙΣΗΜΙΟ ΚΤΠΡΟΤ
ΣΜΗΜΑ ΠΛΗΡΟΦΟΡΙΚΗ
Εσταριστίες
Table of Contents
Chapter 1 Introduction ........................................................................................................... 4
1.1 Overview Narrative ...................................................................................................... 4
1.2 E-Health ....................................................................................................................... 5
1.3 M-Health ...................................................................................................................... 5
1.4 Project Purpose .......................................................................................................... 10
Chapter 2 Theoretical Background ...................................................................................... 14
2.1 Human Heart .............................................................................................................. 14
2.2 Electrocardiography (ECG) ....................................................................................... 15
2.3 Placement of electrodes ............................................................................................. 17
2.4 Characteristics of Norma ECG .................................................................................. 18
2.5 ECG Rhythms ............................................................................................................ 20
Chapter 3 System Requirements .......................................................................................... 26
3.1 Introduction ................................................................................................................ 26
3.2 Programming Language and Tools ............................................................................ 26
3.3 Networks and Communications ................................................................................. 27
3.4 Smartphone‘s ............................................................................................................. 29
3.5 Medical Devices ........................................................................................................ 30
3.6 System Operations and Functions.............................................................................. 30
Chapter 4 Analysis of Previous Work ................................................................................. 32
4.1 Introduction ................................................................................................................ 32
4.2 Previous Systems ....................................................................................................... 32
4.3 Compare existing systems with proposed system ...................................................... 40
4.4 Development of the existing System ......................................................................... 42
Chapter 5 Analysis and System Specifications .................................................................... 45
5.1 Introduction ................................................................................................................ 45
5.2 System Analysis ......................................................................................................... 45
5.3 Processes Flow Diagram (PFD) ................................................................................. 51
5.4 Database Structure ..................................................................................................... 53
5.5 Design Phase .............................................................................................................. 56
5.6 Class Diagram ............................................................................................................ 60
5.7 Use Case diagram ...................................................................................................... 69
5.8 Sequence Diagram ..................................................................................................... 74

5.9 Doctor and Patient Scenarios ..................................................................................... 76
Chapter 6 Implementation Phase ......................................................................................... 84
6.1 Introduction ................................................................................................................ 84
6.2 Programming Language and Platform ....................................................................... 84
6.3 User Interface ............................................................................................................. 84
6.4 Steps for implementing the application ..................................................................... 85
Chapter 7 System Evaluation Phase .................................................................................... 86
7.1 Introduction ................................................................................................................ 86
7.2 Testing specification and planning ............................................................................ 86
7.3 Test Scenarios and results .......................................................................................... 87
7.4 Modularity ................................................................................................................. 99
7.5 Conclusion ............................................................................................................... 100
Chapter 8 Conclusion and Future Work ............................................................................ 101
8.1 Conclusion ............................................................................................................... 101
8.2 External System to be created .................................................................................. 102
8.3 Internal System addition work ................................................................................. 103
Bibliography ...................................................................................................................... 106
Appendix I - User Manual ................................................................................................. 108
Appendix II - Installation Phase ........................................................................................ 117
Chapter 1 Introduction
1.1 Overview Narrative
1.2 E-Health
1.3 M-Health
1.4 Project Purpose
1.5 Project Structure
1.1 Overview Narrative
While technology grows it gives the opportunity and to other areas to be evolves. For
example as technology evolves it gives more opportunities to medicine to help patients,
providing them better life. Medical equipment is evolving to provide better and more
accurate diagnosis, better medical pills, etc.
Beside that other categories may grow that with a combination with medicine may provide
a better life for all of us. For example surgeries may be conducted through VoIP
conference between doctors helping each other how to proceed with the surgery.
Furthermore mobile telephones were evolved to Smartphone‘s telephones. This give much
more potentials combine with medicine to provide to patients better life support. Upon this
telemedicine, m-Health was developed.
Telemedicine combine telecommunication with information‘s technologies in order to
provide distance clinical health care. It provides access for communities that do not have
direct access to health care and provide them access through telemedicine. It provides a
communication between patient and doctor and the exchange between them of medical and
health information‘s [24].
Moreover telemedicine it provides access for patients in remote locations in healthcare.
Patient will have a number of monitor devices at home in which the results will be sending
to the corresponding doctor for analysis. It provides vital information‘s of the patient as
long as the equipment is being using. Depends on the patient condition, doctor can check
those vital information‘s on a daily or weekly basis to determine the best treatment.
Telemedicine manage to reduce the cost of healthcare both for hospitals and patients, and
increase efficiency through better management of chronic diseases, shared health
professional staffing, reduce travel time, reduce cost, and fewer or shorter hospital stays
[26].
1.2 E-Health
E-health Services
Electronic health records: enabling the communication of patient data between
different healthcare professionals such as GPs, specialists etc.
Telemedicine:
Consumer health informatics: use of electronic resources on medical topics by
healthy individuals or patients
Health knowledge management: e.g. in an overview of latest medical journals, best
practice guidelines or epidemiological tracking
Virtual healthcare teams: consisting of healthcare professionals who collaborate
and share information on patients through digital equipment
mHealth or m-Health
Medical research using Grids: powerful computing and data management
capabilities to handle large amounts of heterogeneous data.
Healthcare Information Systems: also often refer to software solutions for
appointment scheduling, patient data management, work schedule management and
other administrative tasks surrounding health [26].
1.3 M-Health
M-Health in mobile devices have the appropriate application in order to help the practice
of medicine and public health. It referred to the support of medicine from mobile devices,
tablets and PDAs. M-Health provide to the increase of access to healthcare and health-
related information‘s, also improve the ability to diagnose and track diseases and expanded
access to ongoing medical education and training for heath workers.[25,38]
Two factors motivate the development of m-health. The first one was the many constraints
that exist in healthcare systems of developing nations, such as high population growth, low
health care, limited financial resources to support healthcare, Chronic Disease, etc. The
second motivation promoted on developing m-health, where mobile phones, the rapid raise
of mobile phones to large segments of the healthcare workforce. In any segment of the
country, you have a mobile access with low information and transaction cost in order to
deliver healthcare [39].
Cells phone can be described according their functionalities from basic cell phones to
Smartphone‘s. M-health procedures can work on any type of cell phone or in depending
the type of application to certain types only. Wide range of procedures were developed for
user from the basic cell phones that its functions are voice communication and Short
message service (SMS). Popular health-related functions of SMS include health behaviours
reminders, request for schedule or confirm of an appointment, notifications or laboratory
results, request for data, encouragements or motivations to maintenance a position
behaviour and educational and information resources to improve self-efficiency.
Mobile Phones
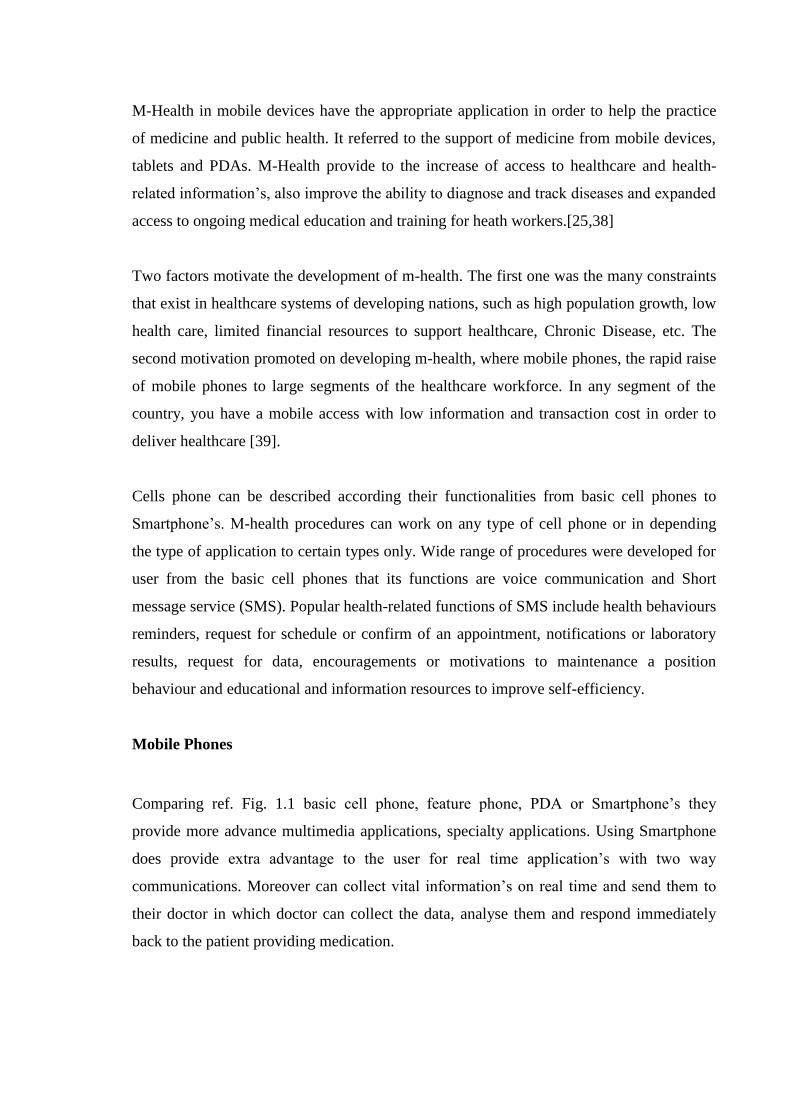
Comparing ref. Fig. 1.1 basic cell phone, feature phone, PDA or Smartphone‘s they
provide more advance multimedia applications, specialty applications. Using Smartphone
does provide extra advantage to the user for real time application‘s with two way
communications. Moreover can collect vital information‘s on real time and send them to
their doctor in which doctor can collect the data, analyse them and respond immediately
back to the patient providing medication.
Moreover m-health can improve communication between patients, caregivers and
providers with video conferencing communications that are beginning to emerge and are
built in to these mobile technologies [27].
Reference 1.1: Cell phones types
M-health Applications
Education and awareness
The main concept was providing mass information‘s from source to recipients
through SMS. SMS are sending directly to user phone device to inform them about
several subjects including testing and treatment methods, etc. The main advantage
of SMS is that is distinctive, offering patient confidentiality in societies where
diseases such as HIV and AIDS are taboo. Beside that it provide information‘s to
users that may have limited access to public health care information‘s, health
clinics, etc.
―Project Masiluleke and Text to Change use SMS message campaigns to provide
HIV/AIDS education in South Africa and Uganda, respectively. Project Masiluleke
takes advantage of the 120 spare characters on free ‗please call me‘ SMS messages
to provide HIV/AIDS education and awareness, while Text to Change employs an
SMS-based quiz to test users‘ HIV/AIDS knowledge and encourage testing and
counseling.‖ [28]
Helpline
Is a phone number that any one may have access to that phone number. It provide
access to range of medical services which include phone consultants, counselling,
service complaints and information‘s about drugs, equipment and available mobile
health clinics.
Diagnostic and treatment support, Communication and training for healthcare
workers
It provides healthcare workers about diagnosis and treatment of patients. It equips
them to a source of information‘s through their mobile phone. This involves
connecting healthcare workers with other health care workers, medical institutions,
ministries of health, or other houses of medical information‘s. This involves using
mobile phones to better organize and target in person training. Beside that it
improves communication projects to increase knowledge transfer among healthcare
workers and improve patient outcomes through such programs.
o Communication and Training for Healthcare Workers
―In the Primary Healthcare Nursing Promotion Program, the National School
for Nurses in Coban, Guatemala used an innovative combination of mobile
phones, landline phones, and tele-writers to train nurses in this rainforest
community.‖ [28]
o Diagnostic and Treatment Support
―Researchers from the University of Melbourne are creating diagnostic and
analytical tools specifically for mobile phones for health workers in
Mozambique. These tools include a built-in calculator for determining drug
dosage and reference materials stored in the phone‘s memory.‖ [28]
Disease and epidemic outbreak tracking, Remote monitoring, Remote data
collection
The main goal is to use mobile functionality in order to collect and transmit data
quickly, cheaply and efficiently. Those vital information‘s according the location
level of specific diseases such as malaria, HIA/AIDS, TB, Avian Flu can provide
help to medical systems, ministries of health‘s or other organizations identify the
source of problem, and provide better target medical resources to areas of greatest
need. That kind of project it would be useful during emergencies in order to
identify where the greatest medical need within the country is.
o Remote Data Collection
―Hundreds of health workers have used PDAs provided by the Ugandan Health
Information Network to collect health data in the field. Not only has this

solution resulted in significant cost savings—25% in the first six months—but
health workers report increased job satisfaction due to the greater efficiency and
flexibility provided by the technology.‖ [28]
o Remote Monitoring
―TB patients in Thailand were given mobile phones so that healthcare
workers (themselves former TB patients) could call these patients on a daily
basis to remind them to take their medication. Medicine compliance rates
reached 90% due to the introduction of this remote monitoring application.‖
[28]
o Disease and Epidemic Outbreak Tracking
―Incidents of Japanese Encephalitis were tracked real-time in Andhra
Pradesh, India, via a combination of mobile phones and web-based
technologies. The government used the information to better prioritize
vaccinations based on evidence of clusters of outbreaks.‖ [28]
Treatment support and medication compliance for patients, including chronic
diseases
Additional to that remote monitor and treatment support provide better involvement
in medical care of the patients. In countries, areas with limited resources such as
beds or medical clinics, remote monitor provide to workers a better feedback about
patient conditions, medication regimen adherence and follow-up schedule. The use
of remote monitor is being using more in areas if medication adherence of AIDS
and diabetes [26].
M-Health Objectives
increased access to healthcare and health-related information (particularly for hard-
to-reach populations)
improved ability to diagnose and track diseases
timelier, more actionable public health information
expanded access to ongoing medical education and training for health workers
M-Health Advantages
Reduced hospitalizations of patients
Increased patient satisfaction
Reduced costs both for patients, not need to be at the hospital every day and for
hospitals because patients will be less and equipment will be used less
Increased self-management, equipment will be used directly from the patient
Improved health and wellness
Increased quality of life
Reduce the caregiver burden
Increased communication and coordination between patients, clinicians, and
caregivers
M-Health – To whom it concerns
Hospitals
Clinics
Nurses - Health Workers
Doctors
Patients
Insurance Companies
1.4 Project Purpose
Heart surgery or other cardio logical diseases that affect patient life, needs to provide them
some solutions that will help them to continue their lives. After a surgery, patients need to
attend on the hospital every day in order the doctor to make the appropriate exams to
ensure that there are no any complications for the patient. That‘s vital information‘s are the
ECG, weight, blood pressure, and oxygen saturation. This exam in order to be done every
day it need a lot of time both from patient and doctor. Some of the patients due to age,
distance or other factors might not be able to be moved every day to the hospital.
Technology gets in our life day by day with its benefits and with disadvantages. Gathering
only the benefits we will provide a system that will support both patient and doctor. It
gives the ability to patient to make the cardiac test from home and for the doctor to exam
the patient without to be face to face with the patient. The patient will be provided with
tools that are necessary in order to measure by its self all the vital information‘s that are
need and then will send them to the doctor. The doctor then will download the data and
check for any arrhythmia on the data.
Population aging is progressing rapidly in many industrialized countries, but those
developing countries whose fertility declines began relatively early also are experiencing
rapid increases in their proportion of elderly people [1].
Needs of older peoples according health are becoming more demanding and more usual.
They have needs for a range of resources that they provide them support in order to be
actively members of the community they leave.
Moreover in middle income and low income countries face a huge problem in their
healthcare system. These countries their main problem is the lack of human and physical
resources and the huge number of diseases. Healthcare access to all reaches of society is
generally low in these countries.
The main goal of this project is to provide a functional application that will handles the
electrocardiogram in distance. The application with a combination with advance medical
devices will provide huge advantage in order to avoid episodes that may set into danger the
patient life. With the certain application we can select the ECG signal, heart rate, oxygen
saturation, blood pressure, weight, plethysmogram in real life time analyze, sending the
information‘s to the appropriate personnel and immediately check them for any arrhythmia
in data. This procedure is vital especially for patients with heart surgery, or chronic
diseases. For those patients is essential to have fast and continuously inspection of the data
in order to prevent any contingency that will harm patient life.
Furthermore the vital information‘s that will be collect, the ECG, oxygen saturation,
patient weight, plethysmogram, heart rate they will be transfer to the appropriate personnel
using a combination of Wi-Fi and web-services, in which in turn the personnel will
download those information‘s either on the portal specify for doctors in which it will
process and will act accordingly to the situation.
The solution that will be providing for both patients and doctors will be two separate
android application portals the ECG application. Patient will login on the patient portal
system, capture all the vitals information‘s that are needed from the appropriate medical
personnel. On the other side the medical personnel will login on the doctor portal system
that in order to download the data the review them.
1.5 Project Structure
The chapter‘s structure is:
Chapter 2 – Theoretical Background:
This chapter will provide some necessary information‘s about ECG, how ECG works and
explain in theoretical for heart, ECG, ECG rhythms.
Chapter 3: - System Requirements
Provides the technologies that are going to be used and devices that are need in order to
implement the application.
Chapter 4: - Analysis of Previous work
In this chapter we will search on previous works that have been implemented according to
our subject. Also we will compare some of those works with our and what it will be
improve depend the other works.
Chapter 5: - Analysis and System specifications
In this chapter is been descript the life cycle of the project the phases that is been follow in
order to analysis, design, and implement the application.
Chapter 6: - Implementation Phase
It provide the programming language that were used in order to implement the application,
and the steps that where followed
.
Chapter 7: - System Evaluation Phase
It will be describing the tests that were following in order to check the correctness of the
application. Beside that it will discuss the modularity of the system for future upgrades.
Chapter 8: - Installation Phase
Describe the steps that have to be follow in order to install the application in Android
Devices and how the needed files will be copied on the memory card of the device.

Chapter 9: - Conclusion and Future work
This is the last chapter of this thesis. In this chapter will be discuss what have we done and
what can be done in order to implement a better application and what external application
are need in order to help for creating more useful application.
Chapter 2 Theoretical Background
2.1 Human Heart
2.2 Electrocardiography (ECG)
2.3 Placement of electrodes
2.4 Characteristics of Norma ECG
2.5 ECG Rhythms
2.1 Human Heart
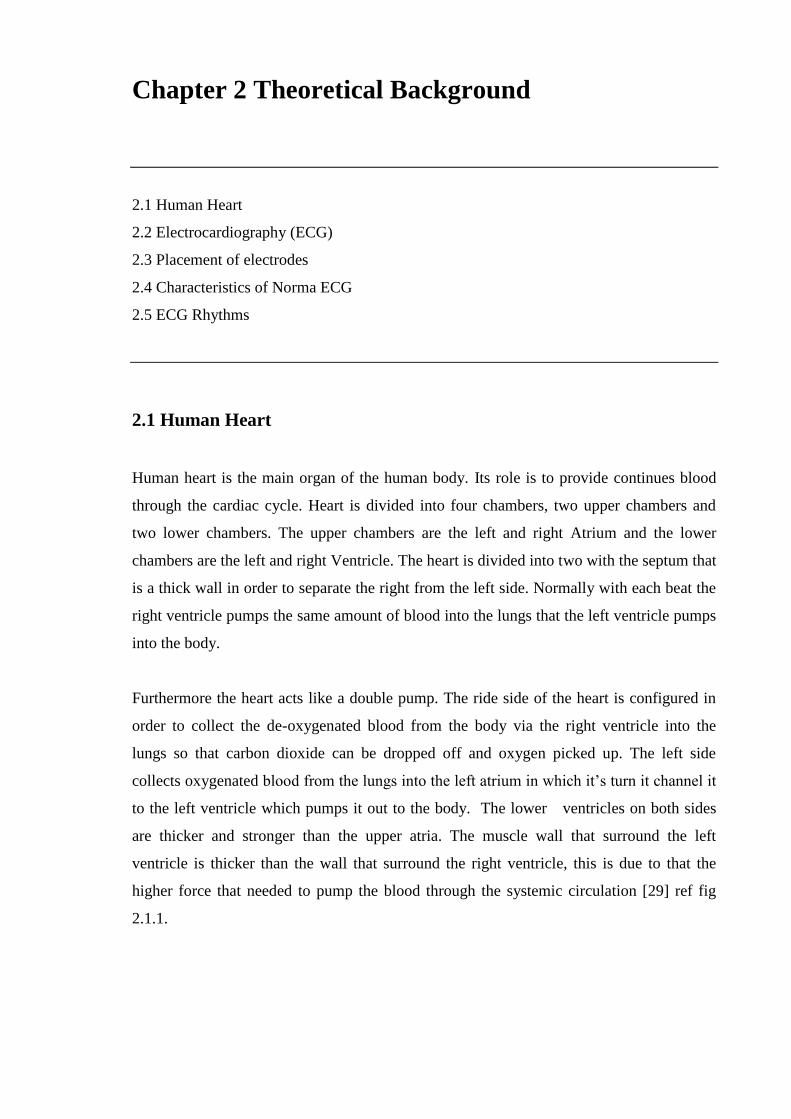
Human heart is the main organ of the human body. Its role is to provide continues blood
through the cardiac cycle. Heart is divided into four chambers, two upper chambers and
two lower chambers. The upper chambers are the left and right Atrium and the lower
chambers are the left and right Ventricle. The heart is divided into two with the septum that
is a thick wall in order to separate the right from the left side. Normally with each beat the
right ventricle pumps the same amount of blood into the lungs that the left ventricle pumps
into the body.
Furthermore the heart acts like a double pump. The ride side of the heart is configured in
order to collect the de-oxygenated blood from the body via the right ventricle into the
lungs so that carbon dioxide can be dropped off and oxygen picked up. The left side
collects oxygenated blood from the lungs into the left atrium in which it‘s turn it channel it
to the left ventricle which pumps it out to the body. The lower ventricles on both sides
are thicker and stronger than the upper atria. The muscle wall that surround the left
ventricle is thicker than the wall that surround the right ventricle, this is due to that the
higher force that needed to pump the blood through the systemic circulation [29] ref fig
2.1.1.
Reference 2.1.1: Human Heart [29]
2.2 Electrocardiography (ECG)
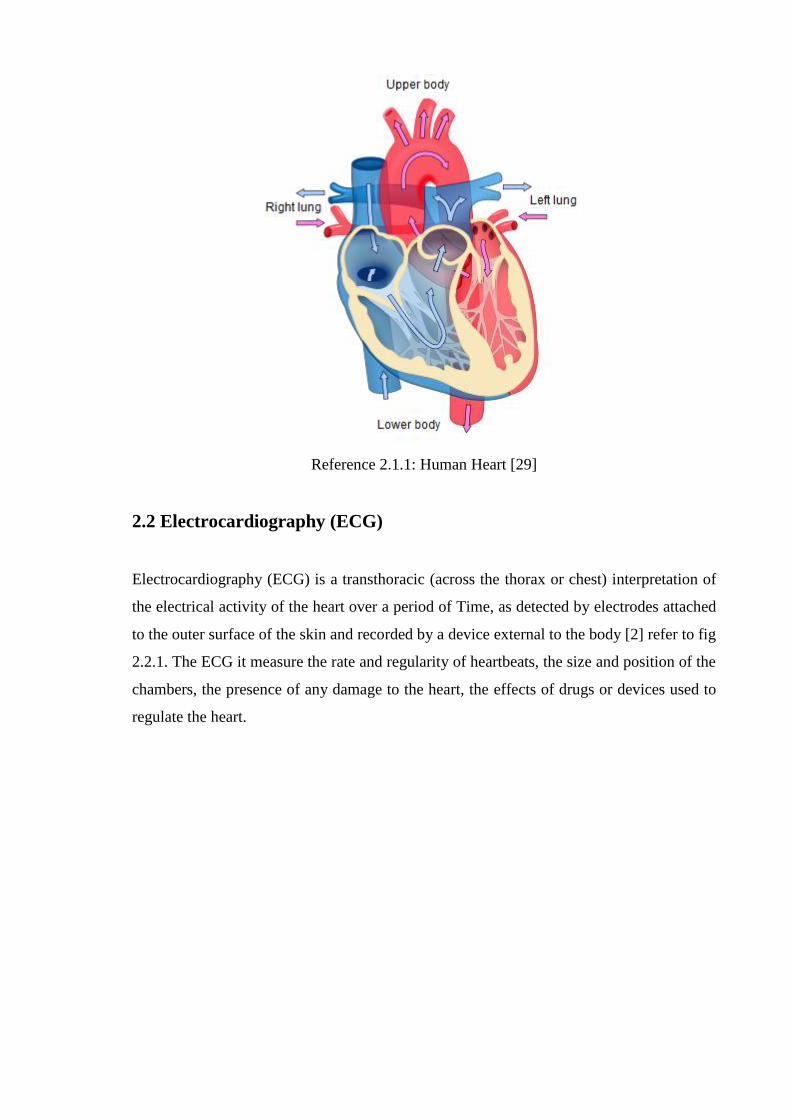
Electrocardiography (ECG) is a transthoracic (across the thorax or chest) interpretation of
the electrical activity of the heart over a period of Time, as detected by electrodes attached
to the outer surface of the skin and recorded by a device external to the body [2] refer to fig
2.2.1. The ECG it measure the rate and regularity of heartbeats, the size and position of the
chambers, the presence of any damage to the heart, the effects of drugs or devices used to
regulate the heart.
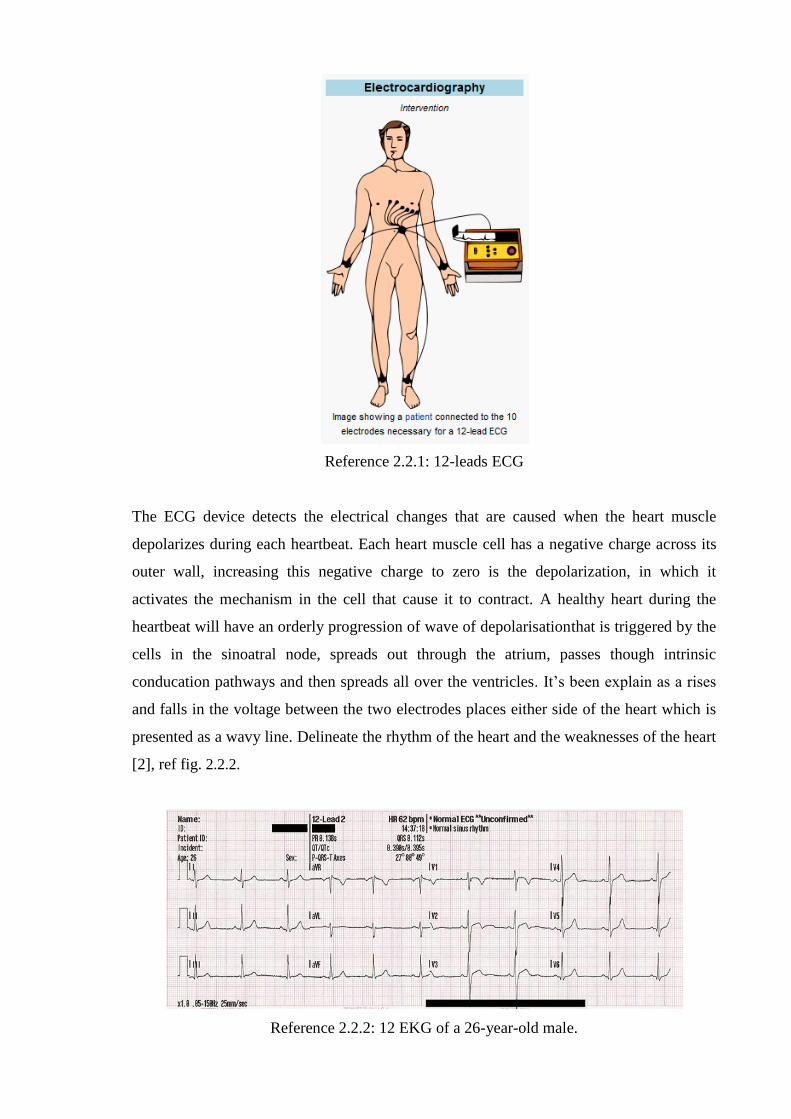
Reference 2.2.1: 12-leads ECG
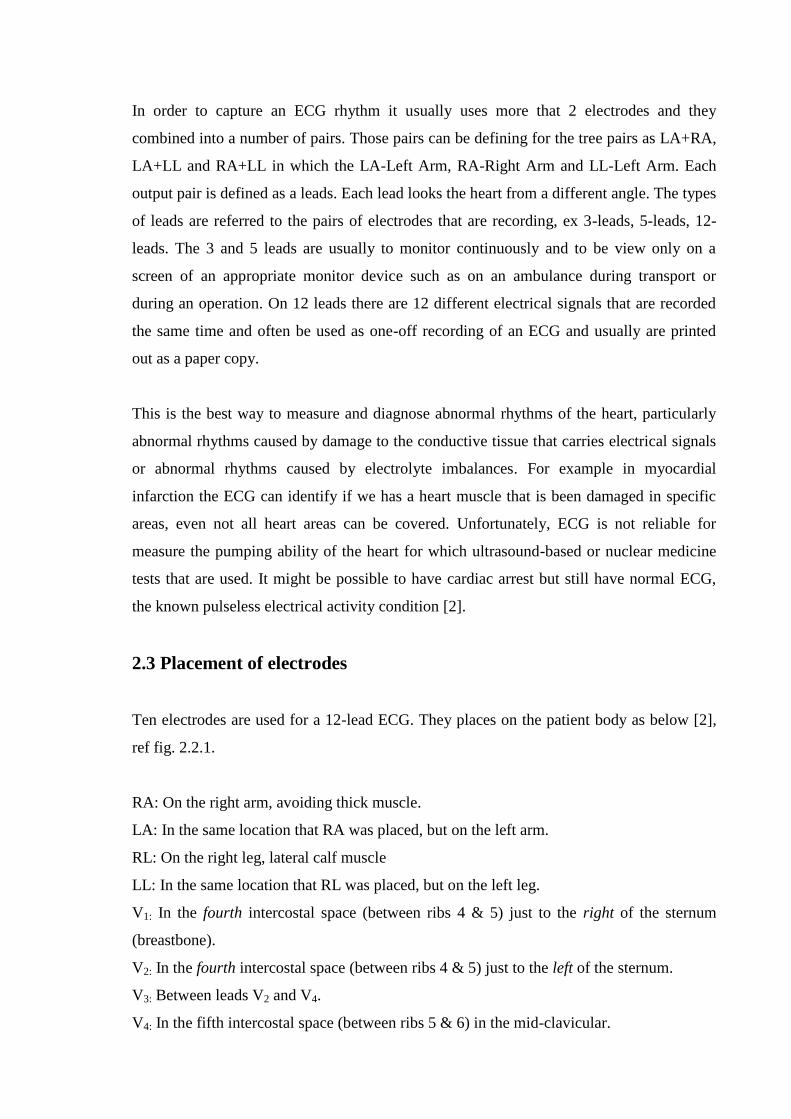
The ECG device detects the electrical changes that are caused when the heart muscle
depolarizes during each heartbeat. Each heart muscle cell has a negative charge across its
outer wall, increasing this negative charge to zero is the depolarization, in which it
activates the mechanism in the cell that cause it to contract. A healthy heart during the
heartbeat will have an orderly progression of wave of depolarisationthat is triggered by the
cells in the sinoatral node, spreads out through the atrium, passes though intrinsic
conducation pathways and then spreads all over the ventricles. It‘s been explain as a rises
and falls in the voltage between the two electrodes places either side of the heart which is
presented as a wavy line. Delineate the rhythm of the heart and the weaknesses of the heart
[2], ref fig. 2.2.2.
Reference 2.2.2: 12 EKG of a 26-year-old male.
In order to capture an ECG rhythm it usually uses more that 2 electrodes and they
combined into a number of pairs. Those pairs can be defining for the tree pairs as LA+RA,
LA+LL and RA+LL in which the LA-Left Arm, RA-Right Arm and LL-Left Arm. Each
output pair is defined as a leads. Each lead looks the heart from a different angle. The types
of leads are referred to the pairs of electrodes that are recording, ex 3-leads, 5-leads, 12-
leads. The 3 and 5 leads are usually to monitor continuously and to be view only on a
screen of an appropriate monitor device such as on an ambulance during transport or
during an operation. On 12 leads there are 12 different electrical signals that are recorded
the same time and often be used as one-off recording of an ECG and usually are printed
out as a paper copy.
This is the best way to measure and diagnose abnormal rhythms of the heart, particularly
abnormal rhythms caused by damage to the conductive tissue that carries electrical signals
or abnormal rhythms caused by electrolyte imbalances. For example in myocardial
infarction the ECG can identify if we has a heart muscle that is been damaged in specific
areas, even not all heart areas can be covered. Unfortunately, ECG is not reliable for
measure the pumping ability of the heart for which ultrasound-based or nuclear medicine
tests that are used. It might be possible to have cardiac arrest but still have normal ECG,
the known pulseless electrical activity condition [2].
2.3 Placement of electrodes
Ten electrodes are used for a 12-lead ECG. They places on the patient body as below [2],
ref fig. 2.2.1.
RA: On the right arm, avoiding thick muscle.
LA: In the same location that RA was placed, but on the left arm.
RL: On the right leg, lateral calf muscle
LL: In the same location that RL was placed, but on the left leg.
V1: In the fourth intercostal space (between ribs 4 & 5) just to the right of the sternum
(breastbone).
V2: In the fourth intercostal space (between ribs 4 & 5) just to the left of the sternum.
V3: Between leads V2 and V4.
V4: In the fifth intercostal space (between ribs 5 & 6) in the mid-clavicular.
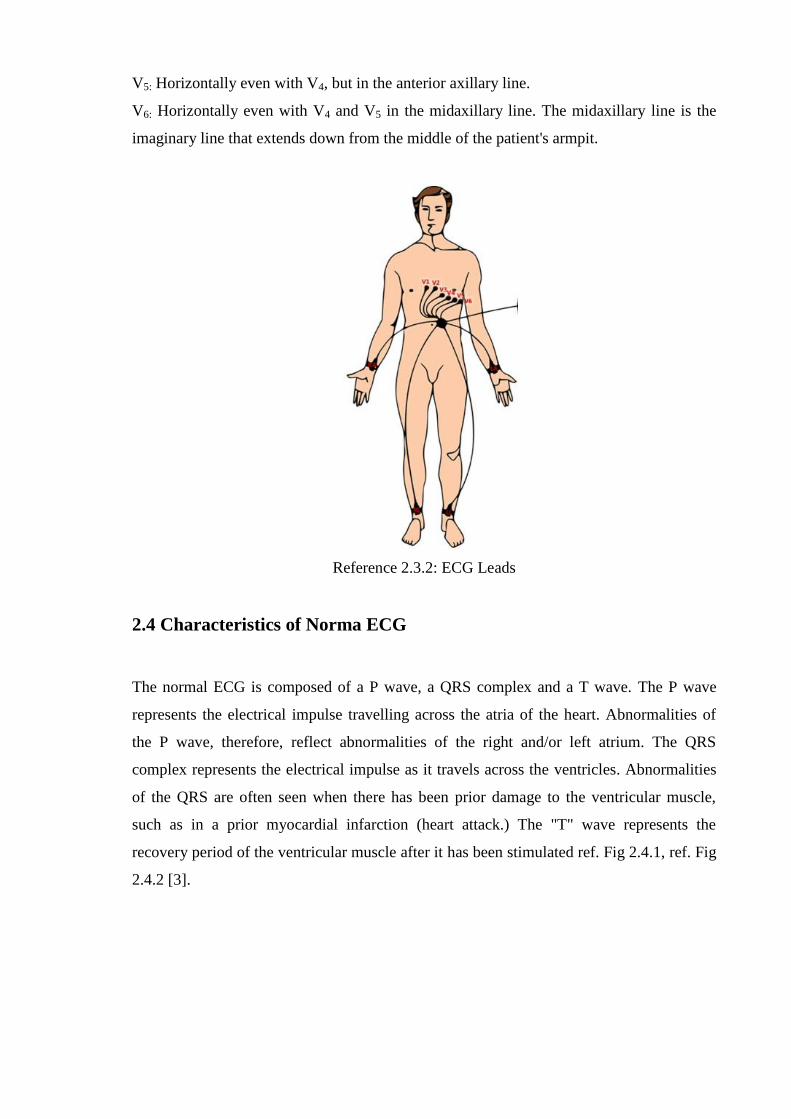
V5: Horizontally even with V4, but in the anterior axillary line.
V6: Horizontally even with V4 and V5 in the midaxillary line. The midaxillary line is the
imaginary line that extends down from the middle of the patient's armpit.
Reference 2.3.2: ECG Leads
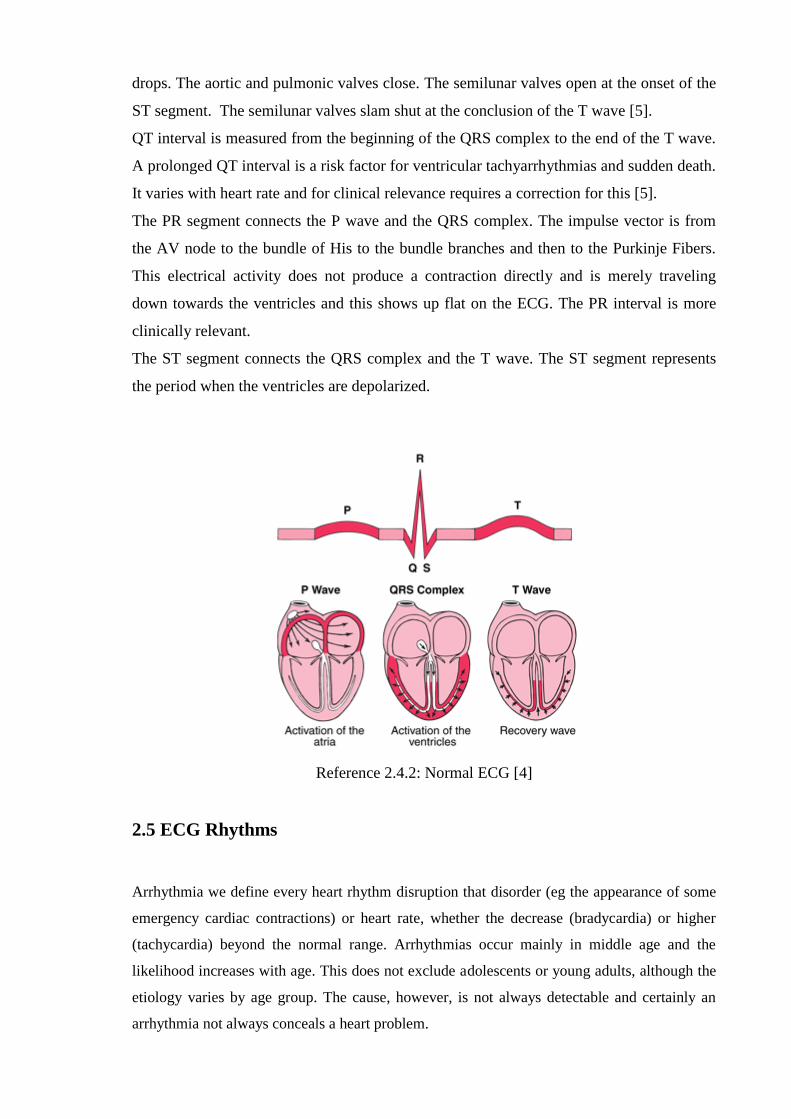
2.4 Characteristics of Norma ECG
The normal ECG is composed of a P wave, a QRS complex and a T wave. The P wave
represents the electrical impulse travelling across the atria of the heart. Abnormalities of
the P wave, therefore, reflect abnormalities of the right and/or left atrium. The QRS
complex represents the electrical impulse as it travels across the ventricles. Abnormalities
of the QRS are often seen when there has been prior damage to the ventricular muscle,
such as in a prior myocardial infarction (heart attack.) The "T" wave represents the
recovery period of the ventricular muscle after it has been stimulated ref. Fig 2.4.1, ref. Fig
2.4.2 [3].
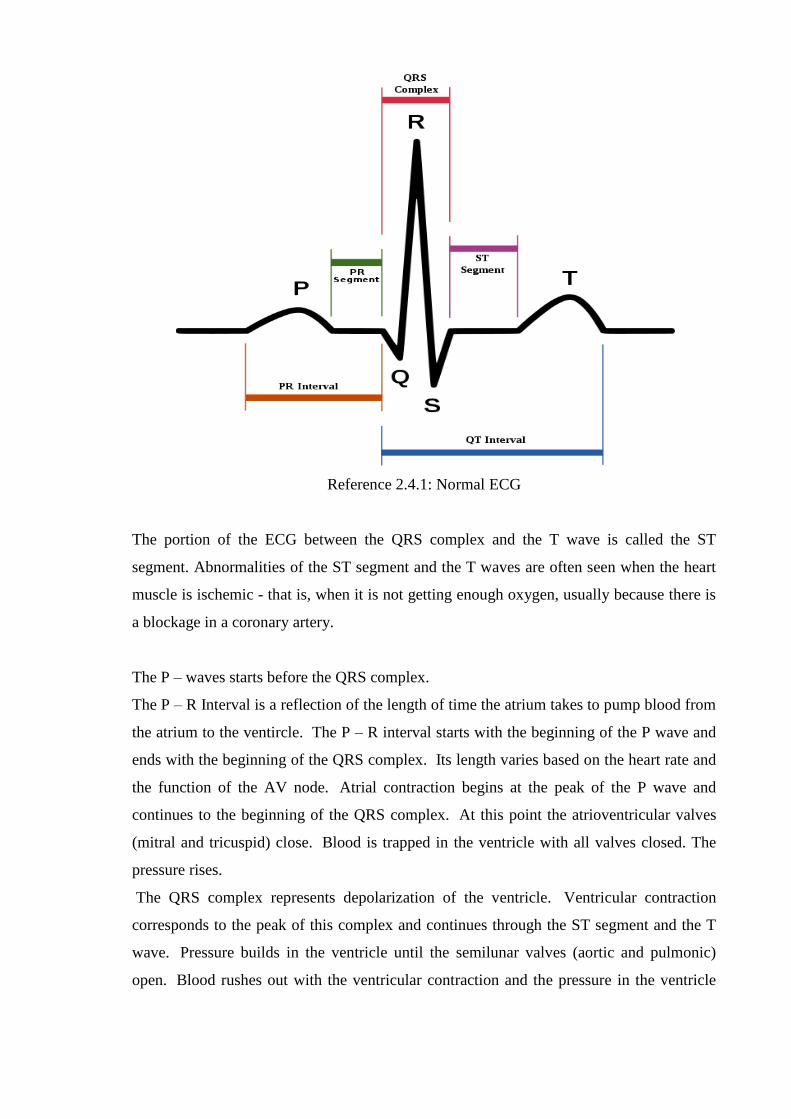
Reference 2.4.1: Normal ECG
The portion of the ECG between the QRS complex and the T wave is called the ST
segment. Abnormalities of the ST segment and the T waves are often seen when the heart
muscle is ischemic - that is, when it is not getting enough oxygen, usually because there is
a blockage in a coronary artery.
The P – waves starts before the QRS complex.
The P – R Interval is a reflection of the length of time the atrium takes to pump blood from
the atrium to the ventircle. The P – R interval starts with the beginning of the P wave and
ends with the beginning of the QRS complex. Its length varies based on the heart rate and
the function of the AV node. Atrial contraction begins at the peak of the P wave and
continues to the beginning of the QRS complex. At this point the atrioventricular valves
(mitral and tricuspid) close. Blood is trapped in the ventricle with all valves closed. The
pressure rises.
The QRS complex represents depolarization of the ventricle. Ventricular contraction
corresponds to the peak of this complex and continues through the ST segment and the T
wave. Pressure builds in the ventricle until the semilunar valves (aortic and pulmonic)
open. Blood rushes out with the ventricular contraction and the pressure in the ventricle
drops. The aortic and pulmonic valves close. The semilunar valves open at the onset of the
ST segment. The semilunar valves slam shut at the conclusion of the T wave [5].
QT interval is measured from the beginning of the QRS complex to the end of the T wave.
A prolonged QT interval is a risk factor for ventricular tachyarrhythmias and sudden death.
It varies with heart rate and for clinical relevance requires a correction for this [5].
The PR segment connects the P wave and the QRS complex. The impulse vector is from
the AV node to the bundle of His to the bundle branches and then to the Purkinje Fibers.
This electrical activity does not produce a contraction directly and is merely traveling
down towards the ventricles and this shows up flat on the ECG. The PR interval is more
clinically relevant.
The ST segment connects the QRS complex and the T wave. The ST segment represents
the period when the ventricles are depolarized.
Reference 2.4.2: Normal ECG [4]
2.5 ECG Rhythms
Arrhythmia we define every heart rhythm disruption that disorder (eg the appearance of some
emergency cardiac contractions) or heart rate, whether the decrease (bradycardia) or higher
(tachycardia) beyond the normal range. Arrhythmias occur mainly in middle age and the
likelihood increases with age. This does not exclude adolescents or young adults, although the
etiology varies by age group. The cause, however, is not always detectable and certainly an
arrhythmia not always conceals a heart problem.

An arrhythmia may not be felt by the patient, but can be found from a preventive check.
Sometimes it can take the form of "fluttering" or chest accompanied by dyspnea, substernal
pain, dizziness or unconsciousness. Of course there are cases that leads directly into cardiac
arrest and, if not mediate direct effects (cardiopulmonary resuscitation, defibrillation) to death.
As a general principle, however, here is concern that the patient should be commensurate with
the severity of symptoms, taking into account and their medical history.
The electrocardiogram (ECG), if done during the arrhythmia, it can detect and provide us with
sufficient evidence to its nature. However, since the arrhythmia may be transient and not
displayed during the test, they are and other methods such as exercise stress test and 24-hour
heart rhythm in order to check patient heart [7].
2.5.1 Normal Sinus Rhythm (NSR)
In a normal heart rhythm, the sinus node generates an electrical impulse which travels
through the right and left atrial muscles producing electrical changes which is represented
on the electrocardiogram (ECG) by the p-wave. The electrical impulse then continues to
travel through specialized tissue known as the atrioventricular node, which conducts
electricity at a slower pace. This will create a pause (PR interval) before the ventricles are
stimulated. This pause is helpful since it allows blood to be emptied into the ventricles
from the atria prior to ventricular contraction to propel blood out into the body. The
ventricular contraction is represented electrically on the ECG by the QRS complex of
waves. This is followed by the T-wave which represents the electrical changes in the
ventricles as they are relaxing. The cardiac cycle after a short pause repeats itself, and so
on ref. Fig. 2.5.1.1 [6].
Characteristics:
Rate: 60-100 per minute
Rhythm: R- R =
P waves: Upright, similar
P-R: 0.12 -0 .20 second & consistent
qRs: 0.04 – 0.10 second
P:qRs: 1P:1qRs

Reference 2.5.1.1: Normal Sinus Rhythm
2.5.2 Fast Heart Rate (Tachycardia)
This means that the impulse generating the heart beats are normal, but they are occurring at
a faster pace than normal. This is termed sinus tachycardia and is seen normally with
exercise, fever, anxiety, hypovemia, hypoxia, myocardial infarction, and responses to
stimulant drugs [5], [6].
Supraventricular tachycardia (SVT). In this abnormal heart rhythm the impulse
stimulating the heart is not generated by the sinus node, but instead comes from a
collection of tissue around and involving the atrioventricular (AV) node. These electrical
impulses from this abnormal site are generated at a rapid impulse, which may reach 280
beats per minute ref. Fig. 2.5.2.1 [6].
Reference 2.5.2.1: Supraventricular tachycardia
In this abnormal rapid heart rhythm the abnormal tissue generating the rapid heart rate is
also in the atria, however, the atrioventricular node is not involved. Since the
atrioventricular node is slow conduction tissue and it is not involved in this type of
abnormal heart rhythm the heart rate in this case (atrial flutter) would be faster than that in
supraventricular tachycardia where the atrioventricular node is involved in generating the
abnormal heart rhythm and will cause it to be slower ref.fig.2.4.2.2 [6].
Characteristics:

Rate: > 100
Rhythm: R- R =
P waves: Upright, similar
P-R: 0.12 -0 .20 second & consistent
qRs: 0.04 – 0.10 second
P:qRs: 1P:1qRs
Reference 2.5.2.2: Atrial flutter
2.5.3 Slow Heart Rate (Sinus Bradycardia)
The heart may slow down, yet maintain the normal pattern of rhythm. In this case the heart
rate can be less than 60 beats per minutes. In a case of athletes in some case it might be
normal, but on other cases it may be due to vagal stimulation, sleep, ischemia to the SA
node, beta blockers, digitalis toxicity, increased ICP [5, 6] ref. Fig. 2.5.3.1.
Characteristics:
Rate: < 60
Rhythm: R- R =
P waves: Upright; similar
P-R: 0.12 -0 .20 second & consistent
qRs: 0.04 – 0.10 second
P:qRs: 1P:1qRs
Fig 2.5.3.1: Slow Heart Rate
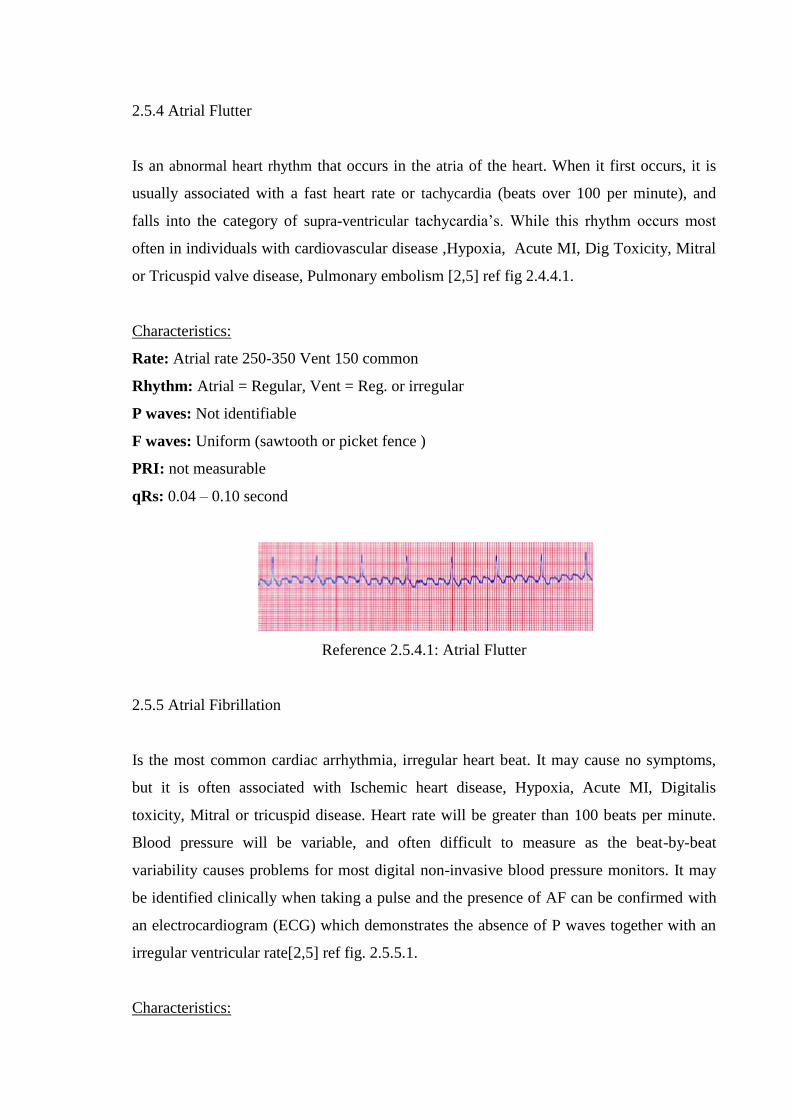
2.5.4 Atrial Flutter
Is an abnormal heart rhythm that occurs in the atria of the heart. When it first occurs, it is
usually associated with a fast heart rate or tachycardia (beats over 100 per minute), and
falls into the category of supra-ventricular tachycardia‘s. While this rhythm occurs most
often in individuals with cardiovascular disease ,Hypoxia, Acute MI, Dig Toxicity, Mitral
or Tricuspid valve disease, Pulmonary embolism [2,5] ref fig 2.4.4.1.
Characteristics:
Rate: Atrial rate 250-350 Vent 150 common
Rhythm: Atrial = Regular, Vent = Reg. or irregular
P waves: Not identifiable
F waves: Uniform (sawtooth or picket fence )
PRI: not measurable
qRs: 0.04 – 0.10 second
Reference 2.5.4.1: Atrial Flutter
2.5.5 Atrial Fibrillation
Is the most common cardiac arrhythmia, irregular heart beat. It may cause no symptoms,
but it is often associated with Ischemic heart disease, Hypoxia, Acute MI, Digitalis
toxicity, Mitral or tricuspid disease. Heart rate will be greater than 100 beats per minute.
Blood pressure will be variable, and often difficult to measure as the beat-by-beat
variability causes problems for most digital non-invasive blood pressure monitors. It may
be identified clinically when taking a pulse and the presence of AF can be confirmed with
an electrocardiogram (ECG) which demonstrates the absence of P waves together with an
irregular ventricular rate[2,5] ref fig. 2.5.5.1.
Characteristics:
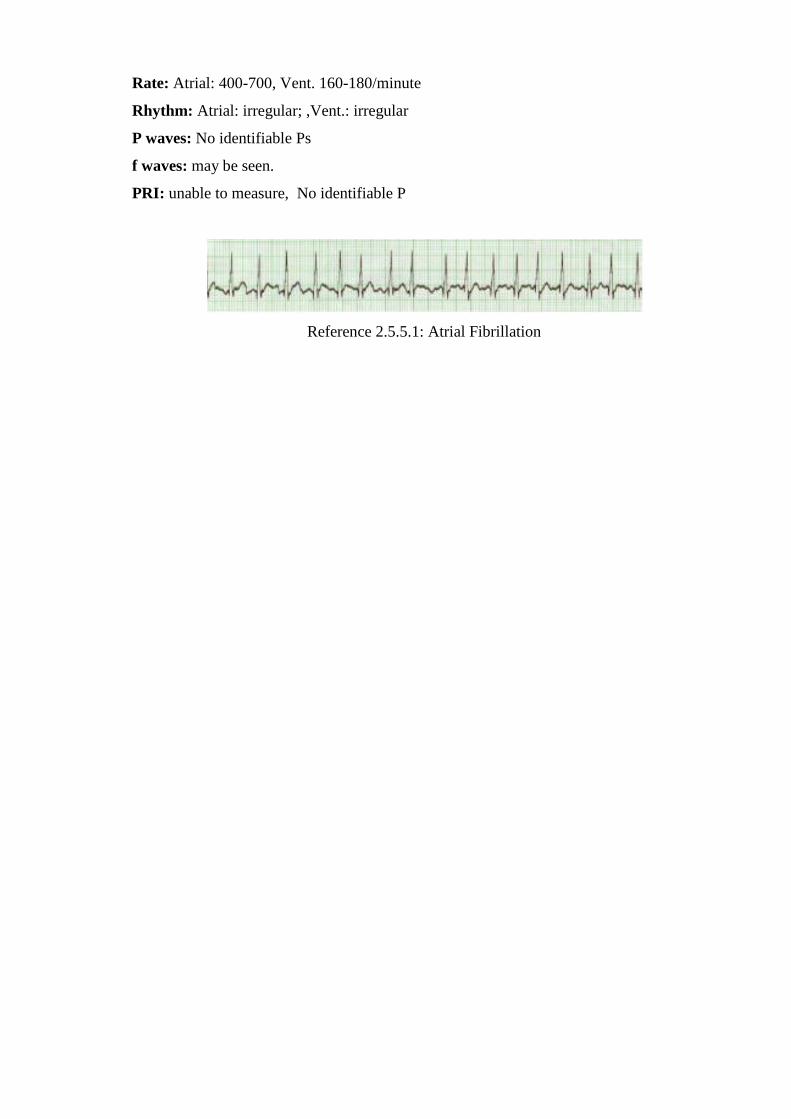
Rate: Atrial: 400-700, Vent. 160-180/minute
Rhythm: Atrial: irregular; ,Vent.: irregular
P waves: No identifiable Ps
f waves: may be seen.
PRI: unable to measure, No identifiable P
Reference 2.5.5.1: Atrial Fibrillation

Chapter 3 System Requirements
3.1 Introduction
3.2 Programming Language and Tools
3.3 Network and Communications
3.4 Smartphone‘s
3.5 Medical Devices
3.6 System Operations and Functions
3.1 Introduction
In this section we will be concentrating to the technologies that we use in order to complete
the thesis. We will concentrate in the programming language that is going to be used, the
communications protocols that were used, and the devices that we use in order to complete
the thesis. Furthermore on the communication between the device application and the main
server.
3.2 Programming Language and Tools
The programming tool that will be used for the implementation of the system both for
patient portal and doctor portal will be eclipse using the Android Development Tools
(ADT) Plugin [30]. Is an open source community that develops open platforms and
products. It includes all the necessary libraries for simple projects. It gives the ability to the
user to create the form and the design of the application. The application will be using
Android Platform 2.3.3 with API Lever 10. For the implementation of the cardiac plot we
will use the Android Plot library in witch is a Java API for creating dynamic and static
charts within an android application. This library is build exclusively for the Android
platform [8].
The system will be developing for Android devices. Android is a software stack for mobile
devices that includes an operating system, middleware and key applications. The Android
SDK provides the tools and APIs necessary to begin developing applications on the
Android platform using the Java programming language.
3.3 Networks and Communications
3.3.1 Wi-Fi Network
Wi-Fi is a popular technology that allows an electronic device to exchange data wirelessly
using radio waves over a computer network, including high-speed Internet connections
[35]. Devices that include Wi-Fi such as a personal computer, Smartphone, etc, can
connect to the internet using a wireless network access point. Connecting the devices with
a Wi-Fi network gives the ability to the user to use several functionalities of the internet if
the device supports those functionalities. Such functionality is the VoIP, it gives the ability
to the user to make telephone calls through internet using some tools.
A Wi-Fi-enabled device can connect to the Internet when within range of a wireless
network connected to the Internet. The coverage of one or more (interconnected) access
points—called hotspots—comprises an area as small as a few rooms or as large as many
square miles. Coverage in the larger area may depend on a group of access points with
overlapping coverage Wi-Fi allows cheaper deployment of local area networks (LANs).
Also spaces where cables cannot be run, such as outdoor areas and historical buildings, can
host wireless LANs. Manufacturers are building wireless network adapters into most
laptops [11].
The main issue with wireless network security is its simplified access to the network
compared to traditional wired networks such as Ethernet. Most business networks protect
sensitive data and systems by attempting to disallow external access [36]. Enabling
wireless connectivity reduces security if the network uses inadequate or no encryption. An
attacker who has gained access to a Wi-Fi network router can initiate a DNS spoofing
attack against any other user of the network by forging a response before the queried DNS
server has a chance to reply [11].
3.3.2 Bluetooth
Bluetooth is a proprietary open wireless technology standard for exchanging data over
short distances (using short-wavelength radio transmissions in the ISM band from 2400-
2480 MHz) from fixed and mobile devices, creating personal area networks (PANs) with
high levels of security. Bluetooth uses a radio unlicensed technology called frequency-
hopping spread spectrum, which chops up the data being sent and transmits chunks of it on
up to 79 bands (1 MHz each; centered from 2402 to 2480 MHz) in the range 2,400-
2,483.5 MHz (allowing for guard bands).
A master Bluetooth device can communicate with a maximum of seven devices in a
piconet an ad-hoc computer network using Bluetooth technology, though not all devices
support this limit. At any given time, data can be transferred between the initial device and
one other device [10].
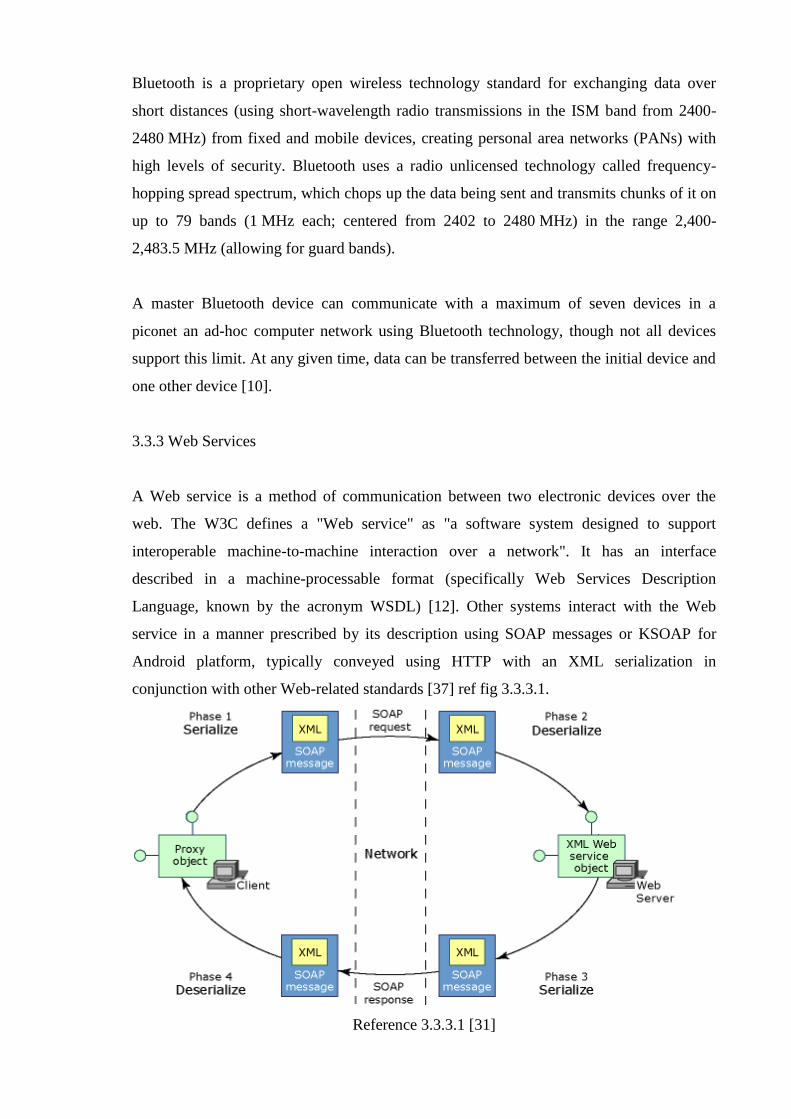
3.3.3 Web Services
A Web service is a method of communication between two electronic devices over the
web. The W3C defines a "Web service" as "a software system designed to support
interoperable machine-to-machine interaction over a network". It has an interface
described in a machine-processable format (specifically Web Services Description
Language, known by the acronym WSDL) [12]. Other systems interact with the Web
service in a manner prescribed by its description using SOAP messages or KSOAP for
Android platform, typically conveyed using HTTP with an XML serialization in
conjunction with other Web-related standards [37] ref fig 3.3.3.1.
Reference 3.3.3.1 [31]

SOAP, originally defined as Simple Object Access Protocol, is a protocol specification for
exchanging structured information in the implementation of Web Services in computer
networks. It relies on Extensible Markup Language (XML) for its message format, and
usually relies on other Application Layer protocols, most notably Hypertext Transfer
Protocol (HTTP) and Simple Mail Transfer Protocol (SMTP), for message negotiation and
transmission. SOAP can form the foundation layer of a web services protocol stack,
providing a basic messaging framework upon which web services can be built [9] ref fig
3.3.3.1.
3.4 Smartphone’s
A Smartphone is a mobile phone built on a mobile computing platform, with more
advanced computing ability and connectivity than a feature phone. The Android operating
system for Smartphone was released in 2008. Android is an open-source platform backed
by Google, along with major hardware and software developers [13].
The current ECG Application will be develop using HTC Desire. The operating system
that is using is Android OS 2.1 upgraded to Android 2.3 (Gingerbread). The phone uses a
1 GHz ARMv7 "Snapdragon" processor, WLAN Wi-Fi 802.11 b/g, Bluetooth v2.1 with
A2DP. Display screen type AMOLED or SLCD, 16M colours Size 480 x 800 pixels, 3.7
inches with touch screen [14] ref fig. 3.4.1.
Reference 3.4.1: HTC Desire

3.5 Medical Devices
Dyna-Vision is a high-quality medical device used to collect record and transmit a range of
vital signs. These can be monitored in real-time using software on a computer, tablet PC or
Smartphone. The Dyna-Vision unit is classified as a class IIb medical device and is
allowed for use in intensive care environment. The patient is connected using sensors and
cable wires.
The units are used on patients that need to be monitored in hospitals, at home, while
travelling or during transportation in ambulances.
The device has the ability to collect ECG up to 12 leads (3, 5, 12 leads). Also can record
heart rate, plethysmogram, heart oxygen and record up to 100 samples per second [15] ref.
Fig. 3.5.1.
Reference 3.5.1: Dyna-vision device
3.6 System Operations and Functions
3.6.1 Patient Functionality
Patient will have to gather his/her vital information‘s according to the doctor advice. The
system will be placed on the patient house. That information‘s will be uploading to the
Application Server that is hosting the database. In order to upload the patient data the
system will have built in a function that will work with the web service of the Application
Server. The methods that are being using inside the web service in order to upload the data
to the server are: AddBloodPressure in which is be used in order to send the data of blood
pressure. The AddECGAnalized12Lead, AddECGAnalized3Lead and
AddECGAnalized5Lead in order to send the patient ECG according to the leads that were
selected. AddHeartRate to send patient heart rate. The AddOxygenSaturation for
uploading the Oxygen Saturation, the AddPlethysmogram for sending the patient
Plethysmogram and the AddWeight for patient weight.
Furthermore the user has the functionality of Stand Alone Mode. By selecting this mode
user will be able to collect all the vitals information‘s that are needed, to be view on the
display screen but will not be able to upload the data on the Database server.
3.6.2 Doctor Functionality
On the other side, on the Doctor side, the Doctor has the ability to view the information‘s
of the patient. Using the web service that is located on the Server will download the data
for a certain patient selecting what information‘s will be downloading and then display that
information on the graph of its Smartphone.
The web services functions that are going to be used are: getBatchTimeStamps it will
display all the dates and times that the certain patient upload data on the server database.
The getBloodPressure will download the patient Blood Pressure. getEcgAnalized function
according what the doctor has define on the leads with download the values for the
appropriate leads. The getHeartRate will provide to the doctor the Heart Rate values. The
getOxygenSaturation it download the Oxygen Saturation. Moreover the getPlethysmogram
will download the Plethysmogram values and last the getWeight it download the patient
weight.

Chapter 4 Analysis of Previous Work
4.1 Introduction
4.2 Previous Systems
4.3 Compare existing systems with proposed system
4.4 Development of existing system
4.1 Introduction
In this section we will analysis previous jobs upon this subject. A small research about
other systems or papers that strengthen our opinion on mobile ECG for distance medical
care. Beside we will analyze the functionalities of previous systems that take in mind in
order to build the new system and what are the changes that were made in order to increase
the functionalities and to be more useful.
4.2 Previous Systems
4.2.1 AliveCor
AliveCor is an ECG system design explicit for iPhone v4 device. For the capture of the
heart rate of the patient it using an iPhone device and a low power, wireless case of the
iPhone that it clips on it, turning the iPhone to a wireless clinical cardiac recorded device.
The cover contain two electros that are be using by holding your hands on it or by adding
the phone on your chest. Beside that there is and the iCard compatible version for iPhone
v3 [18]. The iCard is not connected with a Bluetooth session but is connected directly to
the iPhone device ref fig 4.2.1.1.
The certain device can be used from anyone in order to record their ECG live. After
recording that information‘s they can be turned into a pdf that can be sent to any doctor
anywhere in the world, in which what cardiac patients need is. Beside that can be used as a
feedback device for people that want to train them self to relax on getting their heart rate
down.

Reference 4.2.1.1 iPhone connected with iCard
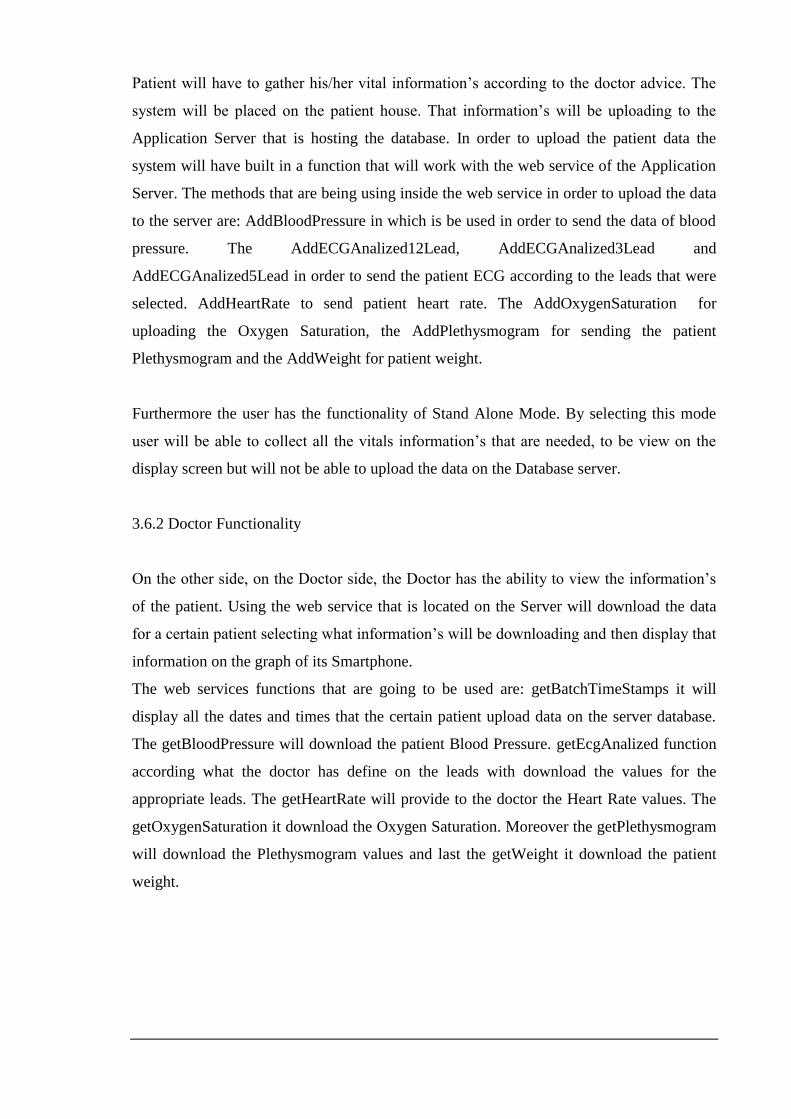
4.2.2 Human++ BAN
Dutch researchers have hacked electrocardiogram (ECG) sensors to Android
phone using an ultra-low-power short-range network. The app tracks & displays the Live
readings with a pretty graph of your own heart activity. The graph‘s behaviour is
monitored by the application and the application can take actions when it thinks it the time.
If your heart stops or lags for a bit, the app can immediately contact a doctor, or the
emergency services, via Wi-Fi or 3G.
It aims to achieve highly miniaturized and autonomous sensors systems that enable people
to carry their personal body area network. The body area network will provide medical,
lifestyle, assisted living, sports or entertainment functions. The system is using low
consumption sensors for electrocardiogram. Those sensors monitor the activities of the
organs of the patient and transmit the data to a hub or on the patient device. Furthermore
the results are sending to the doctor and also alarm can sound in order to notify the patient
that something is not well and need to return to the normal health position.
In addition, app can support other sensors that can attach easily with Body Area Network.
With the right straps, electroencephalogram is also made possible, and the app would track
changes in your neurological condition. The app can be extended, as per the authors, to
even support other medical checkups like blood Pressure, sugar levels, etc [19] ref. Fig.
4.2.2.1.
According to the researches the only problem is that is working with Bluetooth
transmission. This is has as a disadvantage to squeeze the battery just in one day. The next
step of the project is to use low power transmitter with a combination with the sensors.
Reference 4.2.2.1: ECG Human++ BAN
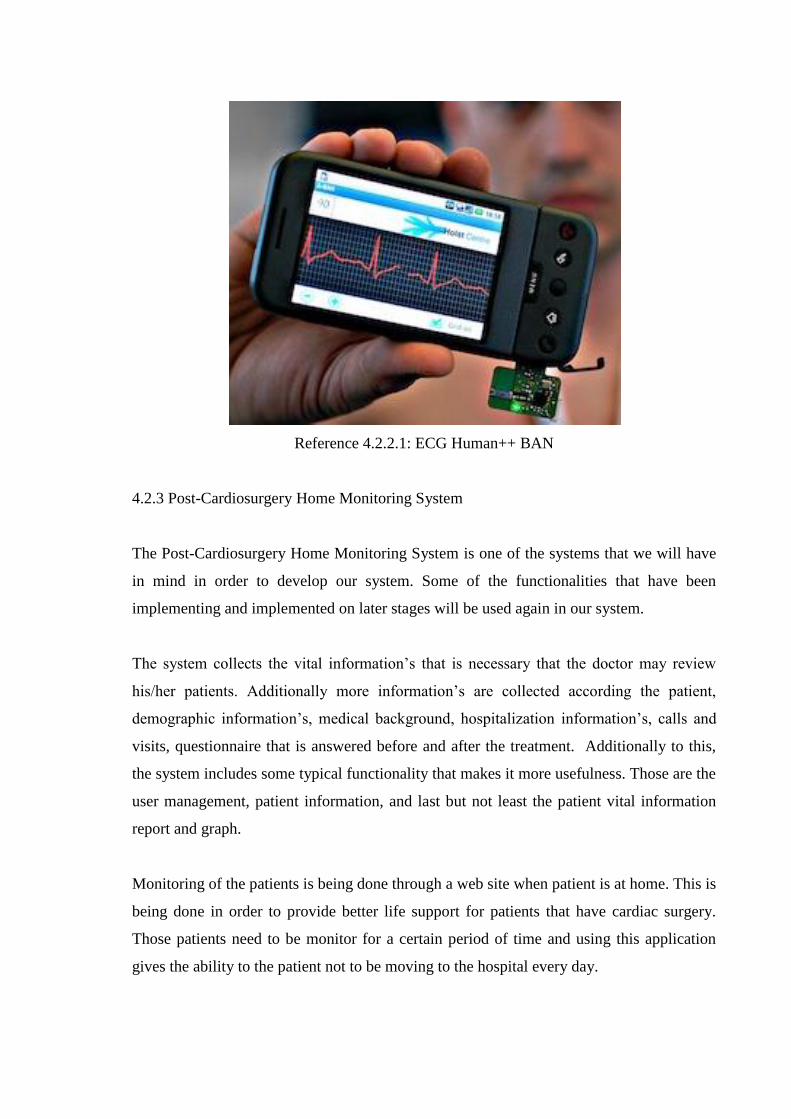
4.2.3 Post-Cardiosurgery Home Monitoring System
The Post-Cardiosurgery Home Monitoring System is one of the systems that we will have
in mind in order to develop our system. Some of the functionalities that have been
implementing and implemented on later stages will be used again in our system.
The system collects the vital information‘s that is necessary that the doctor may review
his/her patients. Additionally more information‘s are collected according the patient,
demographic information‘s, medical background, hospitalization information‘s, calls and
visits, questionnaire that is answered before and after the treatment. Additionally to this,
the system includes some typical functionality that makes it more usefulness. Those are the
user management, patient information, and last but not least the patient vital information
report and graph.
Monitoring of the patients is being done through a web site when patient is at home. This is
being done in order to provide better life support for patients that have cardiac surgery.
Those patients need to be monitor for a certain period of time and using this application
gives the ability to the patient not to be moving to the hospital every day.
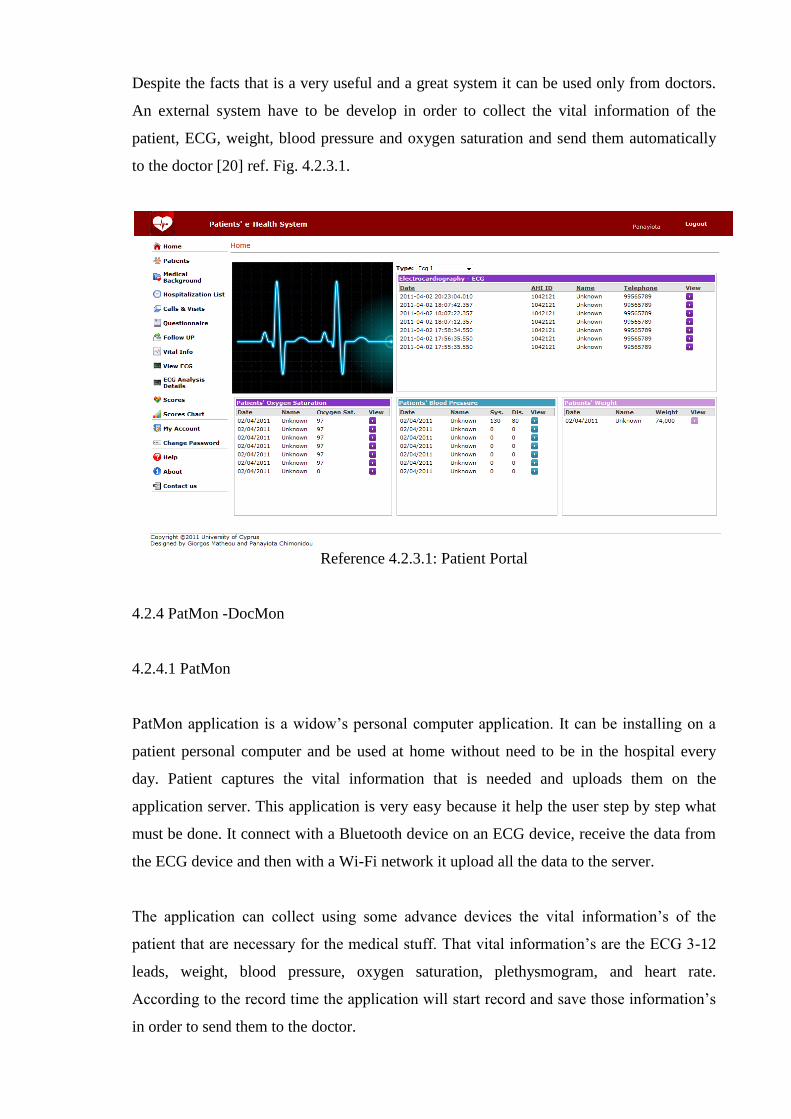
Despite the facts that is a very useful and a great system it can be used only from doctors.
An external system have to be develop in order to collect the vital information of the
patient, ECG, weight, blood pressure and oxygen saturation and send them automatically
to the doctor [20] ref. Fig. 4.2.3.1.
Reference 4.2.3.1: Patient Portal
4.2.4 PatMon -DocMon
4.2.4.1 PatMon
PatMon application is a widow‘s personal computer application. It can be installing on a
patient personal computer and be used at home without need to be in the hospital every
day. Patient captures the vital information that is needed and uploads them on the
application server. This application is very easy because it help the user step by step what
must be done. It connect with a Bluetooth device on an ECG device, receive the data from
the ECG device and then with a Wi-Fi network it upload all the data to the server.
The application can collect using some advance devices the vital information‘s of the
patient that are necessary for the medical stuff. That vital information‘s are the ECG 3-12
leads, weight, blood pressure, oxygen saturation, plethysmogram, and heart rate.
According to the record time the application will start record and save those information‘s
in order to send them to the doctor.
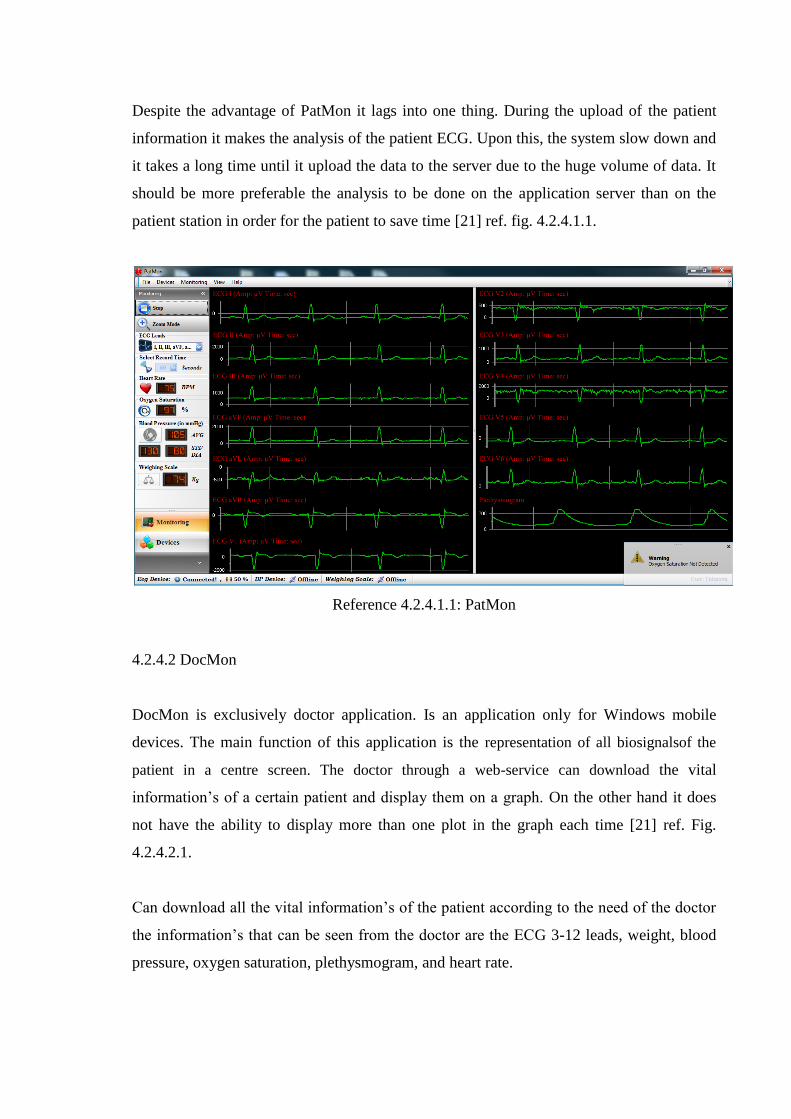
Despite the advantage of PatMon it lags into one thing. During the upload of the patient
information it makes the analysis of the patient ECG. Upon this, the system slow down and
it takes a long time until it upload the data to the server due to the huge volume of data. It
should be more preferable the analysis to be done on the application server than on the
patient station in order for the patient to save time [21] ref. fig. 4.2.4.1.1.
Reference 4.2.4.1.1: PatMon
4.2.4.2 DocMon
DocMon is exclusively doctor application. Is an application only for Windows mobile
devices. The main function of this application is the representation of all biosignalsof the
patient in a centre screen. The doctor through a web-service can download the vital
information‘s of a certain patient and display them on a graph. On the other hand it does
not have the ability to display more than one plot in the graph each time [21] ref. Fig.
4.2.4.2.1.
Can download all the vital information‘s of the patient according to the need of the doctor
the information‘s that can be seen from the doctor are the ECG 3-12 leads, weight, blood
pressure, oxygen saturation, plethysmogram, and heart rate.

Reference 4.2.4.2.1: DocMon
4.2.5 Multicenter randomised trial on home-based telemanagement to prevent hospital
readmission of patients with chronic heart failure
The aim of the study was to determine whether a home-based telemanagement (HBT)
programme in CHF patients decreased hospital readmissions and hospital costs in
comparison with the usual care (UC) follow-up programme over a one-year period.
Four hundred-sixty CHF patients (pts), aged 57±10 years were randomised to two
management strategies: 230 pts to HBT programme and 230 pts to UC programme. The
HBT pts received a portable device, transferring, by telephone, a one-lead trace to a
receiving station where a nurse was available for interactive teleconsultation. The UC pts
were referred to their primary care physicians and cardiologists. The primary objective of
the study was one-year hospital readmission for cardiovascular reasons. The rate of hearth
failure-related readmission was 19% (43 pts) in HBT group and 32% (73 pts) in UC group.
After adjusting for clinical and demographic characteristics, the HBT group had a
significantly lower risk of readmission compared with the UC group. This study suggests
that one-year HBT programme reduce hospital readmissions and costs in CHF patients
[22].

4.2.6 A new telemonitoring system intended for chronic heart failure patients using mobile
telephone technology — Feasibility study
The main purpose of the study was to propose of a new wireless telemonitoring system via
a mobile network for patients in chronic heart failure. System may help to detect early
signs of cardiac decompensation, allowing optimization of and adherence to treatments in
chronic heart failure. With other studies the telemedical support was online only in office
hours in which were limit efficacy. On the certain study was setup a dedicated telemedical
centre that was provide service 24 h a day 7 days a week.
Patients that were selected have to fill in some criteria‘s. They have to be greater than 18,
they were in New York Heart Association call II or class III with a left ventricular ejection
fraction <=35%. Besides that, they have to have at least one episode of decompensation in
the previous 24 months with hospitalization.
The system that was used was installed on a personal digital assistant (PDA) using wireless
Bluetooth system. In order for the system to function it required mobile phone network
connection. Additional to that three devices are used in order to collect the
electrocardiogram measurements, the blood pressure and the weight. All those three
devices support Bluetooth in order to send the data to the PDA. After a collection of the
information‘s the data where transmit through the mobile phone network where the
measurements are organized and sent to the local servers of the respective telemedical
centres.
Support centres where two telemedical centres that provide medical support 24/7 for the
entire period. A structure telephone contact between the telemedical sentre and the patient
was made once a month to discuss disease status, assess symptoms of depression, to
instruct the patient about dealing with emergency situations and to solve any technical
problems. Beside that each patient except from the PDA system was equipped with a
landline-based personal response system for a fast and direct connection between the
patient and the corresponding medical centre.
A clinical event committee blinded to treatment allocation assessed cause of death and
reason for hospitalization. The primary endpoint was total mortality. The first secondary
endpoint was a composite of cardiovascular mortality or hospitalization due to heart
failure. Other secondary endpoints included cardiovascular mortality, all-cause and cause-
specific hospitalizations as well as days lost due to heart failure hospitalization or
cardiovascular death, and changes in quality of life and NYHA class. Overall, 710 CHF
patients were recruited. The mean follow-up was 21.5 ± 7.2 months, with a minimum of 12
months.
4.2.7 LifeLink
National Telehealth Initiative will try to provide to Philippine a telehealth system for
remote consultations. This will done due to that Philippines has problems on medical care
that are the low doctor to patient ration, the concentration of medical specialist in urban
areas and the services of high expertise centres such as poisoning and trauma are difficult
to be replicated in underserved regions due, that are resource intensive and expensive to
maintain.
The benefits of, after the completion of the project will be affecting positive the medical
benefits, economic benefits and technological benefits. In more details:
Medical benefits:
o toxin or trauma patients in rural test sites maximized by network coverage
of K-Agrinet and MCT service communities
o patients who can benefit from remote access to expert specialists in PGH
o doctors involved in diagnosis because of their access to advanced
bioinstrumentation
Economic benefits:
o government and university via eventual OFW use and Medical Tourism via
patients
o start–up entrepreneurs and biomedical companies (benefiting from domestic
capabilities on ground-up design and construction of biomedical
instrumentation)
Technological benefits:
o Philippine academic institutions, academic degrees for research students
from NIP, DEEE and PGH;
o Interdisciplinary research fields ranging from diagnostics to pathology
The project objectives are to develop an application the RxBox that collects health data
from the patients and to establish an emergency care and coordinate service system at the
UP Manila National Telehealth centre.
The RxBox will be used from health centres in which they will collect real-time remote
monitoring data from experts on the centres. The steps on the online diagnostic questions
will be helping the medical stuff in the diagnose of the patient. The RxBox will collect the
ECG, Blood Pressure and Pulse-Ox that will be send using internet or GPRS and will be
sending to the medical centres in order to be integrated on the system. The data will be
displayed in real-time and analysed for the toxicology/trauma specialist. The specialist can
be located either on the TeleCenter or remotely and connected from a Smartphone or a
laptop. Visual inspection inspection could be established from the RxBox camera. Audio
will be used for streamed the voice or sound of heart, lungs or any other abdominal sounds
for more analysis.
Remote health facilities will use an electronic health record system to manage their
patients information‘s and this will be connected to the central operation centre when there
is a need to refer a patient to a higher level facility.
RxBox Objectives
1. To develop the necessary communications protocols for the Rx Box to transmit
data. The test beds shall be situated in rural and urban poor communities from
which health signals (sensor readings, video streaming, consultation and heart/lung
sounds) shall be transmitted via internet, SMS, MMS and GPRS to remote medical
specialists for evaluation.
2. To combine hardware and software protocols to enable multimedia streaming
throught internet for remote video consultation and emergency intervention for the
following servicers.
o Remote real-time monitoring of health and biological signals
o Audio-video remote medical consultation and diagnosis
o Electronic health-information collection, analysis and reporting
o Research and electronic statistical health analysis
o Interoperability and mobility of systems and operations
o Wireless telemicroscopy for microdiagnostics of TB and Dengue
4.3 Compare existing systems with proposed system
The main goal of all the previous systems is to improve the lifestyle of the patient that
suffers from heart problems. All the system that was described previous they invent
applications in order to monitor from distance the patient. They try using technology
devices to reduce admissions times to hospitals. They provide technology to the patient
such as Smartphone, personal computers, sensors, PDA and on doctor site web-services
and systems that analyse cardiac rhythms. According to chapter 4.2.5 using technology for
distance monitor of the patient reduce the cost from both part of patient and hospitals but
more important reduce the readmission of patient to hospitals. Beside that on chapter 4.2.6
remote patient management using PDA and external devices for collecting the
information‘s can help to detect signs of cardiac decompensation, allowing optimization of
and adherence to treatments in chronic heart failure (CHF). They have suggest that
telemedicine in CHF can reduce mortality by 30–35%. The aim of the TIM-HF study was
to investigate the impact of telemedical management on mortality in ambulatory CHF
patients.
My goal is to implement an application that will be suitable for remote medical monitor,
which have a cardiac surgery. The system that will be implementing will be upon the
existing system that is discussed on chapter 4.2.4., that was based on system that is discuss
on chapter 4.2.3. The system is using two different devices for monitor distance the
patients. User will be using the PatMon that need a personal computer device and doctor
will be using the DocMon that you need Windows Mobile Smartphone Device. Our goal is
to merge those two systems in one device with the same OS of the device. The OS that the
new system will be implementing is Android. This must be done due to that Windows
Mobiles are being replaced from Android OS which is open source OS. The system that we
have implement is already using advance technologies such as Smartphone‘s, web-
services, ECG devices etc. The difference with others is that does not provide support 24/7
due to that, the patient will collect all the vitals information‘s that are required and using
advance technologies the data will be send to a dedicated server and from there the
appropriate medical personnel using the same application will be able to view the results.
Another advantage that some of the previous systems that do not implemented are the leads
that can support. Some of them could only support only until 3 leads, with the patient
weight and the heart rate, but in our system we can support up to 12 leads, patient weight,
heart rate, blood pressure, oxygen saturation and plethysmogram.

4.4 Development of the existing System
My project is upon the current functionality of an existing system in order to develop it in
for a different OS. The project Post-Cardio surgery Home Monitoring System was
developed in phase 1 from Panagiota Ximonidou, and on phase 2 from Giorgos Matheou.
On this chapter it will be explain what has be done until now and what I will implement.
4.4.1 Overview of existing system
The system will be consisting from the follow systems, the application server, the Patient
Portal the ECG Analysis server and the ECG archive server. The Application server is web
service that is responsible for save all the data on the database of the server or for retrieve
any data. The Patient Portal is web site responsible for the representative of patients ECG
analysis, patient weight, oxygen saturation, blood pressure, plethysmogram and heart rate.
More over it can provide information‘s according the patient, such as medical
information‘s, or personal details, etc. Also can register new patients or doctors on the
system, completion of questionnaire from the patient, etc.
Beside that the PatMon it provides the ability to the patient to record the ECG rhythms.
The application is a windows based application for personal computers. Patient can
connect to the different external devices that are required to, in order to collect the ECG,
heart rate, oxygen saturation, blood pressure, weight, and plethysmogram. According to the
selected recorded time the application will start record the data and by the end of that
period will upload the data to the database of the Archive Server. PatMon can record up to
12 leads, function that other application‘s cannot support it.
Furthermore the DocMon application is the corresponding application for doctors and
medical personnel. DocMon is windows mobile application that does not support any other
OS. The medical personnel will be able using the web-service to download the vital
information‘s of the patient for a certain date and time and preview them on the device.
The ECG will be plot on the graph in order for the doctor to make the analysis and provide
to the patient the appropriate feedback.

4.4.2 New System
From the existing system nothing will be change, but upon the existing system the new one
will be create for different platform. The new system must cooperate with the existing
system such as the Application Server and Database Server. Will use the web-services
from the Application in order to add functionalities for saving data and retrieve data from
the Database Server. Furthermore, from the existing system the CardiacPortal will be use
in order to validate that data are upload in the database correct and that, the display of the
data are correct concerning the new application draw and CardiacPortal display. The new
system will have the functionalities of DocMon and PatMon.
PatMon was gathering all the vital information‘s of the patient, patients ECG, weight,
oxygen saturation, blood pressure, plethysmogram and heart rate. In order to collect the
ECG will connect with Bluetooth to a dedicated device and retrieve the information‘s. Our
application has the ability to collect up to 12 leads. Beside that it supports the
reconstruction of plethysmogram. Also due to that the connection between two Bluetooth
devices is configure and set properly will be easy for the future to add other dedicated
devices in order to capture other vital information‘s. Moreover when all the vitals
information‘s are collected the on the main screen the graph will start display the data on
the plot. At the end of the process the data will be upload on the Database Server using the
functions of the web-service.
DocMon was the Doctor portal side. Was able to download and review the vital
information‘s that were sending from the patient to the database server. Doctor just has to
select the desire information‘s that need and retrieve them from the server. Upon this idea
on our application the doctor portal will be working. DocMon could only provide the graph
for one ECG each time. In our application we manage to pass this problem. According the
leads that has select previous from the settings and the other selection can display
simultaneous the same time on the graph 3 leads, 5, or 12 leads, or it can display the heart
rate, the weight , oxygen saturation, or plethysmogram. Additional, doctor would be able to
resume the same graph without needed to download again the data from the server. Also it
can pause the graph and move back or forward on the plot and with the resume button to
start again from the step that was moved.

Besides that, PatMon and DocMon where working on Windows personal computer and
Windows Mobile Device respectively. The new system will be working on Android OS.
This is be done due to that Android is a very promising OS with a dramatically increase of
devices that Android is installed. The application will be function on Android devices such
as Smartphone, tabled, notebooks. Despite that Android is an open source which allows a
lot of programmers to play around and create their own applications, in which iOS and
Microsoft does not provide such functionalities.
Chapter 5 Analysis and System Specifications
5.1 Introduction
5.2 System Analysis
5.3 Processes Flow Diagram
5.4 Database Structure
5.5 Design Phase
5.6 Class Diagram
5.7 Use Case Diagram
5.8 Sequence Diagram
5.9 Doctor and Patient Scenarios
5.1 Introduction
A system requirements specification is a structured collection of information that embodies
the requirements of a system [16]. The document must contain the problem, the system
functionality and the rules that must be applied in order for the system to function normal.
Upon that information the system will be design and implement.
With the implementation of the system we would like to solve the problem of patient with
heart rate problems that need to attend to hospital every day. We will implement a system
for distance monitor. The system must support ECG, heart rate, blood pressure, oxygen
saturation, weight, and plethysmogram.
5.2 System Analysis
5.2.1 System Description
The system will be consisting of 4 different subsystems which are:
ECG Application (Android Device)
Application Server (Web Services)
CardiacPortalDB (MS-SQL Database)
Cardiac Portal (Web site)
5.2.1.1 ECG Application (Android Device)
The system is compatible only with Android devices. It can be used both from doctors and
patient according the privileges that each user has. The system identification is been used
in order to provide to the user the appropriate privileges and redirect them to the
appropriate portal mode, patient portal or doctor portal.
5.2.1.1.1 Patient Portal
The main goal of patient site system is to collect the vital information‘s of the patient from
the ECG device. The data that will collect are the ECG (3-12 leads), plethysmogram, blood
oxygen, weight, heart rate and oxygen saturation. After the collection of the vital
information‘s those data will be uploading to the CardiacPortalDB Database using the
Application Server web-service. Beside that it include a device manager which it has the
ability to connect to the devices such as Bluetooth Device or Wi-Fi network device.
Moreover during the receiving of the data from the ECG device will have the ability to
view the data on a graph in real time. Patient has the opportunity to set up the ECG device
according to the instructions of the doctor. It can change the leads, heard rate values,
oxygen saturation values, recording time, etc. Beside that patient can select the Stand
Alone Mode that provides all the functionalities that the application can provide except
that cannot send the information‘s to the Database Server. This can be selected from the
user when the patient does not need to send the information‘s or is not able to connect to
the network or a have a personal medical assistance.
5.2.1.1.2 Doctor Site
On the other hand, due to that user is logged on the Doctor portal and is been authenticated
from the system, user will be able to user the appropriate functionalities of the Doctor
Portal mode. The main purpose of this function is to display the vital information‘s of the
patient in a graph. Doctor will have to provide to the web-service the patient id number and
it will return to the doctor all the date times for the selected patient. Those date times that
will return they are depend from the settings that the doctor select, the leads that need to
preview and if patient has record the selected leads and upload them to the server. After
doctor has select the date time that is required the vital information‘s of the patient are start
to be download on the doctor device. When download has finish it will start loading the
data on the application and on the device screen it starts the plod to be drawn. Doctor has
the ability to setup what information‘s needs to be downloaded. Can select the type of
ECG, if heart rate, plethysmogram, or oxygen saturations are needed.
5.2.1.2 Application Server (web-service)
The application server is a web-service that gives the ability to the doctor and patient to
retrieve and upload data to the server database respectively. The web-service it provides
the authentication of the user (doctor, patient) and then according to the type of the user it
provides access to the appropriate function in order to download or upload data.
The web service it provides the GET services in order for the Doctor to retrieve the data
from the database that have to do with the patient. Also doctor can use the
sendCredintialsToPatient service in order to send the credentials to the patient in order the
application can be used from the patient and can login on the system. Beside that has the
availability of recoverPassword service for receiving a new password for logged on the
application. Doctor Portal mode uses the follow methods:
getBatchTimeStamps
getBloodPressure
getEcgAnalized
getHeartRate
getOxygenSaturation
getPatient
getPlethysmogram
getWeight
recoverPassword
UserLogin
recoverPassword
sendCredintialsToPatient
The ADD methods from the web-service are being using from the Patient Portal mode.
There functionality is in order to provide them the ability to send the data to the Database
of the CardiacPortalDB. Depend from the settings that have been configuring the ECG
device the appropriate methods will be called in order to send the data. If patient does not
select the Stand Alone Mode then the PatientLogin method will be raided in order to
authenticate the patient with the database and allow to continue with the application.
AddBloodPressure
AddECGAnalized12Lead
AddECGAnalized3Lead
AddECGAnalized5Lead
AddHeartRate
AddOxygenSaturation
AddPlethysmogram
AddWeight
PatientLogin
5.2.1.3 CardiacPortalDB
The subsystem is the main database of the system. The database is divided into several
tables according to the needs. The storage to ECG values is saved into 3 different tables. It
has 1 table for each category of leads 3, 5 and 12 lead. Also there are tables to storage the
patient weight, oxygen saturation, blood pressure, plethysmogram and heart rate. All tables
are identifying by a unique key and the patient id in which it‘s connects to the patient table
according the patient id. The CardiacPortalDB will be using the same from the previous
system without any changes. This is being done due to that all the systems are need to
cooperate. They are systems for different users with the same database. The
CardiacPortalDB was re-designing on phase 2 from Giorgos Matheou and because it
covers our needs nothing will be change.
5.2.1.4 Cardiac Portal
Subsystem Cardiac Portal already exists from previous phase of development of the
system. Was initially developed on phase 1 from Panagiota Ximonidou and on phase 2
from Giorgos Matheou. Cardiac Portal is a web site responsible for display patients vital
information‘s such as ECG leads, weight, blood oxygen, etc. Beside that can display
several statistics base on patient vital information‘s and base on questioners that patient has
answer. Furthermore it can provide the functionality to register new patients or doctors on
the system. Also can displays several personal information‘s of the patient such as
telephone, address, etc. The system in our project is been using in order to compare the
results according the graph plot if is correct or not according the data that are upload on the
Server Database.
5.2.2 Application Interface
5.2.2.1 Users Screens
Screen 1: Initial Screen
This screen is display when the application is been started for both users.
On this screen must select the appropriate user type, patient or doctor in
order to forward them to the appropriate screen for login.
o Patient Portal Mode
Screen 1.1: Initial Screen
In this phase user can select if would like to login on the
system and continue as authenticated patient and be able to
use all the functionalities of the system or if prefer to select
the Stand Alone Mode without be able use full
functionalities such as the upload function.
Screen 1.2: Main Screen
On this screen patient will be able to view the vital
information‘s on the graph, setup the ECG device, and use
the devices.
Screen 1.3: Setup ECG Device
Patient can setup the ECG device according to the needs or
how is been ask from the appropriate medical personnel.
Screen 1.4: Devices

Patient can connect from this screen to a Wi-Fi network or
can connect with a Bluetooth to the ECG device and create a
pair of connection.
Screen 1.5: Send Data
When user is using the full functionality mode, after that
vital information‘s are preview on the screen a menu
appeared asking the user if prefer to send the data to the
application server or not.
o Doctor Portal Mode
Screen 1.1: Initial Screen
In this phase user must add its personal credentials in order to login
on the system and continue as authenticated doctor to be able to use
the system otherwise will not be able to continue
Screen 1.2: Recovery Password
In case that user has forgotten the password with this function can
add the username on the fields. Then a random new password will
be sending on the user email address.
Screen 1.3: Main Screen
On this screen doctor will be able to view the vital
information‘s on the graph, setup the settings for download,
and use the devices.
Screen 1.4: Settings
Doctor in this screen can select what data needs to be
downloading in the device. According the selection the
application will call the appropriate methods from the web-
service.
Screen 1.5: Send Credentials to Patient
Using this screen, doctor fill in the fields with the
corresponding data and after a validation the credentials of
the patient are send to the corresponding email that user add.
5.2.2.2 Hardware Needs
For the needs of the project in order for the application to be functional we need the
following device:
We need an Android OS phone with Android 2.3 (Gingerbread). The phone uses a
1 GHz ARMv7 "Snapdragon" processor, WLAN Wi-Fi 802.11 b/g, Bluetooth v2.1
with A2DP. Display screen type AMOLED or SLCD, 16M colours Size 480 x 800
pixels, 3.7 inches with touch screen
5.2.2.3 Communication Needs
For the needs concerning the communications are:
Wi-Fi network
Bluetooth
5.2.3 System Limitations
Memory
According the memory on the android device, there must be at least 256 MB SD
card. This is necessary due that both patient and doctor are using files that are saved
on the memory disk.
System
The system needs the entire screen in order to be able for the user to view the data.
Upon this the user will not be able to use any other application of the device.
5.3 Process Flow Diagram (PFD)
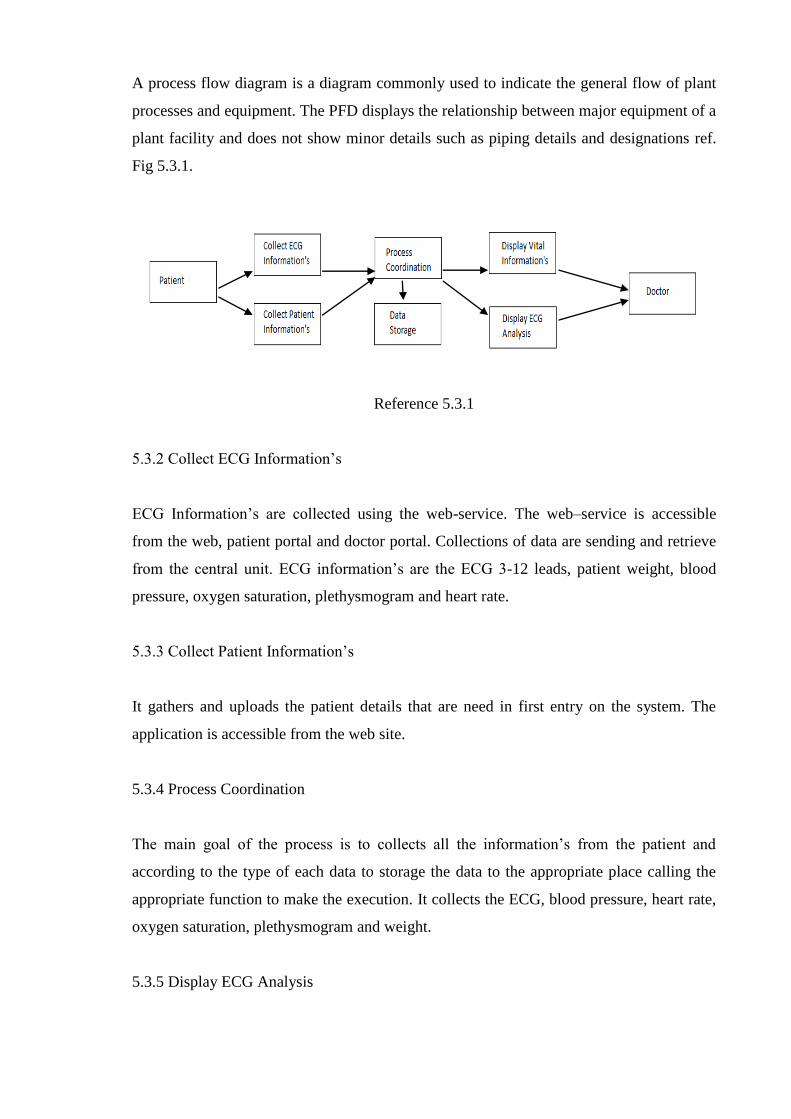
A process flow diagram is a diagram commonly used to indicate the general flow of plant
processes and equipment. The PFD displays the relationship between major equipment of a
plant facility and does not show minor details such as piping details and designations ref.
Fig 5.3.1.
Reference 5.3.1
5.3.2 Collect ECG Information‘s
ECG Information‘s are collected using the web-service. The web–service is accessible
from the web, patient portal and doctor portal. Collections of data are sending and retrieve
from the central unit. ECG information‘s are the ECG 3-12 leads, patient weight, blood
pressure, oxygen saturation, plethysmogram and heart rate.
5.3.3 Collect Patient Information‘s
It gathers and uploads the patient details that are need in first entry on the system. The
application is accessible from the web site.
5.3.4 Process Coordination
The main goal of the process is to collects all the information‘s from the patient and
according to the type of each data to storage the data to the appropriate place calling the
appropriate function to make the execution. It collects the ECG, blood pressure, heart rate,
oxygen saturation, plethysmogram and weight.
5.3.5 Display ECG Analysis
After a request from the doctor do the Display ECG Analysis process according to the
filter conditions it retrieve the appropriate data from the database the display them in the
graph.
5.3.6 Display Vital Information‘s
When the doctor needs to see the patient vital information‘s it call the Display Vital
Information‘s process with the appropriate filters that are define from the doctor and get
the patient weight, blood pressure, oxygen saturation, plethysmogram and heart rate.
5.3.7 Data Storage
The data that are collected from the different process or the request calls that are made
from the process are passed to the Process Coordination in which the process it decide
accordingly what process to raise in order to add, modify or delete from the data storage
database.
5.4 Database Structure
The database structure ref.fig 5.4.1 represents a part of the database. It represents only the vital
tables needed for the ECG of the patient. The database will be used as is build on until know
from the previous phase of the system.
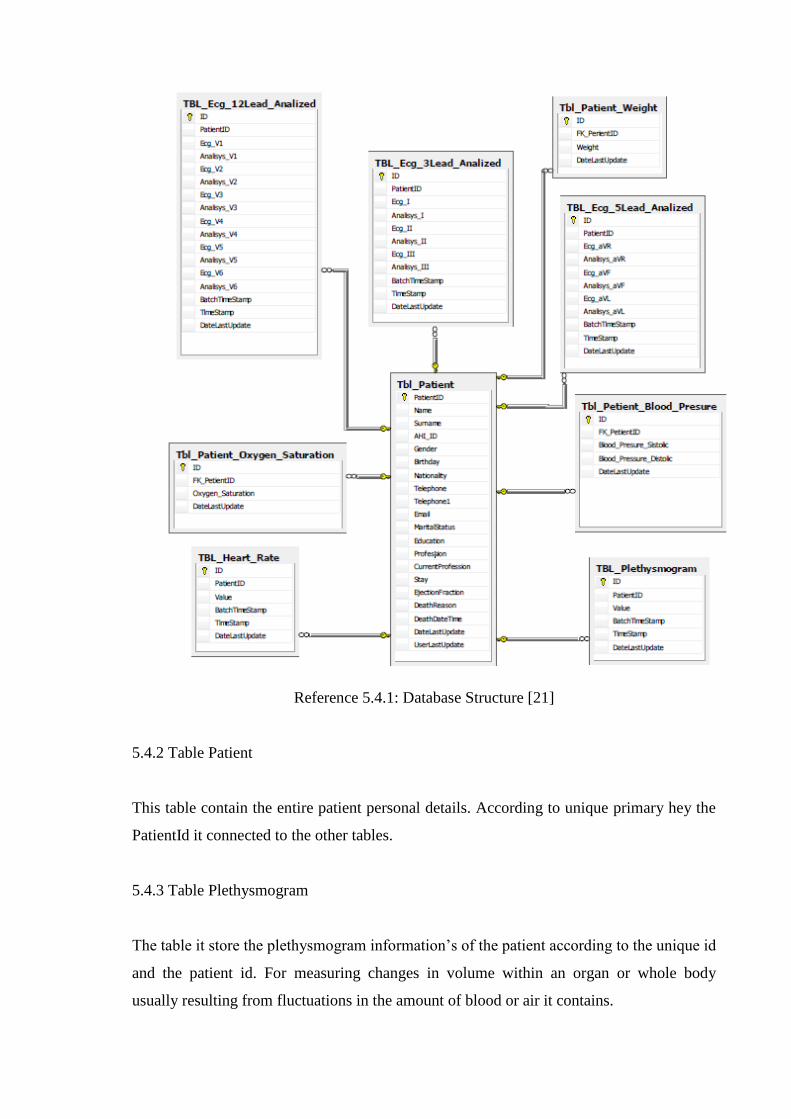
Reference 5.4.1: Database Structure [21]
5.4.2 Table Patient
This table contain the entire patient personal details. According to unique primary hey the
PatientId it connected to the other tables.
5.4.3 Table Plethysmogram
The table it store the plethysmogram information‘s of the patient according to the unique id
and the patient id. For measuring changes in volume within an organ or whole body
usually resulting from fluctuations in the amount of blood or air it contains.
5.4.4 Table ECG 3, 5, 12 Leads
Those tables save the ECG cardiac of the patient in the appropriate table.
5.4.4.1 Table ECG 3 Leads
The leads that save in the table are for 3 leads. The ECG values for 3 leads are I, II, III.
5.4.4.2 Table ECG 5 Leads
The leads that save in the table are for 5 leads. The ECG values for 5 leads are aVL, aVR
and aVF.
5.4.4.3 Table ECG 12 Leads
The leads that save in the table are for 12 leads. The ECG values for 12 leads are V1, V2I,
V3, V4, V5 and V6.
5.4.5 Table Oxygen Saturation
Oxygen saturation is a relative measure of the amount of oxygen that is dissolved or
carried in a given medium. The Oxygen is saved on the table using the primary key ID
with the Patient ID.
5.4.5.6 Table Blood Pressure
During each heartbeat, BP varies between a maximum systolic and a minimum diastolic
pressure. The two values are saves in the table using the primary key ID with the Patient
ID.
5.4.7 Table Weight
The patient weight value is saved in the table using the primary key ID with the Patient
ID.
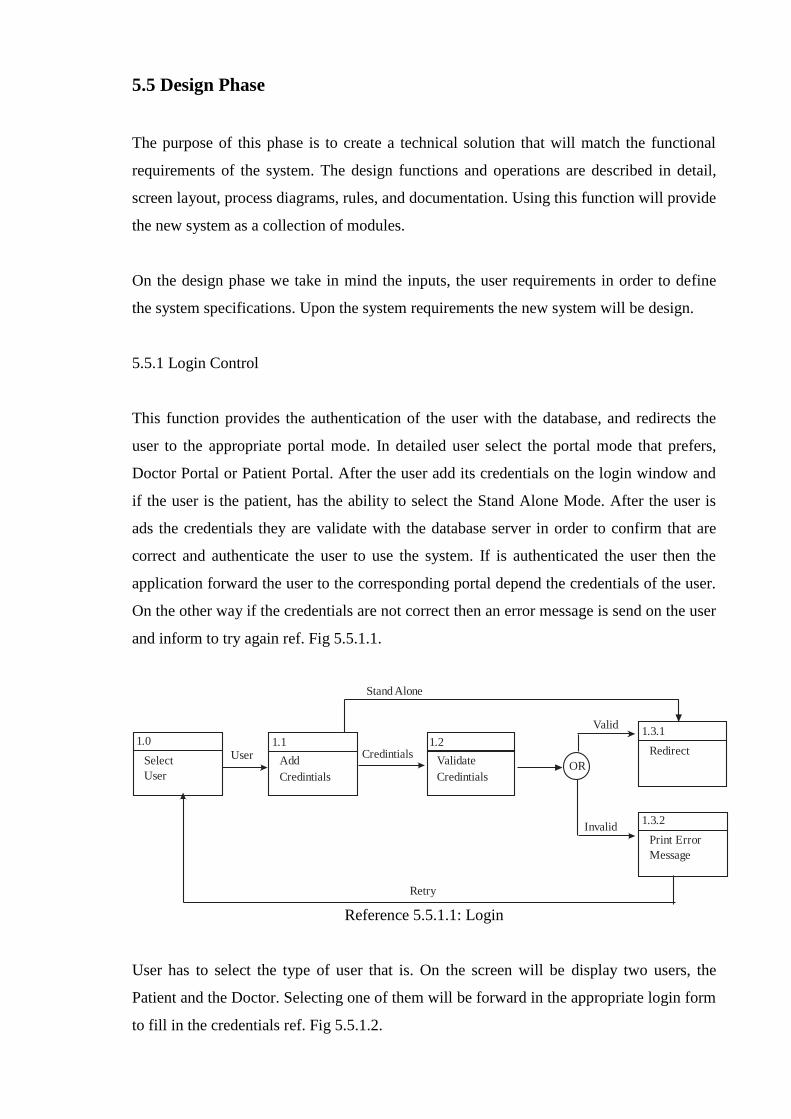
5.5 Design Phase
The purpose of this phase is to create a technical solution that will match the functional
requirements of the system. The design functions and operations are described in detail,
screen layout, process diagrams, rules, and documentation. Using this function will provide
the new system as a collection of modules.
On the design phase we take in mind the inputs, the user requirements in order to define
the system specifications. Upon the system requirements the new system will be design.
5.5.1 Login Control
This function provides the authentication of the user with the database, and redirects the
user to the appropriate portal mode. In detailed user select the portal mode that prefers,
Doctor Portal or Patient Portal. After the user add its credentials on the login window and
if the user is the patient, has the ability to select the Stand Alone Mode. After the user is
ads the credentials they are validate with the database server in order to confirm that are
correct and authenticate the user to use the system. If is authenticated the user then the
application forward the user to the corresponding portal depend the credentials of the user.
On the other way if the credentials are not correct then an error message is send on the user
and inform to try again ref. Fig 5.5.1.1.
Select
User
1.0
Add
Credintials
1.1Credintials
Validate
Credintials
1.2User
OR
Redirect
1.3.1Valid
Print Error
Message
1.3.2Invalid
Retry
Stand Alone
Reference 5.5.1.1: Login
User has to select the type of user that is. On the screen will be display two users, the
Patient and the Doctor. Selecting one of them will be forward in the appropriate login form
to fill in the credentials ref. Fig 5.5.1.2.

Reference 5.5.1.2: Second Level User Type
According what previous user has selected will be forwarded on the corresponding form to
fill in the credentials. When the user fill in the fields and submit the form a validation will
be implemented according the type of user. Due to that Patient form has more fields to fill
in, the application make different validations for both users. Doctor is been validated with
username and password, and on the other hand patient is validated with Patient ID, Patient
SID and Patient Name ref. Fig 5.5.1.3.
Reference 5.5.1.3: Second Level Validate Credentials
After the user is authenticate with the corresponding role is forwarded to the appropriate
portal site. If the user is logged as a doctor then it will be forward to the Doctor Portal site
and if is logged as patient to the Patient Portal site ref.fig. 5.5.1.4.
User
Type
1.0.1
OR Patients
1.0.2.1
Doctors
1.0.2.2
User
Type
User
Type
[1.1 Ref]
[1.1 Ref]
[1.1 Ref] OR Patient
Credintials
1.2.1.1
Doctor
Credintials
1.2.1.2
Valifdate
Patients
1.2.2.1
Validate
Doctors
1.2.2.2
OR OR
[1.3.1 Ref]
[1.3.2 Ref]
[1.3.1 Ref] OR
Patient
Validation
1.4.1.1.1
Doctor
Validation
1.4.1.1.2
Valid
Valid
Patient
Portal
1.4.1.2.1
Doctor
Portal
1.4.1.2.2
Redirected
Redirected
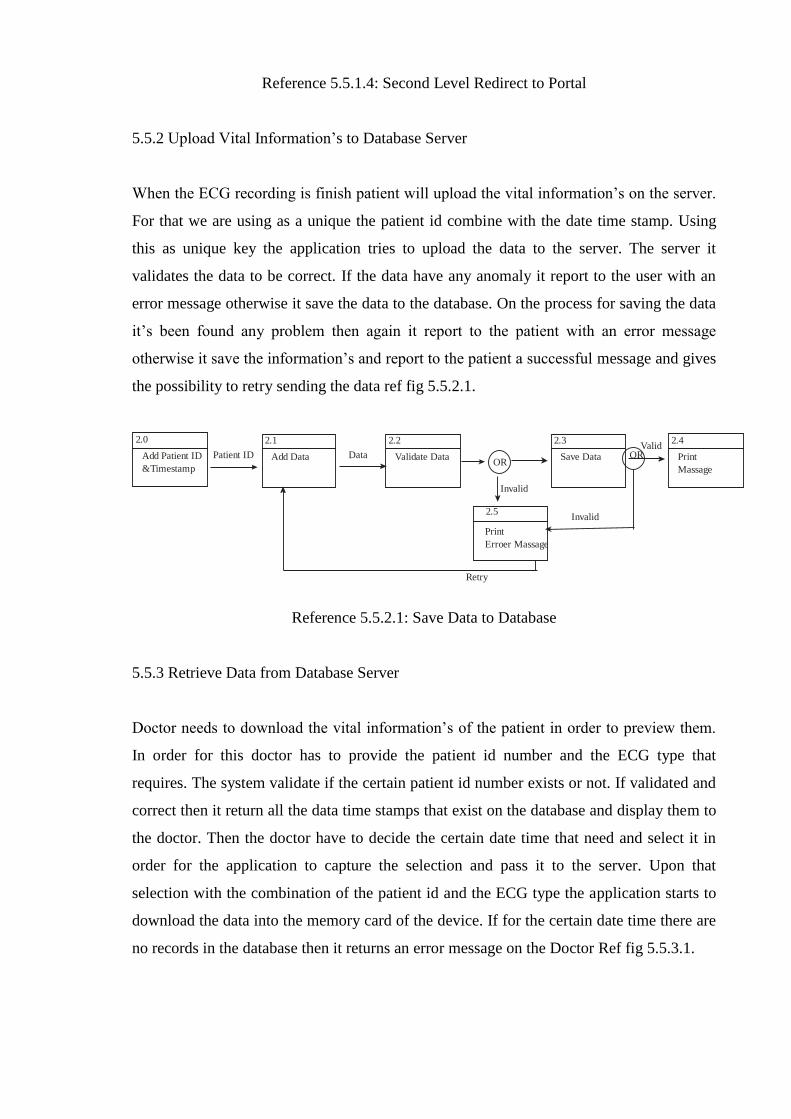
Reference 5.5.1.4: Second Level Redirect to Portal
5.5.2 Upload Vital Information‘s to Database Server
When the ECG recording is finish patient will upload the vital information‘s on the server.
For that we are using as a unique the patient id combine with the date time stamp. Using
this as unique key the application tries to upload the data to the server. The server it
validates the data to be correct. If the data have any anomaly it report to the user with an
error message otherwise it save the data to the database. On the process for saving the data
it‘s been found any problem then again it report to the patient with an error message
otherwise it save the information‘s and report to the patient a successful message and gives
the possibility to retry sending the data ref fig 5.5.2.1.
Add Patient ID
&Timestamp
2.0
Patient ID Add Data
2.1
Data Validate Data
2.2
ORSave Data
2.3
Massage
2.4
Retry
Erroer Massage
2.5
Valid
Invalid
OR
Invalid
Reference 5.5.2.1: Save Data to Database
5.5.3 Retrieve Data from Database Server
Doctor needs to download the vital information‘s of the patient in order to preview them.
In order for this doctor has to provide the patient id number and the ECG type that
requires. The system validate if the certain patient id number exists or not. If validated and
correct then it return all the data time stamps that exist on the database and display them to
the doctor. Then the doctor have to decide the certain date time that need and select it in
order for the application to capture the selection and pass it to the server. Upon that
selection with the combination of the patient id and the ECG type the application starts to
download the data into the memory card of the device. If for the certain date time there are
no records in the database then it returns an error message on the Doctor Ref fig 5.5.3.1.
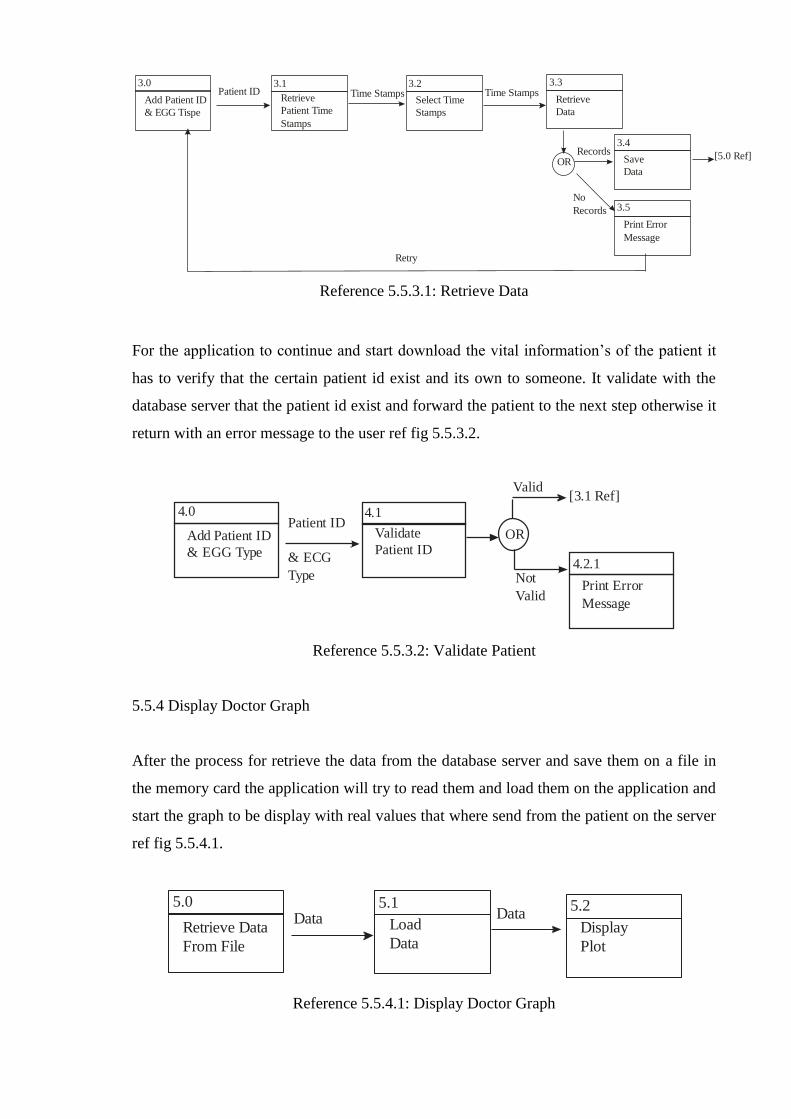
Reference 5.5.3.1: Retrieve Data
For the application to continue and start download the vital information‘s of the patient it
has to verify that the certain patient id exist and its own to someone. It validate with the
database server that the patient id exist and forward the patient to the next step otherwise it
return with an error message to the user ref fig 5.5.3.2.
Add Patient ID
& EGG Type
4.0
Validate
Patient ID
4.1Patient ID
& ECG
Type
OR
Valid
Print Error
Message
4.2.1Not
Valid
[3.1 Ref]
Reference 5.5.3.2: Validate Patient
5.5.4 Display Doctor Graph
After the process for retrieve the data from the database server and save them on a file in
the memory card the application will try to read them and load them on the application and
start the graph to be display with real values that where send from the patient on the server
ref fig 5.5.4.1.
Reference 5.5.4.1: Display Doctor Graph
Add Patient ID
& EGG Tispe
3.0
Retrieve
Patient Time
Stamps
3.1Time Stamps
Select Time
Stamps
3.2Patient ID
OR Save
Data
3.4Records
Print Error
Message
3.5No
Records
Retry
Time StampsRetrieve
Data
3.3
[5.0 Ref]
Retrieve Data
From File
5.0
Load
Data
5.1Data Data
Display
Plot
5.2

The time that are reading the data and are load on the application, the application makes a
validation of the context of the files. It validates them if they are not empty and if the
values are separated with the ―;‖ sign. After, if the validation is correct it forward the user
to the next step, otherwise it displays an error message on the user ref fig 5.5.4.2.
Reference 5.5.4.2: Second level Validate Load Data
5.5.5 Send Credentials to Patient
Doctor as an administrator can send the credentials to the user. From the appropriate screen
user selects and fill in the field with the appropriate values, the application makes a
validation with a cooperation with the database and if is correct then it send the credentials
to the user otherwise it return with the appropriate error message ref fig 5.5.5.1.
Reference 5.5.5.1: Send Credentials to Patient
5.6 Class Diagram
Load
Data
5.1.1
ValidateData
5.1.2Data
OR
Valid
Print Error
Message
5.1.3Not
Valid
[5.2 Ref]
Fill in Field
6.0
OR
Valid
Print Error
Message
6.1.2Not
Valid
Send
Credintials
6.1.1
Retry
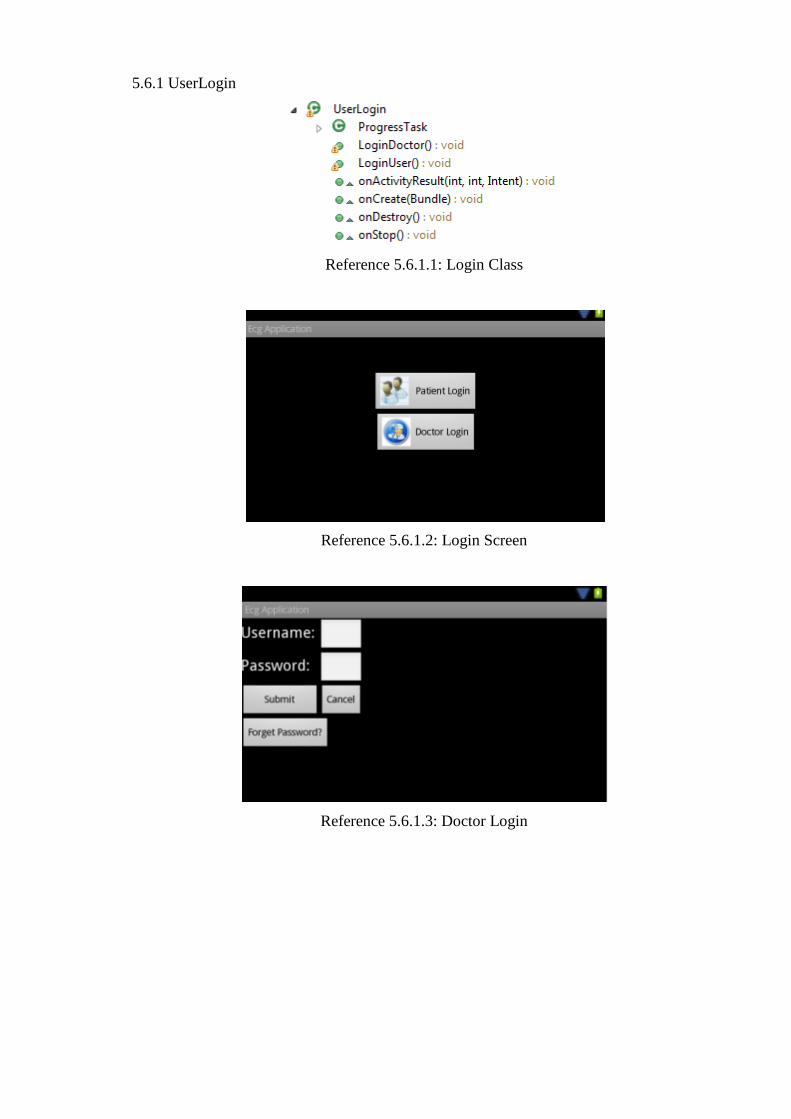
5.6.1 UserLogin
Reference 5.6.1.1: Login Class
Reference 5.6.1.2: Login Screen
Reference 5.6.1.3: Doctor Login
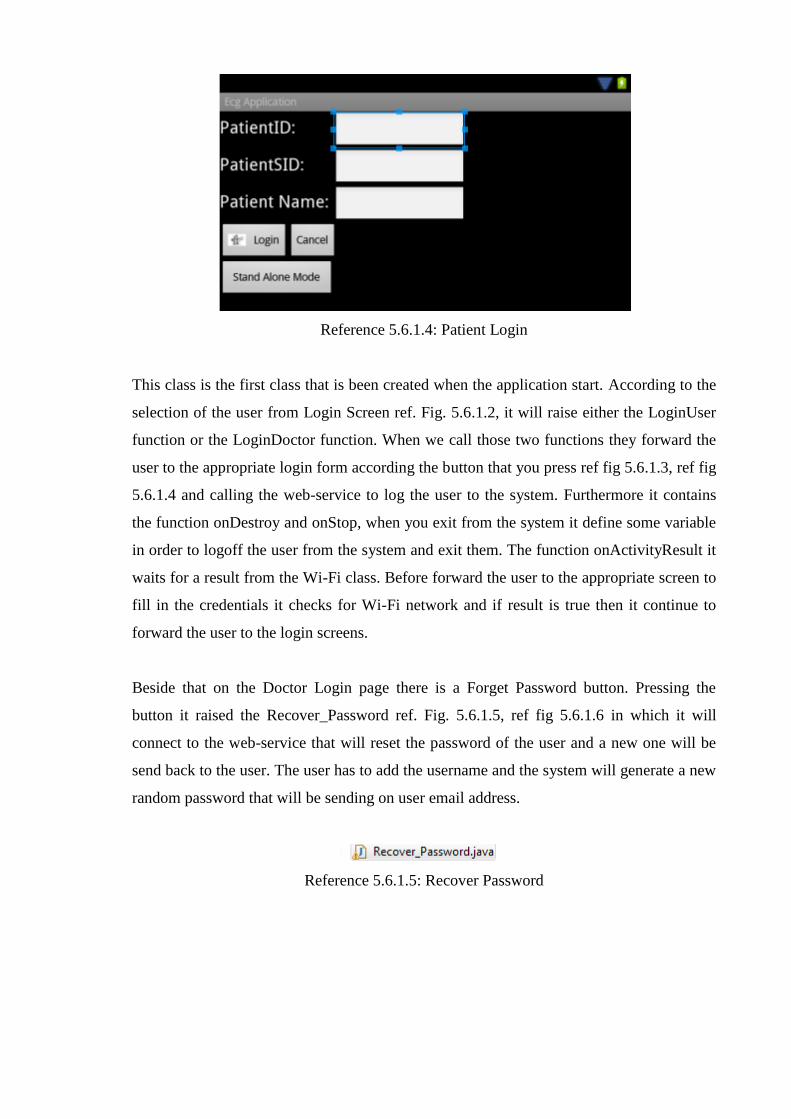
Reference 5.6.1.4: Patient Login
This class is the first class that is been created when the application start. According to the
selection of the user from Login Screen ref. Fig. 5.6.1.2, it will raise either the LoginUser
function or the LoginDoctor function. When we call those two functions they forward the
user to the appropriate login form according the button that you press ref fig 5.6.1.3, ref fig
5.6.1.4 and calling the web-service to log the user to the system. Furthermore it contains
the function onDestroy and onStop, when you exit from the system it define some variable
in order to logoff the user from the system and exit them. The function onActivityResult it
waits for a result from the Wi-Fi class. Before forward the user to the appropriate screen to
fill in the credentials it checks for Wi-Fi network and if result is true then it continue to
forward the user to the login screens.
Beside that on the Doctor Login page there is a Forget Password button. Pressing the
button it raised the Recover_Password ref. Fig. 5.6.1.5, ref fig 5.6.1.6 in which it will
connect to the web-service that will reset the password of the user and a new one will be
send back to the user. The user has to add the username and the system will generate a new
random password that will be sending on user email address.
Reference 5.6.1.5: Recover Password

Reference 5.6.1.6 Recover Password Screen
5.6.2 Doctor Portal Class
Reference 5.6.2.1: Doctor Portal Class
Reference 5.6.2.2: Doctor Portal Screen
While the user selects the Doctor Button from ref fig. 5.6.1.2 the system authenticates the
user as a doctor and log in the user. On the doctor portal the draw function that is been
raised when the user select the Start button ref fig 5.6.2.2. Doctor selects the patient id and
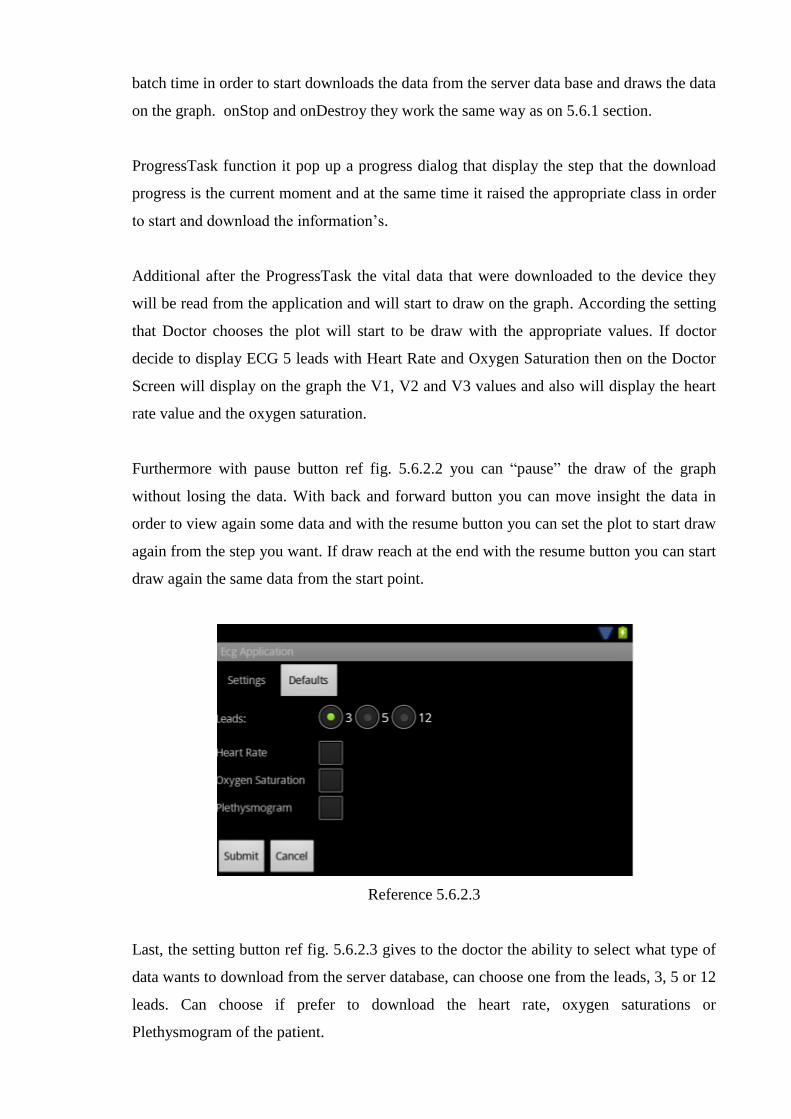
batch time in order to start downloads the data from the server data base and draws the data
on the graph. onStop and onDestroy they work the same way as on 5.6.1 section.
ProgressTask function it pop up a progress dialog that display the step that the download
progress is the current moment and at the same time it raised the appropriate class in order
to start and download the information‘s.
Additional after the ProgressTask the vital data that were downloaded to the device they
will be read from the application and will start to draw on the graph. According the setting
that Doctor chooses the plot will start to be draw with the appropriate values. If doctor
decide to display ECG 5 leads with Heart Rate and Oxygen Saturation then on the Doctor
Screen will display on the graph the V1, V2 and V3 values and also will display the heart
rate value and the oxygen saturation.
Furthermore with pause button ref fig. 5.6.2.2 you can ―pause‖ the draw of the graph
without losing the data. With back and forward button you can move insight the data in
order to view again some data and with the resume button you can set the plot to start draw
again from the step you want. If draw reach at the end with the resume button you can start
draw again the same data from the start point.
Reference 5.6.2.3
Last, the setting button ref fig. 5.6.2.3 gives to the doctor the ability to select what type of
data wants to download from the server database, can choose one from the leads, 3, 5 or 12
leads. Can choose if prefer to download the heart rate, oxygen saturations or
Plethysmogram of the patient.
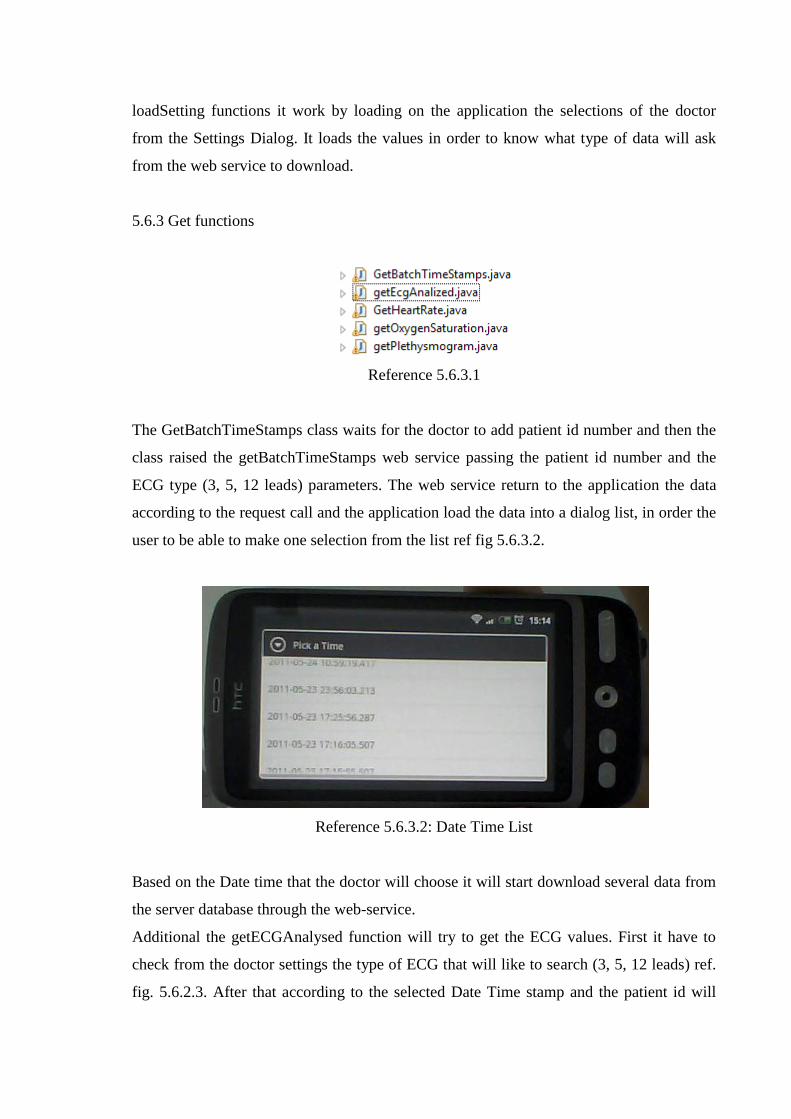
loadSetting functions it work by loading on the application the selections of the doctor
from the Settings Dialog. It loads the values in order to know what type of data will ask
from the web service to download.
5.6.3 Get functions
Reference 5.6.3.1
The GetBatchTimeStamps class waits for the doctor to add patient id number and then the
class raised the getBatchTimeStamps web service passing the patient id number and the
ECG type (3, 5, 12 leads) parameters. The web service return to the application the data
according to the request call and the application load the data into a dialog list, in order the
user to be able to make one selection from the list ref fig 5.6.3.2.
Reference 5.6.3.2: Date Time List
Based on the Date time that the doctor will choose it will start download several data from
the server database through the web-service.
Additional the getECGAnalysed function will try to get the ECG values. First it have to
check from the doctor settings the type of ECG that will like to search (3, 5, 12 leads) ref.
fig. 5.6.2.3. After that according to the selected Date Time stamp and the patient id will
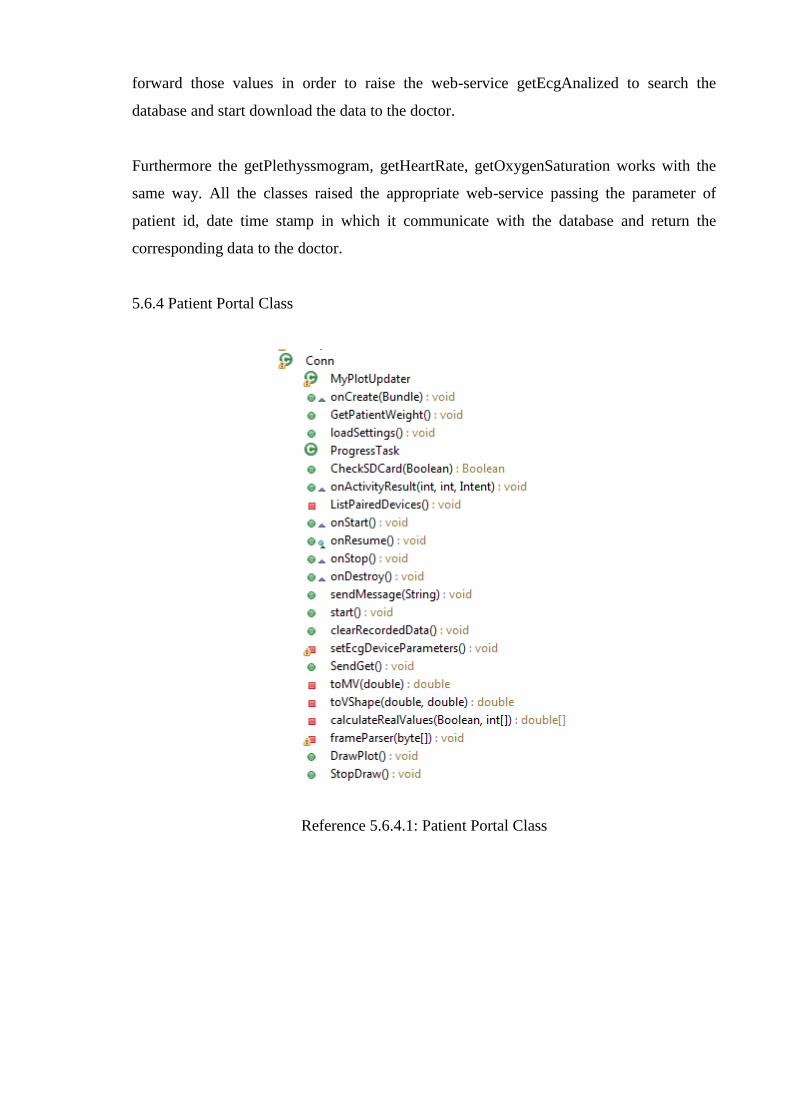
forward those values in order to raise the web-service getEcgAnalized to search the
database and start download the data to the doctor.
Furthermore the getPlethyssmogram, getHeartRate, getOxygenSaturation works with the
same way. All the classes raised the appropriate web-service passing the parameter of
patient id, date time stamp in which it communicate with the database and return the
corresponding data to the doctor.
5.6.4 Patient Portal Class
Reference 5.6.4.1: Patient Portal Class
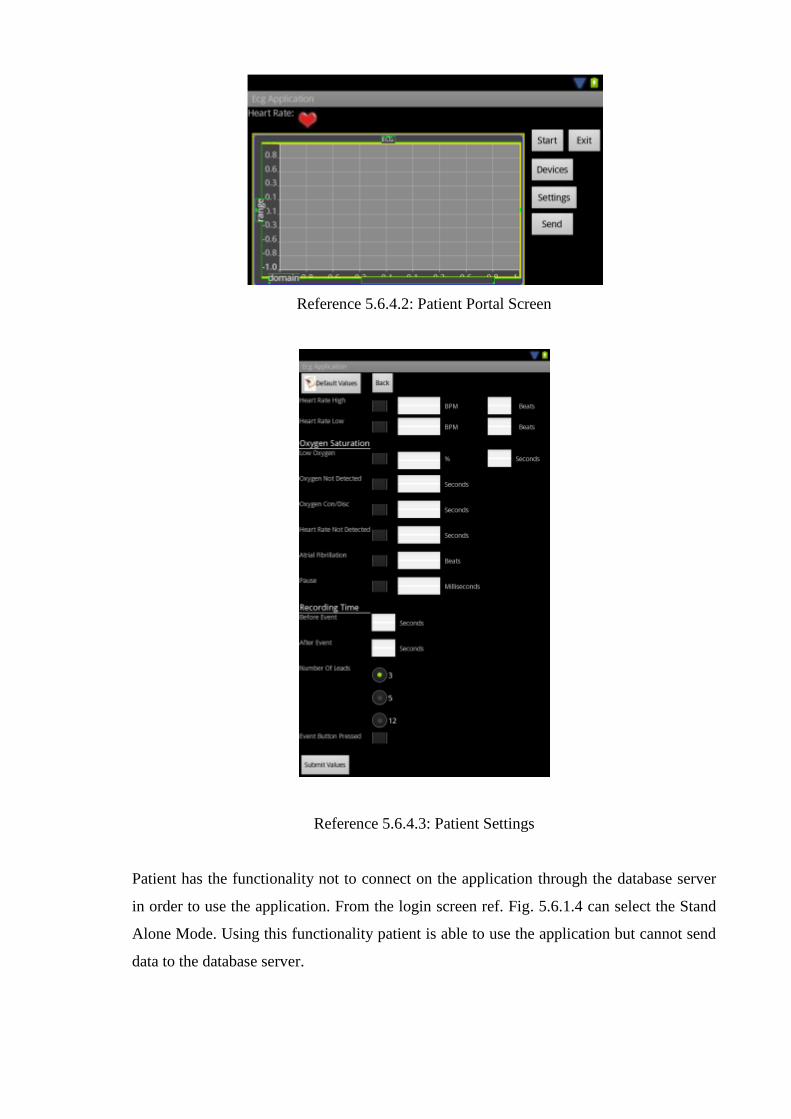
Reference 5.6.4.2: Patient Portal Screen
Reference 5.6.4.3: Patient Settings
Patient has the functionality not to connect on the application through the database server
in order to use the application. From the login screen ref. Fig. 5.6.1.4 can select the Stand
Alone Mode. Using this functionality patient is able to use the application but cannot send
data to the database server.
On the other side on the patient portal they are several functions that are being using.
Settings button ref fig. 5.6.4.2 it load the settings screen. Patient can configure the ECG
Device according to the instructions of the Doctor. Can select the heart rate values, the
oxygen saturation, the recording time, the leads, etc or just can select to set the defaults
values that are proposed from the Doctor. After setting the device the settings are loaded
on the application and raised the setEcgDeviceParameters and send to the ECG device the
settings that were selected.
Selecting the Devices button the user can setup the Bluetooth device and the Wi-Fi
network device. Patient can select the Wi-Fi network to connect to it in order to have
access on the internet and also can select the Bluetooth device to connect to. In order to
connect to the ECG Bluetooth device you have to select the appropriate device from the
Bluetooth device list.
With the Send button raised the sendMessage function. With the certain function the
application send data, information‘s to the Bluetooth device, such as the GET command in
order to start sending to the Android device the cardiac values.
Selecting the start button on Patient portal screen it will start draw a plot according the
vital information‘s that it receive from the ECG device. The graph is set up to start draw
the cardiac plot. The patient has the ability to view the graph for 3 leads values. It will be a
real plot graph as the doctor will be viewing it.
Another function that patient has is the Upload button. Selecting the button the
ProgressTask function is raised. This function is using some classes that call the
corresponding functions from the web-service in order to upload the information‘s of the
patient to the database of the server ref 5.6.5 section.
5.6.5 Add Functions

Reference 5.6.5.1: Add Functions
The upload function will be raised after the data are display on the user screen and has
finish. It will display a menu that will ask the user if prefer to upload the data or not. The
application through the classes communicates with the web-service in order to upload the
selected data to the server database. For all the function it has to pass the patient id number
and the date time stamp and then according to the settings will upload the values that were
collecting from the ECG device. The settings will define what ECG analysis type will
upload and if the other functions are selected from the setting will be uploading too.
5.7 Use Case diagram
Use case is a list of steps, typically defining interactions between a role and a system, to
achieve a goal. Is a graphical representation of the interaction between the user and the
system. A use case diagram it present the different types of users of the system and the
various ways that they interact with the system [23].
5.7.1 Diagram building blocks
Actor: the actor is describe by the term of ―user‖, but this mean that does not have
to be a human but also can be other external systems. They present outside the
rectangular box that represent the system. Actors will interact with the use case by
means of arrows.
Use Case: Are all the functionality of the system that is contained within a system
boundary. It might be a sequence of actions, including and the subcategories of
them that a system might interact with the actors of the system.
Use Case Relationship:
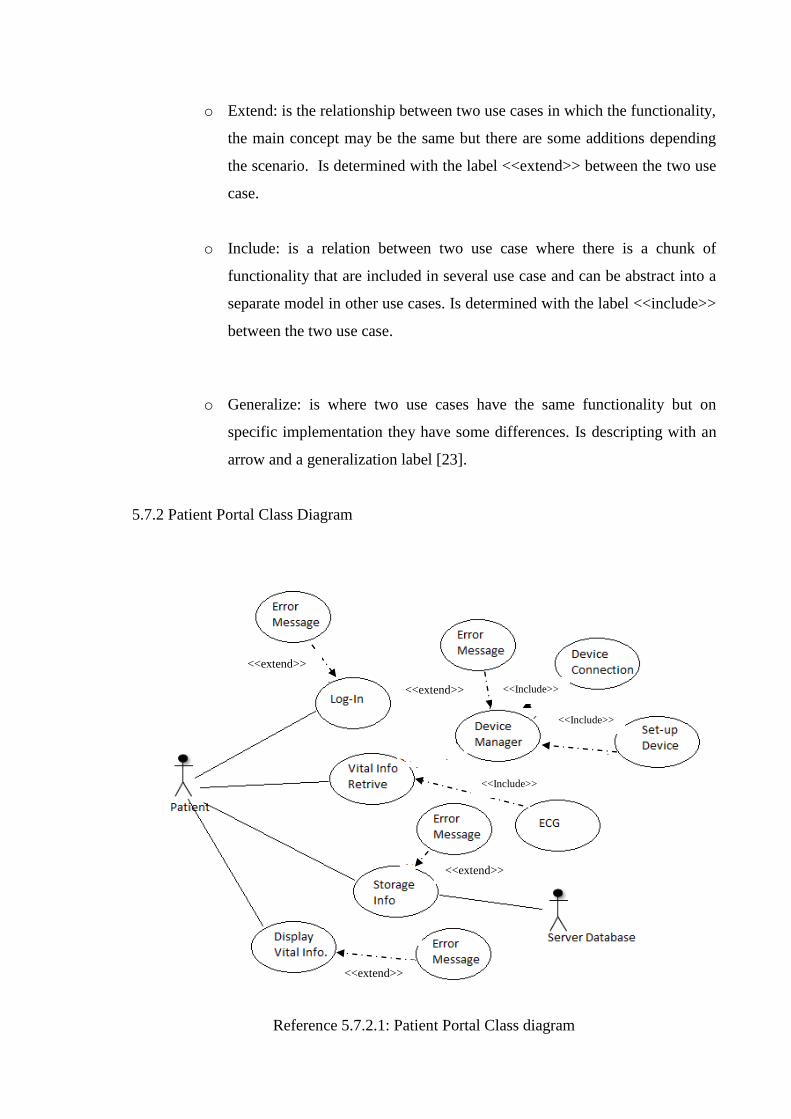
o Extend: is the relationship between two use cases in which the functionality,
the main concept may be the same but there are some additions depending
the scenario. Is determined with the label <<extend>> between the two use
case.
o Include: is a relation between two use case where there is a chunk of
functionality that are included in several use case and can be abstract into a
separate model in other use cases. Is determined with the label <<include>>
between the two use case.
o Generalize: is where two use cases have the same functionality but on
specific implementation they have some differences. Is descripting with an
arrow and a generalization label [23].
5.7.2 Patient Portal Class Diagram
Reference 5.7.2.1: Patient Portal Class diagram
<<extend>>
<<extend>>
<<extend>>
<<extend>>
<<Include>>
<<Include>>
<<Include>>
Patient before to be able to use the application have to login on the system otherwise will
not be able to continue to the procedure. Then it will have to connect with the Bluetooth
ECG device. After that will have to set-up the device according to doctor instructions. It
will receive the vital information‘s and application will start to draw on the graph. When it
finishes receiving data from the ECG Device it will upload the data to the server database.
5.7.5.2.2 Vital information‘s that will be upload
Heart rate
ECG 3, 5, 12 leads
Oxygen Saturation
Plethysmogram
Blood Pressure
Weight
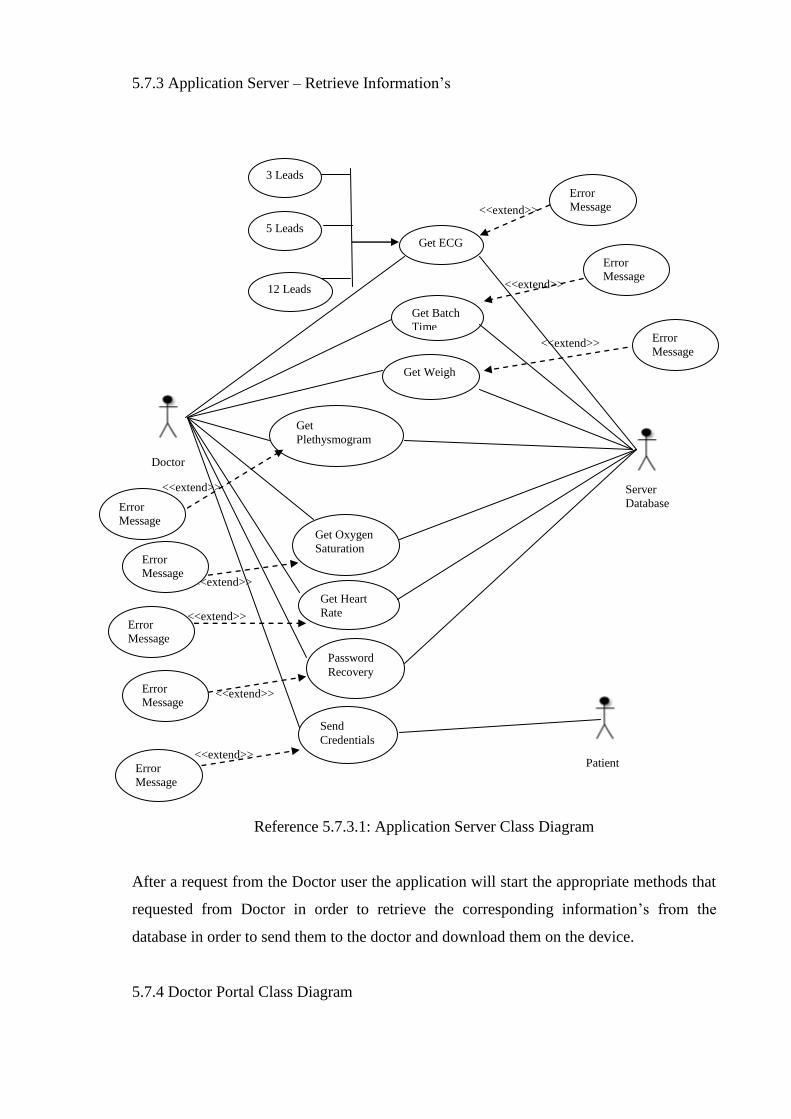
<<extend>>
<<extend>>
<<extend>>
<<extend>>
<<extend>>
<<extend>>
<<extend>>
<<extend>>
5.7.3 Application Server – Retrieve Information‘s
Reference 5.7.3.1: Application Server Class Diagram
After a request from the Doctor user the application will start the appropriate methods that
requested from Doctor in order to retrieve the corresponding information‘s from the
database in order to send them to the doctor and download them on the device.
5.7.4 Doctor Portal Class Diagram
3 Leads
5 Leads
12 Leads
Get ECG
Get Batch
Time
Get Weigh
Get
Plethysmogram
Get Oxygen
Saturation
Get Heart
Rate
Password
Recovery
Send
Credentials
Error
Message
Doctor
Patient
Server
Database
Error
Message
Error
Message
Error
Message
Error
Message
Error
Message
Error
Message
Error
Message

<<extend>>
<<extend>>
<<include>> <<include>>
<<include>>
<<include>>
<<include>>
<<include>>
<<include>>
<<extend>>
Reference 5.7.4.1
Doctor requests for a certain patient the vital information‘s. Add the patient id and return to
doctor the batch times that are saved on the database. Then the doctor select one batch time
from the list and the application starts to download on the doctor device the certain patient
information‘s. The Vital information‘s that will be downloading are according to the set-up
of settings that doctor will figure.
Vital Information‘s:
ECG Type
o 3 Leads
o 5 Leads
o 12 Leads
Weight
Blood Pressure
Oxygen Saturation
Log-in
Error
Message
Vital Info
Display Vital Info
Retrieve
Error
Message
Select
Patient
Patient
Retrieve
Select
Batch time
Retrieve
Batch Time
Select
Vital Info.
Password
Recovery
Send
Credentials
Doctor
Patient
Server
Database
Download
Settings
Error
Message
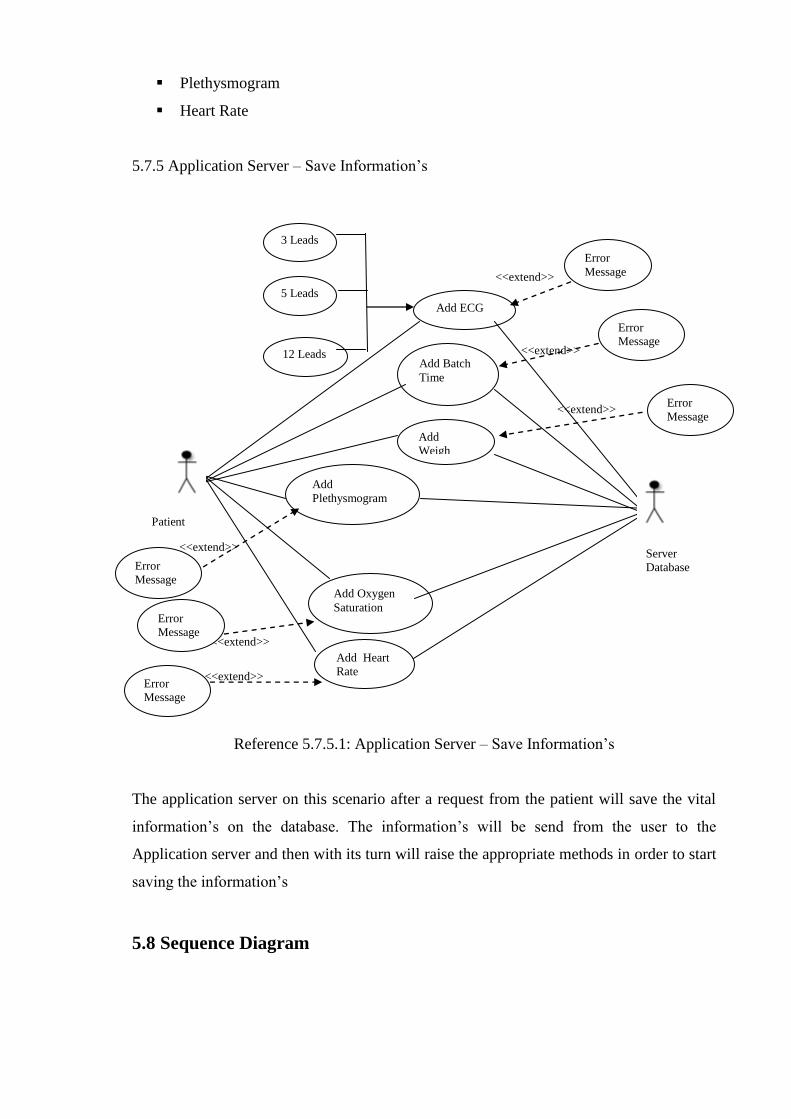
<<extend>>
<<extend>>
<<extend>>
<<extend>>
<<extend>>
<<extend>>
Plethysmogram
Heart Rate
5.7.5 Application Server – Save Information‘s
Reference 5.7.5.1: Application Server – Save Information‘s
The application server on this scenario after a request from the patient will save the vital
information‘s on the database. The information‘s will be send from the user to the
Application server and then with its turn will raise the appropriate methods in order to start
saving the information‘s
5.8 Sequence Diagram
Add
Plethysmogram
Add Oxygen
Saturation
Add Heart
Rate
Error
Message
Error
Message
Error
Message
3 Leads
5 Leads
12 Leads
Add ECG
Add Batch
Time
Add
Weigh
Error
Message
Error
Message
Error
Message
Patient
Server
Database

1. Register
2. Add/Update/Delete
Patient
Information‘s 3. ECG
3, 5, 12
Leads 4. Collect
ECG
5. Vital
Information‘s 6. Collect
Vital
Information‘s
7. Upload
ECG
Information‘s
9. Upload
Vital
Information‘s
8. ECG Data
Storage
10. Vital
Information‘s
Data Storage 11. Request Patient
ECG
13. Request
Patient ECG
12. Request Patient
14. Send
Patient ECG 15. Send
Patient ECG
21. Request Patient
ECG & Vital
Information‘s
23. Request
Patient ECG
& Vital
Information‘s
22. Request Patient
ECG & Vital
Information‘s
24. Send
Patient ECG
& Vital
Information‘s
25. Send
Patient ECG
& Vital
Information‘s
16. Request Vital
Information‘s
18. Request
Vital
Information‘s
19. Send
Vital
Information‘s
20. Send
Vital
Information‘s
17. Request Vital
Information‘s
ECG
Application
Application
Server
Cardiac
Portal
Module Patient Doctor
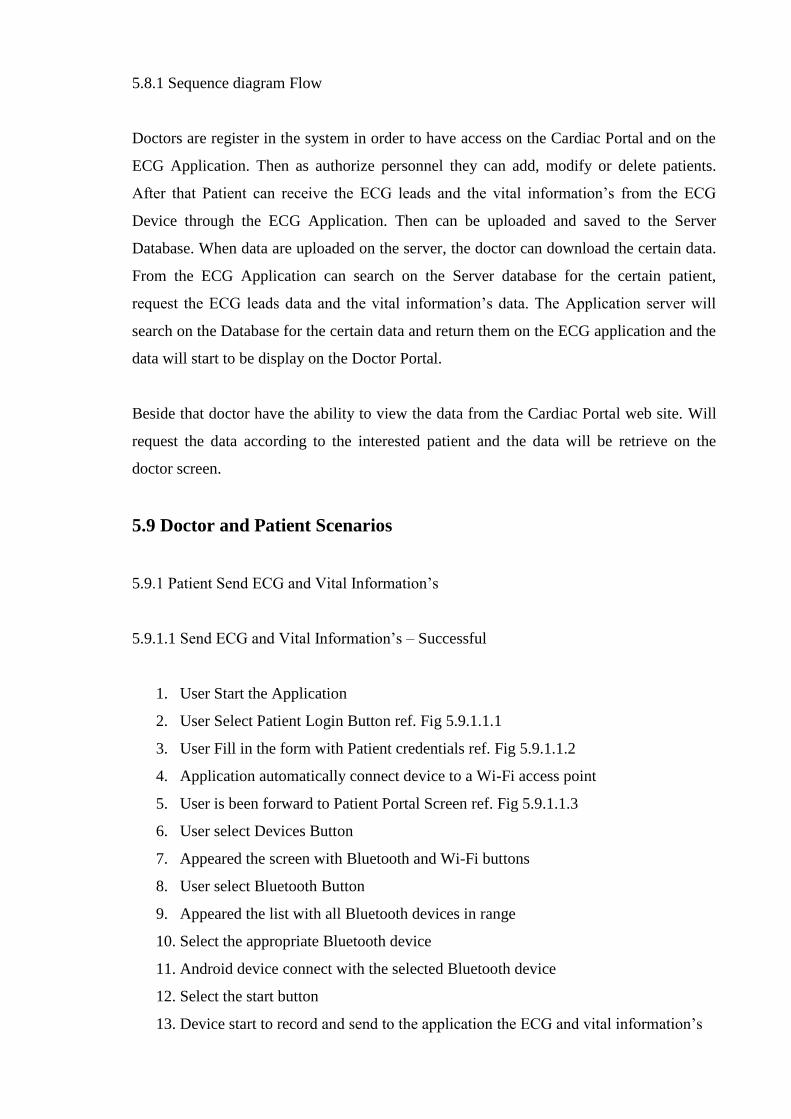
5.8.1 Sequence diagram Flow
Doctors are register in the system in order to have access on the Cardiac Portal and on the
ECG Application. Then as authorize personnel they can add, modify or delete patients.
After that Patient can receive the ECG leads and the vital information‘s from the ECG
Device through the ECG Application. Then can be uploaded and saved to the Server
Database. When data are uploaded on the server, the doctor can download the certain data.
From the ECG Application can search on the Server database for the certain patient,
request the ECG leads data and the vital information‘s data. The Application server will
search on the Database for the certain data and return them on the ECG application and the
data will start to be display on the Doctor Portal.
Beside that doctor have the ability to view the data from the Cardiac Portal web site. Will
request the data according to the interested patient and the data will be retrieve on the
doctor screen.
5.9 Doctor and Patient Scenarios
5.9.1 Patient Send ECG and Vital Information‘s
5.9.1.1 Send ECG and Vital Information‘s – Successful
1. User Start the Application
2. User Select Patient Login Button ref. Fig 5.9.1.1.1
3. User Fill in the form with Patient credentials ref. Fig 5.9.1.1.2
4. Application automatically connect device to a Wi-Fi access point
5. User is been forward to Patient Portal Screen ref. Fig 5.9.1.1.3
6. User select Devices Button
7. Appeared the screen with Bluetooth and Wi-Fi buttons
8. User select Bluetooth Button
9. Appeared the list with all Bluetooth devices in range
10. Select the appropriate Bluetooth device
11. Android device connect with the selected Bluetooth device
12. Select the start button
13. Device start to record and send to the application the ECG and vital information‘s
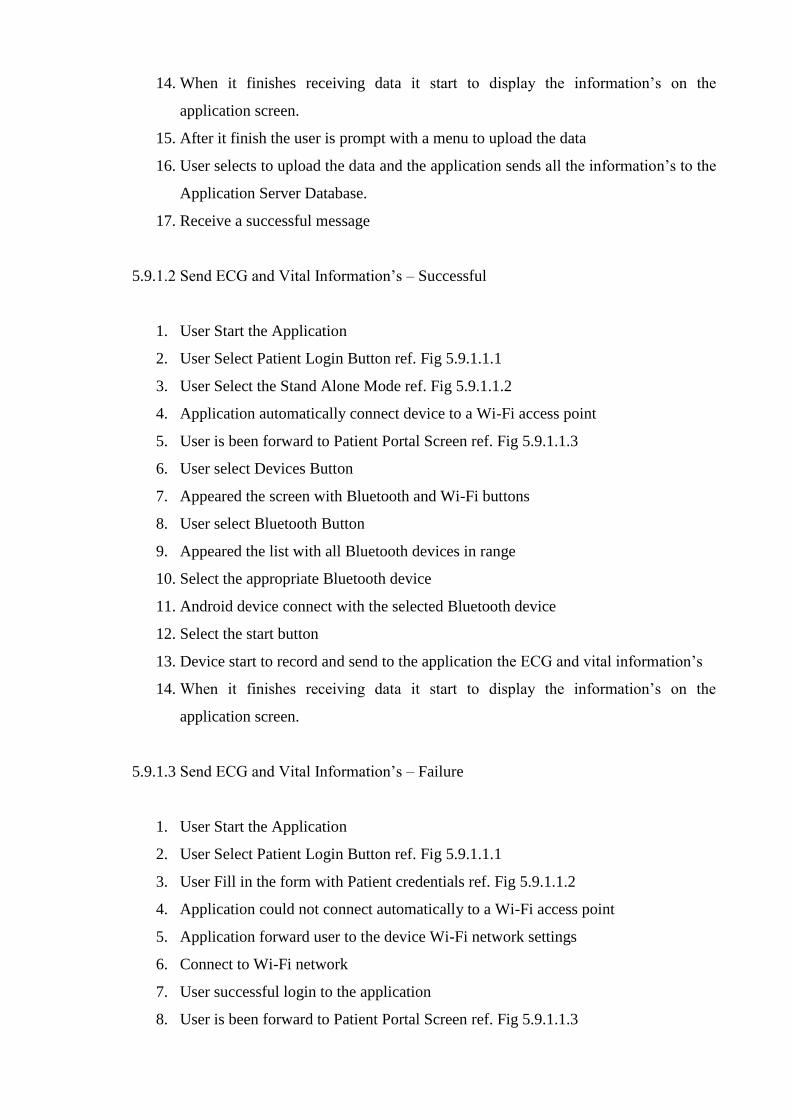
14. When it finishes receiving data it start to display the information‘s on the
application screen.
15. After it finish the user is prompt with a menu to upload the data
16. User selects to upload the data and the application sends all the information‘s to the
Application Server Database.
17. Receive a successful message
5.9.1.2 Send ECG and Vital Information‘s – Successful
1. User Start the Application
2. User Select Patient Login Button ref. Fig 5.9.1.1.1
3. User Select the Stand Alone Mode ref. Fig 5.9.1.1.2
4. Application automatically connect device to a Wi-Fi access point
5. User is been forward to Patient Portal Screen ref. Fig 5.9.1.1.3
6. User select Devices Button
7. Appeared the screen with Bluetooth and Wi-Fi buttons
8. User select Bluetooth Button
9. Appeared the list with all Bluetooth devices in range
10. Select the appropriate Bluetooth device
11. Android device connect with the selected Bluetooth device
12. Select the start button
13. Device start to record and send to the application the ECG and vital information‘s
14. When it finishes receiving data it start to display the information‘s on the
application screen.
5.9.1.3 Send ECG and Vital Information‘s – Failure
1. User Start the Application
2. User Select Patient Login Button ref. Fig 5.9.1.1.1
3. User Fill in the form with Patient credentials ref. Fig 5.9.1.1.2
4. Application could not connect automatically to a Wi-Fi access point
5. Application forward user to the device Wi-Fi network settings
6. Connect to Wi-Fi network
7. User successful login to the application
8. User is been forward to Patient Portal Screen ref. Fig 5.9.1.1.3

9. User select Devices Button
10. Appeared the screen with Bluetooth and Wi-Fi buttons
11. User select Bluetooth Button
12. Appeared the list with all Bluetooth devices in range
13. Select the appropriate Bluetooth device
14. Android device connect with the selected Bluetooth device
15. Select the start button
16. Device start to record and send to the application the ECG and vital information‘s
17. When it finishes receiving data in start to display the information‘s on the
application screen.
18. After it finish the user selects the upload button to send all the information‘s to the
Application Server Database.
19. Receive a successful message
5.9.1.4 Send ECG and Vital Information‘s – Failure
1. User Start the Application
2. User Select Patient Login Button ref. Fig 5.9.1.1.1
3. User Fill in the form with Patient credentials ref. Fig 5.9.1.1.2
4. Application automatically connect device to a Wi-Fi access point
5. User is been forward to Patient Portal Screen ref. Fig 5.9.1.1.3
6. User select Devices Button
7. Appeared the screen with Bluetooth and Wi-Fi buttons
8. User select Bluetooth Button
9. Appeared the list with all Bluetooth devices in range
10. Select the appropriate Bluetooth device
11. Android device connect with the selected Bluetooth device
12. Select the start button
13. Device start to record and send to the application the ECG and vital information‘s
14. Device loses Bluetooth connection with ECG device.
15. Message appeared to user
16. User try to reconnect to ECG Device Bluetooth from Devices button
17. When it finishes receiving data in start to display the information‘s on the
application screen.
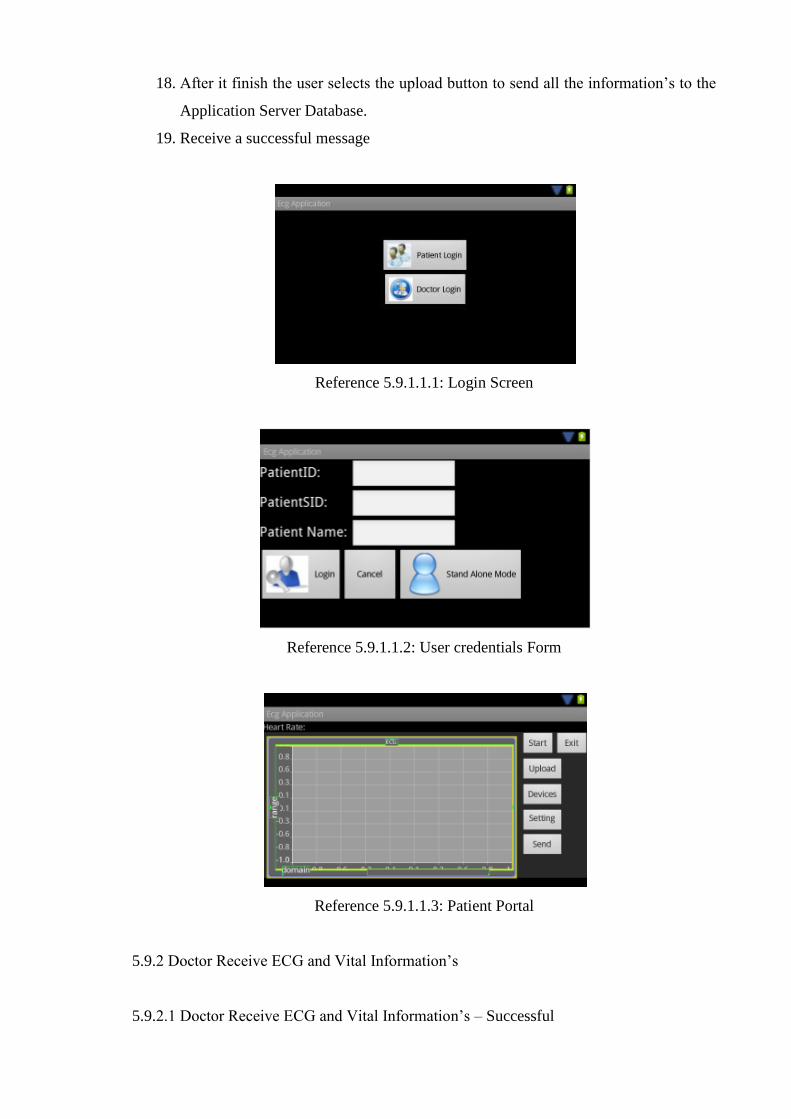
18. After it finish the user selects the upload button to send all the information‘s to the
Application Server Database.
19. Receive a successful message
Reference 5.9.1.1.1: Login Screen
Reference 5.9.1.1.2: User credentials Form
Reference 5.9.1.1.3: Patient Portal
5.9.2 Doctor Receive ECG and Vital Information‘s
5.9.2.1 Doctor Receive ECG and Vital Information‘s – Successful
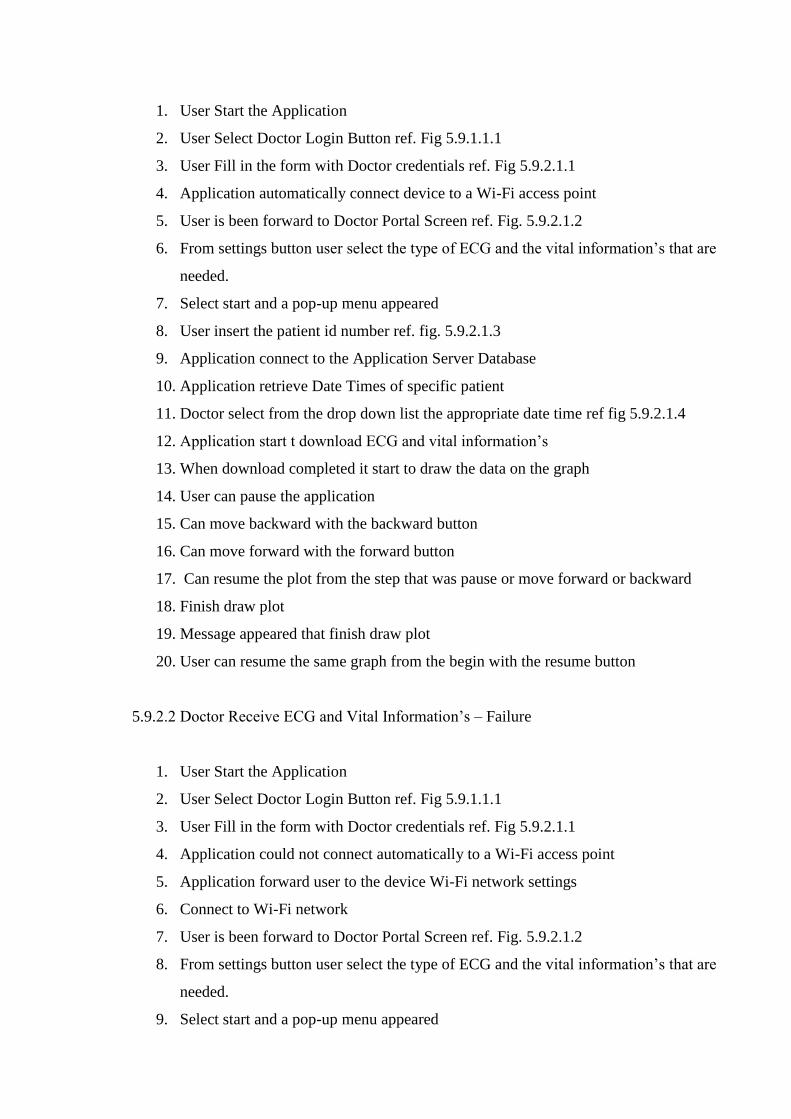
1. User Start the Application
2. User Select Doctor Login Button ref. Fig 5.9.1.1.1
3. User Fill in the form with Doctor credentials ref. Fig 5.9.2.1.1
4. Application automatically connect device to a Wi-Fi access point
5. User is been forward to Doctor Portal Screen ref. Fig. 5.9.2.1.2
6. From settings button user select the type of ECG and the vital information‘s that are
needed.
7. Select start and a pop-up menu appeared
8. User insert the patient id number ref. fig. 5.9.2.1.3
9. Application connect to the Application Server Database
10. Application retrieve Date Times of specific patient
11. Doctor select from the drop down list the appropriate date time ref fig 5.9.2.1.4
12. Application start t download ECG and vital information‘s
13. When download completed it start to draw the data on the graph
14. User can pause the application
15. Can move backward with the backward button
16. Can move forward with the forward button
17. Can resume the plot from the step that was pause or move forward or backward
18. Finish draw plot
19. Message appeared that finish draw plot
20. User can resume the same graph from the begin with the resume button
5.9.2.2 Doctor Receive ECG and Vital Information‘s – Failure
1. User Start the Application
2. User Select Doctor Login Button ref. Fig 5.9.1.1.1
3. User Fill in the form with Doctor credentials ref. Fig 5.9.2.1.1
4. Application could not connect automatically to a Wi-Fi access point
5. Application forward user to the device Wi-Fi network settings
6. Connect to Wi-Fi network
7. User is been forward to Doctor Portal Screen ref. Fig. 5.9.2.1.2
8. From settings button user select the type of ECG and the vital information‘s that are
needed.
9. Select start and a pop-up menu appeared

10. User insert the patient id number ref. fig. 5.9.2.1.3
11. Application connect to the Application Server Database
12. Application retrieve Date Times of specific patient
13. Doctor select from the drop down list the appropriate date time ref fig 5.9.2.1.4
14. Application start t download ECG and vital information‘s
15. When download completed it start to draw the data on the graph
16. User can pause the application
17. Can move backward with the backward button
18. Can move forward with the forward button
19. Can resume the plot from the step that was pause or move forward or backward
20. Finish draw plot
21. Message appeared that finish draw plot
22. User can resume the same graph from the begin with the resume button
5.9.2.3 Doctor Receive ECG and Vital Information‘s – Failure
1. User Start the Application
2. User Select Doctor Login Button ref. Fig 5.9.1.1.1
3. User Fill in the form with Doctor credentials ref. Fig 5.9.2.1.1
4. Application could not connect automatically to a Wi-Fi access point
5. Application forward user to the device Wi-Fi network settings
6. Connect to Wi-Fi network
7. User is been forward to Doctor Portal Screen ref. Fig. 5.9.2.1.2
8. From settings button user select the type of ECG and the vital information‘s that are
needed.
9. Select start and a pop-up menu appeared
10. User insert the patient id number ref. fig. 5.9.2.1.3
11. Application connect to the Application Server Database
12. Application retrieve Date Times of specific patient
13. Doctor select from the drop down list the appropriate date time ref fig 5.9.2.1.4
14. Application start t download ECG and vital information‘s
15. Application lose connection with the Wi-Fi access point
16. Application Stop to download
17. User select Devices button
18. Application forward user to the device settings form

19. Select Wi-Fi button
20. Application try to connect to Wi-Fi access point
21. Connect successful to Wi-Fi network
22. When download completed it start to draw the data on the graph
23. User can pause the application
24. Can move backward with the backward button
25. Can move forward with the forward button
26. Can resume the plot from the step that was pause or move forward or backward
27. Finish draw plot
28. Message appeared that finish draw plot
29. User can resume the same graph from the begin with the resume button
Reference 5.9.2.1.1
Reference 5.9.2.1.2
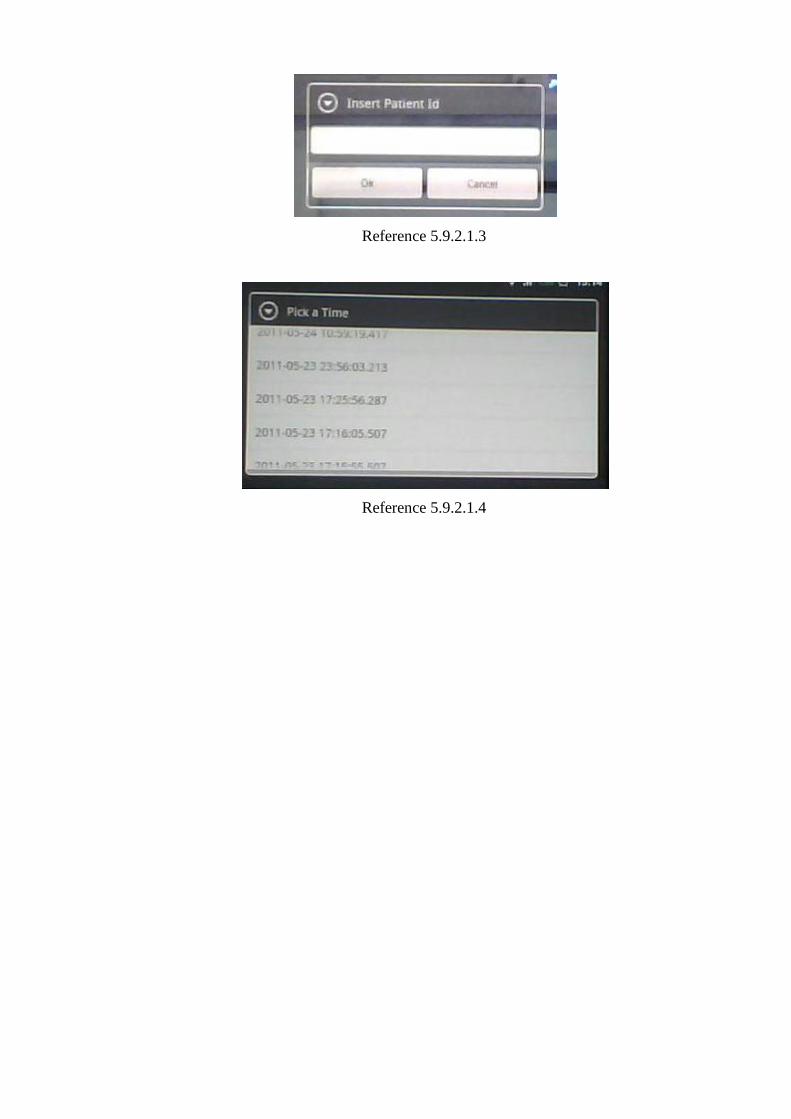
Reference 5.9.2.1.3
Reference 5.9.2.1.4

Chapter 6 Implementation Phase
6.1 Introduction
6.2 Programming Language and Platform
6.3 User Interface
6.4 Steps for Implementing the Application
6.1 Introduction
The implementation phase includes the preparation of the system into a productive
environment. In this phase the system is implemented with the tools that are selected. In
this chapter we will describe how the application was implemented and what are the steps
that were follow.
6.2 Programming Language and Platform
For implementing programming and design the application for both Patient Portal and
Doctor Portal is going to be used eclipse. Eclipse is an open source platform that gives you
the possibility to include Android Development Tools Plug-in. You can create and design
the application to your needs. The programming will be in java that can work with eclipse
and for implementing Android applications its using C++ libraries. The platform will be
Android 2.3.3 with API Level 10 [30].
For the Cardiac Graph is using the Android Plot library which is Java API for creating
dynamic and statics graphs. The certain library is an open source library that we have
extended the code in order to fulfil our needs. [8]
6.3 User Interface
The user interface will be user-friendly in order that people with low knowledge of
technology will be able to use the application after a small training. The displays are design

in such a way that will be understandable, using buttons with useful names. Drop down
list, radio buttons or static buttons are being using in order to provide better understating
from the user. Appendix I
6.4 Steps for implementing the application
Step 1: Learn and understand how tools and the technologies that are going to be use how
they work.
Step2: The system is going to be build upon an already and working system, we must
understand how is working the system, the database server, the web-services and the
Cardiac Portal web site. The system is going to be implementing using the same
functionalities as the previous system but in a new OS platform.
Step3: Implement the application using eclipse toll with java API. They were used the
android libraries that the most of them are in C++.
Step4: Implement the graph plot of the application using the Android Plot library that is an
open source library in which we change it to fit to our needs.
Step 5: Connect the Patient Portal side with the Application Server and save the data to the
Database server.
Step 6: Connect the Doctor Portal side with the Application Server in order to retrieve data
from the Database server.
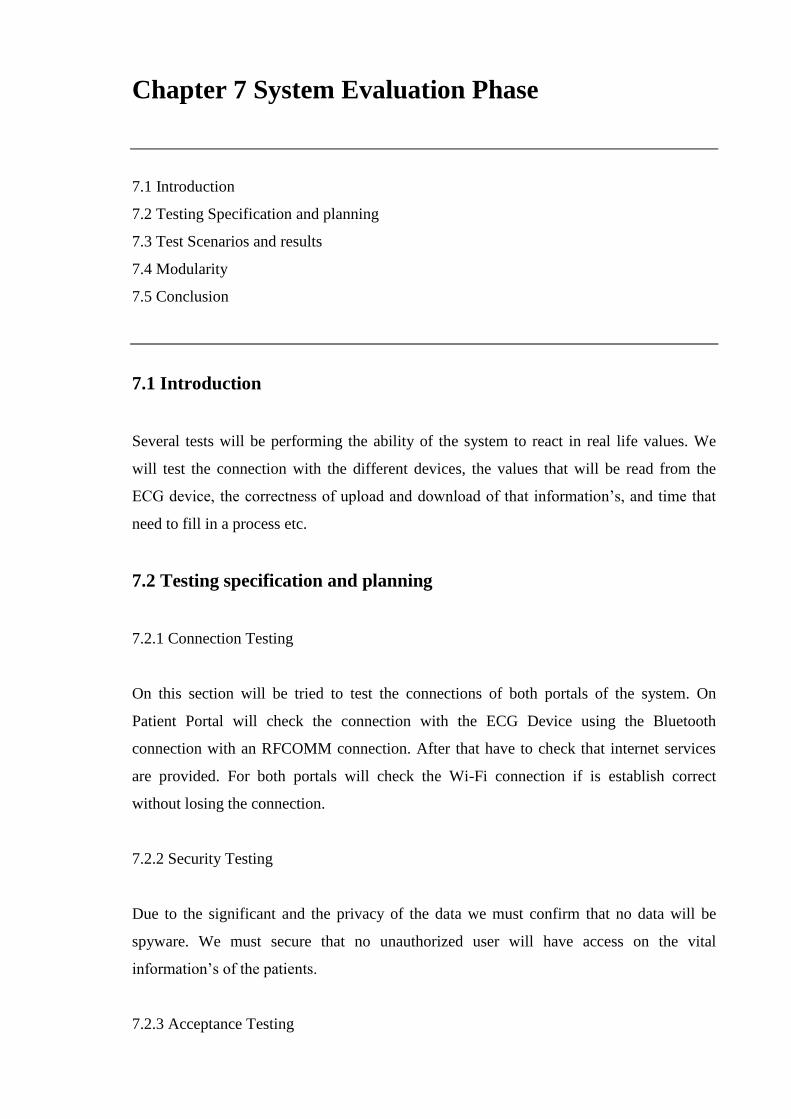
Chapter 7 System Evaluation Phase
7.1 Introduction
7.2 Testing Specification and planning
7.3 Test Scenarios and results
7.4 Modularity
7.5 Conclusion
7.1 Introduction
Several tests will be performing the ability of the system to react in real life values. We
will test the connection with the different devices, the values that will be read from the
ECG device, the correctness of upload and download of that information‘s, and time that
need to fill in a process etc.
7.2 Testing specification and planning
7.2.1 Connection Testing
On this section will be tried to test the connections of both portals of the system. On
Patient Portal will check the connection with the ECG Device using the Bluetooth
connection with an RFCOMM connection. After that have to check that internet services
are provided. For both portals will check the Wi-Fi connection if is establish correct
without losing the connection.
7.2.2 Security Testing
Due to the significant and the privacy of the data we must confirm that no data will be
spyware. We must secure that no unauthorized user will have access on the vital
information‘s of the patients.
7.2.3 Acceptance Testing
The application will be test with real-life data in a real-life environment. The application
will be test by users that will test it. Users will use the application some of the as patients
and others as doctors. This will test the application if it can work under some stress of
users that are familiar with technology or not.
7.2.4 Upload - Download Testing
The system will be examined in real time checking if is working efficiently. For the Patient
Portal we will examine if is sending correct the data on the Database of the Application
Server and the time that needs to send them, depend the length of the data. For the Doctor
Portal we will examine the time that needs to be download from the Application server
depends the length of the data.
7.2.7 Graph Test
We must examine both on Patient and Doctor Portals if the data that are display on the
graph are correct without losing any information‘s. This will be done using in parallel with
the Cardiac Portal web site that is already working on the Server.
7.3 Test Scenarios and results
7.3.1 Connection result
Patient Portal site was connected through a Bluetooth with the device successful. The
connection was establish successful because we were able to send and receive data, with an
important fact that no data where lost or defects on the data because on totals of bytes were
the same and on the graph were no changes. Moreover, on the Wi-Fi testing we manage to
send and receive data using the internet with the Patient Portal and Doctor Portal. Data
were send and received respectively without any lost and display on the graphs correct.
7.3.2 Security results
To accomplice the security, users have to login using username and password on both
Patient Portal and Doctor Portal in order to be able to use the application. Transferring the
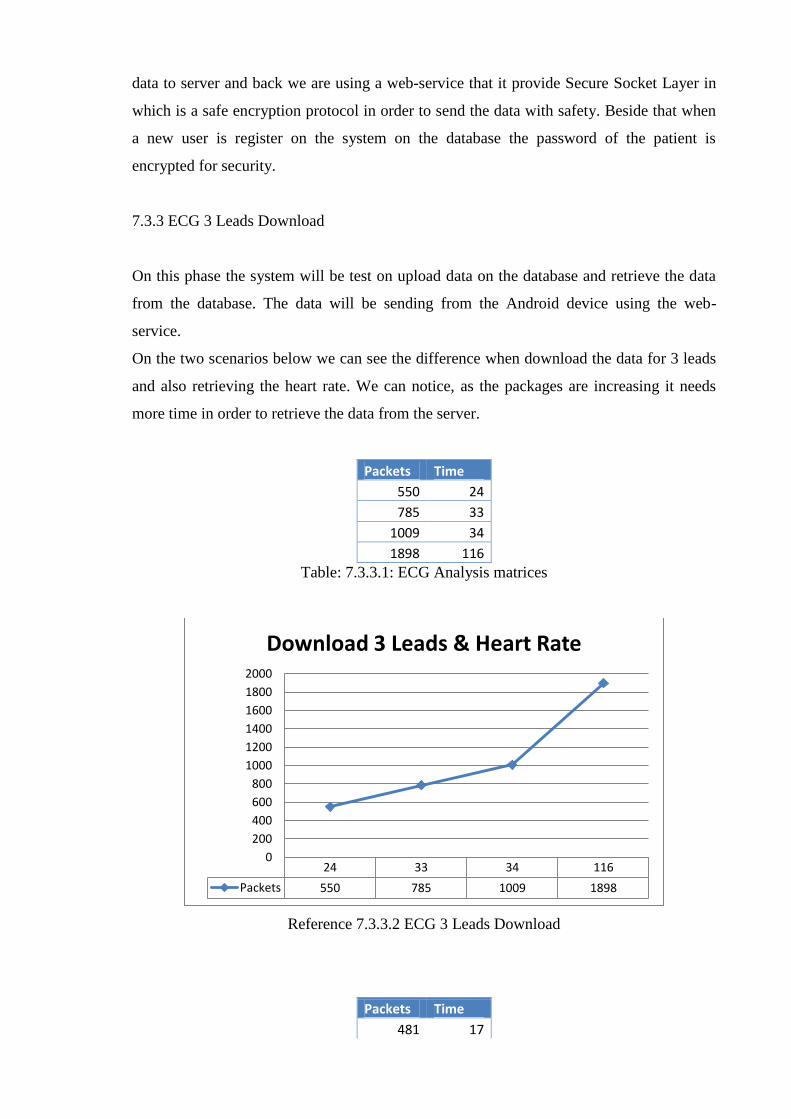
data to server and back we are using a web-service that it provide Secure Socket Layer in
which is a safe encryption protocol in order to send the data with safety. Beside that when
a new user is register on the system on the database the password of the patient is
encrypted for security.
7.3.3 ECG 3 Leads Download
On this phase the system will be test on upload data on the database and retrieve the data
from the database. The data will be sending from the Android device using the web-
service.
On the two scenarios below we can see the difference when download the data for 3 leads
and also retrieving the heart rate. We can notice, as the packages are increasing it needs
more time in order to retrieve the data from the server.
Packets Time
550 24
785 33
1009 34
1898 116 Table: 7.3.3.1: ECG Analysis matrices
Reference 7.3.3.2 ECG 3 Leads Download
Packets Time
481 17
24 33 34 116
Packets 550 785 1009 1898
0
200
400
600
800
1000
1200
1400
1600
1800
2000
Download 3 Leads & Heart Rate
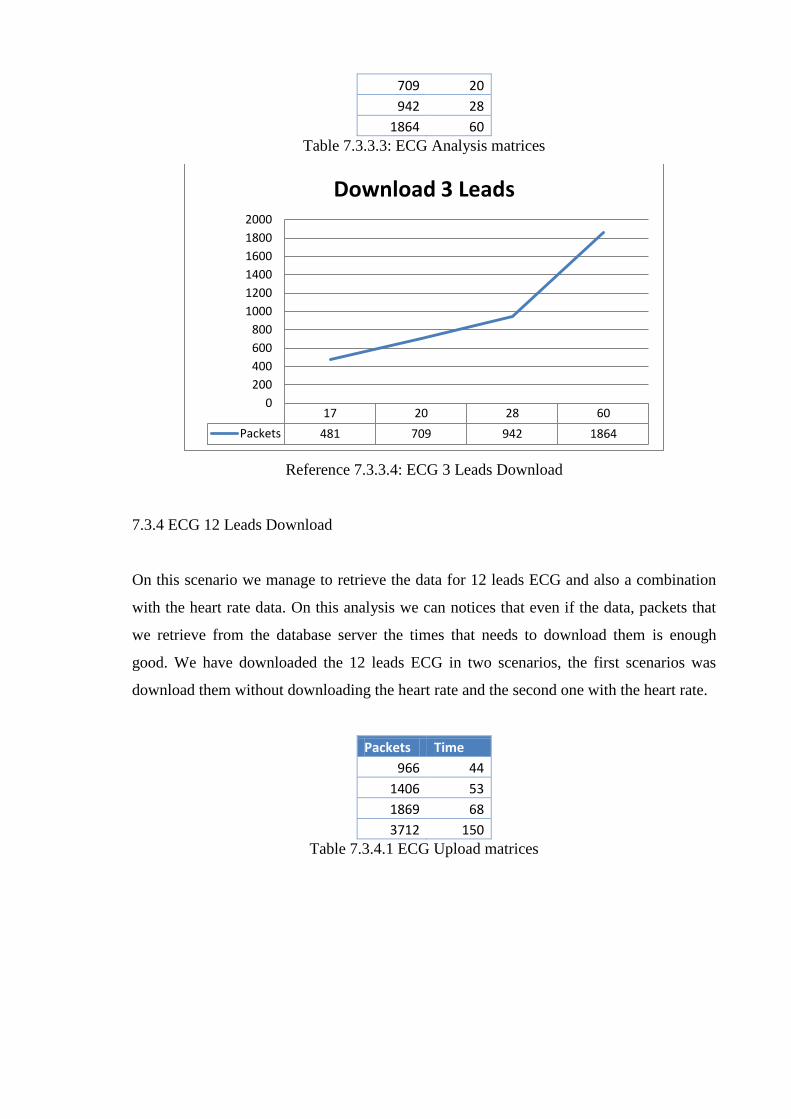
709 20
942 28
1864 60 Table 7.3.3.3: ECG Analysis matrices
Reference 7.3.3.4: ECG 3 Leads Download
7.3.4 ECG 12 Leads Download
On this scenario we manage to retrieve the data for 12 leads ECG and also a combination
with the heart rate data. On this analysis we can notices that even if the data, packets that
we retrieve from the database server the times that needs to download them is enough
good. We have downloaded the 12 leads ECG in two scenarios, the first scenarios was
download them without downloading the heart rate and the second one with the heart rate.
Packets Time
966 44
1406 53
1869 68
3712 150 Table 7.3.4.1 ECG Upload matrices
17 20 28 60
Packets 481 709 942 1864
0
200
400
600
800
1000
1200
1400
1600
1800
2000
Download 3 Leads
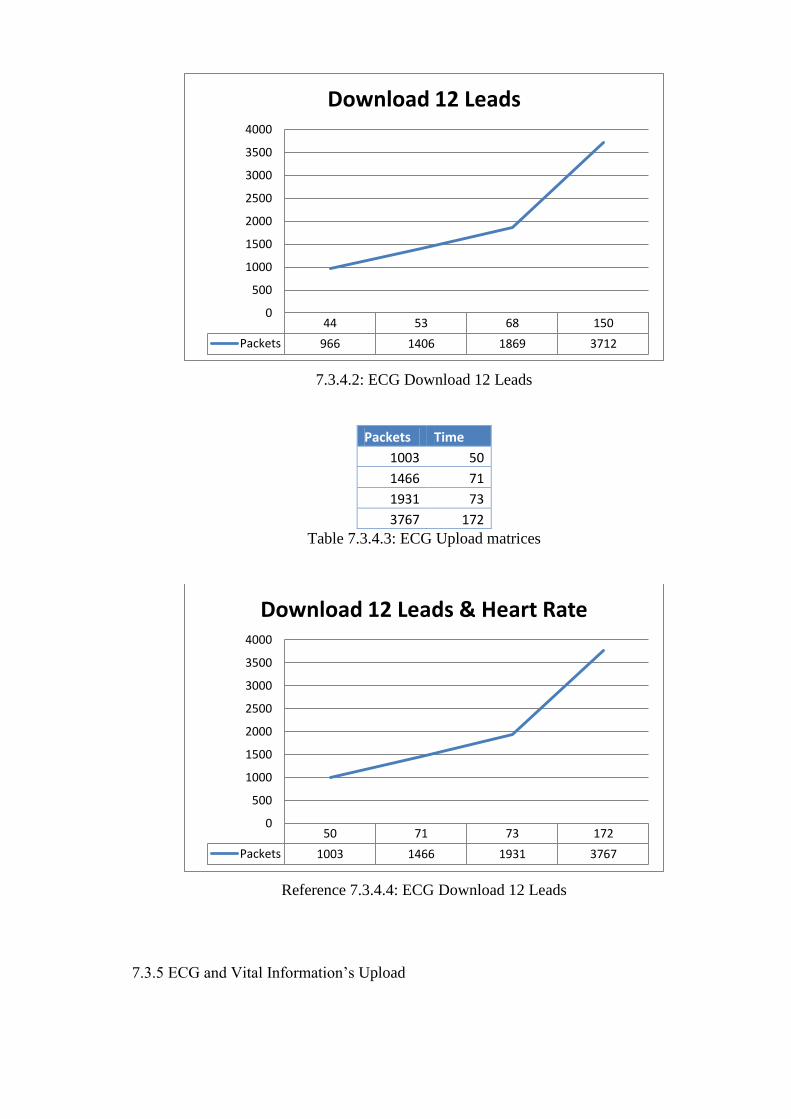
7.3.4.2: ECG Download 12 Leads
Packets Time
1003 50
1466 71
1931 73
3767 172 Table 7.3.4.3: ECG Upload matrices
Reference 7.3.4.4: ECG Download 12 Leads
7.3.5 ECG and Vital Information‘s Upload
44 53 68 150
Packets 966 1406 1869 3712
0
500
1000
1500
2000
2500
3000
3500
4000
Download 12 Leads
50 71 73 172
Packets 1003 1466 1931 3767
0
500
1000
1500
2000
2500
3000
3500
4000
Download 12 Leads & Heart Rate

On this step we will make a combination of information‘s. We will try to send as many
data as we can in order to check the availability of the application and the server and the
time that needs in order to send and receive the data.
We use two scenarios in order to check the ability of the application to upload data on the
server. The first one was to upload the ECG 3 leads with the heart rate and the second one
was the upload of ECG 12 leads with heart rate. Both of them where test with difference
sizes of files.
Packets Time
94 9
127 11
166 13
321 22 Table 7.3.5.1: ECG Download matrices
Reference 7.3.5.2: ECG 3 Leads Upload
Packets Time
167 8
250 11
299 13
550 24 Table 7.3.5.1: ECG Download matrices
9 11 13 22
Packets 94 127 166 321
0
50
100
150
200
250
300
350
Upload 3 Leads
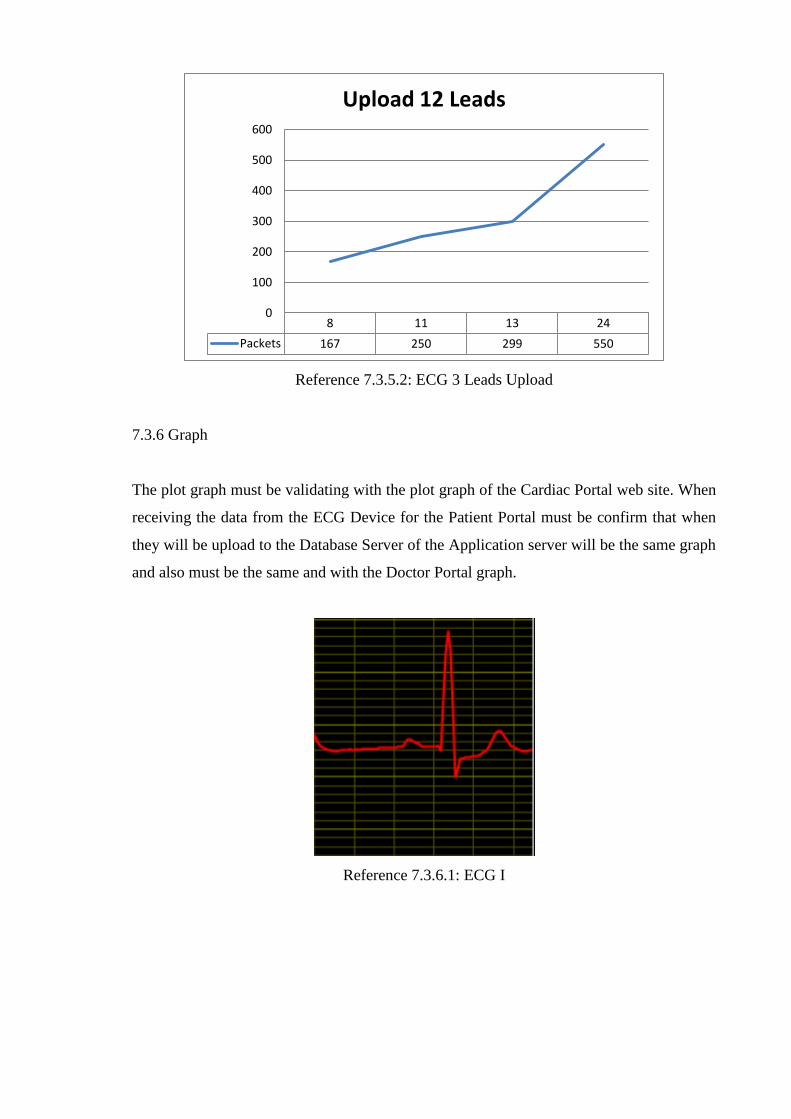
Reference 7.3.5.2: ECG 3 Leads Upload
7.3.6 Graph
The plot graph must be validating with the plot graph of the Cardiac Portal web site. When
receiving the data from the ECG Device for the Patient Portal must be confirm that when
they will be upload to the Database Server of the Application server will be the same graph
and also must be the same and with the Doctor Portal graph.
Reference 7.3.6.1: ECG I
8 11 13 24
Packets 167 250 299 550
0
100
200
300
400
500
600
Upload 12 Leads
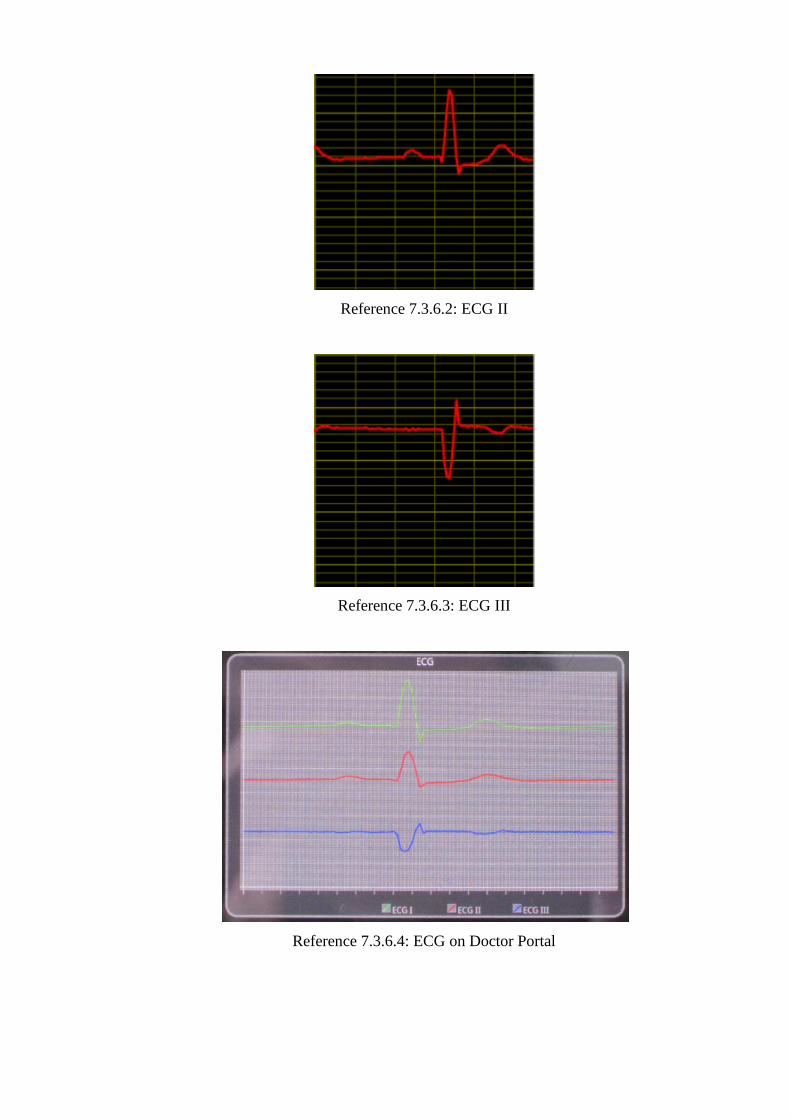
Reference 7.3.6.2: ECG II
Reference 7.3.6.3: ECG III
Reference 7.3.6.4: ECG on Doctor Portal
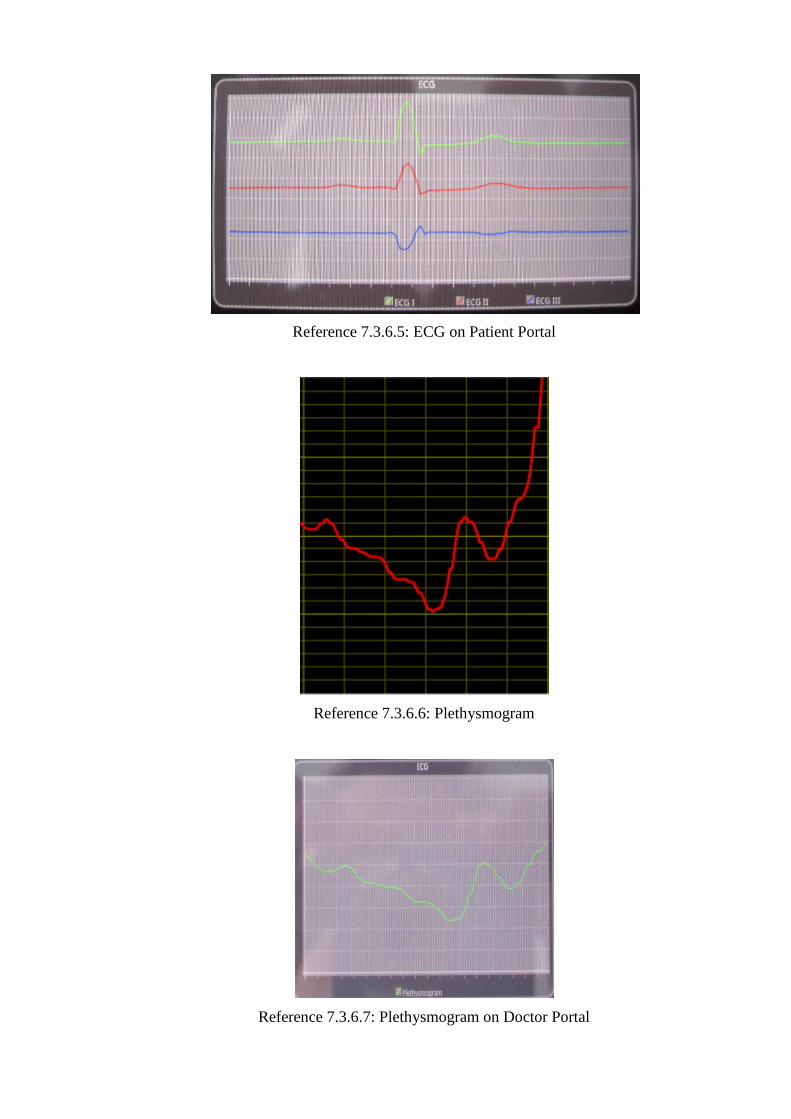
Reference 7.3.6.5: ECG on Patient Portal
Reference 7.3.6.6: Plethysmogram
Reference 7.3.6.7: Plethysmogram on Doctor Portal
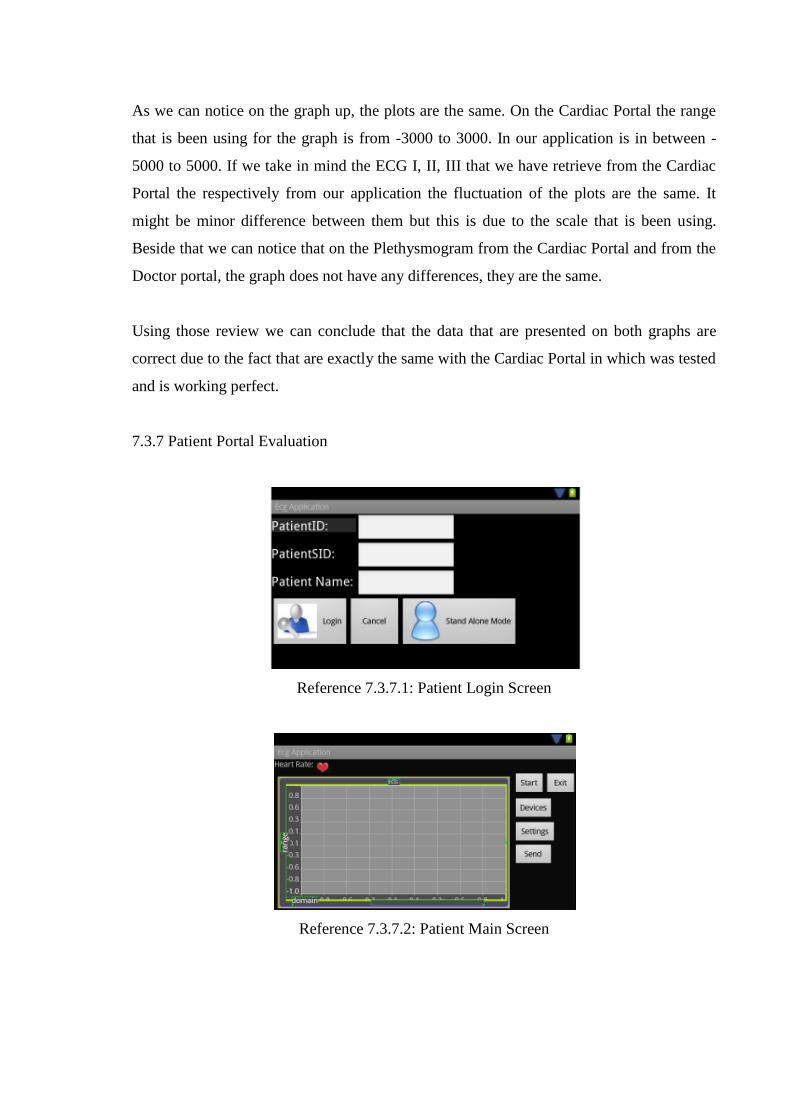
As we can notice on the graph up, the plots are the same. On the Cardiac Portal the range
that is been using for the graph is from -3000 to 3000. In our application is in between -
5000 to 5000. If we take in mind the ECG I, II, III that we have retrieve from the Cardiac
Portal the respectively from our application the fluctuation of the plots are the same. It
might be minor difference between them but this is due to the scale that is been using.
Beside that we can notice that on the Plethysmogram from the Cardiac Portal and from the
Doctor portal, the graph does not have any differences, they are the same.
Using those review we can conclude that the data that are presented on both graphs are
correct due to the fact that are exactly the same with the Cardiac Portal in which was tested
and is working perfect.
7.3.7 Patient Portal Evaluation
Reference 7.3.7.1: Patient Login Screen
Reference 7.3.7.2: Patient Main Screen
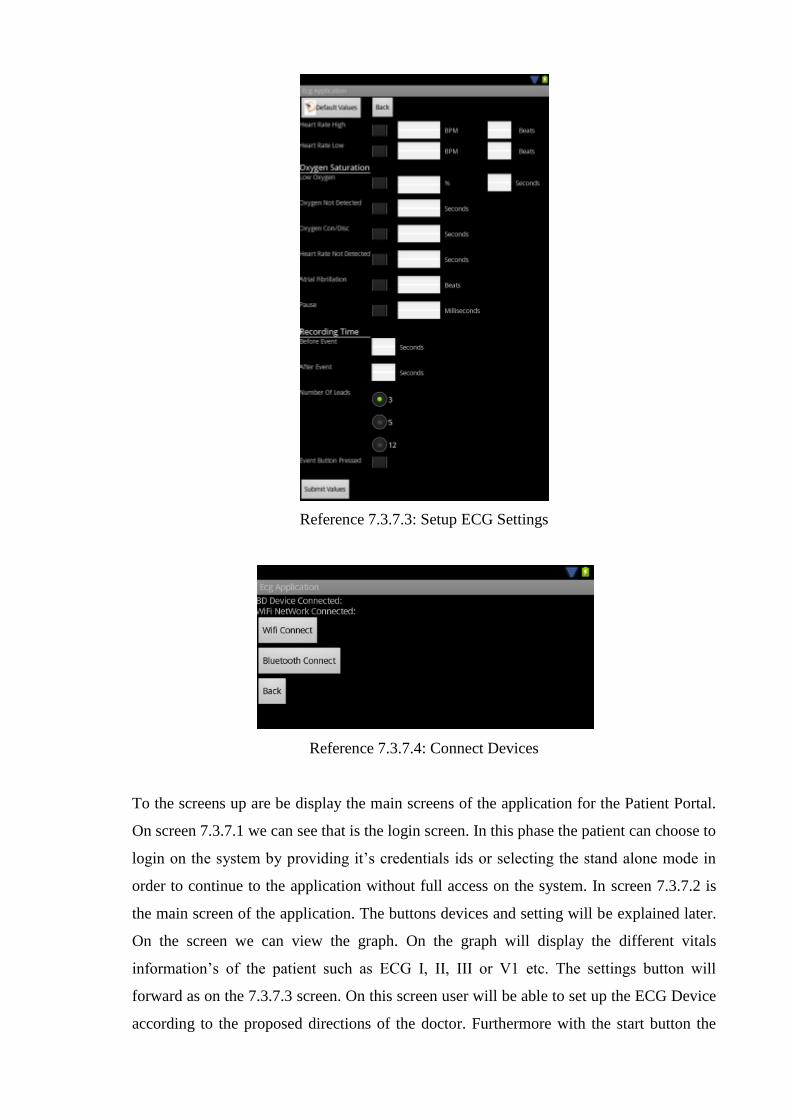
Reference 7.3.7.3: Setup ECG Settings
Reference 7.3.7.4: Connect Devices
To the screens up are be display the main screens of the application for the Patient Portal.
On screen 7.3.7.1 we can see that is the login screen. In this phase the patient can choose to
login on the system by providing it‘s credentials ids or selecting the stand alone mode in
order to continue to the application without full access on the system. In screen 7.3.7.2 is
the main screen of the application. The buttons devices and setting will be explained later.
On the screen we can view the graph. On the graph will display the different vitals
information‘s of the patient such as ECG I, II, III or V1 etc. The settings button will
forward as on the 7.3.7.3 screen. On this screen user will be able to set up the ECG Device
according to the proposed directions of the doctor. Furthermore with the start button the
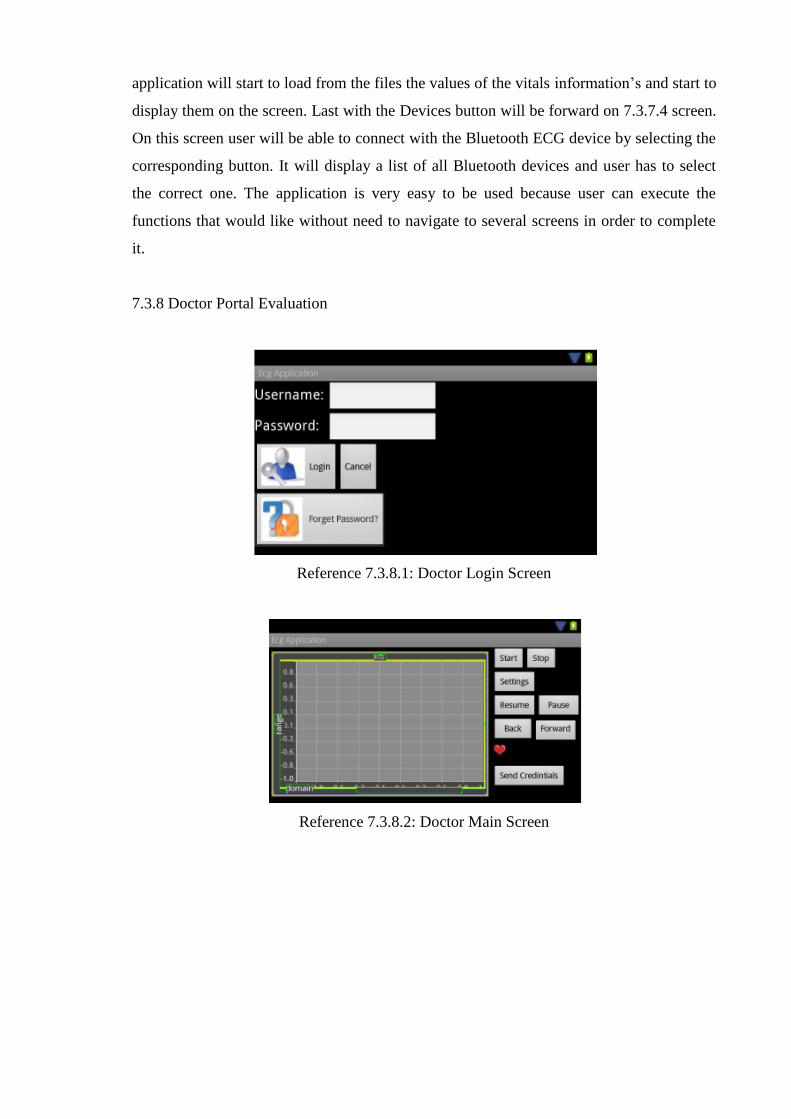
application will start to load from the files the values of the vitals information‘s and start to
display them on the screen. Last with the Devices button will be forward on 7.3.7.4 screen.
On this screen user will be able to connect with the Bluetooth ECG device by selecting the
corresponding button. It will display a list of all Bluetooth devices and user has to select
the correct one. The application is very easy to be used because user can execute the
functions that would like without need to navigate to several screens in order to complete
it.
7.3.8 Doctor Portal Evaluation
Reference 7.3.8.1: Doctor Login Screen
Reference 7.3.8.2: Doctor Main Screen
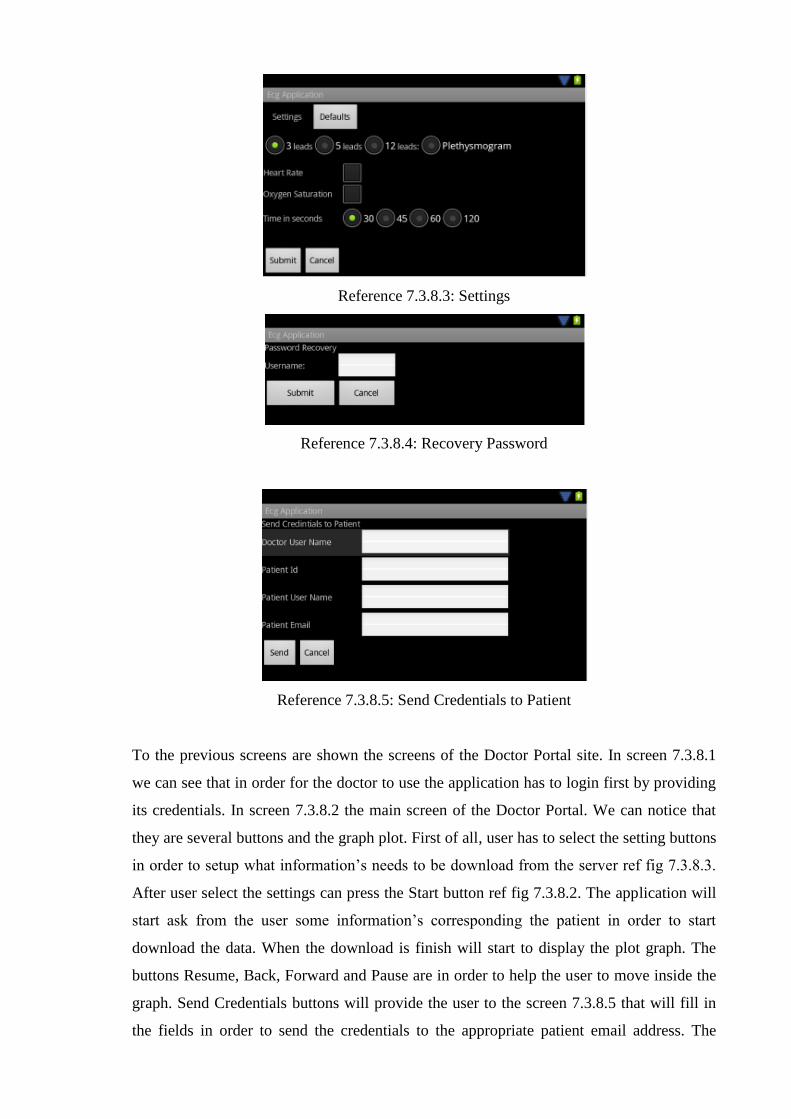
Reference 7.3.8.3: Settings
Reference 7.3.8.4: Recovery Password
Reference 7.3.8.5: Send Credentials to Patient
To the previous screens are shown the screens of the Doctor Portal site. In screen 7.3.8.1
we can see that in order for the doctor to use the application has to login first by providing
its credentials. In screen 7.3.8.2 the main screen of the Doctor Portal. We can notice that
they are several buttons and the graph plot. First of all, user has to select the setting buttons
in order to setup what information‘s needs to be download from the server ref fig 7.3.8.3.
After user select the settings can press the Start button ref fig 7.3.8.2. The application will
start ask from the user some information‘s corresponding the patient in order to start
download the data. When the download is finish will start to display the plot graph. The
buttons Resume, Back, Forward and Pause are in order to help the user to move inside the
graph. Send Credentials buttons will provide the user to the screen 7.3.8.5 that will fill in
the fields in order to send the credentials to the appropriate patient email address. The
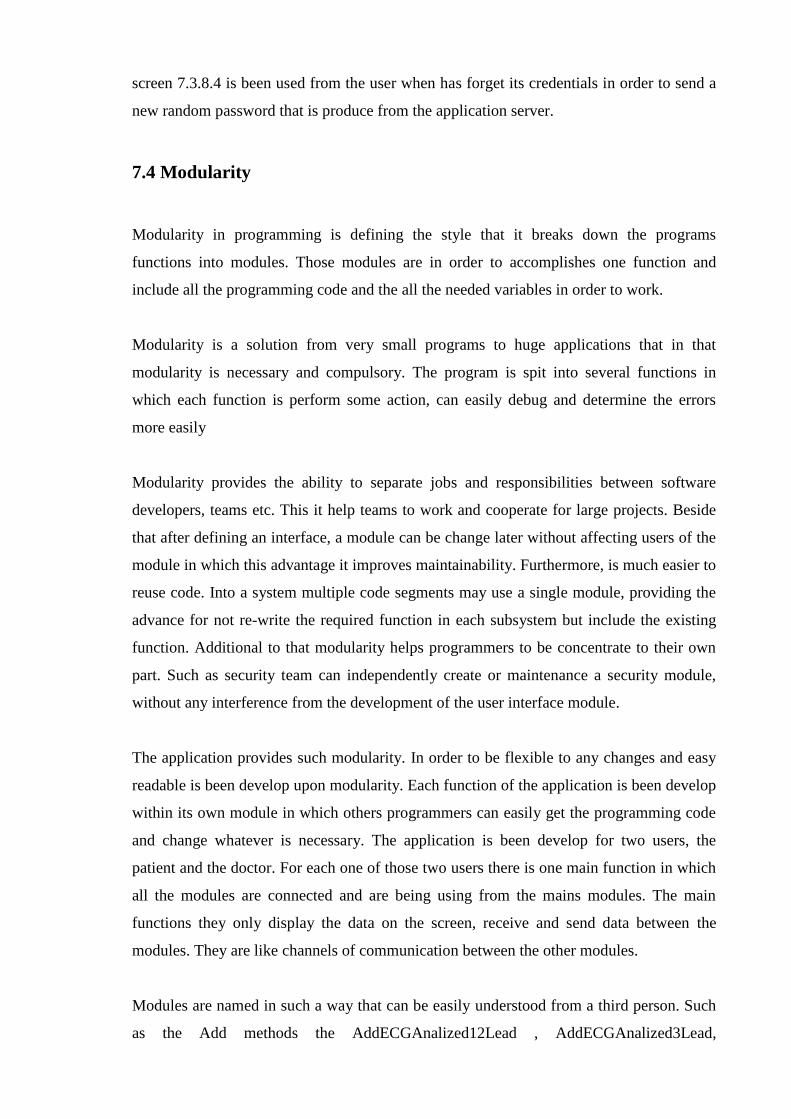
screen 7.3.8.4 is been used from the user when has forget its credentials in order to send a
new random password that is produce from the application server.
7.4 Modularity
Modularity in programming is defining the style that it breaks down the programs
functions into modules. Those modules are in order to accomplishes one function and
include all the programming code and the all the needed variables in order to work.
Modularity is a solution from very small programs to huge applications that in that
modularity is necessary and compulsory. The program is spit into several functions in
which each function is perform some action, can easily debug and determine the errors
more easily
Modularity provides the ability to separate jobs and responsibilities between software
developers, teams etc. This it help teams to work and cooperate for large projects. Beside
that after defining an interface, a module can be change later without affecting users of the
module in which this advantage it improves maintainability. Furthermore, is much easier to
reuse code. Into a system multiple code segments may use a single module, providing the
advance for not re-write the required function in each subsystem but include the existing
function. Additional to that modularity helps programmers to be concentrate to their own
part. Such as security team can independently create or maintenance a security module,
without any interference from the development of the user interface module.
The application provides such modularity. In order to be flexible to any changes and easy
readable is been develop upon modularity. Each function of the application is been develop
within its own module in which others programmers can easily get the programming code
and change whatever is necessary. The application is been develop for two users, the
patient and the doctor. For each one of those two users there is one main function in which
all the modules are connected and are being using from the mains modules. The main
functions they only display the data on the screen, receive and send data between the
modules. They are like channels of communication between the other modules.
Modules are named in such a way that can be easily understood from a third person. Such
as the Add methods the AddECGAnalized12Lead , AddECGAnalized3Lead,

AddECGAnalized5Lead are the modules that are configure in order to send the data on the
Database Server. They are easily understandable what their main purposes are. Beside
those all the modules are named in according that for better understanding.
Furthermore the programming code of the application of each module is been divided into
subclasses. Each module consists of several functions inside the module. Each function is
design for one purpose with a readable programming code. Any programmer can read the
code and understand what each function is doing and makes any changes that are needed.
7.5 Conclusion
During the evaluation of the application it documented that all ECG and other vitals
information‘s are sending on the database correct with no losses. Upon this which is the
main purpose of the system we can conclude that the system is working with success.
Furthermore, during the compare of the same data between the patients, the doctor and the
Cardiac Portal there was no different between the graphs. Even though a larger scale was
used from our application the presentation of the graph was correct and we can notice the
fluctuation of the plot.
Moreover on the times that are needed in order to send and retrieve the ECG information‘s
on the server we are very satisfied. Compare the results, patients will not need at all much
time in order to upload the data due to the fact that the transfer was very fast, in which on
the other hand the download of the data, the time was not dissuasive for using the
application. The matrices that were gathered where made upon the several sizes of files.
Actually where made upon the functions that user is able to use in order to select the time
of data that needs for downloading the according data from the application server.
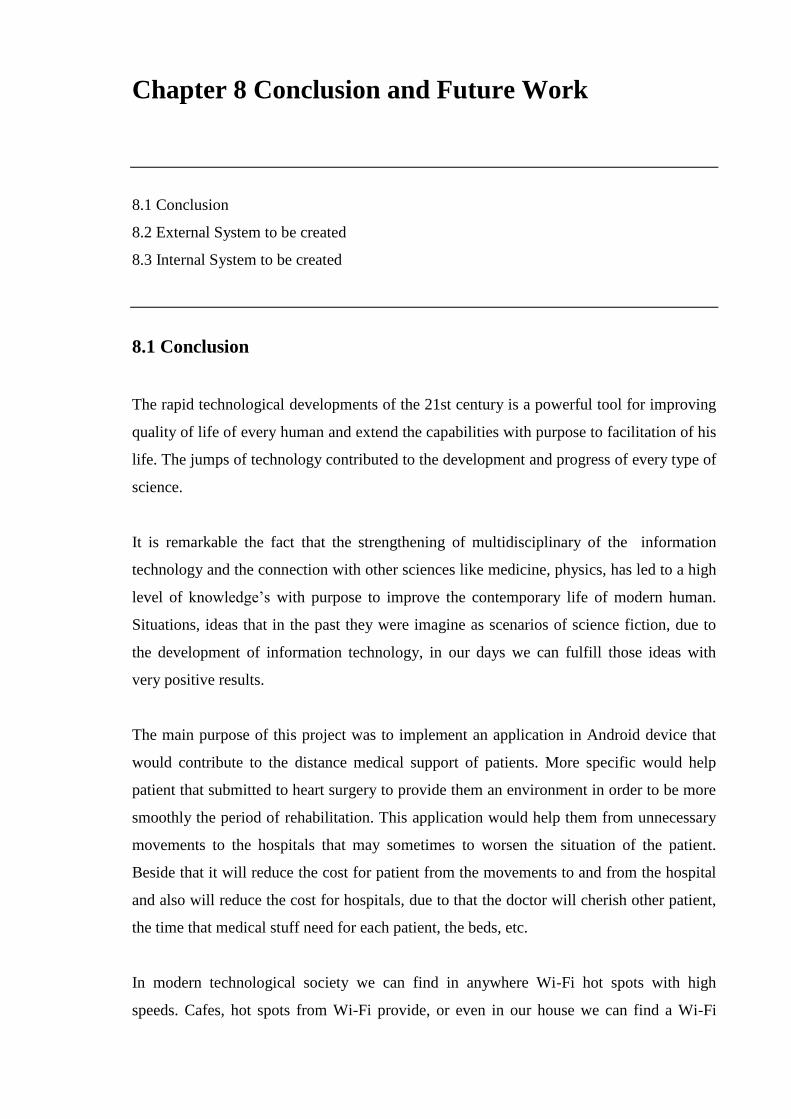
Chapter 8 Conclusion and Future Work
8.1 Conclusion
8.2 External System to be created
8.3 Internal System to be created
8.1 Conclusion
The rapid technological developments of the 21st century is a powerful tool for improving
quality of life of every human and extend the capabilities with purpose to facilitation of his
life. The jumps of technology contributed to the development and progress of every type of
science.
It is remarkable the fact that the strengthening of multidisciplinary of the information
technology and the connection with other sciences like medicine, physics, has led to a high
level of knowledge‘s with purpose to improve the contemporary life of modern human.
Situations, ideas that in the past they were imagine as scenarios of science fiction, due to
the development of information technology, in our days we can fulfill those ideas with
very positive results.
The main purpose of this project was to implement an application in Android device that
would contribute to the distance medical support of patients. More specific would help
patient that submitted to heart surgery to provide them an environment in order to be more
smoothly the period of rehabilitation. This application would help them from unnecessary
movements to the hospitals that may sometimes to worsen the situation of the patient.
Beside that it will reduce the cost for patient from the movements to and from the hospital
and also will reduce the cost for hospitals, due to that the doctor will cherish other patient,
the time that medical stuff need for each patient, the beds, etc.
In modern technological society we can find in anywhere Wi-Fi hot spots with high
speeds. Cafes, hot spots from Wi-Fi provide, or even in our house we can find a Wi-Fi
network. All the vital information‘s from the Android application will be send using a Wi-
Fi network. It will be no fear of losing any data due to the high quality that all providers
support. It was proposed to be used the 3G network for sending and receiving of the data
but due to the mass data that would be transfer each time it would be no economic for the
user. In Cyprus the 3G network is still expensive. For example 1 GB mobile internet will
be cost € 18.30 and each additional MB that is been used, will be cost extra.
I believe that we implement the application in a very stable and helpful stage, that will
provide to the user a more easy way to control its cardiac arrhythmias and for the doctor to
control the patients that need support. The application is easy to be control from home
from the patients of any age and send the information‘s to the appropriate medical stuff.
8.2 External System to be created
An ECG device must be buying in order to be provided to the patient. The existing
device could not be use due to that Android Devices have some bugs on the
Bluetooth settings we could not configure the application to send and receive the
data, we have manage to setup a connection. The ECG device that will be got must
have in mind to work with Android devices. The device must be able to collect the
minimum until 12 leads vital information‘s and the power autonomy that will has.
The analyses of the ECG could not be done on the Android device. In order to
make analyses of the information‘s it will cost to the device CPU and time. If the
analysis is being done on the upload time it will delay until the information‘s would
uploaded on the server taking too much time to be done. The analyses can be done
on the server, the moment that the data are uploaded on the server and saved on a
temporary table a service could fire up a task in order to make the analysis and save
the data in the main ECG table.
The system could not be only to be use from people with cardiac arrhythmias but
also can be used from home user to check there ECG, blood pressure, etc. For
example on ambulance they only check until 5 leads. The application can be setup
to display with standard settings with no need to change them. When a tablet device
exist it will be easy for the ambulance medical personnel to use it combine with an
ECG Device.
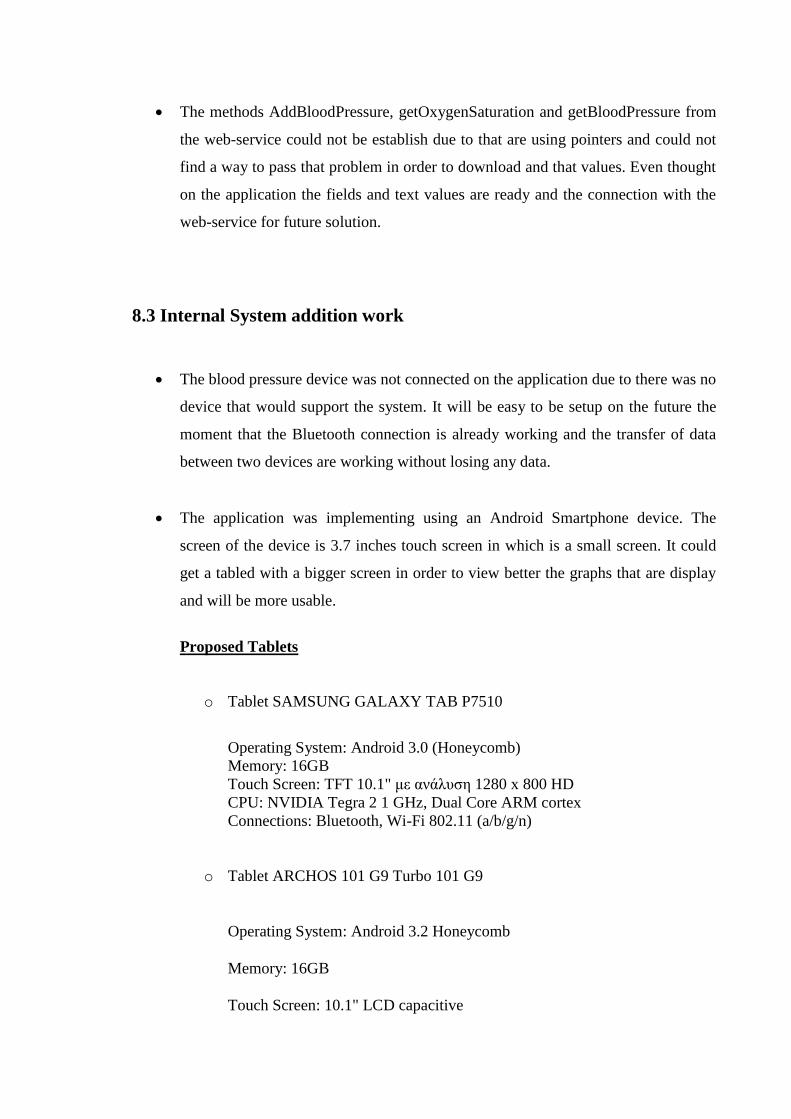
The methods AddBloodPressure, getOxygenSaturation and getBloodPressure from
the web-service could not be establish due to that are using pointers and could not
find a way to pass that problem in order to download and that values. Even thought
on the application the fields and text values are ready and the connection with the
web-service for future solution.
8.3 Internal System addition work
The blood pressure device was not connected on the application due to there was no
device that would support the system. It will be easy to be setup on the future the
moment that the Bluetooth connection is already working and the transfer of data
between two devices are working without losing any data.
The application was implementing using an Android Smartphone device. The
screen of the device is 3.7 inches touch screen in which is a small screen. It could
get a tabled with a bigger screen in order to view better the graphs that are display
and will be more usable.
Proposed Tablets
o Tablet SAMSUNG GALAXY TAB P7510
Operating System: Android 3.0 (Honeycomb)
Memory: 16GB
Touch Screen: TFT 10.1" με ανάλυση 1280 x 800 HD
CPU: NVIDIA Tegra 2 1 GHz, Dual Core ARM cortex
Connections: Bluetooth, Wi-Fi 802.11 (a/b/g/n)
o Tablet ARCHOS 101 G9 Turbo 101 G9
Operating System: Android 3.2 Honeycomb
Memory: 16GB
Touch Screen: 10.1" LCD capacitive
CPU: OMAP 4 ARM CORTEX smart multi-core A9 1.2 GHz
Connection: USB, Wi-Fi 802.11 b/g/n, Bluetooth 2.1 + EDR,
The proposed tablets they fulfil the minimum technical characteristics in order for
the application to be compatible with the tablets. The Archos has a newer Operating
system than the Samsung in which is not a problem because can be updated, beside
that the CPU of the Samsung is much better that this of Archos. According the
other characteristics are the same so there is no problem which one to chose. The
only that characteristic that we should take in mind is the CPU and my opinion is to
get the SAMSUNG that has better CPU and update the Operating System from the
manufacturer support web site.
When the doctor downloads the data, it has to download all the data and then it start
to display them on the graph. A smart and difficult, but efficient way to be done, it
to use buffer. It can start download until a point and then to start display the data
but in the same time to continue downloading the rest of the data.
Could incorporate a function in the application in order when the patient don‘t fill
well or there is a problem with the analysis will send a message to the medical
center in order to provides help to the patient.
Furthermore in order to minimize the time for send and receive the data it could be
used a compress method. Before the data would be send or receive to be compress
with an algorithm, this can be done in upload the phase that patient is receiving the
vital information‘s, those data to be compress in order not to be needed when it will
be upload them in order to reduce the time that is needed to upload them. Also on
the doctor when it tries to download them from the Application server to compress
them, in order the phase to takes for less time.
Video-Conference can be developed on the existing application for better
communication between the patient, the assistance and the remote medical stuff.
Could provide the ability to the doctor to examine the patient remotely, to inspect
the patient for any beatings, injuries, rashes on patient body that could affect the
current illness of the patient
Photo-snapshot could be used in order to provide an extra help on the doctor in
cases that cannot carried a video conference. Beside that photo snapshot could be
kept for history in the patient file for future use.
Bibliography
[1] A. Gavrilov and P. Heuveline, ―Aging of Population Leonid,‖ 2003.
[2] ―Wikipedia.‖ [Online]. Available: www.wikipedia.org.
[3] E. Goldberger, AL, Goldberger, ―The Electrocardiogram (ECG),‖ 2006. [Online].
Available: http://heartdisease.about.com/cs/ekgecg/l/blecg1.htm.
[4] ―Electrocardiogram.‖ [Online]. Available:
http://www.cardiaccatheterization.info/cardiac-catheterization/electrocardiogram.
[5] M. Rudolf Klimes, ―ECG Characteristics and Interventions.‖ .
[6] R.-id Abdulla, ―Abnormal Heart Rhythm (Arrhythmia or Dysrhythmia).‖ [Online].
Available: http://pediatriccardiology.uchicago.edu/PP/abnl rhythm for parents
body.htm.
[7] K. Augikos, ―Cardiac arrhythmias.‖ [Online]. Available: http://night-
flights.pblogs.gr/2007/03/kardiakes-arrythmies-iatrikh-selida-65.html.
[8] T. Nick, ―Android Plot.‖ [Online]. Available: http://androidplot.com/wiki/Home.
[9] ―SOAP.‖ [Online]. Available: http://en.wikipedia.org/wiki/SOAP.
[10] Wikipedia, ―Bluetooth.‖ [Online]. Available: http://en.wikipedia.org/wiki/Bluetooth.
[11] Wikipedia, ―Wi-Fi.‖ [Online]. Available: http://en.wikipedia.org/wiki/Wi-Fi.
[12] Wikipedia, ―Web Services.‖ [Online]. Available:
http://en.wikipedia.org/wiki/Webservices.
[13] Wikipedia, ―Android.‖ [Online]. Available:
http://en.wikipedia.org/wiki/Smartphone#Android.
[14] Wikipedia, ―HTC Desire.‖ [Online]. Available:
http://en.wikipedia.org/wiki/HTC_Desire.
[15] TechMedic, ―Dyna-Vision Unit.‖ [Online]. Available: http://www.dyna-
vision.com/index.php?option=com_content&view=article&id=7&Itemid=9&lang=e
n.
[16] ―System Requirements.‖ [Online]. Available:
http://en.wikipedia.org/wiki/System_requirements_specification.
[17] Wikipedia, ―Entity Relationship Model.‖ [Online]. Available:
http://en.wikipedia.org/wiki/Entity-relationship_model.
[18] ―AliveCor.‖ [Online]. Available: http://alivecor.com.
[19] ―Human++ Ban.‖ [Online]. Available: http://geeknizer.com/ecg-eeg-on-phone.

[20] P. Chimonidou, ―Telemonitoring System for Children with Cardiac Arythmias,‖
Department of Computer Science, University of Cyprus, 2011.
[21] G. Matheou, ―Mobile telemedicine system on a laptop (with sensors) for monitoring
patients during the postoperative period,‖ 2011.
[22] F. G. A. Giordano, S. Scalvini, E. Zanelli, U. Corrà, G.L. Longobardi, V.A. Ricci, P.
Baiardi, ―Multicenter randomised trial on home-based telemanagement to prevent
hospital readmission of patients with chronic heart failure.‖
[23] Wikipedia, ―Use Case Diagram.‖ [Online]. Available:
http://en.wikipedia.org/wiki/Use_Case_Diagram.
[24] Wikipedia, ―Telemedicine.‖ [Online]. Available:
en.wikipedia.org/wiki/Telemedicine.
[25] Wikipedia, ―m-Health.‖ [Online]. Available: http://en.wikipedia.org/wiki/MHealth.
[26] Wikipedia, ―E-Health.‖ [Online]. Available: http://en.wikipedia.org/wiki/EHealth.
[27] C. T. and Aging, ―mHealth Technologies: Applications to Benefit Older Adults,‖
2011.
[28] U. T. M. Kulka, ―Meeting Health Needs Through a Broad Array of Applications.‖
[29] Wikipedia, ―Human Heart.‖ [Online]. Available:
http://en.wikipedia.org/wiki/Human_heart.
[30] Eclipse, ―Eclipse.‖ [Online]. Available: http://www.eclipse.org/.
[31] Microsoft, ―XML Web Service.‖ [Online]. Available: http://msdn.microsoft.com/en-
us/library/x05s00wz%28v=vs.71%29.aspx.
[32] H. Newton, ―Newton‘s telecom dictionary,‖ 2007.
[33] B. Org., ―Bluetooth.‖ .
[34] Alexander, ―Bluetooth and 802.15.1 Patent Analysis Services.‖ [Online]. Available:
http://www.alexanderresources.com/Bluetooth_Patent_Analysis_Services.htm.
[35] Webopedia, ―Wi-Fi Network.‖ .
[36] J. Jensen, ―802.11 g: Pro‘s & Cons of a Wireless Network in a Business
Environment,‖ 2007. .
[37] W3C, ―Web Services Glossary,‖ 2004. .
[38] V. F. United Nation Foundation, ―mHealth for Development: The Opportunity of
Mob ile Technology for Healthcare in the Developing World,‖ Technology.
[39] W. H. Organization, The Global Burden of Disease. 2004.

Appendix I - User Manual
1. Start applications
When the user start the application has to choose between the two types of the
users. Must be selected the Patient or Doctor Portal side, in order to be forward to
the corresponding Login Site ref fig I-1.
Reference I-1
2. Patient Portal Side
2.1 Login Site
The user can select between two modes of the Patient Portal site. Can choose
either to add the credentials to continue as an authenticated user with full access
on the application or can select the Stand Alone Mode ref fig I-2.1.1.
Reference I-2.1.1

2.2 Connect ECG Devices
User select from the menu to connect to devices. Select the Bluetooth Connect
button and display a list to the user with all paired and not paired Bluetooth
devices on the range of the application device. Then selecting the correct ECG
devices from the list, the application will try to connect to the corresponding
Bluetooth device ref fig I-2.2.1, ref fig I-2.2.2.
.
Reference I-2.2.1

Reference I-2.2.2
2.3 Setup ECG Device
Selecting from the menu the Settings button will display to the user the form in
order to set up the ECG Device. From this form can select the leads, the heart
rate etc. Or can select the Default Values and save the selections ref fig I-2.3.1.
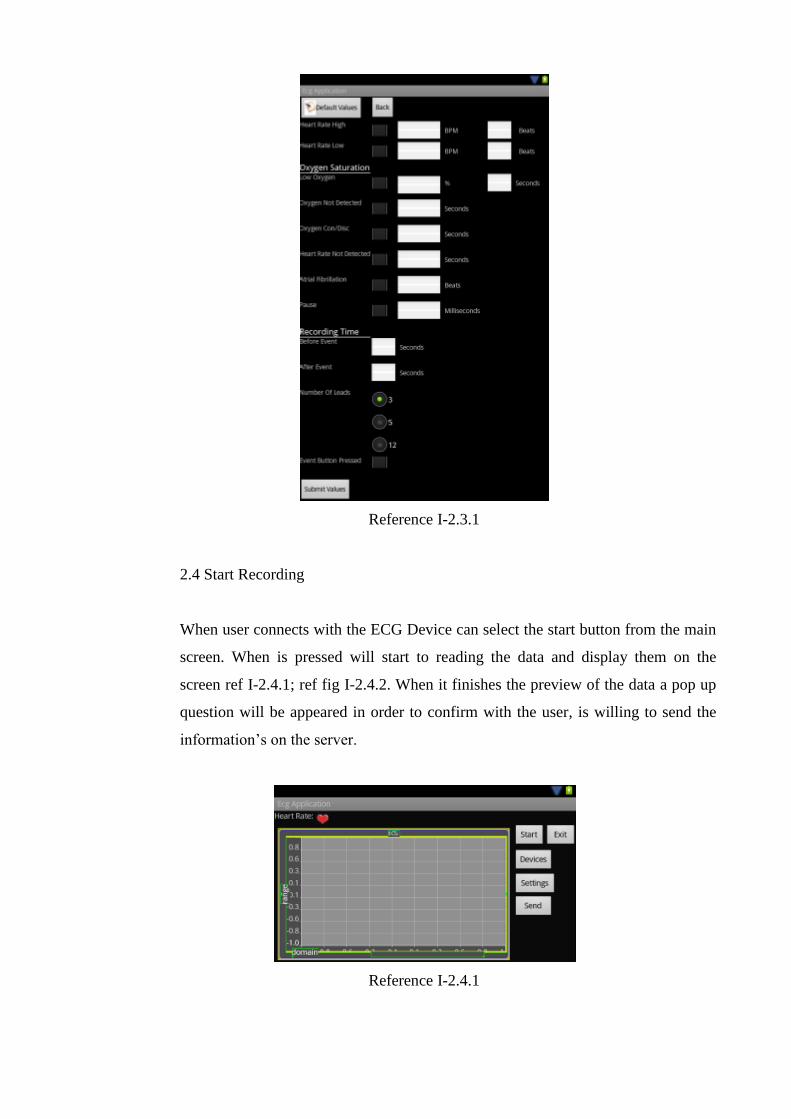
Reference I-2.3.1
2.4 Start Recording
When user connects with the ECG Device can select the start button from the main
screen. When is pressed will start to reading the data and display them on the
screen ref I-2.4.1; ref fig I-2.4.2. When it finishes the preview of the data a pop up
question will be appeared in order to confirm with the user, is willing to send the
information‘s on the server.
Reference I-2.4.1

Reference I-2.4.2
3. Doctor Portal Site
3.1 Login Site
User has to login on the system, providing its credentials username and
password in and will login button will send the credentials to the server in order
to confirm them and authenticate the user. If user is authenticated then it
forwards them to the main form of the Doctor Portal site ref fig I-3.1.1.
Reference I-3.1.1
3.2 Password Recovery
In case that user forgets its password can choose the Forget Password button in
order to forward him in the appropriate form to fill in his username. When user
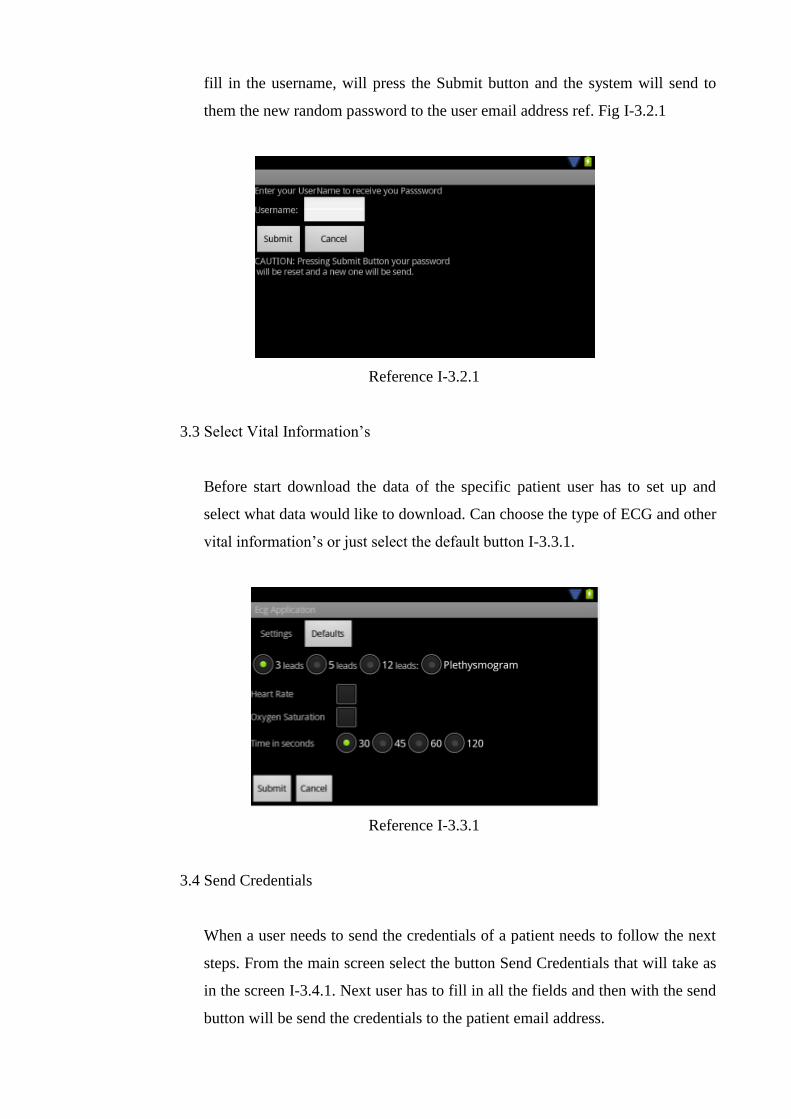
fill in the username, will press the Submit button and the system will send to
them the new random password to the user email address ref. Fig I-3.2.1
Reference I-3.2.1
3.3 Select Vital Information‘s
Before start download the data of the specific patient user has to set up and
select what data would like to download. Can choose the type of ECG and other
vital information‘s or just select the default button I-3.3.1.
Reference I-3.3.1
3.4 Send Credentials
When a user needs to send the credentials of a patient needs to follow the next
steps. From the main screen select the button Send Credentials that will take as
in the screen I-3.4.1. Next user has to fill in all the fields and then with the send
button will be send the credentials to the patient email address.
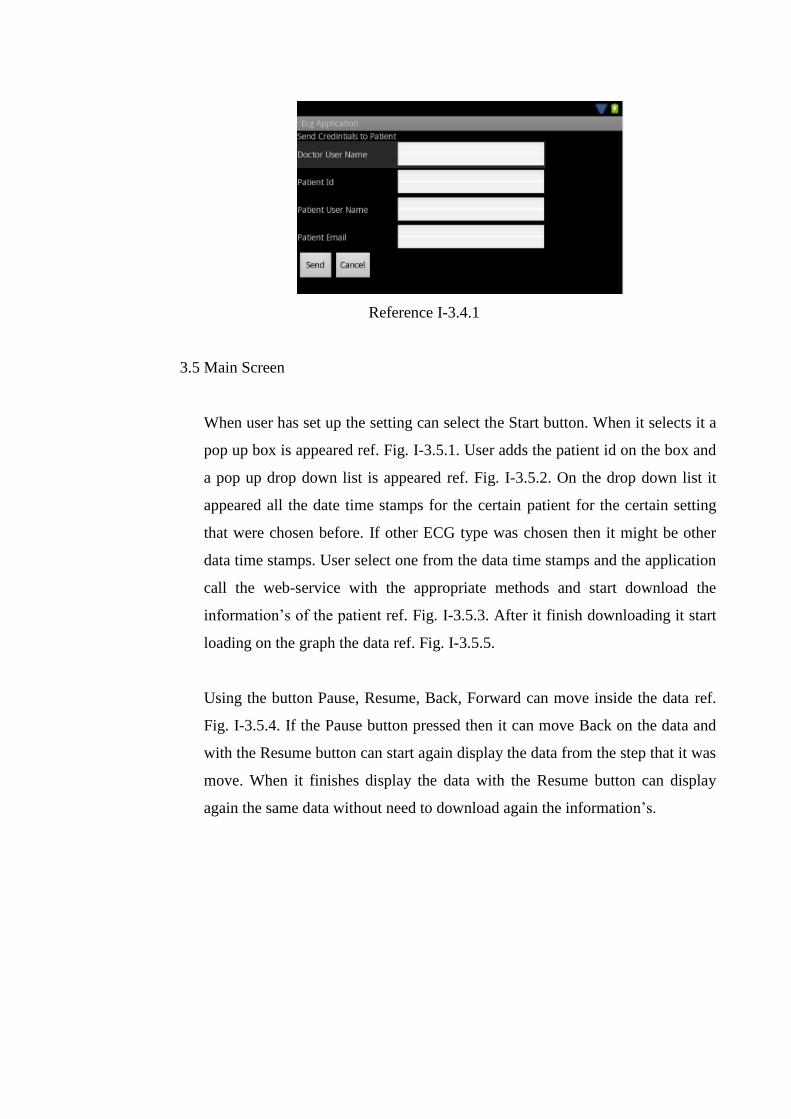
Reference I-3.4.1
3.5 Main Screen
When user has set up the setting can select the Start button. When it selects it a
pop up box is appeared ref. Fig. I-3.5.1. User adds the patient id on the box and
a pop up drop down list is appeared ref. Fig. I-3.5.2. On the drop down list it
appeared all the date time stamps for the certain patient for the certain setting
that were chosen before. If other ECG type was chosen then it might be other
data time stamps. User select one from the data time stamps and the application
call the web-service with the appropriate methods and start download the
information‘s of the patient ref. Fig. I-3.5.3. After it finish downloading it start
loading on the graph the data ref. Fig. I-3.5.5.
Using the button Pause, Resume, Back, Forward can move inside the data ref.
Fig. I-3.5.4. If the Pause button pressed then it can move Back on the data and
with the Resume button can start again display the data from the step that it was
move. When it finishes display the data with the Resume button can display
again the same data without need to download again the information‘s.
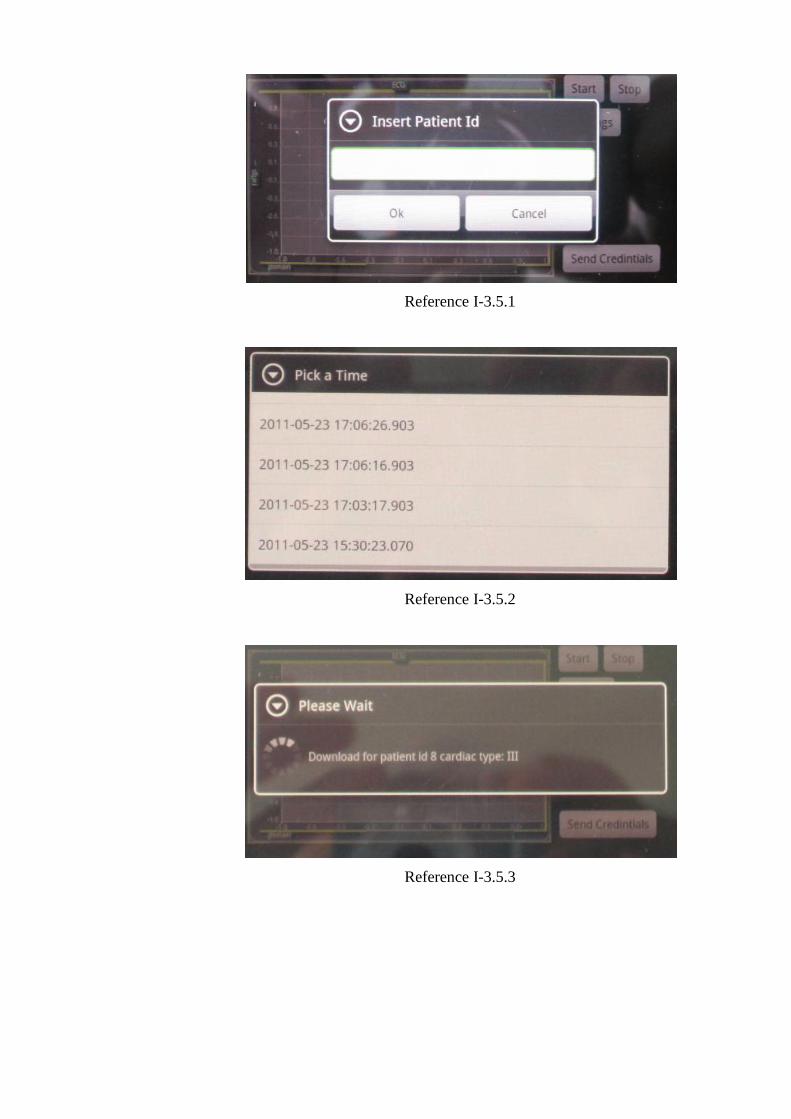
Reference I-3.5.1
Reference I-3.5.2
Reference I-3.5.3

Reference I-3.5.4
Reference I-3.5.5

Appendix II - Installation Phase
1. System Installation Method
The application will be able to be installing on Android Devices. In order this do be done
an .apk file is been created. The certain .apk file in order to install it on the device the
following method must be follow.
1.1 Copy the APK file to the root directory of your memory card.
1.2 Download an application called Apps Installer or any File Manager from the
Android Market. Install it and start the application.
1.3 In the Apps Installer application, you will see a list of the APK files stored in
the root directory of your memory card.
1.4 Select the APK you want to install and you are done. You can now access the
application from the menu.
2 Files Installation
The application in order to be working it needs some files. Those files are been created
automatically for the first time that the application is been started. Beside that each time
that the application start it makes a check on the memory card if the certain folders and
files exist. If some of them are deleted then it creates them.