
Bioinspired Hydrogels as Platforms for Life-Science Applications
Upload
khangminh22Category
view
2download
0
Data Science Applications to
Investment Management
Master's Degree Dissertation
Master in Banking and Finance UPF Barcelona School of Management
Author Jonathan Ayala González
Leveraging in Alternative Data Sets and Unconventional Techniques to Enhance
Portfolio Performance.
Academic Year 2019 – 2020
Mentor Luz Parrondo
Data Science Applications to Investment Management
Project performed within the framework of the Master in Banking and Finance program taught by Barcelona School of Management, a centre associated with Pompeu Fabra University
This work is licensed under a Creative Commons Attribution-NonCommercial-NoDerivatives 4.0 International License

2
Copyright
© Jonathan Ayala González. Reservados todos los derechos. Está prohibido la reproducción
total o parcial de esta obra por cualquier medio o procedimiento, comprendidos la impresión, la
reprografía, el microfilme, el tratamiento informático o cualquier otro sistema, así como la
distribución de ejemplares mediante alquiler y préstamo, sin la autorización escrita del autor o
de los límites que autorice la Ley de Propiedad Intelectual.
© Jonathan Ayala González. All rights reserved. It is prohibited the total or partial reproduction
of this work by any means or procedure, including printing, reprography, microfilm, computer
processing or any other system, as well as the distribution of copies through rental and loan,
without the written authorization of the author or the limits authorized by the Intellectual
Property Law.

3
Acknowledgments
To the women who made this life achievement possible: I.R.D.G., N.G.R. & J.E.G.
I wish to show my gratitude to all the people whose assistance was a milestone in the
completion of this project, especially to my Supervisor professor. My gratitude to all
academic staff of the Masters in Banking and Finance of the Barcelona School of
Management for their firm commitment with our learning during the program,
especially during the confinement period.
4
Abstract
“On the other hand, investing is a unique kind of casino—one where you cannot lose in the end, so
long as you play only by the rules that put the odds squarely in your favour.” (Benjamin Graham - The
Intelligent Investor, 1949). This paper provides a theoretical and practical approach to the uses of data
science as a mechanism to support investment decisions. Although data science applications in
investment management are quite varied and numerous, this paper focuses on a data typology currently
being widely used by large investment institutions worldwide: The Alternative Data Sets. Concretely,
the focus is put on the uses of consumption data and 10-K filings as valuable sources of information
to support investment decisions. Overall, results show that, despite data science and algorithm-based
tools are essential to process and understand underlying business information, these techniques are not
by themselves sufficient to develop a consistent investment strategy but, instead, can be employed as
very useful systems to boost the understanding of the business that underlays every stock in the market.
5
Table of Contents
1. Introduction. ................................................................................................................. 8
PART I: THEORETICAL FOUNDATIONS.
2. Fundamentals of Data Science. ..................................................................................... 11
2.1. Data Typology and Data Structures. ................................................................................. 12
2.2. Algorithms and Machine Learning. .................................................................................. 14
3. Current Trends in the Asset Management Industry. ..................................................... 15
3.1. The Unconventional Data Sets in Asset Management......................................................... 16
3.2. Unconventional Data Sets: State of the Art and Future Trends. ........................................... 17
3.3. Alternative Data Sets Pioneers: The Hedge Funds Industry................................................. 19
PART II: PRACTICAL APPLICATIONS
4. Study Case 1: Corporate Sales Data and Consumption Data. ........................................ 22
4.1. Closely Inspecting Underlying Business Data: Airbnb, Inc. ................................................ 26
4.2. Case Study Conclusions. ................................................................................................ 29
5. Study Case 2: The Open Web - Textual Analysis and Web Scrapping. ........................... 31
5.1. Handling with Open Web Text. ....................................................................................... 32
5.2. Processing Text: The TF-IDF Numerical Statistic. ............................................................ 34
5.3. Applications of Cosine Similarity and TF-IDF on 10-K (Annual Earnings Reports). ............. 35
5.4. Analysis through Python: United Continental Holdings, Inc. .............................................. 38
5.5. Case Study Conclusions. ................................................................................................ 47
6. Case Study 3: Sentiment Analysis Through Textual Analytics. ...................................... 51
6.1. The Sentiment List of Words. ......................................................................................... 52
6.2. Exploring a Default: The Hertz Corporation Company Case. .............................................. 53
6.3. Case Study Conclusions. ................................................................................................ 60
7. Conclusions. ................................................................................................................ 61
References. ............................................................................................................................... 62
Appendix: Code. ....................................................................................................................... 64
6
List of Figures
Figure 1. Structured Vs Unstructured Data. Source: Igneous, Inc. ................................................................................ 13
Figure 2. Alternative Data Sets adoption in Financial Institutions. Source: Deloitte Center for Financial Services. .... 17
Figure 3. Correlation Matrix between Inside Airbnb data and public statics about the real estate market in Barcelona
during 2018. .................................................................................................................................................................... 27
Figure 4. Interactive map comparing ordinary average rent vs Airbnb average rent by neighbourhood. ...................... 28
Figure 5. Cosine Similarity between two Documents A and B. ..................................................................................... 35
Figure 6. Installing Edgar Package and querying a company’s financial forms. ........................................................... 38
Figure 7. Function to extract multiple 10-K Forms. ....................................................................................................... 39
Figure 8. Function to extract only the risk section of a multiple 10-K Forms. .............................................................. 39
Figure 9. Building the words array from multiple 10-K Forms. .................................................................................... 40
Figure 10. Image partially depicting the resulting array of assessing multiple 10-K Forms. ......................................... 40
Figure 11. Vectors distances for each of the years assessed. ......................................................................................... 41
Figure 12. Application of TF and IDF to words count array. ......................................................................................... 41
Figure 13. Determining TF-IDF for each of the pair word-document and calculating Cosine Similarity for each of the
years assessed. ................................................................................................................................................................. 42
Figure 14. Cosine Similarity comparison for each of 10-K analysed. ........................................................................... 43
Figure 15. Cosine Similarity comparison for each of 10-K analysed. ........................................................................... 44
Figure 16. Most impactful words during latest year 10-K according to TF-IDF (10-K released in 2020) .................... 44
Figure 17. Most impactful words during 10-K released in 2019 according to TF-IDF. ................................................ 45
Figure 18. Count of most impactful words during latest year according to TF-IDF (10-K released in 2020). .............. 46
Figure 19. Repeated words unclassified as relevant by TF-IDF. ................................................................................... 46
Figure 20. United Continental Holding, Inc stock performance and Cosine Similarity during the last 7 years. ........... 48
Figure 21. United Continental Holding, Inc stock performance during EDGAR 10-K release. .................................... 49
Figure 22. Determining Cosine Similarity for each of the 10-K assessed. .................................................................... 53
Figure 23. Hertz Global Holdings, Inc stock performance and Cosine Similarity during the last 9 years. .................... 54
Figure 24. Loughran and McDonald List of Words importation and comparison. ........................................................ 55
Figure 25. Positive words frequency of 9 years of 10-K reports in The Hertz Corporation. ......................................... 55
Figure 26. Evolution of positive words of 10-K reports in The Hertz Corporation. ...................................................... 56
Figure 27. Evolution of negative words of 10-K reports in The Hertz Corporation. ..................................................... 56
Figure 28. Graphical representation of the 10-K Sentiment Analysis obtained through Python. The Hertz Corporation
Vs Avis Budget Group, Inc. ............................................................................................................................................ 57
Figure 29. 10-K Sentiment Analysis obtained through Python. Positive Sentiment: The Hertz Corporation Vs Avis
Budget Group, Inc. .......................................................................................................................................................... 58
Figure 30. Most impactful words during latest year 10-K according to TF-IDF (10-K released in 2020). ................... 59
7
List of Tables Table 1. Alternative Data Set per Category in different Asset Management firms. .................................. 19
Table 2. Regression Results: Quarterly Growth in Revenue Announced by Companies on Quarterly
Growth in RTCS. ....................................................................................................................................... 23
Table 3. WQS Quintile classification and Revenues Announcement. ...................................................... 23
Table 4. Company stock price and stock returns prior earnings announcement. ...................................... 25
Table 5. Resulting array from several vectors containing words from different documents. ................... 33
8
1. Introduction.
According to Murray Rothbard in his book Making Economic Sense1, when Ludwing Von Misses
was asked to give a definition of Stock Market he set that “A stock market is crucial to the existence
of capitalism and private property. For it means that there is a functioning market in the exchange
of private titles to the means of production. There can be no genuine private ownership of capital
without a stock market: there can be no true socialism if such a market is allowed to exist.” Since
the first French Courretiers in the 12-th century, passing through the first Dutch pioneers that
introduced innovative techniques to take advantage of the information to trade stocks of the widely
known Dutch West India Company, all the agents in the market have been trying to use information
as a tool to outperform in the Stocks Market. Today is not different.
The technological advances and the explosion of massive data during the past years has led to an
unprecedent volume of information available to everyone. The Big Data paradigm is changing the
way in which investors use the mix technology-information as a tool to find alpha. Despite its
newness and the little professionals that really know how to take advantage of this infinite universe
of possibilities, there are some banks and investment funds already taking advantage of this new
paradigm. In this regard, the hedge fund industry was the first on incorporating Big Data in its
analysis, thus having a huge advantage over its counterparts.
The use of big data tools in business is a reality that it is revolutionizing how information is used
in business decision making. During the last years, Data Science has become a discipline with
paramount importance across many industries, connecting the big data paradigm with its
implications in the real world, analysing how big data can enhance companies to save costs, to
better understand their role in the market and to enhance their daily operations. The financial and
banking industry is no stranger to this phenomenon, so it is important to analyse to what extent the
application of data analytics tools is disrupting these industries. The entire asset management
industry is neither estranger nor sufficiently aware of the impact that could have the expansion of
big data processing tools across the entire industry, however, the deployment of any effective Data
Science projects require high level of investments in human resources and technological tools, this
is why it's paramount important to elucidate to what extend the big data tools can enhance the
portfolio performance of asset management firms.
1 Rothbard, Murray: Making Economic Sense, 2nd edition. (Ludwig von Mises Institute, 2006, ISBN 9781610165907), p.
426
9
Given the wide variety of data sources, data science techniques and algorithms that may eventually
be applied in the asset management industry, it’s important to clarify that this Thesis will
emphasize in one data category that, for its potential to transform the entire asset management
industry during the coming years, deserves to be the central point in which this master’s thesis is
based upon: The Alternative Data Sets. This said, the main objective of this study is to present
through a theoretical and practical approach the uses and utilities of some Data Science and
Machine Learning techniques as a mechanism to leverage in Alternative Data Sets in the asset
management industry. There is a rich literature about the numerous researches done during the last
years on this matter, providing scientific evidence about the extent to which an asset manager can
use these set of tools as a complement of the traditional financial analysis. This Master’s Thesis
will use some of this literature as a baseline to carry out their own study cases, analysing the level
to which a portfolio performance can be improved by using information which, due to its size, its
data source or its data structure, can be considered as Big Data. With this objective as the main
focus of this Thesis, throughout all its content, it is going to be detailed the different techniques
and algorithms that can be used by an asset manager as an additional mechanism to interpret
financial and non-financial information regarding the stocks in which he/she might be investing.
The only way to really know the level of efficiency of Data Science tools as a mechanism to
transform big data in valuable information, is analysing the results of a practical project in which
any stakeholder can evaluate the complexity-efficacy ratio of the new tools that came along with
this new paradigm and, in consequence, decide whether or not these tools could be used in their
investment activity as it is being used in big investment firms worldwide.
To accomplish the described objectives, this master’s Thesis will use a practical approach in which
will be depicted the different techniques of data science / machine learning that can be used on
Alternative Data Sets in the asset management industry. Given the wide nature of the
aforementioned Alternative Data Sets, each of the techniques that will be described throughout this
thesis will be developed alongside a practical project that will be available online for consultation.
This said, it is important to clarify that the different nature of each of the projects makes relevant
to set a uniform methodology in which each of the practical projects must be developed. The
methodology to be carried out along each project is the following:
- Description of the existent literature about the techniques to be deployed in the project,
analysing how these techniques may help asset management industry in their day-to-day job.
10
- Description of the data set in which these techniques will be applied.
- Description of the algorithms / techniques used during the project.
- Conclusions about the results accomplished by the project and the future developments for the
techniques used along the project.
In few words, what is going to be intended to demonstrate through the use of several Data Analysis
projects, is whether or not asset management industry can eventually leverage in some Big Data
tools and Algorithms that, along with the traditional asset management techniques, could
eventually enhance stock analysis. An accurate analysis of the fundamentals of shares of stock,
along with the tools that will be exposed in this Thesis can lead to continuously outperform the
benchmark index in the long run, allowing asset management professionals and qualified investors
to explore much more ways in which they can take advantage of the recent explosion of massive
data, as it is currently happening in big financial institutions. Plus, given the recent industry turn
towards a most technologically sophisticated financial professions, this Master Thesis aims to
clearly illustrate how cutting-edge technologies are increasingly impacting an industry
characterized by general low/negative returns during the last years and, that increasingly requires
more professionals capable of integrating into multifunctional teams where Data, Tech and Finance
will have to coexist in the future to come.
To recap, the objectives pursued in this Master’s Thesis can be summarised in the following 3:
1. Describe how a traditional financial analysis can be complemented with the use of data
science techniques over alternative data sets.
2. Provide scientific evidence about how some of these techniques have been proved to be very
efficient in the investment industry.
3. Demonstrate how some of these techniques can be used (and are currently being used) by
asset managers or professional investors to leverage in alternative data sets as a mechanism
of portfolio performance.
“Big data is about seeing and understanding relationships within and between different pieces of
information that, until very recently, we were striving to fully capture”2.
2 Mayer-Schönberger, Viktor & Cukier, Kenneth: Big Data: A Revolution That Will Transform How We Live, Work and
Think, 1st edition. (Houghton Mifflin Harcourt, 2013, ISBN 9788415832102), p. 33
11
PART I: THEORETICAL FOUNDATIONS.
2. Fundamentals of Data Science.
Data Science can be defined as a multi-disciplinary field that merge processes derived from
computer science, machine learning, mathematics, and statistics, along with the domain of any
specific field, to extract information of massive data. In other words, Data Science can be defined
as the necessity of gathering knowledge of multiple scientific and non-scientific disciplines to
provide a response to the recent explosion of massive data, which has led to the emergence of data
sets previously unavailable. In fact, the possibility of using all available data to solve a given
problem, is the true core of this entire revolution. As stated by professors Mayer-Schönberger and
Kenneth Cukier: “The use of all the available data is feasible in more and more contexts but
implies a cost. Increasing the quantity opens the door to inaccuracy. Of course, wrong figures and
corrupted snippets have always been slipped into data sets, but the key was to treat them as
problems and try to get rid of them, in part because we could. What we never wanted was to
consider them inevitable and learn to live with them. This is one of the fundamental changes of
moving from scarce data to big data”3.
Noted the above, the different and varied nature of the data in terms of size, typology, and structure,
causes that all these data sets cannot be treated with conventional data management tools. This last
aspect about the nature of data is what makes absolutely needful the existence of the figure of data
scientists in this equation. On the investment industry side, during the last years a lot of asset
managers has begun to leverage on advanced analytics as an effort to generate alpha for their
investors, what has led to the creation of cross functional teams in a very traditional business like
the asset management industry. According to McKinsey & Company, the asset management
industry is expected to increase its investment in advanced data analytics during the coming years
not only due to the high competence in the industry, but also as an attempt to better optimize the
industry resources: offsetting high middles and back office costs (10% - 30% potential cost
reduction), increasing its income (5% - 30% higher revenues) and implementing new sources of
alpha through debiased investment decisions, automated big data ingestion for research, improved
trade execution algorithms and, of course, the use of alternative data sets4.
3 Mayer-Schönberger, Viktor & Cukier, Kenneth: Big Data: A Revolution That Will Transform How We Live, Work and
Think, 1st edition. (Houghton Mifflin Harcourt, 2013, ISBN 9788415832102), p. 49 4 Doshi, Sudeep – Kwek, Ju-Hon & Lai, Josep: Advanced Analytics in Asset Management: Beyond the Buzz. (McKinsey
& Company – Financial Services, 2019), p. 3
12
2.1. Data Typology and Data Structures.
When it comes to data typology in the field of data science, the most important distinction must
be made between the known as structured data and unstructured data. Both data types differ not
only in their origin, but also in the query language that can be used for the data extraction during
a data science project. The typology of a data set determines how data will be collected, pre-
processed, modelled, analysed and even, presented during a data science project.
Structured data are the most used and known data types across many industries. This kind of data
is highly organized, and its structure can be easily understood insofar the data can be extracted in
the form of spreadsheets (as the data is contained in relational databases). Examples of structured
data in the industry of financial services could be a data base containing data from a bank’s
customers in which is detailed, in thousands of entries, the customers’ personal details, their net
worth, the value of their assets and liabilities, the average cash on the client’s bank accounts, the
number of products contracted with the bank, etc. However, for the purpose of this work, the main
data type to be used is the unstructured data. Until very recently, this data typology was usually
neglected by companies across many industries, mainly due to organizations were used to work
with stack and static data. However, during the last years, the explosion of data from sources like
social networks, clickstreams, satellite imagery, web advertising and mobile devices, has led to
the beginning of a new sub-age. According to several notable specialists in big data, although
structured data accounts for quantitative facts, the more interesting and potentially more valuable
expert opinions and conclusions are often hidden in unstructured data formats, in fact, it is
estimated that around 85% of all data exists in unstructured formats (i.e. emails, contracts, memos,
legal briefs, social media feeds, etc.)5. Unstructured data is expected to account for 90% of all data
liable to be considered as Big Data, however, during the last years these sort of data has not been
considered to be modelled due to its randomness and the difficulty to analyse it.
It is wide know that the volume of data generated is increasing at a very high speed, in fact,
statistics for unstructured data show a growth rate between 25% and 40% annually, which means
that unstructured data available for organizations will double every 24 – 40 months. Most of the
companies will not be prepared to take advantage of such huge amount of data available.
5 De Boe, Benjamin: Use Cases for Unstructured Data. (InterSystems White Paper, InterSystems Corporation), p. 2
13
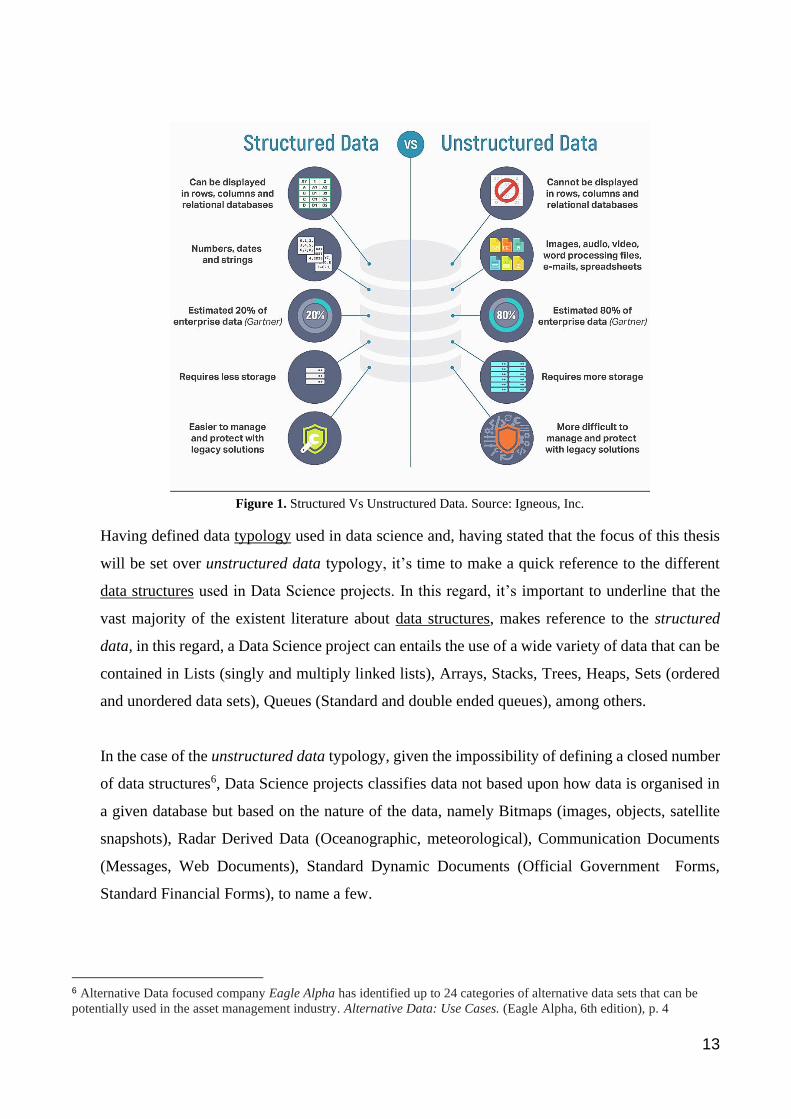
Figure 1. Structured Vs Unstructured Data. Source: Igneous, Inc.
Having defined data typology used in data science and, having stated that the focus of this thesis
will be set over unstructured data typology, it’s time to make a quick reference to the different
data structures used in Data Science projects. In this regard, it’s important to underline that the
vast majority of the existent literature about data structures, makes reference to the structured
data, in this regard, a Data Science project can entails the use of a wide variety of data that can be
contained in Lists (singly and multiply linked lists), Arrays, Stacks, Trees, Heaps, Sets (ordered
and unordered data sets), Queues (Standard and double ended queues), among others.
In the case of the unstructured data typology, given the impossibility of defining a closed number
of data structures6, Data Science projects classifies data not based upon how data is organised in
a given database but based on the nature of the data, namely Bitmaps (images, objects, satellite
snapshots), Radar Derived Data (Oceanographic, meteorological), Communication Documents
(Messages, Web Documents), Standard Dynamic Documents (Official Government Forms,
Standard Financial Forms), to name a few.
6 Alternative Data focused company Eagle Alpha has identified up to 24 categories of alternative data sets that can be
potentially used in the asset management industry. Alternative Data: Use Cases. (Eagle Alpha, 6th edition), p. 4
14
2.2. Algorithms and Machine Learning.
The Big Data paradigm and its impact in Finance cannot be understood without comprehending
what Algorithms are. Algorithms can be defined as a finite sequence of instructions, each of which
has a clear meaning and can be performed with a finite amount of effort in a finite length of time7.
In Data Science terms, algorithms are intrinsically related to Machine Learning insofar Data
Scientist use Machine Learning based models in order analyse large data sets, find answers to
complex questions, and make predictions. In this sense, while an algorithm is defined as a process
that uses a piece of information as an input in order to carry out a sequence of processes previously
defined by humans, Machine Learning entails the self-adjustment of the algorithm through a trial
an error process whose result is an output which quality can be measured by data scientists.
As indicated by its very definition, Machine Learning entails a process in which an algorithm or
groups of algorithms can be trained in order to substantially increase its performance as more
information comes along. Until quite recently, the state of technological development impeded
data scientists of using Machine Learning techniques to develop models over unstructured data
sets, however, a burgeoning industry around the unstructured data has emerged during last years
and, today some companies are taking advantage of GPS locations to track potential customers
movements around retail stores, other track the performance of big malls analysing their available
parking slots during hundreds of days through satellite images and, even the most avid investment
companies are using Natural Language Processing (NLP) algorithms to read Quarterly/Annual
conference calls as an attempt to predict profit warnings in real time. Textual analysis is not only
one of the most promising disciplines in Data Science, but also one of the most popular areas in
the field of sentiment analysis in finance. In fact, during the last years many investment companies
have started to intensively use algorithms like Neural Network, Support Vector Machine and
Naïve Bayes to develop models that assist them through the abstruse path of discerning what the
market sentiment is.
Machine Learning techniques will allow asset managers to handle an inconceivable amount of
data in the near future, providing them with a dynamic understanding of the companies in which
they are invested. The following pages will describe this new innovative sound alliances with the
algorithm.
7 Escardó, Martín: Lectures Notes for Data Structures and Algorithms. (University of Birmingham, Shool of Computer
Science, 2019), p. 5
15
3. Current Trends in the Asset Management Industry.
During recent years, big asset management firms have started to intensively invest in new ways to
use and exploit the massive data placed not only in their databases, but also in third party companies
specialised in providing asset managers and hedge fund managers with verified and back-tested
datasets ready to be integrated in their own investment analysis. Big Data paradigm is impacting
front, middle and back office structures of asset management firms. Middle and back offices from
most major asset management firms have increased automated processes, increasing administrative
efficiency and, thereby, decreasing fixed cost for data management. The algorithm-based
behavioural segmentation of clients is not only enhancing better method to offer clients new
investment products but also is making client retention and prospection within the firm a data-
driven process.
In the investment decision side, managers from big asset management firms have started to see the
rewards of implementing new data driven strategies that help them to generate alpha for their
clients, making possible new ways to gauge market risks, develop new investment strategies and
back-test their own already established strategies. New machine learning methods are also started
to be used across financial analyst teams, helping them to digest hundreds of financial reports and
earnings calls that traditionally have been processed one by one. The recent data explosion has led
to the creation of cross functional asset management teams in which, although the final investment
decision in usually taken by the asset manager, the decision-making process is strongly influenced
by Data Science teams in charge of delivering inputs to the process.
Companies like BlackRock8 have been using this investment approach for more than a decade with
apparently fruitful results. More than a decade experience using data science techniques has led to
BlackRock to become a cutting hedge asset management firm which has been even able to develop
its own sophisticated machine learning methods. As an example, cross functional BlackRock teams
use a machine-learning based method that has been taught to detect the relationship between stock
returns and, on the one hand, a wide array of quantitative data extracted from their internal
databases, and on the other hand, accounting information and analyst forecasts. During years,
BlackRock Systematic Active Equity investment cross functional team has worked to better train
the algorithms behind this technique, which represents the tip of the huge iceberg behind machine
learning techniques used by big asset management firms in the market.
8 https://www.blackrock.com/uk/intermediaries/insights/big-data-in-asset-management,
16
3.1. The Unconventional Data Sets in Asset Management.
In 2017, The Deloitte Center for Financial Services, an organism formed by professionals from a
wide array of industries, backgrounds and with demonstrated experience in cutting-edge
technologies, published a paper in which announced that “Alternative data will likely transform
active investment management over the next five years, from hedge-fund management, to long-only
mutual funds, and even private equity managers9”. In the same report this agency, whose main
goal is to support several areas of financial organizations through insight and research, predicted
that “Those firms that do not update their investment processes within that time frame could face
strategic risks, and might very well be outmanoeuvred by competitors that effectively incorporate
alternative data into their securities valuation and trading signal processes”.
The explosion of massive data during the last years along with the evolution of data manipulation
tools that allow an user friendly way to structure, order, analyse, and interpret data, have made
available the use of new sources of information in the stocks portfolio management processes.
Today, is feasible that even a small asset management boutique could be using new feeds, social
media information, consumption data and metadata, satellite imagery and textual analysis for
financial applications. The explosion of all this information has led to the emergence of new
financial-related institutions whose main activity is to transform all these unstructured data sources
in structured information that is used by small, mid and large financial institutions in their decision-
making processes.
There is a vast number of sources and a wide variety of information that can be used to fuel
innovative ways that helps to better understand the performance of a company or group of
companies that are behind traded shares in the stock market but, in order to extract real value of all
that information, it is first needed that professionals of the financial sector are aware of the limits
of technology and the necessity of developing data analytic skills that allow them to understand,
in general terms, how algorithms work, how a data analytics project should be correctly deployed
and implemented. Only in this way, asset management professionals could potentially know how
to better leverage on this cutting-edge trend, being able to discern between useful and useless data
sources, data structures and algorithms, being also able to pick the better mix between traditional
investment management and big data leveraged investment management according to different
factors like: its own asset management strategy, its own asset allocation methods and the mandate
given by the investors.
9 https://www2.deloitte.com/content/dam/Deloitte/us/Documents/financial-services/us-fsi-dcfs-alternative-data-for-
investment-decisions.pdf
17
3.2. Unconventional Data Sets: State of the Art and Future Trends.
The explosion of the massive data during the past decade has led to Big Data to become a revolution
that is moving at a very fast speed that it is difficult to foretell what would be the implications during
the coming years. Less than 7 years ago, Viktor Mayer-Schönberger and Kenneth Cukier, two of
the more renowned experts in this area foretold what would be one of the main changes that would
eventually cause the emergence of more sophisticated tools to develop Big Data projects, in this
regard they said that “The use of all data available is now feasible in many contexts but it implies a
clear cost. The increasing quantity of data opens the door to inaccuracy. Thereby, there have
always been wrong figures and corrupted fragments in data sets, the key was always treating them
as problems and try to get rid of them. But we never wanted to consider them as inevitable and
learn how to live with them. This is one of the main changes from the scarce data to big data.10”
What they meant with this new possibilities of dealing with potentially wrong data, is that Big Data
would eventually allow the emergence of many ways to implement data-driven projects across
multiple industries, changing the way we live and think. Since them, Financials Services industry
has been one of the main agents in developing innovative methods to implement all these new
possibilities. However, it is important to be aware of the degree of maturity of the industry regarding
the use of alternative data sets to take better and more informed data-driven investment decisions.
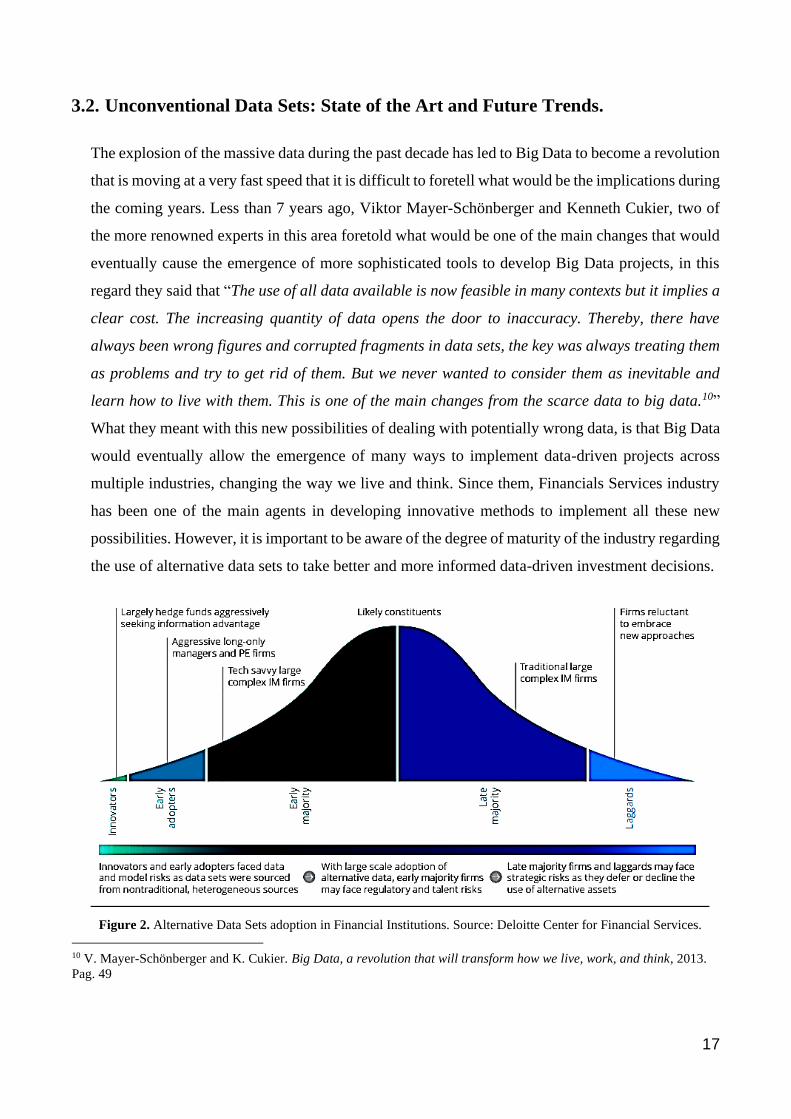
Figure 2. Alternative Data Sets adoption in Financial Institutions. Source: Deloitte Center for Financial Services.
10 V. Mayer-Schönberger and K. Cukier. Big Data, a revolution that will transform how we live, work, and think, 2013.
Pag. 49
18
According to the degree of adoption of alternative data sets forecasted by Deloitte in 2017, the
hedge funds have always been in the forefront of alternative data innovation. The first token of this
fact dates back to 2008, when an investment fund called MarketPsy Long-Short Fund LP began to
use social-media sentiment data into its investment decisions despite of the low degree of
development of social networks at that moment and the low expansion of smartphone technologies
in across all countries. Couple of years later, in 2010, when the traffic in social media networks
skyrocketed, in part boosted by faster and cheaper smartphones, some quantitative hedge funds and
big banks started to try to seek alpha based on these new data sources and information.
Since these innovators stage that started in 2008 – 2012, there has been a lot of skepticism about
the use of these alternative data sets as a reliable source of information to enhance asset managers
decisions-taking processes. Currently, the investment management industry is in the second stage
of technology adoption, the early adopters stage, which characterizes by the emergence of a vast
amount of information providers that offer all kind of unconventional data to investment
management funds, hedge fund and big financial institutions, mainly tailor made and ad-hoc reports
that helps to develop new asset management strategies and keep the competitivity of all these actors
in the market.
Those institutions that adopted Big Data Sources at the first stage described in the last paragraph,
the innovators stage, are playing with a big advantage over the new adopters, they have got in-
house development of their own tools and talent, being able to deploy their own tools along any
data analytics project: data compile, data cleansing, data modelling and, data analysis process. Asset
Managers in companies like BlackRock, are currently using a wide variety of data sources to
enhance the way in which they asses their investment decisions, leveraging not only in traditional
data like company filings to asses a company performance, but also using data GPS satellite imagery
to analyse where and how consumers of a given brand move, social media data to assess the
sentiment of consumers towards a brand and, employee satisfaction data as a proxy to a company
performance in a given quarter11. For being one of the main actors of the innovators stage,
BlackRock is one of the asset management companies best prepared for the change in the industry,
both from a technological and human talent perspective.
11 https://www.blackrock.com/corporate/literature/whitepaper/viewpoint-artificial-intelligence-machine-learning-asset-
management-october-2019.pdf
19
3.3. Alternative Data Sets Pioneers: The Hedge Funds Industry.
During recent years, demand for alternative data sets has sharply increased across many industries.
The increase in demand from financial firms for new data sets has led to a steeply increase in venture
capital invested in new firms whose business model is based on supplying this demand, in fact, in
2017 the amount invested in these new kind of Start-Ups accounted more than 1 billion US
Dollars12. As mentioned earlier when referenced to the BlackRock Systematic Active Equity team,
hedge funds are already intensively using alternative data sets in their investing analysis, in fact,
data published by Eagle Alpha, one of the most important consulting firm in this field, shows that
around 78% of US hedge funds use alternative data sets in their analysis and, in effect, surveys
carried out for this firm in partnership with Ernst & Young, confirms this increasing trend during
last years.
Early adopters of these new sort of data to feed their analysis are mainly large quantitative hedge
funds from firms like Bridgewater, Two Sigma, Citadel, WorldQuant or JPMorgan, to name some
few. This said, during recent years smaller investment firms, smaller hedge funds and traditional
fundamental asset managers firms are also started to integrate alternative data sets-based strategies
to enhance their quant strategies, better manage their risks, improve portfolio construction, and
support their discretionary investment decisions to generate alpha for their clients.
Alternative Data Set per Category13
Business Insights 15,8% Geo-Location 3,9% Consumer Credit 0,8%
Consumer Transactions 5,3% App Usage & Web Traffic 4,0% Reviews and Ratings 1,8%
Employment 3,8% Web Crawled Data 5,9% Pricing 7,7%
Event Detection 3,3% Advertising 2,1% Public Sector 3,2%
Trade 4,5% Sentiment 5,1% Expert Views 0,8%
B2B Datasets 3% Store Locations 1% Open Data 4,5%
Satellite and Weather 6,1% Internet of Things (IoT) 0,9% Social Media 5,2%
Data Aggregators 8,4% Online Search 1,2% ESG 1,8%
Table 1. Alternative Data Set per Category in different Asset Management firms.
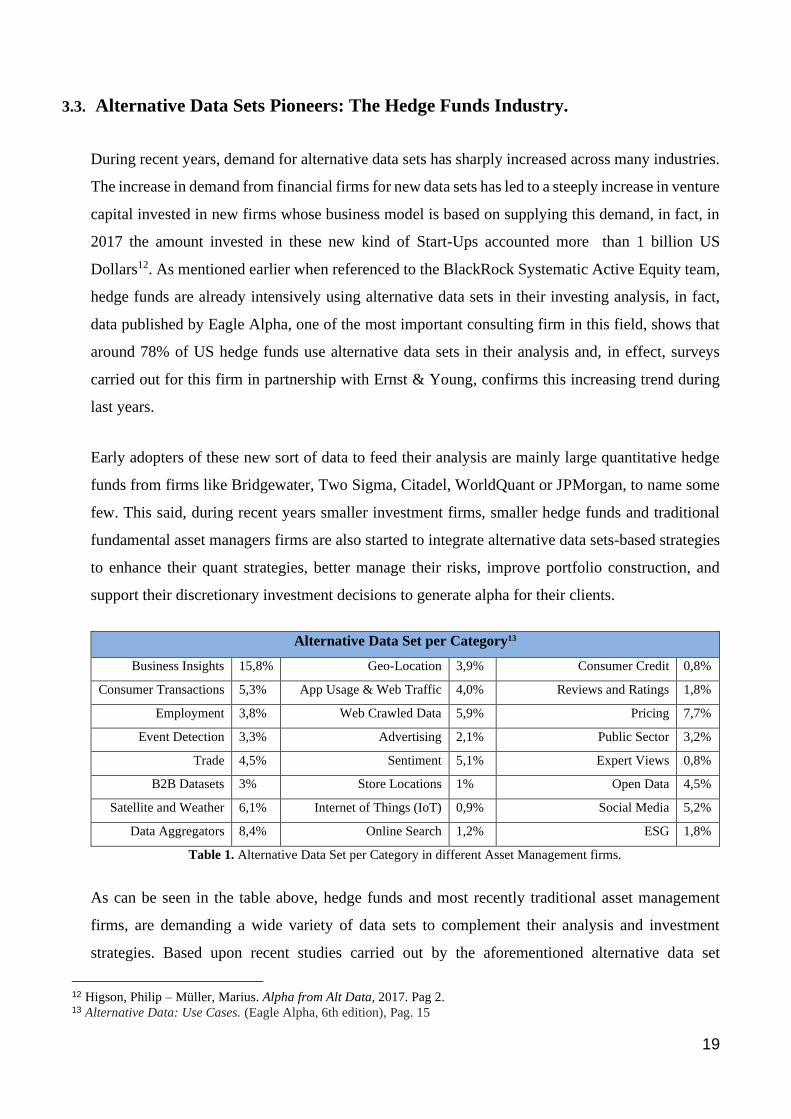
As can be seen in the table above, hedge funds and most recently traditional asset management
firms, are demanding a wide variety of data sets to complement their analysis and investment
strategies. Based upon recent studies carried out by the aforementioned alternative data set
12 Higson, Philip – Müller, Marius. Alpha from Alt Data, 2017. Pag 2. 13 Alternative Data: Use Cases. (Eagle Alpha, 6th edition), Pag. 15
20
specialized firm, Eagle Alpha, whilst both traditional asset management firms and hedge funds use
alternative data sets to identify anomalies that might turn out in signals of risks and opportunities,
traditional asset management firms lead the use of alternative data sets to identify and understand
purchasing and pricing patterns at a microeconomic level and also, to understand the market
sentiment. By the other hand, hedge funds firms lead the use of this sort of data to both, set up
models to forecast micro and macroeconomic trends and for understanding consumer behaviour at
a macroeconomic level. The level of sophistication of hedge funds’ strategies has strongly driven
the development of data sets that were considered unthinkable some years ago. Recent trend
analysis has turned out with most sophisticated data sets demanded by hedge funds, among which
the following stand out:
- Corporate flight activity data sets to map future corporate transactions. U.S. regulation compels
all flights to be published, thereby, several alternative data set providers have gathered
frequency from more than 400.000 flights that links more than 40.000 direct relationship
among Russel 3000 companies, enabling investment firms to better detect new corporate
relationship, mergers, deals and acquisitions among companies from a given sector.
- Structured sentiment analysis data set that provides investment managers with signals for
investment in bonds, currencies, equities, and commodities based upon the combination of
social network analysis and economic press, enabling these investment managers with
additional inputs to either confirm of refute their own vison about the future performance of a
given financial asset.
- Labour force analysis based upon IRS and U.S. Department of labour filings data set that
collects cash contributions, benefits, salary growth and company labour return on investment
for more than 4.000 U.S. public traded companies that account for around 95% of the U.S.
employment, which enables investment firms with the possibility of spotting inflation in
salaries in a given sector or shortfall of skilled workforce for a given economic segment.
- Ready to use credit score for companies from different sectors data set, that aggregates multi
source data to provide investment managers with equities with high bankruptcy rates based
upon predefined criteria.
21
- Transactional data from retail companies that, once processed by third party provider or
through investment firm’s ad-hoc systems, makes possible to measure the level of economic
activity in a given company before quarterly sales reports are presented, which enables
investment firms to carry out investment or hedging strategies through the use of reliable real-
time microeconomic data.
- Employer careers website data set that provides the possibility to analyse workforce shortfalls
for more than 30.000 employers, analysing millions of opened job positions and using
automated systems to eliminates duplicated and expired job offers. This data set type has turned
out to be very effective to predict recent years inflation in sectors where STEM workforce is
overriding.
- Telecoms ID data set, that provides investment managers with data for more than 500 telecom
companies, including real time number of portability and number of devices under management
and, enabling investment managers with the possibility of portraying the user dynamics
regarding telecoms usage.
- Artificial intelligence-based data set that, through the use of authorized email data, provides
investment companies with real time trends in ecommerce and purchasing behaviour of
costumer from 600 companies, allowing investment managers to identify consumers real time
trends.
As can be seen, the use of alternative data set opens a wide world of possibilities not only for the early
adopter hedge fund industry, but also for the traditional asset management industry, for this reason,
the next sections of this master thesis aim to demonstrate how alternative datasets can be used by a
particular investor or an investment management institution to complement traditional financial
analysis and eventually, to improve portfolio performance. To do so, the following case studies will
focus on techniques based on alternative dataset that, given the nature of the data set, could be easily
accessible and understandable. Since the intention of this work is not to explain in an extensive manner
all the existing techniques, the case studies that will be analysed, will focus in both the technicities of
each project and the potential of each of these projects as a supplement for the traditional financial
analysis.
22
PART II: PRACTICAL APPLICATIONS.
There have been several studies that have attempted to demonstrate the practical application of
unstructured data in the asset management industry. The following analysis constitutes the first of
the several cases that will be studied from a practical perspective, in order to elucidate the
effectiveness of alternative data sets in the Asset Management industry.
4. Study Case 1: Corporate Sales Data and Consumption Data.
The fundamental analysis of stocks has proved to be a useful predictor of stocks performance in the
long run. During 2016, an empirical study was carried out over the consumption data of more than
50 US retail companies, including real-time consumption data derived from 50 million mobile
devices14. These companies represented the 64% of revenue of top 100 US retailers (70% of top
100 retailers if online restaurants and services are excluded). The main goal of this study was
studying the relationship between two previously defined indexes and the performance of a stock
around the date of quarterly earnings announcements. The two ad-hoc indexes were named Within
Quarter Sales Activity Index and Post-quarter Activity Index, denoted by the acronyms WQS and
PQS, respectively. These indexes indicated the growth rates on the activity of each of the
companies’ clients, growing as some events related with clients’ intention to visit a specific brick
and mortar store were met. In this specific case, the consumer activity was collected in a unit of
measurement named Consumer Activity (CA). In other words, the indexes were built based upon
the activation of some client signals (extracted from client’s Android mobile devices) that indicated
their intention to purchase in one of the studied companies’ physical stores. The activity in mobile
devices, which contains billions of individual events, were collected by a third-party provider (Mkt
MediaStats, LLC) whose main activity is to provide other companies with ready to use data sets.
The data studied were collected on a quarterly basis between 2009 and 2014.
Given the seasonality factor present across almost all retailers, the Consumer Activity (CA) was
corrected to construct the Real-Time Corporate Sales Index (RTCS):
𝑅𝑇𝐶𝑆𝑖,𝑡 =𝐶𝐴𝑖,𝑡
14
∑ 𝐶𝐴𝑡−𝑗4𝑗=1
14 Froot, Kenneth – Kang, Namho – Ozik, Gideon – Sadka, Ronnie. What do Measures of real-time corporate sales tell
us about earnings surprises and post-announcement returns? (Harvard Business School, University of Connecticut,
EDHEC Business School, Carroll School of Management).
23
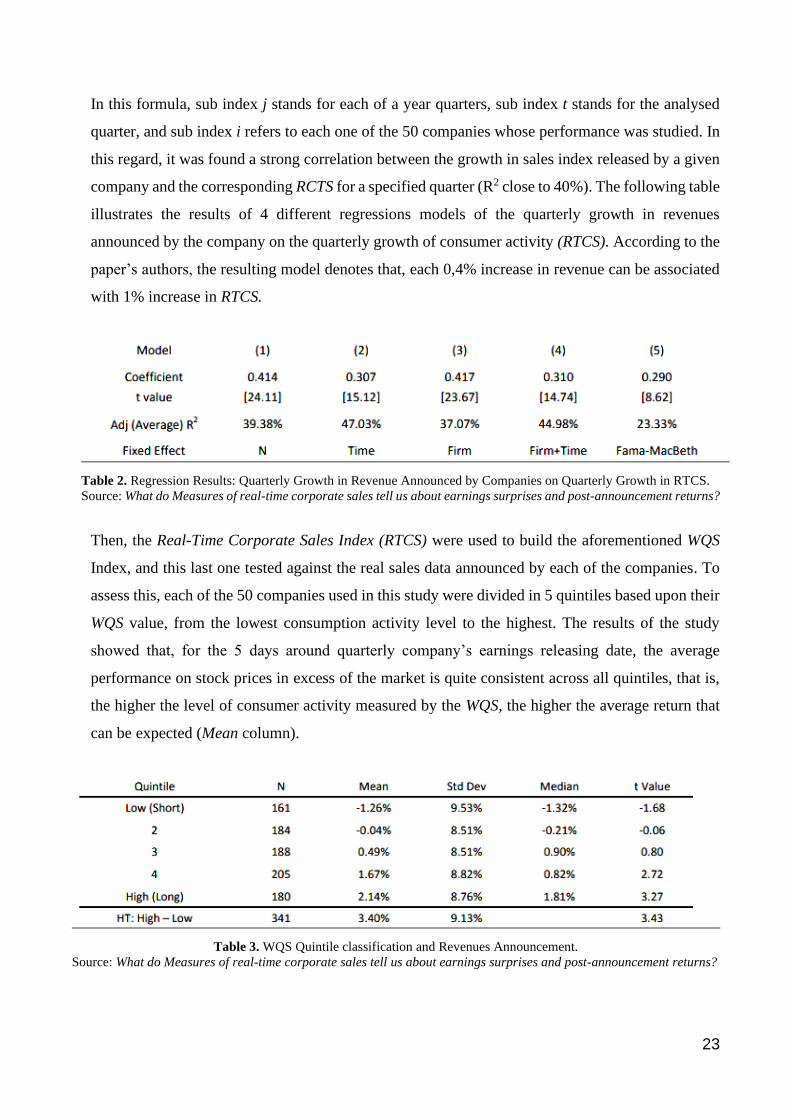
In this formula, sub index j stands for each of a year quarters, sub index t stands for the analysed
quarter, and sub index i refers to each one of the 50 companies whose performance was studied. In
this regard, it was found a strong correlation between the growth in sales index released by a given
company and the corresponding RCTS for a specified quarter (R2 close to 40%). The following table
illustrates the results of 4 different regressions models of the quarterly growth in revenues
announced by the company on the quarterly growth of consumer activity (RTCS). According to the
paper’s authors, the resulting model denotes that, each 0,4% increase in revenue can be associated
with 1% increase in RTCS.
Table 2. Regression Results: Quarterly Growth in Revenue Announced by Companies on Quarterly Growth in RTCS.
Source: What do Measures of real-time corporate sales tell us about earnings surprises and post-announcement returns?
Then, the Real-Time Corporate Sales Index (RTCS) were used to build the aforementioned WQS
Index, and this last one tested against the real sales data announced by each of the companies. To
assess this, each of the 50 companies used in this study were divided in 5 quintiles based upon their
WQS value, from the lowest consumption activity level to the highest. The results of the study
showed that, for the 5 days around quarterly company’s earnings releasing date, the average
performance on stock prices in excess of the market is quite consistent across all quintiles, that is,
the higher the level of consumer activity measured by the WQS, the higher the average return that
can be expected (Mean column).
Table 3. WQS Quintile classification and Revenues Announcement.
Source: What do Measures of real-time corporate sales tell us about earnings surprises and post-announcement returns?
24
At this point, one might wonder to what extent asset managers can use this study, carried out using
financial data between years 2009 and 2014, as a proxy to actively take investment decisions, after
all, the customers consumption habits have dramatically changed from 2009 until now. In this
regard, a complementary study was carried out in June 201915. Unlike the study already analysed,
this one uses a larger sample of 330 US companies, including not only activity related to physical
stores but also to online traffic (e-commerce). Plus, consumer interaction with brands was included
in this case. The sectors analysed comprised around 187 different consume related sectors and, the
financial data collected comes from a larger period of time (from 2009 to 2017). Thereby, the level
of consumers activity in this case was divided in 3 different categories: In-Store, Brand, and Web
based activity. The results in this new study reflected that, although the WQS of all of the three
mentioned categories proved to be highly associated with the Standardized Change in Revenue
(CSR) defined below, the results for consumer web activity indicated to be the most significant of
the proxies (with a correlation close to 60% with the CSR).
𝐶𝑆𝑅 =[(𝑆𝑖,𝑡 − 𝑆𝑖,𝑡−4 ) − 𝑟𝑖,𝑡 ]
𝜎𝑖,𝑡
In the formula above, Si,t and Si,t-4 stand for a company’s (i) revenue in quarter t and quarter t-4
respectively, and ri,t and Si,t stand for a company’s average revenue and standard deviation revenue
over the prior eight quarters respectively. With this data at our disposal and using the called Analyst
FE ratio detailed below, one can answer not only to what extent the information available online
can be already incorporated on current companies’ price on the stock market, but also infer an
answer to the aforementioned question, that is: To what extent Asset Managers can use the
information provided by companies like MediaStats as a proxy to gauge a companies’ quarterly
revenues?
𝐴𝑛𝑎𝑙𝑦𝑠𝑡 𝐹𝐸 = (𝐴𝑖,𝑞 − 𝐹𝑖,𝑞 )
𝑃𝑖,𝑞
In the formula above, Ai,q stands for the a company’s (i) earnings per share (EPS) announced in a
given quarter q, Fi,q stands for the average EPS forecasted by analysts respectively and, Pi,q stands
for the company’s price at the end of the analysed quarter.
15 Froot, Kenneth – Kang, Namho – Ozik, Gideon – Sadka, Ronnie. Predicting Performance Using Consumer Big Data.
(Harvard Business School, University of Connecticut, EDHEC Business School, Carroll School of Management).
25
The results of the regression of analyst FE on WQS for each of the 3 categories studied indicates
that indeed, WQS was a very good proxy to predict not only the quarterly increase in sales but also
the surprise in the stock price relative to the analyst forecast, which converts this empirical study as
an adequate instrument to endorse the use of this sort of alternative data as a valid complement that
helps asset managers on taking more informed investment decisions, supporting asset managers on
divestitures analysis and, facilitating portfolio rebalance assessments.
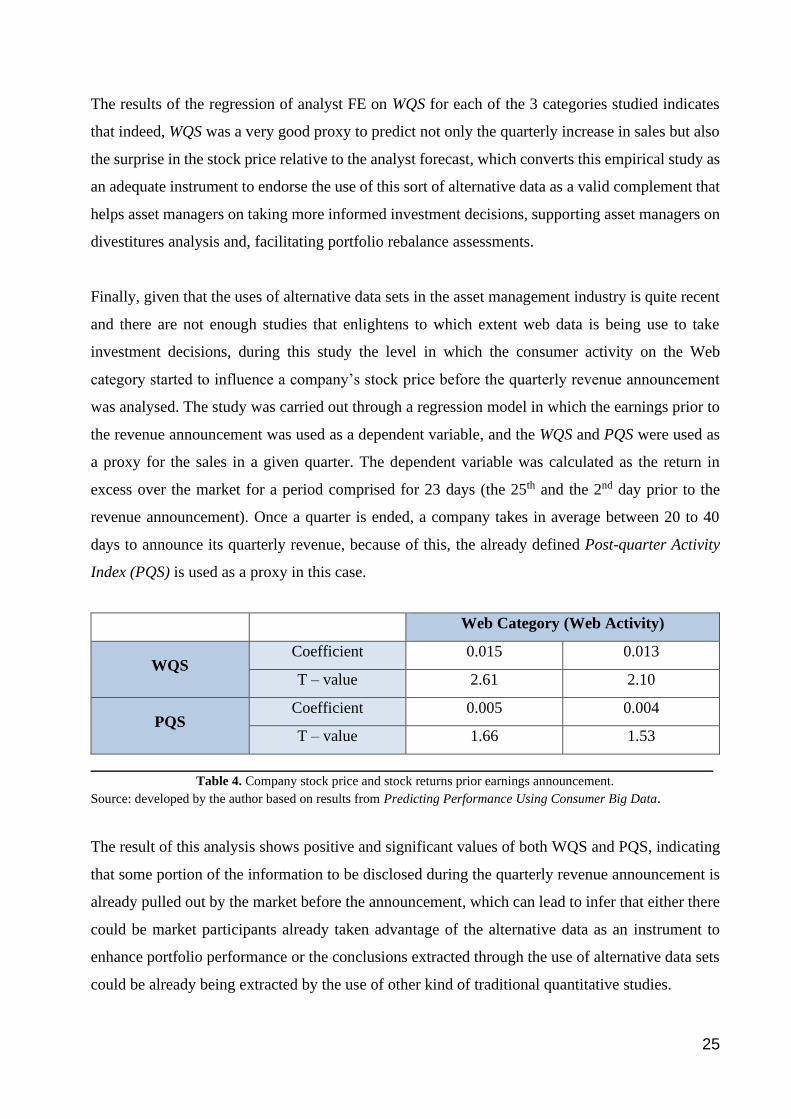
Finally, given that the uses of alternative data sets in the asset management industry is quite recent
and there are not enough studies that enlightens to which extent web data is being use to take
investment decisions, during this study the level in which the consumer activity on the Web
category started to influence a company’s stock price before the quarterly revenue announcement
was analysed. The study was carried out through a regression model in which the earnings prior to
the revenue announcement was used as a dependent variable, and the WQS and PQS were used as
a proxy for the sales in a given quarter. The dependent variable was calculated as the return in
excess over the market for a period comprised for 23 days (the 25th and the 2nd day prior to the
revenue announcement). Once a quarter is ended, a company takes in average between 20 to 40
days to announce its quarterly revenue, because of this, the already defined Post-quarter Activity
Index (PQS) is used as a proxy in this case.
Web Category (Web Activity)
WQS Coefficient 0.015 0.013
T – value 2.61 2.10
PQS Coefficient 0.005 0.004
T – value 1.66 1.53
______________________________________________________________________________ Table 4. Company stock price and stock returns prior earnings announcement.
Source: developed by the author based on results from Predicting Performance Using Consumer Big Data.
The result of this analysis shows positive and significant values of both WQS and PQS, indicating
that some portion of the information to be disclosed during the quarterly revenue announcement is
already pulled out by the market before the announcement, which can lead to infer that either there
could be market participants already taken advantage of the alternative data as an instrument to
enhance portfolio performance or the conclusions extracted through the use of alternative data sets
could be already being extracted by the use of other kind of traditional quantitative studies.
26
4.1. Closely Inspecting Underlying Business Data: Airbnb, Inc.
So far, the methods described during this first study case are based on the use of ad-hoc indexes to
illustrate how investment managers could potentially use alternative data sets to either forecast future
stocks performance, or complement their own traditional financial analysis. It is important to
underline that, the fact of using pre-processed data sets from specialized third-party provider (Mkt
MediaStats, in the cases analysed), might eventually restrict the possibility of investment firms to
develop their own crafted investment methods based on alternative data sets. The existence of big
public traded companies whose practically all sales come directly from the online channel, enables
investment firms to create their own investment analysis methodology. The case of the still privately
held Airbnb is a clear example of how alternative data sets would enable investment managers to
closely inspect a thriving company’s underlying business. Since Airbnb disrupted the tourism
industry back in 2008, the company has astonishingly grown to 150 million users in more than 70.000
cities worldwide. Although the company was planned to go public during the first semester of 2020,
recent turmoils in financial markets have led to postpone Airbnb IPO.
Since practically all company's revenue coming from online-based services are available to be
tracked through web scrapping techniques, qualified in data science investors could calculate the
company’s quarterly/annual turnover if an aggregation of the most representative cities where the
company operates were made, thereby, the traditional financial analysis of this company could be
potentially perfected through the use of these sort of alternative data sets once the company decides
to carry on with the already postponed IPO. In this specific case, third-party providers already exist,
an example of it is Inside Airbnb, a provider that combines multiple open source technologies (D3,
Crossfilter, dc.js, Leaflet, Bootstrap, Python, PostgreSQL and Google Fonts) to deliver users with a
cleaned, ready to use data set that contains all Airbnb listings from any city where the company
operates. Although these data sets are currently offered with a few days delay, it is technically
possible to get almost real time data from almost any city in the globe or analyse the impact of Airbnb
in the real estate market of any city. To better illustrate the potential uses of this sort of data set to
either analyse the performance of the company in a given quarter or to get some insights about the
real estate market of a given city, 35 data sets containing more than 600.000 registers for the city of
Barcelona (Spain) were taken from Inside Airbnb, then these registers were compared against public
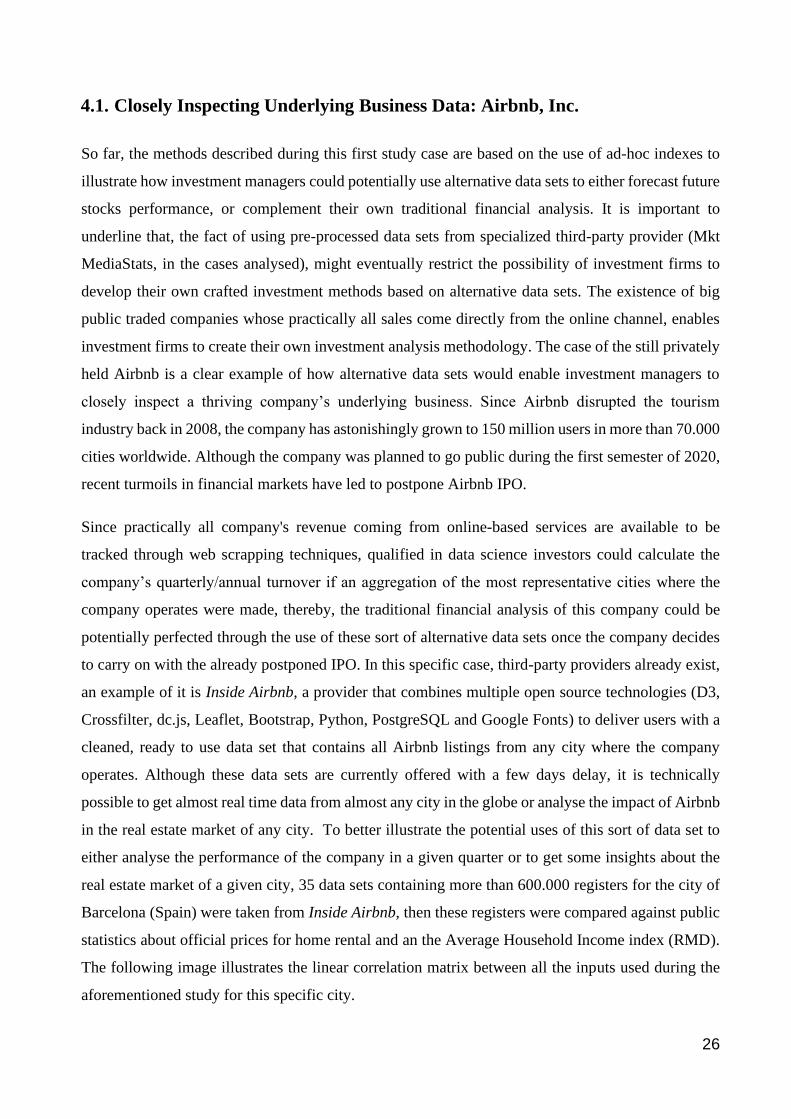
statistics about official prices for home rental and an the Average Household Income index (RMD).
The following image illustrates the linear correlation matrix between all the inputs used during the
aforementioned study for this specific city.
27
Figure 3. Correlation Matrix between Inside Airbnb data and public statics about the real
estate market in Barcelona during 2018.16
Currently, big asset management firms are already intensively using these sort of consumption data
that correlates prices, number of orders and money expense to generate investment strategies that turn
into alpha for their clients. An example of this is the widely known investment bank J.P.Morgan17,
which described how their Global Quantitative and Derivatives Strategy department was utilizing the
aggregated daily spend of around the 80% of all online purchases corresponding to around 5000
retailers to evaluate companies’ future performance based upon a very thorough and exhaustive
analysis developed over a SKU level (stock keeping unit). As described by the company, this analysis
allowed the Bank to develop a trading Long-Short strategy that generated annualised returns of 16.2%
and a Sharpe ratio of 1.13.
16 Ayala Gonzalez, Jonathan. Analysis of the state of the housing rental market in Barcelona. Blockchain as an
alternative to the bubble, 2019 (https://www.rpubs.com/jonathan817/508330)
17 Kolanovis, Marco PhD – Krishnamachari, Rajesh T, PhD. Big Data and AI Strategies, Machine Learning and
Alternative Data Approach to Investing. J.P.Morgan, 2017.
28
The use of consolidated data for Airbnb’s most representative cities along with their own traditional
analysis processes, might enable even smaller asset management firms to develop these kinds of
strategies to generate alpha for their clients. The fact that much of these data are open data, makes
possible that modest and small firms can potentially develop their own trading systems and enhance
their own traditional analysis strategies with alternative data sets without having to implement much
of their budget in such an objective, and aiming this way, a more balanced ratio between the budget
available in an investment company and the Alpha that this company is able to provide to their clients.
This said, it should be noted that companies’ underlying business analysis through Corporate Sales
and Consumption Data may not only help to comprehend the business in which a company operates,
but also to understand the dynamics behind the entire sector in which a company conducts its business,
the case of Airbnb is the paradigm of this. Airbnb data sets have been used multiple times by not only
investment institutions interested on potentially place an order during the Airbnb future IPO, but also
for public organizations that have been impacted by the era of soaring prices in the rental market in
the capital cities of the main developed countries. No evidence has been found about REITs (Real
Estate Investment Trusts) using Airbnb data sets as an instrument to better allocate their investments,
however, Business Intelligence tools allow any investment institution or asset management team to
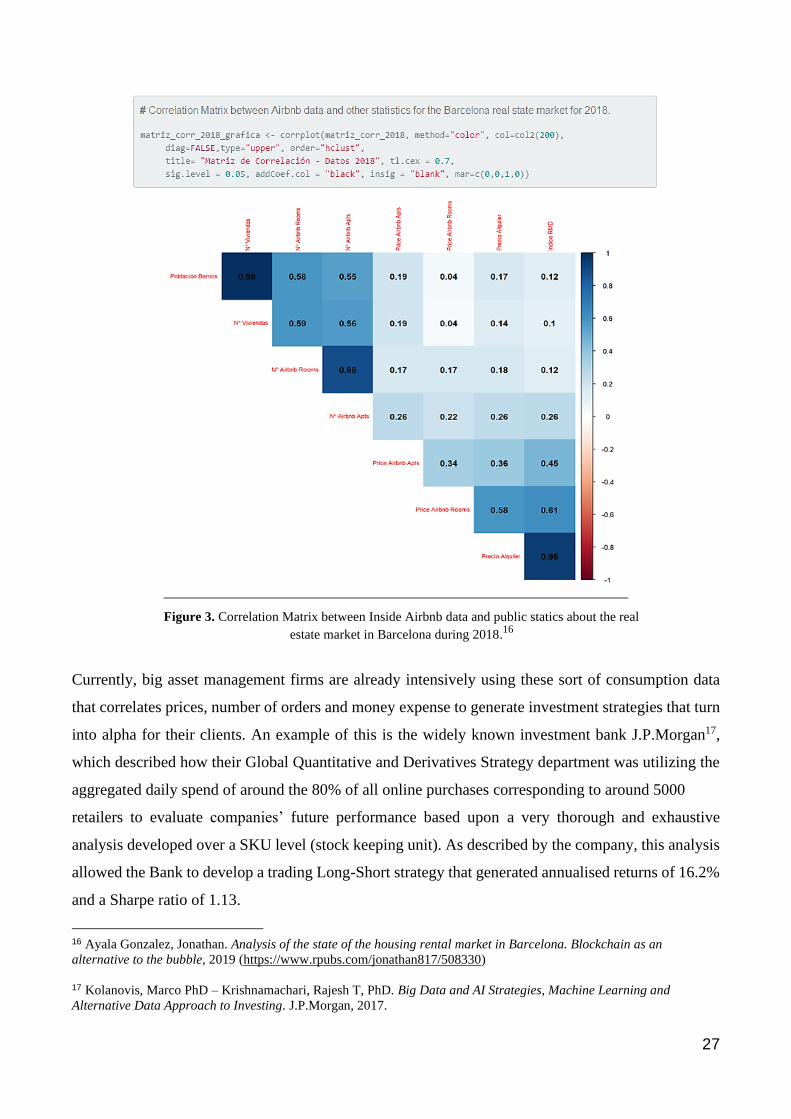
develop their own tools to comprehensively analyse the housing market of any relevant city. Figure 4
above depicts how an interactive map can be feed with relevant financial information.
Figure 4. Interactive map comparing ordinary average rent vs Airbnb average rent by neighbourhood.18
18 Ayala Gonzalez, Jonathan. Analysis of the state of the housing rental market in Barcelona. Blockchain as an
alternative to the bubble, 2019. (Permanent Link to Interactive Map).
29
4.2. Case Study Conclusions.
There is no doubt that having data on the turnover of a company is an important element that helps
to predict the evolution of a business in the long term, enabling investors to be able to measure
the potential net income, cash flow, and even to gauge the cost structure of almost any company.
This said, it is important to differentiate between the main two formats of corporate sales and
consumption data described during this first study case:
The first format refers to the two ad-hoc indexes described at the beginning of this bloc, this is,
the named Within Quarter Sales Activity Index and Post-quarter Activity Index, denoted by the
acronyms WQS and PQS respectively and used in this study as proxies to predict a company’s
stock performance in a given quarter. These indexes showed to be very useful to detect correlations
between the growth rates on the activity of each of the companies’ clients, and the eventual
subsequent change in the stock price of a given company. In this regard, despite these ad-hoc
indexes are supported by specialised research and back testing studies that someway prove a
certain degree of accuracy, these same research also denoted that the Consumer Web Activity
plays a very relevant role in the evolution of the indexes, thereby making these indexes difficult
to be used over companies whose on line sales do not suppose a high stake of the total revenue.
This said, one of the regression models carried out in the study proved that, when the earnings
prior to the revenue announcement were used as a dependent variable, and the WQS and PQS were
used as a proxy for the sales in a given quarter, a big part of the financial information that can be
extracted by these indexes is, at least partially, already being pulled-out by the market once a given
quarter is over (or even before), meaning that a small asset management firm or a private investor
could hardly take advantage of this format of consumption and corporate data, since large
investment institutions are already using similar indexes in their investment strategies. Given the
high level of liquidity and the high level of assets under control of big investment firms, it turns
out to be very disadvantageous for any small asset management firm to rely on ad-hoc indexes to
develop a competitive and sustainable investment strategy in the long run19.
However, what has been said so far does not mean that Corporate Sales and Consumption Data
are no valid alternative data sets to be used as an enhancing mechanism of portfolio performance,
19 https://www.bloomberg.com/news/articles/2020-06-25/quants-sound-warning-as-everyone-chases-same-alternative-
data
30
since the second format of Corporate Sales and Consumption Data described during this chapter
makes reference to the analysis of the underlying business data of public traded companies, a
promising source of financial data feasible of changing the way in which Corporate Sales and
Consumption data is being translated to take investment decisions. Unlike the predefined ad-hoc
indexes, open data allow even smaller particular investors to have access to the very specific detail
of the businesses being developed behind the stock listed in the market. If the proper data science
techniques are carried out over Corporate Sales and Consumption Data either provided by third
parties or self-web scrapped, a vast array a of investment hypothesis can be developed by any
professional asset manager.
The case of the not yet listed Airbnb is a clear example about the investment hypothesis mentioned
above. In this case, the half a million registers spread around different data sets corresponding to
the Airbnb announcements in Barcelona, that originally were used a proxy to understand why
rental prices were soaring in the city, can be also use to create a well-defined income of statement
about the home rental business of this company in a given quarter, enabling investors to
understand how the company is performing in a given region or during a given period of time.
This analysis can also be complemented by correlation studies over the different variables listed
on the data set, and supported by visual instruments that may even help to zoom in the underlying
business to understand on a lower level how a company is doing it in a given market’s segment
(luxury, low cost neighbourhoods, etc).
The level of flexibility of these sort of alternative data sets, the level of closeness with the
underlying business and the potential possibility of obtaining these typology of data in nearly real
time, makes this format of Corporate Sales and Consumption Data liable to be one of the most
impacting alternative data sets for the asset management industry in the mid-term.
31
5. Study Case 2: The Open Web - Textual Analysis and Web Scrapping.
The information and data explosion started some few years ago has led to an unprecedent number
of webpages in which an investor can rely on for financial analysis. Nowadays, any investor can
rely on several well-known finance specialized websites to access to updated financial information
in an orderly and structured manner. These specialised websites are focused strictly in financial
data, however there are much more data available on the open web that can have a significant
impact in how companies listed on stock markets might perform. These sorts of data are not being
gathered for almost any of these noted financial websites. As an example, U.S. Government
publishes every single contract that is related with the Department of Defence, the U.S. Census
usually publishes valuable statistical data that concerns products and services offered by many
companies and, the U.S. Treasury usually broadcasts many economic-related reports that involve
the core business of many companies.
Data Science and Machine Learning specialists have started to use data retrieved from the open
web as a mechanism to better measure risk and asses the economy’s ineradicable uncertainty, also
these sort of mechanisms are being used to gauge a company’s legal risk and support asset
managers to predict asset prices. As all unstructured data, textual analysis has some hurdles that
must be overcame before financial value can be extracted: misspelling, synonyms, punctuations,
abbreviations, industry-specific argot, and context are some of the few obstacle to bear in mind in
any data analytics project related with textual analysis. Data Mining is a burgeoning discipline
that studies patterns in data in order to find value that can lead to answer question in several fields,
finance is one of them. Unlike numeric data, text data necessitates vast preparation before pure
machine learning tools can be used. As commented on Fundamentals of Predictive Text Mining,
“Data-mining methods learn from samples of past experience. If we speak to specialists in
predictive data mining, their data will be in numerical form. These people are the ‘numbers guys.’
The ‘text miners’ do not expect an orderly series of numbers. They are happy to look at collections
of documents, where the contents are readable, and their meaning is obvious. This is our first
distinction between data and text mining: numbers versus text20”.
20 Weiss, Sholom M. – Zhang, Tong – Indurkhya, Nitin. Fundamentals of Predictive Text Mining. Second Edition. 2015,
Pag. 1.
32
5.1. Handling with Open Web Text.
1. Document Collection and Standardization:
Data Science and Machine Learning specialists use textual data retrieved from different
sources in their data analytics projects: third party providers APIs (Application Programming
Interfaces), their own companies’ Data Bases and Data Warehouses, and the open web are an
example of these sources. Regardless where the data come from, all documents must be
standardized as a previous step to analysis. Data Science industry has adopted the widely
known XML (Extensible Markup Language) as the standard method to tag chunks of text that
may be relevant for a Data Scientist analysis. This language uses tags like the following to
encapsulate pieces of relevant text that are then extracted:
<TITTLE> Relevant Tittle </TITTLE>
<TOPIC> Relevant Topic </TOPIC>
<AUTHOR> Author Name </AUTHOR>.
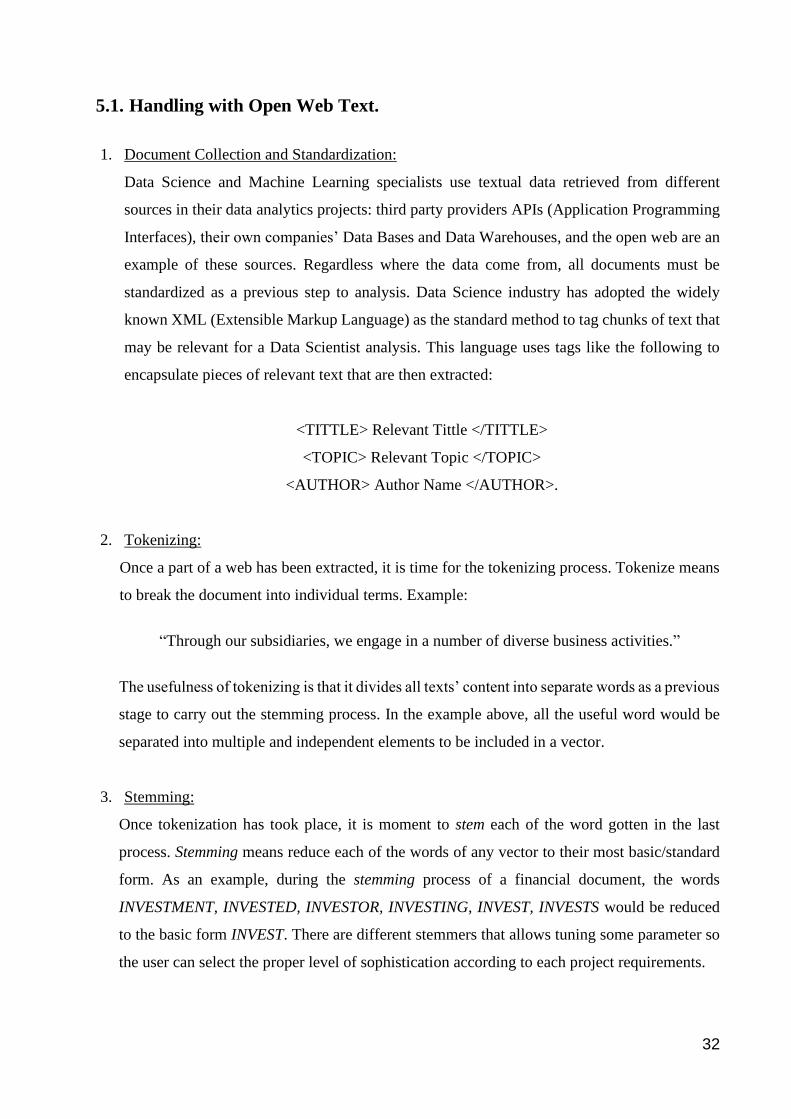
2. Tokenizing:
Once a part of a web has been extracted, it is time for the tokenizing process. Tokenize means
to break the document into individual terms. Example:
“Through our subsidiaries, we engage in a number of diverse business activities.”
The usefulness of tokenizing is that it divides all texts’ content into separate words as a previous
stage to carry out the stemming process. In the example above, all the useful word would be
separated into multiple and independent elements to be included in a vector.
3. Stemming:
Once tokenization has took place, it is moment to stem each of the word gotten in the last
process. Stemming means reduce each of the words of any vector to their most basic/standard
form. As an example, during the stemming process of a financial document, the words
INVESTMENT, INVESTED, INVESTOR, INVESTING, INVEST, INVESTS would be reduced
to the basic form INVEST. There are different stemmers that allows tuning some parameter so
the user can select the proper level of sophistication according to each project requirements.
33
4. Dimension Reduction:
Once a document that contains hundreds or thousands of words has been condensed in a vector
containing its words in its more basic form/root, it is time to remove all the called stop words
from this vector. Repetitive and meaningless words like AND, THE, IT, OR, THEY are removed
from the resulting vector as they do not have statistical power. This process is made through
the use of tailor-made tools configured using the local dictionary of the target language (e.g.
English). In Python, nlkt is one of the most used libraries in this process.
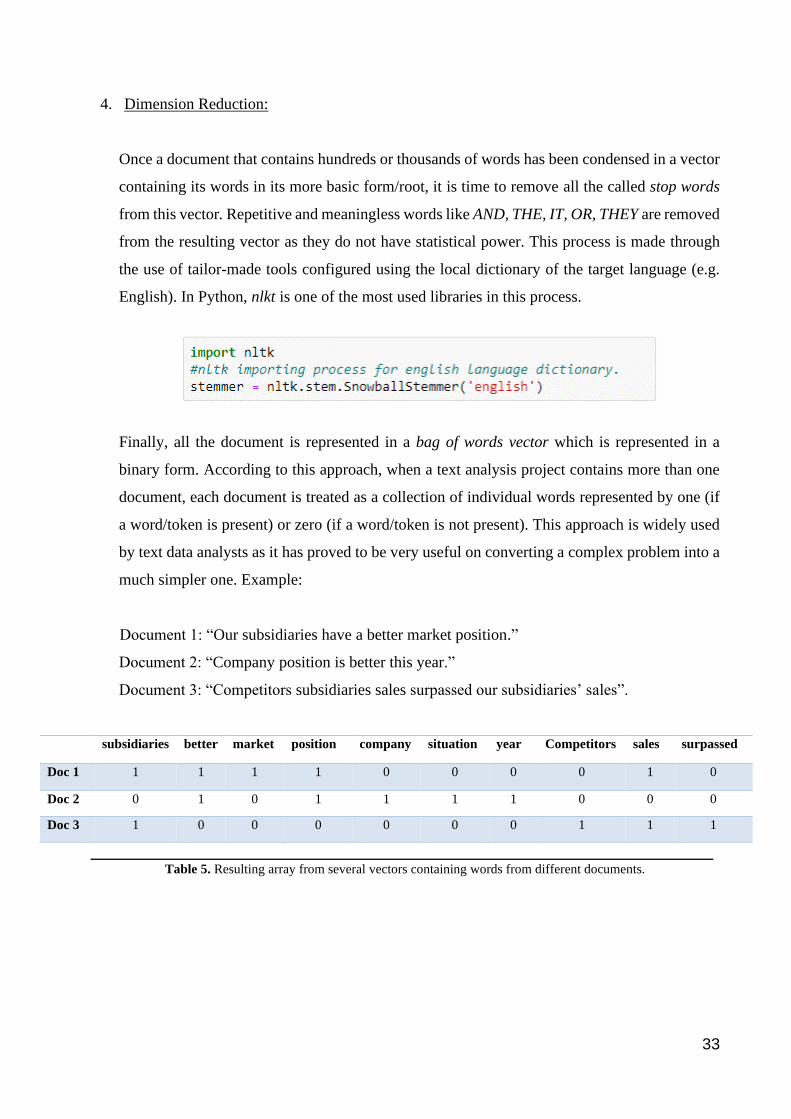
Finally, all the document is represented in a bag of words vector which is represented in a
binary form. According to this approach, when a text analysis project contains more than one
document, each document is treated as a collection of individual words represented by one (if
a word/token is present) or zero (if a word/token is not present). This approach is widely used
by text data analysts as it has proved to be very useful on converting a complex problem into a
much simpler one. Example:
Document 1: “Our subsidiaries have a better market position.”
Document 2: “Company position is better this year.”
Document 3: “Competitors subsidiaries sales surpassed our subsidiaries’ sales”.
subsidiaries better market position company situation year Competitors sales surpassed
Doc 1 1 1 1 1 0 0 0 0 1 0
Doc 2 0 1 0 1 1 1 1 0 0 0
Doc 3 1 0 0 0 0 0 0 1 1 1
______________________________________________________________________________ Table 5. Resulting array from several vectors containing words from different documents.
34
5.2. Processing Text: The TF-IDF Numerical Statistic.
Once the Binary vector has been built, is time to introduce the Term Frequency – Inverse
Document Frequency numerical statistic. In a Raw Term Frequency representation each word is
counted has many times as it appears in the document, this is, counting the word subsidiaries and
sales two times each.
When comparing several documents is normal to have documents with different lengths, in this
regard, TF-IDF uses normalization to create a ready to compare vector by normalizing vectors by
their text length. As an example, a word that appears 10 times in a 500 words financial report will
be much more important for this document than the same word appearing 10 times in another
financial report of a 1.200 words length. TF measures how prevalent is a term within a document,
this is the result of counting how many times t a given term appears in a given document d. This
said, there are some terms that only appear in a single document of the entire collection. These
sorts of terms are considered meaningless in terms of the TF-IDF statistical analysis. In this sense,
if a word appears in every single document in the collection of documents, this term is also most
likely not to add any value to the text analysis process, thereby is not that useful from the point of
view of a text data analyst. Conversely, if a term appears only in some few of the documents
analysed but not in all of the documents in the collection, this term could be very important for
textual analysis insofar as it gives specific information for the textual analytics process. To capture
this information IDF is used.
IDF (t) = log (𝑁𝑢𝑚𝑏𝑒𝑟 𝑜𝑓 𝑑𝑜𝑐𝑢𝑚𝑒𝑛𝑡𝑠 𝑖𝑛 𝑡ℎ𝑒 𝑐𝑜𝑙𝑙𝑒𝑐𝑡𝑖𝑜𝑛
𝑁𝑢𝑚𝑏𝑒𝑟 𝑜𝑓 𝑑𝑜𝑐𝑢𝑚𝑒𝑛𝑡𝑠 𝑐𝑜𝑛𝑡𝑎𝑖𝑛𝑖𝑛𝑔 𝑡𝑒𝑟𝑚 t)
Interpreting the formula above, the more a term t appears in a document in the collection, the
biggest will be the denominator and therefore, the lowest will be the IDF term.
TF-IDF (t,d) = TF (t,d) * IDF (t)
The more frequent a term appears in a single document (TF), the higher would be its TF-IDF with
respect to that document, however, given that IDF term is multiplying in this formula, the less
frequent this term appears in the entire collection, the higher the TF-IDF will be. In this sense, if
a term that is observed to appear very frequently in a given document also appears very often in
the rest of the documents of the collection, the IDF term would acting as a diminishing factor of
the TF-IDF statistic.
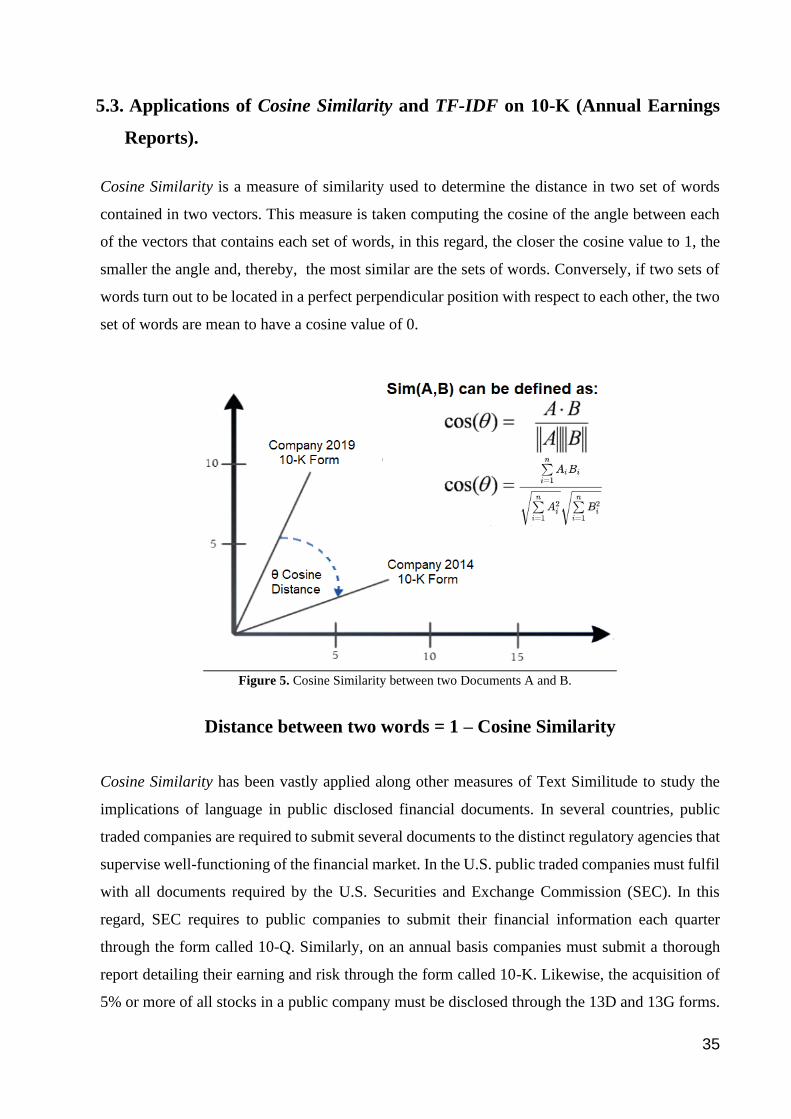
35
5.3. Applications of Cosine Similarity and TF-IDF on 10-K (Annual Earnings
Reports).
Cosine Similarity is a measure of similarity used to determine the distance in two set of words
contained in two vectors. This measure is taken computing the cosine of the angle between each
of the vectors that contains each set of words, in this regard, the closer the cosine value to 1, the
smaller the angle and, thereby, the most similar are the sets of words. Conversely, if two sets of
words turn out to be located in a perfect perpendicular position with respect to each other, the two
set of words are mean to have a cosine value of 0.
Figure 5. Cosine Similarity between two Documents A and B.
Distance between two words = 1 – Cosine Similarity
Cosine Similarity has been vastly applied along other measures of Text Similitude to study the
implications of language in public disclosed financial documents. In several countries, public
traded companies are required to submit several documents to the distinct regulatory agencies that
supervise well-functioning of the financial market. In the U.S. public traded companies must fulfil
with all documents required by the U.S. Securities and Exchange Commission (SEC). In this
regard, SEC requires to public companies to submit their financial information each quarter
through the form called 10-Q. Similarly, on an annual basis companies must submit a thorough
report detailing their earning and risk through the form called 10-K. Likewise, the acquisition of
5% or more of all stocks in a public company must be disclosed through the 13D and 13G forms.
36
Forms 3, 4 and 5 disclose trading transactions of relevant individual stakeholders, i.e. CEO, CFO,
Board members. All these forms available online for consultation are a very rich source of
financial data currently being used for cross-functional asset management teams to extract relevant
financial data, in fact, several empirical studies have been carried out to demonstrate the
implications of the language used on financial forms in the future performance of a company stock
performance. In 2008, a study found that 10-K form companies with lower but persistent earning
are the most difficult to interpret, and that language tone used by relevant stakeholder about
company forward perspective covered in Item 7 from 10-K Forms (Management’s Discussion and
Analysis of Financial Condition and Results of Operations – MD&A), can be used to predict future
earnings shocks21.
One of the most interesting studies on this field was carried out in 2015, illustrating to what extent
textual analysis from companies’ 10-K and 10-Q reports can be used as a proxy for a company’s
sock future performance. In this specific paper, published in 2018 by professors of Harvard
Business School – NBER and University of Illinois at Chicago, authors analysed quarterly and
annual filings of U.S. corporations during two decades, finding that, the decision of actively take
action to change the speech on an annual report against previous years’ reports, has been proved
to have a relation to the future performance of the stock. By focusing on behaviour of corporations,
authors found that when firms break the trend from the former language used in their reports, there
is a considerable quantity of information that can be extracted for this action and that can even
help to estimate the future performance of this company.
The aforementioned research took 350.000 individual reports from U.S. companies between 1995
and 2014 and studied the language used for each of these reports with respect to previous year’s
language. By focusing on companies’ behaviour and analysing companies’ break from former
language used on their 10-K and 10-Q Forms, researchers found that companies tend not to make
many changes in the language used in year’s form with respect to the following year, or in a given
quarter with respect to the next one. Companies were sorted out based upon how similar a
company language was with respect to the language from previous quarter and previous year.
Then, a long/short portfolio of stocks was built based upon the level of similarity of these stocks
(stock with low level of change in their report’s language were bought while stocks from
21 Li, Feng. Textual Analysis of Corporate Disclosures: A Survey of the Literature. 2010. Journal of Accounting
Literature. University of Michigan.
37
companies with changing language was shorted). The results demonstrated that this portfolio
ended up earning 30-60 basis points per month over the following year, accruing return
during the following 18 months and not reversing, thereby implying that fundamentals
changes produced in companies (reflected through the change in annual reports language)
tend to be incorporated into asset prices over the following 12 to 18 months after the change
is produced.
One of the most relevant findings made by this research is that authors were able to detect that,
although is the Management Discussion section (MD&A) the one where management has the
highest level of discretion and flexibility to express the opinion about factors as the company, the
market and the future conditions of the business environment, the risk section it is actually the one
with the biggest amount of return-rich content. The results of this research were very interesting,
concluding that changes to the language and construction of financial reports have strong
implications for firms’ future returns: a portfolio that shorts “changers” and buys “non-
changers” earns up to 188 basis points per month (over 22% per year) in abnormal returns in the
future22.
Although the aforementioned research used four different measures of similarity (Cosine
Similarity, Jaccard Similarity, String Similarity and Simple Similarity) to assess the level in
language change in two different portfolios (equal-weighted and value-weighted portfolio), the
practical nature of this Master’s Thesis will simplify this matter by focusing in the application of
Cosine Similarity (as a change in language approach measure) over the risk section of a given
company.
22 Cohen, Lauren – Malloy, Christopher – Nguyen, Quoc. Lazy Prices. 2018. Harvard Business School and University of
Illinois
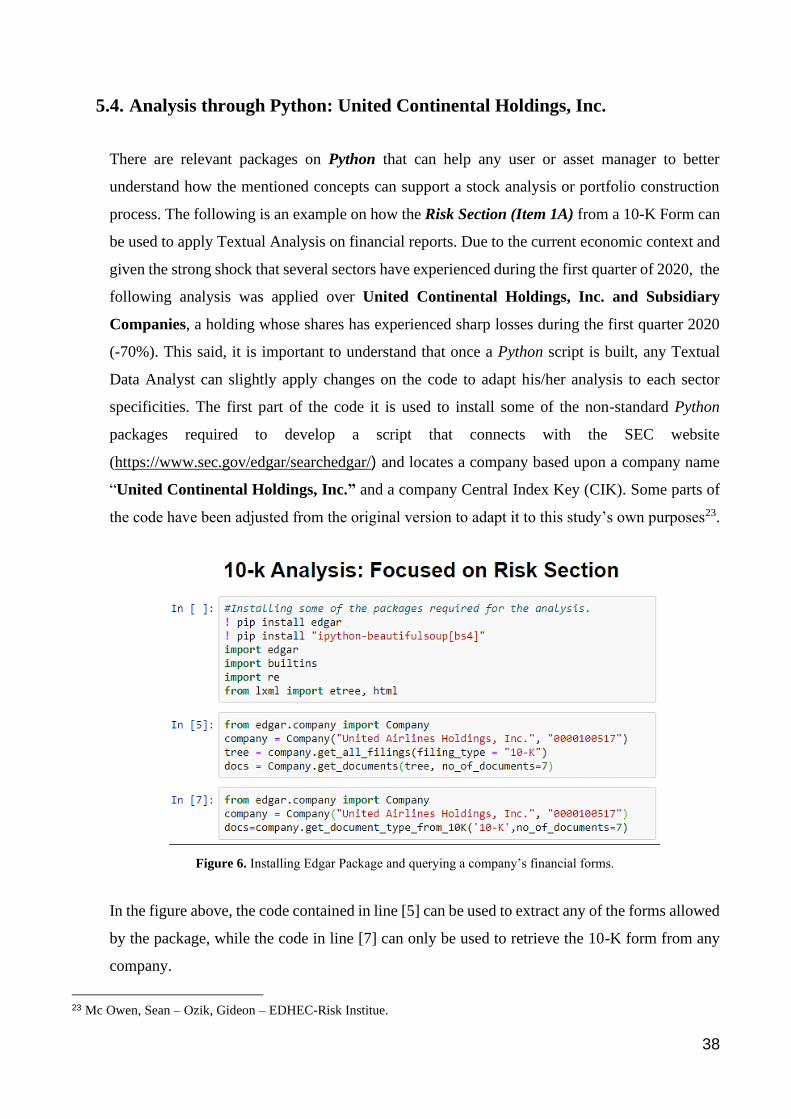
38
5.4. Analysis through Python: United Continental Holdings, Inc.
There are relevant packages on Python that can help any user or asset manager to better
understand how the mentioned concepts can support a stock analysis or portfolio construction
process. The following is an example on how the Risk Section (Item 1A) from a 10-K Form can
be used to apply Textual Analysis on financial reports. Due to the current economic context and
given the strong shock that several sectors have experienced during the first quarter of 2020, the
following analysis was applied over United Continental Holdings, Inc. and Subsidiary
Companies, a holding whose shares has experienced sharp losses during the first quarter 2020
(-70%). This said, it is important to understand that once a Python script is built, any Textual
Data Analyst can slightly apply changes on the code to adapt his/her analysis to each sector
specificities. The first part of the code it is used to install some of the non-standard Python
packages required to develop a script that connects with the SEC website
(https://www.sec.gov/edgar/searchedgar/) and locates a company based upon a company name
“United Continental Holdings, Inc.” and a company Central Index Key (CIK). Some parts of
the code have been adjusted from the original version to adapt it to this study’s own purposes23.
Figure 6. Installing Edgar Package and querying a company’s financial forms.
In the figure above, the code contained in line [5] can be used to extract any of the forms allowed
by the package, while the code in line [7] can only be used to retrieve the 10-K form from any
company.
23 Mc Owen, Sean – Ozik, Gideon – EDHEC-Risk Institue.
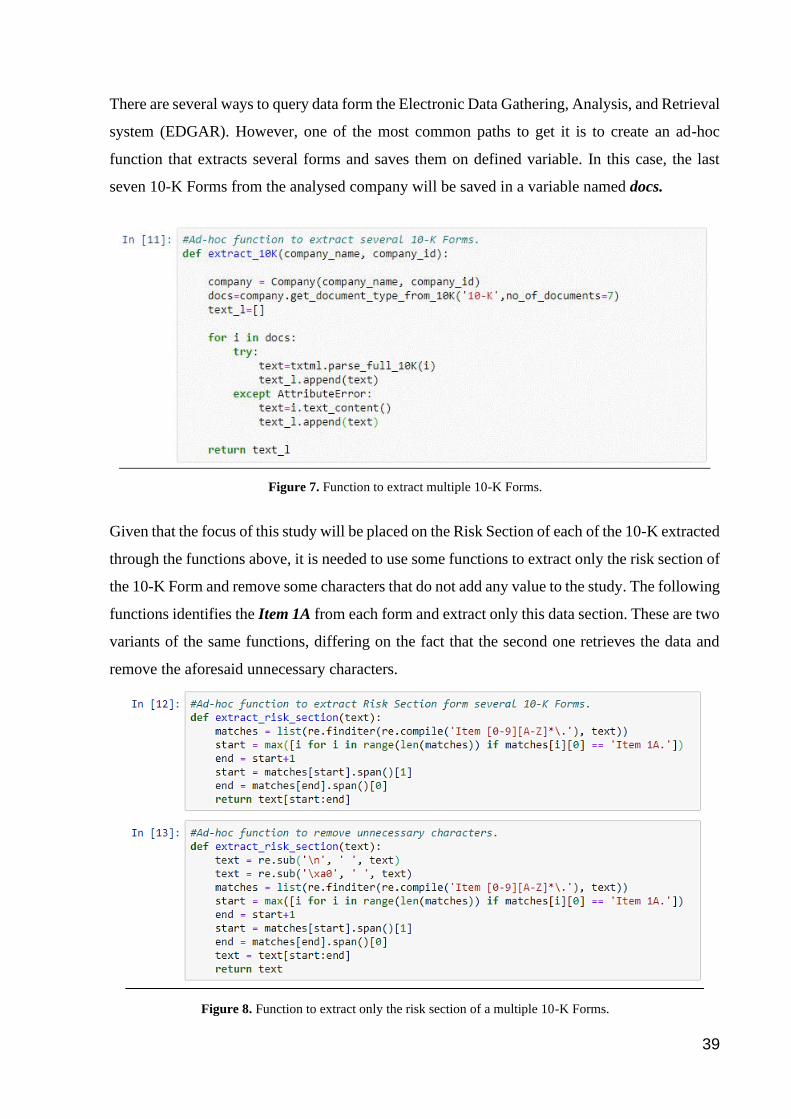
39
There are several ways to query data form the Electronic Data Gathering, Analysis, and Retrieval
system (EDGAR). However, one of the most common paths to get it is to create an ad-hoc
function that extracts several forms and saves them on defined variable. In this case, the last
seven 10-K Forms from the analysed company will be saved in a variable named docs.
Figure 7. Function to extract multiple 10-K Forms.
Given that the focus of this study will be placed on the Risk Section of each of the 10-K extracted
through the functions above, it is needed to use some functions to extract only the risk section of
the 10-K Form and remove some characters that do not add any value to the study. The following
functions identifies the Item 1A from each form and extract only this data section. These are two
variants of the same functions, differing on the fact that the second one retrieves the data and
remove the aforesaid unnecessary characters.
Figure 8. Function to extract only the risk section of a multiple 10-K Forms.
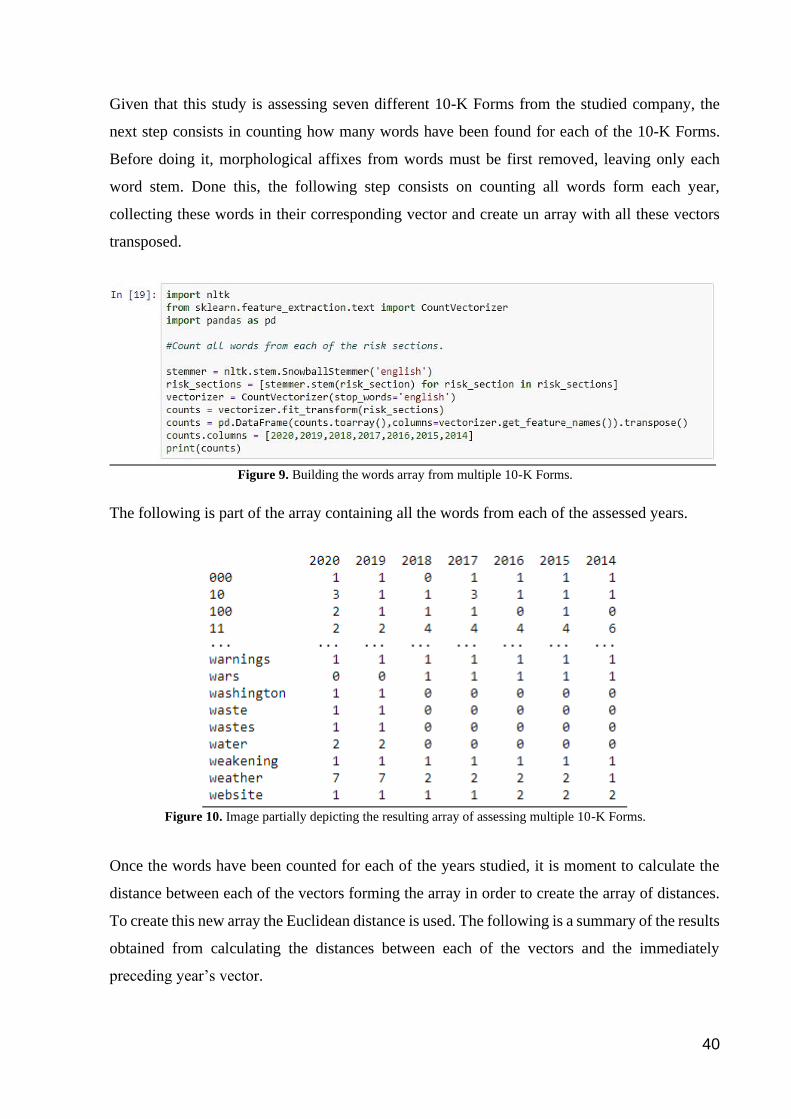
40
Given that this study is assessing seven different 10-K Forms from the studied company, the
next step consists in counting how many words have been found for each of the 10-K Forms.
Before doing it, morphological affixes from words must be first removed, leaving only each
word stem. Done this, the following step consists on counting all words form each year,
collecting these words in their corresponding vector and create un array with all these vectors
transposed.
Figure 9. Building the words array from multiple 10-K Forms.
The following is part of the array containing all the words from each of the assessed years.
Figure 10. Image partially depicting the resulting array of assessing multiple 10-K Forms.
Once the words have been counted for each of the years studied, it is moment to calculate the
distance between each of the vectors forming the array in order to create the array of distances.
To create this new array the Euclidean distance is used. The following is a summary of the results
obtained from calculating the distances between each of the vectors and the immediately
preceding year’s vector.
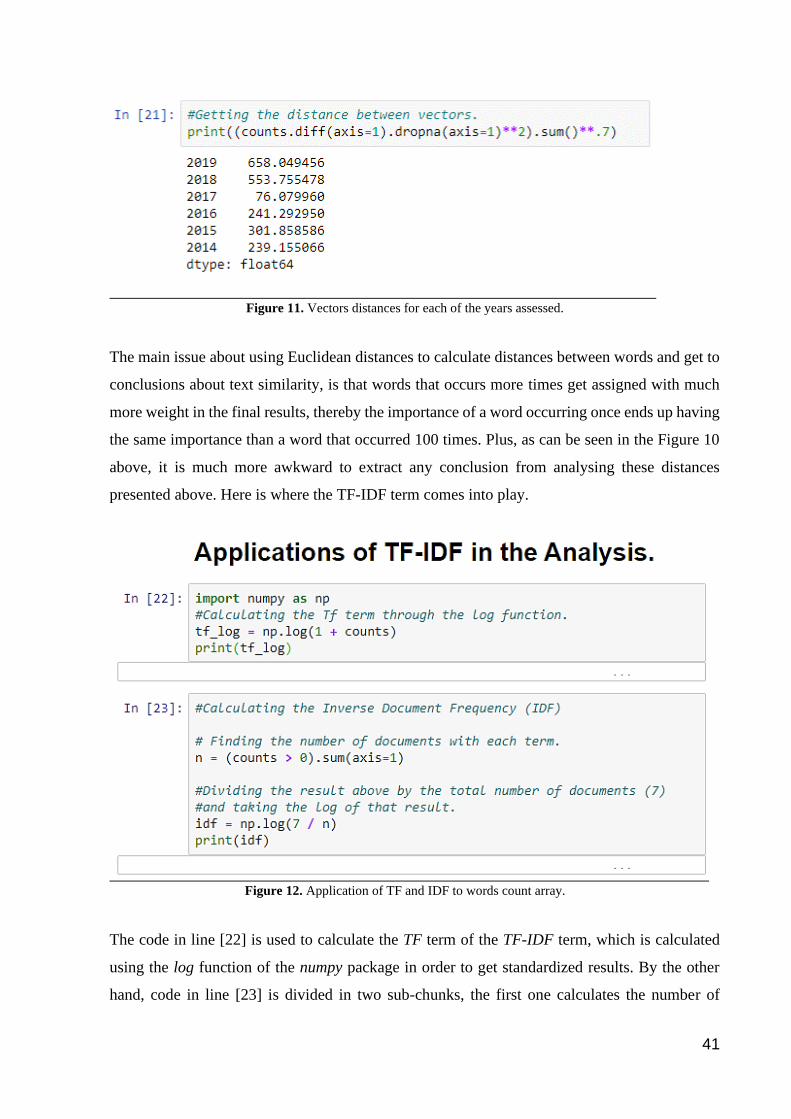
41
Figure 11. Vectors distances for each of the years assessed.
The main issue about using Euclidean distances to calculate distances between words and get to
conclusions about text similarity, is that words that occurs more times get assigned with much
more weight in the final results, thereby the importance of a word occurring once ends up having
the same importance than a word that occurred 100 times. Plus, as can be seen in the Figure 10
above, it is much more awkward to extract any conclusion from analysing these distances
presented above. Here is where the TF-IDF term comes into play.
Figure 12. Application of TF and IDF to words count array.
The code in line [22] is used to calculate the TF term of the TF-IDF term, which is calculated
using the log function of the numpy package in order to get standardized results. By the other
hand, code in line [23] is divided in two sub-chunks, the first one calculates the number of
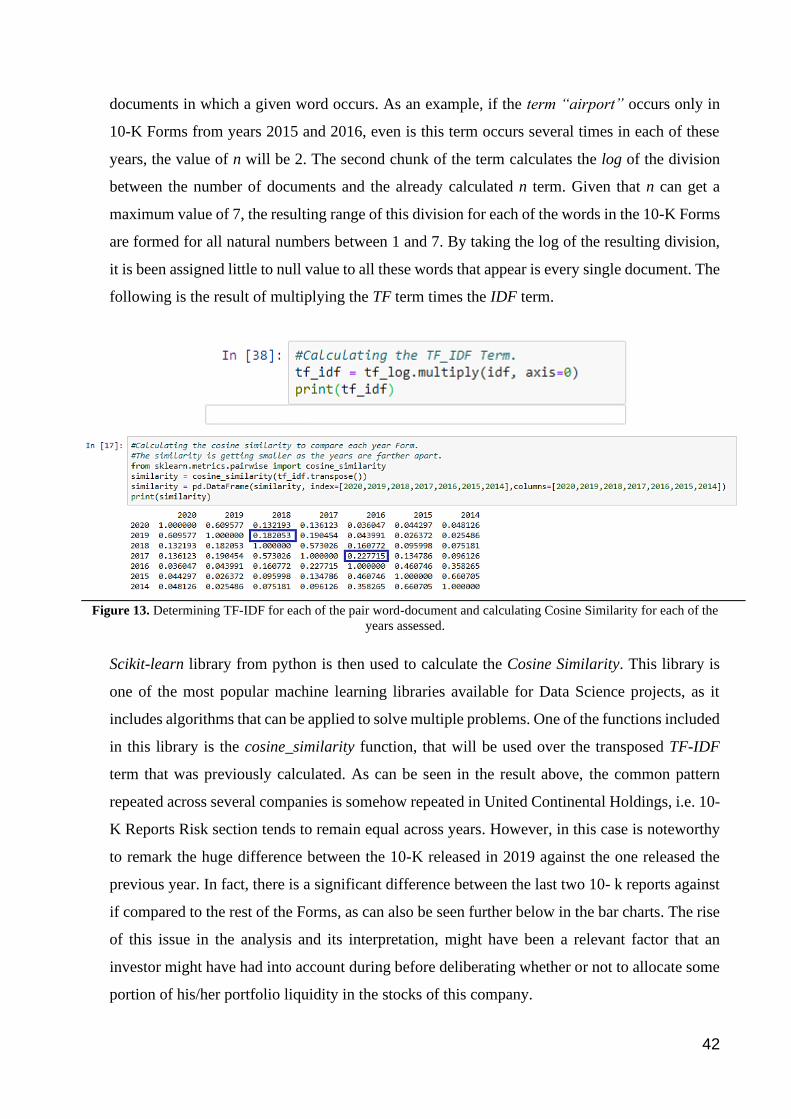
42
documents in which a given word occurs. As an example, if the term “airport” occurs only in
10-K Forms from years 2015 and 2016, even is this term occurs several times in each of these
years, the value of n will be 2. The second chunk of the term calculates the log of the division
between the number of documents and the already calculated n term. Given that n can get a
maximum value of 7, the resulting range of this division for each of the words in the 10-K Forms
are formed for all natural numbers between 1 and 7. By taking the log of the resulting division,
it is been assigned little to null value to all these words that appear is every single document. The
following is the result of multiplying the TF term times the IDF term.
Figure 13. Determining TF-IDF for each of the pair word-document and calculating Cosine Similarity for each of the
years assessed.
Scikit-learn library from python is then used to calculate the Cosine Similarity. This library is
one of the most popular machine learning libraries available for Data Science projects, as it
includes algorithms that can be applied to solve multiple problems. One of the functions included
in this library is the cosine_similarity function, that will be used over the transposed TF-IDF
term that was previously calculated. As can be seen in the result above, the common pattern
repeated across several companies is somehow repeated in United Continental Holdings, i.e. 10-
K Reports Risk section tends to remain equal across years. However, in this case is noteworthy
to remark the huge difference between the 10-K released in 2019 against the one released the
previous year. In fact, there is a significant difference between the last two 10- k reports against
if compared to the rest of the Forms, as can also be seen further below in the bar charts. The rise
of this issue in the analysis and its interpretation, might have been a relevant factor that an
investor might have had into account during before deliberating whether or not to allocate some
portion of his/her portfolio liquidity in the stocks of this company.
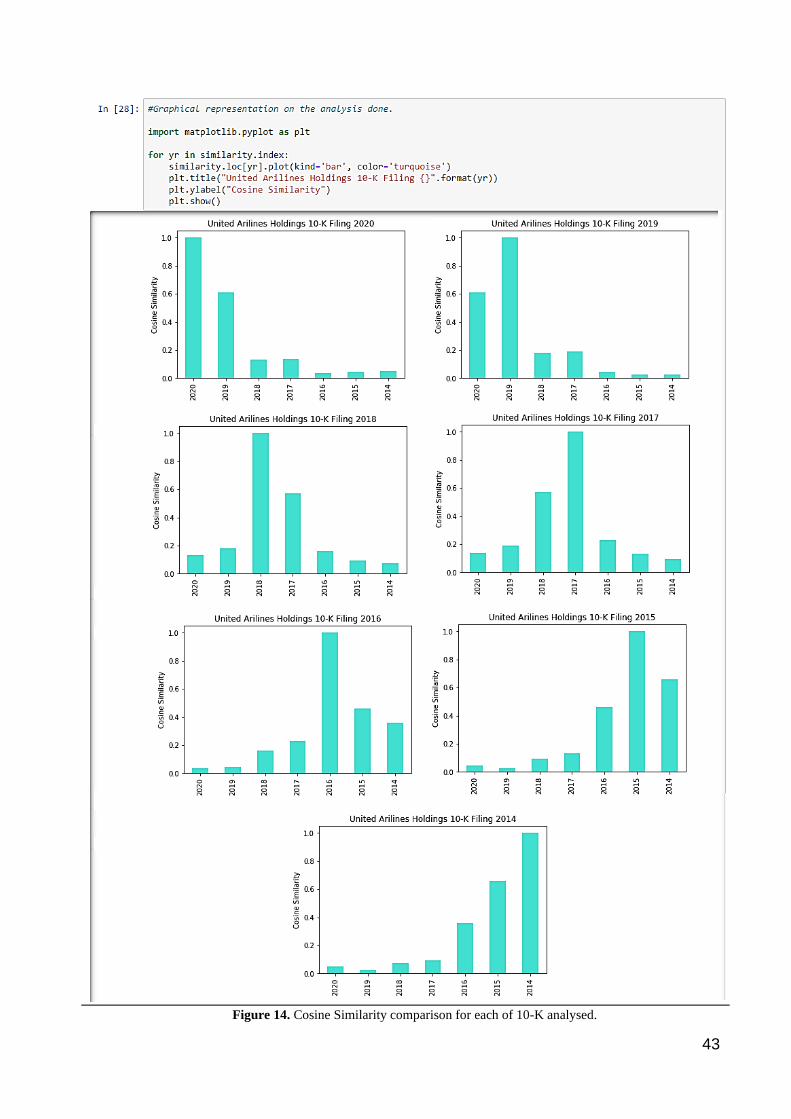
43
Figure 14. Cosine Similarity comparison for each of 10-K analysed.
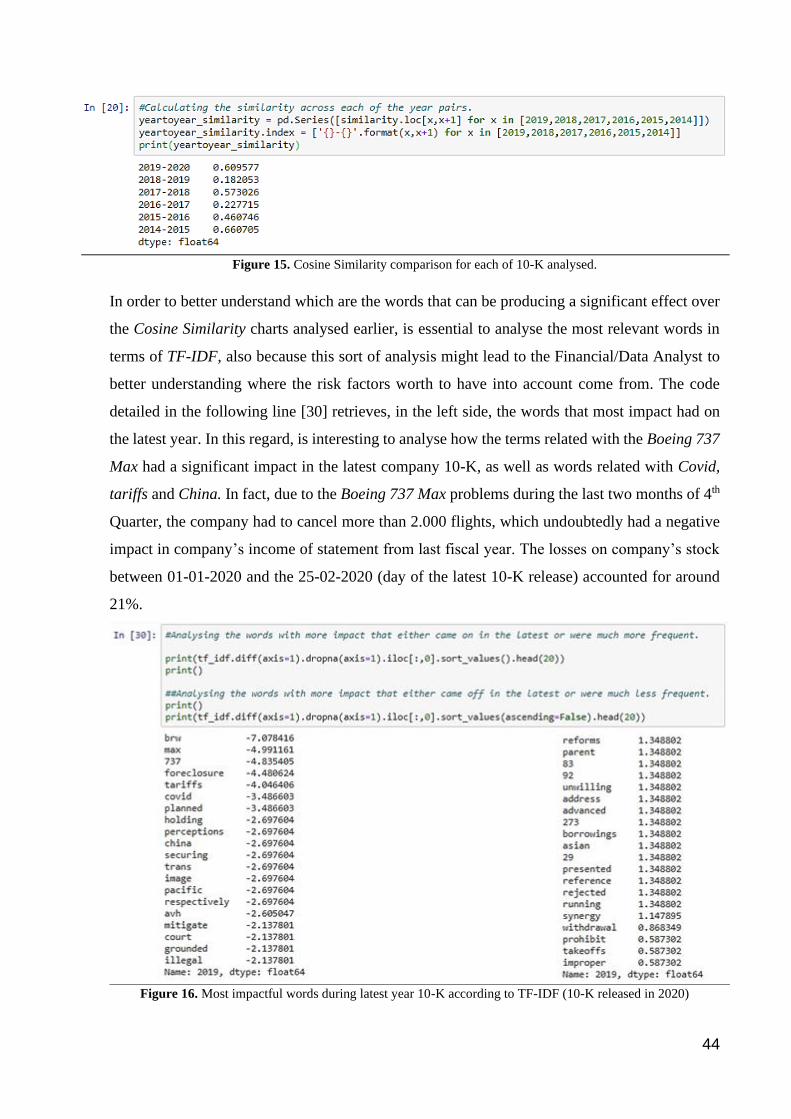
44
Figure 15. Cosine Similarity comparison for each of 10-K analysed.
In order to better understand which are the words that can be producing a significant effect over
the Cosine Similarity charts analysed earlier, is essential to analyse the most relevant words in
terms of TF-IDF, also because this sort of analysis might lead to the Financial/Data Analyst to
better understanding where the risk factors worth to have into account come from. The code
detailed in the following line [30] retrieves, in the left side, the words that most impact had on
the latest year. In this regard, is interesting to analyse how the terms related with the Boeing 737
Max had a significant impact in the latest company 10-K, as well as words related with Covid,
tariffs and China. In fact, due to the Boeing 737 Max problems during the last two months of 4th
Quarter, the company had to cancel more than 2.000 flights, which undoubtedly had a negative
impact in company’s income of statement from last fiscal year. The losses on company’s stock
between 01-01-2020 and the 25-02-2020 (day of the latest 10-K release) accounted for around
21%.
Figure 16. Most impactful words during latest year 10-K according to TF-IDF (10-K released in 2020)
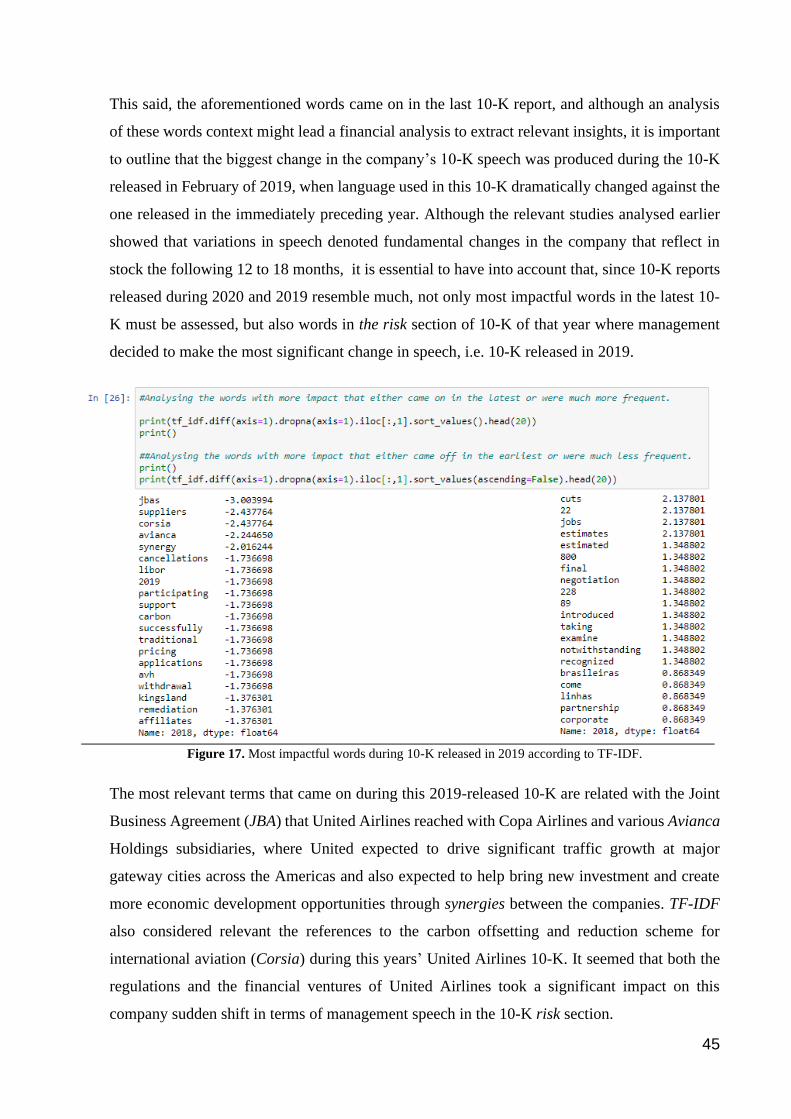
45
This said, the aforementioned words came on in the last 10-K report, and although an analysis
of these words context might lead a financial analysis to extract relevant insights, it is important
to outline that the biggest change in the company’s 10-K speech was produced during the 10-K
released in February of 2019, when language used in this 10-K dramatically changed against the
one released in the immediately preceding year. Although the relevant studies analysed earlier
showed that variations in speech denoted fundamental changes in the company that reflect in
stock the following 12 to 18 months, it is essential to have into account that, since 10-K reports
released during 2020 and 2019 resemble much, not only most impactful words in the latest 10-
K must be assessed, but also words in the risk section of 10-K of that year where management
decided to make the most significant change in speech, i.e. 10-K released in 2019.
Figure 17. Most impactful words during 10-K released in 2019 according to TF-IDF.
The most relevant terms that came on during this 2019-released 10-K are related with the Joint
Business Agreement (JBA) that United Airlines reached with Copa Airlines and various Avianca
Holdings subsidiaries, where United expected to drive significant traffic growth at major
gateway cities across the Americas and also expected to help bring new investment and create
more economic development opportunities through synergies between the companies. TF-IDF
also considered relevant the references to the carbon offsetting and reduction scheme for
international aviation (Corsia) during this years’ United Airlines 10-K. It seemed that both the
regulations and the financial ventures of United Airlines took a significant impact on this
company sudden shift in terms of management speech in the 10-K risk section.
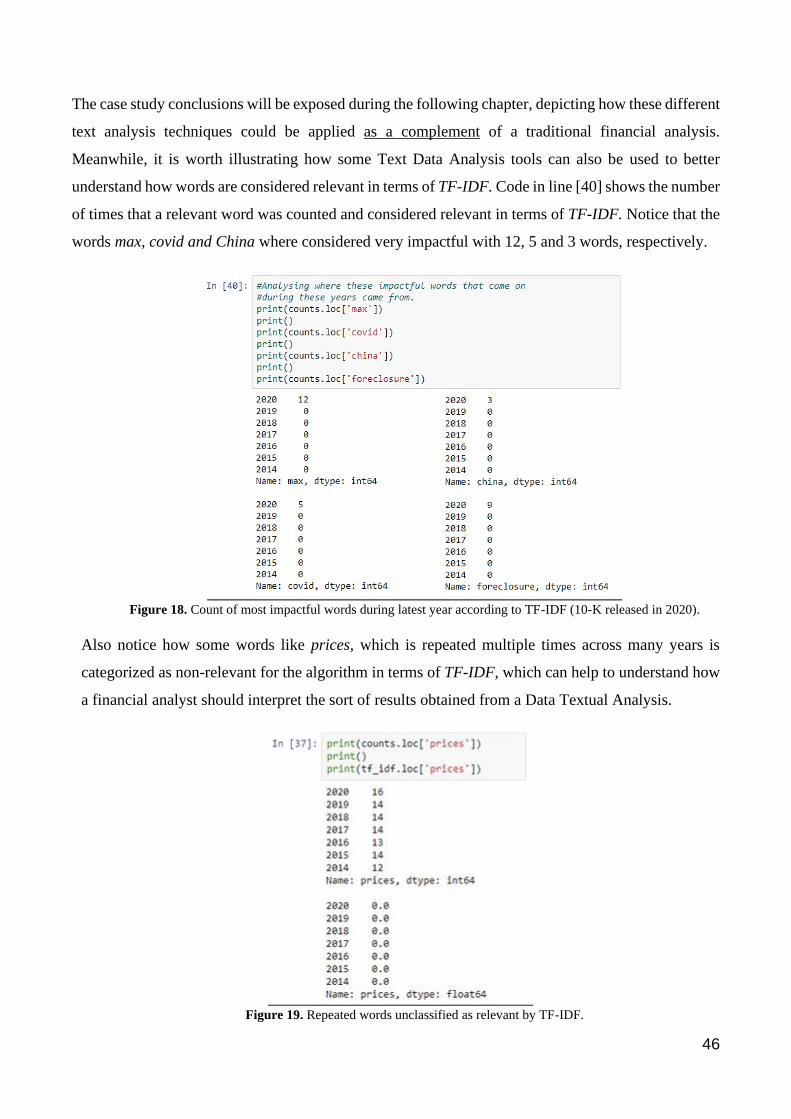
46
The case study conclusions will be exposed during the following chapter, depicting how these different
text analysis techniques could be applied as a complement of a traditional financial analysis.
Meanwhile, it is worth illustrating how some Text Data Analysis tools can also be used to better
understand how words are considered relevant in terms of TF-IDF. Code in line [40] shows the number
of times that a relevant word was counted and considered relevant in terms of TF-IDF. Notice that the
words max, covid and China where considered very impactful with 12, 5 and 3 words, respectively.
Figure 18. Count of most impactful words during latest year according to TF-IDF (10-K released in 2020).
Also notice how some words like prices, which is repeated multiple times across many years is
categorized as non-relevant for the algorithm in terms of TF-IDF, which can help to understand how
a financial analyst should interpret the sort of results obtained from a Data Textual Analysis.
Figure 19. Repeated words unclassified as relevant by TF-IDF.
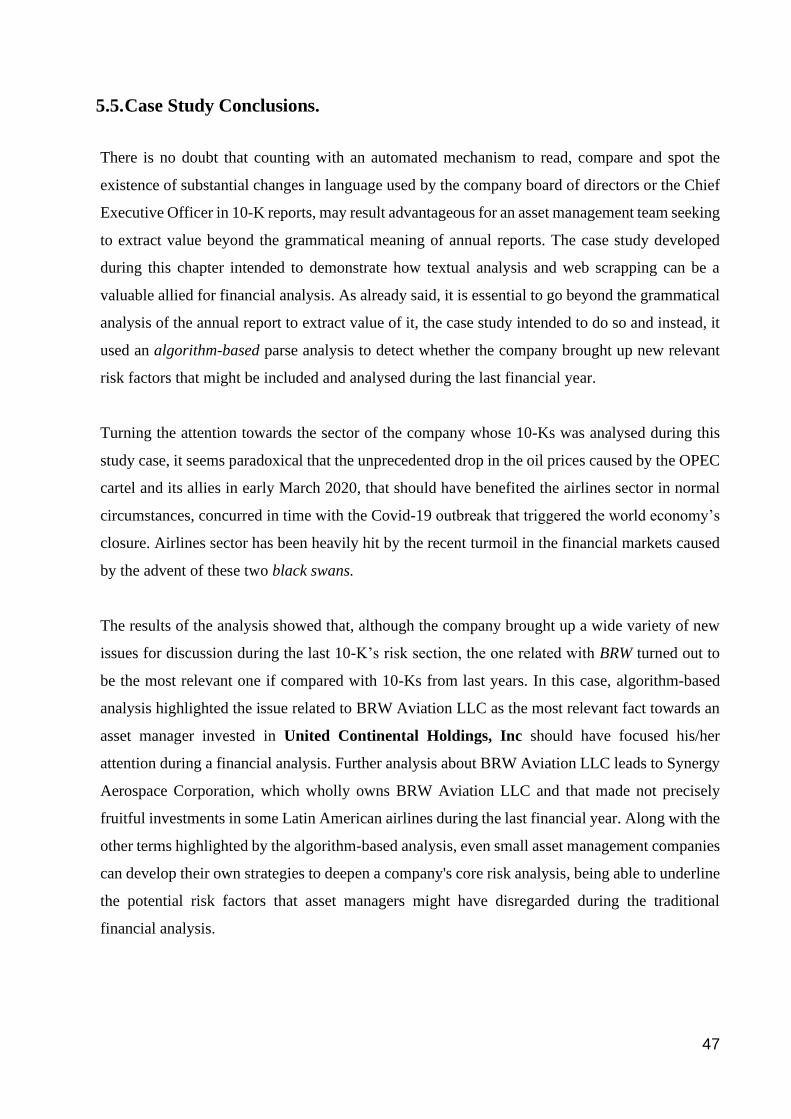
47
5.5. Case Study Conclusions.
There is no doubt that counting with an automated mechanism to read, compare and spot the
existence of substantial changes in language used by the company board of directors or the Chief
Executive Officer in 10-K reports, may result advantageous for an asset management team seeking
to extract value beyond the grammatical meaning of annual reports. The case study developed
during this chapter intended to demonstrate how textual analysis and web scrapping can be a
valuable allied for financial analysis. As already said, it is essential to go beyond the grammatical
analysis of the annual report to extract value of it, the case study intended to do so and instead, it
used an algorithm-based parse analysis to detect whether the company brought up new relevant
risk factors that might be included and analysed during the last financial year.
Turning the attention towards the sector of the company whose 10-Ks was analysed during this
study case, it seems paradoxical that the unprecedented drop in the oil prices caused by the OPEC
cartel and its allies in early March 2020, that should have benefited the airlines sector in normal
circumstances, concurred in time with the Covid-19 outbreak that triggered the world economy’s
closure. Airlines sector has been heavily hit by the recent turmoil in the financial markets caused
by the advent of these two black swans.
The results of the analysis showed that, although the company brought up a wide variety of new
issues for discussion during the last 10-K’s risk section, the one related with BRW turned out to
be the most relevant one if compared with 10-Ks from last years. In this case, algorithm-based
analysis highlighted the issue related to BRW Aviation LLC as the most relevant fact towards an
asset manager invested in United Continental Holdings, Inc should have focused his/her
attention during a financial analysis. Further analysis about BRW Aviation LLC leads to Synergy
Aerospace Corporation, which wholly owns BRW Aviation LLC and that made not precisely
fruitful investments in some Latin American airlines during the last financial year. Along with the
other terms highlighted by the algorithm-based analysis, even small asset management companies
can develop their own strategies to deepen a company's core risk analysis, being able to underline
the potential risk factors that asset managers might have disregarded during the traditional
financial analysis.
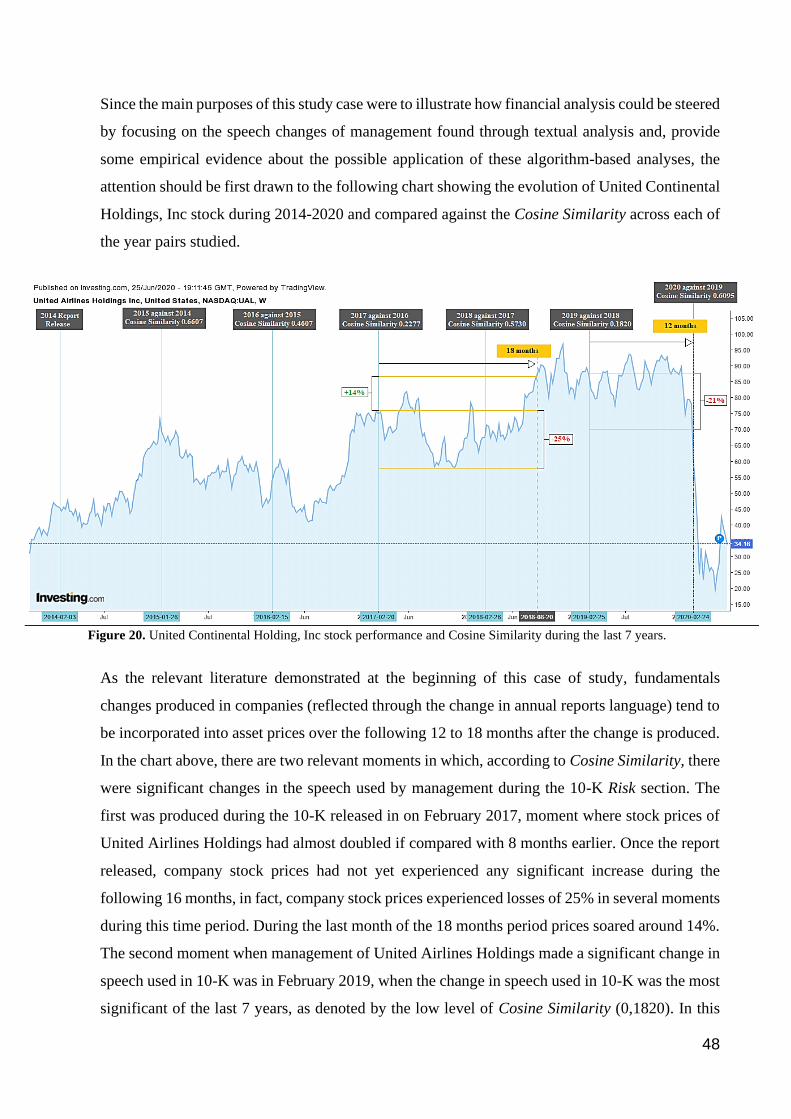
48
Since the main purposes of this study case were to illustrate how financial analysis could be steered
by focusing on the speech changes of management found through textual analysis and, provide
some empirical evidence about the possible application of these algorithm-based analyses, the
attention should be first drawn to the following chart showing the evolution of United Continental
Holdings, Inc stock during 2014-2020 and compared against the Cosine Similarity across each of
the year pairs studied.
Figure 20. United Continental Holding, Inc stock performance and Cosine Similarity during the last 7 years.
As the relevant literature demonstrated at the beginning of this case of study, fundamentals
changes produced in companies (reflected through the change in annual reports language) tend to
be incorporated into asset prices over the following 12 to 18 months after the change is produced.
In the chart above, there are two relevant moments in which, according to Cosine Similarity, there
were significant changes in the speech used by management during the 10-K Risk section. The
first was produced during the 10-K released in on February 2017, moment where stock prices of
United Airlines Holdings had almost doubled if compared with 8 months earlier. Once the report
released, company stock prices had not yet experienced any significant increase during the
following 16 months, in fact, company stock prices experienced losses of 25% in several moments
during this time period. During the last month of the 18 months period prices soared around 14%.
The second moment when management of United Airlines Holdings made a significant change in
speech used in 10-K was in February 2019, when the change in speech used in 10-K was the most
significant of the last 7 years, as denoted by the low level of Cosine Similarity (0,1820). In this
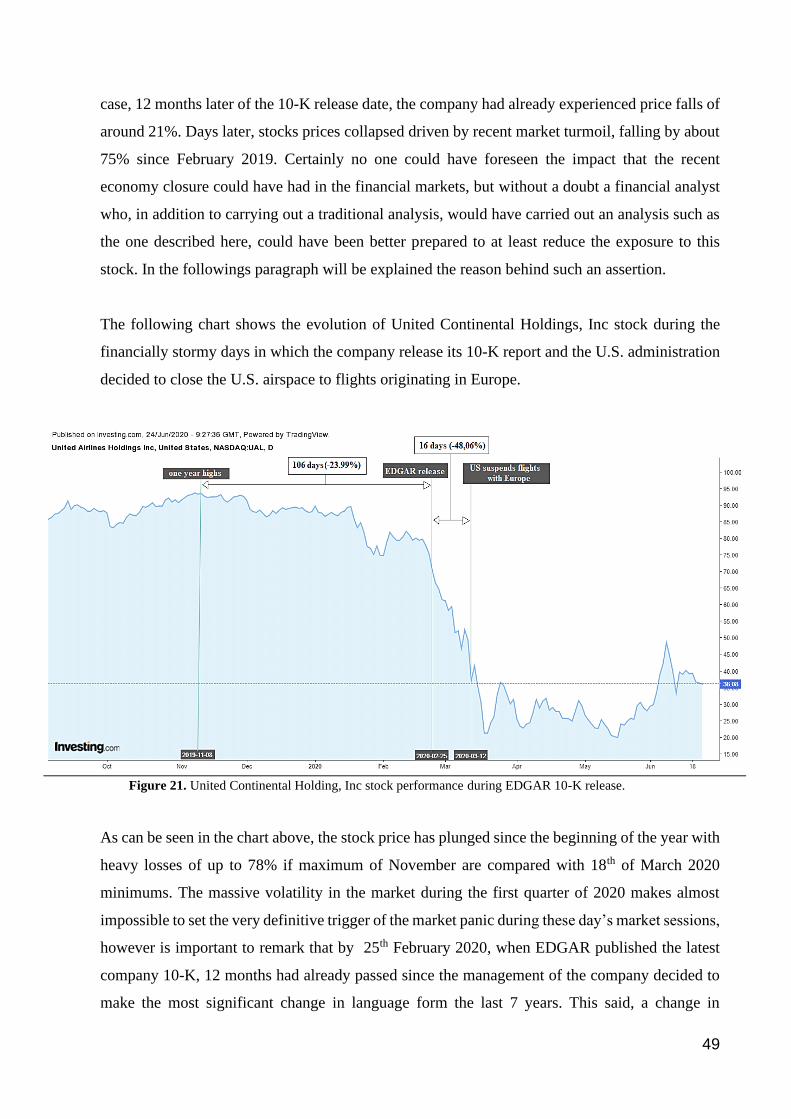
49
case, 12 months later of the 10-K release date, the company had already experienced price falls of
around 21%. Days later, stocks prices collapsed driven by recent market turmoil, falling by about
75% since February 2019. Certainly no one could have foreseen the impact that the recent
economy closure could have had in the financial markets, but without a doubt a financial analyst
who, in addition to carrying out a traditional analysis, would have carried out an analysis such as
the one described here, could have been better prepared to at least reduce the exposure to this
stock. In the followings paragraph will be explained the reason behind such an assertion.
The following chart shows the evolution of United Continental Holdings, Inc stock during the
financially stormy days in which the company release its 10-K report and the U.S. administration
decided to close the U.S. airspace to flights originating in Europe.
Figure 21. United Continental Holding, Inc stock performance during EDGAR 10-K release.
As can be seen in the chart above, the stock price has plunged since the beginning of the year with
heavy losses of up to 78% if maximum of November are compared with 18th of March 2020
minimums. The massive volatility in the market during the first quarter of 2020 makes almost
impossible to set the very definitive trigger of the market panic during these day’s market sessions,
however is important to remark that by 25th February 2020, when EDGAR published the latest
company 10-K, 12 months had already passed since the management of the company decided to
make the most significant change in language form the last 7 years. This said, a change in
50
management speech is not a reason that by itself can lead to take investment decisions, however,
certainly such a big change could have at least risen some red flags in any data science-skilled
asset manager using these sort of financial text analysis tools, as it is currently being done in big
financial institutions24.
TF-IDF results depicted a substantial difference between 2019 and 2018 report and, drawing a
clear divergence not occurred between any of the other reports analysed in previous years. This
can certainly warn asset managers about the course of actions to be subsequently taken, mainly if
the most significance differences during 10-K released at 25th February 2020 were clearly related
with major risks or airlines sectors, i.e. Accidents (Boeing 737 Max), Pandemics (Covid-19,
China) and wrong capital allocation / wrong investments (foreclosure). Since the beginning of the
year until the last 10-K release, United Airlines Holding stocks have already dropped by 21%. As
depicted in Figure 19 above, U.S. suspension of flights with Europe was preceded by a temporary
window opened by the releasing of 10-K report by EDGAR. Between the latest 10-K report release
and the 16 days following that date, losses in company’s stock accounted for roughly 48%. In
other words, red flags risen during the substantial change in language produced 12 months before
of the last report release, along with the analysis of the main components that drove the change in
latest 10-K report and traditional financial analysis could have certainly led asset managers to take
actions in days prior to the market panic, leveraging this way in the opportunities drawn by the
uses of algorithm-based techniques over 10-K text analysis, being able to take decisions in a better
informed manner during rowdy periods in the stocks market.
Finally, it is of paramount importance to clarify that what has been was said here, is not meant to
point this type of analysis as the flawless mechanism used by a method that can be used by asset
managers to continuously limit losses in their market operations, but thorough research carried
out about financial applications of text analysis over the open web, along with traditional
fundamental and financial statement analysis, might certainly lead to the development of robust
complementary methods that could provide small asset management firms with instruments of
analysis comparable to those currently being used in the biggest global investment corporations.
24 Higson, Philip – Müller, Marius. Alpha from Alt Data, 2017. (https://carlyon.ch/wp-content/uploads/2019/12/Alpha-
from-Alternative-Data.pdf)
51
6. Case Study 3: Sentiment Analysis Through Textual Analytics.
Financial and corporate agents have to face iterative tasks on a daily basis: read financial reports,
analyse relevant events markets, sending emails to brokers, back-end, and front-end counterparties,
etc. Although many of these repetitive tasks have been diminished by the arrival of new tools and
financial software improvements, which allow the workforce to use working time on more valuable
assignments, there are some few tasks where financial and corporate agents (i.e. CEO, CFO, board of
directors) decide to actively have an impact on: Annual and Quarterly Reports. The decision of actively
take action to change the speech on an annual report has been proved to have a relation to the future
performance of the stock, as described by the literature cited during study case 2. This said, financial
text analysis is also being studied by a growing body of research focused in the analysis of text to
detect the tone of financially relevant documents.
Recent researches have focused on gather markets sentiment through social media, creating a rich
literature about how relevant information about Stock Markets can be found through sentiment
analysis25 26. Most recent research have even gone further, studying how information about Derivatives
Market can also be found in media27. Data sources of these kind of studies can also be financial and
political blogs, professional product reviews, social networks or discussion groups for product and
company image analysis28. Other set of studies have exclusively focused on financial information
disclosed by the company to gauge the sentiment of the underlying business in that company, in this
regard, even the conference call audio files have been scrutinized seeking for positive or negative vocal
cues revealed by managers’ voice29.
Said the above, what this field of research has always been trying to do is to accurately transform
qualitative information (words and their meaning) into quantitative and measurable information. In the
study case to be developed along this chapter, the method to be used will be known as Bag of Words,
also known as List of Words method.
25 Hailang, Chen – Prabuddha, De – Hu, Jeffrey – Byoung-Hyoun, Hwang. Wisdom of Crowds: The Value of Stock
Opinions Transmitted Through Social Media. 26 Engelberg, Joseph – Parsons, Christopher A. The Causal Impact of Media in Financial Markets. October, 2019. 27 Media and the Term-Structure of Unexpected Option-Implied Volatility. August, 2018. 28 Weiss, Sholom M. – Zhang, Tong – Indurkhya, Nitin. Fundamentals of Predictive Text Mining. Second Edition. 2015,
Pag. 156. 29 Mayew, William J. – Venkatachalam, Mohan. The Power of Voice: Managerial Affective States and Future Firm
Performance. 2009.
52
6.1. The Sentiment List of Words.
Several studies have pointed negative words classifications as an effective proxy to measure tone
of 10-K reports, even reflecting significant correlations with other financial variables. In many of
these studies, the Harvard Psychosociological Dictionary has been used as the baseline list of
words, concretely the Harvard-IV-4 (H4N) list of words30. The main problem with no financial-
focused lists of words like this one, is that tend to misclassify words when gauging tone in financial
applications. The main source of this problem comes from the misclassification of terms like cost,
tax or liability as negative words used in financial reports. Similarly, other words tend to be
classified instead as specific industry segments instead of terms with negative connotation.
Through an empirical research, Tim Loughran and Bill McDonald proved that at least three-
fourths of negative word counts detected in 10-K reports using the Harvard dictionary are actually
not negative in a financial context. In this research on Financial Textual Analysis, five list of words
focused in different categories according to their connotation were created: positive, uncertainty,
litigious, strong modal, and weak modal. The known as Bag of Words method was chose to carry
out this study. In this method, 10-K documents are parsed through the use of a vectorization
approach, this is, converting 10-K reports into vectors of words and word counts.
When each of these lists words where assessed as a mean to evaluate the sentiment over financial
texts, it was found significant relations between these set of words and file date returns, trading
volume, return volatility and standardized unexpected returns. The study took all 10-Ks and 10-
K405s reports from EDGAR between 1994 and 2008, firms from real estate, non-operating firms,
or asset-backet partnerships were exclude from the study, as well as firms not listed on the NYSE,
Amex or NASDAQ and also those firms whose 10-K reports did not include more than 2.000
words. The final sample consisted in 50.115 reports from 8.341 unique firms. TF-IDF weighting
scheme was then used over the multiple studies carried out over the mentioned samples as an
attempt to adjust impact across the entire collections of words.
During Loughran and McDonald’s research was demonstrated that, the usage of the five lists of
words over 10-K filing information are significant informative about trading volume, volatility,
and unexpected stock returns. The lists might be also helpful to link set of words to companies on
which accounting fraud allegations are brought, as well to link these set of words to firms where
weaknesses in their accounting controls have been subsequently discovered.
30 Weber, Robert P. Harvard General Inquirer. Harvard University (Link)
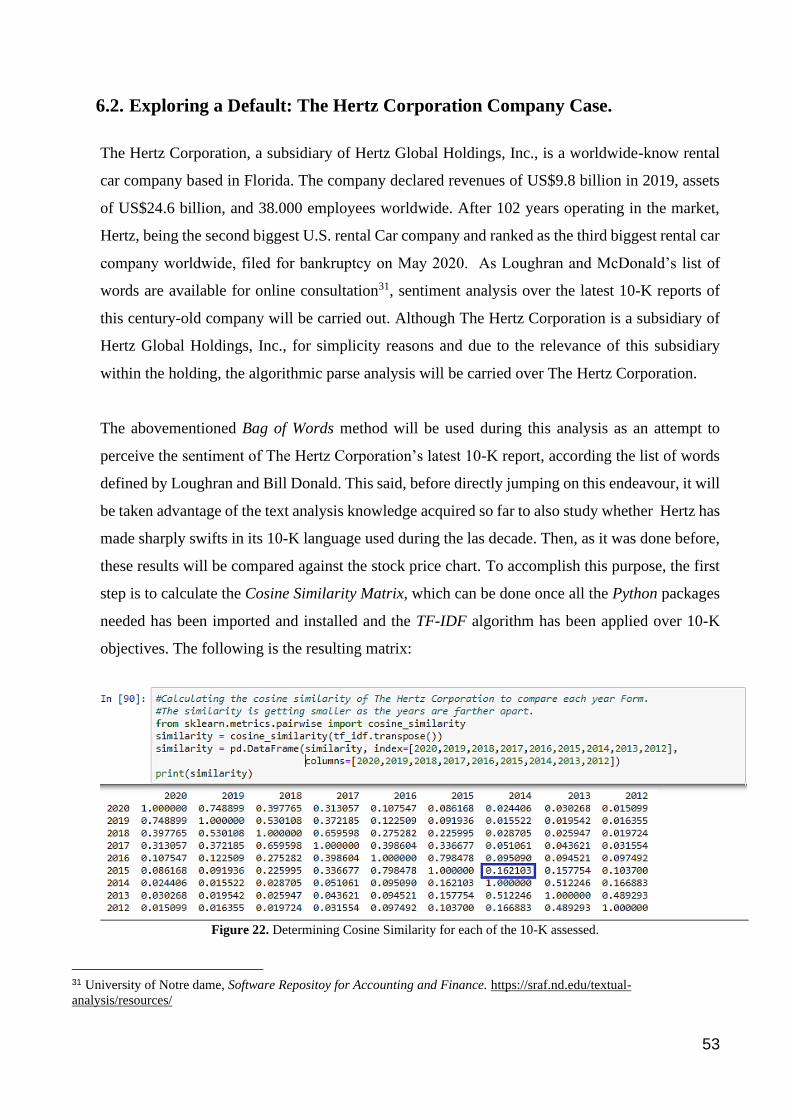
53
6.2. Exploring a Default: The Hertz Corporation Company Case.
The Hertz Corporation, a subsidiary of Hertz Global Holdings, Inc., is a worldwide-know rental
car company based in Florida. The company declared revenues of US$9.8 billion in 2019, assets
of US$24.6 billion, and 38.000 employees worldwide. After 102 years operating in the market,
Hertz, being the second biggest U.S. rental Car company and ranked as the third biggest rental car
company worldwide, filed for bankruptcy on May 2020. As Loughran and McDonald’s list of
words are available for online consultation31, sentiment analysis over the latest 10-K reports of
this century-old company will be carried out. Although The Hertz Corporation is a subsidiary of
Hertz Global Holdings, Inc., for simplicity reasons and due to the relevance of this subsidiary
within the holding, the algorithmic parse analysis will be carried over The Hertz Corporation.
The abovementioned Bag of Words method will be used during this analysis as an attempt to
perceive the sentiment of The Hertz Corporation’s latest 10-K report, according the list of words
defined by Loughran and Bill Donald. This said, before directly jumping on this endeavour, it will
be taken advantage of the text analysis knowledge acquired so far to also study whether Hertz has
made sharply swifts in its 10-K language used during the las decade. Then, as it was done before,
these results will be compared against the stock price chart. To accomplish this purpose, the first
step is to calculate the Cosine Similarity Matrix, which can be done once all the Python packages
needed has been imported and installed and the TF-IDF algorithm has been applied over 10-K
objectives. The following is the resulting matrix:
Figure 22. Determining Cosine Similarity for each of the 10-K assessed.
31 University of Notre dame, Software Repositoy for Accounting and Finance. https://sraf.nd.edu/textual-
analysis/resources/
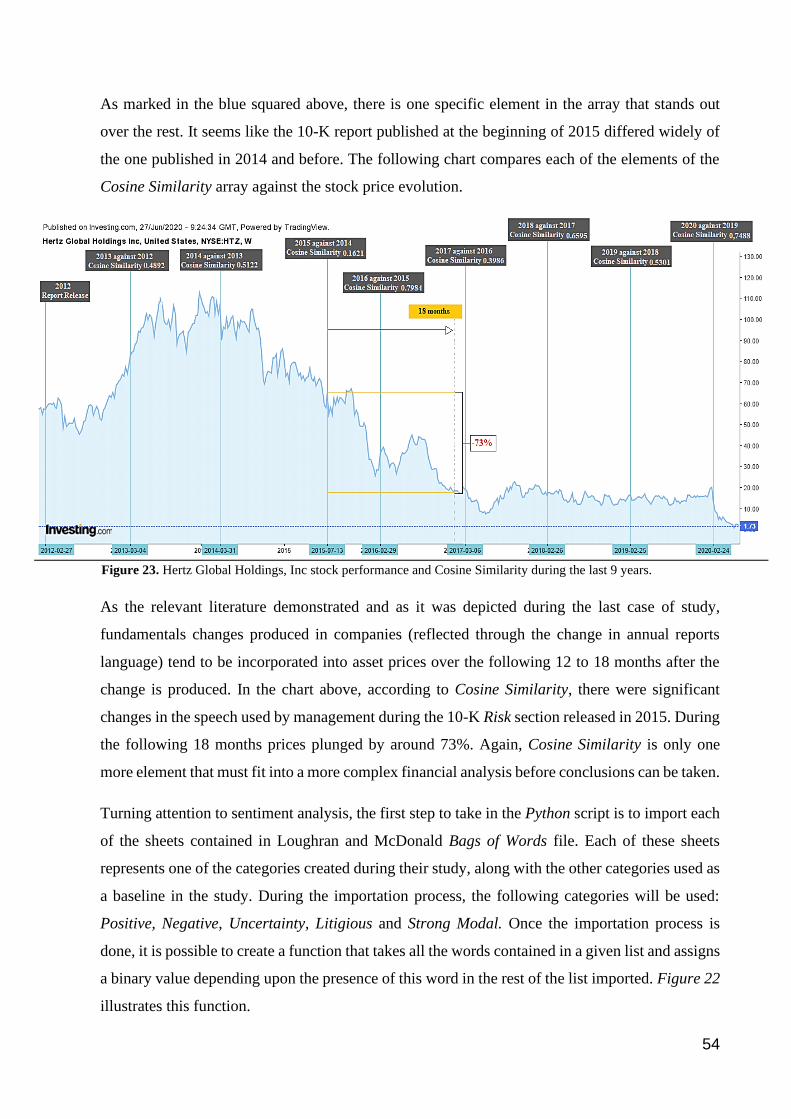
54
As marked in the blue squared above, there is one specific element in the array that stands out
over the rest. It seems like the 10-K report published at the beginning of 2015 differed widely of
the one published in 2014 and before. The following chart compares each of the elements of the
Cosine Similarity array against the stock price evolution.
Figure 23. Hertz Global Holdings, Inc stock performance and Cosine Similarity during the last 9 years.
As the relevant literature demonstrated and as it was depicted during the last case of study,
fundamentals changes produced in companies (reflected through the change in annual reports
language) tend to be incorporated into asset prices over the following 12 to 18 months after the
change is produced. In the chart above, according to Cosine Similarity, there were significant
changes in the speech used by management during the 10-K Risk section released in 2015. During
the following 18 months prices plunged by around 73%. Again, Cosine Similarity is only one
more element that must fit into a more complex financial analysis before conclusions can be taken.
Turning attention to sentiment analysis, the first step to take in the Python script is to import each
of the sheets contained in Loughran and McDonald Bags of Words file. Each of these sheets
represents one of the categories created during their study, along with the other categories used as
a baseline in the study. During the importation process, the following categories will be used:
Positive, Negative, Uncertainty, Litigious and Strong Modal. Once the importation process is
done, it is possible to create a function that takes all the words contained in a given list and assigns
a binary value depending upon the presence of this word in the rest of the list imported. Figure 22
illustrates this function.
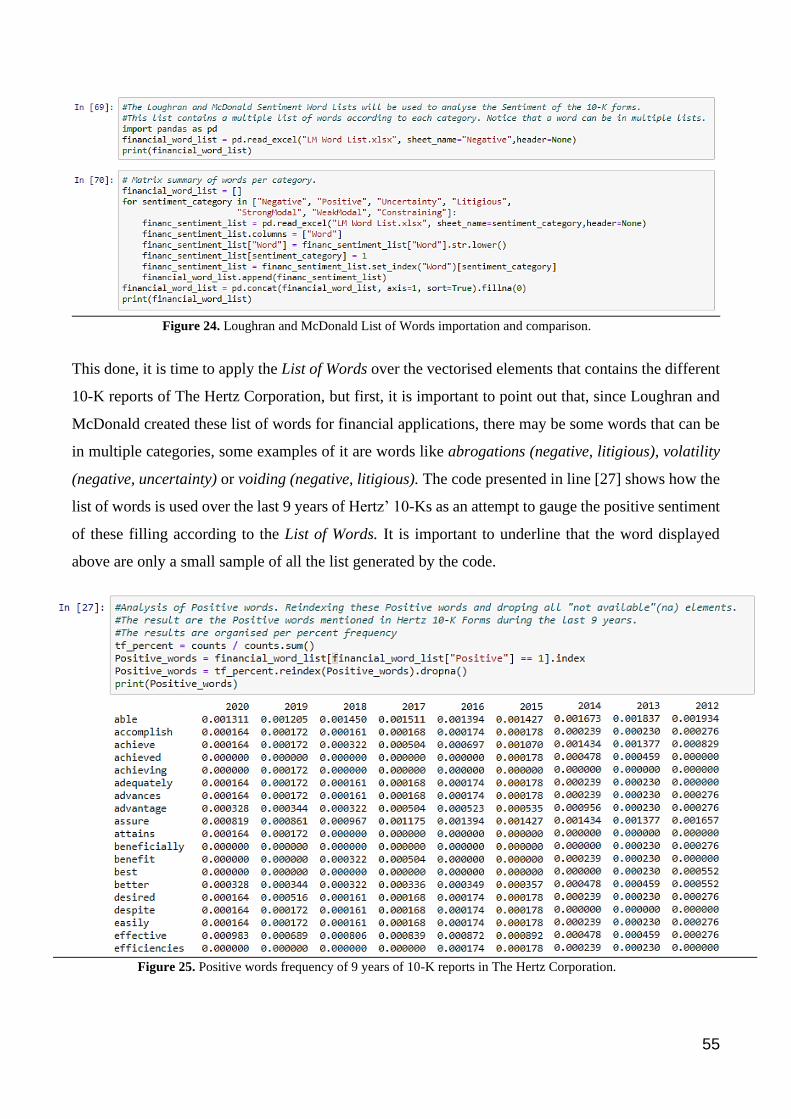
55
Figure 24. Loughran and McDonald List of Words importation and comparison.
This done, it is time to apply the List of Words over the vectorised elements that contains the different
10-K reports of The Hertz Corporation, but first, it is important to point out that, since Loughran and
McDonald created these list of words for financial applications, there may be some words that can be
in multiple categories, some examples of it are words like abrogations (negative, litigious), volatility
(negative, uncertainty) or voiding (negative, litigious). The code presented in line [27] shows how the
list of words is used over the last 9 years of Hertz’ 10-Ks as an attempt to gauge the positive sentiment
of these filling according to the List of Words. It is important to underline that the word displayed
above are only a small sample of all the list generated by the code.
Figure 25. Positive words frequency of 9 years of 10-K reports in The Hertz Corporation.
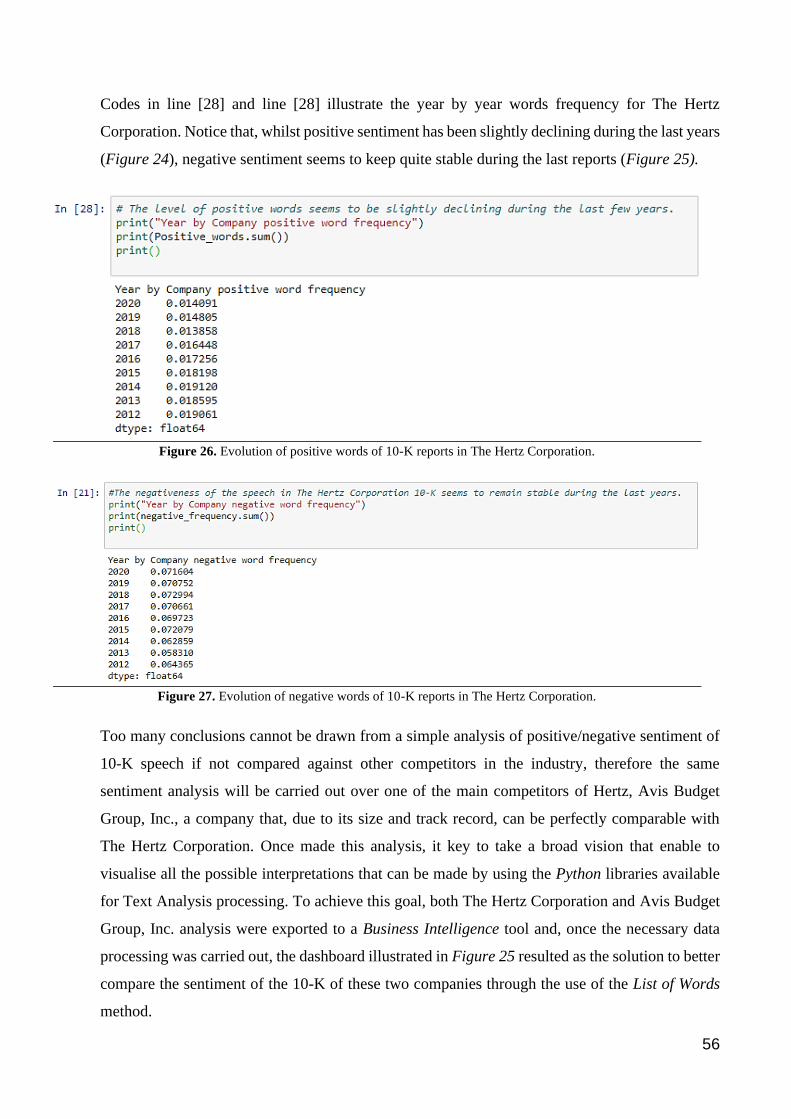
56
Codes in line [28] and line [28] illustrate the year by year words frequency for The Hertz
Corporation. Notice that, whilst positive sentiment has been slightly declining during the last years
(Figure 24), negative sentiment seems to keep quite stable during the last reports (Figure 25).
Figure 26. Evolution of positive words of 10-K reports in The Hertz Corporation.
Figure 27. Evolution of negative words of 10-K reports in The Hertz Corporation.
Too many conclusions cannot be drawn from a simple analysis of positive/negative sentiment of
10-K speech if not compared against other competitors in the industry, therefore the same
sentiment analysis will be carried out over one of the main competitors of Hertz, Avis Budget
Group, Inc., a company that, due to its size and track record, can be perfectly comparable with
The Hertz Corporation. Once made this analysis, it key to take a broad vision that enable to
visualise all the possible interpretations that can be made by using the Python libraries available
for Text Analysis processing. To achieve this goal, both The Hertz Corporation and Avis Budget
Group, Inc. analysis were exported to a Business Intelligence tool and, once the necessary data
processing was carried out, the dashboard illustrated in Figure 25 resulted as the solution to better
compare the sentiment of the 10-K of these two companies through the use of the List of Words
method.
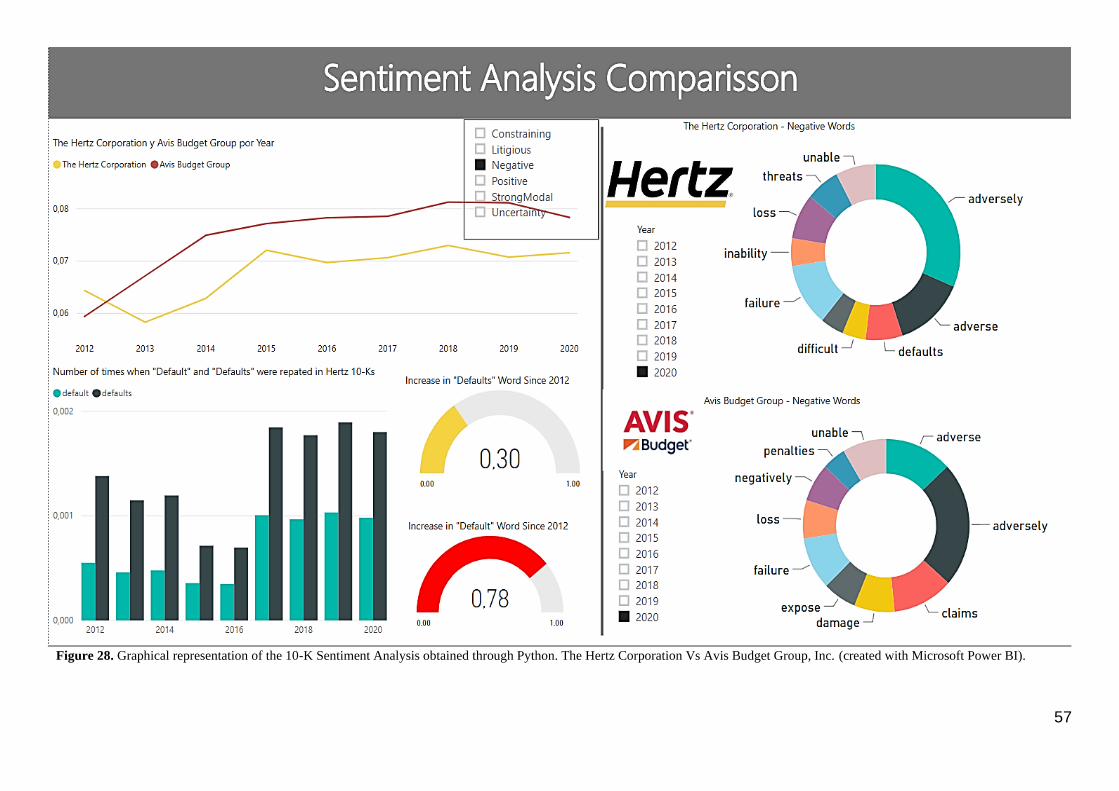
57
Figure 28. Graphical representation of the 10-K Sentiment Analysis obtained through Python. The Hertz Corporation Vs Avis Budget Group, Inc. (created with Microsoft Power BI).
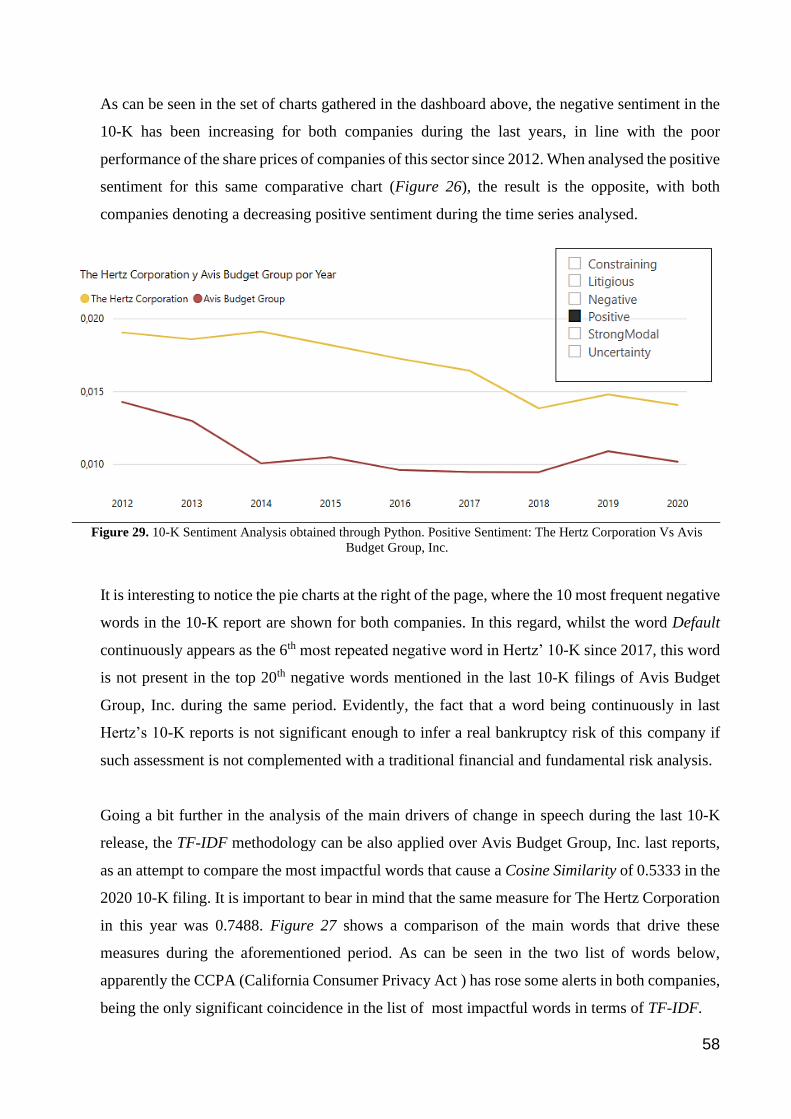
58
As can be seen in the set of charts gathered in the dashboard above, the negative sentiment in the
10-K has been increasing for both companies during the last years, in line with the poor
performance of the share prices of companies of this sector since 2012. When analysed the positive
sentiment for this same comparative chart (Figure 26), the result is the opposite, with both
companies denoting a decreasing positive sentiment during the time series analysed.
Figure 29. 10-K Sentiment Analysis obtained through Python. Positive Sentiment: The Hertz Corporation Vs Avis
Budget Group, Inc.
It is interesting to notice the pie charts at the right of the page, where the 10 most frequent negative
words in the 10-K report are shown for both companies. In this regard, whilst the word Default
continuously appears as the 6th most repeated negative word in Hertz’ 10-K since 2017, this word
is not present in the top 20th negative words mentioned in the last 10-K filings of Avis Budget
Group, Inc. during the same period. Evidently, the fact that a word being continuously in last
Hertz’s 10-K reports is not significant enough to infer a real bankruptcy risk of this company if
such assessment is not complemented with a traditional financial and fundamental risk analysis.
Going a bit further in the analysis of the main drivers of change in speech during the last 10-K
release, the TF-IDF methodology can be also applied over Avis Budget Group, Inc. last reports,
as an attempt to compare the most impactful words that cause a Cosine Similarity of 0.5333 in the
2020 10-K filing. It is important to bear in mind that the same measure for The Hertz Corporation
in this year was 0.7488. Figure 27 shows a comparison of the main words that drive these
measures during the aforementioned period. As can be seen in the two list of words below,
apparently the CCPA (California Consumer Privacy Act ) has rose some alerts in both companies,
being the only significant coincidence in the list of most impactful words in terms of TF-IDF.
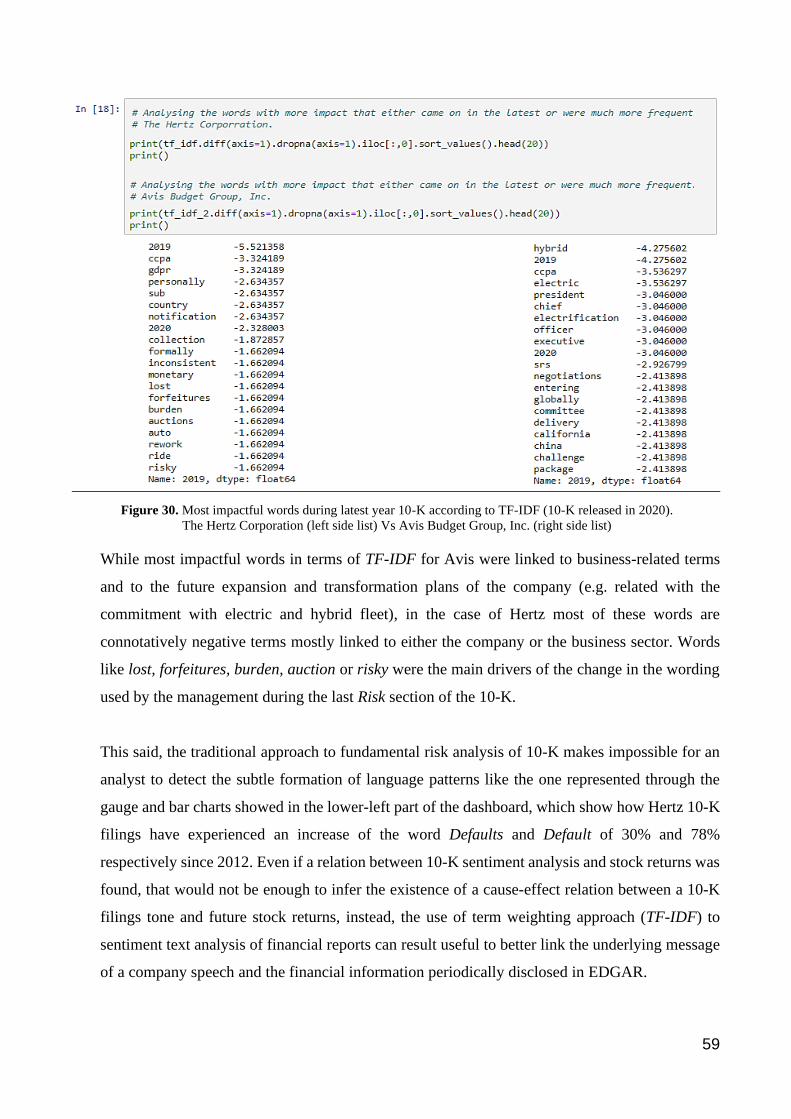
59
Figure 30. Most impactful words during latest year 10-K according to TF-IDF (10-K released in 2020).
The Hertz Corporation (left side list) Vs Avis Budget Group, Inc. (right side list)
While most impactful words in terms of TF-IDF for Avis were linked to business-related terms
and to the future expansion and transformation plans of the company (e.g. related with the
commitment with electric and hybrid fleet), in the case of Hertz most of these words are
connotatively negative terms mostly linked to either the company or the business sector. Words
like lost, forfeitures, burden, auction or risky were the main drivers of the change in the wording
used by the management during the last Risk section of the 10-K.
This said, the traditional approach to fundamental risk analysis of 10-K makes impossible for an
analyst to detect the subtle formation of language patterns like the one represented through the
gauge and bar charts showed in the lower-left part of the dashboard, which show how Hertz 10-K
filings have experienced an increase of the word Defaults and Default of 30% and 78%
respectively since 2012. Even if a relation between 10-K sentiment analysis and stock returns was
found, that would not be enough to infer the existence of a cause-effect relation between a 10-K
filings tone and future stock returns, instead, the use of term weighting approach (TF-IDF) to
sentiment text analysis of financial reports can result useful to better link the underlying message
of a company speech and the financial information periodically disclosed in EDGAR.
60
6.3. Case Study Conclusions.
In general, what was examined during this case study is aligned with the aforementioned research
conclusions. Since the formation of prices in finance is due to a multiplicity of factors, it would be
very daring to make causal links between a company’s 10-K tone and future stock returns,
however, evolution of sentiment through 10-Ks can contribute to the financial analyst ability to
better read other sources of financial information during the decision-taking process. Research in
this regard have demonstrated a significant relation between the negative sentiment and the
evolution of stock returns in trading sessions around announcement date. Significant correlation
patterns between trading volume, unexpected earnings, volatility in stock prices and even the
capacity of detecting accounting frauds have been also proved by research made in this field.
Subtle changes in 10-K language or the emergence of sentiment patterns can only be detected by
the use of the sort of data science systems described during this study case, however, as stated
earlier, textual analysis does not provided enough information to clearly predict stock returns. The
case analysed during this chapter described the already bankrupted Hertz Corporation, subsidiary
of Hertz Global Holdings, Inc. Although some patterns denoting a high level of negativity were
detected in this company and its main competitor, there is not enough evidence to conclude that
bankruptcy could have been foreseen by merely using sentiment analysis tools. In the same way,
although the main changes in the speech made by the management during the last 10-K were driven
by words denoting worry, restlessness and uncertainty, sentiment analysis by itself is not the
flawless predictor of future stock returns.
Paraphrasing some of the closing words made during one of the research studied - Roll (1988), the
results found here do not mean that textual analysis will resolve our profession’s modest ability to
explain stock returns, instead, it can be certainly asserted that sentiment analysis of 10-K filings
can be very useful to perceive sentiment trends in business sectors, to better understand the way in
which stock prices move as more information is disclosed and, as proved during this study case, to
better recognise the main concerns of the management about the business in which a company
operates. As recently said by a quantitative Portfolio Manager and researcher specialised in
Machine Learning, every data set - especially alternative data - is a small part potentially of a
current truth32.
32 Guida, Tony. Big Data and Machine Learning in Quantitative Investment. 2019.
61
7. Conclusions.
During last years, Alternative Data Sets have emerged as one the top financial trends. During 2020,
Financial services companies are expected to spend US$1.7 billion on this industry, the highest figure
since the emergence of these sort of data. Yet, many of investment professionals keep unaware of this
new trend. In this project, several Data Science applications in Alternative Data Sets were presented.
Given the countless applications that these sort of data are currently providing to the investment
industry and due to the wide variety of Alternative Data Sets, this thesis focused exclusively in only
two data typologies: Consumption-Corporate Data and Textual Analysis of Financial Reports.
The research made over the Consumption and Corporate Data intended to shed light upon a little-
known but important subject. It was proved that not all the data sets included under this category are
liable to be used by all investment management firms, being the small investment firms in clear
disadvantage in front of investment institutions with greater liquidity. Nonetheless, when it comes to
Consumption Data directly mined from a company website, this difference is liable to shrink since
there is a greater degree of flexibility and in-house strategies can be crafted.
Study cases about textual analysis proved that, although several inferences can be made from applying
data science techniques over financial reports and, despite the vast body of relevant research available,
these methods are not enough to prove the existence of direct correlations between the change in speech
used by management or the sentiment of the words, and the future returns of stocks. Even though, data
science methodologies presented can certainly help investment management firms to develop robust
methods that complement their traditional financial approach, allowing them to better comprehend and
interpret the underlying message beyond the literal reading of management speech in each 10-K
released in EDGAR.
Some quantitative financial analyst have found evidence that suggest that efficient-market hypothesis
is outstanding in the Alternative Data Sets segment, as data sets are being uniformly used in the
investment industry, thereby, excess of returns vanish quickly as more firms turn their attention
towards this trend. However, exponential development of technology foreseen for this decade will
keep opening doors to new and more sophisticated investment techniques, what will require a financial
industry capable of constantly reinventing itself so as not to lose its way through alpha.
62
References.
Rothbard, Murray: Making Economic Sense, 2nd edition. (Ludwig von Mises Institute, 2006,
ISBN 9781610165907), p. 426
Mayer-Schönberger, Viktor & Cukier, Kenneth: Big Data: A Revolution That Will Transform How We
Live, Work and Think, 1st edition. (Houghton Mifflin Harcourt, 2013, ISBN 9788415832102), p. 33
Mayer-Schönberger, Viktor & Cukier, Kenneth: Big Data: A Revolution That Will Transform How We
Live, Work and Think, 1st edition. (Houghton Mifflin Harcourt, 2013, ISBN 9788415832102), p. 49
Doshi, Sudeep – Kwek, Ju-Hon & Lai, Josep: Advanced Analytics in Asset Management: Beyond the Buzz.
(McKinsey & Company – Financial Services, 2019), p. 3
De Boe, Benjamin: Use Cases for Unstructured Data. (InterSystems White Paper, InterSystems
Corporation), p. 2
Alternative Data focused company Eagle Alpha has identified up to 24 categories of alternative data sets
that can be potentially used in the asset management industry. Alternative Data: Use Cases. (Eagle Alpha,
6th edition), p. 4
Escardó, Martín: Lectures Notes for Data Structures and Algorithms. (University of Birmingham, Shool
of Computer Science, 2019), p. 5
V. Mayer-Schönberger and K. Cukier. Big Data, a revolution that will transform how we live, work, and
think, 2013. Pag. 49
Higson, Philip – Müller, Marius. Alpha from Alt Data, 2017. Pag 2.
Alternative Data: Use Cases. (Eagle Alpha, 6th edition), Pag. 15
Froot, Kenneth – Kang, Namho – Ozik, Gideon – Sadka, Ronnie. What do Measures of real-time corporate
sales tell us about earnings surprises and post-announcement returns? (Harvard Business School,
University of Connecticut, EDHEC Business School, Carroll School of Management).
Froot, Kenneth – Kang, Namho – Ozik, Gideon – Sadka, Ronnie. Predicting Performance Using Consumer
Big Data. (Harvard Business School, University of Connecticut, EDHEC Business School, Carroll School
of Management).
Kolanovis, Marco PhD – Krishnamachari, Rajesh T, PhD. Big Data and AI Strategies, Machine Learning
and Alternative Data Approach to Investing. J.P.Morgan, 2017.
Weiss, Sholom M. – Zhang, Tong – Indurkhya, Nitin. Fundamentals of Predictive Text Mining. Second
Edition. 2015, Pag. 1.
Li, Feng. Textual Analysis of Corporate Disclosures: A Survey of the Literature. 2010. Journal of
Accounting Literature. University of Michigan.
Cohen, Lauren – Malloy, Christopher – Nguyen, Quoc. Lazy Prices. 2018. Harvard Business School and
University of Illinois.
Higson, Philip – Müller, Marius. Alpha from Alt Data, 2017. (https://carlyon.ch/wp-
content/uploads/2019/12/Alpha-from-Alternative-Data.pdf)
Hailang, Chen – Prabuddha, De – Hu, Jeffrey – Byoung-Hyoun, Hwang. Wisdom of Crowds: The Value of
Stock Opinions Transmitted Through Social Media.

63
Engelberg, Joseph – Parsons, Christopher A. The Causal Impact of Media in Financial Markets. October,
2019.
Media and the Term-Structure of Unexpected Option-Implied Volatility. August, 2018.
Weiss, Sholom M. – Zhang, Tong – Indurkhya, Nitin. Fundamentals of Predictive Text Mining. Second
Edition. 2015, Pag. 156.
Mayew, William J. – Venkatachalam, Mohan. The Power of Voice: Managerial Affective States and Future
Firm Performance. 2009.
Guida, Tony. Big Data and Machine Learning in Quantitative Investment. 2019.
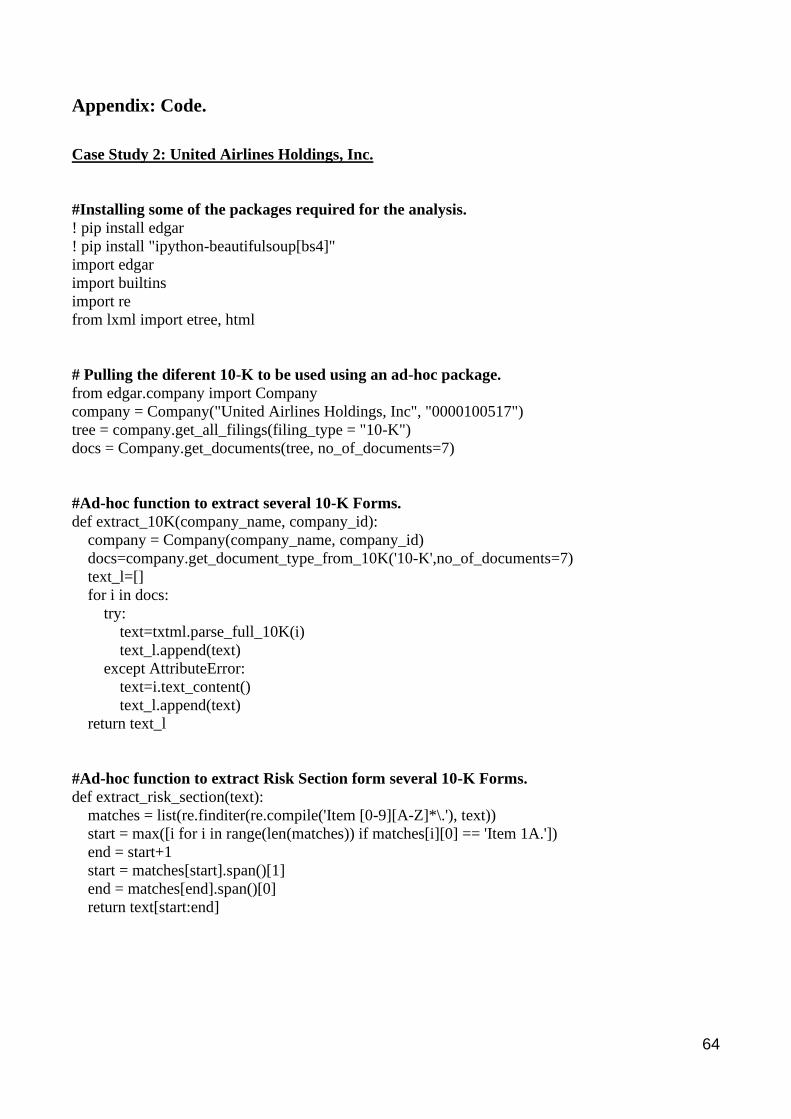
64
Appendix: Code.
Case Study 2: United Airlines Holdings, Inc.
#Installing some of the packages required for the analysis.
! pip install edgar
! pip install "ipython-beautifulsoup[bs4]"
import edgar
import builtins
import re
from lxml import etree, html
# Pulling the diferent 10-K to be used using an ad-hoc package.
from edgar.company import Company
company = Company("United Airlines Holdings, Inc", "0000100517")
tree = company.get_all_filings(filing_type = "10-K")
docs = Company.get_documents(tree, no_of_documents=7)
#Ad-hoc function to extract several 10-K Forms.
def extract_10K(company_name, company_id):
company = Company(company_name, company_id)
docs=company.get_document_type_from_10K('10-K',no_of_documents=7)
text_l=[]
for i in docs:
try:
text=txtml.parse_full_10K(i)
text_l.append(text)
except AttributeError:
text=i.text_content()
text_l.append(text)
return text_l
#Ad-hoc function to extract Risk Section form several 10-K Forms.
def extract_risk_section(text):
matches = list(re.finditer(re.compile('Item [0-9][A-Z]*\.'), text))
start = max([i for i in range(len(matches)) if matches[i][0] == 'Item 1A.'])
end = start+1
start = matches[start].span()[1]
end = matches[end].span()[0]
return text[start:end]
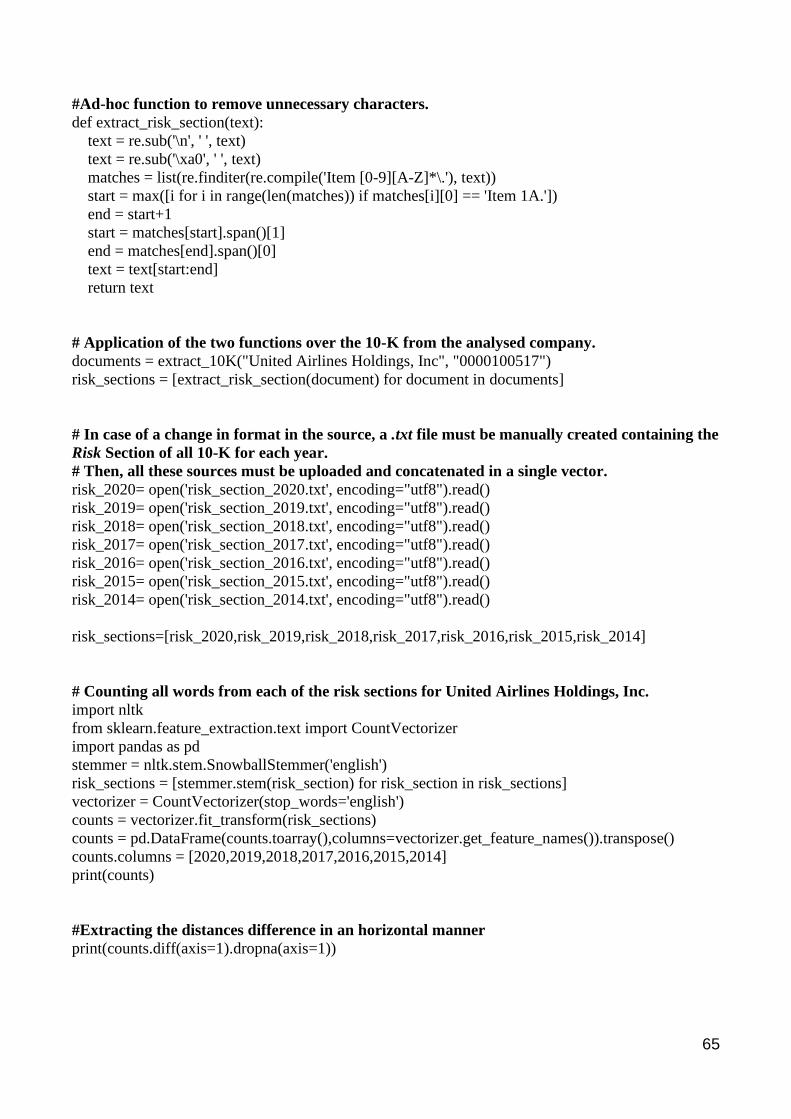
65
#Ad-hoc function to remove unnecessary characters.
def extract_risk_section(text):
text = re.sub('\n', ' ', text)
text = re.sub('\xa0', ' ', text)
matches = list(re.finditer(re.compile('Item [0-9][A-Z]*\.'), text))
start = max([i for i in range(len(matches)) if matches[i][0] == 'Item 1A.'])
end = start+1
start = matches[start].span()[1]
end = matches[end].span()[0]
text = text[start:end]
return text
# Application of the two functions over the 10-K from the analysed company.
documents = extract_10K("United Airlines Holdings, Inc", "0000100517")
risk_sections = [extract_risk_section(document) for document in documents]
# In case of a change in format in the source, a .txt file must be manually created containing the
Risk Section of all 10-K for each year.
# Then, all these sources must be uploaded and concatenated in a single vector.
risk_2020= open('risk_section_2020.txt', encoding="utf8").read()
risk_2019= open('risk_section_2019.txt', encoding="utf8").read()
risk_2018= open('risk_section_2018.txt', encoding="utf8").read()
risk_2017= open('risk_section_2017.txt', encoding="utf8").read()
risk_2016= open('risk_section_2016.txt', encoding="utf8").read()
risk_2015= open('risk_section_2015.txt', encoding="utf8").read()
risk_2014= open('risk_section_2014.txt', encoding="utf8").read()
risk_sections=[risk_2020,risk_2019,risk_2018,risk_2017,risk_2016,risk_2015,risk_2014]
# Counting all words from each of the risk sections for United Airlines Holdings, Inc.
import nltk
from sklearn.feature_extraction.text import CountVectorizer
import pandas as pd
stemmer = nltk.stem.SnowballStemmer('english')
risk_sections = [stemmer.stem(risk_section) for risk_section in risk_sections]
vectorizer = CountVectorizer(stop_words='english')
counts = vectorizer.fit_transform(risk_sections)
counts = pd.DataFrame(counts.toarray(),columns=vectorizer.get_feature_names()).transpose()
counts.columns = [2020,2019,2018,2017,2016,2015,2014]
print(counts)
#Extracting the distances difference in an horizontal manner
print(counts.diff(axis=1).dropna(axis=1))
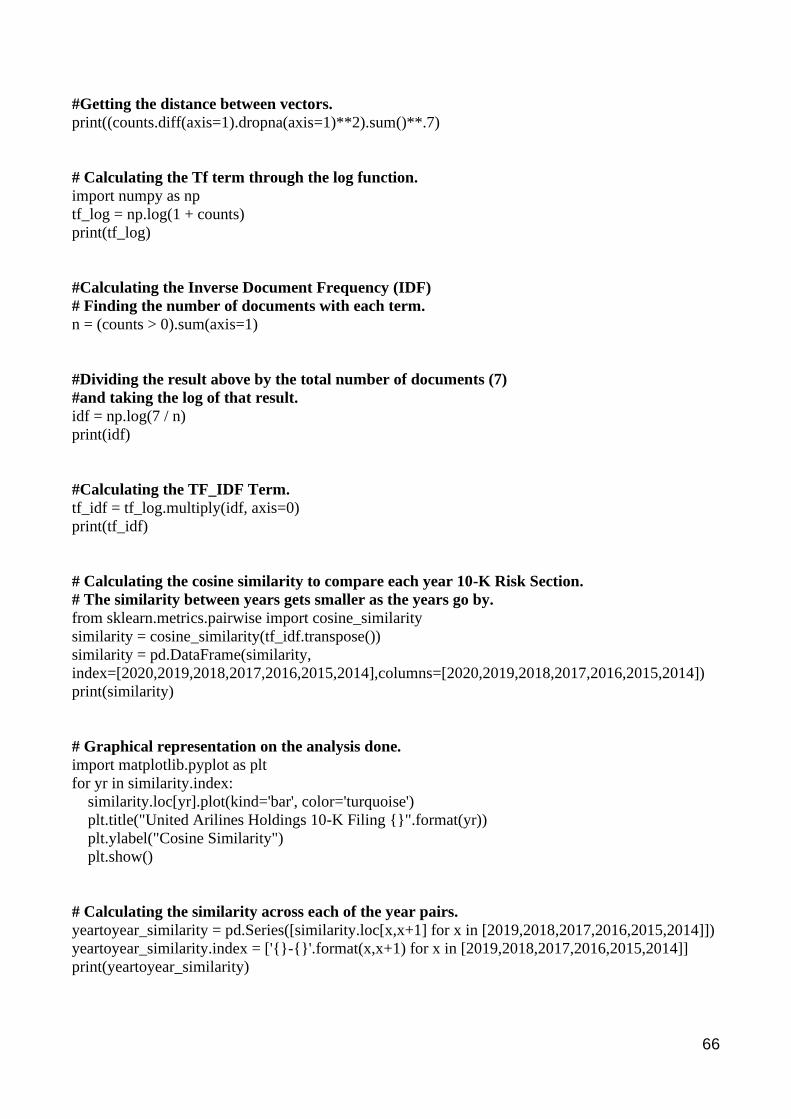
66
#Getting the distance between vectors.
print((counts.diff(axis=1).dropna(axis=1)**2).sum()**.7)
# Calculating the Tf term through the log function.
import numpy as np
tf_log = np.log(1 + counts)
print(tf_log)
#Calculating the Inverse Document Frequency (IDF)
# Finding the number of documents with each term.
n = (counts > 0).sum(axis=1)
#Dividing the result above by the total number of documents (7)
#and taking the log of that result.
idf = np.log(7 / n)
print(idf)
#Calculating the TF_IDF Term.
tf_idf = tf_log.multiply(idf, axis=0)
print(tf_idf)
# Calculating the cosine similarity to compare each year 10-K Risk Section.
# The similarity between years gets smaller as the years go by.
from sklearn.metrics.pairwise import cosine_similarity
similarity = cosine_similarity(tf_idf.transpose())
similarity = pd.DataFrame(similarity,
index=[2020,2019,2018,2017,2016,2015,2014],columns=[2020,2019,2018,2017,2016,2015,2014])
print(similarity)
# Graphical representation on the analysis done.
import matplotlib.pyplot as plt
for yr in similarity.index:
similarity.loc[yr].plot(kind='bar', color='turquoise')
plt.title("United Arilines Holdings 10-K Filing {}".format(yr))
plt.ylabel("Cosine Similarity")
plt.show()
# Calculating the similarity across each of the year pairs.
yeartoyear_similarity = pd.Series([similarity.loc[x,x+1] for x in [2019,2018,2017,2016,2015,2014]])
yeartoyear_similarity.index = ['{}-{}'.format(x,x+1) for x in [2019,2018,2017,2016,2015,2014]]
print(yeartoyear_similarity)
67
# Analysing the words with more impact that either came on in the latest or were much more
frequent.
print(tf_idf.diff(axis=1).dropna(axis=1).iloc[:,0].sort_values().head(20))
print()
# Analysing the words with more impact that either came off in the earliest or were much less
frequent.
print()
print(tf_idf.diff(axis=1).dropna(axis=1).iloc[:,0].sort_values(ascending=False).head(20))
# Analysing where these impactful words that come on during these years came from.
print(counts.loc['max'])
print()
print(counts.loc['covid'])
print()
print(counts.loc['china'])
print()
print(counts.loc['foreclosure'])
# Analysing where these impactful words that come off during these years came from.
print(counts.loc['borrowings'])
print()
print(counts.loc['prohibit'])
print()
print(counts.loc['reforms'])
print()
print(counts.loc['asian'])
68
Case 3: The Hertz Corporation.
In order to properly carry out this project, it is first needed to apply the instructions of Case 2 to the
data sets containing the 10-K Risk sections of The Hertz Corporation.
# The Loughran and McDonald Sentiment Word Lists will be used to analyse the Sentiment of
the 10-K Risk Sections.
import pandas as pd
financial_word_list = pd.read_excel("LM Word List.xlsx", sheet_name="Negative",header=None)
print(financial_word_list)
# Matrix summary of words per category.
financial_word_list = []
for sentiment_category in ["Negative", "Positive", "Uncertainty", "Litigious",
"StrongModal", "WeakModal", "Constraining"]:
financ_sentiment_list = pd.read_excel("LM Word List.xlsx",
sheet_name=sentiment_category,header=None)
financ_sentiment_list.columns = ["Word"]
financ_sentiment_list["Word"] = financ_sentiment_list["Word"].str.lower()
financ_sentiment_list[sentiment_category] = 1
financ_sentiment_list = financ_sentiment_list.set_index("Word")[sentiment_category]
financial_word_list.append(financ_sentiment_list)
financial_word_list = pd.concat(financial_word_list, axis=1, sort=True).fillna(0)
print(financial_word_list)
# Analysing the negative words, reindexing these negative words and droping all "not
available"(na) elements.
# The result are the negative words mentioned in The Hertz Corporation 10-K Risk Section
during the last 9 years.
tf_percent = counts / counts.sum()
negative_words = financial_word_list[financial_word_list["Negative"] == 1].index
negative_frequency = tf_percent.reindex(negative_words).dropna()
print(negative_frequency)
# The negativeness of the speech in The Hertz Corporation 10-K seems to remain stable during
the last years.
# However, it has slightly increased during the last five exercises.
print("Year by Company negative word frequency")
print(negative_frequency.sum())
print()
# Analyisis of the most common negative words in Hertz' latest risk section
negative_frequency.sort_values(by=(2020), ascending=False)
69
# Analysis of Uncertainty words, reindexing these negative words and droping all "not
available"(na) elements.
# The result are the words expressing uncertainty and mentioned in Hertz Corporation 10-K
Forms during the last 9 years.
tf_percent = counts / counts.sum()
uncertainty_words = financial_word_list[financial_word_list["Uncertainty"] == 1].index
uncertainty_words = tf_percent.reindex(uncertainty_words).dropna()
print(uncertainty_words)
# The level of uncertainty terms using by Hertz seems to keep stable in the last few years.
print("Year by Company uncertainty word frequency")
print(uncertainty_words.sum())
print()
# Analysis of Positive words. Reindexing these Positive words and droping all "not
available"(na) elements.
# The result are the Positive words mentioned in Hertz 10-K Risk Section during the last 9
years.
tf_percent = counts / counts.sum()
Positive_words = financial_word_list[financial_word_list["Positive"] == 1].index
Positive_words = tf_percent.reindex(Positive_words).dropna()
print(Positive_words)
# The level of positive words seems to be slightly declining during the last few years.
print("Year by Company positive word frequency")
print(Positive_words.sum())
print()
# Function to extract all sentiments for all list of words analysed in the script.
l = []
for financial_word_typology in financial_word_list.columns:
financial_word_typology_list = financial_word_list[financial_word_list[financial_word_typology]
== 1].index
financial_word_typology_frequency =
tf_percent.reindex(financial_word_typology_list).dropna().sum()
l.append(financial_word_typology_frequency)
financial_word_typology_frequency = pd.concat(l, axis=1)
financial_word_typology_frequency.columns = financial_word_list.columns
print(financial_word_typology_frequency)

70
Copyright © 2022 FDOKUMEN