Science case for 1 mas spectro-imagining in the near-infrared

NOAA – ISRO Joint Science Projects on Earth Observation System Science, Technology, and Applications for Societal
Benefits
A. Powell1, V. Jayarman2, S. Kondragunta1, F. Kogan1, R. Kuligowski1, E. Maturi1,
1NOAA/NESDIS Center for Satellite Applications and Research, Camp Springs, Maryland, U.S.A.
2ISRO, Bangalore, India
ABSTRACT
India and the United States of America (U.S.A.) held a joint conference from June 21-25, 2004 in Bangalore, India to strengthen and expand cooperation in the area of space science, applications, and commerce. Following the recommendations in the joint vision statement released at the end of the conference, the National Oceanic and Atmospheric Administration (NOAA) and the Indian Space and Reconnaissance Organization (ISRO) initiated several joint science projects in the area of satellite product development and applications. This is an extraordinary step since it concentrates on improvements in the data and scientific exchange between India and the United States, consistent with a Memorandum of Understanding (MOU) signed by the two nations in 1997. With the relationship between both countries strengthening with President Bush’s visit in early 2006 and new program announcements between the two countries, there is a renewed commitment at ISRO and other Indian agencies and at NOAA in the U.S. to fulfill the agreements reached on the joint science projects. The collaboration is underway with several science projects that started in 2005 providing initial results.
NOAA and ISRO agreed that the projects must promote scientific understanding of the satellite data and lead to a satellite-based decision support systems for disaster and public health warnings. The projects target the following areas:
• Supporting a drought monitoring system for India • Improving precipitation estimates over India from Kalpana-1 • Increasing aerosol optical depth measurements and products over India • Developing early indicators of malaria and other vector borne diseases via satellite monitoring of
environmental conditions and linking them to predictive models • Monitoring sea surface temperature (SST) from INSAT-3D to support improved forecasting of
regional storms, monsoon onset and cyclones The research collaborations and results from these projects will be presented and discussed in the
context of India-US cooperation and the Global Earth Observation System of Systems (GEOSS) concept.
1. INTRODUCTION
The Memorandum of Understanding (MOU) between the U.S. and India, originally signed in 1997
and renewed in 2002, calls for joint science projects in atmospheric sciences in addition to exchange of satellite data. As signatories of the MOU, the National Aeronautics and Space Administration (NASA), National Oceanic and Atmospheric Administration (NOAA), India Space Research Organization (ISRO) under the Department of Space, and India Meteorological Department (IMD) under the Department of Science and Technology agreed to collaborate on joint science projects with mutual benefits to both
GEOSS and Next-Generation Sensors and Missions,edited by Stephen A. Mango, Ranganath R. Navalgund, Yoshifumi Yasuoka,
Proc. of SPIE Vol. 6407, 640704, (2006) · 0277-786X/06/$15 · doi: 10.1117/12.694020
Proc. of SPIE Vol. 6407 640704-1
Downloaded From: http://proceedings.spiedigitallibrary.org/ on 12/08/2014 Terms of Use: http://spiedl.org/terms
nations. This was further expanded and strengthened at the 2004 meeting in Bangalore, India by the release of a joint vision statement recommending science projects in the area of satellite product development and environmental applications. In addition to the activities related to the MOU, India has been supporting the development of the U.S.–led Global Earth Observing System of Systems (GEOSS) which might lead to forecasting winter weather months in advance, predict where the next outbreak of malaria is likely to hit, and effectively forecast climate, drought, air and water quality.
This paper describes the NOAA-initiated joint projects, which are expected to enhance the role of weather satellites in GEOSS activities. The U.S. and India have been operating weather satellites for several decades now. Scientific advancements in sensors and algorithms have allowed the possibility of using operational weather satellites for various environmental applications such as monitoring and forecasting droughts, rainfall, disease outbreaks, and air quality. NOAA has agreed to share its knowledge and experience of developing scientific algorithms for meteorological and environmental products with its Indian counterparts. India’s current operational geostationary weather satellites include Kalpana-1 and INSAT-3A. India is preparing for the launch of INSAT-3D with sensors similar to the U.S. GOES Imager and Sounder. The ongoing India-U.S. joint projects described below involve the development and implementation of algorithms for deriving products from these three satellite sensors.
2. JOINT SCIENCE PROJECTS
2.1. Evaluating and improving satellite-based precipitation estimates over India
The objective of this project is to evaluate the performance of the NESDIS Hydro-Estimator (HE) satellite rainfall estimation algorithm over India and to determine if modifications to the HE algorithm would improve its performance over India, particularly for rainfall associated with monsoon circulations. The HE is currently run operationally over the continental United States (CONUS) using the GOES infrared (10.7-µm) band, but is also produced in real time on an experimental basis for the entire globe between 60ºN and 60ºS using data from the Japan Meteorological Agency’s Multi-functional Transport Satellite (MTSAT) (western Pacific and East Asia), and the EUMETSAT Meteosat-5 (central Asia, including India) and Meteosat-8 (Europe and Africa) satellites. However, since the algorithm was originally developed and calibrated for convective systems over the continental United States, it has yet to be determined how well or how poorly this particular calibration is suited for most other parts of the world.
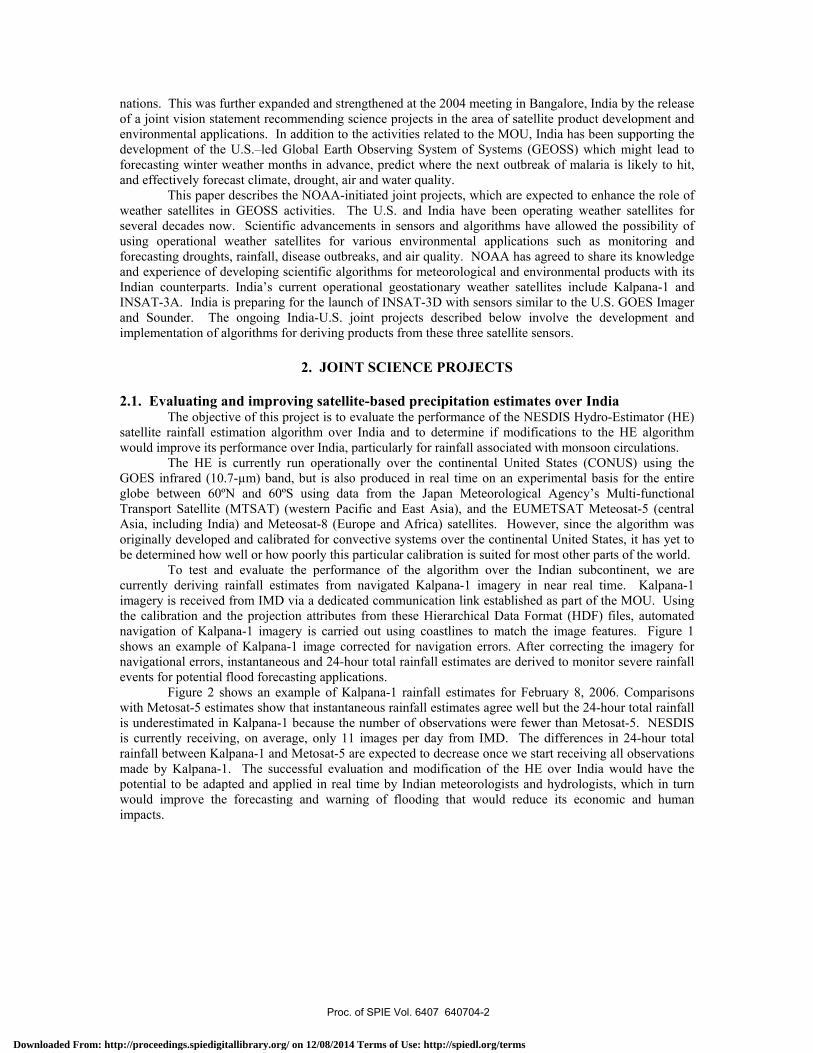
To test and evaluate the performance of the algorithm over the Indian subcontinent, we are currently deriving rainfall estimates from navigated Kalpana-1 imagery in near real time. Kalpana-1 imagery is received from IMD via a dedicated communication link established as part of the MOU. Using the calibration and the projection attributes from these Hierarchical Data Format (HDF) files, automated navigation of Kalpana-1 imagery is carried out using coastlines to match the image features. Figure 1 shows an example of Kalpana-1 image corrected for navigation errors. After correcting the imagery for navigational errors, instantaneous and 24-hour total rainfall estimates are derived to monitor severe rainfall events for potential flood forecasting applications.
Figure 2 shows an example of Kalpana-1 rainfall estimates for February 8, 2006. Comparisons with Metosat-5 estimates show that instantaneous rainfall estimates agree well but the 24-hour total rainfall is underestimated in Kalpana-1 because the number of observations were fewer than Metosat-5. NESDIS is currently receiving, on average, only 11 images per day from IMD. The differences in 24-hour total rainfall between Kalpana-1 and Metosat-5 are expected to decrease once we start receiving all observations made by Kalpana-1. The successful evaluation and modification of the HE over India would have the potential to be adapted and applied in real time by Indian meteorologists and hydrologists, which in turn would improve the forecasting and warning of flooding that would reduce its economic and human impacts.
Proc. of SPIE Vol. 6407 640704-2
Downloaded From: http://proceedings.spiedigitallibrary.org/ on 12/08/2014 Terms of Use: http://spiedl.org/terms

.4
4
PRIM RR ER MM/HR 730Z
flDU2 -R
'::;r.- —
Figure 1: An example image from January 12, 2006 showing Kalpana-1 navigation. Coastline match over Indian sub-continent is better than 2 visible pixels while in the outer parts of the image, offsets are greater than 10 visible pixels.
Figure 2: Instantaneous (left column) and 24-hour total (right column) rainfall estimates for February 8, 2006. Top panels are from Kalpana-1 and bottom panels are from Metosat-5. 2.1.1. Societal benefits
Observations of the location, intensity, duration, and spatial coverage of rainfall are critical for applications ranging from flash flood forecasting to water resources management. Presently existing networks of rain gauge and radar have significant value in providing this information, but observations still
Proc. of SPIE Vol. 6407 640704-3
Downloaded From: http://proceedings.spiedigitallibrary.org/ on 12/08/2014 Terms of Use: http://spiedl.org/terms

IbdO.1 VZA1 5 ssi IbdO.1 VZA3O040[ 0ZAl5 040[
SZA300.35 ___5ZA45 0.35
— 51A00
0240ZA75 020
I 025
020 020
MI 0ptITI,isk, MI OptFsO Tb
$35ib bIbbdO.1 VZA45 $35ib bIbbdO.1 VZA6O040[ 040[0.35 03
0.20 020
10.25 1025
020 ..._::T::;... 020 /
M,bbI 0ptITbisk, M,bbI OptFsO Tb
remain scarce over mountainous regions, oceans, and other areas where it is difficult to maintain ground-based instrumentation. Satellite-based estimates of rainfall can fill in these gaps by providing continuous spatial coverage in a timely fashion, which in turn can lead to improved detection and forecasting of heavy rainfall and flooding, as well as improved monitoring of the availability of water that originates in remote areas. 2.2. Aerosol retrievals from geostationary satellite sensors for air quality applications
The objective of this project is to develop an aerosol optical depth product from India’s geostationary satellites (INSAT-3A and INSAT-3D) and to collect and compile ground observations of aerosol optical depth (e.g., AERONET stations) over the Indian subcontinent for validation studies.
The algorithm to derive aerosol optical depth from INSAT-3A follows the heritage of Advanced Very High Resolution Radiometer (AVHRR) which uses pre-calculated look-up tables (LUTs) as a function of viewing angle, solar zenith angle, surface reflectance, and aerosol optical depths at 0.63 µm. LUTs were created using the INSAT-3A spectral response functions provided by ISRO and a 6S (Second Successive Single Scattering of Satellite Signal) radiative transfer model (Figure 3). The 6S model assumes an aerosol model (refractive index, size distribution, and vertical profile) and climatologies of ozone and water vapor profiles. In future, the 1.61 µm channel will be used to improve the assumptions of aerosol model by using the ratio of radiance measurements at 0.63 and 1.61 µm to determine the angstrom coefficient (estimate of size distribution). One particular difficulty is the determination of surface reflectance and cloud screening. The NOAA/NESDIS GOES aerosol algorithm approach, wherein we use clear-sky composite using the 2nd darkest pixel to determine surface contribution, will be used for INSAT-3A and INSAT-3D. We will also modify and adapt the CLAVR-x (Clouds for AVHRR-extended) algorithm for INSAT-3A and INSAT-3D. Uncertainties in surface reflectance and aerosol model assumptions might be the largest sources of uncertainties in retrieved aerosol optical depth assuming that radiances are well calibrated. The algorithm is currently being tested on cloud-free synthetic scenes created from MODIS observations. Once the algorithm is ready to process the data for cloudy and cloud-free conditions and INSAT-3A data are obtained from ISRO, the algorithm products will be tested and evaluated using ground observations obtained from Indian co-investigators.
Figure 3: Top of the atmosphere reflectances at 0.63 µm (black) and 0.82 µm (red) as a function of aerosol optical depth for different view zenith angles. Different curves are for different solar zenith angles. These curves form the basis of the look-up tables that are inverted to obtain aerosol optical depth from satellite measured radiances.
Proc. of SPIE Vol. 6407 640704-4
Downloaded From: http://proceedings.spiedigitallibrary.org/ on 12/08/2014 Terms of Use: http://spiedl.org/terms

20
65
6 24 4317VEGETATION H EALTH INDEX (VH I),VEGETATION CONDITION INDEX (VCI),TEMPERATURE CONDITION INDEX (TCI)
INDIA, MID-JUNE 1986
2.2.1. Societal benefits
The abundance of atmospheric aerosol loading due to anthropogenic and natural sources warrants a measurement program that can monitor the impact of aerosols on regional climate and air quality. Currently used polar-orbiting satellites and ground networks have limited spatial and temporal coverage. Data gaps due to clouds and once-a-day coverage inhibit us from studying diurnal variation of aerosols and local transport of aerosols on short-time scales. Measurements from geostationary satellites will allow us to monitor aerosols at higher temporal resolution. These datasets can then be used to study the linkages between human health and poor air quality. 2.3. Development of satellite-based decision support drought monitoring system in India
The goals of this project are (1) Adjust the NESDIS satellite-based drought monitoring system to India’s environment; (2) Calibrate and validate the system from in-situ data; (3) Develop models for estimation of drought impacts on the environment and agricultural output.
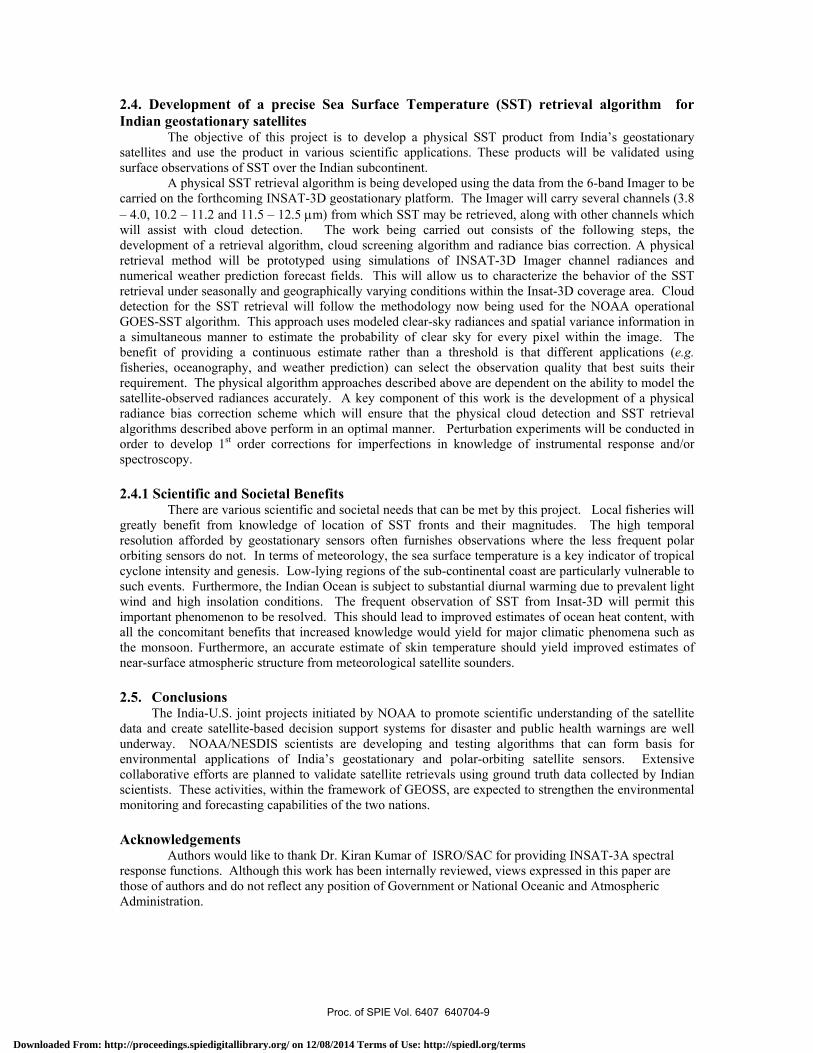
Droughts in India are frequent due to failure and/or delay of monsoon over space and time. The present satellite-based drought monitoring system in India is based on the Normalized Difference Vegetation Index (NDVI). NESDIS has recently advanced this technology by developing Vegetation Health Indices (VHI).
The VHI were designed to evaluate greenness, vigor and hotness of the canopy. They were used as an indirect measure of vegetation condition and drought, which, in turn, will indicate possible weather-related losses of agricultural production. The VHI were used as a proxy for identifying drought area and intensity and early warning of drought-related losses of agricultural production. VHI indices collected for India continent were collected and compared with multi-year crop statistics and meteorological data. Some of the results are presented below. The 1986 drought was one of the most devastating in India. It affected the central and western portion of India. This drought was triggered by moisture stress (VCI) as well as thermal stress (TCI). As the result the vegetation was very unhealthy on nearly 70% of the entire India peninsula.
Figure 4: Vegetation Health Indices.
Proc. of SPIE Vol. 6407 640704-5
Downloaded From: http://proceedings.spiedigitallibrary.org/ on 12/08/2014 Terms of Use: http://spiedl.org/terms

UE 97%
oY= 1 - 1 S — fl-nfl Z z— villa —a — fl-nfl Z * Fills n—zfififil svil,la fififil s*-l-illlal= nm; Sl= fl-finn
Rsc 078MS E0_029 1
5E 2%
5 2D 25 3DYield
The results of AVHRR-based estimates of drought, total vegetation health and their relationship to crop yield were tested on winter wheat grown in Rajasthan. Winter wheat yield anomaly (deviation from technological trend, dY) was correlated with vegetation health indices (VCI and TCI) during the growing season to identify the critical period when these parameters had the strongest impacts on dY. Finally a model (dY=f(VCI, TCI)) was constructed. The model and independent model verification are shown in Fig. 5. The model explains 78% of the independently predicted winter wheat yield. The systematic error (SE) is 3% indicating that the selected parameters explained most (97%) of the yield variance.
Figure 5: Model of dY as a function of VCI and TCI and verification results (predicted vs observed yield). 2.3.1. Societal benefits
Weather-related crop losses have always been a concern for farmers, governments, traders and policy makers in India for the purpose of balanced food supplies, demands, trade, and distribution of aid to people in need. Therefore, early crop loss assessments in response to weather fluctuations are an important issue. Seventy percent of India’s population depends on agriculture. Out of 140 million hectares of the total sown area, 68 percent are vulnerable to droughts, which are frequent due to failure and/or delay of monsoon over space and time. The weather station network in India is not dense enough to provide optimal tools for monitoring drought and assessing crop losses. 2.4. Early detection of malaria epidemics from satellite and climate indicators The goals of this project are to integrate landscape epidemiology, remote sensing, climate, and human health. This approach will be useful in the development of a system for early detection of mosquito-borne malaria, to monitor epidemic intensity, area at risk, duration and to predict the outcome. This study will use new AVHRR-based vegetation health indices. Landscape epidemiology emphasizes that climate and landscape circumscribes the distribution of mosquito-borne diseases, while weather affects the timing, duration, and intensity of outbreaks. Mosquito are sensitive to temperature, rainfall, humidity and landscape condition. Warm surfaces, rainfall, high humidity and healthy vegetation are excellent conditions and habitat for mosquito’s breeding, activities and for carrying the disease to people. The indicated environmental parameters can be indirectly approximated from radiances observed by the operational weather satellites. These proxies can pinpoint public health officials where the deadly vectors transmitting the diseases might dwell.
Proc. of SPIE Vol. 6407 640704-6
Downloaded From: http://proceedings.spiedigitallibrary.org/ on 12/08/2014 Terms of Use: http://spiedl.org/terms

In situ data presented below (Fig. 6) clearly indicate that malaria epidemics strictly follow abundant rainfall, elevated humidity and temperature. In 1989 and 1990, 500 to 1000 mm of rains in September triggered development of malaria epidemic when the number of malaria cases jumped from 800 before the rains to 3000-4000 thereafter. Satellite data shows similar tendency (Fig. 7). In NO malaria years (1986, 1987), VCI in the northern part of India indicates intensive vegetation stress. In years with abundant rainfall (1989, 1990) VCI shows wet conditions favorable for development of mosquitoes and transferring malaria.
Figure 6: Number of Malaria cases and Meteorology.
Proc. of SPIE Vol. 6407 640704-7
Downloaded From: http://proceedings.spiedigitallibrary.org/ on 12/08/2014 Terms of Use: http://spiedl.org/terms

Vegetation Condition Index (VCU(luring Years with and without
1iaIaria epidemicSEPTEMBER
1\ialariaepidemic
NOMalaria
epidemic
72I I I
612243640601204Stressed Fair Favorable
Figure 7: AVHRR-based Vegetation Condition Index (VCI) in years with malaria and no malaria epidemic. 2.4.1. Societal benefits
Malarial epidemics are one of the major public health problems experienced in India. Nearly 2-3 million cases occur every year with about 1000 deaths in many India’s states. Malaria is confined to different forested, urban, epidemic prone areas with highest number of cases reported from northern states and Orissa with Annual Parasite Incidence (API) reaching up to 130 in some districts of Orissa. Some areas face the epidemics due to climate change. The control planners do not get sufficient time to prevent mortality. Early detection of malaria is one of the basic elements of control strategy. Therefore, study of malaria response to the environment and early prediction of malaria based on satellite and in situ data is very important issue for India’s population and socioeconomic activities. The results of this study are expected to be used primarily in the National Vector Borne Diseases Control Program. AVHRR measurements from polar-orbiting satellites will allow us to monitor development of malaria at higher temporal resolution compare to that information provided by the weather station network.
Proc. of SPIE Vol. 6407 640704-8
Downloaded From: http://proceedings.spiedigitallibrary.org/ on 12/08/2014 Terms of Use: http://spiedl.org/terms
2.4. Development of a precise Sea Surface Temperature (SST) retrieval algorithm for Indian geostationary satellites
The objective of this project is to develop a physical SST product from India’s geostationary satellites and use the product in various scientific applications. These products will be validated using surface observations of SST over the Indian subcontinent.
A physical SST retrieval algorithm is being developed using the data from the 6-band Imager to be carried on the forthcoming INSAT-3D geostationary platform. The Imager will carry several channels (3.8 – 4.0, 10.2 – 11.2 and 11.5 – 12.5 µm) from which SST may be retrieved, along with other channels which will assist with cloud detection. The work being carried out consists of the following steps, the development of a retrieval algorithm, cloud screening algorithm and radiance bias correction. A physical retrieval method will be prototyped using simulations of INSAT-3D Imager channel radiances and numerical weather prediction forecast fields. This will allow us to characterize the behavior of the SST retrieval under seasonally and geographically varying conditions within the Insat-3D coverage area. Cloud detection for the SST retrieval will follow the methodology now being used for the NOAA operational GOES-SST algorithm. This approach uses modeled clear-sky radiances and spatial variance information in a simultaneous manner to estimate the probability of clear sky for every pixel within the image. The benefit of providing a continuous estimate rather than a threshold is that different applications (e.g. fisheries, oceanography, and weather prediction) can select the observation quality that best suits their requirement. The physical algorithm approaches described above are dependent on the ability to model the satellite-observed radiances accurately. A key component of this work is the development of a physical radiance bias correction scheme which will ensure that the physical cloud detection and SST retrieval algorithms described above perform in an optimal manner. Perturbation experiments will be conducted in order to develop 1st order corrections for imperfections in knowledge of instrumental response and/or spectroscopy. 2.4.1 Scientific and Societal Benefits
There are various scientific and societal needs that can be met by this project. Local fisheries will greatly benefit from knowledge of location of SST fronts and their magnitudes. The high temporal resolution afforded by geostationary sensors often furnishes observations where the less frequent polar orbiting sensors do not. In terms of meteorology, the sea surface temperature is a key indicator of tropical cyclone intensity and genesis. Low-lying regions of the sub-continental coast are particularly vulnerable to such events. Furthermore, the Indian Ocean is subject to substantial diurnal warming due to prevalent light wind and high insolation conditions. The frequent observation of SST from Insat-3D will permit this important phenomenon to be resolved. This should lead to improved estimates of ocean heat content, with all the concomitant benefits that increased knowledge would yield for major climatic phenomena such as the monsoon. Furthermore, an accurate estimate of skin temperature should yield improved estimates of near-surface atmospheric structure from meteorological satellite sounders. 2.5. Conclusions
The India-U.S. joint projects initiated by NOAA to promote scientific understanding of the satellite data and create satellite-based decision support systems for disaster and public health warnings are well underway. NOAA/NESDIS scientists are developing and testing algorithms that can form basis for environmental applications of India’s geostationary and polar-orbiting satellite sensors. Extensive collaborative efforts are planned to validate satellite retrievals using ground truth data collected by Indian scientists. These activities, within the framework of GEOSS, are expected to strengthen the environmental monitoring and forecasting capabilities of the two nations.
Acknowledgements
Authors would like to thank Dr. Kiran Kumar of ISRO/SAC for providing INSAT-3A spectral response functions. Although this work has been internally reviewed, views expressed in this paper are those of authors and do not reflect any position of Government or National Oceanic and Atmospheric Administration.
Proc. of SPIE Vol. 6407 640704-9
Downloaded From: http://proceedings.spiedigitallibrary.org/ on 12/08/2014 Terms of Use: http://spiedl.org/terms
Copyright © 2022 FDOKUMEN