Session Title Speaker Name Speaker Title & Company - GDC ...
114
-
Upload
khangminh22 -
Category
Documents
-
view
1 -
download
0
Transcript of Session Title Speaker Name Speaker Title & Company - GDC ...


Now this is how the talk will look like:
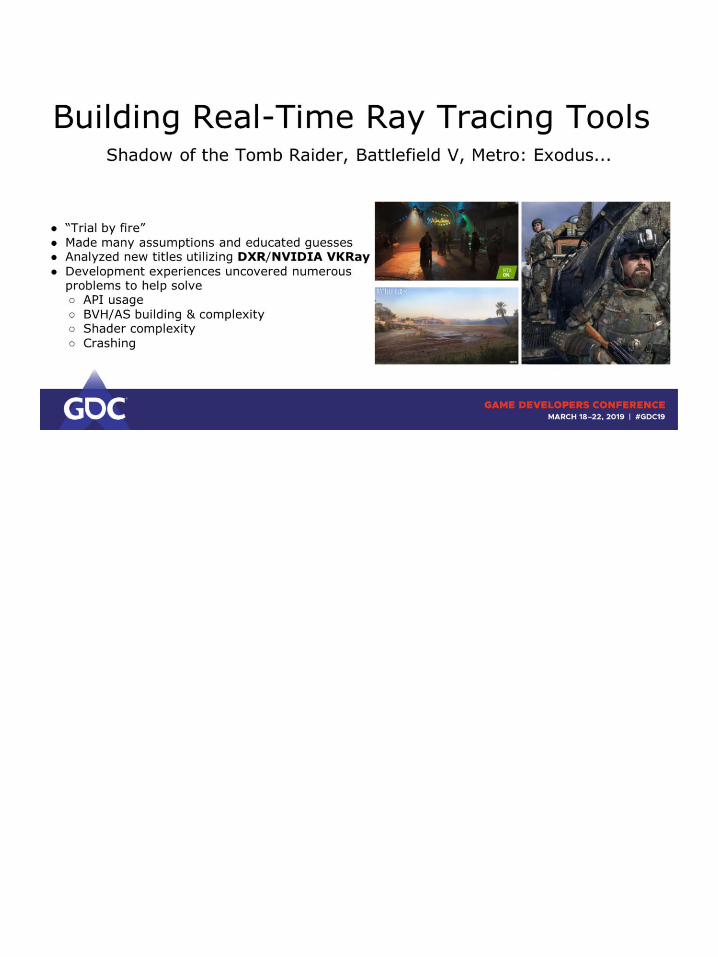
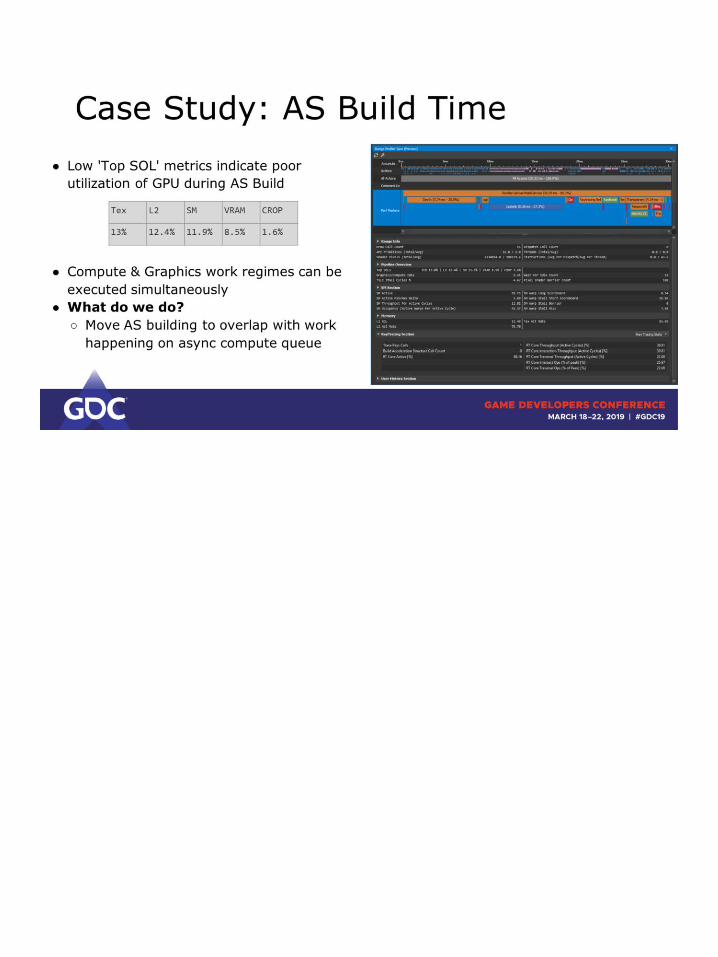
- I present you with a problem that has been seen in a loooooot of AAA titles. Both shipped and upcoming ones.I’m not going to say which titles these are, don’t want to offend anyone and sometimes you have to call a solution “good enough”. People want to ship games at the end of the day.
- I’ll show you how to use RGP to

identify the problem
- I’ll explain the underlying issue
- I’ll tell you how to fix it
- For the following three topics: Barriers, Async, Compression
All of the information given in this talk is about Vega.

You can access this via Events->Wavefront occupancy.
This is probably the view you will spent your first few minutes on to figure out what’s going on in your frame.

You can access this via Events->Wavefront occupancy.
This is probably the view you will spent your first few minutes on to figure out what’s going on in your frame.

You can access this via Events->Wavefront occupancy.
This is probably the view you will spent your first few minutes on to figure out what’s going on in your frame.

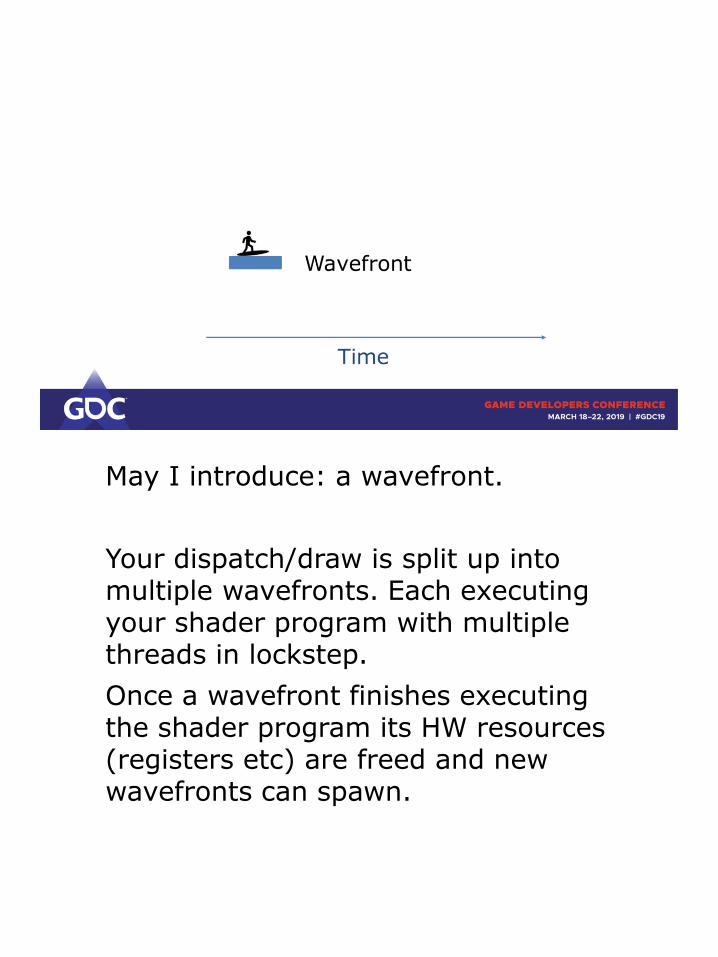
May I introduce: a wavefront.
Your dispatch/draw is split up into multiple wavefronts. Each executing your shader program with multiple threads in lockstep.
Once a wavefront finishes executing the shader program its HW resources (registers etc) are freed and new wavefronts can spawn.
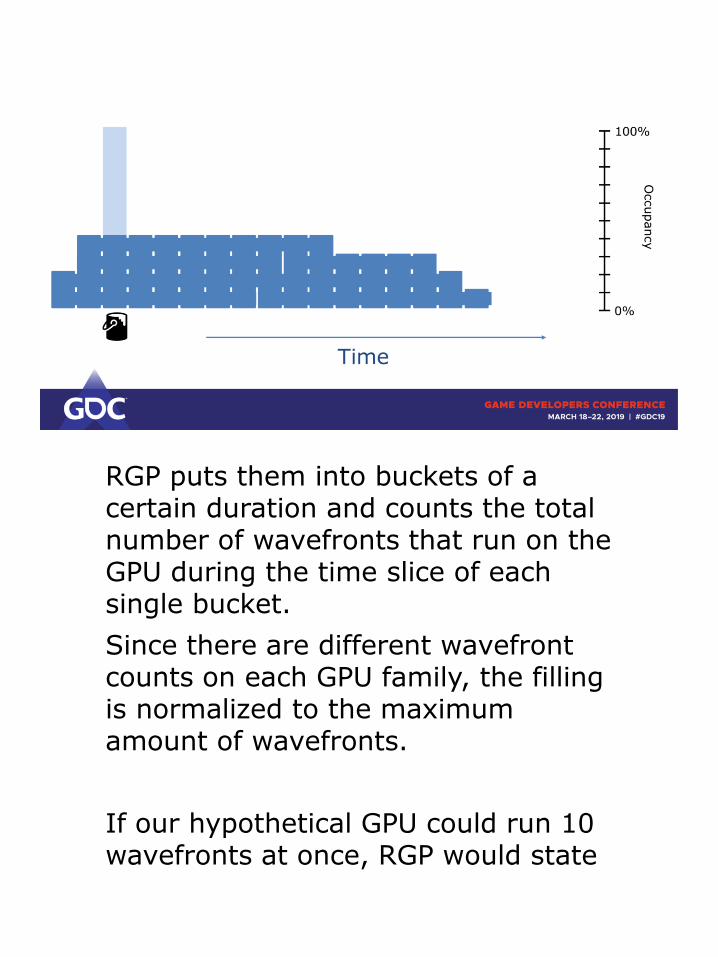
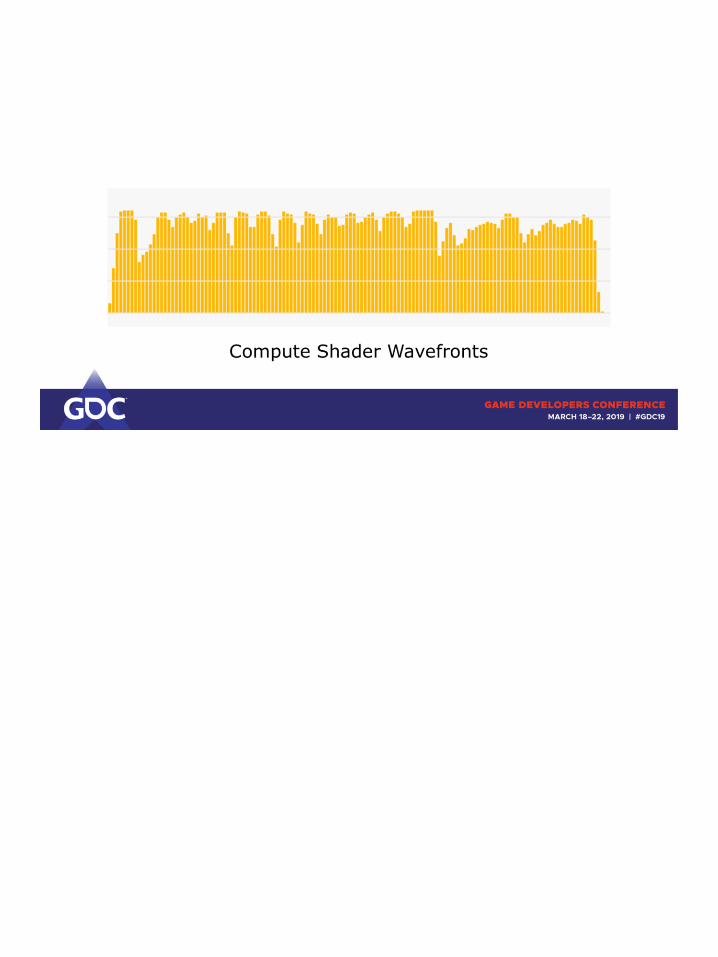
RGP puts them into buckets of a certain duration and counts the total number of wavefronts that run on the GPU during the time slice of each single bucket.
Since there are different wavefrontcounts on each GPU family, the filling is normalized to the maximum amount of wavefronts.
If our hypothetical GPU could run 10 wavefronts at once, RGP would state

40% occupancy here.
(real numbers are in the thousands)
And for completeness sake, this is how RGP would generate the trace for our hypothetical GPU.
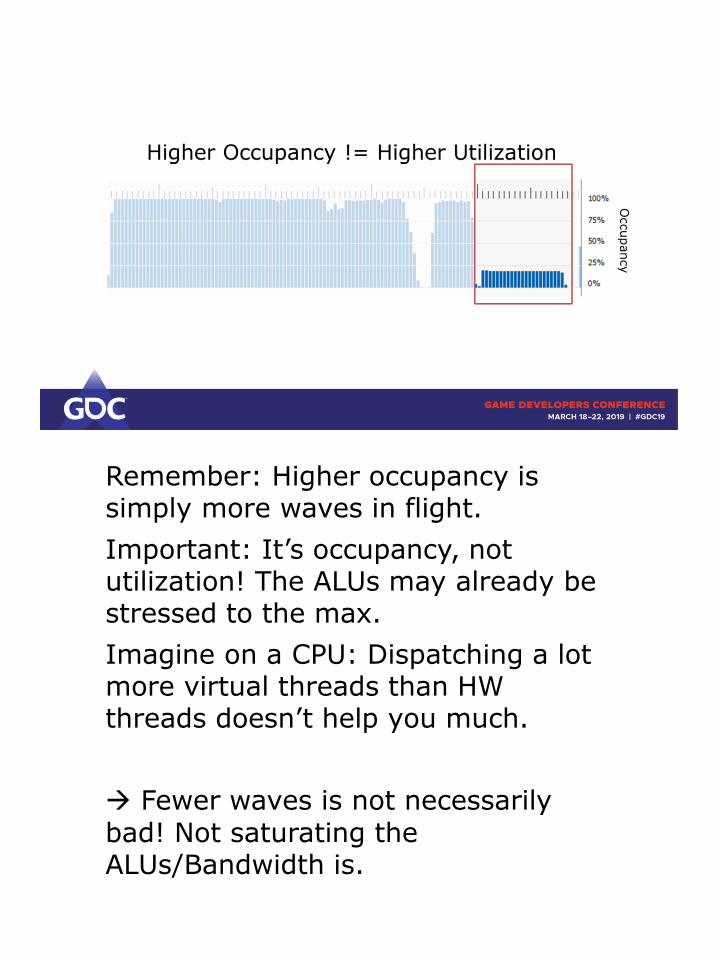
Remember: Higher occupancy is simply more waves in flight.
Important: It’s occupancy, not utilization! The ALUs may already be stressed to the max.
Imagine on a CPU: Dispatching a lot more virtual threads than HW threads doesn’t help you much.
→ Fewer waves is not necessarily
bad! Not saturating the ALUs/Bandwidth is.

Obviously, if there are NO waves running, then we’re not using the shader core to full extent (i.e. we don’t get at least one wave onto each SIMD). Also, usually not all waves are done at the same time. See the occupancy dropping at the end of the workloads.

But what is causing that? RGP knows the answer: Barriers!

Back to our “zoomed” in view.
Without any synchronization the next compute shader could start here.

Barriers cause the next bunch of work items to wait until the prior work all finished.
They also sometimes cause other work to happen (think of compression/decompression & making work visible to other units => flush caches). Thus, they sometimes have some additional overhead aside from draining the shader core.

Now the important part, it’s not only that tiny bit of work being lost (1)
It’s actually that much (2)

So we’re up for issue number 1: Using a barrier after each draw.
Or even worse: multiple barriers after (almost) each draw.
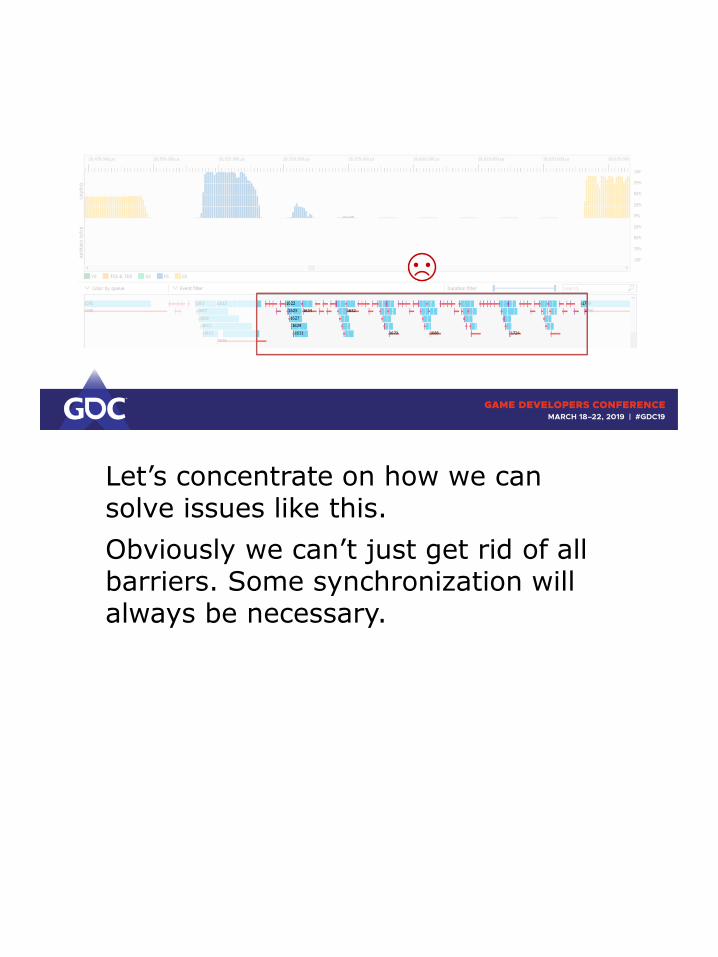
Let’s concentrate on how we can solve issues like this.
Obviously we can’t just get rid of all barriers. Some synchronization will always be necessary.

First, we can batch them, so the driver can manage the synchronization points more precisely.
It’s as easy as submitting them together in a single vkCmdPipelineBarrier / CommandList::ResourceBarrier.
The driver can then easily figure out the worst case synchronization or if only a single cache flush is necessary (instead of multiples) etc.

Only a small impact, but the effects add up! Don’t neglect those.
Also, certain compressions may start earlier, that’s a net win!

This is how you will see it in RGP.
Note that the first barrier is still exactly as long as before, but we were able to get rid of all the other barriers!
We successfully overlapped the FastClearEliminates (writing cleared values from meta data to every pixel -> decompressing the texture) as well.

Be very descriptive in how you define the stage flags. In some cases you pay for being too general.
Vulkan specific. Found by a developer we work with.
If you click on any of these barriers and look to the right side into the details again you see each barrier taking 0.044ms to execute.
Doing a FULL synchronization each.
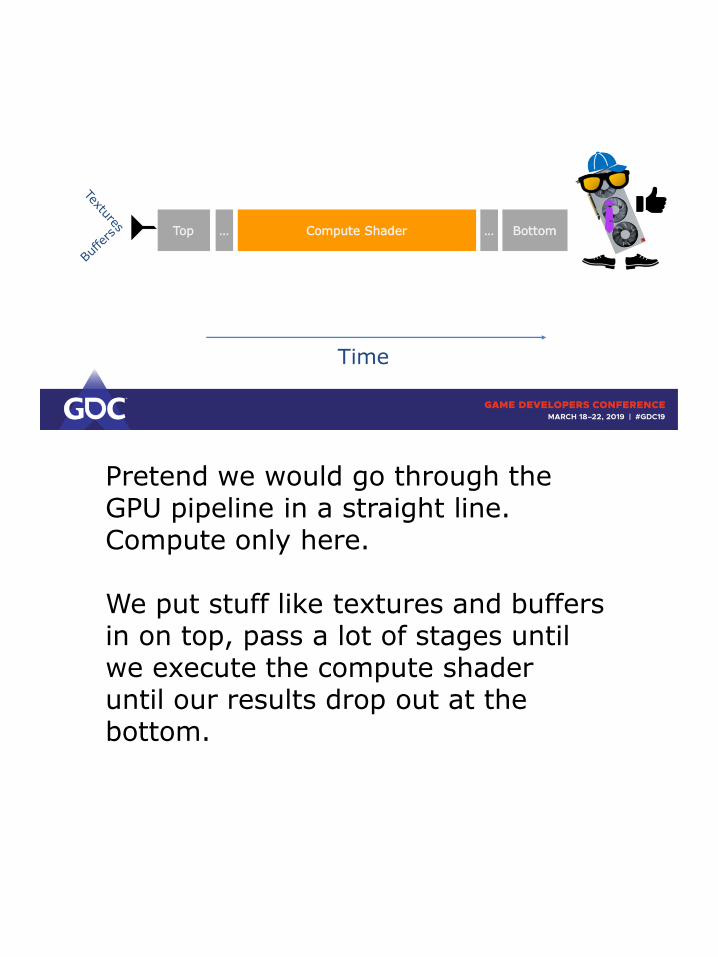
Pretend we would go through the GPU pipeline in a straight line. Compute only here.
We put stuff like textures and buffers in on top, pass a lot of stages until we execute the compute shaderuntil our results drop out at the bottom.

Now let’s say in some special corner cases BOTTOM_OF_PIPE takes a long time to execute.But we’re only interested in dependencies between the CS!

If we would describe the accesses more precisely, we could overlap more.

Here it was set with ALL_COMMANDS (contains BOTTOM_OF_PIPE) on the async compute queue.
Replacing that with COMPUTE shows a big improvement, here enough to overlap with other draws on the graphics queue.

To prove it, here’s the detailed view when clicking on these barriers.
We replaced a full synchronization with the proper CS sync, which is a lot less expensive on the async queue.
Almost a magnitude improvement on each barrier.
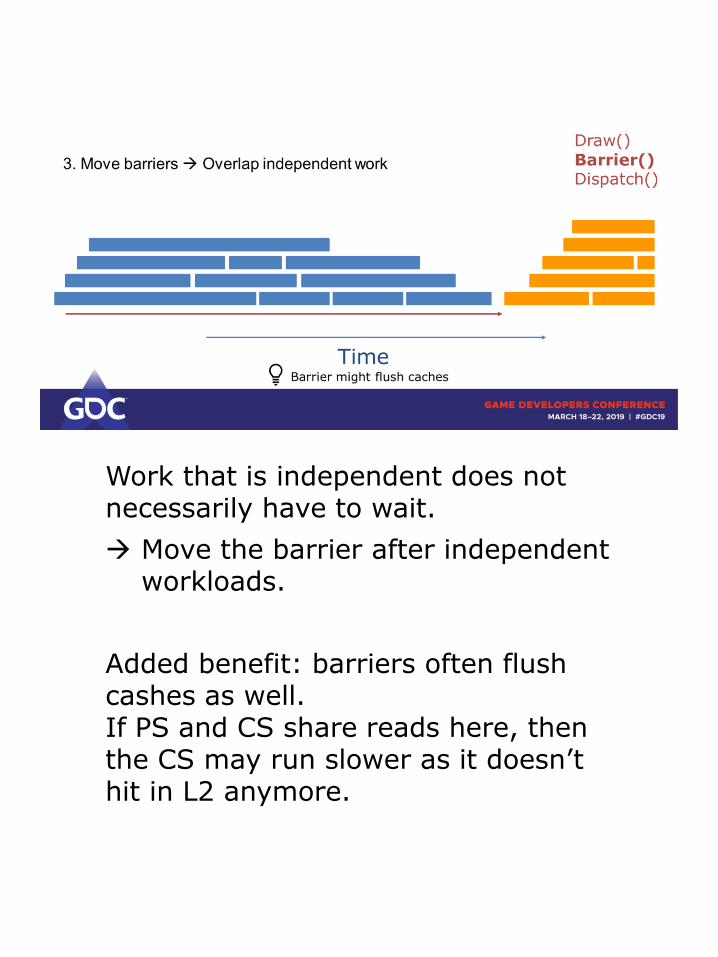
Work that is independent does not necessarily have to wait.
→ Move the barrier after independent workloads.
Added benefit: barriers often flush cashes as well. If PS and CS share reads here, then the CS may run slower as it doesn’t hit in L2 anymore.

Order of submissions here:
1. VS/PS
2. Barrier
3. CS

Order of submission would be:
1. PS
2. CS
3. Barriers

Usually what you want to do is to overlap long running CS waves with raster heavy workloads. In RGP these usually show up as short VS waves with low occupancy.
This is what we start out with. Notice the barrier that causes a gap between the Vertex and the Compute work.
Let’s start with moving that barrier behind the CS.

Pro tip these barriers may be due to start/end of RenderPasses: Add explicit TOP to BOTTOM barriers (basically no-op barriers) as subpass dependencies to EXTERNAL to get rid of implicit barriers at the beginning/end of render passes in Vulkan.
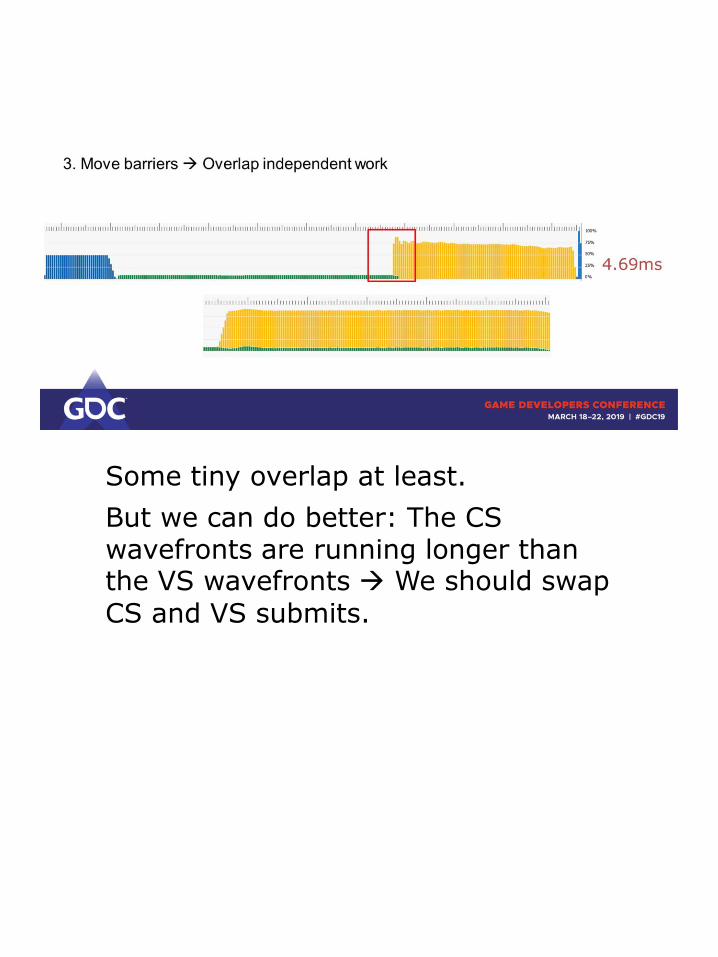
Some tiny overlap at least.
But we can do better: The CS wavefronts are running longer than the VS wavefronts → We should swap
CS and VS submits.

This already looks better than before. Still not ideal as at some point we only spawn new CS waves, no VS waves anymore.
→ We can split up the CS work into
multiple dispatches and interleave it with VS work.
E.g. if the CS is fullscreen, split it into tiles and interleave it with draws.
Imagine shadow cascades with SSAO.

This gives amazing results! And completely without going to the async compute queue.
Works particularly well if you find passes that have significantly different hardware utilization.
E.g. texture fetch heavy SSAO with vertex heavy shadow map rendering.

Async queue does not force waits on the graphics queue! Useful for whole compute passes that require syncs to move to the async queue.
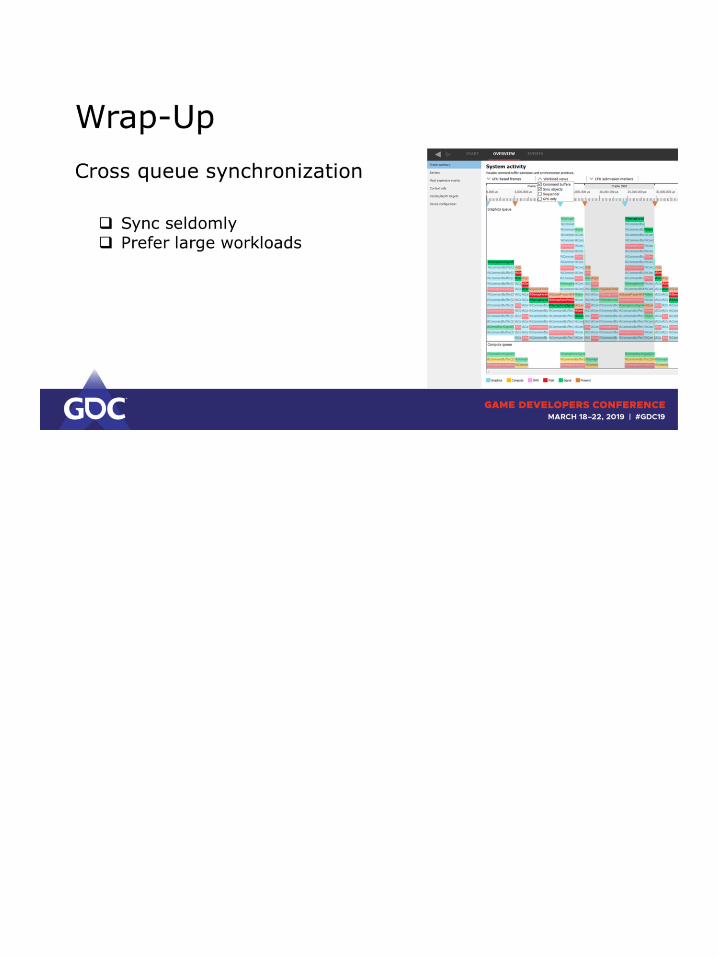
Keep attention to queues fighting for resources.Move passes with a lot of work to the async queue, and keep the number of cross queue syncs to a minimum.

That probably didn’t turn out as expected.

But if done correctly, this can work out great!
See how the compute queue can take over while the graphics queue is draining and filling.

Varying workloads make this a hard problem. Sometimes you end up starving the graphics queue.
Rather aim to keep the graphics queue busy first.
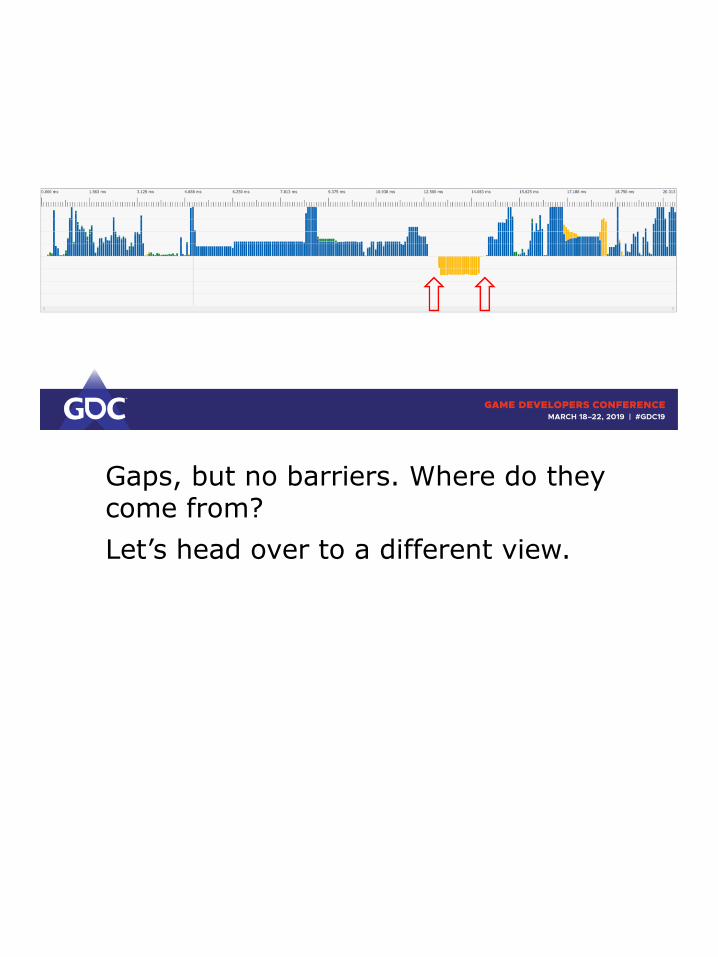
Gaps, but no barriers. Where do they come from?
Let’s head over to a different view.

When you open up your capture you are greeted with the frame summary page. Anyone working with GPUView might see similarities.

Top is the graphics queue.

Bottom is the async compute queue (and/or copy queue if available)
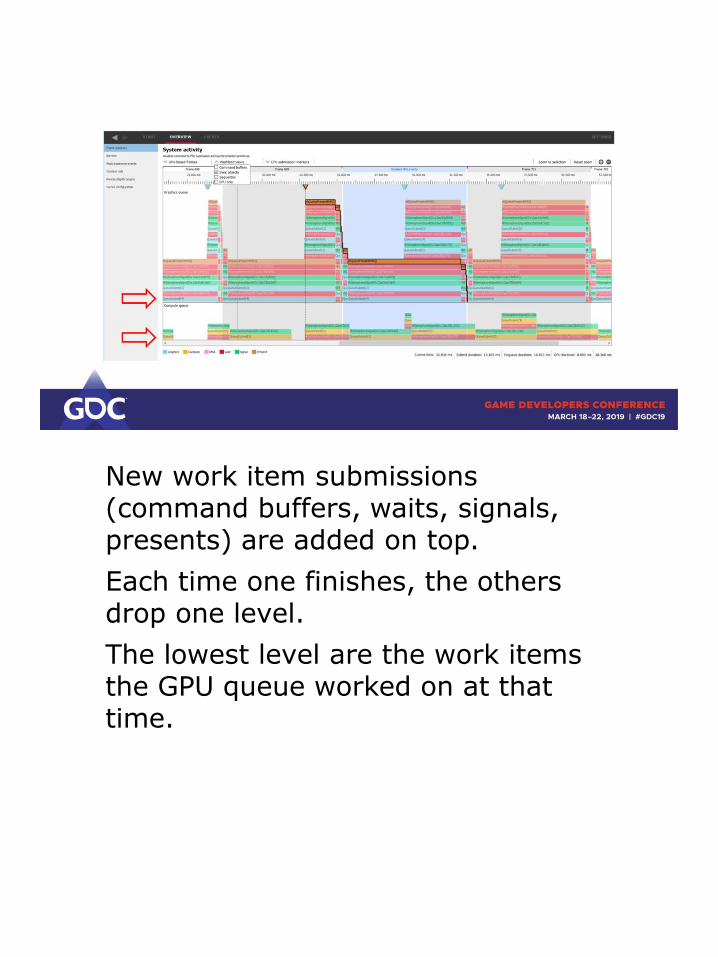
New work item submissions (command buffers, waits, signals, presents) are added on top.
Each time one finishes, the others drop one level.
The lowest level are the work items the GPU queue worked on at that time.
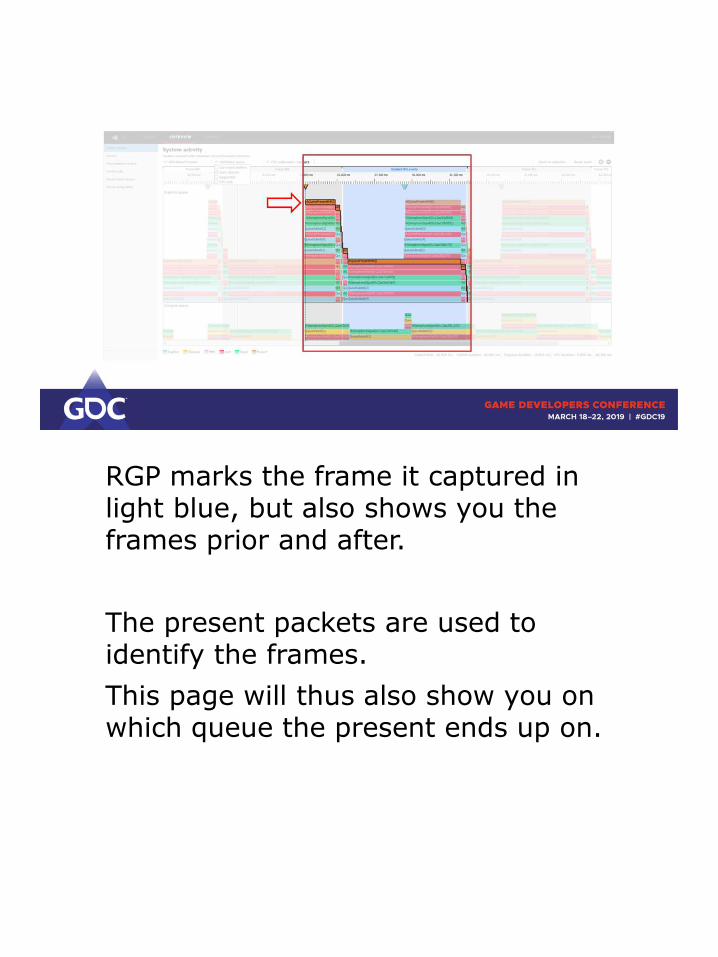
RGP marks the frame it captured in light blue, but also shows you the frames prior and after.
The present packets are used to identify the frames.
This page will thus also show you on which queue the present ends up on.
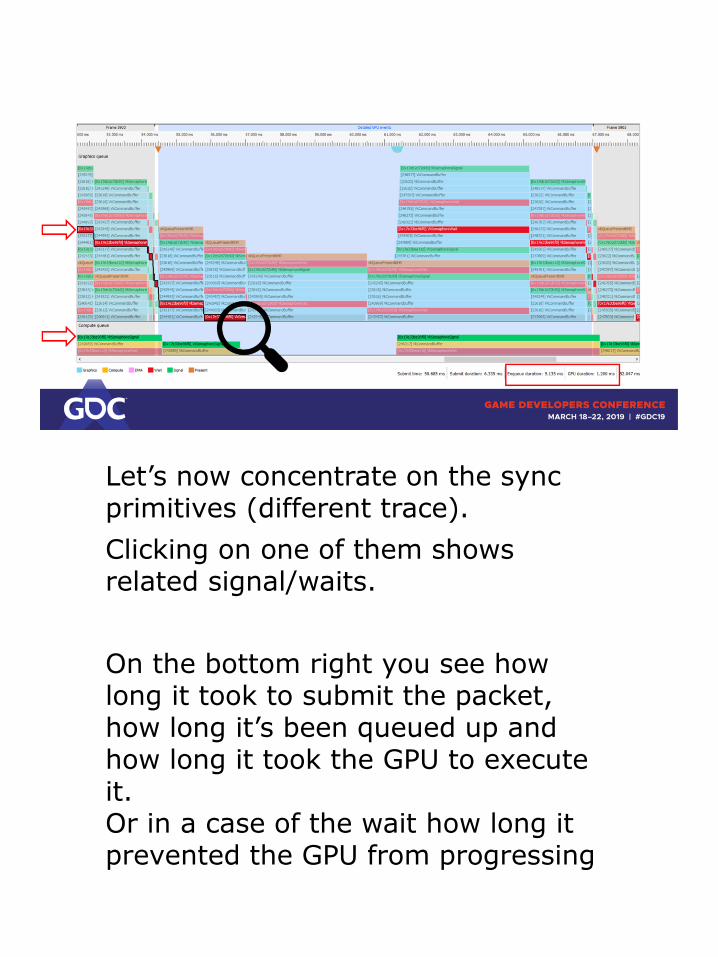
Let’s now concentrate on the sync primitives (different trace).
Clicking on one of them shows related signal/waits.
On the bottom right you see how long it took to submit the packet, how long it’s been queued up and how long it took the GPU to execute it. Or in a case of the wait how long it prevented the GPU from progressing

further.
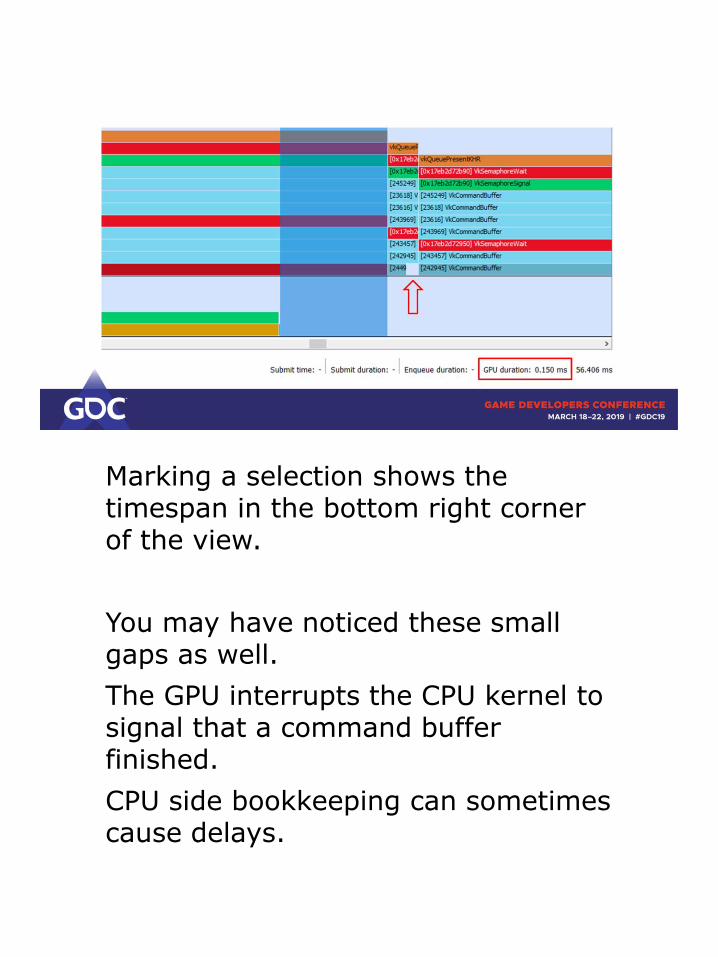
Marking a selection shows the timespan in the bottom right corner of the view.
You may have noticed these small gaps as well.
The GPU interrupts the CPU kernel to signal that a command buffer finished.
CPU side bookkeeping can sometimes cause delays.

Not much you can do about –> only sync seldomly. Only 1-2 times per frame ideally.
Let it run uninterrupted as long as possible to overlap pipeline drains and fills.
And can even overlap with the next frame if your game can take the added latency.
That works because frames usually start with raster heavy workloads (GBuffer, Shadow maps) and end

with compute heavy post processing.


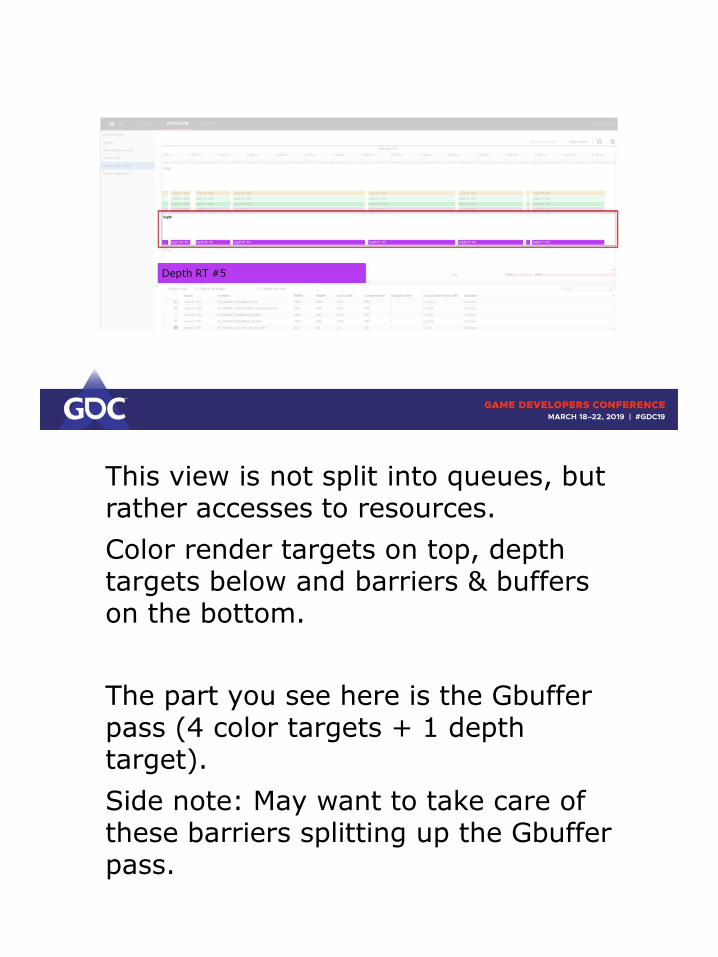
This view is not split into queues, but rather accesses to resources.
Color render targets on top, depth targets below and barriers & buffers on the bottom.
This view is not split into queues, but rather accesses to resources.
Color render targets on top, depth targets below and barriers & buffers on the bottom.
The part you see here is the Gbufferpass (4 color targets + 1 depth target).
Side note: May want to take care of these barriers splitting up the Gbufferpass.

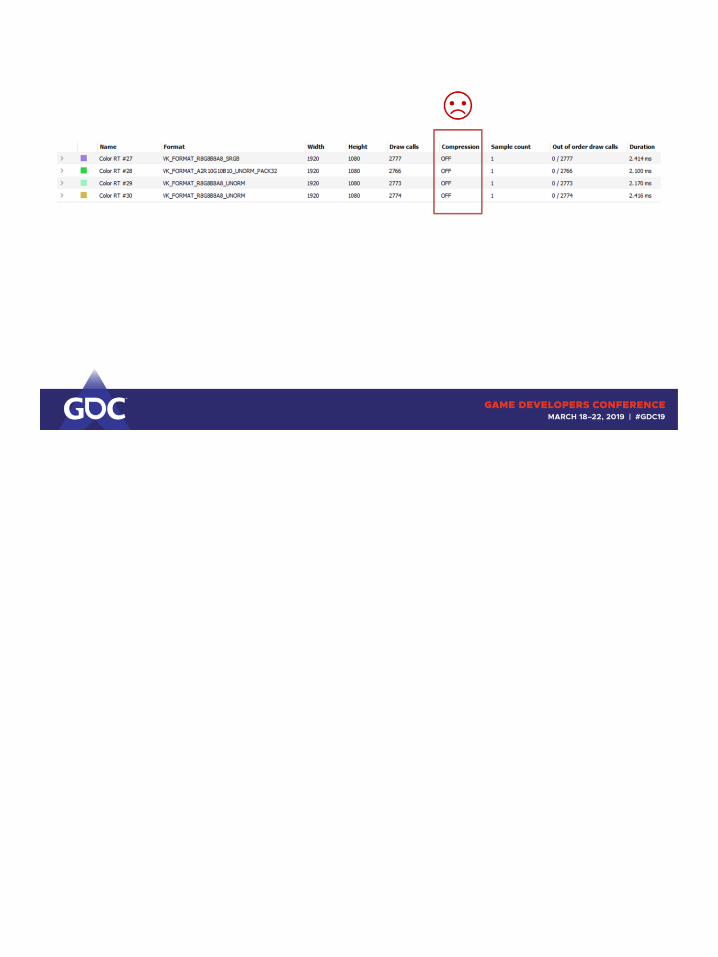
Below it you can see details that unroll once you click on a RT.

Let’s make this a quick (barely scratching the surface) introduction to texture compression as it’s used for render targets.
Let’s start out with a texture and cut it into blocks.
We attach some meta data to the texture that describes attributes per block.
Like

- Cleared
- Clear Color
- Compressed / Decompressed
In compressed state we can overwrite the contents of each original block.
Everything’s lossless compressed so we can restore the correct color per pixel.
Can be done during creation of that texture, meaning rendering into it.
Controlled by transitioning the texture, sometimes may need to decompress it.
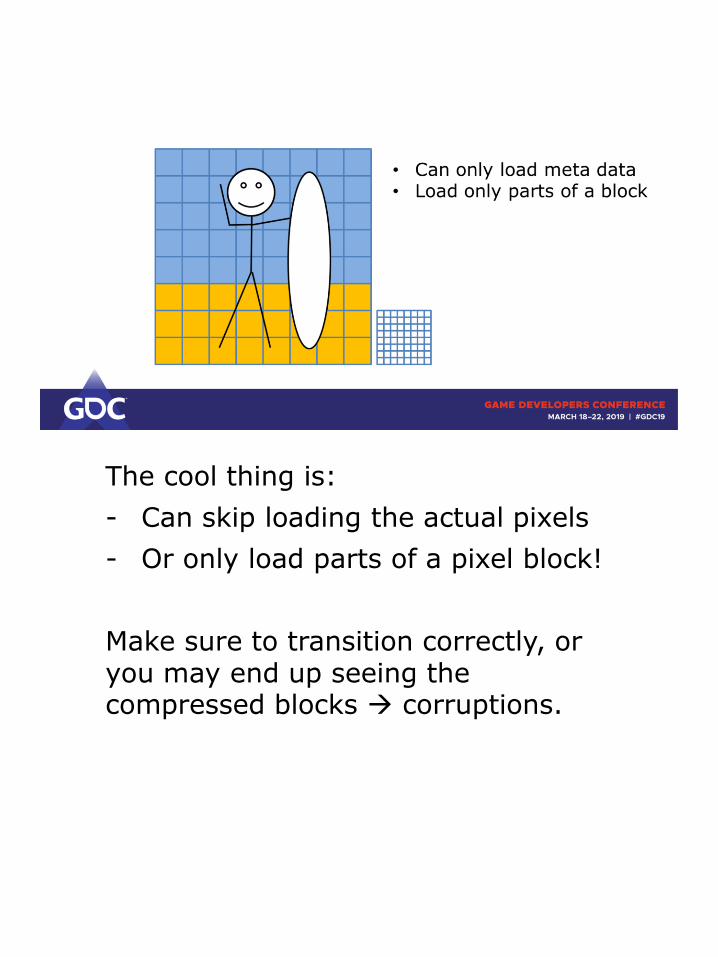
The cool thing is:
- Can skip loading the actual pixels
- Or only load parts of a pixel block!
Make sure to transition correctly, or you may end up seeing the compressed blocks → corruptions.

Make sure to transition correctly, or you may end up seeing the compressed blocks → corruptions.

Cycle through sampling a texture and exporting color values to a render target.
→ We save on bandwidth both on
read AND write to VMEM.
The texture itself isn’t going to be stored more compactly – in fact we even need to attach more data to hold meta information!

Cycle through sampling a texture and exporting color values to a render target.
→ We save on bandwidth both on
read AND write to VMEM.
The texture itself isn’t going to be stored more compactly – in fact we even need to attach more data to hold meta information!

- Rendering many triangles into a target can turn a block to decompressed state. Clearing resets meta data and thus improves compression ratio.
- Shared ownership disables compression (certain blocks can’t handle compression)
- Quirks with UNKNOWN/MUTABLE prevent compression. Can work around it with VK_KHR_image_format_list

- Important if many draws render to that target.

Generous 10% win in this case.