
Solving the Einstein constraint equations on multi-block triangulations using finite element methods

Voronoi Diagrams & Delaunay Triangulations - Their Applications
in Computer ScienceCompiled by
Dr. PISUPATI SADASIVA SUBRAMANYAMSENIOR MEMBER,I.E.E.E.
VIGNANA BHARATHI INSTITUE OF TECHNOLOGY,
HYDERABAD-501301.TELANGANA STATE, INDIA

VORONOI DIAGRAM Voronoi diagram : A way of dividing space into a number of regions. named after Georgy Voronoy, also called a Voronoi tesselation, a Voronoi decomposition, a Voronoi partition, or a Dirichlet tessellation A diagram induced by a finite set A of sites is a decomposition of the plane into possibly unbounded (convex) polygons called Voronoi regions,each consisting of those points at least as close to some particular site as to the others.
Voronoi Cells: A set of points (called seeds, sites, or generators) specified beforehand with each seed having a corresponding region consisting of all points closer to that seed than to any other. The regions are called Voronoi cells. 2

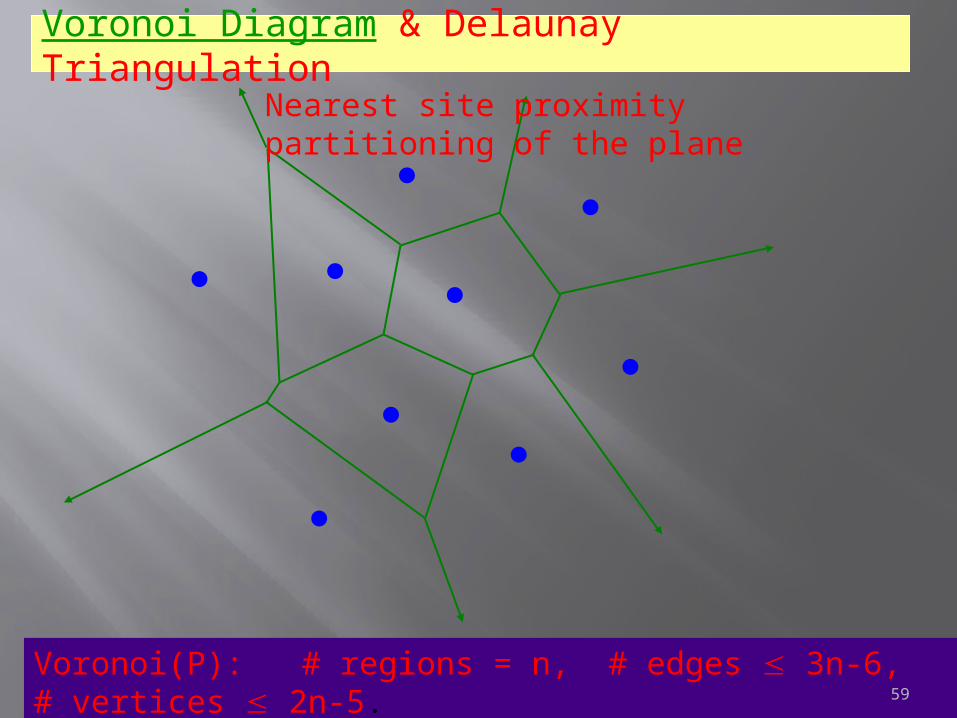
Voronoi Diagram & Delaunay Triangulation
Voronoi(P): # regions = n, # edges 3n-6, # vertices 2n-5.
Nearest site proximity partitioning of the plane
3

Delauny Triangulation Dual is Delauny Triangulation or Empty Region in Voronoi Power Diagram
The dual Delaunay triangulation associated to the same set A of sites is obtained by drawing a triangle edge between every pair of sites whose corresponding Voronoi regions are themselves adjacent along an edge.
Boris Delaunay has equivalently characterized these triangulations via the empty circle property,whereby a triangulation of a set of sites is Delaunay iff the circumcircle of none of its triangles contains sites in its interior.
4

POWER DIGRAMS & OPTMIZATION
The dual Delaunay triangulation associated to the same set A of sites is obtained by drawing a triangle edge between every pair of sites whose corresponding Voronoi regions are themselves adjacent along an edge. Boris Delaunay has equivalently characterized these triangulations via the empty circle property,whereby a triangulation of a set of sites is Delaunay iff the circumcircle of none of its triangles contains sites in its interior.
Voronoi and Delaunay tessellations are themselves solutions of optimization problems
Algorithms to construct Voronoi diagrams and Delaunay triangulations are intimately linked to optimization methods, like the greedy algorithm, flipping and pivoting, divide and conquer. Furthermore the main data structures to implement geometric algorithms were created in conjunction with those for Voronoi and Delaunay tessellations 5

DELUNAY - Local optimality vs global optimality
Theorem Delaunay ⇐⇒ maximum smallest angle of the Delunay Triangle which passes through only 3 Points Of the Circle
With No Point inside the Circle.
T triangulation w/ max. smallest angle ⇒ max. in each quadrilateral
⇒ locally Delaunay
⇒ globally Delaunay
6

GLOBALLY DELAUNAY
Locally Delaunay everywhere
⇐⇒
Globally Delaunay
7

Delaunay Triangulation = Dual of the Voronoi Diagram.
Voronoi Diagram & Delaunay Triangulation
DT(P): # vertices = n, # edges 3n-6, # triangles 2n-5.
8

Voronoi Diagram & Delaunay Triangualtion -Applications.
Applications Proximity space partitioning and the post office
problemHeight InterpolationEuclidean: Minimum Spanning Tree, Traveling
Salesman Problem,Minimum Weight Triangulation, Relative
Neighborhood Graph, Gabriel Graph.In machine learning, Voronoi diagrams are used to do 1-NN classifications.

Voronoi Diagram & Delaunay Triangualtion -Applications -Contd.
A point location data structure can be built on top of the Voronoi diagram in order to answer nearest neighbor queries, where one wants to find the object that is closest to a given query point. Nearest neighbor queries have numerous applications. For example, one might want to find the nearest hospital, or the most similar object in a database. A large application is vector quantization, commonly used in data compression.
Extensions Higher Order Voronoi DiagramsGeneralized metrics - Robot Motion Planning

Voronoi Diagram & Delaunay Triangualtion -Applications -Contd.
In computer graphics, Voronoi diagrams are used to calculate 3D shattering / fracturing geometry patterns. It is also used to procedurally generate organic or lava-looking textures.
In autonomous robot navigation, Voronoi diagrams are used to find clear routes. If the points are obstacles, then the edges of the graph will be the routes furthest from obstacles (and theoretically any collisions).
In mining, Voronoi polygons are used to estimate the reserves of valuable materials, minerals, or other resources. Exploratory drillholes are used as the set of points in the Voronoi polygons.

Voronoi Diagram & Delaunay Triangualtion -Applications -Contd.
Voronoi diagrams together with farthest-point Voronoi diagrams are used for efficient algorithms to compute the roundness of a set of points.[5]
The Voronoi approach is also put to good use in the evaluation of circularity/roundness while assessing the dataset from a coordinate-measuring machine.
In networking, Voronoi diagrams can be used in derivations of the capacity of a wireless network.
In hydrology, Voronoi diagrams are used to calculate the rainfall of an area, based on a series of point measurements. In this usage, they are generally referred to as Thiessen polygons.

Voronoi Diagram & Delaunay Triangualtion -Applications -Contd.
In architecture, Voronoi patterns were the basis for the winning entry for redevelopment of The Arts Centre Gold Coast.[12]
In computational chemistry, Voronoi cells defined by the positions of the nuclei in a molecule are used to compute atomic charges. This is done using the Voronoi deformation density method.
In polymer physics, Voronoi diagrams can be used to represent free volumes of polymers.
In materials science, polycrystalline microstructures in metallic alloys are commonly represented using Voronoi tessellations. In solid state physics, the Wigner-Seitz cell is the Voronoi tessellation of a solid, and the Brillouin zone is the Voronoi tessellation of reciprocal (wave number) space of crystals which have the symmetry of a space group.

Voronoi Diagram & Delaunay Triangualtion -Applications -Contd.
In biology, Voronoi diagrams are used to model a number of different biological structures, including cells[14] and bone microarchitecture.[15]
In ecology, Voronoi diagrams are used to study the growth patterns of forests and forest canopies, and may also be helpful in developing predictive models for forest fires.
In user interface development, Voronoi patterns can be used to compute the best hover state for a given point.

Voronoi Diagram & Delaunay Triangualtion -Applications -Contd.
In epidemiology, Voronoi diagrams can be used to correlate sources of infections in epidemics. One of the early applications of Voronoi diagrams was implemented by John Snow to study the 1854 Broad Street cholera outbreak in Soho, England. He showed the correlation between areas on the map of London using a particular water pump, and the areas with most deaths due to the outbreak.
In geometry, Voronoi diagrams can be used to find the largest empty circle amid a set of points, and in an enclosing polygon; e.g. to build a new supermarket as far as possible from all the existing ones, lying in a certain city.

Voronoi Diagram & Delaunay Triangualtion http://www.google.com/url?sa=t&rct=j&q=&esrc=s&source=web&cd=2&ved=0CCMQFjAB&url=http%3A%2F%2Fwww.cse.yorku.ca%2F~andy%2Fcourses%2F6114%2FSlides%2FCG9-Voronoi.pptx&ei=YpEFVLuCBsm5uASRnYCIBg&usg=AFQjCNGtPgOj24KByS8zh1Gjq0pQU-EcJA&bvm=bv.74115972,d.c2EAlgorithms
Divide-&-Conquer Plane Sweep Lifting into d+1 dimensions Edge-Flip Randomized Incremental Construction
Applications Proximity space partitioning and the post office problem Height Interpolation Euclidean: Minimum Spanning Tree, Traveling Salesman Problem, Minimum Weight Triangulation, Relative Neighborhood Graph, Gabriel
Graph.Extensions
Higher Order Voronoi Diagrams Generalized metrics - Robot Motion Planning
16

CONSTRUCT ALGORITHMS Voronoi and Delaunay tessellations are themselves solutions of optimization problems
Algorithms to construct Voronoi diagrams and Delaunay triangulations are intimately linked to optimization methods, like the greedy algorithm, flipping and pivoting, divide and conquer. Furthermore the main data structures to implement geometric algorithms were created in conjunction with those for Voronoi and Delaunay tessellations
17

Voronoi Diagrams –A Few Applications in Computer Science
Associative File Searching Problem : Consider some file of n two-attribute records
referring Example: 1. latitude and longitude of a
city 2. age and income of a
person. Given an additional target record R . To Retrieve : that record of the file that
matches R the best. For Frequent retrieval of the
same file, a supporting data structure is called for. This associative file searching problem was first
posed by Knuth . A two-dimensional generalization of the
usual (one-attribute) file- searching problem. - in its geometric
version called post-office Problem.
file:///E:/Voronoi%20Power%20Diagrams%20%20folder/Paper%20Power%20Diagrams%20Voronoi%20Diagrams%20A%20Survey%20of%20a%20Fundamental%20Geometric%20Data%20Structure.pdf
18

Post Office Problem Given a set S of n sites in the plane (post
offices), report a site closest to a given query point q (the location of a person).
Shames [1975a] first observed the relevance of Voronoi diagrams to this problem. A site p is closest to q if and only if q falls into the region of p. In a preprocessing step the Voronoi diagram of S is computed. To report a site closest to q, it now suffices to determine the region that contains q.
This shows that the post-office problem can be solved by means of Voronoi diagrams in logarithmic query time and without increasing the order of space, which is well known to be optimal already for usual file searching.
19

Traveling Salesman Problem (TSP)Input: An nn positive distance matrix D=(dij),
i,j = 1..n, where dij is the travel distance from city i
to city j. Output: A traveling salesman tour T. T starts from
the home city (say, city 1) and visits each city exactly once and returns to home city.
Goal: minimize total distance traveled on tour T:
.d)T(CT)j,i(
ij
093125023910511270
D
TOPT (1, 3, 4, 2) ((1, 3), (3,4), (4,2), (2,1))
C(TOPT) = d13 + d34 + d42 + d21
= 2 + 5 + 3 + 5 = 15
20

Euclidean Minimum Spanning Tree
• General (m edge, n vertex graph) MST algorithms (See also AAW):Kruskal or Prim O(m log n) or O(m + n log n) time.
Yao or Cheriton-Tarjan: O(m log log n) time Chazelle: O(m a(m,n)) time.
• EMST requires W(n log n) time in the worst-case. [Linear time reduction from the Closest Pair Problem.]
• EMST in O(n log n) time: (1) Compute DT in O(n log n) time (# edges in DT 3n –6).(2) Apply Prim or Kruskal MST algorithm to DT.
• Next we will show EMST can be obtained from DT in only O(n) time.
21

Euclidean Minimum Spanning Tree
• D. Cheriton, R.E. Tarjan [1976] “Finding minimum spanning trees,” SIAM J. Comp. 5(4), 724-742.• Also appears in §6.1 of [Preparata-Shamos’85].
• Cheriton-Tarjan’s MST algorithm works on general graphs. When applied to a planar graph with n vertices and arbitrary edge-weights, it takes only O(n) time.
• The following graph operations preserve planarity: (a) vertex or edge removal, (b) edge contraction (shrink the edge & identify its two ends):
e
22

Some Classes of TSP
• General TSP : distance matrix D is arbitrary
• Metric-TSP: D satisfies the metric axioms
• Euclidean-TSP: n cities as n points in the plane with Euclidean inter-city distances
These are all NP-hard.
Related Problems:• Minimum Spanning Tree• Hamiltonian Cycle• Graph Matching• Eulerian Graphs
23

Hamiltonian Cycle Problem (HCP)
HCP: Given a graph G(V,E), does G have a Hamiltonian Cycle (HC)?HC is any simple spanning cycle of G, i.e., a cycle that goesthrough each vertex exactly once.
HCP is known to be NP-hard.
Hamiltonian(skeleton of dodecahedron)
Non-Hamiltonian(Peterson graph)
24

Graph MatchingDefinition:
• A matching M in a graph G(V,E) is a subset of the edges of G
such that no two edges in M are incident to a common vertex.
• Weight of M is the sum of its edge weights.• A perfect matching is one in which every vertex is matched.
A perfect matching M of weight 5+2+3+6=16 in graph G.
FACT: Minimum weight maximum cardinality matching can be obtained in polynomial time [Jack Edmonds 1965].
57
9
2
3 86
41
73
25

Min Weight Euclidean Matching
Given 2n points in the Euclidean plane, match them in pairs with n matching edges of minimum total length.
O(n3) on general weighted graphs: Jack Edmonds [1965]
O(n2.5 log4 n): P.M. Vaidya [1989], SICOMP 18(6), 1201-1225.
Mirzaian [1993], “Minimum weight Euclidean matching and weighted relative neighborhood graphs,” WADS, 506-517.
26

Eulerian GraphDefinition: A graph G(V,E) is Eulerian if it has an Euler walk. Euler Walk is a cycle that goes through each edge of G exactly once.
FACT 1: A graph G is Eulerian if and only if (a) G is connected and (b) every vertex of G has even degree.
An Euleriangraph G
An Eulerwalk of G
FACT 2: An Euler walk of an Eulerian graph can be found in linear time.27
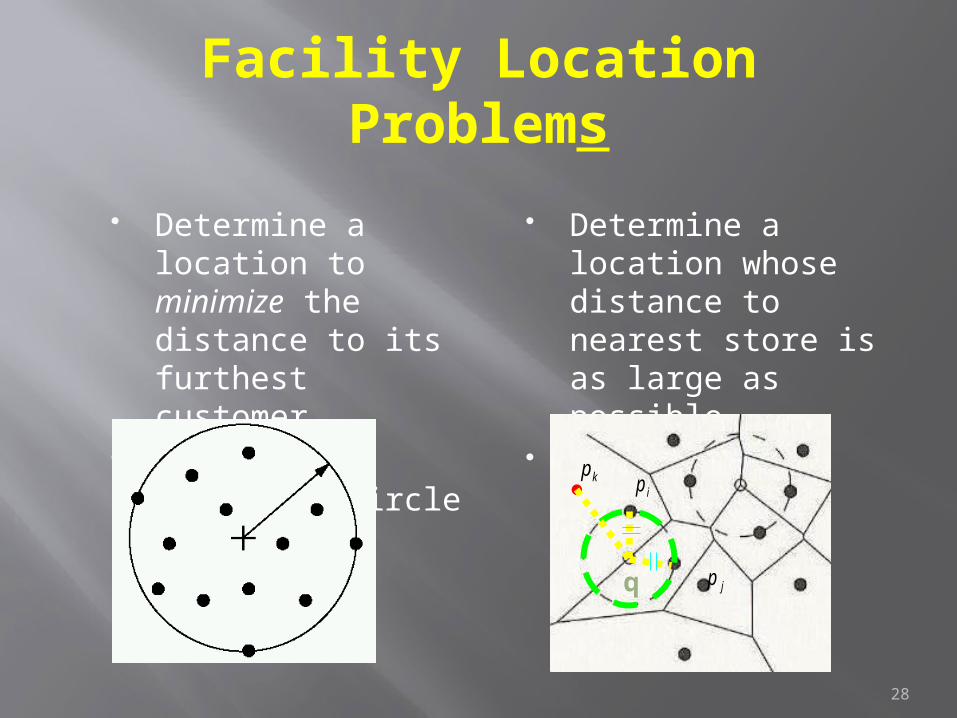
Facility Location Problems
Determine a location to minimize the distance to its furthest customer
Minimum enclosing circle
Determine a location whose distance to nearest store is as large as possible
Largest empty circleip
jp
kp
q
28

Facility Location (version 2)
Seek location for new grocery store, whose distance to nearest store is as large as possible — center of largest empty circle
One restriction: center in convex hull of the sites
29

Facility Location (cont)
Center in hull: p must be coincident with a voronoi vertex
Center on hull: p must lie on a voronoi edge
30

EMPTY REGION –Application in COMPUTER SCIENCE
Sometimes there are empty regions in power diagram. It looks like some regions are smaller compared to the normal Voronoi diagram.
The dual graph for a Voronoi diagram (in the case of a Euclidean space with point sites) corresponds to the Delaunay triangulation for the same set of points. Etc.
Voronoi diagram induced by a finite set A of sites is a decomposition of the plane into possibly unbounded (convex) polygons called Voronoi regions,each consisting of those points at least as close to some particular site as to the others.
31

Largest Empty Circle
32

Cluster Analysis
Determining a partition of the given set of data into subsets whose in-class members are similar and whose cross-class members are dissimilar according to a predefined similarity measure.
Attribute data, similarity is reflected by the proximity of sites in the plane.
Proximity, in turn, is revealed by properties of the Voronoi diagram for these sites.
For instance, dense subsets of sites give rise to Voronoi regions of small area; regions of sites in a homogeneous cluster will have similar geometric shape; for clusters having orientation-sensitive
density, the shapes of the regions will exhibit a corresponding direction sensitivity.
33

Oracle Application Development Framework - Oracle ADF
In Oracle ADF you can create JSF(JavaServer Faces) pages which includes page fragments (A page fragment is a JSF JSP(JSF JavaServer Pages) document that renders as content in another JSF page).
The purpose of page fragments is nothing but re-usability. You can use the same page fragments on different pages with the help of bounded task-flows.
The pages with fragment could appears as Regions (fixed visibility) on JSF page you can also create pages with Dynamic Regions (Dynamically visibility on run-time based on some action or condition).
34

Scheduling Record Accesses and Machine Learning
Consider a mass storage system represented by a two-dimensional array of grid points, each capable of storing one record.
The time for the read/write head to move from point (x, y) to the point (u, U) is proportional to I x – u I + I y – u 1, the distance between these points measured ACM Computing Surveys, Vol 23, No 3, September 1991
MACHINE LEARNING: Voronoi diagrams are used to do 1-NN classifications
35

36
SORTING Lower bound for Delaunay Delaunay can be used to sort numbers
In 2D F(x,y), for every Value of x we have the Value of y searched using Eucledian or Manhatan Search. That Value of y with Minimum search distance gives the Minimum Value of y.
As the Search Distance is incremented, next Higher Value of y is obtained.
If the distance is Greater than the First Distance, x can be incremented.

Collision Detection controlling the motion of robot systems is that of collision detection.
For a robot moving in an obstacle environment, one needs to determine collisions between moving robot subparts and stationary obstacles or between two separately moving subparts of the robot. In particular, proximity detection is important in order to be able to stop the system before a collision will have occurred
The robot system and the environment of obstacles are usually modeled by polygonal objects. For the sake of proximity detection, collision-critical points on the boundary of these objects may be circumscribed by circles whose radii correspond to the tolerance threshold of the system. This reduces the problem to detecting the intersection of circles. Colors may be assigned to the circles in order to distinguish between “harmless” intersections (among circles stemming from the same moving robot part or the same obstacle) and others.
The problem becomes easy, however, if the power diagram (the Voronoi diagram where the power lines of the circles are taken as separators) is available 37

Closest Pairs
In collision detection, two closest sites are in greatest danger of collision
Naïve approach: Q(n2)Each site and its closest pair share an edge check all Voronoi edges O(n)Furthest pair cannot be derived directly from the diagram
38

Visual Delaunay definition: Flipping
Looking at two triangles ABD and BCD in Fig.1 with the common edge BD (see figures), figures), if the sum of the angles α and γ is less than or equal to 180°, the triangles meet the Delaunay condition.Second triangulation does not meet the Delaunay condition (the sum of α and γ is bigger than 180°).Third triangulation does not meet the Delaunay condition (the circumcircles contain more than three points)
Flipping the common edge produces a Delaunay triangulation for the four points.
39

Morphing of Images
For morphing images the Delaunay triangulation provides a 'good' way to create a triangular mesh from points that are going to be moved. Each triangle can be distorted in a simple way, leading to a complex 'morphing' distortion of the overall image.In the example of morphing shown, the triangular shapes are distorted from one image to the next, so for example the hair in the first image is distorted to fit the hair in the second. At the same time as that happens, the colours 'cross fade' from one colour to another so the grey cross fades to brown.
40
IMAGE ENHANCEMENTMODELLING OF TERRAIN: Given a set of sample points, the Delaunay triangulation gives a nice set of triangles to use as polygons in the model. In particular, the Delaunay triangulation avoids narrow triangles (as they have large circumcircles compared to their area).
FINGER PRINT ANALYSIS: Delaunay triangulations are used in many other applications where a shape has to be divided up into triangles. Analysis of stresses and strains in structures is often done using a triangular mesh. In the analysis shown above, more points are put in the area of most interest to get a finer more detailed analysis in that area. That's also what we do when morphing images - we put more points where we want most control over the fine details of the morphing. If you want to change a frown into a smile, put more points around the mouth so you can change the shape more easily.
41

Delaunay Triangulation of Minutiae Points
42

d-dimensional Delaunay For a set P of points in the (d-dimensional) Euclidean space, a Delaunay triangulation is a triangulation DT(P) such that no point in P is inside the circum-hypersphere of any simplex in DT(P). It is known[2] that there exists a unique Delaunay triangulation for P, if P is a set of points in general position; that is, there exists no k-flat containing k + 2 points nor a k-sphere containing k + 3 points, for 1 ≤ k ≤ d − 1 (e.g., for a set of points in ℝ3; no three points are on a line, no four on a plane, no four are on a circle, and no five on a sphere).
43

Terrain Height Interpolation
A perspective view of a terrain.A topographical map of a terrain.
Terrain: A 2D surface in 3D such that each vertical line intersects it in at most one point.f : 2 . f(p) = height of point p in the domain A of the terrain.
Method: Take a finite sample set P A. Compute f(P), and interpolate on A.
P A
f
44

Brute Force Method
Record ID of the closest site to each sample point
Coarsepoint-
samplingresult
Finerpoint-
samplingresult
45
Algorithm
Associate each primitive with the corresponding distance mesh
Render each distance mesh with depth test on Voronoi edges: found by continuation methods
46

Ex: Voronoi diagram between a point and a line
47

Distance Meshes
line curve polygon
48

Applications (Mosaic)
49

50

Medial Axis Computation
Medial axes as part of Voronoi
diagram51

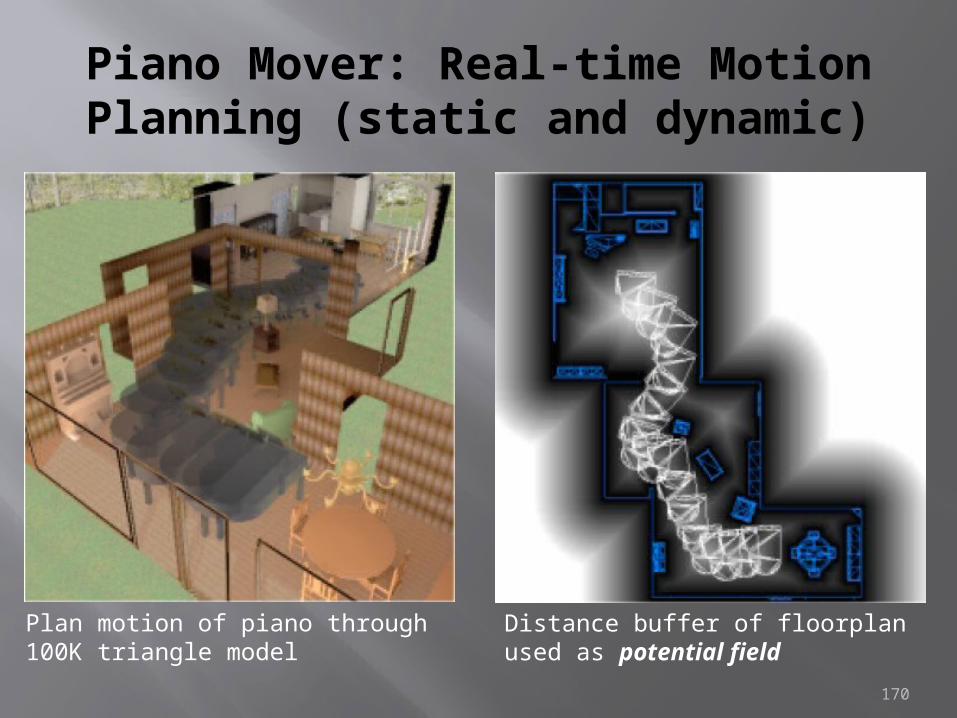
Piano Mover: Real-time Motion Planning (static and dynamic)
Plan motion of piano through 100K triangle model
Distance buffer of floorplan used as potential field
52

Variety of Voronoi Diagram
(regular) Voronoi diagram
Furthest distance Voronoi diagram
53

Minimum Enclosing Circle
Center of MEC is at the vertex of furthest site Voronoi diagram
54

Oracle Application Development Framework - Oracle ADF
In Oracle ADF you can create JSF(JavaServer Faces) pages which includes page fragments (A page fragment is a JSF JSP(JSF JavaServer Pages) document that renders as content in another JSF page).
The purpose of page fragments is nothing but re-usability. You can use the same page fragments on different pages with the help of bounded task-flows.
The pages with fragment could appears as Regions (fixed visibility) on JSF page you can also create pages with Dynamic Regions (Dynamically visibility on run-time based on some action or condition).
55

Voronoi Diagarams
&
Delaunay Triangulations –
Construction56

COSC 6114Prof. Andy Mirzaian
57

Voronoi Diagram & Delaunay Triangulation
P = { p1, p2, … , pn} a set of n points in the plane.
58
Voronoi Diagram & Delaunay Triangulation
Voronoi(P): # regions = n, # edges 3n-6, # vertices 2n-5.
Nearest site proximity partitioning of the plane
59

Delaunay Triangulation = Dual of the Voronoi Diagram.
Voronoi Diagram & Delaunay Triangulation
DT(P): # vertices = n, # edges 3n-6, # triangles 2n-5.
60

Delaunay triangles have the “empty circle” property.
Voronoi Diagram & Delaunay Triangulation
61

Voronoi Diagram & Delaunay Triangulation
62

Voronoi DiagramP = { p1, p2, … , pn} a set of n points in the plane.Assume: no 3 points collinear, no 4 points cocircular.
PB(pi, pj) perpendicular bisector of pipj. pi
pj
H(p i, p j)
half-pla
ne
Voronoi Region of pi:
n
ij1j
jii )p,p(H)p(V
pi
Voronoi Diagram of P:
n
1ii)p(V)P(VD
63

Voronoi Diagram Properties
Each Voronoi region V(pi) is a convex polygon (possibly unbounded). V(pi) is unbounded pi is on the boundary of CH(P). Consider a Voronoi vertex v = V(pi) V(pj) V(pk). Let C(v) = the circle centered at v passing through pi, pj, pk.
C(v) is circumcircle of Delaunay Triangle (pi, pj, pk). C(v) is an empty circle, i.e., its interior contains no other sites of P. pj = a nearest neighbor of pi V(pi) V(pj) is a Voronoi edge
(pi, pj) is a Delaunay edge. more later …
64

Delaunay Triangulation Properties
DT(P) is straight-line dual of VD(P). DT(P) is a triangulation of P, i.e., each bounded face is a triangle (if P is in general position). (pi, pj) is a Delaunay edge an empty circle passing through pi and pj. Each triangular face of DT(P) is dual of a Voronoi vertex of VD(P). Each edge of DT(P) corresponds to an edge of VD(P). Each node of DT(P), a site, corresponds to a Voronoi region of VD(P). Boundary of DT(P) is CH(P). Interior of each triangle in DT(P) is empty, i.e., contains no point of P. more later …
65

LECTURE 7: VORONOI DIAGRAMS
Presented by Allen Miu6.838 Computational Geometry
September 27, 2001Slides 9 - 11; 22 -
66

Voronoi Cells and Segments
v
67

Voronoi Cells and Segments
v
Unbounded CellBounded Cell
Segment
68

Outline Definitions and Examples Properties of Voronoi diagrams Complexity of Voronoi diagrams Constructing Voronoi diagrams
Intuitions Data Structures Algorithm
Running Time Analysis Demo Duality and degenerate cases
69

Constructing Voronoi Diagrams Half plane intersection O( n2 log n )
Fortune’s Algorithm Sweep line algorithm
Voronoi diagram constructed as horizontal line sweeps the set of sites from top to bottom
Incremental construction maintains portion of diagram which cannot change due to sites below sweep line, keeping track of incremental changes for each site (and Voronoi vertex) it “sweeps”
Sweephull Sweephull is a hybrid technique for 2D Delaunay
triangulation that uses a radially propagating sweep-hull (sequentially created from the radially sorted set of 2D points, giving a non-overlapping triangulation), paired with a nal fiiterative triangle ipping step. An accurate flinteger arithmetic variant of the algorithm is also presented.
70

Constructing Voronoi Diagrams-Half Plane Intersection.
Given a half plane intersection algorithm…
71

Constructing Voronoi Diagrams
Given a half plane intersection algorithm…
72

Constructing Voronoi Diagrams
Given a half plane intersection algorithm…
Repeat for each site
Running Time: O( n2 log n )
73

Constructing Voronoi Diagrams-Sweep Line Algorithm
What is the invariant we are looking for?
Maintain a representation of the locus of points q that are closer to some site pi
above the sweep line than to the line itself (and thus to any site below the
line).
ev
pi
Sweep Line
q
74

Constructing Voronoi DiagramsWhich points are closer to a site above the sweep line than to the sweep line itself?
Sweep Line
pi
q
The set of parabolic arcs form a beach-line that bounds the locus of all such points
Equidistance
75

Constructing Voronoi Diagrams
Break points trace out Voronoi edges.
Equidistance
Sweep Line
pi
q
76

Constructing Voronoi DiagramsArcs flatten out as sweep line moves down.
Sweep Line
pi
q
77

Eventually, the middle arc disappears.
Constructing Voronoi Diagrams
Sweep Line
pi
q
78

We have detected a circle that is empty (contains no sites) and touches 3 or more sites.
Constructing Voronoi Diagrams
Sweep Line
pi
q
Voronoi vertex!79

Beach Line properties Voronoi edges are traced by the break points as the sweep line moves down. Emergence of a new break point(s) (from formation of a new arc or a fusion of two existing break points) identifies a new edge
Voronoi vertices are identified when two break points meet (fuse). Decimation of an old arc identifies new vertex
80

Data Structures
Current state of the Voronoi diagram Doubly linked list of half-edge, vertex, cell records
Current state of the beach line Keep track of break points Keep track of arcs currently on beach line
Current state of the sweep line Priority event queue sorted on decreasing y-coordinate 81

Doubly Linked List (D) Divide segments into uni-directional
half-edges A chain of counter-clockwise half-edges
forms a cell Define a half-edge’s “twin” to be its
opposite half-edge of the same segment
ev
Cell(pi)
82

Doubly Linked List (D) Cell Table
Cell(pi) : pointer to any incident half-edge
Vertex Table vi : list of pointers to all incident half-edges
Doubly Linked-List of half-edges; each has: Pointer to Cell Table entry Pointers to start/end vertices of half-edge
Pointers to previous/next half-edges in the CCW chain
Pointer to twin half-edge83

Balanced Binary Tree (T) Internal nodes represent break points between two arcs Also contains a pointer to the D record of the edge being traced
Leaf nodes represent arcs, each arc is in turn represented by the site that generated it Also contains a pointer to a potential circle event
pi pj pk pl
< pj, pk>
< pi, pj> < pk, pl>
pi
pjpk
pl
l
84

Event Queue (Q) An event is an interesting point encountered by the sweep line as it sweeps from top to bottom Sweep line makes discrete stops, rather than a continuous sweep
Consists of Site Events (when the sweep line encounters a new site point) and Circle Events (when the sweep line encounters the bottom of an empty circle touching 3 or more sites).
Events are prioritized based on y-coordinate
85

Site EventA new arc appears when a new site
appears.
l
86

Site EventOriginal arc above the new site is broken into two
Number of arcs on beach line is O(n)
l
87

Circle EventAn arc disappears whenever an empty circle touches three or more sites and is tangent to the sweep line.
Sweep line helps determine that the circle is indeed empty.
Circle Event!Sweep Line
pi
q
Voronoi vertex!
88

Event Queue Summary Site Events are
given as input represented by the xy-coordinate of the site point
Circle Events are computed on the fly (intersection of the two bisectors in between the three sites)
represented by the xy-coordinate of the lowest point of an empty circle touching three or more sites
“anticipated”, these newly generated events may be false and need to be removed later
Event Queue prioritizes events based on their y-coordinates
89

Summarizing Data Structures
Current state of the Voronoi diagram Doubly linked list of half-edge, vertex, cell records
Current state of the beach line Keep track of break points
Inner nodes of binary search tree; represented by a tuple
Keep track of arcs currently on beach line Leaf nodes of binary search tree; represented by a site that generated the arc
Current state of the sweep line Priority event queue sorted on decreasing y-coordinate
90

O(n log n) time algorithm by plane-sweep.
See AAW animation. Generalization: VD of line-segments and circles.
The Wave Propagation View Time as 3rd dimension Conic Sections: Focus-Directrix Sweep Plane & Sweep Line Sweep Plane & Cone Intersection Parabolic Evolution The parabolic front
91

ALGORITHMS A brute-force VD Algorithm Divide-&-Conquer Algorithm Fortune’s Algorithm Steve Fortune [1987], “A Sweepline algorithm for Voronoi Diagrams,” Algorithmica, 153-174
Guibas, Stolfi [1987], “Ruler, Compass and computer: The design and analysis of geometric algorithms,” Proc. of the NATO Advanced Science Institute, series F, vol. 40:
Theoretical Foundations of Computer Graphics and CAD, 111-165.
92

A brute-force VD AlgorithmP = { p1, p2, … , pn} a set of n points in the plane.Assume: no 3 points collinear, no 4 points cocircular.
Voronoi Region of pi:
n
ij1j
jii )p,p(H)p(V
Voronoi Diagram of P:
n
1ii)p(V)P(VD
intersection of n-1 half-planes
• Voronoi region of each site can be computed in O(n log n) time.• There are n such Voronoi regions to compute.• Total time O(n2 log n).
93

DIVIDE-&-CONQUER ALGORITHM
• M. I. Shamos, D. Hoey [1975], “Closest Point Problems,” FOCS, 208-215.
• D.T. Lee [1978], “Proximity and reachability in the plane,” Tech Report No, 831, Coordinated Sci. Lab., Univ. of Illinois at Urbana.• D.T. Lee [1980], “Two dimensional Voronoi Diagram in the Lp metric,”
JACM 27, 604-618. The first O(n log n) time algorithm to construct the Voronoi Diagram of n point sites in the plane. 94

ALGORITHM Construct Voronoi Diagram (P)INPUT: P = { p1, p2, … , pn} sorted on x-axis.OUTPUT: CH(P) and DCEL of VD(P).1. [BASIS]: if n1 then return the obvious answer.2. [DIVIDE]: Let m n/2
Split P on the median x-coordinate into L = { p1, … , pm} & R = { pm+1, … , pn}.
3. [RECUR]: (a) Recursively compute CH(L) and VD(L). (b) Recursively compute CH(R) and VD(R).
4. [MERGE]: (a) Compute Upper & Lower Bridges of CH(L) and CH(R) & obtain CH(P). (b) Compute the y-monotone dividing chain C between VD(L) & VD(R). (c) VD(P) [C] [VD(L) to the left of C] [VD(R) to the right of C]. (d) return CH(P) & VD(P).
END.
O(1)
O(n)
T(n/2)
T(n/2)
O(n)
T(n) = 2 T(n/2) + O(n) = O( n log n). 95

P = { p1, p2, … , pn} a set of n points in the plane.
96

VD(P) = [C] [VD(L) to the left of C] [VD(R) to the right of C] .
97

VD(L) and CH(L)
98

VD(R) and CH(R)
99

Upper & Lower bridges between CH(L) and CH(R) & two end-rays of chain C.
100

1
2
3
4
5
6
7
8
9
(1,5)
(3,5)
(3,6)
(4,6)
(4,7)
(2,7)
Construct chain C.
101

1
2
3
4
5
6
7
8
9
Construct chain C.
102

1
2
3
4
5
6
7
8
9
Crop VD(L) & VD(R) at C.
103

1
2
3
4
5
6
7
8
9
VD(P) and CH(P)
104

FORTUNE’S ALGORITHM• Steve Fortune [1987], “A Sweepline algorithm for Voronoi Diagrams,”
Algorithmica, 153-174.
• Guibas, Stolfi [1987], “Ruler, Compass and computer: The design and analysis of geometric algorithms,” Proc. of the NATO Advanced Science Institute, series F, vol. 40: Theoretical Foundations of Computer Graphics and CAD, 111-165.
O(n log n) time algorithm by plane-sweep. See AAW animation. Generalization: VD of line-segments and circles.Slides 27 – 49 COSC 6114 105

The Wave Propagation View• Simultaneously drop pebbles on calm lake at n sites.• Watch the intersection of expanding waves.
106

Time as 3rd dimension
x
y x
z=time
y
a a
p
papex of the cone
All sites have identical opaque cones.
107

Time as 3rd dimension
xz
y
• All sites have identical opaque cones.• cone(p) cone(q) = vertical hyperbola h(p,q).• Vertical projection of h(p,q) on the xy base plane is PB(p,q).
p q
base plane
108

Time as 3rd dimension
xz
y
Visible intersection of the cones viewed upward from z = - is VD(P).
base plane
109

Conic Sections: Focus-Directrix
focusf
directrix l
w
h
Eccentricity constant:
hwfwe
0 = e point (focus)0 < e < 1 ellipse e = 1 parabola e > 1 hyperbola
110

sweep plane
sweeplinea
baseplane
x
y
Sweep Plane & Sweep Line
z
111

sweep plane
sweep
line l
aa
baseplanep
v
w u
Sweep Plane & Cone Intersection
Vertical projection of intersection of cone(p) & the sweep plane on the base plane is a parabola with focus p and directrix l.
xy
112

p
Parabolic Evolution
l
focus p
l
xy
113

p
Parabolic Evolution
l
focus p
l
xy
114

Time snapshots of moving parabola associated with site p
p
xy
1 2 3
1
2
3
swee
p li
ne
115

Each parabolic arc of the Front is in some Voronoi region.
Each “break” between 2 consecutive parabolic arcs lies on a Voronoi edge.
The parabolic front Sweep plane opaque. So we don’t see future events. Any part of a parabola inside another one is invisible, since a point (x,y) is inside a parabola iff at that point the cone of the parabola is below the sweep plane. Parabolic Front = visible portions of parabola; those that are on the boundary of the union of the cones past the sweep. Parabolic Front is a y-monotone piecewise-parabolic chain. (Any horizontal line intersects the Front in exactly one point.)
swee
p li
ne
116
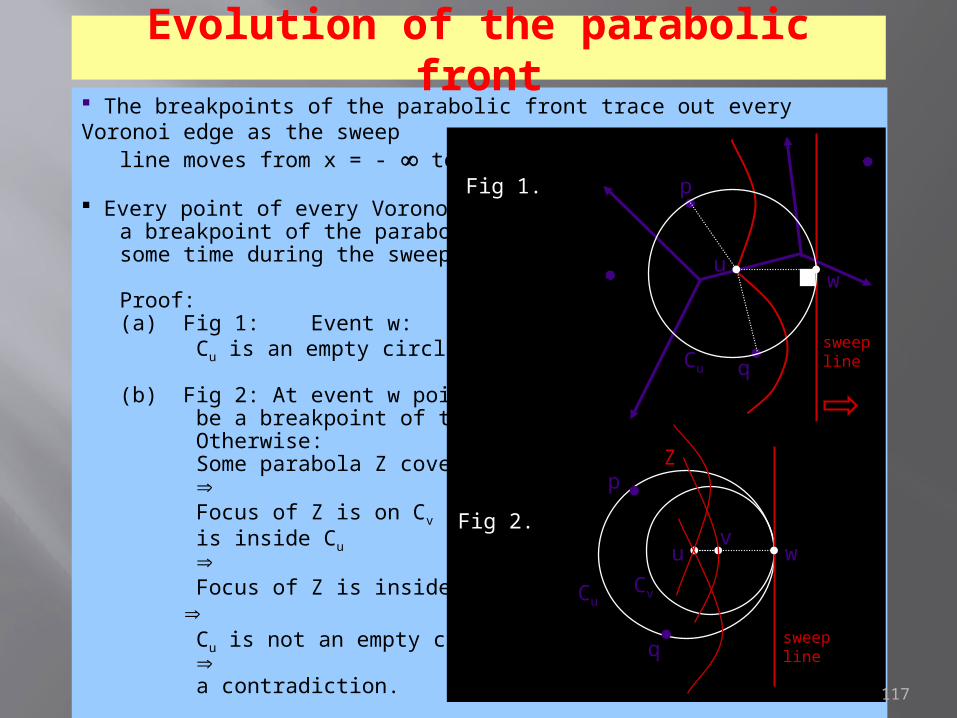
The breakpoints of the parabolic front trace out every Voronoi edge as the sweep line moves from x = - to x = + .
Every point of every Voronoi edge is a breakpoint of the parabolic front at some time during the sweep.
Proof: (a) Fig 1: Event w: Cu is an empty circle.
(b) Fig 2: At event w point u must be a breakpoint of the par. front. Otherwise: Some parabola Z covers u at v Focus of Z is on Cv and Cv is inside Cu Focus of Z is inside Cu
Cu is not an empty circle a contradiction.
Evolution of the parabolic front
p
q
u w
Cu
Fig 1.
Fig 2.wu v
CuCv
p
q
Z
sweepline
sweepline
117

SITE EVENT: Insert into the Parabolic Front.
CIRCLE EVENT: Delete from the Parabolic Front.
DATA STRUCTURES (T & Q)
Event Processing & Scheduling
The Discrete Events
118

SITE EVENTA new parabolic arc is inserted into the front when sweep line hits a new site.
p
q
s
p
q
s
p
q
s
1 2 3
119

SITE EVENT
p
q
s
p
q
s
p
q
s
A parabola cannot appear on the front by breaking through from behind.The following are impossible:
a
ba
b
t t+Dt
a
b
t t+Dtg
a
b
g
A new parabolic arc is inserted into the front when sweep line hits a new site.
120

Circle event w causes parabolic arc b to disappear. a and g cannot belong to the same parabola.
CIRCLE EVENT
w
p
q
s
a
g
b
uw
p
q
s
a
g
b w
p
q
s
a
g
u
121

Q: [SWEEP SCHEDULE: a priority queue] schedule of future events:
all future site-events & some circle-events, i.e., those corresponding to 3 consecutive arcs of the current parabolic front as represented by T.
The others will be discovered & added to the sweep schedule before the sweep lines advances past them.
Conversely, not every 3 consecutive arcs of the current front specify a circle-event. Some arcs may drop out too early.
DATA STRUCTURES (T & Q)
122

Event-driven simulation loop:At each iteration remove the next event (with min x-coordinate) from Q &simulate the effect of the sweep-line advancing past that event point.
Event Processing & Scheduling
123

Event-driven simulation loop:At each iteration remove the next event (with min x-coordinate) from Q &simulate the effect of the sweep-line advancing past that event point.
Event Processing & Scheduling
death(a) : pointing to a circle-event in Q as the meeting point of the
Voronoi edges. (If the edges are diverging, then death(a) = nil.)
Remove circle-event death(a) if:(a) a is split in two by a site-event, or(b) whenever one of the two arcs adjacent to a is
deleted by a circle-event.
a
124

Event-driven simulation loop:At each iteration remove the next event (with min x-coordinate) from Q &simulate the effect of the sweep-line advancing past that event point.
Event Processing & Scheduling
A circle-event update: each parabolic arc b (leaf of T) points to the earliest circle-event, death(b), in Q that would cause deletion of b at the corresponding Voronoi vertex.
death(b)
vs
a
g
b
spurious circle-eventdeath(b’)
s
a
g
b’
b’’
death(b’’)
125

Event-driven simulation loop:At each iteration remove the next event (with min x-coordinate) from Q &simulate the effect of the sweep-line advancing past that event point.
Event Processing & Scheduling
(a,g,d) do not define a circle-event: (a,c,d) is not a circle-event now, it is past the current sweep position.
a
b
a
g
b
cd
d126

|T| = O(n) : the front always has O(n) parabolic arcs, since splits occur at
most n times by site events. Also by Davenport-Schinzel: … a … b … a … b … is impossible. [At most 2n-1 parabolic arcs in T.]
ANALYSIS
|Q| = O(n) : there are at most n site-events and O(n) triples of consecutive
arcs on the parabolic front to define circle-events.Total # events = O(n), Time per event processing = O(log n).
THEOREM: Fortune’s algorithm computes Voronoi Diagram of n sites in the plane using optimal O(n log n) time and O(n) space. 127

DELAUNAY TRIANGULATION
128

Delaunay Triangulation(Slides 50 – 63) Terrain Height Interpolation
Triangulations of Planar Point Sets Delaunay Graph is a Triangulation
129

Terrain Height Interpolation
A perspective view of a terrain.A topographical map of a terrain.
130

Terrain Height Interpolation
A perspective view of a terrain.A topographical map of a terrain.
Terrain: A 2D surface in 3D such that each vertical line intersects it in at most one point.f : 2 . f(p) = height of point p in the domain A of the terrain.
Method: Take a finite sample set P A. Compute f(P), and interpolate on A.
P A
f
131

Triangulations of Planar Point Sets
P = {p1, p2, … , pn } 2.A triangulation of P is a maximal planar straight-line subdivision with vertex set P.
THEOREM: Let P be a set of n points, not all collinear, in the plane. Suppose h points of P are on its convex-hull boundary. Then any triangulation of P has 3n-h-3 edges and 2n-h-2 triangles.
Proof: m = # triangles
3m + h = 2E (each triangle has 3 edges; each edge incident to 2 faces)
Euler: n – E + (m+1) = 2
m = 2n - h - 2, E = 3n – h – 3.
132

Delaunay Graph: Dual of Voronoi Diagram
Delaunay Graph DG(P) as dual of Voronoi Diagram VD(P). 133

Delaunay Graph: Dual of Voronoi Diagram
Delaunay Graph DG(P) as strainght-line dual of Voronoi Diagram VD(P). 134

Delaunay Graph is a Triangulation
THEOREM: Delaunay Graph of P is a straight-line plane graph, & a triangulation of P.
Proof: Follows from the following Lemmas.
Alternative Definition of Delaunay Graph: • A triangle D(pi , pj , pk) is a Delaunay triangle iff the circumscribing circle C(pi , pj , pk) is empty. • Line segment (pi, pj) is a Delaunay edge iff there is an empty circle passing through pi and pj, and no other point in P.
135

Generalizations & Applications Slides 103 - 154
The Post Office ProblemLargest Empty Circle ProblemEuclidean Minimum Spanning TreeCheriton-TarjanTraveling Salesman Problem (TSP)Hamiltonian Cycle Problem (HCP) - Given a graph G(V,E), does G have a Hamiltonian Cycle (HC)?HC is any simple spanning cycle of G, i.e., a cycle that goes through each vertex exactly once. HCP is known to be NP-hard.
Graph MatchingMin Weight Euclidean Matching 136

Eulerian Graph - Definition: A graph G(V,E) is Eulerian if it has an Euler walk. Euler Walk is a cycle that goes through each edge of G exactly once
Robot Motion Planning137

Algorithms and Modern Computer Science
Dr. Marina L. Gavrilova(Sldes 15 – 46)
Dept of Comp. Science, University of Calgary,AB, Canada, T2N1N4
http://www.google.com/url?sa=t&rct=j&q=&esrc=s&source=web&cd=2&ved=0CCMQFjAB&url=http%3A%2F%2Fpages.cpsc.ucalgary.ca%2F~marina%2F335%2FWeek1OverviewADVANCED.ppt&ei=V5sFVOfdCpCXuATwxYHoCA&usg=AFQjCNEe1Ts7V22StQAhKbwN6jyyVONaYA&bvm=bv.74115972,d.c2E
138

VORONOI DIAGRAM (SUPPLEMENTAL)
The Universal Spatial Data Structure (Franz Aurenhammer)
139

Outline Definitions and Examples Properties of Voronoi diagrams Complexity of Voronoi diagrams Constructing Voronoi diagrams
Intuitions Data Structures Algorithm
Running Time Analysis Demo Duality and degenerate cases
140
Nearest Neighbor Search A special case of point-location problem where every face in the subdivision is monotone
Use chain method to get O(log n) time complexity for query
141

142

1
23
4
56
8
7
143

1
23
4
56
8
7
144

1
23
4
56
8
7
145

1
23
4
56
8
7
146

1
23
4
56
8
7
147

1
23
4
56
8
7
148

1
23
4
56
8
7
149

Cluster Analysis
150

Closest Pairs
In collision detection, two closest sites are in greatest danger of collision
Naïve approach: Q(n2)Each site and its closest pair share an edge check all Voronoi edges O(n)Furthest pair cannot be derived directly from the diagram
151

Motion Planning (translational)
Collision avoidance: stay away
from obstacle
152

Fortune’s Algorithm Revisited
Cones Idea H/W implementation
The curve of intersection of two cones projects to a line.
153

45 deg Cone
distance=heightsite
154

Cone (cont)
intersection of cone equal-distance point
155

Cone (cont)When viewed from –Z, we got colored V-cells
156

Nearest Distance Function
Viewed from here[less than]
157
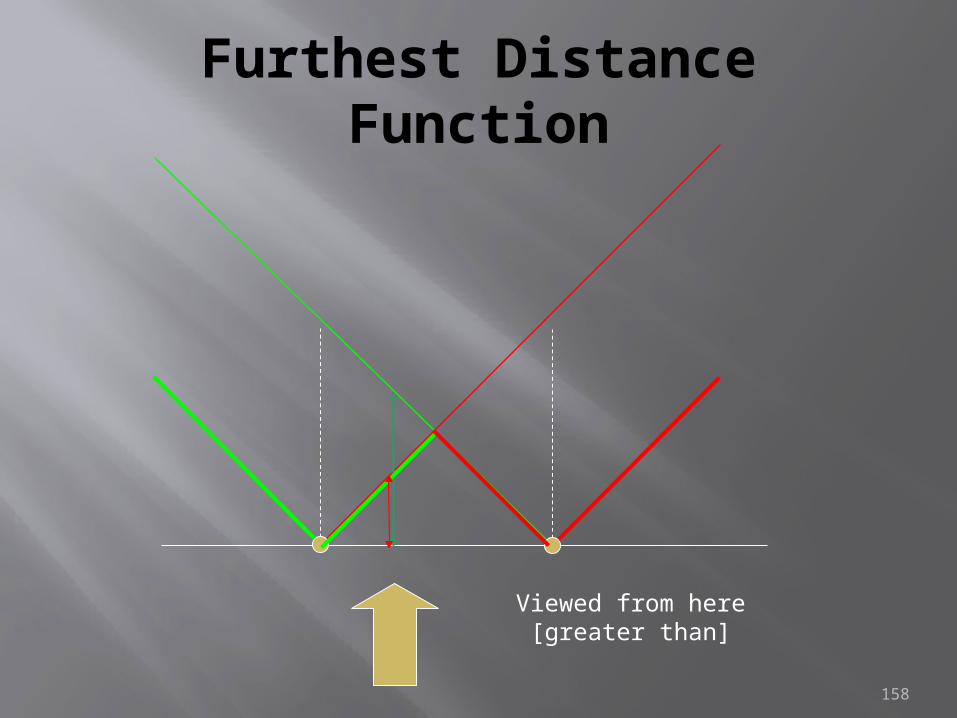
Furthest Distance Function
Viewed from here[greater than]
158

Fortune’s Algorithm (Cont)
Cone slicing
Cone cut up by sweep plane and L are sweeping toward the right.
159

Fortune’s Algorithm (Cont)
Viewed from z = -, The heavy curve is the parabolic front.How the 2D
algorithm and the 3D cones are related…
160

Generalized Voronoi Diagram
V(points), Euclidean distance V(points, lines, curves, …)Distance function: Euclidean, weighted, farthest
161
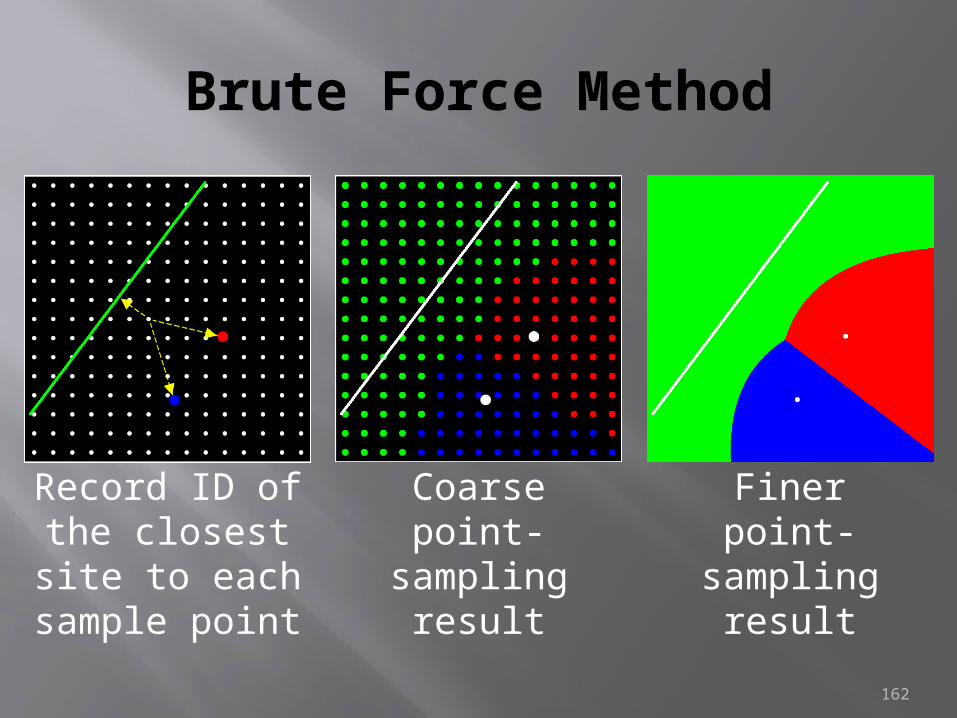
Brute Force Method
Record ID of the closest site to each sample point
Coarsepoint-
samplingresult
Finerpoint-
samplingresult
162

Graphics Hardware Acceleration
Our 2-part discrete Voronoi
diagram representation
Distance
Depth Buffer
Site IDs
Color Buffer
Simply rasterize the cones using
graphics hardware
Haeberli90, Woo97163

Algorithm Associate each primitive with the corresponding distance mesh
Render each distance mesh with depth test on
Voronoi edges: found by continuation methods
164

Ex: Voronoi diagram between a point and a line
165

Distance Meshes
line curve polygon
166

Applications (Mosaic)
167

Hausner01, siggraph
168

Medial Axis Computation
Medial axes as part of Voronoi
diagram169
Piano Mover: Real-time Motion Planning (static and dynamic)
Plan motion of piano through 100K triangle model
Distance buffer of floorplan used as potential field
170

Variety of Voronoi Diagram
(regular) Voronoi diagram
Furthest distance Voronoi diagram
171

Minimum Enclosing Circle
Center of MEC is at the vertex of furthest site Voronoi diagram
172

REFERENCES1. Voronoi Diagrams and Delaunay Trianglulations www.cse.yorku.ca/~andy/courses/.../CG9-Voronoi.pptx
2. Algorithms and Modern Computer Science Dr. Marina L. Gavrilova http://pages.cpsc.ucalgary.ca/~marina/331/Future%20Topics%20331.pdf
3. Voronoi Diagram (Supplemental) The Universal Spatial Data Structure (Franz Aurenhammer) http://www.google.com/url?sa=t&rct=j&q=&esrc=s&source=web&cd=1&ved=0CB0QFjAA&url=http%3A%2F%2F140.129.20.249%2F~jmchen%2Fcompg%2Fslides%2Fvoro-apps.ppt&ei=k4MaVKb5J4KXuASKqYHwCQ&usg=AFQjCNHndXguEM9aKKXpg8pmwf6jEL_m9g&bvm=bv.75097201,d.c2E
173

References – Contd.4.Voronoi Diagram - PowerPoint PPT Presentation http://www.google.com/url?sa=t&rct=j&q=&esrc=s&source=web&cd=1&ved=0CB0QFjAA&url=http%3A%2F%2F140.129.20.249%2F~jmchen%2Fcompg%2Fslides%2Fvoro-apps.ppt&ei=k4MaVKb5J4KXuASKqYHwCQ&usg=AFQjCNHndXguEM9aKKXpg8pmwf6jEL_m9g&bvm=bv.75097201,d.c2E
5. VoronoiDiagrams — A Survey of a Fundamental Geometric Data Structure FRANZ AURENHAMMER file:///E:/Voronoi%20Power%20Diagrams%20%20folder/Paper%20Power%20Diagrams%20Voronoi%20Diagrams%20A%20Survey%20of%20a%20Fundamental%20Geometric%20Data%20Structure.pdf
6. Lecture 7: Voronoi Diagrams. Presented by Allen Miu. http://nms.lcs.mit.edu/~aklmiu/6.838/L7.pdf
174

QUERRIES ?
175

Copyright © 2022 FDOKUMEN