Making Foreign Direct Investment Work for Sub-Saharan Africa
Upload
khangminh22Category
view
1download
0
Foreign Investment Survey, 2013
Economic Statistics and National Accounts Department
Ministry of Development Planning and Statistics State of Qatar, Doha
July, 2014

Foreign Investment Survey, 2013 Page I |
Preface
Foreign investment, especially in term of direct investment does not only help the
developing countries in filling the resources gaps, i.e. both domestic savings and foreign
exchange, but it has also a role in restructuring the developing countries’ economy via the
transfer of technology and managerial skills. In addition, the creation of employment and
the promotion of exports are also seen as the other benefits.
The Qatar National Vision 2030 aims at attracting continuous investment for a sustainable development. Cross-border capital infusion including transfer of advanced technologies has been playing a crucial role in the accomplishment of this progressive vision.
In order to better measure international financial transactions, MDPS in
collaboration with QCB, conducted a survey of Foreign Investment (FI) in the State of Qatar in 2010 for the years 2008 and 2009. The survey was updated and repeated in 2013 to collect data for the years 2010, 2011 and 2012. The main objective of the Foreign Investment Survey is to collect comprehensive data on foreign investment positions and transactions. The detailed results of the 2013 FI survey are featured in this report.
We would like to take this opportunity to express our gratitude and sincere thanks
to all the source agencies for their cooperation in making available the required data for the
Foreign Investment Survey, 2013. Our thanks are also extended to all the staff members
who were involved in the conduct of the survey and in bringing out this publication.
Doha, Qatar Dr. Saleh Bin Mohammed Al-Nabit July, 2014 Minister,
Ministry of Development Planning and Statistics
Foreign Investment Survey, 2013 Page II |
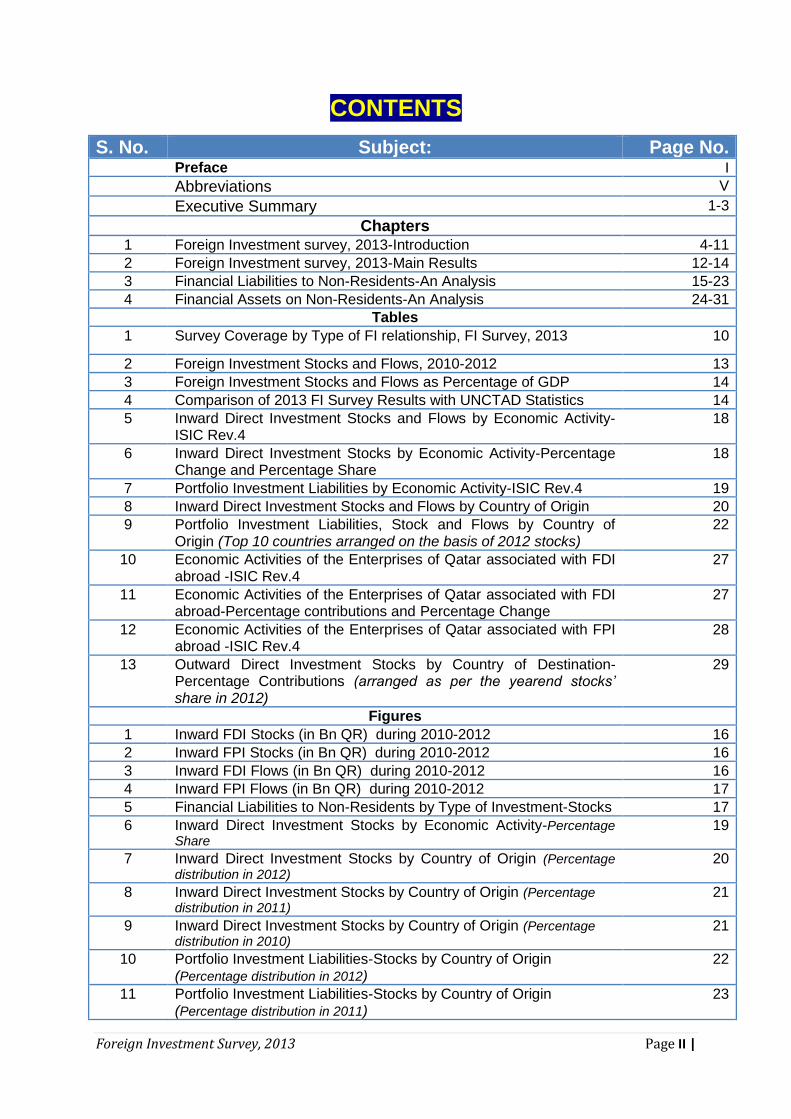
CONTENTS
S. No. Subject: Page No. Preface I
Abbreviations V
Executive Summary 1-3
Chapters
1 Foreign Investment survey, 2013-Introduction 4-11
2 Foreign Investment survey, 2013-Main Results 12-14
3 Financial Liabilities to Non-Residents-An Analysis 15-23
4 Financial Assets on Non-Residents-An Analysis 24-31
Tables
1 Survey Coverage by Type of FI relationship, FI Survey, 2013 10
2 Foreign Investment Stocks and Flows, 2010-2012 13
3 Foreign Investment Stocks and Flows as Percentage of GDP 14
4 Comparison of 2013 FI Survey Results with UNCTAD Statistics 14
5 Inward Direct Investment Stocks and Flows by Economic Activity-ISIC Rev.4
18
6 Inward Direct Investment Stocks by Economic Activity-Percentage Change and Percentage Share
18
7 Portfolio Investment Liabilities by Economic Activity-ISIC Rev.4 19
8 Inward Direct Investment Stocks and Flows by Country of Origin 20
9 Portfolio Investment Liabilities, Stock and Flows by Country of Origin (Top 10 countries arranged on the basis of 2012 stocks)
22
10 Economic Activities of the Enterprises of Qatar associated with FDI abroad -ISIC Rev.4
27
11 Economic Activities of the Enterprises of Qatar associated with FDI abroad-Percentage contributions and Percentage Change
27
12 Economic Activities of the Enterprises of Qatar associated with FPI abroad -ISIC Rev.4
28
13 Outward Direct Investment Stocks by Country of Destination-Percentage Contributions (arranged as per the yearend stocks’ share in 2012)
29
Figures
1 Inward FDI Stocks (in Bn QR) during 2010-2012 16
2 Inward FPI Stocks (in Bn QR) during 2010-2012 16
3 Inward FDI Flows (in Bn QR) during 2010-2012 16
4 Inward FPI Flows (in Bn QR) during 2010-2012 17
5 Financial Liabilities to Non-Residents by Type of Investment-Stocks 17
6 Inward Direct Investment Stocks by Economic Activity-Percentage Share
19
7 Inward Direct Investment Stocks by Country of Origin (Percentage distribution in 2012)
20
8 Inward Direct Investment Stocks by Country of Origin (Percentage distribution in 2011)
21
9 Inward Direct Investment Stocks by Country of Origin (Percentage distribution in 2010)
21
10 Portfolio Investment Liabilities-Stocks by Country of Origin (Percentage distribution in 2012)
22
11 Portfolio Investment Liabilities-Stocks by Country of Origin (Percentage distribution in 2011)
23
Foreign Investment Survey, 2013 Page III |
S. No. Subject: Page No. 12 Portfolio Investment Liabilities-Stocks by Country of Origin
(Percentage distribution in 2010) 23
13 Outward FDI stocks (in Bn QR) during 2010-12 25
14 Outward FPI stocks (in Bn QR) during 2010-12 25
15 Outward FDI flows (in Bn QR) during 2010-12 25
16 Outward FPI flows (in Bn QR) during 2010-12 26
17 Financial Assets on Non-Residents by Type of Investment-Stocks 26
18 Outward Direct Investment Stocks by Country of destination (Percentage distribution in 2012)
29
19 Outward Direct Investment Stocks by Country of destination (Percentage distribution in 2011)
30
20 Outward Direct Investment Stocks by Country of destination (Percentage distribution in 2010)
30
Annexes
1 Manual on the Concepts and Terminologies Associated with the Foreign Investment Survey, 2013
32-42
2 Role of Foreign Investment Statistics and Reference Indicators 43-46
3 Foreign Investment Survey, 2013: Questionnaire 47-59
References
1 Balance of Payment and International Investments Position Manual,
Sixth Edition (BPM6), Washington, DC, USA: International
Monetary Fund (IMF), 2009
2 OECD Benchmark Definition of Foreign Direct Investment, Fourth
Edition 2008, Paris, Organisation For Economic Co-Operation and
Development (OECD), 2008
3 Balance of Payments Compilation Guide, Washington, DC, USA:
International Monetary Fund, 1995
4 Foreign Direct Investment Statistics in ESCWA Member Countries,
Economic And Social Commission for Western Asia (ESCWA), 16
November 2011
5 The Coordinated Direct Investment Survey Guide; Statistics
Department (STA), International Monetary Fund, March 2010
6 The Coordinated Portfolio Investment Survey Guide; Second
Edition, STA, IMF, 2002
7 Foreign investment survey 2010, Doha, Qatar, Economic Statistics
Department, Qatar Statistics Authority, February, 2012
8 System of National Accounts 2008: United Nations Statistics
Division (UNSD), International Monetary Fund (IMF), Organization
of Economic Corporation and Development (OECD), World Bank
and Statistical Office of European Countries (EUROSTAT)
9 Institutional cooperation between central banks and the statistical
offices for producing macroeconomic statistics, Claudia Dziobek
and Florina Tanase, IFC Bulletin No 28, STA-IMF
10 Report on Foreign Investment Statistics Mission to Qatar by Stuart
Brown, Doha, Qatar, September 23-27, 2012, STA, IMF
11 Report on Foreign Investment Statistics by Christie F.J. Richards,
Doha, Qatar, Qatar Statistical Agency (QSA), April 14-16, 2013

Foreign Investment Survey, 2013 Page IV |
S. No. Subject: Page No. 12 Report on Foreign Investment Statistics Mission to Qatar (MDPS),
By Tigran Terlemezian, April 6- May 15, 2014
13 Networking of Expertise on Foreign Direct Investment in the Member States of the ESCWA, Evaluation Report, Tigran G. Terlemezian, ESCWA, and August 27, 2006
14 An Introductory Booklet for some of the concepts and terminologies associated with Foreign Investment Survey
15 Qatar National Vision, 2030
16 Emiri decree on Foreign Investment, 2000 and Subsequent Amendments
***

Foreign Investment Survey, 2013 Page V |
Abbreviations
BIS Bank for International Settlements
BMP6 Balance of Payment Manual Version 6
CDIS Coordinated Direct Investment Survey
CPIS Coordinated Portfolio Investment Survey
DI Direct Investor
DIE Direct Investment Enterprise
ESD Department of Economic Statistics and National Accounts
EUROSTAT Statistical Office of European Countries
FD Financial Derivatives
FDI Foreign Direct Investment
FE Fellow Enterprise
FI Foreign Investment
FPI Foreign Portfolio Investment
IIP International Investment Position
ISIC Rev. 4 International Standard Industrial Classification of All Economic Activities Revision 4
IMF International Monetary Fund
MDPS Ministry of Development Planning and Statistics
OECD Organization of Economic Corporation and Development
QCB Qatar Central Bank
OI Other Investment
QIA Qatar Investment Authority
QR Qatari Riyal
QSA Qatar Statistics Authority
UNCTAD United Nations Conference on Trade and Development

Executive Summary
Foreign Investment Survey, 2013 Page 2 |
Executive Summary
The motive for a foreign investment is crucial in determining how linkages and externalities
develop. There are four main motives for investment: (1) seek natural resources; (2) seek new
markets; (3) restructure existing foreign production; and (4) seek new strategic assets.
One striking feature of the world economy in the recent years has been the growth of
foreign direct investment (FDI), or investment by transnational corporations or multinational
enterprises in foreign countries in order to control assets and manage production activities in those
countries. FDI has grown at a phenomenal rate since the early 1980s, and the world market for it
has become more competitive. Developing countries in general and the countries in the West Asia
in particular are becoming increasingly attractive investment destinations, in part because they can
offer investors a range of "created" assets.
The State of Qatar’s commitment in this direction has been witnessed through the passing
of the Foreign Investment Law by an Emiri decree in mid-October 2000, the setting up of the
“Investment Promotion Department” at the Ministry of Economy and Commerce, the law
establishing the Qatar Science and Technology Park, the law establishing the Qatar Financial
Centre, and the new Commercial Law in 2006. Qatar welcomes foreign participation in joint
ventures through technology supply, market administration and equity participation. Qatar has
already made good headway in developing a political and organizational climate that supports the
business sector. More steps to enhance competitiveness and attract investment are being taken to
infuse more capital in the State’s economy in an environment of a dynamic and increasingly
borderless international economy.
Transactions between Qatar and other countries are recorded in the accounts of the
Balance of Payments (BOP). The Qatar Central Bank (QCB) is responsible for the preparation of
the BOP, including data on foreign investments. In order to better measure international financial
transactions, MDPS in collaboration with QCB, launched its first Foreign Investment (FI) Survey,
in 2010 and conducted the survey for the second time in 2013. 2013 FI Survey aimed to collect
detailed data relating to year 2010, 2011 and major transactions data for 2012.
The objective of the survey was to cover all major establishments (private and public)
operating in the national economy. But the information could be gathered only from privately
owned companies and the public corporations. All the international financial transactions made by
individuals as well as those made by Government were also not covered. However, as a result
editing/validating survey results from the viewpoint of the counterpart economy by using mirror
statistics reported by counterpart economies in Coordinated Direct Investment Survey (CDIS), the
final data on outward direct investment presented in this report include some investments by the
government or individuals. Users are accordingly cautioned that the survey results are not strictly
comparable with the BOP statement of the QCB because of the coverage limitations of this
survey data.
Foreign Investment Survey, 2013 Page 3 |
The major findings of FI survey, 2013 are as follows:
The foreign direct investment (FDI) stocks in the country have touched 111.8 Bn QR at the
end of 2012, showing a rise of 1.2% and 0.5% when compared to the corresponding
position at 110.5 Bn QR and 111.2 Bn QR at the end of 2011 and 2010 respectively;
During 2010, FDI flows of 17 Bn QR have been registered. In the following year 2011,
flows dropped to -0.7 Bn QR. However the recovery in the FDI flows (1.3 Bn QR) has been
noticed in 2012;
Though FDI has targeted various economic activities, four major economic sectors
account for 91% of the Qatar’s total inward FDI at the end of December, 2012. "Mining
and Quarrying" sector tops the list with inward FDI stocks accounting to 49.4 Bn QR or
44% of the total of FDI at the end of 2012. The shares of the "Manufacturing", “Building
and Construction” and “Professional, scientific, technical, administrative and support
service activities” sectors have been 22%, 14% and 11% respectively;
Many countries have contributed to inward FDI stocks in 2012 but five countries namely
United States of America (34.5%), Netherlands (15.3%), France (10.6%), Saudi Arabia
(8.1%), and Italy (6.3%) dominate the list and cover over 74.8% of the total inward direct
investment;
FI Survey, 2013 has also revealed that total outward direct investment from Qatar at the
end of 2012, recorded a figure of 73.9 Bn QR, showing an increase of 19.8% and 56.2%
when compared to the corresponding position at 61.7 Bn QR and 47.3 Bn QR by end of
2011 and 2010 respectively. On the other hand, investment net outflows have reached 12.2
Bn QR in 2012;
In 2012, the following sectors of the economy, Qatar has played a lead role in FDI
abroad: “Financial and insurance activities” (38%), “Professional, scientific, technical,
administrative and support service activities” (27%), “Mining and Quarrying” (12%), and
“Construction” (10%); and
In 2012, Qatar has targeted its major investment in five countries namely: Indonesia
(19.8%), Kuwait (17.1%), France (10.8%), United Arab Emirates (9.1%) and United States
of America (6.6%), representing 63.4% of total outward direct investment.
* Readers may note that value of stocks for 2012 are provisional as these have been
derived primarily by adding the FI transactions for 2012 to the Stocks value, estimated
for 2011, besides utilizing the data of counterpart economies obtained from IMF’s
CDIS.
***

Foreign Investment Survey, 2013 Page 4 |
1. Foreign Investment Survey,
2013
-Introduction
Foreign Investment Survey, 2013 Page 5 |
1. Foreign Investment Survey, 2013- Introduction
Introduction
Foreign investment, especially in term of direct investment does not only help
the developing countries in filling the resources gaps, i.e. both domestic savings and
foreign exchange, but it has also a role in restructuring the developing countries’
economy via the transfer of technology and managerial skills. In addition, the
creation of employment and the promotion of exports are also seen as the other
benefits.
1.2 Foreign Investment Survey (FIS) is an important source of reliable and up-to-
date information on foreign direct investments as well as other cross-border
transactions and positions involving equity and equity securities. Such information is
needed for economic analysis, for measuring how investments have grown over
time, and in understanding the impact of these investments on economic
development. The increase in direct investment flows has laid the foundation for a
marked expansion of international production by transnational corporations. As FDI
flows have grown in volume, they have also become more widely dispersed among
home (outward investor) and host (recipient) countries.
1.3 FDI is increasingly becoming an important source of private external finance
for developing countries including the countries in the Middle East. It is different from
other major types of external private capital flows in that it is motivated largely by the
investors' long-term prospects for making profits in production activities that they
directly control. One key feature of liberalization has been greater openness to
foreign direct investment (FDI) as a means of acquiring technologies, skills and
access to international markets, and of entering dynamic trade and production
systems internal to multinational enterprises (MNEs).
1.4 Multinational corporations looking to invest not only take for granted the
presence of state-of-the-art FDI policy frameworks and a range of business
facilitation measures but also seek a combination of cost reduction, larger markets,
and "created" assets that can help them maintain a competitive edge. Created
assets include communications infrastructure, marketing networks, technology, and
innovative capacity and are critical for enabling firms to maintain their
competitiveness in a rapidly changing world. The rising importance of such assets is
probably the single most important shift that has occurred among the economic
determinants of FDI in a liberalizing and globalizing world economy.
1.5 While FDI represents investment in production facilities, its significance for
developing countries is even greater. Not only can FDI add to investible resources

Foreign Investment Survey, 2013 Page 6 |
and capital formation, but, perhaps more important, it is also a means of transferring
production technology, skills, innovative capacity, and organizational and managerial
practices between locations, as well as of accessing international marketing
networks.
1.6 Qatar Vision 2030 provides a roadmap in developing a political and
organizational climate that supports the foreign investment in the quality
infrastructure projects. Steps to enhance competitiveness and attract foreign
investment have been taken to pervade more capital in the State’s economy in an
environment of a dynamic and globalized economy.
1.7 Qatar’s commitment in this direction was initiated through the passing of the
Foreign Investment Law by an Emiri decree in mid-October 2000, the setting up of
the “Investment Promotion Department” at the Ministry of Economy and Commerce,
the law establishing the Qatar Science and Technology Park, the law establishing
the Qatar Financial Centre, and the new Commercial Law in 2006.
Foreign Investment Statistics
1.8 Internationally harmonized, timely and reliable statistics are essential to
assess the trends and developments of the FI activity, and to assist policy makers in
dealing with the challenges of global markets. The usefulness of investment statistics
depends on their compliance with several quality parameters: a) alignment with
international standards; b) avoiding inconsistencies between countries and reducing
global discrepancies; c) achieving consistent statistical series over time; d)
timeliness; and e) allowing a meaningful exchange of data between partner
countries.
1.9 The statistics on foreign investment (flows and earnings) are collected
primarily for use in compilation of balance of payments of Qatar, which is in turn then
used in national accounts for measuring Gross Domestic Income. The data on year-
end stocks are used to measure the international investment patterns between Qatar
and the rest of the world. Also the directional statistics (by country) is conducted as a
part of the coordinated by the International Monetary Fund (IMF) global investment
surveys: Coordinated Direct Investment Survey (CDIS); and Coordinated Portfolio
Investment Survey (CPIS).
1.10 Keeping this in view, Ministry of Development Planning and Statistics (MDPS)
in collaboration with Qatar Central Bank (QCB) conducted Foreign Investment (FI)
Survey 2013 to collect detailed data on international financial transactions relating to
the years 2010, 2011 and 2012.
Foreign Investment Survey, 2013 Page 7 |
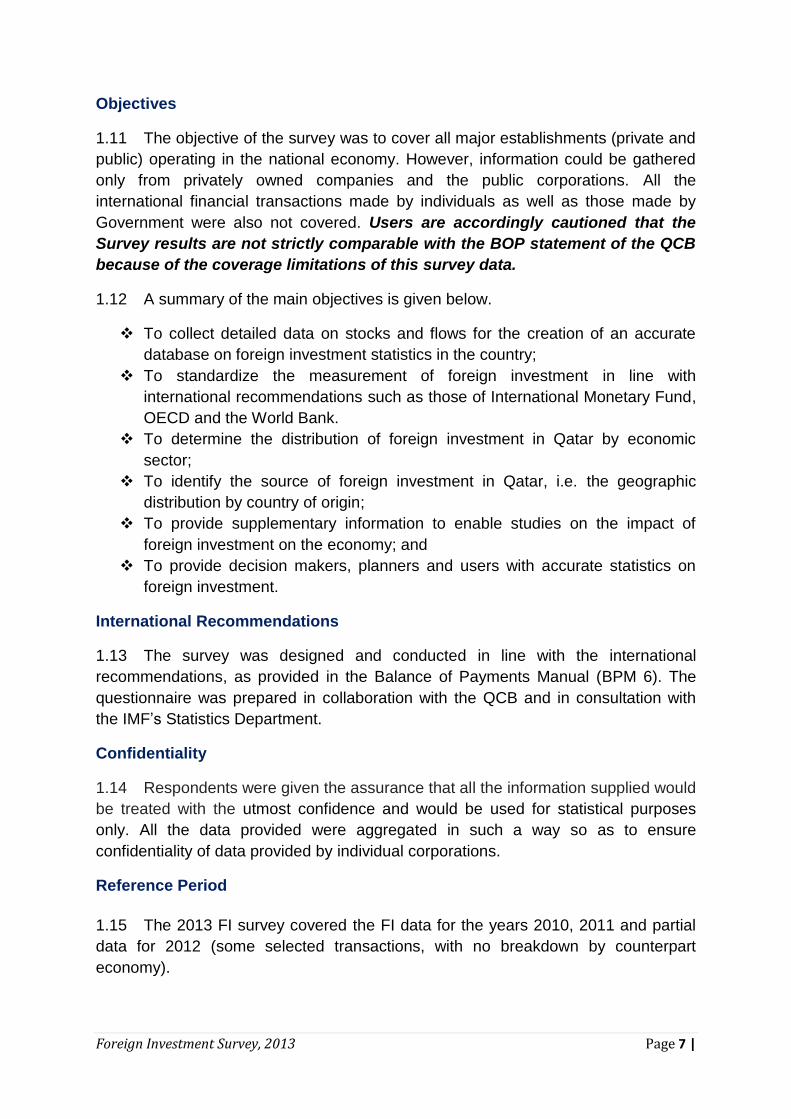
Objectives
1.11 The objective of the survey was to cover all major establishments (private and
public) operating in the national economy. However, information could be gathered
only from privately owned companies and the public corporations. All the
international financial transactions made by individuals as well as those made by
Government were also not covered. Users are accordingly cautioned that the
Survey results are not strictly comparable with the BOP statement of the QCB
because of the coverage limitations of this survey data.
1.12 A summary of the main objectives is given below.
To collect detailed data on stocks and flows for the creation of an accurate
database on foreign investment statistics in the country;
To standardize the measurement of foreign investment in line with
international recommendations such as those of International Monetary Fund,
OECD and the World Bank.
To determine the distribution of foreign investment in Qatar by economic
sector;
To identify the source of foreign investment in Qatar, i.e. the geographic
distribution by country of origin;
To provide supplementary information to enable studies on the impact of
foreign investment on the economy; and
To provide decision makers, planners and users with accurate statistics on
foreign investment.
International Recommendations
1.13 The survey was designed and conducted in line with the international
recommendations, as provided in the Balance of Payments Manual (BPM 6). The
questionnaire was prepared in collaboration with the QCB and in consultation with
the IMF’s Statistics Department.
Confidentiality
1.14 Respondents were given the assurance that all the information supplied would
be treated with the utmost confidence and would be used for statistical purposes
only. All the data provided were aggregated in such a way so as to ensure
confidentiality of data provided by individual corporations.
Reference Period
1.15 The 2013 FI survey covered the FI data for the years 2010, 2011 and partial
data for 2012 (some selected transactions, with no breakdown by counterpart
economy).

Foreign Investment Survey, 2013 Page 8 |
Coverage
1.16 FI Survey, 2013 aimed to cover all major resident enterprises operating
in the national economy which can be categorized into three groups:
Enterprises with FDI;
Enterprises with portfolio investments;
Enterprises with other investments which include 100% Qatari enterprises
having transactions from abroad in the form of loans, investments etc.
among others.
1.17 However, 2013 FI Survey did not cover exhaustively ALL the enterprises
falling under each of the above groups indicated above, because objective reasons
existed, including limitations of indicators available to use in identifying and selecting
enterprises for each and every group; or for cost-effectiveness of the survey.
1.18 Accordingly the coverage of FI Survey, 2013 could be described as: "all major
resident enterprises operating in the national economy" identified from the Annual
Economic Survey of the Ministry (as used in FI Survey, 2010) coupled with the listing
of the Qatar Chamber of Commerce for the year, 2012 with an aim to cover:
All major (above a threshold based on “Paid up capital”) resident enterprises
in Qatar, with potential for direct investment, e.g. all major potential direct
investors excluding government, individuals and households;
All major (above a threshold) resident enterprises in Qatar with potential for
portfolio investment abroad, e.g. all major potential portfolio investors
excluding government, individuals and households;
All major (above a threshold) resident enterprises in Qatar with potential for
large other investment positions and transactions with non-residents: assets
on and liabilities to non-residents, excluding government, individuals and
households;
1.19 The FI Survey, 2010 covering both foreign investment enterprises and foreign
investor enterprises formed the foundation for FI Survey, 2013. The initial frame was
then updated using the listing of the largest foreign investment enterprises selected
from the relevant source listing of the Qatar Chamber of Commerce.
1.20 In FI Survey, 2013 a total of 646 enterprises with potential foreign investments
were identified from the sources listed above, and 601 questionnaires were actually
dispatched. Data were collected from 445 enterprises, of which only 305 enterprises
reported their transactions with non-residents.

Foreign Investment Survey, 2013 Page 9 |
Collection Method
1.21 In FI Survey, 2013 field work was conducted in two phases, as follows:
At the first phase, the questionnaires were hand delivered to each enterprise
using specially recruited and trained enumerators,
For the second phase, part time accountants were recruited to check and
validate the returned questionnaires. Later a follow-up with on non-response
of the largest enterprises was carried out to pursue with the enterprises for
missing data and outliers on returned questionnaires. Further limited
imputations were also made, to fill the data gaps caused by the non-
response.
Field Operations and Training Workshop
1.22 Field work for the survey was conducted during March, 2013 to August, 2013
with the help of part-time enumerators. An introductory booklet called “Concepts and
Terminologies Associated with Foreign Investment Survey, 2013” was prepared and
distributed to enumerators for facilitating the smooth form filling by the respondents.
A training Workshop on FI Survey was also conducted by the ESD of MDPS for the
enumerators, before proceeding to the fieldwork. ESD in the Ministry, in close
collaboration with QCB conducted this workshop. Enumerators were duly trained by
MDPS and QCB representatives on concept, definitions and valuation for ensuring
the collection of the desired information.
FI Survey Questionnaire
1.23 The main topics covered in the questionnaire were grouped under the
following headings:
Identification information;
Shareholders’ Equity;
Direct Investment, inward and outward;
Portfolio and other investment, assets and liabilities; and
Financial derivatives
Income Receipts and Payments
Data Editing/Validation of Data
1.24 The survey results have been checked, edited-validated at enterprise level
record for low coverage and low response rates, internal consistency, through
analytical checks (using the method of calculating position data from transactions);
I. Imputations
1.25 Imputations and data editing/validation were made for 140 enterprises that
returned 2013 FI Survey questionnaire with no data filled in, except the identification
information.
Foreign Investment Survey, 2013 Page 10 |
II. Analytical checks
1.26 The ESD also implemented data editing/validation through analytical checks
at reporting enterprise level. The end year positions for 2010, 2011 and 2012 were
cross checked to ensure a higher level of consistency between two surveys using
the method of calculating position data from transactions data (as reported in 2013
FI Survey and 2010 FI Survey).
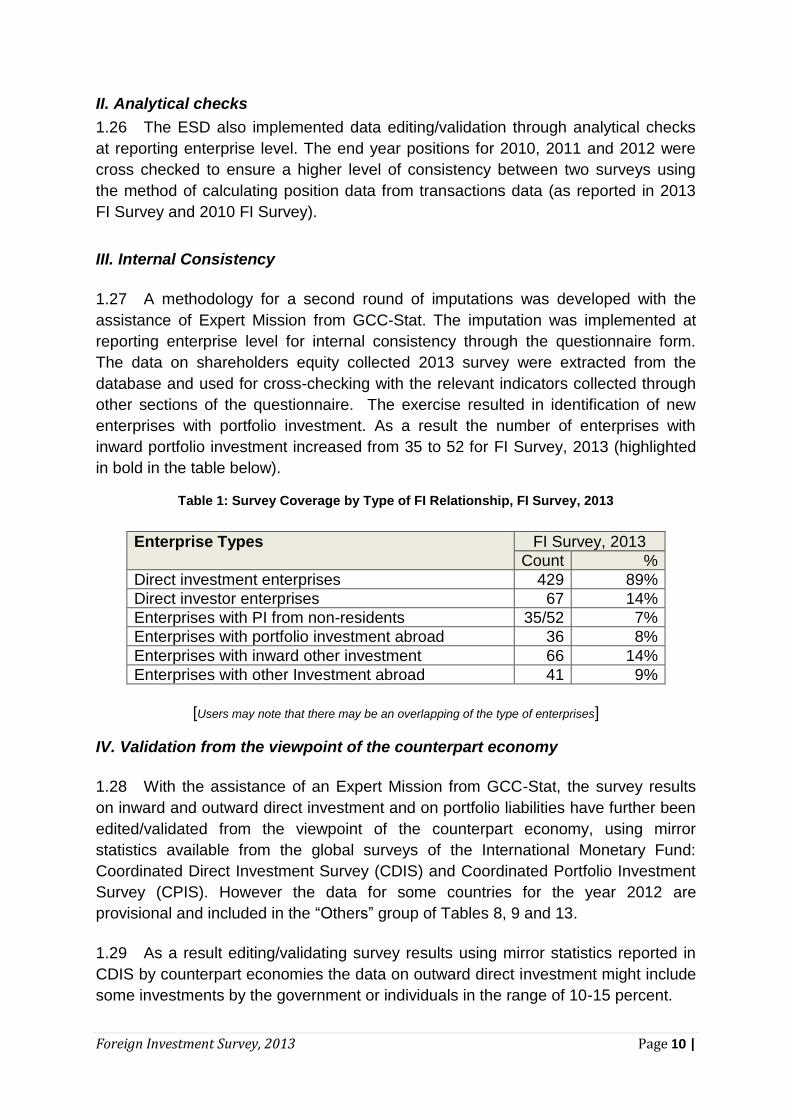
III. Internal Consistency
1.27 A methodology for a second round of imputations was developed with the
assistance of Expert Mission from GCC-Stat. The imputation was implemented at
reporting enterprise level for internal consistency through the questionnaire form.
The data on shareholders equity collected 2013 survey were extracted from the
database and used for cross-checking with the relevant indicators collected through
other sections of the questionnaire. The exercise resulted in identification of new
enterprises with portfolio investment. As a result the number of enterprises with
inward portfolio investment increased from 35 to 52 for FI Survey, 2013 (highlighted
in bold in the table below).
Table 1: Survey Coverage by Type of FI Relationship, FI Survey, 2013
Enterprise Types FI Survey, 2013
Count %
Direct investment enterprises 429 89%
Direct investor enterprises 67 14%
Enterprises with PI from non-residents 35/52 7%
Enterprises with portfolio investment abroad 36 8%
Enterprises with inward other investment 66 14%
Enterprises with other Investment abroad 41 9%
[Users may note that there may be an overlapping of the type of enterprises]
IV. Validation from the viewpoint of the counterpart economy
1.28 With the assistance of an Expert Mission from GCC-Stat, the survey results
on inward and outward direct investment and on portfolio liabilities have further been
edited/validated from the viewpoint of the counterpart economy, using mirror
statistics available from the global surveys of the International Monetary Fund:
Coordinated Direct Investment Survey (CDIS) and Coordinated Portfolio Investment
Survey (CPIS). However the data for some countries for the year 2012 are
provisional and included in the “Others” group of Tables 8, 9 and 13.
1.29 As a result editing/validating survey results using mirror statistics reported in
CDIS by counterpart economies the data on outward direct investment might include
some investments by the government or individuals in the range of 10-15 percent.

Foreign Investment Survey, 2013 Page 11 |
1.30 Using the above described mirror statistics the end year positions for 2010,
2011 and 2012 were further edited/validated at the level of aggregate data broken
down by counterpart economy.
V. Data Editing/Validation for Banking Sector
1.31 In addition, the FI Survey, 2013 results for banking sector were
edited/validated- in close cooperation with the relevant staff of the Qatar Central
Bank (QCB). The validation and editing have been conducted using banking sector
statistics available from the QCB and the Bank for International Settlements (BIS),
affecting banks’ other investment asset and liability positions with non-residents, and
consequently total other investment assets and liability positions.
Report Format
1.32 The document has been organized in the four chapters entitled: [1]. “Foreign
Investment Survey, 2013-Introduction”; [2]: “Foreign Investment Survey, 2013- Main
Results”; [3]: “Financial Liabilities to Non-residents”- An Analysis, primarily covering
the Inward Foreign Investments; and [4] Financial Assets on Non-residents -An
Analysis”, discussing the Outward Foreign Investments. It may also be added that
the income receipts and payments statistics has not been included in the report due
to low response from the enterprises. Users may also note that the economic
activities of the enterprises in this report have been classified as per ISIC Rev.4
unlike the FI Survey Report of 2010.
1.33 The Manual on “Concepts and Terminologies Associated with Foreign
Investment Survey, 2013” is available at Annex-1. “Role of Foreign Investment
Statistics and Reference Indicators” and the FI Survey, 2013 questionnaire are
available at Annex-2 and Annex-3 of this report.
***

Foreign Investment Survey, 2013 Page 12 |
2. Foreign Investment Survey, 2013-Main
Results
Foreign Investment Survey, 2013 Page 13 |
2. Foreign Investment Survey, 2013- Main Results
MDPS in collaboration with QCB launched its first Foreign Investment (FI)
Survey, in 2010 to better measure international financial transactions. The survey
covered the period 2008 and 2009. The next FI survey has been conducted for the
second time in 2013. This survey has been more focused in terms of better
coverage, more professional questionnaire design etc. to collect detailed data
relating to years 2010, 2011 and for 2012.
2.2 The objective of the survey has been to cover all major establishments
(private and public) operating in the national economy. However, information could
be gathered only from privately owned companies and the public corporations. All
the international financial transactions made by individuals as well as those made by
Government were also not covered. Users are accordingly cautioned on the
limitations of the survey data to this extent.
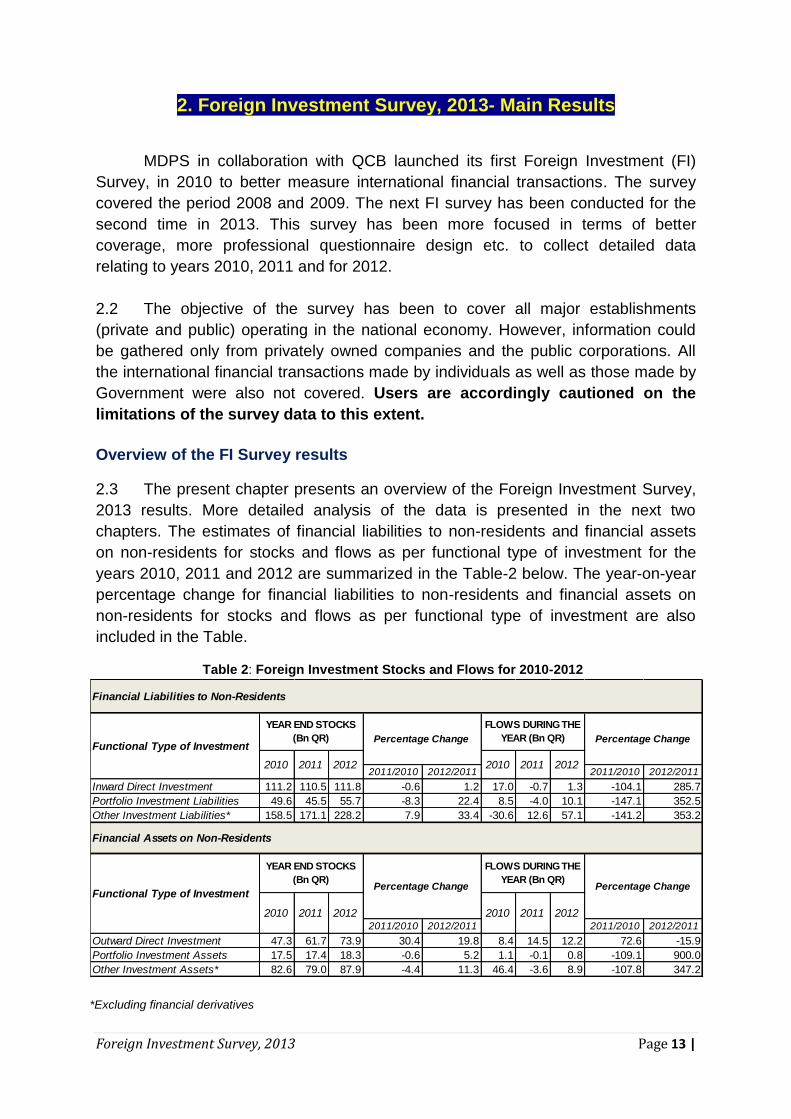
Overview of the FI Survey results
2.3 The present chapter presents an overview of the Foreign Investment Survey,
2013 results. More detailed analysis of the data is presented in the next two
chapters. The estimates of financial liabilities to non-residents and financial assets
on non-residents for stocks and flows as per functional type of investment for the
years 2010, 2011 and 2012 are summarized in the Table-2 below. The year-on-year
percentage change for financial liabilities to non-residents and financial assets on
non-residents for stocks and flows as per functional type of investment are also
included in the Table.
Table 2: Foreign Investment Stocks and Flows for 2010-2012
*Excluding financial derivatives
2011/2010 2012/2011 2011/2010 2012/2011
Inward Direct Investment 111.2 110.5 111.8 -0.6 1.2 17.0 -0.7 1.3 -104.1 285.7
Portfolio Investment Liabilities 49.6 45.5 55.7 -8.3 22.4 8.5 -4.0 10.1 -147.1 352.5
Other Investment Liabilities* 158.5 171.1 228.2 7.9 33.4 -30.6 12.6 57.1 -141.2 353.2
2011/2010 2012/2011 2011/2010 2012/2011
Outward Direct Investment 47.3 61.7 73.9 30.4 19.8 8.4 14.5 12.2 72.6 -15.9
Portfolio Investment Assets 17.5 17.4 18.3 -0.6 5.2 1.1 -0.1 0.8 -109.1 900.0
Other Investment Assets* 82.6 79.0 87.9 -4.4 11.3 46.4 -3.6 8.9 -107.8 347.2
Percentage Change
2010 2011 2012 2010 2011 2012
Functional Type of Investment
YEAR END STOCKS
(Bn QR)Percentage Change
FLOWS DURING THE
YEAR (Bn QR)
Financial Assets on Non-Residents
Financial Liabilities to Non-Residents
Functional Type of Investment
YEAR END STOCKS
(Bn QR) Percentage Change
FLOWS DURING THE
YEAR (Bn QR) Percentage Change
2010 2011 2012 2010 2011 2012
Foreign Investment Survey, 2013 Page 14 |
2.4 It may be seen from the Table 2 that the stocks of foreign direct investment
(FDI) in the country have touched 111.8 Bn QR at the end of 2012, showing a rise of
1.2% when compared to the corresponding position at 110.5 Bn QR at the end of
2011;
2.5 During 2010, FDI flows of 17 Bn QR have been registered. In the following
year 2011, flows dropped to QR -0.7 Bn. However the recovery in the FDI flows (1.3
Bn QR) has been noticed in 2012;
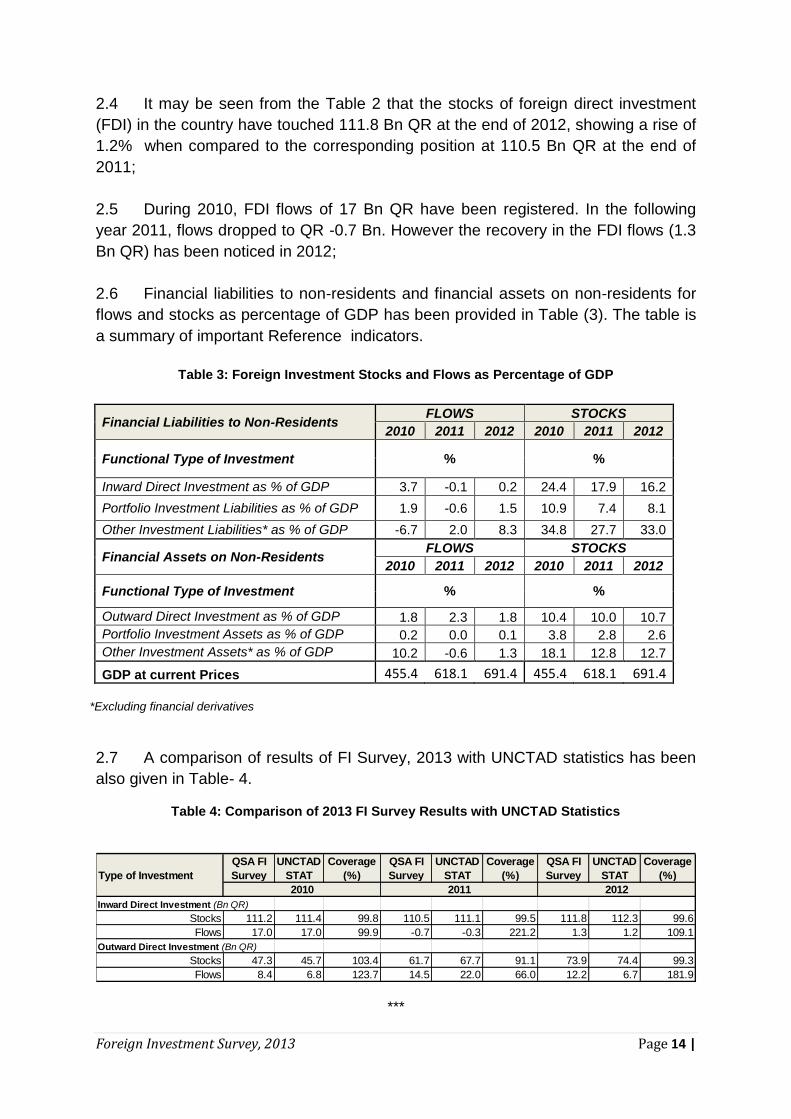
2.6 Financial liabilities to non-residents and financial assets on non-residents for
flows and stocks as percentage of GDP has been provided in Table (3). The table is
a summary of important Reference indicators.
Table 3: Foreign Investment Stocks and Flows as Percentage of GDP
Financial Liabilities to Non-Residents FLOWS STOCKS
2010 2011 2012 2010 2011 2012
Functional Type of Investment % %
Inward Direct Investment as % of GDP 3.7 -0.1 0.2 24.4 17.9 16.2
Portfolio Investment Liabilities as % of GDP 1.9 -0.6 1.5 10.9 7.4 8.1
Other Investment Liabilities* as % of GDP -6.7 2.0 8.3 34.8 27.7 33.0
Financial Assets on Non-Residents FLOWS STOCKS
2010 2011 2012 2010 2011 2012
Functional Type of Investment % %
Outward Direct Investment as % of GDP 1.8 2.3 1.8 10.4 10.0 10.7
Portfolio Investment Assets as % of GDP 0.2 0.0 0.1 3.8 2.8 2.6
Other Investment Assets* as % of GDP 10.2 -0.6 1.3 18.1 12.8 12.7
GDP at current Prices 455.4 618.1 691.4 455.4 618.1 691.4
*Excluding financial derivatives
2.7 A comparison of results of FI Survey, 2013 with UNCTAD statistics has been
also given in Table- 4.
Table 4: Comparison of 2013 FI Survey Results with UNCTAD Statistics
***
QSA FI
Survey
UNCTAD
STAT
Coverage
(%)
QSA FI
Survey
UNCTAD
STAT
Coverage
(%)
QSA FI
Survey
UNCTAD
STAT
Coverage
(%)
Inward Direct Investment (Bn QR)
Stocks 111.2 111.4 99.8 110.5 111.1 99.5 111.8 112.3 99.6
Flows 17.0 17.0 99.9 -0.7 -0.3 221.2 1.3 1.2 109.1
Outward Direct Investment (Bn QR)
Stocks 47.3 45.7 103.4 61.7 67.7 91.1 73.9 74.4 99.3
Flows 8.4 6.8 123.7 14.5 22.0 66.0 12.2 6.7 181.9
2010 2011 2012
Type of Investment

Foreign Investment Survey, 2013 Page 15 |
3. Financial Liabilities to Nonresidents-An
Analysis
Foreign Investment Survey, 2013 Page 16 |
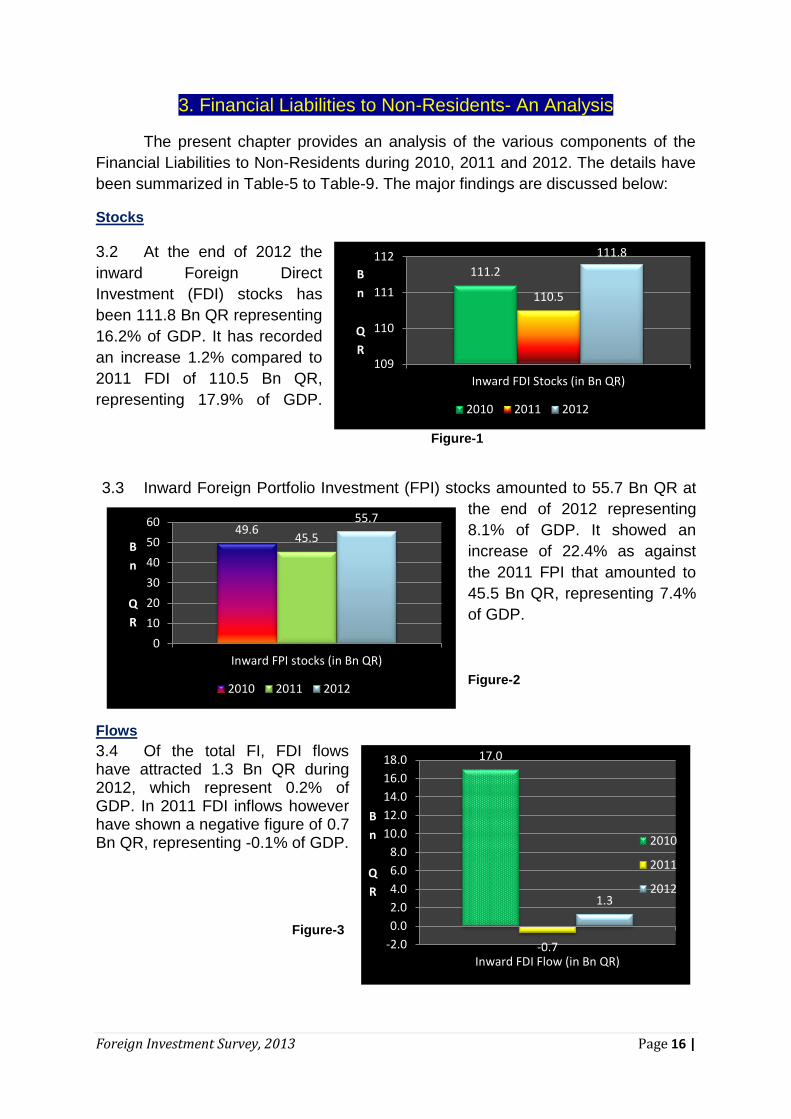
3. Financial Liabilities to Non-Residents- An Analysis
The present chapter provides an analysis of the various components of the
Financial Liabilities to Non-Residents during 2010, 2011 and 2012. The details have
been summarized in Table-5 to Table-9. The major findings are discussed below:
Stocks
3.2 At the end of 2012 the
inward Foreign Direct
Investment (FDI) stocks has
been 111.8 Bn QR representing
16.2% of GDP. It has recorded
an increase 1.2% compared to
2011 FDI of 110.5 Bn QR,
representing 17.9% of GDP.
Figure-1
3.3 Inward Foreign Portfolio Investment (FPI) stocks amounted to 55.7 Bn QR at
the end of 2012 representing
8.1% of GDP. It showed an
increase of 22.4% as against
the 2011 FPI that amounted to
45.5 Bn QR, representing 7.4%
of GDP.
Figure-2
Flows
3.4 Of the total FI, FDI flows have attracted 1.3 Bn QR during 2012, which represent 0.2% of GDP. In 2011 FDI inflows however have shown a negative figure of 0.7 Bn QR, representing -0.1% of GDP.
Figure-3
111.2
110.5
111.8
109
110
111
112
Inward FDI Stocks (in Bn QR)
B
n
Q
R
2010 2011 2012
49.6 45.5
55.7
0
10
20
30
40
50
60
Inward FPI stocks (in Bn QR)
B
n
Q
R
2010 2011 2012
17.0
-0.7
1.3
-2.0
0.0
2.0
4.0
6.0
8.0
10.0
12.0
14.0
16.0
18.0
Inward FDI Flow (in Bn QR)
B
n
Q
R
2010
2011
2012
Foreign Investment Survey, 2013 Page 17 |
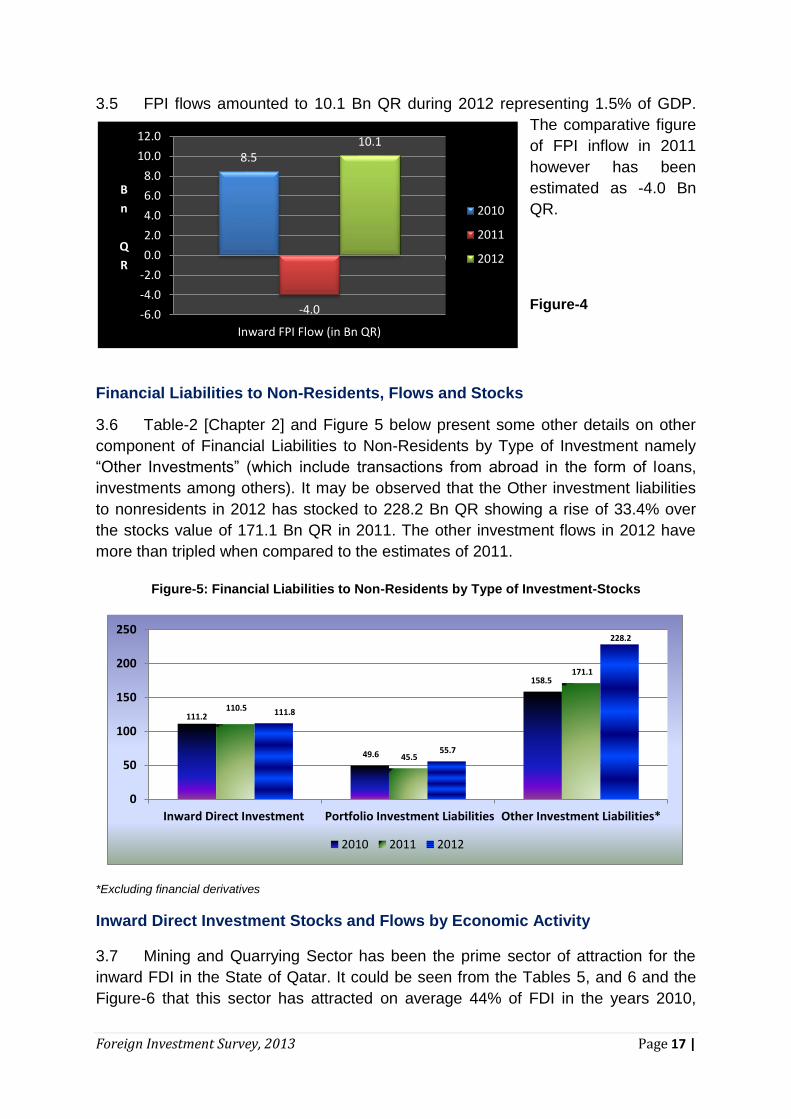
3.5 FPI flows amounted to 10.1 Bn QR during 2012 representing 1.5% of GDP.
The comparative figure
of FPI inflow in 2011
however has been
estimated as -4.0 Bn
QR.
Figure-4
Financial Liabilities to Non-Residents, Flows and Stocks
3.6 Table-2 [Chapter 2] and Figure 5 below present some other details on other
component of Financial Liabilities to Non-Residents by Type of Investment namely
“Other Investments” (which include transactions from abroad in the form of loans,
investments among others). It may be observed that the Other investment liabilities
to nonresidents in 2012 has stocked to 228.2 Bn QR showing a rise of 33.4% over
the stocks value of 171.1 Bn QR in 2011. The other investment flows in 2012 have
more than tripled when compared to the estimates of 2011.
Figure-5: Financial Liabilities to Non-Residents by Type of Investment-Stocks
*Excluding financial derivatives
Inward Direct Investment Stocks and Flows by Economic Activity
3.7 Mining and Quarrying Sector has been the prime sector of attraction for the
inward FDI in the State of Qatar. It could be seen from the Tables 5, and 6 and the
Figure-6 that this sector has attracted on average 44% of FDI in the years 2010,
111.2
49.6
158.5
110.5
45.5
171.1
111.8
55.7
228.2
0
50
100
150
200
250
Inward Direct Investment Portfolio Investment Liabilities Other Investment Liabilities*
2010 2011 2012
8.5
-4.0
10.1
-6.0
-4.0
-2.0
0.0
2.0
4.0
6.0
8.0
10.0
12.0
Inward FPI Flow (in Bn QR)
B
n
Q
R
2010
2011
2012

Foreign Investment Survey, 2013 Page 18 |
2011 and 2012. Manufacturing commands about 22% of FDI during these three
years. Construction shares about 13% of the total FDI in the country. Professional,
scientific, technical and other support services have attracted about 10% of the FDI.
Thus these for sectors of economic activity capture around 90% of FDI in Qatar.
More sectoral details on the levels, percentage contributions, percentage changes
etc. on the stocks and flows of FDI in the last three years are presented in the Tables
5-6 and Figure-6 below:
Table-5: Inward Direct Investment Stocks and Flows by Economic Activity
(ISIC Rev.4)
(Bn QR)
Table-6: Inward Direct Investment Stocks by Economic Activity
(Percentage Share and Percentage change)
2010 2011 2012 2010 2011 2012
Mining and quarrying 50.1 47.6 49.4 2.3 -2.4 1.8
Manufacturing 24.5 25.4 24.5 0.2 1.0 -0.9
Electricity, air conditioning supply; water supply;
sewerage and waste management0.0 0.0 0.0 0.0 0.0 0.0
Construction 13.9 15.5 15.5 7.7 1.6 0.1
Wholesale and retail trade, accommodation and
food service activities3.2 4.7 4.8 0.2 1.5 0.1
Transportation and storage; Information and
communication2.0 2.2 2.1 -0.1 0.1 -0.1
Financial and insurance activities 7.3 3.5 3.3 3.5 -3.8 -0.2
Real estate activities 0.0 0.0 0.0 0.0 0.0 0.0
Professional, scientific, technical, administrative
and support service activities10.0 11.4 12.0 3.1 1.4 0.6
Social and other service activities 0.2 0.2 0.2 0.1 0.0 0.0
Total 111.2 110.5 111.8 17.0 -0.7 1.3
YEAR END STOCKS FLOWS DURING THE YEAREconomic Activity
2010 2011 2012 2011/2010 2012/2011
Mining and quarrying 45.0 43.1 44.2 -4.9 3.7
Manufacturing 22.0 23.0 21.9 3.9 -3.6
Electricity, air conditioning supply; water
supply; sewerage and waste management0.0 0.0 0.0 - -
Construction 12.5 14.0 13.9 11.5 0.3
Wholesale and retail trade, accommodation and
food service activities2.9 4.3 4.3 45.9 1.7
Transportation and storage; Information and
communication1.8 1.9 1.8 6.9 -4.5
Financial and insurance activities 6.5 3.2 3.0 -52.1 -4.9
Real estate activities 0.0 0.0 0.0 - -
Professional, scientific, technical,
administrative and support service activities9.0 10.3 10.7 13.7 5.0
Social and other service activities 0.2 0.2 0.2 -13.1 21.6
Total 100.0 100.0 100.0 -0.6 1.2
Percentage Share of Year end
Stocks (Bn QR)Economic Activity
Percentage Change

Foreign Investment Survey, 2013 Page 19 |
Figure-6: Inward Direct Investment Stocks by Economic Activity-Percentage Share
Portfolio Investment Liabilities by Economic Activity-ISIC Rev.4
3.8 “Professional, scientific, technical and administrative support service activities”
shared almost half of the inward portfolio investment liabilities in the country. “Financial and
Insurance activities” represent another 45% of such investments. Thus these two groups of
economic activity account for the 95% of the portfolio investment liabilities in the State of
Qatar. More details may be seen in the Table-7.
Table-7: Portfolio Investment Liabilities by Economic Activity
(ISIC Rev.4)
-
5.0
10.0
15.0
20.0
25.0
30.0
35.0
40.0
45.0
50.0
Mining and quarrying
Manufacturing Electricity, air conditioning
supply; water
supply; sewerage and
waste management
Construction Wholesale and retail trade,
accommodation
and food service
activities
Transportation and storage;
Information and
communication
Financial and insurance activities
Real estate activities
Professional, scientific, technical,
administrative and support
service activities
Social and other service
activities
2010 2011 2012
2010 2011 2012 2010 2011 2012 2010 2011 2012
Mining and quarrying 2.1 1.8 2.1 4.3 4.0 3.8 0.2 -0.3 0.3
Manufacturing 0.1 0.1 3.3 0.3 0.3 5.9 0.0 0.0 3.2
Electricity, air conditioning supply;
water supply; sewerage and waste
management
0.0 0.0 0.0 0.0 0.0 0.0 0.0 0.0 0.0
Construction 0.2 0.3 0.3 0.4 0.6 0.6 0.2 0.0 0.0
Wholesale and retail trade,
accommodation and food service
activities
0.0 0.0 0.0 0.0 0.0 0.0 0.0 0.0 0.0
Transportation and storage;
Information and communication0.1 0.3 0.3 0.1 0.6 0.5 0.1 0.2 0.0
Financial and insurance activities 21.9 20.5 23.4 44.2 45.0 42.1 5.0 -1.4 2.9
Real estate activities 0.0 0.0 0.0 0.0 0.0 0.0 0.0 0.0 0.0
Professional, scientific, technical,
administrative and support service
activities
25.1 22.5 26.2 50.6 49.5 47.1 3.1 -2.6 3.7
Social and other service activities 0.0 0.0 0.0 0.0 0.0 0.0 0.0 0.0 0.0
Total 49.6 45.5 55.7 100.0 100.0 100.0 8.5 -4.0 10.1
YEAR END
STOCKS (Bn QR)
YEAR END STOCKS-
PERCENTAGE
SHAREEconomic Activity
FLOWS DURING
THE YEAR (Bn QR)
Foreign Investment Survey, 2013 Page 20 |
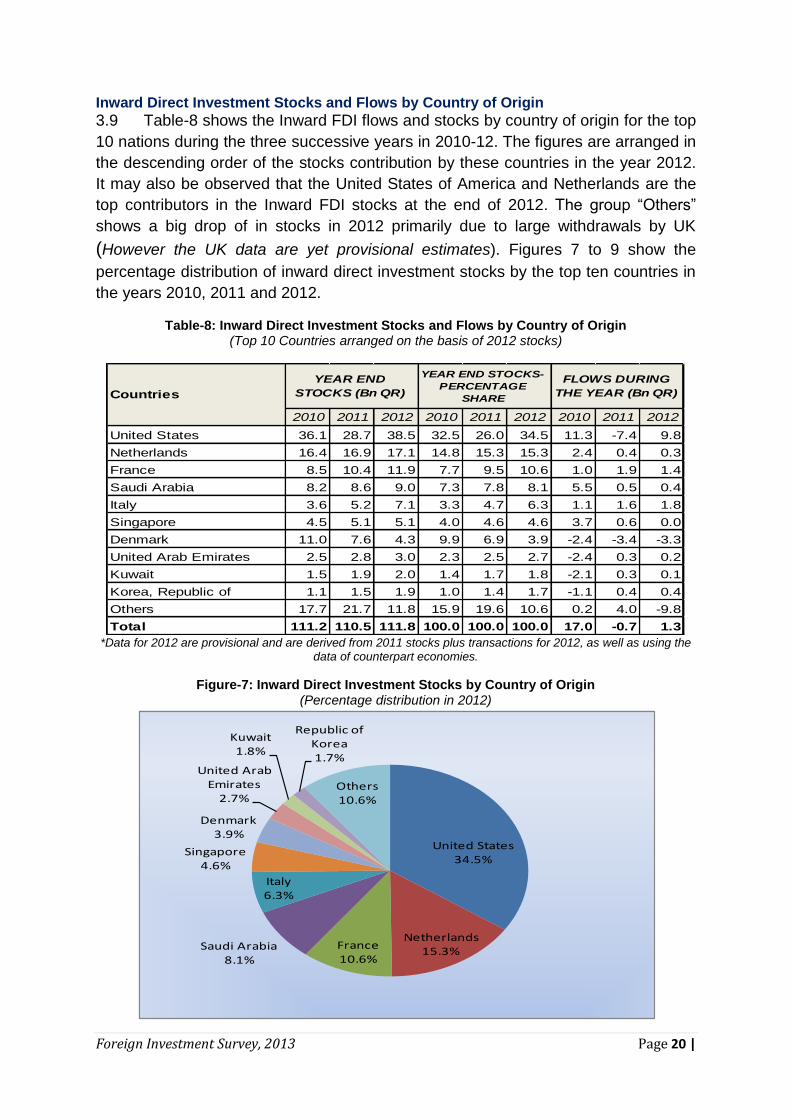
Inward Direct Investment Stocks and Flows by Country of Origin
3.9 Table-8 shows the Inward FDI flows and stocks by country of origin for the top
10 nations during the three successive years in 2010-12. The figures are arranged in
the descending order of the stocks contribution by these countries in the year 2012.
It may also be observed that the United States of America and Netherlands are the
top contributors in the Inward FDI stocks at the end of 2012. The group “Others”
shows a big drop of in stocks in 2012 primarily due to large withdrawals by UK
(However the UK data are yet provisional estimates). Figures 7 to 9 show the
percentage distribution of inward direct investment stocks by the top ten countries in
the years 2010, 2011 and 2012.
Table-8: Inward Direct Investment Stocks and Flows by Country of Origin
(Top 10 Countries arranged on the basis of 2012 stocks)
*Data for 2012 are provisional and are derived from 2011 stocks plus transactions for 2012, as well as using the
data of counterpart economies.
Figure-7: Inward Direct Investment Stocks by Country of Origin (Percentage distribution in 2012)
2010 2011 2012 2010 2011 2012 2010 2011 2012
United States 36.1 28.7 38.5 32.5 26.0 34.5 11.3 -7.4 9.8
Netherlands 16.4 16.9 17.1 14.8 15.3 15.3 2.4 0.4 0.3
France 8.5 10.4 11.9 7.7 9.5 10.6 1.0 1.9 1.4
Saudi Arabia 8.2 8.6 9.0 7.3 7.8 8.1 5.5 0.5 0.4
Italy 3.6 5.2 7.1 3.3 4.7 6.3 1.1 1.6 1.8
Singapore 4.5 5.1 5.1 4.0 4.6 4.6 3.7 0.6 0.0
Denmark 11.0 7.6 4.3 9.9 6.9 3.9 -2.4 -3.4 -3.3
United Arab Emirates 2.5 2.8 3.0 2.3 2.5 2.7 -2.4 0.3 0.2
Kuwait 1.5 1.9 2.0 1.4 1.7 1.8 -2.1 0.3 0.1
Korea, Republic of 1.1 1.5 1.9 1.0 1.4 1.7 -1.1 0.4 0.4
Others 17.7 21.7 11.8 15.9 19.6 10.6 0.2 4.0 -9.8
Total 111.2 110.5 111.8 100.0 100.0 100.0 17.0 -0.7 1.3
YEAR END
STOCKS (Bn QR)
YEAR END STOCKS-
PERCENTAGE
SHARECountries
FLOWS DURING
THE YEAR (Bn QR)
United States34.5%
Netherlands15.3%
France10.6%
Saudi Arabia8.1%
Italy6.3%
Singapore4.6%
Denmark3.9%
United Arab Emirates
2.7%
Kuwait1.8%
Republic of Korea1.7%
Others10.6%

Foreign Investment Survey, 2013 Page 21 |
Figure-8: Inward Direct Investment Stocks by Country of Origin
(Percentage distribution in 2011)
Figure 9: Inward Direct Investment Stocks by Country of Origin
(Percentage distribution in 2010)
United States26%
Netherlands15%
France9%
Saudi Arabia8%
Italy5%
Singapore5%
Denmark7%
United Arab Emirates
2%
Kuwait2%
Republic of Korea
1%
Others20%
United States33%
Netherlands15%
France8%
Saudi Arabia7%
Italy3%
Singapore4%
Denmark10%
United Arab Emirates
2%
Kuwait1%
Republic of Korea
1% Others16%

Foreign Investment Survey, 2013 Page 22 |
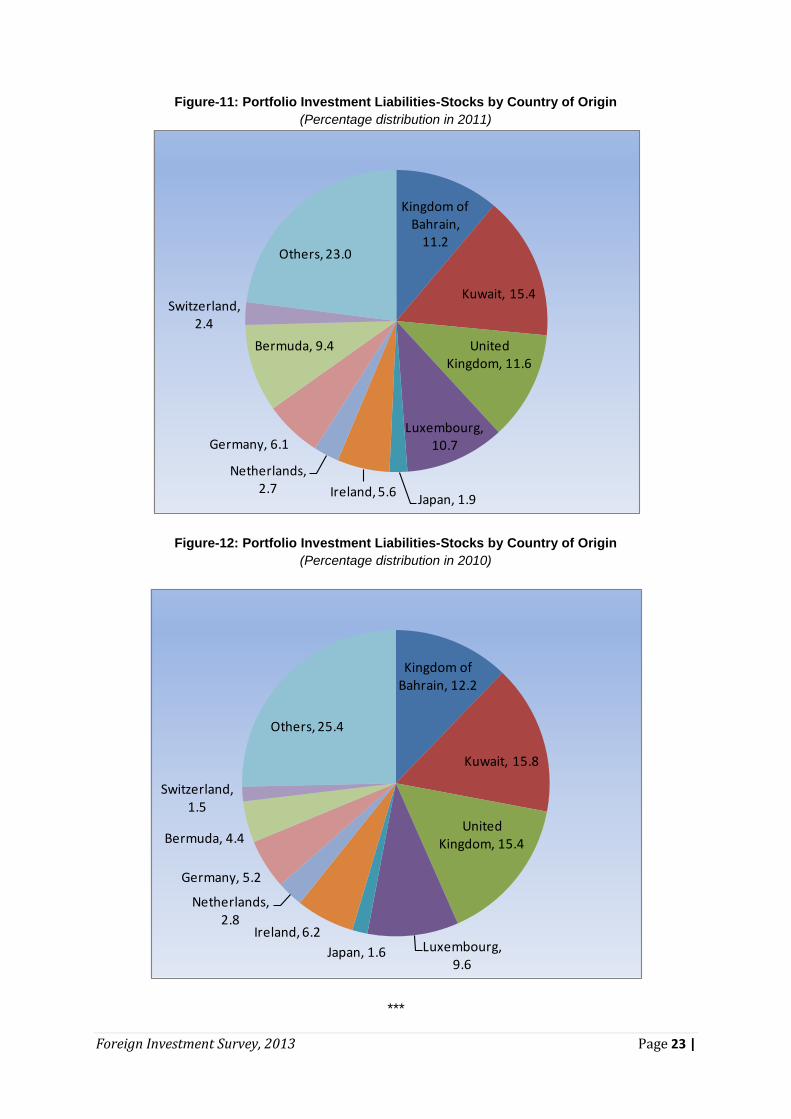
Portfolio Investment Liabilities, Flows and Stocks by Country of Origin
3.10 The portfolio investment liabilities (Flows and Stocks) of the Qatar from the major
nations in the world for the years 2010, 2011 and 2012 are presented in the Table 9. The
Table below shows the percentage share of each of these major countries in the year end
stocks. The countries are arranged in the descending order from top, based on their
contribution made in the year 2012. It could easily be observed that Kingdom of Bahrain
topped the list with 14% share in the year end portfolio investment stocks. Kuwait (13.6%),
United Kingdom (9.4%), Luxembourg (9.0%) and Japan (8.3%) follow the list. More details
could be seen in the Table-9 and the three figures 10 to 12.
Table-9: Portfolio Investment Liabilities, Stock and Flows by Country of Origin,
(Top 10 arranged on the basis of 2012 stocks) (Bn QR)
*Data for 2012 are provisional and are derived from 2011 stocks plus transactions for 2012, as well as using the
data of counterpart economies.
Figure-10: Portfolio Investment Liabilities-Stocks by Country of Origin
(Percentage distribution in 2012)
2010 2011 2012 2010 2011 2012 2010 2011 2012
Kingdom of Bahrain 6.0 5.1 7.8 12.2 11.2 14.0 1.9 -1.0 2.7
Kuwait 7.8 7.0 7.6 15.8 15.4 13.6 -2.8 -0.8 0.6
United Kingdom 7.6 5.3 5.2 15.4 11.6 9.4 2.7 -2.3 -0.1
Luxembourg 4.8 4.9 5.0 9.6 10.7 9.0 0.8 0.1 0.2
Japan 0.8 0.9 4.6 1.6 1.9 8.3 -0.2 0.1 3.8
Ireland 3.1 2.6 3.3 6.2 5.6 6.0 1.1 -0.5 0.8
Netherlands 1.4 1.2 3.2 2.8 2.7 5.7 0.5 -0.1 1.9
Germany 2.6 2.8 3.0 5.2 6.1 5.5 0.9 0.2 0.2
Bermuda 2.2 4.3 3.0 4.4 9.4 5.4 1.6 2.1 -1.3
Switzerland 0.8 1.1 1.3 1.5 2.4 2.3 -0.3 0.3 0.2
Others 12.6 10.5 11.6 25.4 23.0 20.8 2.2 -2.1 1.1
Total 49.6 45.5 55.7 100.0 100.0 100.0 8.5 -4.0 10.1
FLOWS DURING
THE YEAR (Bn QR)
YEAR END
STOCKS (Bn QR)
YEAR END STOCKS-
PERCENTAGE SHARECountries
Kingdom of Bahrain
14%
Kuwait14%
United Kingdom
9%
Luxembourg9%
Japan8%
Ireland6%
Netherlands6%
Germany6%
Bermuda5%
Switzerland2%
Others21%
Foreign Investment Survey, 2013 Page 23 |
Figure-11: Portfolio Investment Liabilities-Stocks by Country of Origin
(Percentage distribution in 2011)
Figure-12: Portfolio Investment Liabilities-Stocks by Country of Origin
(Percentage distribution in 2010)
***
Kingdom of Bahrain,
11.2
Kuwait, 15.4
United Kingdom, 11.6
Luxembourg, 10.7
Japan, 1.9Ireland, 5.6
Netherlands, 2.7
Germany, 6.1
Bermuda, 9.4
Switzerland, 2.4
Others, 23.0
Kingdom of Bahrain, 12.2
Kuwait, 15.8
United Kingdom, 15.4
Luxembourg, 9.6
Japan, 1.6
Ireland, 6.2
Netherlands, 2.8
Germany, 5.2
Bermuda, 4.4
Switzerland, 1.5
Others, 25.4

Foreign Investment Survey, 2013 Page 24 |
4. Financial Assets on
Nonresidents –
An Analysis
Foreign Investment Survey, 2013 Page 25 |
4. Financial Assets on Non-residents-An Analysis
This chapter covers an analysis of the various components of the Financial
Assets on Non-residents during 2010, 2011 and 2012. The details have been
summarized in Table-10 to Table 14. However the coverage is limited to the extent,
the survey data refer only to corporations and exclude transactions and liabilities
made on behalf of government. The key findings are discussed below:
Stocks
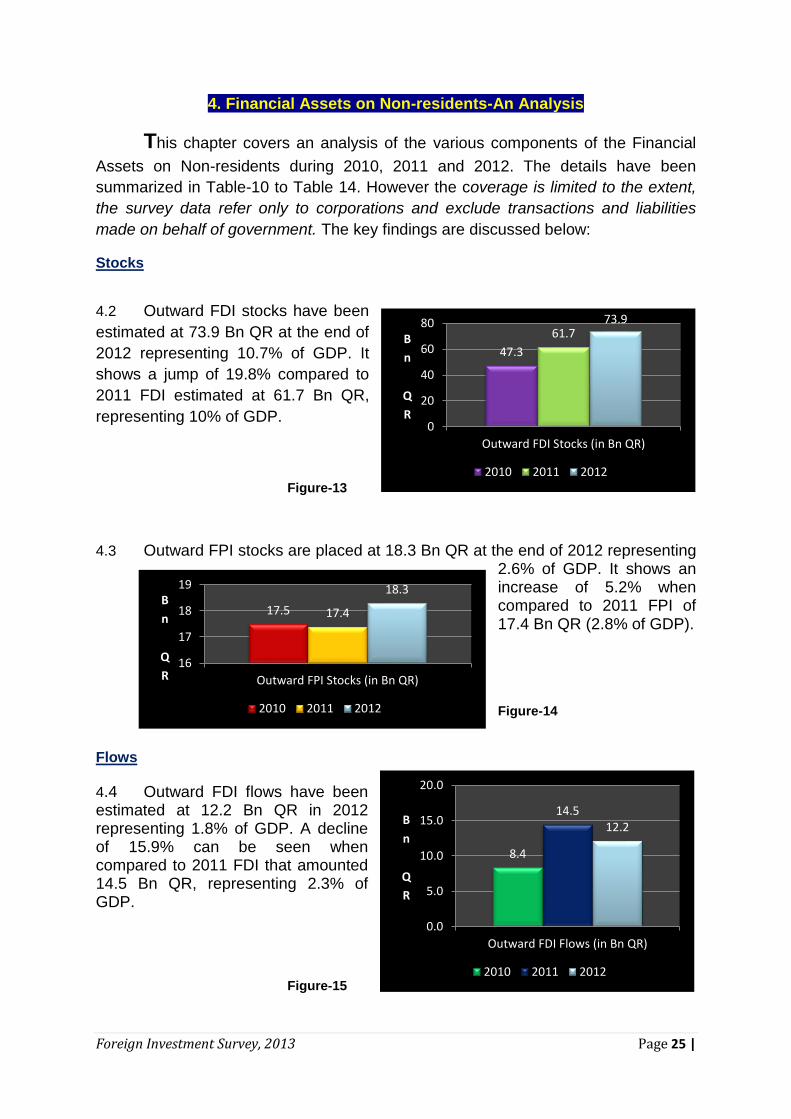
4.2 Outward FDI stocks have been
estimated at 73.9 Bn QR at the end of
2012 representing 10.7% of GDP. It
shows a jump of 19.8% compared to
2011 FDI estimated at 61.7 Bn QR,
representing 10% of GDP.
Figure-13
4.3 Outward FPI stocks are placed at 18.3 Bn QR at the end of 2012 representing 2.6% of GDP. It shows an increase of 5.2% when compared to 2011 FPI of 17.4 Bn QR (2.8% of GDP).
Figure-14
Flows
4.4 Outward FDI flows have been estimated at 12.2 Bn QR in 2012 representing 1.8% of GDP. A decline of 15.9% can be seen when compared to 2011 FDI that amounted 14.5 Bn QR, representing 2.3% of GDP.
Figure-15
47.3
61.7 73.9
0
20
40
60
80
Outward FDI Stocks (in Bn QR)
B
n
Q
R
2010 2011 2012
17.5 17.4
18.3
16
17
18
19
Outward FPI Stocks (in Bn QR)
B
n
Q
R
2010 2011 2012
8.4
14.5 12.2
0.0
5.0
10.0
15.0
20.0
Outward FDI Flows (in Bn QR)
B
n
Q
R
2010 2011 2012
Foreign Investment Survey, 2013 Page 26 |
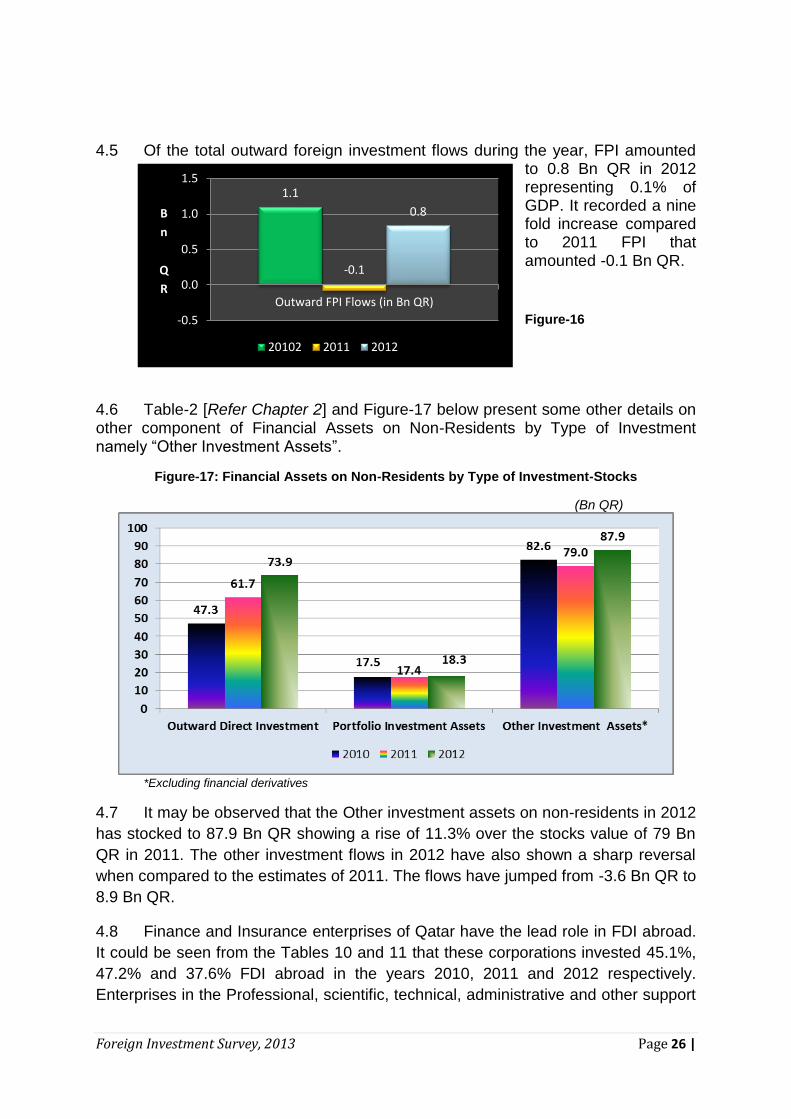
4.5 Of the total outward foreign investment flows during the year, FPI amounted to 0.8 Bn QR in 2012 representing 0.1% of GDP. It recorded a nine fold increase compared to 2011 FPI that amounted -0.1 Bn QR.
Figure-16
4.6 Table-2 [Refer Chapter 2] and Figure-17 below present some other details on other component of Financial Assets on Non-Residents by Type of Investment namely “Other Investment Assets”.
Figure-17: Financial Assets on Non-Residents by Type of Investment-Stocks
(Bn QR)
*Excluding financial derivatives
4.7 It may be observed that the Other investment assets on non-residents in 2012
has stocked to 87.9 Bn QR showing a rise of 11.3% over the stocks value of 79 Bn
QR in 2011. The other investment flows in 2012 have also shown a sharp reversal
when compared to the estimates of 2011. The flows have jumped from -3.6 Bn QR to
8.9 Bn QR.
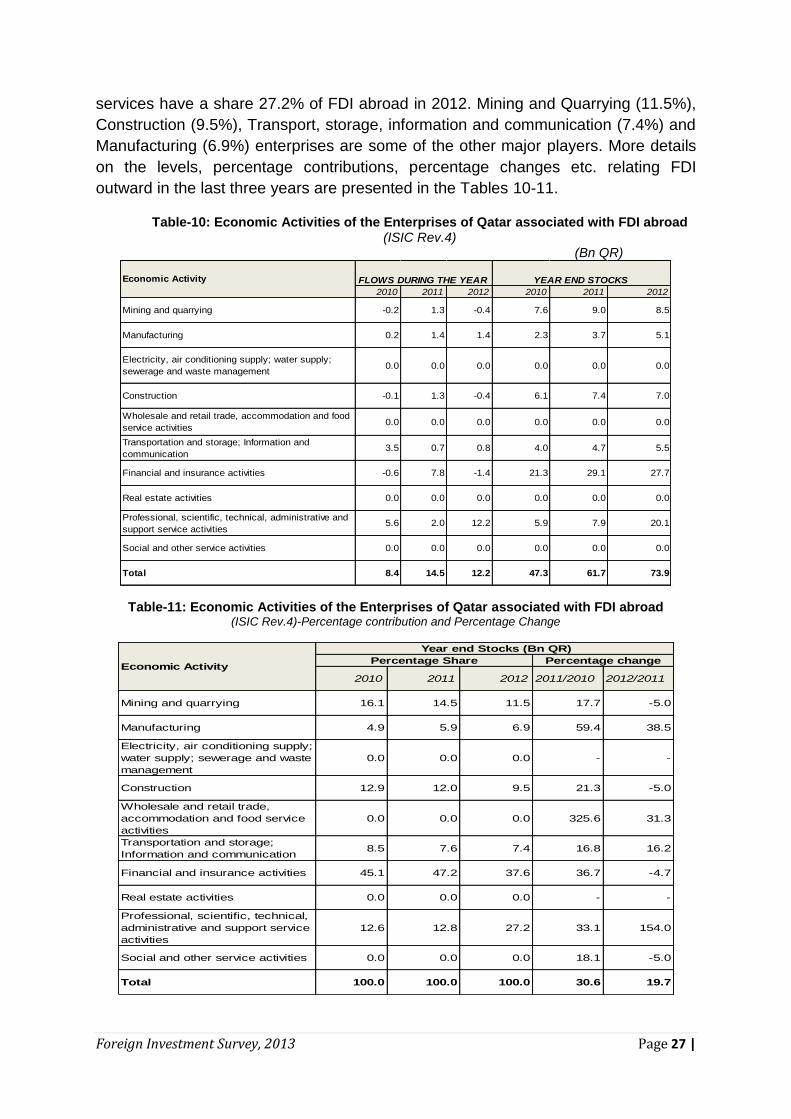
4.8 Finance and Insurance enterprises of Qatar have the lead role in FDI abroad.
It could be seen from the Tables 10 and 11 that these corporations invested 45.1%,
47.2% and 37.6% FDI abroad in the years 2010, 2011 and 2012 respectively.
Enterprises in the Professional, scientific, technical, administrative and other support
1.1
-0.1
0.8
-0.5
0.0
0.5
1.0
1.5
Outward FPI Flows (in Bn QR)
B
n
Q
R
20102 2011 2012
Foreign Investment Survey, 2013 Page 27 |
services have a share 27.2% of FDI abroad in 2012. Mining and Quarrying (11.5%),
Construction (9.5%), Transport, storage, information and communication (7.4%) and
Manufacturing (6.9%) enterprises are some of the other major players. More details
on the levels, percentage contributions, percentage changes etc. relating FDI
outward in the last three years are presented in the Tables 10-11.
Table-10: Economic Activities of the Enterprises of Qatar associated with FDI abroad (ISIC Rev.4)
(Bn QR)
Table-11: Economic Activities of the Enterprises of Qatar associated with FDI abroad (ISIC Rev.4)-Percentage contribution and Percentage Change
2010 2011 2012 2010 2011 2012
Mining and quarrying -0.2 1.3 -0.4 7.6 9.0 8.5
Manufacturing 0.2 1.4 1.4 2.3 3.7 5.1
Electricity, air conditioning supply; water supply;
sewerage and waste management0.0 0.0 0.0 0.0 0.0 0.0
Construction -0.1 1.3 -0.4 6.1 7.4 7.0
Wholesale and retail trade, accommodation and food
service activities0.0 0.0 0.0 0.0 0.0 0.0
Transportation and storage; Information and
communication3.5 0.7 0.8 4.0 4.7 5.5
Financial and insurance activities -0.6 7.8 -1.4 21.3 29.1 27.7
Real estate activities 0.0 0.0 0.0 0.0 0.0 0.0
Professional, scientific, technical, administrative and
support service activities5.6 2.0 12.2 5.9 7.9 20.1
Social and other service activities 0.0 0.0 0.0 0.0 0.0 0.0
Total 8.4 14.5 12.2 47.3 61.7 73.9
YEAR END STOCKSFLOWS DURING THE YEAREconomic Activity
2010 2011 2012 2011/2010 2012/2011
Mining and quarrying 16.1 14.5 11.5 17.7 -5.0
Manufacturing 4.9 5.9 6.9 59.4 38.5
Electricity, air conditioning supply;
water supply; sewerage and waste
management
0.0 0.0 0.0 - -
Construction 12.9 12.0 9.5 21.3 -5.0
Wholesale and retail trade,
accommodation and food service
activities
0.0 0.0 0.0 325.6 31.3
Transportation and storage;
Information and communication8.5 7.6 7.4 16.8 16.2
Financial and insurance activities 45.1 47.2 37.6 36.7 -4.7
Real estate activities 0.0 0.0 0.0 - -
Professional, scientific, technical,
administrative and support service
activities
12.6 12.8 27.2 33.1 154.0
Social and other service activities 0.0 0.0 0.0 18.1 -5.0
Total 100.0 100.0 100.0 30.6 19.7
Economic ActivityPercentage Share Percentage change
Year end Stocks (Bn QR)
Foreign Investment Survey, 2013 Page 28 |
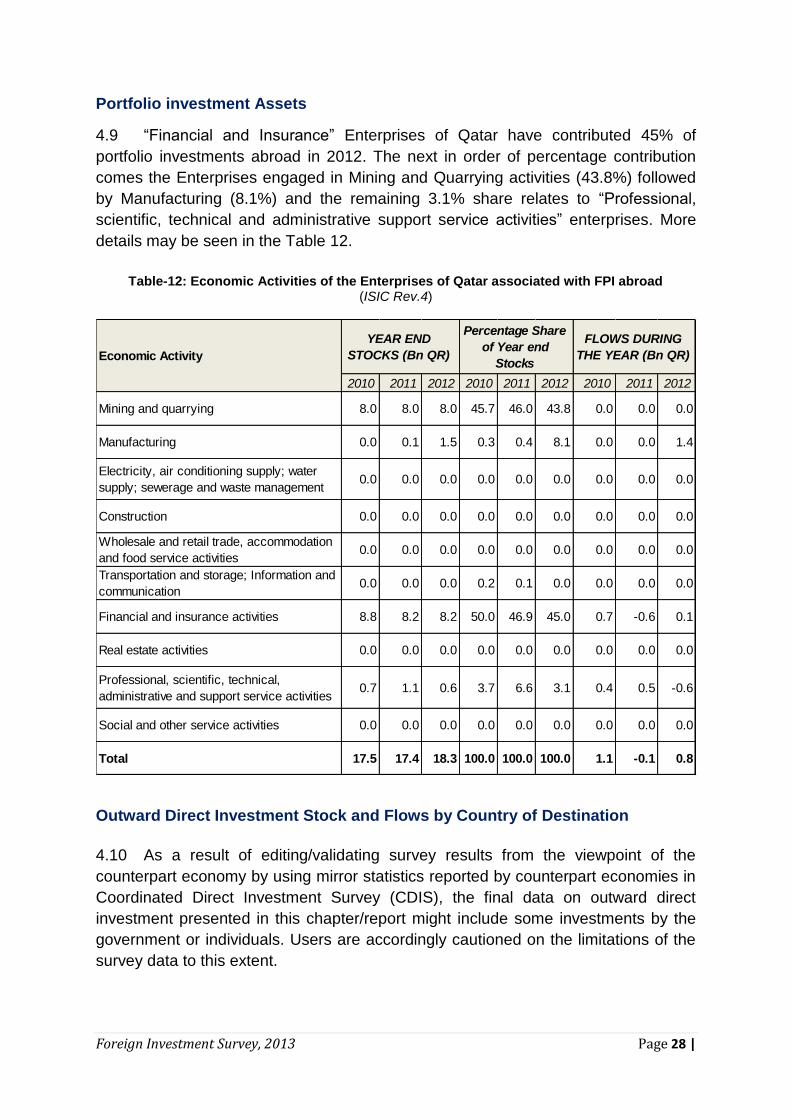
Portfolio investment Assets
4.9 “Financial and Insurance” Enterprises of Qatar have contributed 45% of
portfolio investments abroad in 2012. The next in order of percentage contribution
comes the Enterprises engaged in Mining and Quarrying activities (43.8%) followed
by Manufacturing (8.1%) and the remaining 3.1% share relates to “Professional,
scientific, technical and administrative support service activities” enterprises. More
details may be seen in the Table 12.
Table-12: Economic Activities of the Enterprises of Qatar associated with FPI abroad
(ISIC Rev.4)
Outward Direct Investment Stock and Flows by Country of Destination
4.10 As a result of editing/validating survey results from the viewpoint of the
counterpart economy by using mirror statistics reported by counterpart economies in
Coordinated Direct Investment Survey (CDIS), the final data on outward direct
investment presented in this chapter/report might include some investments by the
government or individuals. Users are accordingly cautioned on the limitations of the
survey data to this extent.
2010 2011 2012 2010 2011 2012 2010 2011 2012
Mining and quarrying 8.0 8.0 8.0 45.7 46.0 43.8 0.0 0.0 0.0
Manufacturing 0.0 0.1 1.5 0.3 0.4 8.1 0.0 0.0 1.4
Electricity, air conditioning supply; water
supply; sewerage and waste management0.0 0.0 0.0 0.0 0.0 0.0 0.0 0.0 0.0
Construction 0.0 0.0 0.0 0.0 0.0 0.0 0.0 0.0 0.0
Wholesale and retail trade, accommodation
and food service activities0.0 0.0 0.0 0.0 0.0 0.0 0.0 0.0 0.0
Transportation and storage; Information and
communication0.0 0.0 0.0 0.2 0.1 0.0 0.0 0.0 0.0
Financial and insurance activities 8.8 8.2 8.2 50.0 46.9 45.0 0.7 -0.6 0.1
Real estate activities 0.0 0.0 0.0 0.0 0.0 0.0 0.0 0.0 0.0
Professional, scientific, technical,
administrative and support service activities0.7 1.1 0.6 3.7 6.6 3.1 0.4 0.5 -0.6
Social and other service activities 0.0 0.0 0.0 0.0 0.0 0.0 0.0 0.0 0.0
Total 17.5 17.4 18.3 100.0 100.0 100.0 1.1 -0.1 0.8
Economic Activity
YEAR END
STOCKS (Bn QR)
FLOWS DURING
THE YEAR (Bn QR)
Percentage Share
of Year end
Stocks
Foreign Investment Survey, 2013 Page 29 |
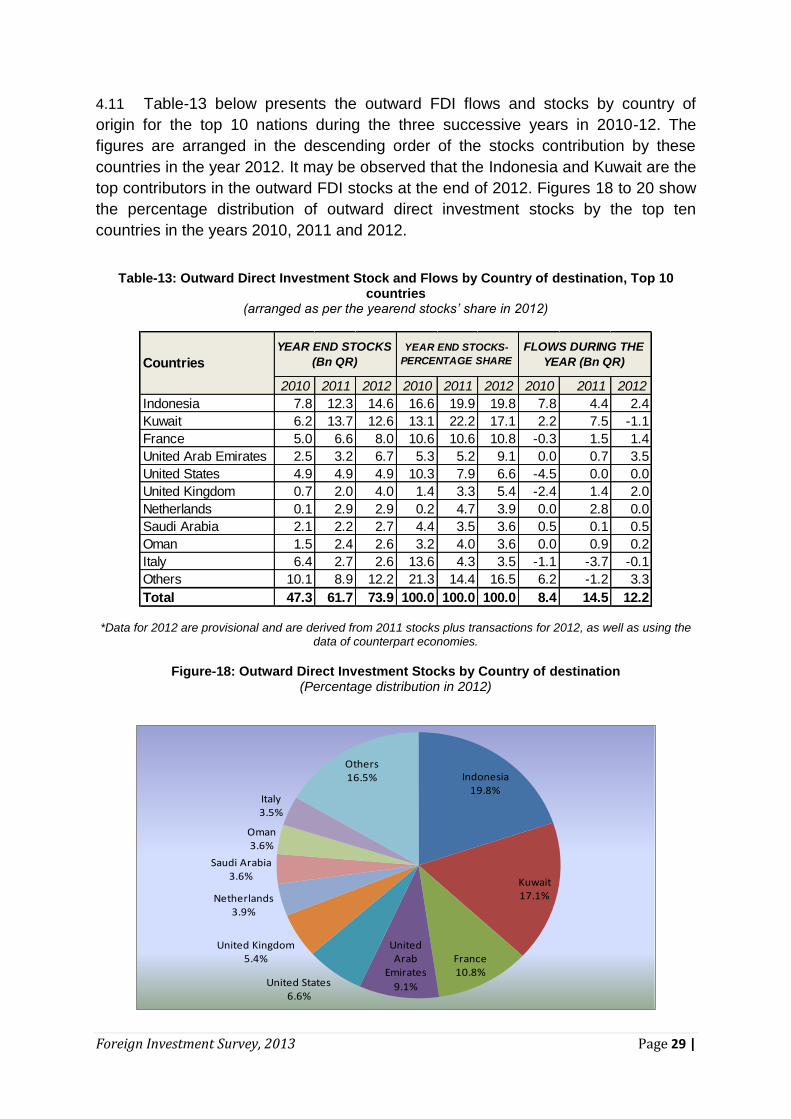
4.11 Table-13 below presents the outward FDI flows and stocks by country of
origin for the top 10 nations during the three successive years in 2010-12. The
figures are arranged in the descending order of the stocks contribution by these
countries in the year 2012. It may be observed that the Indonesia and Kuwait are the
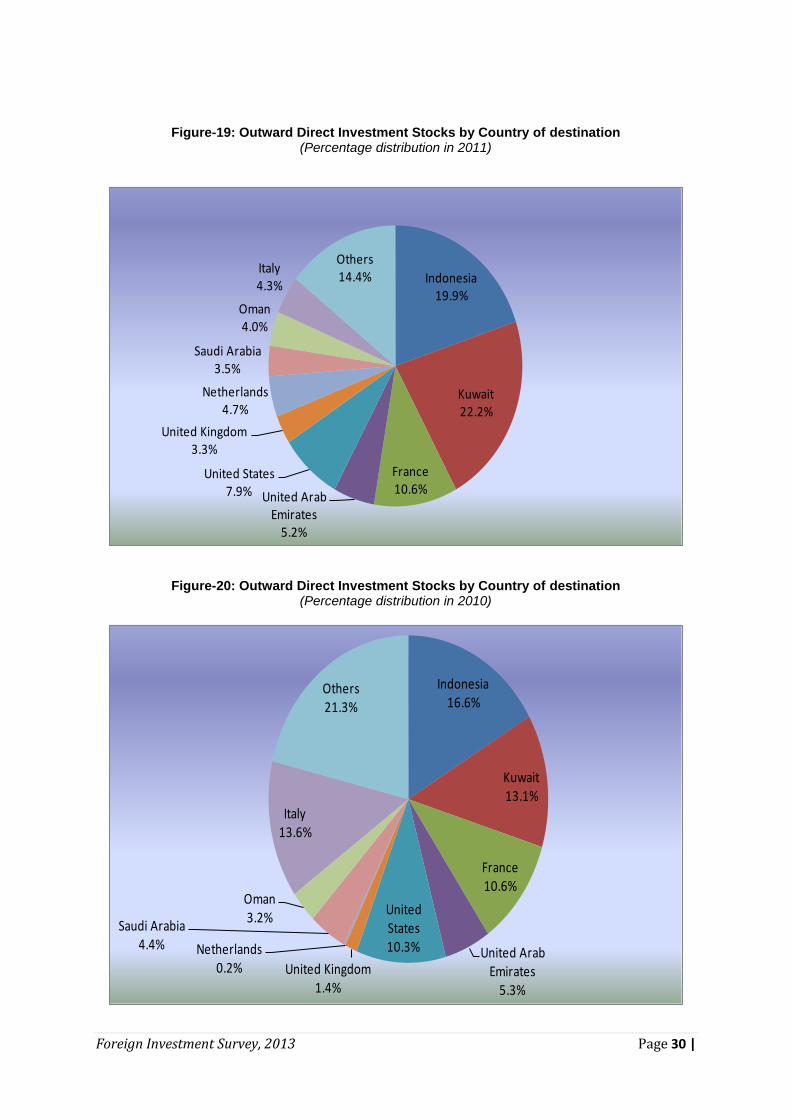
top contributors in the outward FDI stocks at the end of 2012. Figures 18 to 20 show
the percentage distribution of outward direct investment stocks by the top ten
countries in the years 2010, 2011 and 2012.
Table-13: Outward Direct Investment Stock and Flows by Country of destination, Top 10
countries (arranged as per the yearend stocks’ share in 2012)
*Data for 2012 are provisional and are derived from 2011 stocks plus transactions for 2012, as well as using the
data of counterpart economies.
Figure-18: Outward Direct Investment Stocks by Country of destination
(Percentage distribution in 2012)
2010 2011 2012 2010 2011 2012 2010 2011 2012
Indonesia 7.8 12.3 14.6 16.6 19.9 19.8 7.8 4.4 2.4
Kuwait 6.2 13.7 12.6 13.1 22.2 17.1 2.2 7.5 -1.1
France 5.0 6.6 8.0 10.6 10.6 10.8 -0.3 1.5 1.4
United Arab Emirates 2.5 3.2 6.7 5.3 5.2 9.1 0.0 0.7 3.5
United States 4.9 4.9 4.9 10.3 7.9 6.6 -4.5 0.0 0.0
United Kingdom 0.7 2.0 4.0 1.4 3.3 5.4 -2.4 1.4 2.0
Netherlands 0.1 2.9 2.9 0.2 4.7 3.9 0.0 2.8 0.0
Saudi Arabia 2.1 2.2 2.7 4.4 3.5 3.6 0.5 0.1 0.5
Oman 1.5 2.4 2.6 3.2 4.0 3.6 0.0 0.9 0.2
Italy 6.4 2.7 2.6 13.6 4.3 3.5 -1.1 -3.7 -0.1
Others 10.1 8.9 12.2 21.3 14.4 16.5 6.2 -1.2 3.3
Total 47.3 61.7 73.9 100.0 100.0 100.0 8.4 14.5 12.2
Countries
YEAR END STOCKS-
PERCENTAGE SHARE
FLOWS DURING THE
YEAR (Bn QR)
YEAR END STOCKS
(Bn QR)
Indonesia19.8%
Kuwait17.1%
France10.8%
United Arab
Emirates
9.1%United States6.6%
United Kingdom5.4%
Netherlands3.9%
Saudi Arabia3.6%
Oman3.6%
Italy3.5%
Others16.5%
Foreign Investment Survey, 2013 Page 30 |
Figure-19: Outward Direct Investment Stocks by Country of destination (Percentage distribution in 2011)
Figure-20: Outward Direct Investment Stocks by Country of destination
(Percentage distribution in 2010)
Indonesia19.9%
Kuwait22.2%
France10.6%
United Arab Emirates
5.2%
United States7.9%
United Kingdom3.3%
Netherlands4.7%
Saudi Arabia3.5%
Oman4.0%
Italy4.3%
Others14.4%
Indonesia16.6%
Kuwait13.1%
France10.6%
United Arab Emirates
5.3%
United States10.3%
United Kingdom1.4%
Netherlands0.2%
Saudi Arabia4.4%
Oman3.2%
Italy13.6%
Others21.3%
Foreign Investment Survey, 2013 Page 31 |
Concluding Remarks
Recognizing that FDI can contribute to economic development, all
governments want to attract it. Indeed, the world market for such investment is highly
competitive, and developing countries, in particular, seek such investment to
accelerate their development efforts. With liberal policy frameworks becoming
commonplace and losing some of their traditional power to attract FDI, governments
are paying more attention to measures that actively facilitate it. In this context, strong
institutional arrangements to measure FI statistics become more and more relevant.
***
Foreign Investment Survey, 2013 Page 32 |
Annex 1: Manual on the
Concepts and
Terminologies Associated
with the Foreign
Investment Survey, 2013
Foreign Investment Survey, 2013 Page 33 |
Foreign Direct Investment (FDI)
FDI is a category of international investment in which an investor in one
economy acquires an ownership interest that confers influence over the
management of an enterprise in another economy (defined as holding 10% or more
of voting power). FDI constitutes a major component of the international investment
position (IIP) and the balance of payments. Other components of cross-border
capital recorded in the IIP and balance of payments include portfolio investment,
reserve assets, financial derivatives and other investment.
A1.2 Reliable direct investment statistics are needed to define the role of foreign
direct investment in the current and future development of the national economy.
They underpin all analyses on the extent and impact of globalization, they help to
promote the investment for maximum effect and they are an important part of the
assessment of financial soundness of our country.
A1.3 FDI is generally more stable than other forms of cross-border investment,
such as portfolio investment. It involves features such as know-how and technology
transfers.
A1.4 There is growing demand among policy-makers and other users of statistics,
for more complete information on FDI, including geographic details for bilateral and
multilateral analysis.
A1.5 Therefore, the Economic Statistics Department of Qatar Statistic Authority, in
cooperation with various competent authorities (particularly the Qatar Central Bank),
conducted a survey of Foreign Investment in the State of Qatar in 2010 for the years
2008 and 2009. The survey is currently being updated and repeated in 2013 to
collect data for the years 2010, 2011 and 2012.
A1.6 The objectives of the Foreign Investment Survey are to collect comprehensive
data on foreign investment positions and transactions, broken down between equity
and debt, and for debt to be further broken down between claims and liabilities, by
economy of investor/ investment.
A1.7 This booklet has been prepared for institutions involved in the Foreign
Investment Survey in order to explain its objectives, the survey form questions,
definitions and concepts used in the survey, to facilitate filling the survey's form.
A1.8 The questionnaire contains the following questions:
Identification Information
Shareholders' Equity
Direct Investment, inward and outward
Portfolio and other Investment, assets and liabilities
Financial derivatives
Foreign Investment Survey, 2013 Page 34 |
Estimates of International Investment Position
Income receipts and payments
A1.9 Objectives of the Foreign Investment Survey
To establish of an accurate database regarding foreign investment statistics in the country. This is to provide decision-makers with accurate statistics and recent data of foreign investments to enable them setting up the appropriate environment to attract more investments.
To standardize the measurement of foreign investment to be consistent with international standards such as those of International Monetary Fund (IMF) and the World Bank.
To define the role of foreign direct investment in the current and future
development of the national economy.
To determine the distribution of the Foreign Investment in Qatar by
economic sector and highlighting its impact on different sectors.
To identify the source of Foreign Investment in Qatar, i.e. the geographic
distribution by country of origin.
To provide supplementary information regarding the impact of Foreign
Investment on the economy of Qatar. This includes man training and man
power sectors, exports, imports, international services, aspects of
technology transfer, indebtedness of private sector and defining the type of
investment to ensure backward and forward linkages necessary for the
development of other sectors to which foreign investment is not directed.
To identify the enterprises that did not achieve a successful investment in
certain economic activity, and direct them to other economic activities.
The survey results help determining whether the unit is a FDI or direct
investor or fellow enterprise.
To meet the statistical needs of users, researchers, organizations, regional
and international bodies.
The Enterprises targeted in the Survey
A1.10 Any domestic enterprises incurs foreign liabilities when it receives foreign
capital (in from of FDI, portfolio investment or debt) and pays dividends and profits
for shares, interests and others as proceeds for foreign investors. Domestic
enterprises would have foreign assets in the form of direct investment, portfolio and
other form of investment. Within this framework, the survey targets all major resident
enterprises operating in the national economy, which can be categorized into three
groups:
1. All enterprises with FDI
2. All enterprises with portfolio investments
3. All enterprises with other investments which include 100% Qatari enterprises
having transactions from abroad in the form of loans, investments among others
Foreign Investment Survey, 2013 Page 35 |
A1.11 Data from different enterprises will be collected through the foreign investment
survey, and the form will be distributed to enterprises by field researchers. The
questionnaire includes a detailed explanation of its different items.
Advantages of Foreign Direct Investment
A1.12 For the investor
1) For the investing enterprise, FDI usually means access to new markets and
better knowledge of those markets. This may, however, come at higher
international transaction and organizational costs.
2) In some service industries, local market presence (e.g. a banking outlet or
representative office) may be a prerequisite for serving that market.
3) Lower labor, raw material and intermediary input costs may determine the
location of the direct investment enterprise.
A1.13 For the investee
1) Being less liquid and tradable than portfolio investment, FDI flows are usually
less volatile. Especially in the case of developing countries, this type of
financing reduces the risk of external speculation and liquidity crises. FDI
contributes positively to the recipient’s balance of payments, both through the
initial transaction and by adding to export growth; and
2) FDI contributes to growth in the target country by increasing the production
base, by creating employment (e.g. demand from other local industries). By
contributing to higher competition, FDI can lead to an improvement of
other domestic firms’ efficiency and product quality. FDI acts as a catalyst for
domestic investment and technological progress through the transfer of
technology to the recipient. Similarly, it may raise management expertise and
marketing skills.
Definitions of some Terminologies and Concepts used in the survey
Investment
A1.14 Is the spending on capital assets over a certain period. Therefore, it is the net
increase in real capital of the society. Investment can be either individually or in
investment enterprises companies and can be either government-funded public
investment from the budget surplus or by borrowing through issuing bonds in the
country or in the financial market or international bodies and foreign governments or
international organizations (e.g. World Bank) and government investment is genuine,
new capital formation, such as roads, hospitals, etc.

Foreign Investment Survey, 2013 Page 36 |
Foreign investment
A1.15 Foreign Investment occurs when a resident of one economy has a financial
position or makes a financial transaction with a non-resident. There are five types:
direct investment, portfolio investment, financial derivatives, other investment and
reserve assets, all explained in these notes.
Foreign direct investment (FDI)
A1.16 Is cross-border investment made by a direct investor with the intent of
obtaining a long-term interest in an enterprise resident in another country (direct
investment enterprise). International investment is classified as FDI when an investor
owns 10 % or more of ordinary shares or voting rights in an incorporated or
unincorporated enterprise abroad respectively. The direct investor aims to influence
the management of an enterprise resident in another economy.
Foreign direct investor and direct investment enterprise
A1.17 A foreign direct investor may be an individual, an incorporated or
unincorporated public or private enterprise, a government, a group of related
individuals, or a group of related incorporated and/ or unincorporated enterprises,
which has a direct investment enterprise – that is subsidiary, associate or branch –
operating in a country other than the country of residence of foreign direct investor.
A1.18 The Direct Investor (DI) controls the Direct Investment Enterprise (DIE) if it
owns more than 50% of the voting rights of the DIE. The DI significantly influences
the DIE if it owns between 10% and 50% of the DIE voting rights. The control or
influence may be immediate between a DI and DIE, or indirect between a DI and a
DIE through a chain of direct investment.
Fellow enterprises
A1.19 A fellow Enterprise is a nonresident that has a common (immediate or
indirect) parent with your enterprise but neither your enterprise nor the fellow
enterprise holds 10 percent or more of the equity in the other.
NOTE: FOREIGN DIRECT INVESTMENT STATISTICS INCLUDE ALL POSITIONS
AND TRANSACTIONS THAT YOUR ENTERPRISE HAS WITH YOUR DIs AND
YOUR DIEs AND YOUR FELLOW ENTERPRISES.
Portfolio investment
A1.20 It is the investment in current financial instruments like share capital and
bonds (except for Foreign direct Investment) and monetary market instruments and
proof of indebtness.

Foreign Investment Survey, 2013 Page 37 |
A1.21 The main elements of portfolio investment including assets and liabilities are
divided into two elements; Title deeds and proof of indebtness. Both are negotiable
and tradable in organized markets and other financial markets. Debt bonds are
divided into bonds and permits, monetary instruments.
A1.22 Portfolio investment
1. Equity securities: Include all instruments and deeds that prove the right of the owner or holder in
the remaining value of shareholding companies after deducting dues of
creditors. Normally, shares and deeds mean the contribution in the ownership.
2. Debt securities:
Bonds, permits and deeds
Instruments of monetary market and other negotiable credit
instruments
Foreign portfolio investment FPI
A1.23 An investment reflecting the interest of a resident entity from one economy in
an economy other than that of the investor, in ownership of administratively inactive
fiscal bonds and other assets such as the right of active management and control of
bonds issuance. A percentage of less than 10% of equity ownership is applied to
define an investment as FPI.
Financial derivatives
A1.24 Are financial instruments linked to a specific tool, index, or a commodity
through which financial risks can be sold and purchased in the financial markets.
Financial Derivatives represent a type of Foreign Investment separate from Portfolio
and Other Investment.
Other foreign investments
A1.25 Investments other than FDI and FPI such as commercial credit, loans,
deposits and others.
A1.26 Types of Foreign Direct Investment Enterprises
a) Subsidiary
An incorporated enterprise, in which a direct investor owns more than 50% of the
voting shares and has the right to appoint or remove a majority of the members of
the administrative, management or superiorly board. The DI controls the DIE.
These subsidiaries are sometimes referred to as wholly owned (when the direct
investor owns 100% of the equity share), or majority-owned (when the direct
investor owns over 50% of the equity share). When the direct investors own

Foreign Investment Survey, 2013 Page 38 |
between 10% and 50% of the equity share, the enterprise is not called a
subsidiary. It is referred to as an associate.
b) Branch
A branch is an unincorporated enterprise, which is wholly or jointly owned by the
direct investor. A direct investment enterprise branch is an unincorporated
enterprise in host country that:
Is a permanent enterprise or office of a foreign direct investor, or
Is an unincorporated partnership or joint venture between a foreign direct
investor and third parties, or
Is a land, structures (except those owned by foreign government entities), and
immovable equipment and objects in the host country, that is directly owned by a
non-resident, or
Is mobile equipment (such as ships, aircrafts, gas and oil drilling rigs) that
operates within an economy for at least one year if accounted for separately by
the operator and is so recognized by the tax authorities. This is considered to be
investment in a national enterprise in the host country.
c) Associate
An associate is an incorporated enterprise, in which the direct investor owns
between 10% and 50% of the voting power.
The DI significantly influences the DIE, but does not control it.
Legal status of the company
A1.27 Companies’ legal status could be one of the following:
1. Sole Ownership
2. Particular Partnership Company
3. Partnership (Joint) Company
4. Limited Partnership Company
5. Equities Partnership Company
6. Shareholding Company
7. Limited Liability Company
Main economic activity
A1.28 The activity practiced by the enterprise that creates the largest share of total
production value or revenues of the enterprise, or it is the activity specified by the
enterprise t’s owner or manager.

Foreign Investment Survey, 2013 Page 39 |
Secondary economy activity
A1.29 It is an activity within the production unit in addition to the main activity, its
value added must be less than the gross value added of the main economic activity.
Resident and non-resident
Resident
A1.30 An institutional unit is resident in a country when it has a center of economic
interest in the economic territory of that country. It has an economic interest when it
owns a location to practice its activity for a period of time (more than one year)
Resident individual
A1.31 An individual is considered resident of a country, if he/she has been living and
working in that country for more than one year.
Resident enterprise
A1.32 Residency is not based on nationality. An entity is resident of a country, if the
entity has an economic interest in that country i.e. when it has a productive or service
base in the country’s economy in which it is located or from which it conducts its
economic activity and transactions for one year or more. The production or service
base must be fixed.
Local group of foreign investment
A1.33 If a resident enterprise controls (directly or indirectly) other enterprises resident
in the same economy, all the enterprises are called a local group and can be
considered to be the statistical unit for Foreign Investment.
Resident shareholders
A1.34 Resident, whether individuals or entities (public or private), are those who
participate in a productive or service in the economy of the country, regardless of
their nationalities and they are domiciled in it and they engage in wide scale
economic activities for the purpose of continuity, which is usually measured by a
year, on a continuous basis, or with the intention to do so.
Non-resident shareholders
A1.35 They are individuals or entities owning shares of local companies or operating
in the country and do not have a base of economic activities in the economy of the
country and that are not ordinarily domiciled in the country.

Foreign Investment Survey, 2013 Page 40 |
Valuation of direct investment equity
A1.36 The valuation of the DI’s position with its DIE. It is the DI’s share of the market
value of the DIE measured by its paid-up capital, all reserves identified as equity,
cumulated reinvested earnings. Depreciation and revaluations should be included.
The values should be taken from the accounts of the DIE.
A1.37 In this survey, positions data are obtained at the end of two financial years,
2010 and 2011, as well as transactions data during 2010 and 2011.
Shareholder’s equity
A1.38 The market value of an enterprise consisting of paid-up capital, all reserves
identified as equity, cumulated retained earnings. Depreciation and revaluations
should be included. Also called the Net Worth of the enterprise measured by total
assets minus total liabilities.
Percentage of ownership
A1.39 The percentage of shares owned by non-residents expressed as proportion of
the total votes attached to the shared capital of an entity.
Equity capital
A1.40 Equity capital includes equity in branches, ordinary shares (excluding non-
participating preference shares) in subsidiaries and associates, and other capital
contributions such as the provision of machinery.
Paid-up capital
A1.41 It corresponds to the portion of a corporation’s equity obtained from issuing
shares in return for cash or other considerations. It is the amount of a company’s
capital has been funded by the shareholders.
Dividends
A1.42 Part of the company’s earnings that are distributed to shareholders. They
come in the form of cash or stocks. In most cases, dividends are paid on a quarterly
basis, however, in some cases they are paid annually.
Reinvested earnings
A1.43 Consolidated profits earned by the company and its subsidiaries and
associates during the period covered, after deducting tax, interest, depreciation and
dividends. Thus it represents the proportion of profits due to DIs which have been
reinvested in the enterprise. These are treated as equity transactions in Direct
Investment and Balance of Payments statistics. They are only calculated when the

Foreign Investment Survey, 2013 Page 41 |
immediate direct investment is 10% or more.( unless the foreign investment is in an
investment fund).
Retained earnings
A1.44 Earnings not paid out as dividends but instead reinvested in the core business
or used to pay off debt. Also called earned surplus or accumulated earnings or
inappropriate profit.
Reserves
A1.45 Any kind of earning surplus reserved or set aside for emergencies or other
future needs and supporting the enterprise financial position.
Other shareholders’ equities
A1.46 It is the net earnings or the transfer of earnings by the FDI enterprise for the
fiscal years 2010 and 2011. Other capital covers inter-company debt between direct
investors and the enterprises. It includes short-term loans (such as trade credits),
proposed dividends and share premium.
Assets and Liabilities with non-residents
A1.47 Assets with non-residents include:
1- Short-term receivables:
Receivables from foreign direct investors, foreign subsidiaries and other non-
resident enterprises that due within one year. They include trade receivables
(trade in goods and services) and other receivables such as interest / dividends
that are declared but not paid, pensions, insurance and wages.
2- Long-term loans:
Obligations on entities not residing in the country that is due after one year or
more. They include long term loans from FDI enterprises in the country provided
to foreign direct investors, foreign subsidiaries and other direct investment
enterprises not resident in the country.
A1.48 Liabilities with non-residents include:
1- Short-term payables:
They include all short term payables to foreign direct investors, foreign
subsidiaries and other direct investment enterprises abroad that due within one
year. They include trade payables (imports of goods and services) and other
payables such as interests/ dividends that are declared but not paid, pensions,
insurance and wages.
Foreign Investment Survey, 2013 Page 42 |
2- Long-term loans:
They include all long term loans from FDI enterprises in the country taken from
foreign direct investors, foreign subsidiaries and other direct investment
enterprises that are due in one year or more.
Assets and Liabilities
Assets
A1.49 Assets are all that owned by a person or company and have a commercial
value or interchanges value. The assets consist of property or a defined benefit to
others, compared to the obligations duty paid to others.
Fixed assets
A1.50 They are those assets of permanent nature required for the normal conduct of
a business, and which will not normally be converted into cash during the fiscal tax
period, like land, buildings, furniture and fixtures. However, accounts receivable and
inventory are not counted.
Other assets
A1.51 The value of all types of assets other than fixed assets.
Liabilities
A1.52 A liability is a loan or expenses or any other form of obligations on the assets
of an entity, to be paid or recognized by this entity.
Interest
A1.53 Is the cost of borrowing funds in the survey period. It includes all interest
payments on loans from residents and non-resident creditors.
***

Foreign Investment Survey, 2013 Page 43 |
Annex-2:
Role of Foreign Investment Statistics and
Reference Indicators
Foreign Investment Survey, 2013 Page 44 |
Annex 2: Role of Foreign Investment Statistics and Reference Indicators
The global financial integration, enhanced by increasing competition amongst
investors of many counties has led to the introduction of new financial instruments.
These instruments compete on transaction costs and help various economies to
garner more and more investments for their respective nationalities in a transparent
manner. The role of such instruments of Foreign Investment and the related
reference indicators are discussed in the following paragraphs.
Foreign Direct Investment (FDI)
A2.2 Foreign direct investment (FDI) is a key driver of international economic
integration. It plays a crucial role in the rapidly evolving globalization. FDI provides a
means for creating direct, stable and long-lasting links between economies. With the
right policy framework, FDI can provide financial stability, promote economic
development and enhance the well-being of societies. Under the rational policy
environment, it can serve as an important vehicle for local enterprise development,
and it may also help improve the competitive position of both the recipient (“host”)
and the investing (“home”) economy. In particular, FDI encourages the transfer of
technology and know-how between economies. It also provides an opportunity for
the host economy to promote its products more widely in international markets. FDI,
in addition to its positive effect on the development of international trade, is an
important source of capital for a range of host and home economies.
Portfolio Investment
A2.3 Portfolio investment is defined as cross border transactions and positions
involving debt or equity securities, other than those included in direct investment or
reserve assets. Securities are instruments designed for convenient negotiability
between parties, such as shares, bonds, notes and money market instruments. The
negotiability of securities is a way of facilitating trading, allowing them to be held by
different parties during their lives. Negotiability allows investors to diversify their
portfolios and to withdraw their investment readily.
A2.4 Investment fund shares or units (i.e., those issued by investment funds) that
are evidenced by securities and that are not reserve assets or direct investment are
included in portfolio investment. Although they are negotiable instruments, exchange
traded financial derivatives are not included in portfolio investment because they are
included in their own separate category.
Direct investment statistics
A2.5 Regular analysis of direct investment trends and developments is an integral
part of most macro-economic and cross-border financial analysis. It is of prime
interest to policy analysts to identify the source and destination of these investments.

Foreign Investment Survey, 2013 Page 45 |
In other words, identifying partner countries and industries for inward and outward
investments is central to most analysis. There is also increasing interest in identifying
FDI by type, as different types of FDI – Mergers and Acquisitions (M&A) or
Greenfield investments – are likely to impact to a varying extent, in particular, on the
host economy.
A2.6 Direct investment statistics cover all cross-border transactions and positions
between enterprises which are a part of the same group as defined in the FDIR.
According to the standard (core) and supplemental presentations, FDI statistics
include direct investment positions (equity and debt), direct investment income flows
(distributed earnings, reinvested earnings, interest income) and direct investment
financial flows (equity and debt). Market value is the preferred conceptual basis to
measure both direct investment positions and transactions (flows).
A2.7 Direct investment statistics are presented on an aggregate basis in terms of
assets and liabilities and also, separately, on a directional (both for inward/outward
FDI) basis with a geographical and industry breakdown. For both inward and
outward FDI on the directional basis the allocation by partner country uses the
debtor/creditor principle. The directional data are also classified and analysed
according to industrial activity. Directional data for both geographic and industry
analysis should be derived from the basic information compiled on FDI assets and
liabilities.
A2.8 Direct investment statistics are also disaggregated by major industry sectors
based on the International Standard Industrial Classification (ISIC), according to the
principal activity of the direct investment enterprise (in the reporting economy for
inward investments and in the host economy for outward investments).
Reference indicators for cross country comparison
A2.9 These indicators allow cross-country comparisons based on the relative
importance of FI/FDI expressed as a per cent of Gross Domestic Product (GDP).
A2.10 Each ratio indicates the relative importance of globalization for the reporting
economy either for total investments or for investments by economic sector. An
increase of the ratio implies a greater share of foreign investment, thus an increase
in the relative impact of globalization. It is, however, to be noted that FDI flows and
FDI positions when referenced against GDP are not fully compatible measures of
globalization. Nevertheless, in the absence of other more meaningful cross-country
comparisons of the relative size of globalization, GDP remains the best common
reference.
A2.11 FDI financial flows (inward and outward) expressed as a per cent of GDP
indicate the degree of globalization of an economy based on the economic climate

Foreign Investment Survey, 2013 Page 46 |
for a given time period, i.e. the changes over that time period. This indicator provides
early information on the relative attractiveness of economies (both domestic and
foreign) and industries for new investments after allowing for the withdrawal of
investments (disinvestment) during that FDI income flows (inward and outward) as a
per cent of GDP provide information on the relative importance of the earnings of
direct investment enterprises both in the reporting economy and abroad.
A2.12 FDI positions (inward and outward) as a per cent of GDP indicate the extent
of globalization at a given point in time. These structural indicators designate the
interdependence of economies. The ratio for inward FDI positions indicates the
extent of foreign ownership (or foreign presence) in an economy. The ratio for
outward investment indicates the degree of ownership (or presence abroad) of
economic agents in other markets. They also illustrate, respectively, the level of
dependence of the domestic economy on foreign economies and its level of
penetration in foreign markets. A comparison of the results obtained for inward and
outward FDI will indicate the comparative importance of the country as an exporter
or recipient of FDI.
***

Foreign Investment Survey, 2013 Page 47 |
Annex-3
Foreign
Investment
Survey, 2013-
Questionnaire

Foreign Investment Survey, 2013 Page 48 |
رقم المنشأة باإلطار
:*Type of foreign investmentنوع مؤسسة االستثمار االجنبي المباشر*:
Subsidiary شركة تابعةBranch فــــرعAssociate مؤسسة شريكةDirect Investor **مستثمر مباشر
:Mob.Noهاتف جوال:
:Mob.Noهاتف جوال:
:Mob.Noهاتف جوال:
[email protected] : للمراجعة اإلتصال على هاتف:44836729 فاكس: 44837424 ص.ب. 7283 بريد إلكتروني For any queries please contact Tel:44836729 Fax: 44837424 P.O.Box.7283
:Supervisor Nameاسم المشرف :
اسم الباحث:
اسم المفتش:
رقـــم الهاتـف :
State of QatarStatistics Authority
Economic Statistics Department
Inspector Name:
FOREIGN INVESTMENT SURVEY
**A Direct investor (DI) is an enterprise or individual, resident in one economy, that directly or
indirectly holds 10 percent or more of the equity of an enterprise resident in another economy. An
enterprise w ith a foreign direct investor is called a Direct Investment Enterprise (DIE). Assocaite,
Branch and Subsidiary are types of DIE (described in booklet)
* يرجى اختيار الحالة المناسبة.
يمكن ان تعتبر مؤسسة ما مستثمر مباشر وشركة تابعة أو مؤسسة شريكة في نفس الوقت في حال شكلت جزء من سلسلة أو ملكية
متعددة الجنسيات ، إذا أنطبق ذلك على ممؤسستكم ، فأن االستمارة تقوم بجمع البيانات على كل من االستثمار المباشر للداخل والخارج .
PLEASE NOTE THAT ENTERPRISES HAS THE SAME MEANING AS COMPANIES IN THIS FORM.
ـقـانون بيانـات سرية بحـكم ال ال
CONFIDENTIAL BY LAW
Establishment Frame No.
2013
دولة قطر جهاز اإلحصاء
إدارة االحصاءات االقتصادية
Tel. No.:
** المستثمر المباشر هو مؤسسة مقيمة في احد االقتصادات ، تحوز بشكل مباشر على 10% فأكثر من حقوق الملكية للمؤسسة
المقيمة في اقتصاد آخر. ويطلق على المؤسسة التي يتبع لها مستثمر اجنبي مباشر مؤسسة استثماؤر مباشر. وتعد المؤسسة الشريكة
والفوع الشركة التابعة أشكال لمؤسسات نباشر االستثمار المباشر (تم تعريفها في الكتيب).
* Please indicate as appropriate.
An enterprise can be a direct investor and a subsidiary or associate at the same time w hen it is part
of a multinational chain or ow nerhip. If this applies to your enterprise, the questionarrie collects data
on both your inw ard and outw ard direct investment.
مسح اإلستثمار األجنبي
.Questionnaire Noمسلسل اإلستمارة
يرجى مالحظة ان المؤسسات يقصد بها الشركات في هذا النموذج .
Commercial name of the company: االســــم التجاري للمنشأة :
Surveyor Name:

Foreign Investment Survey, 2013 Page 49 |
Identification informationبيانـــــات تعريفيــــة
1 - Commercial name of the company:
2 - Name of director in charge :
3 - CR No.:
4- License No:
5 - Date of license/ CR:
6 - Main economic activity:
:Main economic activity codeرمز النشاط اإلقتصادي الرئيسي :
7- Secondary economic activity:
:Secondary economic activity codeرمز النشاط اإلقتصادي الثانوي:
8 - Establishment address:
:Phone - 1.88.1 - الهاتف :
:Fax - 2.88.2 - الفاكس :
:Web site - 3.88.3 - الموقع االلكتروني:
:E-Mail - 4.88.4 - البريد اإللكتروني:
:Electricity No - 5.88.5 - رقم الكهرباء:
:P.O. Box - 6.88.6 - صندوق بريد:
:Zone - 7.88.7 - المنطقة:
:Street name & number - 8.88.8 - اسم ورقم الشارع :
:Building name & number - 9.88.9 - اسم ورقم المبنى:
9 - Equity percentage
* Resident shareholders (in Qatar) - 9.1%1.9 - المساهمون المقيمون (في دولة قطر)*
**Non resident shareholders (Abroad) - 9.2%2.9 - المساهمون غير المقيمين (خارج دولة قطر)**
Total - 9.3%3.9 - اإلجمالي
10 - Legal status [Please mark the suitable box])يرجى وضع اإلشارة المناسبة التي تنطبق على المنشأة(
Sole ownership - 11 - ملكية فردية
Particular partnership company - 22 - شركة المحاصة
Partnership (Joint) company - 33 - شركة تضامن
Limited partnership company - 44 - شركة توصية بسيطة
Equities partnership company - 55 - شركة توصية باألسهم
.Shareholding company - 66 - شركة مساهمة
.Limited liability company - 77 - شركة ذات مسئولية محدودة
as of 31/12/2011 2011/12/31 في
وتعتبر الشركات الموجودة في الدولة رغم أن ملكيتها تعود لجهات ة قطر. المقيم هو أي فرد أو منشاة أو منظمة مقيمة في دول *
أجنبية مقيمة في االقتصاد القطري.
*A resident is any individual, business o r o ther o rganizat io n residing in Qatar. C o mpanies lo cated in Qatar even if
they are fo reign-o wned, are co nsidered residents o f Qatari eco no my.
**A no n-resident is any individual, enterprise, o r o ther o rganizat io ns residing o verseas. F o reign branches and
subsidiaries o f Qatar co mpanies that are lo cated abro ad are also classif ied as no n-resident ent it ies.
غير المقيم هو أي فرد أو منشاة أو منظمات أخرى مقرها فى الخارج كما أن الفروع األجنبية والشركات التابعة لشركات قطرية **
والموجودة في الخارج تصنف أيضا ككيانات غير مقيمة.
***If the currency o f assets and liabilit ies is o ther than Qatari R iyal, please refer to the exchange rate o f year-end
and co nvert it into lo cal currency (QR ) please f ill the data in tho usand (QR ).
المقومة بها من األصول والخصوم في مؤسستكم *** يرجى ذكر كافة البيانات باآلالف )اللاير القطري(، وإذا كانت العملة )العمالت(
بغير اللاير القطري يرجى استخدام سعر الصرف في نهاية السنة لتحويلها الى العملة المحلية.
13 - رأس المال المدفوع حسب الجنسية : ألف لاير قطري***
TOTAL
Qatar
Other (specify)أخرى (حدد)
6 - النشاط اإلقتصادي الرئيسي :
3 - رقم السجل التجاري :
4- رقم الرخصة:
13 - Total equity by nationality in : 000 QR***
11 - Date of commencing activity
7 - النشاط اإلقتصادي الثانوي :
11 - تاريخ مزاولة النشاط
12 - Total equity of your enterprise in 000 QR (As of 31/12/2011) )2011 / 12 / 31 12 - رأس المال المدفوع ألف لاير قطري )كما هو في
قطر
9 - نسبة المساهمة في رأس المال
Nationalityالجنسية
8 - عنوان المنشأة:
10 - الشكل القانوني للمنشأة
خاصPrivate
المجموع
رمز الجنسية Nationality
Code
حكومي Government
المجموعTotal
2 - المدير المسؤول :
1- اإلسم التجاري للمنشأة:
5 - تاريخ الترخيص/السجل التحاري :
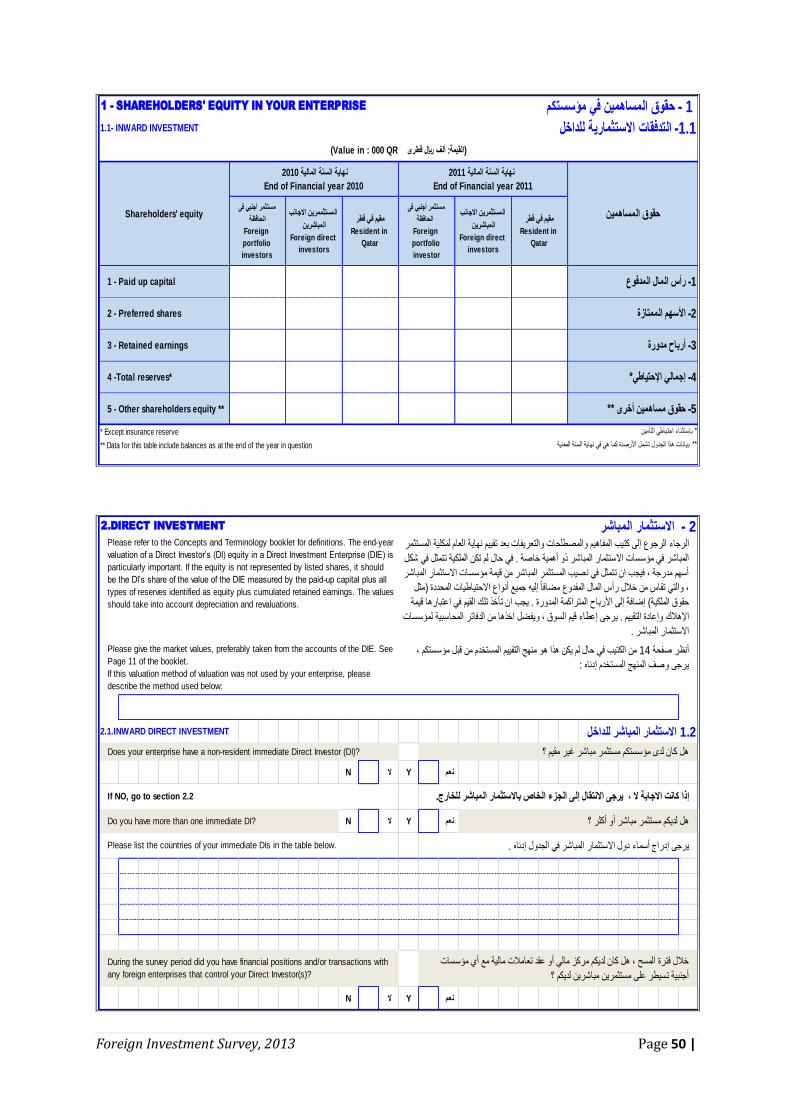
Foreign Investment Survey, 2013 Page 50 |
مقيم في قطر
Resident in
Qatar
المستثمرين االجانب
المباشرين
Foreign direct
investors
مستثمر أجنبي فى
الحافظة
Foreign
portfolio
investor
مقيم في قطر
Resident in
Qatar
المستثممرين االجانب
المباشرين
Foreign direct
investors
مستثمر أجنبي فى
الحافظة
Foreign
portfolio
investors
* Except insurance reserve
** Data for this table include balances as at the end of the year in question
Shareholders' equity
بيانات هذا الجدول تشمل األرصدة كما هي في نهاية السنة المعنية **
2 - Preferred shares
*Total reserves- 44- إجمالي اإلحتياطي*
* بإستثناء احتياطي التأمين
SHAREHOLDERS' EQUITY IN YOUR ENTERPRISE - 1 1 - حقوق المساهمين في مؤسستكم
1.1- INWARD INVESTMENT 1.1- التدفقات االستثمارية للداخل
(Value in : 000 QR القيمة: ألف لاير قطرى)
3- أرباح مدورة
نهاية السنة المالية 2011
End of Financial year 2011
2- األسهم الممتازة
5 - Other shareholders equity **
3 - Retained earnings
1 - Paid up capital
5- حقوق مساهمين أخرى **
1- رأس المال المدفوع
حقوق المساهمين
نهاية السنة المالية 2010
End of Financial year 2010
DIRECT INVESTMENT.22 - االستثمار المباشر
INWARD DIRECT INVESTMENT.1.22.1 االستثمار المباشر للداخل
Nال Yنعم
Nال Yنعم
Nال Yنعم
أنظر صفحة 14 من الكتيب في حال لم يكن هذا هو منهج التقييم المستخدم من قبل مؤسستكم ،
يرجى وصف المنهج المستخدم إدناه :
Please give the market values, preferably taken from the accounts of the DIE. See
Page 11 of the booklet.
If this valuation method of valuation was not used by your enterprise, please
describe the method used below:
هل لديكم مستثمر مباشر أو أكثر ؟
.Please list the countries of your immediate DIs in the table belowيرجى إدراج أسماء دول االستثمار المباشر في الجدول إدناه .
?Does your enterprise have a non-resident immediate Direct Investor (DI)هل كان لدى مؤسستكم مستثمر مباشر غير مقيم ؟
If NO, go to section 2.2إذا كانت االجابة ال ، يرجى االنتقال إلى الجزء الخاص باالستثمار المباشر للخارج.
خالل فترة المسح ، هل كان لديكم مركز مالي أو عقد تعامالت مالية مع أي مؤسسات
أجنبية تسيطر على مستثمرين مباشرين لديكم ؟
During the survey period did you have financial positions and/or transactions with
any foreign enterprises that control your Direct Investor(s)?
Do you have more than one immediate DI?
Please refer to the Concepts and Terminology booklet for definitions. The end-year
valuation of a Direct Investor’s (DI) equity in a Direct Investment Enterprise (DIE) is
particularly important. If the equity is not represented by listed shares, it should
be the DI’s share of the value of the DIE measured by the paid-up capital plus all
types of reserves identified as equity plus cumulated retained earnings. The values
should take into account depreciation and revaluations.
الرجاء الرجوع إلى كتيب المفاهيم والمصطلحات والتعريفات بعد تقييم نهاية العام لمكلية المستثمر
المباشر في مؤسسات االستثمار المباشر ذو أهمية خاصة . في حال لم تكن الملكية تتمثل في شكل
أسهم مدرجة ، فيجب ان تتمثل في نصيب المستثمر المباشر من قيمة مؤسسات االستثمار المباشر
، والتي تقاس من خالل رأس المال المفدوع مضافاً إليه جميع أنواع االحتياطيات المحددة (مثل
حقوق الملكية) إضافة إلى األرباح المتراكمة المدورة . يجب ان تأخذ تلك القيم في اعتبارها قيمة
اإلهالك وإعادة التقييم . يرجى إعطاء قيم السوق ، ويفضل اخذها من الدفاتر المحاسبية لمؤسسات
االستثمار المباشر .
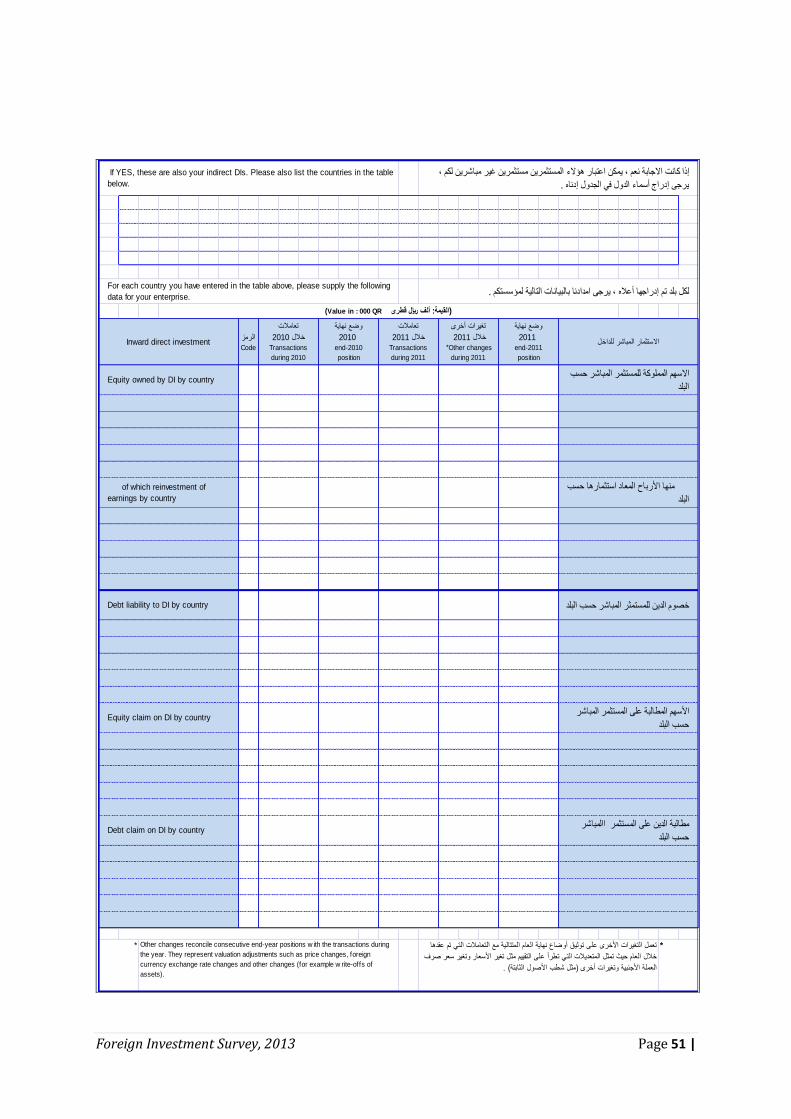
Foreign Investment Survey, 2013 Page 51 |
الرمزCode
**
تعمل التغيرات األخرى على توثيق أوضاع نهاية العام المتتالية مع التعامالت التي تم عقدها
خالل العام حيث تمثل المتعديالت التي تطرأ على التقييم مثل تغير األسعار وتغير سعر صرف
العملة األجنبية وتغيرات أخرى (مثل شطب األصول الثابتة) .
Other changes reconcile consecutive end-year positions w ith the transactions during
the year. They represent valuation adjustments such as price changes, foreign
currency exchange rate changes and other changes (for example w rite-offs of
assets).
Equity claim on DI by country
لكل بلد تم إدراجها أعاله ، يرجى امدادنا بالبيانات التالية لمؤسستكم .For each country you have entered in the table above, please supply the following
data for your enterprise.
Debt liability to DI by country
of which reinvestment of
earnings by country
إذا كانت االجابة نعم ، يمكن اعتبار هؤالء المستثمرين مستثمرين غير مباشرين لكم ،
يرجى إدراج أسماء الدول في الجدول إدناه .
If YES, these are also your indirect DIs. Please also list the countries in the table
below.
(Value in : 000 QR القيمة: ألف لاير قطرى)
وضع نهاية
2011 end-2011
position
تغيرات أخرى
خالل 2011 *Other changes
during 2011
تعامالت
خالل 2011Transactions
during 2011
وضع نهاية
2010 end-2010
position
تعامالت
خالل 2010Transactions
during 2010
منها األرباح المعاد استثمارها حسب
البلد
خصوم الدين للمستمثر المباشر حسب البلد
Equity owned by DI by country
األسهم المطالبة على المستثمر المباشر
حسب البلد
مطالبة الدين على المستثمر االمباشر
حسب البلدDebt claim on DI by country
Inward direct investment االستثمار المباشر للداخل
االسهم المملوكة للمستثمر المباشر حسب
البلد
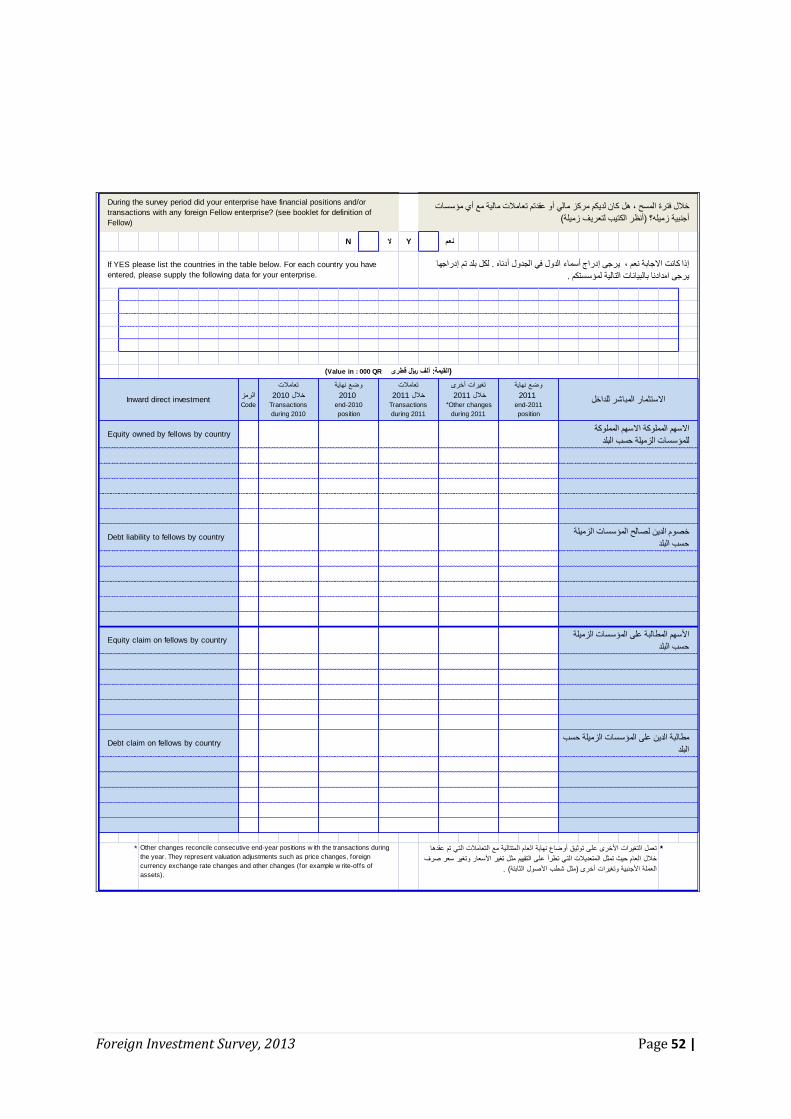
Foreign Investment Survey, 2013 Page 52 |
Nال Yنعم
الرمزCode
تعمل التغيرات األخرى على توثيق أوضاع نهاية العام المتتالية مع التعامالت التي تم عقدها *
خالل العام حيث تمثل المتعديالت التي تطرأ على التقييم مثل تغير األسعار وتغير سعر صرف
العملة األجنبية وتغيرات أخرى (مثل شطب األصول الثابتة) .
Other changes reconcile consecutive end-year positions w ith the transactions during
the year. They represent valuation adjustments such as price changes, foreign
currency exchange rate changes and other changes (for example w rite-offs of
assets).
*
خالل فترة المسح ، هل كان لديكم مركز مالي أو عقدتم تعامالت مالية مع أي مؤسسات
أجنبية زميله؟ (أنظر الكتيب لتعريف زميلة)
During the survey period did your enterprise have financial positions and/or
transactions with any foreign Fellow enterprise? (see booklet for definition of
Fellow)
إذا كانت االجابة نعم ، يرجى إدراج أسماء الدول في الجدول أدناه . لكل بلد تم إدراجها
يرجى امدادنا بالبيانات التالية لمؤسستكم .
If YES please list the countries in the table below. For each country you have
entered, please supply the following data for your enterprise.
(Value in : 000 QR القيمة: ألف لاير قطرى)
االستثمار المباشر للداخل
وضع نهاية
2011 end-2011
position
تغيرات أخرى
خالل 2011 *Other changes
during 2011
تعامالت
خالل 2011Transactions
during 2011
وضع نهاية
2010 end-2010
position
تعامالت
خالل 2010Transactions
during 2010
Inward direct investment
االسهم المملوكة االسهم المملوكة
للمؤسسات الزميلة حسب البلدEquity owned by fellows by country
خصوم الدين لصالح المؤسسات الزميلة
حسب البلدDebt liability to fellows by country
Equity claim on fellows by countryاألسهم المطالبة على المؤسسات الزميلة
حسب البلد
Debt claim on fellows by countryمطالبة الدين على المؤسسات الزميلة حسب
البلد

Foreign Investment Survey, 2013 Page 53 |
OUTWARD DIRECT INVESTMENT.2.22.2. االستثمار المباشر للخارج
Nال Yنعم
Nال Yنعم
الرمزCode
تعمل التغيرات األخرى على توثيق أوضاع نهاية العام المتتالية مع التعامالت التي تم عقدها *
خالل العام حيث تمثل المتعديالت التي تطرأ على التقييم مثل تغير األسعار وتغير سعر صرف
العملة األجنبية وتغيرات أخرى (مثل شطب األصول الثابتة) .
Other changes reconcile consecutive end-year positions w ith the transactions during
the year. They represent valuation adjustments such as price changes, foreign
currency exchange rate changes and other changes (for example w rite-offs of
assets).
*
خالل فترة المسح ، هل كان لديكم مركز مالي أو عقد تعامالت مالية مع أي مؤسسات
أجنبية تسيطر عليها أحد مؤسسات االستثمار المباشر التابعة لكم ؟
During the survey period did you have financial positions and/or transactions with
any foreign enterprises that are controlled by any of your DIEs?
إذا كانت االجابة نعم ، يمكن اعتبار تلك المؤسسات مستثمرين غير مباشرين لكم ، يرجى
إدراج أسماء الدول في الجدول إدناه . لكل بلد تم إدراجها يرجى امدادنا بالبيانات التالية
لمؤسستكم .
If YES, these are also your indirect DIs. Please list the countries in the table
below. For each country you have entered, please supply the following data for
your enterprise.
تعامالت
خالل 2010Transactions
during 2010
?Does your enterprise have one or more immediate foreign DIEsهل كان لدى مؤسستكم مؤسسات استثمار أجنبي مباشر تابعة لكم ؟
إذا كانت االجابة ال ، يرجى االنتقال إلى القسم رقم 3 .
إذا كانت اإلجابة نعم ، يرجى إدراج اسماء الدول .
If NO, please go to Section 3.
If YES, please list the countries.
(Value in : 000 QR القيمة: ألف لاير قطرى)
وضع نهاية
2011 end-2011
position
تغيرات أخرى
خالل 2011 *Other changes
during 2011
تعامالت
خالل 2011Transactions
during 2011
وضع نهاية
2010 end-2010
position
االستثمار المباشر للخارج
مطالبة االسهم على مؤسسات االستثمار
المباشر حسب البلد
Outward direct investment
مطالبة الدين على مؤسسات االستثمار
المباشر حسب البلد
منها األرباح المعاد استثمارها حسب
البلد
Equity claim on DIE by country
Debt claim on DIE by country
Equity liability to DIE by country
Debt liability on DIE by country
of which reinvestment of
earnings by country
خصوم األسهم لمؤسسات االستثمار
المباشر حسب البلد
خصوم الدين على مؤسسات االستثمار
المباشر حسب البلد

Foreign Investment Survey, 2013 Page 54 |
PORTFOLIO AND OTHER INVESTMENT .33. استثمار الحافظة واالستثمارات األخرى
INWARD PORTFOLIO AND OTHER INVESTMENT .1.33.1. استثمار الحافظة للداخل واالستثمارات األخرى
Nال Yنعم
الرمزCode
تعامالت
خالل 2011Transactions
during 2011
وضع نهاية
2010 end-2010
position
تعامالت
خالل 2010Transactions
during 2010
**
تغيرات أخرى
خالل 2011 *Other changes
during 2011
محفظة االستثمار إلى للداخل وأخرى
سندات الملكية حسب البلد
استثمار الحافظة
خالل فترة المسح هل كان لديكم مركز مالي أو عقدتم تعامالت مالية مع أي مؤسسات
أجنبية غير متضمنة في القسم رقم 2 لالستثمار المباشر ؟
During the survey period did your enterprise have financial positions and/or
transactions with any foreign enterprises that are not included in section 2-Direct
Investment?
إذا كانت االجابة نعم ، يرجى إدراج اسماء الدول في الجدول أدناه . لكل بلد تم إدراجها ،
يرجى امدادنا بالبيانات التالية لمؤسستكم .
If YES, please list the countries in the table below. For each country you have
entered, please supply the following data for your enterprise.
(Value in : 000 QR القيمة: ألف لاير قطرى)
وضع نهاية
2011 end-2011
position
Inward portfolio
and other investment
Equity securities by country
Portfolio investment
Other changes reconcile consecutive end-year positions w ith the transactions during
the year. They represent valuation adjustments such as price changes, foreign
currency exchange rate changes and other changes (for example w rite-offs of
assets).
تعمل التغيرات األخرى على توثيق أوضاع نهاية العام المتتالية مع التعامالت التي تم عقدها
خالل العام حيث تمثل المتعديالت التي تطرأ على التقييم مثل تغير األسعار وتغير سعر صرف
العملة األجنبية وتغيرات أخرى (مثل شطب األصول الثابتة) .
إجمالي استثمار الحافظة
سندات الدين حسب البلد
العملة والودائع حسب البلد
Debt securities by country
Loans by countryالقروض حسب البلد
Total other investmentإجمالي االستثمارات األخرى
Trade credit by countryإئتمان تجاري حسب البلد
Other liabilities by country الخصوم األخرى حسب البلد
Other investmentاستثمارات أخرى
Total Portfolio Investment
Currency and deposit by country

Foreign Investment Survey, 2013 Page 55 |
OUTWARD PORTFOLIO AND OTHER INVESTMENT .3.23.2.محفظة االستثمار واالستثمارات االخرى الى الخارج
Nال Yنعم
الرمزCode
(Value in : 000 QR القيمة: ألف لاير قطرى)
وضع نهاية
2011 end-2011
position
تغيرات أخرى
خالل 2011 *Other changes
during 2011
محفظة االستثمار واالستثمارات االخرى الى الخارج
استثمار الحافظة
Debt securities by countryسندات الدين حسب البلد
**
وضع نهاية
2010 end-2010
position
Outward portfolio
and other investment
Portfolio investment
العملة والودائع حسب البلد
إجمالي االستثمارات األخرى
During the survey period did your enterprise have financial positions and/or
transactions with any foreign enterprises that are not included in Section 2- Direct
Investment?
If YES, please list the countries in the table below. For each country you have
entered, please supply the following data for your enterprise.
خالل فترة المسح هل كان لديكم مركز مالي أو عقدتم تعامالت مالية مع أي مؤسسات
أجنبية غير متضمنة في القسم رقم 2 لالستثمار المباشر ؟
إذا كانت االجابة نعم ، يرجى إدراج اسماء الدول في الجدول أدناه . لكل بلد تم إدراجها ،
يرجى امدادنا بالبيانات التالية لمؤسستكم .
تعمل التغيرات األخرى على توثيق أوضاع نهاية العام المتتالية مع التعامالت التي تم عقدها
خالل العام حيث تمثل المتعديالت التي تطرأ على التقييم مثل تغير األسعار وتغير سعر صرف
العملة األجنبية وتغيرات أخرى (مثل شطب األصول الثابتة) .
Other changes reconcile consecutive end-year positions w ith the transactions during
the year. They represent valuation adjustments such as price changes, foreign
currency exchange rate changes and other changes (for example w rite-offs of
assets).
Equity securities by countryسندات الملكية حسب البلد
تعامالت
خالل 2010Transactions
during 2010
تعامالت
خالل 2011Transactions
during 2011
Total portfolio investmentإجمالي استثمار الحافظة
Other investmentاستثمارات أخرى
Currency and deposit by country
Loans by countryالقروض حسب البلد
Trade credit by countryإئتمان تجاري حسب البلد
Total other investment
Other assets by countryاألصول األخرى حسب البلد
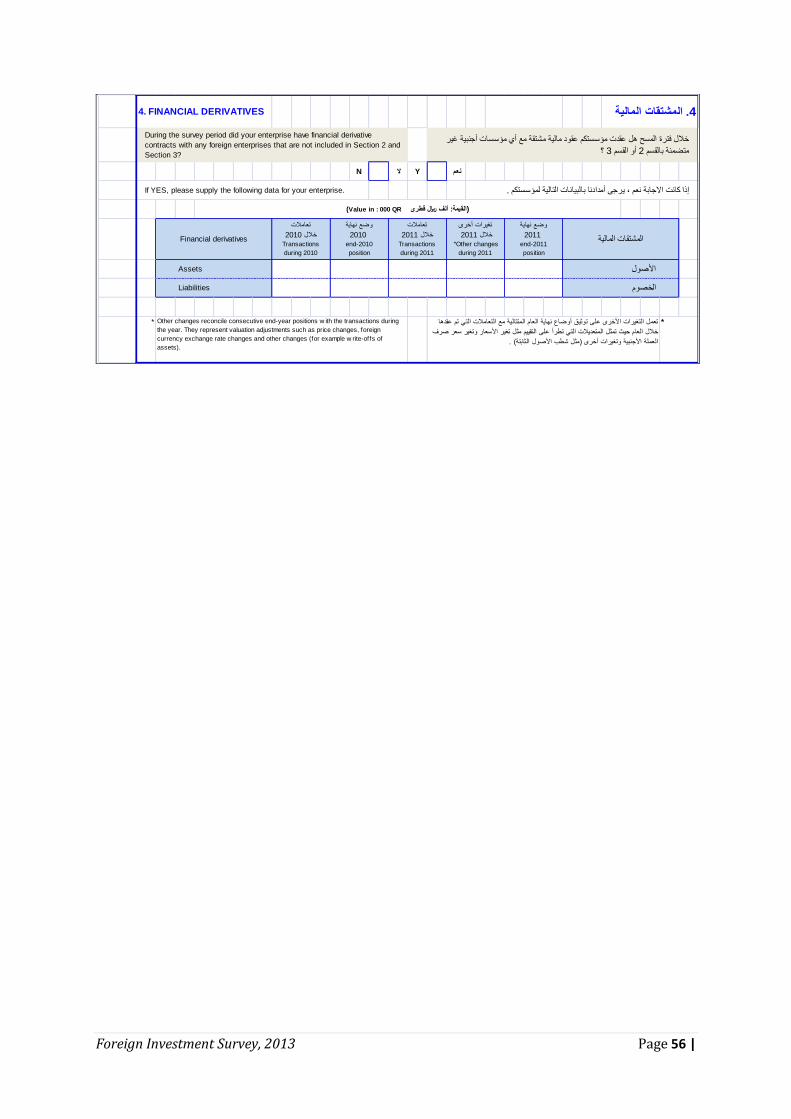
Foreign Investment Survey, 2013 Page 56 |
FINANCIAL DERIVATIVES .44. المشتقات المالية
Nال Yنعم
*
Liabilities الخصوم
(Value in : 000 QR القيمة: ألف لاير قطرى)
وضع نهاية
2011 end-2011
position
تعمل التغيرات األخرى على توثيق أوضاع نهاية العام المتتالية مع التعامالت التي تم عقدها *
خالل العام حيث تمثل المتعديالت التي تطرأ على التقييم مثل تغير األسعار وتغير سعر صرف
العملة األجنبية وتغيرات أخرى (مثل شطب األصول الثابتة) .
Other changes reconcile consecutive end-year positions w ith the transactions during
the year. They represent valuation adjustments such as price changes, foreign
currency exchange rate changes and other changes (for example w rite-offs of
assets).
Financial derivatives
Assetsاألصول
تعامالت
خالل 2011Transactions
during 2011
وضع نهاية
2010 end-2010
position
إذا كانت االجابة نعم ، يرجى أمدادنا بالبيانات التالية لمؤسستكم .
During the survey period did your enterprise have financial derivative
contracts with any foreign enterprises that are not included in Section 2 and
Section 3?
خالل فترة المسح هل عقدت مؤسستكم عقود مالية مشتقة مع أي مؤسسات أجنبية غير
متضمنة بالقسم 2 أو القسم 3 ؟
تعامالت
خالل 2010Transactions
during 2010
If YES, please supply the following data for your enterprise.
المشتقات المالية
تغيرات أخرى
خالل 2011 *Other changes
during 2011
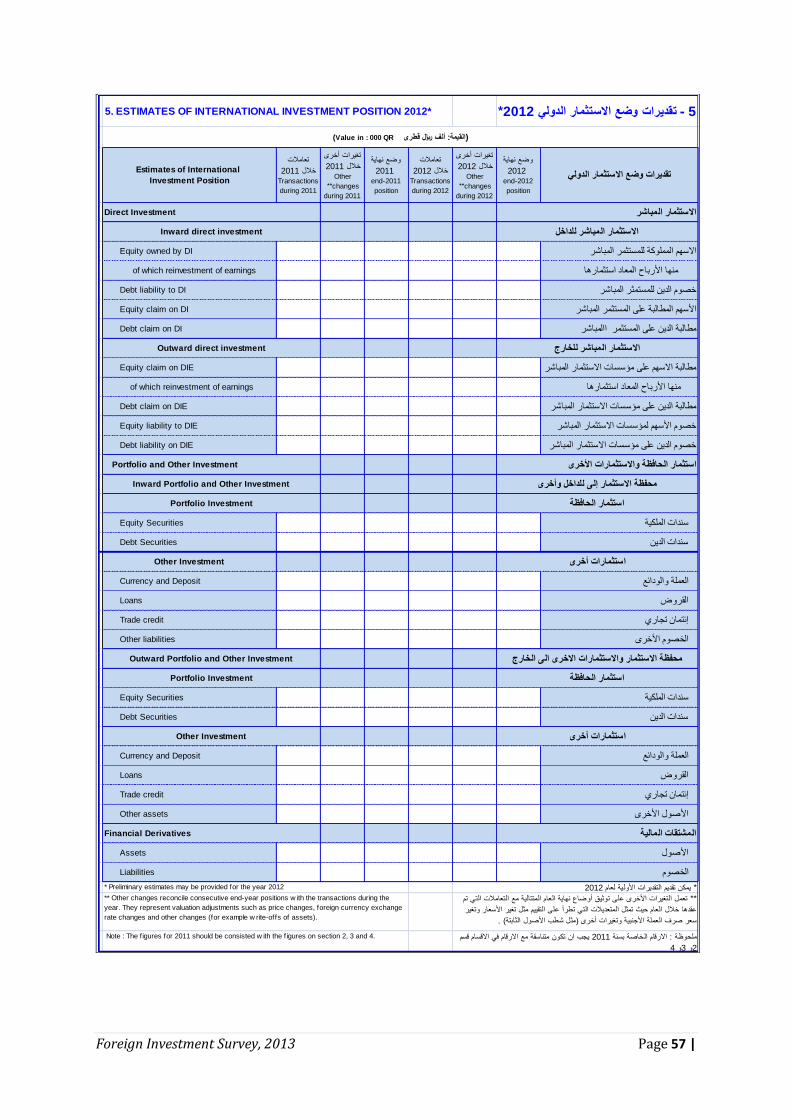
Foreign Investment Survey, 2013 Page 57 |
*ESTIMATES OF INTERNATIONAL INVESTMENT POSITION 2012 .55 - تقديرات وضع االستثمار الدولي 2012*
وضع نهاية
2012 end-2012
position
تغيرات أخرى
خالل 2012 Other
**changes
during 2012
تعامالت
خالل 2012Transactions
during 2012
وضع نهاية
2011 end-2011
position
تغيرات أخرى
خالل 2011 Other
**changes
during 2011
(Value in : 000 QR القيمة: ألف لاير قطرى)
تقديرات وضع االستثمار الدولي
تعامالت
خالل 2011Transactions
during 2011
Estimates of International
Investment Position
Direct Investmentاالستثمار المباشر
Inward direct investmentاالستثمار المباشر للداخل
Equity owned by DIاالسهم المملوكة للمستثمر المباشر
of which reinvestment of earnings منها األرباح المعاد استثمارها
Debt liability to DIخصوم الدين للمستمثر المباشر
Equity claim on DIاألسهم المطالبة على المستثمر المباشر
Debt claim on DIمطالبة الدين على المستثمر االمباشر
Outward direct investmentاالستثمار المباشر للخارج
Equity claim on DIEمطالبة االسهم على مؤسسات االستثمار المباشر
of which reinvestment of earnings منها األرباح المعاد استثمارها
Debt claim on DIEمطالبة الدين على مؤسسات االستثمار المباشر
Equity liability to DIEخصوم األسهم لمؤسسات االستثمار المباشر
Debt liability on DIEخصوم الدين على مؤسسات االستثمار المباشر
Portfolio and Other Investmentاستثمار الحافظة واالستثمارات األخرى
Inward Portfolio and Other Investmentمحفظة االستثمار إلى للداخل وأخرى
Portfolio Investmentاستثمار الحافظة
Equity Securitiesسندات الملكية
Debt Securitiesسندات الدين
Other Investmentاستثمارات أخرى
Currency and Depositالعملة والودائع
Loansالقروض
Trade creditإئتمان تجاري
Other liabilitiesالخصوم األخرى
Outward Portfolio and Other Investmentمحفظة االستثمار واالستثمارات االخرى الى الخارج
Portfolio Investmentاستثمار الحافظة
Equity Securitiesسندات الملكية
Debt Securitiesسندات الدين
Other Investmentاستثمارات أخرى
Currency and Depositالعملة والودائع
Loansالقروض
Trade creditإئتمان تجاري
Other assetsاألصول األخرى
Financial Derivativesالمشتقات المالية
Assetsاألصول
Liabilitiesالخصوم
Preliminary estimates may be provided for the year 2012 ** يمكن تقديم التقديرات األولية لعام 2012
** تعمل التغيرات األخرى على توثيق أوضاع نهاية العام المتتالية مع التعامالت التي تم
عقدها خالل العام حيث تمثل المتعديالت التي تطرأ على التقييم مثل تغير األسعار وتغير
سعر صرف العملة األجنبية وتغيرات أخرى (مثل شطب األصول الثابتة) .
** Other changes reconcile consecutive end-year positions w ith the transactions during the
year. They represent valuation adjustments such as price changes, foreign currency exchange
rate changes and other changes (for example w rite-offs of assets).
ملحوظة : االرقام الخاصة بسنة 2011 يجب ان تكون متناسقة مع االرقام في االقسام قسم
2و 3و 4
Note : The f igures for 2011 should be consisted w ith the f igures on section 2, 3 and 4.

Foreign Investment Survey, 2013 Page 58 |
6 - الدخل المستلم والمدفوعات *
مدفـــوعPayments
مستــلمReceipts
مدفـــوعPayments
مستــلمReceipts
.A non-resident is any individual, enterprise, or other organization residing overseas******غير المقيم هو أي شخص او منشاة أو منظمة مقيمة خارج الدولة .
حــسب البنـود
خالل 2011During 2011
خالل 2010During 2010
3.1- المساهمين المقيمين
1( األرباح المدفوعة إلى / المستلمة من
منها مستثمرين أجانب مباشرينof which: share of foreign direct
Investors
Total
6 - INCOME RECEIPTS AND PAYMENTS*
**المستثمرين االجانب المباشرين هم االشخاص والوحدات غير مقيمة الذين يملكون على االقل %10
من اجمالي راسمال الشركة.
**Foreign direct investors are non-resident entities who own at least 10% of the total
common shares of your company.
*On accrual basis.
3.3- المساهمين المقيمين
* التسجيل على أساس اإلستحقاق.
3.3- Resident shareholders
(Value in : 000 QR القيمة ألف لاير قطري)
المجموع
Foreign direct investors -1.33.1- مستثمرين أجانب مباشرين
3.2- Other non-residents 2.3- غير المقيمين اآلخرين
الرمزCode
Interest received from/paid to (33( الفائدة المدفوعة إلى / المستلمة من
**Foreign direct investors -1.11.1- مستثمرين أجانب مباشرين**
***Other non-residents -2.11.2- غير المقيمين اآلخرين***
Reinvested earnings (22( المتحصالت من إعادة اإلستثمار
1) Dividends received from/paid to
1.3- Resident shareholders
Components
Name of the companyاسم الشركة
Name of the ownerاسم مالك الشركة
Name of the managerاسم مدير الشركة
توقيع Signatureال
Name of respondentاسم المدلي بالبيانات
توقيع Signatureال
.Phone No./ mobile No-رقم الهاتف / رقم المحمول
Official stamp of the companyالختم الرسمي للشركة / المنشأة
Dateالتاريخ
Avowalإقرار
أقر بأن البيانات الواردة بهذه اإلستمارة صحيحة ومطابقة لما هو وارد
بالدفاتر والسجالت الرسمية .
I, the undersigned confirm that the mentioned data in this questionnaire are
correct and compatible with the books and official records
Foreign Investment Survey, 2013 Page 59 |
Auditor هاتف جوالMob.No.
Auditing supervisor هاتف جوالMob.No.
Data entry in charge هاتف جوالMob.No.
Data entry auditing in
charge.Mob.Noهاتف جوال
مدخل البيانات
lمشرف تسويق
مدقق اإلدخال
المدقق
Office auditing and data entry teamفريق العمل المكتبي والتجهيز اآللي
Copyright © 2022 FDOKUMEN