Trade and Foreign Investment: Comparing India and China
42
India and China: Past Trade Liberalization and Future Challenges Arvind Panagariya Columbia University Tokyo Club Macro Conference December 6-7, 2006
-
Upload
khangminh22 -
Category
Documents
-
view
1 -
download
0
Transcript of Trade and Foreign Investment: Comparing India and China

India and China: Past Trade Liberalization and Future Challenges
Arvind PanagariyaColumbia University
Tokyo Club Macro ConferenceDecember 6-7, 2006
Broad Outline
Recent PerformanceThe Pattern of TradeForeign InvestmentTrade and Foreign Investment PoliciesLooking Ahead• National Trade Policies• Preferential Trade Area (PTA) Arrangements• The Doha Round
Concluding Remarks

Figure 1: India: Growth Rates During Four Phases
4.1
3.2
4.8
6.1
0
1
2
3
4
5
6
7
1951-65 1965-81 1981-88 1988-04

Figure 2: Official Growth Rate in China
9.410
9.1
0
2
4
6
8
10
12
1981-90 1991-00 2001-04

Points to Note
In terms of the shift to 6% plus growth rate, India is approximately a decade behind ChinaEven post-1988, China has grown at least 3% per-annum faster. The gap is higher in per-capita terms.This has meant rapidly diverging per-capita incomes in the two countries

Figure 3: Per-capita GDP in India and China at 2000 $US
0
200
400
600
800
1000
1200
1400
1982
1983
1984
1985
1986
1987
1988
1989
1990
1991
1992
1993
1994
1995
1996
1997
1998
1999
2000
2001
2002
2003
2004
IndiaChina

More Impressive Growth in India in the Last Three Years
GDP Growth: Business cycle or a fundamental shift in the growth rate?
4.0
7.1
5.2
8.1
0.0
1.0
2.0
3.0
4.0
5.0
6.0
7.0
8.0
9.0
1990-93 1993-97 1997-03 2003-06

Growth in dollar terms has been even more spectacular
Dramatic 16.4% annual growth in the GDP in current dollars in the last three years ($billion)
452 461 478506
601
695
798
0
100
200
300
400
500
600
700
800
900
1999-00 2000-01 2001-02 2002-03 2003-04 2004-05 2005-06

Salient Features of Growth in India in the Last three Years(1)
Exports in 1990-91 doubled for the first time in 1999-00. Recently, they doubled in just three years: from $52.7 billion to $102.7 billionServices exports have doubled in just two years: from $26.9 billion in 2003-04 to $60.6 billion in 2005-06Exports of goods and services as a proportion of the GDP grew from 7.2% in 1990-91 to 11.6% in 1999-00, and to 20.5% percent in 2005-06.Trade/GDP ratio rose from 15.9% in 1990-91 to 25.2% in 1999-00 and to 43.1% in 2005-06

Salient Features of Growth in India in the Last three Years(2)
Foreign investment up from $6 billion in 2002-03 to $20.2 billion in 2005-06. DFI up from $5 billion to $7.8 billion over the same periodRemittances up from $17.2 billion in 2002-03 to $24.6 billion in 2005-06Phone lines up from the stock of 5 million in 1990-91 to a flow of 5 million per month. 185 million lines as of July 31, 2006Sales of passenger vehicles up from 707,000 in 2002-03 to 1.14 million in 2005-06. Total number of vehicles produced in the last three years in excess of all registered vehicles in 1990-91

Evolution of Trade Openness
As measured by exports/GDP ratio, China was already more open than India in 1982Over 1982-03, exports/GDP ratio grew rapidly in both countries but it grew much more rapidly in ChinaIn the early to mid-1980s, exports in both countries grew less rapidly than subsequently (Overvalued exchange rate in India; planning through export targets in China)China’s share in the world trade grew almost five-fold during this period

Figure 4: Exports of Goods and Services as Proportion of the GDP
0.0
5.0
10.0
15.0
20.0
25.0
30.0
35.0
1982
1983
1984
1985
1986
1987
1988
1989
1990
1991
1992
1993
1994
1995
1996
1997
1998
1999
2000
2001
2002
2003
IndiaChina

Figure 6: Share of exports of goods and services in the world market
0.0
1.0
2.0
3.0
4.0
5.0
6.0
1982 1990 2000 2003
IndiaChina

India: Patterns of Exports
Item 2003-04 2004-05 2005-06PI. Primary products 15.5 16.2 16.0II. Manufactured goods 76.0 72.7 69.9A. Leather and manufactures 3.4 2.9 2.6B. Chemicals and related products 14.8 14.9 14.1C. Engineering goods 19.4 20.8 21.01. Iron & steel 3.9 4.7 3.42. Manufacture of metals 3.8 4.1 4.13. Machinery and instruments 4.3 4.5 4.74. Transport equipment 3.1 3.4 4.4D. Textile and textile products 20.0 16.2 15.61. Cotton yarn, fabrics, made-ups, etc. 5.3 4.1 3.86. Readymade garments 9.8 7.9 8.2E. Gems and jewellery 16.6 16.5 15.1F. Handicrafts (excluding handmade carpets) 0.8 0.5 0.4G. Other manufactured goods 1.0 1.0 1.1III. Petroleum products 5.6 8.4 11.2IV. Others 2.9 2.7 2.9

Pattern of Exports: Factor Intensities
Haphazard in IndiaSoftware (skilled-labor intensive)Gems and jewelry (semi-skilled-labor intensive)Apparel (unskilled-labor intensive)Textiles; Petroleum and petroleum products; and Iron & steel (capital intensive)
Coherent in ChinaApparel, textiles, toys, footwear, sports goods in 1990sOffice machinery, telecommunications, electrical machinery, apparel currently
China more specialized by the stage of production

Figure 1: Top Six Exports of India
0.0
2000.0
4000.0
6000.0
8000.0
10000.0
12000.0
14000.0
1980
1982
1984
1986
1988
1990
1992
1994
1996
1998
2000
2002
2004
66 Non-metallic mineralmanufactures, n.e.s.
65 Textile yarn,fabrics,made-uparticles, n.e.s. and relatedproducts84 Articles of apparel andclothing accessories
33 Petroleum,petroleumproducts and related material
89 Miscellaneousmanufactured articles
67 Iron and steel

Figure 9: Top six exports of China
0
10000
20000
30000
40000
50000
60000
70000
80000
90000
100000
1984
1986
1988
1990
1992
1994
1996
1998
2000
2002
2004
75 Office machines & automaticdata processing machines
76 Telecommunications & soundrecording and reproducingapparatus and equipment77 Electrical machinery,apparatus & appliances
84 Articles of apparel and clothingaccessories
89 Miscellaneous manufacturedarticles
65 Textile yarn,fabrics,made-uparticles, n.e.s., and relatedproducts

Figure 10: Top two exports of each of India and China
0
10000
20000
30000
40000
50000
60000
70000
80000
90000
100000
1984
1986
1988
1990
1992
1994
1996
1998
2000
2002
2004
75 Office machines &automatic data processsingmachines (China)
76 Telecommunications &sound recording andreproducing apparatus andequipment (China)66 Non-metallic mineralmanufactures, n.e.s. (India)
65 Textile yarn,fabrics,made-uparticles, n.e.s. and relatedproducts (India)

Merchandise Imports
China’s imports have been concentrated in machinery and transport equipment (SITC 7)—46% during 2001-04.In India, SITC 7 accounts for only 19% importsMineral fuels and lubricants (SITC 3) account for 31 percent of India’s importsThe structure of imports also points to a very capital intensive production structure in India

Figure 4: Services Exports of India
0.0
10.0
20.0
30.0
40.0
50.0
60.0
70.0
1990
-9119
92-93
1994
-9519
96-97
1998
-9920
00-01
2002
-0320
04-05
PR
Total ($Billion)Miscellaneous ($Billion)

Composition of Software Exports
Year
IT Services ($Billion)
ITES-BPO ($Billion)
Total Software ($Billion)
Growth in Total
Software
Share of BPO in
Software1 2 3 4 (=2+3) 5 61995-96 0.8 0.81996-97 1.1 1.1 45.91997-98 1.8 1.8 59.91998-99 2.6 2.6 47.81999-00 3.4 0.6 4.0 52.4 14.32000-01 5.3 0.9 6.2 56.9 15.02001-02 6.2 1.5 7.6 23.0 19.62002-03 7.0 2.5 9.5 24.8 26.22003-04 9.2 3.6 12.8 34.1 28.12004-05 13.1 4.6 17.7 38.3 26.02005-06 17.3 6.3 23.6 33.3 26.7

India’s Software Exports ($billion)
YearIT Services ITES/BPO
Total Software
1995-96 0.8 0.82000-01 5.3 0.9 6.22003-04 9.2 3.6 12.82004-05 12.0 5.2 17.2

Figure 5: Foreign Investment ($Billion)
0.0
10.0
20.0
30.0
40.0
50.0
60.019
90-9
1
1991
-92
1992
-93
1993
-94
1994
-95
1995
-96
1996
-97
1997
-98
1998
-99
1999
-00
2000
-01
2001
-02
2002
-03
2003
-04
2004
-05
2005
-06P
China (DFI)India (Total Foreign Invesment)India (DFI)

Prasad and Wei on DFI into China from 1998 to 2004
“Table 2 shows that about two-thirds of these flows have been going into manufacturing, with real estate accounting for about another 10 percent. Within manufacturing, the largest identifiable share has consistently gone to electronics and communication equipment. The share of manufacturing has risen by almost 15 percentage points since 1998, largely at the expense of the shares of utilities, construction, transport and telecommunication services, and real estate. Since the industries with declining FDI shares are largely focused on non-traded goods, the evolution of this pattern of FDI seems to be consistent with the notion that these inflows have been stimulated by China’s increasing access (both actual and anticipated) to world export markets...”

India: Composition of DFI, 1991-2005Item $Billion PercentElectrical Equipments (incl computer software) 4.9 16.0Transportation Industry 3.1 10.3Services Sector 3.0 9.8Telecommunications 2.9 9.5Fuels (Power & Oil Refinery) 2.5 8.3Chemicals (Other than Fertilizers) 1.9 6.2Food Processing Industries 1.2 3.9Drugs and Pharmaceuticals 0.9 3.1Cement and Gypsum Products 0.7 2.5Metallurgical Industries 0.6 2.1Consultancy Services 0.4 1.5Miscellaneous Mechanical & Engineering 0.5 1.6Textiles (Includ Dyed, Printed) 0.4 1.4Trading 0.4 1.2Paper and Pulp including paper product 0.4 1.2Hotel & Tourism 0.3 1.0Glass 0.3 0.8Rubber Goods 0.2 0.8Commercial, Office & Household Equipment 0.2 0.8Industrial Machinery 0.2 0.7Machine Tools 0.2 0.5Other 5.2 17.0Total 30.5 100.0

Trade Policy in the mid 1970s
ALL trade centrally controlled in both countriesIndia
LicensingThe “Red Book” of allowed imports and their quantities issued every six monthsCanalization
ChinaCentrally controlled FTCs directly under the Ministry of Foreign Trade

Liberalization in the 1980s: India
Scope of “canalized” imports reduced Open General Licensing (OGL) expanded: 30% imports freed up by 1990East-Asian style export incentives in the second half of the 1980sMore than 30 percent real depreciation of the rupee in the second half of the 1980sTariffs raised to mop up the quota rents
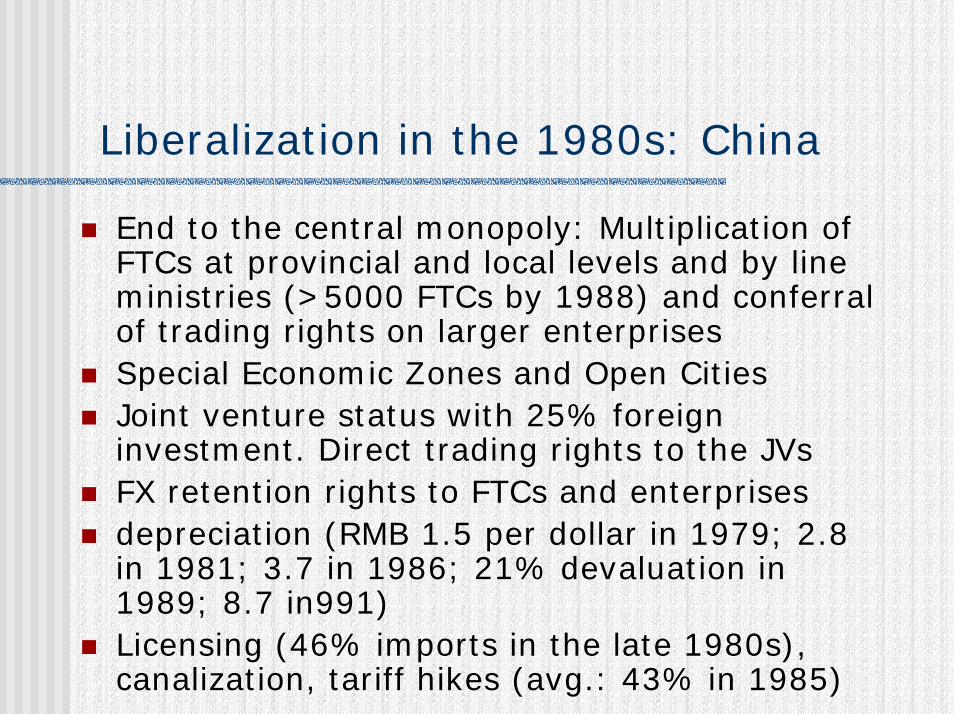
Liberalization in the 1980s: China
End to the central monopoly: Multiplication of FTCs at provincial and local levels and by line ministries (>5000 FTCs by 1988) and conferral of trading rights on larger enterprisesSpecial Economic Zones and Open Cities Joint venture status with 25% foreign investment. Direct trading rights to the JVs FX retention rights to FTCs and enterprisesdepreciation (RMB 1.5 per dollar in 1979; 2.8 in 1981; 3.7 in 1986; 21% devaluation in 1989; 8.7 in991)Licensing (46% imports in the late 1980s), canalization, tariff hikes (avg.: 43% in 1985)

Comparing India and China
China was more open in the 1980sDefault regime in India: Licensing; actual user and domestic availability conditions (except OGL)In China: No restriction on the companies authorized to trade except for products subject to canalization or licensingOvervalued exchange rate in India in the first
half of the 1980sForeign investment regime far more open in China (esp. in the SEZs and open cities)

1990s and Beyond: India
End to licensing in capital and intermediate goods in 1991; in consumer goods in 2001Highest industrial tariff down from 350 percent in 1991 to 12.5 percent currentlyAgriculture: Very high tariff equivalents (bound at 100 to 300 percent)Services: On balance more open now than China (exceptions: distribution services and insurance)DFI: Negative list approach; only a handful of sectors with sectoral caps below 51 percent.

1990s and Beyond: China
Scope of licensing reduced: by 1997, only 5% of the tariff lines under licensingAverage industrial tariff down from 43% in the late 1980s to 40% in 1993, 23% in 1996, 15% in 2001, and 9% by 2006 under the WTO entry conditionsAgricultural tariff: 15% under entry conditionsSubstantial liberalization of services under the WTO entry conditions (including distribution and insurance sectors)

Why India Lags Behind China
Trade openness is not the major factor: in industry and services India is almost as open as ChinaDomestic policies are the key factor
Small-scale industries (SSI) reservationBusiness houses with $27 million or more in assets limited to 19 “core” capital-intensive industries (list expanded in the 1980s)Foreign investment limited to 40% in most casesLabor market rigidities
Infrastructure (power is the biggest constraint)
Looking Ahead
National Trade PoliciesBilateral AgreementsMultilateral Negotiations: The Doha Round

National Trade Policies
Further compression of tariffsEliminating tariff peaks: automobiles (new and used)Agriculture (liberalization with other reforms in the area)Trade facilitationContingent Protection (Anti-dumping)

Trade FacilitationTransaction Location Norm Air Freight Delhi Airport Export 2.5 days Less than 12 hours Import 15 days Less than 12 hours Containerized Sea Freight Mumbai Ship Waiting Time 3-5 days Less than 6 hours Export Dwell Time 3-5 days Less than 18 hours Import Dwell Time 7-14 days Less than 24 hours

Anti-dumping: 1995-05Figure 6: Anti-dumping Initiations
0
50
100
150
200
250
300
350
400
450
India United States EuropeanCommunity
Argentina South Africa Australia Canada China, P.R. Brazil Turkey

Figure 7: Annual Anti-dumping Initiations: Top Three and China
0
10
20
30
40
50
60
70
80
90
1995 1996 1997 1998 1999 2000 2001 2002 2003 2004 2005
IndiaUnited StatesEuropean CommunityChina, P.R.

Preferential Trade Agreements
Discriminatory: Trade diversion versus trade creationRules of OriginSectoral exclusionsSpaghetti Bowl
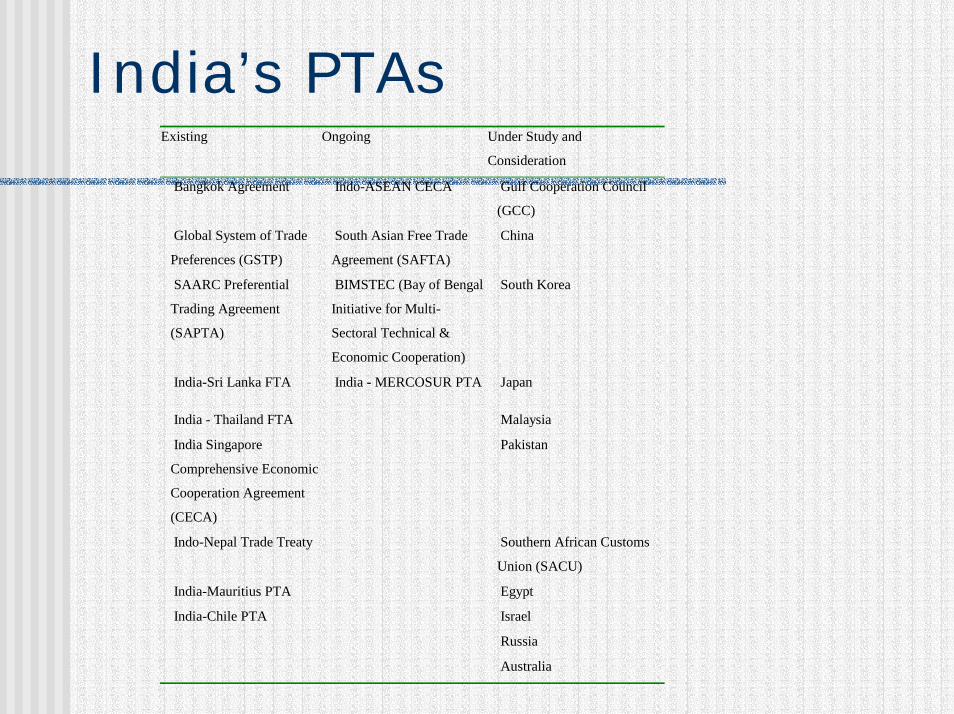
India’s PTAsExisting Ongoing Under Study and
Consideration
Bangkok Agreement Indo-ASEAN CECA Gulf Cooperation Council
(GCC)
Global System of Trade
Preferences (GSTP)
South Asian Free Trade
Agreement (SAFTA)
China
SAARC Preferential
Trading Agreement
(SAPTA)
BIMSTEC (Bay of Bengal
Initiative for Multi-
Sectoral Technical &
Economic Cooperation)
South Korea
India-Sri Lanka FTA India - MERCOSUR PTA Japan
India - Thailand FTA Malaysia
India Singapore
Comprehensive Economic
Cooperation Agreement
(CECA)
Pakistan
Indo-Nepal Trade Treaty Southern African Customs
Union (SACU)
India-Mauritius PTA Egypt
India-Chile PTA Israel
Russia
Australia

An India-China FTA?
If India and China insist n taking the bilateral road (not recommended), best to have a bilateral with each otherGiven Chinese competitiveness, less scope for trade diversion in IndiaCan serve as the focal point for the other Asian countries and pry open the EU and NAFTA to Asia from which they have diverted tradePromote an alternative template

Doha RoundIndia has taken a hard line on agricultural liberalization—large number of special products, special safeguardLiberalization in agriculture by India will be good—in a liberalized regime, Indian agriculture is likely to be competitiveSome sectors may emerge as successful exporters, pressure for agricultural reforms (land titles, private mundies etc.) will increase

Thanks You and That is All