tax policy and foreign direct investment (fdi) in nigeria
119
TAX POLICY AND FOREIGN DIRECT INVESTMENT (FDI) IN NIGERIA BY: DANLADI KAMAL MOHAMMED MEC/41616/133/DF A Thesis submitted to the College of Higher Degrees and Research in Partial Fulfillment of the Requirements for the Award of Master of Arts in Economics Of Kampala International University Kampala, Uganda May,2015
-
Upload
khangminh22 -
Category
Documents
-
view
1 -
download
0
Transcript of tax policy and foreign direct investment (fdi) in nigeria
TAX POLICY AND FOREIGN DIRECT INVESTMENT (FDI)
IN NIGERIA
BY:
DANLADI KAMAL MOHAMMED
MEC/41616/133/DF
A Thesis submitted to the College of Higher Degrees and Research in Partial Fulfillment of
the Requirements for the Award of Master of Arts in Economics
Of Kampala International University
Kampala, Uganda
May,2015

DECLARATION A
"This thesis is my original work and has not been presented for a Degree or any other academic
award in any University or Institution of learning"_
Signature~~-~ ----~---- - Name of the Candidate Danladi Kamal Mohammed

Approval
"I confinn that the work reported in this thesis was carried out by the candidate under my
supervision" .
Name of the Supervisor Dr. ISAAC MO KONO ABU GA
Sign~l;.£. .. .. . . . ... . . ~ .
Date: J~ ly eJ ~
11

DEDICATION
I dedicate this thesis to my late parents' Malam Mahammadu kado and Malama Saadatu Ali may
their soul rest in perfect peace Amin.
111

ACKNOWLEDGEMENTS
First and foremost i would like to thank the almighty God for the gift of life and health that he
has given to me to make me be able to write this research work. I would also like to acknowledge
the assistance and role played by the following personalities to the successful completion of this
study. I thank my late parents may their soul rest in peace for sacrificing the little they had, in
thick and thin and invested in my education. Thank you for looking after me and enabling me to
acquire a lifelong investment. I also thank my best friend and Brother Baffa Yahaya for his
financial assistance during my programme in Kampala International University (K.I.U).
I cannot s.1y exactly how grateful. I am to my supervisor Dr.Abuga Isaac whose guidance in this
study was beyond mensure tlrnnk you for guiding me with patience and o.lso for providing me
with professional advice.
I cannot forget the efforts of staff of Kampala International University especially lecturers of
College of Business and Management for their input and effort that made me acquire the
invaluable knowledge.
[n the same way. I \Votilcl like to thank the management and staff of Central Bank of Nigeria
(CBN) ABUJA. federal ministry of finance Abuja Nigeria National Bureau of Statistics Abuja
Nigeria for their time given to me.
L.1stly [ would like to acknowledge my wives. sons and daughters for their patience during my
study at Kampala International University Uganda.
IV

CTL
EU
FDI
FIRS
GDP
GFCF
NBS
MAT
MNEs
OECD
PAYE
PIT
FIRS
SMES
SPSS
U.K
CBN
U.S.
NRA
LIST OF ACRONYMS AND ABBREVIATIONS
Commercial Transaction Levy
European Union
Foreign Direct Investment
Federal Inland Revenue Services
Gross Domestic Product
Gross Fixed Capital Formation
National Bureau of Statistics
Minimum Alternate Tax
Multinational Enterprises
Organization for Economic Co-operation and Development
Pay As You Earn
Personal Income Tax
Federal Inland Revenue Sen,ice
Small and Medium Enterprises
Special Package for Social Scientists
United Kingdom
Central Bank of Nigeria
United States
Nigeria Revenue Authority
V

VAT
VIF
OVTEST
Value Added Tax
Variance Inflating Factor
Omitted Variable Test
VI

LIST OF TABLES
Table 4.1 Summary of All Variables Exercised in this Study
Table 4.2 Descriptive Statistics of FDI the Dependent variable and the Independent variables
Table 4.3 Trend ofFDI inflow in Nigeria between 1984 and 2014
Table 4.4Trend of Tax Incentives in Nigeria between 1984 and 2014
Table 4.5Trend of Corporate Tax Rates In Nigeria between 1984 and 2014
Table4.6The main Categories of Tax Incentives in Nigeria
Table 4.7Sumrnary ofFDI inflow. Tax Rate, Tax Incentives and GDP (1984 -2014)
Table 4.8 Pearson Correlation of the Independent Variables v-,1ith the Dependent variables
Table 4.9 Correlation value among Independent variables
Table 4.10 VIF value among Independent Variables
Table 4.11 Linktest calculation
Table 4.12 Shapiro Wilk Test on Normality Problem
Table 4.13 Regression Estimation using Robust Standard Error
Vil

LIST OF FIGURES
Figure 2.1 conceptual frame work
Figure 4.1 Trend ofFDI inflows in Nigeria 1984 to 2014
Figure 4.2 Trend of Corporate Tax Rates In Nigeria between 1984 and 2014
Figure 4.3 Trend of tax incentive in Nigeria 1984 to 2014
VIII

ABSTRACT
The study investigated the influence of tax incentives, tax rate on the foreign direct
investment in the period 1984-2014. The model is derived from eclectic paradigm
theory. It can be understood from this theory the main factors that driven FDI inflows
have been the need to receive market access, the opportunities presented by large scale
privatization process and the degree of political and economic stability. The researcher
utilized secondary data of 30 years. Data points and data have been taken from
UNICTAD Annual reports World Bank development reports, central bank of Nigeria
CBN publication on monetary policy. CBN Annual Report and statement of account
and federal ministry of finance reports. The trend of each of the above mentioned
construct variables have also been examined in the study to show their movement and
changes between (the independent variable) tax policy and foreign direct investment
(dependent variable) in Nigeria. The researcher used Pearson Linear Correlation
Coefficient (PLCC) and ordinary lenst square (OLS) regression analysis. To examine
the trend of the research variables line graphs have been employed. The study findings
showed the trend of tax incentive in Nigeria in the study period were fluctuations fi·om
time to time. Tax incentives in million of Naira has experienced a decreasing and
increasing trend. In summary form tax incentive from 1984-1986 was declining then
from 1987-1993 ,,vere a general rising trend of tax incentive in Nigeria. Fluctuations
from time as that of tax incenti\'es. [n summary form the FDI intlov, of Nigeria has
experienced an increased trends in some shorter year for instance 1992 the FDI inflmv
raised to 42, 624from 111, 730 in 1991.
The research concluded the tax policy as presented by tax incentives and tax rate ,vhich
were the main focus of this study. Based on the research finding the researcher
concluded the tax policy presented by tax incentive and tax rate have positive
significant effect on FDI ini10\v in Nigeria. The researcher also recommenclecl based on
the empirical quantitative analysis that tnx rate has a significant and negative impact on
FDI inflow accordingly. lowering tax rate accompanied by tax procedure simplification
,vill increase FDI inflow and a tax incentive policy showed be planned and managed
appropriately.
IX

TABLE OF CONTENTS
DECLARATION A
DECLARATION B
DEDICATION
ACKNOWLEDGEMENTS
LIST OF ACRONYMS AND ABBREVIATIONS
LIST OF TABLES
LIST OF FIGURES
ABSTRACT
TABLE OF CONTENTS
CHAPTER ONE
INTRODUCTION
1.0 Introduction
1.1 Background of the Study
1.1. l Historical and Global Perspectives
1.1.2 Theoretical Perspective
1.1.3 Conceptual Perspective
1.1.4 Contextual Perspective
1.2 ProblemStatement
1.3 General Objective
1.4 Objectivesof the study
1.4 .1 Specific objective
1.5 Research Questions
1.6 Research hypothesis
1.7 Research Scope
1.7.1 Geographical Scope
1.7.2 Content Scope
1. 7 .3 Theoretical Scope
1.7.4 Time Scope
1.8 Significance of the Study
1. 9 Operationa I Definition of Key Words
1.10 Study Limitations
X
Error! Bookmark not defined.
iii
iv
V
vii
viii
ix
X
1
1
1
1
1
6
6
10
12
13
13
13
13
14
14
14
14
15
15
16
16
17

CHAPTER TWO
REVIEW OF RELATED LITERATURE
2.0 Introduction
2.1 Conceptual Framework
Figure 2.1: Conceptual Framework
2.2 Theoretical Review
2.2.2.1 Foreign Direct Investment Theory
2.2.2.2 Capital Market Theory
2.2.2.3 Theories Assuming Perfect Market
2.2.2.4 Theories Assuming Imperfect Market
2.2.2.5 The Eclectic Theory
2.3Foreign Direct Investment
2.4 Tax Incentives and Foreign Direct Investment (FDI)
2.5 Policy Arguments for Tax Incentives in Attracting FDI
2.5 Tax Policy
2.7 Challenges Faced by Developing Countries in Tax System
2.8 Tax Administration and Data
2.9 Gaps in the Literature
CHAPTER THREE
METHODOLOGY
3.0 Introduction
3.1 Research Design
3.2 Data Collection Techniques
3.3 Data Analysis
3.3.1 Statistical method
3.3.2 Variables descriptions and measurement
CHAPTER FOUR
PRESENTATION ANALYSIS AND INTERPRETATION OF DATA
4.0 Introduction
4.1.1 Foreign Direct Investment (FDI) Inflow as Dependent Variable
4.1.2 Tax Incentives
4.1.3 Tax Rate
:-:1
18
18
18
18
18
19
19
20
20
22
23
24
29
36
38
40
41
45
47
47
47
47
47
49
49
51
52
52
52
53
53
53
le!
' !
lal
Ii I I, I'! II i
' Ii ·i
1

4.1.4 Gross Domestic Product (GDP) Growth
4.2 Descriptive Analysis
Source: World Bank (2015); Central Bank ofNigeria (2014)
Source: World Bank (2015); Central Bank ofNigeria (2014)
4.6 Basic Assumption Test
4.6.1 Multicollinearity
4,6.2 Omitted Variable Test
4.6.3 Normality Test
4.6.4 Autocorrelation Test
4.6.5 Heteroscedasticity Test
4. 7 Relationship between Tax Policy and FDI Inflow
4.8 Statistical Test for OLS Model
4.8.1 GDP Growth
4.8.2 Tax Rate
4.8.3 Tax Incentives
CHAPTER FIVE
SUMMARY, OF FINDINGS, CONCLUSIONS AND RECOMMENDATIONS
5.0 Introductions
5.1 Summary of Findings
5.2 Conclusions
5.3 Recommendations
REFERENCES
APPENDICES
APPENDIX 1 A: TRANSMITTAL LETTER
APPENDIX 18: TRANSMITTAL LETTER FOR THE ORGANIZATIONS
APPENDIX II: CLEARANCE FROM ETHICS COMMITTEE
APPENDIX III: INFORMED CONSENT
APPENDIX VI: TIME FRAME FOR RESEARCH PROJECT
APPENDIX VII: RESEARCH BUDGET
APPENDIX VIII: RESEARCHER'S CURRICULUM VITAE
APPENDIX IX: TREND OF FDI NET INFLOWS TO NIGERIA 1984 - 2014 (US$)
APPENDIX X: NIGERIA'S GDP GROWTH (1984-2014)
Xll
54
55
56
57
69
69
71
72
73
74
74
77
77
77
77
79
79
79
79
80
82
84
89
89
90
91
92
93
94
95
97
99

APPENDIX XI: TAX RATE IN NIGERIA 1984 - 2014 101
APPENDIX XIII: SUMMARY OF ALL VARIABLES EXERCISED IN THIS STUDY 105
XIII

1.0 Introduction
CHAPTER ONE
INTRODUCTION
Considerable effort and attention in most developing and mid-developed countries is devoted to
tax policies best suited to influencing foreign direct investment (FDI), \Nhich is believed to be
pivotal in the promotion of economic development. The major focus of these efforts is the
formulation and implementation of desirable fiscal policies ,vith considerable stress being placed
on the role of tax policies as an instrument of promoting FDI. Tax policy has always been an
important instrument for augmenting revenue. This is as true in developing countries as in
developed countries. where tax revenue is the major source of domestic revenue. This paper
empirically analyzed the relationship between Nigeria's tax policies and foreign direct
investment (FDI) in the country. Tax policy was the independent variable w"hilst FDI was
dependent variable. This chapter covers background to the study. statement of the problem,
objectives of the study. research questions Ztnd hypotheses. justification. significance and scope
of the study and limitations.
1.1 Background of the Study
I.LI Historical and Global PcrspcctiYCs
Tnxation ts an important issue today as tt was in the past and it \viii be in the future. The lirst
detailed information about taxation can be found in Ancient Egypt. This means. the origin of
taxation policies can be traced in the Ancient Egypt around 3000-2800 BC in the first dynasty of
the Old kingdom (Keen & Mansour. 20 I 0). The earliest and most widespread form of taxation

was the corvee and tithe . This was a form of forced labor provided to the state by peasants too
poor to pay other forms of taxation. Therefore, labour in ancient Egypt is a synonym for taxes).In
the earliest times, countries were confronted with similar problems as we are today. For example,
the pharaohs searched for ways to reduce corruption of their tax collectors called scribes (Adam
1993). This was inscribed the famous Rosetta Stone at around 200 B.C during the reign of
Ptolemy, which did not only help to maintain the hieroglyphic knowledge but is also the first
"tax-oriented" documentation, which reports a tax amnesty, where tax rebels were released from
prison, remitting them also the tax debts. The success of the tax amnesty increased the incentive
to use this instrument as a regular medicine to check civil disorder (Adams 1993).
Since 1980, FDI inflow in the world has rapidly increased, especially to developing counh·ies. It
reached culmination point around the year 2007 where global FDI inflows attained USD 2.3
billion. After experiencing a declining during the period of 2001 -2003 , FDI inflows began to
show an upward trend in 2005 -2007. Unfortunately, after then it showed a declining trend until
2009 . In 2010, global FDI inflow reached an estimated $1,244 billion with a little increase from
level of $1,185 billion (Sources: www.unctad.org/fdistatistics). However, there was an uneven
pattern between regions and also between sub-regions. FDl inflows to developed countries and
transitional economies contracted further in 20 I 0. In contrast. those to developing economies
recovered strongly, and together with transitional economies for the first time surpassed the 50
per cent mark of global FDI flows (UNCTAD. 2012).
In this age of globalization. most African countries seek to become integrated with the
international economy. However, they face significant challenges in this pursuit, including the
need to increase tax revenues. Hence tax policy makers have to analyze the prevailing conditions
2

in the country and determine the relevant mix of taxes that can influence FDI and thus, raise
sufficient revenue for national development. Many Sub-Saharan African (SSA) countries,
Nigeria included, have increasingly restructured their tax systems for this specific purpose.
Despite numerous tax reforms that were intended to improve the economic and social situation,
the rate of growth FDI has remained low, fragile, and the country remains on the list of the mid
developed countries in the world.
Africa's natural resources account for the uneven spread of FDI inflows across the continent and
the 24 countries in Africa classified by the World Bank as oil and mineral-dependent have on
average accounted for close to three-quarters of annual FDI flows over the past two decades
(UNCTAD, 2005). Nigeria share of net FDI in 1990 was 588 million Dollars accounting 24.19%
of African countries but this however declined in 21.07% in 1995, 14.43% in 1997, 8.22% in
1999, 5.88% in 2001 and 7.98% in 2006. In spite of the abundance of natural resources in the
country, the investment response has been poor even with the economic reforms aimed at
creating an investor-friendly environment. Col.lier and Patillo (1999) argued that FDl is lmv in
Africa because of the closed trade and unfriendly tax policies and corruption. Other scholars
have however. contended that most African countries' tax policies lack do not offer tax
incentives to effectively attract larger inflows of FDI even in the primary sector (Lall, 2004 ). Lall
sees the lack of "attractive tax incentives·• in Africa as cutting it off from the most dynamic
components of global FDl inflows in all sectors.
In order to achieve uniformity in the system of taxation throughout Nigeria. the colonial
Government set tip the Raisman Commission in 1958. This Commission recommended the
introduction of uniform basic income tax principles. for application in all the regions of Nigeria .
.,
.)

The recommendation was accepted by GovernmenL which incorporated same, into the
Constitution of the Federal Republic of Nigeria. This led to the promnlgation of the Income Tax
Management Act, 1961 and The Companies income Tax Act, 1961. These legislations were later
repealed arid re-enacted as The Personal Income Tax Act CAP P8 FN 2004 and The Companies
Income Tax Act CAP C21 FN 2004, respectively. As a result of the reassessment carried out by
the law Review Commission, these laws have been reviewed and codified, and are included in
the laws of the Federal Republic of Nigeria 2004.
The adoption of the macroeconomic programme embedded in the SAP started the process of
gradual increase in the FDI inflow in Nigeria. The period 1990 and 1993 witnessed a drop in
the rate of inflow largely due to a protracted political impasse that disrupted productive
activities and created a regime of uncertainty, which subsequently encouraged capital flight.
In 1995, in order to improve on the level of uncertainty and liberalise the investment climate
in the country, the government promulgated the Nigerian Investments Promotion Commission
Act cap n.117 ( 1995 ), LFN .(NIPC). The aftermath of the promulgation of the commission
was a momentous increase in the FDI inflow into the country especially into the non-oil
sectors.
In the recent years, government of this oil-rich Nigeria. which has for a couple of years been
hobbled by political instability. corruption, inadequate infrastructure. and poor macroeconomic
management hindering economic development and grO\vth began pursuing economic reforms.
Major interests were FDI as a means of achie,,ing economic growth. In this effort. a National
Council on Privatisation was established. in addition the Nigerian Investment Promotion Council
(NIPC) and. has been strengthened to serve as a one- stop office for clearing all the requirements
4
11
11.1.· ' i .,
! lj
fl l:I il Ei
11

for investment in Nigeria. This has been through attracting FDI through taxation policy in form
of tax incentives is an avenue bei11-g adopted.
Taxes in Nigeria can broadly be divided into two categories: direct and indirect taxes. The major
direct taxes for 2011/2012 in Nigeria were: Pay As You Earn (PA YE), corporate taxes, and
withholding taxes (Murgatroy et al., (2013). Indirect taxes include the Value Added Tax (VAT),
which is a consumption tax, as well as import duties and excise taxes imposed on international
trade and locally manufactured goods. The authors state that these taxes were introduced to meet
Nigeria's broad tax policy objectives that include: establishment of a semi-autonomous revenue
authority, enacting new laws, and rationalizing the overall tax structure.
Lyakurwa (2003) has stressed macroeconomic policy failures as deflecting FDI inflows in Africa.
According to Lyakurwa, irresponsible fiscal policies have generated unsustainable budget
deficits and inflationary pressures, raising local production costs, generating exchange rate
instability and making the region too risky a location for FDI. In addition, excessive levels of
corruption, regulation and political risk all associated with tax policies are also believed to have
further derail FDI, adding to an unattractive business climate for FDI.
Ngowi (2001) points out that the main factors preventing an increased inflow of FDI in Africa is
that most countries are regarded as high risk because they are characterized by a lack of political
and institutional stability. Additional factors that are cited as hindrances to prospective FDI
include poor access to world markets. price instability. high levels of corruption, small and
stagnant markets and inadequate infrastructure. Morrisset (2000) suggests that the most
important features of African countries successfully attracting FDI are strong economic growth
and aggressive trade liberalization. Other important factors include privatization programs. the
5

modernization of mining and investment codes, the adoption of international agreements relating
to FDI, a few large priority projects which have significant multiplier effects, and a high-profile
image-building exhibition involving the head of state.
1.1.2 Theoretical Perspective
This study was guided by the Theory of Foreign Direct Investment (FDI), Dunning (1993)
electronic paradigm as sited in Dunning (2011) suggested that the main factors that drive FDI
inflows have been the need to secure market access, the oppmtunities presented by large scale
privatization processes and the degree of political and economic stability; and the Capital Market
Theory by Greta Garbo that was fonnulatecl in 2007, which explains the dynamic
macroeconomic Foreign Direct Investment theory. It emphasizes that the timing of the
investment depends on the changes in the macroeconomic environment.These theoriesaided the
researcher to understand why companies participate in FDI, what FDisconsider when
selectingone destined country over the others, and why they prefer a specific entry mode tohost
countries (Moosa, 2002). This theory fmther enabled the researcher to understand the
relationship between tax policy incentive provisions and FDI from a host country point of view
and why one country succeed in attracting FDI while others remain stagnant in FDigrowth, what
incentives are more preferable to investors in establishing attractiveinvesting environment.
1.1.3 Conceptual Perspective
Tax policy is an administrative apparatus that is built to levy and collect tax. through applying
different tariff and basis taxation, in order lo apply policy that has built (Slemrocl, 2000). Tax
policy is concerned with the reasoning behind how much revenue the government is collecting,
6

what the revenue is being used for, and whether the government is collecting revenue in the most
appropriate way.
On the other hand, Foreign direct investment (FDI) is a direct investment into production or
business in a country by an individual or company in another country, either by buying a
company in the target country or by expanding operations of an existing business in that country
(Agosin, 2009a). Broadly, foreign direct investment includes "mergers and acquisitions, building
new facilities, reinvesting profits earned from overseas operations and intra company loans". In a
narrow sense, foreign direct investment refers just to building new facilities. It is often argued
that countries are less vulnerable to external financing difficulties when ctment account deficits
are financed largely by FDI inflows. rather than debt-creating capital flows (Dean et al.. (2011 ).
According to Nwankwo (2006), FDI creates employment and acts as a vehicle of technology
transfer, provides superior skills and management techniques, facilitates increases product
diversity. Ayanwale (2007) stated that most countries strive to attract FDI because of its
acknowledged advantages as a tool of economic development. This view is supported
by Nwankwo (2006) study on Nigeria which stated that FD I is an engine of economic grovvth and
development in Africa where its need cannot be over emphasized. Nigeria joined the rest of the
World in seeking FOi as evidenced by the [n view of the NEPAD initiative. the government is
working toward developing stronger public-private partnerships for roads, agriculture. and power
through the attraction of FOi among other measures.
Taxation is the bedrock of a Country to fulfil its responsibility and ensure its continuity.
According to Modugu, Eragbe and lzedonmi (2012), taxation goes hand in hand with economic
grow1h and lifeblood for governments to deliver essential services and to make long-term
7

investments m public goods. However, sometime, government waives taxes 111 exchange for
certain gains. This is done in form of tax incentives as a provision of the prevailing tax policy.
Therefore, as pait of the efforts to provide an enabling environment that is conducive to the
growth and incentives for various sectors of the economy. However, the tax sensitivity of FDI
has important policy implications.
Although the potential importance of the need to attract FDI in the development process cannot
be over-emphasised, two fundamental issues concerning FDI are critical. These include the
determinant factors of FDI in a typical host country, whether these factors are under the control
of the host country and not subjected to the manipulations of FDI countries.
Scholars assert that FDI inflows generally provide a more stable source of external financing
than private debt and portfolio equity flows. And there is no gainsaying the importance of FDI
inflows for its contribution to sustaining current account imbalances in countries such as
Pakistan, South Africa and Turkey, where the value of FDI inflows is estimated to have covered
their entire current account deficit in 2007. But this is only part of the story. As governments
employ some incentives in form of taxation so as to attract foreign investors, there is need to
finds out the extent to which these two variables are related especially in case of Nigeria.
FDI has played a crucial role in business internationalization. Massive changes have taken place
both in terms of size, scope. and methods of FDI in the last decade. These changes occur
because of developments in technology. relaxing restrictions on foreign investment barriers in
many countries, as well as deregulation and privatization of many industries. Development of
information technology systems, as well as. more affordable cost in global communication
allows foreign investment to be managed easier.
8

Based on the data provided by the Word Development Indicators (WDI), it is known that the FDI
inflow into Nigeria was still low tn 2005 standing at 1,-005 million Dollars. Although it happened
to increase in the subsequent years 2006, 2009 and 2012, it was still lower compared to other
countries in the same development bracket, which means that there was a capital flight.
Exercising a tax policy for instance tax incentives in enticing foreign direct investment is not a
new method. According to M01isset and Pimia (1999), when other factors such as infrastructure,
cost of production, economic and political stability are more or less equal, tax regulation may
have a significant effect on choices. This effect varies, however, depending on the tax
instrument used, the characteristics of the multinational company, and the relationship between
the tax systems of the home and recipient countries.
In a more competitive world, exercising a tax policy, tool or incentives to attract FDI has become
a global phenomenon. Some countries in Asia and Afiica rely on tax holidays and import duty
exemptions to entice FDI while those in Western Europe prefer to apply accelerated depreciation
(UNCT AD, 1995). This competition will encourage Nigeria to enact tax policy regulations that
tend to be more beneficial for FDI companies than achieving its tax revenue target. However,
there should be a balance that might lead the country to win both tax revenue target and FOi
inflow. This research sees to analyze the relationship between tax policy and FDI in Nigeria
using a quantitative method. It focused on tax policy provision as tax incentive determinant
factors in attracting FDI inflows in Nigeria. The researcher also included some other
determinant factors as control variable such as GDP growth as a proxy for market size. Gross
Fixed Capital Formation (GFCF) as a proxy for infrastructure. trade openness as a proxy for
government policy inflation as a proxy for economy stability and tax rate.
9
I
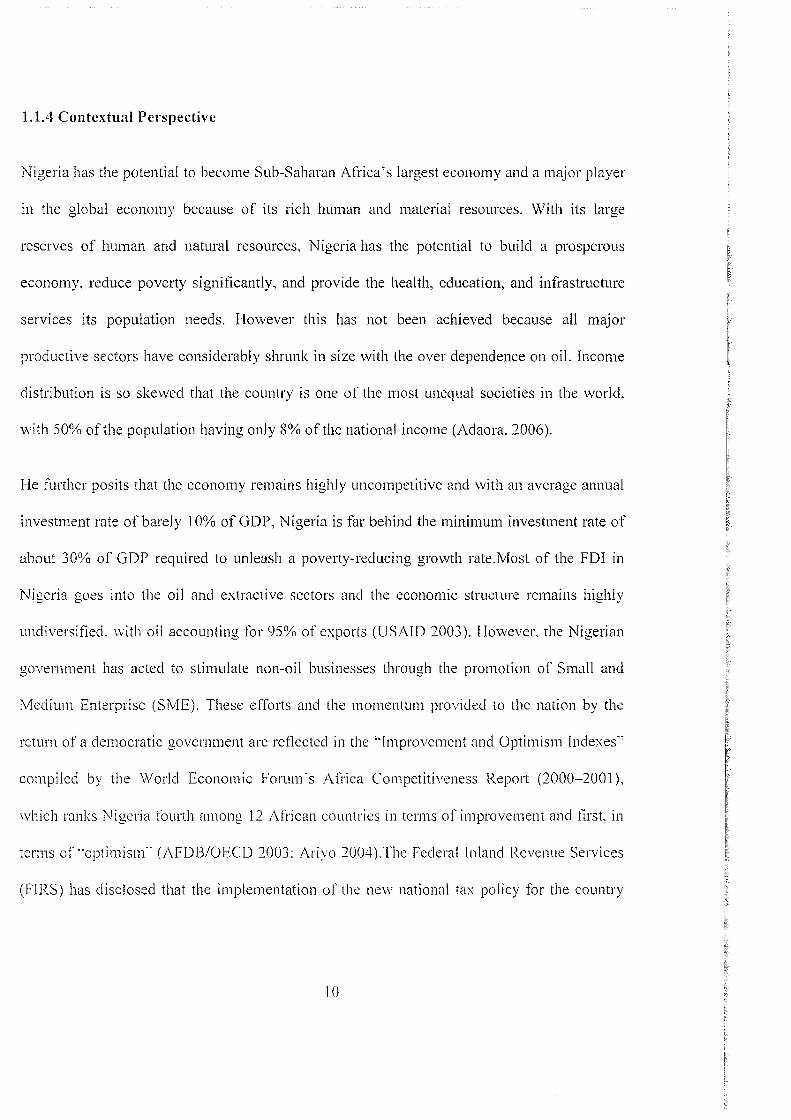
1.1.4 Contextual Perspective
Nigeria has the potential to become Sub-Saharan Africa's largest economy and a major player
in the global economy because of its rich human and material resources. With its large
reserves of human and natural resources, Nigeria has the potential to build a prosperous
economy, reduce poverty significantly, and provide the health, education, and infrastructure
services its population needs. However this has not been achieved because all major
productive sectors have considerably shrunk in size with the over dependence on oil. Income
distribution is so skewed that the country is one of the most unequal societies in the world,
with 50% of the population having only 8% of the national income (Adaora, 2006).
He futther posits that the economy remains highly uncompetitive and with an average annual
investment rate of barely I 0% of GDP, Nigeria is far behind the minimum investment rate of
about 30% of GDP required to unleash a pove1ty-reducing growth rate.Most of the FDI in
Nigeda goes into the oil and extractive sectors and the economic structure remains highly
undiversified, with oil accounting for 95% of exports (USAID 2003). However, the Nigerian
government has acted to stimulate non-oil businesses through the promotion of Small and
Medium Enterprise (SME). These effmts and the momentum provided to the nation by the
return of a democratic government are reflected in the '"Improvement and Optimism Indexes"
compiled by the World Economic Forum "s Africa Competitiveness Rep01t (2000-2001 ),
which ranks Nigeria fomth among 12 African countries in terms of improvement and first, in
terms of "'optimism'' (AFDB/OECD 2003: Ari yo 2004 ).The Federal Inland Revenue Services
(FIRS) has disclosed that the implementation of the new national tax policy for the country
10
I t
I

has commenced following the approval of the final draft of the regulation by the Federal
Government which was gazette on September 21, 2012.
Commenting on Transfer Pricing regulation in Nigeria, Bamidele noted that the regulations
gave effect to the provisions of-(a)section 17 of the Personal Income Tax Act, CAP P8, Laws of
the Federation of Nigeria, 2004 (as amended by the Personal Income Tax (Amendment) Act,
2011 );(b) section 22 of the Companies Income Tax Act, CAP C2 l, Laws of the Federation of
Nigeria, 2004 (as amended by the Companies Income Tax (Amendment} Act 2007; and (c)
section 15 of the Petroleum Profit Tax Act, CAP 13, Laws of the Federation of Nigeria. 2004.
The objectives, according to him, include: to ensure that Nigeria is able to tax on an appropriate
taxable basis corresponding to the economic activity deployed by multinational enterprises in
Nigeria, including in their transactions and dealings with associated enterprises; to provide the
Nigerian authorities the tools to fight tax evasion through over or under-pricing of controlled
transactions between associated enterprises etc.
The country has remained ahead of several other African economies in offering incentives and
creating a favorable environment for foreign investors. In spite of the discouragement caused by
the political instabilities in the n01thern part of the country. foreign investors still find Nigeria a
favorable place for investment (Fjeldstad and Moore. 2009). This has been enhanced by the
government's effo1ts to attract investors through many favorable investment policies. However,
there is a lot of concern on in the recent years that a range of factors need to be taken into
consideration to attract and sustain FOi on the Nigerian economy (Wade. 2010). Besides the
quality of labor, standard of living, skills, human resource retaining capacity of the local market,
one of the biggest issues has been that of tax policy since many of the donors have ,vithclrawn
11

- ........ - .................................................................................................... --- -------········· .. ··-·---····~·······---
their support to the country and the country has to tussle is budget through revenue generated
from local tax (Wade, 2010). It is therefore through this fact that tlris study is attempting to
investigate the relationship between tax policy and FDI in Nigeria.
1.2 ProblemStatement
A good tax policy can significantly attract FDI in any country. This can be achieved through tax
revenue reduction inform of tax incentive. This however, can be counterproductive if care is not
taken for many reasons. Adeola (2011) opined that it is note-worthy to emphasize that there is
enormous untapped investment opportunities that exist in the Nigerian economy for the
investment appetite of both local and foreign investors.
Despite Adoela's (201 I) argument, investments particularly FDI is perceived to be potentially
significant to promote economic growth. In addition, the presence of foreign capital can be a
source of technological development, expmt growth and employment. Therefore, countries like
Nigeria are very enthusiastic and eager to attract FOL One of the factors influencing FOi that is
still controversial in the country is tax policy, a policy that provides for a form of tax incentive
facilities. Accordingly, there is a need to have more empirical evidences about the relationship
between tax incentive policy and FDI. Better understanding on the issue will allow government
and policy maker to design better policies in attracting FDI. This study therefore seeks to
empirically examine the relationship between the tax policy incentive provisions and FOI inflow
in Nigeria.
12
I I

1.3 General Objective
The broad objective of this study is to analyze the relationships between tax rate, tax incentives,
GDP growth and foreign direct investment in Nigeria.
1.4 Objectives of the study
1.4.1 Specific objectives
The specific objectives are to:
1. Examine the relationship between tax incentive and foreign direct investment in Nigeria.
11. Examine the relationship between tax rates and foreign direct investment in Nigeria.
111. Examine the relationship between GDP growth and foreign direct investment in Nigeria.
1.5 Research Questions
Based on the above problem statement this study seeks to answer the following research
questions;
1. What is the relationship between tax incentive and foreign direct investment in Nigeria?
11. What is the relationship between tax rates and foreign direct investment in Nigeria?
111. What is the relationship between GDP growth and foreign direct investment in Nigeria?
13

1.6 Research hypothesis
The research study employs individual test hypotheses that identifies which of the set of
independent variables are significant predictors of dependent variable. That is it tests the
independent variables individually rather than as a unit.
Tax incentive has no significant relationship on FDI inflow in Nigeria (ie ~1 = 0)
Tax rate has no significant relationship on FOi inflow in Nigeria (ie ~1 = 0)
GDP Growth has no significant relationship on FOi inflow in Nigeria (ie B1 = 0)
1.7 Research Scope
1.7.1 Geographical Scope
This study was carried out in Nigeria, the country has been chosen for this study because it has
many foreign investors carrying out different forms of business. Thus, finding relevant and
appropriate secondary data will be much easier.
1.7.2 Content Scope
While there are many determinant factors of FD!. the present study focused on tax policy as
determinant factor in attracting FOi inflow in Nigeria. To have a robust empirical result in
14
I
I ~)

---···········~--~···········~·········~···········
pe1forming the quantitative method using Pearson's linear correlation coefficient and Ordinary
Least Square, technique the researcher consider GDP growth, Tax rate and tax incentives as the
constructs t independent variables.
1.7.3 Theoretical Scope
This research study is guided by Dunning (1987) proposed a theoretical framework to examine
the relationship between fiscal policies and the flow of investments from a foreign country to a
host country and institute as electronic theory. According to the theory, there are foreign country
to host country. There must be advantage the investor company, the host country must have a
location advantage to be able to attract investors to invest their capital and their must be a
stimulus in internalizing factor that encourages firms or foreign investors to invest directly in the
form of FDI. The study is also guided by several Garbo capital market theory (2007) explains the
dynamic Macro economic foreign direct investment theory which emphasis that the taming of
the investments depends on the charge of microeconomic environment.
1.7.4 Time Scope
Regarding the time frame of this research, in qualitative analysis of tax policy regulations. the
researcher picked out regulation from government gazette enacted in 1961 to the current one in
2004. However. in performing the quantitative estimation the researcher only included data from
period 1984 to 2014 considering the data availability.
15
I I I I
f
I i
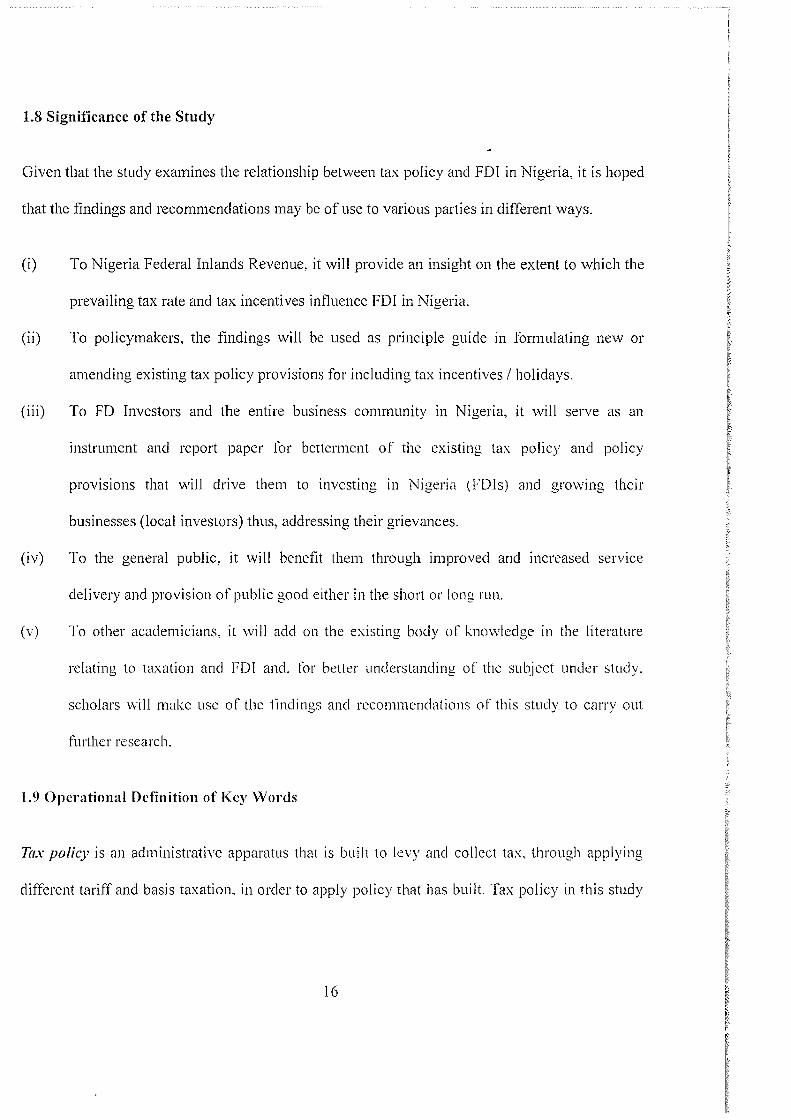
1.8 Significance of the Study
Given that the study examines the relationship between tax policy and FDI in Nigeria, it is hoped
that the findings and recommendations may be of use to various pat1ies in different ways.
(i) To Nigeria Federal Inlands Revenue, it will provide an insight on the extent to which the
prevailing tax rate and tax incentives influence FDI in Nigeria.
(ii) To policymakers, the findings will be used as principle guide in formulating new or
amending existing tax policy provisions for including tax incentives / holidays.
(iii) To FD Investors and the entire business community in Nigeria, it will serve as an
instrument and report paper for betterment of the existing tax policy and policy
provisions that will drive them to investing in Nigeria (FDis) and growing their
businesses (local investors) thus, addressing their grievances.
(iv) To the general public, it will benefit them through improved and increased service
delivery and provision of public good either in the short or long run.
(v) To other academicians, it will add on the existing body of knowledge in the literature
relating to taxation and FDI and, for better understanding of the subject under study,
scholars will make use of the findings and recommendations of this study to carry out
further research.
1.9 Operational Definition of Key Words
Tax policy is an administrative apparatus that is built to levy and collect tax. through applying
different tariff and basis taxation, in order to apply policy that has built. Tax policy in this study
16

was measured in terms of effectiveness of tax incentives; tax administration, and tax policy
convemence.
Foreign direct investment (FD/) is a direct investment into production or business in a country
by an individual or company in another country, either by buying a company in the target country
or by expanding operations of an existing business in that country. FDI was measured through
the scope of FDI; human resource development; technological development and level of
employment opportunities.
1.10 Study Limitations
One of the major limitations of this study is cost analysis of tax policy regulation in attracting
FDI inflow due to the difficulty in both data source and complicated calculation. However, the
idea of cost analysis of tax holiday can be a subject of further research after knowing the
relationship and impact of tax policy incentives on FDI inflow.
Since the researcher did not collect the data he has no control over ·what is contained in the data
as used in the study was secondary data from both national and international organizations.
17
I I I
I I
l t

CHAPTER TWO
REVIEW OF RELATED LITERATURE
2.0 Introduction
The following chapter elaborates the theoretical review; then illustrates the conceptual
framework showing the interaction between the study variables.
2.1 Conceptual Framework
Figure 2.1: Conceptual Framework
Independent Variable
Tax Policy • Tax Incentives • Tax Rates • GDP growth
Intervening Variables • Inflation • Trade Openness • GFCF
Dependent Variable
Foreign Direct Investment
Income distribution
Government
Source: Adopted from Greta Garbo (2007): Modified by the Researcher
18
I f f
t
I !
II• . I
I I'.·,,:. ' . I·.' •
I m;

Figure 2.1 indicates the effectiveness in tax policy in regards to GDP growth tax incentive. tax
rate and other control variables (inflation, trade openness and GFCF) in influencing FDI inflow
in Nigeria. However, this relationship can be affected if cases of corruption, civil wars, and weak
government policies are not well streamlined.
2.2 Theoretical Review
A number of theories have been developed to explain the determinants of FDI. Extensive
reviews of the main FDI theories and determinants of FDI range from the FID theory. economic
theories of Vernon (1966), the internationalization theory of Rugman (1981), Dunning·s (1993)
electronic theory and Greta's capital market theory (2007).
2.2.2.1 Foreign Direct Investment Theory
The fast growing and reliability of FDI compared to other capital instruments has brought
interest to the development theory of FDI. Some FDI theories tried to explain why companies
participate in FDL what are the considerations of selecting one destined country over the others,
and why they prefer a specific entry mode to host countries. From the host country point of
views, other FDr theories explained why one country succeed in attracting FDI while others
remain stagnant in FDI growth. what incentives are more preferable to inveswrs in establishing
attractive investing environment. According to Moosa (2002), theories of FD! can be classified
into four types: (1) Theories assuming perfect market; (2) theories assuming imperfect market:
(3) other theories: ( 4) theories based on other variables. The following section will discuss in
detail each of theory.
19

2.2.2.2 Capital Market Theory
The Capital Market Theory as formulated by Greta Garbo (2007) explains the dynamic
macroeconomic Foreign Direct Investment theory. This theory emphasizes that the timing of the
investment depends on the changes in the macroeconomic environment. As taxation is an issue
connected to macroeconomics, this theory becomes relevant to this study as its variables include
tax policy and foreign direct investment.
In establishing a clear understanding between tax policy and FDI, Logue (2009) presents Capital
market theory in relation to taxation and professional investors' ability to forecast future
earnings. According to him, there is no significant difference between the average investment
performance of the well-informed and the uninformed investors. If there were, the differences in
performance between and within the two groups of investors should be due to chance. There are
tests of security prices and returns predictability based upon several explanatory variables such
as dividend yields, term-structure of interest rate, quarterly earnings reports, calendar effect, day
of-the-week effects, price-earnings ratios effect, price-to-book ratios effect, size effect. and
trading volume effect. Since this theory sets its emphasis on taxation and investors ability to
forecast the future and these are also the variables on which this study is centered on, the theory
becomes relevant principle to guide this study.
2.2.2.3 Theories Assuming Perfect Market
There are three hypotheses under this theory: (]) the differential rate of return~ (2) the
diversification of hypothesis; (3) the output and market size hypothesis.
20

The gist of differential rate of return hypothesis is that capital flows from the country with a
lower rate of return to the country \.\Tith a higher rate of return and eventually leads to equality of
the real rate of return. In this hypothesis, business risk is assumed to be neutral regardless
investing location, making real rate of return as an isolated variable in investment decision.
Business risk neutrality means that an investor considers foreign market as perfect substitution of
the domestic market. As this represents one of the first efforts in elaborating FDI theory, many
researchers have tested this hypothesis by examining the relationship between FDI inflow and
rate of return in several countries. Unfortunately, most of them failed to provide suppo1ting
evidence relevant to this hypothesis (Agarwal, 1980}.
Yang (1999) in his research on FOi in China between rich coastal area and poor inland area
attempted to adjust the role of rate of return by inputting human capital variable. The result
suggested that majority FDI in china flows to rich coastal area even though poor inland area
offers a higher rate of return. Perhaps, human capital adjusted the differential rate of return effect
between rich coastal area and poor inland area.According to Moosa (2002), the failure in
suppo1ting this hypothesis. arose from inconsistency of this hypothesis. This is because in this
hypothesis. capital only flows in one direction, which is from a lower rate of return country to a
higher rate of return country. This hypothesis fundamentally failed in explaining why countries
like Nigeria experiences inflow and outflow of FDI simultaneously even if it has a higher rate of
return than others.
In portfolio hypothesis, investors do not only consider rate of return. but also incorporate risk of
business in investment decision. This hypothesis postulates investment as a positive function on
rate of return and a negative function on risk of business. When risk of business is included. then
21

investment diversification becomes relevant. Rather than selecting countries exclusively on
-higher rate of return, capital mobility now also flows by desire to n111111mze risk by
diversification. While some scholars identified some loopholes in this theoretical hypothesis, the
theory itself is preferable to differential rate of return hypothesis for some reasons. First, it
considers business risks which constitute vital element in business decision. Second, it proposes
logical reason on the existence of cross investment intra countries.
2.2.2.4 Theories Assuming Imperfect Market
Several hypotheses fall under this theory such as the industrial organization hypothesis, the
internalization hypothesis, the location hypothesis. the eclectic theory. the product life cycle
hypothesis and the oligopolistic reaction hypothesis.
According to this theory, when a multinational company establishes a subsidiary outside its
home country, it will encounter many disadvantages when competing with domestic company.
These disadvantages derive from various differences in culture, language, the legal system. and
manyinter-country differences. For example. foreign companies more often have to pay higher
wages for the same quality workers since working with them is associated with high risk and
uncertainty. It happens to language differences as well, as foreign companies should bear extra
cost to overcome the language barrier. Therefore. in order to deal with these disadvantages,
foreign companies must possess some advantages among which are tax incentives provided by
the prevailing tax policy of a receiving country. These comparative advantages should be innate
advantages that can be easily transferred to foreign subsidiaries and large enough to surpass these
disadvantages, (LallandStreeten, I 977)

According to this theory·s internalization hypothesis. FDI emanates to substitute market
transaction with internal transaction. This theory explains why companies prefer FDI than
exporting or importing from abroad or licensing. For example if there is a problem in production
process regarding sh01i supply in raw material, a company may decide to establish a subsidiary
company abroad in producing that raw material to ensure that raw material is available. Similar
problems might arise from imperfection and failure of market for other intermediary goods or
services such as labor, knowledge. marketing, and resource endowment. Moosa (2002)
mentioned several advantages of internalization such as avoiding of time lags, bargaining and
buyer uncertainty. In association to the time lag, bargaining and uncertainty, companies replace
some of market function for intermediary goods or services with internal process such as intra
company transaction. For that reason, researchers claimed that internalization theory represents
the main body of FOi theory, and considered others as a subset of this theory.
2.2.2.5 The Eclectic Theory
Dunning (1987) proposed a theoretical framework to examine the relationship between fiscal
policies and the flovv of investments from a foreign country to a host country and institute it as
eclectic theory. Till today, this theory is still relevant. According to Dunning ( 1987), there are
three main aspects causing the flow of capital from a foreign country to host country. First there
must be ownership advantage of the investor company. This advantage is very specific in each
company and required as compensation to offset disadvantage a company might encounter
during investment in the host country. Ownership advantage can take the form of a monopoly on
a particular product or brand, a more efficient production processes, management skills and
greater knowledge about the market or marketing techniques. Out of those advantages. there are

also internal factors in the home country which stimulate companies to expand their operation
abroad such as unfavorable tax policies, high wage tates, increasingly expensive energy, limited
resources, and tight regulation on environment.
Second, the host country must have a location advantage to be able to attract foreign investors to
invest their capital. This advantage will be an enticement for potential investors to exploit the
existing potential advantages for the sake of business. Location advantage can be enormous
attractive tax incentives and lax policy regulation. Others include domestic potentials, high
growth, low inflation, cheap labor, abundant natural resources, and availability of infrastructure,
and lax regulation on environmental control. If the first condition is fulfilled, but the second
condition is not satisfied, investors, (in this term a multinational company), will choose to export
to host country as a way to exploit ownership advantage.
Third, although the first and second conditions are met, there must be a stimulus in internalizing
factor that encourages firms or foreign investors to invest directly in the form of FDI and not the
other way such as licensing, franchising or investment portfolio. Those three factors are a
representation of the previous three hypotheses consists of the industrial organization
hypotheses, the internalization hypothesis and the location hypotheses.
2.3Foreign Direct Investment
Feenstra and Hanson (2005) showed that foreign direct investment (FDI) has been one of the
principal beneficiaries of the liberalization of capital flows over recent decades, and now
constitutes the m~jor fonn of capital inflow for many developing countries, including low
income ones like Chad, Mauritania, Sudan and Zambia. But while there are reasons to celebrate
24
I
this success, the current financial turmoil does not bode well for the sustainability these flows in
2009.lt is often argued that countrie~are less vulnerable to extemal financing difficulties when
current account deficits are financed largely by FDI inflows, rather than debt-creating capital
flows (Dean et al., (201 I). The scholars assert that FDI inflows generally provide a more stable
source of external financing than private debt and portfolio equity flows. And there is no
gainsaying the impotiance of FDI inflows for its contribution to sustaining current account
imbalances in countries such as Pakistan, South Africa and Turkey, where the value of FDI
inflows is estimated to have covered their entire current account deficit in 2007. But this is only
pait of the story.
Wade (20 IO)noted that FD I might actually be one of the forms of cross-border flows that will be
privileged (as it has been in the aftermath to previous crises). Indeed, in a deleveraged world,
FDI may become one of the few ways in which low and middle-income countries can access
capital for development. But in the meanwhile policy makers in developing countries need to
monitor trends carefully and adapt policy accordingly. FDI is in itself no panacea. and can
sometimes compound problems during times of financial crisis. It is certainly no substitute for
enlarging tax bases and promoting better mobilization of domestic resources.
Nigeria has joined the rest of the world in seeking FDI and the country is deeply involved in the
attracting FDI in the country as a mqjor component (Fjelclstacl and Moore. 2009). The empirical
results like other previous studies confirmed that FDI impacts positively on Nigeria's economic
growth. Therefore. taking a peek at Kano State through the lens of FOL we can see that this
country is making bigger economic strides step by step and year by year. From the results. it was
recommended that in order to encourage and finance economic growth. the government should
25

continue striving to achieve a sound degree of infrastructural development, together with a good
cromestic labor force (Nigeria Federal Office of Statistics, 2012).
There are several problems facing all businesses; both domestic and foreign. These are
weaknesses in infrastructure provision, a lack of personal and property security, poor governance
and corruption. Without continued efforts in these areas, efforts on other fronts, however sound,
might have a limited impact. Reflecting such major constraints, Nigeria ranked below average in
the 2005 Transparency International Business Cm?fidence Survey among African countries
surveyed. Such a poor environment for business makes it difficult for Nigeria to increase the rate
of FDI inflows. While these factors are in a sense intangible in the business climate, their impact
is real in terms of its effect on foreign investment and consequently on the growth of the
economy.
Other elements like the complex regulatory environment, policy instability, the predominance of
state owned enterprises, and layers of business regulation at the state and local level, all
contribute to corruption by providing opportunities for patronage and intervention in private
business affairs (AFDB/OECD 2003; World Bank. 2002). [n spite of this, the table below
indicates that Nigeria still ranks amongst the top FOi receiving countries in Africa.
However with the transition to democracy and intense competition for FDl by other developing
countries, the Nigerian administration now shows a welcoming attitude to investors. The
government has aimed its most generous incentives at the sectors that present the greatest
obstacles to economic development particularly infrastructure. Nigeria is becoming investor
friendly, with some laws allowing for 100% foreign ownership of businesses and unhindered
repatriation of capital. In addition, the gO\·ernrnent has put in place a range of incentives
16

designed to lower the cost of doing business to offset the higher-cost operating environment
arising from factors such as deficient infrastructure (Adaora, 2006).
He fm1her states that various industries have been afforded 'pioneer status', giving start-ups a
five-year tax holiday. There are 69 industries benefiting from this incentive, including mining,
large-scale commercialised agriculture, food processing, manufacturing and tomism.
Manufacturers that add value to imp011ed inputs are eligible for a five-year 10% local VAT
concession. Manufacturers using a prescribed minimum level of local raw materials, for instance,
70% for agro-allied industries and 60% for engineering industries, are entitled to a five-year 20%
tax concession.
Investors can take advantage of an infrastructure incentive that permits a 20% tax deduction of
the cost of providing infrastructure facilities that should have been provided by the government.
Such facilities include access roads, pipe-borne water and electricity supply. There is a generous
tax allowance on research and development (R&D), with up to 120% of expenditure being tax
deductible, provided that such R&D activities are carried out in Nigeria and are related to the
business from which profits are derived. In the case of research into the use of local raw
materials, the tax-deductible allowance rises to 140%. The government is also targeting
investment into some economically disadvantaged areas, extending the tax holiday available to
'pioneer status' industries to seven years and adding a 5% capital depreciation allowance.
Additional tax breaks are available for labour-intensive modes of production (Financial Times.
2005).
According to the World Bank, Nigeria's macroeconomic performance over the last two years
has been commendable. The economic reform eff011s are showing positive results including:
27
I

• In 2005, growth continued to be strong at 7% for the economy as a whole and 8% for the
non-oil sector. In the first quaiter of 2006, the Nigerian economy grew by 8.3%.
• In January 2006, the country received its first credit rating (BB-) from Fitch and Standard
and Poor's.
• Year-on-year inflation fell from 28% in August to 12% by December 2005.
• A Fiscal Responsibility Bill has passed critical second readings in both the Senate and
House.
• The National Assembly is discussing a Public Procurement Refonn Bill.
• A bank consolidation prograin was implemented strengthening the financial sector and
enhancing its ability to provide credit to the private sector.
• The import tariff regime has been liberalized reducing the number of tariff bands from 19
to 5 and lowering the average tariff from about 29% to 12%.
With the deregulation of the telecommunication sector, Nigeria's telecommunications
sector is now in a rapid growth mode. According to the Nigerian Communications
Commission (NCC), there's enormous growth potential in the market, as demand for telecom
service has been high because of market liberalization and massive telecom investments. Over
recent years, all branches of the telecom industry have generated considerable growth and the
telecom industry has emerged as a main motor of the country's economy. rt is only the oil
sector that has seen more investment and telecom is novv seen as the most lucrative branch for
investment in Nigeria's economy.
As a result, Nigeria presently boasts Africa·s largest and most promising telecom market.
Even though Nigeria is trailing other countries in terms of providing phone technology at an
28

affordable pnce and doing so reliably, the market has taken significant strides m its
development (Ariyo 2005).
According to the studies caffied out by Chen (2011 )in Nigeria, it was noted that after the
1980s economic crisis, Nigeria, like other Sub-Saharan countries, recognized the need to
rationalize and harmonize the tax rates. The objectives were to attract and promote investment
in Nigeria, increase revenue yields, and simplify tax administration. This study shows that the
corporate income tax was lowered from 60% to 30% in 1997, and the maximum individual
tax rate was reduced from 60% in 1987/88 to 30% in 1993/94. The many wide-ranging
exemptions that have been granted to special sectors over the years -- including a number of
Minister's powers to exempt -- have been abolished. They include provisions granting tax
holidays under the Investment Code of 1991, which were repealed in 1997, and a provision in
the Customs Management Act empowering the Minister to grant specific waiver of taxes and
duties on imports, which was repealed in 2001.
2.4 Tax Incentives and Foreign Direct Investment (FOi)
According to (Easson. 2004), tax incentives can be defined as a special tax provision granted to
qualified investment projects (however determined) that represents a statutory favorable
deviation from a corresponding provision applicable to investment projects in general (projects
that receive no special tax provision). An implication of this definition it is any tax provision that
is applicable to all investment projects. As it has been defined above, according to statutory
regulation, tax incentive is a tax facility granted to specific investors that meet certain criteria as
stipulated in tax law. Those who are eligible benefit more than those who do not receive tax
incentives. According to UNCTAD (2000) there are different categories of tax incentives
29

commonly used by both developed countries and developing countries and these include reduced
corporate income tax rate, which can be set lowered by governments as an exception on common
statutory income tax rate to induce FDI into some regions or specific sectors; loss carry forward,
tax holidays, investment allowances, investment tax credits. reduced taxes on dividends and
interest paid abroad, preferential treatment of long-term capital gains, deductions for qualifying
expenses, zero or reduced tariffs and employment-based deductions.
These incentives are commonly targeted toward foreign investors. The rationale for increased
efforts to attract FDI stems from the belief that FDI have several positive effects on national
development indicators. Among these are productivity gains, technology transfers. introduction
of new processes, managerial skills and technical know-how in the domestic market, employee
training, international production networks, and access to markets. Empirical studies have
showed that a tax policy that puts incentives at forefront of attracting FDI is an important vehicle
for the transfer of technology, contributing to growth in larger measure than domestic
investment.
Therefore, in the face of inadequate resources to finance long-term development in Africa and
with pove1ty reduction looking increasingly bleak, attracting FOi has assumed a prominent place
in the strategies of African countries (Nwankwo. 2006). While contributing to the debate on FOi
and tax incentives, Fakile and Adegbile (201 I ) stated that it is on the basis of these asse1tions
about the advantages of FDI that governments have often provided special incentives to foreign
firms to set up companies in their countries.
Levying taxes on the transaction or business activity is one of the considerations to promote
economic efficiency. Tax neutrality requires that the tax provisions do not discriminate treatment
30
t
I i
I
for any activity or other economic decisions. Tax is one crucial factor for investors in
determining the decision to invest in a country. Theoretically, taxes affect investment decisions
because tax assessment influences the amount of benefits and costs. Hovvever, econometric
studies, which try to find the relationship betv,reen tax poly and FDI, ended up with inconclusive
decision smce there are many variables g1vmg influence on FDI inflow. Easson (2004)
explained the importance of tax policies in investment decision.
In the first instance. countries with high income tax rate would induce compames to invest
abroad more than countries with lower income tax rate. The logical explanation for this in te1ms
of cost of production is that high level of taxes contributes in raising labor cost and might be a
stimulus for company to dislocate its production to countries with lower cost (Easson. 2004 ).
HO\:vever, many economists refuted this explanation by claiming that taxation plays a little in
constructing the production cost. Therefore, they understate its role as the last thing to be
considered
Easson (2004) further asserts that tax provisions and tax rates factor in selecting host countries
\viii only become consiclen1tion after the decision to invest abroad has been made. However. the
main considerations for in\'estor in selecting the location are market size and political stability.
When all main considerations are relatively equal. then taxes may play important role in
investing decision.
According to Easson (2004 ), export oriented FDI is relatively more sensitive to cost factor since
international market is inherent with its high level of competitiveness. Therefore. difference in
tax rate \\1ill significantly influence investment decision. On the other hand, domestic market
31
I ,, I I
I

oriented FOi is less sensitive to tax rate difference as long as other domestic competitors bear the
same tax provision.
Majority of the studies conducted before 1990s revealed that taxation played a minor role in any
FDI decision. However, most recent studies suggested the increasingly importance of taxation in
investment decision. It seemed that the location of destination countries selected by companies
is sensitive to taxation and becoming more so over time for several explanation. According to
Easson (2004 ), there are other FDI barriers, which have been eliminated, taxation as the
remaining obstacle deserves for more consideration. Secondly, as a process of production in
multinational companies is getting globalized, it will become an international production which
involves other worldwide companies. This will increase export and import as channeling means
in the process of production. In this case, import and exp011 correspond sensitively toward tax
difference.
In support of Fakile and Adegbile (2011) and Morisset (2003) view that tax incentive is a tool to
attract FDI, Edmiston et al., (2003), opined that governments often seek to attract FDI by
offering tax incentives to firms in exchange for ce1tain benefits.
Curiously, the empirical evidence of the benefits of offering tax incentives both at the firm level
and at the national level remains ambiguous. Although trade theory expects FDI inflows to
result in improved competitiveness of host countries' exports, the pace of technological change in
the economy as a whole will depend on the innovative and social capabilities of the host country,
together with the absorptive capacity of other enterprises in the country (Carkovic and Levine,
2002).
32
Morisset (2003) asse1ts that tax incentive is a reduction in the corporate income tax rate, through
tax holidays or temporary rebates for ce1tain types of investment or companies. This is supp01ted
by Fakile and Adegbile (2011) who stated that tax incentives are pa1t of the tax policies of
developing countries and usually established and enacted by governments in order to grant
foreign investors more attractive conditions to invest in their country. Other evidence emerging
around the world suggests that tax incentives have a more apparent effect on the composition of
FDI than on its level (Morisset, 2003). Indeed, most governments use tax policies to attract
particular types of investment or to change conduct rather than to increase the overall level of
investment.
According to Morisset, the tax sensitivity of FDI has important policy implications. However, in
attracting FDI there is no doubt that more important are such factors as basic infrastructure,
political stability and the cost and availability of labour. Some empirical analysis and surveys
have confirmed that tax incentives are a poor instrument for compensating for negative factors in
but that does not mean that tax incentives have no effect on FOL
Research has shown that in recent years, there has been growing evidence that tax incentives
influence the location decisions of companies with regional economic groupings such as
European Union, North American Free Trade Area and Association of Southeast Asian Nations.
Also in the United States of America incentives can play a decisive role in the final location
decisions of foreign companies once the choices are nan-owed down to a handful of sites with
similar characteristics (Morisset. 2003 ).
In Nigeria, growing evidence shows, that tax incentives are a crucial factor for mobile firms and
firms operating in multiple markets. such as banks. insurance companies. and Internet-related
...,..., ..)..)

businesses. This is because these firms can better exploit different tax regimes across countries
FaRile and Adegbile, 2011 ). Such strategies may explain the success of tax havens in attracting
subsidiaries of global companies and the spending by multinationals on economists and
accountants to justify their transfer prices, designed to suit their tax needs. Similarly, tax rates
generally have a greater effect on the investment decisions of export-oriented companies than on
those seeking the domestic market or location-specific advantages, because such firms not only
are more mobile but also operate in competitive markets with very slim margins.
The Nigerian Government has put in place a number of investment incentives for the stimulation
of private sector investment from within and outside the country. While some of these incentives
cover all sectors, others are limited to some specific sectors. The nature and application of these
incentives have been considerably simplified. The incentives include: tax holidays, initial capital
allowance, and free duty on equipment (Fakile and Adegbile 2011 ).
Never the less, tax incentives being used to attract FDI is not the end of the story, there is the
problem of tax compliance on the part of companies. Also tax incentive has its cost. For instance
Modugu et al., (2012), expressed concern over tax compliance in their study on voluntary tax
compliance in Nigeria they opined that the need to improve voluntary tax compliance has
resulted in various tax policy reforms by various successive governments. They stated that these
reforms have not been able to stimulate the expected increase in tax revenue over the years, and
this has snowballed into a tax gap as revealed in the share of income taxes in total revenue
profile of the country.
While competition in the application of tax incentives to attract FDI already started in some
regions, most notably in Asia. the concern remains that countries may end up in a bidding war,
34
I
I I

favouring multinational firms at the expense of the state and the welfare of its citizens. This risk
has pushed governments to try to harmonize their tax policies under regional or international
agreements. Beyond the risk of a bidding war, tax incentives are likely to reduce fiscal revenue
and create frequent opportunities for illicit behaviour by companies and tax administrators.
These issues have become cmcial in developing countries, which face more severe budgetary
constraints and corruption than do industrial countries.
There is no doubt that tax incentives are costly. The first and most direct costs are those
associated with the potential loss of revenue for the host government. The second is whether or
not the new investment would have come to the country if it had offered lower incentives or
none at all. If the answer is yes, free-rider investors benefit while the treasury loses, and the
economy reaps no net gains. These examples illustrate the need to clearly evaluate the welfare
implications of tax incentives, both at the level of the firm and globally.
Tax incentives also have many other, less obvious costs. Because they influence the investment
decisions of private companies. they can distort the allocation of resources. And they can attract
investors looking exclusively for short term profits, especially in countries where the basic
fundamentals (such as political and macroeconomic stability) are not yet in place. Another
problem \Vith incentive measures relates to the cost and difficulty of administering them
effectively.
Literature expressed that incentive regimes generally impose a large administrative burden. so
they must be more than marginally effective to cover the costs of their implementation and
produce a net benefit. Discretionary regimes, which rely on case-by-case evaluations, are
especially difficult to administer. These regimes result in delay and uncertainty for investors,
35

which can increase the cost of investment. They have also led to significant corruption.
effectively screened out desirable investments, and undermined sound policymaking and the
development of competitive markets. Morisset (2003) opined that to achieve the gains of tax
incentives for national development, developing countries must structure tax policies in a way so
as to attract foreign investment, without creating a negative impact in the domestic economy.
This is to ensure that they do not fall into a harmful tax competition against other countries.
2.5 Policy Arguments for Tax Incentives in Attracting FOi
Numerous arguments have been brought fo1ward for using tax policy provisions for incentives
in attracting FDI. OECD Tax Policy Studies (2001) stated several crucial arguments for using
tax incentives which can be classified as: international competitiveness, regional development,
income distribution and, macroeconomic considerations. These tax policy arguments for tax
incentives must consider other fiscal objectives like host country needs and circumstances.
These studies argue that tax incentives designed to encourage FDI, including general host
country tax relief measures, those targeted at investment in R&D. and those tied to exports, are
oftof a country, by improving its ability to attract internationally mobile capital. This view
assumes that multinational companies take tax incentives into account when making location
decisions and that tax incentives operate at the margin to swing investment decisions in favor of
the host country.
The theory of correcting for market failureposits correcting market failure as tax incentives.
This argument arises from the belief of private market failed in generating appropriate level of
investment. Therefore, government should inte1fere by introducing tax incentives. One example
36

of market failures is positive externalities in terms of companyresearch and development.
Companies, which conduct research and development (R&D) experiment, usually ignore its
positive externalities over other companies. Tax policies can play a positive role by encouraging
companies in maintaining their interest on R&D project.This can also arise on account of other
factors as well, including asymmetric information. Potential foreign direct investors may have
incomplete infom1ation on investment opp01tunities in a given host country, for a variety of
reasons. This may result in less investment in the host country than if full information were
available. In such cases, incentives might be called to promote FDI beyond the level that would
otherwise occur.
Fm1her, tax incentives policies may be targeted at investment in regions where unemployment
is a serious problem. For example, on account of remoteness from major urban centers, tending
to drive up factor costs or labor immobility or wage rigidities that prevent the labor market from
clearing. Operating from a remote area means significantly higher transpo11ation costs in
accessing production materials, and in delivering end-products to markets. placing that location
at a competitive disadvantage relative to other possible sites. Certain areas may also suffer from
a lack of natural resources. tending to put them at a further cost disadvantage.Moreover. firms
may find it difficult to encourage skilled labor to relocate and work in remote areas that do not
offer the services and conveniences available in other centers. Workers may demand higher
wages to compensate for this. which again implies higher costs for prospective investors.
In such cases. tax incentives policies may be provided to compensate investors for these
additional business costs. Where the incentives are successful in attracting new investment
and/or in forestalling the out migration of foreign capital. they may contribute to an improved
37
I

income distribution in the country. There may also exist a tax policy desire to address regional
in~ome distribution concerns through subsidizing employment through investment initiatives,
rather than through direct income supplement programs.
A tax policy that provides typically broad-based incentives has also been advocated to address a
range of macro-economic problems, such as cyclical ( or structural) unemployment, balance of
payments deficits, and high inflation. Such a policy would not be specifically targeted on FDI,
but on investment in general regardless residence. When tax incentives are used to provide
countercyclical stimulation for example, by encouraging investment and thus aggregate demand
in the economy, they are often introduced as temporary measures. Temporary incentives offer
the prospect of increased investment in the short-term while permanent incentives play in longer
term. When such measures are used, they are typically announced and then immediately
executed for better result.
2.5 Tax Policy
According toOberholzer(2008),tax policy analysis necessarily examines the nature and role of
the state, for most of the purposes of tax instruments are identical to the function of government
itself. In a sense, taxes are a necessary evil in private property regimes~ we have taxes in order
to give government entities access to cash and productive resources. From this derives the old
maxim that "taxation is one of the few things that one can be certain about."
Moesen and Persoon (2002) showed that the imposition and collection of taxes is simply one of
the fundamental policy instruments used to achieve governmental social and economic goals.
The objectives of tax policy are similar to those of public policy in developing countries. and
38
I i
overlap with the purposes of the tax system or the purpose of most governments. There are five
purposes for collecting revenue through taxes: to give government power to allocate resources;
to enable government to provide/support social development; to stabilize the economy; to
constitute and define the market place; and to encourage optimal economic growth. These are
explained below:
Bahemuka (2006} showed that the most developing countries are extremely focused on economic
growth in both the private and public sectors. According to the author, even in primarily market
based economies, governments need to acquire assets for public sector capital fonnation and
development-related expenditures. There appears to be no limit to the tax gadgetry used in
different countries to stimulate economic growth. Most developing countries encourage foreign
direct investment to stimulate economic growth through the use of tax incentives, and many
developing countries impose higher taxes on retained profits than on distributed profits in order
to encourage distribution. However, the effectiveness of some policies -- especially of incentives
-- remains uncertain because there is still insufficient data to link such policies with growth
performance.
Bahemuka (2006) also shows that the use of ta,'( instruments to enhance economic stability is
important in developing countries because this enables them to ensure elasticity with respect to
changes in the value of money and income levels. If tax yields rise when national income rises.
governments have less need to rely on deficit financing to maintain and expand the level of
public-sector activity in a growing economy.
According to Boyatzis(2008 ). the distributional role of taxes in developing countries is another
important purpose of the tax system. The author explains that the disparities in income can block
39

development and increase demands for government social spending. The mam explicitly
redistributive tax in most tax systems is the personal income tax (PIT). In prnctice, the personal
income tax in developing countries is far from being progressive due to large disparities in
incomes. These disparities are compounded by the influence of the rich, who may end up paying
fewer taxes due to numerous exemptions or favors from the government.
2. 7 Challenges Faced by Developing Countries in Tax System
Developing countries face fo1midable challenges in trying to establish effective and efficient
tax systems. As summarized by Bakibinga (2006), the leading authority on these issues, all
developing countries have to address four basic problems: (1) the structure of the economy,
which makes it difficult to impose and collect taxes; (2) the limited capacity for tax
administration; (3) the poor quality of basic data and; (4) in many developing countries like
Nigeria, the fact that the political setup is less amenable to rational tax policy than it is in
advanced countries. Each of these basic challenges is discussed further below.
According to Anupam et al., (2000) developing countries have well-known economic
characteristics: large shares of total economic output and employment are based in agriculture~
they have relatively large informal sectors; entrepreneurial units are small and numerous: wages
form a relatively small share of total national income; and a relatively small share of total
consumer spending takes place in large modern establishments.
The bulk of literature on tax policy in developing countries tends to focus on large taxpaying
units, countering tax avoidance and evasion, and the formal economy (Anupam et al., 2000).
While those policy analysts who discuss the particular problems caused by relatively large
40

informal sectors of the economy differ in their views as to exactly what should be done about
this gap in developing countries' tax bases, they do agree that the informal sectors need to be
brought into the documentary process, and that some form of presumptive taxation may be the
best way to begin collecting revenues from the best-documented sectors.
Another characteristic of developing economies that is an obstacle to tax policy is the low
registration rate of taxpayers. According to Bird (2002), taxpayers register in low numbers either
because they do not understand their obligations or because they are deliberately evading tax.
The scholar recommends that one of the main objectives of tax administration should be to
identify and bring tax evading entities into the system. He fmiher explains that each taxpayer
should be assigned a unique number and contact details should be noted and validated. Other
government agencies like the police, land registrars, and licensing departments should also be
involved in finding tax evaders.
2.8 Tax Administration and Data
Cuccia(2004) noted that one of the challenges facing tax policy in developing countries is the
lack of efficient tax administration. In his explanation, the author showed that administrations
face major problems: a large proportion of the economy is at a subsistence level; many taxpayers
do not keep records, and even where records are kept. they are not necessarily reliable. Taxpayer
cooperation is also lo,v because of chronic shortages of trained officials. traditions of corruption,
and lack of visible improvements in government services. As a consequence. countries often
develop tax systems that exploit whatever obvious revenue-generating options they have rather
than develop modern and efficient tax systems that create wide tax bases from which to draw
41

revenue. Hence many developing countries often end up with too many small tax sources, too
heavy a reliance on foreign trade taxes, and a relatively small use of personal income taxes.
a. Gross Domestic Product Growth
One out of several key factors as FDI determinant is host market growth rate. It can be measured
by the GDP growth rate. Investors, especially foreign investors, will be more captivated in
count1ies with larger market size, as indicated by GDP growth rate which reflects the level of
potential demand.
Definition of GDP growth as World Bank (2012) clarified is the annual percentage growth rate
of GDP at market prices based on constant local currency where the aggregates are based on
constant 2000 U.S. dollars. The terminology of GDP itself is defined as the sum of gross value
added by all resident producers in the economy plus any product taxes and minus any subsidies
not included in the value of the products. It is calculated without making deductions for
depreciation of fabricated assets or for depletion and degradation of natural resources.
Various studies indicate that GDP growth is an impo1tant sign to indicate market attractiveness.
Moreover, various studies have shovvn that transaction costs would be lower in countries with
high levels of growth ( Caves, 1 971; Zhao and Zhu. 2000 ). The proposed research hypotheses
related to this variable is GDP Growth has positive effect on FDI inflow.
b. Tax Rate
There are many types of tax rate in which researchers are interested in determining the
relationship between tax rate and FOL Among those well known tax rates are statutory tax rate
which is the rate stipulated under taxation law, average effective tax rate, marginal effective tax
42

rate, and real effective tax rate. Average effective tax rate represents how taxation affects profit
after income tax imposition.
It is calculated as a percentage of income tax over accounting profit. Marginal effective ta.'< rate
measures the extent to which tax rates result in the addition of the pre-tax profit from an
investment project. Marginal effective tax rate measured to which extent income tax will
contribute to additional earning before tax in an investing project. The calculation of marginal
tax rate is by dividing the percentage of increasing or decreasing one unit of tax rate by
percentage of increasing or decreasing in earning before tax.
In this study, statutory income tax rate based on Companies Income Tax Act CAP C21 FN 2004
in Nigeria was utilized. Out of several layers of income tax rate, the highest tax rate imposed on
income will be used in this study. There are several reasons for selecting statutory income tax
rate than the others. First, statutory tax rate is the easiest way to measure tax burden level
compared to other methods. Second. statutory tax rate plays an important role in country
selection by multinational companies because companies are more likely to choose a country
with low tax rates. As such, this study hypothesizes that tax rate has a negative impact on FOi.
c. Tax Incentives
Tax incentive policy has been implemented by many developing countries and transition
economies in attracting FD! inflow. This incentive policy is intended toward new established
firm rather than currently existing companies. New companies are exempted from the burden of
income tax over a specified period of time and usually this period can be extended for a
subsequent period at a lower tax rate.
43

This study exploits tax incentive policy as a dummy variable, representing the presence or
absence of tax incentives over the period of 1984 to 2014. Taxation and investment regulation
correspond to tax incentives was analyzed to determined the year in which it is present. There are
several regulations related to tax incentives over period 1970 to 2014. First, the colonial
Government Raisman Commission of 1958, which recommended the introduction of unifo1m
basic income tax principles for application in all the regions of Nigeria, which led to the
promulgation of the Income Tax Management Act, 1961 and The Companies income Tax Act,
1961. These legislations were later repealed arid re-enacted as The Personal Income Tax Act
CAP P8 FN 2004 and The Companies Income Tax Act CAP C21 FN 2004, respectively. As a
result of the reassessment carried out by the law Review Commission, these laws have been
reviewed and codified, and are included in the laws of the Federal Republic of Nigeria 2004.
Tax incentive was measured in two ways, effective tax rate which is annual tax revenue as a
percentage of Gross Domestic Product (GDP). And also average tax rate, which is the average
of effective tax rate and presence of tax incentive. The presence of tax incentive was scored as I
and O for otherwise (Buettner and Ruf (2005); Edmiston, Mudd and Valev. 2003).
Others included political risk. which sends fear and panic that discourages investment. a secured
political environment encourages investment. This was measured by number of coup de-tat in
Nigeria as used by Ayanwale (2007) and Nwankwo (2006).
44
I r

2.9 Gaps in the Literature
This chapter has widely discussed a good amount of literature related to the subject under study
however, there still exists some gaps, which have been identified and presented hereunder. For
instance, tax incentives should be encouraged if there is mutual gain by both the host country and
FDI.
In addition, although the potential importance of the need to attract FDI in the development
process cannot be over-emphasised. two fundamental issues concerning FDI are critical. First
what are the determinant factors of FDI in a typical host country? Secondly, are these factors
under the control of the host countiy and not subjected to the manipulations of FD I countries?
While the hypothesis of differential rate of return represents one of the first efforts in elaborating
FDI theory, many researchers have tested this hypothesis by examining the relationship between
FDI inflow and rate of return in several countries. Unfortunately, most of them failed to provide
suppo1iing evidence relevant to this hypothesis (Agarwal. 1980).
Moreover, Moosa (2002) stated that, the validity of this hypothesis was questioned even on
theoretical ground. First there could be other reasons than the rate of return to explain why
companies invest abroad. Maximizing sales to reach market penetration. logical and operational
reason for benefitting resource endowment in host countries. or circumventing trade barrier are
other reasons for this capital inflow. More impo1tantly is the diversification of risk by
minimizing risk per rate of return if companies expand its operation abroad. These flaws will be
patched up by next hypothesis.
45

One method for testing the po1tfolio hypothesis is by examining the relationship of business risk
and rate of fetum on investment flow to a group of countries. However, Agarwal (1980)
concluded that empirical evidence in favor of this theory seems to be weak. For example, Steven
( 1969) in his work on aggregate direct investment to Latin America countries could not obtain
any empirical evidence in supporting this theory. Moosa (2002) concluded that some problems
might be encountered when testing this hypothesis such as: (I) risk and return are calculated
from repo1ted profit, which are absurd to be equal to actual profit for several reasons, including
accounting methods and transfer pricing; (2) risk variable cannot be accurately measured by
calculating standard deviation of historical data.
46

3.0 Introduction
CHAPTER THREE
METHODOLOGY
This chapter comprises the procedures and activities involved in drawing logical conclusions on
the research study. It deals with research design, data collection techniques of the variables and
data analysis of different validating procedure used in the study.
3.1 Research Design
This research was essentially investigative and explanatory in nature. It examined the
relationship between tax policy and foreign direct investment in Nigeria. The study was
conducted by utilizing Pearson ·s Linear Correlation Coefficient and ordinary least square
regression on time series data to observe the relationship between tax policies particularly tax
incentives and tax rate variable and GDP growth on FDI inflow in Nigeria during period 1984 to
2014. Secondary data including foreign direct investment inflow, tax incentives, tax rate and
GDP growth were collected to be used in the empirical estimation. Further analysis of the
relationship was conducted in the form of descriptive analysis, mainly describing the history of
relationship between tax policy and FDI inflow in Nigeria and. explaining the reasons behind
that relationship. In short, this chapter discusses the data collection techniques. model
specification. and data processing.
3.2 Data Collection Techniques
Secondary quantitative data were utilized in this study. Quantitative data are data in \Vhich the
containing information was expressed numerically and often analyzed mathematically by
47

implementing statistical or econometric techniques. Regarding quantitative data, this study dealt
prin1arily with secondary data in the sense that data set could easily be collected and analyzed.
Based on the aim of the research, a review of the literature suppo1ied by secondary empirical
studies was conducted. A literature review was pe1formed to identify the perf01mance
assessment methods and practices followed and prescribed in the various FDI and tax policies,
tax incentive practices and guidelines, and to determine the factors affecting FDI attractiveness.
GDP growth inclusive
The literature comprised a1ticles published in accredited journals, ruticles in popular
publications, doctoral theses and industry frameworks, guidelines and regulations. Secondary
data were therefore extensively utilized in this study. The secondary data were manually
gathered from Central Bank of Nigeria (CBN) publication on major economic, financial and
banking indicators.
Also the CBN publications on monetary policy, surveillance activities and operations, CBN
annual report and statement of account and Federal Ministry of Finance repmts, were reviewed.
Some of the data were also extracted from other responsible and annual statistical bulletin and
UNCTAD reports for 1984 to 2014.
Panneerselvam, (2006) stated that secondary data collection provides easiness in term of cost.
time and effort when obtaining the data. Secondary data are data \Vhich were already created for
the purpose of first-time use by the creator and future use for others.
In this study, quantitative data encompass foreign direct investment inflow, gross domestic
product growih, tax rate and tax incentives. Assunc;:ao. et al. (2011) categorized those indicators
48

above into several groups. Indicators such as GDP growth represent market size and
macroeconomics indicator, and finally, rax rate and tax incentives represented governmental
approach and economic incentives. Detailed explanations about those data are examined closely
below.
3.3 Data Analysis
In order to analyze the data obtained from the reviewed economic and financial reports
comprehensively, both descriptive and inferential statistics were applied. Understanding and
analyzing the overall effect of tax policy mainly tax incentives and tax rate as well as GDP
growth on the attraction of FDI in Nigeria was critical to this study, therefore, the validating
procedures were based on statistical analysis.
3.3.1 Statistical method
The statistical method used includes descriptive statistics and Karl Pearson coefficient of
correlation method of analysis. Karl Pearson's r is the most widely used in practice to measure
the degree of correlation between two series. It is typically denoted by r which is a measure of
the correlation (linear dependence) between two variables X and Y sciences as a measure of the
strength of linear dependence between two variables as per the fonnula below.
49

In samples, the value of correlation coefficient r is calculated as
r= n(IX}:) - crxH!v)
\' "' ' ipttn·>11♦ t Cf%' HdNU
Where n is the number of the data set, x and yare the variables to be related
According to Gupta (2009). among the statistical methods used for measuring the degree of
relationship, Karl Pearson method is the most popular. The correlation coefficient summarizes in
one figure not only the degree of correlation but also the direction that is whether con-elation is
positive or negative. Between two variables X and Y, giving a value between +1 and -1
inclusive, where I is total positive co1Telation, 0 is no correlation and -1 is total negative
correlation.
Furthermore, a key mathematical prope11y of the Pearson correlation coefficient is that it is
invariant to separate changes in location and scale in the two variables. Therefore, it was adopted
because of its qualities which match the expectations of this study.
The formulated hypotheses were tested with the aid of Statistical Package for Social Sciences
(SPSS).
Linear trend model was also developed to estimate the rate of change of each variable
FDI= ~o+P1GDP Growth +~2 Tax rate +p3 Tax incentives +e
50

Where Po is constant, Pt is the rate of change of the dependent variable GDP Growth, ~2 is the
rate of change of the dependent variable tax rate, ~3 is the rate of change of the dependent
variable tax incentives and E is the error tea
3.3.2 Variables descriptions and measurement
Unlike the earlier studies by Ayanwale (2007); Nwankwo (2006); Buettner and Ruf (2005), this
study attempted to empirically shed light on the critical response or behavior of FDI towards the
prevailing tax policy on tax incentives and tax rate and GDP growth in the major sectors of
Nigeria's economy.
These statistics are oft.en disclosed in the financial reports of Central bank of Nigeria. Thus. all
the tax incentives, tax rates, GDP growth and economic statistics on FDI measurement data were
obtained manually from the annual audited financial reports of the CBN. Copies of their 1991 to
2012 annual reports were reviewed and adequately analyzed.
Two categories of variables were used in this study; these were~ I st) the independent variable -
Tax policy as an attracting measure such as tax incentives, tax rate and other tax policy measures
of attraction FDI and the GDP growth 2nd) the dependent variable FDI in Nigeria. The FOi
variable was based on the actual figure of FDI in Nigeria during the period under review. The tax
policy measures of attraction \Vere viev.red from several dimensions of tax policy.
All the variables were extracted from the actual performance figures reported in the CBN and
UNCTAD annual reports betvveen 1991 and 2012.
51

CHAPTER FOUR
PRESENTATION ANALYSIS AND INTERPRETATION OF DATA
4.0 Introduction
This chapter discusses the c01relation results of Pearson Linear Correlation Coefficient and the
estimation results of Ordinary Least Square regression analysis, which represents the relationship
between dependent variable (FDI Inflow) and Independent Variable Tax Policy as it concerns
(Tax Rate, Tax Incentives and GDP Growth, using time series data for year 1984 - 2014. Further
descriptive analysis related to historical tax incentives and tax rate regulation is presented
subsequently.
4.1 Summary of all Variables Exercised in this Study
Table 4.1: Summary of all Variables Exercised in this Study
Variable Explanation Unit Source
Dependent Variable:
FD! Inflow Net foreign investment us$ World Development
to Nigeria Indicator
Independent Variable:
Tax Incentives The presence or absence Dummy Variable Nigeria's Regulation
of Tax Incentive (Tl) (Tax Policy)
Provision in the tax
policy represented by:
I for presence of TI
0 for absence of TI
Tax Rate Highest Statutory tax % Nigeria's Regulation
rate according to (Tax Policy)
Nigeria's Tax Policy
GDP Growth GDP Growth as % World Development
percentage increase or Indicator
decrease of Nigeria's
I !

4.1.1 Foreign Direct Investment (FDI) Inflow as Dependent Variable
Dependent variable in this study is FDI inflow. Refen-ing to the (World Bank, 2012), FDI data in
this study refer to FDI net inflows (new investment inflows less disinvestment) in Nige1ia as the
reporting economy from foreign investors. Application ofFDI inflow in this study was impoitant
for comparison to other studies since most of studies about FDI utilized this variable as
independent variable.
4.1.2 Tax Incentives
Tax incentive has been implemented by Nigerian government in attracting FDI inflow. This
incentive is intended toward new established firm rather than currently existing companies. New
companies are exempted from the burden of taxes over a specified period of time and usually this
period can be extended for a subsequent period at a lower tax rate. This study exploited tax
incentive as a dummy variable. representing the presence or absence of tax incentives over the
period ofl 984 to 2014.
4.1.3 Tax Rate
While there are many types of tax rate in which different researchers are interested. the current
study was interested in statutory tax rate to determine the relationship between tax rate and FDI
m Nigeria. This is the rate stipulated under Nigerian Tax policy. Others were the average
effective tax rate, marginal effective tax rate. and real effective tax rate. Average effective tax
rate represents how taxation affects profit after income tax imposition. It is calculated as a
53
percentage of income tax over accounting profit. Marginal effective tax rate measures the extent
to which tax rates result in the addition of the pre-tax profit from an investment project. Marginal
effective tax rate measured to which extent income tax contributes to additional earning before
tax in an investing project. The calculation of marginal tax rate is by dividing the percentage of
increasing or decreasing one unit of tax rate by percentage of increasing or decreasing in earning
before tax.
In this study, statutory tax rate based on Nigerian Tax Policy was utilized. Out of several layers
of income tax rate, the highest tax rate imposed on income will be used in this study. There are
several reasons for selecting statutory tax rate than the others. First, statutory tax rate is the
easiest way to measure tax burden level compared to other methods. Second, statutory tax rate
plays an important role in country selection by multinational companies because companies are
more likely to choose a country with low tax rates. As such, this study hypothesized that tax rate
had no significant influence on FOi inflow to Nigeria.
4.1.4 Gross Domestic Product (GDP) Growth
One out of several key factors as FDI determinant is host country's market growth rate. It can be
measured by the GDP growth rate. Investors. especially foreign investors, can be more
captivated in countries with larger market size, as indicated by GDP growth rate which reflects
the level of potential demand. Definition of GDP grO\vth as World Bank (2012) clarified is the
annual percentage growth rate of GDP at market prices based on constant local currency where
the aggregates are based on constant 2000 U.S. dollars. The terminology of GDP itself is defined
as the sum of gross value added by all resident producers in the economy plus any product taxes
and minus any subsidies not included in the value of the products. [t is calculated without
54

making deductions for depreciation of fabricated assets or for depletion and degradation of
natural resources.
Various studies indicate that GDP growth is an important sign to indicate market attractiveness.
Moreover, various studies have shown that transaction costs would be lower in countries with
high levels of growth ( Caves, 1971; Zhao and Zhu, 2000). This study null hypothesis was that
GDP Growth has no significant relationship with FDI inflow to Nigeria.
4.2 Descriptive Analysis
Before presenting the analysis results, this chapter describes the nature of the variables used in
this study. Descriptive statistics of dependent and independent variables in the model are
summarized in table 4.1.
Table 4.2 Descriptive Statistics of FDI the Dependent Variable and Independent Variables
N Mean Std. Deviation
1 FDI 30 5.9690 10.34625
2 Tax Rate 30 0.6206 1.10198
,., Tax Incentives 30 1.3 I 03 0.55099 .)
4. GDP Growth 30 0.7431 1.2089
Table 4.2shows the result of the descriptive statistics. The analysis results indicate a mean of
0.6206 with a minimal standard deviation of 1.1019 for tax rate and, a mean of 1.3103 with
standard deviation of 0.55099 for tax incentive a mean of 0.7431 with a standard deviation of
1.2089 for GDP growth. The implication here is that tax rate, tax incentive and GDP grov.1h are
55

to a large extent determinants of FDI inflow in Nigeria. This means a rejection of the null
hypotheses and acceptance of the alternative hypotheses.
4.3 Table 4.3: FDI Net inflow to Nigeria 1984 - 2014 (%)
Year FDI Inflow(%) 1984 115,164,785 1985 485,581,321 1986 193,214,908 1987 610,552,091 1988 378,667,098 1989 4,692,249,739 1990 485,581,321 1991 I 93,214,908 1992 610,552,091 1993 378,667,098 1994 1,884,249,739 1995 1,079,271,551 1996 1,593,459,222 1997 1,539,445,718 1998 1,051,326,217 1999 1,004,916,719 2000 1,140,137,660 2001 I , 190,632,024 2002 I ,874,042, I 30 2003 2,005,390,033 2004 1,874,033,035 2005 4,982,533,943 2006 4,854,416,867 2007 6,034,971,231 2008 8. 196,606,673 2009 8,554,840,769 2010 6,048,560.266 2011 8,841,952,775 2012 7,101,031,884 2013 5.609,000,000 2014 4,808,400.000
Source: World Bank (2015); Central Bank of Nigeria (2014)
56
I I

Trend of FDI Inflow in Nigeria in the period 1984 to 2014
9500000000 9000000000 8500000000 8000000000 7500000000 7000000000 - 6500000000
-(A-6000000000
~ 5500000000 ...... :: 5000000000
.2 4500000000 I+- 4000000000 .s 1-'1 3500000000
~ 3000000000 2500000000 2000000000
,-,-r,-,-,-,,-,-,-r,-,-,-r,-,-,-,,-,-,-,-,,-,-,-,,-,-, .l_L_I__J __ LL_I__J _ _i_L_L_I_J._L_L_I __ LL_L_l__j _ _l_L_L.J_.l_L_L_J _ _l_L I I I I I I 1 I I I I I I I I I I I I I I I I I I I I I I I +-~-~~-4-L-~~-4-L-~~-4-L-~~-4-L-~~-~-4-L-~~- -L ~-4-L I I l I I I I I I I I I I I I I I I I I I I I I I I I I I I ,-,-,,-,-,-,,-,-,-r,-,-,-r,-,-,-r,-,-,-,-, - -, ,-,-, I I I I I I I I I I I l I I I I I I I I I I I I I I I I I I I 1-r-,-7-1-r-,-7-1-r-r7-·rr-r7-,-r-r7-7-1-r-1- -1 r ,- -1-r 4-L-~~-4-L-~~-+-L-~~-4-+-~~-4-L-~~-~-4-L- ~-4 -~ 4-+ I I I I I I I I I I ! I I I I I I I I I I I I I I I I I I I I +-r-r;-+-r-r;-+-r-r7-➔-+-r7-➔-+-r7-;-+-r- ;-+- -r; +-+ I I I I I I l I I I I I I I I I I I I I I I I I I I I I I 1-r-r,-1-r-r,-1-r-r7-,-y-r7-,-r-r7-7-1-r ,-1- -r,- -r .l_L_LJ _ _l_L_LJ_.l_L_LJ_J_L_LJ_J_L_LJ_J _ _i_L LJ _ _i_L_LJ _ _ L I I I I I I I 1 I I I I I I I I I I I I I 1 I I I I I I l I I +-+-~4-+-~-~4-+-~-~~-➔-+-~~-➔-+-~~-4- - -~4-+-~-~4-+ I I I I I ! I I I I I I I I I I I I I l I I I I I I I T-r-r7_T_ -r7-T-r-r7-,-r-r7-,-r-r7-7- -r-r7-T-r-r7_T_T
l _ L _I_ .J_.l_ _l__j __ LL_L_I_J._J__L_I_J._l_L_I _ _J '.J._L_L.J _ _l_L_L.J_ .LL I I I I I I I I I I I I I I I I I I I I I I I I I I I I I I I +-~-~4-+ -~4-+-~-~~-➔-+-~~-➔-+-~~-4 +-~-~4-+-~-~4-+-+ I I I I I I l I I I I I I I I I I I I I I I I I I I I I I I I ,-,-,,-,, ,,-,-,-r,-,-,-r,-,-,-r,-, ,-,-,,-,-,-,,-,-, .LL_I _ _J _ _l L I__J _ _l_L_L_L . .LL_L_I_J._L_L_I _ _J _l_L_l__j __ LL_I_.J __ LL I I I [ I I I I I I I I I I I I I I I I I I I I I I I I I I 4-L-~~-4 L ~~-4-L- ~-4-L-~~-4-L- -4-L-~~-+-L-~~-+-L I I I I I I l I I I I I I I I I I I I I I I I I I ,-,-,,-,-, ,,-,-, n- - -,,-,-r. ,,-,-,-,-,,-,-,-,,-,-, I I I I ! I I 1 I I I I I I I I I I I I I I I I I I 1-r-r,- -r -7-1-~ r ,-r- -r-r7-,-1-r-r,-1-r-r,-1-r ~- -~ -~ ~- -~~-4-L-h~-4-L-~~-~-+-~-~~-+-L-~~-+-+
l l I I I I I I I I I I I I I I I I I I I I I I -r- ;-+-r-r -+-r-r~-~-+-r7-➔-r-r7-;-+-r-r1-+-r-r1-+-+
◊rt-◊v◊~8?\~#'yr5f$~rSJ,◊&,,◊ar-◊&J◊~~\J/fZ$'~~~&,f;"&*'f)~'f)~&\r#~~~-o-'fJ◊'fJ~ Year
Source: World Bank (2015); Central Bank of Nigeria (2014)
In the above figure. numbers on the X-Axis represent years ranging from I 984 to 2014. This
figure and preceding table present the trend of FDI inflow to Nigeria (billion dollars) between
1984 and 2014.
The figure and table above show a very low FDI inflow to Nigeria between I 984 and 1993 as it
ranged between 115.2 billion USO and 378.7 billion USO respectively. A sharp increase in the
FDI inflow to the country happened in 1994 when it grew to 1,884.2 billion USO. Though it
stagnated at about 1,000.0 billion and L500.0 billion USO between and 200L a shocking trend
57

of sharp increase took place between 2002 and 2011. Within this period, FDI inflow to Nigeria
ranged between 1,874.0 billion USD and 8,841.9 billion USD. The figure above shows a
shocked trend of sharp plunge of FDI inflow in Nigeria during 2012 and 2014. According to the
figure, FDI inflow to Nigeria decreased from 8,841.9 billion USO in 2011 to 7,101.0 billion
USD in 2012, 5,609.0 billion USD in 2013 and 4,808.4 billion USD in 2014. The shock in this
trend might be a result of increase in total tax rate of Nigeria from 32.2% in 2010 to 33.8% in
2013 and 2014.
According to UNCTAD (2009) the Foreign Direct Investment inflows to Nigeria is mainly
concentrated in the oil sector and highly influenced by its price at the intemational market as
well as the Nigerian national reforms and policies in this sector. lt was noted that as of 1970, a
year before Nigeria became a member of the Organization for the Petroleum Exporting Countries
(OPEC), the foreign direct investment inflows was about $205million. This figure by 1984 had
risen to 115.2 billion USO. Also, the investments inflows also responded proportionally in the
same line with the attractive fiscal policies for private sector investors in oil and gas sectors that
followed in 1986 (UNCTAD, 2009, p8).
The United Nations Conference on Trade and Development (UNTAD) ranked Nigeria as
Africa's number one destination for Foreign Direct Investment in Africa, for the second time in
two years. The latest UNCTAD report, titled, "Global Value Chains: Investment and Trade for
Development", put Nigeria's FDI net inflows at 5,609.0 billion USO in 2013. The repo1t said
Foreign Direct Investment flows to African countries went up by five per cent in 2012, though
global FDI declined by l 8per cent. The report noted that most of the FDls into Africa mainly
58

driven by the extractive industry, but said there was an increase in investments in consumer
oriented n1anufacturing and services. ·
Nigeria receives the largest amount of Foreign Direct Investment (FOi) in Africa. Foreign Direct
Investment inflows have been growing eno1n1ously over the course of the last decade making the
country the nineteenth greatest recipient of FDI in the world. Nigeria's most important sources of
FDI have traditionally been the home countries of the oil majors. The USA, present in Nigeria's
oil sector through Chevron Texaco and Exxon Mobil, had investment stock of USD3.4 billion in
Nigeria in 2008, the latest figures available. The UK, one of the host countries of Shell, is
another key FOi partner- UK FDI into Nigeria accounts for about 20% of Nigeria's total foreign
investment. As China seeks to expand its trade relationships with Africa, it too is becoming one
of Nigeria's most important sources of FOi; Nigeria is China's second largest trading partner in
Africa, next to South Africa. From USD3 billion in 2003, China's direct investment in Nigeria is
repo1ied to be now worth around USD6 billion. The oil and gas sector receives 75% of China's
FDI in Nigeria. Other significant sources of FOi include Italy, Brazil, the Netherlands. France
and South Africa (UNCTAD. 2014).
Nigeria, by the year 2020 is poised to be among the Top 20 economies in the world with a
minimum GDP of$ 900 billion and a per capital income of at least $ 4000 per annum. As pa1t of
this Vision 20:2020, the Nigerian Government has put in place a number of investment
incentives for the stimulation of private sector investment from within and outside the country.
While some of these incentives cover all sectors, others are limited to some specific sectors. The
nature and application of these incentives have been considerably simplified. A brief summary of
the types of incentives offered include~ tax holiday/ tax exemption; investment allowance/tax
59
I i
I I I I I l

credit; duty/VAT exemption/ reduction; R&D allowance; deduction for qualified expenses.
Table 2.4 elaborate the main categories of tax incentives
60

NIGERIA'S GDP GROWTH 1984-2014 (%)
Table 4.5: Nigeria's GDP Growth 1984-2014 (%)
Year GDP, bin.% GDP per capita, dollars Current Prices
1984 180.2 2204 1985 178.8 2131 1986 90.4 1050 1987 55.8 631 1988 67 738 1989 60.5 650 1990 68.3 715 1991 64 652 1992 58.l 577 1993 56.7 549 1994 47 445 1995 49 452 1996 52 468 1997 54.4 477 1998 56.5 484 1999 57.7 481 2000 74.6 607 2001 71 563 2002 95.1 736 2003 108.8 821 2004 141.3 1039 2005 180.5 1293 2006 233.9 1632 2007 267.7 1819 2008 334.6 2213 2009 272.5 1754 2010 369.1 2311 2011 411.7 2508 2012 461 2730 2013 515 2966 2014 522.6 1097.97
Source: ·world Bank (2015); Central Bank of Nigeria (2014)
61
GDP Growth Rate
-1.2 11.3 1.9
-0.79 7.7 7.1 11.4
0 2.7 1.6
0.79 2.1 4
2.9 2.9 0.35 5.4 4.4 21.4 10.2 10.5 6.5 6
6.5 6.3 6.9 7.9 4.8 4.3 5.3 6.8
l i I'
I
11'
i ! I

u, I-
.m 8 ~ c
::ci 0: s
540
480
420
360
300
240
180
120
60
Trend of GDP of Nigeria in the period 1984 to 2014
-?i49...,_6{P~<{}."'°',fi,-?i,s,-?i~..&'\~'\,~'9y~ar-~°'\cJf._,~~~.t?i6PiY~~~~,s,iY*'\,#''\,#'\,&~r!PiY&~~~viY◊iY~ Year
Source: World Bank (2015); Central Bank of Nigeria (2014)
In the above figure, numbers on the X-Axis represent years ranging from 1984 to 2014. This
figure and preceding table present the trend of Nigeria's GDP growth (billion dollars) between
1984 and 2014. The table and figure above present the GDP growth of Nigeria betvveen 1984 and
2014. During the years (1984-20114), the GDP of Nigeria rose by 342.4 billion US dollars from
180.2 to 522.6 billion US dollars. A sharp decline in the GDP growth occurred between 1986
and 2002 when it fellow from 178.8 billion USO to 90.4 billion USO and stagnated at a growth
rate, which ranged between -0.79% and 2.9%. Great change began to happen in 2000 when the
country's GDP growth rate moved to 5.4% growing the GDP from 95.1 billion USO to 108.8
billion USO in 2003. Significant growth in Nigeria's GOP happened between 2004 and 2014
62

from 141.3 billion USD to 522.6 billion USD. The average annual growth of GDP of Nigeria
was 11 .4 billion US dollars or 44.8%. Share in the World however, dropped by 0.07%. Share in
Africa decreased by 1.5%. Share in Western Africa rose by 4.4%. In nut shell, the minimal GDP
of Nigeria was in 1984 (180.2 billion US dollars) and maximal GDP of Nigeria was in 2014
(522.6 billion US dollars). The annual growth rate of GDP in Nigeria was 6.8% in 2014.
63
I I

Tax Rate in Nigeria 1984 - 2014 (%)
Table 4.6: Tax Rate in Nigeria 1984 - 2014· (%)
Year Tax rate(%) 1984 35 1985 35 1986 35 1987 35 1988 35 1989 35 1990 30 1991 30 1992 30 1993 30 1994 30 1995 30 1996 30 1997 30 1998 30 1999 31.4 2000 31.4 2001 31.4 2002 31.4 2003 31.4 2004 31.4 2005 31.4 2006 32.2 2007 32.2 2008 32.2 2009 "7? .J ___
2010 32.2 2011 32.6 2012 33.8 2013 33.8 2014 33.8
Source: World Bank (2015); Central Bank of Nigeria (2014)
64

35.6
35.2
34.8
34.4
34.0
"o" 33.6 ci' 33.2 -(IJ 32.8 ,I.I IC
32.4 a.. >< ~ 32.0
31.6
31.2
30.8
Trend of Tax Rate in Nigeria in the period 1984 to 2014 - -T_T_T_r-r-r-r,-1-1-1-T_T_T_r-r-r-r,-,-1-1-T-T-,-r-r-r,-1-1-1 I I I I I I I I I I I I I I I I I I I I I I I I I I I I I I +-+-+-~-~-~-r~-4-4-➔-+-+-+-~-~-~-~~-4-➔-➔-+-+-~-~-~-r~-4-4-
1 I I I I I I I I I I I I I I I I I I I I I I I I _ -L- - _ -LJ_J_J_J_i_L_L_L_L_L_LJ_J_J_J_i_L_L_L-L-LJ_J_J_
I I I I I I I I I I I I I I I I I I I I I I I I I I I 1 I I
+-+-+-l--t- -l--l--l--l-4-+-+-+-l--t-l--l--l--l-4-4-+-+-f--t-t-l--l--l--l-• I I I I I I I I I I I I I I I I I I I I I I I I I I I I I I +-+-+-r-~- -r,-~-~-➔-+-+-+-r-~-r-r,-~-➔-➔-+-+-r-~-r-r,-~-~-1 I I I I I I I I I I I I I I I I I I I I I I I I I I I 4-4-L-~-~- -LJ-~-~-~-4-L-L-~-~-L-LJ-~-~-~-4-L-~-~-~-L -~-~! I I I I I I I I I I I I I I I I I I I I I I I I I I I I I I
+-+-t-t--r-, -:--:--1--1- ➔ -+-+-+-J--r-:--:--:--1-➔- ➔-+-t-J--r-r-: 7--1--1-, I I I I I I I I I I I I I I I I I I I I I I I I I I I I I I T-T-T-,-r-r-r7-7-,-,-T_T_T_r-r-r-r7-7-,-,-T-T-,-r-r- 7-7-7-1 I I I I I I I I I I I I I I I I I l I I I I I I I I I I I +-+-+-~-~-~ ~~-4-4-➔-+-+-+-~-~-r-~~-4-➔-➔-+-+-~-~- r~-4-4-1 I I Ill I I l I I I I I I I I I I I I I -----1 I I I i_i_L_L_L_L LJ_J_J_J_i_L_L_L_L_L_LJ_J_J_J_ -L-L-L-L-LJ_J_J_ I I l I I I I I I I I I I I I 1 I I I I I I I I I I I I I I I I I I I I I I I I I I I I I I I I I I I I I I I I I I I I I I T_T_T_r-r-r r,-,-,-,-T_T_T_r_ --- -- - - T-T-r-r-r-r,-,-,-1 I I I I I I I I I I I I I I I I I I I I I I I 7-7-T-,-r-r r,-,-,-1-T_T_T-, r-r-r,-1-1-1-T-T-,-r-r-r,-1-1-1 I I I I I I I I I I I I I I I I I I I I I I I I I I I I I I +-+-+-~-~-~ r~-~-~-➔-+-+-+-~ ~-r-r~-4-➔-➔-+-+-~-~-~-r4-~-4-1 I I I I I I I I I I I I I I I I I I I I I I I I I I I I I I
+-+-t-t--r-r -:--1--1-➔-+-+-t-1-r-~-~~--1-➔-➔-+-t-J--r-r-l-~--1--1-, I I I I I -&--Gl-----G-D-e-+-.... -0-_. I I I I I I I I I 1 I I I I I I T-T-r-r-r-r -r-r-r7-7-,-,-T-r-r-r-r-r7-7-7-
~~~~~~NN~~~~~~~~~~~~~~~~~~~~~~ ~~~~~~~-~-~~~-~-~~~-~~~~~~~~~~~~~~~
Year
Source: Source: UNCTAD 2014, World Tax Database (2014); World Bank (2015); Central Bank of Nigeria (2014)
In the above figure, numbers on the X-Axis represent years ranging from 1984 to 2014. This
figure and corresponding table present the trend of total tax rate(% of profit) in Nigeria between
1984 and 2014. Total tax rate is the total amount of taxes payable by businesses (except for labor
taxes) after accounting for deductions and exemptions as a percentage of profit.
Total tax rate (% of profit) in Nigeria was one of the highest in the world measured at 35.0
between 1984 and 1989. Following the country's tax policy amendments in 1989, the tax rate
stood at 30.0 between 1990 till 1998 when it was then measured at 31.4 between 1999 and 2005.
The tax rate in Nigeria later measured at 32.2 between 2006 and 2010. In 2011, total tax rate was
at 32.6. However. with the recent data on development indicators. the total tax rate in Nigeria
65
...................... ,. .. !
I I

was measured last measured in 2014 and stood at constant rate of 33.8 between 2012 and 2014.
Up to last-measured at 33.80 according to the World Bank.
Table 4.7. Tax Incentives of Nigeria from 1984 to 2014 (%)
Year Tax Incentives(%) 1984 6.7 1985 6.7 1986 6.7 1987 6.7 1988 7.5 1989 7.5 1990 7.5 1991 7.5 1992 7.5 1993 7.5 1994 7.5 1995 7.5 1996 11.0 1997 11.0 1998 11.0
1999 30.8 2000 30.8 2001 30.8 2002 30.8 2003 30.8 2004 30.8 2005 30.8 2006 31.6 2007 3 l.6 2008 31.6 2009 3 l.6 2010 31.6 2011 32.1 2012 32.5 2013 31.7 2014 32.7
Source: World Bank (2015); Central Bank of Nigeria (2014)
66

Figure 4.4 Trend of Tax Incentives in Nigeria in the period 1984 to 2014.
33
30
27 'o' ~ 24 II)
(lJ 21 .~ ,1.,1
C:
~ 18 .s >< 15 ~
12
9
6
Trend of Tax Incentives in Nigeria in the period 1984 to 2014
6 ~57.5~5~57.5~5~57. 6.76.76.7 .7
11.111.0.1 0
0 '4° '\.#' 0-s, '94], 0<8\Js'?0C)\~~&;, -?>°'"'ip0dp '\.~'\06p 41' ,s,<S-'\.,&\&~0 '\.,# rf;,(s> '\.,~~,s. '\.,&~&i ~\~->rf;, <J,'i,"?'f' ~
Year
Source: World Bank (2015); Central Bank of Nigeria (2014)
In the figure above, numbers on the X-axis represent years under study from 19984 to 2014. This figure
and the corresponding table present the trend of tax incentives in Nigeria in the period 1984 to
2014.
According to the trend sho\\ed by the figure above. the tax incentives in Nigeria \Vere increasing
steadily from 1984 to 1998. In the next year the tax incentives sharply increased from 11 % to
30.8%. This sudden increase is because of the countt-y" s policy amendments in 1999 towards
attraction of foreign direct investment. From 2000 up to 2014 tax incentives of Nigeria were
experienced on the consistency steady increase.
67

Table 4.7: Summary of FOi Inflow, Tax Rate, Tax Incentives and GDP (1984 - 2014)
Variable Observation Mean Median Std. Dev. Min. Max
FDI INFLOW 30 2.21E+09 8.87e+08 3.79E+09 -4.55E+09 l.34E+I0
GDP GROWTH 30 5.350373 5.989109 4.067567 -13.12672 9.084714
Tax Rate 30 33.03333 30 4.759624 28 45
Tax Incentives 30 0.2333333 0 0.4301831 0 1
This study covered 30 observations from 1984 to 2014. One dependent variable (FDI inflow)
and independent variable tax incentives tax rates and GDP Growth are summarized in the above
table.
Out of four variables, only FDI inflow has a standard deviation higher than its average. This
condition shows the data are not equally spread. However, it is still permissible to incorporate
the data into model OLS regression analysis. Moreover, the summary of the data shows that all
variables have positive average even though some of them have negative value as shown in the
minimal value of FDI inflow and GDP Growth.
4.5 Relationship between Tax Incentives, Tax Rate, GDP Growth and FD[ inflow in
Nigeria
Table 4.8: Pearson Correlations of the Independent variables with the Dependent variable
FOi Sig N Decision Tax Pearson Correlation .490 .024 I 30 Significant Positive Incentives Coefficient (r) Relationship -Tax Rate Pearson Correlation .450 .041 30 Significant Positive
Coefficient (r) Relationship GDP Penrson Correlation .450 .041 30 Significant Positive
I Growth Coefficient (r) I Relationship
Table 4.8 indicates that there is a positive relationship betv,1een tax rate, tax incentives, GDP
growth and. FDI inflow in Nigeria. These results for tax rate and tax incentives show that the
68

relationship is statiscally significant considering the Pearson Correlation Coefficients r = .490, r
= .450 and r = .450at 0.05 level of significance:- Therefore, these analysis results reject the null
hypotheses and accept the alternative hypotheses thus, concluding that there is significant impact
of taxincentive. tax rate and GDP growth on FDI inflow to Nigeria. This result also supports the
findings inEdmiston, Mudd and Valev(2003 ), vvhich concluded that tax incentives stimulate the
inflow of FOL Thisresult also suppo11s the findings in Buettner and Ruf (2005), which explained
that the statutory tax rate shows asignificant positive impact on FDI.
4.6 Basic Assumption Test
4.6.1 Multicollinearity
The first basic assumption test undertaken here is multicollinearity test. tvlulticollinearity means
that independent variables should not correlate one another. If correlation exists between
independent variable, then we are in the state of multicollinearity problem. In this case, the
regression model vvill end up with an incorrect or erroneous result and therefore. invalid
conclusion will be prevailed.
The simplest multicollinearity test is conducted by testing the correlation coefficient between the
independent variables. As a rule (rule of thumb). if the correlation coefficient is above 0.85. ,ve
should suspect of multicollinearity problems among independent variables. Another moderate
method. which is commonly used. is by using variance-inflating factor or VIF test. VIF value
above 10 will be considered as multicollinearity problem and the problem will be solved by
dropping the independent variable from the model.Correlation value betvveen independent
variables can be shown as belov,r:
69

Table 4.9: Correlation Value among Independent Variable
FDI Inflow GDP Tax Rate Tax
Growth Incentives
FDJ Inflow 1
GDP Growth 0.0345 1
Tax Rate 0.1889 0.7622 1
Tax Incentives 0.3891 0.1772 0.4003 1
Table 4.9 shows that the maximal absolute correlation value among independent variables is
0.7622 which exists between Tax rate and GDP Growth variable. Since the maximal absolute
correlation value is below the rule of thumb (in this study. it is assumed to be 0.85), vve may
conclude that we do not have multi-collinearity. Another method that has been applied is VIF
approach. The value ofVIF approach as STATA version 12.0 calculated is as follow:
Table 4.10: VIF Value among Independent Variable
Variable VIF 1/VIF
GDPGROWTH 4.01 0.249651
Tax Rate 3.99 0.250669
Tax Incentives 1.95 0.512337
Mean V!F 3.46 '
Since all the values of VIF are below the l 0. it can be concluded that there 1s no multi
collinearity problem in the model.
70

4.6.2 Omitted Variable Test
This study carried out two tests in examining the omitted variable. The first one is Omitted
Variable Test (OVTEST), and the other is Linktest. Both of them are available in STAT A 12.0.
The idea behind OVTEST was that this test could analyze the model by checking if the model
has omitted any important variable or included any unnecessary variable. The null hypothesis in
OVTEST is that the model has no omitted variable. Therefore, we should not reject the null
hypothesis if the model is built con-ectly.
OVTEST Calculation
. ovtest
Ramsey RESET Test using powers of the fitted values of FOi iNFLOW
Ho: Model has no omitted variable
F (3. 20) = 0.11
Prob.> F = 0.9535
According to the above calculation. we find that Prob> F = 0.9535 which is highly insignificant
even for 10% level of significance. Therefore, we cannot reject the null hypothesis and
concluded that the model has been correctly specified. This model already included important
variables and omitted unnecessary variable.
Another omitted variable test performed in this study is Linktest. The way we take conclusion in
this test is by carefully observing the _hatsq value. If the _hatsq value is not significant, we may
conclude that the model has been correctly specified.
71
.......... ------ .. !

Table 4.11: Linktest Calculation
. linktest
I SS df MS Number of obs = 30
Source F (2, 27) = 59 .52
Model 3.3987e+20 2 1.6993e+20 Prob> F = 0.0000
Residual 7.7091e+19 27 2.8552e+J8 R-Squared = 0.815 I
Adj. R-Squared = 0.80 I 4
Root MSE = I .7e+09
Total 4. l696e+20 29 l.4378e+19
FOi INFLOW Coefi. Std. Error t p> It I (95% Coef. Interval)
hat .9677175 .173079 5.59 0.000 .6125872 l .322848 -
Jrntsq 4.67e- I 2 2. l3e-l I 0.22 0.828 -J.89e-11 4.83e+ 11
cons -4416808 3.70e+08 -0.01 0.991 -7.36e+08 7.54e+08 -
In the linktest above, the variable _hatsq is not significant. The _hatsqProb> [t] value is 82.8%
\Vhich is higher than 10% significant level. Therefore. this confirms that there is have no
specification error in the model. No model modification is needed here.
4.6.3 Normality Test
Normality test is performed to determine whether the data in the study is normally distributed or
not. This study o.pplied Shapiro Wilk test to detect normality problem in the model. Null
hypothesis in Shapiro-Wilk test is that the data have been normally distributed. I hve select 5%
le\·el of significance. then vie may reject the null hypothesis if prob> z ft)r Shapiro-Wilk test is
below 5%: otherwise we have no option but to accept null hypothesis and conclude that the
residual data are normally distributed.
72

Table 4.12: Shapiro ·wilk Test on Normality Problem
. swilk r Shapiro-Wilk W test for normal data
Variable
Obs lw Iv iz I Prob>z r 30 I o.93358 ) 2.11 l I 1.545 I 0.06116
Shapiro-Wilk test calculated in STATA version 12.0 yield value prob> z is 6.116% which is
higher than 5% level of significant. Therefore. we can safely conclude that the residual of this
model is normally distributed. The graphical method performed by ST AT A version 12.0 also
shows the normality of model residual.
4.6.4 Autocorrelation Test
Autocorrelation test is conducted by applying Durbin-Watson Test (d statistics). According to
Gujarati (2005), the area in which we do not reject null hypothesis and decide that we do not
have autocorrelation problem in the model is if the Durbin Watson value is located between 2
and 4-du. As the figure 4. 9 shows. Durbin Watson statistics value is 2.164005 which is clearly
located bet\veen 2 and 4-clu. Therefore. \Ve may consider that the model is clear from
autocorrelation problem.
Durbin \Vatson Statistics
. dwstat
Durbin-Watson ct-statistics ( 7. 30) 2.164005
73
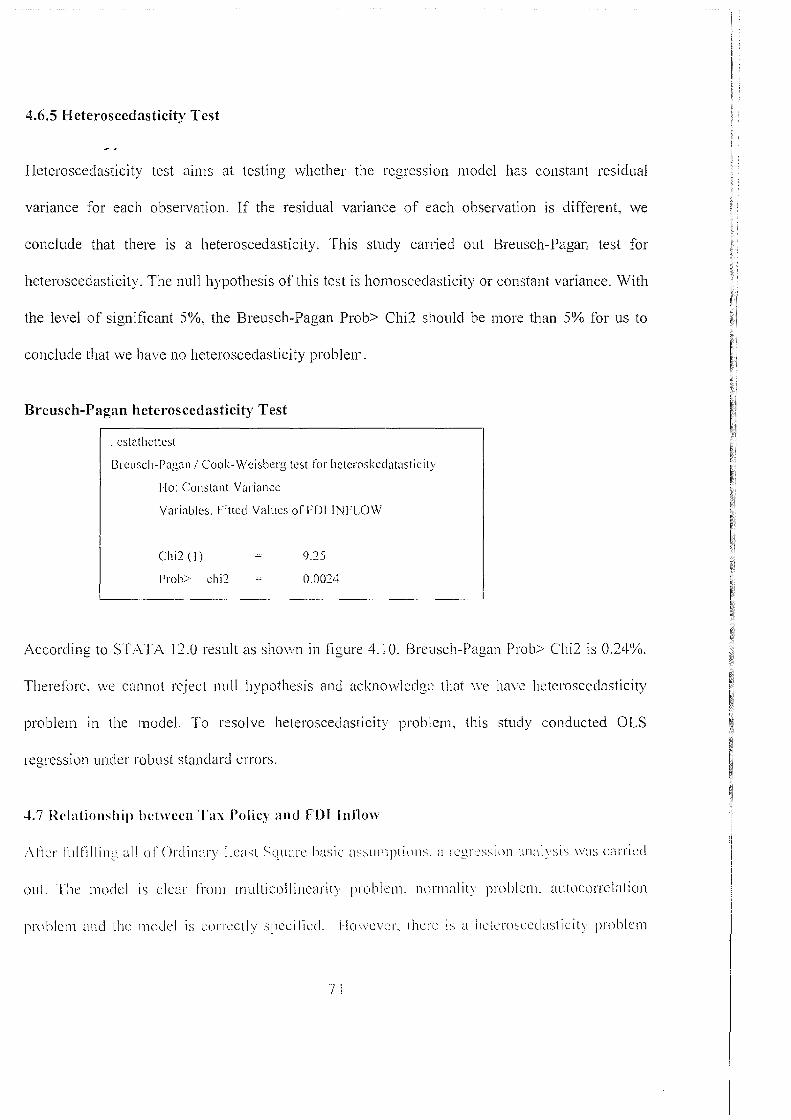
4.6.5 Heteroscedasticity Test
Heteroscedasticity test aims at testing whether the regression model has constant residual
variance for each observation. If the residual variance of each observation is different, we
conclude that there is a heteroscedasticity. This study carried out Breusch-Pagan test for
heteroscedasticity. The null hypothesis of this test is homoscedasticity or constant variance. With
the level of significant 5%, the Breusch-Pagan Prob> Chi2 should be more than 5% for us to
conclude that ,ve have no heteroscedasticity problem.
Breusch-Pagan heteroscedasticity Test
. estathettest
B1·eusch-Pagan / Cook-Weisberg test for heteroskedatasticity
Ho: Constant Variance
Vat"iables: Fitted Values of FDI INFLOW
Chi2 (l)
Prob> chi2
9.25
0.0024
According to STA TA 12.0 result as shown in figure 4.10. Breusch-Pagan Prob> Chi2 is 0.24%.
Therefore. \Ve cannot reject null hypothesis and acknovv-Jeclge that ,ve have heteroscedasticity
problem in the model. To resolve heteroscedasticity problem. this study conducted OLS
regression under robust standard errors.
4.7 Relationship between Tax Policy and FOi Inflow
After fulfilling all of Ordinary Least Square basic assumptions. a regression analysis was carried
out. The model is clear from multicollinearity problem, normality problem. autocorrelation
problem and the model is correctly specified. However. there is a heteroscedasticity problem
74

here. To solve this problem, OLS regression was conducted under robust standard errors.
STAT A 12.0 gave the result of OLS regression using robust standard en-ors as follovvs:
Table4.13: Regression Estimation Using Robust Standard Error
. regress FDIINFLOW GDPGROWTH TaxRateTaxlncentives, vce (robust)
Linear Regression
Number of obs = 30
F (6, 23) = 19.02
Prob> F = 0.0000
R-Squared = 0.8148
Root ivlSE = l .8e+09
FDIINFLOW Coer. Robust Std. t p> It I 95% Coef Interval)
Error
GDPGROWTH I .64e+08 I .64e+08 0.98 0.337 -l.82e+08 5. I le+08
TaxRate -2.07e+08 6.95e+08 -2.97 0.007 -2.50e+09 8.45e+08
Tax Incentives -6.98e+08 7.46e+08 0.94 0.359 -2.24e+09 8.45e+08
cons -1.1 Oe+ I 0 5.38e+09 -2.04 0.053 -2.2 le+ 10 l.66e+08 -
Table 4.13 exposes regression estimation of Tax Policy provisions for Tax Incentives, Tax Rates
and GDP Growth on FDI inflov•i in Nigeria. The model is good enough because the R value is
81.48%.
Since there is no multicollinearity problem, high value of R indicated that the independent tax
policy with its construct variables (Tax Incentives. Tax Rate and GDP Growth) succeed to
explain the FD! inflmv trends in Nigeria.
From table 4.13 above. we can develop the researchmodel that is a multiple regression model.
FDI =Po+ P1GDP Growth+ B2Tax rate+ PJ Tax incentive+ e1
75

Where
FDI is the Foreign Direct Investment (independent variable)
While the dependent variables include
GDP growth is the Gross Domestic Product growth
Tax Rate
Tax incentives
e1 is the error term
~o, Bi, B2. ~3- Are the parameters in the model.
FDF""' 1.10 + 1.64 GDP growth-2.07 Tax Rate-6.98 Tax incentive.
The result from the regression analysis model indicate that Gross Domestic Product Growth is
positively rel::tted to FDI by the positive signs as GDP Grmvth increases by one unit on the
average FDI \;,.,rill increase by l .64 units.
According to the model tax rate and tax incentive are reversely related to FDI as the negative
sign reveals. This means thnt when tax rates increased by one unit FDI \\'ill decrease on the
average by 2.07 units and \\'hen tax incentive increased by one unit FD! will on the average
decrease by 6.98 units Yvhen all mentioned variables are zero FD! will be approximately 1.10
units, this means the rate ofFDl independent of tax policy was 1.10 units.
76

4.8 Statistical Test for OLS Model
This section discusses several statistical tests co9ering t-test from previous OLS regression. T
test is conducted by comparing the value of 1 statistics of each independent variable vvith the
value of t table. By using ST A TA 12.0, we can easily know the result oft -test by comparing
Probability of/ value with level of significance. In this study, the researcher used 5 percent or
95% confidence level. If the probability oft value< 5 percent, then it can be concluded that the
independent variable is significant toward dependent variable. To be more precise explanation of
t -test for each independent variable is presented below.
4.8.1 GDP Growth
Probability value of r statistics is 0.33 7 which is higher than level of significant 5%. Therefore, it
can be concluded that GDP Growth has no significant relationship with FDI inflow. The result is
quite surprising since we expect significant relationship with positive value of GDP Growth.
4.8.2 Tax Rate
Tax rate shows a negative signal and indicates a significant relationship with FDI Inflow. The
probability value of t statistics for tax rate is 0.007. which is lovver than 5 percent level of
significance. The negative sign here is quite acceptnble since lower tax rate means higher profit
after tax for investors.
4.8.3 Tax Incentives
Tax incentives. which has probability value oft statistics 0.359. This vrdue is much higher that 5
percent level of signi f'icance. Therefore. it can be cone lucled that tax incentives has insignificant
relationship with FDI innow. This finding is in line with many researchers conclusion. For
77
example, Root &Ahmed (1978), and Cleeve (2008) in their empirical research regarding
determinant o1 FDI inflovv proved that tax incentives is not significant as FDI determinant.
78

CHAPTER FIVE
SUMMARY OF FINDINGS, CONCLUSIONS AND RECOMMENDATIONS
5.0 Introductions
This chapter covers three parts 1 ). Summary of findings 2) conclusion and 3) recommendation,
the chapter presents the discussions of the results derived from the data presented in chapter
four, it explained the major study findings of the impact of tax policy on foreign direct
investment in Nigeria 111 the period 1984 to 2014. It states the conclusion and based on the
conclusion some policy: recommendations are presented from the findings of the study. In
relations to the research objectives.
5.1 Summary of Findings
Findings of the study were presented based on the objectives of the study) .To examme the
relationship between tax incentive and foreign direct investment in Nigeria.2. Toexamine the
relationship bet\veen tax rates and foreign direct investment in Nigeria. 3. To examme the
relationship betv•ieen GDP Growth and foreign direct investment in Nigeria.
The first objective of the study \\·as to examine the relationship between tax incentives ancl
foreign direct investment in Nigeria in the period 1984 to 2014. Based on the finding tax
incentives has probability value oft-statistics 0.359 \Vhich is much higher than that 5 percent the
level of significance. It can therefore be concluded that tax incentives has insignificant ~ ~
relationship \Vith FDI inflmv. This finding is in line with many reseurchers conclusions for
example Root & Ahmed (1978) and Cleeve(2008)in their empirical research regarding
79

determinant of FDI in flow proved that tax incentives policy is not significant as FDI
determinant.
Considering the second objective which is to examine the relationship between tax rate and
foreign direct investment inflow in Nigeria in the period 1984 to 2014 the following
findings emerged from the analysis's below.
Tax rate shows a negative signal and indicates a significant relationship with FDI inflow .the
probability value oft-statistics for tax rate is 0.007 which is lower than 5 percent level of
significance. The negative sign here is quite acceptable since lower tax rate means higher profit
after tax for investors.
The third objective of the study was to exan1me the relationship between GDP growth and
foreign direct investment in Nigeria. Based on ordinary least square regression analysis, this
study shows that GDP growth has insignificant relationship with FDI inflow in igeria.
The findings of the research study reveals that two out of the three independent variables tax
incentive and GDP growth has insignificant relationship with FDl inflow. Also the findings
reveal that tax rate has negative significant relationship to FDf.
5.2 Conclusions
Based on the facts and findings presented in chapter four. the following salient conclusions have
been made.
80

Based on Ordinary Least Square regression analysis, this study found that tax rates have
significant impact on FDI inflow in Nigeria either in negative or positive. Tax rate therefore is an
independent variable with negative significant relationship.
Tax is convincingly proven not significant as FOi inflow determinant. The possible reason is
because tax incentives offered in Nigeria will never be able to offset susceptibility in economic,
politic, government policy and lack of infrastructure as previously prevailed in Nigeria.
Moreover, tax incentives as a provision of tax policy specially are not the main consideration for
investors in investment decision making. However, if other main FDI determinants are available,
tax incentives will be additional point for investors in locating their investment. Hence, we
conclude by rejecting the null hypothesis tax incentive has no positive effect on FDI inflow in
Nigeria.
The tax policy in awarding tax incentives as it was executed under previous government policies
brought uncertainty for investors. They will therefore spend extra eff01t only for knowing
whether they are eligible or not for being granted this incentive. As a result, both investors and
policy makers easily fall into corruptions, cronyism, and nepotism.
Tax reforms in 2004 had proven that lowering tax rate, offering tax incentives and simplification
of tax mechanism can attract FDI growth more than giving tax holiday facility. Investors
appreciate more on lower tax rate and simple tax procedure as well as extending tax incentive
facilities. However, reducing the tax rate and simplifying tax procedures need extra effort and
precise calculation than giving tax incentive facilities. The study also reveals that GDP grow1h
has insignificant relationship with FDI inflow in Nigeria.
81
I I

5.3 Recommendations
Referring to ""the previously described conclusions, this study offers the following essential
recommendations in order to sustain and maintain foreign direct investment inflow in Nigeria as
well as sound tax policy.
Empirical quantitative analysis concluded that tax rate has a significant and negative impact on
FDI inflow. Accordingly, lowering tax rate accompanied by tax procedure simplification will
increase FDI inflow. Hov,1ever, lowering tax rate can also mean giving incentives of tax rate
discount to all taxpayer which in fact will decrease tax revenue. Therefore, it is better for the
government to opt for tax rate discount incentive and select the appropriate criteria for granting
this incentive.
A tax incentive policy should be planned and managed appropriately. The requirement in giving
it should be clearly stipulated in law in such a way that investors can easily interpret without
incurring dispute. Moreover. government should not repeat the previous mistakes by granting tax
incentives based on discretionary basis to seal up any opportunity that could bring toward
corruption, cronyism. and nepotism.
There should put in place national policy that can increase the country higher level of GDP
growth as an impo1tant sign to indicate market attractiveness and transaction cost will be lower.
Lastly, there is need for conducting cost analysis before implementing tax incentive policy.
Government should assure that the benefit from FDI inflov./ as a result of implementing tax
incentive facilities is higher the cost associated ,vith it. This cost benefit analysis needs
82

meticulous calculation and analysis. However, the result will lead to effective and efficient tax
holiday regulation.
5.4 Areas for further Research
The researcher suggests the following areas for further research:
1. The effect of political stability on motivation toward investment
2. Income distribution and foreign direct investment
3. Multi-national cooperation and foreign direct investment
83

REFERENCES
AdaoraNwankwo (2006), The Determinants of Foreign Direct Investment lnflo\VS (FDI) in
Nigeria, Newcastle Business School, Northumbria University, Newcastle upon Tyne,
England
Ayan wale K. (2007), international transfer pricing. Mass Edward Elgar
Agosin, M. (2009).Korea and Taiwan in the financial crisis.Working Paper, 5. Santiago, Center
on International Economics and Development, University of Chile.
Akingube, 0. (2003) Flow of Foreign Direct Investment To Hitherto Neglected Developing
Countries. ·wIDER Discussion Paper. January.
Anupam, Evangelos A. and Dhaneshwar G (2000).Promoting Growth in Sub-Saharan Africa.
Washington: International Monetary Fund, Publication Services.
Ariyo, A ( ) Utility Privatisation and the Poor: Nigeria in Focus.
Ayo k i ,M. ( 200 7 ),Tax Pe rformanceinPoorC ountries: Country Re po rtN igerial PRA
WorkingpaperNo.21
Barnett. Tony and Piers B. (1994 ).AIDS in Africa: Irs Present and Future Impact. England:
John Wiley and Sons Ltd.
Bekibinga A. (2006), the eHect of investors on firm performance
84

Bhagwati, J. and Srinivas,m. T. N. (2002) Trade and Poverty. American Economic Review
Papers and Proceedings May.
Bird and, Richard M. and Enid S. (2004 ).International Handbook of Land and Property
Taxation. Cheltenham, U.K. and Northampton, Mass.: Edward Elgar.
Bird, M. (2002). Tax Policy and Economic Development. Baltimore and London:
Borensztein, E. (1990) Debt Overhang, Credit Rationing and Investment. Journal of
Development Economics. 32, p.315-335.
Boyatzis,R.E.(2008),Competenciesinthe21 stcentury,Journaloflvfanagement
Development.Vo 1.2 7No .1.2008. pp.5-12.EmeraldGroupPub lishingLimitecl0262- l 711.
Cantwell, J. (1997) Globalization and Development in Africa.In Dunning, J. and I-Iamdani,
K.The New Globalism and Developing Countries.UNO Press.
Chan, K.1-L Chow. L.. (2007). International transfer pricing for business operations in
Chen, \V .. (2011 ). The effect of investor origin on firm performance: Domestic and
China: inducements. regulation. and practice. Journal of Business Finance and
Accounting 24 (9 & 10). 1269-1289.
Collier P. (2010). The Political Economy of Natural Resources, social research Vol77 :
Collier, P. and Patillo. C. (1999), Reducing the Risk ofinvestment in Africa. Mcmillan.
Cucc ia,A. (2 004 ). Theeconom icso ftaxco mp! iance :whatclO\vekno\~/and\Vhere
85

dowego?Joumalofaccountingliterature13 :81-116.
Estimatingtheimpactsoftaxpolicy ,enforcement,andIRSresponsiveness(Publication 1916,R
ev .11-96). Washington,DC :lnternalRevenueService.
Fjeldstad, 0. and Moore.M. (2009.) "Revenue authorities and public authority in sub-
foreign investment in the United States. Journal of International Economics 83 (2), 219-
228.
Gastanaga, V.M., Jeffery, B.N. and Bistra, P. (1998) Host Country Reforms and Foreign
Direct investment Inflows: How Much Difference Do They Make? World
Development, 26(7), p.1299-314.
Gatt (2011 b ). Trade Policy Review - Ghana, Volume I. Report. Geneva.
Globalization I - Trade Reform, Development Policy Review, Vol. 28, No. 5, pp. 553-
571, September 2010
Government in East Asian Industrialization.Princeton, NJ. Princeton University Press.
Greta G. (2007) Capital market Operation and the challenges. Emerald publishing company.
Hanson. G.H. (2001) Should Countries Promote Foreign Direct investment?G-24 Discussion
Paper 9.
International Review."Public Budgeting & Finance, 27( 1 ). pp. 41-68.
Keen & Mansour (20 I 0). Revenue Mobilization in Sub-Saharan Africa: Challenges from
86
I I
I I

Lall, S. (2004) Is African Industry Competing? QEH Working Paper 121, Oxford: Queen
Elizabeth House.
Logue, D. (2009). Moving policy forward: brain drain' as a wicked problem. Globalisation,
Societies & Education 7, no. 1: 41-50. Academic Search Premier, EBSCOhost. Retrieved
February 18, 2014.
Mikese!L John L.( 2007). "Developing Options for the Administration of Local Taxes: An
Moesen, W., A. and Persoon. 2002. --Measuring and explaining the productive efficiency
Morrisset J. (2000) Foreign Direct Investment in Africa: Policies Also Matter. Transnational
Corporations. 9(2 ). p. l 07-125.
Mudugu et al (2012), flow of FDI in developing countries
Ngowi. H.P. ( 2001) Can Africa Increase Its Global Share of Foreign Direct Investment? West
Africa Review 2(2).
No 4: Winter 2010.
of tax offi:ces: a non-parametric best practice frontier approach.··
TijclschrilhoorEconomie en Management 3. p. 399-416.
Plumley,A.H.(2006).Thecleterrninantsofinclividualincornetaxcompliance:
87

Romer, P.M. (2009). TYvo strategies for economic development: Using ideas and producing
ideas. Proceedings of the World Bank Conference on Development EconDmics.
Washington, DC, World Bank.
Sachs, J.D. (2004) Ending Africa's Poverty Trap.Brookings Papers on Economic Activity, 1,
p.117-240.
Saharan Africa. "The Journal of Modern African Studies, 4 7: 1. pp. 1.
Slemrod, J. (2000) •'Optimal Tax Theory and Optimal tax Systems," Journal of Economic
Perspectives, Vol.4, No. 1, pp. 157-178. (Winter).
Snowdon, B. (2005) A Global Compact To End Poverty: Jeffery Sachs on Stabilisation,
Transition, and \\1eapons of Mass Destruction. World Economics, 6(4 ).
The Johns Hopkins University Press.
United Nations Conference Trade and Development (2005) Economic Development of
Africa: Rethinking the Role of Foreign Direct Investment. New York and Geneva.
\Vade. R. (2010). Governing the Market - Economic Theory and the Role of
88

APPENDICES
APPENDIX 1 A: TRN'iSMITTAL LETTER
OFFICE OF THE DEPUTY VICE CHANCELLOR (DVC)
COLLEGE OF HIGHER DEGREES AND RESEARCH (CHOR)
KAMPALA INTERNATIONAL UNIVERSITY
Ggaba Road-Kansanga. P.O. Box 20000, Kampala, Uganda. Tel: +256-414-266813, +256-41-267634 Fax: +256-414-501974.Cel:+256-706-251084 E-mail: [email protected], Website: www.kiu.ac.ug
"'OFFTCE-6rTFn:~1n:;oJj tiif D"EPARTM!::tfr;·1:coR«:>Mics;-i:n)sfNESS Ai\!D f•lAMAGEMENT SCIENCES
COLLEGE OF HIGHER DEGREES AND RESEARCH
Apri!, 08, 2014.
'.H'HRODUCTION LETTER FOR DANlADI KAMAL MOHAMMED REG.NO.
MEC/41616/133/DF TO CONDUCT RESEARCH IN YOUR ORRGANISATION
The above mentioned candidate is a bonafide student of Kampala international
Ur 1versity pursuing a Masters' of Arts in Economics.
H i is currently conducting a field research for his dissertation entitled "Taxi Policy ancl
fcreign Direct Investment in ,(mm State Nigeria."
Your organization has been identified as valuable source of information pertaining to
his research project. The purpose of tl,is letter then is to request you to avail him with
peitinent information lle may need.
Any information sl1ared with hirn •· :1 be used for academic purposes only and shall be
kept with utmost confidentiality.
Any assistance rendered to hfm w1H be ilighly appreciated.
Yours truly,
Dr. Edris s. !<asenene
Deputy Prindpai, CHOR.
"Expiodng J-!eights"
89
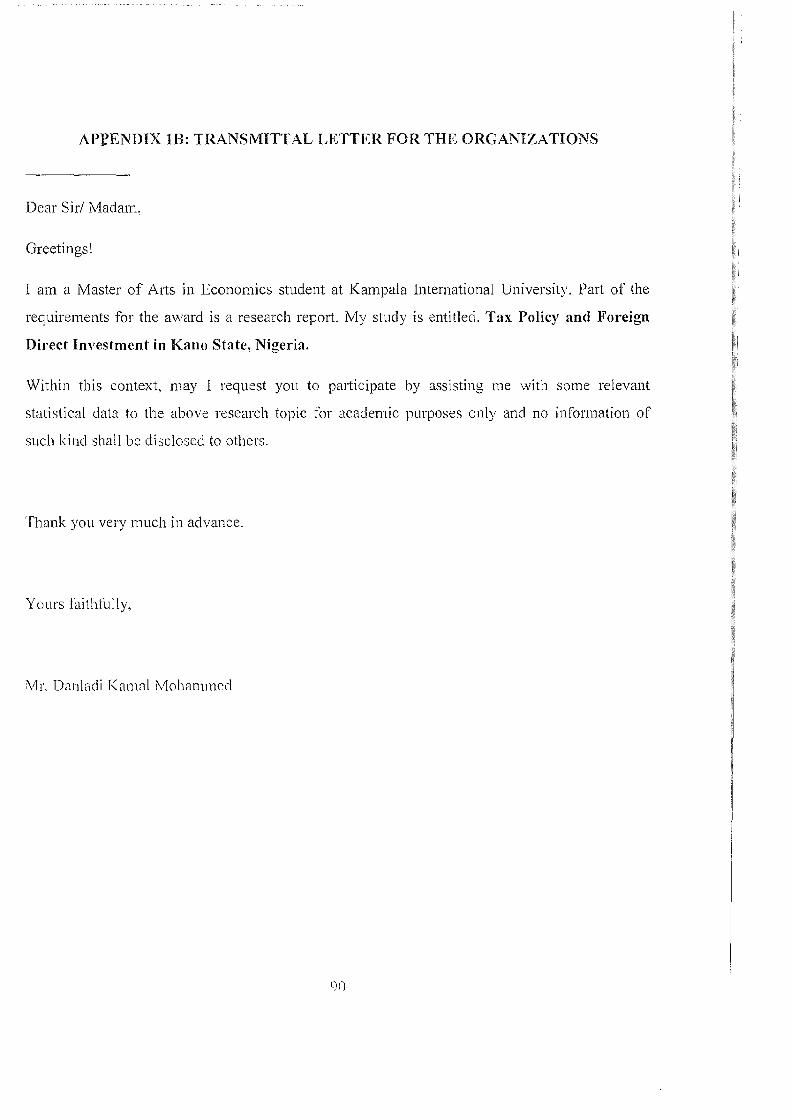
AP}!ENDIX 1B: TRANSMITTAL LETTER FOR THE ORGANIZATIONS
Dear Sir/ Madam,
Greetings!
I am a Master of Arts in Economics student at Kampala International University. Pa1i of the
requirements for the award is a research report. My study is entitled, Tax Policy and Foreign
Direct Investment in Kano State, Nigeria.
Within this context, may I request you to participate by assisting me \Vith some relevant
statistical data to the above research topic for academic purposes only and no information of
such kind shall be disclosed to others.
Thank you very much in advance.
Yours faithfully,
Mr. Danladi Kamal rvlohammed
90

APPENDIX II: CLEARANCE FROM ETHICS COMMITTEE
. .:. ' ~
91
'.:::<:·, • -- 2009
i'eo•,,:·.:s':,i 'sce1,::t
RDGB!f:::-"',
Rcc-:.:,r•'
',, 'f'?:':
.. 1-/·I 2,D,
L
Debit Credit
us:; 7;::.s oo
US$ 335 00 USS •i ,085.00 US$ ·I ,NJ5 00
USS 335,00
.J~r o./_i ::-:: Js.:. -,- i} ~~J
l;:o'.i L; 00
US':'> 1,835.00 USS 1,335.00

APPENDIX III: INFORMED CONSENT
I am giving my consent to be part of the research study of Mr. Danladi Kamal Mohammed that
will focus on Tax Policy and Foreign Direct Investment in Kano State, Nigeria.
I shall be assured of privacy, anonymity and confidentiality and that I will be given the option to
refuse pai1icipation and right to withdraw my participation anytime.
I have been informed that the research is voluntary and that the results will be given to me if I
ask for it.
Initials: --------------
Date ---------------
92

APPENDIX VI: TIME FRAME FOR RESEARCH PROJECT
ACTIVITY
Months
Proposal writing
Proposal Editing
Data collection
Data Anangement
Data analysis and
presentation
Editing
submission
Defense
and final
DURATION
Jan.2015 Feb,2015 Mar,2015 APril,2015
93

APPENDIX VII: RESEARCH BUDGET
Particular Quantity AmountN
Stationary Paper 7 Reams
Ink 1 Cartridge 6000
Binding materials 7
Research Assistants 3@ 100,000 12,000
Transport costs l 0,000
Data Analysis 6,000
Up keep 5,000
Miscellaneous 6,000
Total 45,000N
94

APPENDIX VIII: RESEARCHER'S CURRICULUM VITAE
PERSONAL PROFILE
Danladi Kamal Mohammed
Male
Nigerian
Name
Gender
Nationality
Contact 0755381270 (Uganda) +2568037465689 (Nigeria)
EDUCATIONAL BACKGROUND
Institution
Kampala International University
(Uganda)
Award
Masters ofa1is in Economics
Masters in financial Economics
Year
1nv1ew
University of Abuja (Nigeria)
Bayaro University Kano Nigeria
AhmacluBallo University Zaria
Jigawa State College of education
(Gumel)
Masters in Treasury Management
BAED Economics
2000-2013
2007-2009
1989-1992
1984-1987 NCE Mathematics/Economics
GovtSecondarySchool Ringim Senior Secondary Certificate
SabonGarinYaya primary School Primary School Certificate
WORK EXPEREINCE
Classroom teacher
Ministry if education Kano state Nigeria
Classroom teacher
ivtinistry of educntionJig,l\\aState Nigerin
C !ass room tench er
Jigawa state college of education Gurne\ Nigeria
Lecturing
95
1977-1983
1970-1977
l 987-1989
1992-1993
1994-clate
OTHER RELEVANT DAT A
Class teacher
House master
Kitchen master
Head of Department Economics
COE Gumal Nigeria
LANGUAGE PROFICIENCY
LANGUAGE
English
Hausa
REFEREES
Dr. UmmaAbdulwaheed
Director school of remedial
Studies SuleLamido
UniversityKafin Hausa
Dr. DahiruAbdulkadir
WRITTEN
Very good
Excellent
Provost Jigawa College of education Gumel
Dr. Yalwa Mohammed
Department o t' economics
University of Abuja
Dr. A bugalsac
Kampala International University
Prof essorDezi
Kampala International University
96
1987-1989
2000-2006
SPOKEN
very good
Excellent

APPENDIX IX: TREND OF FDI NET INFLOWS TO NIGERIA 1984-2014 (US$)
Year - FDI Inflow (US$) 1984 115,164,785 1985 485,581,321 1986 193,214,908 1987 610,552,091 1988 378,667,098 1989 4,692,249,739 1990 485,581,321 1991 193,214,908 1992 610,552,091 1993 378,667,098 1994 1,884,249,739 1995 1,079,271,551 1996 1,593,459,222 1997 1,539,445,718 1998 1,051,326,217 1999 1,004.916,719 2000 1,140,137,660 2001 L 190,632,024 2002 1,874,042,130 2003 2,005,390,033 2004 1,874,033,035 2005 4,982,533,943 2006 4,854,416,867 2007 6,034.971,231 2008 8,196,606.673 2009 8,554,840.769 2010 6,048,560,266 2011 8,841,952,775 2012 7.101.031.884 2013 5.609,000.000 2014 4.808.400.000
Source: ·world Bank (2015); Central Bank of Nigeria (2014)
97

....... -{;A-
~ -~ .Q I.I-
i5 1-1
r:2
Jrend of FDI Inflow in Niger,a in th~ period 1984 to 2014
9500000000 9000000000 8500000000 8000000000 7500000000 7000000000 6500000000 6000000000 5500000000 5000000000 4500000000 4000000000 3500000000 3000000000 2500000000 2000000000 1500000000
7-r-r4-7-r-r4-7-r-r1-1-,-r,-1-T-r,-4-T-r-r4-T-r-r4-T-T l_L_LJ_l_L_LJ_l_L_LJ_J_l_LJ_J_l_LJ_J_l_L_LJ_l_L_LJ_l_l I I I I I I I I I I I I I I I I I I I I I I I I I I 1 I I I +-~-h~-+-L-h~-+-~-h~-4-+-h~-4-+-h~-~-+-~-h~- -L ~-+-+ I I I I I I I I I I I I I I I I I I I I I I I I I I I I I I T-r-r4-T-,-r4-7-r-r,-1-T-r1-1-,-r1-4-T-,-r - -r 4-T-r I I I I I I I I I I I I I I I I I I I I I I I I I I I I I I I T-r-r7_T_r-r7-T-r-r7-,-T-r7-,-T-r7_7_T_r_r -Tr r -T-T +-L-h~-+-~-h~-+-L-h~-4-+-h~-4-+-h~-~-+-~- ~-+ -h +-+ I I I I I I I I I I I I I I I I I I I I I I I I I I I I I I I +-r-r7-+-r-r7-+-r-r7- ➔ -+-r7-➔-+-r7-7-+-r- 7-+- -r7 +-+ I I I I I I I I I I I I I I I I I I I I I I I I I I I I I T-r-,-7-T_f_1_7_T_r_r-,-,-T-r-,-,-T-r-,-7-T-r-· 7-T-" -,-7- -y i_L_LJ_i_L_LJ_i_L_L~-~-L-L~_i_L_L~_J_i_L LJ_i_L_L~- _L I I I I I I I I I I I I I 1 I I I I I I I I I I I I I I I I I +-~-~~-+-~-~~-+-~-~~- ➔ -+-~~- ➔ -+-~~-~- - -~~-+-~-~~-+ I I I I I I I I I I I I I I I I I I I I I I I I I I I T-,-r7_T_ -r7-T-,-r7-,-T-r7-,-T-r7-7- -,-r7-T-,-r7-T-T l_L_LJ_l __ LJ_l_L_LJ_J_l_LJ_J_l_LJ_J_l_L_LJ_l_L_LJ_l_l I I I I I I I I I I I I I I I I I I I I I I I I I I I I I I I +-~-~~-+ -~~-+-~-~~- ➔ -+-~~- ➔ -+-~~-~ +-~-~4-+-~-~4-+-+ I I I I I I I I I I I I I I I I I I I I I I I I I I I I I I I T-,-r4-, ,-r4-,-r-r1-1-;-r,-1-,-r1-4 7-r-r4-T-,-r4_T_T l_L_LJ_l L LJ_l_L_LJ_J_l_LJ_J_l_LJ_J l_L_LJ_l_L_LJ_l_l I I I I I I I I I I I I I I I I I I I I I I I I I I I I I I +-~-h~-+ ~ h~-+-~- ~-4-+-h~-4-+- -+-~-h~-+-L-h~-+-+ I I I I I I I I I I I I I I I I I I I I I I I I I ;-;-r4-T-, r4-T-, n-. "-r1-,-; r,-4-T-,-r7-T-,-r4-T-T I I I I I I I I I I I I I . I I I I I I I I I I I I I T-r-r7- -r -7-T-r r ,-r- -r-r7-7-T-r-r7-T-r-r7_T_T +- -h -L ~- -h~-4-+-h~-4-+-h~-~-+-L-h~-+-L-h~-+-L
I I I I I I I I I I I I I I I I I I I I 1 I I I -r- 7-+-r-r -+-r-r7- ➔ -+-r7- ➔ -+-r7-7-+-r-r7-+-r-r7-+-+
0*0~0~~qj).f:!0;;::f?~~~oJ-,0~* ~6?0d?$~~6/!v&~~<S-,,f)0,f)r:S-,ff9,f)~&\~#~"~1)v,f)◊~~ Year
Source: \Vorld Bank (2015); Central Bank of Nigeria (201.t)
98

APPENDIX X: NIGERIA'S GDP GROWTH (1984-2014)
Year GDP, bin. US Dollars GDP per capita, dollars GDP Growth Rate Current Prices
1984 180.2 2204 -1.2 1985 178.8 2131 11.3 1986 90.4 1050 1.9 1987 55.8 631 -0.79 1988 67 738 7.7 1989 60.5 650 7.1 1990 68.3 715 11.4 1991 64 652 0 1992 58.1 577 2.7 1993 56.7 549 1.6 1994 47 445 0.79 1995 49 452 2.1 1996 52 468 4 1997 54.4 477 2.9 1998 56.5 484 2.9 1999 57.7 481 0.35 2000 74.6 607 5.4 2001 71 563 4.4 2002 95.1 736 21.4 2003 108.8 821 10.2 2004 141.3 1039 10.5 2005 180.5 1293 6.5 2006 233.9 1632 6 2007 267.7 1819 6.5 2008 334.6 2213 6.3 2009 272.5 1754 6.9 2010 369. l 2311 7.9 2011 411.7 2508 4.8 2012 461 2730 4.3 2013 515 2966 5.3 2014 522.6 1097.97 6.8
Source: vVorld Bank (2015); Central Bank of Nigeria (2014)
99

Trend of GDP of Nigeria in the period 1984 to 2014
540
480
420 !I) I-
.m 360
B 300
~ C: 240 :s
Q.. .. 180 s 120
60
~~#$~~ff~~$$0j~~~~~~~~#~~~~fi&~~~,d' ~ ~or~ ~''v9~ ~'~ 'v~'~ '9'v'v v~ ~~-v ~~ ~~~ ·v v~ ~ ~ ~-v
Year
Source: ·world Bank (2015); Central Bank of Nigeria (2014)
100

APPENDIX XI: TAX RATE IN NIGERIA 1984 - 2014
Year - Tax rate(%) 1984 35 1985 35 1986 35 1987 35 1988 35 1989 35 1990 30 1991 30 1992 30 1993 30 1994 30 1995 30 1996 30 1997 30 1998 30 1999 31.4 2000 31.4 2001 31.4 2002 31.4 2003 31.4 2004 31.4 2005 31.4 2006 32.2 2007 32.2 2008 32.2 2009 '"'?? .) ___
2010 "?? .) ___
2011 32.6 2012 33.8 2013 33.8 2014 33.8
Source: 'World Bank (2015); Central Bank of Nigeria (2014)
l 01

35.6
35.2
34.8
34.4
34.0
...... 33.6 ~ 0 33.2 '-" (!,J 32.8 ... !ti i.. 32.4 >< {J. 32.0
31.6
31.2
30.8
30.4
30.0
Trend of Tax Rate in Nigeria in the period 1984 to 2014
T-T-T-,-,-,-,4-7-,-1-T-T-,-,-,-,-,4-,-;-;-T-,-,-,-,-,4-4-,I I I I I I I 1 I I 1 I 1 1 I I I I I I I I I I I I I I I I I +-+-+-~-~-~-~4-4-4-4-+-+-+-~-~-~-~4-4-4-4-+-+-~-~-~-~4-4-4-
I I l I l I I I I I I I I I I I I I I I I I I I I - _ -L- - _L~_J_J_J_i_L_L_L_L_L_L~_J_J_J_i_L_L_L_L_LJ_J_J_
I l I I I 1 I I I I 1 I I l I l l l I I I I I I I I I I 1 I I l I I I I I I I I I I I I I I 1 1 I I I I I I I I I I I I I T_T_T_r_r_ -r7-7-7-,-T_T_T_r-r-r-r,-7-,-,-T-T-r-r-r-r,-,-,-1 I I I I l I l I I I I I I I I I l I I I I I l I l I I I I I +-+-+-r-r- -r7-7-7- ➔-+-+-+-r-r-r-r7-7-➔-➔-+-+-r-r-r-r7-7-7-1 I I I I I I I I I I I I I I I I I I I I I I I I I I I 4-4-L-~-~- -~~-~-~-4-4-L-L-~-~-~-~~-~-4-4-4-L-~-~-~-~ -~-~I I I I I I I I I I l I l I I I I I 1 I I I I I I I I I I I I i_i_L_L_L _ _ LJ_J_J_J_i_L_L_L_L_L_LJ_J_J_J_i_L_L_L_L_LJ_J_J_ I I I l I I I I I I I I I I I I I I I I I I I I 1 I I I I I I I I I I I I I I I l I I I I I I I 1 I I I I I I I I I I I I I T-T-r-r-r-r-r7-7-7-,-T-r-r-r-r-r-r7-7-,-,-T-r-r-r-r- 7-7-7-1 I I I I I I I l I I I I I I I I I I I I I I I I I I I I I +-+-+-~-~-~ ~4-4-4-4-+-+-+-~-~-~-~4-4-4-4-+-+-~-~-h ~4-4-4-1 I I I I I I l l I l I l I I I I I I I I I -----~ I I I I i_i_L_L_L_L LJ_J_J_J_i_L_L_L_L_L_LJ_J_J_J_~_L_L_L_L-LJ_J_J_ 1 I I I I I I I I I I I I I I I 1 I I I I I I I I I 1 I I I I I I I I I I I I I I I I 1 1 I I I I I I I I I I I I I 1 I l I T_T_T_r-r-r r7-7-,-,-T_T_T_r_ ----,- - - T-T-r-r-r-r,-,-,-1 1 I I I I I I I I I I I I I I I I I I I I I I T-T-,-,-,-, ,4-,-,-1-T-,-T-, ,-,-,4-,-1-1-1-T-,-,-,-,4-,-,I I I I I I l 1 I I 1 I I I I I 1 l I I I I I I I I I I I I l +-+-+-~-~-~ ~4-4-4-4-+-+-+-~ ~-~-~4-4-4-4-+-+-~-~-~-~4-4-4-l I I I I I I I I I I I I I 1 I I I I I I I I I I I I I I I I i_i_L_L_L_L _J_~_J_J_i_L_L_ -L-L-LJ-~_J_J_i_L_L_L_L_LJ_J_J_ I I I I I I I l I I 1 I I I I I I I I I I I I I I 1 I I I I I I I I I I ~~-►•~-►♦~-• ! 1 I I I 1 I I I I I I I I I I T-T-r-r-r-r -r-r-r7-7-,-,-T-r-r-r-r-r7-7-7-
~~~~~~~~w~~~~~~~~~~~~~~~~~~~0~ ~◊◊~~◊◊~~-◊◊~-~◊◊~~~~~~~~~~~~~~~~
Year
Source: World Bank (2015); Central Bank of Nigeria (2014)
102

Appendix XII: Tax Incentives in Nigeria from 1984 to 2014
Year Tax Incentives(%) 1984 6.7 1985 6.7 1986 6.7 1987 6.7 1988 7.5 1989 7.5 1990 7.5 1991 7.5 1992 7.5 1993 7.5 1994 7.5 1995 7.5 1996 11.0
1997 11.0
1998 11.0
1999 30.8 2000 30.8 2001 30.8 2002 30.8 2003 30.8 2004 30.8 2005 30.8 2006 31.6 2007 31.6 2008 31.6 2009 31.6 2010 31.6 2011 32.1 2012 32.5 2013 32.7 2014 32.7
Source: \Vorld Bank (2015); Central Bank of Nigeria (2014)
103

33
30
27 'o' ~ 24 VI (l)
-~ 21 .., C:
/3 18 iS X 15 ~
12
Trend of Tax Incentives in Nigeria in the period 1984 to 2014
_,2i32·- . 30.830.810.830. 8l0. Sl0.810,g3LSl.6ll. 6ll.6l1. tr .
11.CU.D.1 0
9- 7.57.57.57.57.57.57.57."'
6 6.7 6.7 6.7 6.7
'~~~@~W~~0~~~~~~&N&&~~~~~&~y~◊~ ~~~~~~~~~~~~~~~~~~~~~~~~~~~~~~
Year
Source: World Bank (2015); Central Bank of Nigeria (2014)
104

APPENDIX XIII: SUMMARY OF ALL VARIABLES EXERCISED IN THIS STUDY
:riable Explanation - Unit Source
,pendent
lriable:
)1 Inflow Net foreign investment to Nigeria US$ World Development
Indicator
dependent
triable:
1x Incentives The presence or absence of Tax Incentive (TI) Dummy Nigeria's Regulation
Provision in the tax policy represented by: Variable (Tax Policy)
l for presence of TI
0 for absence of TI
LX Rate Highest Statutory tax rate according to Nigeria's % Nigeria's Regulation
Tax Policy (Tax Policy)
DP Growth GDP Grmvth as percentage increase or decrease % World Development
of Nigeria's Indicator
Source: Federal Office of Statistics
105