
The European Council Decisions Related to Turkey's Accession to the EU: Interests vs. Norms

12 May 2015, 16th International Academic Conference, Amsterdam ISBN 978-80-87927-09-0 , IISES
SAVAŞ ÇEVIKSelcuk University, Faculty of Economics and Administrative Sciences, Department of Economics, Turkey
MEHMET OKAN TAŞARSelcuk University, Faculty of Economics and Administrative Sciences, Department of Economics, Turkey
THE IMPACT OF DOUBLE TAX TREATIES ON FOREIGN DIRECTINVESTMENTS: EVIDENCE FROM TURKEY’S OUTWARD FDIS
Abstract:Double tax treaties (DTT) are mainly signed to overcome the problem of international doubletaxation and to coordinate national tax systems in bilateral or multilateral economic interactions.However, one more reason to engage in DTTs is to facilitate international economic flows forcapital especially and to attract foreign capital. To increase foreign direct investment (FDI) is adesirable policy goal for both developing and developed countries. In order to examine whetherDDTs have significant impact on FDIs, this paper analyzes Turkey’s outward FDI stocks to 71 hostcountries over the period of 2001-2012.In analyses, we use Turkey’s FDI stock toward the host countries as dependent variable. In additiona number of control variables, we analyze the impact of a dummy of presence of DTTs and the ageof treaty. As the estimation technique, we mainly use fixed effect estimators and regressions withpanel-corrected standard errors (PCSE) to handle heteroskedasticity and autocorrelation, in additionto some other specifications for robustness aims. After controlling for various determinants ofbilateral FDI stocks, the study’s results show that DTTs are indeed positively associated with foreigninvestment toward the host country from Turkey. This finding supports policy considerations on theimpact of DTTs on FDIs. The results hold for various of specifications.
Keywords:double tax treaties, foreign direct investments, international double taxation
JEL Classification: H87, F21, H25
120http://www.iises.net/proceedings/16th-international-academic-conference-amsterdam/front-page

1. Introduction
Foreign direct investments are not only seen to play vital role in economic performance of
developing countries especially but also become increasingly more important in word
economy. It is widely accepted by policy-makers and scholars that tax treatment of both
host and home country to investments and their returns may have influence on FDI
activities. In order to attract foreign investments and to facilitate cross-border activities,
countries sign bilateral double tax treaties (DTT). Today the world is covered by a network
of bilateral tax treaties consist of a few thousands. DTTs are considered to overcome two
important problems of international taxation: ‘double taxation’ conventionally and fiscal
evasion recently. If DTTs eliminate double taxation and uncertainty in interactions between
national tax systems, one expects that introducing a DTT would have positive effect the
economic activities between treaty partners. This paper focuses on the impact of DTTs on
FDI activities.
It is widely accepted that since a DTT reduces tax barriers to capital flows, it can expect
that FDI activity would rise after a treaty is enforced. In spite of the general consensus of
the view that tax treaties would increase FDI activity between their signatories, there are
some legal and economic arguments against that. On the other hand, the empirical findings
on the impact of DTTs do not present consistent results. Some studies report negative
and/or statistically insignificant impact, some other publish positive coefficient on the DTT
variables. Furthermore, studies are based on mostly developed countries. We seek to
contribute to literature by examining Turkey’s DTT and outward FDI. To our knowledge,
this is the first time the relationship between Turkey’s DTTs and FDI activity is analyzed.
For this purpose, we employ a panel data of 71 host countries over 2001-2012, based on
Turkish FDI abroad. At various specifications, we find positive impact of DTTs on FDI
outward stocks.
The paper is organized as following. In next section, we review the DTTs’ developments
and functions. Later on, we present an overview of Turkey’s DTT network and FDI activities
to show the study’s motivation. Section 4 reviews the literature on the impact on DTTs on
foreign direct investments. After we introduce data, variables and estimation technique
employed in empirical analyses in Section 5, it is presented the results in Section 6. Final
section concludes.
2. Double Tax Treaties: An Overview
The cross-border economic activities poses two important problems on traditional national
power to tax: overlapping national claims to tax that cause double taxation and possibilities
of tax evasion. These two problems require international cooperation between national
authorities (Rixen, 2008, p. 1). International cooperation on tax issues has governed by
bilateral tax agreements which generally follow model conventions developed by OECD
and United Nations (UN). Multilateral cooperation on international tax issues has quite
limited.
12 May 2015, 16th International Academic Conference, Amsterdam ISBN 978-80-87927-09-0 , IISES
121http://www.iises.net/proceedings/16th-international-academic-conference-amsterdam/front-page
Initial and main function of double tax treaties, broadly stated, has been to eliminate the
problem of double taxation and thus, to facilitate cross-border capital and trade movements
(Arnold and McIntyre, 2002, p. 105), although in the last quarter of twentieth century, the
issue of international tax evasion has become more urgent in international tax agenda.
Bilateral DTTs are considered to contribute worldwide efficiency in allocating the capital by
eliminating double taxation with respect to allocate taxing rights between two jurisdictions
(actually between residence country and source country). Thus, there are two operational
objectives of tax treaties as eliminating double taxation and combating fiscal evasion, and
thereby functioning to facilitate investment and trade worldwide. Aside from these
objectives, some ancillary objectives such as eliminating of discrimination against foreign
nationals and non-residents, the exchange of information1 between contracting states, and
providing a mechanism for resolving disputes arising from the interactions of tax systems
of contracting states (Arnold and McIntyre, 2002, p. 106) by regulating the mutual
agreement procedure.
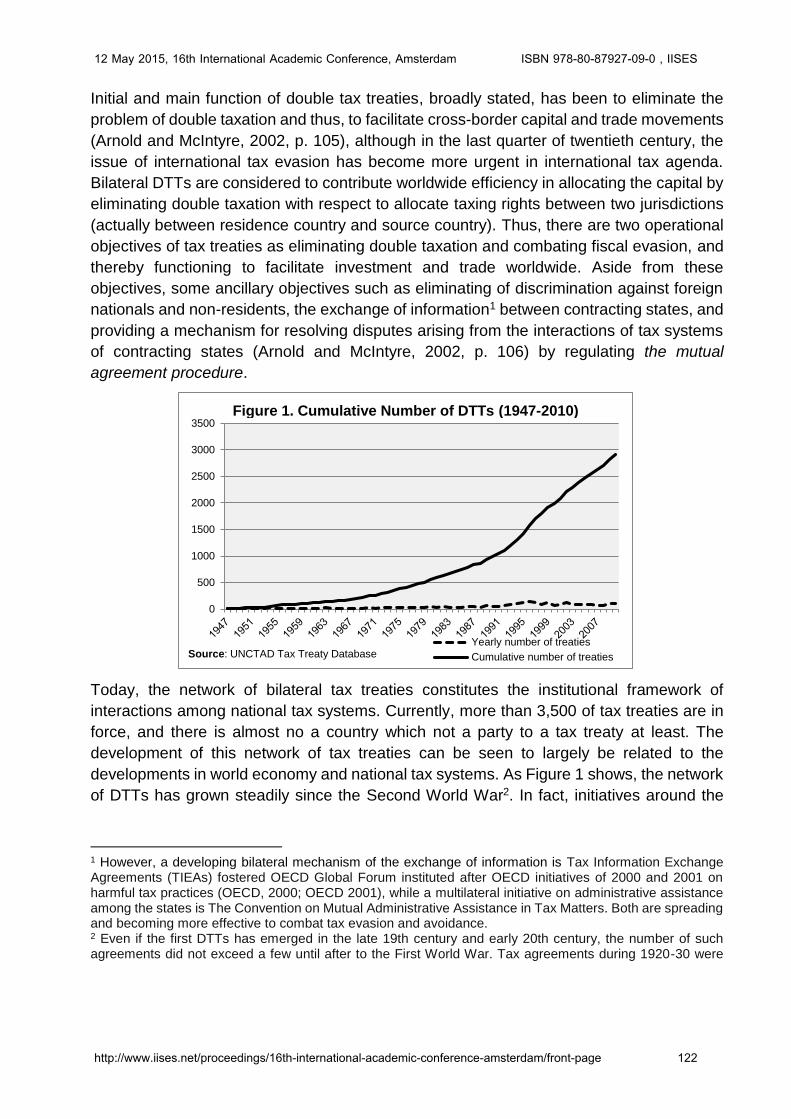
Today, the network of bilateral tax treaties constitutes the institutional framework of
interactions among national tax systems. Currently, more than 3,500 of tax treaties are in
force, and there is almost no a country which not a party to a tax treaty at least. The
development of this network of tax treaties can be seen to largely be related to the
developments in world economy and national tax systems. As Figure 1 shows, the network
of DTTs has grown steadily since the Second World War2. In fact, initiatives around the
1 However, a developing bilateral mechanism of the exchange of information is Tax Information Exchange Agreements (TIEAs) fostered OECD Global Forum instituted after OECD initiatives of 2000 and 2001 on harmful tax practices (OECD, 2000; OECD 2001), while a multilateral initiative on administrative assistance among the states is The Convention on Mutual Administrative Assistance in Tax Matters. Both are spreading and becoming more effective to combat tax evasion and avoidance. 2 Even if the first DTTs has emerged in the late 19th century and early 20th century, the number of such agreements did not exceed a few until after to the First World War. Tax agreements during 1920-30 were
0
500
1000
1500
2000
2500
3000
3500
Yearly number of treaties
Cumulative number of treatiesSource: UNCTAD Tax Treaty Database
Figure 1. Cumulative Number of DTTs (1947-2010)
12 May 2015, 16th International Academic Conference, Amsterdam ISBN 978-80-87927-09-0 , IISES
122http://www.iises.net/proceedings/16th-international-academic-conference-amsterdam/front-page

League of Nations after First World War in which they culminated in model conventions in
1943 and 1946 have important role in expansion of the treaty network (Arnold and McIntyre,
2002, p. 107). In consequence of two world wars and Great Depression of 1929, it has not
been a significant movement in the international capital and financial movements until the
end of The Second World War. After the War, international capital flows and the activities
of multinational corporations increased quite rapidly despite of temporary slowdown the oil
crisis of the mid-1970s. Beginning the 1960s and particularly 1980, by another wave of
globalization, while capital controls were liberalized, the network of DTTs has also
continued to expand (Rixen, 2008, p. 108).
Other accelerators of expanding of treaty network have been the independency of colonies
of developed European countries and advancements in communication and transportation
technologies. While initial agreements were naturally among developed countries, after the
Second World War, both the rising of new and independent developing countries,
increasing in capital and trade movements have facilitated international interactions on tax
issues around the League of Nations and thereafter United Nations and OECD (Cevik,
2013, p.111). Thus, as seen from Figure 2, tax treaties between developed and developing
countries have expanded from the period concerned.
Another factor which fosters efforts to make agreements between developed and
developing countries is the participation of transition economies in international economic
and political network after the collapse of Soviet Union in 1990s. As Figure 2 displays, in
this period, the treaties between not only developed and developing countries but also
among developing countries has greatly increased.
mainly a regional phenomenon and were limited to the taxation of a few matters such as railways, inheritance and traveling salesmen (McIntyre, 2005, p. 1; UNCTAD 2000, p. 22; Seligman 1928, 37-47).
0
20
40
60
80
100
120
140
160
Developed-Developed
Developing - Developed
Developing-Developing
Figure 2. The Number of DTTs by Country Groups (1947-2010)
Source: UNCTAD Tax Treaty Database
12 May 2015, 16th International Academic Conference, Amsterdam ISBN 978-80-87927-09-0 , IISES
123http://www.iises.net/proceedings/16th-international-academic-conference-amsterdam/front-page

3. The Treaty Network and FDI Profile of Turkey
Since initiatives around UN, Turkey has actively joined in the process of international tax
governance in a manner of representing the perspective of developing countries. However,
the first double tax treaty was signed at 1970 with Austria. Thenceforth, Turkey’s network
of DTT has expanded and currently, Turkey is one of the developing countries which signed
the most agreements with 80 DTTs (for full list, see Appendix B). As seen from Figure 3
that presents yearly number of DTTS signed by Turkey, Turkey has actually participated in
worldwide treaty network after 1980s when is Turkey’s liberalization period. Also, after
1990s, Turkey has signed a series agreement with transition economies of Central/East
Europe and Central Asia.
Figure 4 displays country groups which are tax treaty partner of Turkey. The most important
partners of Turkey are European countries, transition economies and countries from the
Middle East-North Africa (MENA). Turkey has a DTT with almost all of EU and EFTA
members, with a few exceptions. Although MENA countries that is Turkey’s near neighbors
do not have an important share in Turkey’s outward FDI stock, almost all of them have a
DTT with Turkey.
Considering together Figure 4 and Figure 5, it can be seen that a tendency of making a tax
agreement is closely linked to Turkish FDI stocks toward partner country. Turkey’s outward
FDI stocks partners are mostly European countries and transition economies of Central
Asia - East Europe, even though the over half of total FDI stocks intensify in a few countries
such as Netherland, Azerbaijan, Malta and Germany.
Actually, until 1990s, the abroad investments of Turkish firms have been quite limited to a
few sectors such as banking, construction and travel-tourism agencies, and a few firms
(the number of firms who invest abroad is only 80 in 1988 and some of them was public
enterprises).
0
1
2
3
4
5
6
7
8
9
Figure 3. The Number of Treaties Signed by Turkey
12 May 2015, 16th International Academic Conference, Amsterdam ISBN 978-80-87927-09-0 , IISES
124http://www.iises.net/proceedings/16th-international-academic-conference-amsterdam/front-page

By liberalizing of foreign exchange regime and developing of incentive measures in 1989
and collapsing of Soviet Union in same period, Turkish outflows of FDI has started to
increase in volume and to diversify with respect to country, the number of firms (more than
3000) and sector such as energy, telecommunication, services and manufacturing (Yavan,
2012). Eventually, during 2000s, the increasing was doubled in terms of FDI stocks as seen
from Figure 5, despite of declining in the period of global crisis.
Today, according to World Investment Report of UNCTAD (2014), in 2013, Turkey ranked
45th with 32.782 million $ in the world in terms of FDI outward stocks and 33th with 145.467
million $ in terms of FDI inward stocks. In terms of the percentage of gross domestic
product, outward FDI of Turkey as is 4%, while inward FDI is 17.6%.
Despite of the importance increasing of Turkey’s FDI movements toward foreign markets,
the issue was rarely exclusively examined. Among these, Erdilek (2003), Culpan and
Africa; 3 Americas; 3
South/East Asia; 12
Transition countries of Europe and
Central Asia; 16
MENA; 17
Europe (members of EU and EFTA); 29
Figure 4. Turkey's DTTs by Regions
Source: TRA
Other countries;
3,16%Africa; 1,10%
Latin America and the
Caribbean; 3,77%
Asia; 5,05%
North America;
6,45%
Transition economies; 25,22%
Europe (developed); 55,26%
Figure 5. Turkey's Outward FDI Stocks (2012)
Source: UNCTAD
0
5
10
15
20
25
30
Inward FDI Stock (GDP%) Outward FDI Stock (GDP%)
Figure 5. Inward and Outward FDI Stock of Turkey (1980-2013)
Source: UNCTAD
12 May 2015, 16th International Academic Conference, Amsterdam ISBN 978-80-87927-09-0 , IISES
125http://www.iises.net/proceedings/16th-international-academic-conference-amsterdam/front-page

Akcaoglu (2003), Akcaoglu (2005), Apan (2006), Kayam and Hisarciklilar (2009), Anil et al.
(2011) and Yavan (2012) can be mentioned. Of the limited number of studies is one of the
major motivations of this study to contribute both to examine Turkey’s FDI to foreign
markets and to understand the impact of tax treaties on FDI behaviors.
4. Literature Review on DTTs and FDIs
It is generally accepted that tax treaties are indispensable and effective tools for eliminating
distortionary impacts of the conflict among national tax systems. Tax treaties help to
alleviate distortionary effect of taxation by coordinating tax systems of treaty partners.
Thus, while it reduces tax barriers to capital flows, it can expect that FDI activity would rise
after a treaty is enforced. Therefore policymakers assume that everyone who involved in
tax treaties benefits from treaties (Murthy and Bhasin, 2003, p.5; Dagan, 2000: 939). In
spite of the general consensus of the view that tax treaties would increase FDI activity
between their signatories, there are some legal and economic arguments against that.
Dagan (2000) argues that this conventional view of treaties’ function is highly overrated
and misguided, although treaties have benefits other than eliminating double taxation, such
as politic, administrative and social gains. In order to prevent double taxation, treaties are
not only workable solutions compared to unilateral mechanisms such as tax credits and
exemptions. In the case of presence of unilateral reliefs of tax credits and exemption,
Whalley (2001) argues that tax treaties and withholding taxes provided by them would have
rather a revenue transfer effects between national governments which are partners of the
treaty, if tax rates are similar in host and home countries as in the situation of OECD.
Similarly, Avi-Yonah and Halabi (2012) draw attention on other functions of tax treaties and
argue that jurisdictional conflicts could be solved even in the case of the absence of a tax
treaty, since countries already have unilateral measures for double taxation.
Empirical literature provides controversial findings. From the data of OECD countries over
the period of 1982-1992, Blonigen and Davies (2004a) separate old and renegotiated
treaties, thus, find a positive and significant coefficient on old treaties and negative and
insignificant one on new treaties, while pooling old and new ones produces positive
coefficient. From data on U.S. inward and outward FDI over the period 1980-1999,
Blonigen and Davies (2004b) analyze the effect of old and new treaties and could not find
significant effect of DTTs on inbound and outbound FDI activities. Based on similar sample,
Millimet and Kumas (2008) find by applying a quantile treatment effects approach that
although there is a slight positive effect when FDI levels are initially small, coefficients are
significantly negative in the upper quantiles of the FDI distribution. Davies (2003) also
examines the effect of treaty revisions on the data of U.S. inward and outward FDI, and
finds the revisions to be insignificant with negative coefficients. Another paper that finds
negative coefficient is that Egger et al. (2006) find a negative impact of DTTs on FDI from
the data of OECD source countries over the period of 1985-2000 by using two-step
selection model to overcome the problem of endogeneity.
12 May 2015, 16th International Academic Conference, Amsterdam ISBN 978-80-87927-09-0 , IISES
126http://www.iises.net/proceedings/16th-international-academic-conference-amsterdam/front-page

Di Giovanni (2005) examines cross-border activities of mergers and acquisitions (M&A)
and finds positive relationship between DTT and M&A by the aggregated data of 193
countries. As an example of single-country analysis, Ohno (2010) examines the
relationship between Japan treaties and FDI abroad and concludes newly concluded
treaties have a significant long-run positive effect, while tax treaties revised has no
significant effect on Japan’s FDI outbound. Barthel et al. (2010) find that DTTs lead to
higher FDI stocks from the data 30 source countries and 105 host countries over the period
of 1978-2004, after controlling standard determinants of FDI. Recently, Baker (2014) finds
no significant effect on the flows of FDI from the data of 30 OECD countries and 206 non-
OECD countries over the period of 1991-2006 by using the difference-in-difference
estimator, while Lejour (2014) finds bilateral and multilateral treaties to be have significant
positive effect on FDI of OECD countries.
Davies et al. (2009) use micro level data on Swedish-owned multinationals from 1965-1998
unlike other studies. They find that although the presence of tax treaty has no significant
effect on the level of affiliate sales, treaty formation increases the probability of the
existence of a subsidiary in the host country. Thus, they conclude that “even if a treaty does
not affect the desired size of investment, it can affect the attractiveness of one host country
over another. This might be the case if MNEs are assured by the tax certainty that a treaty
creates, for even if this does not affect the marginal decisions of a firm after entering, it
reduces the overall risk of entry.”
As can be seen, the empirical literature is mostly on the developed countries, exclusively
U.S. There are limited numbers of studies concentrated on exclusively developing
countries’ FDI activities and DTTs. Neumayer (2007) analyzes the effect of DTTs on FDI
stocks from U.S. to developing countries in addition to total inward FDI stocks and inflows
of developing countries. He finds that developing countries which have a DTT with the US
receive more FDI from the US. Countries with a higher number of DTTs have higher FDI
inward stocks and inflows. Another result of Neumayer (2007), when the sample split into
categories of middle and low income countries, the positive effect is only found for the
middle income countries. Coupe et al. (2009) examines the effect of DTTs and BITs on FDI
flows toward transition economies from OECD countries and cannot be find consistent
results related to the influence of treaties. Murthy and Bhasin (2013) analyze the impact of
DTTs on Indian FDI flows, and find treaty dummy and the age of treaty to be have small
but positive and significant effect on FDI inflows of India.
Controversial findings and failing to find a positive impact of DTTs on FDI could be resulted
by a few sources. One limitation is that sample size of studies is mostly small and non-
representative as pointed out by Barthel et al. (2010). Another one is that the results are
obviously sensitive to estimation technique employed. Finally, as pointed out by Baker
(2014), eliminating double taxation is not only aspect of tax treaties. DTTS are also
intended to fiscal evasion, and thereby, they can be expected to have negative effect on
FDI activity in some cases at least.
12 May 2015, 16th International Academic Conference, Amsterdam ISBN 978-80-87927-09-0 , IISES
127http://www.iises.net/proceedings/16th-international-academic-conference-amsterdam/front-page
5. Data and Econometric Procedure
This study seeks to contribute into the literature by providing evidence not only from a
different sample that is of a developing country’s FDI activities but also on Turkey’s outward
FDI activity which is relatively little examined. We aims to analyze the influence of DTTs
signed by Turkey on Turkish outward FDI activity by controlling standard estimators of
determinants of FDI suggested by literature on FDI.
We use Turkey’s outward FDI stocks at its nominal level (US$) as dependent variable,
while studies from literature use either FDI stocks or flows and either absolute values or as
a share of a country’s GDP. In order to reduce skewness in the data, we took natural log
of the dependent variable as well as most of the explanatory variables. Using natural logs
also makes easy interpretation of coefficients as elasticisies. The data on FDI stocks were
obtained from Republic of Turkey Central Bank (RTCB).
Our sample covers the data of 71 countries over the period of 12 years from 2001 to 2012.
Appendix A present the lists of countries covered in analyses.
In order to consider the role of tax treaties in promoting foreign direct investments which is
our main purpose in the study, we use a dummy of the existing of double tax treaty between
Turkey and partner country as main explanatory variable. However, in some models we
employ age of treaty. The data on treaty variables was obtained from Turkish Revenue
Administration.
One issue to create a dummy variable which takes the value of “0” for the year without DTT
and “1” for the year when the DTT is present is which date will use to represent the
presence of treaty. As usual, double tax treaty initially signed by treaty partners on
conclusion of the negotiations, then, a process under the domestic law starts to ratify the
treaty by parliaments or head of the states. Thus, the signature dates differ from ratification
date. After the ratification, DTTs can entry into force. However, neither the ratification of
the treaty or the date of entry into force does not mean the treaty provisions become
effective with respect to taxes. Typically, the DTT’s provisions are applicable in taxable
events in beginning of the year following the ratification. While some studies take signature
date (e.g., Neumayer, 2007) or ratification date period (e.g., Coupe, Orlova, and Skiba,
2009), we use the year in which the treaty provisions become effective with respect to tax
issues, as Barthel, Busse and Neumayer (2010). It is reasonable to assume that investors
take into account a DTT by its effectiveness date in investment decisions. Appendix B
presents Turkey’s tax treaties and their dates concerned.
Another treaty variable which is used in some equations is the life of treaty. This variable
takes value “1” for the year of effectiveness of the treaty, thereon, increase continuously
by subsequent years as long as the treaty is in effect. We can expect that the lifetime of
the treaty has positive impact on FDI stocks toward a country.
12 May 2015, 16th International Academic Conference, Amsterdam ISBN 978-80-87927-09-0 , IISES
128http://www.iises.net/proceedings/16th-international-academic-conference-amsterdam/front-page

Apart from these two variables, we include a set of control variables which are used as
standard covariates of FDI in both general FDI literature and the literature on relation
between tax treaties and FDIs. We mainly reviewed Blonigen and Piger (2011) in the
selection of control variables. Blonigen and Piger (2011) present a comprehensive review
of variables included and specifications employed in empirical studies on bilateral FDI.
Control variables used in the econometric specifications of the study and their summary
statistics are presented in Appendix C.
We use the log of host-country GDP (current, US$) and the log of host GDP per capita
(constant, 2005 US$) as gravity measures. Both were taken from World Bank, World
Development Indicators. It is assumed that these two variables are to control market size
and purchasing power of domestic consumers of the host country, and to have positive
impact on FDI flows and stocks.
However, we use two more variable GDP-related in some specifications to see if similarities
or differences between Turkey and host country have influence on FDI behavior. The
variable ln GDP similarity measures similarity of host and Turkey GDP [Similarity
index=(Host GDP/Sum of Host and Turkey’s GDP)*(Home GDP/Sum of Host and Turkey’s
GDP)], while the variable ln sq. GDP p.c. difference measures squared differences
between GDP per capita of both country. Taken into account the technologic level of
Turkey’s industry, we expect that similarities can have positive impact on FDIs stocks.
Other macroeconomic determinants employed are the log of inflation (average consumer
prices, index) to control macroeconomic distortions and economic stability, ln FDI
openness (sum of Inward and outward FDI stock as a share of GDP) to be a proxy the
openness, attitude toward globalization and general attractiveness of the country,
manufacturing (manufact) as a percentage of merchandise exports (standardized values
by converting into a four point scale, where: the low values indicates the high level of
manufacturing exports) to control reliance on primary or manufactured commodities in
export and for foreign exchange.
As geography measures, we use the number of neighboring states (nborder) sharing a
border with the identified state as a proxy trade opportunities in the region, and the log of
distance (ln distance) between the capital cities of countries (miles) as a proxy for transport
costs. We expect negative sign on ln distance and positive sign on nborder.
We also consider political and social stability as determinant of FDI through interstate
political violence (intviol, the magnitude score of international violence and warfare) and
civil political violence (civviol, the magnitude score civil violence and warfare)
Finally, we use two more estimators to consider the cooperation between host country and
Turkey in international agreement network. One of them is a dummy which takes the value
“1” if two countries have signed a bilateral investment agreement (BIT), and the other is a
dummy which takes the value “1” if two countries share a free trade agreement or a custom
12 May 2015, 16th International Academic Conference, Amsterdam ISBN 978-80-87927-09-0 , IISES
129http://www.iises.net/proceedings/16th-international-academic-conference-amsterdam/front-page

union (FTA). We expect positive sign on both variables, since these agreements encourage
investment and trade relationships, and reduce uncertainty of possible disputes.
As estimation technique, we firstly consider fixed-effects estimator because we are mainly
interested in analyzing the impact of tax treaties over the time within a country. We applied
Hausman specification test as the way of choosing fixed and random effects (see Table 1).
Since cross-sectional dependency, heteroskedasticy and serial correlation are potential
and common problems in panel data, we test each equation through the Breusch-Pagan
test and the Pesaran's test against cross sectional independence, the modified Wald test
against group-wise heteroskedasticity in the residuals, and the Wooldridge test against
autocorrelation. The tests indicate the data is heavily heteroscedastic and in some case
autocorrelated. Therefore, the rest of the analyses, we use linear regression
heteroskedasticity-corrected standard errors (PCSE) and Prais-Winsten regression in the
case of first order autocorrelation and heteroskedasticity (see Table 2). Finally, to test if the
results are robust toward additional variables and different samples, we add categorical
variables that represent country groups by income and region, and restrict the sample to
Europe and transition countries which are the most important country groups in Turkey’s
FDI and international trade profile, and to middle-income countries subsequently (see
Table 3).
6. Results
Table 1 reports results for fixed-effects estimations. We first estimate a baseline model
which contains treaty variables and GDP related two variables in Column (1) and (2). In
these estimations we found significant coefficient on DTT dummy although age of treaty
does not have statistically significant impact on ln FDI. Latter, in Column (3) and (4), we
expanded the estimation to full model. In this case, again DTT dummy has a positive and
statistically significant coefficient, although the magnitude of the coefficient has slightly
decreased. However, in both cases, DTT dummy considerably magnitude coefficients.
After the coefficient on dummy variable in log-level equations was made necessary
correction following Goldstein (1992), we found that having a DTT increases FDI stock by
495% for Column (1) and by 201% for Column (2). Yet, it should be taken into account that
the static models might tend to overestimate the impact considered. Since we have
relatively short time span in data, dynamic models could not produce consistent results,
therefore, we do not use dynamic models.
When we look at control variables, we found and statistically and economically significant
positive coefficient on FTA and BIT. On the other hand, except of ln GDP and ln FDI
openness, we cannot found statistically significant coefficients on the other variables.
Moreover, we would like to emphasize that none of estimations in other specifications
produced statistically significant coefficient on ln inflation.
12 May 2015, 16th International Academic Conference, Amsterdam ISBN 978-80-87927-09-0 , IISES
130http://www.iises.net/proceedings/16th-international-academic-conference-amsterdam/front-page

Table 1 Estimation Results for Fixed Effects
(1)
Baseline Model
(2)
Baseline
Model
(3)
Expanded
Model
(4)
Expanded
Model
DTT (dummy) 2.077*** 1.449*
(0.765) (0.833)
Age of treaty 0.102 0.075
(0.093) (0.106)
FTA (dummy) 3.375*** 3.877*** 2.808** 3.174**
(1.207) (1.194) (1.280) (1.269)
BIT (dummy) 2.818*** 3.218*** 2.693*** 2.953***
(0.801) (0.791) (0.863) (0.850)
ln GDP (Host) 0.960 0.949 -0.422 -0.458
(0.745) (0.860) (0.931) (1.017)
ln GDP per capita
(Host) 4.113** 3.715* 6.995*** 6.649***
(2.063) (2.065) (2.394) (2.402)
ln inflation -0.310 -0.280
(0.264) (0.266)
ln FDI openness 2.006*** 1.915***
(0.666) (0.706)
manufact -0.224 -0.338
(0.819) (0.817)
nborder -0.337 -0.355
(0.944) (0.948)
ln distance Omitted because of collinearity
intviol -1.320 -1.343
(1.263) (1.265)
civviol -0.521 -0.511
(0.369) (0.369)
constant -53.105*** -49.094*** -48.967*** -44.362**
(11.309) (15.399) (13.486) (18.564)
Number of Obs. 961 961 800 800
R2 0.118 0.112 0.132 0.129
Hausman Test χ²(5)=21*** χ²(5)=18.9*** χ²(5)=28.7*** χ²(5)=30.1***
standard errors in parentheses; * p<0.1, ** p<0.05, *** p<0.01
Table 2 presents estimation results for regressions with panel-corrected standard errors to
take account of heterosikedasticiy and autocorrelation. Colum (1) and (2) which presents
estimations for only heterosikedasticy corrections shows that both DTT dummy and age of
treaty have significant and positive effect on FDI. Colum (3) and (4) consider AR(1)
autocorrelation process and heteroskdasticity, and in this case, we just found significant
coefficient on DTT dummy, not on the age of treaty. In these estimation and indeed all
estimations in Table 2 and Table 3, we find positive coefficient ln GDP as a proxy of market
size, and negative coefficient on ln GDP per capita as a proxy of purchasing power of
consumers in the country. Negative coefficient on ln GDP per capita can be explained by
technological structure of Turkish manufacturing. As point out by Kayam and Hisarciklilar
(2009) who find similar results, Turkish FDI firms generally produce the low quality products
and increases in income of host country might not positively affect Turkish outward FDIs.
12 May 2015, 16th International Academic Conference, Amsterdam ISBN 978-80-87927-09-0 , IISES
131http://www.iises.net/proceedings/16th-international-academic-conference-amsterdam/front-page

In Column (5) and (6), we employed similarity and difference measures of GDP-related
variables in which both have positive coefficients, instead of ln GDP and ln GDP per capita.
Even in these cases, treaty variables have found positively associated with FDI.
Table 2. Estimation Results for Linear Regressions with Panel-Corrected Standard Errors
(PCSE)
(1) (2) (3) (4) (5) (6)
DTT (dummy) 1.607** 1.693* 2.240***
(-0.66) (-0.91) (-0.67)
Age of treaty 0.103*** 0.088 0.161***
(-0.03) (-0.06) (-0.04)
FTA (dummy) 1.758*** 1.746*** 2.073* 2.064* 1.993*** 1.853***
(-0.66) (-0.65) (-1.14) (-1.13) (-0.65) (-0.64)
BIT (dummy) 0.232 0.235 0.506 0.565 0.918 0.89
(-0.55) (-0.54) (-0.74) (-0.74) (-0.56) (-0.55)
ln GDP (Host) 2.119*** 2.023*** 1.898*** 1.857***
(-0.21) (-0.21) (-0.35) (-0.37)
ln GDP per capita (Host) -1.940*** -1.932*** -1.696*** -1.711***
(-0.3) (-0.31) (-0.49) (-0.49)
ln GDP similarity 2.255*** 1.788**
(-0.79) (-0.81)
ln sq. GDP p.c. difference 0.257** 0.178
(-0.12) (-0.12)
ln inflation 0.035 0.064 -0.078 -0.072 0.206 0.272
(-0.28) (-0.28) (-0.23) (-0.23) (-0.29) (-0.29)
ln FDI openness 1.980*** 1.872*** 1.829*** 1.764*** 0.818*** 0.765**
(-0.32) (-0.32) (-0.47) (-0.47) (-0.3) (-0.3)
manufact 1.374*** 1.344*** 1.089*** 1.076** 0.807*** 0.833***
(-0.25) (-0.25) (-0.42) (-0.42) (-0.27) (-0.27)
nborder 0.357*** 0.376*** 0.369** 0.375*** 0.906*** 0.886***
(-0.08) (-0.08) (-0.15) (-0.14) (-0.07) (-0.07)
ln distance -2.993*** -2.936*** -2.296*** -2.330*** -0.462 -0.541
(-0.46) (-0.45) (-0.85) (-0.86) (-0.4) (-0.39)
intviol 1.849*** 2.124*** 0.753 0.84 3.448*** 3.702***
(-0.64) (-0.65) (-0.67) (-0.68) -0.79) (-0.8)
civviol -0.817*** -0.842*** -0.570* -0.575** (-0.351* -0.404**
(-0.21) (-0.2) (-0.3) (-0.29) -0.2) (-0.19)
constant -14.155*** -11.526*** -15.481** -13.339* -120.868*** -93.144**
(-3.78) (-3.75) (-6.87) (-6.88) (-41.68) (-43.15)
Number of obs. 800 800 800 800 800 800
R2 0.27 0.271 0.12 0.118 0.207 0.213
Heteroskedasticity-corrected standard errors in parentheses; * p<0.1, ** p<0.05, *** p<0.01
On the other hand, estimations in Table 2 have produced more significant coefficients for
control variables. Except of BIT and ln inflation, all coefficients are statistically significant in
most of the equations.
12 May 2015, 16th International Academic Conference, Amsterdam ISBN 978-80-87927-09-0 , IISES
132http://www.iises.net/proceedings/16th-international-academic-conference-amsterdam/front-page
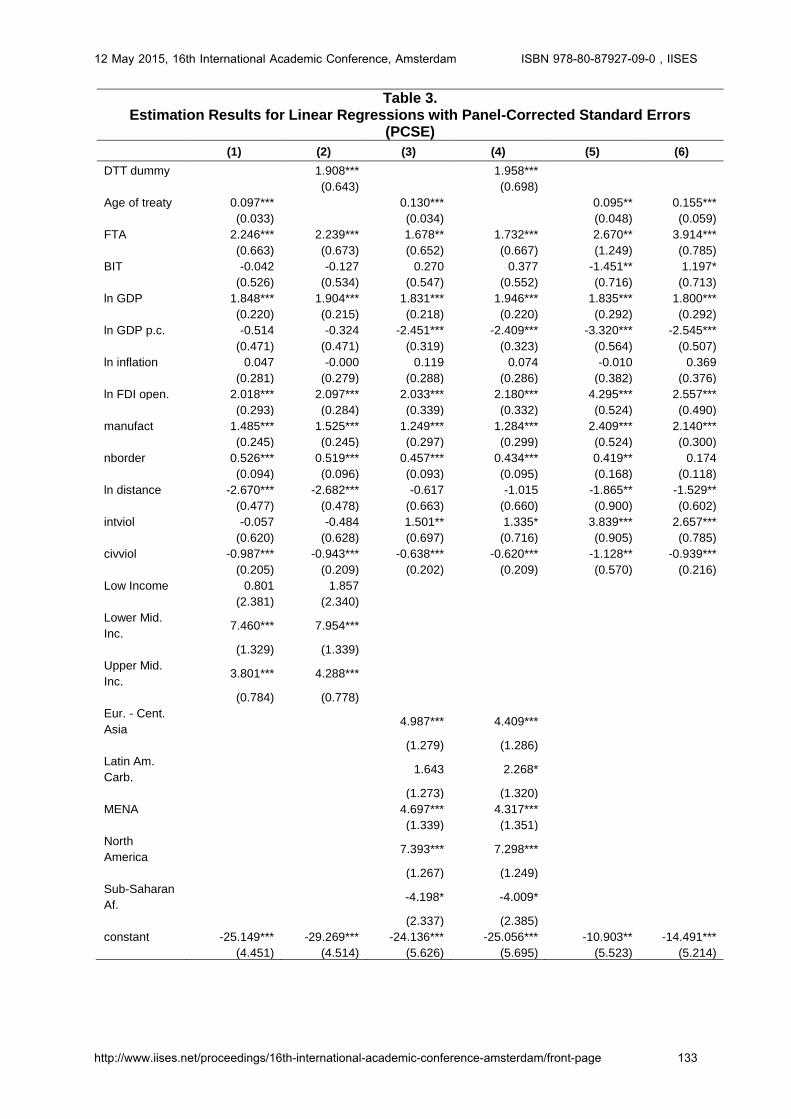
Table 3. Estimation Results for Linear Regressions with Panel-Corrected Standard Errors
(PCSE)
(1) (2) (3) (4) (5) (6)
DTT dummy 1.908*** 1.958***
(0.643) (0.698)
Age of treaty 0.097*** 0.130*** 0.095** 0.155***
(0.033) (0.034) (0.048) (0.059)
FTA 2.246*** 2.239*** 1.678** 1.732*** 2.670** 3.914***
(0.663) (0.673) (0.652) (0.667) (1.249) (0.785)
BIT -0.042 -0.127 0.270 0.377 -1.451** 1.197*
(0.526) (0.534) (0.547) (0.552) (0.716) (0.713)
ln GDP 1.848*** 1.904*** 1.831*** 1.946*** 1.835*** 1.800***
(0.220) (0.215) (0.218) (0.220) (0.292) (0.292)
ln GDP p.c. -0.514 -0.324 -2.451*** -2.409*** -3.320*** -2.545***
(0.471) (0.471) (0.319) (0.323) (0.564) (0.507)
ln inflation 0.047 -0.000 0.119 0.074 -0.010 0.369
(0.281) (0.279) (0.288) (0.286) (0.382) (0.376)
ln FDI open. 2.018*** 2.097*** 2.033*** 2.180*** 4.295*** 2.557***
(0.293) (0.284) (0.339) (0.332) (0.524) (0.490)
manufact 1.485*** 1.525*** 1.249*** 1.284*** 2.409*** 2.140***
(0.245) (0.245) (0.297) (0.299) (0.524) (0.300)
nborder 0.526*** 0.519*** 0.457*** 0.434*** 0.419** 0.174
(0.094) (0.096) (0.093) (0.095) (0.168) (0.118)
ln distance -2.670*** -2.682*** -0.617 -1.015 -1.865** -1.529**
(0.477) (0.478) (0.663) (0.660) (0.900) (0.602)
intviol -0.057 -0.484 1.501** 1.335* 3.839*** 2.657***
(0.620) (0.628) (0.697) (0.716) (0.905) (0.785)
civviol -0.987*** -0.943*** -0.638*** -0.620*** -1.128** -0.939***
(0.205) (0.209) (0.202) (0.209) (0.570) (0.216)
Low Income 0.801 1.857
(2.381) (2.340)
Lower Mid.
Inc. 7.460*** 7.954***
(1.329) (1.339)
Upper Mid.
Inc. 3.801*** 4.288***
(0.784) (0.778)
Eur. - Cent.
Asia 4.987*** 4.409***
(1.279) (1.286)
Latin Am.
Carb. 1.643 2.268*
(1.273) (1.320)
MENA 4.697*** 4.317***
(1.339) (1.351)
North
America 7.393*** 7.298***
(1.267) (1.249)
Sub-Saharan
Af. -4.198* -4.009*
(2.337) (2.385)
constant -25.149*** -29.269*** -24.136*** -25.056*** -10.903** -14.491***
(4.451) (4.514) (5.626) (5.695) (5.523) (5.214)
12 May 2015, 16th International Academic Conference, Amsterdam ISBN 978-80-87927-09-0 , IISES
133http://www.iises.net/proceedings/16th-international-academic-conference-amsterdam/front-page

Number of
Obs. 800 800 800 800 424 377
R2 0.320 0.322 0.305 0.302 0.321 0.349
Heteroskedasticity-corrected standard errors in parentheses; * p<0.1, ** p<0.05, *** p<0.01
Finally, we make some changes in specifications for testing robustness. In Table 3, we add
a factor variable for income levels in Column (1) and (2), and a factor variable for
geographic regions in Column (3) and (4). Column (1) and (2) indicates that middle income
countries has significant and positive association with ln FDI (base level is high-income),
while tax treaty variables are still significant and important. Column (3) and (4) shows that
all coefficient on regions are statistically significant except of Latin America in Column (3)
(base level is South/East Asia). Again, coefficients on tax treaty variables are significant.
As a final point, we consider the sample restricted to Europe-Transition countries (Column
5) and to middle-income countries (Column 6). In both cases, the age of treaty was included
in the equations, because almost all countries have already a tax treaty for almost all years
of sample period. The lifetime of treaty is positively associated with FDI stocks toward the
countries sampled.
7. Concluding Remarks
The main purpose of this study is to analyze the impact of bilateral DTTs on FDI in the case
of Turkish outbound FDI stocks. The study’s results can be summarized as following:
Descriptive analysis shows that Turkey’s behavior of signing the DTT is linked to the
process of its participation in globalization through liberalization of capital flows and
exchange regime, and the rise of states that is newly independent or in the period of
transition to market economy that the most of them are connected to Turkey culturally or
geographically. Turkey signed treaty with its developed trade partners e.g. Austria,
Germany, Norway, Netherland, France in 1970s. During 1990s, Turkey signed tax treaties
with transition countries of Central Asia and East-Central Europe besides some developed
countries and East-South Asia. In 2000s, in addition a number of countries, most of MENA
countries have become treaty partner of Turkey. Currently Turkey is one of the developing
countries which have the most number of treaties, while its DTTs are largely of the regions
of European, Central Asian and MENA. On the other hand, by globalization and
liberalization, Turkish investors started to globally operate. Thus, after 1990s and especially
2000s, Turkish residents and companies increased their FDI activity toward foreign
countries, as well as FDIs into Turkey increases. The paper studies the relationship
between having a DTT and investing abroad in the case of Turkey.
Empirical literature does not show consistent result on this effect. Most of the studies find
statistically insignificant effect or even negative effect as well as positive relationship
between DTTs and FDIs. Both negative of positive association can be confirmed by
theoretical insight. Since DTTs have two main functions of eliminating international double
12 May 2015, 16th International Academic Conference, Amsterdam ISBN 978-80-87927-09-0 , IISES
134http://www.iises.net/proceedings/16th-international-academic-conference-amsterdam/front-page
taxation and tax evasion/avoidance, negative coefficients on DTT variables could be
explained the latter function.
Our econometric estimations which is based on a panel data of 71 of Turkey’s outward FDI
partners in the period of 2001-2012 indicates that DTTs are positively associated with
Turkey’s outward FDI stocks. In all specifications, we find positive and significant in
statistical and economic terms on DTT dummy. Also, the most of estimations produce the
positive coefficient on the variable which represents the age of DTT. Results are robust to
changing in the sample and the specification. From policy perspective, it can be said that
engaging in a treaty have influence Turkey’s FDI activity, at least, with respect to outward
FDI stocks.
It should be noted that since the results are sensitive the sample analyzed and the
specification method, the study’s limitation should be taken into account at interpreting
findings of the study. First of all, the endogeneity which would lead to bias and spurious
associations in coefficients is an important problem. Turkey may be seeking treaties with
only the countries for which there are already large amount of FDI activity. However, at
least considering MENA countries which do not have important share in Turkey’s outward
FDIs (inbound FDIs or political/cultural issues may have effect to make agreements with
these countries) and other reasons for signing treaty, we can assume the treaty variables
are independent from our dependent variable. Even so, future researches may use some
instruments to control the endogeneity. Instead of using a dummy on treaty, using firm-
level data, comparing the withholding tax rates provided by treaties and tax rates in the
absence of a treaty and considering treaties’ provisions on allocate taxing rights between
residence and source countries would be useful for our understanding of the impact of
treaties in the future researches. Also, Turkey’s DTTs should be analyzed with its impact
on inbound FDI and by dyadic data of mutual FDI activities of treaty partners.
References
AKÇAOĞLU, E. (2005). Türk Firmalarının Dış yatırımları: Saikler ve Stratejiler. [Outward Investments of
Turkish Firms: Motives and Strategies] İstanbul: Türkiye Bankalar Birligi.
ANIL, I. et al. (2011) The determinants of Turkish outward foreign direct investment. Modern Economy. 2.
717-728
APAN, E (2006). Türkiye'nin Yurt Dışına Doğrudan Yatırımları ve Türk Firmalarının Doğrudan Dış Yatırım
Kararlarını Etkileyen Faktörler [Turkey’s Outward FDIs and the Factors Which Affect Turkish Firms’
Decision to Invest Abroad]. Ankara: Hazine Müsteşarlığı.
ARNOLD, B. J. and McINTYRE, M. J. (2002). International Tax Primer. The Hague/London/New York: Kluwer
Law International
AVI-YONAH, R. and HALABI, O. (2012) Double or nothing: a tax treaty for the 21st Century. University of
Michigan Law School, Law and Economics Research Paper Series. No. 12-009
BAKER, P. L. (2014) An analysis of double taxation treaties and their effect on foreign direct investment.
International Journal of Economics of Business. 21(3), 341-377
12 May 2015, 16th International Academic Conference, Amsterdam ISBN 978-80-87927-09-0 , IISES
135http://www.iises.net/proceedings/16th-international-academic-conference-amsterdam/front-page

BARTHEL, F., BUSSE, M. and NEUMAYER, E. (2010), The Impact of double taxation treaties on foreign
direct investment: evidence from large dyadic panel data. Contemporary Economic Policy. 28(3). 366-
377.
BLONIGEN, B. A. and DAVIES, R. B. (2004a) Do bilateral tax treaties promote foreign direct investment?. In
CHOI, E.K. and HARTIGAN, J. C. Handbook of International Trade, Vol. II: Economic and Legal
Analyses of Trade Policy and Institutions. London: Blackwell, 526–546.
BLONIGEN, B. A. and DAVIES, R. B. (2004b) The effects of bilateral tax treaties on U.S. FDI activity.
International Tax and Public Finance. 11. 601–622.
BLONIGEN, B. A. and PIGER, J. (2011) Determinants of foreign direct investments. NBER Working Papers.
No. 16704.
CEVIK, S. (2013) Kuresel Ekonomide Uluslararası Vergileme [International Taxation in Global Economy].
Konya: Palet Publishing
COUPE, T., ORLOVA, I. and SKIBA, A. (2009) The Effect of tax and investment treaties on bilateral FDI flows
to transition countries. In SAUVANT, K. P. & SACHS, L. E. (eds.). The Effect of Treaties on Foreign
Direct Investment: Bilateral Investment Treaties, Double Taxation Treaties, and Investment
Flows. Oxford, UK: Oxford University Press. 681–715.
CULPAN, R. and AKCAOGLU, E. (2003) An examination of Turkish direct investments in Central Eastern
Europe and Commonwealth of Independent States”. In MARINOVA, S. T. and MARINOV, M. A. (eds.)
Foreign Direct Investment in Central and Eastern Europe. Aldershot: Ashgate
DAGAN, T. (2000) Tax treaties myth. New York University Journal of International Law and Politics, 32, 939‐
996
DAVIES, R. B. (2003) Tax treaties, renegotiations, and foreign direct investment. University of Oregon
Economics Department Working Papers. No. 2003-14. June.
DAVIES, R: B., NORBACK, P. and TEKIN-KORU, A. (2009) The effect of tax treaties on multinational firms:
new evidence from microdata. The World Economy. 32(1). 77-110
DI GIOVANNI, J. (2005) What drives capital flows? The case of cross-border M&A activity and financial
deepening. Journal of International Economics. 65. 127–149.
EGGER, P., LARCH, M., PFAFFERMAYR, M., and WINNER, H. (2006) The impact of endogenous tax
treaties on foreign direct investment: theory and evidence. Canadian Journal of Economics. 39. 901–
931.
ERDILEK, A. (2003) A comparative analysis of inward and outward FDI in Turkey, Transnational
Corporations, 12, 79-106.
GOLDSTEIN, R. (1992) Interpretations of dummy variables in regressions with log dependent variable. Stata
Technical Bulletin, January, STB-5, 21-22
KAYAM, S. S. and HISARCIKLILAR, M. (2009) Determinants of Turkish FDI abroad. Mimeo. 8th International
Conference of the Middle East Economic Association, 18-20 March, Nice, France. [http://mpra.ub.uni-
muenchen.de/17813/1/MPRA_paper_17813.pdf].
LEJOUR, A. (2014). The foreign investment effects of tax treaties. Oxford University Centre for Business
Taxation Working Papers. No: WP 14/3
McINTYRE, M. J. (2005) Developing countries and international cooperation on income tax matters: an
historical review. Mimeo. [http://www.michielse.com/files/mcintyre_intl_cooperation.pdf]
12 May 2015, 16th International Academic Conference, Amsterdam ISBN 978-80-87927-09-0 , IISES
136http://www.iises.net/proceedings/16th-international-academic-conference-amsterdam/front-page
MILLIMET, D. and KUMAS, A. (2008) Reassessing the effects of bilateral tax treaties on US FDI activity
Mimeo, [http://faculty.smu.edu/millimet/pdf/tt.pdf]
MURTHY, K.V.B. and BHASIN, N. (2013) The impact of bilateral tax treaties on FDI Inflows: The Case of
India. Mimeo. [http://papers.ssrn.com/sol3/papers.cfm?abstract_id=2234966].
NEUMAYER, E. (2007) Do double taxation treaties increase foreign direct investment to developing
countries?. Journal of Development Studies. 43. 1501–1519.
OECD (2000) Toward Global Tax Co-operation: Report to the 2000 Ministerial Council Meeting and
Recommendations by the Committee on Fiscal Affairs (Progress in Identifying and Eliminating Harmful
Tax Practices). [http://www.oecd.org/tax/transparency/44430257.pdf]
OECD (2001) The OECD’s Project on Harmful Tax Practices: The 2001 Progress Report.
[http://www.oecd.org/ctp/harmful/2664438.pdf]
OHNO, T. (2010) Empirical analysis of international tax treaties and foreign direct investment. Japan Ministry
of Finance, Public Policy Review. 6(2). 287-311
RIXEN, P. (2008) Political Economy of International Tax Governance, London: Palgrave Macmillian
SELIGMAN, E. R. A. (1928) Double Taxation and International Fiscal Corporation. New York: The MacMillan
Company.
UNCTAD (2000) Taxation, UNCTAD Series on Issues in International Investment Agreements. New York /
Geneva: United Nations.
UNCTAD (2014) World Investment Report: 2014. Switzerland: UN Publication
WHALLEY, J. (2001) Puzzles over international taxation of cross border flows of capital income. NBER
Working Papers. No. 8662
YAVAN, N. (2012) Türkiye’nin yurt dışındaki doğrudan yatırımları: tarihsel ve mekânsal perspektif [Turkish
outward direct investment: a historical and spatial perspective]. Bilig. 63. 237-270
Appendix A. List of Countries
Whole Sample of Countries (71)
Albania, Algeria, Argentina, Australia, Austria, Azerbaijan, Bahrain, Bangladesh, Belarus, Belgium, Bosnia, Brazil, Bulgaria, Canada, China, Croatia, Czech R., Denmark, Egypt, Finland, France, Georgia, Germany, Greece, Hungary, India, Indonesia, Iran, Ireland, Israel, Italy, Jordan, Kazakhstan, Korea, Kuwait, Kyrgyzstan, Latvia, Liberia, Libya, Lithuanian, Luxembourg, Macedonia, Malaysia, Mexico, Moldova, Montenegro, Morocco, Netherlands, Oman, Pakistan, Panama, Poland, Portugal, Qatar, Romania, Russia, Saudi Arabia, Serbia, Singapore, Slovakia, South Africa, Spain, Sweden, Switzerland, Syria, Thailand, Tunisia, UAE, USA, Ukraine, United Kingdom.
Europe and Transition Countries (37) Albania, Austria, Azerbaijan, Belarus, Belgium, Bosnia, Bulgaria, Croatia, Czech R., Denmark, Finland, France, Georgia, Germany, Greece, Hungary, Ireland, Italy, Kazakhstan, Kyrgyzstan, Latvia, Lithuanian, Luxembourg, Macedonia, Moldova, Montenegro, Netherlands, Poland, Portugal, Romania, Russia, Serbia, Slovakia, Spain, Sweden, Ukraine, United Kingdom.
Middle Income Countries (34)
Albania, Algeria, Argentina, Azerbaijan, Belarus, Bosnia, Brazil, Bulgaria, China, Egypt, Georgia, Hungary, India, Indonesia, Iran, Jordan, Kazakhstan, Kyrgyzstan, Libya, Macedonia, Malaysia, Mexico, Moldova, Montenegro, Morocco, Pakistan, Panama, Romania, Serbia, South Africa, Syria, Thailand, Tunisia, Ukraine.
12 May 2015, 16th International Academic Conference, Amsterdam ISBN 978-80-87927-09-0 , IISES
137http://www.iises.net/proceedings/16th-international-academic-conference-amsterdam/front-page

Appendix B. Turkey’s Double Tax Treaties
Contracting State
The date of signature
The year of effectiveness of treaty provisions
Contracting State
The date of signature
The year of effectiveness of treaty provisions
1 Austria (*) 03.11.1970 01.01.1974 41 Russia 15.12.1997 01.01.2000
2 Norway (*) 16.12.1971 01.01.1977 42 Indonesia 25.02.1997 01.01.2001
3 Korea 24.12.1983 01.01.1987 43 Lithuanian 24.11.1998 01.01.2001
4 Jordan 06.06.1985 01.01.1987 44 Croatia 22.09.1997 01.01.2001
5 Tunisia 02.10.1986 01.01.1988 45 Moldova 25.06.1998 01.01.2001
6 Romania 01.07.1986 01.01.1989 46 Singapore 09.07.1999 01.01.2002
7 Netherland 27.03.1986 01.01.1989 47 Kyrgyzstan 01.07.1999 01.01.2002
8 Pakistan 14.11.1985 01.01.1989 48 Tajikistan 06.05.1996 01.01.2002
9 United Kingdom
19.02.1986 01.01.1989 49 Czech Republic
12.11.1999 01.01.2004
10 Finland (*) 09.05.1986 01.01.1989 50 Spain 05.07.2002 01.01.2004
11 Northern Cyprus
22.12.1987 01.01.1989 51 Bangladesh 31.10.1999 01.01.2004
12 France 18.02.1987 01.01.1990 52 Latvia 03.06.1999 01.01.2004
13 Germany (*) 16.04.1985 01.01.1990 53 Slovenia 19.04.2001 01.01.2004
14 Sweden 21.01.1988 01.01.1991 54 Greece 02.12.2003 01.01.2005
15 Belgium 02.06.1987 01.01.1992 55 Syria 06.01.2004 01.01.2005
16 Denmark 30.05.1991 01.01.1991 56 Thailand 11.04.2002 01.01.2006
17 Italy 27.07.1990 01.01.1994 57 Sudan 26.08.2001 01.01.2006
18 Japan 08.03.1993 01.01.1995 58 Luxembourg 09.06.2003 01.01.2006
19 UAE 29.01.1993 01.01.1995 59 Estonia 25.08.2003 01.01.2006
20 Hungary 10.03.1993 01.01.1993 60 Iran 17.06.2002 01.01.2006
21 Kazakhstan 15.08.1995 01.01.1997 61 Morocco 07.04.2004 01.01.2007
22 Macedonia 16.06.1995 01.01.1997 62 Lebanon 12.05.2004 01.01.2007
23 Albania 04.04.1994 01.01.1997 63 South Africa 03.03.2005 01.01.2007
24 Algeria 02.08.1994 01.01.1997 64 Portugal 11.05.2005 01.01.2007
25 Mongolia 12.09.1995 01.01.1997 65 Serbia-Mont. 12.10.2005 01.01.2008
26 India 31.01.1995 01.01.1994 66 Ethiopia 02.03.2005 01.01.2008
27 Malaysia 27.09.1994 01.01.1997 67 Bahrain 14.11.2005 01.01.2008
28 Egypt 25.12.1993 01.01.1997 68 Qatar 25.12.2001 01.01.2009
29 China 23.05.1995 01.01.1998 69 Bosnia 16.02.2005 01.01.2009
30 Poland 03.11.1993 01.01.1998 70 Saudi Arabia 09.11.2007 01.01.2010
31 Turkmenistan 17.08.1995 01.01.1998 71 Georgia 21.11.2007 01.01.2011
32 Azerbaijan 09.02.1994 01.01.1998 72 Oman 31.05.2006 01.01.2011
33 Bulgaria 07.07.1994 01.01.1998 73 Yemen 26.10.2005 01.01.2011
34 Uzbekistan 08.05.1996 01.01.1997 74 Ireland 24.10.2008 01.01.2011
35 USA 28.03.1996 01.01.1998 75 New Zeal. 22.04.2010 01.01.2012
36 Belarus 24.07.1996 01.01.1999 76 Canada 14.07.2009 01.01.2012
37 Ukraine 27.11.1996 01.01.1999 77 Switzerland 18.06.2010 01.01.2013
38 Israel 14.03.1996 01.01.1999 78 Brazil 14.03.2005 01.01.2013
39 Slovakia 02.04.1997 01.01.2000 79 Australia 28.04.2010 01.01.2014
40 Kuwait 06.10.1997 01.01.1997 80 Malta 14.07.2011 01.01.2014
(*) These treaties has revised by 2008 for Austria, 2010 for Norway, 2009 for Finland, and 2011 for Germany
12 May 2015, 16th International Academic Conference, Amsterdam ISBN 978-80-87927-09-0 , IISES
138http://www.iises.net/proceedings/16th-international-academic-conference-amsterdam/front-page

Appendix C. Variables and Descriptive Statistics
Variable Mean
(Std. Dev) Min.
(Max.) Description Source
ln FDI 12.485 (7.735)
0 (22.954)
FDI stock (current, US$) Republic of Turkey Central Bank (www.tcmb.gov.tr)
DTT (dummy) 0.738 (0.440)
0 (1)
Double tax treaties (dummy) Turkish Revenue Administration (www.gib.gov.tr)
Age of treaty 8.194 (7.725)
0 (39)
Age of double tax treaties (years) Authors’ calculation
FTA 0.470 (0.499)
0 (1)
Regional/Free trade agreements (dummy, included free trade agreements and custom unions)
World Trade Organization (www.wto.org)
BIT 0.651 (0.477)
0 (1)
Bilateral investment treaties (dummy) Republic of Turkey, Ministry of Economy (www.economy.gov.tr)
ln GDP (Host) 25.593 (1.909)
19.829 (30.414)
GDP (current, US$) World Bank, World Development Indicators (www.worldbank.org)
ln GDP per capita (Host)
8.951 (1.415)
5.046 (11.364)
GDP per capita (constant, 2005 US$) World Bank, World Development Indicators (www.worldbank.org)
ln GDP similarity
53.856 (0.337)
53.244 (54.331)
GDP similarity index [(Host GDP/Sum of Host and Turkey’s GDP)*(Home GDP/Sum of Host and Turkey’s GDP)]
Authors’ calculation
ln sq. GDP per capita difference
17.771 (2.492)
2.303 (22.538)
Squared differences between per capita GDPs (per capita GDP of host country – per capita GDP of Turkey)2
Authors’ calculation
ln inflation 1.228 (0.945)
-5.116 (4.113)
Inflation (average consumer prices, index) IMF World Economic Outlook (www.imf.org)
ln FDI openness
3.793 (1.010)
0.876 (7.167)
FDI openness (Inward and outward FDI stock as a share of GDP)
United Nations Conference on Trade and Development (http://unctadstat.unctad.org)
nborder 4.075 (2.709)
0 (14)
Number of neighboring states sharing a border with the identified state.
Database on Major Episodes of Political Violence and Conflict Regions (www.systemicpeace.org)
ln distance 7.383 (0.767)
6.144 (9.106)
Distance between the capital cities of countries (miles)
www.timeanddate.com
manufact 0.662 (1.115)
0 (3)
Manufacturing as a Percentage of Merchandise Exports (standardized values by converting into a four point scale, where: the low values indicates the high level of manufacturing exports)
State Fragility Index (www.systemicpeace.org)
intviol 0.034 (0.283)
0 (3)
Interstate political violence (international violence and warfare)
Database on Major Episodes of Political Violence and Conflict Regions (www.systemicpeace.org)
civviol 0.330 (1.229)
0 (9)
Civil political violence (civil violence and warfare)
Database on Major Episodes of Political Violence and Conflict Regions (www.systemicpeace.org)
12 May 2015, 16th International Academic Conference, Amsterdam ISBN 978-80-87927-09-0 , IISES
139http://www.iises.net/proceedings/16th-international-academic-conference-amsterdam/front-page
Copyright © 2022 FDOKUMEN


![TURKEY'S INVOLEMENT IN SOMALIA: ASSESMENT OF A STATE-BUILDING IN PROGRESS [SETA: Ankara, 2014]](https://static.fdokumen.com/doc/165x107/6320c3c318429976e4065aa4/turkeys-involement-in-somalia-assesment-of-a-state-building-in-progress-seta.jpg)


![The International Politics of the Middle East and Turkey's Place [In Greek]](https://static.fdokumen.com/doc/165x107/6328507cb13f7c3b6307fe99/the-international-politics-of-the-middle-east-and-turkeys-place-in-greek.jpg)

![Turkey's Religious Diplomacy [Arab World Geographer, 2014]](https://static.fdokumen.com/doc/165x107/6331fefa4e0143040300745c/turkeys-religious-diplomacy-arab-world-geographer-2014.jpg)