The impact of outward FDI on the home country's labour demand and skill composition
16
The impact of outward FDI on the home country’s labour demand and skill composition Stefano Elia a,1 , Ilaria Mariotti b,2 , Lucia Piscitello a, * a DIG-Politecnico di Milano, P.zza L. da Vinci, 32 – 20133 Milan, Italy b DiAP-Politecnico di Milano, P.zza L. da Vinci, 32 – 20133 Milan, Italy 1. Introduction Recent theoretical and empirical literature has been devoting increasing attention to the relationship between outward FDI and the demand for labour in the MNEs’ parent companies and in their home countries. In several advanced countries, many argue that firms’ internationalisation is responsible for loss of workplaces (especially in the manufacturing sector) as well as decrease in low skilled workers’ real wages - both in absolute and in relative terms. In fact, over tha last 30 years, the United States have registered a loss of about 2.5 millions of labour force in the manufacturing sector (the share on the total has decreased from 26.4% to 14.7%); the United Kingdom has lost about 3.5 millions of workers in 1970–1998 (the share of the employees in the manufacturing sector dropped from 34.7% to 18.6%), and similar trends have also been recorded in other advanced countries (Legrain, 2002; Wolf, 2004). At the same time, since the beginning of the 1980s, a consistent acceleration in the demand for skilled workers is observed (Katz & Murphy, 1992). Three different events are used in the economic literature to explain these phenomena: (i) information and communication technologies, which are capital intensive and skill intensive (Autor, Katz, & Krueger, 1998; Bound & Johnson, 1992); (ii) changes and pressures induced by globalisation (Wood, 1994; Borjas & Ramey, 1995); (iii) international fragmentation, reorganization of production and outsourcing (see among the others, Bardhan & Kroll, 2003; Feenstra & Hanson, 2001; McKinsey, 2005). Nevertheless, while several empirical investigations have underlined the role of technological change and capital deepening on the increase of the high skilled workers’ demand (Machin & Van Reenen, International Business Review 18 (2009) 357–372 ARTICLE INFO Article history: Received 14 July 2008 Received in revised form 26 February 2009 Accepted 6 April 2009 Keywords: Demand for labour Market seeking FDI Resource seeking FDI Skill composition ABSTRACT The present paper adds to the literature investigating the effects of outward FDI on the home country employment and skill composition. Considering the ‘‘industrial region’’ as the unit of the analysis, we capture both direct and indirect effects of foreign production on the parent company and its environment. The empirical evidence refers to the internationalisation of production by Italian firms throughout the period 1996–2002, and it shows that foreign activities have a negative impact upon the demand for low skilled workers in the parent company’s ‘‘industrial region’’, but also on the demand for high skilled workers when FDI are addressed to high income countries. ß 2009 Elsevier Ltd. All rights reserved. * Corresponding author. Tel.: +39 02 2399 2740; fax: +39 02 2399 2710. E-mail addresses: [email protected] (S. Elia), [email protected] (I. Mariotti), [email protected] (L. Piscitello). 1 Tel.: +39 02 2399 2756; fax: +39 02 2399 2710. 2 Tel.: +39 02 2399 3928; fax: +39 02 2399 4105. Contents lists available at ScienceDirect International Business Review journal homepage: www.elsevier.com/locate/ibusrev 0969-5931/$ – see front matter ß 2009 Elsevier Ltd. All rights reserved. doi:10.1016/j.ibusrev.2009.04.001
Transcript of The impact of outward FDI on the home country's labour demand and skill composition

The impact of outward FDI on the home country’s labour demandand skill composition
Stefano Elia a,1, Ilaria Mariotti b,2, Lucia Piscitello a,*a DIG-Politecnico di Milano, P.zza L. da Vinci, 32 – 20133 Milan, Italyb DiAP-Politecnico di Milano, P.zza L. da Vinci, 32 – 20133 Milan, Italy
1. Introduction
Recent theoretical and empirical literature has been devoting increasing attention to the relationship between outwardFDI and the demand for labour in the MNEs’ parent companies and in their home countries. In several advanced countries,many argue that firms’ internationalisation is responsible for loss of workplaces (especially in the manufacturing sector) aswell as decrease in low skilled workers’ real wages - both in absolute and in relative terms. In fact, over tha last 30 years, theUnited States have registered a loss of about 2.5 millions of labour force in the manufacturing sector (the share on the totalhas decreased from 26.4% to 14.7%); the United Kingdom has lost about 3.5 millions of workers in 1970–1998 (the share ofthe employees in the manufacturing sector dropped from 34.7% to 18.6%), and similar trends have also been recorded inother advanced countries (Legrain, 2002; Wolf, 2004). At the same time, since the beginning of the 1980s, a consistentacceleration in the demand for skilled workers is observed (Katz & Murphy, 1992).
Three different events are used in the economic literature to explain these phenomena: (i) information andcommunication technologies, which are capital intensive and skill intensive (Autor, Katz, & Krueger, 1998; Bound & Johnson,1992); (ii) changes and pressures induced by globalisation (Wood, 1994; Borjas & Ramey, 1995); (iii) internationalfragmentation, reorganization of production and outsourcing (see among the others, Bardhan & Kroll, 2003; Feenstra &Hanson, 2001; McKinsey, 2005). Nevertheless, while several empirical investigations have underlined the role oftechnological change and capital deepening on the increase of the high skilled workers’ demand (Machin & Van Reenen,
International Business Review 18 (2009) 357–372
A R T I C L E I N F O
Article history:
Received 14 July 2008
Received in revised form 26 February 2009
Accepted 6 April 2009
Keywords:
Demand for labour
Market seeking FDI
Resource seeking FDI
Skill composition
A B S T R A C T
The present paper adds to the literature investigating the effects of outward FDI on the
home country employment and skill composition. Considering the ‘‘industrial region’’ as
the unit of the analysis, we capture both direct and indirect effects of foreign production on
the parent company and its environment. The empirical evidence refers to the
internationalisation of production by Italian firms throughout the period 1996–2002,
and it shows that foreign activities have a negative impact upon the demand for low skilled
workers in the parent company’s ‘‘industrial region’’, but also on the demand for high
skilled workers when FDI are addressed to high income countries.
� 2009 Elsevier Ltd. All rights reserved.
* Corresponding author. Tel.: +39 02 2399 2740; fax: +39 02 2399 2710.
E-mail addresses: [email protected] (S. Elia), [email protected] (I. Mariotti), [email protected] (L. Piscitello).1 Tel.: +39 02 2399 2756; fax: +39 02 2399 2710.2 Tel.: +39 02 2399 3928; fax: +39 02 2399 4105.
Contents lists available at ScienceDirect
International Business Review
journa l homepage: www.e lsev ier .com/ locate / ibusrev
0969-5931/$ – see front matter � 2009 Elsevier Ltd. All rights reserved.
doi:10.1016/j.ibusrev.2009.04.001

1998; Piva & Vivarelli, 2004; Piva, Santarelli, & Vivarelli, 2003), the evidence on the impact of globalisation and internationaldivision of labour on the change of employment and wages of the MNEs’ parent companies and the involved countries is farfrom being conclusive (see Molnar, Pain, & Taglioni, 2007 for a recent survey). Additionally, empirical studies on the impactof outward FDI on domestic employment have so far:
(1) Focused mainly on the direct effect of foreign affiliate production on the MNE parent company (i.e., foreign activitiessubstitute the parent’s domestic employment or do they rather complement it?). Indeed, even when acknowledging theexistence of possible indirect effects on the MNE’s relevant business environment (customers, suppliers, competitors),the latter has been proxied by the MNE parent’s industry or home country;
(2) Proxied domestic skill composition with the share of skilled workers over the total employment at home. Hence,whenever such a ratio increased, it was seen as a sign of domestic skill upgrading.
This paper aims at adding to this literature in two ways. First, it investigates the overall impact of outward FDI on theMNE’s home country employment and its skill composition, by allowing for both direct (i.e., on the MNE’s parent) andindirect (i.e., on the parent’s relevant business environment) effects. In order to do that, the unit of analysis is the ‘‘regionalindustry’’, i.e., each ensemble of firms operating in the same industrial macro-sector—constituted by interdependent sectorsbelonging to the same industrial filiere—and localised in the same geographical region (see Mariotti, Mutinelli, & Piscitello,2003). In particular, we claim that the analysis run simply at the firm-level does not allow to take into account how foreignproduction affects the parent’s relevant business environment. The fundamental hypothesis is that the lion share of suchimpact is sectorally and spatially circumscribed within the regional industry (as previously defined) in which the firmoperates and carries out the most of its external relations.
Second, we investigate the impact of outward FDI on the skill composition of the MNE’s relevant regional industry byestimating the relative demand for both high and low skilled workers separately3 (Adams, 1999; Ahn, Fukao, & Ito, 2008;Driffield, Love, & Taylor, 2005; Ekholm & Hakkala, 2006; Hijzen, Gorg, & Hine, 2005). In fact, the effects of outwardinvestments on the skill composition of the parent company are difficult to capture (Agarwal, 1997), and this is even harderwhen the measure adopted to proxy skill composition and skill upgrading is the share of skilled workers over totalemployment (Feenstra & Hanson, 1996, 1999 and Slaughter, 2000 for the US; Anderton & Brenton, 1999 and Hijzen, Gorg, &Hine, 2005, for the UK; Head & Ries, 2002 for Japanese MNEs; Strauss-Kahn, 2003 for France; Anderton, Brenton, & Oscarsson,2002 and Hansson, 2005 for Sweden; Brenton & Pinna, 2001, Castellani, Mariotti, & Piscitello, 2008, and Helg & Tajoli, 2005for Italy). Indeed, such a ratio does not allow to single out the effects of outward FDI on each typology of workers (high vs. lowskilled), as the ratio might register an upsurge (reduction) when only low skilled employment (i.e., the denominator)decreases (increases), without any real change in the amount of high skilled workers, or when both high and low skilledworkers decrease, but the latter decreases more than the former.
Empirical evidence is provided with reference to the Italian case throughout the period 1996–2002. Using a SUReconometric technique, our analysis shows that (i) outward FDI has a significant negative impact upon the demand for lowskilled workers in the parent company’s regional industry, but (ii) this is true only for FDI addressed to lower wage countries(namely, Central and Eastern European – CEECs – countries), while FDI to high income markets (namely, OECD countries)does not seem to impact significantly on the demand for labour (neither high or low skilled workers). These findings areimportant for our understanding of the effects of outward FDI on the home country’s employment because they suggest thatnot all types of FDI do equally influence the domestic skill composition, and that only low skilled workforce is more likely tobe (negatively) affected by the MNEs’ internationalisation of production.
The remaining of the paper is organized as follows. The next section provides a brief review of the literature on direct andindirect effects of outward FDI on domestic employment and skill composition, and it illustrates our research approach. Thethird Section describes the empirical analysis, namely the model and the variables considered, the data employed and theresults obtained. The fourth Section concludes the paper.
2. Research background
2.1. Previous literature on the effects of outward FDI on domestic employment and skill composition
The theory of the multinational firm does not provide clear predictions on the effect of investment abroad on theemployment level and skill composition in the investing firm and its home country, but some of the mechanisms andeffects that outward FDI might have on the labour markets in source economies have been illustrated (see Barba Navaretti& Venables, 2004, Dunning & Lundan, 2008; Molnar, Pain, & Taglioni, 2007 for recent discussions). One of the most basicissues is the distinction between resource seeking and market seeking investments (Dunning, 1993). Specifically,‘‘resource seeking investments aim to acquire abroad particular and specific resources of a higher quality at a lower real
3 It is worth noting that we focus on the unidirectional line of causation from outward FDI to domestic employment. However, the causation might run
also in the opposite direction. This is the case of Japan, where the early stages of outward FDI were motivated by the shortage of unskilled workers in labour-
intensive industries at home (Ozawa, 2005). Although this is not the case with Italy, the same has happened in other countries like Korea and Taiwan, We
particularly thank an anonimous referee for providing us with the stimulus of clarifying this issue.
S. Elia et al. / International Business Review 18 (2009) 357–372358

cost than could be obtained in their home country. Resources include physical resources but also cheap and wellmotivated unskilled or semiskilled labour’’ (Dunning & Lundan, 2008, p. 68). Market seeking investments aim instead tosupply goods or services to markets in the target or adjacent countries.4 Therefore, as concerns the effects on homeemployment level, and particularly the relationship between employment in the parent company and its foreignaffiliates, firms undertaking resource seeking investments are more likely to re-locate some of the labour intensiveactivities in low cost countries, as these initiatives are principally driven by differences in factor endowments betweenhome and host countries, and they are explained by the need to exploit location specific factors of production. As aconsequence, the structure of domestic production may change, since low skilled employment decreases. Hence, theeffect on the domestic market would be, ceteris paribus, a net decrease in the employment level. Nonetheless, because ofother compensatory effects, the ceteris paribus condition does not generally hold. In fact, the increased efficiencyassociated to the new structure of the production chain can enhance the parent company’s competitive position andincrease its (domestic and foreign) market share through positive externalities exerted on domestic production anddemand (Chen & Ku, 2003). Additionally, as the presence abroad might stimulate exports, foreign production mightpositively impact on domestic production, thus complementing it. As far as the impact on skill composition, resourceseeking (or cost saving) investments are likely to lead to skill upgrading at home, as they often occur through therelocation of labour intensive production phases to foreign countries where wages are lower. However, it is worth notingthat this concern that multinationals are exporting jobs has been recently extended also to white collars and/or skilledemployees, due to the increasing outsourcing.
The effect of market seeking investments on the employment of the parent company is also ambiguous (for a survey, seeAgarwal, 1997). On the one hand, foreign affiliates often substitute previous exports from the parent company. If this is thecase, foreign activities reduce production (and employment) in the domestic activities at home. On the other hand, wheneverthe foreign activity replicates abroad only the final segment of production, the demand for intermediate goods and servicesproduced by the parent company would rise, thus increasing domestic production and the relevant employment. Likewise,especially for multi-product companies, activities abroad may increase their penetration on foreign markets and oftendetermine a bandwagon effect on exports of other product varieties within the same firm. Additionally, it is also worthconsidering that foreign activities that are geographically dispersed are likely to require more supervision, coordination andcontrol, i.e., those ‘‘headquarter services’’ (such as R&D, finance, marketing, logistics, etc.), which are typically concentratedin the parent company. Hence, outward FDI might also crucially impact the domestic skill composition, as the parentcompany’s requirements for high-skilled workers and white collars increase (Blomstrom, Fors, & Lipsey, 1997; Castellani,Mariotti, & Piscitello, 2008; Driffield & Chiang, 2007; Fors & Kokko, 1999; Helpman & Krugman, 1985; Mariotti, Mutinelli, &Piscitello, 2003).
2.2. Our approach
We argue that this is only part of the story. Outward FDI may have (direct) effects not just on the parent company’sdomestic employment but also (indirect) effects on the business environment in which it operates (Mariotti & Piscitello,2007; Mariotti, Mutinelli, & Piscitello, 2003; Savona & Schiattarella, 2004). Namely, the latter refers to subcontractingrelations and local externalities induced by the demand (originated from the parent company and its foreign affiliates) forspecialised inputs, services, managerial and operative skills (Rodrigues-Clare, 1996), and it has to do with the so called‘‘supporting firm employment effect’’ (Dunning & Lundan, 2008, p. 426). Indeed, production in foreign affiliates couldinduce:
- Substitutive effects on domestic employment in the local context in which the MNE operates due to: (i) the reduction ofdomestic low skilled labour force; (ii) a loss of market shares by local suppliers, and a loss of the opportunity to learnand grow through the relationship with the parent company; and (iii) the write-off of previous subcontractingrelations;
- Complementary effects, whenever the enhanced competitive position of the parent company and its additional demandfor specialised inputs do increase the externalities on the local context. The transfer of production abroad may have apositive effect when the parent company’s suppliers become also suppliers for the foreign affiliates. In such a case, themarket for suppliers could even expand, at least as long as the costs for logistics and reorganisation do not overwhelmthe marginal advantage. Specifically, resource seeking FDI may induce upgrading in the local system and in the supplychain competitiveness by promoting a differentiation in specialisation and competencies between countries, with theconsequent development of a quality service sector linked to it (Mariotti & Piscitello, 2007; Savona & Schiattarella,2004). Similarly, the effects of market seeking investments (for instance, in terms of greater requirements for highly
4 It is worth observing that sometimes literature distinguishes between vertical and horizontal investments. The former refer to investments through
which different stages of production are geographically fragmented across different countries with the location of such stages depending on where the
factor of production they use intensively is relatively cheap (Braconier, Norback, & Urba, 2005). The latter are instead defined as the replication of all or part
of the home production process in a foreign country, thus producing similar output in both home and host countries, and economising on any cost of
exporting (Molnar, Pain, & Taglioni, 2007).
S. Elia et al. / International Business Review 18 (2009) 357–372 359

skilled workers and white collar employees) could also extend to the whole economic area in which the parentcompany operates, because of the externalities generated by the induced demand for specialised inputs and highskilled labour.
Moreover, previous empirical studies on the influence of globalisation on the demand for skilled labour do often adoptproxies that measure skill upgrading only indirectly. Instead, we claim that the most popular proxy, i.e., the share of highskilled workers over total employment [high skilled/(high skilled + low skilled)], may lead to misleading conclusions as itmay point to skill upgrading even when the high skilled component does not change at all. In fact, the ratio may increasebecause of the reduction of low skilled employment, as well as from the unbalanced decrease in both high and low skilledworkers (but the latter decreases more than the former). Within this context, the analysis by Head & Ries (2002) onJapanese MNEs in the period 1956–1990 shows a positive and significant effect of outward investments on the parentcompany’s skill intensity only when foreign affiliates are located in low-income countries. The measure adopted for skillintensity is defined as wHH/(wHH + wLL), where H and L are high and low-skilled workers and wH and wL are their respectivewages. Slaughter (2000) demonstrates that the US industry data provide no support for a positive relationship betweenMNEs activities and skill upgrading (measured by the nonproduction worker share of the wage bill of US industries) overthe 1977–1994 period. Using the same proxy, Feenstra & Hanson (1996) find that foreign outsourcing (defined by theauthors as the substitution of imported inputs and finished goods for domestically produced goods) can account for 18.9–21.3% of the observed increase in the nonproduction worker share of the wage bill for their 4-digit SIC industries sample in1979–1990. Likewise, Hansson (2005) finds that the relocation of activities by Swedish MNEs to non-OECD regions (CEEcountries in particular) contributed to the skill upgrading of their home activities, as measured by the level change in theskilled-labour share of the total wage bill, in the period 1990–1997. Ito & Fukao (2005) found that vertical intra-industrytrade with Asian countries or imports from Asian countries had a significant positive impact on the skilled labour share inJapan. More recently, Castellani, Mariotti, & Piscitello (2008), studying Italian manufacturing firms that becamemultinational (for the first time) in the period 1998–2003, find a positive and significant impact on the share of skilledworkers in parent companies. However, such a result holds only when foreign initiatives are undertaken in Central andEastern European countries.
Although such apparent univocal results, it is worth noting that they are not always robust to changes in the unit level ofanalysis. In fact, evidence significantly differs when adopting the firm level, the industry level or the regional-industry level,as they capture different effects (direct vs. indirect) of outward FDI. For instance, Head & Ries (2002) find that foreigninvestments in low income countries have a positive and significant effect on the skill intensity of Japanese MNEs’ parentcompanies, but such an effect disappears when repeating the analysis at the industry level. Mixed results emerge also whenestimating relative demand for low and high skilled labour separately. Namely, Driffield, Love, & Taylor (2005), investigatingoutward FDI undertaken by UK MNEs’ over the period 1987–1996, find that foreign investments reduce the demand for lowskilled labour, and to some extent also for high skilled labour, at home. However, while the former is associated with FDI thatare strongly motivated by the search for lower factor costs, the latter refer to technology seeking FDI directed to foreigncountries that are more R&D intensive than the UK.
Likewise, using a cost function approach to estimate the effect of offshoring of intermediate input production on thecomposition of labour demand, Ekholm & Hakkala (2006) find that offshoring to low-wage economies tend to shift demandaway for workers with upper secondary education, benefiting workers in the highest skill group. On the other hand, they donot find any statistically significant effect of offshoring to high-income countries on domestic employment.
Following these latter studies, which adopted structural equations for estimating factor demand, we investigate theimpact of outward FDI separately on both high and low skilled workers.
3. The empirical analysis
3.1. The model
The dynamics of high and low skilled employment has been traditionally analysed mainly through the use of a translogcost function, whose specification depends on the inputs that are assumed to be part of the cost and production functions (forfurther details, see Berndt, 1990; Christensen, Jorgenson, & Lau, 1973; Diewert, 1974). As in Adams (1999), we assume thatthe variable inputs are labour (both high skilled and low skilled) and materials; instead, capital and technology areconsidered to be quasi-fixed factors since they require a long period to change (Berman, Bound, & Griliches, 1994). Therefore,using material price as numeraire, the final normalized translog function becomes:
lnC
wM
� �¼ a0 þ
Xk¼H;L
Xj¼H;L
bk; j lnwk
wMln
w j
wMþ bY lnY þ
Xj¼H;L
b j;Y lnw j
wMlnY þ bY Tech Changeþ
Xj¼H;L
b j;Y lnw j
wMTech Change
þ bY lnK þXj¼H;L
b j;Y lnw j
wMlnK þ
Xj¼H;L
b j;uu j lnw j
wMþ uc
where wM is the cost of materials, w j is either the cost of high (H) or the cost of low (L) skilled workers, Y is the output,Tech_Change is technological change, K the capital, and uc the error term.
S. Elia et al. / International Business Review 18 (2009) 357–372360

According to the Shephard’s Lemma, the cost share for each input j, which also expresses the demand for that input, isgiven by:
s j ¼dlnðC=wMÞdlnðwJ=wMÞ
Hence, by differentiating the cost function with respect to the relative price of high and low skilled workers, we obtain thefollowing system of cost share functions:
sL ¼ aL þX
j¼L;HbL; j ln
w j
wMþbLY lnY þ bLK lnK þ bLRTech Changeþ uL
sH ¼ aH þX
j¼L;HbH; j ln
w j
wMþbHY lnY þ bHK lnK þ bHRTech Changeþ uH
8><>:
Since the aim of our analysis is to understand whether outward FDI is among the factors affecting the demand for highskilled and low skilled workers, we augment the equations by adding the FDI term:
sL ¼ aL þXj¼L;H
bL; j lnw j
wMþbLY lnY þ bLK lnK þ bLRTech Changeþ bLIFDI þ uL
sH ¼ aH þX
j¼L;HbH; j ln
w j
wMþbHY lnY þ bHK lnK þ bHRTech Changeþ bHIFDI þ uH
8>><>>:
It may not be out of place here reminding that our observation unit is not the firm but the ‘‘regional industry’’ defined asthe ensemble of firms operating in the same industrial macro-sector—constituted by interdependent sectors belonging tothe same industrial filiere—and localised in the same geographical region (see Mariotti, Mutinelli, & Piscitello, 2003).Specifically, as a proxy for the regional industry, we considered the combination of the 20 Italian administrative regions(defined at the NUTS2 level5), and 9 manufacturing macro sectors (see Table 1 for the detailed description of regions andindustries). Such a definition is intentionally based on a quite aggregate level in order to capture the most of theinterdependencies between parent companies and their business environment, with reference to both the intersectoralrelations6 and their spatial dimension. As far as the Italian case is concerned, the hypothesis is corroborated by thedistinctive nature of the Italian industrial system whose competitiveness is grounded on a specific structure based on localsystems, which allow to exploit agglomerative advantages and to capture the efficiency of proximity between suppliersand users (Porter, 1992; Mariotti, Mutinelli, & Piscitello, 2008). However, as the empirical literature has variouslyconfirmed the role of geographical proximity and face-to-face communication in buyer-supplier relationships (e.g., Dyer &
Table 1
Italian NUTS 2 regions and industries.
Italian NUTS 2 regions Industries (NACE codes)
Abruzzo Food, beverage, tobacco (FBT)—15, 16
Basilicata Textile, clothing, leather, shoes (TEX)—17, 18, 19
Calabria Paper, printing, publishing (PAP)—20, 21, 22
Campania Chemicals, pharmaceuticals (CPH)—23, 24, 25
Emilia Romagna Non-metallic products (NMP)—26
Friuli Venezia Giulia Metals (MET)—27
Lazio Metal products, machinery (MAC)—28, 29, 31, 32, 33
Liguria Transport equipments (TRA)—34, 35
Lombardy Other manufacturing (OTH)—36, 40, 41, 45
Marche
Molise
Piedmont
Puglia
Sardinia
Sicily
Tuscany
Trentino Alto Adige
Umbria
Valle d’Aosta
Veneto
5 The Nomenclature of Territorial Units for Statistics (NUTS) refers to the Eurostat scheme of classification. It is based on the institutional divisions
currently in force in the member states, according to the tasks allocated to territorial communities, to the sizes of population necessary to carry out these
tasks efficiently and economically, and to historical, cultural and other factors.6 We are aware that this high aggregate level might lead to attribute to FDI other employment variations occurring in the regional industry, i.e., variations
which have nothing to do with it. Nevertheless, an excessively disaggregate sectoral breakdown might miss the filiere effect, as it would ascribe the FDI
impact only to a single unit even when it is attributable to another unit or to several units at the same time. A trade-off does actually exist but the chosen
level seems to be reasonably appropriate to face it.
S. Elia et al. / International Business Review 18 (2009) 357–372 361
Chu, 2003 for US, Japan and Korea; Bonte, 2008 for Germany), we believe the same concept may be easily applicable also toother countries.7
3.2. Data and variables
As our aim is to understand whether and how outward FDI undertaken by Italian firms in a certain period do influence thecomposition of domestic employment in their regional industry, our dependent variables refer to the growth rate of bothhigh skilled and low skilled workers (in the relevant regional industry) in the period 1996–2002. Data come from the ItalianNational Institute for Social Security (INPS), which provides a census of manual workers, clerks and managers in Italian firms.Specifically, we associate manual workers to the low skilled category, while clerks and managers to the high skilledcategory.8 Therefore, our variables are defined as follows:
D0296logHi:r ¼ logHigh skilledi;r;2002 � logHigh skilledi;r;1996
D0296logLi:r ¼ logLow skilledi;r;2002 � logLow skilledi;r;1996
where r = 1, .. 20 regions, and i = 1, . . ., 9 macro sectors.Therefore, the equations to be estimated are the following:
D0296logHi:r ¼ aL þ
Xj¼L;H
bL; jD0296ln
w j
wMþbLYD
0296lnYi;r þ bLKD
0296lnKi;r þ bLR
X02
96
Tech changei;r þ bLI
X00
94
FDIi;r þ uL
D0296logLi:r ¼ aH þ
Xj¼L;H
bH; jD0296ln
w j
wMþbHYD
0296lnYi;r þ bHKD
0296lnKi;r þ bHR
X02
96
Tech changei;r þ bHI
X00
94
FDIi;r þ uH
8>>>>><>>>>>:
According to empirical studies mentioned in Section 2 and data availability, we considered the following explanatoryvariables:
- X00
94
FDIi;r is the number of employees located abroad in foreign affiliates by Italian firms belonging to industry i and region r
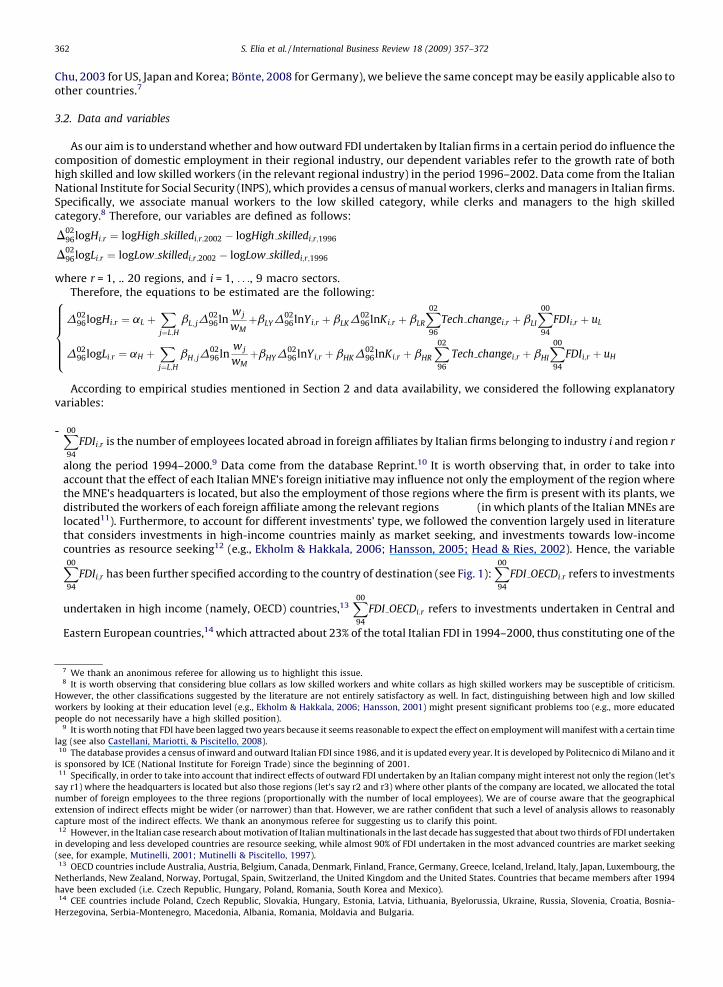
along the period 1994–2000.9 Data come from the database Reprint.10 It is worth observing that, in order to take intoaccount that the effect of each Italian MNE’s foreign initiative may influence not only the employment of the region wherethe MNE’s headquarters is located, but also the employment of those regions where the firm is present with its plants, wedistributed the workers of each foreign affiliate among the relevant regions (in which plants of the Italian MNEs arelocated11). Furthermore, to account for different investments’ type, we followed the convention largely used in literaturethat considers investments in high-income countries mainly as market seeking, and investments towards low-incomecountries as resource seeking12 (e.g., Ekholm & Hakkala, 2006; Hansson, 2005; Head & Ries, 2002). Hence, the variable
X00
94
FDIi;r has been further specified according to the country of destination (see Fig. 1):X00
94
FDI OECDi:r refers to investments
undertaken in high income (namely, OECD) countries,13X00
94
FDI OECDi:r refers to investments undertaken in Central and
Eastern European countries,14 which attracted about 23% of the total Italian FDI in 1994–2000, thus constituting one of the
7 We thank an anonimous referee for allowing us to highlight this issue.8 It is worth observing that considering blue collars as low skilled workers and white collars as high skilled workers may be susceptible of criticism.
However, the other classifications suggested by the literature are not entirely satisfactory as well. In fact, distinguishing between high and low skilled
workers by looking at their education level (e.g., Ekholm & Hakkala, 2006; Hansson, 2001) might present significant problems too (e.g., more educated
people do not necessarily have a high skilled position).9 It is worth noting that FDI have been lagged two years because it seems reasonable to expect the effect on employment will manifest with a certain time
lag (see also Castellani, Mariotti, & Piscitello, 2008).10 The database provides a census of inward and outward Italian FDI since 1986, and it is updated every year. It is developed by Politecnico di Milano and it
is sponsored by ICE (National Institute for Foreign Trade) since the beginning of 2001.11 Specifically, in order to take into account that indirect effects of outward FDI undertaken by an Italian company might interest not only the region (let’s
say r1) where the headquarters is located but also those regions (let’s say r2 and r3) where other plants of the company are located, we allocated the total
number of foreign employees to the three regions (proportionally with the number of local employees). We are of course aware that the geographical
extension of indirect effects might be wider (or narrower) than that. However, we are rather confident that such a level of analysis allows to reasonably
capture most of the indirect effects. We thank an anonymous referee for suggesting us to clarify this point.12 However, in the Italian case research about motivation of Italian multinationals in the last decade has suggested that about two thirds of FDI undertaken
in developing and less developed countries are resource seeking, while almost 90% of FDI undertaken in the most advanced countries are market seeking
(see, for example, Mutinelli, 2001; Mutinelli & Piscitello, 1997).13 OECD countries include Australia, Austria, Belgium, Canada, Denmark, Finland, France, Germany, Greece, Iceland, Ireland, Italy, Japan, Luxembourg, the
Netherlands, New Zealand, Norway, Portugal, Spain, Switzerland, the United Kingdom and the United States. Countries that became members after 1994
have been excluded (i.e. Czech Republic, Hungary, Poland, Romania, South Korea and Mexico).14 CEE countries include Poland, Czech Republic, Slovakia, Hungary, Estonia, Latvia, Lithuania, Byelorussia, Ukraine, Russia, Slovenia, Croatia, Bosnia-
Herzegovina, Serbia-Montenegro, Macedonia, Albania, Romania, Moldavia and Bulgaria.
S. Elia et al. / International Business Review 18 (2009) 357–372362

preferred destination areas by Italian MNEs, andX00
94
FDI OECDi:r refers to the investments undertaken in other low-income
developing countries (data on the detailed breakdown of outward FDI by region, industry and destination country arereported in Tables A1–A4 in the Appendix).
- The proxy for technological changeP02
96 Tech changei;r
� �refers to the cumulated sum of patents granted to region r in
industry i over the period considered, weighted by the total number of employees in the same industrial region (asat the beginning of the period of analysis). Data comes from the Crenos research institute of the University ofCagliari.15
- The proxy used for capital (D0296lnKi;r) has been built through the perpetual inventories method, by using the year 1996 as
basis.16 The data used to obtain the capital through the perpetual inventory method are the gross fixed investments,17
which have been provided for each region-industry couple at current prices for each year of the period 1996–2002. Theother data employed for capital are the productivity growth of each region, the employment growth rate for each regionand the national depreciation rate of the capital: the first two data come from the Eurostat database, while the third one hasbeen derived by using data provided by the Italian Statistical Institute (ISTAT).
- The variable D0296lnYi;r is measured in terms of value added expressed at current prices for the years 1996 and 2002. Data
come from the Italian Statistical Institute (ISTAT).- Wage data (w j with j = L, H) come from the INPS database. Specifically, the salary of high skilled workers (wH) has been
computed as the mean between the wages of clerks and managers.
Finally, we introduced region and industry dummies in order to control for fixed effects.Descriptive statistics and correlation coefficients for dependent and explanatory variables are reported in Table 2.
3.3. Results
Following Ekholm & Hakkala (2006), we estimate the system using a seemingly unrelated regression (SUR) to take apossible correlation between the residuals of the two equations into account.
Estimation results are reported in Tables 3–5. Specifically, Table 3 reports estimation of models without dummies, whileTables 4 and 5 report estimations of models in which region and industry dummies have been inserted, respectively. Theresults (in all the three tables) have been reported illustrating first results for the overall FDI (i.e., irrespective of destinationcountries) undertaken by Italian MNEs, then for FDI addressed to high income countries, and finally for FDI in low incomecountries (namely, CEE countries and other less developed countries).
Results from models run without fixed effect dummies (Table 3) reveal that domestic demand for labour decreases forlow skilled workers and this is due both to capital-biased technological change (as witnessed by the positive and always
Fig. 1. Geographical breakdown of outward FDI (in terms of number of employees) by Italian companies, 1994–2000.
15 Specifically, data refer to patents granted to Italian inventors from 1996 to 2002. These data have been associated to each industry-region, according to
the Yale Technology Concordance (YTC) table, which allows to convert the International Patent Classification (IPC) provided by the EPO into the NACE codes,
and to the origin of the inventors, respectively.16 The capital of the initial year (1996) has been computed as follows: Ki;r;1996 ¼ Ii;r;1996=ðni þ pi þ dÞ, where Ii,r,1996 are the gross fixed investments of the
year 1996, while ni + pi + d are the productivity growth of each region, the employment growth rate for each region and the national depreciation rate of the
capital, respectively. To compute the capital for the year 2002, the accumulation law that has been used is: Ki,r,t+1 = (1 � d)Ki,r,t + Ii,r,t.17 The gross fixed investments data come from the Eurostat database.
S. Elia et al. / International Business Review 18 (2009) 357–372 363

Table 2
Descriptive statistics and correlation coefficients.
D0296logHi;r D
0296logLi;r D
0296log
wH i;rwM i
D0296log
wL irwM i
D0296logYi;r D
0296logKi;r
X02
t¼96
Tech Changeti;r
X00
t¼94
FDI TOTt;i;r
X00
t¼94
FDI OECDt;i;r
X00
t¼94
FDI CEEt;i;r
X00
t¼94
FDI DEVt;i;r
Obs. (no.) 172 172 165 165 150 155 171 172 172 172 172
Mean �0.047 �0.022 �0.015 �0.090 0.100 0.420 0.003 1876.136 927.980 447.918 500.238
Std. dev. 0.221 0.200 0.118 0.111 0.321 0.328 0.005 5254.414 2969.257 1499.915 1247.742
Min �0.841 �0.553 �0.327 �0.337 �0.692 �0.072 0 0 0 0 0
Max 0.572 0.482 0.343 0.308 2.053 1.954 0.027 54116.110 31596.100 15445.290 7865.310
D0296logHi;r 1
D0296logLi;r 0.4019* 1
D0296log
wH i;rwM i
�0.1617* �0.3324*
1
D0296log
wL i;rwM i
�0.2021* �0.2029* 0.6271*
1
D0296logYi;r 0.1992* 0.0997 �0.3107* �0.2365* 1
D0296logKi;r 0.0244 0.1024 0.1138 0.0414 0.0878 1
X02
t¼96
Tech Changeti;r 0.2842* 0.1639* �0.2952* �0.2822* 0.0495 0.0009 1
X00
t¼94
FDI TOTt;i;r �0.0335 �0.1389* 0.0483 0.0145 �0.0939 �0.1106 0.1514* 1
X00
t¼94
FDI OECDt;i;r �0.0401 �0.1076 0.0347 0.0334 �0.0776 �0.0813 0.1642* 0.9727* 1
X00
t¼94
FDI CEEt;i;r �0.0159 �0.1661* 0.0344 �0.0364 �0.0518 �0.1112 0.1265* 0.8746* 0.7881* 1
X00
t¼94
FDI DEVt;i;r �0.0267 �0.1294* 0.0794 0.0253 �0.1755* �0.1584* 0.0946 0.8450* 0.7691* 0.6057* 1
* Significance at 10%.
S.E
liaet
al./In
terna
tion
al
Bu
siness
Rev
iew1
8(2
00
9)
35
7–
37
23
64

Table 3
SUR models without dummies.
Dep. variable Total FDI FDI_OECD FDI_CEE FDI_DEV
D0296logHi;r D
0296logLi;r D
0296logHi;r D
0296logLi;r D
0296logHi;r D
0296logLi;r D
0296logHi;r D
0296logLi;r
D0296log
wH i;rwM i
0.063 (0.31) �0.621*** (�3.51) 0.058 (0.29) �0.636*** (�3.58) 0.065 (0.32) �0.602*** (�3.39) 0.059 (0.29) �0.616*** (�3.48)
D0296log
wL i;rwM i
�0.215 (�1.02) 0.030 (0.16) �0.206 (�0.98) 0.047 (0.25) �0.220 (�1.05) 0.009 (0.05) �0.218 (�1.04) 0.009 (0.05)
D0296logKi;r 0.007 (0.11) 0.110* (1.96) 0.008 (0.12) 0.115** (2.04) 0.008 (0.13) 0.108* (1.93) 0.008 (0.13) 0.104* (1.84)
D0296logYi;r 0.114* (1.94) �0.029 (�0.56) 0.114* (1.94) �0.027 (�0.52) 0.117** (1.98) �0.024 (�0.47) 0.113* (1.90) �0.040 (�0.77)
X02
t¼96
Tech Changeti;r 0.059*** (3.21) 0.018 (1.14) 0.060*** (3.25) 0.018 (1.09) 0.057*** (3.16) 0.017 (1.04) 0.058*** (3.14) 0.019 (1.17)
X00
t¼94
FDIt;i;r �0.015 (�0.80) �0.032** (�2.01) �0.018 (�0.97) �0.027* (�1.66) �0.009 (�0.54) �0.031** (�2.07) �0.010 (�0.43) �0.045** (�2.23)
Constant �0.085** (�2.47) �0.071** (�2.36) �0.085** (�2.46) �0.072** (�2.37) �0.086** (�2.49) �0.071** (�2.36) �0.086** (�2.50) �0.072** (�2.38)
Region dummies No No No No No No No No
Industry dummies No No No No No No No No
Obs. 146 146 146 146 146 146 146 146
R2 0.1250 0.1736 0.1268 0.1667 0.1230 0.1750 0.1223 0.1788
x2 20.86 30.68 21.21 29.21 20.47 30.97 20.35 31.80
p value 0.0019 0.0000 0.0017 0.0001 0.0023 0.0000 0.0024 0.0000
* If p < 0.10, ** if p < 0.05; *** if p < 0.01.
Note. The Breusch–Pagan test for the independence of errors rejects the hypothesis that the errors of the two equations are independent for all the specifications, hence, it confirms that the two equations are highly
correlated and that the SUR analysis is appropriate for our specification.
S.E
liaet
al./In
terna
tion
al
Bu
siness
Rev
iew1
8(2
00
9)
35
7–
37
23
65

Table 4
SUR models with region dummies.
Dep. variable Total FDI FDI_OECD FDI_CEE FDI_DEV
D0296logHi;r D
0296logLi;r D
0296logHi;r D
0296logLi;r D
0296logHi;r D
0296logLi;r D
0296logHi;r D
0296logLi;r
D0296log
wH i;rwM i
�0.019 (�0.09) �0.916*** (�4.52) �0.026 (�0.11) �0.923*** (�4.53) �0.013 (�0.06) �0.895*** (�4.42) �0.017 (�0.07) �0.913*** (�4.50)
D0296log
wL i;rwM i
�0.080 (�0.38) 0.300 (1.58) �0.069 (�0.33) 0.314 (1.64) �0.088 (�0.41) 0.272 (1.44) �0.083 (�0.39) 0.281 (1.48)
D0296logKi;r �0.053 (�0.75) 0.078 (1.25) �0.053 (�0.75) 0.081 (1.28) �0.052 (�0.74) 0.077 (1.24) �0.051 (�0.72) 0.075 (1.19)
D0296logYi;r 0.150*** (2.61) �0.028 (�0.54) 0.150*** (2.62) �0.027 (�0.53) 0.151*** (2.62) �0.024 (�0.47) 0.150*** (2.59) �0.036 (�0.69)
X02
t¼96
Tech Changeti;r 0.069*** (3.62) 0.022 (1.31) 0.070*** (3.66) 0.022 (1.29) 0.068*** (3.59) 0.021 (1.23) 0.067*** (3.55) 0.022 (1.28)
X00
t¼94
FDIt;i;r �0.013 (�0.70) �0.030* (�1.87) �0.016 (�0.92) �0.024 (�1.52) �0.008 (�0.47) �0.032** (�2.07) �0.002 (�0.07) �0.039* (�1.87)
Constant �0.046 (�0.79) �0.022 (�0.42) �0.044 (�0.77) �0.032 (�0.62) �0.050 (�0.84) �0.015 (�0.28) �0.059 (�1.01) �0.024 (�0.46)
Region dummies Yes Yes Yes Yes Yes Yes Yes Yes
Industry dummies No No No No No No No No
Obs. 146 146 146 146 146 146 146 146
R2 0.3116 0.3280 0.3133 0.3226 0.3103 0.3316 0.3093 0.3280
x2 66.07 71.25 66.60 69.54 65.70 72.43 65.38 71.25
p value 0.0000 0.0000 0.0000 0.0000 0.0000 0.0000 0.0000 0.0000
*If p < 0.10, ** if p < 0.05; *** if p < 0.01.
Note. The Breusch–Pagan test for the independence of errors rejects the hypothesis that the errors of the two equations are independent for all the specifications, hence, it confirms that the two equations are highly
correlated and that the SUR analysis is appropriate for our specification.
S.E
liaet
al./In
terna
tion
al
Bu
siness
Rev
iew1
8(2
00
9)
35
7–
37
23
66

Table 5
SUR models with industry dummies.
Dep. variable Total FDI FDI_OECD FDI_CEE FDI_DEV
D0296logHi;r D
0296logLi;r D
0296logHi;r D
0296logLi;r D
0296logHi;r D
0296logLi;r D
0296logHi;r D
0296logLi;r
D0296log
wH i;rwM i
0.330* (1.38) �0.143 (�0.83) 0.317 (1.33) �0.159 (�0.92) 0.344 (1.44) �0.129 (�0.74) 0.331 (1.38) �0.135 (�0.78)
D0296log
wL i;rwM i
0.196 (0.69) �0.004 (�0.02) 0.205 (0.72) 0.005 (0.02) 0.192 (0.67) �0.010 (�0.05) 0.182 (0.64) �0.024 (�0.11)
D0296logKi;r �0.007 (�0.10) 0.096** (2.06) �0.005 (�0.08) 0.098** (2.11) �0.005 (�0.08) 0.099** (2.11) �0.005 (�0.08) 0.094** (1.99)
D0296logYi;r 0.061 (0.99) �0.034 (�0.77) 0.062 (1.00) �0.033 (�0.75) 0.065 (1.05) �0.030 (�0.66) 0.063 (1.01) �0.037 (�0.83)
X02
t¼96
Tech Changeti;r 0.025 (1.10) 0.040** (2.44) 0.026 (1.13) 0.041** (2.47) 0.024 (1.04) 0.038** (2.32) 0.023 (1.02) 0.039** (2.36)
X00
t¼94
FDIt;i;r �0.028 (�1.58) �0.033*** (�2.58) �0.030* (�1.69) �0.033*** (�2.57) �0.024 (�1.45) �0.027** (�2.20) �0.022 (�0.97) �0.038** (�2.35)
Constant �0.077 (�1.19) 0.192*** (4.11) �0.077 (�1.19) 0.192*** (4.10) �0.075 (�1.16) 0.193*** (4.11) �0.079 (�1.21) 0.188*** (4.02)
Dummy CPH 0.134* (1.69) �0.295*** (�5.15) 0.130* (1.65) �0.298*** (�5.21) 0.138* (1.73) �0.290*** (�5.05) 0.135* (1.70) �0.292*** (�5.09)
Dummy FBT �0.114* (�1.15) �0.295*** (�4.10) �0.113 (�1.14) �0.294*** (�4.08) �0.119 (�1.19) �0.300*** (�4.14) �0.107 (�1.07) �0.284*** (�3.94)
Dummy MAC 0.208*** (2.82) �0.167*** (�3.13) 0.210*** (2.85) �0.166*** (�3.11) 0.204*** (2.77) �0.174*** (�3.25) 0.196*** (2.67) �0.175*** (�3.29)
Dummy MET �0.233* (�1.89) �0.348*** (�3.92) �0.227* (�1.85) �0.342*** (�3.85) �0.242** (�1.96) �0.358*** (�4.01) �0.233* (�1.89) �0.348*** (�3.91)
Dummy NMP 0.084 (1.20) �0.214*** (�4.25) 0.084 (1.21) �0.214*** (�4.24) 0.082 (1.17) �0.216*** (�4.26) 0.084 (1.19) �0.213*** (�4.22)
Dummy PAP 0.023 (0.28) �0.233*** (�3.88) 0.024 (0.28) �0.233*** (�3.87) 0.023 (0.28) �0.233*** (�3.86) 0.023 (0.28) �0.233*** (�3.86)
Dummy TEX 0.018 (0.23) �0.477*** (�8.83) 0.014 (0.18) �0.482*** (�8.92) 0.023 (0.30) �0.472*** (�8.65) 0.016 (0.21) �0.478*** (�8.80)
Dummy TRA 0.164** (2.00) �0.315*** (�5.31) 0.163** (1.99) �0.317*** (�5.34) 0.157* (1.92) �0.323*** (�5.43) 0.166** (1.99) �0.304*** (�5.06)
Obs. 146 146 146 146 146 146 146 146
R2 0.2280 0.5076 0.2298 0.5074 0.2259 0.5016 0.2198 0.5039
x2 43.12 150.50 43.57 150.400 42.60 146.96 41.13 148.28
p value 0.0001 0.0000 0.0001 0.0000 0.0001 0.0000 0.0002 0.0000
*If p < 0.10, ** if p < 0.05, *** if p < 0.01.
Note. The Breusch–Pagan test for the independence of errors rejects the hypothesis that the errors of the two equations are independent for all the specifications, hence, it confirms that the two equations are highly
correlated and that the SUR analysis is appropriate for our specification.
S.E
liaet
al./In
terna
tion
al
Bu
siness
Rev
iew1
8(2
00
9)
35
7–
37
23
67

significant coefficient for the variable D0296lnKi;r) and to foreign production undertaken by Italian companies (the variables
related to the amount of foreign employees is always negative and significant at least at p < 0.10, for any destinationcountry). Interestingly, the same results hold when inserting region dummies (Table 4), while inserting industry dummies(Table 5), i.e., taking into account that the internationalisation processes by Italian industrial regions have a stronger interindustry (rather than inter region) variance (see Tables A1–A4 in the Appendix), it emerges that foreign activities donegatively impact (at least at p < 0.05) on the demand for low skilled workers at home (i.e., in each industrial region), butalso on the demand for high skilled workers when FDI are addressed to high income countries (the coefficient of the variable
X00
94
FDI OECDi:r is negative and significant at p < 0.10).
These results are consistent with the idea that foreign investments addressed to low income countries are mainlyresource seeking investments of a cost-saving type, thus implying the transfer of labour-intensive activities from the hometo the host countries and, hence, a decrease of demand for domestic low-skilled workers. However, the results reveal alsothat foreign production negatively impact on the domestic demand for labour even when FDI are directed to high incomecountries. Interestingly, this holds both for low and high skilled labour. Specifically, the impact on low skilled labour may berelated to the fact that cost saving investments have been increasingly undertaken also in high income countries (see Alfaro& Charlton, 2007); the negative impact on high skilled labour may be instead related to the increasing outsourcing of servicesand activities that had been traditionally maintained within the headquarters18 (Dunning & Lundan, 2008).
Therefore, compared to earlier studies in which there appears to be a generalised consensus about the skill upgrading of thedomestic employment stemming from MNEs’ foreign production, this study confirms that outward internationalisationundertaken by Italian firms induces (negative) changes in the demand for low skilled workers, but also for high skilled workerswhen FDI are addressed to high income countries.19 Our results are in line with previous findings on skill upgrading stemmingfrom FDI in low income countries (e.g., Ekholm & Hakkala, 2006; Hansson, 2004; Head & Ries, 2002). However, the negativeimpact of FDI in high income countries on the demand for high skilled workers has been already obtained by Driffield, Love, &Taylor (2005)20 who justify it by assuming those FDI to be mainly technology seeking rather than market seeking.21
4. Conclusion and discussion
The paper contributes to the debate concerning the impact of internationalisation of production on labour and itscomposition in the home country. Within this debate, where outward FDI (especially those addressed towards low incomecountries) are responsible for the substitution of employment between parent companies and foreign affiliates, this is the firststudy (at least to our knowledge) aiming at assessing both direct and indirect effects on the parent company and its relevantenvironment, defined both at the industrial and geographical level. Indeed, international production may involve an increase incompetitiveness of the firm investing abroad in terms of productivity, output and trade, labour intensity and skills, managerialcapabilities, technological sourcing, etc. This holds intuitively when firms that relocate abroad are likely to move their relativelyinefficient production phases to another country where costs are lower, thus becoming more efficient and expanding productionand employment along in other stages for which they have a comparative advantage (Agarwal, 1997; Carr, Markusen, & Maskus,1998; Markusen, Konan, Venables, & Zhang, 1996). Therefore, when a MNE undertakes a resource seeking FDI, the labourintensive activities are likely to be transferred in low income countries while the other (skill-intensive) activities remain in thehome country, thus giving rise to the increase in the domestic skill intensity, i.e., to the phenomenon known as skill upgrading.
In line with other recent studies (Driffield, Love, & Taylor, 2005; Ekholm & Hakkala, 2006), we claim that in order to properlycapture the impact of outward FDI on the domestic demand for labour it is necessary to single out the effects on each typology ofworkers (high vs. low skilled). Following the standard approach, which distinguishes between investments to high income andlow income countries, we find that they both impact negatively on the demand for low skilled workers in the parent company’s‘‘industrial region’’, and also on the demand for high skilled workers, when foreign affiliates are in high income countries. Theseresults seem to confirm the evidence put forward by recent studies (e.g., Alfaro & Charlton, 2007) showing that the share ofresource seeking FDI (subsidiaries which provide inputs to their parent firms) is larger than commonly thought, even withindeveloped countries. Admittedly, more empirical analysis is certainly needed on this issue.
Therefore, our future research agenda is quite rich. First of all, as one may expect that the relationship between outwardFDI and the parent company’s employment may change over time, further estimation should embrace a longer time span.Indeed, the impact on the demand for labour at home in the immediate post-investment period is likely to be affected by the
18 The unit of analysis of the present study is the ‘‘regional industry’’, which includes 9 manufacturing macro sectors, while services are excluded.
Therefore the effects of services outsourcing cannot be measured.19 As noted by one referee, this result must be interpreted with care, since due to a limited time series, we cannot test for further lagged effect, which might
further change the results.20 The authors carry out an analysis at industry level, therefore measuring both direct effects (at the MNE level) and indirect effects (at the level of the
customers, suppliers and competitors operating in the same industry.21 As a matter of fact, this result would explain why some authors find an increase in the share of high skilled workers over the total; indeed, the domestic
demand for labour does decrease for both high and low skilled workers, but the latter decreases more.
S. Elia et al. / International Business Review 18 (2009) 357–372368

negative consequences of the reorganization process, while it is likely to be positively influenced by the following increasedcompetitiveness of the company and the relevant environment.
Additionally, in order to take into account possible spillover effects across regions, appropriate spatial econometric toolsmay be used (for a recent application of spatial econometrics to technology spillovers, see Driffield, 2006). Indeed, the impactof an MNE’s international activity may sometimes cross the administrative border of the relevant NUTS2 region, and affectthe employment of other bordering regions (i.e., through backward and forward linkages).
In policy terms, our results indicate that concerns about the impact of outward FDI on domestic employment and jobsmay be somehow well placed. Indeed, the empirical exercise developed suggests that outward FDI reduce the demand forlow skilled labour in Italy as well as—in some cases—the demand for high skilled workers. Although it would be necessary totake into account all the complex relationships between foreign production, domestic employment and production, foreigntrade and the variations in the investing firms’ competitive advantages, nonetheless it is possible to draw someconsiderations on the issue. Specifically, a lasting increase of vertical investment, causing such a depressive impact on thedomestic employment, would become unsustainable in the long term unless adequately balanced by other initiatives abroadeither market seeking or aiming at tapping into local source of excellence. Indeed, although leading to a likely reduction inthe domestic demand for labour in the short run, they are also likely to increase the company’s competitiveness in the longerterm. Secondly, the changes induced on the domestic employment imply systematic and flexible adjustments upon thelabour market. In particular, that concerns the greater supply of higher vocational profiles and the consequent need ofadditional investment in human capital. The lack of such structural adjustment processes would cause other fatalconsequences for the competitiveness of the country, and the stability and growth of the domestic employment.
Acknowledgments
The authors wish to thank participants at the AIB Annual Conference 2008, the EUNIP Annual conference 2007, the ETSGAnnual conference 2007, the ERSA Annual conference 2007, for their constructive comments and suggestions. Financialsupport from the FIRB-RISC 2003 is gratefully acknowledged.
Table A1
Distribution (%) of total outward FDI undertaken by Italian companies, 1994–2000, by region and industry.
Region Industry (a)
CPH FBT MAC MET NMP OTH PAP TEX TRA Total
Abruzzo 0.0 0.0 0.2 0.0 0.0 0.1 0.0 0.2 0.3 0.8
Basilicata 0.0 0.8 0.0 0.0 0.0 0.0 0.0 0.1 0.2 1.2
Calabria 0.0 0.3 0.0 0.0 0.1 0.0 0.0 0.0 0.0 0.4
Campania 0.1 1.5 1.2 0.0 0.0 0.1 0.0 0.2 1.3 4.3
Emilia R. 0.3 6.7 3.8 0.1 0.6 0.5 0.2 0.8 0.9 14.0
Friuli V. G. 0.0 0.2 0.4 0.3 0.1 0.3 0.3 0.1 0.0 1.6
Lazio 0.2 1.4 0.7 0.0 0.1 0.2 0.1 0.2 0.9 3.8
Liguria 0.0 0.4 0.0 0.1 0.1 0.0 0.0 0.0 0.0 0.7
Lombardy 3.2 3.9 16.8 1.3 0.4 1.2 1.1 4.3 4.2 36.4
Marche 0.2 0.2 1.0 0.0 0.1 0.3 0.0 0.5 0.7 2.8
Molise 0.0 0.0 0.3 0.0 0.0 0.0 0.0 0.1 0.0 0.4
Piedmont 1.0 1.2 3.6 2.3 0.1 0.3 0.4 1.1 6.5 16.4
Puglia 0.0 0.5 0.6 0.1 0.1 0.2 0.0 0.2 0.5 2.2
Sardinia 0.0 0.0 0.0 0.0 0.1 0.0 0.0 0.0 0.0 0.1
Sicily 0.1 0.3 0.2 0.0 0.1 0.0 0.0 0.0 0.0 0.7
Tuscany 0.4 0.0 0.3 1.8 0.2 0.1 0.4 1.0 0.2 4.4
Trentino A.A. 0.1 0.1 0.3 0.0 0.2 0.1 0.0 0.1 0.1 1.0
Umbria 0.0 0.1 0.2 0.0 0.0 0.0 0.0 0.0 0.0 0.4
Valle d’Aosta 0.0 0.0 0.0 0.0 0.0 0.0 0.0 0.0 0.0 0.0
Veneto 0.3 1.1 2.4 0.0 0.5 0.2 0.2 3.4 0.1 8.3
Total 6.0 18.7 31.9 6.0 2.8 3.4 2.8 12.4 16.0 100.0
Note. (a) FBT: Food, Beverage, Tobacco; TEX: Textile, Clothing, Leather, Shoes; PAP: Paper, Printing, Publishing; CPH: Chemicals, Pharmaceuticals; NMP:
Non-metallic products; MET: Metals; MAC: Metal Products, Machinery; TRA: Transport Equipments; OTH: Other Manufacturing.
Table A2
Distribution (%) of FDI towards OECD countries undertaken by Italian companies, 1994–2000, by region and industry.
Region Industry
CPH FBT MAC MET NMP OTH PAP TEX TRA Total
Abruzzo 0.1 0.0 0.1 0.0 0.0 0.0 0.0 0.1 0.1 0.4
Basilicata 0.0 1.0 0.0 0.0 0.0 0.0 0.0 0.2 0.1 1.3
S. Elia et al. / International Business Review 18 (2009) 357–372 369
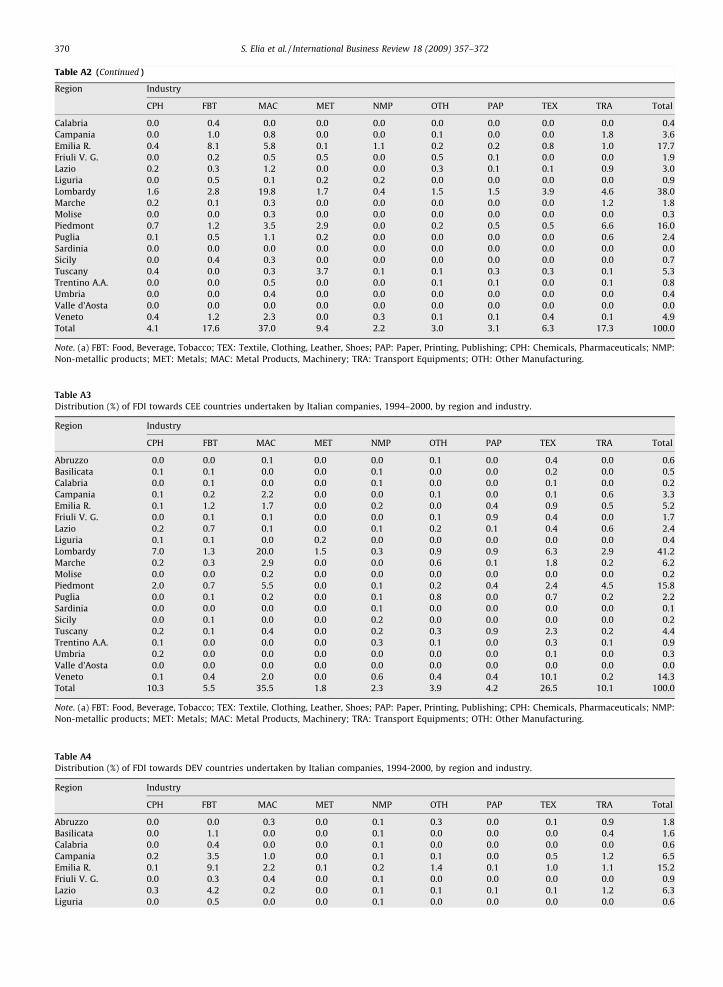
Table A2 (Continued )
Region Industry
CPH FBT MAC MET NMP OTH PAP TEX TRA Total
Calabria 0.0 0.4 0.0 0.0 0.0 0.0 0.0 0.0 0.0 0.4
Campania 0.0 1.0 0.8 0.0 0.0 0.1 0.0 0.0 1.8 3.6
Emilia R. 0.4 8.1 5.8 0.1 1.1 0.2 0.2 0.8 1.0 17.7
Friuli V. G. 0.0 0.2 0.5 0.5 0.0 0.5 0.1 0.0 0.0 1.9
Lazio 0.2 0.3 1.2 0.0 0.0 0.3 0.1 0.1 0.9 3.0
Liguria 0.0 0.5 0.1 0.2 0.2 0.0 0.0 0.0 0.0 0.9
Lombardy 1.6 2.8 19.8 1.7 0.4 1.5 1.5 3.9 4.6 38.0
Marche 0.2 0.1 0.3 0.0 0.0 0.0 0.0 0.0 1.2 1.8
Molise 0.0 0.0 0.3 0.0 0.0 0.0 0.0 0.0 0.0 0.3
Piedmont 0.7 1.2 3.5 2.9 0.0 0.2 0.5 0.5 6.6 16.0
Puglia 0.1 0.5 1.1 0.2 0.0 0.0 0.0 0.0 0.6 2.4
Sardinia 0.0 0.0 0.0 0.0 0.0 0.0 0.0 0.0 0.0 0.0
Sicily 0.0 0.4 0.3 0.0 0.0 0.0 0.0 0.0 0.0 0.7
Tuscany 0.4 0.0 0.3 3.7 0.1 0.1 0.3 0.3 0.1 5.3
Trentino A.A. 0.0 0.0 0.5 0.0 0.0 0.1 0.1 0.0 0.1 0.8
Umbria 0.0 0.0 0.4 0.0 0.0 0.0 0.0 0.0 0.0 0.4
Valle d’Aosta 0.0 0.0 0.0 0.0 0.0 0.0 0.0 0.0 0.0 0.0
Veneto 0.4 1.2 2.3 0.0 0.3 0.1 0.1 0.4 0.1 4.9
Total 4.1 17.6 37.0 9.4 2.2 3.0 3.1 6.3 17.3 100.0
Note. (a) FBT: Food, Beverage, Tobacco; TEX: Textile, Clothing, Leather, Shoes; PAP: Paper, Printing, Publishing; CPH: Chemicals, Pharmaceuticals; NMP:
Non-metallic products; MET: Metals; MAC: Metal Products, Machinery; TRA: Transport Equipments; OTH: Other Manufacturing.
Table A3
Distribution (%) of FDI towards CEE countries undertaken by Italian companies, 1994–2000, by region and industry.
Region Industry
CPH FBT MAC MET NMP OTH PAP TEX TRA Total
Abruzzo 0.0 0.0 0.1 0.0 0.0 0.1 0.0 0.4 0.0 0.6
Basilicata 0.1 0.1 0.0 0.0 0.1 0.0 0.0 0.2 0.0 0.5
Calabria 0.0 0.1 0.0 0.0 0.1 0.0 0.0 0.1 0.0 0.2
Campania 0.1 0.2 2.2 0.0 0.0 0.1 0.0 0.1 0.6 3.3
Emilia R. 0.1 1.2 1.7 0.0 0.2 0.0 0.4 0.9 0.5 5.2
Friuli V. G. 0.0 0.1 0.1 0.0 0.0 0.1 0.9 0.4 0.0 1.7
Lazio 0.2 0.7 0.1 0.0 0.1 0.2 0.1 0.4 0.6 2.4
Liguria 0.1 0.1 0.0 0.2 0.0 0.0 0.0 0.0 0.0 0.4
Lombardy 7.0 1.3 20.0 1.5 0.3 0.9 0.9 6.3 2.9 41.2
Marche 0.2 0.3 2.9 0.0 0.0 0.6 0.1 1.8 0.2 6.2
Molise 0.0 0.0 0.2 0.0 0.0 0.0 0.0 0.0 0.0 0.2
Piedmont 2.0 0.7 5.5 0.0 0.1 0.2 0.4 2.4 4.5 15.8
Puglia 0.0 0.1 0.2 0.0 0.1 0.8 0.0 0.7 0.2 2.2
Sardinia 0.0 0.0 0.0 0.0 0.1 0.0 0.0 0.0 0.0 0.1
Sicily 0.0 0.1 0.0 0.0 0.2 0.0 0.0 0.0 0.0 0.2
Tuscany 0.2 0.1 0.4 0.0 0.2 0.3 0.9 2.3 0.2 4.4
Trentino A.A. 0.1 0.0 0.0 0.0 0.3 0.1 0.0 0.3 0.1 0.9
Umbria 0.2 0.0 0.0 0.0 0.0 0.0 0.0 0.1 0.0 0.3
Valle d’Aosta 0.0 0.0 0.0 0.0 0.0 0.0 0.0 0.0 0.0 0.0
Veneto 0.1 0.4 2.0 0.0 0.6 0.4 0.4 10.1 0.2 14.3
Total 10.3 5.5 35.5 1.8 2.3 3.9 4.2 26.5 10.1 100.0
Note. (a) FBT: Food, Beverage, Tobacco; TEX: Textile, Clothing, Leather, Shoes; PAP: Paper, Printing, Publishing; CPH: Chemicals, Pharmaceuticals; NMP:
Non-metallic products; MET: Metals; MAC: Metal Products, Machinery; TRA: Transport Equipments; OTH: Other Manufacturing.
Table A4
Distribution (%) of FDI towards DEV countries undertaken by Italian companies, 1994-2000, by region and industry.
Region Industry
CPH FBT MAC MET NMP OTH PAP TEX TRA Total
Abruzzo 0.0 0.0 0.3 0.0 0.1 0.3 0.0 0.1 0.9 1.8
Basilicata 0.0 1.1 0.0 0.0 0.1 0.0 0.0 0.0 0.4 1.6
Calabria 0.0 0.4 0.0 0.0 0.1 0.0 0.0 0.0 0.0 0.6
Campania 0.2 3.5 1.0 0.0 0.1 0.1 0.0 0.5 1.2 6.5
Emilia R. 0.1 9.1 2.2 0.1 0.2 1.4 0.1 1.0 1.1 15.2
Friuli V. G. 0.0 0.3 0.4 0.0 0.1 0.0 0.0 0.0 0.0 0.9
Lazio 0.3 4.2 0.2 0.0 0.1 0.1 0.1 0.1 1.2 6.3
Liguria 0.0 0.5 0.0 0.0 0.1 0.0 0.0 0.0 0.0 0.6
S. Elia et al. / International Business Review 18 (2009) 357–372370

Appendix A
The following are Tables A1–A4.
References
Adams, J. D. (1999). The structure of firm R&D, the factor intensity of production, and skill bias. The Review of Economics and Statistics, 81, 499–510.Agarwal, J. P. (1997). Effect of foreign direct investment on employment in home countries? Transnational Corporations, 6/2, 1–28.Ahn, S., Fukao, K., & Ito, K. (2008). Outsourcing in East Asia and its impact on the Japanese and Korean Labour Markets, OECD Trade Policy working paper 65, Paris.Alfaro, L., & Charlton, A. (2007). Intra-industry foreign direct investment, NBER working paper 13447, Cambridge.Anderton, R., & Brenton, P. (1999). Outsourcing and low-skilled workers in the UK. Bulletin of Economic Research, 51, 267–286.Anderton, R., Brenton, P., & Oscarsson, E. (2002). Outsourcing and inequality, CEPS working paper 187, Brussels.Autor, D. H., Katz, L. F., & Krueger, A. B. (1998). Computing inequality: Have computers changed the labor market? The Quarterly Journal of Economics, 113/4, 1169–
1213.Barba Navaretti, G., & Venables, A. J. (2004). Multinational firms in the world economy. University Press: Princeton.Bardhan, A., & Kroll, C. (2003). The new wave of outsourcing. Research Report Fisher Center for Real Estate and Urban Economics, University of California, Berkeley.Berman, E., Bound, J., & Griliches, Z. (1994). Changes in the demand for skilled labor within U.S. manufacturing: Evidence from the annual survey of manufacturers.
Quarterly Journal of Economics, 109/2, 367–397.Berndt, E. R. (1990). The practice of econometrics. London: Addison-Wesley.Blomstrom, M., Fors, G., & Lipsey, R. E. (1997). Foreign direct investment and employment: home country experience in the United States and Sweden. The
Economic Journal, 107, 1787–1797.Bonte, W. (2008). Inter-firm trust in buyer–supplier relations: Are knowledge spillovers and geographical proximity relevant? Journal of Economic Behaviour and
Organization, 67, 855–870.Borjas, G. J., & Ramey, V. A. (1995). Foreign competition, market power, and wage inequality. Quarterly Journal of Economics, 4, 1075–1110.Bound, G., & Johnson, G. (1992). Changes in the structure of wages in the 1980s: an evaluation of alternative explanations. American Economic Review, 3, 371–
392.Braconier, H., Norback, P. J., & Urba, D. (2005). Multinational enterprises and wage costs: Vertical FDI revisited. Journal of International Economics, 67, 446–
470.Brenton, P., & Pinna, A. M. (2001). The declining use of unskilled labour in Italian manufacturing: is trade to blame? CEPS working paper 178, Brussels.Castellani, D., Mariotti, I., & Piscitello, L. (2008). The impact of outward investments on parent company’s employment and skill composition. Evidence from the
Italian case. Structural Change and Economic Dynamics, 19/1, 81–94.Chen, T.-Y., & Ku, Y.-H. (2003). The effect of overseas investment on domestic employment, NBER working paper 10156, Cambridge.Christensen, L. R., Jorgenson, D. W., & Lau, L. J. (1973). Transcendental logarithmic production frontiers. The Review of Economics and Statistics, 55/1, 28–45.Diewert, W. E. (1974). Applications of duality theory. In M. Intriligator & D. Kendrick (Eds.), Frontiers of quantitative economics. Amsterdam: North-Holland, (106–
171).Driffield, N. (2006). On the search for spillovers from foreign direct investment (FDI) with spatial dependency. Regional Studies, 40, 107–119.Driffield, N., & Chiang, M. (2007), The effects of offshoring to China: Reallocation, employment and productivity in Taiwan, paper presented at the AIB conference, April,
London.Driffield, N., Love, J. H., & Taylor, K. (2005). Productivity and labour demand effects of inward and outward FDI on UK industry. mimeo: Aston Business School.Dunning, J. H. (1993). Multinational enteprises and the global economy. London: Addison Wesley.Dunning, J. H., & Lundan, S. (2008). Multinational enteprises and the global economy, 2nd ed.. Cheltenham: Edward Elgar.Dyer, J. H., & Chu, W. (2003). The role of trustworthiness in reducing transaction costs and improving performance: empirical evidence from the United States,
Japan and Korea. Organization Science, 14, 57–68.Ekholm, K., & Hakkala, K. (2006). The effect of offshoring on labour demand: Evidence from Sweden, CEPR discussion paper 5648, London.Feenstra, R. C., & Hanson, G. H. (1996). Globalization, outsourcing and wage inequality. American Economic Review, 86, 240–245.Feenstra, R. C., & Hanson, G. H. (1999). The impact of outsourcing and high-technology capital on wages: Estimates for the United States, 1979–1990. Quarterly
Journal of Economics, 114/3, 907–940.Hansson, P. (2001). Skill upgrading and production transfer within Swedish multinationals, FIEF Working Paper no.166.Hansson, P. (2004). Skill upgrading and production transfer within Swedish multinationals in the 1990s, CEPS Working Documents 163.Feenstra, R. C., & Hanson, G. H. (2001). Global production sharing and rising inequality: A survey of trade and wages, NBER working paper 8372, Cambridge.Fors, G., & Kokko, A. (1999). Home country effects of FDI: Foreign production and structural change in home country operations. Paper presented at the Seventh
Sorbonne International Conference.Hansson, P. (2005). Skill upgrading and production transfer within Swedish multinationals. Scandinavian Journal of Economics, 107, 673–692.
Table A4 (Continued )
Region Industry
CPH FBT MAC MET NMP OTH PAP TEX TRA Total
Lombardy 2.9 8.4 8.2 0.1 0.5 0.8 0.4 3.4 4.6 29.2
Marche 0.1 0.2 0.7 0.0 0.2 0.4 0.0 0.2 0.2 1.9
Molise 0.0 0.0 0.3 0.0 0.1 0.0 0.0 0.4 0.0 0.8
Piedmont 0.6 1.5 2.0 3.3 0.1 0.4 0.3 1.2 8.0 17.5
Puglia 0.0 0.8 0.3 0.0 0.2 0.0 0.0 0.1 0.6 1.9
Sardinia 0.0 0.1 0.0 0.0 0.1 0.0 0.0 0.1 0.0 0.3
Sicily 0.2 0.4 0.2 0.0 0.3 0.0 0.0 0.0 0.0 1.1
Tuscany 0.8 0.1 0.2 0.0 0.3 0.1 0.0 1.0 0.4 2.7
Trentino A.A. 0.1 0.2 0.2 0.0 0.7 0.0 0.0 0.0 0.2 1.4
Umbria 0.0 0.2 0.0 0.0 0.0 0.1 0.0 0.0 0.0 0.4
Valle d’Aosta 0.0 0.0 0.0 0.0 0.0 0.0 0.0 0.0 0.0 0.0
Veneto 0.4 1.7 3.0 0.0 1.0 0.2 0.0 2.8 0.1 9.1
Total 5.7 32.6 19.1 3.6 4.3 3.8 1.0 10.9 18.9 100.0
Note. (a) FBT: Food, Beverage, Tobacco; TEX: Textile, Clothing, Leather, Shoes; PAP: Paper, Printing, Publishing; CPH: Chemicals, Pharmaceuticals; NMP:
Non-metallic products; MET: Metals; MAC: Metal Products, Machinery; TRA: Transport Equipments; OTH: Other Manufacturing.
S. Elia et al. / International Business Review 18 (2009) 357–372 371

Head, K., & Ries, J. (2002). Offshore production and skill upgrading by Japanese manufacturing firms. Journal of International Economics, 58, 81–105.Helg, R., & Tajoli, L. (2005). Patterns of international fragmentation of production and implications for the labor markets. The North American Journal of Economics
and Finance, 16, 233–254.Helpman, E., & Krugman, P. (1985). Market structure and foreign trade. Cambridge: MIT Press.Hijzen, A., Gorg, H., & Hine, R. C. (2005). International outsourcing and the skill structure of labour demand in the United Kingdom. The Economic Journal, 115, 860–
878.Ito, K., & Fukao, K., 2005. Nihon no Sangyoukan Sangyounai Kokusai Bungyou to Taigai Chokusetsu Toushi—Kokunai no Butteki Jinteki Shihon Shinka heno Eikyou,
in Japanese (Japanese Inter- and Intra-Industry Division of Labour and ForeignDirect Investment – The impact on Domestic Physical and Human CapitalDeepening). Hi-Stat Discussion Paper Series 115. Hitotsubashi University, Tokyo.
Katz, L. F., & Murphy, K. M. (1992). Changes in Relative Wage, 1963-1987: Supply and Demand Factors. The Quarterly Journal of Economics, 107/1, 35–78.Legrain, P. (2002). Open World: The Tryth About Globalization. London: Abacus.Machin, S., & Van Reenen, J. (1998). Technology and changes in the skill structure: Evidence from seven OECD countries. Quarterly Journal of Economics, 113, 1215–
1244.Mariotti, I., & Piscitello, L. (2007). The impact of outward FDI on local employment. Evidence from the Italian case. In M. Arauzo, D. Liviano, & M. Martın (Eds.),
Entrepreneurship, economic growth and industrial location. London: Edward Elgar, (299–320).Mariotti, S., Mutinelli, M., & Piscitello, L. (2008). The Internationalization of Production by Italian Industrial Districts’ Firms: Structural and Behavioural
Determinants, Regional Studies. 42/5, 719–735.Mariotti, S., Mutinelli, M., & Piscitello, L. (2003). Home country employment and foreign direct investment: Evidence from the Italian case. Cambridge Journal of
Economics, 27, 419–431.Markusen, J. R., Konan, D. E., Venables, A. J., & Zhang, K. H. (1996). a unified treatment of horizontal direct investment, vertical direct investment and the pattern of trade
in goods and services, NBER working paper 5696, Cambridge.McKinsey (2005). The Emerging Global Labour Market, June.Molnar, M., Pain, N., & Taglioni, D. (2007). The internationalisation of production, international outsourcing and employment in the OECD, OECD working paper 21,
Paris.Mutinelli, M. (2001). L’internazionalizzazione produttiva delle imprese italiane: caratteristiche strutturali, tendenze evolutive e motivazioni. In O., Garavello, & G.,
Barba Navaretti (eds.), Investimenti diretti esteri delle imprese italiane nei paesi emergenti, Milano: Giuffre Editore.Mutinelli, M., & Piscitello, L. (1997). Understanding the strategic orientation of Italian foreign investment in Central and Eastern Europe. International Business
Review, 6/2, 185–205.Ozawa, T. (2005). Institutions, Industrial Upgrading, and Economic Performance in Japan. Cheltenham: Edward Elgar.Piva, M., Santarelli, E., & Vivarelli, M. (2003). The skill bias effect of technological and organisational change: Evidence and policy implications. Research Policy, 34,
141–157.Piva, M., & Vivarelli, M. (2004). The determinants of skill bias in Italy: R&D, organisation or globalisation? Economics of Innovation and New Technology, 4, 329–347.Porter, M. (1992). The Competitive Advantages of Nations. New York: The Free Press.Rodrigues-Clare, A. (1996). Multinationals, linkages and economic development. American Economic Review, 86, 852–873.Savona, M., & Schiattarella, R. (2004). International relocation of production and the growth of services. The case of the ‘‘Made in Italy’’ industries. Transnational
Corporations, 2, 57–76.Slaughter, M. J. (2000). Production transfer within multinational enterprises and American wages. Journal of International Economics, 50, 449–472.Strauss-Kahn, V. (2003). The role of globalisation in the within-industry shift away from unskilled workers in France, NBER working paper 9716, Cambridge.Wolf, M. (2004). Why Globalisation Works. New Haven and London: Yale University Press.Wood, A. (1994). North-South Trade, Employment, and Inequality: Changing Fortunes in a Skill-driven World. Oxford: Claredon Press.
Stefano Elia is a PhD student at Politecnico di Milano, and visiting student at CIBUL (Leeds, UK). His main research interest concerns M&As from emerging countriesto advanced countries and their impact on the performance of target firms.
Ilaria Mariotti is assistant Professor of Applied Economics at Politecnico di Milano. Her main research interests concern regional economics, internationalisationprocesses and the impact of FDI on the home and host countries.
Lucia Piscitello is Professor of International Institutions and Regulation at Politecnico di Milano. Her main research interests concern direct and indirect effects ofFDI on the host and the home country, the relationship between internationalisation and skill upgrading, the relationship between forms of internationalization,the location of R&D activities by MNCs, the internationalisation of SMEs, clusters and industrial districts, knowledge transfer and technological catching upthrough FDI.
S. Elia et al. / International Business Review 18 (2009) 357–372372