A country's image as tourist destination for external intermediaries
28
The current issue of M & M can be found at: www.managementmarketing.ro Correspondence: Adriana Zait E‐mail: [email protected] A country's image as tourist destination for external intermediaries Oana Vicol University Alexandru Ioan Cuza, Iaşi, România Adriana Zaiţ University Alexandru Ioan Cuza, Iaşi, România Abstract: Destination image is an important variable of influence for tourist behavior. Previous studies showed that intermediaries – different travel agencies ‐ influence the visiting intentions of potential tourists, being able to form opinions and shape behaviors. Measuring the perception of travel agencies and other intermediaries about the tourist image of a destination country becomes really important. Reliable and valid measurement instruments are necessary. The vast majority of previous studies used instruments developed for individual tourists, and they do not offer details about how the measurement instruments were obtained. Our objective was to show how one can build an appropriate instrument for intermediaries; the main contribution of our study lays in the scrutiny and rigor of the instrument development process. We performed an instrumental research, on five stages: documentary research through literature review, exploratory research for general and specific attributes, initial questionnaire design based on the first two stages, questionnaire testing on experts and reliability checking on a pilot study. Both qualitative (content analysis and expert ranking) and quantitative (reliability tests) methods of analysis were used. The final instrument obtained is presented in the conclusions section and could be used to estimate external intermediaries’ attitude towards a destination country. The main implications are methodological – the whole scale development procedure can be used in order to build and test similar research instruments. Keywords: country image, tourist destination, scale validation, instrumental research, travel agencies. Please cite this article as following: Vicol, O. and Zait, A. (2014), “A country's image as tourist destination for external intermediaries”, Management & Marketing. Challenges for the Knowledge Society, Vol. 9, No. 1, pp. 47‐74. Introduction People’s visiting decisions are significantly influenced by the tourist destination’s image (Echtner and Ritchie, 1991; Chen and Hsu, 2000; Beerli and Martin, 2004; Tasci et al., 2007; Alcaniz et al., 2009). Previous studies in the field of destination image also showed that intermediaries influence the visiting intentions of potential tourists, being able to form opinions and shape behaviors (Gartner, 1993; Lawton and Page, 1997; Baloglu and Mangaloglu, 2001;
Transcript of A country's image as tourist destination for external intermediaries

ThecurrentissueofM&Mcanbefoundat:www.managementmarketing.ro
Acountry'simage
Correspondence:AdrianaZait
E‐mail:[email protected]
Acountry'simageastouristdestinationforexternalintermediaries
OanaVicol
UniversityAlexandruIoanCuza,Iaşi,România
AdrianaZaiţUniversityAlexandruIoanCuza,Iaşi,România
Abstract:Destination image isan importantvariableof influence for touristbehavior.Previousstudiesshowedthat intermediaries–different travelagencies ‐ influencethevisitingintentionsofpotentialtourists,beingabletoformopinionsandshapebehaviors.Measuringtheperceptionoftravelagenciesandotherintermediariesaboutthetouristimage of a destination country becomes really important. Reliable and validmeasurement instruments are necessary. The vast majority of previous studies usedinstrumentsdevelopedfor individual tourists,andtheydonotofferdetailsabouthowthemeasurement instrumentswereobtained.Ourobjectivewastoshowhowonecanbuildanappropriateinstrumentforintermediaries;themaincontributionofourstudylaysinthescrutinyandrigoroftheinstrumentdevelopmentprocess.Weperformedaninstrumentalresearch,onfivestages:documentaryresearchthroughliteraturereview,exploratory research for general and specific attributes, initial questionnaire designbasedonthe first twostages,questionnairetestingonexpertsandreliabilitycheckingonapilotstudy.Bothqualitative(contentanalysisandexpertranking)andquantitative(reliability tests) methods of analysis were used. The final instrument obtained ispresented in the conclusions section and could be used to estimate externalintermediaries’ attitude towards a destination country. The main implications aremethodological–thewholescaledevelopmentprocedurecanbeusedinordertobuildandtestsimilarresearchinstruments. Keywords: country image, touristdestination, scale validation, instrumental research,travelagencies. Please cite this article as following: Vicol, O. and Zait, A. (2014), “A country's image as touristdestination for external intermediaries”,Management&Marketing.Challenges for theKnowledgeSociety,Vol.9,No.1,pp.47‐74.
IntroductionPeople’s visiting decisions are significantly influenced by the touristdestination’simage(EchtnerandRitchie,1991;ChenandHsu,2000;BeerliandMartin, 2004; Tasci et al., 2007; Alcaniz et al., 2009). Previous studies in thefieldofdestinationimagealsoshowedthatintermediariesinfluencethevisitingintentionsofpotentialtourists,beingabletoformopinionsandshapebehaviors(Gartner, 1993; Lawton and Page, 1997; Baloglu and Mangaloglu, 2001;

Vol.9No.1Spring,pp.47‐74,ISSN1842‐0206|Management&Marketing.ChallengesfortheKnowledgeSociety
48
M&M
Martin,2011).Inthislight,measuringtheperceptionoftravelagenciesandotherintermediaries on the tourist image of a destination country becomes reallyimportant. In order to do this, a reliable and validmeasurement instrument isnecessary.Thevastmajorityofpreviousstudiesusedinstrumentsdevelopedforindividual tourists and,moreover, they did not provide details about the scaledevelopmentprocess.Thisiswhyourobjectivewastoperformaninstrumentalresearchinordertobuildanappropriateinstrumentforintermediaries,thefocusbeing on the methodological details – scrutiny and rigor of the instrumentdevelopment process. Our instrumental research had five stages: documentaryresearch through literature review, exploratory research, questionnaire designbasedonthetwopreviousstages,questionnairetestingonexpertsandreliabilitycheckingonapilotstudy(seeFigure1).Figure1.Stagesoftheinstrumentalresearch
The literature review process allowed us to identify previous methods fordefining and operationalizing the construct “destination” image, as well asdifferent variables and scales used for quantifying the main components ofattitude (cognitive, affective and conative). Relevant tourism attributes, bothgeneral and country specific, were obtained through an exploratory survey,followedbycontentanalysis.Usingtheresultsfromthedocumentarystudyandthe exploratory one, we designed the questionnaire – the first draft of theresearch instrument.Thisquestionnairewas testedonapanelofexpertsandweusedtheresultsforrefiningtheresearchinstrument.Afterthisqualitativeapproach, meant to validate the instrument from a conceptual and contentpoint of view, a statistical reliability check was performed, using CronbachAlphaestimators,andthefinalresearchinstrumentwasobtained.
The instrument is designed tomeasure Romania’s image as a destinationcountry, from theperspective of external tourismagencies as intermediaries.ThequestionnairewasdesignedinEnglishandcouldbeusedeitherinEnglishorinthe native language of the sending country, after a cultural translation process(adaptationofwords andback translation checkingprocedure).TheGerman,
II.ExploratoryresearchI.Literaturereview
Initialvariablesandscalesfortouristdestination’simage
III.Questionnairedesign
IV.Testonexperts
V.Reliabilitytesting‐pilotstudy
Relevantlistoftouristattributes‐generalandspecific

Vol.9No.1Spring,pp.47‐74,ISSN1842‐0206|Management&Marketing.ChallengesfortheKnowledgeSociety
49
Acountry'simage
FrenchandItalianformsofthequestionnaireareavailablefromtheauthors,onrequest. Although the instrument is context‐specific (Romania as a touristdestination),theprocedurethroughwhichtheinstrumentwasbuiltandtestedis generally valid and recommended; the main focus of our study was themethodological process throughwhich the instrumentwasobtained, throughthecombinedqualitativeandquantitativeapproaches.Literaturereview–methods,variablesandscalesSeveral definitions of destination image are used in the literature. From apragmaticpointofview, thedestination imagerepresentsa fundamentaluniton which all the complex dimensions of tourism rely, a central point indevelopingandprovidingtourismproducts(UNWTO,2004).Fromaconceptualperspective, most studies use one of the first definitions suggested byCrompton (1979) and Gartner (1989). Crompton (1979) defines destinationimage as the sum of beliefs, ideas and impressions that an individual holdsabouta specificdestination.Gartner (1989) considers that individualsdonothavethecognitivecapacitytoevaluateobjectsandattributes,andsotheytendtosimplifytheprocessandusespecificcriteria,asafunctionoftheirparticularsituation.WebasedourstudyonthedefinitionofferedbyCromptonandtriedtoofferonoperational(measurable)perspectiveoftheconstruct,aswell.
One of the most used scales for the operationalization of the constructdestinationimageisthatsuggestedbyEchtnerandRitchie(1991).Theyapplybothquantitativeandqualitative instruments inorder toevaluatedestinationimage:aquantitativeapproachfortheidentificationofcommoncharacteristicsand attributes and a qualitative approach for determining holistic andpsychological impressions associatedwithdestination image. Their scalewasalsousedbyotherresearchers(ChenandKerstetter,1999;CourtandLupton,1997; Joppe et al., 2001; MacKay and Fesenmaier, 1997; Milman and Pizam,1995; O’Leary and Deegan, 2005; Tapachai and Waryszak, 2000). The mainadvantage of using both quantitative and qualitative approaches lies in thepossibilityofobtainingacompleteevaluationofthedestinationimage,throughtheanalysisofthecognitiveandespeciallytheaffectivecomponentofattitude,muchmorepersonalandsubjective.Bothquantitativeandqualitativemethodswere previously used by Dann (1996), Echtner and Ritchie (1993), Lubbe(1998),MacKayandFesenmaier(1997),O’LearyandDeegan(2005),Tapachaiand Waryszak (2000), and Walmsley and Young (1998). Beerli and Martin(2004) extracted a list of nine dimensions, containing all the attributesidentifiedinpreviousscalesusedformeasuringtouristdestinationimage.
Thevastmajorityofpreviousstudiesusedquantitativeapproaches,basedon structured instruments containing Likert and semantic differential scales.These instruments have normal methodological limitations, becauserespondents need to evaluate certain characteristics of the analyzeddestinationwhichdonot correspond to their perceived image (Tapachai andWaryszak, 2000).Qualitative studies are able to focus on the complexity andinternalrelationshipsofreallifetouristexperiences(RyanandCave,2005).
Vol.9No.1Spring,pp.47‐74,ISSN1842‐0206|Management&Marketing.ChallengesfortheKnowledgeSociety
50
M&M
Qualitative research in tourism is quite often associatedwith storytelling,and previous studies suggest using open questions in order to generatenarrative stories (Govers and Go, 2001; Ryan and Cave, 2005). Using acombinedapproach(quantitativeandqualitative)theresearchercouldbalancelimits and disadvantages, obtaining a better internal validity through thequalitativeapproachandabetter reliability andexternal validity through thequantitativeapproach(ClarkandDawson,1999;Burns,2000).
Qualitativemethods,althoughnotsopresent,aremoreandmorerecognizedas a necessary complement for researches interested in revealing thepsychological characteristics and holistic impressions of destination image(Dann, 1996; Echtner andRitchie, 1993;MackayandFesenmaier, 2000;Reilly,1990).GoversandKumar(2007)usedaqualitativemethodinordertoidentifythemostappropriatecategoriesofattributesandtheircomponents,whichtheyfurther incorporated into a quantitative research. Their narrative technique,togetherwiththecontentanalysisoftheanswers,wasalsousedbyMartinandBosque (2008). The study performed by Baloglu and Mangaloglu (2001) ontourism intermediaries suggests that tourist destination image should bemeasuredusingbothquantitativeandqualitativemethods,ifwewantthatimagetobe „real”.Themethodology in the field is stilldeveloping,andcomparabilityamongstudiesisstilldesiderating.Thisiswhywedecidedtoapplybothmethodsinordertoobtain,refineandtestourresearch instrument. Inthenextsectionswepresent themain results fromeach stageof our instrumental research.Weshortly present the researchmethodwith the corresponding justification, thentheresultsintermsofinstrument(questionnaire)structureanddetails(items).Exploratoryresearch–generalandspecificattributesMost of theprevious studies (Baloglu andMcCleary, 1999a;Beerli andMartin,2004;Hosanyetal.,2006;Leeetal.,2005;MartinandBosque,2008;PhillipsandJang,2008)haveevaluatedonlythegeneralattributesofadestination(beaches,mountains, culture, monasteries etc.), specific attributes (for example paintedmonasteries from Bucovina) having been considered in just a few studies(Harahsheh, 2009). Results obtained through the analysis of specific attributescouldofferimportantinformationfortheinstitutionsinchargewithpromotingacountry,ingeneral,andRomania,inparticular,asatouristdestination.
Thefirststageoftheexploratoryresearchwastoidentifyalltheelements,bothcommonandunique,usedtopromoteRomaniaintheonlineenvironment.The approach consisted in the analysis of two types of websites – those ofRomanian intermediaries offering packages for foreign tourists and thoseofficiallyusedtopromoteRomaniaastouristdestinationatnationallevelandinthreeEUCountries–France,ItalyandGermany.Inordertoidentifythemostrelevant attributes we used an exploratory online survey, on a sample ofexperts in tourism (from tourism agencies). The questionnaire had threesections,onewithopenquestions,onewithmultiplechoicequestionsandonefor thedemographicprofileof therespondents.Wecomparedanswers to the
Vol.9No.1Spring,pp.47‐74,ISSN1842‐0206|Management&Marketing.ChallengesfortheKnowledgeSociety
51
Acountry'simage
openquestionstothosefromthemultiplechoicequestions(whichuseditemsfrompreviousstudies).
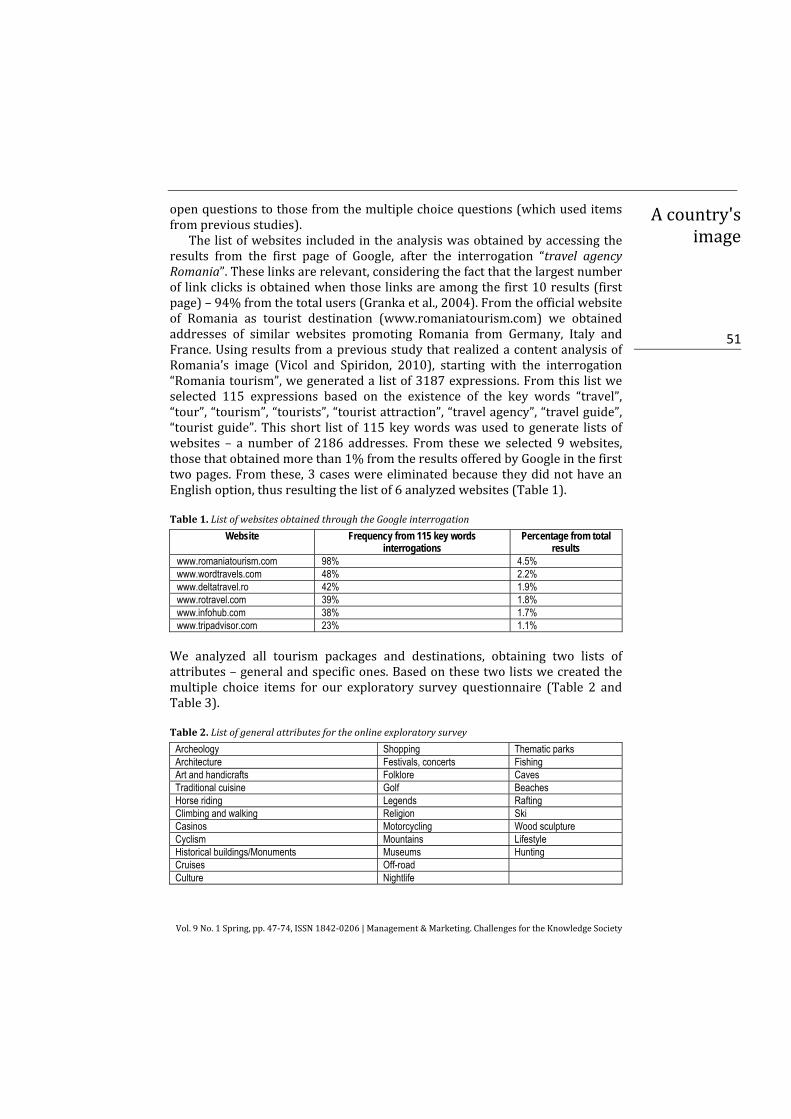
Thelistofwebsites includedintheanalysiswasobtainedbyaccessingtheresults from the first page of Google, after the interrogation “travel agencyRomania”.Theselinksarerelevant,consideringthefactthatthelargestnumberof linkclicksisobtainedwhenthoselinksareamongthefirst10results(firstpage)–94%fromthetotalusers(Grankaetal.,2004).Fromtheofficialwebsiteof Romania as tourist destination (www.romaniatourism.com) we obtainedaddresses of similar websites promoting Romania from Germany, Italy andFrance.UsingresultsfromapreviousstudythatrealizedacontentanalysisofRomania’s image (Vicol and Spiridon, 2010), starting with the interrogation“Romaniatourism”,wegeneratedalistof3187expressions.Fromthislistweselected 115 expressions based on the existence of the key words “travel”,“tour”,“tourism”,“tourists”,“touristattraction”,“travelagency”,“travelguide”,“touristguide”.This short listof115keywordswasused togenerate listsofwebsites – a number of 2186 addresses. From thesewe selected 9websites,thosethatobtainedmorethan1%fromtheresultsofferedbyGoogleinthefirsttwopages.Fromthese,3caseswereeliminatedbecausetheydidnothaveanEnglishoption,thusresultingthelistof6analyzedwebsites(Table1).Table1.ListofwebsitesobtainedthroughtheGoogleinterrogation
Website Frequency from 115 key words interrogations
Percentage from total results
www.romaniatourism.com 98% 4.5%www.wordtravels.com 48% 2.2%www.deltatravel.ro 42% 1.9%www.rotravel.com 39% 1.8%www.infohub.com 38% 1.7%www.tripadvisor.com 23% 1.1%
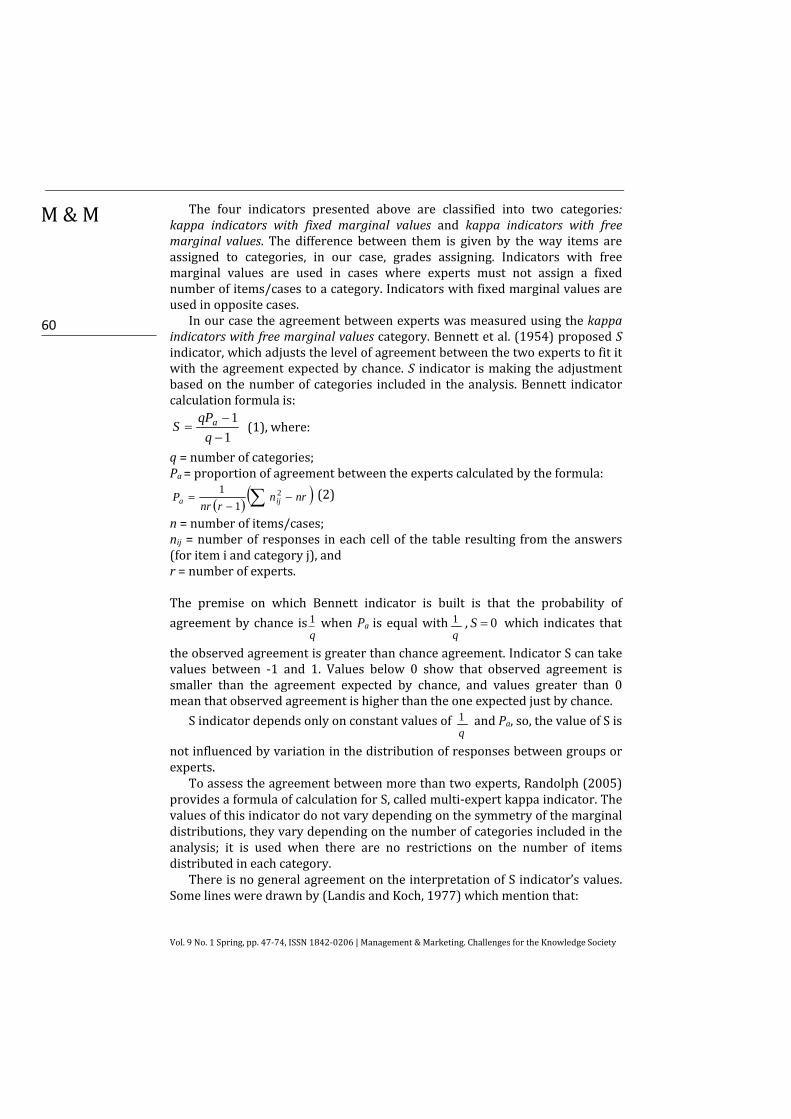
We analyzed all tourism packages and destinations, obtaining two lists ofattributes–generalandspecificones.Basedonthesetwolistswecreatedthemultiple choice items for our exploratory survey questionnaire (Table 2 andTable3).Table2.Listofgeneralattributesfortheonlineexploratorysurvey
Archeology Shopping Thematic parks Architecture Festivals, concerts FishingArt and handicrafts Folklore CavesTraditional cuisine Golf BeachesHorse riding Legends RaftingClimbing and walking Religion SkiCasinos Motorcycling Wood sculpture Cyclism Mountains LifestyleHistorical buildings/Monuments Museums HuntingCruises Off-roadCulture Nightlife

Vol.9No.1Spring,pp.47‐74,ISSN1842‐0206|Management&Marketing.ChallengesfortheKnowledgeSociety
52
M&M
Table3.Listofspecificattributesfortheonlineexploratorysurvey
Dracula/Bran Castle Medieval townsPeleş and Pelişor Castles Parliament/Ceauşescu palaceDanube Delta UNESCO patrimonyGeorge Enescu festival Wineries and traditional cuisineOvidiu’s island and Sf. Andrei monastery Archeological sites TransylvaniaMonasteries from Bucovina Black Sea resortsMocăniţa train Spa/Balneo/Thermal resortsMonuments of Constantin Brâncuşi Muddy volcanoesCarpathian mountains
SampleanddesignfortheexploratoryresearchWe downloaded a list of approximately 3000 travel intermediaries from thewebsite of the Ministry of Regional Development and Tourism (all licensedcompanies,activeornot)andconfronted itwiththe listofactivemembersoftheNationalAssociationofTravelAgenciesfromRomania(ANAT).Thisishowwe obtained a list of 797 intermediaries with the corresponding e‐mailaddresses, and this was our sample. We used SurveyGizmo.com in 4 stages,with one initial e‐mail (20.12.2011) and 3 follow‐up e‐mails (12.01.2012,16.01.2012,20.01.2012).From797sente‐mails,141turnedouttobeincorrectaddresses,whichgaveus just656e‐mails reallysent.The total responseratewas 17.84% (117 responses, both complete and partial), and the rate ofcompleteresponseswasof9.15%(60responses).
We used two forms of our exploratory questionnaire, one for interme‐diariesoffering touristpackages forRomania (questionnaireA,12questions)and one for intermediaries not offering such packages (questionnaire B, 9questions).ThetwogroupswerefilteredthroughaninitialquestionandthentheSurveyGizmoprogramseparatedtheiransweringpath.ForgroupAwehadthreeopenquestions,concerningthemainRomanianattractionspromoted,themost visitedattractions from their offer and theattractionsperceivedas lesspromoted for foreign tourists. For group B, only perceptions about themostpromoted attractions were registered. As multiple choice questions we useditems/attributesobtainedfromtheanalysisoftravelwebsites.TheaimwastoelicitallpotentialgeneralandspecificattributesforRomania.
QualitativeanalysisofdatacollectedthroughtheexploratoryresearchWe used content analysis for interpreting the collected qualitative data(answers to the open questions). For the data coding we used the emergentcoding method (Haney et al., 1998). We first examined all the responses,individually (two different investigators), and obtained two separate lists ofcodes.Then,weobtainedacommonlist,throughaprocessofcomparisonandunificationofpreviouslists.Asafinalstep,wecoded(usingthecommonlistofcodes)allanswers(texts).Responseswereclassified intogeneralandspecificitems.Thenumberofentriesofeverycodeandthecontext inwhichthecodeappearedwasthencheckedagain,inordertovalidateinferences,andwealsochecked the inter‐rater coding reliability (Neuman,2003).WeusedWordStat6.1.4(trial)andobtainedareliability levelof98%.Basedontheclassification

Vol.9No.1Spring,pp.47‐74,ISSN1842‐0206|Management&Marketing.ChallengesfortheKnowledgeSociety
53
Acountry'simage
realizedbyBeerliandMartin(2004), the itemsweobtainedweregrouped ingeneral attributes and specific attributes. Group B was eliminated from theanalysisbecauseofthesmallnumberofrespondents(12).
GeneralattributesselectionprocessAcomparativeanalysisonresponsesofthreeopenquestions(1,2and5fromquestionnaire A) was made. From the responses to the fifth question, thefollowing attributes were selected: Historical buildings/Monuments,Mountains, Museums, Culture, Religion, Traditional cuisine, Handmade Art,Folklore,andArchitecture.Theselectionwasmadebasedonthefactthatthisfirst9attributes cumulate55%of total items,while the restof the itemsareincludedinthelast22attributes.
Fromthe firstandsecondquestions(openendedquestions,questionnaireA)weselectedthefirst6ofeachattributesthatcumulate82%fromthetotalitemsoffirstquestion,and90%fromtotalitemsofthesecondquestion.The6attributesobtainedoutofbothquestionsarethesame,meaningthatwehavealistof6attributesfromtheopenquestionsthatiscomparedwiththelistof9attributes from the closed question. Attributes Cities and Regions wereeliminatedfromthefinallistbecauseoftheirlackofspecificity,andattributesReligion and Mountains were found in both final lists. The resulting list ofattributesispresentedinTable4.
Table4.Generalattributesobtainedthroughexploratoryresearch
No.
General attractions - group A Number Percent %
Percent from answers %
1 Historical buildings/Monuments 40 6.80 83.332 Mountains 38 6.46 79.173 Museums 37 6.29 77.084 Culture 36 6.12 75.005 Handmade Art 35 5.95 72.926 Traditional cuisine 35 5.95 72.927 Religion 35 5.95 72.928 Architecture 33 5.61 68.759 Folklore 33 5.61 68.75 Total 54.76 General attributes from open – ended question 1
1 Castles and Fortresses 29 13.30 76.322 Religion 22 10.09 57.893 Delta 22 10.09 57.894 Mountains 17 7.8 44.74 Total 41.28 General attributes from open – ended question 2
1 Castles and Fortresses 19 13.29 39.582 Religion 13 9.09 27.083 Mountains 11 7.69 22.924 Delta 11 7.69 22.92
Total 37.76

Vol.9No.1Spring,pp.47‐74,ISSN1842‐0206|Management&Marketing.ChallengesfortheKnowledgeSociety
54
M&M
Becauseof theirsimilarity, thepossibilityofoverlappingmeanings for twooftheattributes ‐CastlesandFortressesandHistoricbuildings/Monuments ‐wasverifiedinSPSS: weidentifiedallrespondentsthatselectedBranCastleandPelesandPelisor
Castleonquestion6and therespondentsthatlisteditemsincludedinCastlesandFortressesattribute
(fromopenendedquestion). Usingcrosstabulationanalyseswefoundthat: 80% selected the attribute Historic buildings/Monuments from the 48
respondentsofgroupA(question6) 100%respondentsthatselectedHistoricbuildings/Monumentsselectedalso
items with Bran Castle code (1 and 2 open ended questions) – specificexpression.
100%respondentsthatselectedHistoricbuildings/Monumentsselectedalsoitems with Peleş Castle code (1 and 2 open ended questions) specificexpression.
all 3 items from the general expression code “Castles” were given byrespondents which selected Historic buildings/Monuments (open endedquestion1)
allitemsincludedingeneralcode“Castles”aregivenbyrespondentswhichselected Historic buildings/Monuments attribute. – general expression(question1)
100%ofitemsfromcodeFortressesandfortifiedchurchesinTransylvaniawere mentioned by respondents which selected the attribute Historicbuildings/Monuments.
Based on this analysiswe can say that the 3 specific attributes: Bran Castle,Peleş Castle and Fortresses and fortified churches in Transylvania areassociatedwiththegeneralattributeHistoricbuildings/Monuments,whichwasrecodedinHistoricbuildings/Castles/Fortresses.
The final listof generalattributes selected for theanalysis ispresented inTable5.
Table5.GeneralAttributesselectedforanalysis
General attributes1 Historical monuments/Castles/Fortresses 6 Gastronomy/Cuisine2 Mountains 7 Religious sites/Monasteries 3 Museums 8 Architecture4 Culture 9 Folklore 5 Handicraft 10 Delta
TheselectionprocessofspecificattributesToselectspecificattributesweusedagraphicformoftheresponses,havingascriterionthepercentageofoccurrenceforeachattributeinthetotalnumberofresponses. As a result we obtained three comparable lists of attributes. Theanalysis included the resultsofopenendedquestions1and2and theclosedquestion6.Thefinal listofattributesincludedthosethathaveappearedinall

Vol.9No.1Spring,pp.47‐74,ISSN1842‐0206|Management&Marketing.ChallengesfortheKnowledgeSociety
55
Acountry'simage
threelistsorintheansweroptionsforquestionsix,andinat leastoneofthelistsresultingfromopenendedquestions.TheattributesobtainedareshowninTable6.Attributesthatrefertohistoricalcitiesandregionsofthecountrywereexcludedfromtheanalysis,asinthecaseofgeneralattributes.
Table6.Finallistofspecificattributes
Final list of specific attributes 1 Painted Monasteries Bucovina 2 Bran/Dracula Castle 3 Danube Delta 4 SPA/Thermal resorts 5 Peleş and Pelişor Castles 6 Black Sea Resorts 7 Medieval Towns 8 Fortresses from Transylvania
TheMedievalCitiesattributewasintroducedintheencodingitemsphase,inthegeneral expressions category (code medieval towns and cities), because itincludesanumberofcities(Bistriţa,Braşov,Cluj‐Napoca,Mediaş,Sebeş,Sibiuand Sighişoara) promoted under this name (Medieval Cities) on the websitewww.romaniatourism.com/medieval‐towns.htmlanditisconsideredageneralattribute. This information is relevant because the website appears with afrequencyof98%, following the interrogationof thesearchengineusing115keywordsrealizedintheVicolandSpiridon(2010)study.Thisclassificationisverycommonand,althoughtheattributeisnotinthelistofspecificattributesfrom the open ended questions (due to the encoding method), because itappears in itemsof bothopenendedquestions7 and3 times,wedecided toincludetheattributeMedievalCitiesinthefinallistofspecificattributes.
TheCarpathianMountainsattributeisonthe7thplaceinrankclassificationandthe4thplaceintheevaluationbasedonthepercentageofresponsesofthe6thquestion.Thisattributeappearsjustonetimeinopenendedquestion1and2timesinthesecondopenendedquestion.Ontheotherhand,mostreferencesweremadetothegeneralattributeMountains,whichisincludedinthefinallistofgeneralattributes;thereforethisattributewasnotincludedinthefinallistofspecificattributes.
TheUNESCOHeritageAreas attribute is ranked 6th in both classificationsmadeforquestion6,butitwasnotmentionedintheanswerstoanyoftheopenended questions. To check the frequency of occurrence on thewebsites thatpromoteRomaniaasatouristdestination,weusedthedatabasedevelopedbyVicol and Spiridon (2010). The database contains 548Word documents thathavebeenprocessedwith the softwareWordStat.The3wordsphrasesweregenerated and we measured their frequencies. The phrases containing theword “UNESCO” (WORLD HERITAGE UNESCO) was identified in 6.8% ofdocumentswithafrequencyofoccurrenceof62, in37casesoutof178threewordsphrasesidentifiedintotal.Incomparisonwiththeexpressionsthatareon the first places like: “Hotel in Bucharest” (frequency 706), “Castles andFortresses” (frequency 487) and “Black Sea Coast” (frequency 355) the

Vol.9No.1Spring,pp.47‐74,ISSN1842‐0206|Management&Marketing.ChallengesfortheKnowledgeSociety
56
M&M
attribute that refers toUNESCO’soccurs too rarely inorder tobe included inspecificattributesfinallist.
TheattributeHouseofParliament/Ceausescu isplaced8th in the ranks topand 7th in the top based on the percentages of answers. Two items wereidentifiedinopenendedquestions,oneineachofthetwoquestions.Also,thePalace of Parliament expression was found in 6.8% of documents, with thefrequencyofoccurrenceof69,in37casesoutof178threewordsphrases.Wedecidedtonotincludeitinthefinallistofspecificattributes.
TheattributeVineyardsandTraditionalCuisineisplaced8th(bypercentofresponses)and10(rankstop)anditwasnotidentifiedasaniteminanyoftheanswersofopenendedquestions.Basedonthat,wedecidednottoincludeitinthe final list of specific attributes. The Constantin Brancusi's Monumentsattribute ranks14th (ranks top)and10(bypercentof responses)and itwasnotidentifiedinanyoftheanswersofopenendedquestions,soitwasdecidednottoincludeitinthefinallistofspecificattributes.
Attributes: Archaeological Sites, Transylvania, Mocăniţa, George EnescuFestival,Ovidiu’s IslandandStAndrew’sMonasteryandMudVolcanoes are thelastplacedinresponsesofclosedendedquestionandtheywerenotmentionedintheanswersofopenendedquestions.Asaresult, theywereexcludedfromthe final list of specific attributes. Although the attributeArchaeological SitesTransylvania was excluded from the final list, in the answers of open endedquestionsthereisanotherattributethatreferstotheregionofTransylvania‐Cities and Fortified Churches fromTransylvania. It occupies 7th place in bothclassifications of results of first and second open ended questions, and wedecided to include it in the list of specific attributes.The last attributeswereexcluded from the final list:Wooden Churches of Maramureş and Moldova’sMonasteries.
Inconclusion,thefinallistofattributesofRomaniaasatouristdestination,obtainedfromexploratoryresearchincludes:27generalattributes(10generalattributesaddedtothe17selectedintheprocessofreviewofliterature)and8specificattributes.
ThedesignofthemeasuringinstrumentforthefinalresearchBased on the specific and general list of attributes obtained from theexploratory research and after the literature review process, we built themeasurementinstrumentforthetouristdestinationimage.Theinstrumentwasdeveloped in English in order to facilitate the translation process into otherlanguages,dependingonthetourists’sourcecountry(weusedGerman,Italianand French). The instrumentwas divided into 4 sections (A to E). Section Acontainstwoquestions:thefirstaimstoidentifyvisitorsandnon‐visitorsandthesecondquestionaimstoidentifythetypeofvisitthatrespondentshad.Theopen question from Section B was used to identify the first attribute/wordscoming to the respondents’ mind when asked about Romania as a touristdestination. This was adapted from Baloglu andMangaloglu (2001). In theirstudy,respondentslistedthefirst3adjectivesornounsthatcametotheirmind

Vol.9No.1Spring,pp.47‐74,ISSN1842‐0206|Management&Marketing.ChallengesfortheKnowledgeSociety
57
Acountry'simage
when thinkingof a certain tourist destination. SectionC is divided into threesubsections:SectionC1aoperationalizescognitiveimage,SectionC1bassessesrespondents' familiarity with specific attributes, Section C2 includes itemsmeasuring affective and conative image and section C3 operationalizes theconativecomponentof image “intention to recommend”.SectionD includes4questionsthataimedtoidentify:themaincompetitorsofRomaniaasatouristdestination, familiarity and attractiveness of the destination and the overallimage.Thelastpartofthequestionnaire(SectionE)includesquestionsmeanttoidentifythedemographicprofileofrespondentsandthetypeofcompanyinwhichtheywork.Cognitivecomponentoftouristdestinationimage(TDI)ThecognitivecomponentofTDIismeasuredbythegeneralattributesresultingfromtheexploratory researchand literature reviewand isoperationalized inSection C1a of the questionnaire. In Section C1b we evaluated theintermediaries’ familiaritywith the specific attributes.We used a total of 27itemstomeasurethecognitivecomponentand8itemstomeasurefamiliaritywith specific attractions. The items selected to measure the cognitivedimension were classified into five categories: infrastructure, socio‐politicalenvironment,naturalenvironment,generalattractions(culture,historyandart),andprice‐qualityratio.Anumberof3to14itemswereassignedtoeachofthefive categories, based on previous studies (Obenour, 2005; Calatone et al.,1989;ChenandHsu,2000;Alcanizetal.,2009;BalogluandMangaloglu,2001;Pike and Ryan, 2004; Baloglu and McCleary, 1999a; Pike, 2003; Beerli andMartin, 2004; Lee et al., 2005; Byon and Zhang, 2010; Hui and Wan, 2003;Echtner and Ritchie, 1991). In Table 7 we present the 5 categories with theassigneditems.
Table7.Cognitiveimageitems
1 Value for money Price-quality ratio (Value for money)
2 Costs/price levels 3 Quality of services 4 Infrastructure/transportation
Infrastructure
5 Access to destination/accessibility 6 Tourist information 7 Suitable accommodations 8 Scenery
Natural Environment
9 Climate 10 Cleanliness 11 Overcrowding 12 Air and noise pollution 13 Historical monuments/Castles/Fortresses
Attractions (culture, history and art)
14 Mountains 15 Museums 16 Culture 17 Handicraft 18 Gastronomy/Cuisine 19 Religious sites/Monasteries

Vol.9No.1Spring,pp.47‐74,ISSN1842‐0206|Management&Marketing.ChallengesfortheKnowledgeSociety
58
M&M
20 Architecture 21 Folklore 22 Delta 23 Personal safety
Social and political environment
24 People /Hospitality 25 Language barriers 26 Political stability 27 Economic development
We used semantic differential scales with values from 1 to 7, where 1 –
“offersverylittle”and7–“offersalot”tomeasurethe27itemsofSectionC1.Inaddition, to avoid errors in measuring non‐responses, 2 other options wereadded:Idon’tknowandIdonotwanttoanswer(AishandJoereskog,1990).Thecategory Specific attractions / landmarks include items used to measurefamiliarity, in C1b section of the questionnaire, identified by exploratoryresearch.Theeight itemsareshown inTable8andareoperationalizedusingsemantic‐differential scales with values from 1 to 7, where 1 – “not at allfamiliar”and7–“veryfamiliar”andthe2nonresponseoptions.
Table8.Familiarityitems–Specificattractionscategory
Painted Monasteries Bucovina
Specific attractions
Bran/Dracula Castle Danube Delta SPA/Thermal resorts Peleş and Pelişor Castles Black Sea Resorts Medieval TownsFortresses from Transylvania
AffectivecomponentofTDIWe used the bipolar semantic differential scale to measure the affectivecomponentof imagedefined inpreviousstudies(BalogluandBrinberg,1997;BalogluandMangaloglu,2001;PikeandRyan,2004;MartinandBosque,2007;Leeetal.,2005;Hosanyetal.,2006)asfollows:Unpleasant–Pleasant,Sleepy‐Arousing, Distressing – Relaxing, Gloomy‐ Exciting. The non‐response optionswerealsoavailable.
Intentiontorecommend‐conativecomponentofTDIPreviousstudiesusedarangeof2to4itemstoidentifybehavioralintentions(ByonandZhang,2010;Castroetal.,2007;ChenandTsai,2007;Lee,2009;ChiandQu,2008;Alcanizetal.,2009).Intheirstudy,ByonandZhang(2010)usedforthispurpose4items:intentrecommendationtofamilyandfriends,intentionto(re)visit,sayingpositivethingstootherpeopleandwillingnesstoparticipateinsportscompetitions.Duetothenatureofresearch, the last itemwasadaptedtoour study and transformed into: intention to recommend Romanian travelpackages to customers. We used a 1‐7 semantic differential scale, with 1 –Definitelynotand7–Definitelyyes.Thetwooptionsofnon‐responseswerealsoincluded.Thelastnonresponsewastransformedinto„Notsell”.

Vol.9No.1Spring,pp.47‐74,ISSN1842‐0206|Management&Marketing.ChallengesfortheKnowledgeSociety
59
Acountry'simage
InsectionDofthequestionnaireweincludedfourquestions:anopenendedquestion that aimed to identify the main competing countries in terms oftourism; a question for measuring the overall image of Romania by using adifferential scale with values from 1 to 7 (very negative ‐ very positive)(BalogluandMcCleary,1999a;BeerliandMartin,2004)andtwonon–responseoptions. Familiarity and attractiveness (Sonmez and Sirakaya, 2002) wereoperationalized throughquestionsD3 andD4 that used the samedifferentialscale with 7 steps. The last part of the questionnaire aims to identify therespondents’ characteristics and the company that they represent: age, sex,name of the company, company’s number of employees, time spent in thecompany (number of years) and their position (president/ generalmanager,operations manager, consultant, marketing or other), type of agency (touroperator, travel agent or both), depending on the destination company typesold(incoming,outgoing,both).
The last question segmented the sample into two groups: intermediarieswho sell packages to Romania and intermediaries who don’t offer suchpackages.Thisway,acomparisonwaspossiblebetweenthetwosub‐samples.
Questionnairetestingonexperts–contentvalidityTo test the content validity of the instrument thatmeasures TDI, we used asampleoffourtravelexperts:threeprofessorsfromtheUniversityofAl.I.Cuzaandone expert in tourism (responsible for promotingRomania as a touristicdestination).Contentvaliditywasperformedoneach itemandon theoverallscale.Relevanceandclarityweretestedandmeasuredona4‐pointLikertscale(Lynn,1986;Waltzetal.,1991)presentedinTable9.
Table9.Relevanceandclarityscale
Relevance 1=irrelevant 2= needs revision 3=relevant with small changes
4=very relevant Grade:
Comments: Clarity 1=Unclear 2= needs revision 3=clear with small changes 4=very clear Grade: Comments:
Literature provides four kappa indicators for statistical analysis of nominalagreement between more than two experts (Warrens, 2010). Light andHubert’s indicators are multi‐expert version of Cohen’s indicator for twoexperts and Fleiss's indicator is an extension of Scott’spi indicator formorethantwoexperts.Finally,SindicatorproposedbyRandolphisageneralizationofBennettetal.(1954)’sindicatorformorethantwoexperts.Assumingthatallthe experts assigned a minimum proportion of responses for each category,Warrens (2010) compares the four indicators and demonstrates themathematical superiority of the Randolph S indicator. Specifically, Warrens(2010) shows that Fleiss’s indicator is lower than Hubert and Randolph’sindicators, and that Randolph’s indicator is superior to Hubert and Light’sindicators.
Vol.9No.1Spring,pp.47‐74,ISSN1842‐0206|Management&Marketing.ChallengesfortheKnowledgeSociety
60
M&M
The four indicators presented above are classified into two categories:kappa indicators with fixed marginal values and kappa indicators with freemarginal values. The difference between them is given by theway items areassigned to categories, in our case, grades assigning. Indicators with freemarginal values are used in cases where experts must not assign a fixednumberofitems/casestoacategory.Indicatorswithfixedmarginalvaluesareusedinoppositecases.
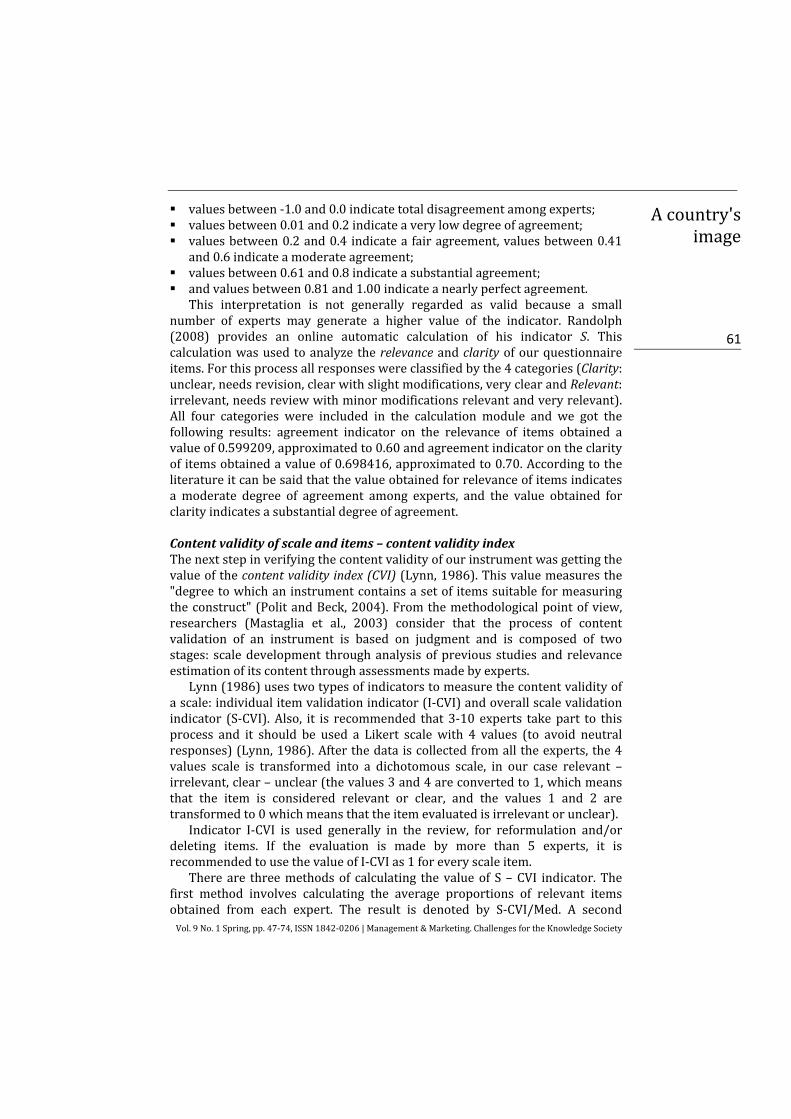
Inourcasetheagreementbetweenexpertswasmeasuredusingthekappaindicatorswithfreemarginalvaluescategory.Bennettetal.(1954)proposedSindicator,whichadjuststhelevelofagreementbetweenthetwoexpertstofititwith theagreementexpectedbychance.S indicator ismakingtheadjustmentbasedonthenumberofcategories included in theanalysis.Bennett indicatorcalculationformulais:
1
1
q
qPS a (1),where:
q=numberofcategories;Pa=proportionofagreementbetweentheexpertscalculatedbytheformula:
nrnrnr
P ija2
1
1 (2)
n=numberofitems/cases;nij=numberofresponses ineachcellof the tableresulting fromtheanswers(foritemiandcategoryj),andr=numberofexperts.The premise on which Bennett indicator is built is that the probability of
agreementby chance isq1 whenPa is equalwith
q1 , 0S which indicates that
theobservedagreementisgreaterthanchanceagreement.IndicatorScantakevalues between ‐1 and 1. Values below 0 show that observed agreement issmaller than the agreement expected by chance, and values greater than 0meanthatobservedagreementishigherthantheoneexpectedjustbychance.
Sindicatordependsonlyonconstantvaluesofq1 andPa,so,thevalueofSis
notinfluencedbyvariationinthedistributionofresponsesbetweengroupsorexperts.
Toassesstheagreementbetweenmorethantwoexperts,Randolph(2005)providesaformulaofcalculationforS,calledmulti‐expertkappaindicator.Thevaluesofthisindicatordonotvarydependingonthesymmetryofthemarginaldistributions,theyvarydependingonthenumberofcategoriesincludedintheanalysis; it is used when there are no restrictions on the number of itemsdistributedineachcategory.
ThereisnogeneralagreementontheinterpretationofSindicator’svalues.Somelinesweredrawnby(LandisandKoch,1977)whichmentionthat:
Vol.9No.1Spring,pp.47‐74,ISSN1842‐0206|Management&Marketing.ChallengesfortheKnowledgeSociety
61
Acountry'simage
valuesbetween‐1.0and0.0indicatetotaldisagreementamongexperts; valuesbetween0.01and0.2indicateaverylowdegreeofagreement; valuesbetween0.2and0.4 indicateafairagreement,valuesbetween0.41
and0.6indicateamoderateagreement; valuesbetween0.61and0.8indicateasubstantialagreement; andvaluesbetween0.81and1.00indicateanearlyperfectagreement.
This interpretation is not generally regarded as valid because a smallnumber of experts may generate a higher value of the indicator. Randolph(2008) provides an online automatic calculation of his indicator S. Thiscalculationwasusedtoanalyze therelevanceandclarityofourquestionnaireitems.Forthisprocessallresponseswereclassifiedbythe4categories(Clarity:unclear,needsrevision,clearwithslightmodifications,veryclearandRelevant:irrelevant,needsreviewwithminormodificationsrelevantandveryrelevant).All four categories were included in the calculation module and we got thefollowing results: agreement indicator on the relevance of items obtained avalueof0.599209,approximatedto0.60andagreementindicatorontheclarityofitemsobtainedavalueof0.698416,approximatedto0.70.Accordingtotheliteratureitcanbesaidthatthevalueobtainedforrelevanceofitemsindicatesa moderate degree of agreement among experts, and the value obtained forclarityindicatesasubstantialdegreeofagreement.
Contentvalidityofscaleanditems–contentvalidityindexThenextstepinverifyingthecontentvalidityofourinstrumentwasgettingthevalueofthecontentvalidityindex(CVI)(Lynn,1986).Thisvaluemeasuresthe"degreetowhichaninstrumentcontainsasetof itemssuitableformeasuringtheconstruct"(PolitandBeck,2004).Fromthemethodologicalpointofview,researchers (Mastaglia et al., 2003) consider that the process of contentvalidation of an instrument is based on judgment and is composed of twostages: scaledevelopment throughanalysisofprevious studiesandrelevanceestimationofitscontentthroughassessmentsmadebyexperts.
Lynn(1986)usestwotypesofindicatorstomeasurethecontentvalidityofascale:individualitemvalidationindicator(I‐CVI)andoverallscalevalidationindicator (S‐CVI). Also, it is recommended that 3‐10 experts takepart to thisprocess and it should be used a Likert scale with 4 values (to avoid neutralresponses)(Lynn,1986).Afterthedataiscollectedfromalltheexperts,the4values scale is transformed into a dichotomous scale, in our case relevant –irrelevant,clear–unclear(thevalues3and4areconvertedto1,whichmeansthat the item is considered relevant or clear, and the values 1 and 2 aretransformedto0whichmeansthattheitemevaluatedisirrelevantorunclear).
Indicator I‐CVI is used generally in the review, for reformulation and/ordeleting items. If the evaluation is made by more than 5 experts, it isrecommendedtousethevalueofI‐CVIas1foreveryscaleitem.
There are threemethodsof calculating thevalueof S–CVI indicator.Thefirst method involves calculating the average proportions of relevant itemsobtained from each expert. The result is denoted by S‐CVI/Med. A second

Vol.9No.1Spring,pp.47‐74,ISSN1842‐0206|Management&Marketing.ChallengesfortheKnowledgeSociety
62
M&M
methodofcalculation involvesgatheringall the indicators I‐CVIanddividingthe sumby the total number of items (S –CVI/I). The thirdmethod involvesgatheringallrelevantresponsesanddividingbythetotalnumberofresponses(S‐ CVI/R). All three methods provide the same values of S – CVI indicator.Besides these three methods researchers use the method of universalagreement (S‐CVI/UA), considered the strictest method of assessing contentvalidityofaninstrument.Thismeansthatasumofallrelevant itemsismade(all items that have the value of 1of CVI‐I) and this is divided by the totalnumberofitems.InmostcasestheamountofS‐CVI/UAislessthantheS‐IVC,andthereforeareconsideredacceptablevaluesgreaterthan0.70(Waltzetal.,2005). S‐CVI indicator is considered acceptable for values greater than 0.80(Polit and Beck, 2004), but Waltz et al. (2005) recommended the minimumacceptedvaluetobe0.90.
Forourinstrument,thefollowingindicatorswerecalculated:indicatorsforoverall scale by 4 methods, both for clarity and relevance. The results areshown in Table 10, Table 11, Table 12 and Table 13. Some authors offerinformationontheacceptanceleveloftheindicator,asfollows:a70%indicatesanecessaryagreementbetweentheexperts,80%indicatesaproperagreement,and90%canbetranslatedintoagoodagreementbetweenexperts(Hartmann,1977;Houseetal.,1981).AsshowninTable10,weobtainedCVIindexvalues,calculatedby the twomethods,of95%and84%. Indexvalueof0.95S‐CVI/Medindicatesagoodagreementbetweentheexpertsintermsofrelevanceanda value of 0.84 S‐CVI/AU‐indicates a proper agreement between experts intermsofrelevancefortheassessedscale.
Table10.Contentvalidityforrelevance
Relevance Total experts Total items Total relevant responses Total I-CVI = 1 380,36 53,25 213 47S-CVI /Med 0,95 S-CVI /I 0,95 S-CVI /R 0,95 S-CVI /AU 0,84 S‐CVI/Med–contentvalidity indicatorcalculatedas theaverageproportionofvalidityobtainedfromeachexpertanddividedbythetotalnumberofexperts.S‐CVI/I–contentvalidityindicatorcalculatedasthesumofI‐CVIindicatoranddividedbythetotalnumberofitems.S‐CVI/R–contentvalidityindicatorcalculatedasthesumofallrelevantitemsanddividedbythetotalnumberofresponses.It CVI / AU – content validity indicator calculated as the sum of value 1 of I ‐CVI indicator anddividedbythetotalnumberofitems.
TheobtainedvaluesaftermeasuringthescaleclarityarepresentedinTable11.Thescale index forclaritywascalculated,as inthecaseofrelevance,bybothmathematicalmethodsandtheresultsare:S‐CVI/med=0.97(97%)andCVI/AU=0.89(89%).

Vol.9No.1Spring,pp.47‐74,ISSN1842‐0206|Management&Marketing.ChallengesfortheKnowledgeSociety
63
Acountry'simage
The value obtained for S – CVI/Med – 0.97 indicates good agreementbetween the experts in terms of scale clarity the S – CVI/AU – 0.89 indicatesadequateagreementamongexpertsintermsoftheclarityscale.
Table11.Contentvalidityforclarity
Clarity Total experts Total items Total relevant responses Total I-CVI=1 387,50 54,25 217,00 50,00 S-CVI /Med 0,97 S-CVI /I 0,97 S-CVI /R 0,97 S-CVI /AU 0,89 Table12.ItemswithI‐IVC<1,00forrelevance
No. Items 4 values scale transformed scale I-CVI Exp 1 Exp 2 Exp 3 Exp 4 Exp 1 Exp 2 Exp 3 Exp 4
1 Personal safety 2 4 4 4 0 1 1 1 0,75 2 Language barriers 2 3 4 4 0 1 1 1 0,75 3 Political Stability 1 4 4 3 0 1 1 1 0,75 4 Agglomeration 2 4 4 2 0 1 1 0 0,50 5 Noise and
Environment pollution
2 4 2 4 0 1 0 1 0,50
6 Delta 4 4 4 2 1 1 1 0 0,75 7 Price level 4 4 2 3 1 1 0 1 0,75 8 SPA/Balneo 3 4 4 2 1 1 1 0 0,75 9 Intention to (re)visit 3 4 4 1 1 1 1 0 0,75
Table13.ItemswithI‐IVC<1,00forclarity
No. Items 4 values scale transformed scale I-IVC Exp 1 Exp 2 Exp 3 Exp 4 Exp 1 Exp 2 Exp 3 Exp 4
1 Agglomeration 3 2 4 2 1 0 1 0 0,50 2 Noise and Environment
pollution 3 4 2 4 1 1 0 1 0,75 3 Delta 4 4 4 2 1 1 1 0 0,75 4 Price level 4 4 2 3 1 1 0 1 0,75 5 SPA/Balneo 4 4 4 2 1 1 1 0 0,75 6 Intention to (re)visit 4 4 4 1 1 1 1 0 0,75
According to themethodology proposed by Lynn (1986), when using panelswith less than five experts, content validity index for each itemmust have avalueof1,orobtainperfectagreement.Inthiscase,fromall56evaluateditemsweobtained indexvalueof1only for47forrelevanceand50forclarity.Theitemswithindexvalueof0wereanalyzedseparately.
Sameitemsthatobtainedvalueslessthan1forrelevanceobtainedlessthan1alsoforclarity.
Items from Natural Environment category, Congestion and Noise andEnvironmentpollution,with I‐CVI = 0.50were removed from the instrument:Thus, three items remained in this categorywith the I‐CVI=1of the5 itemsoriginallyproposed.

Vol.9No.1Spring,pp.47‐74,ISSN1842‐0206|Management&Marketing.ChallengesfortheKnowledgeSociety
64
M&M
Followingtheanalysisofcommentsprovidedbyexperts,wedecidedto: Remove the following items: personal safety, language barriers, political
stabilityandintentionto(re)visit,and Reviewthefollowingitems:pricelevel,climateandtouristinformation.
From the 56 items included in the validation phase, six items wereeliminatedandthreewerereviewed(Table14).
Table14.Eliminatedandrevieweditemsaftercontentvalidationprocess
No. Items I-CVI Relevance
I-CVI Clarity
Reviewed items
1 Personal Safety 0,75 Eliminated2 Language Barriers 0,75 Eliminated3 Political Stability 0,75 Eliminated4 Congestion 0,50 0,50 Eliminated5 Noise and Environment pollution 0,50 0,75 Eliminated6 Delta 0,75 0,75 Maintained7 Price level 0,75 0,75 Revised Good Prices 8 SPA/Balneo 0,75 0,75 Maintained9 Intention to (re)visit 0,75 0,75 Eliminated10 Tourist information 1 1 Revised Tourist information centers 11 Climate 1 1 Revised Climate/Temperature
Reliabilitytesting–pilotstudyTheobjectiveofthepilotstudywastoestimatetheinstrument’sreliabilitybycheckingthe internalconsistency.Researchershavedifferentviewsregardingthe minimum number of responses required for a pilot study. For example,Hertzog (2008) considers that a sample between 25‐40 respondents issufficient,JohansonandBrooks(2009)arguethataminimumof30responsesisnecessary,andHill(1998)statesthat10to30respondentsaresufficientfortestingofaninstrument.
Thepilotstudywasconductedduring7‐13.03.2012onasampleconsistingof Romanian tourism intermediaries who participated in the previousexploratoryinvestigation.Theexperts’validatedinstrumentwasintroducedinSurveyGizmoonlineplatform.Thegenerated linkwiththequestionnairewassent by mail to all respondents who provided complete responses in theprevious exploratory investigation. We obtained a 24.6% response rate, 15completeresponsesoutof61sentemails.
The process of estimating instrument reliability by assessing the internalconsistencyofresponsesisusedforreflectiveconstructs.Internalconsistencyrefers to the correlation between the items, on a test sample, whilehomogeneity refers to the unidimensionality of the scale. A scale isunidimensional if the items measure a single latent construct. Studies haveshown thatCronbach'sAlpha estimator is influencedby thenumberof itemsused in thescale. If thenumberof items increases, thevalueof theestimatorwill also increase, so it is recommended to report Cronbach Alpha for eachinstrumentconstruct(TavakoliandDennick,2011).
Cronbach Alpha can range between 0.00 ‐ 1.00 and its value variesaccording to: the number of items of the scale and inter‐item links. The

Vol.9No.1Spring,pp.47‐74,ISSN1842‐0206|Management&Marketing.ChallengesfortheKnowledgeSociety
65
Acountry'simage
literatureoffersvariousrangesofacceptancetoitsinterpretation.Forexample,Hairetal. (2006)consideredtheminimumlevel isobtained forAlpha=0.70,whileMalhotra(2010)suggestsaminimumvalueof0.60.Mostresearchersusethe range 0.70 ‐ 0.95 according to the interpretation of the estimator, and avalue greater than 0.95 is considered redundant and in this case it isrecommendedtoreducethescale. InTable15, theCronbachAlphavaluesforeachconstruct/imagedimension(affective,cognitiveandconativeimage),andfortheSpecificAttractionscategoryarepresented.
Table15.CronbachAlpha’svalues
Construct Category Items Mean Standard deviation
Cronbach Alpha - α
Cognitive
0,944
Infrastructure
Infrastructure/Transportation 3,73 1,33
0,745
Access to destination/Accessibility 4,27 1,28Tourist information centers 3,13 1,41Suitable accommodations 5,27 1,10
Socio-political environment
People/Hospitality 5,33 1,400,534 Economic development 3,93 0,96
Natural environment
Scenery 5,67 1,29
0,547 Climate/Temperature 5,47 1,06Cleanliness 3,27 1,28
General attractions
Historical monuments/Castles/Fortresses 5,73 1,16
0,935
Mountains 6,00 0,93Museums 5,20 1,37Culture 5,93 1,33Handicrafts 5,40 1,40Gastronomy/Cuisine 5,80 1,42Religious sites/Monasteries 6,27 0,96Architecture 5,53 1,41Folklore 5,73 1,16Delta 6,60 0,74
Price-quality (value for money)
Value for money 4,80 1,32
0,928 Good prices 4,87 1,19Quality of services 4,13 1,41
Affective
Unpleasant-Pleasant 3,93 1,16
0,928
Sleepy-Arousing 3,60 0,99Distressing-Relaxing 3,40 1,12Gloomy-Exciting 3,53 0,92
Conative
Intention to recommend to others - family and friends 5,80 1,42
0,948
Say positive things to other people 5,93 1,39Intention to recommend Romania's tourism packages to your clients 5,53 1,64
Specific attractions
Painted monasteries from Bucovina 6,20 1,08
0,872
Dracula/Bran Castle 6,33 1,23Danube Delta 5,87 1,60Spa/Balneo resorts 4,40 1,45Peleş and Pelişor Castles 6,00 1,07Black Sea resorts 5,60 1,76Medieval towns 5,33 1,72Fortified churches and fortresses from Transylvania 5,53 1,41

Vol.9No.1Spring,pp.47‐74,ISSN1842‐0206|Management&Marketing.ChallengesfortheKnowledgeSociety
66
M&M
Thesubscalesthatmeasurecategories:Socio‐politicalenvironmentandnaturalenvironment with 2 and 3 items, obtained the Alpha coefficient values lowerthan0.6(0.53and0.54).Basedonliterature(Leeetal.,2005)itwasdecidedtocombinethetwocategoriesintoasinglescaletitledSocio‐politicalandnaturalenvironment. The Alpha coefficient for this new construct is 0.757 and wedecidedtokeeptheitemsintheinstrument(seeTable16).
Table16.CronbachAlphavaluefortheTDIcognitivesubscale
Category Items Average Standard Deviation
Cronbach Alpha - α
Socio-political and natural environment
People/Hospitality 5,33 1,397
0,757 Economic development 3,93 ,961Scenery 5,67 1,291Climate/Temperature 5,47 1,060Cleanliness 3,27 1,280
TheotherthreecategoriesthatdefinethecognitivedimensionofthescaleTDI,Infrastructure,Price‐QualityRatio,GeneralAttractionsobtainedAlpha’svaluesbetween0.74and0.935.CronbachAlphavalue for thecognitivedimension is0.944.Thesevaluesdenoteaverygood internal consistencyof thescale.Theconstructs for affective and conative dimensions obtained high values forAlpha, 0.928 and 0.948, but not more than 0.95 which would have createdsuspicionofredundancyof items.Thescale forspecificattractionsobtainedagoodvalueCronbachAlpha(0.87).Afteranalyzingtheresultsofthepilotstudytheinstrumenthasnotsufferedanychanges.TheinstrumentwasdevelopedinEnglish,inordertofacilitatethebacktranslationprocessandavoiderrorsthatcouldoccurbytranslatingtheinstrumentintoRomanianandbackintoEnglish.Thefinalformispresentedintheannexes.ConclusionsandfuturedirectionsOur study brings an important contribution from the point of view ofinstrumentalresearch,showingthemainstagesandproceduresnecessaryforobtaining a reliable and valid researchmeasurement instrument. As a futuremanagerialimplication,suchaquestionnairecouldbeusedtoactuallymeasureRomania’s destination image from the perspective of external intermediariesfrom different tourist sending countries, after a cultural translation of theinstrument from English to the native language of the analyzed country.Following the sameprocedure, instruments specific forother countries couldbedeveloped–themostimportantpartbeingthequalitativeassessmentofthescale.
We started our approach because several studies demonstrated thattourists,especiallywhentheydon’thavepreviousdirectexperiences,trustandturntoprofessionalsources,liketravelagencies,foradvice(BitnerandBooms,1982; Snepenger et al., 1990; Baloglu and Managaloglu, 2001). This is whymeasuring the perceived destination image of intermediaries is important,using a sound instrument that would allow comparisons. Although theliteratureondestination image isabundant,onlya fewstudiesmeasuredthis

Vol.9No.1Spring,pp.47‐74,ISSN1842‐0206|Management&Marketing.ChallengesfortheKnowledgeSociety
67
Acountry'simage
perceived image fromthe intermediaries’perspective(McLellanandFoushee,1983;GartnerandBachri,1994;BalogluandManagaloglu,2001;XiaoandMair,2006;Camprubietal.,2008).Asa step forward fromthesestudies,whichdonotinsistontheresearchinstrumentsused,wepresentacomplexanddetailedmixedmethodology–qualitativeandquantitative–andathoroughdescriptionof the whole scale development process, addressing reliability and validityissues.Anotherplus is the fact thatweusedreal travel intermediaries to testthe instrument, while other studies used students. Moreover, such a mixedprocedure used on real travel agents leads to a valid instrument forcomparisonsamongcountries,despitethelargedifferencesintermsofspecifictouristattributes.
Thereareseverallimitsforourstudy.Themainoneisrelatedtothesmallsamplesusedfortestingtheinstrumentinvariousstages:weusedfourtravelexperts for testing the content validity and 15 travel agents for testing theinternalconsistencyofthescale.Althoughsomeauthorssuggestthatanumberof 10 to 30 respondentswould be appropriate (Hill, 1998), a bigger numberwould be more assuring. Also, for the content analysis (in order to get thegeneral and specific attributes), only two coders were used. As futureapproaches,weintendtoretesttheinstrumentusingalargersampleofexpertsfor the content validity and a larger sample of travel agents for testing theinternal consistency. Applying the instrument in order to obtain Romania’sperceiveddestinationimagefromtheexternalintermediaries’perspectivewillalsoallowustosupplementarytestthesuggestedscale.
ReferencesAlcaniz, E.B., Garcia, I.S. and Blas, S.S. (2005), “Relationships among residents’ image,
evaluationofthestayandpost‐purchasebehavior”,JournalofVacationMarketing,Vol.11,No.4,pp.291‐302.
Baloglu,S.andBrinberg,D.(1997),“Affectiveimagesoftourismdestinations”,JournalofTravelResearch,Vol.35,No.4,pp.11‐15.
Baloglu, S. andMangaloglu,M. (2001), “Tourism destination images of Turkey, Egypt,Greece, and Italy as perceived by US‐based tour operators and travel agents”,TourismManagement,Vol.22,No.1,pp.1‐9.
Baloglu,S.andMcCleary,K.W.(1999a),“U.S.internationalpleasuretravelers’imagesoffour Mediterranean destinations: A comparison of visitors and non‐visitors”,JournalofTravelResearch,Vol.38,No.2,pp.144‐152.
Baloglu, S. and McCleary, K.W. (1999b), “A model of destination image formation”,AnnalsofTourismResearch,Vol.26,No.4,pp.868‐897.
Beerli,A.(2004),“Tourists’characteristicsandtheperceivedimageoftouristdestinations:aquantitativeanalysis‐acasestudyofLanzarote,Spain”,TourismManagement,Vol.25,No.5,pp.623‐636.
Beerli, A. and Martin, D.J. (2004). “Factors influencing destination image”, Annals ofTourismResearch,Vol.31,No.3,pp.657‐681.
Bitner, M.J. and Booms, B.H. (1982), “Trends in Travel and Tourism Marketing: TheChangingStructureofDistributionChannels”, JournalofTravelResearch,Vol.20,No.4,pp.39‐44.
Bosque, I. and Martin, H. (2008), “Tourist satisfaction a cognitive‐affective model”,AnnalsofTourismResearch,Vol.35,No.2,pp.551‐573.

Vol.9No.1Spring,pp.47‐74,ISSN1842‐0206|Management&Marketing.ChallengesfortheKnowledgeSociety
68
M&M
Calantone, R.J., Benedetto, A.D., Hakam, A. and Bojanic, D.C. (1989), “Multiple multi‐national tourism positioning using correspondence analysis”, Journal of TravelResearch,Vol.28,No.2,pp.25‐32.
Camprubí,R.,Guia,J.andComas,J.(2008),“Destinationnetworksandinducedtourismimage”,TourismReview,Vol.63,No.2,pp.47‐58.
Chen, C.F. and Tsai, D.C. (2007), “Howdestination image and evaluative factors affectbehavioralintentions?”,TourismManagement,Vol.28,No.1,pp.1115‐22.
Chen,J.S.andHsu,C.H.C.(2000),“MeasurementofKoreantourists’perceivedimagesofoverseasdestinations”,JournalofTravelResearch,Vol.38,No.4,pp.411‐416.
Chen,P.J.andKerstetter,D.L.(1999),“InternationalStudents’ImageofRuralPennsylvaniaasaTravelDestination”,JournalofTravelResearch,Vol.37,No.3,pp.256‐266.
Crompton,J.L.(1977),“Asystemsmodelofthetourist’sdestinationselectiondecisionprocess with particular reference to the role of image and perceived constraints”,
Crompton.Dann,G.M.S.(1996),“Tourists’imagesofadestination–analternativeanalysis”,Journal
ofTravelandTourismMarketing,Vol.5,No.1/2,pp.41‐55.Echtner,C.M.andRitchie, J.R.B.(1991),“Themeaningandmeasurementofdestination
image”,JournalofTourismStudies,Vol.2,No.2,pp2‐12.Echtner, C.M. and Ritchie, J.R.B. (1993), “The measurement of destination image: An
empiricalassessment”,JournalofTravelResearch,Vol.31,No.4,pp.3‐13.Gartner, W.C. (1993), “Image formation process”, Journal of Travel and Tourism
Marketing,Vol.2,No.2/3,pp.191‐216.Gartner,W.C.(1989).“Tourismimage:Attributemeasurementofstatetourismproducts
using multidimensional scaling techniques”, Journal of Travel Research, Vol. 28,No.2,pp.16‐20.
Gartner,W.C. and Bachri, T. (1994), “Tour operators’ role in the tourism distributionsystem:An Indonesian case study”, Journalof InternationalConsumerMarketing,Vol.6,No.3/4,pp.161‐179.
Govers, R., Go, F.M. and Kumar, K. (2007), “Promoting Tourism Destination Image”JournalofTravelResearch,Vol.46,No.1,pp.15‐23.
Granka, L.A., Joachims, T. and Gay,G. (2004), “Eye‐tracking analysis of user behavior”,Proceedings of the 27th annual international conference on Research anddevelopmentininformationretrievalSIGIR04,478.ACMPress.
Hartmann, D. (1977), “Considerations in the choice of inter‐observer reliabilityestimates”,JournalofAppliedBehaviorAnalysis,Vol.10,No.1,pp.103‐116.
Hertzog, M.A. (2008), “Considerations in determining sample size for pilot studies”,Researchinnursingandhealth,Vol.31,No.2,pp.180‐191.
House, A.E., House, B.J. and Campbell, M.B. (1981), “Measures of inter‐observeragreement: Calculation formulas and distribution effects”, Journal of BehavioralAssessment,Vol.3,No.1,pp.37‐57.
Hui,T.K.andWan,T.W.D.(2003),“Singapore’simageasatouristdestination”,InternationalJournalofTourismResearch,Vol.5,No.4,pp.305‐313.
Johanson,G.A.andBrooks,G.P.(2009),“InitialScaleDevelopment:SampleSizeforPilotStudies”,EducationalandPsychologicalMeasurement,Vol.70,No.3,pp.394‐400.
Joppe, M., Martin, D.W. and Waalen, J. (2001), “Toronto’s image as a destination: Acomparativeimportance‐satisfactionanalysisbyoriginofvisitor”,JournalofTravelResearch,Vol.39,No.3,pp.252‐260.
Lee,C.‐ki,Lee,Y.‐ki andLee,B. (2005), “CFA‐Korea’sdestination image formedby the2002WorldCup”,AnnalsofTourismResearch,Vol.32,No.4,pp.839‐858.
Lubbe, B. (1998), “Primary image as a dimension of destination image: An empiricalassessment”,JournalofTravelandTourismMarketing,Vol.7,No.4,pp.21‐43.

Vol.9No.1Spring,pp.47‐74,ISSN1842‐0206|Management&Marketing.ChallengesfortheKnowledgeSociety
69
Acountry'simage
MacKay,K.J.andFesenmaier,D.R.(2000),“Anexplorationofcross‐culturaldestinationimageassessment”,JournalofTravelResearch,Vol.38,No.4,pp.417‐423.
Malhotra,N.K.(2010),MarketingResearch:AnAppliedOrientation,Pearson:NewYork.Malhotra,N.,Agarwal,J.andPeterson,M.(1996),“Methodologicalissuesincross‐ultural
marketing research: a state‐of‐the‐art review”, International Marketing Review,Vol.13,No.5,pp.7‐43.
Mastaglia, B., Toye, C. and Kristjanson, L.J. (2003), “Ensuring content validity ininstrument development: challenges and innovative approaches”, ContemporarynurseajournalfortheAustraliannursingprofession,Vol.14,No.3,pp.281‐291.
McLellan R.W. and Foushee, K.D.(1983), “Negative images of the United States asexpressed by tour operators from other countries”, Journal of Travel Research,Vol.22,No.1,pp.2‐5.
Milman, A. and Pizam, A. (1995), “The Role of Awareness and Familiarity with aDestination: The Central Florida Case”, Journal of TravelResearch, Vol. 3, No. 3,pp.21‐27.
Neuman,W.L.(2003),SocialResearchMethods:QualitativeandQuantitativeApproaches.J.Lasser(ed.)Relevanceofsocialresearch,Vol.8,p.608.
Obenour,W.(2005),“Thedevelopmentofadestinationthroughtheimageassessmentof six geographic markets”, Journal of Vacation Marketing, Vol. 11, No. 2,pp.107‐119.
O'Leary,S.andDeegan, J. (2005),“Ireland'sImageasaTourismDestinationinFrance:Attribute Importance and Performance”, Journal of Travel Research, 43,pp.247‐256.
Pike, S. (2002), “Destination image analysis – a review of 142 papers from 1973 to2000”,TourismManagement,Vol.23,No.5,pp.541‐549.
Pike,S.andRyan,C.(2004),“Destinationpositioninganalysisthroughacomparisonofcognitive,affective,andconativeperceptions”, JournalofTravelResearch,Vol.42,No.4,pp.333‐342.
Polit, D.F. and Beck, C.T. (2006), “The content validity index: are you sure you knowwhat'sbeingreported?Critiqueandrecommendations”,Researchinnursinghealth,Vol.29,No.5,pp.489‐497.
Reilly, M.D. (1990), “Free Elicitation of Descriptive Adjectives For Tourism ImageAssessment”,JournalofTravelResearch,Vol.28,No.4,pp.21‐26.
Snepenger,D.,Meged,K.,Snelling,M.andWorrall,K.(1990),“InformationSearchStrategiesbydestination‐naiveTourists”,JournalofTravelResearch,Vol.29,No.1,pp.13‐16.
Sonmez,S.andSirakaya,E.(2002),“Adistorteddestinationimage?ThecaseofTurkey”,JournalofTravelResearch,Vol.41,No.2,pp.185‐196.
Tapachai,N.andWaryszak,R.(2000),“Anexaminationoftheroleofbeneficialimageintouristdestinationselection”,JournalofTravelResearch,Vol.39,No.1,pp37‐44.
Tasci, A.D.A. and Gartner, W.C. (2007), “Destination Image and Its FunctionalRelationships”,JournalofTravelResearch,Vol.45,No.4,pp.413‐425.
Tasci, A.D.A., Gartner, W.C. and Tamer Cavusgil, S. (2007), “Conceptualization andOperationalization of Destination Image”, Journal of Hospitality and TourismResearch,Vol.31,No.2,pp.194‐223.
Tavakol,M. andDennick,R. (2011), “Making senseofCronbach’s alpha”, InternationalJournalofMedicalEducation,Vol.2,pp.53‐55.
Vicol,O.C.andSpiridon,S.I.(2010),“EvaluatingOnlineDestinationImageByAnalyzingPictures Used in Presenting Romania on Websites”, Ovidius University AnnalsEconomicSciencesSerie,Vol.10,No.1,pp.1353‐1358.
Xiao,HandMair,L. (2006), “Aparadoxof images:representationofChinaasa touristdestination”,JournalofTravelandTourismMarketing,Vol.20,No.2,pp.1‐14.

Vol.9No.1Spring,pp.47‐74,ISSN1842‐0206|Management&Marketing.ChallengesfortheKnowledgeSociety
70
M&M
Walmsley, D.J. and Young, M. (1998), “Evaluative images and tourism: The use ofpersonal constructs to describe the structure of destination images”, Journal ofTravelResearch,Vol.36,No.3,pp.65‐69.
Waltz, C.F., Strickland, O. and Lenz, E. (1991). Measurement in nursing research.Philadelphia:F.A.Davis.
Warrens, M.J. (2010), “Inequalities between multi‐rater kappas”, Advances in DataAnalysisandClassification,Vol.4,No.4,pp.271‐286.
***UnitedNationsWorldTourismOrganization(2004).www2.unwto.org/

Vol.9No.1Spring,pp.47‐74,ISSN1842‐0206|Management&Marketing.ChallengesfortheKnowledgeSociety
71
Acountry'simage
Annex1.
Finalquestionnairevalidatedthroughtheinstrumentalresearch
SectionA–FilterquestionsNumberoftimesyouvisitedRomania:____________________Whattypeofvisititwas?LeisureBusinessBoth
SectionB–MostknownelementsthatcompoundRomania’simagePlease write the first 3 ‐ 5 words or statements that come to yourmindwhen you think ofRomaniaasatouristdestination.____________________________________________________________________________
SectionC–ImagedestinationdimensionsC1a.ItemsusedtoidentifythecognitivedimensionThinkingaboutRomaniaasatouristdestination,pleasestate,onascaleof1to7,ifyouagreeornotwiththefollowingstatements:(Where1=Offersverylittle,7=Offersverymuch)
Offersverylittle=1
2 3 4 5 6
Offersverymuch=7
Don’tKnow
Don'twanttoanswer
Infrastructure/transportation Accesstodestination/accessibility
Touristinformation(centers) Suitableaccommodations People/Hospitality Economicdevelopment Scenery Climate/temperature Cleanliness Historicalmonuments/Castles/Fortresses
Mountains Museums Culture Handicraft Gastronomy/Cuisine Religioussites/Monasteries Architecture Folklore Delta Valueformoney Goodprices Qualityofservices
Vol.9No.1Spring,pp.47‐74,ISSN1842‐0206|Management&Marketing.ChallengesfortheKnowledgeSociety
72
M&M
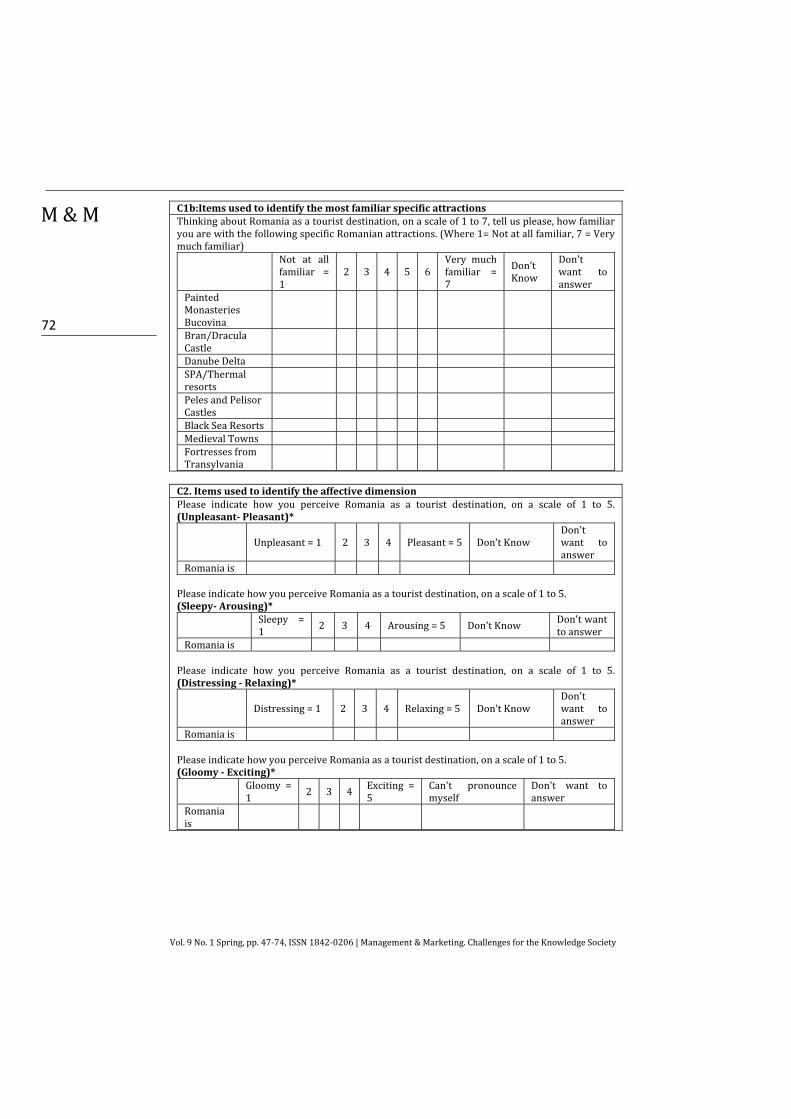
C1b:ItemsusedtoidentifythemostfamiliarspecificattractionsThinkingaboutRomaniaasatouristdestination,onascaleof1to7,tellusplease,howfamiliaryouarewiththefollowingspecificRomanianattractions.(Where1=Notatallfamiliar,7=Verymuchfamiliar)
Not at allfamiliar =1
2 3 4 5 6Very muchfamiliar =7
Don’tKnow
Don'twant toanswer
PaintedMonasteriesBucovina
Bran/DraculaCastle
DanubeDelta SPA/Thermalresorts
PelesandPelisorCastles
BlackSeaResorts MedievalTowns FortressesfromTransylvania
C2.ItemsusedtoidentifytheaffectivedimensionPlease indicate how you perceive Romania as a tourist destination, on a scale of 1 to 5.(Unpleasant‐Pleasant)*
Unpleasant=1 2 3 4 Pleasant=5 Don’tKnowDon'twant toanswer
Romaniais PleaseindicatehowyouperceiveRomaniaasatouristdestination,onascaleof1to5.(Sleepy‐Arousing)*
Sleepy =1 2 3 4 Arousing=5 Don’tKnow Don'twant
toanswerRomaniais
Please indicate how you perceive Romania as a tourist destination, on a scale of 1 to 5.(Distressing‐Relaxing)*
Distressing=1 2 3 4 Relaxing=5 Don’tKnowDon'twant toanswer
Romaniais PleaseindicatehowyouperceiveRomaniaasatouristdestination,onascaleof1to5.(Gloomy‐Exciting)*
Gloomy =1 2 3 4
Exciting =5
Can't pronouncemyself
Don't want toanswer
Romaniais

Vol.9No.1Spring,pp.47‐74,ISSN1842‐0206|Management&Marketing.ChallengesfortheKnowledgeSociety
73
Acountry'simage
C3.ItemsusedtoidentifytheconativedimensionThinkingaboutRomaniaasatouristdestination,onascaleof1to7pleasestateifyouagreeornotwiththefollowingstatements(Where1=Definitelyno,7=Definitelyyes)*
Definitelyno=1 2 3 4 5 6 Definitely
yes=7Don’tKnow
Don'twant toanswer
Intention torecommend toothers ‐ family andfriends
Say positive thingstootherpeople
ThinkingaboutRomaniaasatouristdestination,onascaleof1to7pleasestateifyouagreeornotwiththefollowingstatements.(Where1=Definitelyno,7=Definitelyyes)*Ifyoudon'tselltourismpackagestoRomaniapleaseanswerwith"don'tsell"
Definitely no =1 2 3 4 5 6
Intention to recommendRomania's tourism packages toyourclients
D.Itemsusedtoidentifycompetitivetouristdestinations,generalimage,familiarityandinteresttowardsRomaniaIfyouhavetocompare,withwhichcountry/countrieswouldyoucompareRomaniaasatouristdestination?*__________________________________________________________What is your overall image of Romania as a tourist destination, on a scale of 1 to 7 (1=Verynegative,5=Verypositive)*
Verynegative=1 2 3 4 5 6 Very
positive=7Don’tKnow
Don'twant toanswer
Overallimage
In general, how appealing is Romania to you as a tourist destination, on a scale of 1 to 7?(Where1=Veryunappealing,7=Veryappealing)*
Veryunappealing =1
2 3 4 5 6Veryappealing =7
Don’tKnow
Don't wanttoanswer
Appealing Howfamiliar/knowledgeabledoyouconsideryourselftobewithRomania,onascaleof1to7?(Where1=Notatallfamiliar,5=Veryfamiliar)*
Not at allfamiliar =1
2 3 4 5 6Veryfamiliar =7
Don’tKnowDon'twant toanswer
Familiarity
Vol.9No.1Spring,pp.47‐74,ISSN1842‐0206|Management&Marketing.ChallengesfortheKnowledgeSociety
74
M&M
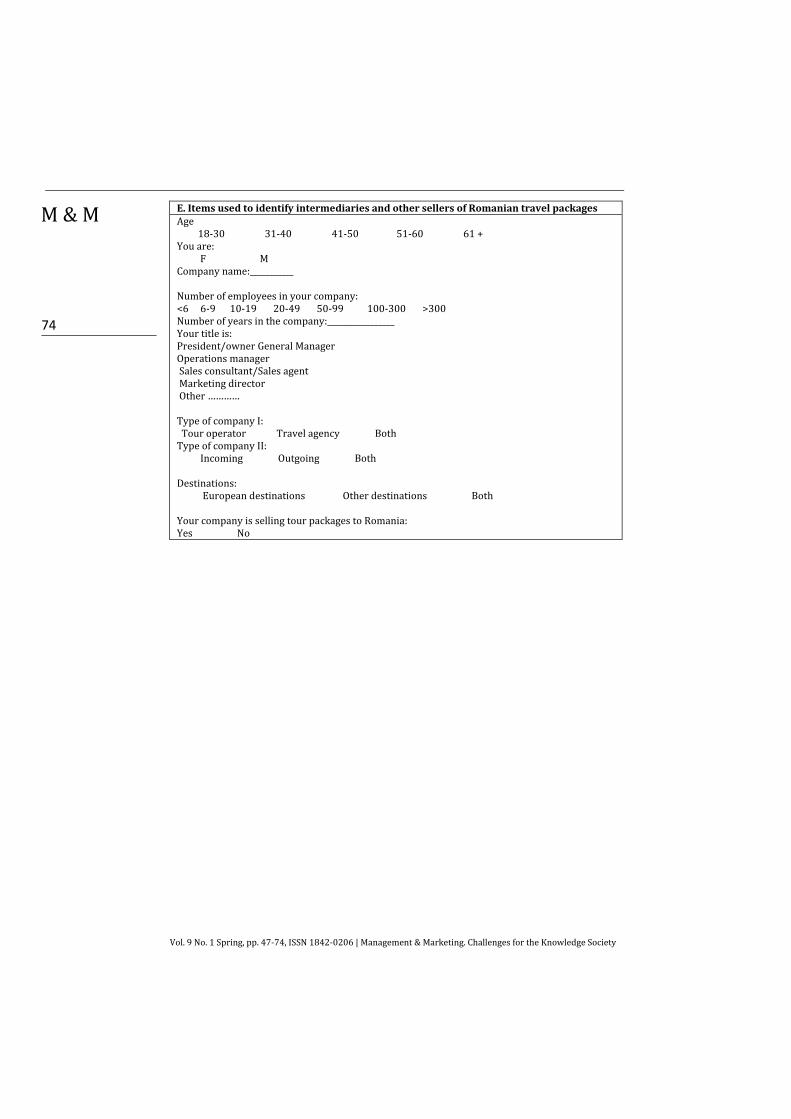
E.ItemsusedtoidentifyintermediariesandothersellersofRomaniantravelpackagesAge18‐3031‐4041‐5051‐6061+Youare:FMCompanyname:___________Numberofemployeesinyourcompany:<66‐910‐1920‐4950‐99100‐300>300Numberofyearsinthecompany:_________________Yourtitleis:President/ownerGeneralManagerOperationsmanagerSalesconsultant/SalesagentMarketingdirectorOther…………TypeofcompanyI:TouroperatorTravelagencyBothTypeofcompanyII:IncomingOutgoingBothDestinations:EuropeandestinationsOtherdestinationsBothYourcompanyissellingtourpackagestoRomania:YesNo