Shreveport-Bossier Convention and Tourist Bureau Mardi ...
35
Shreveport-Bossier Convention and Tourist Bureau Mardi Gras 2014 Economic Impact Study August 2014 Destination Exploration 416 Landon Drive Nashville, Tennessee 37220 (615) 714-9797 www.destinationexploration.com
-
Upload
khangminh22 -
Category
Documents
-
view
0 -
download
0
Transcript of Shreveport-Bossier Convention and Tourist Bureau Mardi ...

Shreveport-Bossier Convention and Tourist Bureau
Mardi Gras 2014 Economic Impact Study
August 2014
Destination Exploration
416 Landon Drive
Nashville, Tennessee 37220
(615) 714-9797
www.destinationexploration.com

2
Table of Contents
BACKGROUND AND METHODOLOGY 3
EXECUTIVE SUMMARY 6
DETAILED FINDINGS 8
RESPONSES 8
GROUP SIZE 8
GROUP COMPOSITION 9
MODE OF TRANSPORTATION 10
PREVIOUS ATTENDANCE 11
NUMBER OF TIMES 13
AWARENESS OUTLETS 14
PARADE ATTENDANCE 15
PLACE OF RESIDENCE 16
TRIP ATTRIBUTES 18
LENGTH OF STAY 19
CITY OF OVERNIGHT STAY 19
ACCOMMODATIONS 20
PARADE IMPORTANCE 21
ECONOMIC IMPACT 22
LIKELINESS TO RETURN 23
DEMOGRAPHICS 24
OCCUPATION 24
HOUSEHOLD INCOME 27
AGE 28
MARITAL STATUS 30
RACE 31
GENDER 32
3
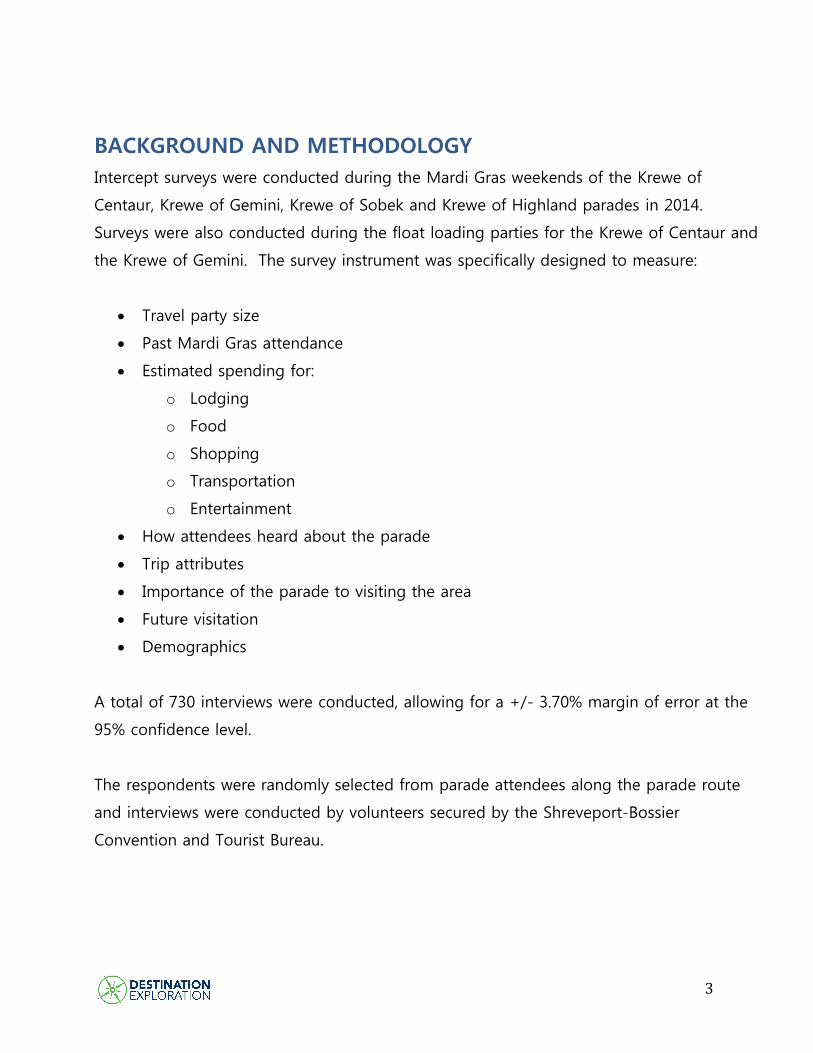
BACKGROUND AND METHODOLOGY
Intercept surveys were conducted during the Mardi Gras weekends of the Krewe of
Centaur, Krewe of Gemini, Krewe of Sobek and Krewe of Highland parades in 2014.
Surveys were also conducted during the float loading parties for the Krewe of Centaur and
the Krewe of Gemini. The survey instrument was specifically designed to measure:
Travel party size
Past Mardi Gras attendance
Estimated spending for:
o Lodging
o Food
o Shopping
o Transportation
o Entertainment
How attendees heard about the parade
Trip attributes
Importance of the parade to visiting the area
Future visitation
Demographics
A total of 730 interviews were conducted, allowing for a +/- 3.70% margin of error at the
95% confidence level.
The respondents were randomly selected from parade attendees along the parade route
and interviews were conducted by volunteers secured by the Shreveport-Bossier
Convention and Tourist Bureau.

4
Destination Exploration developed the survey instrument, conducted on-site interviewer
training, tabulated and analyzed the data. The study was administered during Mardi Gras
2014.
To best estimate the number of parade viewers, Destination Exploration and the SBCTB
volunteers attempted to randomly survey parade goers at the Krewe of Centaur parade on
February 22, 2014 and the Krewe of Gemini parade on March 1, 2014.
For the purposes of this report and calculating the estimated economic impact of the
various parades the following attendance estimation will be used:
The parade route is 6.5 miles long, which includes a bridge approximately a half-mile long
on which parade viewers are not allowed during the parade. The length of the parade
route is 6 miles long (6.5 miles minus the half mile bridge). At 5,280 per mile, the parade
route is estimated at 31,680 feet in overall length. Each person is estimated to take up a
two-foot space standing more or less shoulder-to-shoulder. Shoulder-to-shoulder crowds
were observed throughout the parade route. It is important to note that not all areas
were shoulder-to-shoulder. However, the majority of the route was extremely crowded.
Two feet per person for a six miles route would result in 15,840 on a single side of the
parade route and 31,680 on both sides of the parade route one person deep. It is
unrealistic to assume that every inch of the parade route was occupied, however some
areas were more crowded than others.
For the purposes of this report, the overall attendance will be based solely on the Krewe
of Gemini and the Krewe of Centaur parades. The Krewe of Sobek and Krewe of Highland
parades are much smaller in comparison. Also, in 2014 the Krewe of Highland parade was
impacted by severe weather, which affected attendance and interviewing. The survey
sample from the Krewe of Sobek was too small to draw conclusions. Therefore for
attendance estimating purposes we will assume that the Krewe of Centaur parade
averaged five persons deep and the Krewe of Gemini averaged four persons deep. By
5
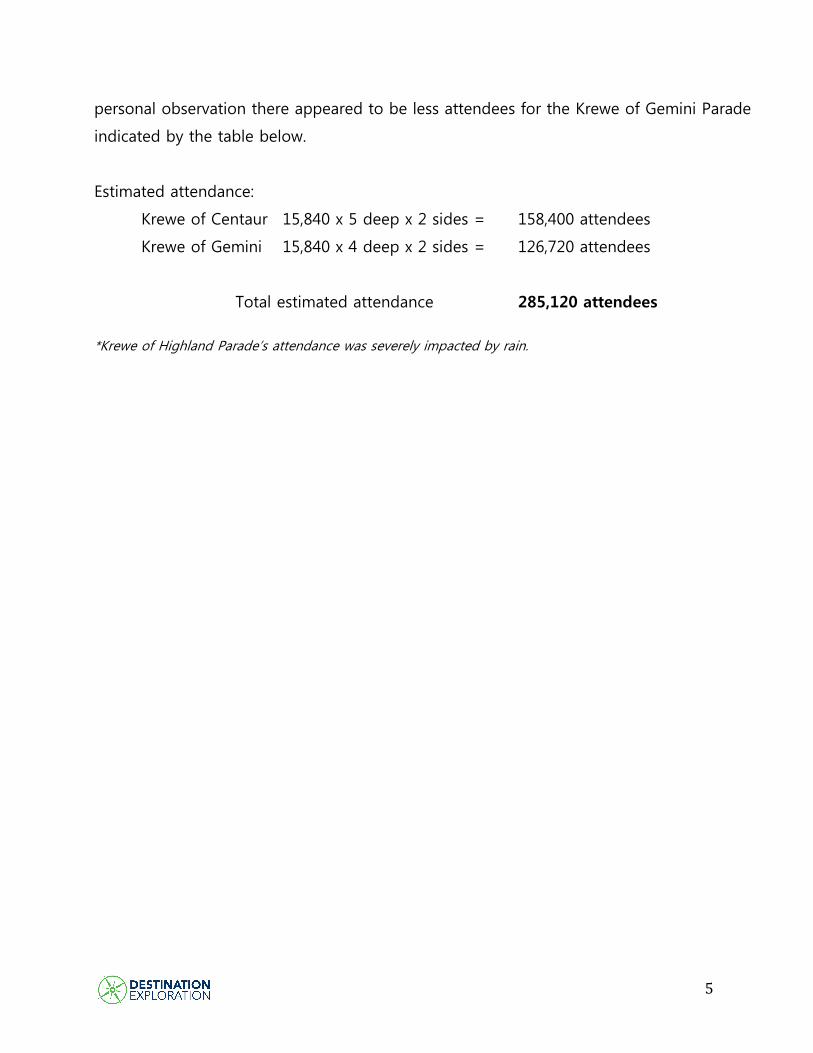
personal observation there appeared to be less attendees for the Krewe of Gemini Parade
indicated by the table below.
Estimated attendance:
Krewe of Centaur 15,840 x 5 deep x 2 sides = 158,400 attendees
Krewe of Gemini 15,840 x 4 deep x 2 sides = 126,720 attendees
Total estimated attendance 285,120 attendees
*Krewe of Highland Parade’s attendance was severely impacted by rain.

6
EXECUTIVE SUMMARY
2014 Mardi Gras festivities exceeded 285,120 in attendance.
The overall group is 10 for the parades and 4 for the float-loading parties.
o Groups predominantly consisted of family and friends.
Most respondents traveled to the festivities by car.
More than 80% of parade attendees were repeat visitors.
o On average, respondents had visited nine previous Mardi Gras parades.
o On the other hand, most float-loading party attendees were first-time visitors.
Word-of-mouth and family and friends are your greatest sources for raising
awareness about the parades and float-loading parties.
o Social media and print ads could be improved in order to boost awareness
through those media outlets.
The parades and float-loading parties were very important deciding factors for
visiting the area.
About 1 in 3 parade guests and 1 in 5 float-loading party guests resided outside of
the Shreveport-Bossier area. These are the people who are more likely to spend
tourism dollars in your city.
o However, the majority did not stay overnight.
o Most of those staying overnight stayed in Shreveport.
o About one-third of overnight guests stayed in a hotel/motel.

7
On average, the per-person spending for overnighters is $99.93 compared to $23.47
for day-trippers which equates to an estimated $9.9 million economic impact for
Shreveport-Bossier during Mardi Gras in 2014.
Almost all respondents plan to return to Mardi Gras in 2015.

8
DETAILED FINDINGS
Responses
Please note that response rates varied greatly during the various parades and float loading
parties. It’s important to note that only the Krewe of Centaur and Krewe of Gemini
yielded enough responses for analysis.
Krewe of
Centaur
Parade
Krewe of
Gemini
Parade
Overall Parade
Responses 298 272 570
Krewe of
Centaur Float
Loading
Krewe of
Gemini Float
Loading
Overall Float
Loading
Responses 41 35 76
Group Size
Although some of the parades drew smaller average groups, it can be said that Mardi
Gras attendance is truly a group event with an average overall group size of 10.
Krewe of
Centaur
Krewe of
Gemini
Overall
Avg. Group
Size
11 9 10
The float loading parties drew slightly smaller groups.
Krewe of
Centaur Float
Loading
Krewe of
Gemini Float
Loading
Overall Float
Loading
Avg. Group
Size
5 3 4

9
Group Composition
Since the Mardi Gras experience is a group experience, the group make-up is primarily a
mix of both family and friends. Approximately one-half of the respondents attended with
family and friends compared to one-third with family.
Results for the two float-loading parties were slightly different. More people (55.3%) came
with family only. One-fourth (25%) came with a combination of family and friends and
19.7% came with friends only.
15%
17%
32%
35%
53%
48%
0% 20% 40% 60% 80% 100%
Krewe of Gemini Parade
Krewe of Centaur Parade
Q4 Group Composition
Friends Family Both Friends & Family
25.7%
14.6%
60.0%
51.2%
14.3%
34.1%
0% 20% 40% 60% 80% 100%
Krewe of Gemini Float Loading
Krewe of Centaur Float Loading
Q4 Group Composition
Friends Family Friends & Family

10
Mode of Transportation
We asked what main mode of transportation people used to get to the various parades.
Most came by car. When looking at the overall data combined, 90.6% of parade attendees
came by car, 3.9% came by bike or walked, 1.4% came by airplane, 0.3% took a bus, and
3.9% came by some other mode of transportation.
Results for the two float-loading parties were similar to the parades. When looking at the
float-loading party data, approximately nine in 10 came by car, followed by bike or
walked, and airplane or took a bus.
8.1%
1.0%
1.1%
2.0%
0.4%
0.3%
3.3%
2.4%
87.1%
94.3%
0.0% 10.0% 20.0% 30.0% 40.0% 50.0% 60.0% 70.0% 80.0% 90.0%100.0%
Krewe of Gemini Parade
Krewe of Centaur Parade
Q5 Mode of Transportation
Car Bike/Walk Bus Airplane Other

11
Previous Attendance
We asked people if 2014 was their first time ever attending the Shreveport-Bossier Mardi
Gras parades. We found that Mardi Gras is definitely an annual event, with the majority of
respondents stating this was not their first time to attend the parades. When looking at
both parades, over three-quarters are repeat attendees.
3%
2%
3%
2%
9%
5%
86%
90%
0% 10% 20% 30% 40% 50% 60% 70% 80% 90% 100%
Krewe of Gemini Float Loading
Krewe of Centaur Float Loading
Q5 Mode of Transportation
Car Bike/Walk Bus Airplane
13.2%
21.0%
86.8%
79.0%
0% 10% 20% 30% 40% 50% 60% 70% 80% 90% 100%
Krewe of Gemini Parade
Krewe of Centaur Parade
Q6 First Time Attending
Yes No

12
On the other hand, most float-loading party attendees said that this was in fact their first
time ever attending one of those parties.
82.4%
75.6%
17.8%
24.4%
0% 10% 20% 30% 40% 50% 60% 70% 80% 90% 100%
Krewe of Gemini Float Loading
Krewe of Centaur Float Loading
Q6 First Time Attending
Yes No

13
Number of Times
We asked those who stated that 2014 was not their first time visiting the parades or float
loading parties how many times they had attended before. On average, respondents had
attended the parades ten previous times and the float-loading parties four times.
Krewe of Centaur
Parade
Krewe of
Gemini Parade
Overall Parade
Avg. # of Times 10 10 10
Krewe of Centaur
Float Loading
Krewe of Gemini Float
Loading
Overall Float
Loading
Avg. # of Times 5 3 4

14
Awareness Outlets
When asked how they found out about the various Mardi Gras parades, most respondents
said through family, friends or word-of-mouth. When looking at the overall combined
data, a total of 35% found out through family or friends, followed by 22.5% who found
out through word-of-mouth. Print ads accounted for 6.7%, website searches for 3.8%,
Facebook for 3.7%, Twitter for 1%, and Mardi Gras brochure 1.9%.
13.7%
33.1%
35.4%
33.8%
27.0%
19.6%
12.5%
2.1%
2.3%
2.1%
1.5%
7.1%
1.1%
0.4%
6.5%
1.8%
0.0% 5.0% 10.0% 15.0% 20.0% 25.0% 30.0% 35.0% 40.0%
Krewe of Gemini Parade
Krewe of Centaur Parade
Q8 Awareness Outlets
Facebook Twitter Website Search
Mardi Gras Brochure Print Advertisement Word-of-Mouth
Family/Friends Other

15
Word-of-mouth scored strongest for the float-loading parties, with close to half of
respondents saying that’s how they found out about the parties. Family or friends came in
second. Facebook also worked well in raising awareness about the float-loading parties.
Print ads, website searches and Twitter did not produce a lot of awareness.
Parade Attendance
We asked people at the two float-loading parties if they planned to attend the Krewe of
Centaur or Krewe of Gemini parade the following day. The majority (89.2%) said yes.
27.3%
10.0%
9.1%
20.0%
36.4%
55.0%
3.0%
5.0%
0.0%
0.0%
3.0%
2.5%
6.1%
0.0%
15.2%
7.5%
0.0% 10.0% 20.0% 30.0% 40.0% 50.0% 60.0%
Krewe of Gemini Float-Loading
Krewe of Centaur Float-Loading
Q8 Awareness Outlets
Facebook Twitter Website Search
Mardi Gras Brochure Print Advertisement Word-of-Mouth
Family/Friends Other

16
Place of Residence
Place of residence varied widely based on which parade people attended. The Krewe of
Gemini Parade drew a significant number of people from outside the Shreveport-Bossier
area, while the Krewe of Centaur parade drew approximately one-third from outside the
area. Those outside Shreveport-Bossier are extremely important attendees because they
have the ability to create a significant economic impact due to travel and are more likely
to spend additional time in the area.
The float-loading parties drew mainly people residing in Bossier City or Shreveport.
85.3%
92.5%
14.7%
7.5%
0% 10% 20% 30% 40% 50% 60% 70% 80% 90% 100%
Krewe of Gemini Float Loading
Krewe of Centaur Float Loading
Q9 Parade Attendance
Yes No
33.3%
43.0%
17.4%
20.5%
49.3%
36.5%
0% 10% 20% 30% 40% 50% 60% 70% 80% 90% 100%
Krewe of Gemini Parade
Krewe of Centaur Parade
Q10 Place of Residence
Shreveport Bossier City Other
37%
26%
37%
63%
27%
11%
0% 10% 20% 30% 40% 50% 60% 70% 80% 90% 100%
Krewe of Centaur Float-Loading
Krewe of Gemini Float-Loading
Place of Residence
Shreveport Bossier City Other

17
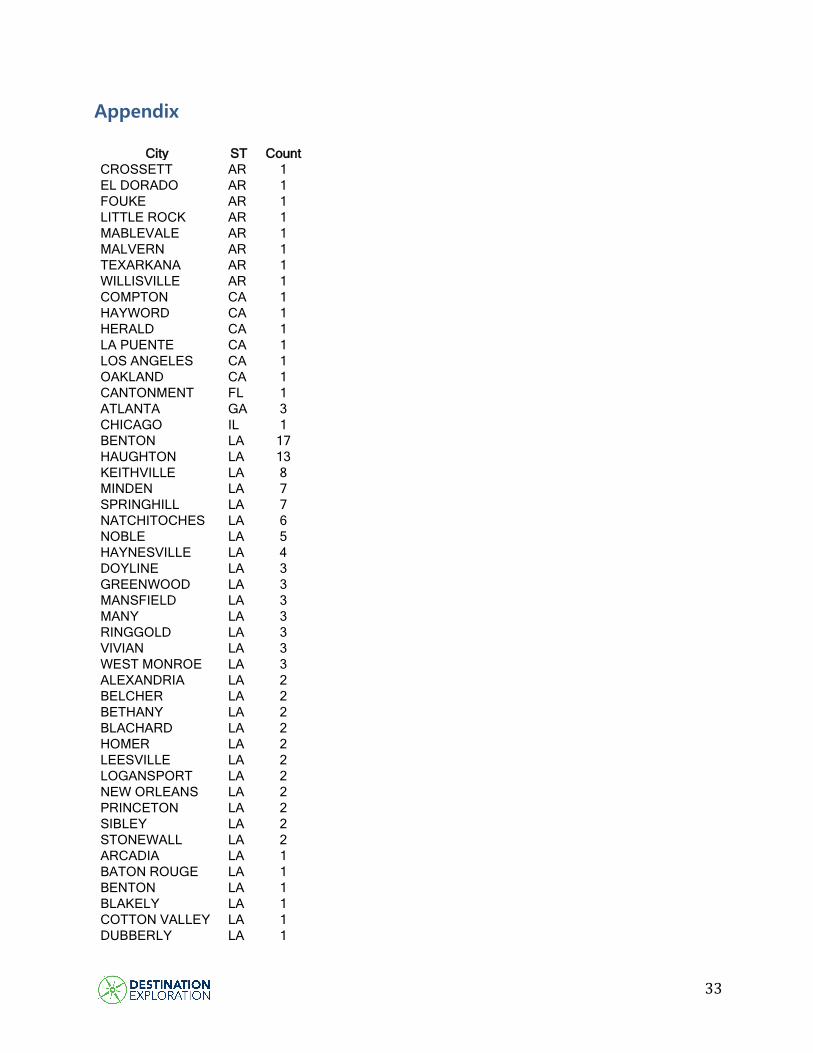
A complete listing of other cities outside of Shreveport-Bossier City can be found in the appendix.
Those attendees from outside the Shreveport-Bossier area came from as far as California,
New York and south Florida. However, the majority of those stating they were from
outside the Shreveport-Bossier area were within a 200-mile region.
A complete listing of cities outside Shreveport-Bossier City can be found in the appendix.

18
Trip Attributes
The majority of parade and float-loading party attendees in 2014 did not stay overnight in
the Shreveport-Bossier City area. The Krewe of Centaur Parade drew slightly more
overnight visitors than the others.
14.2%
18.1%
85.8%
81.9%
0.0% 10.0% 20.0% 30.0% 40.0% 50.0% 60.0% 70.0% 80.0% 90.0% 100.0%
Krewe of Gemini Parade
Krewe of Centaur Parade
Q12 Overnight Visitor
Yes No
2.9%
55.6%
97.1%
44.4%
0% 10% 20% 30% 40% 50% 60% 70% 80% 90% 100%
Krewe of Gemini Float-Loading
Krewe of Centaur Float-Loading
Q12 Overnight Visitor
Yes No

19
Length of Stay
Most of the parade attendees who stayed overnight stayed for two nights. Krewe of
Centaur attendees were more likely to stay 3 or more nights compared to Krewe of
Gemini attendees. On average overnight attendees stayed 2.16 nights.
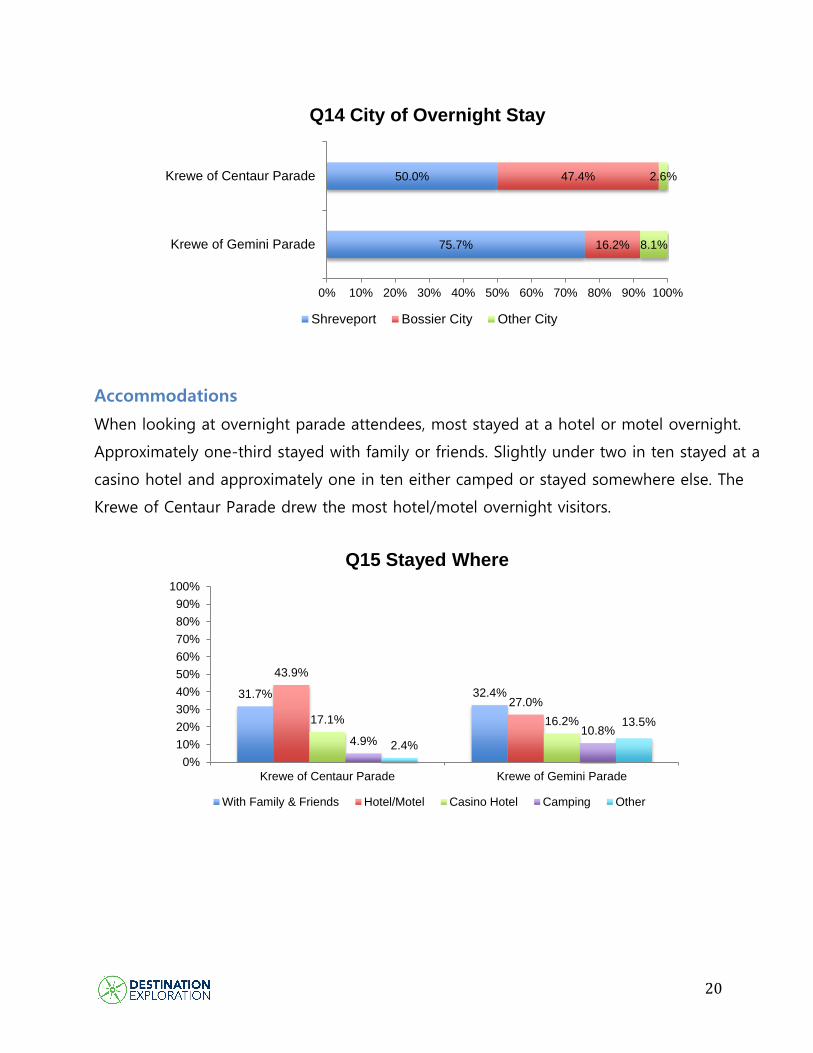
City of Overnight Stay
When asked if they spent their overnight stay in Shreveport, Bossier City or some other
city, the majority of parade attendees stayed in Shreveport. Krewe of Centaur attendees
were more likely to stay in Bossier City compared to Krewe of Gemini attendees.
35.9%
17.5%
51.3%
40.0%
5.1%
25.0%
7.7%
17.5%
0.0% 20.0% 40.0% 60.0% 80.0% 100.0%
Krewe of Gemini Parade
Krewe of Centaur Parade
Q13 Length of Stay
1 night 2 nights 3 nights 4+ nights
20
Accommodations
When looking at overnight parade attendees, most stayed at a hotel or motel overnight.
Approximately one-third stayed with family or friends. Slightly under two in ten stayed at a
casino hotel and approximately one in ten either camped or stayed somewhere else. The
Krewe of Centaur Parade drew the most hotel/motel overnight visitors.
75.7%
50.0%
16.2%
47.4%
8.1%
2.6%
0% 10% 20% 30% 40% 50% 60% 70% 80% 90% 100%
Krewe of Gemini Parade
Krewe of Centaur Parade
Q14 City of Overnight Stay
Shreveport Bossier City Other City
31.7% 32.4%
43.9%
27.0%
17.1% 16.2%
4.9% 10.8%
2.4%
13.5%
0%
10%
20%
30%
40%
50%
60%
70%
80%
90%
100%
Krewe of Centaur Parade Krewe of Gemini Parade
Q15 Stayed Where
With Family & Friends Hotel/Motel Casino Hotel Camping Other

21
Parade Importance
We asked participants how important the various parades were in their decision to come
to the area on a scale of one to five, with one being “not at all important” and five being
“very important.” We found that the parades were the main reason why people came to
the area.
Krewe of
Centaur
Parade
Krewe of
Gemini
Parade
Overall
Parade
Avg.
importance
4.5 4.1 4.3
We also asked the float-loading party participants how important the two float-loading
parties were in their decision to come to the area on a scale of one to five, with one being
“not at all important” and five being “very important.” Again, we found that the parties
were the main reason why people came to the area.
Krewe of
Centaur Float
Loading
Krewe of
Gemini Float
Loading
Overall
Float
Loading
Avg.
importance
4.8 5 4.9

22
Economic Impact
The economic impact of the 2014 Shreveport-Bossier Mardi Gras festivities is based on the
reported estimated spending among respondents interviewed throughout the Mardi Gras
Parades. On average, Mardi Gras overnight attendees spend $99.93 during their visit
compared to day-trippers spending $23.47.
The table below shows the calculation of the total reported spending of overnights and
day-trippers by attendance provided previously in this report.
Overall Estimated Spending Overnighters
% of
Overnight
Total
Day-
trippers
% of Day-
tripper
Total
Total
Spending
% of
Total
Hotel/Motel expenditures $683,809 16% $0 0% $683,809 7%
Meal/Food expenditures $812,023 19% $2,957,761 52% $3,769,784 37%
Transportation expenditures $1,068,452 25% $1,023,840 18% $2,092,292 21%
Entertainment expenditures $555,595 13% $853,200 15% $1,408,795 14%
Shopping expenditures $1,153,928 27% $853,200 15% $2,007,128 21%
Total reported spending $4,273,806 100% $5,688,001 100% $9,961,808
It’s important to note that overnighter average spending is directly impacted by those who
stayed with family and/or friends versus a hotel/motel. The average spending in the
hotel/motel category for those staying overnight in a hotel/motel is $202.88.
Estimated Economic Impact based on 285,120 combined attendance
# of
Attendees
Avg.
Spending Projected Spending
Day-trippers (85% of attendees) 242,352 $23.47 $5,688,001
Overnighters (15% of attendees) 42,768 $99.93 $4,273,806
Total Estimated Economic Impact $9,961,808

23
Likeliness to Return
Almost all participants said they wanted to return for the parades next year: an average of
98.2% of parade guests and 94.1% of float-loading party guests.
3.6%
96.4% 100.0%
0%
10%
20%
30%
40%
50%
60%
70%
80%
90%
100%
Krewe of Centaur Parade Krewe of Gemini Parade
Q18 Likeliness to Return
Not likely to return next year Likely to return next year
5.3% 6.7%
94.7% 93.3%
0.0%
10.0%
20.0%
30.0%
40.0%
50.0%
60.0%
70.0%
80.0%
90.0%
100.0%
Krewe of Gemini Float-Loading
Krewe of Centaur Float-Loading
Q18 Likeliness to Return
Not likely to return next year Likely to return next year

24
DEMOGRAPHICS
Occupation
Overall, most parade survey participants were employed in the professional/technical field.
Close to one-fifth were in the skilled/semi-skilled labor force, followed by sales/clerical and
homemakers or retired. Approximately, 7.3% were students, 5.6% worked for the
local/state/national government and 3.1% were unemployed. The remaining 3.2% indicated
“other” for their occupation.
Similarly, 32% of float-loading party survey participants were employed in the
professional/technical field. However, homemakers/retired scored second at 20%, followed
by 18.7% who were in sales/clerical, and 12% who were in the skilled/semi-skilled labor
force. One in ten (10.7%) was a student. Four percent were unemployed and 2.7% worked
for the local/state/national government.

25
3.5%
2.8%
4.2%
7.0%
1.5%
2.4%
25.8%
15.7%
17.7%
15.7%
6.9%
7.7%
8.5%
10.5%
31.9%
38.1%
0% 5% 10% 15% 20% 25% 30% 35% 40% 45%
Krewe of Gemini Parade
Krewe of Centaur Prade
Q19 Occupation
Professional/Technical Homemaker/RetiredStudent Sales/ClericalSkilled/Semi Skilled Labor Not EmployedLocal/State/National Government Other

26
0.0%
0.0%
2.9%
2.4%
8.8%
0.0%
14.7%
9.8%
23.5%
14.6%
17.6%
4.9%
14.7%
24.4%
17.6%
43.9%
0% 10% 20% 30% 40% 50%
Krewe of Gemini Float-Loading
Krewe of Centaur Float-Loading
Q19 Occupation
Professional/Technical Homemaker/Retired
Student Sales/Clerical
Skilled/Semi Skilled Labor Not Employed
Local/State/National Government Other

27
Household Income
When looking at the parade data combined, most respondents had an annual household
income between $25,000-$49,999 or $50,000-$74,999. Approximately one-fourth fell in
the higher income brackets: $75,000 - $100,000 or more than $100,000. Close to one in
ten made less than $18,000 a year or $18,000-$24,999.
Float-loading party respondents were somewhat less affluent. Twenty percent had an
annual household income of less than $18,000. Approximately one in ten earned $18,000-
$24,999 (13.8%), one in four $25,000-$49,999 (26.2%) and about one in ten each earned
$50,000-$74,999 (13.8%), $75,000-$100,000 (7.7%) or $100,000 or more (10.8%).
8.9% 8.8% 6.3% 8.8%
29.2% 27.0%
35.8% 22.5%
14.4%
17.9%
5.5% 14.7% 0.4%
0%
10%
20%
30%
40%
50%
60%
70%
80%
90%
100%
Krewe of Gemini Parade Krewe of Centaur Parade
Q20 Household Income
Under $18,000 $18,000 - $24,999 $25,000 - $49,999 $50,000 - $74,999
$75,000 - $100,000 Over $100,00 Refused

28
Age
2014 attendees were a mix of all ages. One in ten parade survey respondents was 18-24,
two in ten were 25-34, approximately one-third were 35-44 and one-quarter were 45-54.
One in ten were 55-64 and approximately 3% were 65 years or older.
Of the float-loading party respondents, 16.7% were 18-24, 13.9% were 25-34, 25% each
were 35-44 or 45-54, 12.5% were 55-64 and 6.9% were 65 years old or older.
10.0%
28.6% 10.0%
17.1% 40.0%
14.3%
13.3% 14.3%
13.3% 2.9%
13.3%
8.6%
14.3%
0%
10%
20%
30%
40%
50%
60%
70%
80%
90%
100%
Krewe of Gemini Float-Loading Krewe of Centaur Float-Loading
Q20 Household Income
Under $18,000 $18,000 - $24,999 $25,000 - $49,999 $50,000 - $74,999
$75,000 - $100,000 Over $100,00 Refused
10.4%
8.3%
23.5%
22.1%
32.8%
27.5%
23.9%
25.7%
6.7%
12.7%
2.7%
3.6%
0% 20% 40% 60% 80% 100%
Krewe of Gemini Parade
Krewe of Centaur Parade
Q21 Age
18-24 25-34 35-44 45-54 55-64 65 +

29
28.1%
7.5%
15.6%
12.5%
28.1%
22.5%
21.9%
27.5%
3.3%
20.0%
3.0%
10.0%
0% 10% 20% 30% 40% 50% 60% 70% 80% 90% 100%
Krewe of Gemini Float-Loading
Krewe of Centaur Float-Loading
Q21 Age
18-24 25-34 35-44 45-54 55-64 65 +

30
Marital Status
More than half of this year’s respondents were married. More than one-third were single.
Only a few were divorced or widowed.
32.3% 34.2%
59.9% 58.3%
5.1% 6.0% 2.7% 1.5% 0.0%
20.0%
40.0%
60.0%
80.0%
Krewe of Centaur Parade Krewe of Gemini Parade
Q22 Marital Status
Single Married Divorced Widow/Widower
25.0%
47.1%
62.5% 50.0%
5.0% 2.9% 7.5%
0.0%
20.0%
40.0%
60.0%
80.0%
Krewe of Centaur Float-Loading Krewe of Gemini Float-Loading
Q22 Marital Status
Single Married Divorced Widow/Widower

31
Race
About two thirds of this year’s attendees were Caucasian, followed by African Americans
and Hispanics.
75.7% 68.7%
15.3%
28.6%
6.3% 1.5% 2.8% 1.2%
0.0%
20.0%
40.0%
60.0%
80.0%
Krewe of Centaur Parade Krewe of Gemini Parade
Q24 Race
Caucasian African-American Hispanic Other
75.6% 66.7%
14.6% 18.2%
7.3% 9.1% 2.4% 6.1%
0.0%
20.0%
40.0%
60.0%
80.0%
Krewe of Centaur Float-Loading Krewe of Gemini Float-Loading
Q24 Race
Caucasian African-American Hispanic Other

32
Gender
The majority of respondents were female with approximately a 60%/40% split.
40.9%
47.4%
59.1%
52.6%
0% 20% 40% 60% 80% 100%
Krewe of Gemini Parade
Krewe of Centaur Parade
Q25 Gender
Male Female
41.5%
44.1%
58.5%
55.9%
0% 20% 40% 60% 80% 100%
Krewe of Centaur Float-Loading
Krewe of Gemini Float-Loading
Q25 Gender
Male Female
33
Appendix
City ST Count
CROSSETT AR 1
EL DORADO AR 1
FOUKE AR 1
LITTLE ROCK AR 1
MABLEVALE AR 1
MALVERN AR 1
TEXARKANA AR 1
WILLISVILLE AR 1
COMPTON CA 1
HAYWORD CA 1
HERALD CA 1
LA PUENTE CA 1
LOS ANGELES CA 1
OAKLAND CA 1
CANTONMENT FL 1
ATLANTA GA 3
CHICAGO IL 1
BENTON LA 17
HAUGHTON LA 13
KEITHVILLE LA 8
MINDEN LA 7
SPRINGHILL LA 7
NATCHITOCHES LA 6
NOBLE LA 5
HAYNESVILLE LA 4
DOYLINE LA 3
GREENWOOD LA 3
MANSFIELD LA 3
MANY LA 3
RINGGOLD LA 3
VIVIAN LA 3
WEST MONROE LA 3
ALEXANDRIA LA 2
BELCHER LA 2
BETHANY LA 2
BLACHARD LA 2
HOMER LA 2
LEESVILLE LA 2
LOGANSPORT LA 2
NEW ORLEANS LA 2
PRINCETON LA 2
SIBLEY LA 2
STONEWALL LA 2
ARCADIA LA 1
BATON ROUGE LA 1
BENTON LA 1
BLAKELY LA 1
COTTON VALLEY LA 1
DUBBERLY LA 1

34
ELEM GRAVES LA 1
FRIERSON LA 1
GLOSTER LA 1
GRAND CANE LA 1
HAUGHTON LA 1
HAUGHTON LA 1
HORNBECK LA 1
KEATCHIE LA 1
KEITHVILLE LA 1
KEITHVILLE LA 1
LEESVILLE LA 1
LISBORN LA 1
MOORINGSPORT LA 1
OIL CITY LA 1
OPELOUSAS LA 1
PLAIN DEALING LA 1
PRINCETON LA 1
QUITMAN LA 1
RODESSA LA 1
RUSTON LA 1
RUSTON LA 1
WINNFIELD LA 1
ASHTON MD 1
MS STATE MS 1
WILMINGTON NC 1
ROCHESTER NY 1
CINCINNATI OH 1
BROKEN ARROW OK 1
BROKEN BOW OK 1
DUNCAN OK 1
WARWICK RI 1
DALLAS TX 10
TEXARKANA TX 8
HOUSTON TX 5
LONGVIEW TX 4
WASKOM TX 4
ARLINGTON TX 2
CARTHAGE TX 2
NACOGDOCHES TX 2
TYLER TX 2
ALVARADO TX 1
AMARILLO TX 1
BIVINS TX 1
COLD SPRINGS TX 1
DEBERRY TX 1
DEERNY TX 1
FORNEY TX 1
FORT WORTH TX 1
HASLET TX 1
HENDERSON TX 1
HOUSTON TX 1
KATY TX 1
MARSHALL TX 1
MART TX 1

35
OVERTON TX 1
SCURRY TX 1