Lithuanian Tourist Satisfaction Index Model
17
35 (XURSHDQ -RXUQDO RI 7RXULVP +RVSLWDOLW\ DQG 5HFUHDWLRQ Vol. 5, Issue 1, pp. 35-51, 2014 © 2014 Polytechnic Institute of Leiria. All rights reserved Printed in Portugal www.ejthr.com Research EJTHR Tourism Lina Pileliene, Ph.D. is Associated Professor at Faculty of Economics and Management, 9\WDXWDV 0DJQXV 8QLYHUVLW\ /LWKXDQLD +HU PDLQ VFLHQWLÀF UHVHDUFK DUHDV DUH FRQVXPHU EH- haviour, customer satisfaction and loyalty, place marketing, neuromarketing, Author’s e-mail: [email protected]. Viktorija Grigaliunaite is master student at Faculty of Economics and Management, Vytautas Magnus University, Lithuania. Her research focuses are: mathematical methods in marketing, statistical analysis of the data. Author’s e-mail: [email protected]. LITHUANIAN TOURIST SATISFACTION INDEX MODEL Lina Pileliene Viktorija Grigaliunaite Vytautas Magnus University, Lithuania ABSTRACT: Whereas tourism can be named as one of the most emerging areas of the ser- vice sector in Lithuania, the research aims to develop the Lithuanian Tourist Satisfaction In- dex. While developing the index, core variables (components of the index) are determined and their impact on tourist satisfaction measured. The Lithuanian Tourist Satisfaction Index is elaborated according to the following stages: 1. Manifest and latent variables (causes and consequences of tourist satisfaction) are determined based on the analysis of previous scien- WLÀF UHVHDUFKHV WKHRUHWLFDO PRGHO RI 7RXULVW 6DWLVIDFWLRQ ,QGH[ LV HODERUDWHG 7KHRUHWLFDO PRGHO RI 7RXULVP 6DWLVIDFWLRQ ,QGH[ LV EHLQJ YHULÀHG EDVHG RQ D TXHVWLRQQDLUH UHVHDUFK ZLWK Lithuanian tourists who had visited foreign countries; 3. The impact of model’s variables on WRXULVW VDWLVIDFWLRQ ZLWK D VSHFLÀF FRXQWU\ LV GHWHUPLQHG $IWHU JHQHUDOL]LQJ 7RXULVW 6DWLVIDF- tion Indexes with different countries, main variables with impact on Lithuanian tourist satis- faction are determined; the general Lithuanian Tourist Satisfaction Index Model is composed. Keywords: customer satisfaction, Lithuanian tourist, satisfaction index, tourist satisfaction. RESUMEN: El turismo puede ser considerado como una de las áreas más emergentes del sector de los servicios en Lituania, por lo que la investigación tiene como objetivo desarrollar el Índice Lituano de Satisfacción de los Turistas. Al desarrollar el índice, fueron determinadas variables fundamentales (componentes del índice) y su impacto en la satisfacción del turista. El Índice Lituano de Satisfacción de los Turistas fue elaborado a través de las etapas siguien- WHV 6H GHWHUPLQDURQ ODV YDULDEOHV PDQLÀHVWDV \ ODWHQWHV FDXVDV \ FRQVHFXHQFLDV GH OD VDWLV- IDFFLyQ GH ORV WXULVWDV FRQ EDVH HQ HO DQiOLVLV GH LQYHVWLJDFLRQHV FLHQWtÀFDV DQWHULRUHV (O Modelo teórico del Índice de Satisfacción de los Turistas sigue siendo analizado a través de una investigación por cuestionario con turistas lituanos que visitaron países extranjeros; 3. Se determinó el impacto de las variables del modelo en la satisfacción de los turistas en un país HVSHFtÀFR 'HVSXpV GH JHQHUDOL]DU ORV tQGLFHV GH VDWLVIDFFLyQ GH ORV WXULVWDV HQ GLIHUHQWHV países, fueron determinadas las principales variables que tienen impacto en la satisfacción de los turistas lituanos; fue elaborado el modelo lituano del índice de satisfacción de los turistas. Palabras clave: satisfacción del consumidor, turistas lituanos, índice de satisfacción, satisfac- ción de los turistas. RESUMO: O turismo pode ser considerado como uma das áreas mais emergentes do setor dos serviços na Lituânia, pelo que a investigação tem como objetivo desenvolver o Índice Li- tuano de Satisfação dos Turistas. Ao desenvolver o índice, foram determinadas variáveisfun- damentais (componentes do índice) e o seu impacto na satisfação do turista. O Índice Litua- no de Satisfação Turística foi elaborado através das etapas seguintes: 1. Determinaram-se as variáveis manifestas e latentes (causas e consequências da satisfação dos turistas) com base ˙ ˙ – ˙ ˙
Transcript of Lithuanian Tourist Satisfaction Index Model

35
(XURSHDQ�-RXUQDO�RI �7RXULVP��+RVSLWDOLW\�DQG�5HFUHDWLRQVol. 5, Issue 1, pp. 35-51, 2014
© 2014 Polytechnic Institute of Leiria. All rights reservedPrinted in Portugalwww.ejthr.com
ResearchEJTHR Tourism
ResearchEJTHR Tourism
European Journal ofTourism, Hospitality and Recreation
ResearchEJTHR Tourism
ResearchEJTHR Tourism
European Journal ofTourism, Hospitality and Recreation
Lina Pileliene, Ph.D. is Associated Professor at Faculty of Economics and Management, 9\WDXWDV�0DJQXV�8QLYHUVLW\��/LWKXDQLD��+HU�PDLQ�VFLHQWLÀF�UHVHDUFK�DUHDV�DUH��FRQVXPHU�EH-haviour, customer satisfaction and loyalty, place marketing, neuromarketing, Author’s e-mail: [email protected].
Viktorija Grigaliunaite is master student at Faculty of Economics and Management, Vytautas Magnus University, Lithuania. Her research focuses are: mathematical methods in marketing, statistical analysis of the data. Author’s e-mail: [email protected].
LITHUANIAN TOURIST SATISFACTION INDEX MODEL
Lina PilelieneViktorija Grigaliunaite
Vytautas Magnus University, Lithuania
ABSTRACT: Whereas tourism can be named as one of the most emerging areas of the ser-vice sector in Lithuania, the research aims to develop the Lithuanian Tourist Satisfaction In-dex. While developing the index, core variables (components of the index) are determined and their impact on tourist satisfaction measured. The Lithuanian Tourist Satisfaction Index is elaborated according to the following stages: 1. Manifest and latent variables (causes and consequences of tourist satisfaction) are determined based on the analysis of previous scien-WLÀF�UHVHDUFKHV��WKHRUHWLFDO�PRGHO�RI �7RXULVW�6DWLVIDFWLRQ�,QGH[�LV�HODERUDWHG�����7KHRUHWLFDO�PRGHO�RI �7RXULVP�6DWLVIDFWLRQ�,QGH[�LV�EHLQJ�YHULÀHG�EDVHG�RQ�D�TXHVWLRQQDLUH�UHVHDUFK�ZLWK�Lithuanian tourists who had visited foreign countries; 3. The impact of model’s variables on WRXULVW�VDWLVIDFWLRQ�ZLWK�D�VSHFLÀF�FRXQWU\�LV�GHWHUPLQHG�����$IWHU�JHQHUDOL]LQJ�7RXULVW�6DWLVIDF-tion Indexes with different countries, main variables with impact on Lithuanian tourist satis-faction are determined; the general Lithuanian Tourist Satisfaction Index Model is composed. Keywords: customer satisfaction, Lithuanian tourist, satisfaction index, tourist satisfaction.
RESUMEN: El turismo puede ser considerado como una de las áreas más emergentes del sector de los servicios en Lituania, por lo que la investigación tiene como objetivo desarrollar el Índice Lituano de Satisfacción de los Turistas. Al desarrollar el índice, fueron determinadas variables fundamentales (componentes del índice) y su impacto en la satisfacción del turista. El Índice Lituano de Satisfacción de los Turistas fue elaborado a través de las etapas siguien-WHV�����6H�GHWHUPLQDURQ�ODV�YDULDEOHV�PDQLÀHVWDV�\�ODWHQWHV��FDXVDV�\�FRQVHFXHQFLDV�GH�OD�VDWLV-IDFFLyQ�GH�ORV�WXULVWDV��FRQ�EDVH�HQ�HO�DQiOLVLV�GH�LQYHVWLJDFLRQHV�FLHQWtÀFDV�DQWHULRUHV�����(O�Modelo teórico del Índice de Satisfacción de los Turistas sigue siendo analizado a través de una investigación por cuestionario con turistas lituanos que visitaron países extranjeros; 3. Se determinó el impacto de las variables del modelo en la satisfacción de los turistas en un país HVSHFtÀFR�����'HVSXpV�GH�JHQHUDOL]DU�ORV�tQGLFHV�GH�VDWLVIDFFLyQ�GH�ORV�WXULVWDV�HQ�GLIHUHQWHV�países, fueron determinadas las principales variables que tienen impacto en la satisfacción de los turistas lituanos; fue elaborado el modelo lituano del índice de satisfacción de los turistas. Palabras clave: satisfacción del consumidor, turistas lituanos, índice de satisfacción, satisfac-ción de los turistas.
RESUMO: O turismo pode ser considerado como uma das áreas mais emergentes do setor dos serviços na Lituânia, pelo que a investigação tem como objetivo desenvolver o Índice Li-tuano de Satisfação dos Turistas. Ao desenvolver o índice, foram determinadas variáveisfun-damentais (componentes do índice) e o seu impacto na satisfação do turista. O Índice Litua-no de Satisfação Turística foi elaborado através das etapas seguintes: 1. Determinaram-se as variáveis manifestas e latentes (causas e consequências da satisfação dos turistas) com base
˙˙–
˙
˙

TOURIST SATISFACTION INDEX MODEL36
QD�DQiOLVH�GH�LQYHVWLJDo}HV�FLHQWtÀFDV�DQWHULRUHV�����2�PRGHOR�WHyULFR�GR�ÌQGLFH�GH�6DWLVIDomR�GRV�7XULVWDV�IRL�YHULÀFDGR�DWUDYpV�GH�XPD�LQYHVWLJDomR�SRU�TXHVWLRQiULR�FRP�WXULVWDV�OLWXDQRV�que visitaram países estrangeiros; 3. Determinou-se o impacto das variáveis do modelo na VDWLVIDomR�GRV�WXULVWDV�QXP�SDtV�HVSHFtÀFR�����$SyV�JHQHUDOL]DU�RV�tQGLFHV�GH�VDWLVIDomR�GRV�turistas em diferentes países, foram determinadas as principais variáveis que têm impacto na satisfação dos turistas lituanos; foi elaborado o modelo lituano do índice de satisfação dos turistas. Palavras-chave: satisfação do consumidor, turistas lituanos, índice de satisfação, sa-tisfação dos turistas.
INTRODUCTION
Customer satisfaction research is one of the most popular sco-pes in marketing research. Generally, customer satisfaction is de-termined by calculating the Customer Satisfaction Index, which LV�EDVHG�RQ�D�VSHFLÀF�PRGHO��,Q�WKH�ZRUOG��WKHUH�LV�D�ZLGH�YDULH-ty of national and international models of customer satisfaction indexes. After calculating the index, a level of customer satis-faction with a product, organization, or a sector is determined. Whereas tourism is considered as a driver of economic growth and one of the leading service industries in many countries (Kli-mek, 2013), tourist satisfaction measurement becomes a relevant topic among scholars.
While calculating the country’s customer satisfaction index, FRXQWU\�VSHFLÀF�IDFWRUV�DIIHFWLQJ�LWV�FXVWRPHU�VDWLVIDFWLRQ�KDYH�to be determined. Various authors from all over the world have revealed different determinants and indexes of Tourist Satisfac-tion (Krešic, Prebešac, 2011; Song et al., 2011; Al-Majali, 2012; Siri et al., 2012; et al.). One of the many reasons for these dis-tinctions may be due to dissimilarities among people in different countries, their values, habits, beliefs, cultural heritage, way of life, HWF���4XLQWDO��3ROF]\QVNL���������7KLV�PDNHV�D�VXJJHVWLRQ�WKDW�people living in different countries are affected by different de-terminants of tourist satisfaction with their destination. Therefo-UH��WKH�VFLHQWLÀF�SUREOHP�VROYHG�LQ�WKH�DUWLFOH�UDLVHV�WKH�TXHVWLRQ��what is Lithuanian tourist satisfaction and what are the factors determining their satisfaction?
Whereas tourism can be named as one of the most emerging areas of service sector in Lithuania, the research aims to deve-lop Lithuanian Tourist Satisfaction Index. While developing the
z

PILELIENË AND GRIGALIUNAITË 37
index, core variables (components of the index) are determined and their impact on tourist satisfaction measured.
With the purpose of developing a research model for Lithua-nian tourist satisfaction, theoretical analysis and synthesis are pro-vided. Tourists’ attitudes and evaluations towards selected coun-tries are determined, based on a questionnaire research. Structural equation modelling (SEM) using partial least squares (PLS) path modelling methodology is applied for statistical analysis.
LITERATURE REVIEW
In recent years the conception of customer satisfaction be-came very popular and important in most business sectors. The tourism industry is a large business sector and from a tourism point of view, the same conception of customer satisfaction ap-plies to tourists because they are also subscribers to the services provided (Salleh et al., 2013).
In the largest part of customer satisfaction research metho-dologies, e.g. American Customer Satisfaction index, European Customer Satisfaction index, Norwegian Customer Satisfaction barometer, Swedish Customer Satisfaction barometer, etc. (John-son et al., 2001), as well as in the tourists satisfaction researches (Som et al., 2011; Salleh et al., 2013), the main consequence of satisfaction is considered to be loyalty to the destination.
On the other hand, determinants of tourist satisfaction in di-fferent countries diverge. Various authors from all over the world have revealed different determinants and indexes of Tourist Sa-tisfaction (see Table 1). One of the many reasons for these dis-tinctions may be due to dissimilarities among people in different countries, their values, habits, beliefs, cultural heritage, way of OLIH��HWF���4XLQWDO��3ROF]\QVNL���������7KLV�PDNHV�D�VXJJHVWLRQ�that people living in different countries are affected by different determinants of tourist satisfaction with their destination.

TOURIST SATISFACTION INDEX MODEL38
Table 1: Determinants of Tourist Satisfaction indicated by various authors
Author Country (index) Determinants of tourists satisfaction
Siri et al. (2012) India Hotel / Lodging attributesLocal transport, food outside hotel attributesShopping, local people, airport attributesActivity attributesAttraction attributes Information service attributes
Al-Majali, 2012 Jordan Perceived risk
Image
Service climate
Song et al., 2011 China Tourist characteristics
Perceived performance
Assessed value
Expectations
Krešic, Prebešac, 2011
Croatia (Index of destination attractiveness)
Accommodation and catering facilities
Activities in destination
Natural features
Destination aesthetics
Environmental preservation
Destination marketing
Song et al, 2012; PolyU Tourist Satisfaction In-dex Report, 2013
Hong Kong (Overall Tourist Satisfaction index)
Attractions
Hotels
Immigration
Restaurants
Retail Shops
Transportation
6RXUFH� self-elaboration based on D. Krešic, D. Prebešac (2011), H. Song et al. (2011), M. M. Al-Majali (2012), R. Siri et al. (2012), H. Song et al. (2012), PolyU Tourist Satisfaction Index Report (2013), M. Salleh et al. (2013).
Nevertheless, many different determinants of customer sa-tisfaction may be included as manifest variables in the other de-terminants, for example: attractions and retail shops in the Overall
z
z

PILELIENË AND GRIGALIUNAITË 39
Tourist Satisfaction index may be included as manifest variables for latent variable activities in destination in the Index of Destina-tion Attractiveness, as well as hotels and restaurants may be inclu-ded for variable DFFRPPRGDWLRQ�DQG�FDWHULQJ�IDFLOLWLHV.
Therefore, it could be stated that although there are many di-fferent determinants, most of them correspond to each other or may be a context of the other determinants. Accordingly, the Index of Destination Attractiveness has less generalized groups of determinants of tourist satisfaction in comparison with the Overall Tourist Satisfaction index. Consequently, the Index of Destination Attractiveness may include all the determinants from the Overall Tourist Satisfaction index and even more factors that PD\�LQÁXHQFH�D�SDUWLFXODU�FRXQWU\·V�WRXULVW�VDWLVIDFWLRQ�OHYHO�ZLWK�their destination.
RESEARCH METHODOLOGY
6HOHFWLRQ�RI �WKH�WKHRUHWLFDO�/LWKXDQLDQ�7RXULVW�6DWLVIDFWLRQ�,QGH[�PRGHO %DVHG�RQ�WKH�DQDO\VLV�RI �WKH�VFLHQWLÀF�OLWHUDWXUH��WKH�IROORZLQJ�
latent variables constituted the theoretical Lithuanian Tourist Sa-tisfaction Index model, used for the research: accommodation and catering facilities, activities in destination, natural features, destination aesthetics, environmental preservation, destination marketing, overall satisfaction, loyalty. All the determinants of customer satisfaction from the Overall Tourist Satisfaction index were included in the model as the manifest variables of their cor-responding latent variables. Considering that all manifest variables RI �WKH�H[RJHQRXV�ODWHQW�YDULDEOHV�LQ�WKH�PRGHO�GHÀQH�WKHLU�FRQV-truct, changes in the construct do not necessarily impact all its REVHUYHG�LWHPV��PDQLIHVW�YDULDEOHV�GR�QRW�FRYHU�DQG�GHÀQH�GLIIH-rent aspects of the latent variables, these constructs are conside-red to be formative (Andreev et al., 2009). Contrarily, constructs of latent variables VDWLVIDFWLRQ and loyalty�DUH�UHÁHFWLYH��7HQHQKDXV�et al., 2005). Endeavoring to make a deeper analysis, the assump-tion was made that there can exist a possibility of exogenous va-
TOURIST SATISFACTION INDEX MODEL40
riables having a direct effect on loyalty. Consequently, structural equations representing the model are:
1) Satisfaction = ȕ70��ȕ71 Accommodation and catering ��ȕ72 Activi-ties in destination ��ȕ73 Natural features ��ȕ74 Destination aesthetics ��ȕ75 Environmental preservation ��ȕ76 Destination marketing ��ȗ7 2) Loyalty �ȕ80��ȕ81 Accommodation and catering ��ȕ82 Activities in destination ��ȕ83 Natural features ��ȕ84 Destination aesthetics + ȕ85 Environmental preservation���ȕ86 Destination marketing ��ȕ87 6DWLVIDFWLRQ���ȗ8
Subsequently, the theoretical Lithuanian Tourist Satisfaction Index model used for the research consists of eight latent varia-bles (six exogenous and two endogenous). All manifest variables formed a questionnaire for respondents’ evaluations (WKH�TXHVWLRQ�QDLUH� LV�DYDLODEOH� IURP� WKH�DXWKRUV�XSRQ� UHTXHVW). A 10-point evalua-tion scale was applied for the questionnaire. Coelho and Esteves (2006) highlighted that the accuracy of the satisfaction research results is higher when the 10-point scale is used for the research.
7KH�VDPSOHThe total sample size (based on the recommendations for cus-
tomer satisfaction researches) was 251. The survey was conducted in the summer of 2013. Achieving to increase the variety of the respondents, the survey was handled both, in person and via the Internet. 27 percent of males and 73 percent of females partici-pated in the survey. 41 percent of the respondents indicated their income between 1000 and 2000 Litas (national currency: 1 Litas = 0.2896 Euro; further - Lt) per month, 21 percent – more than 3000 Lt and the same percent of respondents indicated their in-come is less than 1000 Lt per month; 17 percent of respondents’ income indicated to be between 2001 and 3000 Lt per month.

PILELIENË AND GRIGALIUNAITË 41
ANALYSIS OF THE RESEARCH RESULTS
Attempting to determine Lithuanian tourists’ traveling patterns, respondents were asked about their traveling companions: if they were travelling to the destination as tourists alone, or with frien-ds, or family. 40 percent of the respondents stated that they were travelling with family, 29 percent – with friends, 26 percent – with family and friends, and only 5 percent of respondents were tra-velling alone. Accordingly, it can be stated that most Lithuanian tourists prefer traveling with a company.
The twelve most popular outbound countries (Great Britain, Czech Republic, Slovakia, Austria, France, Spain, Portugal, Italy, Greece, Turkey, Egypt, and Tunisia) were given for respondents’ HYDOXDWLRQ��'LVWULEXWLRQ�RI �WKH�GHVWLQDWLRQV�LGHQWLÀHG�E\�UHVSRQ-dents is shown in Figure 1. Every fourth respondent indicated Turkey as the main travel destination. 13 percent of respondents LQGLFDWHG�6SDLQ�����SHUFHQW�²�,WDO\��$OO�WKH�RWKHU�VSHFLÀHG�FRXQ-tries were indicated by less than 10 percent of respondents each. 17 percent of respondents chose the option “Other” and indica-ted these countries: Papua New Guinea, Poland, Malta, Sweden, Latvia, Belgium, USA, Germany, Finland, Croatia, Norway, Al-bania, Jamaica, Netherlands, Bulgaria, Switzerland, and Austra-lia. Hence, more than a half of the respondents chose southern European countries as their destination.
Figure 1. Distribution of travel destinations evaluated, N = 251
TOURIST SATISFACTION INDEX MODEL42
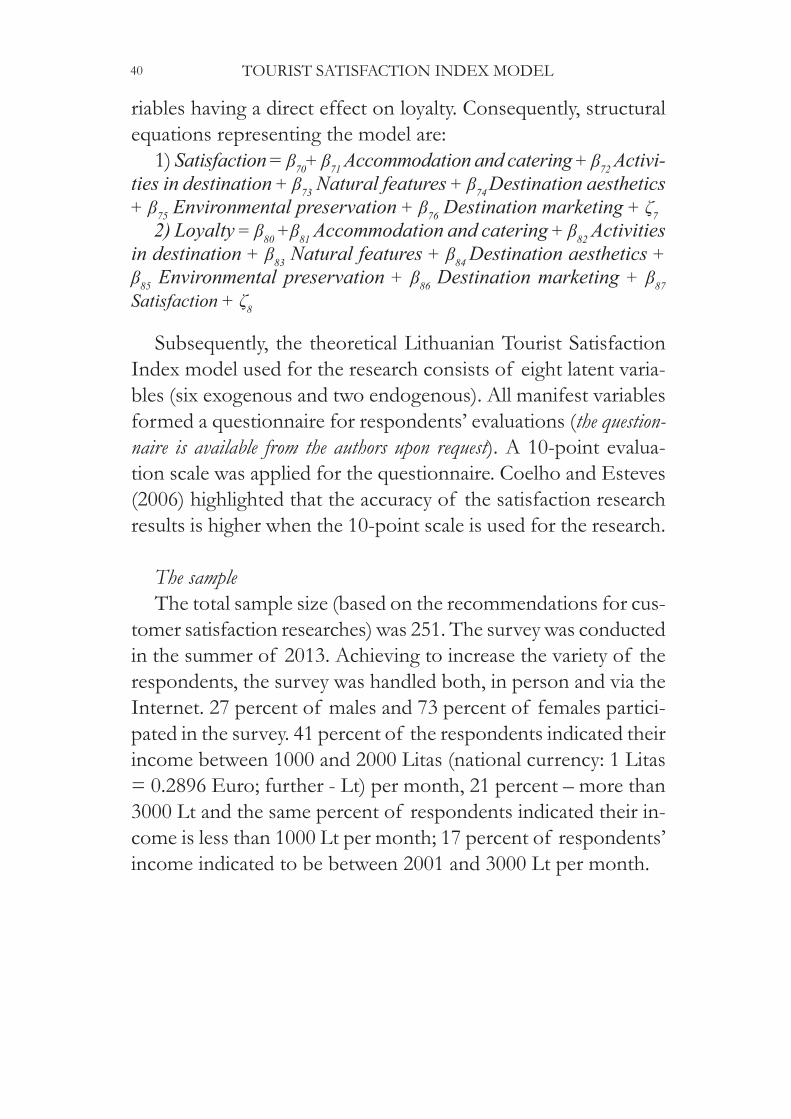
The theoretical Lithuanian Tourist Satisfaction index model had two latent variables, which had no positive neither or nega-WLYH�VWDWLVWLFDOO\�VLJQLÀFDQW�GLUHFW�LPSDFW�RQ�WRXULVW�VDWLVIDFWLRQ��as well as total impact on loyalty (see Table 2). According to J. )��+DLU�HW�DO����������QRQ�VLJQLÀFDQW�LPSDFWV�GR�QRW�VXSSRUW�WKH�proposed causal relationship. These variables were accommodation
and catering and destination aesthetics��7KHVH�ÀQGLQJV�LPSO\�WKH�DV-sumption that whatever the services of accommodation and the DHVWKHWLFV�RI �WKH�WRXULVW�GHVWLQDWLRQ�ZHUH��WKLV�GRHV�QRW�LQÁXHQFH�Lithuanian tourists’ satisfaction with the country. Additionally, accommodation and catering and destination aesthetics do not even have an indirect impact on loyalty to Lithuanian tourists’ destination. Variables activities in destination, destination marketing, and environmen�tal preservation�GLUHFWO\�DQG�VWDWLVWLFDOO\�VLJQLÀFDQWO\�LPSDFW�VDWLVIDF�tion��EXW�WKHLU�GLUHFW�LQÁXHQFH�RQ� loyalty� LV�LQVLJQLÀFDQW��2Q�WKH�RWKHU�KDQG��WKHVH�YDULDEOHV�KDYH�VLJQLÀFDQW�WRWDO�HIIHFW�RQ�loyalty. Only the variable QDWXUDO�IHDWXUHV�GLUHFWO\�DQG�VLJQLÀFDQWO\�LPSDFWV�both: VDWLVIDFWLRQ and loyalty.
Consequently, the new PLS Path model of Lithuanian Tourist Satisfaction index was constructed with six latent variables: acti- acti-vities in destination, natural features, environmental preservation, destination marketing, overall satisfaction, loyalty. Each latent va-riable had two to three manifest variables. 7KH�VXIÀFLHQW�GHJUHH�RI �FRQYHUJHQW�YDOLGLW\�RI �UHÁHFWLYH�FRQV-
tructs indicated by AVE values, were high above 0.5. Values of Composite Reliability and Cronbach’s Alpha were obtained hi-gher than 0.7 and this displays the internal consistency reliabili-W\�RI �UHÁHFWLYH�FRQVWUXFWV��5�VTXDUH�YDOXHV�RI �HQGRJHQRXV�ODWHQW�variables in the structural model were substantial (see Table 3).

PILELIENË AND GRIGALIUNAITË 43
7DEOH����3DWK�&RHIÀFLHQWV��7RWDO�(IIHFWV�DQG�WKHLU�VLJQLÀFDQFHV�DW�the theoretical model
Variables AVE Composite Reliability R Square Cronbach’s Alpha
LoyaltySatisfaction
0.9110.787
0.95340.917
0.66310.693
0.90240.8631
All exogenous latent variables had a moderate effect size on endogenous latent variable satisfaction. Hence, the highest effect size is created by variable ‘destination marketing’. The variable ‘natu�UDO�IHDWXUHV· had a great effect size on satisfaction too (see Table 4).
Table 4: Effect size f2
Variables f2
Activities in destination -> SatisfactionDestination marketing -> SatisfactionEnvironmental preservation -> SatisfactionNatural features -> Satisfaction
0.080.170.070.16
Table 3: Values of AVE, Composite Reliability, R Square andCronbach’s Alpha
VariablesPath
&RHIÀFLHQWT (path
FRHIÀFLHQW�Total Effect
T (total effect)
Accommodation and Catering:-> Loyalty -0.0434 0.6167 0.0509 1.0339
Accommodation and Catering -> Satisfaction 0.0634 1.0308 0.0634 1.0308
Activities in destination -> Loyalty 0.0949 1.5441 0.1531 3.3427
Activities in destination -> Satisfaction 0.1909 3.2291 0.1909 3.2291
Destination aesthetics -> Loyalty 0.0100 0.1666 0.0429 0.7583
Destination aesthetics -> Satisfaction 0.0535 0.7651 0.0535 0.7651
Destination marketing -> Loyalty 0.0916 1.1100 0.2735 4.215
Destination marketing -> Satisfaction 0.3409 4.2919 0.3409 4.2919
Environmental preservation -> Loyalty -0.0538 0.9987 0.1328 3.102
Environmental preservation -> Satisfaction 0.1655 3.0884 0.1655 3.0884
Natural features -> Loyalty 0.1935 2.7902 0.3854 5.4112
Natural features -> Satisfaction 0.2353 3.5773 0.2353 3.5773
Satisfaction -> Loyalty 0.8021 22.4681 0.8021 22.4681

TOURIST SATISFACTION INDEX MODEL44
5HÁHFWLYH�PHDVXUHPHQW�PRGHO�REWDLQHG�GLVFULPLQDQW�YDOLGLW\�DW�WZR�FULWHULD��,Q�YLHZ�RI �WKH�ÀUVW�FULWHULRQ��WKH�ORZHVW�YDOXH�RI �¥$9(�ZDV�REWDLQHG�JUHDWHU�WKDQ�WKH�ODWHQW�FRQVWUXFW¶V��KLJKHVW�correlation (see Table 5) with any other latent construct. In view of the second discriminant validity assessment criterion, all ma-nifest variables’ loadings of their corresponding latent variables ZHUH�KLJKHU�WKDQ�LWV�FURVV�ORDGLQJV��&RQVHTXHQWO\��WKH�UHÁHFWLYH�measurement model was considered as reliable and valid with re-ference to discriminant validity, convergent validity and internal consistency reliability.
Table 5: Latent variables’ correlations
Activities in destination
Destination marketing
Environmental preservation
LoyaltyNatural features
Destination marketingEnvironmental preservationLoyaltyNatural featuresSatisfaction
0.53630.32680.55510.51690.5982
0.65080.65090.57910.751
0.46440.4250.6058
0.6463 0.8017 0.6747
2XWHU� ORDGLQJV�RI � UHÁHFWLYH�PHDVXUHPHQW�PRGHO�DUH� UHSUH�measurement model are repre-sented in Table 6. All outer loadings are higher than 0.8. As a UHVXOW��PDQLIHVW�YDULDEOHV�RI �UHÁHFWLYH�PHDVXUHPHQW�PRGHO�ZHUH�LGHQWLÀHG�DV�UHOLDEOH�
7DEOH����2XWHU�ORDGLQJV�RI �UHÁHFWLYH�FRQVWUXFWV
Variables Loyalty Satisfaction
Manifest variable of 6DWLVIDFWLRQ No. 1Manifest variable of 6DWLVIDFWLRQ No. 2Manifest variable of 6DWLVIDFWLRQ No. 3Manifest variable of Loyalty No. 1Manifest variable of Loyalty No. 2
000
0.95130.9576
0.9380.89640.8231
00
Evaluating cross-validated redundancy measures for the en-dogenous latent variables, the chosen omission distance d was 7 �����������LQWHJHU���$OO�FURVV�YDOLGDWHG�UHGXQGDQF\�YDOXHV��4���for endogenous latent variables are above zero (see Table 7). Consequently, the structural model is assessed as displaying pre-dictive relevance.
PILELIENË AND GRIGALIUNAITË 45
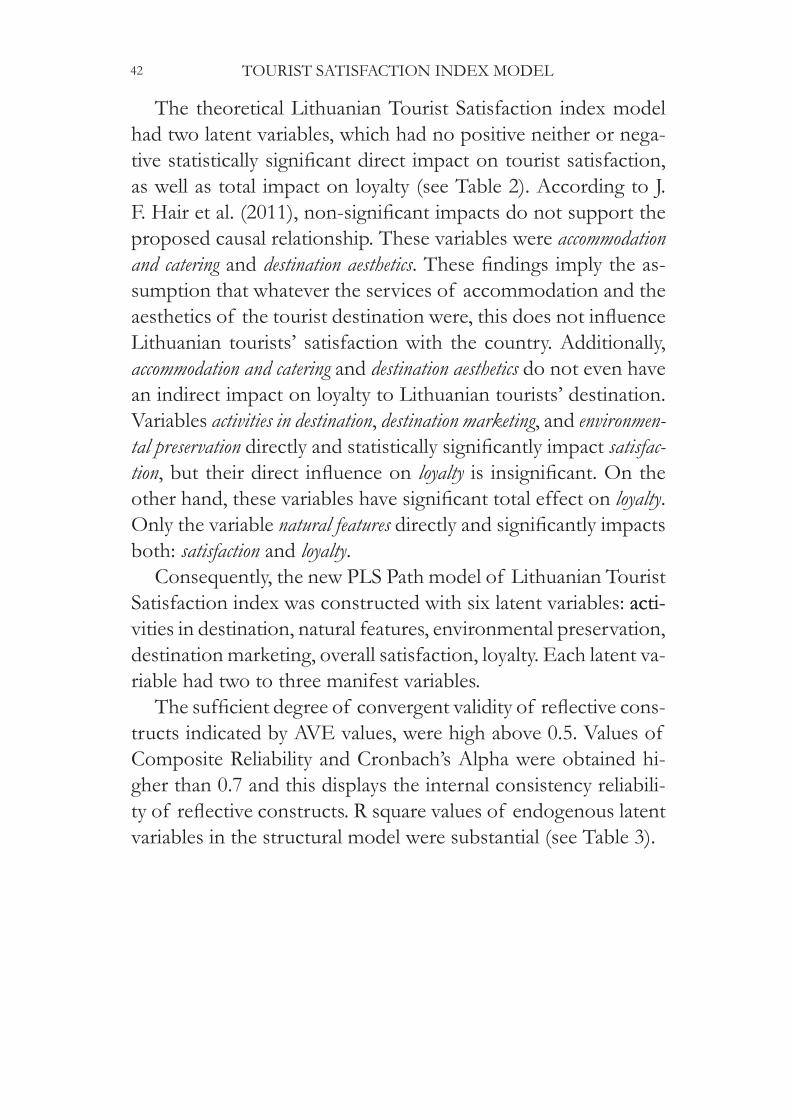
Table 7: Stone-Geisser‘s Q2
Total SSO SSE 1-SSE/SSO
SatisfactionLoyalty
753.0000502.0000
342.7093201.3042
0.54490.5990
)RUPDWLYH�LQGLFDWRUV·�ZHLJKWV�DQG�WKHLU�VLJQLÀFDQFH�DUH�VKR-wn in Table 8. All formative indicators’ weights are moderate and VLJQLÀFDQW�������VLJQLÀFDQFH�OHYHO��
7DEOH����)RUPDWLYH�LQGLFDWRUV·�ZHLJKWV�DQG�WKHLU�VLJQLÀFDQFH
N.º of manifest variable of VSHFLÀHG�ODWHQW�YDULDEOH���������
Original Sample
Standard Deviation
T Statistics
1 -> Activities in destination2 -> Activities in destination3 -> Activities in destination4 -> Destination marketing5 -> Destination marketing6 -> Environmental preservation7 -> Environmental preservation8 -> Environmental preservation9 -> Natural features10 -> Natural features11 -> Natural features
0.48360.40390.27740.71930.41380.39680.25590.56120.41970.55230.3284
0.14720.18430.14170.08440.09950.14380.09270.14210.09710.09250.0858
3.28582.19191.95728.52544.16012.75862.75923.94924.32395.97363.8293
When applying formative constructs, it is important to avoid PXOWLFROOLQHDULW\�SUREOHPV��7KH�YDULDQFH�LQÁDWLRQ�IDFWRU��9,)��IRU�the exogenous latent variables is provided in Table 9. J. F. Hair et al. (2011) detailed that the value of VIF must be less than 5 in order to claim that multicollinearity is not the problem. As it can be seen in Table 9, all the values of VIF for each exogenous variable is less than 3; accordingly, in this case multicollinearity problems have been avoided.
Table 9: Collinearity Statistics
VariablesCollinearity Statistics
Tolerance VIF
Activities in destination .646 1.548
Destination marketing .418 2.394
Environmental preservation .571 1.752
Natural features .600 1.668

TOURIST SATISFACTION INDEX MODEL46
3DWK�FRHIÀFLHQWV��WRWDO�HIIHFWV�DQG�WKHLU�VLJQLÀFDQFHV�IRU�WKH�/L-thuanian Tourists Satisfaction index model are shown in Table 10.
7DEOH�����3DWK�&RHIÀFLHQWV��7RWDO�(IIHFWV�DQG�WKHLU�VLJQLÀFDQFHV
VariablesPath
&RHIÀFLHQWT
StatisticsTotal Effect
T Statistics
Activities in destination -> LoyaltyActivities in destination -> SatisfactionDestination marketing -> LoyaltyDestination marketing -> SatisfactionEnvironmental preservation -> LoyaltyEnvironmental preservation -> SatisfactionNatural features -> LoyaltyNatural features -> SatisfactionSatisfaction -> Loyalty
0.1974
0.358
0.18680.19350.2860.6712
3.41
4.4563
3.33352.79024.876611.1104
0.13250.19740.24020.3580.12540.18680.38540.2860.6712
3.42423.41
3.83714.45633.3673.33355.41124.876611.1104
The variable ‘activities in destination’�KDV�D�GLUHFW�VLJQLÀFDQW�DYH-rage impact on VDWLVIDFWLRQ�DQG�LQGLUHFW�VLJQLÀFDQFH�DYHUDJH�WRWDO�impact on loyalty. Destination marketing�KDV�D�JUHDW�GLUHFW�VLJQLÀFDQW�impact on VDWLVIDFWLRQ�DQG�WKH�DYHUDJH�LQGLUHFW�VLJQLÀFDQW�WRWDO�LP-pact on loyalty. Environmental preservation�KDV�D�GLUHFW�VLJQLÀFDQW�DYH-rage impact on VDWLVIDFWLRQ�DQG�LQGLUHFW�VLJQLÀFDQFH�DYHUDJH�WRWDO�impact on loyalty. The variable ‘QDWXUDO�IHDWXUHV· of the destination GLUHFWO\�VLJQLÀFDQWO\�DIIHFWV�VDWLVIDFWLRQ and loyalty. Impact on satis-faction is average as well as direct impact on loyalty, though total HIIHFW�RQ�OR\DOW\�LV�VXEVWDQWLDO��6DWLVIDFWLRQ�GLUHFWO\�VLJQLÀFDQWO\�affects loyalty and this effect is the strongest in the whole model.
The Index values of latent variables are shown in Table 11. The worst evaluated variable was ‘environmental preservation’. Activities in destination was evaluated quite well, considering that index values above 75 scores were regarded as high, predicting business success in the future. Then again, taking under consid-eration that all variables’ scores (except environmental preservation) achieve the high level, activities in destination was assessed as the worst variable in the high scores level group.

PILELIENË AND GRIGALIUNAITË 47
Table 11: Index values of latent variables
Variable LV Index Values
Activities in destinationDestination marketingEnvironmental preservationLoyaltyNatural featuresSatisfaction
828373878484
Destination marketing almost achieves the level of satisfaction, and QDWXUDO�IHDWXUHV even meet the level of satisfaction. Bearing in PLQG�WKDW�ÀYH�YDULDEOHV�LQ�WKH�PRGHO�GLUHFWO\�DQG���RU�LQGLUHF-tly positively affect tourist loyalty, it is expected and proved that tourists’ loyalty for their destination has the highest index score.
DISCUSSION
The analysis of the research results suggests that accommoda�tion and catering and destination aesthetics does not have a statistically VLJQLÀFDQW�GLUHFW�RU�LQGLUHFW�LPSDFW�RQ�VDWLVIDFWLRQ�DQG�OR\DOW\�LQ�terms of Lithuanian tourists. Considering that the research spe-FLÀFDOO\�FRQWDLQV�WRXULVWV�DSSURDFK�DQG�PRVW�RI �WKH�/LWKXDQLDQ�tourists have the average income (according to Statistics Lithua-QLD���������DYHUDJH�����4��LQFRPH�ZDV��������/W���LW�FDQ�EH�DV-sumed that most of the decisions for accommodation and catering is are based on the price. Consequently, because of the tourist’s RZQ�GHFLVLRQ��WKLV�GRHV�QRW�LQÁXHQFH�WKH�VDWLVIDFWLRQ�OHYHO�ZLWK�the foreign country, as well as their loyalty to the destination. 7KHUHIRUH��LW�FDQ�EH�VWDWHG�WKDW�LI �WRXULVWV�ZHUH�GLVVDWLVÀHG�ZLWK�WKH�DFFRPPRGDWLRQ�DQG�FDWHULQJ��EXW�VDWLVÀHG�ZLWK�WKH�FRXQWU\�itself, it may not decrease the loyalty to the country, just due to WKH�VSHFLÀF�DFFRPPRGDWLRQ�DQG�FDWHULQJ�IDFLOLWLHV�WKH\�ZHUH�GLV-VDWLVÀHG�ZLWK��$V� IRU�destination aesthetics, the assumption could be made that the aesthetics of the destination had no impact on tourist satisfaction because it was considered more like the natu-ral characteristics of the country; respondents perceived that the destination must be in such condition of aesthetics that it was.

TOURIST SATISFACTION INDEX MODEL48
As a result, Lithuanian Tourist Satisfaction index model is pro-vided in Figure 2.
Figure 2. Lithuanian Tourist Satisfaction index model
The model contains four exogenous latent variables and two endogenous latent variables. All the exogenous latent variables activities in destination, destination marketing, environmental preservation, and natural features, are the determinants of tourist satisfaction. These determinants directly positively and VLJQLÀFDQWO\�DIIHFW�VDWLVIDFWLRQ��7KHUHIRUH��HQKDQFLQJ�RQH�RU�PRUH�of these determinants would have a positive effect on satisfaction. In addition, the variable ‘QDWXUDO� IHDWXUHV· directly positively and VLJQLÀFDQWO\�DIIHFWV�loyalty. Moreover, enhancing the index scores of natural features would have a direct positive effect on both: satisfaction and loyalty. Because of the great direct positive and VLJQLÀFDQW�HIIHFW�RI �VDWLVIDFWLRQ�LQ�OR\DOW\��HQKDQFLQJ�RQH�RU�PRUH�determinants of satisfaction would have indirect and positive effect on loyalty, too.
PILELIENË AND GRIGALIUNAITË 49
CONCLUSIONS
There are various different Tourist Satisfaction indexes deve-loped all over the world due to dissimilarities among people in GLIIHUHQW�FRXQWULHV��'HVSLWH�WKLV��WKH�DQDO\VLV�RI �WKH�VFLHQWLÀF�OL-terature led to the conclusion that most of the determinants of WRXULVW� VDWLVIDFWLRQ�GHÀQHG� LQ� GLIIHUHQW� LQGH[HV� FRUUHVSRQG� WR�each other and could be connected.
The analysis of the research results shows that most of Li-thuanian tourists prefer traveling with a company and the most popular destination among Lithuanian tourists is southern Eu-ropean countries.
Activities in destination, destination marketing, environmental preservation and natural features of the country are the determi-nants of Lithuanian tourists’ satisfaction. Furthermore, Lithua-nian tourists’ satisfaction and natural features of the country are two determinants that directly affect Lithuanian tourists’ loyalty to the country.
Consequently, it could be stated that if natural features of the destination are not striking, then marketing of the destina-tion should be improved in order to increase Lithuanian tourists’ loyalty to the particular destination.
REFERENCES
Al-Majali, M. M. (2012). International Tourists Satisfaction: Case of Jordan. International Business Research, 5 (9), 210-216.
Andreev, P., Maoz, H., Heart, T., Pliskin, N. (2009). Validating Formative Partial Least Squares (PLS) Models: Methodological Review and Empirical Illustration. ICIS 2009 Proceedings. Paper 193.&RHOKR��3��6���(VWHYHV��6��3����������7KH�FKRLFH�EHWZHHQ�D�ÀYH�
point and a ten-point scale in the framework of customer satis-faction measurement. International Journal of Market Research, 49 (3), 313-339.
Hair, J. F., Ringle, C. M., Sarstedt, M. (2011). PLS-SEM: Indeed a Sil-ver Bullet. Journal of Marketing Theory and Practice, 19 (2), 139-152.
TOURIST SATISFACTION INDEX MODEL50
Johnson, M. D., Gustafsson, A., Andreassen, T. W., Lervik, L., Cha, J. (2001). The evolution and future of national customer satisfaction index models. Journal of Economic Psychology, 22 (2), 217–245.
Klimek, K. (2013). Destination management organizations and their shift to sustainable tourism development. European Journal of Tourism, Hospitality and Recreation, 4 (2), 27-47.
Krešic, D., Prebešac, D. (2011). Index of destination attracti-veness as a tool for destination attractiveness assessment. TOU-RISM - An International Interdisciplinary Journal, 59 (4), 497-517.
PolyU Tourist Satisfaction Index Report (2013). Retrieved from: http://hotelschool.shtm.polyu.edu.hk/tsi/common/me-thodology.jsp [Accessed August 25, 2013].4XLQWDO��9��$���3ROF]\QVNL��$����������)DFWRUV�LQÁXHQFLQJ�WRX-
ULVWV·�UHYLVLW�LQWHQWLRQV��$VLD�3DFLÀF�-RXUQDO�RI �0DUNHWLQJ�DQG�/R-gistics, 22 (4), 554 - 578.
Salleh, M., Omar, K., Yaakop, A. Y., Mahmmod, A. R. (2013). Tourist Satisfaction in Malaysia. International Journal of Business and Social Science, 4 (5), 221-226.
Siri, R., Josiam, B., Kennon, L., Spears, D. (2012). Indian Tou-rists’ Satisfaction of Bangkok, Thailand. Journal of Services Re-search, 12 (1), 25-42.
Som, A. P. M., Shirazi, S. F. M., Marzuki, A., Jusoh, J. (2011). A critical analysis of tourist satisfaction and destination loyalty. Journal of Global Management, 2 (2), 178-183.
Song, H., Li, G., van der Veen, R., Chen, J. L. (2011). Assessing Mainland Chinese Tourists’ Satisfaction with Hong Kong Using Tourist Satisfaction Index. International Journal of Tourism Re-search, 13 (1), 82-96.
Song, H., van der Veen, R., Li, G., Chen, J., L. (2012). The Hong Kong tourist satisfaction index. Annals of Tourism Rese-arch, Vol. 39 (1), 459-479.
Statistics Lithuania (2013). Average monthly earnings and indi-ces by sex, type, sector, statistical indicator and quarter. Retrieved from <http://db1.stat.gov.lt/statbank/selectvarval/saveselec-

PILELIENË AND GRIGALIUNAITË 51
tions.asp?MainTable=M3060311&PLanguage=1&TableStyle=&%XWWRQV 3;6,G ����,4< 7& 67 67UYDU� UYDU�=&rvar2=&rvar3=&rvar4=&rvar5=&rvar6=&rvar7=&rvar8=&-rvar9=&rvar10=&rvar11=&rvar12=&rvar13=&rvar14=>
Tenenhaus, M., Vinzi, V. E., Chatelin, Y.-M., Lauro, C. (2005). PLS path modeling. Computational Statistics and Data Analysis, 48 (1), 159-205.
6XEPLWWHG����th�6HSWHPEHU������)LQDO�YHUVLRQ����th�'HFHPEHU������
$FFHSWHG����th�'HFHPEHU������5HIHUHHG�DQRQ\PRXVO\