Foreign investment 2000 - Cepal
236
Foreign investment 2000 in latin america and the caribbean
-
Upload
khangminh22 -
Category
Documents
-
view
1 -
download
0
Transcript of Foreign investment 2000 - Cepal
Foreigninvestment
2000
in latin americaand the caribbean

Copyright ©United Nations 2001All rights reserved
Printed in Chile
Applications for the right to reproduce this work are welcomed and should be sent to the Secretary of the Publications Board, UnitedNations Headquarters, New York, N.Y. 10017, U.S.A. Member States and their governmental institutions may reproduce this workwithout prior authorization, but are requested to mention the source and inform the United Nations of such reproduction.
UNITED NATIONS PUBLICATION
Sales No.: E.01.II.G.12
ISSN - 0257 - 2184ISBN 92-1-121301-0
LC/G.2125-PJune 2001

Foreign Investment in Latin America and the Caribbean, 2000 Report is the latest edition of a series published annually by theECLAC Unit on Investment and Corporate Strategies. It was prepared by Álvaro Calderón and Michael Mortimore, with assistancefrom external consultants Matías Kúlfas and José Claudio Linhares Pires on the country case studies concerning thetelecommunications industries in Argentina and Brazil, respectively, and from Jaime Crispi on chapter I. Nicole Moussa made amajor substantive contribution to chapter IV (telecommunications), as did Sebastián Vergara in the case of chapter II (Chile). Thecompilation and processing of statistical data was carried out by Lorena Farías with the assistance of Carlos Guaipatin, José Luis Limaand Juan Pablo Álvarez.
The Unit's Information Centre has served as the primary source of quantitative data. The development of this Information Centrehas provided the Unit with ready access to statistical information and other types of data from a number of international organizations,including the International Monetary Fund (IMF), the Statistical Office of the European Communities (EUROSTAT), the UnitedNations Conference on Trade and Development (UNCTAD) and the Institute for European-Latin American Relations (IRELA), aswell as a host of national institutions such as central banks and investment promotion agencies for Latin America and the Caribbean.
Any comments or suggestions regarding this publication are welcome and should be directed to Michael Mortimore (email:[email protected]).
Notes and explanation of symbols
The following symbols have been used in the tables in this study:
Three dots (. . .) indicate that data are not available or are not separately reported.A dash (-) indicates that the amounts is nil or negligible.A point (.) is used to indicate decimals.Use if a hyphen (-) between years, e.g., 1971-1973, indicates reference to the complete number of calendar years involved, includingthe beginning and end years.The word “dollars” refers to United States dollars, unless otherwise specified.Figures and percentages in tables may not neccessarly add up to the corresponding totals, because of rounding.
Foreign investment in Latin America and the Caribbean, 2000 5
CONTENTS
Page
ABSTRACT · · · · · · · · · · · · · · · · · · · · · · · · · · · · · · · · · · · · · · · · · · · · · · · · · 11
FOREWORD · · · · · · · · · · · · · · · · · · · · · · · · · · · · · · · · · · · · · · · · · · · · · · · · · 13
SUMMARY AND CONCLUSIONS · · · · · · · · · · · · · · · · · · · · · · · · · · · · · · · · · · · · 151. Regional outlook · · · · · · · · · · · · · · · · · · · · · · · · · · · · · · · · · · · · · · · · · 162. Chile · · · · · · · · · · · · · · · · · · · · · · · · · · · · · · · · · · · · · · · · · · · · · · · · 203. Japan · · · · · · · · · · · · · · · · · · · · · · · · · · · · · · · · · · · · · · · · · · · · · · · 224. Telecommunications · · · · · · · · · · · · · · · · · · · · · · · · · · · · · · · · · · · · · · · 24
INTRODUCTION: A REGULATORY CHALLENGE · · · · · · · · · · · · · · · · · · · · · · · · · · · 27
I. REGIONAL PANORAMA· · · · · · · · · · · · · · · · · · · · · · · · · · · · · · · · · · · · · · 33
A. RECENT TRENDS IN FOREIGN DIRECT INVESTMENT IN LATIN AMERICA ANDTHE CARIBBEAN· · · · · · · · · · · · · · · · · · · · · · · · · · · · · · · · · · · · · · · · 331. Overall foreign direct investment · · · · · · · · · · · · · · · · · · · · · · · · · · · · · · · 332. Foreign direct investment in Latin America and the Caribbean: recent inflows
and trends · · · · · · · · · · · · · · · · · · · · · · · · · · · · · · · · · · · · · · · · · · · 36
B. STRATEGIES, AGENTS AND MODALITIES OF FOREIGN DIRECT INVESTMENT · · · 551. Strategies and actors: the legacy of the 1990s· · · · · · · · · · · · · · · · · · · · · · · · · 552. Competitiveness and emerging strategies: the phenomenon of mergers and acquisitions · · 66
C. A NEW NATIONAL STRATEGY ON FOREIGN DIRECT INVESTMENT · · · · · · · · · 821. New policies in the Dominican Republic: a focus on advanced technology and
improvement of system competitiveness · · · · · · · · · · · · · · · · · · · · · · · · · · · 82
II. CHILE: FOREIGN DIRECT INVESTMENT AND CORPORATE STRATEGIES · · · · · · · · 89
A. FOREIGN CAPITAL IN THE CHILEAN ECONOMY · · · · · · · · · · · · · · · · · · · · · 901. A century marked by the mining investments of North American firms · · · · · · · · · · · 902. FDI in the 1990s: from mining to services · · · · · · · · · · · · · · · · · · · · · · · · · · 91
B. STRATEGIES OF TRANSNATIONAL CORPORATIONS IN CHILE · · · · · · · · · · · · 1001. Pursuit of natural resources for exports · · · · · · · · · · · · · · · · · · · · · · · · · · · · 1002. Access to services markets: Chile as a stepping stone to Latin America · · · · · · · · · · · 114
C. CONCLUSIONS· · · · · · · · · · · · · · · · · · · · · · · · · · · · · · · · · · · · · · · · · · 129
6 CEPAL
Page
III. JAPAN: INVESTMENT AND CORPORATE STRATEGIES IN LATIN AMERICA AND THECARIBBEAN · · · · · · · · · · · · · · · · · · · · · · · · · · · · · · · · · · · · · · · · · · · · · 131
A. WHAT HAS POWERED JAPANESE OUTWARD FDI? · · · · · · · · · · · · · · · · · · · · 134B. THE JAPANESE CHALLENGE TO THE GLOBAL AUTOMOTIVE INDUSTRY:
TOYOTA AND HONDA · · · · · · · · · · · · · · · · · · · · · · · · · · · · · · · · · · · · · 145C. THE JAPANESE CONSUMER ELECTRONICS INDUSTRY: SONY AND MATSUSHITA
ELECTRIC INDUSTRIAL · · · · · · · · · · · · · · · · · · · · · · · · · · · · · · · · · · · · 152D. BEYOND TRADING: MITSUBISHI CORPORATION · · · · · · · · · · · · · · · · · · · · 162E. AN INNOVATIVE NEWCOMER: NTT-DOCOMO POSITIONS ITSELF IN THE GLOBAL
TELECOMS INDUSTRY · · · · · · · · · · · · · · · · · · · · · · · · · · · · · · · · · · · · 167F. CONCLUSIONS OF JAPANESE INVESTMENT IN LATIN AMERICA AND THE
CARIBBEAN · · · · · · · · · · · · · · · · · · · · · · · · · · · · · · · · · · · · · · · · · · · 170
IV. TELECOMMUNICATIONS: INVESTMENT AND CORPORATE STRATEGIES IN LATINAMERICA AND THE CARIBBEAN · · · · · · · · · · · · · · · · · · · · · · · · · · · · · · · · 173
A. TELECOMMUNICATIONS AND GLOBALIZATION· · · · · · · · · · · · · · · · · · · · · 1731. Technological change · · · · · · · · · · · · · · · · · · · · · · · · · · · · · · · · · · · · · 1752. Increased competition · · · · · · · · · · · · · · · · · · · · · · · · · · · · · · · · · · · · · 1823. The transnationalization process · · · · · · · · · · · · · · · · · · · · · · · · · · · · · · · 198
B. TRANSNATIONAL TELECOMMUNICATIONS COMPANIES IN LATIN AMERICAAND THE CARIBBEAN · · · · · · · · · · · · · · · · · · · · · · · · · · · · · · · · · · · · · 2041. The first wave: European State companies · · · · · · · · · · · · · · · · · · · · · · · · · · 2042. Globalizers · · · · · · · · · · · · · · · · · · · · · · · · · · · · · · · · · · · · · · · · · · 213
C. CONCLUSIONS · · · · · · · · · · · · · · · · · · · · · · · · · · · · · · · · · · · · · · · · · 224
BIBLIOGRAPHY · · · · · · · · · · · · · · · · · · · · · · · · · · · · · · · · · · · · · · · · · · · · · · 227
BOXES
I.1 Spanish banking comes ashore in Mexico · · · · · · · · · · · · · · · · · · · · · · · · · · · · · · 41I.2 AES in Latin America: a world player expands into the region from a Brazilian base · · · · · · · 45I.3 Heavy stakes in the Brazilian market: BSCH takes control of BANESPA· · · · · · · · · · · · · · 47I.4 The Southern Cone food and beverage industry and the global strategy of Danone · · · · · · · · · 49I.5 Convergence between development policy targets and the strategies of transnational firms:
Dominican Republic and Unión Fenosa · · · · · · · · · · · · · · · · · · · · · · · · · · · · · · · 86II.1 Broken Hill Proprietary (BHP): a globalized mining company? · · · · · · · · · · · · · · · · · · · 105II.2 Nutreco: food for fish? fish for food?· · · · · · · · · · · · · · · · · · · · · · · · · · · · · · · · · 111III.1 The analytical shortcomings in official statistics on Japanese FDI· · · · · · · · · · · · · · · · · · 132III.2 The wild flying geese model · · · · · · · · · · · · · · · · · · · · · · · · · · · · · · · · · · · · · 137III.3 Colour television receiver operations in Tijuana: cluster or fluster? · · · · · · · · · · · · · · · · · 161
Foreign investment in Latin Ameria and the Caribbean, 2000 7
Page
IV.1 The GSM route to third-generation (3G) mobile telephony · · · · · · · · · · · · · · · · · · · · · 178IV.2 Argentina: the cost of privatization without competition· · · · · · · · · · · · · · · · · · · · · · · 188IV.3 Mexico: the cost of defending a national champion · · · · · · · · · · · · · · · · · · · · · · · · · 191IV.4 Brazil: the benefits of learning from others' mistakes · · · · · · · · · · · · · · · · · · · · · · · · 194IV.5 Undersea cables: the real-time link with the rest of the world · · · · · · · · · · · · · · · · · · · · 210
TABLES
I.1 Latin America and the Caribbean: net inflow of foreign direct investment, by subregion,1990-2000· · · · · · · · · · · · · · · · · · · · · · · · · · · · · · · · · · · · · · · · · · · · · · · 37
I.2 LAIA: net inflow of foreign direct investment, 1990-2000 · · · · · · · · · · · · · · · · · · · · · 39I.3 Central America and the Caribbean: net inflow of foreign direct investment, by country,
1990-2000· · · · · · · · · · · · · · · · · · · · · · · · · · · · · · · · · · · · · · · · · · · · · · · 52I.4 Financial centres: foreign direct investment, 1995-1999 · · · · · · · · · · · · · · · · · · · · · · · 55I.5 Latin America and the Caribbean: strategies of transnational corporations in the 1990s · · · · · · 56I.6 South America: international competitiveness in world imports, 1985-1998 · · · · · · · · · · · · 57I.7 Mexico and the Caribbean Basin: international competitiveness in world imports, 1985-1998 · · · 58I.8 Latin America and the Caribbean: 500 largest firms, 1990-1999 · · · · · · · · · · · · · · · · · · 59I.9 Latin America and the Caribbean: 100 main manufacturing firms, 1990-1992, 1994-1996 and
1998-1999· · · · · · · · · · · · · · · · · · · · · · · · · · · · · · · · · · · · · · · · · · · · · · · 60I.10 Latin America and the Caribbean: 200 largest exporters, 1995-1999 · · · · · · · · · · · · · · · · 61I.11 100 largest transnational firms present in Latin America, by consolidated sales, 1999 · · · · · · · 62I.12 10 largest transnational banks in Latin America, by consolidated assets, 1999 · · · · · · · · · · · 65I.13 Latin America and the Caribbean: privatization and tenders involving foreign investments of over
US$ 100 million, by sector and amount, 1999-2000 · · · · · · · · · · · · · · · · · · · · · · · · · 70I.14 Latin America and the Caribbean: private firms purchased by foreign investors for over US$ 100
million, by sector and amount, 1999-2000 · · · · · · · · · · · · · · · · · · · · · · · · · · · · · · 73I.15 Mergers and acquisitions of private companies in Latin America and the Caribbean, by sector and
industry, 1999-2000· · · · · · · · · · · · · · · · · · · · · · · · · · · · · · · · · · · · · · · · · · 81I.16 Dominican Republic: international competitiveness in North American imports · · · · · · · · · · 83II.1 Chile: foreign direct investment, 1985-2000 · · · · · · · · · · · · · · · · · · · · · · · · · · · · · 93II.2 Chile: 50 largest fully or partly foreign-owned firms, by value of sales, 1999-2000 · · · · · · · · 97II.3 Chile: international competitiveness in world imports, 1985-1998 · · · · · · · · · · · · · · · · · 99II.4 Chile: main mining ventures · · · · · · · · · · · · · · · · · · · · · · · · · · · · · · · · · · · · · 103II.5 Production of marketable copper · · · · · · · · · · · · · · · · · · · · · · · · · · · · · · · · · · · 104II.6 Main world copper firms, 2000 · · · · · · · · · · · · · · · · · · · · · · · · · · · · · · · · · · · · 106II.7 Chile: main salmon firms · · · · · · · · · · · · · · · · · · · · · · · · · · · · · · · · · · · · · · · 112II.8 Chile: main foreign fresh fruit exporting firms, 1999-2000 season · · · · · · · · · · · · · · · · · 113II.9 Chile: largest services acquisitions, 1995-2000 · · · · · · · · · · · · · · · · · · · · · · · · · · · 115II.10 Enersis and Gener: main assets in Latin America · · · · · · · · · · · · · · · · · · · · · · · · · · 118II.11 Chile: largest electricity firms, by sales, 1999 · · · · · · · · · · · · · · · · · · · · · · · · · · · · 120II.12 Chile: main telecommunications firms, by segment · · · · · · · · · · · · · · · · · · · · · · · · · 122II.13 Chile: main fully or partly foreign-owned banks, by value of assets, 1999-2000 · · · · · · · · · · 128
8 CEPAL
Page
III.1 Typology for adoption of Japanese management techniques (JMT), circa 1990· · · · · · · · · · · 135III.2 Japan: outflows of FDI in the manufacturing sector, by region, 1970-1998 · · · · · · · · · · · · · 141III.3 Geographical specialization of the international systems of Japanese, United States and German
corporations outside industrialized countries, 1996 · · · · · · · · · · · · · · · · · · · · · · · · · 143III.4 Leading Japanese corporations by foreign assets, 1998 · · · · · · · · · · · · · · · · · · · · · · · 144III.5 Leading motor vehicle manufacturers, by worldwide sales, 1999 · · · · · · · · · · · · · · · · · · 147III.6 Toyota vehicle production by region, 1990 and 1999 · · · · · · · · · · · · · · · · · · · · · · · · 148III.7 Toyota's international production system for motor vehicles, 1999 · · · · · · · · · · · · · · · · · 150III.8 Honda's international production system for motor vehicles, 1999 · · · · · · · · · · · · · · · · · 150III.9 Nissan's international production system for motor vehicles, 1999 · · · · · · · · · · · · · · · · · 151III.10 Market share rankings of top three colour TV manufacturers, by region, 1999 · · · · · · · · · · · 156III.11 Sony: sales by segment, 1990-1st quarter, 2000 · · · · · · · · · · · · · · · · · · · · · · · · · · · 156III.12 Sony: sales by market, 1990-1st quarter, 2000 · · · · · · · · · · · · · · · · · · · · · · · · · · · · 156III.13 Matsushita electric industrial: sales by segment, 1991-2000 · · · · · · · · · · · · · · · · · · · · · 159III.14 Matsushita electric industrial: sales by market, 1991-2000 · · · · · · · · · · · · · · · · · · · · · 159IV.1 Third-generation (3G) licences in the European Union · · · · · · · · · · · · · · · · · · · · · · · 186IV.2 Indicators of telecommunications service performance in four Latin American countries,
1990-2000· · · · · · · · · · · · · · · · · · · · · · · · · · · · · · · · · · · · · · · · · · · · · · · 197IV.3 The 15 largest telecommunications companies, by market segment, 1999· · · · · · · · · · · · · · 199IV.4 Telecommunications: the largest mergers and acquisitions, 1990-2000 · · · · · · · · · · · · · · · 201IV.5 Latin America: the leading telecommunications companies, by market segment, 1999 · · · · · · · 202IV.6 Latin America: largest mergers and acquisitions in the telecommunications sector,
1990-2000· · · · · · · · · · · · · · · · · · · · · · · · · · · · · · · · · · · · · · · · · · · · · · · 203IV.7 Telefónica de España: main operations in Latin America, 2000 · · · · · · · · · · · · · · · · · · · 207IV.8 Telefónica de España and Portugal Telecom: Brazilian assets of the new mobile telephony
company· · · · · · · · · · · · · · · · · · · · · · · · · · · · · · · · · · · · · · · · · · · · · · · · 208IV.9 Telecom Italia: main operations in Latin America, 2000· · · · · · · · · · · · · · · · · · · · · · · 211IV.10 Verizon: main operations in Latin America, 2000 · · · · · · · · · · · · · · · · · · · · · · · · · · 216IV.11 SBC Communications: main operations in the Americas, 2000 · · · · · · · · · · · · · · · · · · · 220IV.12 América Móvil: main operations in the Americas, 2000 · · · · · · · · · · · · · · · · · · · · · · · 221IV.13 Bell Canada International: main operations in Latin America, 2000 · · · · · · · · · · · · · · · · · 222IV.14 BellSouth: main operations in Latin America, May 2000 · · · · · · · · · · · · · · · · · · · · · · 223

Foreign investment in Latin America and the Caribbean, 2000 9
Page
FIGURES
I.1 Net inflow of foreign direct investment· · · · · · · · · · · · · · · · · · · · · · · · · · · · · · 34I.2 Net inflow of foreign direct investment· · · · · · · · · · · · · · · · · · · · · · · · · · · · · · 36I.3 Foreign direct investment flows to Latin America and the Caribbean, 1995-2000· · · · · · · · 38I.4 Foreign direct investment in Mexico, by sector, 1995-1999 and first semester 2000 · · · · · · 40I.5 Foreign direct investment in Brazil, by sector, January-October 2000 · · · · · · · · · · · · · · 44I.6 Transborder mergers and acquisitions and foreign direct investment in developed countries · · 67II.1 Chile: foreign direct investment, 1975-2000 · · · · · · · · · · · · · · · · · · · · · · · · · · · 92II.2 Chile: foreign direct investment by sector, 1990-2000 · · · · · · · · · · · · · · · · · · · · · · 94II.3 Chile: foreign direct investment by country of origin, 1990-2000 · · · · · · · · · · · · · · · · 95II.4 Price of copper on the London Metal Exchange, 1960-2000 · · · · · · · · · · · · · · · · · · · 101II.5 Chile: composition of fisheries exports, 1991-1999 · · · · · · · · · · · · · · · · · · · · · · · 110II.6 Chile: ratio of basic to mobile telephone service subscribers· · · · · · · · · · · · · · · · · · · 124II.7 Chile: share of foreign banks in total lending in the financial system, 1995-2000 · · · · · · · · 127III.1 Japan: outward FDI and exchange rate, 1970-1999· · · · · · · · · · · · · · · · · · · · · · · · 133III.2 Major gainers of OECD import share of the 50 most dynamic products in international trade,
1977-1996 · · · · · · · · · · · · · · · · · · · · · · · · · · · · · · · · · · · · · · · · · · · · · 136III.3 Japan: structural upgrading and FDI · · · · · · · · · · · · · · · · · · · · · · · · · · · · · · · 139III.4 Sales by Japanese manufacturing affiliates in Asia and Latin America, FY 1998 · · · · · · · · 141III.5 Japan: production and export of motor vehicles, 1950-1999 · · · · · · · · · · · · · · · · · · · 146III.6 Japan: production, exports and imports of electronics, 1950-2000 · · · · · · · · · · · · · · · · 153III.7 Japan: production, exports and imports of consumer electronics equipment, 1950-2000 · · · · 154III.8 Japan: domestic and overseas production of colour TVs, 1990-1999 · · · · · · · · · · · · · · 154III.9 Japan: imports and exports of colour TVs, 1966-2000 · · · · · · · · · · · · · · · · · · · · · · 155III.10 Organizational structure of Mitsubishi Corporation · · · · · · · · · · · · · · · · · · · · · · · 165IV.1 Routes towards third-generation mobile telephony · · · · · · · · · · · · · · · · · · · · · · · · 177IV.2 Development of GSM in mobile telephony · · · · · · · · · · · · · · · · · · · · · · · · · · · · 180IV.3 Telecommunications: the competitive situation in different segments, 1999· · · · · · · · · · · 185

10 CEPAL
■
ABSTRACT
■
This study seeks to provide greater insight into foreign direct investment (FDI) in Latin
America and the Caribbean. A corporate strategy-based analytical framework has been
used to interpret the copious yet heterogeneous information available on the subject. The
research programme employed by the Unit on Investment and Corporate Strategies is
structured around the examination of specific situations in selected investor countries,
FDI host countries and FDI recipient industries in the region. This research, together with
the statistical and qualitative data compiled by the Unit's Information Centre, has been
used to provide an increasingly comprehensive picture of FDI in the region.
In 2000, for the first time in nearly two decades, theLatin American and Caribbean region's FDI inflowsdropped by 20% from the previous year's figure to standat just US$ 74.191 billion. Nevertheless, caution shouldbe exercised in analysing this turnaround in the trend,since the large inflows recorded for 1999 were the resultof a limited number of major acquisitions of LatinAmerican companies by foreign corporations which areunlikely to be repeated in the future. In addition, close to60% of total foreign capital inflows were concentrated injust two countries: Brazil and Mexico. In fact, Brazil wasthe top choice of foreign investors for the fifth yearrunning and accounted for 40% of total FDI inflows tothe entire region. Moreover, in a continuation of the trendof earlier years, a very high percentage of FDI flows were
used for the acquisition of existing assets, primarily inservices sectors such as telecommunications, energy andfinance.
In addition to giving a broad-ranging and detailedreview of FDI in Latin America and the Caribbean, thisreport presents a thorough analysis of Chile's position asa destination country (particularly in naturalresource-based activities and, more recently, services);of Japan's role as a major international investor, but onewhich has few interests in the region; and of thetelecommunications industry, one of the sectors that bestreflects the astonishingly rapid changes associated withglobalization. Each of these elements contributes to anincreasingly thorough grasp of the nature and impact ofFDI in the region as well as a fuller understanding of thephenomenon itself.
Foreign investment in Latin America and the Caribbean, 2000 11

12 ECLAC
■
FOREWORD
■
Foreign Investment in Latin America and the Caribbean, 2000 Report uses the same
analytical structure as the last two editions of Foreign Investment, which entails five main
elements: (i) the interpretation of a selected aspect of FDI with a view to gaining a fuller
understanding of the phenomenon as such or improving the approach we take to it; (ii) a
presentation of the most recent statistical information available; (iii) a case study on a
major FDI recipient country; (iv) a case study on a major investor country; and (v) a case
study on an industry in the region in which FDI plays a significant role. This structure
reflects the institutional view that, while official FDI statistics are clearly a necessary input
for an analysis of FDI, other types of information that can only be provided by research
into a range of individual cases at the country and sector levels are also required. The fact
that this publication contains three chapters on specific cases and a single chapter on
statistical information as such suggests that although examining selected experiences is a
much more complex undertaking than analysing official statistics is, it also provides
greater insight into the subject.
As part of the 2000 edition's exploration of businessstrategies used in the region, the case study on Chilepresented in chapter II discusses strategies for obtainingraw materials and for seeking out national service
markets. Chapter III looks into the question of whether ornot there is in fact fairly little Japanese FDI in the regionand, in the process, examines the efficiency-seekingstrategy being used by Japanese electronics firms in
Foreign investment in Latin America and the Caribbean, 2000 13

Mexico. Finally, the analysis of the telecommunicationsindustry provided in chapter IV focuses on strategies forseeking out national markets.
A number of innovations have been introduced in2000 Report which set it apart from earlier editions. Inchapter I, changes have been made in the weightings ofLatin America's 100 largest transnational corporations'consolidated sales based on the size of their stake in theiraffiliated companies. This change has been made inorder to provide a clearer picture of the actual presencemaintained by transnational corporations in the region.In addition, statistical information on thetransnationalization process in the region during the1990s is presented in the form of two- or three-yearaverages in order to bring out the structural aspects ofthis phenomenon and thus differentiate between themand its more short-term or cyclical facets. The effortmade in chapter III to explain why so little foreign direct
investment (FDI) is coming from a specified investorcountry (Japan) represents a further innovation. Anotherfirst in this year's edition is the commencement of anin-depth consideration of FDI in services, in this case asit relates to the telecommunication industry (see chapterIV).
The Commission would once again like to requestthe on-going collaboration of transnational corporations,governmental organizations, business associations andacademic institutions in the prodigious task ofidentifying, gathering, processing and analysingstatistical data and background information on differentcountries' and industries' experiences in this area. Wewould also like to thank, in particular, the Japan ExternalTrade Organization (JETRO) for the extremely valuableinputs which its staff provided for chapter III of thisreport.
José Antonio Ocampo
Executive Secretary
ECLAC
14 ECLAC

■
SUMMARY AND CONCLUSIONS
■
Foreign Investment in Latin America and the Caribbean, 2000 Report begins with a
discussion of the challenges analysed in the preceding two editions � the statistical
challenge and the normative challenge� and then adds a third: the regulatory challenge.
The issues to be confronted in these areas pose different sorts of complications for
decision-makers concerned with the role that foreign direct investment (FDI) should play
in the countries' development processes. This is due to the following factors:
• The major differences to be found in terms ofmethodologies, accounting procedures, definitionsand coverage of official information on FDI make itmore difficult to arrive at an understanding of thephenomenon and, hence, to adopt policy decisions onthe subject. The statistical challenge facing the regioninvolves upgrading official statistics andsupplementing them with other sorts of information.
• Fierce competition for FDI has led to the proliferationof agreements aimed at promoting and providingguarantees for FDI. These instruments includebilateral treaties, free trade agreements (a number ofwhich contain chapters on investment), regionalnegotiations (e.g., the Negotiating Groups of the FreeTrade Area of the Americas) and multilateralarrangements (the obligations assumed under theGeneral Agreement on Trade in Services (GATS)within the framework of the World Trade Organization,trade-related investment measures, the Trade-RelatedAspects of Intellectual Property Rights (TRIPs)Agreement, etc.). For many countries, these
instruments are part of a fairly undiscriminatingpolicy of attracting as much FDI as possible (the"more is better" approach); as a result, countries oftenfind that they have assumed obligations which, furtherdown the road, will place limitations on their owndevelopment programmes. The normative challenge,for its part, calls for a refinement of FDI policy and itsalignment with the countries' larger developmentplans.
• Recently, FDI flows are increasingly being channeledinto liberalized services sectors. In situations whereexperience with such flows is limited, whereregulatory systems and institutions are weak, andwhere resources are scarce, the implementation of FDIpolicies of the "more is better" type can cause seriousproblems in service industries that are not prepared toreceive large FDI inflows. This type of situation oftenarises when the dominant incumbent is privatized. Insuch cases the regulatory challenge entails setting up amodern, effective regulatory framework beforeservice activities are opened up to FDI.
Foreign investment in Latin America and the Caribbean, 2000 15
In order to meet these challenges, a more integralFDI policy is needed that defines the nationalgovernment's development priorities, the role that FDI isexpected to play and the instruments or mechanisms for
channelling FDI based on those priorities. A policy ofthis sort may be a better choice for developing countriesthan a "more is better" policy or, at the least, can serve tocomplement such an approach.
1. Regional outlook
In 2000, worldwide FDI flows topped US$ 1.1 trillion,which was nearly 14% more than in 1999 and over threetimes as much as in 1995. These figures indicate that theglobal expansion of transnational corporations (TNCs)remained on course during the first year of the newcentury. The geographic distribution of FDI flows in2000 also held to the trend towards an increasingconcentration in developed countries which hademerged in the second half of the 1990s. In fact, virtuallythe entire annual increase in world FDI flows in 2000was accounted for by flows to developed countries,which, at nearly US$ 900 billion in 2000, were 17%higher than in 1999. In the developed world, the maintwo recipients were the United States and Germany, withinflows of around US$ 250 billion each, followed bysuch European countries as the United Kingdom,Belgium, France and the Netherlands. FDI flows todeveloping countries in 2000, on the other hand,remained fairly close to their 1999 levels, at around US$190 billion. This meant that the developing countries'share of worldwide FDI inflows shrank from over onethird of the total in 1995 to less than one fifth in 2000.
Among all the developing countries, almost 95% ofFDI flows in 2000 were concentrated in just two regions:Asia, and Latin America and the Caribbean. In 2000 thedeveloping Asian countries received over US$ 100billion in FDI, which was an increase of more than 10%over the 1999 figure. Although some countries that hadbeen hit hard by the 1997 crisis, such as the Republic ofKorea and Malaysia, have regained their attractivenessas an investment site, this annual increase in FDI flows islargely a reflection of how swiftly direct investment isgrowing in the People's Republic of China. In fact, flowsto mainland China and to the Special AdministrativeRegion of Hong Kong, taken together, amounted to over70% of the subregion's total FDI inflows.
After having trebled in the second half of the 1990s,annual FDI flows to Latin America and the Caribbeanfell in 2000. The inflows for the year still amounted tomore than US$ 74 billion, but this nonethelessrepresented a drop of more than 20% from the 1999 level
of over US$ 93 billion. However, despite this downturn,the figure recorded for 2000 was far more than threetimes as high as the average annual flow during1990-1994 and was 16% higher than the average annualflow in the second half of the decade. As a matter of fact,the decline in FDI flows to the region in 2000 wasprimarily a result of circumstantial factors rather thanconstituting a change in trend, since just threetransactions in 1999 � the acquisitions of YacimientosPetrolíferos Fiscales (YPF) in Argentina by the Spanishfirm Repsol for US$ 15.168 billion and of Endesa andEnersis in Chile by Endesa-España for a total ofUS$ 3.55 billion� are equal to the total differencebetween FDI flows to Latin America and the Caribbeanin 1999 and in 2000. The member countries of the LatinAmerican Integration Association (LAIA) received anestimated flow of over US$ 67 billion in 2000, orsomewhat more than 90% of the FDI flows received bythe region as a whole, while the Central American andCaribbean countries accounted for around 6% of theregion's total estimated inflows.
The level of FDI flows received by the two largestmembers of LAIA � Brazil and Mexico� in 2000(which accounted for 60% of total LAIA inflows) wasmore or less than same as in earlier years. Theapproximately US$ 30 billion in FDI that went to Brazilwas heavily concentrated in the restructuring of serviceactivities, while the US$ 13 billion in FDI that enteredMexico was mainly divided between investments inmanufacturing and acquisitions in the financial sector.Argentina and Chile saw sharp decreases in FDI ascompared to 1999. Although in both of these cases part ofthe decline can be attributed to the influence that thelarge-scale transactions mentioned earlier had on flowsin 1999, there are a number of medium-term factors thathave raised doubts as to the future growth of FDI in thosecountries. FDI flows in 2000 to some Andean countries,such as Colombia and Peru, were below the averages forthe preceding years owing to recent bouts of political andeconomic instability, but Venezuela's inflows roseconsiderably as a result of major acquisitions in the
16 ECLAC

services sector. In Central America and the Caribbean,the main recipients in 1999 (estimates for the individualcountries in this subregion for 2000 are not available)were the Dominican Republic (25% of the subregionaltotal), Costa Rica (12%), Trinidad and Tobago (12%),Jamaica (10%) and Panama (10%).
From a medium-term perspective, the copiousamounts of FDI that flowed into Latin America and theCaribbean in the 1990s brought about thorough-goingchanges in the countries' and subregions'competitiveness and in the structure of industrialproperty in the region as a whole. Changes incompetition at the national or subregional level havebeen spurred by the operations of TNCs in the region andhave been strongly influenced by the business strategies
pursued by these firms in the various countries. Incountries or subregions where much of the FDI receivedin the 1990s was made up of efficiency-seekinginvestments used to integrate regional productionfacilities into larger manufacturing networks, as inMexico and the Caribbean basin, internationalcompetitiveness has increased in industries that play afairly dynamic role in world trade. On the other hand, incountries and subregions where the main focus was ontraditional natural resource-seeking activities ormanufacturing activities catering to local or subregionalmarkets, as in much of South America, FDI inflows inthe 1990s did not generate any significant improvementin international competitiveness. In both regions, asizeable and increasing share of FDI in the 1990s was
Foreign investment in Latin America and the Caribbean, 2000 17
LATIN AMERICA AND THE CARIBBEAN: NET INFLOWS OF FOREIGN DIRECTINVESTMENT, BY SUBREGION, 1990-2000
(Millions of dollars and percentages)
1990- 1999
1994a 1995 1996 1997 1998 1999 share 2000b
(%)
1. Central Americaand the Caribbean 1 406 1 984 2 106 4 212 6 112 5 351 5.7 4 500
2. Caribbean financialcentres 2 506 2 427 3 119 4 513 6 398 2 599 2.8 2 500
3. Latin AmericanIntegrationAssociation(LAIA) 14 249 27 789 41 301 61 125 66 025 85 571 91.5 67 191
Argentina 2 982 5 315 6 522 8 755 6 670 23 579 25.2 11 957Bolivia 85 393 474 731 957 1 016 1.1 695Brazil 1 703 4 859 11 200 19 650 31 913 32 659 34.9 30 250Chile 1 207 2 957 4 634 5 219 4 638 9 221 9.9 3 676Colombia 818 968 3 113 5 638 2 961 1 140 1.2 1 340Ecuador 293 470 491 625 814 690 0.7 740Mexico 5 430 9 526 9 186 12 831 11 312 11 786 12.6 12 950Paraguay 99 103 136 233 196 95 0.1 100Peru 796 2 056 3 225 1 781 1 905 1 969 2.1 1 193Uruguay … 157 137 126 164 229 0.2 180Venezuela 836 985 2 183 5 536 4 495 3 187 3.4 4 110
Total (1+2+3) 18 162 32 200 46 526 69 850 78 535 93 521 100.0 74 191Source: ECLAC, Unit on Investment and Corporate Strategies of the Division of Production, Productivity and Management, on the basis of information
provided by the International Monetary Fund (IMF); United Nations Conference on Trade and Development (UNCTAD), World Investment Report,2000. Cross-border Mergers and Acquisitions and Development, New York; and the central banks of the individual countries.
aAnnual average.
bEstimates prepared by ECLAC, Unit on Investment and Corporate Strategies of the Division of Production, Productivity and Management, on the basis of
information provided by the central banks of the individual countries.

channeled into services sectors as investors sought totake advantage of the liberalization, privatization andderegulation of these industries.
The structure of industrial property in the regionunderwent an intensive transnationalization process inthe 1990s. TNCs expanded their share of the region's 500largest firms' total sales from 27% in 1990-1992 to 43%in 1998-1999. During the same period, privately-ownedlocal firms' share of these companies' total salesremained constant, at slightly under 40%, whileState-owned enterprises saw their share shrink from 33%to 19%. The transnationalization of industrial property inthe region in the 1990s was particularly evident in themanufacturing sector. Between 1990-1992 and1998-1999, the percentage of the total sales of theregion's 100 largest manufacturers corresponding toTNCs climbed from 53% to 63%, privately-owned localfirms' share fell from 43% to 37%, and the proportionaccounted for by State-owned companies dropped from4% to just 1%. In the case of the region's 200 largestexporters, the share of those exports carried out by TNCsjumped from 29% in 1995 to 41% in 1999, whereasprivately-owned local firms saw their share slip from37% to 33% and the percentage accounted for byState-run enterprises declined from 34% in 1995 to 26%in 1999.
An analysis of the consolidated sales of the 100largest TNCs in the region shows European firms to be inthe forefront. In 1999, firms from the European Unionaccounted for 50% of regional TNC sales, those from theUnited States generated 43% of those sales, Swisscompanies had a 5% share and the rest was divided upamong Japanese, Australian and Canadian firms. As fortheir regional distribution, TNC operations were heavilyconcentrated in the three largest countries, with 34% oftheir sales being in Brazil, 30% in Mexico and 25% inArgentina. When disaggregated by industrial category,the figures show that one fourth of TNC sales were in theautomotive industry and another 50% was divided upamong five industries: electronics (11% of the total),food and beverages (11%), commerce (10%),telecommunications (10%) and petroleum (10%).Telefónica-España was the TNC with the highestconsolidated sales figure in the region in 1999, followedby the United States automaker, General Motors, andother motor vehicle manufacturers that occupied five ofthe top eight spots in the ranking. The ninth and tenthplaces were held by oil companies Repsol-YPF (Spain)and Exxon Mobil (United States), and the twelfth andthirteenth by the electrical power companiesEndesa-España and AES Corporation, respectively. Incommerce, the French firm Carrefour was in fifth place;among electronics firms, IBM, Motorola and Intel were
some of the high-ranking United States companies,while in the food and beverages category, Nestlé(Switzerland) and Unilever (United Kingdom/Netherlands) were among the leaders.
From the standpoint of the various modes ofinvestment, during the last two years the global economyhas experienced a huge wave of cross-border mergersand acquisitions. Worldwide, there was a fourfoldincrease in the sum spent on cross-border mergers andacquisitions between 1995 and 1999, when the totalreached US$ 720 billion. This upswing reflects anintensive global move to restructure production which ishighly concentrated in developed countries andindustries whose competitive parameters have beenaltered by the institutional and technological changesassociated with globalization. The steps being taken toopen up trade and investment flows and to liberalizemany industries, together with the growing degree ofcultural interchange occurring across borders, hasgenerated a trend towards market growth andstandardization that has spurred the expansion of firmsthat are striving to reduce competition in their traditionalmarkets and seek profits in new ones. The speed andstrategic nature of technological change in someindustries has also fostered the creation of hugeconglomerates capable of investing heavily in researchand development, while the digital andtelecommunications revolution has made it easier tomanage increasingly large and diversified productionunits. Consequently, at the global level, the process ofchange associated with merger and acquisition activityhas been led by highly capital or innovation-intensiveindustries, such as the automotive industry,pharmaceuticals, telecommunications, electricity orbanking, and by industries whose market power isprimarily based on marketing and distribution, such asthe food and beverage and the tobacco industries.
In quantitative terms, Latin America has been anactive participant in this process. While the extremelyimportant role played by privatization as a vehicle forforeign capital's penetration into the region was ahallmark of the second half of the 1990s, during the pasttwo years there has been a boom in mergers andacquisitions of private firms. In 1999-2000,privatizations, concessions or tenders of publicenterprises valued at over US$ 100 million each totalledUS$ 19.5 billion, of which US$ 4.7 billion correspondedto primary-sector firms and US$ 14.8 billion to theprivatization of services (no privatizations ofmanufacturing enterprises valued at over US$ 100million took place during the period under review). Thelargest privatization operations undertaken during thisperiod included the Spanish firm Repsol's purchase of
18 ECLAC
15% of Argentina's Yacimientos Petrolíferos Fiscales(YPF) in 1999 for more than US$ 2 billion, theconcession awarded in 2000 to a consortium ofArgentine, United States and Korean firms for thedevelopment of the Camisea gasfields in Peru forUS$ 1.6 billion and the acquisition by Banco SantanderCentral Hispano (BSCH) of a controlling interest inBanco de Estado de São Paulo (Banespa) in 2000 forUS$ 3.55 billion.
A large portion of the funds used for mergers andacquisitions of private firms in 1999-2000 wasconcentrated in the services sector, while the primarysector's share was somewhat smaller and themanufacturing sector's was very limited. One of thelargest operations of this type in the two-year periodunder review was "Operation Veronica", the code namegiven to a US$ 20 billion series of acquisitions in whichTelefónica España swapped its own shares for shares inits Argentine, Brazilian and Peruvian subsidiaries inorder to increase its stake in those companies to close to100%. A number of major Spanish banks were alsoactively involved in this process in the financial sectorsof Argentina, Brazil, Chile and Mexico. This last countrysaw a sweeping reorganization of foreign bankingoperations in 2000, with BSCH acquiring Grupo Serfínfor US$ 1.56 billion and Banco Bilbao ViscayaArgentaria (BBVA) putting up US$ 1.85 billion to mergeits Mexican operations with Grupo Bancomer. In theelectricity sector there were also a number of majoracquisitions (by Endesa España in Chile and by AESCorporation in Argentina, Brazil, Chile and Venezuela)during this period. Within the primary sector, a largeproportion of these funds were concentrated in a singleoperation: Repsol's 1999 acquisition of privately-heldshares in YPF for more than US$ 13 billion. In themanufacturing sector, on the other hand, the mostnotable transactions involved light industry, especiallyin the food and beverages subsector.
Thus, although in quantitative terms Latin Americahas become part of the global process of changeassociated with mergers and acquisitions in recent years,the sectoral distribution of these operations raises somedoubts as to the ultimate effects of this process on theregion's international competitiveness. This is becauseeven though the restructuring and consolidation of majorservice industries in Latin America through mergers andacquisitions can lead to an improvement in the quality ofthose services and hence boost the region's systemiccompetitiveness (although this also poses newchallenges for regional regulatory agencies), themanufacturing sector's virtual absence from this processis a cause of concern. Not only is the level of resourcesused for mergers and acquisitions in Latin America's
secondary sector much lower than it is in developedcountries, but the relatively few operations of this sortthat are carried out are also concentrated intechnologically simple industries primarily catering todomestic or subregional markets. Accordingly, in thefuture it will be important for the countries of the regionto attract TNCs and activities that can build upon theregion's potential in industries playing a more dynamicrole in international trade. This means that the individualcountries will need to set out explicitly to identify, on arealistic basis, their potential competitive advantages inthese types of industries and to design specific policiesregarding those sectors that will fit in with each nation'slarger development plans.
The Dominican Republic's recent experiences inthis regard are quite interesting. This country hasmodified its FDI policies substantially in the last fewyears in order to bring them into line with its nationaldevelopment objectives and has been receivingincreasingly abundant flows of FDI. These policymodifications have come in response both to changes inexternal conditions influencing the country and to areassessment of how the various types of foreigninvestment affect its economy. Since the 1980s,Dominican policies on export processing zones (EPZs)had attracted TNC assembly industries and, as a result,various Dominican products � particularly apparel�had established a strong position in the United Statesmarket. In the 1990s, however, the DominicanRepublic's competitiveness in these industries began towane. In response, the Dominican authorities devised anovel policy package for TNC operations aimed ataltering the structure of FDI in the country in a way thatwould boost its international competitiveness.
These changes have included an effort to promoteFDI in high-technology industries, initiatives for usingforeign investment to upgrade service infrastructure andenhance the economy's systemic competitiveness, andpolicies to encourage foreign tourism projects to usemore national inputs. In the first of these areas, thegovernment has taken the initiative and has contactedefficiency-seeking TNCs in high value-added sectors witha view to promoting investment. It is also building a"cyber park" to serve as a centre for training inengineering, electronics and robotics and industrialoperations in such areas as software, hardware, electronicsassembly, call centres, robotics and e-commerce. In aneffort to boost the economy's systemic competitiveness, aseries of legal reforms have been implemented in the lastfew years in order to clarify and streamline commercialoperations as they relate to labour issues, taxation, tariffs,customs and legal procedures, and public enterprises. A
Foreign investment in Latin America and the Caribbean, 2000 19
plan for attracting foreign funds in order to capitalize keypublic enterprises has also been developed. Theparticipation of major TNCs in capitalizationprogrammes in the electricity sector has been
particularly noteworthy. In the tourism industry, effortsto set up joint ventures involving local and foreign firmshave paved the way for new investments amounting toabout 10% of the sector's total FDI.
2. Chile
FDI played various roles in Chile during the twentiethcentury as the country passed through different stages inits history. During the liberal regime in place prior to thecrisis of the 1930s, FDI was almost wholly concentratedin mining and support services for this industry, in whichthe country had major comparative advantages. Then, inthe 1950s, as the country embarked upon animport-substituting industrialization (ISI) process, agrowing volume of FDI in manufacturing began to beadded to these more traditional investment flows. Thenationalization of large-scale mining enterprises and theagrarian reform of the 1960s and 1970s generated anenvironment that was extremely unattractive to FDI. Thepolitical and social underpinnings for this process wereswept away by the 1973 military coup, however, whichushered in a new era of economic liberalism entailingextensive market reforms and highly pro-FDI economicpolicies. The country's return to democracy in the 1990swas not accompanied by any major change in the broadlines of economic policy; what is more, it was coupledwith a positive macroeconomic performance and servedto reinforce political guarantees of the stability requiredby foreign investors.
Given these conditions, FDI flows to Chile surgedduring the 1990s, climbing from an annual average ofUS$ 720 million in 1985-1989 to over US$ 5 billionannually in 1995-1999. The buoyancy of FDI during thedecade was also marked by changes in the means of entryused by foreign investors and by new sectoraldevelopments. In the second half of the 1980s,debt-equity swaps (known as "Chapter XIX swaps"),which enjoyed large implicit subsidies, were the mostpopular investment modality. In the 1990s, on the otherhand, the rise in Chilean debt paper to near-parity levelson international secondary markets put an end to thatsubsidy and prompted investors to return to moretraditional modes of investment (DL 600). In addition,whereas in the first half of the decade investments weremainly channeled into greenfield projects, during thesecond half FDI was heavily concentrated in acquisitionsof private firms.
These differences are also related to a number ofsectoral developments. Viewed from this standpoint, the1990s can be divided into two halves. As a carryoverfrom the patterns seen in the 1980s, in 1990-1995 most ofthe TNCs that entered the country were drawn there bythe possibility of obtaining raw materials, and FDI wastherefore concentrated in activities linked to Chile'snatural resource-based comparative advantages. Miningconsequently accounted for 58% of the total, services foronly 24% and manufacturing (in many cases, naturalresource- processing industries) for 15%. These figuresshifted in the second half of the decade as the operationsof TNCs in Chile were redirected towards services as ameans of taking advantage of the domestic market'sgrowth. Thus, in this period FDI was closely linked tolarge-scale acquisitions in the electricity,telecommunications and banking sectors and topublic-utility operating concessions. During these yearsservices accounted for nearly two thirds of total FDI,mining's share shrank to 24% and manufacturing was thedestination for 10% of these investment flows. Thischange in the sectoral structure of investment also led toa change in the geographical distribution of investmentsources. In the first half of the 1990s, two thirds ofinvestment funds came from North America (UnitedStates and Canada) and only 15% from the EuropeanUnion. In 1995-1999, however, flows from NorthAmerica came to just 37% of the total, while those fromthe European Union amounted to 45%. Within Europe,the largest investor was Spain, whose large-scaleacquisitions of Chilean utilities accounted for 30% of theflows during this period.
The heavy investment in the mining sector seenduring the first half of the 1990s was attributable to thevery significant natural advantages that the country hasto offer large-scale mining concerns (especially in thecase of copper), the markedly pro-FDI laws that were inplace in Chile during the military regime, technologicaladvances in the industry and favourable marketconditions. This situation dovetailed with the expansionstrategies being pursued at the time by world-class
20 ECLAC

mining enterprises such as Phelps Dodge Corporation(United States), Placer Dome, Falconbridge and RioAlcom (Canada), Rio Tinto Zinc and Anglo American(United Kingdom) and Broken Hill Proprietary(Australia), and the combination of these factors spurredsuch firms to engage in an ambitious investment drive inthe Chilean mining sector, and especially in the copperindustry. These investments helped drive up Chileancopper production by an annual average rate of 12.3%during the 1990s, thus hiking the country's share in worldcopper output from 18% in 1990 to 30% by 1999.
Foreign investors have also taken part in a number ofother interesting developments linked to Chile's naturalresources. One case in point is the participation offoreign investors in the development of the forestrysector and the forest products industry (particularlywood pulp) in the second half of the 1980s. Largeenterprises (mainly from North America and NewZealand) used debt-equity swaps to acquire forestryassets in Chile and formed partnerships with localinvestors to develop them. This process, which led to therapid growth of the sector and its exports in the first halfof the 1990s, came to an end in the second half of thedecade as these alliances were discontinued and theforeign firms sold their shares to local corporate groups.In the fishery sector, by contrast, local investorsdominate the low value-added segments associated withfishmeal production, but foreign investors are gainingground in higher value-added segments, especially thesalmon industry. Foreign (Norwegian, Dutch andCanadian) firms invested heavily in this area of activity� which had originally been developed with the help ofstrong State support� in the 1990s and now generate40% of the country's output. The strength of this sectorduring the decade has been clearly reflected in its exportperformance, as the sector's share of total Chileanexports jumped from 1.8% in 1991 to 5.3% in 2000.
Other processing industries in which foreign firmshave been a significant factor in recent decades includethe production of fresh fruit for export and the wineindustry. Large TNCs have played a very important rolein the swift development of fresh fruit exports in the lastfew decades by linking up small and medium-scale localproducers, centralizing selection, packaging, refrigera-tion and pre-export transport, and marketing the fruitabroad. As a result, in the 1999/2000 season, the fourlargest TNCs (three based in the United States and oneItalian firm) accounted for nearly 30% of all fresh fruitexports, which in turn represent over 8% of Chile's totalexports. Chile's burgeoning wine industry has also receivedhefty foreign investments in recent years, chiefly throughpartnerships with local vineyards for the production of
relatively fine vintage wines capable of competing inhigh-end segments of the international market.
The second half of the 1990s, as noted earlier, hasbeen marked by a preponderance of foreign investmentin Chile's service industries. Unlike what occurred inother countries of the region, most of Chile's majorState-run utilities were privatized early on, in the 1980sand the beginning of the 1990s, and the development ofthese service activities was primarily carried out at a laterstage by private local investors. The recent wave offoreign investment in this sector has consequently beenheavily concentrated in private acquisitions. Thissituation is most clearly illustrated by the electricalpower industry. Most of Chile's electricity companieswere privatized in the late 1980s, and during the 1990sthey rapidly expanded their operations in the country andin the region as a whole. This expansion drive wasconducted under the guidance of private Chileaninvestors which formed conglomerates that havesubsequently maintained a major subregional presence.Then, in the last two years, these conglomerates attractedthe attention of the two main TNC players operating inthis sector within the region: Endesa España and AESCorporation of the United States. In 1999, EndesaEspaña acquired controlling stakes, in rapid succession,in Enersis and then in Endesa Chile for more thanUS$ 3.5 billion, and in 2000 AES Corporation acquiredGener for US$ 1.3 billion. Thus, the regional expansionstrategies of these major TNCs radically altered theownership structure of Chile's electricity sector in thespace of just two years.
Another service industry that has been a majorrecipient of foreign investment is telecommunications.Steps to reform this sector in Chile began early on, in the1980s, and ultimately led to the privatization of the majorState enterprises in the sector � the Empresa Nacional deTelecomunicaciones (Entel) and the Compañía deTeléfonos de Chile (CTC)� in the second half of thedecade and to the increasing involvement of foreigninvestors in their ownership and management during the1990s. Therefore, although local investors played apredominant role in the privatization of Entel, a processwhich spanned the years from 1986 to 1992, thecompany is now firmly controlled by Telecom Italia.CTC was sold to the Australian Bond Corporation in1988, but this firm's lack of experience and capacity inthe sector led it to sell its stake (slightly less than 50%) in1990 to Telefónica de España, which retains control overthe company. During the 1990s Telefónica, along withother major TNCs in the sector, used Chile as a testingground for its expansion into the rest of the region andinvested large amounts in various segments of its
Foreign investment in Latin America and the Caribbean, 2000 21
telecommunications industry over the course of thedecade. As a result, today a number of large-scaleoperators, such as Telefónica de España, Telecom Italiaand BellSouth (United States), are active in the sector.
The Chilean banking sector is another serviceindustry that has been transformed by foreign investorsin recent years. A large number of foreign banks movedinto this sector during the 1990s, including Spanishbanks such as Banco Santander and Banco CentralHispano, as well as Citibank (United States), ChaseManhattan (United States), BankBoston (United States)and the Bank of Nova Scotia (Canada) and institutionsfrom other countries. More recently, the concentration ofownership in Chile's banking industry has also beenheightened by the merger of Banco Santander and BancoCentral Hispano in Spain to form Banco SantanderCentral Hispano (BSCH). These developments illustratehow events outside the region can influence nationalindustries in today's globalized world.
The sanitation industry is yet another area of Chile'sservices sector in which foreign investors were quiteactive in the late 1990s. This industry had undergonereforms in the late 1980s and early 1990s, but it was notuntil 1998 that its regulatory system was modified to
open the door to private firms. Between 1998 and 2000 aseries of operating concessions were auctioned off toprivate (mainly foreign) enterprises for a total of overUS$ 1.6 billion.
In sum, foreign investment in Chile has been highlyconcentrated in two main areas during the last twodecades. In the 1980s and first half of the 1990s, FDI wasmainly channeled into the development of exportactivities concerned with tapping and processing naturalresources. Since that time foreign investors have steadilybeen moving into the higher value-added segments ofthese areas of activity, with the exception of mining.During the second half of the 1990s, by contrast,investment was concentrated in the acquisition of firmsin major service industries. However, the declining paceof some of the main economic activities involved inutilizing natural resources and the swiftly progressingtransnationalization of the country's services sector raiseserious doubts as to the future growth of foreigninvestment and its potential impact on the nation'sdevelopment. These concerns should be taken intoconsideration when analysing the Chilean authorities' asyet incipient efforts to attract new foreign investment inmore technologically sophisticated sectors.
3. Japan
During the twentieth century, Japan experienced aprocess of rapid development and modernization,becoming the second most important industrial power inthe world. Step by step, Japan caught up with andovertook countries whose industrialization had begunmuch earlier, often in areas in which the other countrieshad been leaders for many years. Especially worth notingwas its performance vis-à-vis the United Kingdom, in thetextile industry; the United States, in the automobileindustry and production of goods for mass consumption;and Germany, in the manufacture of industrialmachinery. Thus, this Asian country managed tospecialize in certain fast-growing sectors through aprocess of "catching up" to and assimilation of foreigntechnology and modernization at the local level whichincluded the adoption of innovative labour relations andorganizational structures supported by a platform ofhigh-quality public and educational services.
In the course of this industrialization process thattook place during the second half of the twentiethcentury, there were at least three waves of foreign direct
investment from Japan. The first was spearheaded bygeneral trading companies and was mainly gearedtowards providing the natural resources needed for localindustrialization efforts. The second wave, during the1970s, was associated with the search for foreignmarkets on the part of manufacturing companies,particularly in the electronics industry. The third wavealso involved manufacturing companies, but this timethey invested much larger sums, with a view to setting upinternationally integrated production systems organizedat the regional level, particularly in the automotiveindustry. Although Latin America and the Caribbeanreceived a substantial percentage of the relatively lowflows of Japanese FDI during the first wave ofinvestments, the region's share was not significant duringthe last two stages, in which investments wereconcentrated in North America, Asia and Europe. Thus,except for Mexico, Latin America received a very smallshare of the large amounts of FDI from Japanesemanufacturing companies during the final decades of thetwentieth century.
22 ECLAC
This situation was caused by a number of factors of apurely regional nature which acted in combination withcircumstances in other regions and with the particularway that Japanese transnational corporations operate indifferent sectors. As regards regional conditions,Japanese manufacturing investments in search ofnational markets were made at a time when manycountries in the region were beginning to realize (in thelate 1970s) that their import-substitution industrial-ization model had outrun its usefulness, or when theywere suffering the effects of the external debt crisis of the1980s. The explosion of FDI in search of efficiency, on theother hand, occurred when much of the region had openedup to international trade and this, combined with theabsence of policies to encourage manufacturing FDI, ledthe Japanese corporations to choose to supply the regionthrough exports. The case of Mexico was an exception,inasmuch as after its entry into the United States marketthrough the North American Free Trade Agreement(NAFTA), this country has often been included byJapanese manufacturing companies in their integratedNorth American production systems, particularly throughassembly operations. The rest of the region, however, hasnot played a significant role in the internationally integratedoperations of the Japanese companies. As far as otherregions are concerned, the aggressive policies adopted overthe last three decades by the Asian developing countries toattract Japanese manufacturing FDI, stand in sharp contrastwith the absence of such policies in Latin America. Thissituation is further illustrated by an analysis of world andregional FDI flows from some Japanese manufacturingindustries in recent decades.
The Japanese automobile industry is a goodexample. Although this industry generated strong FDIflows in the final decades of the twentieth century, andsome of the main Japanese auto makers have beenpresent in Latin America for a long time, thesecompanies have not shown much interest in expandingtheir regional operations or incorporating them into theirintegrated production system. Thus, although someJapanese transnational auto makers that were quiteactive in the 1990s, such as Toyota, Honda and Nissan,considerably expanded their integrated operations at theglobal level during that period, this growth wasconcentrated in the major markets of North America,Asia and Europe, with the region being practically leftout of the process. Again, the only exception wasMexico, where these companies made some investmentsin order to take advantage of the special access Mexicohas to the expanded North American market. TheJapanese auto makers that still operate in the largerMercosur countries, on the other hand, have not beenincluded in broader integrated production networks; in
fact, they have grown very little in recent years, and theystill follow the traditional approach of seeking access tolocal markets.
The Japanese electronics industry developed moreor less along the same lines as the automobile industry;during the 1990s, it became even more dependent onintegrated international production systems. As far asforeign investments are concerned, there were alsodifferences between the way Sony and MatsushitaElectric Co. operated in North America, Asia andEurope, where most production activity wasconcentrated outside of Japan, and in Latin America.Within the region, there is also a clear differencebetween Mexico, which is included in the integratedproduction systems these companies have set up forNorth America, and the rest of the region. Indeed, both ofthese companies operate large production units innorthern Mexico (mainly Tijuana) which are stronglyintegrated with the corresponding administration,production, and research and development centres in theUnited States. In the rest of the region, however, therehas been no international integration of the Japaneseelectronics industry. Both these companies supplyfinished products for export to the rest of the region fromtheir regional sales bases in Miami and Panama. Theexception to this general rule is that of the assembly unitsin free trade zones in other countries, especially Brazil,which produce for the local market.
The experience of non-manufacturing sectors withJapanese FDI in the region has been different in somerespect. A good example of the more traditional Japanesestrategy of investing in the region in search of naturalresources is that of the Mitsubishi trading company, theseventh largest in the world in terms of sales for 1999 andthe second largest in Japan. Although its operations inthe region are relatively smaller as a share of its globalinvestments, this company owns mining, oil and energyoperations which are significant from the regionalperspective, in Argentina, Brazil, Chile, Peru andMexico. Despite its size, however, it represents a bygoneperiod in terms of the international projection ofJapanese corporations, one which seems doomed todisappear. This is reflected, among other things, in thefact that its global organization is set up by functions, insharp contrast to the geographical organizational modelthat has been adopted by the more dynamic Japanesemanufacturing companies in recent decades.
In the services sector, the telecommunicationscompany NTT-DoCoMo is one of only a few Japaneseutilities that operate in the region. It will be interesting tosee if this company's recent investments in mobiletelephony in Brazil signal a new stage of greaterJapanese penetration in utilities in the region, where the
Foreign investment in Latin America and the Caribbean, 2000 23
field is currently dominated by European and UnitedStates companies. However, its minimal investment inthe region (only 1% of one company in Brazil) contrastssharply with the strong position it has gained, during thesame period, in mobile telephony in the United States,Asia and Europe. This seems to indicate thatNTT-DoCoMo is pursuing geographic priorities that aresimilar to those of the Japanese manufacturing
companies discussed earlier, for which Latin Americaclearly plays only a minor role.
The above examples would seem to support thepremise that the relative absence of Japanese FDI inLatin America and the Caribbean is due to global factors,to regional circumstances and to the particularcharacteristics and modus operandi of the Japanesecompanies themselves.
4. Telecommunications
The telecommunications industry, which until recentlywas fairly stagnant and consisted mainly of basic(fixed-line) telephone services, usually provided by asingle State-owned operator (except in the UnitedStates), has become a vibrant industry that has opened upto the dynamic digital world of broad-band technology,including the new generation of mobile cellulartelephony, the Internet and multimedia. FDI has played amajor role in the growth of this industry. During1990-2000, this growth was evident in the fact that thenumber of main lines provided increased from 520 to 920million, international traffic grew from 22 to 110 billionminutes, subscriptions to cellular telephone services rosefrom 11 to 650 million, and the Internet grew from 2.6 to285 million users. Outside the industry itself, theexpansion of the sector has had a highly positive effect,inasmuch as it has helped to improve the systemiccompetitiveness of national economies and facilitatedtheir entry into the international economy.
At the same time, the globalization oftelecommunications has also had a negative effect,especially since the risks to which the industry is exposedhave increased considerably. In fact, the situation hasbecome so serious that there is concern about thefinancial stability of the industry. Over the last year,many of the large world telecommunicationscorporations have lost half or more of their value on thestock market, their debts have increased to alarmingproportions, and there are indications that they have beenactively selling some of their assets. Two events � thehigh prices brought at auctions of new licences forthird-generation mobile cellular service in Europe andthe fact that the United States Telecommunications Act(1996) had a negative impact on long-distancecompanies and failed to bring greater competition in thefixed-line segment� which occurred at the same timethat some large firms were facing serious problems
brought to light the fact that both the authorities of thedeveloped countries and the firms themselves have notalways acted wisely. In some instances, the authoritiesthemselves have created the situation by trying to chargemaximum rates for licences; in other cases, the largecorporations are at fault, as they have sometimes riskedthe future of their own company by engaging intechnological speculation.
The globalization process reflects a long-term trendtowards a single universal market. It has three mainelements: technological change, increased competitionand transnationalization of the main economic agents.These three aspects of the globalization process areclearly reflected in the telecommunications industry.Technological change is evident in the transition towardsso-called third-generation telecommunications, whichhas facilitated the digital revolution by speeding up thetransmission of voice, data, images and video. Manylarge corporations decided to bet their future on theexpectation that their new killer applications, especiallyin mobile telephony and the Internet, would bring acommercial, financial and stock-exchange bonanzasimilar to the one created when first-generation analognetworks were replaced by second-generation digitalsystems. So far, however, this course of action has onlybrought financial instability.
With regard to the increase in competition in thetelecommunications industry, a distinction must bemade between basic telephony and mobile cellular/Internet/multimedia technology. In the case of theformer, which is still the largest, although slowest,segment of the industry, competition has increased in therecently privatized public fixed-line monopolies in twoways. While partially or totally privatizing the mainincumbents and agreeing to the formal commitments setforth in the fourth protocol to the General Agreement onTrade in Services of the World Trade Organization
24 ECLAC
(which promotes market-friendly regulation of privateenterprise and competition) are important steps in thisdirection, with very few exceptions, the incumbents stillcontrol substantial shares of the domestic market. Theseoperators have invested huge amounts of money toextend their fixed-line systems, and the increasedcompetition in long-distance services has drastically cutcosts. Mobile cellular telephony, on the other hand, hasbeen highly competitive from the beginning, since itsgrowth was not dependent upon the use of third-partynetworks as was the case with fixed-line telephony. Itappears that mobile cellular telephones will soon replacefixed-line phones as the main type of telecom-munications service. That is why proper management oflicensing systems, along with reliable and functionalregulatory institutions, will be essential to ensure that thepositive impact prevails over the negative impact ofglobalization in the field of telecommunications.
The transnationalization of major economic agentshas been particularly notable in the telecommunicationsindustry. Moreover, a new class of transnationalcorporations has been created, i.e., that of partiallyprivatized incumbents, such as Deutsche Telekom,France Telecom, Telefónica de España and Telmex deMéxico, which have begun to establish internationalnetworks of their own. The technology race andincreased competition have led to a strong move towardsconsolidation. Between 1990 and August 2000, 188mergers and acquisitions took place in the sector, withindividual price tags surpassing the US$ 1 billion markand the total figure standing at US$ 1.282 trillion. In2000, just one transaction � the purchase of the Germanfirm Mannesmann by the British firm VodafoneAirTouch� involved more than US$ 200 billion.Strategic alliances or joint ventures in specific segmentsare also significant. Thus, regional consolidations in themain markets are already taking place throughout theworld. The large North American and Europeancorporations have been the quickest to make use of theoption of setting up international systems.
The strategies of the major telecommunicationsfirms are most apparent in the way they go about settingup their international operations. There have been twowaves of FDI in telecommunications in Latin America.The first one was focused on privatizing the mainoperators of basic telephone services in countries such asArgentina, Mexico, Venezuela, Chile and Peru. In thismanner, a few European firms, such as Telefónica deEspaña and Telecom Italia, arrived on the scene. Thesecompanies began by operating fixed-line telephoneservices and then expanded their presence in athree-pronged effort: by entering other segments (such
as mobile telephones, Internet, data), purchasing theshares they did not control in the local enterprise, andentering other countries, especially Brazil. Telefónica deEspaña, for example, has grown considerably thanks toits assets purchases in Latin America over the last tenyears. Through Operation Veronica, this firm hasincreased its share in its associated companies in theregion, gaining full control of the most important firms inalmost every case, to become the largest transnationalcorporation in Latin America, in terms of overall sales.Thus, a very significant part of these firms' internationalsystems, which are not top ranked at the world level, arein Latin America.
A second wave of telecommunications FDI in theregion seems to have started with the efforts of thecorporations involved in globalization to gain a positionon the market. The entry of Vodafone in VerizonWireless (with the recently merged Bell Atlantic andGTE) seems to have brought a new rationale to GTEassets in Latin America (based on CDMA technology),particularly with the entry of Vodafone in Iusacell(Mexico), a mobile telephone company controlled byVerizon. Another example of a globalization strategythat includes Latin America is that of SBC Communi-cations, Telmex (América Móvil) and Bell CanadaInternational, which operate jointly under the name ofTelecom Américas. In fact, this firm was created in orderto integrate the separate platforms of these companies inLatin America, especially in mobile telephony, on thebasis of TDMA technology. The merger of mobilecellular assets in the United States belonging to SBC andBellSouth � owner of a broad range of digital mobiletelephone services in the region� could also lead to anassociation of its networks in the region.
Latin America's experience with the first wave ofFDI in the telecommunications industry was not entirelypositive. The priorities of the period � to maximize thesales value of privatized State assets in some cases or tobackstop a national champion in others� did notfacilitate progress in the sector as much as it might have.Buyers enjoyed long periods during which they heldexclusive rights and kept the monopolistic rents earnedfrom basic telephone services in exchange forinvestments aimed at expanding their national networks.In general, the lack of a clear vision regarding thedevelopment of telecommunications, the scantexperience of national authorities, the absence oflegislation to set up a regulatory framework for thetelecommunications sector and the absence ofindependent regulatory institutions contributed to themeagre results achieved relative to the opportunities thatwere available. The next wave of FDI in
Foreign investment in Latin America and the Caribbean, 2000 25
telecommunications offered the countries of the regionan opportunity to attain greater consistency between theobjectives of globalization-oriented corporate strategiesand of national policy in the field of mobile telephony. Inview of Brazil's success in improving the outcome ofprivatization of the Telebras system in 1998, thanks to itshaving learned from the experiences of other countries ofthe region, the governments of the Latin Americancountries would be well advised to do their homeworkbefore tackling the potential issue of licensing the newthird-generation mobile telephony services.
A sound regulatory system will, of course, play akey role in ensuring satisfactory performance of theindustry. Other countries would do well to learn from theLatin American experience, taking note of thefundamental issues involved. The authorities concernedwill need to take a modern approach and decide what
goals they want to pursue in dealing with thetelecommunications industries and set priorities, forexample, through the design of a nationaltelecommunications programme. Legislation ontelecommunications should be passed in order to ensurethat the regulatory system has a solid legal basis and thatits institutions are granted the necessary independence tofunction properly. Along the same lines, regulatorybodies must be given sufficient budgetary resources toperform their duties and hire qualified professional staffso as to guarantee the stability of the system. Contrary tothe case with basic telephone services, new types ofregulation will probably be needed for the mobiletelephone/Internet/multimedia segment of the industry.It should then be possible to maximize the positive andminimize the negative effects of globalization in thetelecommunications industry.
26 ECLAC

■
INTRODUCTION: A REGULATORY CHALLENGE
■
The ECLAC publication Foreign Investment in Latin America and the Caribbean, 1998
Report began with a reference to the very significant statistical challenge that faces
decision-makers interested in making sense out of the large but heterogeneous amount of
official information that is available on foreign direct investment (FDI). It points out that
very serious differences in methodology, accounting practices, definitions and coverage
of the principal official sources of statistical information result in a less than full
understanding of FDI as an economic phenomenon. Policy-making in this field can
become unnecessarily complex, given that the available official statistical information
does not adequately reflect the real-world situation of FDI. ECLAC feels that the efforts
made by international and national institutions to promote methodological convergence
have been very valuable; nevertheless, much remains to be done. The statistical challenge
to policy-makers is to improve official information and to supplement it with data from
other sources in order to obtain a clearer picture of what is actually involved in FDI.
Another challenge � of a normative nature� waspointed out in Foreign Investment in Latin America andthe Caribbean, 1999 Report. Policy-making by nationalauthorities with regard to FDI has been complicated bythe fact that there has been a proliferation of bilateral,plurilateral and multilateral agreements and negotiationsaimed at promoting and protecting FDI through theestablishment of basic legal norms designed to facilitateFDI flows in the context of the globalization process.
This has produced a number of asymmetries, includingthose existing among countries at different levels ofdevelopment. This, however, has created moreconfusion than clarity concerning the role of FDI innational development policy. Some governments haveclearly felt that adhering to international investmentagreements is a prerequisite for access to FDI. Whilethere is obviously a need to harmonize international rulesand norms on FDI with national legislation, it is also
Foreign investment in Latin America and the Caribbean, 2000 27
clear that this must serve the interests of bothcapital-importing and capital-exporting countries. Inother words, when concluding international investmentagreements, developing countries face a basic challenge:how to link the goal of creating an appropriate, stable,predictable and transparent foreign direct investmentpolicy framework that enables firms to meet theircorporate objectives on the one hand, with that ofretaining a margin of freedom necessary to pursue theirnational development objectives, on the other(UNCTAD, 1999a).
Interestingly, even the Multilateral Agreement onInvestment (MAI) initiative of the Organisation forEconomic Co-operation and Development (OECD) hasnot been implemented for a host of reasons, includingdifferences of opinion within this group ofcapital-exporting countries (UNCTAD, 1999b). In thisregard, the 1999 Report suggests that it would be prudentto gain a better understanding of the foreign investmentphenomenon itself and, in particular, of its relationshipwith trade and its impact on development,1 beforeembarking on sophisticated and binding multilateralinitiatives in favour of all-inclusive common rules. Thenormative challenge for policy-makers is to leave roomfor more complex FDI policies of a developmentalnature that do more than simply attract FDI from a “moreis better” perspective.
This year we would like to bring the reader’sattention to what we refer to as the regulatory challengeassociated with the surge of FDI in services. Regulationis generally associated with the prevention ofmonopolistic behaviour or with situations marked bysevere market failures. The need for regulation isglaringly evident in markets involving naturalmonopolies, as in the case of public utilities andinfrastructure, especially when such facilities areoperated by private firms. Until the 1980s, the consensusview was that the predominant actors in these sectorsshould be public enterprises operating under thesupervision of the relevant ministry. In thetelecommunications sector � a case of particular interest
in this year’s edition� this system, whereby State-runfirms were in charge of managing monopoly rents,started to break down in the 1980s as a consequence ofthe wave of revolutionary technological advances thatwas being headed up by the private sector. Thesedevelopments began to call the sector’s status as a“natural monopoly” increasingly into question asneoliberal economic thought and advocates ofprivatization began to become more and moreinfluential. In the case of the Latin American countries,there was the added complication of the external debt andits implications in terms of public enterprises’ ability tofinance their operations, all of which severely limitedtheir modernization and expansion efforts. Hence, as aresult of the privatization of State-owned assets in thepublic utilities and infrastructure sector, which wasultimately carried out in a large number of countries,regulation has taken on a fundamental role in resourceallocation in non-competitive situations.
In the latter part of the 1990s, global flows of FDIshifted heavily in favour of services in response to newstrategies being used by transnational corporations(TNCs) seeking national market access in servicesundergoing liberalization, such as telecommunications,infrastructure services (electricity generation anddistribution, gas distribution, water and sanitationservices) and financial services, among others. TheGeneral Agreement on Trade in Services (GATS)2
encouraged FDI in services through its fourth (basictelecommunications) and fifth (financial services)protocols, which established the multilateral rules fortwo of the main service sectors into which FDI flowedduring the 1990s. In this regard, GATS may be thoughtof as a framework for a multilateral promotion andprotection agreement on investment3 in services. Theprivatization of State companies, State assets or Stateconcessions was a driving force behind much of this FDI.The telecommunications industry is a good example.
Significant regulatory changes have been made inorder to increase the role of market mechanisms in thetelecommunications industry by eliminating entry
28 ECLAC
1 For an examination of the relative success of corporations and countries in using FDI to reach their goals in Latin America, see Mortimore(2000).
2 The GATS is the first set of multilaterally agreed and legally enforceable rules and disciplines ever negotiated to cover international trade inservices. It contains three central elements: a framework of general rules and disciplines (presence of the service supplier and modes of delivery,national treatment, most-favoured-nation treatment, transparency, recognition of qualifications, payments, market access schedules andprogressive liberalization); annexes addressing special conditions relating to the individual sectors covered (financial services,telecommunications and air transport services, plus one on the temporary movement of key personnel); and the national schedules of marketaccess commitments.
3 We speak of “investment” rather than “trade” because of the supreme importance of one of the four modes of supply, i.e., commercial presence(a foreign company setting up subsidiaries or branches to provide services in another country) over the others, i.e., cross-border supply (servicessupplied from one country to another); consumption abroad (consumers or firms making use of a service in another country); and presence ofnatural persons (individuals travelling from their own countries to supply services in another). See http://www.wto.org.

barriers and redefining the role of public enterprises.Such changes were implemented as early as themid-1980s in some of the main English-speakingcountries (United States, 1984; United Kingdom, 1985;Canada, 1990; and Australia, 1991) and Japan (1986),and as of 1998 in the European Union (Boyland andNicoletti, 2000; OECD, 1999a). One interesting lessonto be learned from the experience of the developedcountries is that while benefits in the form of lowerprices, improved quality and new services can beobtained relatively quickly through liberalization,changes in the market structure —specifically, reducingthe market share of existing dominant basic telephonyoperators— come about at quite a slow pace. In theEuropean Union, for example, between 1997 and 1999the change in the incumbent’s share was only from 99%to 96% (Commission of the European Communities,2000). The introduction of competition into mobiletelephony can be quite rapid; for instance, in theEuropean Union, between 1998 and 2000, the averagemobile operator’s market share fell from 65% to 50%(meaning that all competitors together then held a marketshare equal to that of the leader). It should be mentionedthat the mobile market share of the fixed-line incumbentsin most member countries of the European Union isconsiderable (in the 40%-60% range).
In the United States, the monopoly provider—AT&T— was broken up into seven Regional BellOperating Companies or “Baby Bells” in 1984, and the1996 Telecommunications Act was aimed at promotinggreater competition in local telephone service inexchange for access to long-distance service. Contrary toexpectations, the seven Baby Bells were consolidatedinto just four providers, and by 2000, new-entrantcompetitive local exchange carriers had achieved a lessthan 7% share of the principal telephone lines in thatmarket (FCC, 2000a). In the telecommunications sector,the experiences of both Europe and the United Statessuggest that it is important to distinguish betweenmarkets that are open to increased competition and theactual market structure when discussing the topic ofcompetition.
The first stage of the market liberalization process intelecommunications produced a host of new and sticky
regulatory issues. There has been an evolution from onekind of regulation in basic telephony (dealing withpricing, interconnection, tariff rebalancing, crosssubsidies, cost accounting, resale, rights of way, leasedlines, universal service needs, local loop unbundling)4 toanother kind of regulation in more competitive markets,such as mobile cellular telephony (determining spectrumallocation and the use, characteristics, number andduration of licenses, network expansion, convergence,data protection).5 However, one of the most fundamentalnew issues has to do with the establishment andoperations of the regulatory institutions themselves(OECD, May 2000). It has become increasingly clearthat having more competitive service markets does notdo away with the need for regulation, but rather that theevolution of regulatory requirements produces a need forcontinual upgrading and adaptation of the regulatoryinstitutions themselves.
Dealing with some of the world’s biggest TNCs hasnot been easy for regulators in developing countries,especially the smaller ones.6 In comparison to theirdeveloped-country counterparts, these regulators areoften poorly prepared for their new tasks in managing thetransition from State to private-sector monopolies andthen to increased competition. Moreover, the initiallymore competitive market conditions for mobile cellularcommunications require a completely different andunfamiliar set of regulations. Finally, unlike the situationin developed countries, where the sector’sreorganization did not occur until after basic servicecoverage was virtually universal in both demographicand territorial terms, regulatory agencies in developingcountries must also include the objective of attaininguniversal coverage in their restructuring plans; hence theneed to implement a more dynamic expansion anddevelopment policy in the telecommunications sector. Inother words, regulators in developing countries, whichare generally characterized as possessing weakerinstitutions, less experience and fewer resources, mustnot only carry out traditional and new regulatory dutiesbut must also square these tasks with development goals.Furthermore, in attempting to advance towards theirdevelopment goals, these regulators often findthemselves being squeezed between TNCs seeking to
Foreign investment in Latin America and the Caribbean, 2000 29
4 See, for example, Chisari and Estache (1999), Guasch and Hahn (1997), Kelly (2000a), Battiston (2000), Molano (2000), OAS (2000), Rozas(2000), Benitez et al. (2000), Boyland and Nicoletti (2000) and Xavier (2000a).
5 See, for example, Kelly (2000b), Srivastava (2000), Carrasco (2000), Staple (2000), Valente da Silva (2000), Venegas (2000) and Xavier(2000b).
6 Cable and Wireless, a UK telecommunications company with extensive interests, including in the Caribbean Basin, was faced with a new kind ofproblem in 2000. The Organization of Eastern Caribbean States threatened to evict this monopoly telecommunications provider from four otherislands if it persisted in withdrawing from St. Lucia. The Prime Minister of St. Lucia addressed the nation on this problem in February 2000(Total Telecom, 2000a).
maintain monopoly rents in basic telephony or to acquirecompetitive advantages in mobile telephony, on the onehand, and their own government as it seeks to maximizethe inflow of FDI from the sale of State assets orconcessions, on the other.
The experience of the telecommunications industryin Latin America is illustrative in this regard (see chapterIV). Latin America is the region that has bestdemonstrated that FDI inflows can be greatly increasedby privatizing incumbent national operators and openingup the telecommunications industry to foreigninvestment. Indeed, during the 1990s, FDI inflowsresulting from privatization (US$ 40 billion) and newmobile licences (US$ 10 billion) have proved that point.Fully 22 of the 89 providers of basic telephone servicethat were privatized in the world during the 1990s are inLatin America. More than two thirds of the countries ofthe region have partially or totally privatized their Statetelephone companies (ITU, 2000). Thus, Latin Americahas demonstrated that opening up thetelecommunications industry by privatizing Stateoperators can attract huge inflows of FDI.
Unfortunately, as has been noted by theInternational Telecommunications Union (ITU, 2000),the initial success of privatization led policy-makers tobelieve that the solution to all their problems was to selloff State telephone operators. Although the situation hasimproved, Latin America is still faced with the difficultfact that no more than one third of all households in theregion possess a telephone. The lack of competition andthe lax performance requirements set for monopolyoperators have caused prices to remain high. After thefirst few years following privatization, investment infixed-line networks has fallen sharply in many countries.
The first round of privatizations in thetelecommunications industry in Latin America producedsubstantial new FDI inflows from the sale ofEntel-Argentina, Entel-Peru, CANTV (Venezuela) andpart of Telmex (Mexico). In terms of value, those sales,which were carried out in the early 1990s, were some ofthe main cross-border acquisitions to take place in theLatin American telecommunications industry between1990 and 2000. The current problems stem from the factthat the long periods of exclusive operation granted toforeign investors had the effect of considerably delayingcompetition from new entrants in the market for basictelephone services and that new regulatory institutionsoften were not created until after (long after, in somecases) the privatization process was complete. Inessence, a State monopoly had been transformed into aprivate monopoly in exchange for some ratherundemanding requirements for new investment in thefixed-line network.
Fortunately, other Latin American countries havehad an opportunity to learn from the mistakes orshortcomings of the first round of privatization. Thus, ina region where many national authorities havedemonstrated a marked preference for obtaining thehighest price for State assets in the telecommunicationssector rather than a conscientious and well-thought-outtelecommunications policy aimed at achievingdevelopment goals in the sector, Brazil stands out as aninteresting exception (Herrera, 1998a). The privatizationof the Telebras system was preceded by the enactment ofthe 1997 Telecommunications Act. An interestingfeature of the new telecommunications policy in Brazilwas the decision to split the monopoly fixed-linenetwork supplier (Telebras) into more manageablepieces during the privatization exercise. Theprivatization of State assets was conducted by means ofrelatively transparent auctions. Moreover, the nationalmarket was segmented along geographic lines, bothfixed and mobile telephony were included in theprivatization process, and competitor companies wereimmediately established to ensure a minimum level ofcompetition in each area. Commitments to provideuniversal service coverage reflected national priorities.Finally, at a regulatory level, both national competition(CADE) and sectoral regulatory (ANATEL) authoritieswere set up in a simultaneous and coordinated way. Theresults were very positive both when measured by FDIinflows —for the sale of State assets and further(greenfield) investments in the modernization of thetelecommunications system— and when evaluated interms of national development goals in the sector. Thiscase provides a good example of the fact thatprivatization works better when combined with morecompetition and better regulation (Wallsten, 1999).
This learning experience has given rise tosignificant changes in the competitive situation and theregulatory framework of the early privatizers (Argentinaand Mexico) as the periods of exclusivity come to an end.It has also had an impact in other countries of the region.Trinidad and Tobago and Jamaica, for example, havedecided to shorten the period of exclusive operationgranted to the monopoly telephone service provider.Moreover, new regulators have been establishedthroughout the region: 18 of the 22 regulators operatingin Latin America in 2000 were created during the 1990s.
The regulatory challenge in Latin America, then, isto avoid the temptation to simply maximize FDI inflowsby privatizing incumbent service operators, and insteadto establish a coherent development policy for the sectorthat is aimed at simultaneously achieving corporatestrategy objectives and national policy goals. There is
30 ECLAC

ample evidence that a clear game plan with measurabletargets combined with more competition and betterregulation are essential. With regard to regulatoryframeworks, the experience of the telecommunicationsindustry has demonstrated that better results have beenobtained where the legislation on telecommunicationsestablishes “an enforceable regulatory code” (Cowhey
and Klimenko, 2000) which includes an independent andintegrated regulatory entity equipped with sufficienthuman and financial resources to get the job done.7 Thatlesson holds for other services as well. Good regulationshelp ensure that FDI inflows for basic services producetangible local benefits rather than merely a change ofownership.
Foreign investment in Latin America and the Caribbean, 2000 31
7 See Commission of the European Communities (2000) and OECD (2000). Web pages containing considerable material on regulatory issues intelecommunications include http://www.regulate.org, http://www.ahciet.net/regulac and http://www.regulatel.org.
■
I. REGIONAL PANORAMA
■
A. RECENT TRENDS IN FOREIGN DIRECT INVESTMENT INLATIN AMERICA AND THE CARIBBEAN
1. Overall foreign direct investment
One of the phenomena at the core of the current process of economic globalization is the
expansion of transnational corporations (TNCs) through foreign direct investment (FDI).
During the 1990s, the sales of TNC subsidiaries increased at a much faster rate than global
exports, and their levels of production grew from 5% of total GDP in 1982 to 10% in 1999.
FDI, which accounted for just 2% of gross fixed capital formation in 1980, represented
14% by 1999 (UNCTAD, 2000). Although the process dates from further back, FDI
growth was particularly explosive in the second half of the 1990s. In fact, according to
UNCTAD estimates, world flows of FDI in 2000 were more than US$ 1.1 trillion, which
was an increase of almost 14% with respect to 1999 and equivalent to more than three
times global FDI flows in 1995 (see figure I.1).
Foreign investment in Latin America and the Caribbean, 2000 33
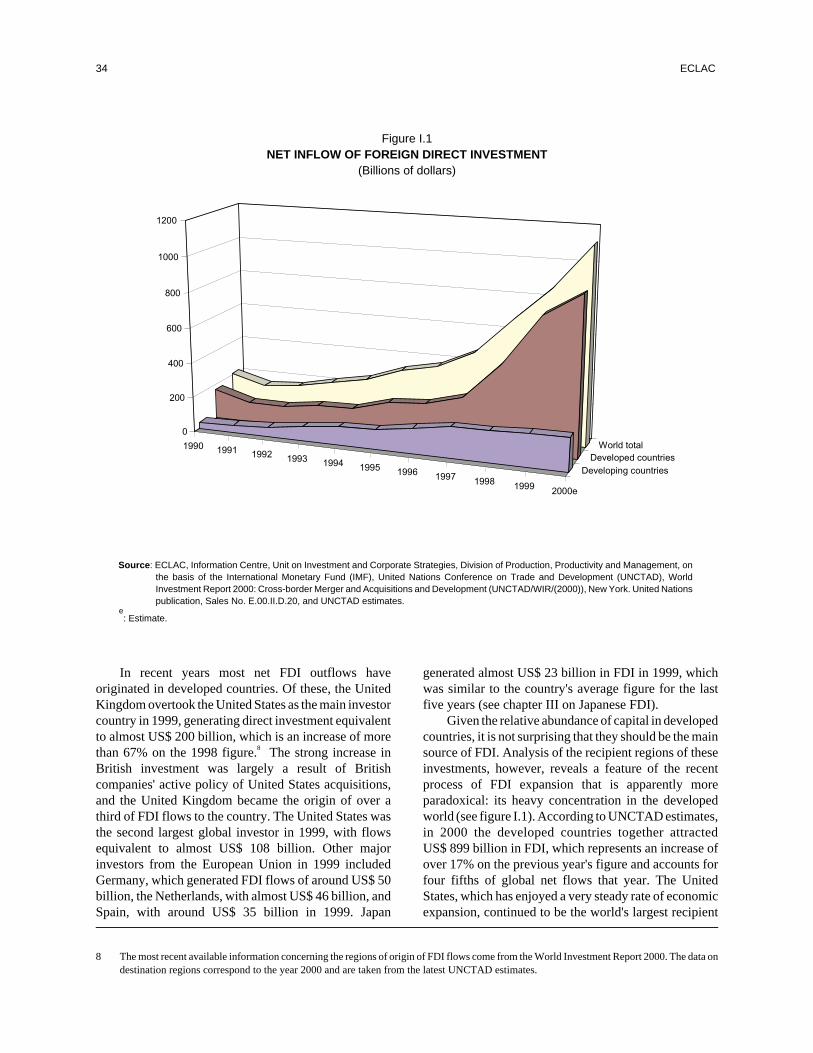
In recent years most net FDI outflows haveoriginated in developed countries. Of these, the UnitedKingdom overtook the United States as the main investorcountry in 1999, generating direct investment equivalentto almost US$ 200 billion, which is an increase of morethan 67% on the 1998 figure.8 The strong increase inBritish investment was largely a result of Britishcompanies' active policy of United States acquisitions,and the United Kingdom became the origin of over athird of FDI flows to the country. The United States wasthe second largest global investor in 1999, with flowsequivalent to almost US$ 108 billion. Other majorinvestors from the European Union in 1999 includedGermany, which generated FDI flows of around US$ 50billion, the Netherlands, with almost US$ 46 billion, andSpain, with around US$ 35 billion in 1999. Japan
generated almost US$ 23 billion in FDI in 1999, whichwas similar to the country's average figure for the lastfive years (see chapter III on Japanese FDI).
Given the relative abundance of capital in developedcountries, it is not surprising that they should be the mainsource of FDI. Analysis of the recipient regions of theseinvestments, however, reveals a feature of the recentprocess of FDI expansion that is apparently moreparadoxical: its heavy concentration in the developedworld (see figure I.1). According to UNCTAD estimates,in 2000 the developed countries together attractedUS$ 899 billion in FDI, which represents an increase ofover 17% on the previous year's figure and accounts forfour fifths of global net flows that year. The UnitedStates, which has enjoyed a very steady rate of economicexpansion, continued to be the world's largest recipient
34 ECLAC
Figure I.1NET INFLOW OF FOREIGN DIRECT INVESTMENT
(Billions of dollars)
1990 1991 19921993 1994
19951996
19971998
19992000e
Developing countries
Developed countries
World total
0
200
400
600
800
1000
1200
Source: ECLAC, Information Centre, Unit on Investment and Corporate Strategies, Division of Production, Productivity and Management, onthe basis of the International Monetary Fund (IMF), United Nations Conference on Trade and Development (UNCTAD), WorldInvestment Report 2000: Cross-border Merger and Acquisitions and Development (UNCTAD/WIR/(2000)), New York. United Nationspublication, Sales No. E.00.II.D.20, and UNCTAD estimates.
e: Estimate.
8 The most recent available information concerning the regions of origin of FDI flows come from the World Investment Report 2000. The data ondestination regions correspond to the year 2000 and are taken from the latest UNCTAD estimates.
in 2000; it was closely followed by Germany, and in bothcases, investments were estimated at around US$ 250billion. In the case of Germany, a very large proportionof FDI in 2000 is attributable to a single operation (theacquisition of Mannesmann by the British companyVodafone Air Touch for over US$ 200 billion). Otherrecipients within the European Union have also seen FDIgrow as their domestic industries have achieved greaterregional consolidation. In 2000 the United Kingdomattracted inflows estimated at over US$ 106 billion indirect investment, Belgium and Luxembourg togetherreceived flows estimated at around US$ 39 billion, andSpain and Sweden accounted for around US$ 25 billioneach. A special case within this regional block is Irelandwhich, despite its relatively small size, received inflowsof over US$ 18 billion in 1999 and US$ 14 billion in2000, which were highly concentrated in manufacturing.Japan attracted FDI inflows of almost US$ 6 billion in2000, which was a relatively small sum for the size of thecountry but high compared to historical trends.
Together, the developing countries received anestimated total of almost US$ 190 billion in directinvestment in 2000, which was similar to the 1999 figure.In 2000 the developing world thus continued the relativedecline as an FDI recipient seen in recent years: FDIflows to developing countries decreased from one thirdof the global total in 1995 to less than a fifth in 2000, andsince 1997 it has been clear that there is little hope ofclosing the gap between investments in developing anddeveloped countries (see figure I.1). There are, however,notable differences in this respect within the developingworld. At one extreme is the case of the African continentand the countries of Central Asia (former Sovietrepublics) which have recently become independent.Despite their large relative size, these regions werevirtually isolated from the process of productiveglobalization via FDI in the 1990s. In both cases foreigndirect investment is minimal in terms of the global totalsand tends to be highly concentrated in extractiveactivities and in just a few countries. In striking contrastto these regions, the developing countries of South, Eastand South-East Asia and the Latin American countriesexperienced very robust absolute growth in FDI inflowsover the last decade and together accounted for almost95% of FDI flows to all developing regions in 2000 (seefigure I.2).
With regard to developing countries in South, Eastand South-East Asia, the situation varies from one caseto another. Among the countries worst affected by theAsian crisis, Indonesia continues to suffer the effects ofthe crisis � as well as the effects of its own politicalinstability� on FDI, while Thailand recorded estimated
flows similar to its pre-crisis average. The Republic ofKorea, however, saw FDI inflows increase considerablyafter the crisis, as a result of major acquisitions of assets,with the figures soaring in both 1999 and 2000. Theregion as a whole recorded a considerable increase inFDI levels in 2000, attracting total flows of over US$ 100billion. This recent trend is also attributable in greatmeasure to the power of the People's Republic of Chinato draw flows. Excluding the Hong Kong SpecialAdministrative Region of China, the country receivedFDI inflows estimated at US$ 39 billion in 2000, whichwas similar to the average of the five preceding years. Infact, while in the first half of the 1990s Asia wascharacterized by increasing flows to the ASEANcountries, the second half of the decade was marked byFDI inflows to the People's Republic of China. Anotherinteresting feature of the regional pattern is the strongincrease in flows to the Hong Kong SpecialAdministrative Region (SAR) following its return to thePeople's Republic of China. The territory, which manyinvestors (particularly persons of Chinese origin residingoverseas) use as a stepping stone to continental China,received FDI flows estimated at over US$ 33 billion in2000, which was over three times the annual FDI averagereceived in the five-year period prior to its reversion tothe People's Republic of China.
Compared with other developing regions, recentdirect investment trends in Latin America also lookpromising. In fact, over the last decade FDI inflows to theregion grew significantly, not only in absolute terms butalso relative to the rest of the developing world, with theregion's share of total FDI flows to developing countriesgrowing from 29% in 1995 to 37% in 2000. Thiscomparison, however, does not hold true for the region'sshare of total world FDI flows. Given the tendencies ofrecent flows to be concentrated in the developed world,as discussed earlier, the region's share in global flowsplunged in 2000: FDI flows to Latin Americarepresented 11% of global flows on average in the period1995-1999, but in 2000 accounted for barely 6%. From aquantitative perspective, this would seem to indicatethat, despite the recent strong flows of FDI to the region,Latin America is participating less actively in the globalprocess of productive integration than in recent years.Even so, the potential benefits of this process are alsovery sensitive to the way in which different countries andregions participate in the world economy. The followingsection provides a detailed analysis of the situation inLatin America in 2000, mainly from a quantitativestandpoint, while later sections will analyse the processof global productive integration in depth and study theregion's involvement in this process.
Foreign investment in Latin America and the Caribbean, 2000 35

2. Foreign direct investment in Latin America and the Caribbean:recent inflows and trends
After tripling between 1994 and 1999 and successfullysurmounting the financial crisis of the late 1990s, annualinflows of foreign direct investment to Latin Americaand the Caribbean changed somewhat during the firstyear of the new decade. Estimated FDI inflows to theregion amounted to little more than US$ 74 billion in2000, which is a fall of more than 20% from the figure ofover US$ 93 billion in FDI entering the region in 1999.From a medium-term perspective, however, this annualresult should not necessarily be interpreted as a setbackto the process of FDI expansion seen in recent years.Despite the annual fall, the flows which are estimated tohave entered the region in 2000 more than tripled theaverage annual flows of the 1990-1994 period (see table
I.1) and were almost 16% higher than the average annualinflows recorded during the second half of the decade.The decrease between the 1999 and 2000 figures is alsolargely a response to one-off elements from which realtrends cannot reliably be read. Thus, if the resourcesfrom three extraordinary operations � the acquisition ofYPF in Argentina by the Spanish firm Repsol forUS$ 15.168 billion and the acquisition of Endesa andEnersis in Chile by Endesa España for a total of US$3.55billion (see chapter II)� are subtracted from the totalfigure for 1999, then there is almost no difference inregional FDI between 1999 and 2000. As shown in tableI.1, however, the regionwide situation masks somesubstantial differences between subregions.
36 ECLAC
Figure I.2NET INFLOW OF FOREIGN DIRECT INVESTMENT
(Billions of dollars)
19901991
19921993
19941995
19961997
19981999
2000e
L. America and the Caribbean
Developing Asian countries
Developing countries
0
20
40
60
80
100
120
140
160
180
200
Source: ECLAC, Information Centre, Unit on Investment and Corporate Strategies, Division of Production, Productivity and Management, on thebasis of the International Monetary Fund (IMF), United Nations Conference on Trade and Development (UNCTAD), World InvestmentReport 2000: Cross-border Merger and Acquisitions and Development (UNCTAD/WIR/(2000)), New York. United Nations publication,Sales No. E.00.II.D.20, and UNCTAD estimates.
e: Estimate.

(a) FDI in LAIA countries
In 2000, the distribution of FDI flows to LAIA9
were very favourable to Brazil and Mexico, whichtogether accounted for almost two thirds of the total. Thesubstantial share of the two largest countries in 2000marks a major change with respect to the last five years ofthe 1990s, in which average flows to these two countrieswere barely more than half the subregional total. Theobvious counterpart to this increase in the FDI share ofthe two largest LAIA countries is a fall in the relativeparticipation of the rest of the South American countriesin the regional total. The countries of the AndeanCommunity (Bolivia, Colombia, Ecuador, Peru andVenezuela) reduced their share in total FDI flows toLAIA members from an average of 18% during thesecond half of the 1990s to around 12% in 2000. Theother South American countries (Argentina, Chile,Paraguay and Uruguay) also saw their share of total FDIflows to LAIA fall, from 28% on average in the period1995-1999 to around 25% in 2000. These changes inregional distribution during the first year of the new
decade respond to national and subregional phenomenawhich will be discussed below.
(i) Mexico: manufactures remain stable andservices receive new inflows
TNC activity in the Mexican economy grew verysignificantly during the 1990s (see ECLAC, 2000a,chapter II); this was reflected in a considerableexpansion of FDI flows into the country. Although anexact comparison cannot be drawn, owing to changes inthe methodology used to record flows, when the averageyearly flows of the 1980s are used as a base, it becomesapparent that FDI flows to Mexico more than quadrupledbetween 1995 and 1999, to over US$ 10.5 billion peryear on average. Another characteristic of inflows overthis period was their relative stability. Thus, unlike thesituation in other countries in the region, the level ofyearly inflows to Mexico remained very stable in theperiod 1995-1999, not varying more than 20% in anysingle year. ECLAC estimates suggest that this trend wascarried over into 2000, with flows of some US$ 13 billion
Foreign investment in Latin America and the Caribbean, 2000 37
Table I.1LATIN AMERICA AND THE CARIBBEAN: NET INFLOW OF FOREIGN DIRECT
INVESTMENT, BY SUBREGION, 1990-2000(Millions of dollars)
1990- 1995 1996 1997 1998 1999 1995- 2000e
1994a 1999a
1. ALADI 14 250 27 789 41 301 61 125 66 025 85 571 56 362 67 191(Brazil) 1 703 4 859 11 200 19 650 31 913 32 659 20 056 30 250(Mexico) 5 430 9 526 9 186 12 831 11 312 11 786 10 928 12 950
2. Central America andthe Caribbean 1 406 1 984 2 106 4 212 6 112 5 351 3 953 4 500
3. Financial centres 2 506 2 427 3 119 4 513 6 398 2 599 3 811 2 500
Total 18 162 32 200 46 526 69 850 78 535 93 521 64 126 74 191Source: ECLAC, Information Centre, Unit on Investment and Corporate Strategies, Division of Production, Productivity and Management, on the basis of the
International Monetary Fund (IMF), United Nations Conference on Trade and Development (UNCTAD), World Investment Report 2000:Cross-border Merger and Acquisitions and Development (UNCTAD/WIR/(2000)), New York. United Nations publication, Sales No. E.00.II.D.20,and the central banks of each country.
aAnnual average.
eEstimates of the ECLAC Unit on Investment and Corporate Strategies, on the basis of information provided by the central bank of each country.
9 LAIA (Latin American Integration Association) is made up of Argentina, Brazil, Bolivia, Colombia, Chile, Cuba, Ecuador, Paraguay, Peru,Mexico, Uruguay and Venezuela. Given the lack of statistics for Cuba that are comparable to the rest of the countries, Cuba is not included in theLAIA references in this section.
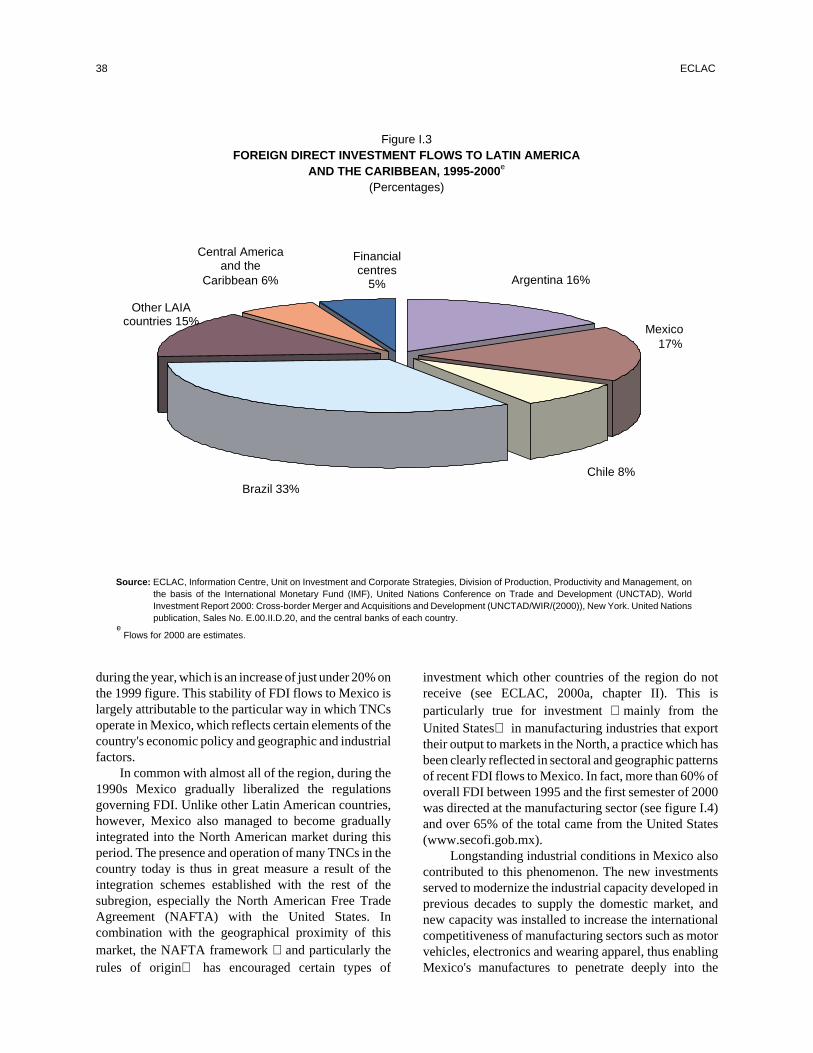
during the year, which is an increase of just under 20% onthe 1999 figure. This stability of FDI flows to Mexico islargely attributable to the particular way in which TNCsoperate in Mexico, which reflects certain elements of thecountry's economic policy and geographic and industrialfactors.
In common with almost all of the region, during the1990s Mexico gradually liberalized the regulationsgoverning FDI. Unlike other Latin American countries,however, Mexico also managed to become graduallyintegrated into the North American market during thisperiod. The presence and operation of many TNCs in thecountry today is thus in great measure a result of theintegration schemes established with the rest of thesubregion, especially the North American Free TradeAgreement (NAFTA) with the United States. Incombination with the geographical proximity of thismarket, the NAFTA framework � and particularly therules of origin� has encouraged certain types of
investment which other countries of the region do notreceive (see ECLAC, 2000a, chapter II). This isparticularly true for investment � mainly from theUnited States� in manufacturing industries that exporttheir output to markets in the North, a practice which hasbeen clearly reflected in sectoral and geographic patternsof recent FDI flows to Mexico. In fact, more than 60% ofoverall FDI between 1995 and the first semester of 2000was directed at the manufacturing sector (see figure I.4)and over 65% of the total came from the United States(www.secofi.gob.mx).
Longstanding industrial conditions in Mexico alsocontributed to this phenomenon. The new investmentsserved to modernize the industrial capacity developed inprevious decades to supply the domestic market, andnew capacity was installed to increase the internationalcompetitiveness of manufacturing sectors such as motorvehicles, electronics and wearing apparel, thus enablingMexico's manufactures to penetrate deeply into the
38 ECLAC
Figure I.3FOREIGN DIRECT INVESTMENT FLOWS TO LATIN AMERICA
AND THE CARIBBEAN, 1995-2000e
(Percentages)
Source: ECLAC, Information Centre, Unit on Investment and Corporate Strategies, Division of Production, Productivity and Management, onthe basis of the International Monetary Fund (IMF), United Nations Conference on Trade and Development (UNCTAD), WorldInvestment Report 2000: Cross-border Merger and Acquisitions and Development (UNCTAD/WIR/(2000)), New York. United Nationspublication, Sales No. E.00.II.D.20, and the central banks of each country.
eFlows for 2000 are estimates.
Brazil 33%Chile 8%
Mexico17%
Argentina 16%
Financialcentres
5%
Central Americaand the
Caribbean 6%
Other LAIAcountries 15%
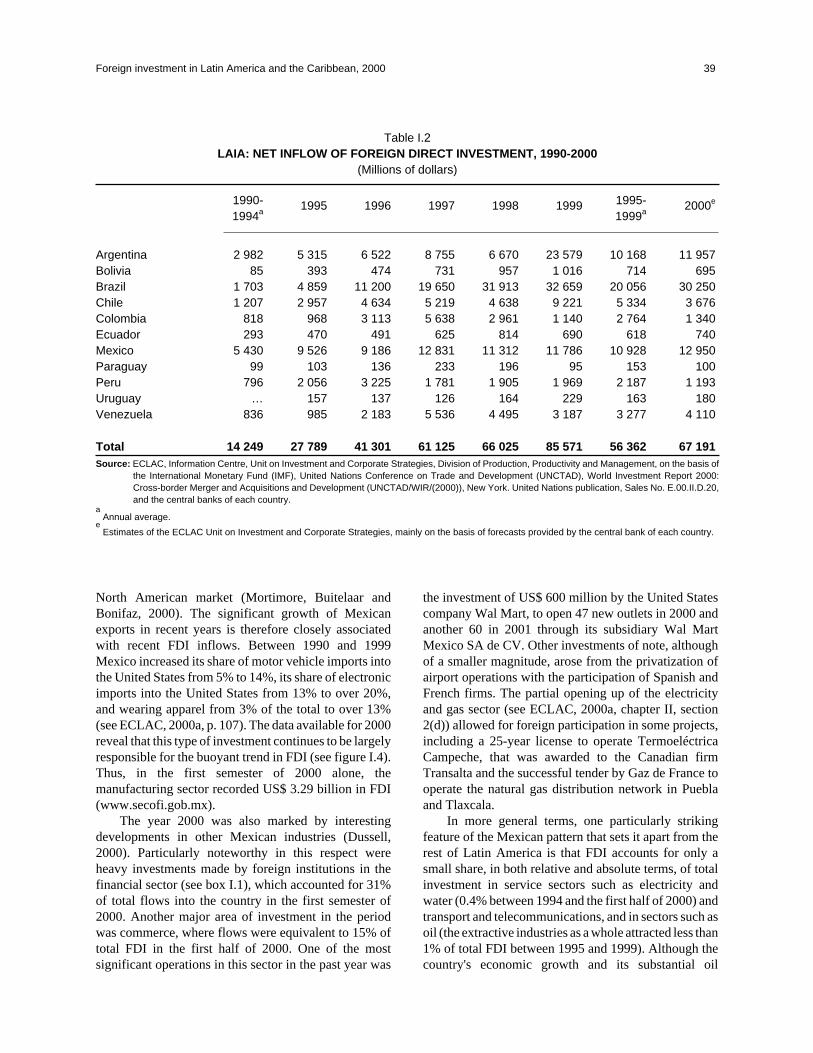
North American market (Mortimore, Buitelaar andBonifaz, 2000). The significant growth of Mexicanexports in recent years is therefore closely associatedwith recent FDI inflows. Between 1990 and 1999Mexico increased its share of motor vehicle imports intothe United States from 5% to 14%, its share of electronicimports into the United States from 13% to over 20%,and wearing apparel from 3% of the total to over 13%(see ECLAC, 2000a, p. 107). The data available for 2000reveal that this type of investment continues to be largelyresponsible for the buoyant trend in FDI (see figure I.4).Thus, in the first semester of 2000 alone, themanufacturing sector recorded US$ 3.29 billion in FDI(www.secofi.gob.mx).
The year 2000 was also marked by interestingdevelopments in other Mexican industries (Dussell,2000). Particularly noteworthy in this respect wereheavy investments made by foreign institutions in thefinancial sector (see box I.1), which accounted for 31%of total flows into the country in the first semester of2000. Another major area of investment in the periodwas commerce, where flows were equivalent to 15% oftotal FDI in the first half of 2000. One of the mostsignificant operations in this sector in the past year was
the investment of US$ 600 million by the United Statescompany Wal Mart, to open 47 new outlets in 2000 andanother 60 in 2001 through its subsidiary Wal MartMexico SA de CV. Other investments of note, althoughof a smaller magnitude, arose from the privatization ofairport operations with the participation of Spanish andFrench firms. The partial opening up of the electricityand gas sector (see ECLAC, 2000a, chapter II, section2(d)) allowed for foreign participation in some projects,including a 25-year license to operate TermoeléctricaCampeche, that was awarded to the Canadian firmTransalta and the successful tender by Gaz de France tooperate the natural gas distribution network in Pueblaand Tlaxcala.
In more general terms, one particularly strikingfeature of the Mexican pattern that sets it apart from therest of Latin America is that FDI accounts for only asmall share, in both relative and absolute terms, of totalinvestment in service sectors such as electricity andwater (0.4% between 1994 and the first half of 2000) andtransport and telecommunications, and in sectors such asoil (the extractive industries as a whole attracted less than1% of total FDI between 1995 and 1999). Although thecountry's economic growth and its substantial oil
Foreign investment in Latin America and the Caribbean, 2000 39
Table I.2LAIA: NET INFLOW OF FOREIGN DIRECT INVESTMENT, 1990-2000
(Millions of dollars)
1990- 1995 1996 1997 1998 1999 1995- 2000e
1994a 1999a
Argentina 2 982 5 315 6 522 8 755 6 670 23 579 10 168 11 957Bolivia 85 393 474 731 957 1 016 714 695Brazil 1 703 4 859 11 200 19 650 31 913 32 659 20 056 30 250Chile 1 207 2 957 4 634 5 219 4 638 9 221 5 334 3 676Colombia 818 968 3 113 5 638 2 961 1 140 2 764 1 340Ecuador 293 470 491 625 814 690 618 740Mexico 5 430 9 526 9 186 12 831 11 312 11 786 10 928 12 950Paraguay 99 103 136 233 196 95 153 100Peru 796 2 056 3 225 1 781 1 905 1 969 2 187 1 193Uruguay … 157 137 126 164 229 163 180Venezuela 836 985 2 183 5 536 4 495 3 187 3 277 4 110
Total 14 249 27 789 41 301 61 125 66 025 85 571 56 362 67 191Source: ECLAC, Information Centre, Unit on Investment and Corporate Strategies, Division of Production, Productivity and Management, on the basis of
the International Monetary Fund (IMF), United Nations Conference on Trade and Development (UNCTAD), World Investment Report 2000:Cross-border Merger and Acquisitions and Development (UNCTAD/WIR/(2000)), New York. United Nations publication, Sales No. E.00.II.D.20,and the central banks of each country.
aAnnual average.
eEstimates of the ECLAC Unit on Investment and Corporate Strategies, mainly on the basis of forecasts provided by the central bank of each country.

40 ECLAC
Figure I.4FOREIGN DIRECT INVESTMENT IN MEXICO, BY SECTOR,
1995-1999 AND FIRST SEMESTER 2000(Percentages)
1995-1999:
First
Source: ECLAC, Information Centre of the Unit on Investment and Corporate Strategies, Division of Production, Productivity and Management, onthe basis of official information.
Manufacturing 61%
Financialservices
13%
Other industries14%
Commerce12%
Manufacturing 46%Other
industries7%Commerce
16%
Financial services 31%

Foreign investment in Latin America and the Caribbean, 2000 41
Banco Santander and BancoCentral Hispano merged in 1999to form Banco Santander CentralHispano (BSCH), creating one ofthe largest banking institutions inEurope. With a very solid financialbase, the newly-established BSCHconsolidated the assets that thetwo banks had each acquiredseparately in Latin America to forman extensive regional network. InOctober of the same year BancoBilbao y Vizcaya and BancoArgentaria merged to form BancoBilbao y Vizcaya-Argentaria(BBVA), to generate a financialinstitution that was Spain's secondlargest and which yieldedconsiderable financial sway. Thelarger institutions resulting fromthese mergers have competedvigorously over the last two yearsfor banking assets in Brazil andMexico, as the industries of bothcountries undergo very rapidprocesses of change.Consequently, almost 80% of theresources involved in bankingmergers and acquisitions andprivatizations in Latin America inthe biennium 1999-2000 wereconcentrated in those twocountries, with a sizeable sharegoing to Spanish institutions. InBrazil the most noteworthytransaction was the acquisition byBSCH of control of Banespa (seebox I.3). The most significantchanges of the last year, however,took place in Mexico.In fact, last year the main Spanishbanking institutions gained majorshares of the traditionally closedMexican banking industry. Theirentry was also facilitated byfar-reaching changes in Mexico. Inparticular, the effects of thefinancial crisis of 1994 and thesubsequent regulatory changeswere fundamental in creating theconditions which made the entry offoreign banking institutionspossible. In order to understandthe transformation currentlyunderway, it is thus necessary to
briefly review its origins. In thewake of the Mexican currencycrisis the banks —which hadraised their levels of activityconsiderably in previous years—found that the economic situationand unfavourable legislationprevented them from recovering alarge proportion of their creditportfolios. This seriouslyjeopardized their continuedoperation, with effects whichreverberated throughout theeconomy. This phenomenon wasreflected in a sharp contraction ofcredit and steep interest ratehikes; after more than five yearsthe situation has still not returnedto normal. According to data fromthe Mexican Central Bank,commercial bank credit to theprivate sector in July 2000 was12% lower than in July 1999 and70% lower than in 1994. Inaddition, the lending rate in July2000 was seven times higher thanthe United States rate (Expansión,2000a and b).Given the severity of the crisis, theauthorities intervened in some ofthe beleaguered institutions andmade regulatory changesdesigned to allow foreigninstitutions to participate in thecapitalization of the industry.During the first stage, from 1995on, the operations of foreigninstitutions involved purchasingstock in seriously undercapitalizedsmall and medium-sized Mexicanbanks. These operations gatheredstrength from 1996 onward, as theauthorities relaxed the restrictiveregulations on foreign ownershipin the industry. During this stage,which lasted until 1998, BancoBilbao y Vizcaya, BancoSantander and Banco CentralHispano entered the Mexicanmarket along with other institutionssuch as Banco Comercial dePortugal, the Canadian Bank ofNova Scotia and Bank of Montreal,the British Hong Kong andShanghai Banking Corporation
(HSBC), and the United Statesfirm J.P. Morgan. As a result, thelevels of borrowing and loanplacements by foreign banksincreased more than 50-foldbetween 1994 and 1998 (Dussel,2000).A second and deeper stage in thisprocess began in January 1999,when the remaining restrictions onforeign capital stock in bankingwere lifted. Thus, although 1999did not see any major newtransactions involving foreigncapital, the process gatheredmomentum in 2000, when bothBSCH and BBVA significantlyincreased their presence inMexican industry with majoroperations involving over US$ 1.5billion apiece. The first of thesemegaoperations was set in train atthe end of 1999, when the Institutode Protección del Ahorro Bancario(IPAB) initiated the sale of GrupoFinanciero Serfin. IPAB hadgained control of Serfin shares inJune 1999, to safeguard theresources of savers who haddeposits in the institution, whichfaced a very difficult financialsituation. IPAB separated thenon-performing and current loansportfolio (which was soldseparately at 25% of its nominalvalue) from the institution's overallportfolio, and put the rest ofSerfin's assets up for sale,establishing certain conditionsrelating to the economic andtechnical capacity of potentialbuyers. Initial expressions ofinterest were received from BSCH(through Banco SantanderMexicano), HSBC Bank USA,Citicorp and Grupo FinancieroBanamex-Accival. The processconcluded in May 2000, whenBSCH acquired 100% of theSerfin stock at a cost of US$ 1.56billion.The second major operation tookplace a month later, in June 2000,when Bancomer accepted amerger proposal from BBVA. Inthis operation the Spanish bank
Box I.1SPANISH BANKING COMES ASHORE IN MEXICO
42 ECLAC
put up US$ 1.4 billion in cash, toacquire almost a third of theBancomer stock, and committed afurther US$ 450 million incapitalization bonds, to reach atotal capital input of US$ 1.85billion. The Bancomer grouphad recently concluded anagreement to purchase BancoPromex fromIPAB for a sum of US$ 209million, and thus added thePromex assets to the merger. Theresulting institution, GrupoFinanciero BBVA Bancomer,became the leader of the Mexicanmarket with total assetsequivalent to morethan a quarter of the industrytotal. BBVA became responsiblefor the operational managementof the new institution, but theownership remains quite diluted,with 32.2% held by BBVA (whichhas announced its intention toextend its stake to 40%), while16.4% belongs to the formercontrolling group Bancomer,10.5% to the Government, 10.5%is on the domestic market, asimilar proportion on theinternational market, and 10.8% isheld by the Bank of Montreal,which has indicated an interest inselling its share.The two large Spanish playersface quite dissimilar situations inthe wake of the megaoperations inwhich they were involved. BBVAbegan its association withBancomer aggressively, proposingto double profits within three yearsby means of an intensiveprogramme of asset streamliningand expansion in the pensions andelectronic commerce areas. Inaddition, it has embarked upon apowerful expansion strategy in theUnited States Hispanic market;this area of business began inSeptember 2000 with the openingof branches in Texas and is
ultimately expected to provide15% of total profits. The initialwork of BSCH, in contrast, is torepair the image of Serfin, whichlost a lot of prestige as a result ofthe crisis. BSCH will also need toinvest intensively in expanding itscoverage of branches, staff andproducts to avoid being left behindin the developing competitivemarket.Two trends which emerged fromrecent operations thus seem to beestablished for the coming years.One is the clear trend towards thetransnationalization of bankingcapital. The second, whichevidently goes hand in hand withthe first, is the consolidation of theindustry to form a few large, highlycapitalized institutions which haveaccess to external financing andare able to meet the cost ofmaintaining a modern platform fordifferent dimensions of thebanking business. In this context,small and medium-sized domesticinstitutions that do not link up witheach other or with transnationalbanks will certainly tend to beabsorbed. The role that might beplayed by other foreigninstitutions present in Mexico,such as Citibank or J.P Morgan,or other new foreign entrants, isstill not clear. In this regard,United States banks have aremarkably low profile in whatcould be considered to be one oftheir natural markets, given thegeographical proximity and thelinks generated between the twoeconomies by NAFTA. It is alsonot easy to determine what theultimate effects of thisrestructuring will be, in terms of itswider impact on the economy. Inthe short term, the injection of FDIcapital has brought majorbenefits, by buttressing thesystem as a whole. In the case ofBancomer, for example, the
capital injected by the merger withBBVA meant that the newinstitution was able to meet Baselcapital-adequacy requirementstoward the end of the year, with a12.4% capital base. The creditoutlook for the country, however,is more complex. Althoughincreased competition has made itpossible to liberalize and graduallyreactivate consumer credit, creditto production sectors hascontinued to stagnate and interestrates remain very high.This is an issue of concern for thefuture. The authorities investedalmost US$ 100 billion torehabilitate the banking industryduring the second half of the1990s, and the economic andstructural difficulties whichoriginally generated the creditshrinkage have now been fully orlargely resolved. Themacroeconomic framework isadequate and has displayedreasonable growth over recentyears, inflation is falling, thebanking sector is in great measurefinancially sound, a newbankruptcy law guarantees thatinstitutions can recover their loansby legal means if necessary, andthe industry has been liberalizedin terms of the ownership ofinstitutions. The crucial question iswhether, in this context, thebanking industry will be able toadequately meet the financingneeds of the country's productionsectors. This entails expandingvolumes of credit and reducinginterest rates to a level closer tothe industry's borrowing rate, inother words, the internationalrates or the interest rate ondeposits. If this does not happensoon there will be legitimateconcern about the benefits for thecountry of recent foreigninvestment in banking.
Box I.1 (concluded)

reserves would suggest that it is in an excellent position,in terms of natural and economic advantages, for foreigninvolvement in these industries, certain institutionalrestrictions are in force: either the industry remainslargely in the public sector or the foreign share in it islimited. In telecommunications, with the exception ofcellular telephony, foreign participation is restricted bylaw to 49% of the total, and TELMEX, the former Statecompany, maintains almost a monopoly over localservice and controls the interconnection infrastructure(see ECLAC, 2000a, chapter II, section 2(b) and boxIV.3 herein). The State is the main player in theelectricity and oil sectors, through the NationalElectricity Council (CNE) and Petróleos de Mexico(PEMEX), respectively. Thus, although construction ofnew generating capacity has been opened up somewhatand there are plans for major investments, the ownershipstructure of the established industry shows no sign ofimminent change. President Vicente Fox confirmed thispolicy in his inaugural speech of 1 December 2000,ruling out the privatization of PEMEX or CNE during histerm in office.
In 2000 FDI flows to Mexico thus maintained thetrends of the 1990s, with some variations in the servicessector. Manufacturing continued to enjoy the buoyancyof recent years, with investments being made in theautomobile, electronics and clothing industries; inservices, investments in the financial sector roseconsiderably, and large investments were made incommerce. Despite some recent major transactions in theservices sector, telecommunications and electricityremain largely under Mexican control, as does the oilindustry. The departure of the InstitutionalRevolutionary Party (PRI) from office and the entry ofPresident Fox are unlikely to presage changes in FDItrends or investment patterns.
(ii) Brazil: restructuring privatized sectors andnew investments in services
Brazil's FDI inflows expanded rapidly in the secondhalf of the 1990s, boosted by the success of thestabilization policy embodied in the Real Plan, theeconomic liberalization programmes, the regionalintegration policies and extensive privatizations. Thus,in defiance of the crisis which led to the devaluation ofthe real at the beginning of 1999, flows to the SouthAmerican giant grew from an average of less than US$ 2billion in the period 1990-1994 to over US$ 30 billion inthe last two years of the decade. ECLAC estimates alsoindicate that this growth carried over unaltered into2000, when FDI flows of around US$ 30 billion wererecorded again, making Brazil the largest recipient of
FDI in Latin America and the Caribbean for the fifthconsecutive year, with 45% of total flows to LAIA in2000.
The sustained volume of foreign direct investmentin Brazil in 2000 does not mean, however, that thepatterns of investment in the country have been similar toprevious years. On the contrary, inflows in 2000displayed interesting new features. In terms of themodality of investment, 2000 brought a markedslowdown in the privatization process. In 1999 almost30% of FDI flows (US$ 8.786 billion) were directlylinked to different privatization processes (US$ 6.659billion in the telecommunications industry, US$ 1.106billion in the gas industry and US$ 1.02 billion in theelectricity industry). In 2000, however, only 12% of totalFDI income reported in the first ten months of the yearwas directed at the purchase of State assets (US$ 2.033billion in telecommunications, US$ 295 million in gasand US$ 693 million in electricity). According to theCentral Bank of Brazil, the remainder of FDI betweenJanuary and October 2000 � over US$ 22 billion� wasdirected at non-privatization investment.
The increase in the proportion of FDI not linked toprivatizations does not imply, however, that FDI in 2000returned to the sectoral patterns observed before thisprocess began, when a large share of FDI went tomanufacturing activities (in 1995, 55% of FDI stock wasconcentrated in manufacturing). On the contrary,although not directly linked to the privatization process,more than three quarters of total FDI flows in the first tenmonths of 2000 were destined for the services sector, andjust 24% for manufacturing (see figure I.5). Within thissector, the distribution by industrial activity over the lasttwo years shows a decrease in flows to the manufacturingindustries that have traditionally been most closelyassociated with foreign capital. Thus, for example, themotor vehicle and car parts industry as a whole, whichattracted heavy investments at the beginning of the1990s, reduced its share in non-privatization FDI flowsfrom 12% in 1999 to 5% in 2000. Among themanufacturing industries that have traditionally attractedFDI, only the chemical and pharmaceutical industryreceived sums of over US$ 1 billion in the first tenmonths of 2000.
The strength of FDI inflows in 2000 thus appears tohave been based on relatively new phenomena within theservices sector, which (disregarding flows linked toprivatizations) attracted almost two thirds of total FDI inthe first ten months of the year. In fact, the data from thesector and information on major operations in 2000 seemto indicate a dynamic process of restructuring andconsolidation in industries that have recently been
Foreign investment in Latin America and the Caribbean, 2000 43

privatized or liberalized. Thus, the aggregate data oninvestment for January to October 2000 show directinvestment inflows worth US$ 6.703 billion to thetelecommunications sector, FDI inflow of US$ 2.803billion to the financial sector and flows of US$ 1.876billion to electricity and gas utilities (see figure I.5).These resources have been directed at both assetsacquisitions by major players, to enable them to increaseor consolidate their presence in different segments ofthese industries, and at investments to broaden andmodernize the operation of recently acquired companies,either through privatization or private-sectoracquisitions.
The most noteworthy transaction in thetelecommunications sector in 2000 was the purchase byTelefónica España of minority stakes in Telesp SA andTele Sudeste Celular (now part of Telefónica Brazil) inthe context of what was known as "Operation Veronica",by which shares were cashed in for US$ 10.423 billionand US$ 2.419 billion, respectively (see chapter IV).This operation was followed, in terms of the amountinvolved, by transactions of over US$ 1 billion throughwhich Portugal Telecom acquired shares in Telesp
Celular (US$ 756 million) and the purchase by theUnited States firm Velocom of a third share of Vesper(US$ 875 million). Telecom Italia, Bell South andAmerican Telephone and Telegraph, were among thetransnational corporations involved in majortransactions in the communications sector in 2000. Thebanking sector saw the privatization of Banespa, whichwas bought by BSCH in November 2000 for US$ 3.55billion (see box I.3), a sum five times higher than its bookvalue, and the purchase of Conglomerado FinancieroMeridional, also by BSCH, for close to US$ 1 billion.Other transactions involved purchases by the UnitedStates firm Chase Manhattan Bank and the Spanishcompany Caja de Ahorros La Caixa.
The main operations in the electricity sectorinvolved the United States firm AES, which increased itsstake in Eletricidade Metropolitana de São Paulo at a costof US$ 1.085 billion (see box I.2), the purchase of a largeshare in Light Serviços de Eletricidade by Electricité deFrance for US$ 628 million and the acquisition byEletricidade de Portugal of ES Centrais Elétricas forUS$ 535 million. Also in the energy area, the BrazilianState-owned oil company Petrobrás continued its recent
44 ECLAC
Figure I.5FOREIGN DIRECT INVESTMENT IN BRAZIL, BY SECTOR,
JANUARY-OCTOBER 2000(Percentages)
Source: ECLAC, Information Centre of the Unit on Investment and Corporate Strategies, Division of Production, Productivity and Management,on the basis of official information.
Telecommunications 33%
Manufacturing24%
Other 7%
Commerce 7%
Internet5%
Electricity,gas and water9%
Financial services 14%
Foreign investment in Latin America and the Caribbean, 2000 45
Mergers and acquisitions in theLatin American —and particularlyBrazilian— electricity sector reflecta far-reaching process ofrestructuring at the global andregional levels. As in otherindustries, this phenomenon canbe explained at both levels by anumber of factors relating toeconomic policy, technologicalchange (in the electricity and otherindustries) and the new global andregional strategies of majorplayers. The upshot of thiscombination of factors has been agrowing private-sector involvementin the industry and a strongprocess of internationalization, aswell as horizontal and verticalintegration in recent years.In terms of economic policy, manyLatin American governments haverecently sought private financing toaddress the need to expand andupgrade their electric powersystems in a context of fiscalausterity. In the case of Brazil, thishas led to a vigorous process ofprivatization. In addition to thesereforms, another source ofattraction for transnationalcorporations is the growthpotential of the electricity systems:according to forecasts made bythe United States EnergyInformation Administration (EIA,1999), during the first two decadesof the century demand forelectricity will expand at anaverage rate of 4.2% per year inLatin America, while demand inthe industrialized countries willgrow at an annual rate of less than2%. In terms of technology, themost significant recentdevelopment has been moreefficient use of natural gas forgeneration. In combination withthe advantages of gas over otherfossil fuels, this has increased thecompetitiveness of the resource,which has encouraged increasingconvergence between theelectricity and natural gas
industries in the form of integratedconglomerates. With regard tobroader technological progress,the greater possibilities forprocessing and transmittinginformation by combiningadvances in informationtechnology andtelecommunications has had theeffect of encouraging theintegration of the industry throughhorizontal and vertical networks,and contributed to thetransnationalization of companiesto form ever larger conglomerates.One of the most outstandingexamples of a player that hasmade the most of these newconditions at world level to widenand expand its operations is theUnited States firm AESCorporation, which today has avery strong presence in the region,based mainly in Brazil. Founded in1982, AES has enjoyed explosivegrowth over the last five years andis now the largest electricitycompany in the world. Between1994 and 2000, AES increased itsmarket capitalization 20-fold, fromUS$ 1.5 billion in the mid-1990s toalmost US$ 30 billion in the lastyear of the decade. Over the sameperiod, the corporation expandedits operations from just nine plantsin three countries to 137generating plants (with a totalcapacity of 41,300 megawatts)and 19 distribution businesses in30 countries in North America,Latin America, Western Europe,Eastern Europe, Central Asia andSouth-East Asia, with a total of54,000 employees. In just fiveyears, AES has thus grown froman independent generatingoperation in North America into aglobal generating business whichhas also moved into distributionand marketing of electric power inmany regions. The company wasoriginally created to supplyelectricity in small deregulatedniches in the United States; its
international expansion and newbusiness came about as anextension of these activities. Atpresent, however, geographicaldiversification and involvement indistribution and administrationactivities have become central toits strategic vision.Within this strategy, thecorporation's geographicalexpansion is aimed at making themost of the opportunities whicharise from restructuring andderegulation processes in differentdeveloping and developedcountries and diversifying thecompany's risk, while itsexpansion into new businessareas, such as energy distributionand marketing, is intended toidentify new niches of higherpotential profitability within thesector by building on theexperience and capacities alreadyinstalled in the electricity business.The results in terms ofgeographical distribution are plainto see, given the broad-frontedexpansion of the company in thelast five years. In terms ofdiversification of business lines, asignificant indicator is that in thefirst three quarters of 2000 almosthalf of the corporation's incomecame from sources other thanpower generation. The mostoutstanding overall result is thatprofits grew at an average annualrate of over 30% for the last fiveyears of the 1990s. In terms oforganizational structure, AEScombines a very decentralizeddecision-making scheme withstrong control of ownership. Thus,although all the operationaldecisions and many strategicdecisions are made at thesubsidiary level, the policy of AESis to gain majority control ofownership in order to commandmanagement responsibility in allthe consortiums in which it isinvolved and to pursue itsbusiness strategy unobstructed.
Box I.2AES IN LATIN AMERICA: A WORLD PLAYER EXPANDS INTO THE REGION FROM
A BRAZILIAN BASE
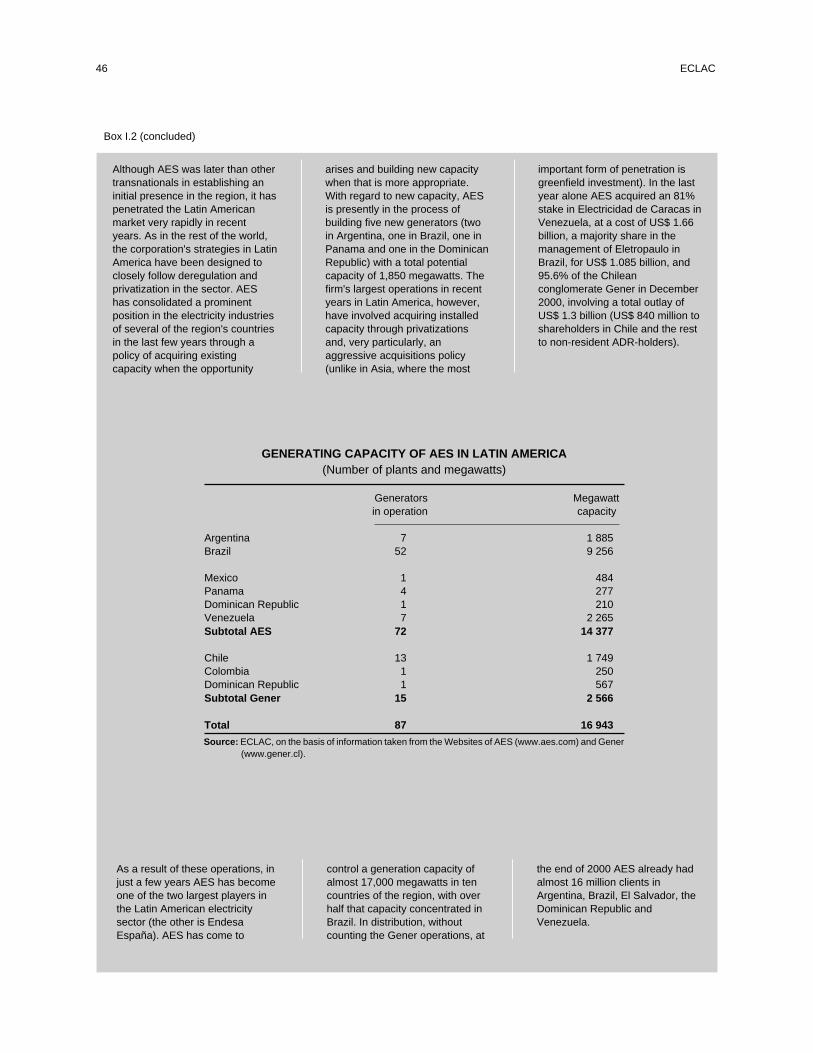
46 ECLAC
Although AES was later than othertransnationals in establishing aninitial presence in the region, it haspenetrated the Latin Americanmarket very rapidly in recentyears. As in the rest of the world,the corporation's strategies in LatinAmerica have been designed toclosely follow deregulation andprivatization in the sector. AEShas consolidated a prominentposition in the electricity industriesof several of the region's countriesin the last few years through apolicy of acquiring existingcapacity when the opportunity
arises and building new capacitywhen that is more appropriate.With regard to new capacity, AESis presently in the process ofbuilding five new generators (twoin Argentina, one in Brazil, one inPanama and one in the DominicanRepublic) with a total potentialcapacity of 1,850 megawatts. Thefirm's largest operations in recentyears in Latin America, however,have involved acquiring installedcapacity through privatizationsand, very particularly, anaggressive acquisitions policy(unlike in Asia, where the most
important form of penetration isgreenfield investment). In the lastyear alone AES acquired an 81%stake in Electricidad de Caracas inVenezuela, at a cost of US$ 1.66billion, a majority share in themanagement of Eletropaulo inBrazil, for US$ 1.085 billion, and95.6% of the Chileanconglomerate Gener in December2000, involving a total outlay ofUS$ 1.3 billion (US$ 840 million toshareholders in Chile and the restto non-resident ADR-holders).
GENERATING CAPACITY OF AES IN LATIN AMERICA(Number of plants and megawatts)
Generators Megawattin operation capacity
Argentina 7 1 885Brazil 52 9 256
Mexico 1 484Panama 4 277Dominican Republic 1 210Venezuela 7 2 265Subtotal AES 72 14 377
Chile 13 1 749Colombia 1 250Dominican Republic 1 567Subtotal Gener 15 2 566
Total 87 16 943
Source: ECLAC, on the basis of information taken from the Websites of AES (www.aes.com) and Gener(www.gener.cl).
As a result of these operations, injust a few years AES has becomeone of the two largest players inthe Latin American electricitysector (the other is EndesaEspaña). AES has come to
control a generation capacity ofalmost 17,000 megawatts in tencountries of the region, with overhalf that capacity concentrated inBrazil. In distribution, withoutcounting the Gener operations, at
the end of 2000 AES already hadalmost 16 million clients inArgentina, Brazil, El Salvador, theDominican Republic andVenezuela.
Box I.2 (concluded)
process of opening up in 2000, undertaking jointexploration and exploitation projects, mainly withcompanies from the United Kingdom and the UnitedStates. In 2000 Petrobrás also ventured into theArgentine fuel distribution industry, by trading 350gasoline stations, control of the Bahía Blanca Refineryand 10% of Yacimiento de Albacora Leste, for 700gasoline stations in Argentina, belonging to Repsol YPF.
Although less significant in quantitative terms,another interesting phenomenon in the Brazilian servicessector in 2000 was an increase in investment in the
Internet sector, including activities related to serviceprovision, generation of multimedia content andelectronic commerce. In a relatively new development,in 2000 large transnational service companies investedintensively to position themselves in this rapidlygrowing industry. The major transactions in this contextwere the acquisition of stock in Organizaciones Globo byTelecom Italia for US$ 810 million and the acquisition ofZip.Net by PT Multimedia of Portugal at a cost ofUS$ 415 million. Other players that increased theirstakes in this industry in 2000 were the United States
Foreign investment in Latin America and the Caribbean, 2000 47
Brazil ended 2000 with anoperation of a magnitude that wasunprecedented in the LatinAmerican financial system. At anauction held on 20 November2000, Banco Santander CentralHispano (BSCH) acquired 33% ofthe capital stock of Banco doEstado de São Paulo (Banespa)with a cash payment of US$ 3.55billion. BSCH thus gained 60% ofthe voting shares (the capital ofBanespa consists of 37.44 millionshares, of which 50% are votingshares and the other 50% arenon-voting preferred stock).The auction concluded a processthat was set in motion in May 2000when the privatization wasannounced. Subsequently, therewere repeated setbacks as theregulators identified transparencyproblems and the unions tooklegal action. In August 2000,however, Brazil's SupremeFederal Court finally gave theoperation the go-ahead and, aftercompeting with differentinternational financial agencies,BSCH won the tender inNovember 2000 with a veryaggressive offer which was threetimes higher than the second offerand five times more than the bookvalue of the stock. The Spanishbank conducted this acquisitionwith the financial support of itsstrategic partner Royal Bank ofScotland Group plc, whichunderwrote BSCH shares valuedat more than US$ 400 million. This
transaction was the beginning of amore substantial strategy ofpenetration in the Brazilian marketby BSCH, which the Spanish bankconsolidated on 28 December2000 with a public tender offer forthe whole of the Banespa capitalheld by minority shareholders at aprice of 95 reales per 1,000shares; this represented a bonusof 58% over the market price atthe date of the offer.Some of the features of theoperation set it apart from earliertransactions conducted by BSCHin the region. Firstly, the BSCHrole in the Banespa privatizationrepresented the first time theSpanish bank had tendered for alocal financial agency in this way;its presence in the region hadtraditionally been pursued throughmergers and private acquisitions,in line with the strategy usedpreviously by Banco Santander(ECLAC, 2000b). Secondly, in thelight of the bank's recentoperations in Mexico (see box I.1),this transaction confirms theinterest shown by BSCH in theregion's largest markets. In fact,the main attraction of Brazil is itslarge size (more than three timesthe size of the Spanish market).Brazil accounts for 40% of LatinAmerica's banking business andhas a high growth potential: in2000 just 50% of the populationaged 18 years or over had acurrent account (95% in Spain)and there were 19,400 inhabitants
per branch (1,100 in Spain).Brazil's financial system alsooffers some benefits, such as thelarge size of its institutions,extensive distribution networks,operations that are relativelydiversified within the privatebanking business, high profitabilityand high levels of capitalization.The strengthening of the BSCHpresence in Brazil (which had onlybeen in the country, throughBanco Santander do Brasil, since1997) is thus part of a strategy ofcreating shareholder value whilemaintaining high levels of networth and liquidity in all its banks.BSCH is now Brazil's third-rankingprivate financial agency, withUS$ 30 billion in assets, US$ 9.5billion in deposits, US$ 5.2 billionin credit investment and US$ 6.6billion in administered funds. Thisoperation also consolidates itsstrong regional position: thecompany's Latin American assetsstand at US$ 113 billion, with aregional market share of clientdeposits of 10.4% (US$ 67 billion),7.5% of investment funds(US$ 14.7 billion) and 14.6% ofpension funds (US$ 10 billion).The medium-term objectives ofBSCH in Banespa will be to obtaina net profit of US$ 800 million in2003, increase deposits throughactive management of traditionaland new products, and increaseoperational efficiency.
Box I.3HEAVY STAKES IN THE BRAZILIAN MARKET: BSCH TAKES CONTROL OF BANESPA
companies Microsoft and Diebold and the Venezuelangroup Cisneros. Given the great potential and stillrelatively low density of Internet use among theBrazilian population, this area is likely to enjoysignificant expansion in years to come.
Although the specific features of some investmentshave changed, in 2000 overall FDI in Brazil kept up themomentum of recent years. Given the relative drop ininvestment in manufacturing and the smaller number ofprivatizations, FDI was largely directed at therestructuring and consolidation of service industries thathad previously been privatized and liberalized, such astelecommunications, financial services and electricity.The drive of this process, in combination with theopening and liberalization of the oil sector, shouldmaintain FDI flows into Brazil in the near future.
(iii) The rest of Mercosur and the Andeancountries
In marked contrast to the cases of Mexico andBrazil, the first year of the new decade brought a fall inFDI inflows to the rest of South America. In fact,estimated FDI flows to South America as a whole,excluding Brazil, decreased by 30% in 2000 from their1999 level. This drop, however, can be explained by theeffect of the YPF acquisition in Argentina and that ofEndesa Chile and Enersis in Chile, without which the1999 inflows would have been smaller than the estimatedinflows for 2000 in the subregion. In terms of their shareof the regional total, flows to South America excludingBrazil declined as a proportion of total flows to LAIAcountries, from 46% in the second half of the 1990s to36% in 2000. The rest of this section includes a review ofFDI in individual countries, an analysis of the industrialprocesses that have accounted for these investments anda discussion of the prospects for FDI in some countries ofthe region.
In the Southern Cone, Argentina and Chile recordedmajor absolute decreases in FDI inflows in 2000 withrespect to 1999. In Argentina, inflows amounted to aboutUS$ 12 billion, which was a drop of almost 50% from the1999 figure. This result, however, is heavily influencedby one-off factors: if the Repsol purchase of YPF is
subtracted from total FDI inflows for 1999, the level for2000 is in fact higher than for 1999. Nevertheless,estimated inflows for 2000 were also influenced by alarge single operation by Telefónica of Spain, whichaccounted for almost a third of the resources invested inArgentina during the year.10 In terms of total FDI inflowsfor both years, however, Argentina accounted for almost18% of total FDI to LAIA countries in 2000, a levelsimilar to that for the period 1995-1999. In the case ofChile, on the other hand, FDI inflows in 2000 amountedto US$ 3.676 billion, a decrease of 60% with respect to1999; thus, the country's share in total LAIA inflows fellfrom almost 10% in the period 1995-1999 (see figureI.3.) to 5.5% in 2000. Although the fall in 2000 ispartially explained by the comparative effect of sizeableEndesa España operations in 1999, the year 2000 was notwithout special operations, which means that thedecrease in FDI in Chile is also a reflection oflonger-term phenomena in the country.
If the exceptional operations in Argentina in recentyears, the virtual end of privatizations, the poorinternational competitiveness of the economy and thedepressed domestic situation, are left out of theanalysis, then certain questions arise about the sourcesof FDI in Argentina in the new decade. These factorshave resulted in an absence of FDI inflows attributableto privatizations in 2000, when FDI was largelydirected at the acquisition of companies geared towardsthe local market, in both the manufacturing and servicessectors. The main operations in the manufacturingsector in 2000 suggest a concentration of investment inrelatively simple activities, particularly in thefoodstuffs and beverages industry, which absorbed twothirds of inflows to the sector in 1999 (see box I.4). Incontrast, FDI to more sophisticated industries with aregional scope has declined. The motor vehicleindustry is an example: after being restructured withforeign capital in the 1990s in order to extend it to thesubregional market within Mercosur, it was seriouslyaffected by the devaluation of the Brazilian real in1999 and non-compliance with reciprocal purchaseagreements within the regional block, and the industryrecorded disinvestment of about US$ 200 million in1999.
48 ECLAC
10 This was part of the so-called “Operation Veronica”, through which Telefónica España increased its stake in its subsidiaries in Argentina, Braziland Peru to almost 100% (see chapter IV). This operation involved outlays of US$ 3.719 billion in Argentina, US$ 12.842 billion in Brazil andUS$ 3.218 billion in Peru. The operation was conducted by means of exchanging shares in Telefónica España with residents and non-residents ofthe region for shares or ADRs in the subsidiary companies in these countries. It did not, therefore, entail a direct influx of foreign exchange tothese economies. In Argentina the operation was entered in the balance of payments as foreign direct investment income, offset so as not to affectthe balance on capital account by a decrease in the portfolio investments in the country by non-residents who swapped their shares for those ofTelefónica España, and by an increase in the holdings of external assets of resident investors who participated in the share-swap scheme (seeMinistry of Economic Affairs, Public Works and Services, Argentina, 2000).

Foreign investment in Latin America and the Caribbean, 2000 49
The heavy involvement of the foodand beverage industry in recentmergers and acquisitions in theLatin American manufacturingsector is indicative of a majorrestructuring in this industry insome countries of the region. Theprocess stems from both nationalphenomena and from the globaland regional strategies pursued inrecent years by transnationalcompanies in response to thetechnological and markettransformation taking place in thefood and beverage industry at theglobal level. In particular, theglobalization of the media hasbrought changes in the structure ofsome industries, including this one,which heavily target the finalconsumer and involve fundamentalchanges in the factors that definecompetitive advantages. In theseindustries marketing activities andinnovation directed at marketpositioning and retaining brandloyalty have come to play anessential role in competition. In acontext of increasingly globalizedconsumption patterns, expansionthrough foreign direct investmentinto markets with a large capacityfor consumption makes it possibleto spread the global costs ofmarketing activities and innovation.The strategies of majortransnational players in this type ofindustry in recent years have thusbeen aimed at gaining a position inhigh-growth markets, in order totap directly into the rentsassociated with the ownership ofbrands that are increasinglyrecognized at the global level.In Latin America, operations in theindustry during the biennium1999-2000 have shown a highdegree of geographicalconcentration. In fact, 33 of the 39merger and acquisition operationsrecorded in this period in theregional industry took place inBrazil, Argentina and Chile, whichtogether attracted 85% of theresources directed at the food andbeverage industry in the region. In
part, this confirms the nationalfactors that motivate merger andacquisition operations in theindustry: all three countries haverelatively stable economies and awide base of medium- andhigh-income consumers, they areculturally homogeneous, and theyhave consumption patterns that aresimilar to those of more developedcountries. In addition, medium- andhigh-income consumers in thesecountries tend increasingly toemulate consumption patternsassociated with globally recognizedbrands, in a phenomenonfacilitated by the powerfuldevelopment oftelecommunications and the recentmarket entry of the internationalmedia in these countries. In thiscontext, it is unremarkable thattransnational companies that ownmajor brands of food andbeverages have acquired localplants to capitalize on their brandname in domestic markets.The clearest examples of this typeof strategy in Latin America inrecent years include France'slargest food company, the DanoneGroup, which currently hasinvestments in Argentina, Braziland Mexico. By 1997 this companyhad already recognized thechanges that were taking place inthe industry, and developed a newbusiness strategy specificallyaimed at restructuring its globaloperations in this new internationalcontext. According to the DanoneGroup, the elements of thisstrategy include: (i) focusing theGroup's activities on threebusiness lines —fresh dairyproducts, mineral water andbiscuits— which "offer significantprofit and growth potential";(ii) speeding up internationalexpansion in these three main linestake advantage of growth inemerging markets; (iii) optimizingassets and publicity to increase theprofits of the Group's main brands;(iv) designing and developingproducts to be marketed under the
main brand names; (v) developingconsumer confidence in its brandsthrough strict policies of foodsafety and quality; and(vi) improving organization andglobal integration to boostefficiency and attention toconsumer preferences.This new strategy has enabled theDanone Group to position itself asa major world player in theindustry in recent years.Undoubtedly the strategy offocusing on three products hasproven successful and has madethe Group a world leader in dairyproducts and biscuits, and theworld's second largest in mineralwater. In Latin America, inparticular, the Group's recentacquisitions have resulted indecisive leadership of theBrazilian and Argentine dairyproduct markets. Geographicalexpansion firmly based onacquisitions in the United States,Latin America and other emergingmarkets has, generally speaking,been successful. In 1999 marketsoutside the European Unionaccounted for around a third of theGroup's income and more thanhalf of its workforce, and in thefirst half of 2000 sales in thesemarkets grew at an annual rate of11.7%, compared with an annualrate of 5.7% and 6.6% in Franceand the rest of the EuropeanUnion, respectively. The strategyof brand strengthening has alsoyielded good results, with over twothirds of sales in recent yearsderiving from brands that arenumber one in their respectivemarkets. In addition to thesestrategic moves, the Group hasmade changes in its structure: in1999 the company created globalintranets by product, wherebyinformation on each product linecan be transmitted rapidlybetween subsidiaries and acrossgeographical boundaries, and in2000 it began work on aworldwide integratedadministrative platform.
Box I.4THE SOUTHERN CONE FOOD AND BEVERAGE INDUSTRY AND THE
GLOBAL STRATEGY OF DANONE

The year 2000 also saw major acquisitionsinvolving foreign capital in service industries, includingthe above-mentioned Telefónica España operation, thepurchase by Banco Santander Central Hispano of astake in Banco del Río de la Plata and in Banco deGalicia y Buenos Aires, and the acquisition ofEmdersa by the United States electricity companyGPU. Given that Argentine service industries are nowhighly transnationalized, however, this process isunlikely to continue to be a dynamic source of newexternal resources for very much longer. Perhaps thesector most likely to attract growing volumes of FDIinto Argentina in the future is mining. According tothe Argentine Department of Mines, between 1993and 1999 almost US$ 700 million was invested inexploration of new fields, and major mining projects byAustralian and Canadian companies are underway orbeing studied.
As in neighbouring Argentina, recent FDI trends inChile raise important questions about direct investmentsources in the future (see chapter II of this report for amore extensive analysis of FDI in Chile). Despite acouple of utility company acquisitions involvingvoluminous sums toward the end of the year, in 2000 FDIinflows to Chile were well below the average for thepreceding five-year period. In fact, although they were
not all recorded in 2000, the flows generated by theacquisition of more than 95% of the Chilean electricityconglomerate Gener by AES Corporation, involving anoutlay of over US$ 840 million (see box I.2) in Chile inDecember 2000 and the acquisition of over 30% of thetelecommunications company ENTEL by TelecomItalia, for over US$ 900 million, together wereequivalent to almost half the total FDI inflows recordedin Chile for the entire year. In the light of this, questionsarise about the sources of FDI in the years to come(Moguillansky, 2000). Mining, which was the mostdynamic sector in terms of attracting FDI in the 1990s,has completed its cycle of heaviest investments. Chile'smost significant privatizations took place in the 1980sand, as in Argentina, ownership of the main serviceindustries is already highly transnationalized. Inresponse to this concern about future sources of FDI, andin the light of certain selectivity criteria that theauthorities were beginning to apply to new investment inChile, in 2000 there were incipient efforts to attractinvestment in sectors with a higher level of technologicalsophistication.
Further to the north, the Andean Communitycountries (Bolivia, Colombia, Ecuador, Peru andVenezuela) received estimated FDI inflows of aroundUS$ 8 billion in 2000, which was 12% higher than in
50 ECLAC
As part of this new strategy,Danone developed an ambitiousplan of acquisitions in the SouthernCone to consolidate its LatinAmerican operations, and it hasbought numerous assets inArgentina and Brazil over the lasttwo years. In Brazil, Danone hasdeveloped mostly in the dairyproducts and biscuits markets, andthe Group's recent acquisitionshave increased its market share ofthese industries. These includeincreasing its stake to almost 100%in Aymoré biscuits in February2000, and acquiring the Paulista
dairy brand and the Guarantiguetaprocessing plant in the state of SãoPaulo in December 2000. Theserecent dairy acquisitions will addsome US$ 100 million to theGroup's dairy sales —amounting toabout US$ 130 million in 1999—,and will make Danone the largestplayer in this market in Brazil with amarket share of 11%. In Argentina,Danone has established apresence in all three of its strategicpriority areas, with DanoneArgentina as the main dairycompany, Bagley in biscuits andAguas Minerales in bottled water.
The Group's recent operationsincreased its stake in the dairybusiness, in which it is now thefrontrunner, having gained controlof La Serenísima distributor inSeptember 2000. It alsoconsolidated its presence in thebottled water and biscuitsindustries by acquiring TermasVillavicencio in 1999 andincreasing its stake in Bagleybiscuits to almost 100%.
Box I.4 (concl.)
Source: ECLAC, Information Centre of the Unit on Investment and Corporate Strategies, Division of Production, Productivity and Management, andDanone website (www.danone.com).
1999 but 14% lower than the annual average of theperiod 1995-1999. This subregional total maskssignificant differences between countries, however. Interms of the distribution of inflows, the position ofVenezuela was particularly interesting, as the countryincreased its share of flows to the Andean Communityfrom a third of the total in the period 1995-1999 to morethan half of all estimated inflows in the first year of thenew decade. The expansion of Venezuela's share reflectsboth an increase in the absolute levels of FDI inflows toVenezuela and a reduction of flows to other largeAndean countries. In recent years countries such asColombia and Peru thus experienced sharp reductions inabsolute and relative FDI inflows compared to earlierperiods, while in the last two years the other twomembers of the subregional block, Bolivia and Ecuador,attracted flows that were similar or slightly higher thanthe figures for the period 1995-1999.
In some countries of the Andean Community, thesharp fall in FDI inflows over the last two years has beenlargely a response to uncertainty caused by the political,economic and institutional instability which has besetthem. The most illustrative case is Colombia, where theintensification of the guerrilla conflict over the last twoyears and the general insecurity in the country haveclearly affected its FDI inflow, which fell year on yearbetween 1997 and 2000. In fact, after reaching a recordUS$ 5.639 billion in 1997, FDI inflows to Colombiadecreased to US$ 1.14 and US$ 1.34 billion in 1999 and2000, respectively. Although less dramatic, the recentinstability in Peru has also affected FDI, and inflows in2000 are forecast to drop by around 45% with respect tothe average flows of the previous five-year period.Despite the notable upturn in 2000, the trend of FDI inrecent years in Venezuela has also shown the effects ofuncertainty deriving from the process of political andinstitutional change the country has undergone in recentyears. In fact, before the upswing in 2000, FDI inflows toVenezuela had fallen significantly in both 1998 and1999.
With regard to sectoral distribution, recent FDI toAndean Community countries has reflected their richnatural resources on the one hand, and the reformsimplemented and potential for development offered bytheir service industries, on the other. In the sector ofnatural resources, in 2000 a 40-year concession toexploit Peru's Camisea gas reserve was awarded toPluspetrol Energy (controlled by the Spanish companyRepsol-YPF); the British companies Anglo Americanand Billiton and the Swiss firm Glencore acquired sharesin the Colombian coal mine Cerrejón Zona Norte; andthe Canadian firm Crestar Energy Inc. and the Italiancompany Agip acquired holdings in the Ecuadorian oil
sector. In the services sector, major operations in 2000included the acquisition of Electricidad de Caracas inVenezuela by the United States firm AES (see box I.2);the purchase of a majority stake in Telefónica del Perú byTelefónica España through share swaps in the so-called"Operation Veronica" (see footnote 3); and theacquisition of the Colombian firm Celumóvil by theUnited States company BellSouth.
Flows to LAIA as a whole thus displayed somenew features at both the national and regional levels inthe first year of the new decade. The main share of newinvestment went to the largest countries, Mexico andBrazil, which will probably continue to attract a majorshare of FDI flows in coming years. The rest of SouthAmerica faces different kinds of difficulties at thenational and subregional levels. In Argentina andChile, the problems relate to the fact that the mainsources of FDI in the 1990s have now been exhausted.In the Andean countries the difficulties are largelyassociated with the political and economic instabilitythat has been a feature of some countries of thesubregion recently.
(b) FDI in the Caribbean Basin
Although the Central American and Caribbeancountries account for a relatively small share of recentinflows to Latin America and the Caribbean (6% of thetotal in the period 1995-2000; see figure I.3), togetherthese economies received a considerable amount of FDIfor their size, as they attracted US$ 5.351 billion in 1999.This result is consistent with recent trends in FDIinflows, which grew strongly during the 1990s to reachan average of US$ 3.953 billion in the period 1995-1999:an increase of over 180% with respect to the average forthe preceding five-year period. Although almost all thecountries of the subregion experienced some increase inFDI inflows in the second half of the 1990s (the onlyexceptions being Antigua and Barbuda and Guyana), ingeneral this inflow was highly concentrated in just afew countries; this was a reflection of their size and thenew investment patterns and strategies of TNCs. Thus,60% of total FDI inflows to the subregion in the period1995-1999 were directed at just four countries:Panama, Trinidad and Tobago, Dominican Republicand Costa Rica. If these flows are added to FDI inanother five receiving countries � Jamaica, ElSalvador, Guatemala, Nicaragua and Honduras� , thenFDI inflows to those nine countries (of a total of 25)account for almost 90% of the subregional total in thesecond half of the 1990s (see table I.3). The informationthat is available on FDI in 2000 suggests that this trend in
Foreign investment in Latin America and the Caribbean, 2000 51

distribution of flows was carried over into the first yearof the new decade.
The largest recipient of FDI in the subregion in 1999was the Dominican Republic, which received US$ 1.338billion, more than 25% of the subregional total. This
level of annual flows was almost double the 1998 figureand completed a five-year period of rapid growth, withannual average FDI inflows to the Dominican Republicin the second half of the 1990s three and a half timeshigher than inflows in the period 1990-1994. This rapid
52 ECLAC
Table I.3CENTRAL AMERICA AND THE CARIBBEAN: NET INFLOW OF FOREIGN DIRECT
INVESTMENT, BY COUNTRY, 1990-2000(Millions of dollars and percentages)
1990- 1995 1996 1997 1998 1999 1995- 19991994a 1999a (%)
Anguilla 10 ... ... ... ... ...Antigua and Barbuda 35 31 19 24 26 12 22 0.2Aruba 38 -6 84 196 84 392 150 7.3Barbados 11 12 13 15 16 15 14 0.3Belize 14 21 17 12 18 -7 12 -0.1Costa Rica 222 337 427 408 613 669 491 12.5Cuba 7 9 12 13 30 15 16 0.3Dominica 17 54 18 22 11 13 24 0.2El Salvador 12 38 -5 59 1104 231 285 4.3Grenada 18 20 18 35 51 43 33 0.8Guatemala 88 75 77 84 673 155 213 2.9Guyana 65 74 93 53 47 48 63 0.9Haiti … 7 4 4 11 30 11 0.6Honduras 41 50 91 122 84 230 115 4.3Jamaica 124 147 184 203 369 524 285 9.8Montserrat 6 ... ... ... ...Nicaragua 19 75 97 173 184 300 166 5.6Panama b 190 267 410 1256 1206 516 731 9.6Dominican Republic 171 414 97 421 700 1338 594 25.0Saint Kitts and Nevis 22 20 35 20 34 77 37 1.4Saint Vincent and theGrenadines 22 31 18 55 28 25 31 0.5Saint Lucia 42 30 23 47 84 87 54 1.6Suriname -38 -21 19 -9 9 5 1 0.1Trinidad and Tobago 270 299 355 999 730 633 603 11.8
Total 1 406 1 984 2 106 4 212 6 112 5 351 3 953 100.0Source: ECLAC, Information Centre, Unit on Investment and Corporate Strategies, Division of Production, Productivity and Management, on the basis of
the International Monetary Fund (IMF), United Nations Conference on Trade and Development (UNCTAD), World Investment Report 2000:Cross-border Merger and Acquisitions and Development (UNCTAD/WIR/(2000)), New York. United Nations publication, Sales No. E.00.II.D.20,and the central banks of each country.
aAnnual average.
bThe data on flows to Panama in 1999 were updated on 16 January 2001 on the basis of information provided directly to ECLAC by the Comptroller-General
of Panama.

growth was the result of a series of sectoral priorities andnew types of operations by TNCs in the country in the1990s (see section C of this chapter). In terms of sectoralstructure, the traditionally natural-resource-based exportstructure underwent considerable diversification in the1990s, thanks to heavy foreign investments in relativelysimple manufacturing activities in textiles or assemblyof imported components for the electronics industry(Mortimore and Peres, 1998). In addition, the country'sindustrial growth generated infrastructure needs whichled the administration to undertake a major process ofinvestment in the electricity sector with activeprivate-sector participation; partly foreign-fundedelectricity privatizations thus accounted for a largepercentage of the FDI increase recorded in 1999. Theseefforts are also closely linked to the authorities' bid toencourage investments in more sophisticated types ofmanufacturing. Another notable area of investment inthe Dominican Republic is tourist infrastructure: theSpanish corporations Occidental Hoteles and BestHotels both invested heavily in hotel capacity in thecountry in 2000.
The second-largest recipient of FDI in CentralAmerica and the Caribbean in 1999 was Trinidad andTobago. This country attracted US$ 633 million inFDI, or 12% of the subregional total that year.Trinidad and Tobago was also the second largestrecipient of FDI in the Caribbean Basin throughout theperiod 1995-1999, when average annual inflows morethan doubled with respect to the previous five-yearperiod. This relatively small economy's ability toattract foreign investment is directly linked to theexploitation of the country's abundant hydrocarbonresources (see ECLAC, 2000a, box I.1). Foreigninvestment in Trinidad and Tobago in the 1990s wasthus highly focussed on exploration, exploitation andexport of the abundant petroleum and natural gasresources. Within this sector, the largest recentinvestments have been directed at natural gas, theproduction of which increased five-fold in the 1990s.Major TNCs to invest recently in different phases ofnatural gas exploitation in Trinidad and Tobagoinclude the American firms Amoco and Enron, BritishGas and the Spanish company Repsol.
Also the Caribbean, the Jamaican economy receivedUS$ 524 million in FDI in 1999, which was almost 10%of the subregional total and represented an increase ofmore than 40% with respect to the 1998 figure. Incommon with other countries of the region, FDI inflowsto Jamaica in the 1990s were largely directed at relativelysimple manufacturing activities in export-processingzones. In recent years, these investments have beensupplemented by heavy outlays in the services sector,
particularly the tourist industry and telecommunications.Investments in cellular telephony were particularlysignificant in this respect in 2000, with outlays of aboutUS$ 50 million apiece by the United States firmsCentennial Communication and Cellular OneCaribbean.
Another country to attract substantial investment in1999, this time in continental Central America, wasCosta Rica, with FDI inflows of US$ 669 million, whichwas equivalent to over 12% of the subregional total and36% higher than the annual average for the period1995-1999. In terms of the sectoral distribution ofinvestments, Costa Rica saw voluminous outlays beingmade in the manufacturing sector over the last decade;thus, unlike other countries in the region, it has madestrides towards modernizing its manufacturing capacityand attracted investments in more sophisticated areas(see ECLAC, 2000a, chapter I, section C). One of theoutcomes of this strategy was the installation of amicroprocessing plant by the manufacturer Intel in 1998.In recent years overall investment has also been swelledby investments in infrastructure areas, including theaward of a 20-year licence in 1999 to the United Statesconsortium Airport Group International, to operate JuanSantamaría airport in San José. In comparison with othercountries of the subregion that have recently privatizedtheir telecommunications systems, Costa Rica has notbeen able to attract significant flows to the sector, and theproposal to privatize the industry faced serious politicalproblems in 2000.
Privatization-linked FDI flows to Panama fluctuatedenormously in the late 1990s. The sale of basic telephonyto the private sector in 1997, involving the Britishcompany Cable and Wireless, and the privatization of theelectricity industry in 1998, involving the Canadian firmHydroQuebec, and the United States firms CoastalCorporation and AES Corporation (see box I.2), madePanama the largest receiver of FDI in the subregion inthose two years, with annual flows to the country of overUS$ 1.2 billion in each. The absence of majorprivatizations in 1999 meant that the decade closed withinflows falling to US$ 516 million, a level closer tohistorical flows and equivalent to 10% of inflows to thesubregion in 1999. Although in 2000 there were nosignificant privatizations, the available estimatessuggest that the 1999 trend was carried over into the firstyear of the new decade. AES Corporation and BellSouthhave already announced plans to invest a total of overUS$ 400 million in electricity generation (AES) andcellular telephony (BellSouth).
In El Salvador and Guatemala, investments in thefirst half of the 1990s were heavily influenced by thedevelopment of export-processing zones, particularly in
Foreign investment in Latin America and the Caribbean, 2000 53
the apparel industry. More recently, the most powerfulsources of attraction for investment in these countrieshave been privatizations and acquisitions. FDI inflows toEl Salvador amounted to US$ 231 million in 1999.Although this was far below the figure for 1998, whenthe main telecommunications company and severalelectricity companies were privatized, the 1999 figurewas still buoyed by the privatization process, coming inwell above all the previous years of the decade. Therewere no major privatizations in 2000, but acquisitions inthe electricity and telecommunications sectors continuedto attract heavy FDI flows. In June 2000 the UnitedStates firm Pennsylvania Power and Light investedUS$ 94 million to purchase a 50% stake in Empresa deElectricidad de Centroamérica, and the United Statesfirm World Wide Wire Communications acquired a25% share in the communications company Saltel inMarch.
Guatemala attracted FDI flows of US$ 155 millionin 1999. As in El Salvador, this figure was much lowerthan in 1998, when there was intensive privatizationactivity, but nevertheless reflected a rising trend withrespect to previous years, also in connection withownership changes in infrastructure sectors. Although2000 saw no more large privatizations, major TNCscontinued to be involved in acquisitions and new plansfor investment in services. Telmex of Mexico, forexample, acquired Grupo Luca, which controlsTelecomunicaciones de Guatemala (TELGUA), andannounced plans to invest US$ 400 million over thenext two years.
Although less advanced than in some of theirCentral American neighbours, infrastructureprivatization processes also account for a considerableproportion of recent FDI inflows to Honduras andNicaragua, which recorded major acquisitions involvingforeign capital in the manufacturing sector. FDI inflowsto Honduras in 1999 amounted to US$ 230 million,which represents a significant increase with respect toprevious years and is mainly attributable to the partialprivatization of telecommunications infrastructure.Most of the privatization activity in 2000 took place inthe area of sanitation tenders, in which Suez Lyonnaisedes Eaux successfully bid US$ 150 million for a 30-yearlicence to operate sanitation services. The largestoperation of 2000, however, was not related toprivatizations but the acquisition of the HonduranCorporación Cressida by the British company Unileverfor US$ 314 million.
Nicaragua also saw a significant increase in FDIinflows in 1999 with respect to 1998, with flows ofUS$ 300 million in the last year of the decade. Somerecent operations suggest that this dynamism is likely tocarry over into 2000. The privatizations programme tookmajor strides forward with the acquisition of theelectricity companies Dissur and Disnor by UniónFenosa of Spain in September 2000. In terms of privateoperations in manufacturing, the Mexican companyCopamex acquired a stake in Industrias Unidas deCentroamérica, in the paper industry, and Cemex, also ofMexico, announced future investments of US$ 94million in the Canal cement plant.
The other economies of the subregion togetheraccounted for 11% of total FDI inflows to CentralAmerica and the Caribbean in the period 1995-1999.Among these relatively smaller economies, the largestreceiver in this period was Aruba, with average flows ofUS$ 150 million, mainly directed at the tourist industryand, more recently, at the oil industry, the country'ssecond largest. The Guyanese economy drew averageannual FDI flows of over US$ 63 million in the period1995-1999, mainly in gold mining, the forestry sectorand infrastructure (CARICOM, 2000). Other smallerCaribbean economies that have received very highlevels of FDI in recent years in relation to their size,particularly in the tourist sector, are Saint Lucia, SaintKitts and Nevis, Saint Vincent and the Grenadines,Antigua and Barbuda, and Dominica. The strongtransnationalization of these economies is reflected inthe fact that currently they all have levels of FDI stockthat are very close to or even higher than their annualGDP (CARICOM, 2000).
FDI flows to the financial centres of the Caribbeanamounted to US$ 2.599 billion in 1999. This fall ofalmost 60% with respect to 1998 and 30% with respect tothe annual average for the period 1995-1999 (see tableI.4), largely attributable to a marked decrease in flows toBermuda and the Cayman Islands. As these countries donot provide information about the origin and destinationof flows, it is not possible to establish the cause of thesesharp reductions with any degree of certainty. Thesefinancial centres are not actually the final destination ofthe great majority of the flows they receive, inasmuch asthe funds tend to be in transit to other countries, bothwithin and outside the region, and therefore are veryunstable. Given the efforts deployed by OECD todiscourage the corporations of developed countries fromusing these centres, however, there is reason to supposethat their relative share in flows to the region coulddecrease in the future.
54 ECLAC

B. STRATEGIES, AGENTS AND MODALITIES OF FOREIGN DIRECTINVESTMENT
1. Strategies and actors: the legacy of the 1990s
As the country-by-country analysis of the previoussection shows, the increase in FDI flows to LatinAmerica and the Caribbean in the 1990s was notuniformly distributed throughout the region. There weresignificant differences in both the strategies and themodalities of investment pursued by the TNCs that wereinvolved in different countries and industries acrossLatin America and the Caribbean. Table I.5 outlinesTNC strategy in the region in the 1990s.
As table I.5 shows, there were two differentapproaches to the manufacturing sector in the 1990s.One involved a strategy that was relatively new to theregion, whereby FDI in manufacturing in Mexico and theCaribbean Basin was largely directed at generatinginternational competitiveness (mainly exports to NorthAmerica) in dynamic industries such as motor vehicles,electronics and apparel (see Mortimore, 2000). Thesecond strategy pursued by some TNCs in themanufacturing sector in the 1990s was to deepentraditional investment patterns. Used particularlyintensively in large and medium-sized South Americancountries, this strategy involved investments in the
restructuring and modernization of production unitstargeting local and wider subregional markets whichwere comparatively protected by different integrationschemes (for example, from Argentina to Mercosur orfrom Colombia to the rest of the Andean Community).
In the 1990s FDI in the primary sector focussedstrongly on countries that are relatively rich in miningresources and hydrocarbons with a view to benefittingfrom traditional comparative advantages. Thesignificant increase in the sums invested in this sectorover the last decade was thus a direct reflection of theprocesses of liberalization of international trade, theopening up of natural-resource extraction industries toforeign capital in countries such as Argentina, Brazil,Bolivia, Colombia, Chile and Venezuela, and a politicalclimate throughout almost the entire region which wasmore favourable to FDI. Mexico is an exception to thispattern, since FDI is still barred from the country'sabundant hydrocarbon resources and allowing it in thenear future is not a priority on the national agenda.
In the tertiary sector, despite differences betweenindustries, the massive investments of the 1990s reached
Foreign investment in Latin America and the Caribbean, 2000 55
Table I.4FINANCIAL CENTRES: FOREIGN DIRECT INVESTMENT, 1995-1999
(Millions of dollars)
1990- 1995 1996 1997 1998 1999 1995-1994a 1999a
Netherlands Antilles 23 10 11 103 151 70 69Bahamas 6 107 88 210 147 145 139Bermudas 2 065 1 350 2 100 1 700 2 400 184 1 547Cayman Islands 255 490 410 2 000 3 500 1 800 1 640Virgin Islands 157 470 510 500 200 400 416
Total 2 506 2 427 3 119 4 513 6 398 2 599 3 811Source: ECLAC, Information Centre, Unit on Investment and Corporate Strategies, Division of Production, Productivity and Management, on the basis of
the International Monetary Fund (IMF), United Nations Conference on Trade and Development (UNCTAD), World Investment Report 2000:Cross-border Merger and Acquisitions and Development (UNCTAD/WIR/(2000)), New York. United Nations publication, Sales No. E.00.II.D.20.
aAnnual average.

virtually all of the region, at varying paces depending onthe liberalization and privatization policies of thedifferent countries. The basic strategy of TNCs in thissector was to acquire and modernize existing infra-structure in order to participate in the expansion of theregional markets and establish a large enough regionaland global presence to compete with other TNCs.
The typology of FDI in Latin America and theCaribbean that is shown in table I.5, though simple,presents a comprehensive overview of the operations ofTNCs in Latin America and the Caribbean during the1990s. There is a clear distinction between the strategiesof transnational firms � particularly in terms of theiroperations in the primary and manufacturing sectors�in South America, on the one hand, and in Mexico andthe Caribbean Basin, on the other. In South America,during the 1990s TNCs continued to pursue theirtraditional strategies based on natural resources in theregion, and in the manufacturing sector they continued toproduce for a national or regional market. In Mexico andthe Caribbean Basin, in contrast, transnational firmsdeveloped new strategies which involved integrating the
countries of the subregion into their internationalproduction systems, in an attempt to improve efficiencyand compete in markets and industries in whichinternational trade was increasing. Tables I.6 and I.7show trends in the international competitiveness ofSouth America, on the one hand, and of Mexico and theCaribbean Basin, on the other, in the period 1985-1998.
As these tables clearly show, in the period1985-1998 the different strategies of TNCs in the regionhelped to generate a powerful contrast between theinternational competitiveness of South America, on theone hand, and Mexico and the Caribbean Basin, on theother. South America's share of the international marketfell from 3.34% in 1985 to 2.81% in 1998, while theshare of Mexico and the Caribbean Basin increased from2.13% to 2.80%. Even more strikingly, South America'smarket share increased or remained stable in the leastdynamic segments of world trade, while Mexico and theCaribbean Basin saw their share increase most in thefastest-growing sectors. The only sector in which SouthAmerica increased its share in world trade between 1985and 1998 was natural resources (from 7.12% to 10%),
56 ECLAC
Table I.5LATIN AMERICA AND THE CARIBBEAN: STRATEGIES OF TRANSNATIONAL
CORPORATIONS IN THE 1990s
Corporate (A) (B) (C)strategy Efficiency Raw materials Market access (national
or regional)Sector
Oil/gas:Venezuela,Colombia,
Primary Argentina, Bolivia andBrazilMinerals: Chile,Argentina and Peru
Motor vehicles: Motor vehicles: MercosurMexico Chemicals: BrazilElectronics: Mexico Agribusiness, foods and beverages:
Manufactures and Caribbean Basin Argentina, Brazil and MexicoApparel: Cement: Colombia and VenezuelaCaribbean Basinand Mexico
Financial: Brazil, Mexico, Chile, Argentina,Venezuela, Colombia and PeruTelecommunications: Brazil, Argentina, Chileand Peru
Services Electricity: Chile, Colombia, Brazil, Argentina andCentral AmericaNatural gas distribution: Argentina, Brazil, Chileand ColombiaRetail commerce: Brazil, Argentina, Mexico,Chile
Source: ECLAC, Information Centre of the Unit on Investment and Corporate Strategies, Division of Production, Productivity and Management.

while its share of resource-based manufacturesdecreased from 5.03% to 4.59%, and of non-resource-based manufactures from 1.21% to 1.17%. Over thesame period Mexico and the Caribbean Basin improvedtheir international competitiveness in non-resource-based manufactures from 1.17% to 2.95% of world trade.
The difference in the international competitivenessof the two subregions is also reflected in the way their
export structures have developed. In the mid-1980s bothsubregions participated in the world economy in asimilar manner, with exports being highly dependent onnatural resources and commodity-intensivemanufactures. The situation was very different by 1998,however: 69.7% of South American exports still reliedon natural resources and resource-based manufactures,while Mexico and other countries of the Caribbean Basin
Foreign investment in Latin America and the Caribbean, 2000 57
Table I.6SOUTH AMERICA: INTERNATIONAL COMPETITIVENESS
IN WORLD IMPORTS, 1985-1998(Percentages)
1985 1990 1995 1998
I. Market share 3.34 2.73 2.73 2.81Natural resources (1) 7.12 7.59 8.93 10.03Manufactures based on natural resources (2) 5.03 4.33 4.55 4.59Manufactures not based on natural resources (3) 1.21 1.13 1.11 1.17- Low technology (4) 1.93 1.73 1.66 1.53- Mid-level technology (5) 1.16 1.18 1.32 1.51- High technology (6) 0.45 0.35 0.28 0.38Other (7) 2.08 1.14 1.33 1.42
II. Export structure (contribution) 100.0 100.0 100.0 100.0Natural resources (1) 49.2 44.3 43.6 44.0Manufactures based on natural resources (2) 29.2 28.3 27.6 25.7Manufactures not based on natural resources (3) 19.7 26.0 27.1 28.5- Low technology (4) 8.2 10.5 10.1 9.0- Mid-level technology (5) 9.9 13.5 15.1 16.7- High technology (6) 1.5 1.9 2.0 2.8Other (7) 1.9 1.4 1.7 1.8
III. 10 main exports by contributiona b
52.3 44.6 40.8 41.1333 Crude petroleum oils + 12.3 10.0 11.2 11.1081 Feeding-stuff for animals (not including unmilled cereals) + 4.4 4.4 4.7 4.3334 Petroleum products, refined - 10.7 7.2 4.4 4.3071 Coffee and coffee substitutes - 9.9 4.6 4.1 4.1682 Copper - 3.2 4.5 3.7 3.6057 Fruit and nuts (not including oil nuts), fresh or dried + 2.9 3.9 3.6 3.6281 Iron ore and concentrates + 4.1 4.4 3.3 3.1222 Oil seeds, oil nuts and oil kernels + 2.2 2.4 2.1 2.5781 Passenger motor vehicles + 0.6 0.7 1.2 2.3287 Ores and concentrates of common metals + 2.1 2.4 2.4 2.3
Source: ECLAC, on the basis of the CAN computer program.
Groups of goods based on the Standard International Trade Classification (SITC Rev.2).
(1) Contains 45 simply processed commodities, including concentrates.
(2) Contains 65 items: 35 agricultural/forestry groups and another 30 (mostly metals -except steel-, petroleum products, cement, glass, etc.).
(3) Contains 120 groups which represent the sum of (4) + (5) + (6).
(4) Contains 44 items: 20 groups of the textile-wearing apparel cluster, plus another 24 (paper products, glass and steel, jewels).
(5) Contains 58 items: 5 groups from the motor vehicle industry, 22 from the processing industry and 31 from the engineering industry.
(6) Contains 18 items: 11 groups from the electronics cluster plus another 7 (pharmaceutical products, turbines, aeroplanes,
instruments).
(7) Contains 9 unclassified groups (mostly from section 9).a
Groups that correspond (*) to the 50 fastest-growing in world imports, 1985-1998.b
Groups in which South America gained (+) or lost (-) market share in world imports, 1985-1998.
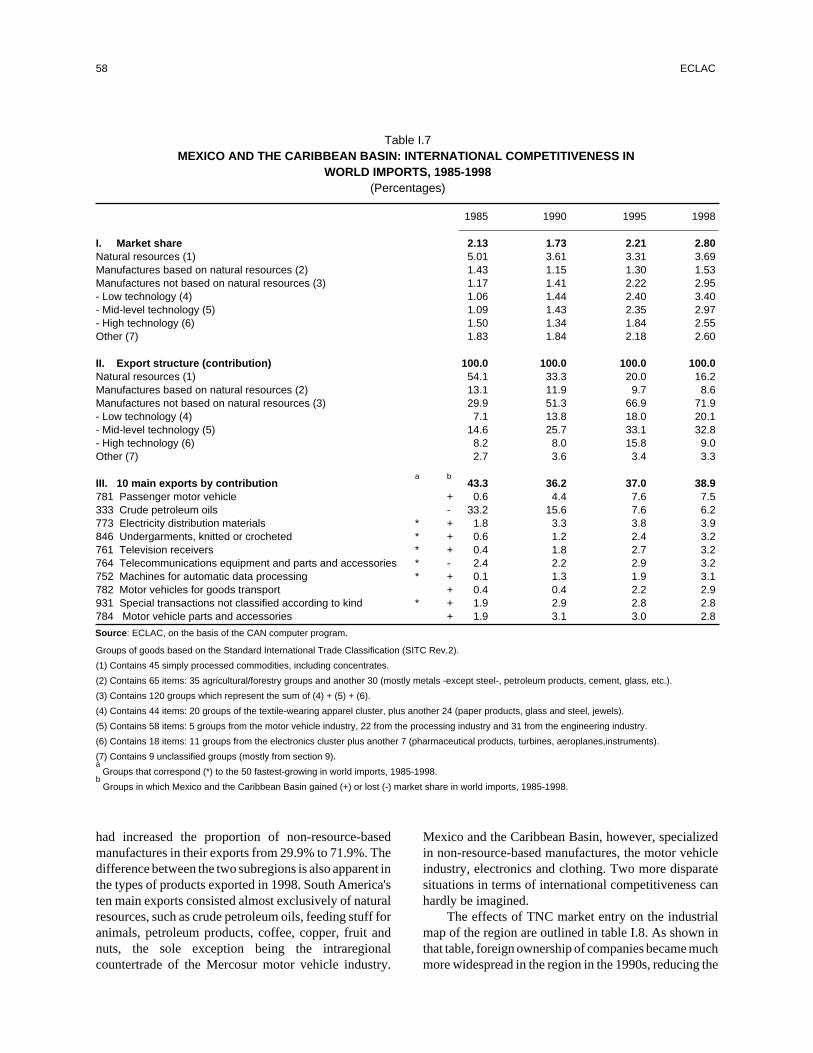
had increased the proportion of non-resource-basedmanufactures in their exports from 29.9% to 71.9%. Thedifference between the two subregions is also apparent inthe types of products exported in 1998. South America'sten main exports consisted almost exclusively of naturalresources, such as crude petroleum oils, feeding stuff foranimals, petroleum products, coffee, copper, fruit andnuts, the sole exception being the intraregionalcountertrade of the Mercosur motor vehicle industry.
Mexico and the Caribbean Basin, however, specializedin non-resource-based manufactures, the motor vehicleindustry, electronics and clothing. Two more disparatesituations in terms of international competitiveness canhardly be imagined.
The effects of TNC market entry on the industrialmap of the region are outlined in table I.8. As shown inthat table, foreign ownership of companies became muchmore widespread in the region in the 1990s, reducing the
58 ECLAC
Table I.7MEXICO AND THE CARIBBEAN BASIN: INTERNATIONAL COMPETITIVENESS IN
WORLD IMPORTS, 1985-1998(Percentages)
1985 1990 1995 1998
I. Market share 2.13 1.73 2.21 2.80Natural resources (1) 5.01 3.61 3.31 3.69Manufactures based on natural resources (2) 1.43 1.15 1.30 1.53Manufactures not based on natural resources (3) 1.17 1.41 2.22 2.95- Low technology (4) 1.06 1.44 2.40 3.40- Mid-level technology (5) 1.09 1.43 2.35 2.97- High technology (6) 1.50 1.34 1.84 2.55Other (7) 1.83 1.84 2.18 2.60
II. Export structure (contribution) 100.0 100.0 100.0 100.0Natural resources (1) 54.1 33.3 20.0 16.2Manufactures based on natural resources (2) 13.1 11.9 9.7 8.6Manufactures not based on natural resources (3) 29.9 51.3 66.9 71.9- Low technology (4) 7.1 13.8 18.0 20.1- Mid-level technology (5) 14.6 25.7 33.1 32.8- High technology (6) 8.2 8.0 15.8 9.0Other (7) 2.7 3.6 3.4 3.3
III. 10 main exports by contributiona b
43.3 36.2 37.0 38.9781 Passenger motor vehicle + 0.6 4.4 7.6 7.5333 Crude petroleum oils - 33.2 15.6 7.6 6.2773 Electricity distribution materials * + 1.8 3.3 3.8 3.9846 Undergarments, knitted or crocheted * + 0.6 1.2 2.4 3.2761 Television receivers * + 0.4 1.8 2.7 3.2764 Telecommunications equipment and parts and accessories * - 2.4 2.2 2.9 3.2752 Machines for automatic data processing * + 0.1 1.3 1.9 3.1782 Motor vehicles for goods transport + 0.4 0.4 2.2 2.9931 Special transactions not classified according to kind * + 1.9 2.9 2.8 2.8784 Motor vehicle parts and accessories + 1.9 3.1 3.0 2.8
Source: ECLAC, on the basis of the CAN computer program.
Groups of goods based on the Standard International Trade Classification (SITC Rev.2).
(1) Contains 45 simply processed commodities, including concentrates.
(2) Contains 65 items: 35 agricultural/forestry groups and another 30 (mostly metals -except steel-, petroleum products, cement, glass, etc.).
(3) Contains 120 groups which represent the sum of (4) + (5) + (6).
(4) Contains 44 items: 20 groups of the textile-wearing apparel cluster, plus another 24 (paper products, glass and steel, jewels).
(5) Contains 58 items: 5 groups from the motor vehicle industry, 22 from the processing industry and 31 from the engineering industry.
(6) Contains 18 items: 11 groups from the electronics cluster plus another 7 (pharmaceutical products, turbines, aeroplanes,instruments).
(7) Contains 9 unclassified groups (mostly from section 9).a
Groups that correspond (*) to the 50 fastest-growing in world imports, 1985-1998.b
Groups in which Mexico and the Caribbean Basin gained (+) or lost (-) market share in world imports, 1985-1998.
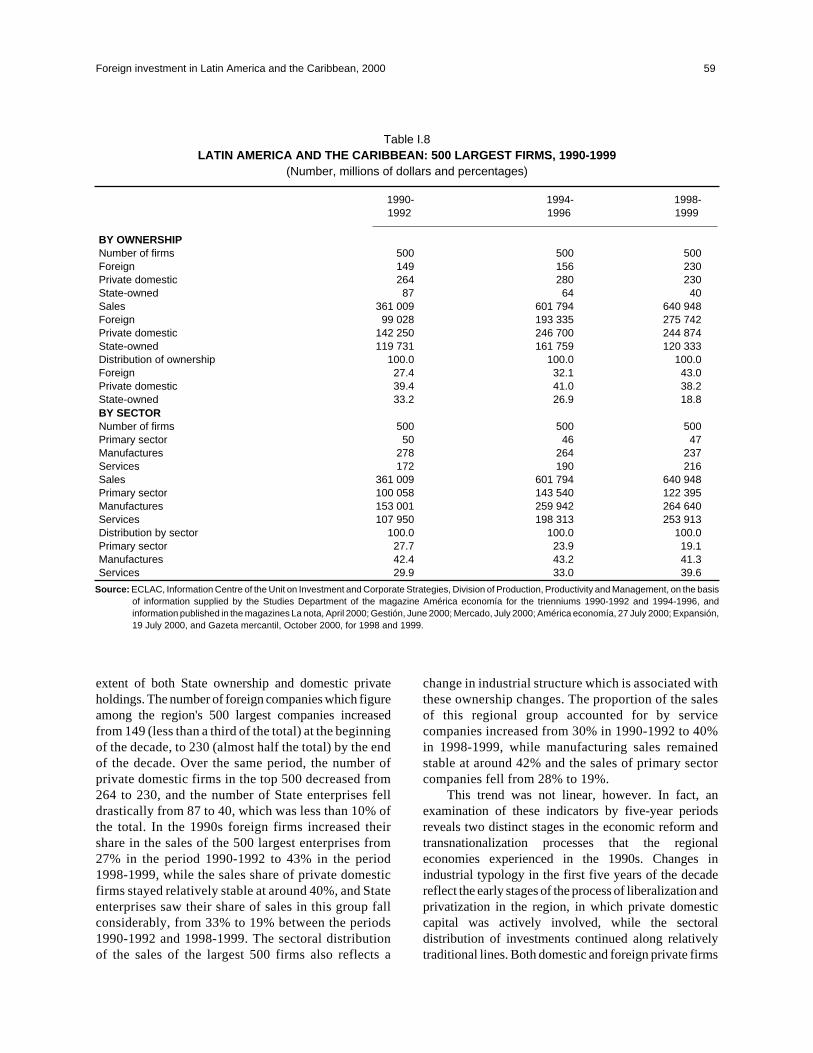
extent of both State ownership and domestic privateholdings. The number of foreign companies which figureamong the region's 500 largest companies increasedfrom 149 (less than a third of the total) at the beginningof the decade, to 230 (almost half the total) by the endof the decade. Over the same period, the number ofprivate domestic firms in the top 500 decreased from264 to 230, and the number of State enterprises felldrastically from 87 to 40, which was less than 10% ofthe total. In the 1990s foreign firms increased theirshare in the sales of the 500 largest enterprises from27% in the period 1990-1992 to 43% in the period1998-1999, while the sales share of private domesticfirms stayed relatively stable at around 40%, and Stateenterprises saw their share of sales in this group fallconsiderably, from 33% to 19% between the periods1990-1992 and 1998-1999. The sectoral distributionof the sales of the largest 500 firms also reflects a
change in industrial structure which is associated withthese ownership changes. The proportion of the salesof this regional group accounted for by servicecompanies increased from 30% in 1990-1992 to 40%in 1998-1999, while manufacturing sales remainedstable at around 42% and the sales of primary sectorcompanies fell from 28% to 19%.
This trend was not linear, however. In fact, anexamination of these indicators by five-year periodsreveals two distinct stages in the economic reform andtransnationalization processes that the regionaleconomies experienced in the 1990s. Changes inindustrial typology in the first five years of the decadereflect the early stages of the process of liberalization andprivatization in the region, in which private domesticcapital was actively involved, while the sectoraldistribution of investments continued along relativelytraditional lines. Both domestic and foreign private firms
Foreign investment in Latin America and the Caribbean, 2000 59
Table I.8LATIN AMERICA AND THE CARIBBEAN: 500 LARGEST FIRMS, 1990-1999
(Number, millions of dollars and percentages)
1990- 1994- 1998-1992 1996 1999
BY OWNERSHIPNumber of firms 500 500 500Foreign 149 156 230Private domestic 264 280 230State-owned 87 64 40Sales 361 009 601 794 640 948Foreign 99 028 193 335 275 742Private domestic 142 250 246 700 244 874State-owned 119 731 161 759 120 333Distribution of ownership 100.0 100.0 100.0Foreign 27.4 32.1 43.0Private domestic 39.4 41.0 38.2State-owned 33.2 26.9 18.8BY SECTORNumber of firms 500 500 500Primary sector 50 46 47Manufactures 278 264 237Services 172 190 216Sales 361 009 601 794 640 948Primary sector 100 058 143 540 122 395Manufactures 153 001 259 942 264 640Services 107 950 198 313 253 913Distribution by sector 100.0 100.0 100.0Primary sector 27.7 23.9 19.1Manufactures 42.4 43.2 41.3Services 29.9 33.0 39.6
Source: ECLAC, Information Centre of the Unit on Investment and Corporate Strategies, Division of Production, Productivity and Management, on the basisof information supplied by the Studies Department of the magazine América economía for the trienniums 1990-1992 and 1994-1996, andinformation published in the magazines La nota, April 2000; Gestión, June 2000; Mercado, July 2000; América economía, 27 July 2000; Expansión,19 July 2000, and Gazeta mercantil, October 2000, for 1998 and 1999.
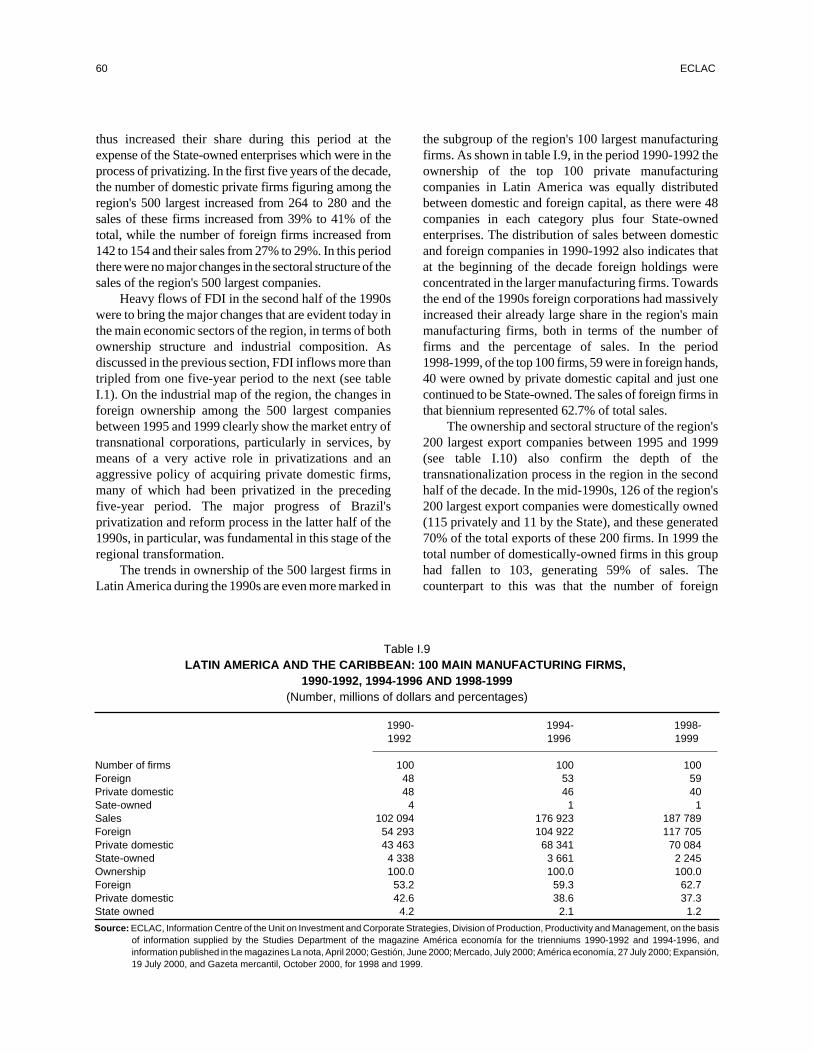
thus increased their share during this period at theexpense of the State-owned enterprises which were in theprocess of privatizing. In the first five years of the decade,the number of domestic private firms figuring among theregion's 500 largest increased from 264 to 280 and thesales of these firms increased from 39% to 41% of thetotal, while the number of foreign firms increased from142 to 154 and their sales from 27% to 29%. In this periodthere were no major changes in the sectoral structure of thesales of the region's 500 largest companies.
Heavy flows of FDI in the second half of the 1990swere to bring the major changes that are evident today inthe main economic sectors of the region, in terms of bothownership structure and industrial composition. Asdiscussed in the previous section, FDI inflows more thantripled from one five-year period to the next (see tableI.1). On the industrial map of the region, the changes inforeign ownership among the 500 largest companiesbetween 1995 and 1999 clearly show the market entry oftransnational corporations, particularly in services, bymeans of a very active role in privatizations and anaggressive policy of acquiring private domestic firms,many of which had been privatized in the precedingfive-year period. The major progress of Brazil'sprivatization and reform process in the latter half of the1990s, in particular, was fundamental in this stage of theregional transformation.
The trends in ownership of the 500 largest firms inLatin America during the 1990s are even more marked in
the subgroup of the region's 100 largest manufacturingfirms. As shown in table I.9, in the period 1990-1992 theownership of the top 100 private manufacturingcompanies in Latin America was equally distributedbetween domestic and foreign capital, as there were 48companies in each category plus four State-ownedenterprises. The distribution of sales between domesticand foreign companies in 1990-1992 also indicates thatat the beginning of the decade foreign holdings wereconcentrated in the larger manufacturing firms. Towardsthe end of the 1990s foreign corporations had massivelyincreased their already large share in the region's mainmanufacturing firms, both in terms of the number offirms and the percentage of sales. In the period1998-1999, of the top 100 firms, 59 were in foreign hands,40 were owned by private domestic capital and just onecontinued to be State-owned. The sales of foreign firms inthat biennium represented 62.7% of total sales.
The ownership and sectoral structure of the region's200 largest export companies between 1995 and 1999(see table I.10) also confirm the depth of thetransnationalization process in the region in the secondhalf of the decade. In the mid-1990s, 126 of the region's200 largest export companies were domestically owned(115 privately and 11 by the State), and these generated70% of the total exports of these 200 firms. In 1999 thetotal number of domestically-owned firms in this grouphad fallen to 103, generating 59% of sales. Thecounterpart to this was that the number of foreign
60 ECLAC
Table I.9LATIN AMERICA AND THE CARIBBEAN: 100 MAIN MANUFACTURING FIRMS,
1990-1992, 1994-1996 AND 1998-1999(Number, millions of dollars and percentages)
1990- 1994- 1998-1992 1996 1999
Number of firms 100 100 100Foreign 48 53 59Private domestic 48 46 40Sate-owned 4 1 1Sales 102 094 176 923 187 789Foreign 54 293 104 922 117 705Private domestic 43 463 68 341 70 084State-owned 4 338 3 661 2 245Ownership 100.0 100.0 100.0Foreign 53.2 59.3 62.7Private domestic 42.6 38.6 37.3State owned 4.2 2.1 1.2
Source: ECLAC, Information Centre of the Unit on Investment and Corporate Strategies, Division of Production, Productivity and Management, on the basisof information supplied by the Studies Department of the magazine América economía for the trienniums 1990-1992 and 1994-1996, andinformation published in the magazines La nota, April 2000; Gestión, June 2000; Mercado, July 2000; América economía, 27 July 2000; Expansión,19 July 2000, and Gazeta mercantil, October 2000, for 1998 and 1999.
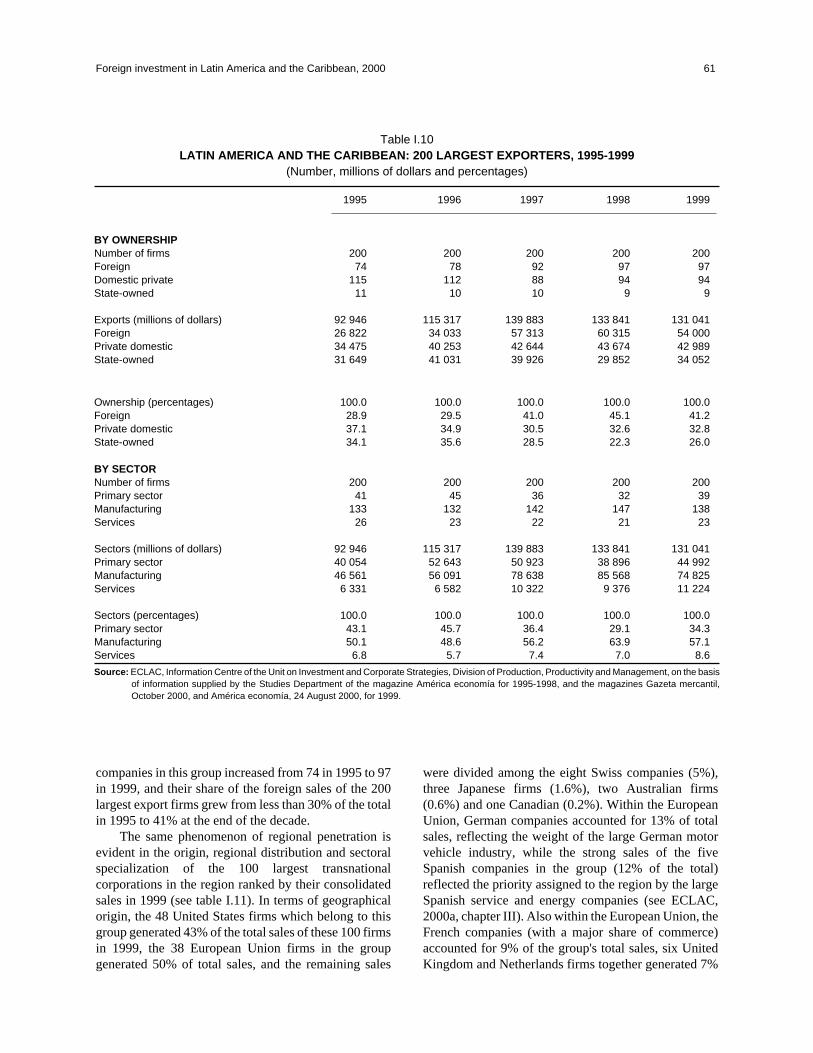
companies in this group increased from 74 in 1995 to 97in 1999, and their share of the foreign sales of the 200largest export firms grew from less than 30% of the totalin 1995 to 41% at the end of the decade.
The same phenomenon of regional penetration isevident in the origin, regional distribution and sectoralspecialization of the 100 largest transnationalcorporations in the region ranked by their consolidatedsales in 1999 (see table I.11). In terms of geographicalorigin, the 48 United States firms which belong to thisgroup generated 43% of the total sales of these 100 firmsin 1999, the 38 European Union firms in the groupgenerated 50% of total sales, and the remaining sales
were divided among the eight Swiss companies (5%),three Japanese firms (1.6%), two Australian firms(0.6%) and one Canadian (0.2%). Within the EuropeanUnion, German companies accounted for 13% of totalsales, reflecting the weight of the large German motorvehicle industry, while the strong sales of the fiveSpanish companies in the group (12% of the total)reflected the priority assigned to the region by the largeSpanish service and energy companies (see ECLAC,2000a, chapter III). Also within the European Union, theFrench companies (with a major share of commerce)accounted for 9% of the group's total sales, six UnitedKingdom and Netherlands firms together generated 7%
Foreign investment in Latin America and the Caribbean, 2000 61
Table I.10LATIN AMERICA AND THE CARIBBEAN: 200 LARGEST EXPORTERS, 1995-1999
(Number, millions of dollars and percentages)
1995 1996 1997 1998 1999
BY OWNERSHIPNumber of firms 200 200 200 200 200Foreign 74 78 92 97 97Domestic private 115 112 88 94 94State-owned 11 10 10 9 9
Exports (millions of dollars) 92 946 115 317 139 883 133 841 131 041Foreign 26 822 34 033 57 313 60 315 54 000Private domestic 34 475 40 253 42 644 43 674 42 989State-owned 31 649 41 031 39 926 29 852 34 052
Ownership (percentages) 100.0 100.0 100.0 100.0 100.0Foreign 28.9 29.5 41.0 45.1 41.2Private domestic 37.1 34.9 30.5 32.6 32.8State-owned 34.1 35.6 28.5 22.3 26.0
BY SECTORNumber of firms 200 200 200 200 200Primary sector 41 45 36 32 39Manufacturing 133 132 142 147 138Services 26 23 22 21 23
Sectors (millions of dollars) 92 946 115 317 139 883 133 841 131 041Primary sector 40 054 52 643 50 923 38 896 44 992Manufacturing 46 561 56 091 78 638 85 568 74 825Services 6 331 6 582 10 322 9 376 11 224
Sectors (percentages) 100.0 100.0 100.0 100.0 100.0Primary sector 43.1 45.7 36.4 29.1 34.3Manufacturing 50.1 48.6 56.2 63.9 57.1Services 6.8 5.7 7.4 7.0 8.6
Source: ECLAC, Information Centre of the Unit on Investment and Corporate Strategies, Division of Production, Productivity and Management, on the basisof information supplied by the Studies Department of the magazine América economía for 1995-1998, and the magazines Gazeta mercantil,October 2000, and América economía, 24 August 2000, for 1999.

62 ECLAC
Table I.11100 LARGEST TRANSNATIONAL FIRMS PRESENT IN LATIN AMERICA, BY CONSOLIDATED SALES, 1999
(Millions of dollars)
ECLAC Firm Country of origin SectorArgen-
Brazil ChileColom-
Mexico Other Totaltina bia
1 Telefónica de España S.A. Spain Telecoms. 4 634 5 010 698 … … 2 097 12 4392 General Motors United States Motor vehicle 600 3 895 370 181 7 340 39 12 425
Corporation (GM)3 Volkswagen AG Germany Motor vehicle 1 020 3 976 … … 6 906 … 11 9024 DaimlerChrysler AG Germany Motor vehicle 784 1 610 … … 7 352 … 9 7465 Carrefour Group/ France Commerce 5 092 4 469 … … … … 9 561
Promodés a
6 Ford Motor Company United States Motor vehicle 1 144 2 406 … 13 4 689 … 8 2527 Repsol-YPF Spain Petroleum 7 980 14 99 16 … … 8 1098 Fiat Spa Italy Motor vehicle 1 160 6 499 … … … … 7 6599 Royal Dutch-Shell Group United Kingdom/ Petroleum 1 834 3 658 768 … … 189 6 449
Netherlands10 Exxon Mobil Corporation United States Petroleum 1 675 2 625 1 019 948 … 136 6 40311 International Business United States Electronics 586 1 500 … … 3 393 … 5 479
Machines (IBM)12 Endesa España Spain Electricity 814 466 3 790 294 … 111 5 47513 The AES Corp. United States Electricity 753 2 214 512 … … 1 703 5 18214 Wal Mart Stores United States Commerce 500 534 … … 3 782 … 4 81615 Nestlé Switzerland Foodstuffs 430 1 770 650 105 1 811 … 4 76616 Renault/Nissan Motor a France Motor vehicle 1 139 285 33 38 2 684 … 4 17917 Unilever United Kingdom/ Foodstuffs 1 213 1 734 485 170 524 … 4 126
Netherlands18 Motorola Inc. United States Electronics 208 1 000 … 9 2 600 … 3 81719 Cargill, Incorporated United States Foodstuffs 2 059 1482 … … … … 3 54120 Intel Corporation United States Electronics … 840 … … … 2 700 3 54021 PepsiCo United States Beverages 630 189 … 40 2 673 … 3 53222 Royal Ahold N.V. Netherlands Commerce 2 117 811 514 … … … 3 44223 The Coca-Cola Company United States Beverages 1 620 395 272 95 891 63 3 33624 Olivetti Spa./ Italia Italy Telecoms. 2 326 308 385 … 143 … 3 162
Telecom a
25 General Electric (GE) United States Machinery … … … 94 3 048 … 3 14226 Siemens AG Germany Machinery 693 839 50 103 1 086 … 2 77127 BASF AG Germany Chemicals 757 1 024 … … 717 … 2 49828 Hewlett-Packard United States Electronics 317 480 … … 1 672 … 2 46929 Aventis (Hoechst AG/ Germany Chemicals … 1 068 … 56 1 298 … 2 422
Rhône-Poulenc)30 The Exxel Group United States Various 2 263 … … … … … 2 26331 L.M. Ericsson Suecia Machinery … 1 705 … … 557 … 2 26232 Philip Morris United States Tobacco 1 757 236 … … 135 … 2 128
Companies Inc.b
33 Procter & Gamble United States Hygiene/ 318 … 150 122 1 490 … 2 080Cleaning
34 BellSouth Corporation United States Telecoms. 540 309 … 183 … 949 1 98135 Nippon Electric Co. (NEC) Japan Electronics … 625 … … 1270 … 189536 Casino Guichard- France Commerce 581 843 … 259 … 199 1 882
Perrachon37 E.I. du Pont de Nemours United States Chemicals 281 555 … 100 941 … 1 87738 Xerox United States Electronics 157 1 097 … 480 10 1 74439 Cisco Systems Inc. United States Electronics … 1 723 … … … … 1 72340 Pirelli S.p.A. Italy Tyres … 1 723 … … … … 1 72341 Royal Philips Electronics Netherlands Electronics … 323 … … 1 370 … 1 693
(Koninklijke PhilipsElectronics N.V.)
42 Bayer AG Germany Chemicals 350 531 … … 663 … 1 54443 Novartis Switzerland Chemicals 243 689 … 135 432 … 1 49944 British American (BAT) United Kingdom Tobacco 621 761 108 … … … 1 490
Tobacco Plc.45 Anheuser-Busch United States Beverages … … 114 … 1 292 4 1 41046 Électricité De France (EDF) France Electricity 307 1 089 … … … 1 39647 Holderbank Switzerland Cements 258 242 74 … 809 … 1 383
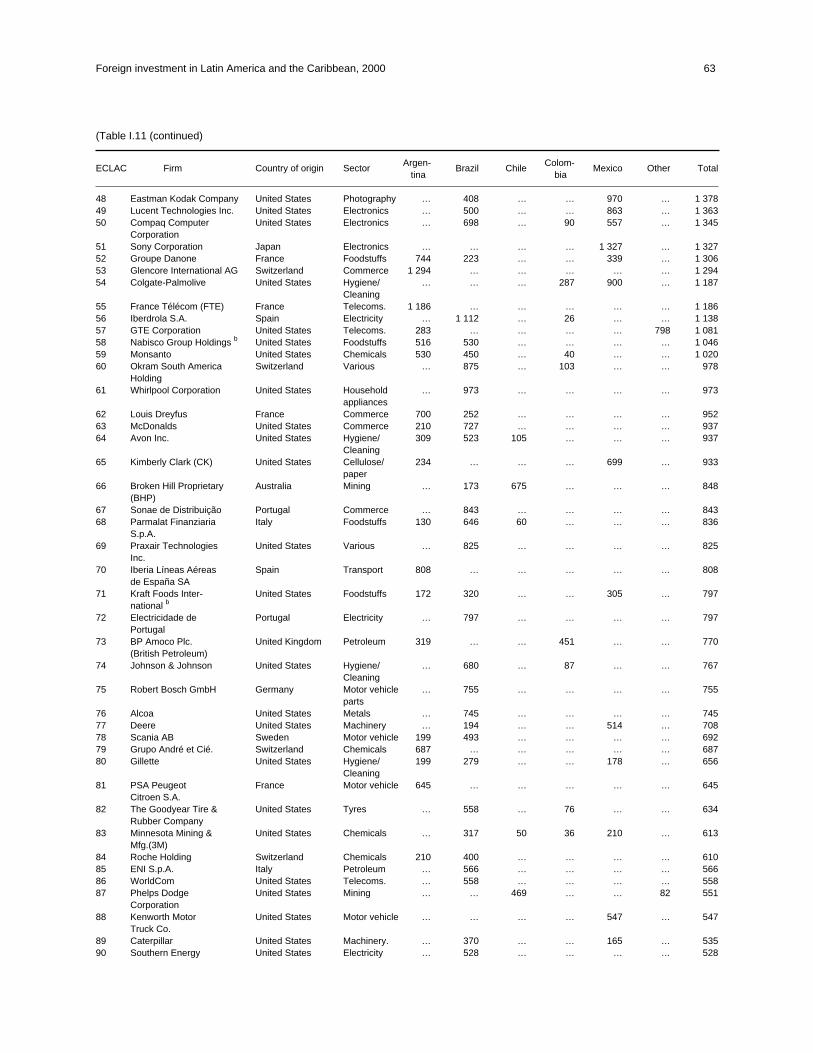
Foreign investment in Latin America and the Caribbean, 2000 63
(Table I.11 (continued)
ECLAC Firm Country of origin SectorArgen-
Brazil ChileColom-
Mexico Other Totaltina bia
48 Eastman Kodak Company United States Photography … 408 … … 970 … 1 37849 Lucent Technologies Inc. United States Electronics … 500 … … 863 … 1 36350 Compaq Computer United States Electronics … 698 … 90 557 … 1 345
Corporation51 Sony Corporation Japan Electronics … … … … 1 327 … 1 32752 Groupe Danone France Foodstuffs 744 223 … … 339 … 1 30653 Glencore International AG Switzerland Commerce 1 294 … … … … … 1 29454 Colgate-Palmolive United States Hygiene/ … … … 287 900 … 1 187
Cleaning55 France Télécom (FTE) France Telecoms. 1 186 … … … … … 1 18656 Iberdrola S.A. Spain Electricity … 1 112 … 26 … … 1 13857 GTE Corporation United States Telecoms. 283 … … … … 798 1 08158 Nabisco Group Holdings b United States Foodstuffs 516 530 … … … … 1 04659 Monsanto United States Chemicals 530 450 … 40 … … 1 02060 Okram South America Switzerland Various … 875 … 103 … … 978
Holding61 Whirlpool Corporation United States Household … 973 … … … … 973
appliances62 Louis Dreyfus France Commerce 700 252 … … … … 95263 McDonalds United States Commerce 210 727 … … … … 93764 Avon Inc. United States Hygiene/ 309 523 105 … … … 937
Cleaning65 Kimberly Clark (CK) United States Cellulose/ 234 … … … 699 … 933
paper66 Broken Hill Proprietary Australia Mining … 173 675 … … … 848
(BHP)67 Sonae de Distribuição Portugal Commerce … 843 … … … … 84368 Parmalat Finanziaria Italy Foodstuffs 130 646 60 … … … 836
S.p.A.69 Praxair Technologies United States Various … 825 … … … … 825
Inc.70 Iberia Líneas Aéreas Spain Transport 808 … … … … … 808
de España SA71 Kraft Foods Inter- United States Foodstuffs 172 320 … … 305 … 797
national b
72 Electricidade de Portugal Electricity … 797 … … … … 797Portugal
73 BP Amoco Plc. United Kingdom Petroleum 319 … … 451 … … 770(British Petroleum)
74 Johnson & Johnson United States Hygiene/ … 680 … 87 … … 767Cleaning
75 Robert Bosch GmbH Germany Motor vehicle … 755 … … … … 755parts
76 Alcoa United States Metals … 745 … … … … 74577 Deere United States Machinery … 194 … … 514 … 70878 Scania AB Sweden Motor vehicle 199 493 … … … … 69279 Grupo André et Cié. Switzerland Chemicals 687 … … … … … 68780 Gillette United States Hygiene/ 199 279 … … 178 … 656
Cleaning81 PSA Peugeot France Motor vehicle 645 … … … … … 645
Citroen S.A.82 The Goodyear Tire & United States Tyres … 558 … 76 … … 634
Rubber Company83 Minnesota Mining & United States Chemicals … 317 50 36 210 … 613
Mfg.(3M)84 Roche Holding Switzerland Chemicals 210 400 … … … … 61085 ENI S.p.A. Italy Petroleum … 566 … … … … 56686 WorldCom United States Telecoms. … 558 … … … … 55887 Phelps Dodge United States Mining … … 469 … … 82 551
Corporation88 Kenworth Motor United States Motor vehicle … … … … 547 … 547
Truck Co.89 Caterpillar United States Machinery. … 370 … … 165 … 53590 Southern Energy United States Electricity … 528 … … … … 528
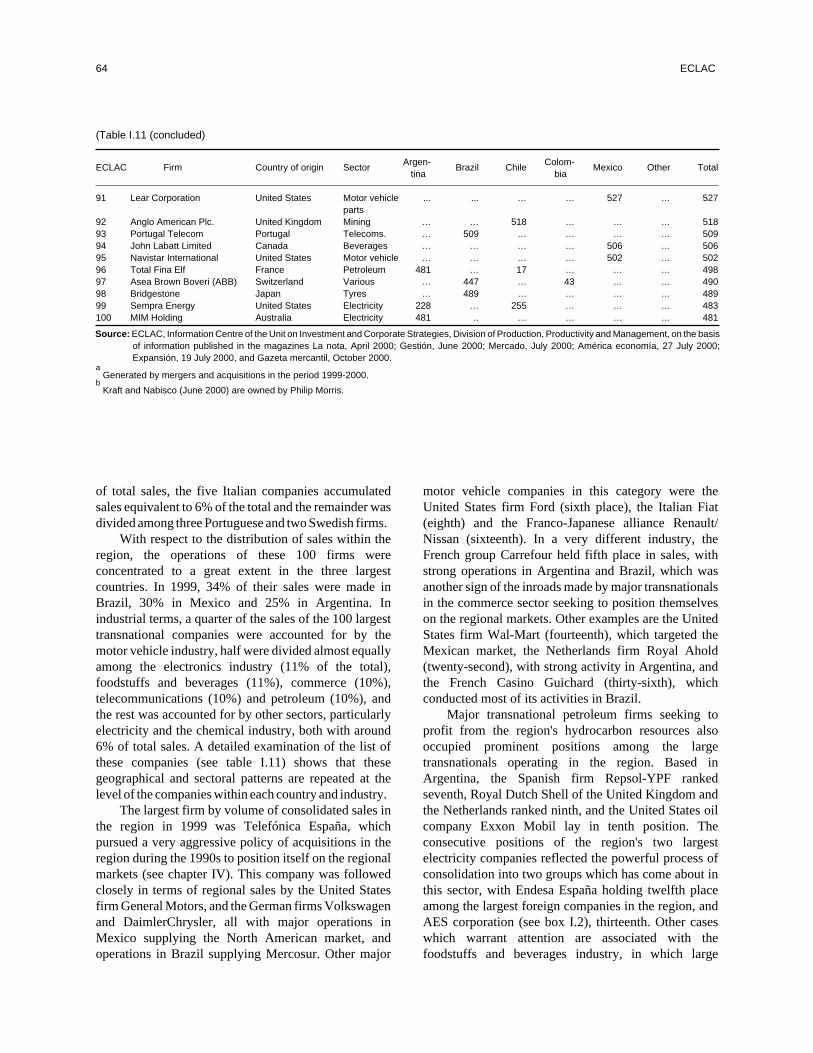
of total sales, the five Italian companies accumulatedsales equivalent to 6% of the total and the remainder wasdivided among three Portuguese and two Swedish firms.
With respect to the distribution of sales within theregion, the operations of these 100 firms wereconcentrated to a great extent in the three largestcountries. In 1999, 34% of their sales were made inBrazil, 30% in Mexico and 25% in Argentina. Inindustrial terms, a quarter of the sales of the 100 largesttransnational companies were accounted for by themotor vehicle industry, half were divided almost equallyamong the electronics industry (11% of the total),foodstuffs and beverages (11%), commerce (10%),telecommunications (10%) and petroleum (10%), andthe rest was accounted for by other sectors, particularlyelectricity and the chemical industry, both with around6% of total sales. A detailed examination of the list ofthese companies (see table I.11) shows that thesegeographical and sectoral patterns are repeated at thelevel of the companies within each country and industry.
The largest firm by volume of consolidated sales inthe region in 1999 was Telefónica España, whichpursued a very aggressive policy of acquisitions in theregion during the 1990s to position itself on the regionalmarkets (see chapter IV). This company was followedclosely in terms of regional sales by the United Statesfirm General Motors, and the German firms Volkswagenand DaimlerChrysler, all with major operations inMexico supplying the North American market, andoperations in Brazil supplying Mercosur. Other major
motor vehicle companies in this category were theUnited States firm Ford (sixth place), the Italian Fiat(eighth) and the Franco-Japanese alliance Renault/Nissan (sixteenth). In a very different industry, theFrench group Carrefour held fifth place in sales, withstrong operations in Argentina and Brazil, which wasanother sign of the inroads made by major transnationalsin the commerce sector seeking to position themselveson the regional markets. Other examples are the UnitedStates firm Wal-Mart (fourteenth), which targeted theMexican market, the Netherlands firm Royal Ahold(twenty-second), with strong activity in Argentina, andthe French Casino Guichard (thirty-sixth), whichconducted most of its activities in Brazil.
Major transnational petroleum firms seeking toprofit from the region's hydrocarbon resources alsooccupied prominent positions among the largetransnationals operating in the region. Based inArgentina, the Spanish firm Repsol-YPF rankedseventh, Royal Dutch Shell of the United Kingdom andthe Netherlands ranked ninth, and the United States oilcompany Exxon Mobil lay in tenth position. Theconsecutive positions of the region's two largestelectricity companies reflected the powerful process ofconsolidation into two groups which has come about inthis sector, with Endesa España holding twelfth placeamong the largest foreign companies in the region, andAES corporation (see box I.2), thirteenth. Other caseswhich warrant attention are associated with thefoodstuffs and beverages industry, in which large
64 ECLAC
(Table I.11 (concluded)
ECLAC Firm Country of origin SectorArgen-
Brazil ChileColom-
Mexico Other Totaltina bia
91 Lear Corporation United States Motor vehicle ... ... … … 527 … 527parts
92 Anglo American Plc. United Kingdom Mining … … 518 … … … 51893 Portugal Telecom Portugal Telecoms. … 509 … … … … 50994 John Labatt Limited Canada Beverages … … … … 506 … 50695 Navistar International United States Motor vehicle … … … … 502 … 50296 Total Fina Elf France Petroleum 481 … 17 … … … 49897 Asea Brown Boveri (ABB) Switzerland Various … 447 … 43 … … 49098 Bridgestone Japan Tyres … 489 … … … … 48999 Sempra Energy United States Electricity 228 … 255 … … … 483100 MIM Holding Australia Electricity 481 .. … … … … 481
Source: ECLAC, Information Centre of the Unit on Investment and Corporate Strategies, Division of Production, Productivity and Management, on the basisof information published in the magazines La nota, April 2000; Gestión, June 2000; Mercado, July 2000; América economía, 27 July 2000;Expansión, 19 July 2000, and Gazeta mercantil, October 2000.
aGenerated by mergers and acquisitions in the period 1999-2000.
bKraft and Nabisco (June 2000) are owned by Philip Morris.

transnationals sought access to regional markets. In thisindustry the Swiss company Nestlé, theBritish-Netherlands Unilever and the United States firmsCargill Incorporated, Pepsi Cola and Coca Cola wereamong the 25 largest transnational companies in theregion. Lastly, in the electronics industry, the UnitedStates firms IBM (eleventh place), Motorola(eighteenth), General Electric (twenty-fifth) andHewlett-Packard (twenty-eighth) focussed their regionaloperations in Mexico on exports to the United States,while Intel (twentieth place) exported large volumesfrom its plant in Costa Rica.
The transnationalization of the region'sproductive sectors that is evident in the above analysiswas also evident in the financial sector in the 1990s. Asshown in table I.12, by 1999 European and NorthAmerican banks had a major presence in several of theregion's countries. Measured by the value ofconsolidated assets across the region, the foreign bankwith the largest presence in 1999 was the Spanishinstitution BSCH, which controlled assets worth over
US$ 80 billion. The second largest Spanish bank in thiscategory was BBVA, which directly controlled assetsof over US$ 28 billion throughout the region, to rankthird behind the United States institution Citibank.Given that BBVA has pursued a strategy based ongaining control of the management of the institutions inwhich it has a stake, without necessarily controlling fullownership, this measurement (the regional institution'stotal assets multiplied by its share in the ownership ofthe transnational bank) underestimates the true extentof BBVA's control over the regional industry in relationto Citibank and other institutions which prefer to owntheir subsidiaries outright. As shown in table I.12, otherEuropean banks among the ten largest transnationalbanks in the region in 1999 included the Netherlandsinstitution ABN Amro, Hong Kong and ShanghaiBanking Holdings of the United Kingdom, and BancaCommerciale Italiana of Italy. From North America,the group of the ten largest includes BankBoston andChase Manhattan (United States) and Bank of NovaScotia and Bank of Montreal (Canada).
Foreign investment in Latin America and the Caribbean, 2000 65
Table I.1210 LARGEST TRANSNATIONAL BANKS IN LATIN AMERICA,
BY CONSOLIDATED ASSETS, 1999(Millions of dollars)
ECLAC Bank Country of origin Argentina Brazil Chile Colombia Mexico PeruVene-
Totalzuela
1 Banco Santander Spain 11 654 17 017 16 798 903 28 664 1 712 3 903 80 651Central Hispano(BSCH)
2 Citibank United States 10 429 6 384 5 630 1 419 7 901 835 … 32 5983 Banco Bilbao Spain 6 606 4 730 2 509 2 362 8 247 1 514 2 007 27 975
Vizcaya Argentaria(BBVA)
4 BankBoston United States 11 350 6 244 6 261 112 516 … … 24 4835 ABN Amro Holding Netherlands 2 802 8 993 3 487 … 115 … … 15 3976 Hongkong and United Kingdom 4 456 7 293 1 298 … 394 … … 13 441
Shanghai BankingHoldings PLC.(HSBC Holdings)
7 Banca Commerciale Italy 2 384 6 491 … 384 … 2 808 … 12 067Italiana
8 Chase Manhattan United States 631 2 010 5 924 … 130 108 8 803Corp.
9 Bank of Nova Scotia(Scotiabank) Canada 2 101 … 4 363 … 112 156 217 6 949
10 Bank of Montreal Canada … … … … 5 720 … … 5 720
Source: ECLAC, Information Centre of the Unit on Investment and Corporate Strategies, Division of Production, Productivity and Management, on the basisof information published in Gazeta mercantil latinoamericana, "1000 Mayores Empresas de América Latina", October 2000.

2. Competitiveness and emerging strategies: the phenomenon ofmergers and acquisitions
As discussed, the trends in FDI flows and changes inindustrial structure in the region in the 1990s reveal twodistinct stages in the process of reform andtransnationalization of the region's economies. After aslow beginning to the reform process, with widespreadinvolvement of regional capital in the first half of thedecade, the second half of the 1990s brought a rapidprocess of change in the different productive sectors,directed and led largely by extraregional capital.Furthermore, FDI flows and the activity of TNCs in theregion in the period 1999-2000 appear to suggest that theregion's industries are now undergoing a third stage ofconsolidation of more global dimensions.
Although the strategies and modalities of marketentry by TNCs and transformation of domesticeconomies have varied substantially between countriesand subregions, some major features are common tomost. Without question, the most innovative forms ofFDI from the standpoint of the region in the last twoyears are mergers and acquisitions, which have becomevery significant mechanisms of market entry orexpansion. This is a reflection of deep-seated globalfactors; in recent years mergers and acquisitions haveserved as an instrument of very rapid change in thestructure of industrial ownership, pointing to radicalrestructuring processes that have an impact at both theglobal and the regional levels. The trends and effects ofthese phenomena within the region will be discussedlater on in varying degrees of detail. Before looking at theregional situation, however, it is useful to situate theregional phenomenon within the wider global context.
(a) Mergers and acquisitions and new features ofcompetitiveness: the global phenomenon
In terms of investment modalities, the mostsignificant global development of recent years has beenthe spiralling number of transborder mergers andacquisitions and the dramatic increase in the amountsinvolved.11 In fact, the annual resources disbursed in this
type of operation almost quadrupled between 1995 and1999, growing from just above US$ 186 billion in themiddle of the decade to over US$ 720 billion by the endof the period. In 1999 alone, transborder merger andacquisition operations involved resources equivalent to8% of world GDP (UNCTAD, 2000). Moreover, theintensive merger and acquisition activity recorded inboth developed and developing countries in 2000 wouldsuggest that the sums involved were even greater thatyear. This very rapid change in the ownership structureof major productive assets reflects a process of industrialrestructuring which has ramifications in almost all theregions of the world. Further analysis is required in orderto understand the determinants and potential effects forLatin America and the Caribbean of the currentexpansion of world FDI flows.
The geographical distribution of transbordermergers and acquisitions provides some pointers to helpcharacterize the underlying phenomenon of industrialrestructuring. Although almost all regions of the worldhave been involved to some extent, it is clear that thesharp increase in mergers and acquisitions in the last fiveyears has been concentrated in the more developedcountries and regions; almost 90% of the resourcesinvolved in transborder mergers and acquisitions in 1999were directed at assets in developed countries.12
Although developing countries also recorded an increasein absolute terms in the resources directed at this type ofoperations, the phenomenon has been highly focussed onthe developed world. The trend of mergers andacquisitions to be concentrated in more developed areasis also apparent within developing regions, where themain targets of mergers and acquisitions resources havebeen relatively high-income countries in South-EastAsia and Latin America, which are regions with moreconsolidated industries.
The sectoral distribution of the firms involved alsoprovides some useful elements for analysis. Onenoteworthy feature in this respect is the virtuallynon-existent incidence of the primary sector among
66 ECLAC
11 It is methodologically incorrect to directly compare the figures for FDI flows from balance-of-payments information with the amountscorresponding to transborder merger and acquisition transactions (see UNCTAD, 2000 for a discussion of methodology). Just as a reference,however, it is interesting to note that the total resources involved in transborder mergers and acquisitions in 1999 were equivalent to almost 95%of global FDI flows that year, and showed similar trends in more recent years (see figure I.6).
12 Although in this text we use the general term "mergers and acquisitions" to refer to these operations, only a very small number of them are puremergers. Thus, although the financial and legal frameworks for these operations and the identity of the parties once the transaction has beencompleted may vary, in the great majority of cases the acquiring and acquired parties can be clearly identified.

either acquired assets or purchasing firms. In 1999 thetotal value of mergers and acquisitions in the primarysector represented barely 1% of the overall value. Incontrast, the process of mergers and acquisitions hasbeen particularly intensive in the services sector, closelyfollowed by manufacturing. In 1999, 56% of the value ofassets purchased through mergers and acquisitions werein the tertiary sector and 43% in manufacturing;moreover, these proportions had been relatively stablethroughout the preceding five-year period. Thesepercentages were not significantly different among thepurchasing companies either, which was attributable tothe fact that a high proportion of transborder mergers andacquisitions took place between companies in the samesector. There were some differences within sectors withrespect to the activities of the buying and bought parties;
further analysis of this may help to pinpoint theunderlying restructuring process.
Examination of the industries of origin of thepurchasing firm and the acquired assets provides somekeys to the competitive factors that influence thedecision to go ahead with a merger or an acquisition. Theproduction or market relationship between the firmsinvolved is particularly revealing. If the firms which joinforces via a merger or an acquisition are in the same areaof production and are therefore actual or potentialcompetitors, the merger or acquisition is of thehorizontal variety, and is usually motivated by the needto economize by consolidating parallel operations and/ormarket power. If the firms are located at different stagesof a production chain, however, then the operation is ofthe vertical type. The motivation in this case is to reduce
Foreign investment in Latin America and the Caribbean, 2000 67
Figure I.6TRANSBORDER MERGERS AND ACQUISITIONS AND FOREIGN DIRECT
INVESTMENT IN DEVELOPED COUNTRIES(Billions of dollars)
19901991
19921993
19941995
19961997
19981999
M&A in developed countries
FDI in developed countries
0
100
200
300
400
500
600
700
800
Source: ECLAC, Information Centre, Unit on Investment and Corporate Strategies, Division of Production, Productivity and Management, onthe basis of the International Monetary Fund (IMF), United Nations Conference on Trade and Development (UNCTAD), WorldInvestment Report 2000: Cross-border Merger and Acquisitions and Development (UNCTAD/WIR/(2000)), New York. UnitedNations publication, Sales No. E.00.II.D.20.
transaction costs and uncertainties within the productionchain. A third possibility is that the firms are not relatedat all, and therefore form a conglomerate. In this case theoperations seek to reduce risk or to generate economiesof scope. Horizontal operations were the main driver ofthe process in recent years, with a value equivalent to70% of total transborder mergers and acquisitions in1999. The total value of vertical operations did not reach10% of the total in any single year of the decade and thevalue of conglomerate operations decreased from over40% of the total in 1991 to 27% in 1999 (UNCTAD,2000).
The global wave of mergers and acquisitions at theend of the 1990s was therefore highly concentrated inhorizontal consolidations. Observation of the industriesmost heavily involved in the process gives an insightinto some of the more long-term determinants of thistrend. The industries most involved are those in whichthe parameters that define competitiveness havechanged very rapidly � in different ways� in recentyears in the wake of global technological andinstitutional changes linked to the process ofglobalization. In terms of the institutional framework,deregulation and the increase in trade and investmentflows and in cultural exchanges have accelerated theformation of markets which � even if they cannot bedescribed as genuinely global� cover increasinglyextensive areas of the globe. Deregulation has alsoallowed major actors greater freedom to try to increasetheir market influence and capture monopoly rents. Withregard to technology, change has come about in at leasttwo significant dimensions. The first concerns the speedand strategic nature of technological change in someindustries, in which competitiveness hinges on theability to assimilate new technology rapidly. The secondtechnological dimension concerns the impact of thedigital revolution and the development oftelecommunications on the capacity of firms to handlegreat volumes of information over large geographicaldistances, and on the development of cultural codes andpatterns of consumption that are increasingly global.
Although the general determinants are common, thespecific motivations for consolidation thus vary fromone industry to another, depending on the factors thatdetermine competitiveness in each. It is possible todistinguish at least two overall types of industry that havewitnessed strong consolidation through mergers andacquisitions in recent years. The first group includesactivities which are very capital intensive and/or heavilydependent on technological innovation, such as themotor vehicle, pharmaceutical, telecommunications (seechapter IV for an account of this sector), electricity and
banking industries. In this case, horizontal mergers andacquisitions reduce competition, eliminate excesscapacity and spread the high costs of research anddevelopment. The second type of group covers activitieswith relatively standardized products which are directedalmost wholly at the final consumer. Although lessdependent on technological innovation, these industries� such as foodstuffs, beverages, tobacco and clothing�rely heavily on marketing and distribution activities. Aswell as reducing competition, mergers and acquisitionsin these industries serve to generate economies of scalein marketing and distribution and increase negotiatingcapacity with suppliers. It is not surprising, therefore,that during recent years the pattern of industrialconcentration at the world level has become moremarked in these industries also.
The depth of the industrial restructuring process ledby large transnational companies raises questions aboutthe distribution between actors and regions of thebenefits of the technological and institutional changes inthe global economy. It is extremely important to graspthe impact of these changes on the countries of theregion, in terms of both the well-being of theirpopulations and their potential for economicdevelopment. The rest of this chapter seeks to contributeto a reflection on this issue by providing a brief overviewof merger and acquisition patterns in Latin America inthe last two years.
(b) Mergers and acquisitions: the regional impactin 1999-2000
The global process of mergers and acquisitions hashad both direct and indirect effects on Latin Americaand the Caribbean. The direct effects concern the localconsequences of the phenomenon as regionalproduction units are acquired by extraregionalcompanies and the industries in which they operate arerestructured and consolidated. The indirect effects referto the impact of certain extraregional acquisitions ormergers on the industrial map of the region, as they alterthe structure of ownership of subsidiaries in LatinAmerica.
The rest of this section will focus on the directimpact of the process of mergers and acquisitions in theregion, examining both sectoral and industrial trends andthe features of restructuring processes that involvemergers and acquisitions in specific industries.Nevertheless, it is important to bear in mind that mergersand acquisitions outside the region can affect industriesin the region. Some recent examples are the mergersbetween the main Spanish banks, the Renault-Nissan
68 ECLAC
merger, and, had it gone ahead, the potential impact ofthe merger between the Spanish energy companiesEndesa and Iberdrola that was proposed in 2000.13 Byconsolidating their investments in the region, the largeSpanish banking mergers that generated BBVA andBSCH sharply increased the concentration of thebanking industry in some countries of the Americas (seebox I.1). The merger of Renault and Nissan enabled thesecompanies to consolidate and rationalize their assets inthe region; it has already been announced that theMexican Nissan plants in Aguascalientes andCuernavaca will begin producing Renault automobiles,while the Renault plant in Argentina will produce Nissanautomobiles. Had it not been called off, the mergerbetween Iberdrola and Endesa España would haveconsolidated assets which the two companies controlseparately in Brazil, on the one hand, and Colombia andChile, on the other, causing problems of industrialconcentration, particularly in Brazil. Under Brazilianlaw, no single company may control a market share ofmore than 35% of the area in which it operates or morethan 25% of the national total, meaning that the mergedinstitution would have had to sell assets in thenortheastern Brazil to comply with this legislation(América economía, 25 January 2001).
One of the fundamental changes in the pattern ofacquisitions of firms in the region in the last bienniumwas a relative decrease in the purchase of State-ownedassets as a market-entry mechanism and a sharp increasein acquisitions of private companies. The drop in FDIinflows through the sale of State assets is a region-widephenomenon that is attributable to the natural end of theprocess: after a decade of very intensive privatizationactivity (see table I.8), most of the traditional Stateenterprises in the areas of telecommunications, energyand finance were already in private hands. In recent yearstenders and licensing of public services to the privatesector have increased, partially offsetting the decline inlarge privatizations of previous years; even so, the totalresources involved in privatizations, concessions andtenders together has fallen both in absolute terms andrelative to total FDI flows. In the biennium 1999-2000,total resources involved in operations worth overUS$ 100 million amounted to US$ 19.462 billion (seetable I.13), which was much lower than the figure ofUS$ 87.518 billion recorded in mergers and acquisitionsof private companies involving over US$ 100 million inthe region in the same period.
In the category of privatizations, concessions andtenders involving more than US$ 100 million in theperiod 1999-2000, large operations in the primary sectorincluded Repsol's purchase of the share of YPF that wasstill controlled by the Argentine State, at a cost ofUS$ 2.011 billion, and the concession awarded by thePeruvian Government to a consortium of Argentine,United States and Korean companies to operate theCamisea gas field. The services sector saw privatizationsin 1999-2000 for over US$ 100 million involvingBritish, French, Spanish and United States companies inArgentina and Chile, and concessions were awarded toforeign companies to operate airports in Colombia,Costa Rica, Chile, Mexico and the Dominican Republic.Although to a lesser extent than in earlier years, thesectors traditionally associated with privatizations alsorecorded some operations of over US$ 100 million in thebiennium: in the energy sector assets were privatized inBrazil, Ecuador, El Salvador, Guatemala, Mexico, Peruand the Dominican Republic, involving United Statesand European companies, and in telecommunicationscellular telephony concessions were awarded inArgentina, Brazil and Peru. The largest privatization ofthe biennium in terms of resources disbursed took placein the financial sector, with the purchase of Banespa inBrazil by BSCH at a cost of US$ 3.55 billion in 2000 (seebox I.3).
As mentioned earlier, most of the regional mergersand acquisitions in the last biennium involved purchasesof private firms (see table I.14). The largest operation ofthis type in the primary sector was Repsol's acquisition of83.2% of the shares of the Argentine company YPF fromprivate shareholders for a total price of US$ 13.158billion. In the manufacturing sector, the relatively smallnumber of operations involving over US$ 100 millionincluded the United States firm Bestfoods' purchase ofthe foodstuffs company Arisco Industrial in Brazil forUS$ 752 million and the acquisition by Aladis of Spainof a 50% stake in the tobacco company Habanos de Cubaat a cost of US$ 500 million. Operations in the electricitysector in the period included three large acquisitions, in2000, by the United States firm AES Corporation inBrazil, Chile and Argentina, for over US$ 1 billionapiece (see box I.2). Also in the electricity sector, in 1999Endesa España gained control of the Chilean companyEnersis for US$ 2.146 billion and, through Enersis,acquired control of Endesa Chile with a capital outlay ofUS$ 1.45 billion. The commerce sector also saw
Foreign investment in Latin America and the Caribbean, 2000 69
13 The failure of the merger being negotiated by the two companies, which was announced on 5 February 2001, was largely due to a decision handeddown by a Spanish court which amended some of the rules governing operations in the country's electricity sector and would have obliged thecompany resulting from the proposed merger to sell a number of assets.

70 ECLAC
Table I.13LATIN AMERICA AND THE CARIBBEAN: PRIVATIZATIONS AND TENDERS
INVOLVING FOREIGN INVESTMENTS OF OVER US$ 100 MILLION,BY SECTOR AND AMOUNT, 1999-2000
(Millions of dollars)
Country of PercentageFirm Country Buyer origin of foreign Amount Year
capital
1. PRIMARY SECTORS 4 681OIL AND GAS 4 157Yacimientos Petrolíferos Argentina Repsol-YPF Spain 15.0 2 011 1999Fiscales (YPF)Reserva de Gas Camisea Peru Pluspetrol Energy S.A. Argentina 1 600 2000
Hunt Oil Co. United StatesSK Corporation Korea
First round of oil blocks Brazil Exxon Mobil Corporation United States 286 1999Elf Aquitaine FranceRepsol-YPF SpainRoyal Dutch-Shell NetherlandsGroup
Concession of 21 Brazil Petroleum Brasileiro SA Brazil 260 2000exploration areas (PETROBRAS)
Companhia Brasileira Brazilde Petróleo IpirangaChevron Corporation United StatesQueiroz Galvão Brazil
MINERAL EXTRACTION 524Construction of Antamina Peru Spie Capag S.A. France 140 2000slurry line Ingenieros Civiles y Peru
Contratistas GeneralesS.A.(ICCGSA)
Cerrejón Zona Norte Colombia Anglo American P.L.C. United Kingdom 16.7 128 2000(CZN) Coal MineCerrejón Zona Norte Colombia Billiton P.L.C. United Kingdom 16.7 128 2000(CZN) Coal MineCerrejón Zona Norte Colombia Glencore International Switzerland 16.7 128 2000(CZN) Coal Mine A.G.
2. MANUFACTURES 0
3. SERVICES 14 781
WATER 2 504Companhia de Generação Brazil Duke Energy United States 39.0 692 1999de Energia ElétricaParanapa-NemaEmpresa Metropolitana de Chile Suez Lyonnaise des France 25.6 492 1999Obras Sanitarias (EMOS) EauxEmpresa Metropolitana de Chile Aguas de Barcelona Spain 25.6 492 1999Obras Sanitarias (EMOS) (AGBAR)Operation of sanitation Argentina Azurix United States 439 1999services in Buenos AiresESSBÍO (Empresa de Chile Thames Water P.L.C. United Kingdom 42.0 282 2000Servicios Sanitarios delBío-Bío)Water and refuse services Brazil Suez Lyonnaise des France 107 2000of Manaus Saneamiento Eaux

Foreign investment in Latin America and the Caribbean, 2000 71
Cuadro I.13 (continued)
Country of PercentageFirm Country Buyer origin of foreign Amount Year
capital
TRANSPORT 1 428Operation of four Dominican Ogden Corp. United States 400 1999airports RepublicJuan Santamaría de Costa Rica Airport Group United States 279 1999San José Airport International (AGI)Operation South-East Mexico Groupe GTM France 276 1999Airport Controladora Interna- Mexico
cional de transporteaéreo (CINTRAS.A. de C.V.)Copenhagen Airport Denmark
Alfonso Bonilla Aragón Colombia Consorcio Aerocali S.A. Colombia 120 2000AirportOperation of two rail Colombia Red Nacional de Spain 120 2000network systems Ferrocarriles (RENFE)
Ferrocarriles de la SpainGeneralitat de Cataluña(FGC)
Port of San Antonio Chile Sudamericana Agencias Chile 121 1999Aéreas y Marítimas(SAAM)SAA Holding Chile
Second urban concession Chile Grupo Dragados Spain 112 2000North-South system
Skanska BOT AB SwedenEmpresa Constructora ChileBrotec S.A.Empresa Constructora ChileBelfi S.A.
ELECTRIC POWER 4 314Companhia Energética de Brazil Iberdrola S.A. Spain 79.6 1 000 2000Pernambuco (CELPE)CESP- Hidrovia Tiete-Paraná Brazil The AES Corp. United States 38.7 480 1999Bajio Power Project Mexico Intergen Aztec Energy Mexico 430 1999Electricity generation Ecuador Wartsila Power Finland 350 1999Building and Operation Mexico Intergen Aztec Energy Mexico 335 2000Rosarito IVGas distribution to south Brazil Gas Natural SDG Spain 298 2000São PauloEmpresa de Distribución de Dominican Unión Fenosa Desarro- Spain 50.0 212 1999Energía Eléctrica Norte y Sur Republic llo y Acción Exterior
(Ufacex)Termoeléctrica Campeche Mexico Transalta Canada 200 2000Companhia de Electricidade Brazil Consorcio Guaraniana Brazil 31.3 185 1999do Estado da Bahia
Empresa Generadora de Dominican Enron United States 50.0 145 1999Electricidad Haina RepublicGeneradora Acajutja S.A. El Salvador Duke Energy United States 80.0 125 1999Construction of Represa Peru Lockheed Martin United States 124 1999CuchiqueseraEmpresa de Generación Peru Duke Energy United States 30.0 112 2000Eléctrica Norperú (EGENOR)Empresa Distribuidora Dominican The AES Corp. United States 50.0 109 1999Eléctrica del Este RepublicCompanhia Energética do Brazil Eletrobrás (Eletrobras) Brazil 96.4 108 2000Amazonas (CEAM)
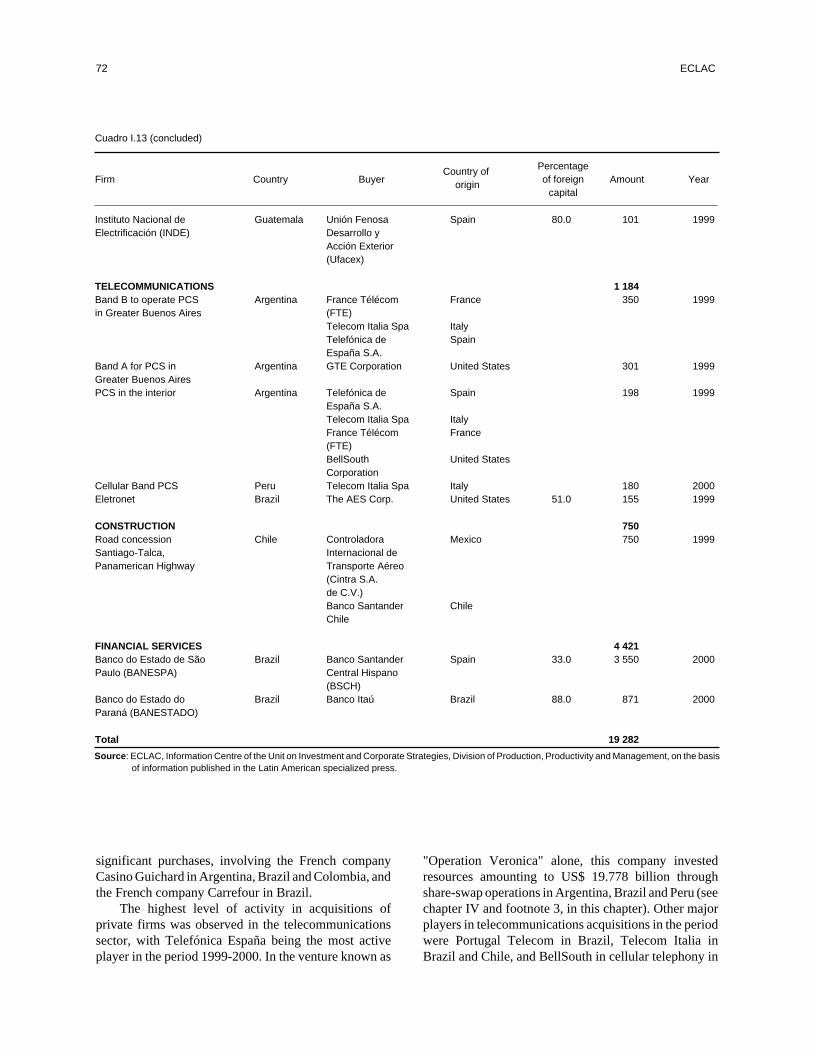
significant purchases, involving the French companyCasino Guichard in Argentina, Brazil and Colombia, andthe French company Carrefour in Brazil.
The highest level of activity in acquisitions ofprivate firms was observed in the telecommunicationssector, with Telefónica España being the most activeplayer in the period 1999-2000. In the venture known as
"Operation Veronica" alone, this company investedresources amounting to US$ 19.778 billion throughshare-swap operations in Argentina, Brazil and Peru (seechapter IV and footnote 3, in this chapter). Other majorplayers in telecommunications acquisitions in the periodwere Portugal Telecom in Brazil, Telecom Italia inBrazil and Chile, and BellSouth in cellular telephony in
72 ECLAC
Cuadro I.13 (concluded)
Country of PercentageFirm Country Buyer origin of foreign Amount Year
capital
Instituto Nacional de Guatemala Unión Fenosa Spain 80.0 101 1999Electrificación (INDE) Desarrollo y
Acción Exterior(Ufacex)
TELECOMMUNICATIONS 1 184Band B to operate PCS Argentina France Télécom France 350 1999in Greater Buenos Aires (FTE)
Telecom Italia Spa ItalyTelefónica de SpainEspaña S.A.
Band A for PCS in Argentina GTE Corporation United States 301 1999Greater Buenos AiresPCS in the interior Argentina Telefónica de Spain 198 1999
España S.A.Telecom Italia Spa ItalyFrance Télécom France(FTE)BellSouth United StatesCorporation
Cellular Band PCS Peru Telecom Italia Spa Italy 180 2000Eletronet Brazil The AES Corp. United States 51.0 155 1999
CONSTRUCTION 750Road concession Chile Controladora Mexico 750 1999Santiago-Talca, Internacional dePanamerican Highway Transporte Aéreo
(Cintra S.A.de C.V.)Banco Santander ChileChile
FINANCIAL SERVICES 4 421Banco do Estado de São Brazil Banco Santander Spain 33.0 3 550 2000Paulo (BANESPA) Central Hispano
(BSCH)Banco do Estado do Brazil Banco Itaú Brazil 88.0 871 2000Paraná (BANESTADO)
Total 19 282
Source: ECLAC, Information Centre of the Unit on Investment and Corporate Strategies, Division of Production, Productivity and Management, on the basisof information published in the Latin American specialized press.
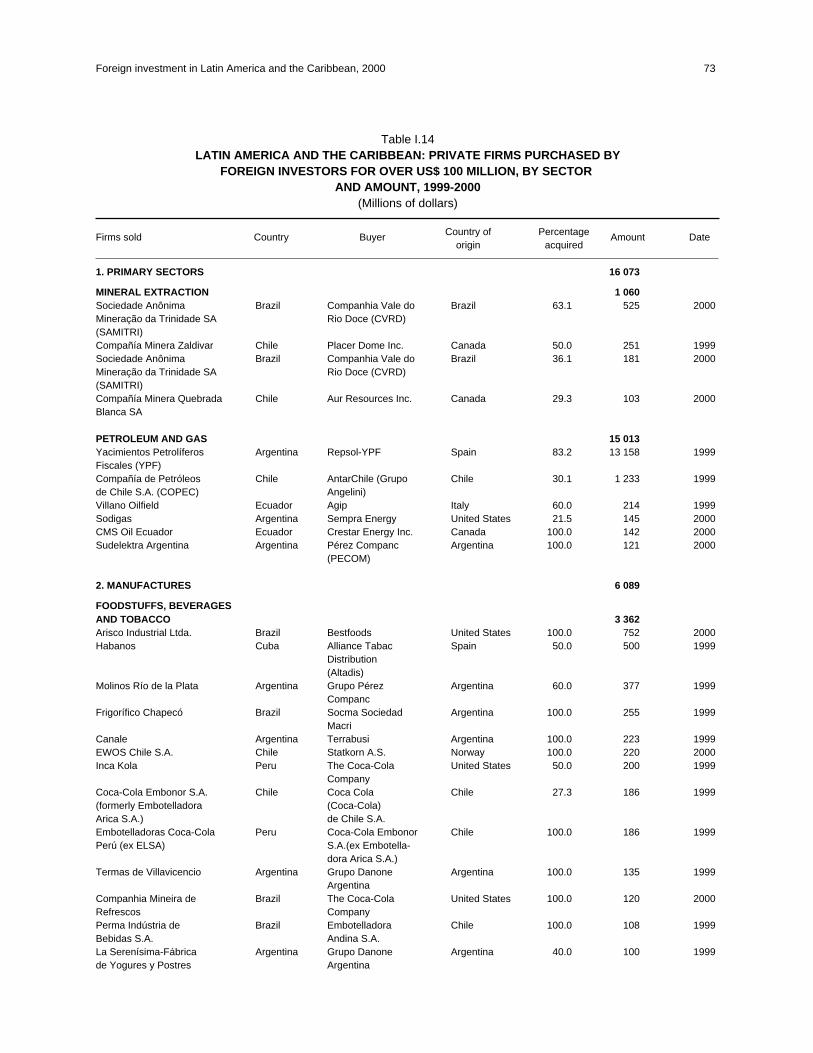
Foreign investment in Latin America and the Caribbean, 2000 73
Table I.14LATIN AMERICA AND THE CARIBBEAN: PRIVATE FIRMS PURCHASED BY
FOREIGN INVESTORS FOR OVER US$ 100 MILLION, BY SECTORAND AMOUNT, 1999-2000
(Millions of dollars)
Firms sold Country Buyer Country of Percentage Amount Dateorigin acquired
1. PRIMARY SECTORS 16 073
MINERAL EXTRACTION 1 060Sociedade Anônima Brazil Companhia Vale do Brazil 63.1 525 2000Mineração da Trinidade SA Rio Doce (CVRD)(SAMITRI)Compañía Minera Zaldivar Chile Placer Dome Inc. Canada 50.0 251 1999Sociedade Anônima Brazil Companhia Vale do Brazil 36.1 181 2000Mineração da Trinidade SA Rio Doce (CVRD)(SAMITRI)Compañía Minera Quebrada Chile Aur Resources Inc. Canada 29.3 103 2000Blanca SA
PETROLEUM AND GAS 15 013Yacimientos Petrolíferos Argentina Repsol-YPF Spain 83.2 13 158 1999Fiscales (YPF)Compañía de Petróleos Chile AntarChile (Grupo Chile 30.1 1 233 1999de Chile S.A. (COPEC) Angelini)Villano Oilfield Ecuador Agip Italy 60.0 214 1999Sodigas Argentina Sempra Energy United States 21.5 145 2000CMS Oil Ecuador Ecuador Crestar Energy Inc. Canada 100.0 142 2000Sudelektra Argentina Argentina Pérez Companc Argentina 100.0 121 2000
(PECOM)
2. MANUFACTURES 6 089
FOODSTUFFS, BEVERAGESAND TOBACCO 3 362Arisco Industrial Ltda. Brazil Bestfoods United States 100.0 752 2000Habanos Cuba Alliance Tabac Spain 50.0 500 1999
Distribution(Altadis)
Molinos Río de la Plata Argentina Grupo Pérez Argentina 60.0 377 1999Companc
Frigorífico Chapecó Brazil Socma Sociedad Argentina 100.0 255 1999Macri
Canale Argentina Terrabusi Argentina 100.0 223 1999EWOS Chile S.A. Chile Statkorn A.S. Norway 100.0 220 2000Inca Kola Peru The Coca-Cola United States 50.0 200 1999
CompanyCoca-Cola Embonor S.A. Chile Coca Cola Chile 27.3 186 1999(formerly Embotelladora (Coca-Cola)Arica S.A.) de Chile S.A.Embotelladoras Coca-Cola Peru Coca-Cola Embonor Chile 100.0 186 1999Perú (ex ELSA) S.A.(ex Embotella-
dora Arica S.A.)Termas de Villavicencio Argentina Grupo Danone Argentina 100.0 135 1999
ArgentinaCompanhia Mineira de Brazil The Coca-Cola United States 100.0 120 2000Refrescos CompanyPerma Indústria de Brazil Embotelladora Chile 100.0 108 1999Bebidas S.A. Andina S.A.La Serenísima-Fábrica Argentina Grupo Danone Argentina 40.0 100 1999de Yogures y Postres Argentina
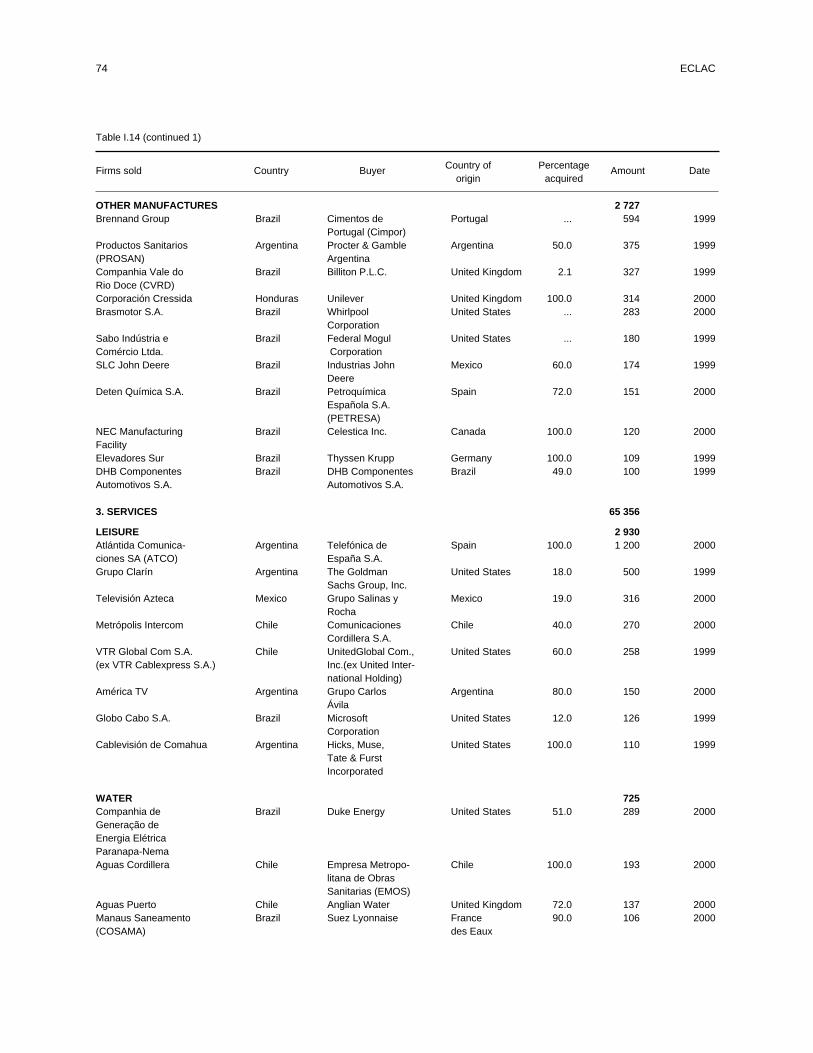
74 ECLAC
Table I.14 (continued 1)
Firms sold Country Buyer Country of Percentage Amount Dateorigin acquired
OTHER MANUFACTURES 2 727Brennand Group Brazil Cimentos de Portugal ... 594 1999
Portugal (Cimpor)Productos Sanitarios Argentina Procter & Gamble Argentina 50.0 375 1999(PROSAN) ArgentinaCompanhia Vale do Brazil Billiton P.L.C. United Kingdom 2.1 327 1999Rio Doce (CVRD)Corporación Cressida Honduras Unilever United Kingdom 100.0 314 2000Brasmotor S.A. Brazil Whirlpool United States ... 283 2000
CorporationSabo Indústria e Brazil Federal Mogul United States ... 180 1999Comércio Ltda. CorporationSLC John Deere Brazil Industrias John Mexico 60.0 174 1999
DeereDeten Química S.A. Brazil Petroquímica Spain 72.0 151 2000
Española S.A.(PETRESA)
NEC Manufacturing Brazil Celestica Inc. Canada 100.0 120 2000FacilityElevadores Sur Brazil Thyssen Krupp Germany 100.0 109 1999DHB Componentes Brazil DHB Componentes Brazil 49.0 100 1999Automotivos S.A. Automotivos S.A.
3. SERVICES 65 356
LEISURE 2 930Atlántida Comunica- Argentina Telefónica de Spain 100.0 1 200 2000ciones SA (ATCO) España S.A.Grupo Clarín Argentina The Goldman United States 18.0 500 1999
Sachs Group, Inc.Televisión Azteca Mexico Grupo Salinas y Mexico 19.0 316 2000
RochaMetrópolis Intercom Chile Comunicaciones Chile 40.0 270 2000
Cordillera S.A.VTR Global Com S.A. Chile UnitedGlobal Com., United States 60.0 258 1999(ex VTR Cablexpress S.A.) Inc.(ex United Inter-
national Holding)América TV Argentina Grupo Carlos Argentina 80.0 150 2000
ÁvilaGlobo Cabo S.A. Brazil Microsoft United States 12.0 126 1999
CorporationCablevisión de Comahua Argentina Hicks, Muse, United States 100.0 110 1999
Tate & FurstIncorporated
WATER 725Companhia de Brazil Duke Energy United States 51.0 289 2000Generação deEnergia ElétricaParanapa-NemaAguas Cordillera Chile Empresa Metropo- Chile 100.0 193 2000
litana de ObrasSanitarias (EMOS)
Aguas Puerto Chile Anglian Water United Kingdom 72.0 137 2000Manaus Saneamento Brazil Suez Lyonnaise France 90.0 106 2000(COSAMA) des Eaux
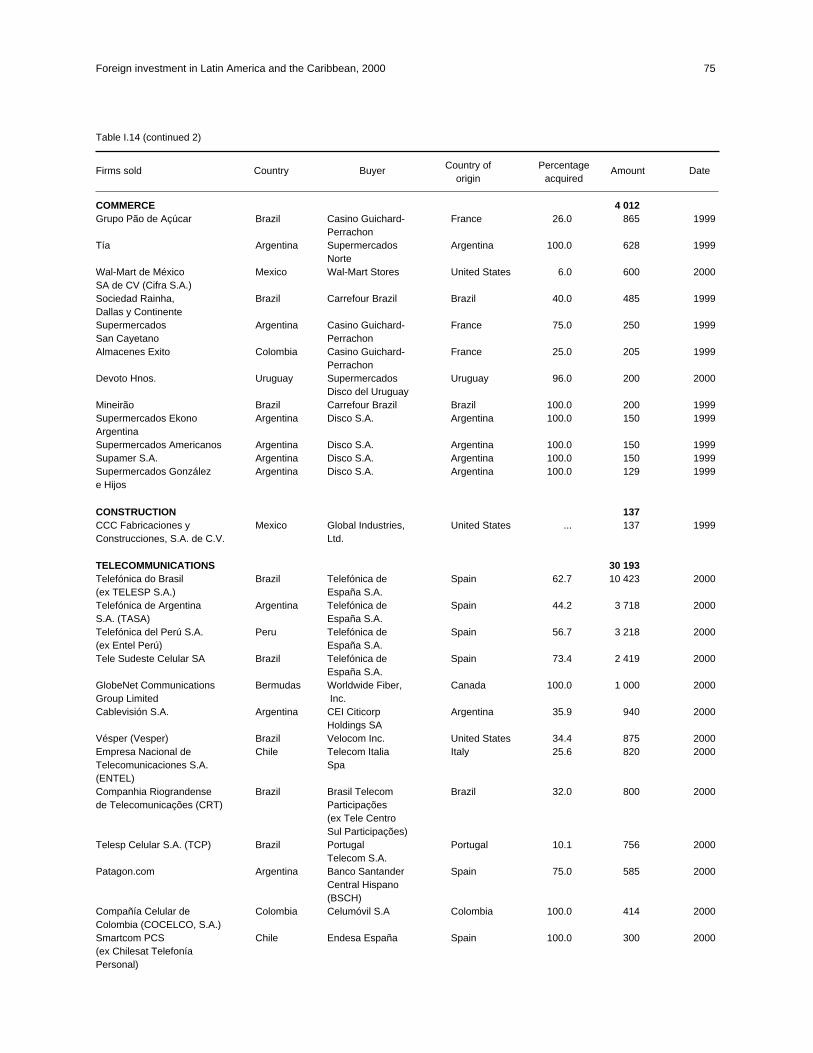
Foreign investment in Latin America and the Caribbean, 2000 75
Table I.14 (continued 2)
Firms sold Country Buyer Country of Percentage Amount Dateorigin acquired
COMMERCE 4 012Grupo Pão de Açúcar Brazil Casino Guichard- France 26.0 865 1999
PerrachonTía Argentina Supermercados Argentina 100.0 628 1999
NorteWal-Mart de México Mexico Wal-Mart Stores United States 6.0 600 2000SA de CV (Cifra S.A.)Sociedad Rainha, Brazil Carrefour Brazil Brazil 40.0 485 1999Dallas y ContinenteSupermercados Argentina Casino Guichard- France 75.0 250 1999San Cayetano PerrachonAlmacenes Exito Colombia Casino Guichard- France 25.0 205 1999
PerrachonDevoto Hnos. Uruguay Supermercados Uruguay 96.0 200 2000
Disco del UruguayMineirão Brazil Carrefour Brazil Brazil 100.0 200 1999Supermercados Ekono Argentina Disco S.A. Argentina 100.0 150 1999ArgentinaSupermercados Americanos Argentina Disco S.A. Argentina 100.0 150 1999Supamer S.A. Argentina Disco S.A. Argentina 100.0 150 1999Supermercados González Argentina Disco S.A. Argentina 100.0 129 1999e Hijos
CONSTRUCTION 137CCC Fabricaciones y Mexico Global Industries, United States ... 137 1999Construcciones, S.A. de C.V. Ltd.
TELECOMMUNICATIONS 30 193Telefónica do Brasil Brazil Telefónica de Spain 62.7 10 423 2000(ex TELESP S.A.) España S.A.Telefónica de Argentina Argentina Telefónica de Spain 44.2 3 718 2000S.A. (TASA) España S.A.Telefónica del Perú S.A. Peru Telefónica de Spain 56.7 3 218 2000(ex Entel Perú) España S.A.Tele Sudeste Celular SA Brazil Telefónica de Spain 73.4 2 419 2000
España S.A.GlobeNet Communications Bermudas Worldwide Fiber, Canada 100.0 1 000 2000Group Limited Inc.Cablevisión S.A. Argentina CEI Citicorp Argentina 35.9 940 2000
Holdings SAVésper (Vesper) Brazil Velocom Inc. United States 34.4 875 2000Empresa Nacional de Chile Telecom Italia Italy 25.6 820 2000Telecomunicaciones S.A. Spa(ENTEL)Companhia Riograndense Brazil Brasil Telecom Brazil 32.0 800 2000de Telecomunicações (CRT) Participações
(ex Tele CentroSul Participações)
Telesp Celular S.A. (TCP) Brazil Portugal Portugal 10.1 756 2000Telecom S.A.
Patagon.com Argentina Banco Santander Spain 75.0 585 2000Central Hispano(BSCH)
Compañía Celular de Colombia Celumóvil S.A Colombia 100.0 414 2000Colombia (COCELCO, S.A.)Smartcom PCS Chile Endesa España Spain 100.0 300 2000(ex Chilesat TelefoníaPersonal)
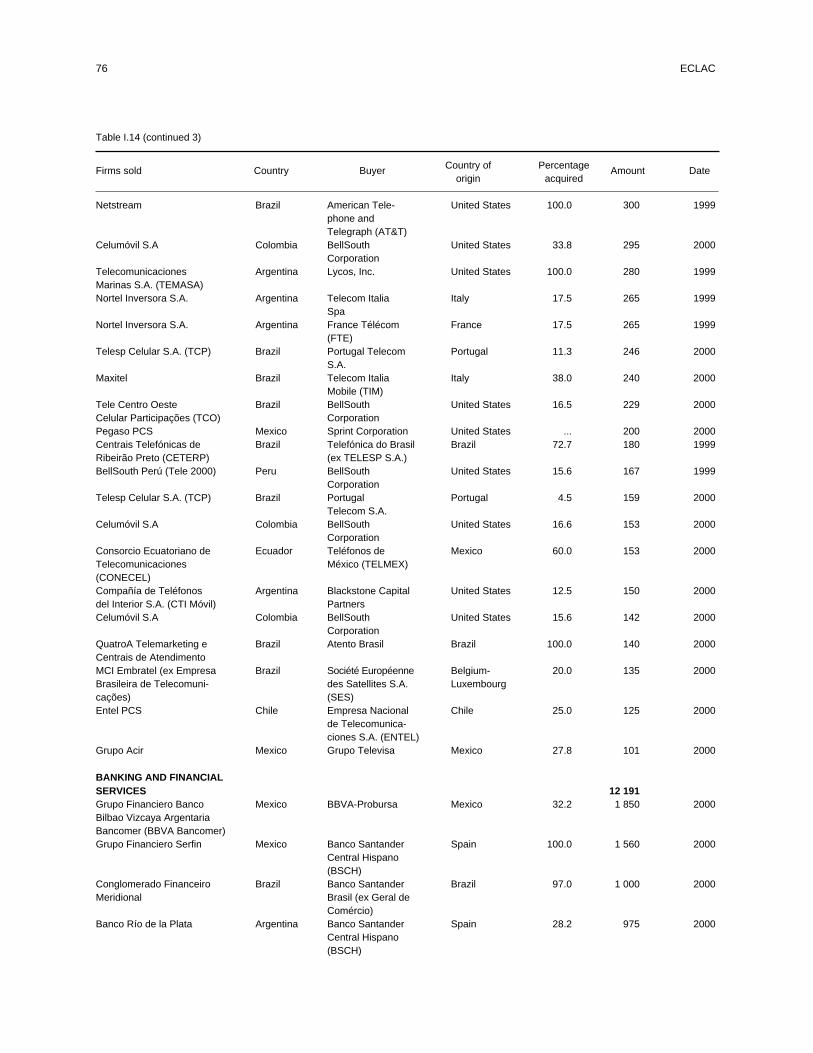
76 ECLAC
Table I.14 (continued 3)
Firms sold Country Buyer Country of Percentage Amount Dateorigin acquired
Netstream Brazil American Tele- United States 100.0 300 1999phone andTelegraph (AT&T)
Celumóvil S.A Colombia BellSouth United States 33.8 295 2000Corporation
Telecomunicaciones Argentina Lycos, Inc. United States 100.0 280 1999Marinas S.A. (TEMASA)Nortel Inversora S.A. Argentina Telecom Italia Italy 17.5 265 1999
SpaNortel Inversora S.A. Argentina France Télécom France 17.5 265 1999
(FTE)Telesp Celular S.A. (TCP) Brazil Portugal Telecom Portugal 11.3 246 2000
S.A.Maxitel Brazil Telecom Italia Italy 38.0 240 2000
Mobile (TIM)Tele Centro Oeste Brazil BellSouth United States 16.5 229 2000Celular Participações (TCO) CorporationPegaso PCS Mexico Sprint Corporation United States ... 200 2000Centrais Telefónicas de Brazil Telefónica do Brasil Brazil 72.7 180 1999Ribeirão Preto (CETERP) (ex TELESP S.A.)BellSouth Perú (Tele 2000) Peru BellSouth United States 15.6 167 1999
CorporationTelesp Celular S.A. (TCP) Brazil Portugal Portugal 4.5 159 2000
Telecom S.A.Celumóvil S.A Colombia BellSouth United States 16.6 153 2000
CorporationConsorcio Ecuatoriano de Ecuador Teléfonos de Mexico 60.0 153 2000Telecomunicaciones México (TELMEX)(CONECEL)Compañía de Teléfonos Argentina Blackstone Capital United States 12.5 150 2000del Interior S.A. (CTI Móvil) PartnersCelumóvil S.A Colombia BellSouth United States 15.6 142 2000
CorporationQuatroA Telemarketing e Brazil Atento Brasil Brazil 100.0 140 2000Centrais de AtendimentoMCI Embratel (ex Empresa Brazil Société Européenne Belgium- 20.0 135 2000Brasileira de Telecomuni- des Satellites S.A. Luxembourgcações) (SES)Entel PCS Chile Empresa Nacional Chile 25.0 125 2000
de Telecomunica-ciones S.A. (ENTEL)
Grupo Acir Mexico Grupo Televisa Mexico 27.8 101 2000
BANKING AND FINANCIALSERVICES 12 191Grupo Financiero Banco Mexico BBVA-Probursa Mexico 32.2 1 850 2000Bilbao Vizcaya ArgentariaBancomer (BBVA Bancomer)Grupo Financiero Serfin Mexico Banco Santander Spain 100.0 1 560 2000
Central Hispano(BSCH)
Conglomerado Financeiro Brazil Banco Santander Brazil 97.0 1 000 2000Meridional Brasil (ex Geral de
Comércio)Banco Río de la Plata Argentina Banco Santander Spain 28.2 975 2000
Central Hispano(BSCH)

Foreign investment in Latin America and the Caribbean, 2000 77
Table I.14 (continued 4)
Firms sold Country Buyer Country of Percentage Amount Dateorigin acquired
Banco Bandeirantes Brazil Unibanco (União de Brazil 90.0 670 2000Bancos Brasileiros)
Banco Santiago Chile Banco Santander Spain 21.8 600 1999Central Hispano(BSCH)
Seguros Monterrey Mexico New York Life United States ... 570 2000Insurance
Seguros Comercial Mexico Internationale Neder- Netherlands 28.0 555 2000América (SCA) landen Group (ING)Banco de Chile Chile Holding Quiñenco Chile 35.0 542 2000
S.A.(Luksic)AFJP Previnter Argentina AFJP Orígenes Argentina 45.0 330 2000Banca Promex Mexico Grupo Financiero Mexico 100.0 282 2000
BancomerGrupo Siembra Argentina Citibank United States 50.0 280 2000AFP Provida S.A. Chile Banco Bilbao Spain 40.7 266 1999
Vizcaya Argentaria(BBVA)
Seguros Bital Mexico ING Baring Netherlands 49.0 225 1999Interbank Venezuela Venezuela Banco Mercantil Venezuela 97.0 218 2000
VenezuelaAFJP Consolidar Argentina Banco Bilbao Spain 36.0 200 1999
Vizcaya Argentaria(BBVA)
Banco Caja de Ahorro S.A. Argentina Banca Commerciale Italy 85.0 200 2000Italiana
Banco Caracas Venezuela Banco de Venezuela Venezuela 66.0 200 2000Afore Bital Mexico ING Bank Netherlands 51.0 196 2000Banco del Suquía Argentina Banco Bisel Argentina 72.2 189 2000Banco Wiese Sudameris Perú Peru Banco Sudameris France 64.8 180 1999Afore Garante Mexico Citibank United States 51.0 179 2000AFJP Previnter Argentina AFJP Orígenes Argentina 10.0 165 2000BRS Investment Argentina Merrill Lynch United States 100.0 162 2000AFP Unión Peru AFP Nueva Vida Peru 100.0 135 1999Asistencia Médica Social Argentina Aetna United States 100.0 120 1999Argentina S.A. (AMSA)Banco Sudamericano Chile Bank of Nova Canada 33.0 116 1999
Scotia (Scotiabank)Banco Caracas Venezuela Banco de Venezuela Venezuela 27.1 116 2000Banco Patrimonio de Brazil Chase Manhattan United States 100.0 110 1999Investimento Corp.
HOTELS AND RESTAURANTS 668Allegro Resorts Dominican Occidental Hoteles Spain 100.0 400 2000
RepublicHoteles Camino Real- Mexico Grupo Empresarial Mexico 100.0 152 2000División Real Turismo ÁngelesHotel Marriott Puerto Vallarta Mexico Marriott International United States ... 116 2000
INFORMATICS 1 733Globo.com Brazil Telecom Italia Spa Italy 30.0 810 2000Zip.Net Brazil PT Multimedia Portugal 100.0 415 2000Procomp Amazónia Brazil Diebold United States 100.0 225 1999Indústria Eletrónica S.A.Sonda Chile Telefónica CTC Chile Chile 60.0 126 1999
(ex Compañía deTelecomunicacionesde Chile S.A. (CTC))

78 ECLAC
Table I.14 (concluded)
Firms sold Country Buyer Country of Percentage Amount Dateorigin acquired
Sistemas Integrados de Argentina Banco Bisel Argentina 100.0 157 2000Control S.A. (SICSA)
ELECTRIC POWER 12 767Empresa Nacional de Chile Enersis S.A. Chile 34.7 2 146 1999Electricidad S.A. (ENDESAChile)Electricidad de Caracas Venezuela The AES Corp. United States 81.3 1 658 2000(EDC o Elecar)Enersis S.A. Chile Endesa España Spain 32.0 1 450 1999Eletricidade Metropolitana Brazil The AES Corp. United States 35.6 1 085 2000de São Paulo (EletropauloMetropolitana)Compañía Nacional de Chile HydroQuébec Canada 100.0 1 076 2000Transmisión Eléctrica S.A.(TRANSELEC S.A.)Gener S.A. Chile The AES Corp. United States 61.5 842 2000ES Centrais Elétricas Brazil Eletricidade de Portugal 38.3 535 1999(ESCELSA) Portugal (EDP)Chilquinta Energía S.A. Chile Sempra Energy United States 45.2 415 1999(Enerquinta)Chilquinta Energía S.A. Chile Public Services United States 45.2 415 1999(Enerquinta) Enterprise Group
(PSEG)EMDERSA Argentina GPU, Inc. United States 88.0 381 1999Light Serviços de Brazil Électricité de France 20.2 337 2000Eletricidade France (EDF)Light Serviços de Brazil Électricité de France 9.2 291 2000Eletricidade France (EDF)Companhia Energética do Brazil Pensylvannia Power United States 84.7 290 2000Maranhão (CEMAR) and Light (PP&L -
PPL)Bajio Power Project Mexico AEP Resources United States 50.0 215 2000Hidroeléctrica Alicura S.A. Argentina Grupo AES Argentina 59.0 205 2000
ArgentinaEmpresa Eléctrica EMEC S.A. Chile Compañía General Chile 75.8 203 1999(ex Empresa Eléctrica de de Electricidad (CGE)Coquimbo S.A.)Companhia Força e Luz Cata- Brazil Alliant Energy United States 49.2 200 2000guazes-Leopoldina (CFLCL) ResourcesCompanhia de Eletricidade Brazil Endesa España Spain 25.0 172 2000do Rio de Janeiro (CERJ)Grupo Lipigas Chile Repsol-YPF Spain 45.0 171 2000Electricidad de Caracas Venezuela Brown Brother United States 13.0 158 1999(EDC o Elecar) Harriman & Co.Energisa S.A. Brazil Alliant Energy United States 45.6 148 2000
ResourcesCompañía General de Chile Grupo Marín Chile 7.8 139 2000Electricidad (CGE)
Corporación Eléctrica de la Colombia Unión Fenosa Spain 32.5 135 2000Costa- Atlántica (CORELCA)-Electrocosta y ElectrocaribeEmpresa de Energía del Colombia Unión Fenosa Spain 28.2 100 2000Pacífico S.A. (EPSA)
4. TOTAL 87 518
Source: ECLAC, Information Centre of the Unit on Investment and Corporate Strategies, Division of Production, Productivity and Management, on the basisof information published in the specialized press in Latin America.

Brazil, Colombia and Peru, and other transnationals ofthe sector. In the financial sector, the largest acquisitionswere conducted by Spanish banks, in particular BSCH:in the biennium 1999-2000 this bank purchased a stake inBanco del Río de la Plata of Argentina for US$ 975million, acquired Conglomerado Meridional in Brazilfor US$ 1 billion and the Serfín Group in Mexico forUS$ 1.56 billion (see box I.1), and purchased a 22%share of Banco de Santiago in Chile at a cost of US$ 600million. BBVA merged its Mexican operations with theBancomer Group, at a cost of US$ 1.85 billion (see boxI.1), and acquired major stakes in the pensions industryin Argentina and Chile. Two other service industries thatexperienced a relative increase in mergers andacquisitions in the last two years � and whose operationshave become increasingly inter-related� were themedia and the Internet industries, including the areas ofconnection, content and electronic commerce.
If the sample in table I.14 were extended to allprivate mergers and acquisitions (not only those costingover US$ 100 million), it would include the 494 mergerand acquisition operations in Latin America and theCaribbean (shown in the ECLAC database for the period1999-2000), which involve resources amounting to overUS$ 93 billion14 (see table I.15). In keeping with globalpatterns, only 31 of these recent operations � equivalentto 6% of the total� took place in the primary sector. Thispercentage varies significantly, however, when theresources directed at these operations are considered tothe massive impact of the YPF acquisition by Repsol in1999. Mergers and acquisitions in the primary sector inthe period 1999-2000 thus involved resources ofUS$ 16.749 billion, or 18% of the regional total. If theYPF purchase is subtracted from the total, however, theresources involved in mergers and acquisitions in thissector would have been barely more than 2% of theregional total, indicating a primary sector share inmergers and acquisitions in the region similar to that seenin the rest of the world.15 Some difference does persistthough, and is attributable to mining operations in theSouthern Cone. During the period 1999-2000, 14operations of this type took place for a total of US$ 1.273billion, and involving Australian, British, Canadian andUnited States firms in Argentina, Brazil, Chile and Peru.
The competitive rationale of these acquisitions was of atraditional sort, as large transnational companies soughtto use their technological, administrative and financialadvantages to maximize rents from the abundant miningresources in some of the region's countries.
The role of the Latin American manufacturingsector in the merger and acquisition process in1999-2000 was in total contrast to that of the primarysector. Although the 116 transactions recorded in thissector during the biennium represent almost a fourth oftotal operations, the resources involved (US$ 7.508billion) represent only 8% of the total amount spent. Thiswas partly a reflection of the fact that recent merger andacquisition operations in the Latin Americanmanufacturing sector focussed on activities that weretechnologically simple and not capital-intensive. As inthe rest of the world, the services sector in Latin Americawas the most active in terms of mergers and acquisitionsin recent years. The period 1999-2000 recorded 347merger and acquisition operations in this sector for a totalof US$ 67.156 billion. As a matter of fact, more than 70%of the operations conducted and the resources invested inmergers and acquisitions in the region were concentratedin the services sector. Although this sector has been in thevanguard of the recent increase in mergers andacquisitions at the global level, its share in Latin Americahas been disproportionately high in comparison withother regions. This would indicate that the mergers andacquisitions process of recent years has features whichare unique to Latin America and the Caribbean, in bothservices and manufacturing.
At least two comparative features of the servicessector help to explain why the sectoral distribution ofmergers and acquisitions in Latin America has differedfrom that of other regions in recent years. One is theprocess of reform and greater openness to foreigninvestment in Latin America's main service industries incomparison to other developing regions, and the other isthe process of restructuring that has come in the wake ofthe privatizations in the region. With regard to theformer, Latin America's privatizations and the fact thatforeign capital has easier access to the continent's serviceindustries than to those of developing countries in Asia,have been instrumental in determining the sectoraldifferences of the phenomenon between the two regions.
Foreign investment in Latin America and the Caribbean, 2000 79
14 This database includes information on both transborder mergers and acquisitions, and mergers and acquisitions between firms in the samecountry. The data examined below are therefore not strictly comparable with the UNCTAD information on global transborder mergers andacquisitions quoted in the previous section. Given that a very large proportion of the resources directed at mergers and acquisitions in LatinAmerica and the Caribbean in recent years has involved transborder operations, however, the data used in this section still provide a usefulpicture of the phenomenon.
15 It should be noted that UNCTAD classifies operations involving oil companies in the petroleum processing and refining industry, i.e., in themanufacturing sector. ECLAC, however, includes these operations (for example, the acquisitions of YPF by Repsol) in the primary sector.
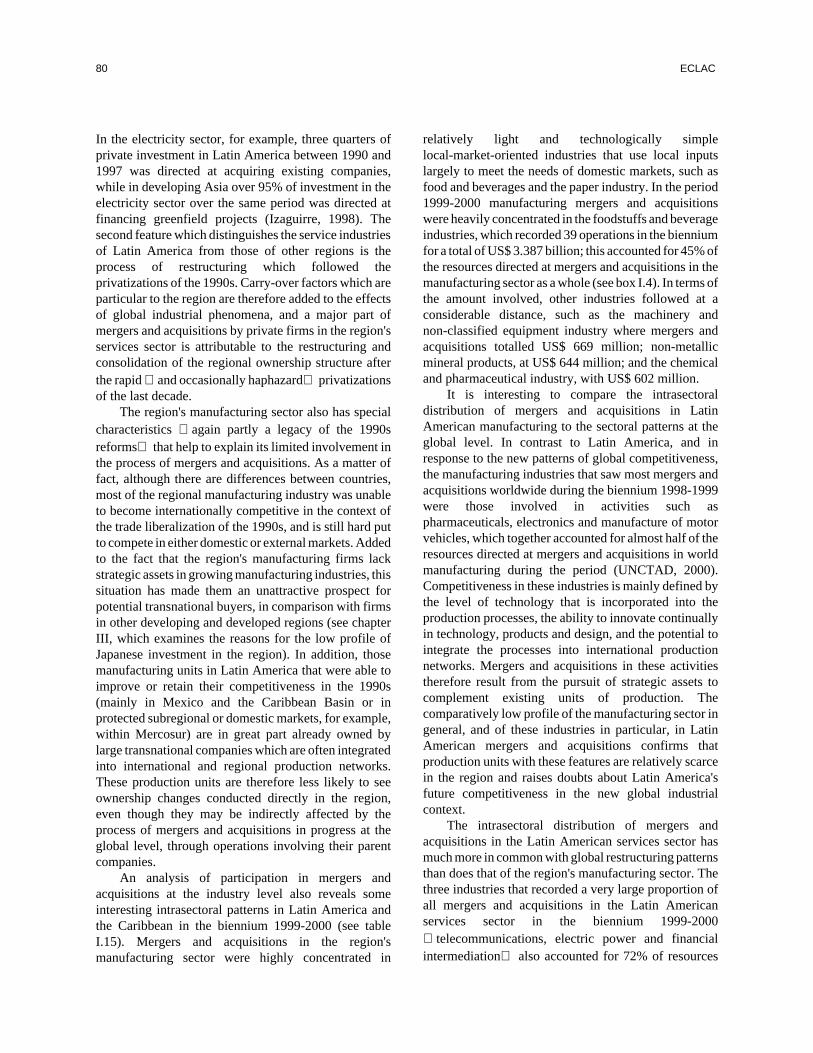
In the electricity sector, for example, three quarters ofprivate investment in Latin America between 1990 and1997 was directed at acquiring existing companies,while in developing Asia over 95% of investment in theelectricity sector over the same period was directed atfinancing greenfield projects (Izaguirre, 1998). Thesecond feature which distinguishes the service industriesof Latin America from those of other regions is theprocess of restructuring which followed theprivatizations of the 1990s. Carry-over factors which areparticular to the region are therefore added to the effectsof global industrial phenomena, and a major part ofmergers and acquisitions by private firms in the region'sservices sector is attributable to the restructuring andconsolidation of the regional ownership structure afterthe rapid � and occasionally haphazard� privatizationsof the last decade.
The region's manufacturing sector also has specialcharacteristics � again partly a legacy of the 1990sreforms� that help to explain its limited involvement inthe process of mergers and acquisitions. As a matter offact, although there are differences between countries,most of the regional manufacturing industry was unableto become internationally competitive in the context ofthe trade liberalization of the 1990s, and is still hard putto compete in either domestic or external markets. Addedto the fact that the region's manufacturing firms lackstrategic assets in growing manufacturing industries, thissituation has made them an unattractive prospect forpotential transnational buyers, in comparison with firmsin other developing and developed regions (see chapterIII, which examines the reasons for the low profile ofJapanese investment in the region). In addition, thosemanufacturing units in Latin America that were able toimprove or retain their competitiveness in the 1990s(mainly in Mexico and the Caribbean Basin or inprotected subregional or domestic markets, for example,within Mercosur) are in great part already owned bylarge transnational companies which are often integratedinto international and regional production networks.These production units are therefore less likely to seeownership changes conducted directly in the region,even though they may be indirectly affected by theprocess of mergers and acquisitions in progress at theglobal level, through operations involving their parentcompanies.
An analysis of participation in mergers andacquisitions at the industry level also reveals someinteresting intrasectoral patterns in Latin America andthe Caribbean in the biennium 1999-2000 (see tableI.15). Mergers and acquisitions in the region'smanufacturing sector were highly concentrated in
relatively light and technologically simplelocal-market-oriented industries that use local inputslargely to meet the needs of domestic markets, such asfood and beverages and the paper industry. In the period1999-2000 manufacturing mergers and acquisitionswere heavily concentrated in the foodstuffs and beverageindustries, which recorded 39 operations in the bienniumfor a total of US$ 3.387 billion; this accounted for 45% ofthe resources directed at mergers and acquisitions in themanufacturing sector as a whole (see box I.4). In terms ofthe amount involved, other industries followed at aconsiderable distance, such as the machinery andnon-classified equipment industry where mergers andacquisitions totalled US$ 669 million; non-metallicmineral products, at US$ 644 million; and the chemicaland pharmaceutical industry, with US$ 602 million.
It is interesting to compare the intrasectoraldistribution of mergers and acquisitions in LatinAmerican manufacturing to the sectoral patterns at theglobal level. In contrast to Latin America, and inresponse to the new patterns of global competitiveness,the manufacturing industries that saw most mergers andacquisitions worldwide during the biennium 1998-1999were those involved in activities such aspharmaceuticals, electronics and manufacture of motorvehicles, which together accounted for almost half of theresources directed at mergers and acquisitions in worldmanufacturing during the period (UNCTAD, 2000).Competitiveness in these industries is mainly defined bythe level of technology that is incorporated into theproduction processes, the ability to innovate continuallyin technology, products and design, and the potential tointegrate the processes into international productionnetworks. Mergers and acquisitions in these activitiestherefore result from the pursuit of strategic assets tocomplement existing units of production. Thecomparatively low profile of the manufacturing sector ingeneral, and of these industries in particular, in LatinAmerican mergers and acquisitions confirms thatproduction units with these features are relatively scarcein the region and raises doubts about Latin America'sfuture competitiveness in the new global industrialcontext.
The intrasectoral distribution of mergers andacquisitions in the Latin American services sector hasmuch more in common with global restructuring patternsthan does that of the region's manufacturing sector. Thethree industries that recorded a very large proportion ofall mergers and acquisitions in the Latin Americanservices sector in the biennium 1999-2000� telecommunications, electric power and financialintermediation� also accounted for 72% of resources
80 ECLAC
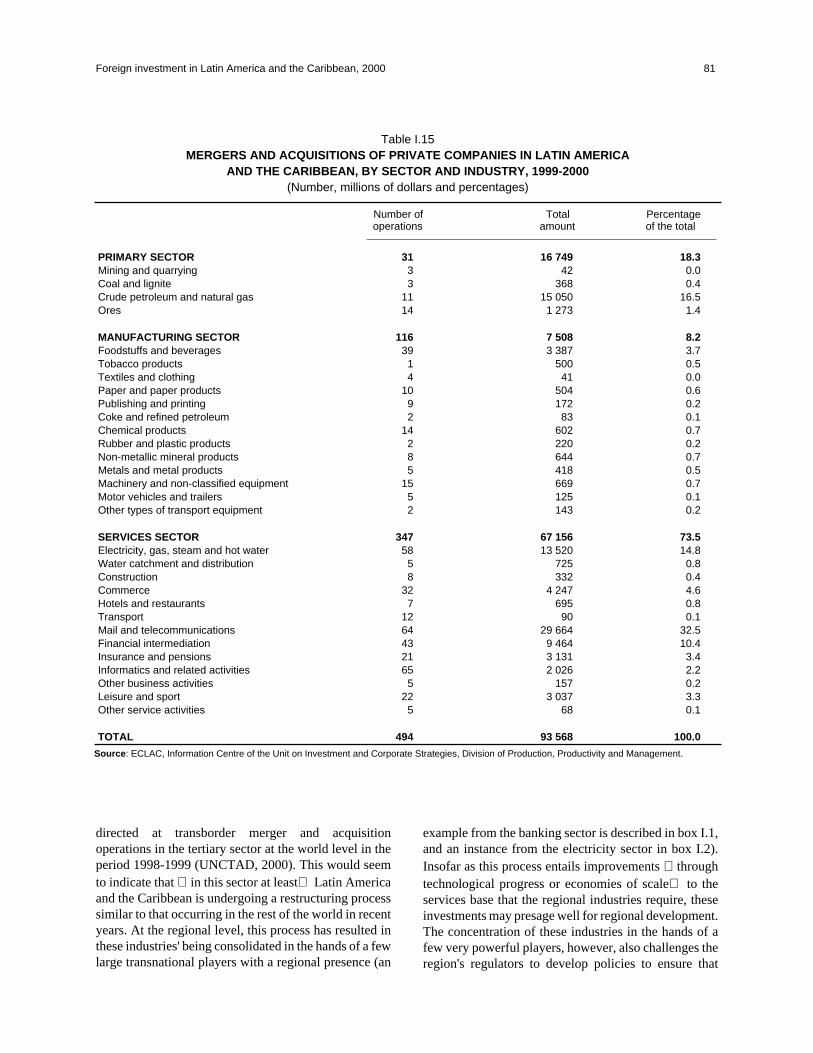
directed at transborder merger and acquisitionoperations in the tertiary sector at the world level in theperiod 1998-1999 (UNCTAD, 2000). This would seemto indicate that � in this sector at least� Latin Americaand the Caribbean is undergoing a restructuring processsimilar to that occurring in the rest of the world in recentyears. At the regional level, this process has resulted inthese industries' being consolidated in the hands of a fewlarge transnational players with a regional presence (an
example from the banking sector is described in box I.1,and an instance from the electricity sector in box I.2).Insofar as this process entails improvements � throughtechnological progress or economies of scale� to theservices base that the regional industries require, theseinvestments may presage well for regional development.The concentration of these industries in the hands of afew very powerful players, however, also challenges theregion's regulators to develop policies to ensure that
Foreign investment in Latin America and the Caribbean, 2000 81
Table I.15MERGERS AND ACQUISITIONS OF PRIVATE COMPANIES IN LATIN AMERICA
AND THE CARIBBEAN, BY SECTOR AND INDUSTRY, 1999-2000(Number, millions of dollars and percentages)
Number of Total Percentageoperations amount of the total
PRIMARY SECTOR 31 16 749 18.3Mining and quarrying 3 42 0.0Coal and lignite 3 368 0.4Crude petroleum and natural gas 11 15 050 16.5Ores 14 1 273 1.4
MANUFACTURING SECTOR 116 7 508 8.2Foodstuffs and beverages 39 3 387 3.7Tobacco products 1 500 0.5Textiles and clothing 4 41 0.0Paper and paper products 10 504 0.6Publishing and printing 9 172 0.2Coke and refined petroleum 2 83 0.1Chemical products 14 602 0.7Rubber and plastic products 2 220 0.2Non-metallic mineral products 8 644 0.7Metals and metal products 5 418 0.5Machinery and non-classified equipment 15 669 0.7Motor vehicles and trailers 5 125 0.1Other types of transport equipment 2 143 0.2
SERVICES SECTOR 347 67 156 73.5Electricity, gas, steam and hot water 58 13 520 14.8Water catchment and distribution 5 725 0.8Construction 8 332 0.4Commerce 32 4 247 4.6Hotels and restaurants 7 695 0.8Transport 12 90 0.1Mail and telecommunications 64 29 664 32.5Financial intermediation 43 9 464 10.4Insurance and pensions 21 3 131 3.4Informatics and related activities 65 2 026 2.2Other business activities 5 157 0.2Leisure and sport 22 3 037 3.3Other service activities 5 68 0.1
TOTAL 494 93 568 100.0
Source: ECLAC, Information Centre of the Unit on Investment and Corporate Strategies, Division of Production, Productivity and Management.

some of the gains resulting from such improvements areactually passed on to users.
Independently of any improvements that might beachieved in the services sector, the pattern of industrialrestructuring generated by mergers and acquisitions inLatin America raises questions as to how the process willaffect the region's competitive position. Although anefficient platform of services is undoubtedly important, acountry's competitiveness in the new global economicscheme is strongly determined by the development of itsmanufacturing sector and, within this sector, by thecompetitiveness of the fastest-growing and mosttechnologically advanced industries (Lall, 2000). Incomparison with other regions, these industries in LatinAmerica show no sign of significant restructuringthrough mergers and acquisitions. Latin America'spotential for playing a dynamic role in the new globalstructure hinges on generating production capacities and
comparative advantages in manufacturing industries thatoffer high profitability and growth, and whosecompetitiveness develops in pace with technologicalchange; such industries have accounted for a verysignificant share of mergers and acquisitions in thedeveloped world in recent years. Moreover, historywould suggest that the development of industrialcapacity in these areas does not happen spontaneously.The region would therefore require policies that make itpossible to respond to this challenge by various means,one of which would be to encourage the consolidation inthe region of transnational firms having the technology,financial capacity and strategic assets needed to competein these growing industries. The following section willexamine the case of a country that is attempting to attractthis type of firm through FDI policy, with a view toimproving the competitive position of its economy in thenew world economic order.
C. A NEW NATIONAL STRATEGY ON FOREIGN DIRECT INVESTMENT
As in the 1999 Report (ECLAC, 2000a), this sectionlooks at the cases of some countries in the region thathave attempted to give a new focus to their foreigninvestment policies, seeking to bring them in line withtheir broader development targets. Unlike the approach� which was very common in the region in recentyears� of attempting to attract the largest volume of FDIpossible through opening up of markets, liberalization,deregulation of the domestic economy and privatizationof State assets, strategies of this type begin by taking
stock of the country's existing and potential competitiveadvantages and then define and adopt modalities ofchannelling foreign investment accordingly, throughactive, specific and consistent policy tools. The lastReport studied the cases of Costa Rica and its policy offocusing on advanced technology and internationalcompetitiveness, and of Bolivia with its active policy ofcreating an energy export complex. In this edition, a briefanalysis is made of the new FDI policy of the DominicanRepublic.
1. New policies in the Dominican Republic: a focus on advanced technology andimprovement of system competitiveness
The position of the Dominican Republic in the worldeconomy has historically been based almostexclusively on a small group of agricultural goods, suchas sugar, coffee, cacao and tobacco, and some minerals,such as nickel. This relationship with the internationaleconomy was insufficient to enable the DominicanRepublic to establish a solid pattern of economicdevelopment and left the country's performance
vulnerable to the cycle of international prices in theseexports, generating significant external disequilibriaand periodic balance-of-payment problems. Theinstability inherent in this structure persisted at leastuntil the early 1980s, when the country's external debtcrisis prompted the Administration to take a newapproach to international trade, based on the benefitsoffered by the United States Government for
82 ECLAC
export-processing zones under the Caribbean BasinInitiative, through the joint production mechanism (firstTSUS 807, later HTSUS 9802) which gave preferentialaccess to the United States market (Mortimore, Duthooand Guerrero, 1995).
Table I.16 illustrates how successful this new policyhas been in terms of the Dominican Republic's share ofNorth American imports (Canada and the United States)between 1985 and 1998. In general, as the table shows,during this period the country considerably increased its
Foreign investment in Latin America and the Caribbean, 2000 83
Table I.16DOMINICAN REPUBLIC: INTERNATIONAL COMPETITIVENESS
IN NORTH AMERICAN IMPORTS(Canada and United States)
1985 1990 1995 1998
I. Market share 0.25 0.31 0.38 0.41Natural resources (1) 0.40 0.25 0.20 0.21Manufactures based on natural resources (2) 0.38 0.25 0.26 0.35Manufactures not based on natural resources(3) 0.15 0.32 0.43 0.45
- Low technology (4) 0.52 1.02 1.46 1.49- Mid-level technology (5) 0.04 0.11 0.15 0.16- High technology (6) 0.02 0.03 0.05 0.05
Other (7) 0.77 0.47 0.33 0.28
II. Export structure (contribution) 100.0 100.0 100.0 100.0Natural resources (1) 23.7 10.6 5.6 5.0Manufactures based on natural resources(2) 24.0 11.6 8.9 11.1Manufactures not based on natural resources (3) 39.6 71.4 81.9 80.7
- Low technology (4) 33.1 56.8 65.9 64.9- Mid-level technology (5) 5.1 12.8 13.5 13.3- High technology (6) 1.2 1.7 2.57 2.4
Other (7) 12.9 6.4 3.68 3.2
III. 10 main exports by contribution (ISIC Rev.2)a b
45.8 64.2 72.3 76.5842 Men's and boy's outer garments, knitted or crocheted * + 5.4 13.5 16.5 17.4846 Undergarments, knitted or crocheted * + 5.6 8.2 12.6 13.8843 Women's, girl's and infant's outer garments, knitted or
crocheted * + 5.8 10.2 10.6 10.1872 Medical instruments and appliances * + … 4.3 7.0 6.8845 Outer garments and accessories, knitted or crocheted * + 0.9 4.7 5.7 6.5122 Tobacco manufactures + 1.8 1.3 1.9 5.1772 Electrical apparatus for making and breaking or for
protecting electrical circuits * + 1.3 3.9 4.2 5.1612 Manufactures of leather or of artificial or reconstituted
leather + 3.4 6.4 6.1 4.9061 Sugar and honey - 17.8 7.2 4.2 3.8897 Jewellery and goldsmiths' or silversmiths' wares + 3.7 4.8 3.5 3.1
Source: ECLAC, on the basis of the CAN computer program.
Groups of goods based on the Standard International Trade Classification (SITC Rev.2)
(1) Contains 45 simply processed commodities, including concentrates.
(2) Contains 65 items: 35 agricultural/forestry groups and another 30 (mostly metals ¾except steel¾, petroleum products, cement, glass, etc.).
(3) Contains 120 groups which represent the sum of (4) + (5) + (6).
(4) Contains 44 items: 20 groups of the textile-wearing apparel cluster, plus another 24 (paper products, glass and steel, jewels).
(5)Contains 58 items: 5 groups from the motor vehicle industry, 22 from the processing industry and 31 from the engineering industry.
(6) Contains 18 items: 11 groups from the electronics cluster plus another 7 (pharmaceutical products, turbines, aeroplanes, instruments).
(7) Contains 9 unclassified groups (mostly from section 9).a
Groups that correspond (*) to the 50 fastest-growing among North American imports, 1985-1998.b
Groups in which the Dominican Republic gained (+) or lost (-) market share in North American imports, 1985-1998.

share of that market, from 0.25% to 0.41%. Thisincrease, however, was not uniformly distributed acrossall products: while the share of non-resource-basedDominican manufactures in the North American marketgrew from 0.15% to 0.45% (and within this group theshare of manufactures with low technological contentgrew from 0.52% to 1.49%), the share of Dominicancommodities in the North American market fell from0.40% to 0.21%. Not only did Dominican exports to theUnited States increase, therefore, but their structure alsounderwent a drastic change: together, commodities andresource-based manufactures fell from over half the totalin 1980 to less than 15% of the value of total exports in1998, and exports of non-resource-based manufacturesdoubled their share, to reach over 80% of the total in1998. To be more precise, over two thirds of exports inthe latter group corresponded to low-technologymanufactures � mostly apparel� so that in the period1985-1998 four of the six Dominican exports which weredynamic in North America were clothing. The policyimplemented at the beginning of the 1980s thus enabledthe Dominican Republic to improve its position on theinternational market, based on assembly of wearingapparel for export to the North American market throughpreferential access mechanisms.
The successful restructuring of external trade by theDominican Republic was based on the combined effectof three elements: specific policies aimed at foreigninvestment in the country (especially incentives inexport-processing zones), preferential access providedby the United States Government, and the strategies ofNorth American firms seeking efficiency in theexport-processing zones. This particular combinationmade the Dominican Republic the main supplier ofwearing apparel from the Caribbean Basin to the UnitedStates. Despite successfully positioning the country onthe international market, however, this process proved tohave some limitations in terms of the developmentexpectations of the Dominican Republic. In particular,the United States Government requirement forpreferential access to be subject to the use of UnitedStates inputs (fabrics, thread, buttons, etc.) meant thatassembly operations in export-processing zones nevergrew domestic roots or generated local suppliers to anysignificant degree. Rather than any real gain in theintrinsic competitiveness of the Dominican economy,therefore, the increased share of the North Americanmarket won by Dominican wearing apparel was areflection of improved competitiveness of NorthAmerican subsidiaries and their subcontractors using thepreferential access mechanisms (Vicens, Martínez andMortimore, 1998).
In fact, during the 1990s the Dominican Republic'smarket share was already beginning to wane in the face ofnew competition from other countries in the CaribbeanBasin (El Salvador, Honduras, Guatemala) and the effectof the advantages obtained by Mexico through the NorthAmerican Free Trade Agreement (NAFTA) (see ECLAC,2000a, chapter IV). The partial reversion of this situationin 2000 serves to further demonstrate the strongdependence of this type of activity on preferential accessto the United States market. The announcement of theCaribbean Basin Trade Partnership Act, which was signedin October 2000 and extends the tariffs which Mexico hasenjoyed since 1994 to the beneficiary countries of theCaribbean Basin Initiative, has encouraged some firmsthat had emigrated to return to the Dominican Republic,and an increase in employment in these activities isexpected in the next few years (Latin Finance, December2000). Mexico still has a major advantage that thesecountries did not receive, however, i.e., the impact of theNAFTA rules of origin on the domestic production chain(see ECLAC, 2000a, chapter IV). The Dominicanauthorities realize that because of their high mobility andlow domestic impact, these activities cannot guaranteelong-term development.
In response to this situation, the Dominicanauthorities have begun to refocus their developmentstrategies and foreign investment policies in recentyears. At a workshop on FDI in the Caribbean Basin runby the Organisation for Economic Co-operation andDevelopment (OECD) in April 2000, the Director of thecountry's National Planning Office summarized theanalytical basis of this new effort with the observationthat while governments seek to encourage nationaldevelopment, transnational corporations seek tostrengthen their own international competitiveness, andthe two objectives may be only weakly linked…[therefore] clearly identifying the objective is anindispensable step to reaping worthwhile fruits fromforeign investment (Camilo, 2000). According to theDominican Secretary of State for Trade and Industry, thecountry's policy must be directed at gaining a successfulposition in the world economy in terms of increasingcompetitive advantages (Bonetti, 2000). In line with thisoverall objective, at least three complementary fields ofaction have been defined: (1) development of a newfocus for the export-processing zones in order toencourage the establishment of higher-technologyindustries, (2) major efforts to improve the economy'ssystem competitiveness competitiveness, and (3)promotion of greater participation of domestic firms innew foreign investment projects in the tourism sector.
The first field of action is still very new, and it isdifficult to discern concrete results. It is already clear,
84 ECLAC
however, that the Government is making an effort toencourage industry that is intensive in advancedtechnology, in order to diversify the country's productionstructure and its export basket while encouragingresearch and the specialization of existing humanresources (OPI-RD, 2000a). Accordingly, theAdministration has already identified and establishedcontact with large transnational corporations that pursueefficiency in activities with greater value added and ahigher level of technological sophistication, and expectsto conclude investment agreements with HewlettPackard, Paragon Solutions, Apogee Networks andTerra Networks, among other firms in the sector (LatinFinance, December 2000). One specific result of theGovernment's drive is the construction of the ParqueCibernético de Santo Domingo, a US$ 200 millionproject directed at the official objective of making theDominican Republic the top technology country in theregion, preparing to enter fully into the "New DigitalEconomy" (OPI-RD, 2000b). The first phase of the Parkincludes construction of the Technological Institute ofthe Americas, which will offer advanced courses in theareas of engineering, electronics, robotics, informationand telecommunications technology. According to theDominican Government, the Institute has alreadysecured financial backing from companies such asMicrosoft, Cisco Systems and Siemens (Latin Finance,December 2000). The park's business centre is designedto host industrial and service activities such as industrialhardware and software operations, electronic assembly,calling centres, electronic commerce and robotics.Toward the end of 2000 a quarter of the Park's projectedcapacity was already occupied.
With respect to improving the economy's systemcompetitiveness competitiveness, the changes have beendirected at generating two types of benefits:(i) improving the domestic market infrastructure andsupply of services; and (ii) providing better support forexport activities in the export-processing zones, byovercoming the shortcomings that have been identified,for example, in the supply of electric power. Efforts inthis direction were ongoing throughout the 1990s andincluded numerous reforms in areas such as labour(1992), tax (1992) tariffs (1993) and public-sectorenterprises (1997). Some items remaining on the agendaare reform of the social security system, the introductionon legislation on competition, the adoption of overalllegislation to regulate the energy sector, a new tariffreform act, a monetary and financial code and intellectualproperty legislation (Camilo, 2000). Significant changeshave also come about in terms of reform of the judicialsystem, increased customs transparency and improved
administration of the taxation system, among others(Pellerano and Herrera, 2000).
Despite the significance of these transformations inthe institutional and legal framework, the most tangiblerecent changes from a system competitivenessperspective probably have to do with the process ofcapitalization and privatization of key public-sectorfirms. In fact, in response to evident shortcomings in theperformance of some public-sector enterprises whichprovide services that are essential for thecompetitiveness of the economy, the authoritiesembarked on a programme to capitalize these firms andtransfer their management to the private sector. Thismove to improve efficiency attracted transnationalservice companies which sought access to the domesticmarket, thus by means of a tendering process, fivetransnational corporations acquired stakes in theState-owned electric power utility, CorporaciónDominicana de Electricidad (CDE). As a result, FDIdirected at increasing and modernizing electricitygeneration and distribution amounted to US$ 644million (see box I.5), and new projects in the energysector are estimated to bring inflows of US$ 1.55 billionfrom now until the end of 2003. It will take time to fullyresolve the major difficulties that have beleaguered theDominican electricity system for decades, and there arestill some doubts as to how the process will work out(Latin Finance, December 2000). Nevertheless, servicesto users and the reliability of the system are certain tobenefit from the increased generation capacity, togetherwith the rationalization and the technical improvementsresulting from these new investments. Moreover, theprocess has already brought clear benefits to the fiscalaccounts by eliminating subsidies to the sector.
Foreign investment has also generated substantialprogress in other areas of public infrastructure. A newscheme of airport concessions to domestic and foreignoperators which brought in US$ 309 million had apositive effect on the economy's system competitivenesscompetitiveness (Núñez, 2000). A planned investmentof US$ 200 million by local and foreign investors tobuild the new Port of Caucedo on the outskirts of SantoDomingo will boost the development of the country'sexport process. Efforts to conclude joint investmentagreements between transnational and domestic firms inthe tourism sector have also met with some success,particularly with respect to new investments by Spanishand German firms, which currently account for over 10%of total investments in this sector.
In view of the policies recently implemented by theDominican Government, it is no surprise that FDIincome should have grown markedly during the 1990s,both in absolute terms and in relation to the size of the
Foreign investment in Latin America and the Caribbean, 2000 85

86 ECLAC
In the mid-1990s, the Governmentof the Dominican Republic wasaware that the lack of a reliablesource of electric power wasjeopardizing the country'sdevelopment aspirations,especially in terms of theeconomy's system competitivenesscompetitiveness. In fact, accordingto a survey conducted by theECLAC Unit on Investment andCorporate Strategies, 30 of the 60largest firms (by sales) that wereoperating in the export-processingzones identified the "unreliablenational energy supply" as theirsecond main operational problem,after "cumbersome customsprocedures" (Mortimore, Duthooand Guerrero, 1995). Three yearslater, another survey conducted on16 domestic and foreign firms inthe clothing industry defined the"high cost of energy in the country"as the main obstacle to exportactivity (Vicens, Martínez andMortimore, 1998). The situationwas so awkward that many firmshad to invest in their owngenerating equipment in order tokeep their operations running.Seeking to remedy this and otherproblems, the Governmentembarked on a programme tocapitalize the State-owned utilities.The objective was to make themmore efficient and transfer theiradministration to private-sectorfirms of proven efficiency. In the
case of Corporación Dominicanade Electricidad (CDE), this wasachieved through a tender processto enlarge the electrical system by200 MW in which five foreigncompanies were involved. FDIinflow from this process amountedto more than US$ 644 million by1999 and generated commitmentsworth US$ 1.55 billion for theperiod 2000-2003 (Núñez, 2000).Unión Fenosa is a Spanishelectricity company that has beenexpanding steadily since 1987, andcurrently has operations in 36countries on four continents(Europe, the Americas, Asia andAfrica). In Latin America thecompany has operations inPanama, Guatemala, Mexico andthe Dominican Republic. Despitethis extensive network, UniónFenosa is much smaller in terms ofsales, assets and capitalizationthan other Spanish electricitycompanies such as EndesaEspaña and Iberdrola (ECLAC,2000a, chapter II). Unlike these,Unión Fenosa has pursued a policyof alliances with local firms toexpand its market presence indeveloping countries.Consistently with this strategy,Unión Fenosa joined forces withCDE in the Dominican Republic,entering the country in August1999. At present the company haselectricity distribution operationsthrough two firms, Edenorte and
Edesur, involving a capital input ofUS$ 212 million, and two electricpower generators (190 MW),Palomara and La Vega, whichrepresent a capital contribution ofUS$ 120 million. Unión Fenosawas attracted to the DominicanRepublic by a combination offactors, including the aversion torisk displayed by some of itscompetitors, the possibility ofentering the market with smallerinvestments through thecapitalization programme, and theperception that the Governmentwas serious in seeking a solutionto a substantial problem. Theresults are evident: Unión Fenosahas drastically reduced energylosses, significantly cut the utility'sunrecoverable commercial creditsand attracted new clients. Somecompanies have even abandonedtheir in-house generating systemsas a result of the improvements inthe national supply. All this hasresulted in a rapid upturn in thecompany's medium-term net worthand brought the Governmentcloser to its targets in terms of thecountry's system competitivenesscompetitiveness, in a strikingexample of convergence betweendevelopment policy targets andthe strategy of an expandingtransnational company.
Source: ECLAC, on the basis of presentations by Miguel Olivera, Director of Unión Fenosa, and Fernando Matamoros, General Manager ofEdenorte, at the workshop on Foreign Direct Investment in the Caribbean Basin, organized by the Organisation for Economic Cooperationand Development (OECD) and the Dominican Republic Foreign Investment Promotion Office (OPI-RD), Santo Domingo, 11 and 12 April2000.
Box I.5CONVERGENCE BETWEEN DEVELOPMENT POLICY TARGETS AND THE STRATEGIES OF
TRANSNATIONAL FIRMS: DOMINICAN REPUBLIC AND UNIÓN FENOSA

economy. In fact, annual FDI inflows increased ten-fold,from US$ 133 million in 1990 to US$ 1.338 billion in1999, and in terms of GDP, from 4.4% of GDP in 1993 to7.8% in 1998 (Núñez, 2000). At the same time, theDominican economy increased its average annualgrowth from 4.2% in the period 1991-1994 to 7.8% in1995-1999. The influence of FDI in this result isapparent from observation of the sectors in which thistype of investment is concentrated (export-processingzones, commerce, tourism and communications), all ofwhich grew at a faster rate than the rest of the economy.By 1999, the export-processing zones were alreadygenerating about US$ 4 billion in exports, mostly on thebasis of accumulated FDI, while the capitalization of the
electricity company CDE attracted almost half (47%) ofFDI inflows that year, with telecommunications andtourism accounting for a substantial part of the balance(16% and 22%, respectively). In addition, investmentprojections for those sectors during the period2000-2003 are already in the order of US$ 1.403 billion(Núñez, 2000). The Dominican authorities thereforeappear to have struck a reasonably good balance betweendomestic policy targets and the interests of foreign directinvestors, successfully attracting investment in activitiesthat have been defined as priority areas within nationaldevelopment policy. The years to come will tell what theimpact of these achievements on the country'sdevelopment potential will be.
Foreign investment in Latin America and the Caribbean, 2000 87
■
II. CHILE: FOREIGN DIRECT INVESTMENT ANDCORPORATE STRATEGIES
■
Previous publications (ECLAC, 1998; ECLAC, 2000a) have examined Brazil and
Mexico, which are two of the region’s largest economies and the main recipients of FDI in
Latin America and the Caribbean. The analysis in this edition will focus on one of the
emerging economies, which has been most successful in attracting FDI. Compared to
other countries of the region, Chile came to the attention of foreign investors early on, at a
time when the economies of the subcontinent were beset by severe economic difficulties.
Chile has received massive FDI inflows over the last 20 years, thanks to its enormous
comparative advantages in diverse activities linked to the extraction and processing of
natural resources. These comparative advantages were heightened by the deep and
wide-ranging economic reforms of the 1970s, which were then consolidated with the
return to democracy at the beginning of the 1990s. More recently, in addition to these
voluminous investments in natural-resource-related activities, foreign firms have been
streaming into the services sector. This new wave of FDI differs from the earlier trend in
that it has been focused on the purchase of existing assets in activities that were previously
dominated by private local groups, especially in the electricity sector.
Foreign investment in Latin America and the Caribbean, 2000 89
This chapter will examine the main features of FDIinflows to the Chilean economy, as well as the buildingblocks of the strategies used by the transnational firmsthat have established a presence in the country. The
analysis will consider two distinct groups of foreigninvestors in Chile: those who are seeking out naturalresources, and those who are endeavouring to gain astake in the domestic or regional services markets.
■
A. FOREIGN CAPITAL IN THE CHILEAN ECONOMY
1. A century marked by the mining investments of North American firms
Foreign firms have been present in the Chilean economysince the early twentieth century. In the 1930s and 1940s,most foreign investment originated in the United Statesand, to a lesser extent, the United Kingdom. UnitedStates companies concentrated on mining and the Britishfirms on services such as railways, electricity andtelephones (Banco Central de Chile, 1956). Later,changes in FDI regulations during the Administration ofPresident Carlos Ibáñez del Campo (1954-1958) resultedin a significant increase in manufacturing investments,although mining continued to be the main attraction forforeign firms.
The 1960s saw major increases in FDI inflows.Between 1959 and 1970, capital inflows wereconcentrated in the mining sector (58.8%),manufacturing (38.8%) —mainly the manufacture ofpaper and petroleum-based chemicals— and to a muchsmaller extent in services (1.5%). During this period,United States and Canadian firms accounted for the bulkof foreign inflows, generating 43.3% and 26.2% of thetotal, respectively (CORFO, 1972; ODEPLAN, 1972).
In the late 1960s Chile’s economic landscape wassubstantially altered by a series of reforms, particularlythe nationalization of large-scale copper mining andagrarian reform. The pace of these reforms increasedwith the election to office of the Popular Unity party,headed by the socialist president Salvador Allende. Atthis time, the State became more deeply involved in theeconomy, and the scope of action for private agentsnarrowed. In the wake of these developments, within arelatively short period of time the country lapsed into a
severe political and economic crisis and, as conditionsfor foreign capital were found to be discouraging, a steepfall in FDI inflows ensued.
In late 1973, a military coup overthrew SalvadorAllende. The new authorities made sweeping changes ineconomic policy with the introduction of a neoliberalmodel involving a drastic decrease in public-sectoractivity in the economy and radical changes in fiscalaffairs, labour policy and finance, economic relationswith other countries (financial and import liberalizationand export promotion) and the ownership of the means ofproduction (Ffrench-Davis, 1999; Foxley, 1980). Withthese measures, the new government sought to turn themarket into the main agent of resource allocation, privateenterprise into the driving force of the economy andcomparative advantage-based exports into thefoundation for the country’s economic development.
With regard to FDI, the military government tried togenerate confidence among private investors and thusdispel the poor international perception of the Chileaneconomy. In 1974 the government enacted the ForeignInvestment Statute (Decree Law 600, known as DL 600),which regulates the conditions of market entry,capitalization and remittances of foreign capital. Theseprovisions remain largely unchanged today. This newlegal framework guaranteed access to all productionactivities, tax stability and non-discriminatory treatmentvis-à-vis local enterprise. The Chilean authorities usedthis legal instrument to raise the profile of foreigninvestment, and it soon became one of the main sourcesof financing for a renewed development strategy based
90 ECLAC

on an extensive opening of the economy. It was hopedthat FDI would thus help to strengthen and broaden theChilean export sector. The desired results did notmaterialize quickly, however. In the period 1975-1980,the Chilean economy recorded annual FDI inflows ofaround US$ 188 million, and these funds were heavilyconcentrated in the mining sector.
In the early 1980s, the country suffered one of itsgreatest economic crises ever. A strong external shockgenerated by an abrupt break in foreign financing, risinginternational interest rates and a deterioration in theterms of trade, exacerbated by heavy domesticborrowing and a dogmatic economic policy, caused GDPto plunge by 14% in 1982. In response, the authoritiesadopted a more pragmatic economic —and particularlyforeign-exchange— policy. An attempt was made tostimulate private investment by creating a debtconversion mechanism (described in chapters XVIII andXIX of the Chilean Central Bank’s Compendium ofRules on International Exchange).
Between 1985 and 1990, the period when ChapterXIX was in force, this mechanism generated close to80% of total FDI flows into the country (see table II.1).The mechanism was widely welcomed because theinvestors who used it enjoyed an implicit subsidy in theform of discounts amounting to an estimated 46% of thevalue of their investments, which was not available toinvestors under DL 600 (Ffrench-Davis, 1990). Thedebt-conversion programme was promoted extensivelyabroad, and this helped to create a favourable climate forforeign investors and encourage them to consider Chileas an investment prospect (see figure II.1). The rapid andsustained upturn in the economy, however, had the effectof pushing up the prices of Chilean external debt paperand consequently making this mechanism less profitable(Calderón and Griffith-Jones, 1995). In 1992, therefore,operations of this sort ceased.
Chapter XIX made it possible to finance majorprojects in the flourishing resource-based manufacturingindustry, particularly the forestry sector, whichaccounted for almost 30% of inflows into the countryunder this mechanism. These investments —like thosemade in agricultural activities (mainly fresh fruit) andfisheries— boosted Chilean exports of these products.Services activities also received a large share of theresources that flowed into the country under ChapterXIX, particularly telecommunications, electrical energy,banking, pension fund administrators and tourism.
At the same time, the second half of the 1980s sawan upturn in FDI inflows channelled through thetraditional mechanism of DL 600, most of which went tonew mining projects (see figure II.1). Between 1985 and1990, this sector accounted for 54% of DL 600 inflows.Over this period the majority of investments originatedin North America (United States and Canada), whichaccounted for 42% of the total.
In the early 1990s the improvement in theinvestment climate was consolidated. This process wasaided by the positive macroeconomic indicatorsgenerated by the Chilean economy, whose attractivenesswas enhanced by the re-establishment of a democraticsystem. The debt-equity conversion programme thusallowed Chile to become rapidly reintegrated intointernational business circles by attracting financialresources to new sectors (agribusiness, pulp and paper)from investor countries which had not previously beenvery active in Latin America (New Zealand, Australia,Saudi Arabia, etc.). Meanwhile, investments intraditional activities, in particular mining, met withfavourable conditions that sparked a cycle of majorinvestments which lasted almost throughout the 1990s.Towards the end of the decade, large-scale flows of FDIinto services activities began to shape a new pattern inthe involvement of transnational corporations in theChilean economy (see figure II.1).
2. FDI in the 1990s: from mining to services
In the 1990s the Chilean economy posted one of the bestperformances in Latin America and the Caribbean interms of FDI inflows. In fact, the country was one of themain destinations for international investors in a periodin which the region was slowly beginning to recoverfrom the effects of the external debt crisis of the 1980s. Inthe case of Chile, a very significant share of the first
investments made during this boom period were for newprojects, particularly in sectors linked to the extractionand processing of natural resources for export. In otherSouth American countries, most FDI inflows wereassociated with privatization programmes.
At the beginning of the decade the successful debtconversion programme (Chapter XIX) was the initial
Foreign investment in Latin America and the Caribbean, 2000 91
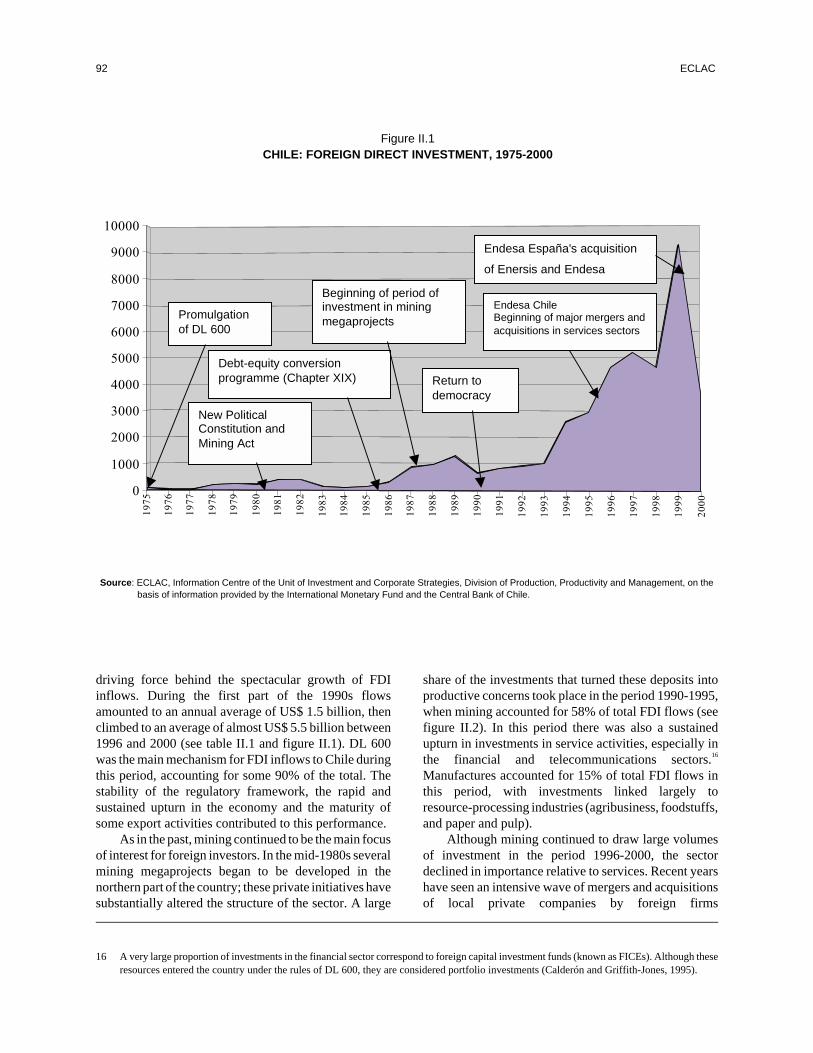
driving force behind the spectacular growth of FDIinflows. During the first part of the 1990s flowsamounted to an annual average of US$ 1.5 billion, thenclimbed to an average of almost US$ 5.5 billion between1996 and 2000 (see table II.1 and figure II.1). DL 600was the main mechanism for FDI inflows to Chile duringthis period, accounting for some 90% of the total. Thestability of the regulatory framework, the rapid andsustained upturn in the economy and the maturity ofsome export activities contributed to this performance.
As in the past, mining continued to be the main focusof interest for foreign investors. In the mid-1980s severalmining megaprojects began to be developed in thenorthern part of the country; these private initiatives havesubstantially altered the structure of the sector. A large
share of the investments that turned these deposits intoproductive concerns took place in the period 1990-1995,when mining accounted for 58% of total FDI flows (seefigure II.2). In this period there was also a sustainedupturn in investments in service activities, especially inthe financial and telecommunications sectors.16
Manufactures accounted for 15% of total FDI flows inthis period, with investments linked largely toresource-processing industries (agribusiness, foodstuffs,and paper and pulp).
Although mining continued to draw large volumesof investment in the period 1996-2000, the sectordeclined in importance relative to services. Recent yearshave seen an intensive wave of mergers and acquisitionsof local private companies by foreign firms
92 ECLAC
Figure II.1CHILE: FOREIGN DIRECT INVESTMENT, 1975-2000
Source: ECLAC, Information Centre of the Unit of Investment and Corporate Strategies, Division of Production, Productivity and Management, on thebasis of information provided by the International Monetary Fund and the Central Bank of Chile.
19
75
19
76
19
77
19
78
19
79
19
80
19
81
19
82
19
83
19
84
19
85
19
86
19
87
19
88
19
89
19
90
19
91
19
92
19
93
19
94
19
95
19
96
19
97
19
98
19
99
20
00
0
1000
2000
3000
4000
5000
6000
7000
8000
9000
10000
Promulgationof DL 600
Debt-equity conversionprogramme (Chapter XIX)
Beginning of period ofinvestment in miningmegaprojects
Endesa España's acquisition
of Enersis and Endesa
Endesa ChileBeginning of major mergers andacquisitions in services sectors
Return todemocracy
New PoliticalConstitution andMining Act
16 A very large proportion of investments in the financial sector correspond to foreign capital investment funds (known as FICEs). Although theseresources entered the country under the rules of DL 600, they are considered portfolio investments (Calderón and Griffith-Jones, 1995).
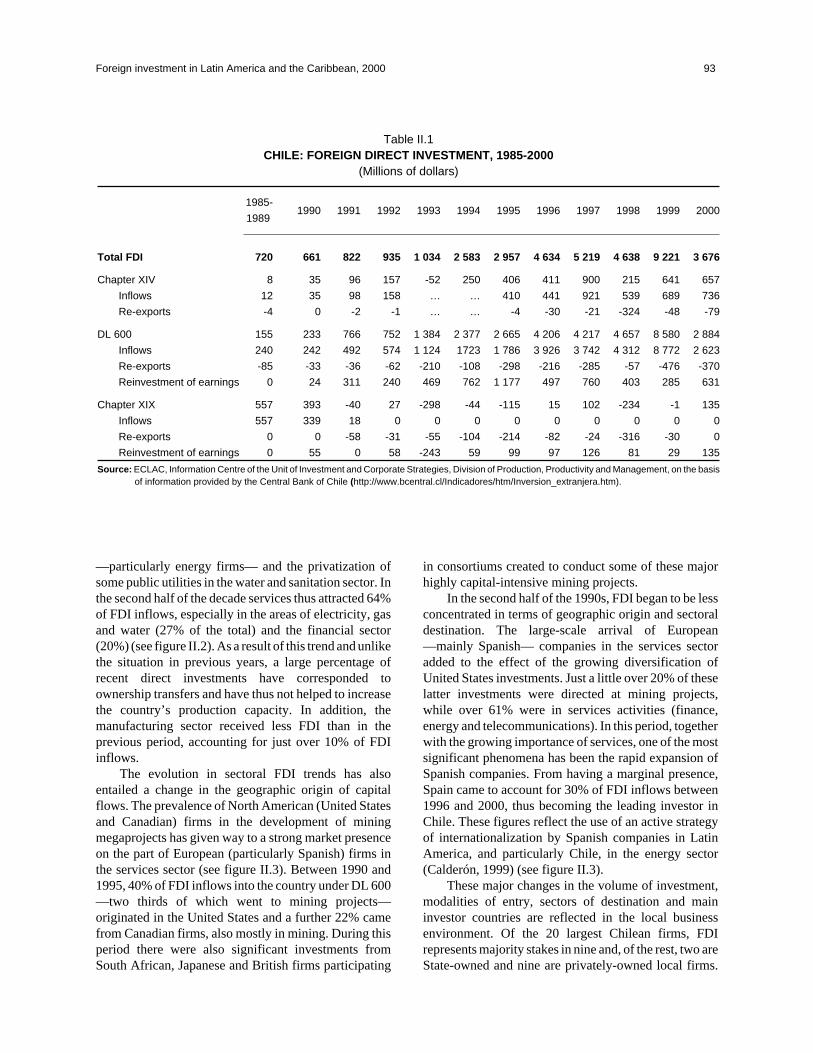
—particularly energy firms— and the privatization ofsome public utilities in the water and sanitation sector. Inthe second half of the decade services thus attracted 64%of FDI inflows, especially in the areas of electricity, gasand water (27% of the total) and the financial sector(20%) (see figure II.2). As a result of this trend and unlikethe situation in previous years, a large percentage ofrecent direct investments have corresponded toownership transfers and have thus not helped to increasethe country’s production capacity. In addition, themanufacturing sector received less FDI than in theprevious period, accounting for just over 10% of FDIinflows.
The evolution in sectoral FDI trends has alsoentailed a change in the geographic origin of capitalflows. The prevalence of North American (United Statesand Canadian) firms in the development of miningmegaprojects has given way to a strong market presenceon the part of European (particularly Spanish) firms inthe services sector (see figure II.3). Between 1990 and1995, 40% of FDI inflows into the country under DL 600—two thirds of which went to mining projects—originated in the United States and a further 22% camefrom Canadian firms, also mostly in mining. During thisperiod there were also significant investments fromSouth African, Japanese and British firms participating
in consortiums created to conduct some of these majorhighly capital-intensive mining projects.
In the second half of the 1990s, FDI began to be lessconcentrated in terms of geographic origin and sectoraldestination. The large-scale arrival of European—mainly Spanish— companies in the services sectoradded to the effect of the growing diversification ofUnited States investments. Just a little over 20% of theselatter investments were directed at mining projects,while over 61% were in services activities (finance,energy and telecommunications). In this period, togetherwith the growing importance of services, one of the mostsignificant phenomena has been the rapid expansion ofSpanish companies. From having a marginal presence,Spain came to account for 30% of FDI inflows between1996 and 2000, thus becoming the leading investor inChile. These figures reflect the use of an active strategyof internationalization by Spanish companies in LatinAmerica, and particularly Chile, in the energy sector(Calderón, 1999) (see figure II.3).
These major changes in the volume of investment,modalities of entry, sectors of destination and maininvestor countries are reflected in the local businessenvironment. Of the 20 largest Chilean firms, FDIrepresents majority stakes in nine and, of the rest, two areState-owned and nine are privately-owned local firms.
Foreign investment in Latin America and the Caribbean, 2000 93
Table II.1CHILE: FOREIGN DIRECT INVESTMENT, 1985-2000
(Millions of dollars)
1985-
19891990 1991 1992 1993 1994 1995 1996 1997 1998 1999 2000
Total FDI 720 661 822 935 1 034 2 583 2 957 4 634 5 219 4 638 9 221 3 676
Chapter XIV 8 35 96 157 -52 250 406 411 900 215 641 657
Inflows 12 35 98 158 … … 410 441 921 539 689 736
Re-exports -4 0 -2 -1 … … -4 -30 -21 -324 -48 -79
DL 600 155 233 766 752 1 384 2 377 2 665 4 206 4 217 4 657 8 580 2 884
Inflows 240 242 492 574 1 124 1723 1 786 3 926 3 742 4 312 8 772 2 623
Re-exports -85 -33 -36 -62 -210 -108 -298 -216 -285 -57 -476 -370
Reinvestment of earnings 0 24 311 240 469 762 1 177 497 760 403 285 631
Chapter XIX 557 393 -40 27 -298 -44 -115 15 102 -234 -1 135
Inflows 557 339 18 0 0 0 0 0 0 0 0 0
Re-exports 0 0 -58 -31 -55 -104 -214 -82 -24 -316 -30 0
Reinvestment of earnings 0 55 0 58 -243 59 99 97 126 81 29 135
Source: ECLAC, Information Centre of the Unit of Investment and Corporate Strategies, Division of Production, Productivity and Management, on the basisof information provided by the Central Bank of Chile (http://www.bcentral.cl/Indicadores/htm/Inversion_extranjera.htm).

94 ECLAC
Figure II.2CHILE: FOREIGN DIRECT INVESTMENT BY SECTOR, 1990-2000
(Percentages)
1990-1995
1996-2000
Mining 58%
Agriculture 3%
Other services 6%
Paper and publishing 4%Food, beverages and tobacco
3%
Financial services 11%
Chemical industry 4%
Other manufactures 4%
Electricity, gas and water1%
Communications 6%
Mining 24%Agriculture 1%
Other services 10%
Financial services20%
Communications 7%
Electricity, gas and water 27%
Chemical industry 5%Other manufactures 1%
Paper and publishing1%
Food, beverages and tobacco4%
Source: ECLAC, Information Centre of the Unit of Investment and Corporate Strategies, Division of Production, Productivity and Management, on the basisof information provided by the Foreign Investment Committee of the Ministry of Economic Affairs, Mining and Energy of Chile.

Foreign investment in Latin America and the Caribbean, 2000 95
Figure II.3CHILE: FOREIGN DIRECT INVESTMENT BY COUNTRY OF ORIGIN, 1990-2000
(Percentages)
1990-1995
1996-2000
Other European Unioncountries 8%
United Kingdom 5%
Spain 2%Others 9%
Other developed countries14%
United States 40%
Canada 22%
Other developed countries11%
Others 7%
United States 25%Canada 12%
Other European Unioncountries 10%
United Kingdom 5%
Spain 30%
Source: ECLAC, Information Centre of the Unit of Investment and Corporate Strategies, Division of Production, Productivity and Management, on thebasis of information provided by the Foreign Investment Committee of the Ministry of Economic Affairs, Mining and Energy of Chile.
Among the foreign firms, services companies haveincreased in number, particularly rapidly, especially inthe electrical energy and telecommunications sectors(see table II.2). Among the main exporting companies,however, the foreign presence is much more significant.Of the 20 largest exporters (with external sales of overUS$ 100 million), 14 are foreign firms, and 9 of these aremining companies.
FDI and the presence of transnational corporationshave thus radically altered the Chilean economy over thelast decade. Firstly, these capital inflows, and particularlythe heavy investments made in the mining sector, havebeen largely responsible for the increase in exports. Otheractivities in which the availability of foreign capital hascontributed to export growth include several that are beingpursued in the agribusiness, fisheries and forestry sectorsin association with local enterprises —mainly throughdebt-equity swap mechanisms. In the 1990s, FDI in manyof these joint ventures dried up, and private local groupsthus gained control of the production of a number ofexport commodities (pulp and paper, fishmeal, etc.). Theinterest of foreign investors shifted to other resource-based activities not involving commodities which offermore added value and afford greater significance tocertificates of origin (fine wines, salmon and, to a lesserextent, fresh fruit). One of the main impacts of thepresence of foreign capital in the economy can thus bejudged in terms of the country’s internationalcompetitiveness.
Between 1985 and 1998 Chile’s robust exportgrowth —especially of natural resources and resource-based manufactures— increased its share of the worldmarket from 0.23% to 0.32% (see table II.3). Thecountry’s share in the world market for natural resourcesgrew from 0.41% to 1.06%, while in resource-basedmanufactures the increase was from 0.61% to 0.95%.The percentage of Chile’s total exports which fell intothese two categories continued to be around 90%. Thecountry has thus specialized in sectors that are growinglittle or not at all in international trade, which means thatit has had to displace other actors in order to increase itsmarket share. In fact, none of Chile’s 10 main exportproducts belong to the group of dynamic ones ofinternational trade, and consequently none are increasingtheir share of world imports (see table II.3). The trendsshown by the Chilean economy are nonethelessremarkable, given the characteristics and size of thecountry. Chile has thus become a preferred location formany transnational corporations involved in extractiveactivities which have undergone major operationalrestructuring at the world level.
Along with other large Latin American economies,Chile still has a production base inherited from the
import substitution years. Owing to the broad-rangingprocess of trade liberalization implemented in thecountry, however, the subsidiaries of transnationalcorporations have embarked upon intensive processes ofrationalization which have been reflected in a markedreduction in its technology- and knowledge-intensiveproduction activities. Local subsidiaries have thereforebecome increasingly specialized under majortransnational corporations’ regional restructuringprogrammes. Subsidiaries of Nestlé, Unilever, GeneralMotors, Coca-Cola and Procter & Gamble thus continueto occupy important positions among the largestforeign-owned enterprises in the Chilean economy (seetable II.2), but they now have closer links with their sistersubsidiaries in neighbouring countries and theirproduction activities are increasingly specialized.General Motors is a case in point, in that it has shiftedfrom producing small runs of several different modelsfor the domestic market to specializing in assembling asingle model (LUV pick-up trucks) for the national andregional markets. In fact, the General Motors subsidiaryfigures among the country’s 20 largest exportcompanies, standing in twelfth place among the foreignfirms in this category (see table II.3).
Although the presence of foreign firms in theservices area has undoubtedly been instrumental inimproving Chile’s systemic competitiveness, this hasbeen less true for other countries of the region, since asignificant percentage of the largest services companieswere owned by local groups during their expansion andconsolidation phases. It has been only recently that thepositive performance of these companies and theirinternationalization within Latin America have attracteda significant degree of attention from transnationalcorporations seeking to assume regional leadershippositions.
This phenomenon reflects a curious aspect thatwarrants further examination. Foreign firms weredecisive in the success of the first phase of Chileanexport-based economic development, but they thenwithdrew from those activities that were most sensitiveto international price cycles. The exception to this wasthe mining industry. In the services sectors, however,transnational firms initially accounted for a relativelyinsignificant share, with local groups maintaining theirleadership after the privatizations of the early 1980s. Themain exception to this was basic telephone services. Inresponse to the solid performance of these sectors,however, foreign firms began to seek controlling stakesin the companies involved, and this generated a wave ofmergers and acquisitions on an unprecedented scale. Inshort, foreign firms have pursued two basic strategies inthe Chilean economy in recent years:
96 ECLAC
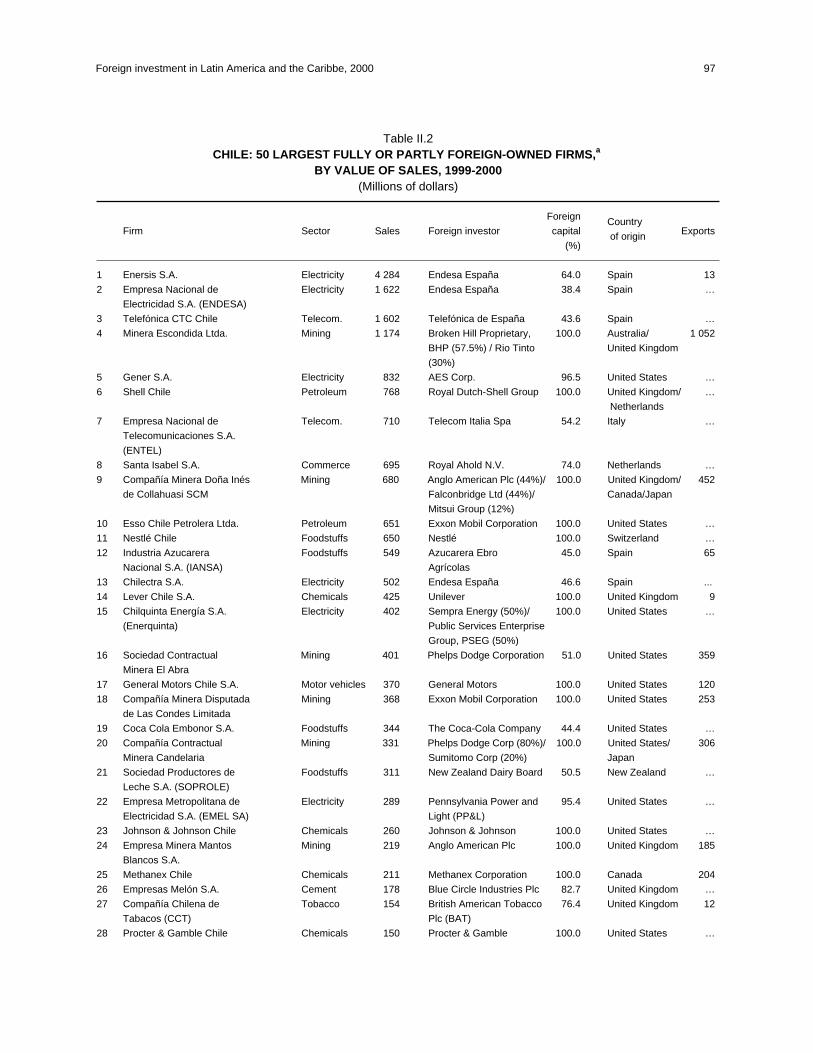
Foreign investment in Latin America and the Caribbe, 2000 97
Table II.2CHILE: 50 LARGEST FULLY OR PARTLY FOREIGN-OWNED FIRMS,a
BY VALUE OF SALES, 1999-2000(Millions of dollars)
Foreign CountryFirm Sector Sales Foreign investor capital of origin Exports
(%)
1 Enersis S.A. Electricity 4 284 Endesa España 64.0 Spain 13
2 Empresa Nacional de Electricity 1 622 Endesa España 38.4 Spain …
Electricidad S.A. (ENDESA)
3 Telefónica CTC Chile Telecom. 1 602 Telefónica de España 43.6 Spain …
4 Minera Escondida Ltda. Mining 1 174 Broken Hill Proprietary, 100.0 Australia/ 1 052
BHP (57.5%) / Rio Tinto United Kingdom
(30%)
5 Gener S.A. Electricity 832 AES Corp. 96.5 United States …
6 Shell Chile Petroleum 768 Royal Dutch-Shell Group 100.0 United Kingdom/ …
Netherlands
7 Empresa Nacional de Telecom. 710 Telecom Italia Spa 54.2 Italy …
Telecomunicaciones S.A.
(ENTEL)
8 Santa Isabel S.A. Commerce 695 Royal Ahold N.V. 74.0 Netherlands …
9 Compañía Minera Doña Inés Mining 680 Anglo American Plc (44%)/ 100.0 United Kingdom/ 452
de Collahuasi SCM Falconbridge Ltd (44%)/ Canada/Japan
Mitsui Group (12%)
10 Esso Chile Petrolera Ltda. Petroleum 651 Exxon Mobil Corporation 100.0 United States …
11 Nestlé Chile Foodstuffs 650 Nestlé 100.0 Switzerland …
12 Industria Azucarera Foodstuffs 549 Azucarera Ebro 45.0 Spain 65
Nacional S.A. (IANSA) Agrícolas
13 Chilectra S.A. Electricity 502 Endesa España 46.6 Spain ...
14 Lever Chile S.A. Chemicals 425 Unilever 100.0 United Kingdom 9
15 Chilquinta Energía S.A. Electricity 402 Sempra Energy (50%)/ 100.0 United States …
(Enerquinta) Public Services Enterprise
Group, PSEG (50%)
16 Sociedad Contractual Mining 401 Phelps Dodge Corporation 51.0 United States 359
Minera El Abra
17 General Motors Chile S.A. Motor vehicles 370 General Motors 100.0 United States 120
18 Compañía Minera Disputada Mining 368 Exxon Mobil Corporation 100.0 United States 253
de Las Condes Limitada
19 Coca Cola Embonor S.A. Foodstuffs 344 The Coca-Cola Company 44.4 United States …
20 Compañía Contractual Mining 331 Phelps Dodge Corp (80%)/ 100.0 United States/ 306
Minera Candelaria Sumitomo Corp (20%) Japan
21 Sociedad Productores de Foodstuffs 311 New Zealand Dairy Board 50.5 New Zealand …
Leche S.A. (SOPROLE)
22 Empresa Metropolitana de Electricity 289 Pennsylvania Power and 95.4 United States …
Electricidad S.A. (EMEL SA) Light (PP&L)
23 Johnson & Johnson Chile Chemicals 260 Johnson & Johnson 100.0 United States …
24 Empresa Minera Mantos Mining 219 Anglo American Plc 100.0 United Kingdom 185
Blancos S.A.
25 Methanex Chile Chemicals 211 Methanex Corporation 100.0 Canada 204
26 Empresas Melón S.A. Cement 178 Blue Circle Industries Plc 82.7 United Kingdom …
27 Compañía Chilena de Tobacco 154 British American Tobacco 76.4 United Kingdom 12
Tabacos (CCT) Plc (BAT)
28 Procter & Gamble Chile Chemicals 150 Procter & Gamble 100.0 United States …

• Pursuit of raw materials for export. Chile’s abundantnatural resources have made the country a target forthe main transnational corporations in the miningsector and in some activities associated withagriculture and forestry. In recent years, foreigninvestors’ interest has tended to shift fromresource-based commodities (pulp and paper,fishmeal) to less standardized products for whichcertificates of origin are an important factor (finewines and salmon).
Access to domestic and regional markets in theservices sector. This is the case oftelecommunications, financial services and, morerecently, the generation and distribution of electricalenergy and of drinking water and sanitation services.The regional leadership exercised by some localgroups early on attracted the attention oftransnational firms seeking to position themselvesinternationally as global service groups.
98 ECLAC
Foreign CountryFirm Sector Sales Foreign investor capital of origin Exports
(%)
29 Empresa Metropolitana de Sanitation 140 Suez Lyonnaise des Eaux 51.2 France / Spain …
Obras Sanitarias (EMOS) (25.6%)/Aguas de
Barcelona (25.6%)
30 Cementos Polpaico Cement 138 Holderbank 53.9 Switzerland …
31 Dole Chile S.A. Agriculture 137 Dole Food Company Inc. 100.0 United States 137
32 Forestal Terranova S.A. Forestry 132 81.2 Switzerland 110
33 Compañía Minera Mantos Mining 130 Placer Dome Inc. 100.0 Canada 130
de Oro
34 VTR Global Com S.A. Telecom. 127 United Global Com. Inc. 100.0 United States …
35 Editorial Lord Cochrane S.A. Editorial 122 R.R. Donnelley & Sons 98.5 United States 44
Company
36 Compañía Minera Quebrada Mining 119 Aur Resources Inc. 76.5 Canada 119
Blanca S.A.
37 Bata Chile Textiles 117 Thomas Bata Ltd. 100.0 Canada …
38 Exportador Unifrutti Agriculture 113 De Nadai Group (DNG) 95.3 Italy 113
Traders Limitada
39 Pesca Chile Fisheries 109 Pescanova S.A. 50.0 Spain 109
40 Ewos Chile S.A. Foodstuffs 106 Ewos 100.0 Norway …
41 Cosméticos Avon Chile S.A. Chemicals 105 Avon Inc. 100.0 United States 1
42 Sodexho Chile S.A. Commerce 100 Sodexho Alliance 100.0 France …
43 Smartcom PCS Telecom. 99 Endesa España 100.0 Spain …
44 Mainstream Salmones y Fisheries 65 Ewos 92.7 Norway …
Alimentos S.A.
45 Empresa de Obras Sanitarias Sanitation 64 Anglian Water 40.6 United Kingdom …
de Valparaíso (ESVAL)
46 Papeles Bio-Bio S.A. Paper 64 Fletcher Challenge Ltd. 100.0 New Zealand 33
47 Industrias de Maíz y Foodstuffs 60 Bestfoods 100.0 United States 1
Alimentos S.A.
48 Parmalat Chile Foodstuffs 60 Parmalat Finanziaria 100.0 Italy …
S.p.A.
49 Pesquera Mares Fisheries 58 Nutreco 100.0 Netherlands 54
Australes Ltda.
50 L'Oréal Chile S.A. Chemicals 57 L'Oréal 100.0 France 6
Souce: ECLAC, Information Centre of the Unit of Investment and Corporate Strategies, Division of Production, Productivity and Management, on the basis ofAmérica economía, Gazeta mercantil latinoamericana, Diario Estrategia and El diario, and information provided directly by the firms.
aForeign stake in December 2000.
Table II.2 (concluded)

Foreign investment in Latin America and the Caribbean, 2000 99
Table II.3CHILE: INTERNATIONAL COMPETITIVENESS IN WORLD IMPORTS,
1985-1998
1985 1990 1995 1998
I. Market share 0.23 0.29 0.32 0.32
Natural resourcesa
0.41 0.76 1.03 1.06Resource-based manufactures
b0.61 0.80 0.90 0.95
Non-resource-based manufacturesc
0.02 0.03 0.05 0.04- Low technology
d0.02 0.04 0.06 0.06
- Mid-level technologye
0.02 0.03 0.06 0.06- High technology
ff0.01 0.01 0.01 0.01
Otherg
0.21 0.21 0.18 0.16
II. Export structure (contribution) 100.0 100.0 100.0 100.0
Natural resourcesa
41.3 42.0 42.4 41.4Resource-based manufactures
b51.6 49.7 46.1 47.4
Non-resource-based manufacturesc
4.1 5.9 9.6 9.4- Low technology
d1.0 2.3 3.0 3.3
- Mid-level technologye
2.8 3.3 5.8 5.5- High technology
f0.3 0.3 0.7 0.6
Otherg
2.9 2.4 1.9 1.8
III. 10 main exports by contribution, 1998h i
75.7 75.4 69.9 71.4
682 Copper + 34.5 33.4 24.7 26.1287 Ores and concentrates of base metals + 11.3 10.0 12.7 11.7057 Fruit and nuts (not including oil nuts), fresh
or dried + 12.4 13.4 10.5 10.5034 Fresh fish (live or dead) chilled or frozen + 1.5 4.4 5.6 7.0251 Paper pulp and waste + 4.1 3.5 6.1 4.2112 Alcoholic beverages + 0.3 0.7 1.6 3.3081 Feeding-stuff for animals (not including unmilled
cereals) - 5.8 4.1 3.7 2.8248 Wood, simply worked, and railway sleepers
of wood + 1.7 2.5 2.2 2.8512 Alcohols, phenols, phenol-alcohols and their
derivatives + 0.1 0.9 1.2 1.5281 Iron ore and concentrates - 3.9 2.5 1.6 1.5
Source: ECLAC, on the basis of the ECLAC computer program (CAN) for analysing the international competitiveness of countries. Groups of goods basedon the Standard International Trade Classification (SITC Rev.2).
aContains 45 simply processed commodities, including concentrates.
bContains 65 items: 35 agricultural/forestry groups and another 30 (mostly metals other than steel, petroleum products, cement, glass, etc.).
cContains 120 groups which represent the sum of d + e + f .
dContains 44 items: 20 groups of the textile and wearing apparel cluster, plus another 24 (paper products, glass and steel, jewels).
eContains 58 items: 5 groups from the motor-vehicle industry, 22 from processing industries and 31 from the engineering industry.
fContains 18 items: 11 groups from the electronics cluster plus another 7 (pharmaceutical products, turbines, aeroplanes, instruments).
gContains 9 non-classified groups (mostly from section 9).
hGroups that correspond (*) to the 50 fastest-growing categories in world imports, 1985-1998.
iGroups in which gained Chile (+) or lost (-) market share in world imports, 1985-1998.

B. STRATEGIES OF TRANSNATIONAL CORPORATIONS IN CHILE
1. Pursuit of natural resources for export
(a) Metal mining: the great magnet of the Chileaneconomy
Chile has an abundance of rich mineral deposits thathave attracted the world’s foremost mining companies.Since the beginnings of this activity, the mining sectorhas been very significant for the Chilean economy (seetable II.3). At the present time, mining accounts for 44%of Chile’s exports, 35% of its FDI stock, 8% of GDP andclose to 16% of gross fixed capital formation. The sectoris dominated by copper, which accounts for almost 85%of all mining exports, making Chile the principal copperproducer in the world and the location of the largestknown reserves of this mineral.17
From the beginnings of the copper mining industryand until it was nationalized in the 1970s, miningconcerns were owned almost exclusively by foreignfirms. In 1971 a constitutional reform resulted in thedeposits owned by the United States firms Anaconda,Kennecott and Cerro Corporation being transferred tothe Chilean State, which then established theCorporación Nacional del Cobre de Chile (CODELCO).This State enterprise thus came to account for 84% ofChile’s copper production.18 This situation came about ata time when most of the Latin American countries wereinvolved in a lengthy, large-scale effort to nationalizetheir resource-based industries.
With the military coup of 1973 and the newdirection taken by economic policy, the situation in theChilean mining sector began to change rapidly, at least interms of its regulatory framework. The advent of DL600, which promoted FDI in all economic activities, wasfollowed by constitutional reforms in 1980 thatguaranteed private investors ownership rights overmining concessions, although the State maintainedownership of the deposits themselves. To this end, theGovernment passed the Constitutional Mining
Concessions Organization Act and the Mining Code,which both came into effect in 1983. The newregulations were nothing short of a pioneering step inLatin America, as they incorporated the concept of fullconcession and an attractive compensation mechanismin the case of expropriation based on the present value ofthe future flows that the concession would generate. Italso provided for a favourable taxation scheme, whichafforded an implicit subsidy to mining activity.19 Privateinvestors were slow to respond to these changes,however.
Competition among the main copper producerscontinued to increase on the international market duringthe 1970s. On the one hand, substitutes withtechnological and price advantages began to appear and,on the other, the industry entered into a phase ofdeconcentration, with the emergence of independentproducers in the United States, Canada, Peru, Philippinesand Indonesia (Bande, Marshall and Silva, 1993). Withdemand declining, the price of copper fell sharply andcompetition became more aggressive. This plunged thelarge companies of the industry into a deep crisis,particularly United States firms that were accustomed tosetting market conditions (see figure II.4). Some of thesefirms even asked the United States Government toimplement protectionist measures to help them deal withthis new competitive environment, but these initiativeswere not ultimately successful. This situation—exacerbated by the toughening of environmentalregulations in developed countries— revealed a lack ofcompetitiveness on the part of United States companies,which were obliged to develop strategies directed atimproving efficiency and reducing costs. High-costoperations were therefore shut down, productionprocesses were modernized20 and enhanced with newtechnologies, and labour underwent significantrestructuring, which included redundancies, contract
100 ECLAC
17 In 1998, Chile accounted for 30% of the world’s mined copper production, with 3,687 metric tons of fine metal. Chile was followed by the UnitedStates with 15.1%, Indonesia (6.6%), Canada (5.7%), Australia (4.9%), Russia (4.1%) and Peru (3.9%) (COCHILCO, 1999).
18 CODELCO was organized into four divisions corresponding to the nationalized deposits of Chuquicamata, El Salvador, Andina and El Teniente.
19 Mining benefits from rapid depreciation of fixed assets. Also, joint ventures in mining are not subject to the 35% tax on distributed earnings until
they record a book profit.
20 The most significant innovations include leaching, solvent extraction and electrowinning (Sx-Ew). New systems for transporting materials also
came into use, along with semi-mobile crushers used inside the mines, heavy mining equipment, semi-autogenous mills, large flotation cells,
autogenous fusion processes, use of oxygen in smelting, etc.

renegotiation, salary cuts and new forms ofsubcontracting. Companies thus focussed theirobjectives on cost minimization, improved efficiencyand reduced external vulnerability (Sánchez, Ortiz andMoussa, 1999; Moussa, 1999).21
Beginning in 1986, the downward trend wasreversed and copper prices boomed (see figure II.4). Incombination with technological improvements, highprices led to the re-opening of mines that had beenclosed, expansion of some working mines and thedevelopment of new projects. This phenomenon had theeffect of stepping up the pace of restructuring in thecopper industry. In addition to the earlier changes, theindustry witnessed the internationalization ofproduction, diversification through acquisitions and theestablishment of strategic alliances and joint ventures asmechanisms for securing the financial resources neededto launch new megaprojects. New means of organizationmade it possible to benefit from economies of scale,synergies and externalities associated with a moreflexible supply, facilitate access to new technologies,
secure more and better sources of financing and increasenegotiating power vis-à-vis refineries and suppliers.
As mentioned previously, despite manyfar-reaching reforms of the regulatory framework andthe country’s abundant high-quality deposits, theChilean economy did not receive significant sums ininvestment between 1974 and 1985. In this periodCODELCO became the largest copper producer in Chile—and, indeed, the world— and, in fact, it and MineraDisputada de Las Condes (owned by the United Statesfirm Exxon Mobil) accounted for almost all domesticproduction. This trend was attributable to the wariness offoreign investors —given the recent nationalizations—and the intensive restructuring of the world’s largestmining companies. In the second half of the 1980s,however, as profitability picked up and the strategies oftransnational companies changed, foreign investmentflowed into Chile on a large scale. Technologicaladvances in the copper industry, a positive price cycleand the country’s particular characteristics—exceptional geological conditions, favourable
Foreign investment in Latin America and the Caribbean, 2000 101
Figure II.4PRICE OF COPPER ON THE LONDON METAL EXCHANGE, 1960-2000
(Cents per pound)
0
20
40
60
80
100
120
140
1960
1962
1964
1966
1968
1970
1972
1974
1976
1978
1980
1982
1984
1986
1988
1990
1992
1994
1996
1998
2000
Source: ECLAC, Information Centre of the Unit of Investment and Corporate Strategies, Division of Production, Productivity and Management, onthe basis of information published in Boletín estadístico mensual of the Chilean Copper Commission.
21 To a great extent, in the mining —and particularly copper— market, pricing is an exogenous factor and does not depend on conditions that agentson the supply or demand sides may impose voluntarily. Price determination is influenced by supply factors, such as new explorations andprojects, installed capacity and technological advances, and by demand factors such as level of consumption by end-user industries, level ofeconomic activity and technological changes. A price that reflects the aggregate balance between supply and demand is thus determined on thebasis of the world’s major metal exchanges. In Chile the reference used is the London Metal Exchange.
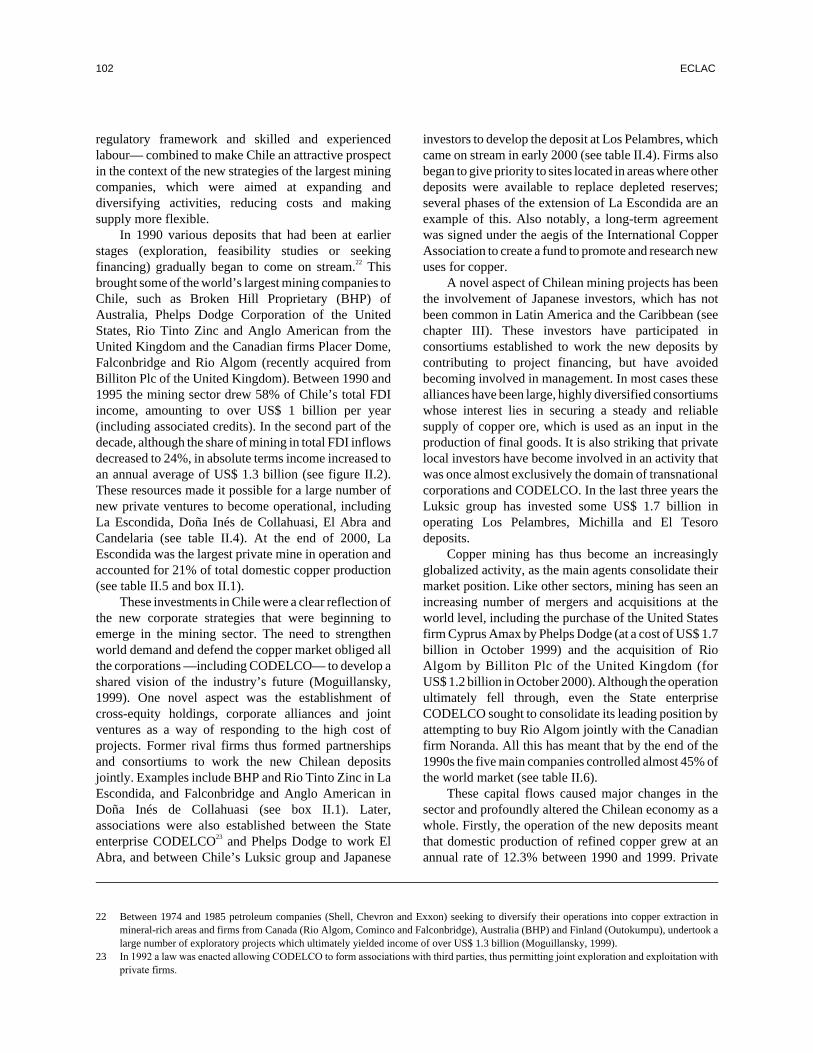
regulatory framework and skilled and experiencedlabour— combined to make Chile an attractive prospectin the context of the new strategies of the largest miningcompanies, which were aimed at expanding anddiversifying activities, reducing costs and makingsupply more flexible.
In 1990 various deposits that had been at earlierstages (exploration, feasibility studies or seekingfinancing) gradually began to come on stream.22 Thisbrought some of the world’s largest mining companies toChile, such as Broken Hill Proprietary (BHP) ofAustralia, Phelps Dodge Corporation of the UnitedStates, Rio Tinto Zinc and Anglo American from theUnited Kingdom and the Canadian firms Placer Dome,Falconbridge and Rio Algom (recently acquired fromBilliton Plc of the United Kingdom). Between 1990 and1995 the mining sector drew 58% of Chile’s total FDIincome, amounting to over US$ 1 billion per year(including associated credits). In the second part of thedecade, although the share of mining in total FDI inflowsdecreased to 24%, in absolute terms income increased toan annual average of US$ 1.3 billion (see figure II.2).These resources made it possible for a large number ofnew private ventures to become operational, includingLa Escondida, Doña Inés de Collahuasi, El Abra andCandelaria (see table II.4). At the end of 2000, LaEscondida was the largest private mine in operation andaccounted for 21% of total domestic copper production(see table II.5 and box II.1).
These investments in Chile were a clear reflection ofthe new corporate strategies that were beginning toemerge in the mining sector. The need to strengthenworld demand and defend the copper market obliged allthe corporations —including CODELCO— to develop ashared vision of the industry’s future (Moguillansky,1999). One novel aspect was the establishment ofcross-equity holdings, corporate alliances and jointventures as a way of responding to the high cost ofprojects. Former rival firms thus formed partnershipsand consortiums to work the new Chilean depositsjointly. Examples include BHP and Rio Tinto Zinc in LaEscondida, and Falconbridge and Anglo American inDoña Inés de Collahuasi (see box II.1). Later,associations were also established between the Stateenterprise CODELCO23 and Phelps Dodge to work ElAbra, and between Chile’s Luksic group and Japanese
investors to develop the deposit at Los Pelambres, whichcame on stream in early 2000 (see table II.4). Firms alsobegan to give priority to sites located in areas where otherdeposits were available to replace depleted reserves;several phases of the extension of La Escondida are anexample of this. Also notably, a long-term agreementwas signed under the aegis of the International CopperAssociation to create a fund to promote and research newuses for copper.
A novel aspect of Chilean mining projects has beenthe involvement of Japanese investors, which has notbeen common in Latin America and the Caribbean (seechapter III). These investors have participated inconsortiums established to work the new deposits bycontributing to project financing, but have avoidedbecoming involved in management. In most cases thesealliances have been large, highly diversified consortiumswhose interest lies in securing a steady and reliablesupply of copper ore, which is used as an input in theproduction of final goods. It is also striking that privatelocal investors have become involved in an activity thatwas once almost exclusively the domain of transnationalcorporations and CODELCO. In the last three years theLuksic group has invested some US$ 1.7 billion inoperating Los Pelambres, Michilla and El Tesorodeposits.
Copper mining has thus become an increasinglyglobalized activity, as the main agents consolidate theirmarket position. Like other sectors, mining has seen anincreasing number of mergers and acquisitions at theworld level, including the purchase of the United Statesfirm Cyprus Amax by Phelps Dodge (at a cost of US$ 1.7billion in October 1999) and the acquisition of RioAlgom by Billiton Plc of the United Kingdom (forUS$ 1.2 billion in October 2000). Although the operationultimately fell through, even the State enterpriseCODELCO sought to consolidate its leading position byattempting to buy Rio Algom jointly with the Canadianfirm Noranda. All this has meant that by the end of the1990s the five main companies controlled almost 45% ofthe world market (see table II.6).
These capital flows caused major changes in thesector and profoundly altered the Chilean economy as awhole. Firstly, the operation of the new deposits meantthat domestic production of refined copper grew at anannual rate of 12.3% between 1990 and 1999. Private
102 ECLAC
22 Between 1974 and 1985 petroleum companies (Shell, Chevron and Exxon) seeking to diversify their operations into copper extraction inmineral-rich areas and firms from Canada (Rio Algom, Cominco and Falconbridge), Australia (BHP) and Finland (Outokumpu), undertook alarge number of exploratory projects which ultimately yielded income of over US$ 1.3 billion (Moguillansky, 1999).
23 In 1992 a law was enacted allowing CODELCO to form associations with third parties, thus permitting joint exploration and exploitation with
private firms.

Foreign investment in Latin America and the Caribbean, 2000 103
Table II.4CHILE: MAIN MINING VENTURES(Millions of dollars and percentages)
Foreign Foreign Country Exports Actual Start StartFirm investor capital of (1999) FDI of of pro-
(%) origin (1998) venture duction
Minera Escondida Ltda. Broken Hill Proprietary, 100.0 Australia/ 1 643 1 847 1988 1991BHP (57.5%) / Rio Tinto UnitedZinc (30%) / JECO Kingdom/Corporation (10%) / JapanWorld Bank (2.5%)
Compañía Minera Doña Anglo American Plc (44%) / 100.0 United 452 1 630 1996 1998Inés de Collahuasi SCM Falconbridge Ltd (44%) / Kingdom/
Mitsui Group (12%) Canada/Japan
Sociedad Contractual Phelps Dodge Corporation 51.0 United States 359 1 349 1995 1996Minera El Abraa
Compañía Minera Disputada Exxon Mobil Corporation 100.0 United States 253 1 995 … 1916de Las Condes Limitada
Sociedad Contractual Minera Phelps Dodge Corp (80%) / 100.0 United States / 306 457 … 1994Candelaria Sumitomo Corp (20%) Japan
Empresa Minera Mantos Anglo American Plc 100.0 United 185 … … …Blancos S.A. Kingdom
Compañía Minera Mantos Placer Dome Inc. 100.0 Canada 130 305 … …de Oro
Compañía Minera Quebrada Aur Resources Inc.b 76.5 Canada 119 369 1993 1994Blanca S.A.
Compañía Minera Cerro Billiton Plcc 100.0 United 564 1992 1994Colorado Kingdom
Compañía Minera Los Mitsubishi Corp. (15%) / 40.0 Japan … 1 360 1997 2000Pelambresd Nippon Mining & Metals Co.
Ltd. (15%) / Marubeni Corp.(8.8%) / Mitsui & Co. Ltd.(1.3%)
Sociedad Contractual Placer Dome Inc. 100.0 Canada … 409 … 1995Minera Zaldívar
Compañía Minera Lomas Westmin Resources Ltd. 100.0 Canada … 278 1997 1998Bayas
Compañía Minera El Indio Barrick Gold Corporation 100.0 Canada … … 1978 1990
Source: ECLAC, Information Centre of the Unit of Investment and Corporate Strategies, Division of Production, Productivity and Management, on the basisof information provided by the Chilean Copper Commission and the Foreign Investment Committee of the Ministry of Economic Affairs, Mining andEnergy of Chile.
aThe remaining 49% is held by CODELCO.
bIn November 2000, Aur Resources purchased 76.5% of the Quebrada Blanca mine, which was owned by Cominco Limited and Teck Corporation, at a cost
of US$ 181 million.c
In August 2000, Billiton Plc acquired the Canadian firm Rio Algom for US$ 1.2 billion, including its mining concerns in Chile.d
60% is held by the Chilean group Luksic.

mining —largely with foreign capital— was the driver ofthis trend, with an annual growth rate of 35.6%, whileCODELCO recorded growth of just 3.6% per year. Chiletherefore increased its share of world copper output andconsolidated its position as top producer, with anincrease from 18% in 1990 to 30% in 1999(COCHILCO, 1999). Secondly, the share of fully orpartly foreign-owned private projects in Chile’s totalcopper production increased sharply. Between 1985 and2000 the share of private projects increased from 10% to66%, while the CODELCO share of total production fellfrom 80% to 33% (see table II.5). Thirdly, the growth ofthe mining industry has had a powerful impact on thesector’s exports, which grew by 6.9% yearly over the lastdecade, to account for 44% of Chile’s total external salesin 1999. Lastly, these investments brought new
technologies, organizational know-how and equipmentsupply firms which have helped to modernize the sectorand close the gap with more competitive miningindustries (Katz, Cáceres and Cárdenas, 2000).
In recent years, gold mining in Chile has alsoreceived a considerable boost. Like the large coppercompanies, gold mining firms have undergonefar-reaching restructuring processes. Twenty years ago,gold production was largely a cottage industry or aby-product of copper mining. Today, technologicaladvances have made it possible to substantially reducecosts and to mine low-grade deposits. As a result, majorcompanies in the world market —such as Barrick GoldCorporation, Placer Dome and Anglo American— havelaunched several projects in the country. Goldproduction thus recorded an annual growth rate of 8.5%
104 ECLAC
Table II.5PRODUCTION OF MARKETABLE COPPER
(Thousands of metric tons of fine copper)
1980 1985 1990 1992 1993 1994 1995 1996 1997 1998 1999 2000
Large-scale mining 904 1 077 1 195 1 156 1 139 1 134 1 165 1 221 1 231 1 403 1 507 1 483
CODELCO 904 1 077 1 195 1 156 1 139 1 134 1 165 1 221 1 231 1 403 1 507 1 483
Private mining 64 134 220 593 715 890 1 109 1 677 1 958 2 083 2 696 2 923
Escondida - - 9 336 389 484 467 841 933 868 958 915
Collahuasi - - - - - - - - - 48 435 433
Disputada 28 77 112 132 181 188 198 201 202 216 248 256
Candelaria - - - - - 31 150 137 156 215 227 207
El Abra - - - - - - - 51 194 199 220 199
Mantos Blancos 35 57 72 69 75 77 76 122 133 138 152 155
Zaldívar - - - - - - 22 77 96 135 150 148
Cerro Colorado - - - - - 21 34 59 60 75 100 116
Quebrada Blanca - - - - - 7 46 68 67 71 73 73
Michillaa - - - 13 20 27 56 63 63 62 61 52
Lomas Bayas - - - - - - - - - 19 45 50
El Indio - - 27 25 28 31 35 35 32 28 15 14
Los Pelambresa - - - 17 22 23 23 23 23 9 12 305
Small mining
enterprises 105 137 173 184 201 196 213 217 202 201 179 38
ENAMI 103 122 142 148 154 119 127 128 97 83 71 …
Others 2 14 30 35 47 78 86 89 105 118 108 …
Total 1 073 1 348 1 588 1 933 2 055 2 220 2 487 3 116 3 392 3 687 4 383 4 444
Source: ECLAC, Information Centre of the Unit of Investment and Corporate Strategies, Division of Production, Productivity and Management, on the basisof information provided by the Chilean Copper Commission (COCHILCO).
aVentures conducted by the Chilean group Luksic.

Foreign investment in Latin America and the Caribbean, 2000 105
Broken Hill Proprietary (BHP) isan Australian company with along tradition in the miningbusiness. Founded in 1885, itgrew and diversified rapidly onthe domestic market in silver,lead, zinc and iron mining andsteel production. In the 1980sBHP embarked on aswiftly-paced internationalexpansion drive with thedevelopment of the Ok Tedicopper mine in Papua NewGuinea, the acquisition of theUnited States firm UtahInternational Inc., andexplorations in Chile. In Chile,BHP discovered one of theworld's largest deposits of copperore, La Escondida, which becameone of the company's mostvaluable assets.
In the 1990s, BHP acquiredseveral companies, opened newmines, moved into thehydrocarbons business andincreased its steel productioncapacity. In common with othermining companies, BHP steppedup its internationalizationprogramme and established aseries of alliances and jointventures as mechanisms offinancing for new projects indifferent parts of the world. In1996, BHP acquired the UnitedStates firm Magma CopperCompany of Tucson, with majorcopper deposits in the states ofArizona and Nevada, and in Peru.In combination with the coppermining operations already ownedby the company, these venturesand acquisitions made BHP thesecond-largest producer ofcopper in the world after
CODELCO. Today, thisAustralian company has threemain areas of operation, withmining accounting for 41% ofassets, followed by steelproduction (26%), hydrocarbons(25%); other smaller-scaleactivities account for 8%.
Almost 40% of BHP incomecomes from marketing miningproducts, led by coal (14%) andcopper (12%). Steel productionlies slightly behind (37%),followed by hydrocarbons (24%).BHP mining activities arecurrently quite diversified in termsof location and product: Australia(iron ore, silver, zinc and carbon),Brazil (iron ore), United States(coal and copper), Indonesia(coal), Chile (copper), PapuaNew Guinea (copper), Peru(copper) and Canada (diamonds).In terms of copper, BHP Chileaninvestments in La Escondidadeposits are the company's mainasset.
La Escondida was discovered in1981 by a consortium led by BHPand entered the production phaseat the end of 1990. As well as itseconomic importance, this projectis particularly interesting as it wasone of the first strategic alliancesestablished for the purpose ofworking a new mining concern.BHP and the British firm Rio TintoZinc, which were former rivals,contributed most of the capitaland their experience in the miningbusiness; the Japaneseconsortium JECO Corporationcontributed financial resourcesand a market for the ore; and theWorld Bank agency, International
Finance Corporation (IFC), providedpart of the financing at a time whensuch resources were very scarce inLatin America. Thus far, actualinvestment in the project stands atUS$ 1.847 billion, of which BHP putup US$ 1.052 billion. State-of-the-arttechnology and a series ofexpansions have made it possible toincrease production from 298,000tons of copper in 1991 to 915,000tons in 2000. La Escondida has thusbecome Chile's foremost deposit� outstripping the CODELCO minesof Chuquicamata and El Teniente�and accounts for 21% of domesticcopper production. The mine's shareof total domestic production isexpected to increase to close to25% in the coming years as a resultof the new expansions. In December2000 construction work began onPhase IV of the project, intended tomaintain production levels as thegrade of the ore in existing depositsdeclines in the next few years, andon a new concentrates treatmentplant. An assessment is also underway of the Escondida Norte project,a deposit of copper reserves of over500 million tons.
In summary, this Australiancompany has sought to lower costsand improve operational efficiencythrough a strategy ofinternationalization and forgingalliances. Sales, acquisitions,alliances and financial restructuringare based on an assessment of thefuture competitiveness of thecompany's various assets at theaggregate level. In the next fewyears it is expected that the firm willcontinue to consolidate itsoperations at the world level andbecome firmly established as amajor supplier of mining products.
Box II.1BROKEN HILL PROPRIETARY (BHP): A GLOBALIZED MINING COMPANY?
Source: ECLAC, Unit of Investment and Corporate Strategies, Division of Production, Productivity and Management, on the basis of information fromBroken Hill Proprietary (http://www.bhp.com).
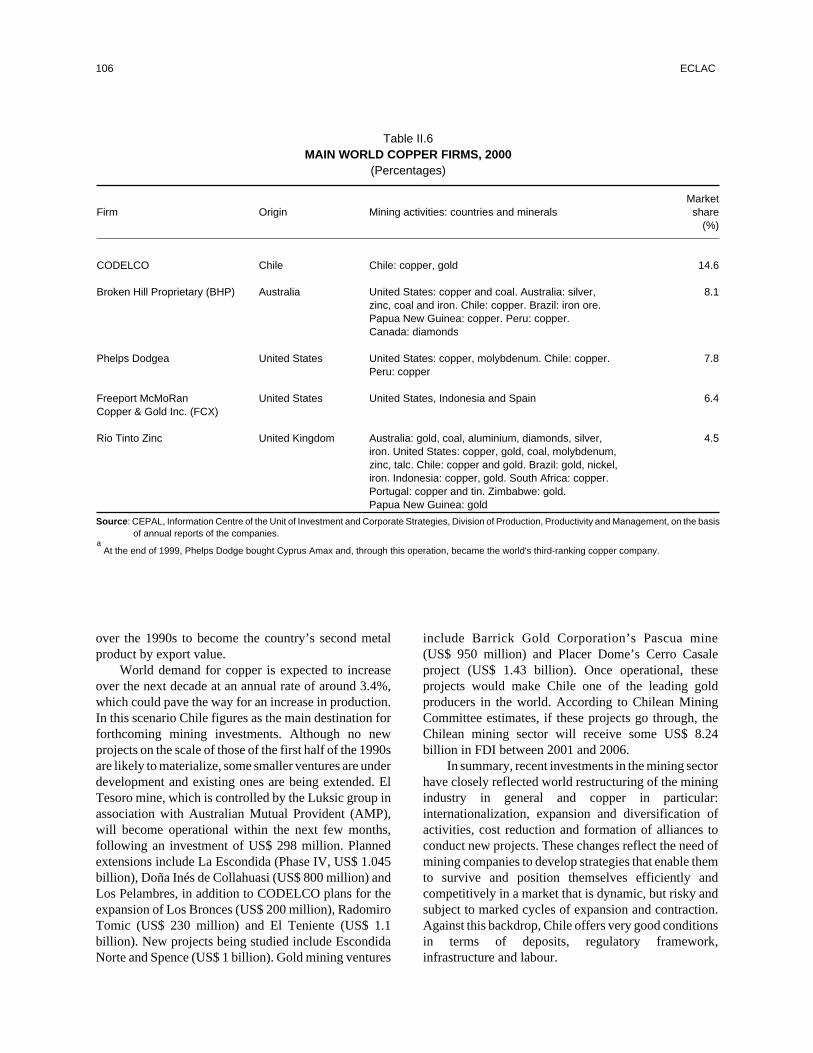
over the 1990s to become the country’s second metalproduct by export value.
World demand for copper is expected to increaseover the next decade at an annual rate of around 3.4%,which could pave the way for an increase in production.In this scenario Chile figures as the main destination forforthcoming mining investments. Although no newprojects on the scale of those of the first half of the 1990sare likely to materialize, some smaller ventures are underdevelopment and existing ones are being extended. ElTesoro mine, which is controlled by the Luksic group inassociation with Australian Mutual Provident (AMP),will become operational within the next few months,following an investment of US$ 298 million. Plannedextensions include La Escondida (Phase IV, US$ 1.045billion), Doña Inés de Collahuasi (US$ 800 million) andLos Pelambres, in addition to CODELCO plans for theexpansion of Los Bronces (US$ 200 million), RadomiroTomic (US$ 230 million) and El Teniente (US$ 1.1billion). New projects being studied include EscondidaNorte and Spence (US$ 1 billion). Gold mining ventures
include Barrick Gold Corporation’s Pascua mine(US$ 950 million) and Placer Dome’s Cerro Casaleproject (US$ 1.43 billion). Once operational, theseprojects would make Chile one of the leading goldproducers in the world. According to Chilean MiningCommittee estimates, if these projects go through, theChilean mining sector will receive some US$ 8.24billion in FDI between 2001 and 2006.
In summary, recent investments in the mining sectorhave closely reflected world restructuring of the miningindustry in general and copper in particular:internationalization, expansion and diversification ofactivities, cost reduction and formation of alliances toconduct new projects. These changes reflect the need ofmining companies to develop strategies that enable themto survive and position themselves efficiently andcompetitively in a market that is dynamic, but risky andsubject to marked cycles of expansion and contraction.Against this backdrop, Chile offers very good conditionsin terms of deposits, regulatory framework,infrastructure and labour.
106 ECLAC
Table II.6MAIN WORLD COPPER FIRMS, 2000
(Percentages)
MarketFirm Origin Mining activities: countries and minerals share
(%)
CODELCO Chile Chile: copper, gold 14.6
Broken Hill Proprietary (BHP) Australia United States: copper and coal. Australia: silver, 8.1zinc, coal and iron. Chile: copper. Brazil: iron ore.Papua New Guinea: copper. Peru: copper.Canada: diamonds
Phelps Dodgea United States United States: copper, molybdenum. Chile: copper. 7.8Peru: copper
Freeport McMoRan United States United States, Indonesia and Spain 6.4Copper & Gold Inc. (FCX)
Rio Tinto Zinc United Kingdom Australia: gold, coal, aluminium, diamonds, silver, 4.5iron. United States: copper, gold, coal, molybdenum,zinc, talc. Chile: copper and gold. Brazil: gold, nickel,iron. Indonesia: copper, gold. South Africa: copper.Portugal: copper and tin. Zimbabwe: gold.Papua New Guinea: gold
Source: CEPAL, Information Centre of the Unit of Investment and Corporate Strategies, Division of Production, Productivity and Management, on the basisof annual reports of the companies.
aAt the end of 1999, Phelps Dodge bought Cyprus Amax and, through this operation, became the world's third-ranking copper company.
(b) Other natural resources: from commodities toproducts bearing certificates of origin
In the second half of the 1980s the Chilean economyreceived major capital flows in the form of FDI in otherresource-based production sectors. This inflowcoincided with strong growth in exports of forestryproducts, paper and pulp, and some agricultural (mainlyfresh fruit) and fisheries products. In most cases,investment helped to fortify local groups and boostexports. In the 1990s, however, tougher competition onthe world commodities markets and slimmer profitmargins meant that some of the foreign investors that hadbeen very active during the previous decade withdrew orrelocated.
(i) The forestry sector: consolidation of localgroups
Chile has enormous natural advantages in theforestry sector, and these conditions have been reflectedin the rapid growth of the country’s tree plantations.24
The State played an active role in promotinginvestments, establishing firms and plantations, andencouraging the industrialization of the sector, which hasbeen directed largely towards the production of pulp andpaper. At the beginning of the 1970s various projectsreached maturity, in particular several concerned withpulp production (Katz, Stumpo and Varela, 2000). From1974 onward, in line with the new orientation ofeconomic policy, the situation in the sector began tochange. The existing State enterprises were transferredto the private sector and incentives were created tostimulate private investment in forestry. Decree Law 701of 1974 was a key mechanism in the subsequentdevelopment of forestry activity in Chile.25 From thattime on, the private sector began to invest heavily andexports, particularly of pulp, enjoyed sustained growth.In fact, the ratio of output to external sales of pulpquickly rose above 65%, and now stands at above 80%.The forestry sector as a whole —pulp and paper,silviculture and wood products— have thus become thesecond most important source of exports for the Chileaneconomy, after mining.
The increase in investment came about in aninternational context marked by increasing competitionand growing concentration of production. Seeking tobenefit from economies of scale, optimize operations,streamline production structures and reduce costs, majorcompanies increased the scale of their productionactivities and geographical diversification. It thereforebecame necessary to seek new terrain in which to investand to take advantage of the special incentives offered bycountries keen to develop their industries. Countries withlow relative costs such as Chile, Brazil and South Africatherefore became attractive destinations for internationalmarket leaders, which led to an increase in their share ofworld production.26
During the second half of the 1980s, the sectorrecorded large volumes of FDI, much of which entered thecountry under the debt-equity conversion programme. Infact, the forestry sector was the main target of ChapterXIX transactions, accounting for almost 30% of the total.In most cases, foreign firms forged alliances with the mainlocal groups in the sector (Matte and Angelini). The mostsignificant investments included:• A joint venture between the local firm Compañía
Manufacturera de Papeles y Cartones S.A. (CMPC) ofthe Matte group and the United States firm SimpsonPaper Company to develop an industrial complexknown as Celulosa del Pacífico (CELPAC), whichproduced bleached pulp and derivatives.
• The purchase of Forestal e Industrial Santa Fe S.A. (anindustrial complex producing bleached pulp andderivatives) and its raw materials supplier ForestalColcura S.A., in addition to the development of areforestation programme by a consortium led by theUnited Kingdom-Netherlands firm RoyalDutch-Shell and Citicorp and Scott Paper of theUnited States.
• The purchase of a majority share in Compañía dePetróleos de Chile S.A. (COPEC) from the local groupAngelini by the New Zealand firm Carter Holt HarveyCo. These resources enabled COPEC to prepay itsexternal borrowings, an operation which it had beenunable to undertake after its bid to gain control of thecountry’s largest private business complex (Rozas,
Foreign investment in Latin America and the Caribbean, 2000 107
24 The most widely planted species in Chile is radiata pine, which grows at a yearly average rate of 20 to 25 m3
per hectare, whereas in Sweden and
the United States the rate is less than 7 m3
(Stumpo, 1997).
25 Decree Law 701 absolutely prohibited the expropriation of forestry lands and afforded a 20-year subsidy of up to 75% of the cost of forestationand administration of plantations. It also granted exemptions and reductions on property taxes and on earnings from exploiting natural andartificial forests. In 1994, this legal framework was superseded by a package of laws which reduced the tax incentives and incorporated strongerenvironmental and social provisions.
26 A significant share of world production is concentrated in developed countries (United States, Japan, Germany, United Kingdom. France,
Canada, Italy, Sweden and Finland) owing to the intensive processes of integration, productive specialization and technological innovation
undergone by their industries (Bercovich and Katz, 1997).

1992). In mid-1987 forestry activity represented 56%of COPEC assets, headed by Compañía de CelulosaArauco y Constitución S.A. (CELCO).
• The purchase of Forestal Bío Bío S.A. and Papeles yBosques Bío Bío S.A. —which together produced40% of the newsprint manufactured in the country atthat time— by the New Zealand firm FletcherChallenge.
Most of these investments were associated with thetransfer of existing assets that had been renderedrelatively non-convertible either by high levels ofborrowing on the part of domestic firms or simply by thefact that the controlling local shareholders had gonebankrupt. These assets were largely acquired bytransnational firms from the United States (SimpsonPaper Co. and Scott Paper Co.) and New Zealand (CarterHold Harvey and Fletcher Challenge) which had noexisting operations in the country or by transnationalbanks that were carrying large sums of Chilean externaldebt (Rozas, 1992). The forestry sector thus channelledinvestments worth US$ 192 million through DL 600between 1982 and 1989 and US$ 1.026 billion throughChapter XIX between 1985 and 1989.
The increase in installed capacity at world level,combined with a steep decline in demand from thecountries of the Organisation for EconomicCo-operation and Development (OECD), caused a sharpprice fall which obliged companies to reduce costs andimprove efficiency. In the first half of the 1990sinvestments in Chile were in the process of maturing, andthis was reflected in an increase in output and exports.Between 1990 and 1996, output grew by 11.9% per year,while productivity recorded an increase of 7.9% (Katz,Stumpo and Varela, 2000). Sectoral growth displayed ashift towards specialization in pulp production anddownstream integration in the forestry sector, reflectingfirms’ attempts to benefit from economies of integration(associated with natural advantages) and economies ofscale (associated with the size of plants). Pulp exportsthus grew from about US$ 400 million to almostUS$ 2 billion between 1985 and 2000, coming to accountfor 11% of the country’s external sales.
In response to these trends, transnationalcorporations began to withdraw from the Chileanforestry industry. Firstly, the Matte group bought the
assets of Royal Dutch-Shell (Forestal e Industrial SantaFe), and Simpson Paper (Celulosa del Pacífico) sold itsassets to the Matte group.27 Later, the alliance betweenCarter Holt Harvey and COPEC was dissolved, and theAngelini group took control of the assets held by the NewZealand firm.28 The main alliances between domestic andforeign firms thus came to an end, FDI flows to the sectorstagnated and local groups positioned themselves as themain agents of production and export. Currently, theselocal groups are embarking upon strategies involving theinternational expansion of production that will allowthem to take advantage of subsidies and lower land pricesto develop new plantations in neighbouring countries.
In summary, the negligible presence of foreigncapital in the Chilean forestry sector can be attributed to avariety of factors. Firstly, the production base of thesector was structured several decades ago, and privatelocal groups were therefore able to position themselvesbetter than in other sectors and maintain their marketshare right up to the time when their investments maturedat the end of the 1980s. The Matte and Angelini groupswere large property holders in the sector and their firmsdisplayed positive levels of growth, output and exportcompetitiveness, especially in pulp. Given theseconditions, the best alternative available to foreign firmswas to associate with local groups, which were alreadywell run, were integrated into local input networks andhad developed competitive exports. Secondly,competition on commodities markets became tougherin the 1990s, with a significant decrease in profits, andthis prompted the withdrawal of the foreign investorsthat owned stakes in some of the sector’s leadingcompanies.
(ii) The fisheries sector: from yellow jack tosalmon
Chile has over 5,000 kilometres of coastline, whichhas enabled it to become one of the largest fish producersin the world. In the mid-1990s, Chile ranked third incapture fishery, after China and Peru, and ahead ofJapan, the United States and Russia. The country wasalso the world’s second largest exporter of fishmeal,after Peru, outstripping the export figures of Denmarkand Iceland (FAO, 2000; Kouzmine, 1999).
108 ECLAC
27 In September 1997, CMPC bought 80% of Forestal e Industrial Santa Fe from Royal Dutch-Shell, thus gaining 100% control of the short-fibrepulp plant. In December of the same year, CMPC acquired the stake of Simpson Paper and other minority shareholders to own Celulosa delPacífico and Forestal Angol outright, in an operation which represented a total investment of US$ 476 million. After these purchases, CMPCembarked upon a process of reorganization which included merging and transferring some assets.
28 In December 1999 the Angelini group gained control of COPEC after purchasing Carter Holt Harvey’s stake in the company for some US$ 1.233
billion.
Capture activities with a low level of added valueand activities associated with the production and exportof fishmeal have historically attracted little foreigncapital. Instead, as in the forestry sector, some foreignagents have used the debt conversion mechanism toinvest in ownership stakes in the country’s largestfisheries, usually in partnership with local groups such asAngelini. Foreign investors gradually withdrew from thesector’s more traditional segments, however, as stocksdeclined steadily and commodity prices trendeddownward (affecting fishmeal), while the existing levelof regulation proved inadequate for managing theresource and some firms borrowed to excess. Morerecently, products with higher added value, such asturbot and deep-sea cod, have begun to attract foreigninvestment as trends in world markets have become morepromising. These activities are still incipient, however.
The salmon industry, on the other hand, has seenspectacular growth. This is attributable to the country’senormous natural advantages and the lower productioncosts associated with labour, infrastructure and feeding,in addition to effective start-up support from Stateagencies.29 The Association of Salmon and TroutProducers has also been actively involved throughout theprocess, initially through a policy directed at positioningChilean salmon on international markets and later withthe establishment of the Salmon Technological Institute(Intesal), an agency which has worked to improveproduction techniques, quality control and diseasemanagement. The salmon industry has invested almostUS$ 2.5 billion in building processing plants andpurchasing machinery. Today, salmon is the leadingsegment of the fisheries industry and accounts for 50% oftotal fisheries exports (see figure II.5). From 1.8% of thecountry’s total external sales in 1991, salmon farminggrew to account for 5.3% in 2000, or some US$ 950million. Chile has thus become the second largestproducer in the world and, together with Norway (theworld’s main exporter), represents 68% of total salmonsales on the international market.
It has not been entirely plain sailing for the Chileansalmon industry, however. United States producers fileda complaint regarding dumping and subsidization in1997. In July 1998 it was successfully demonstrated that
the activity was not subsidized. Thanks to thispreliminary ruling by the Department of Commerce,only two Chilean firms had to pay tariff surcharges toplace their products on the United States market, andalmost 70% of Chilean fresh salmon output destined forthe United States market is not subject to tariffsurcharges.
Rapidly increasing demand has encouraged theworld’s largest salmon firms —from Norway and theUnited States— to internationalize their operations andseek new locations for production and farming.Norwegian firms are also obliged to expand overseasbecause of production quotas at home. Chile’sgeographical conditions (fjords, canals, islands andlakes), natural advantages (climate and watertemperature) and economic situation (availability offood and labour) have brought the country to theattention of several of these companies.
Fish farming in Chile operates on the basis ofaquaculture concessions granted by the State, and theprocedure is rather complicated and cumbersome. Forthis reason, the great majority of foreign investorsseeking to become established in the country havepurchased existing firms. Within a relatively shortperiod, companies from Norway (Fjörd Seafood, Ewos,Stolt Seafann), the Netherlands (Nutreco) and Canada(B.C. Packard) acquired some of Chile’s largest salmonproducers. Today, foreign firms account for almost 40%of output (Estrategia, 23 October 2000, p. 13). TheNetherlands firm Nutreco has become the country’smain exporter (US$ 86.8 million).30 Nutreco also ownsTrow Chile, which has won almost 40% of the salmonfeed market (see box II.2). In late 2000, Fjörd Seafood,one of the world’s largest salmon producers, acquiredSalmones Americanos and Salmones Tecmar31 forUS$ 50 and US$ 90 million, respectively. Theseacquisitions rapidly moved this Norwegian companyinto second place in terms of exports. By combining thecapacity of these acquisitions, Fjörd Seafood plans toincrease its output to some 33,000 tons in 2001 and thusaccount for 10% of world production within a few years.Lastly, Ewos, also from Norway, bought Mainstream(the second-largest salmon exporter in Chile), in keepingwith the shift towards the globalization of aquaculture
Foreign investment in Latin America and the Caribbean, 2000 109
29 Although there was no formal policy supporting the sector, Fundación Chile was responsible for a major milestone in the development of salmonfarming, with the introduction of intensive farming technology. Fundación Chile also established the company Antártica, which was a pioneer inChilean salmon farming and very successful. In fact, in 1998 the company became the first ever to produce over 1,000 tons per year. Later, thisfirm was acquired by Nippon Suissan Kaisha of Japan, but its greatest impact was to have set a successful example in the private sector for theestablishment of similar enterprises.
30 On 1 July 2000 Nutreco merged with Mares Australes and Marine Harvey. The new enterprise retained the name of Marine Harvey, which
enjoyed a better international position.
31 Salmones Tecmar had also acquired Salmones Quellón and stakes in Salmones Huillinco (37%) and Salmones Maintec (50%).
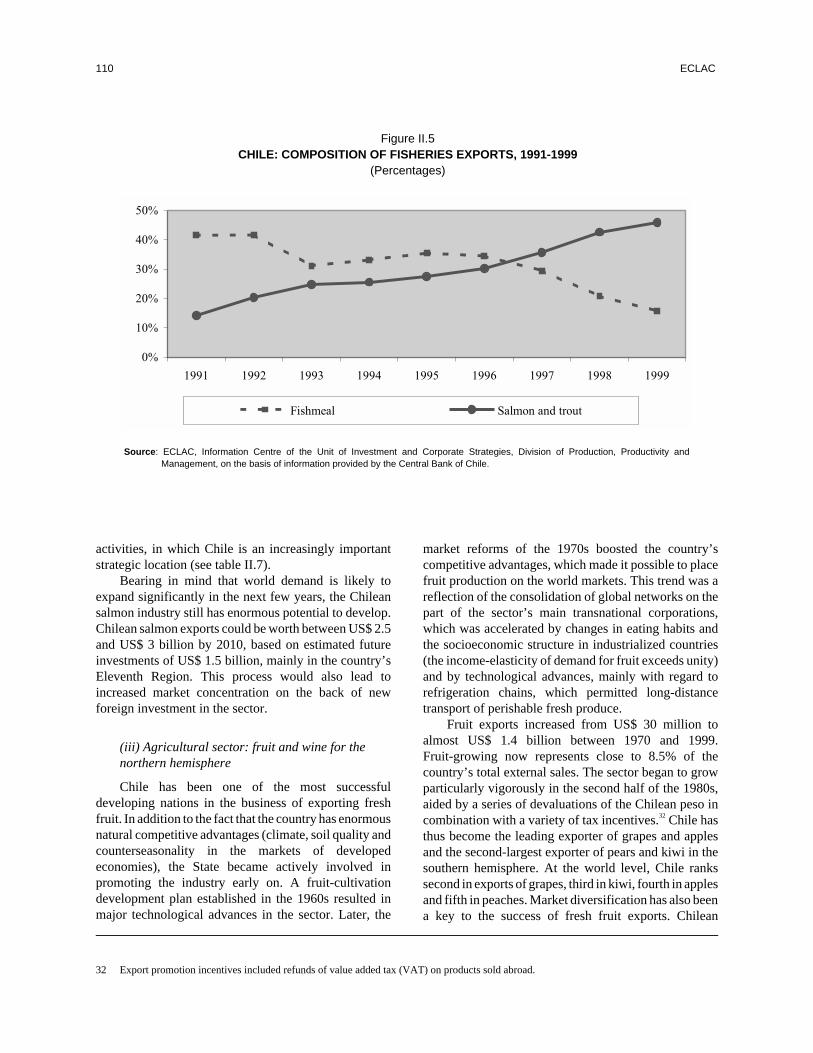
activities, in which Chile is an increasingly importantstrategic location (see table II.7).
Bearing in mind that world demand is likely toexpand significantly in the next few years, the Chileansalmon industry still has enormous potential to develop.Chilean salmon exports could be worth between US$ 2.5and US$ 3 billion by 2010, based on estimated futureinvestments of US$ 1.5 billion, mainly in the country’sEleventh Region. This process would also lead toincreased market concentration on the back of newforeign investment in the sector.
(iii) Agricultural sector: fruit and wine for thenorthern hemisphere
Chile has been one of the most successfuldeveloping nations in the business of exporting freshfruit. In addition to the fact that the country has enormousnatural competitive advantages (climate, soil quality andcounterseasonality in the markets of developedeconomies), the State became actively involved inpromoting the industry early on. A fruit-cultivationdevelopment plan established in the 1960s resulted inmajor technological advances in the sector. Later, the
market reforms of the 1970s boosted the country’scompetitive advantages, which made it possible to placefruit production on the world markets. This trend was areflection of the consolidation of global networks on thepart of the sector’s main transnational corporations,which was accelerated by changes in eating habits andthe socioeconomic structure in industrialized countries(the income-elasticity of demand for fruit exceeds unity)and by technological advances, mainly with regard torefrigeration chains, which permitted long-distancetransport of perishable fresh produce.
Fruit exports increased from US$ 30 million toalmost US$ 1.4 billion between 1970 and 1999.Fruit-growing now represents close to 8.5% of thecountry’s total external sales. The sector began to growparticularly vigorously in the second half of the 1980s,aided by a series of devaluations of the Chilean peso incombination with a variety of tax incentives.32 Chile hasthus become the leading exporter of grapes and applesand the second-largest exporter of pears and kiwi in thesouthern hemisphere. At the world level, Chile rankssecond in exports of grapes, third in kiwi, fourth in applesand fifth in peaches. Market diversification has also beena key to the success of fresh fruit exports. Chilean
110 ECLAC
Figure II.5CHILE: COMPOSITION OF FISHERIES EXPORTS, 1991-1999
(Percentages)
0%
10%
20%
30%
40%
50%
1991 1992 1993 1994 1995 1996 1997 1998 1999
Fishmeal Salmon and trout
Source: ECLAC, Information Centre of the Unit of Investment and Corporate Strategies, Division of Production, Productivity andManagement, on the basis of information provided by the Central Bank of Chile.
32 Export promotion incentives included refunds of value added tax (VAT) on products sold abroad.

produce is sold in three major markets: North America(United States and Canada), Europe and Latin America,which each account for roughly a third of exports.
Transnational corporations have been veryimportant in this process, particularly since this is such astrongly integrated and globalized market. The chainfrom tree to consumer is complex and not necessarilylinked by direct ownership, but by a series of contractualagreements33 (Gwynne, 1998; Murray, 1999). In Chile,the large export firms —mostly foreign-owned— wereinstrumental in coordinating small producers and inbeginning to position and market fruit products abroad.
Firstly, the exporters provided the services to prepare,pack and store the fruit. Secondly, they assembled largeenough quantities to justify investment in services,obtain economies of scale in transport and gain the powerto negotiate prices in the destination countries. Theseexport companies were also fundamental in identifying,adapting and transferring technology to the fruit sector.In the mid-1980s foreign firms started up their operationsin Chile under the debt conversion mechanism (ChapterXIX) and invested heavily to promote the activity. Sincethen, with the exception of the local firm David DelCurto,34 transnational corporations have spearheaded
Foreign investment in Latin America and the Caribbean, 2000 111
Nutreco is a transnationalcorporation based in theNetherlands and a leader in theaquaculture and farmingindustries. The corporation'saquaculture activities consist ofproducing fish food and breeding,raising, processing and marketingsalmon. Its agricultural activitiesinvolve the production of animalfeedstuffs, stock raising and meatprocessing. Nutreco has recentlypursued an active strategy ofinternational expansion, largelythrough acquisitions. Today thecorporation owns some 80production and processing plantsin 18 countries, and its marketpresence is highly diversified.During the 1990s Nutreco rapidlybecame the leading company inthe sector when it acquired theBritish firm Marine Harvest and-jointly with Norsk Hydro AS ofNorway- Hydro Seafood, also of
Norway, the world's largestsalmon producer, with a 12%share of the world market.Nutreco has also deployed majorefforts in product innovation andcost control, seeking to optimizesynergy between firms and takeadvantage of economies of scale.
In 1988, Nutreco began itsactivities in Chile by forming analliance with a local animal feedproducer, and then boughtPesquera Mares Australes andcreated the local subsidiary TrowChile, which specialized in fishfood. Mares Australes is one ofthe country's largest salmonenterprises today, with activitiesin the Tenth and EleventhRegions, while Trow Chile is oneof the largest players in the fishfood market. Trow Chile owns theworld's largest fish foodprocessing plant, which is located
in Osorno, and other plantsstrategically located close tostock-raising areas. The subsidiaryhas developed new products forstock raising and has successfullyreduced costs and improved thefinal quality control of its products.The firm boosted its growth in thefish food industry by purchasingBiomaster, a fish food subsidiary ofIndustria Azucarera Nacional S.A.(IANSA). Meanwhile, Nutrecoincreased its stakes in the Chileansalmon market through theacquisition of Marine Harvest. Thecorporation has production activitiesin Chile and Canada, which hasenabled it to take advantage of arapidly expanding North Americanmarket. Through Pesquera MaresAustrales and Marine Harvest,Nutreco has become the leadingsalmon exporter in Chile.
Box II.2NUTRECO: FOOD FOR FISH? FISH FOR FOOD?
Source: ECLAC, Information Centre of the Unit of Investment and Corporate Strategies, Division of Production, Productivity and Management, on thebasis of information from Marine Harvest (http://www.marine-harvest.com) and Nutreco (http://www.nutreco.com).
33 These agreements include the informal contract between consumers and their preferred supermarket chain; the more formal contracts betweensupermarket chains, wholesalers and importers and different types of fruit export companies; and contracts between export firms and producers(Murray, 1999).
34 This company was a pioneer in the fresh fruit export industry. It was founded in the 1950s by the Chilean businessman David Del Curto and isnow Chile’s leading fruit exporter, with over 13 million crates per year.
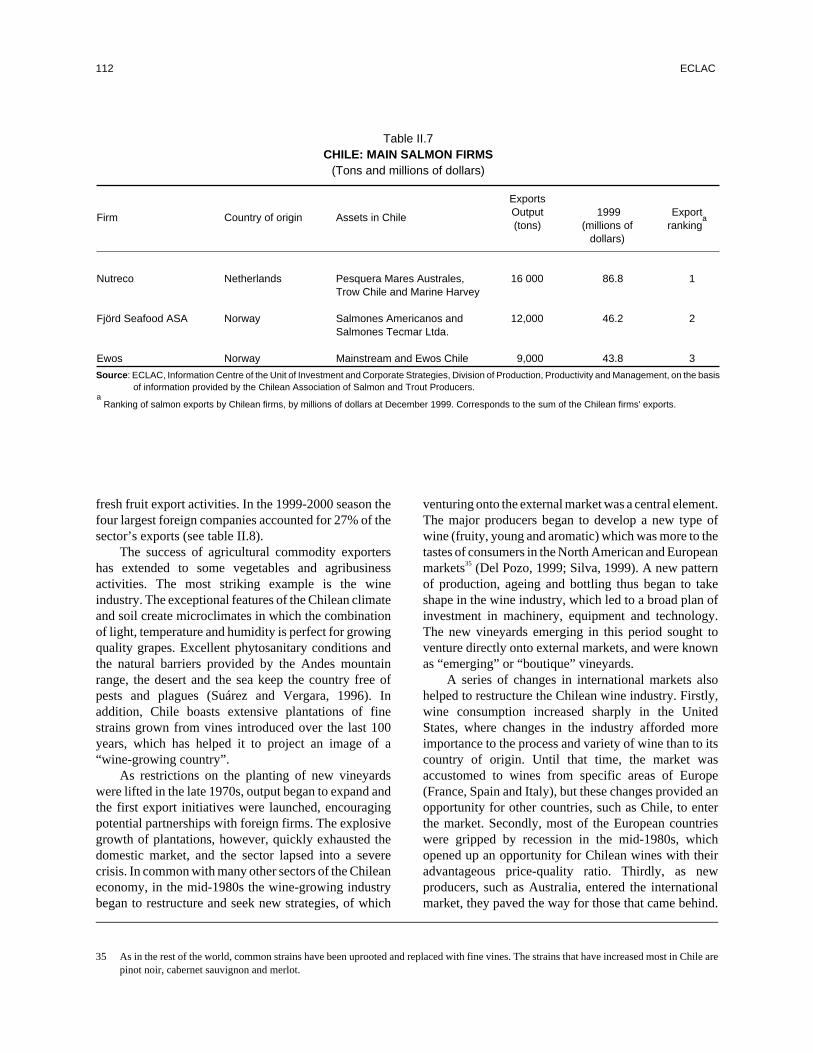
fresh fruit export activities. In the 1999-2000 season thefour largest foreign companies accounted for 27% of thesector’s exports (see table II.8).
The success of agricultural commodity exportershas extended to some vegetables and agribusinessactivities. The most striking example is the wineindustry. The exceptional features of the Chilean climateand soil create microclimates in which the combinationof light, temperature and humidity is perfect for growingquality grapes. Excellent phytosanitary conditions andthe natural barriers provided by the Andes mountainrange, the desert and the sea keep the country free ofpests and plagues (Suárez and Vergara, 1996). Inaddition, Chile boasts extensive plantations of finestrains grown from vines introduced over the last 100years, which has helped it to project an image of a“wine-growing country”.
As restrictions on the planting of new vineyardswere lifted in the late 1970s, output began to expand andthe first export initiatives were launched, encouragingpotential partnerships with foreign firms. The explosivegrowth of plantations, however, quickly exhausted thedomestic market, and the sector lapsed into a severecrisis. In common with many other sectors of the Chileaneconomy, in the mid-1980s the wine-growing industrybegan to restructure and seek new strategies, of which
venturing onto the external market was a central element.The major producers began to develop a new type ofwine (fruity, young and aromatic) which was more to thetastes of consumers in the North American and Europeanmarkets35 (Del Pozo, 1999; Silva, 1999). A new patternof production, ageing and bottling thus began to takeshape in the wine industry, which led to a broad plan ofinvestment in machinery, equipment and technology.The new vineyards emerging in this period sought toventure directly onto external markets, and were knownas “emerging” or “boutique” vineyards.
A series of changes in international markets alsohelped to restructure the Chilean wine industry. Firstly,wine consumption increased sharply in the UnitedStates, where changes in the industry afforded moreimportance to the process and variety of wine than to itscountry of origin. Until that time, the market wasaccustomed to wines from specific areas of Europe(France, Spain and Italy), but these changes provided anopportunity for other countries, such as Chile, to enterthe market. Secondly, most of the European countrieswere gripped by recession in the mid-1980s, whichopened up an opportunity for Chilean wines with theiradvantageous price-quality ratio. Thirdly, as newproducers, such as Australia, entered the internationalmarket, they paved the way for those that came behind.
112 ECLAC
Table II.7CHILE: MAIN SALMON FIRMS
(Tons and millions of dollars)
Exports
Firm Country of origin Assets in Chile Output 1999 Export(tons) (millions of ranking
a
dollars)
Nutreco Netherlands Pesquera Mares Australes, 16 000 86.8 1Trow Chile and Marine Harvey
Fjörd Seafood ASA Norway Salmones Americanos and 12,000 46.2 2Salmones Tecmar Ltda.
Ewos Norway Mainstream and Ewos Chile 9,000 43.8 3
Source: ECLAC, Information Centre of the Unit of Investment and Corporate Strategies, Division of Production, Productivity and Management, on the basisof information provided by the Chilean Association of Salmon and Trout Producers.
aRanking of salmon exports by Chilean firms, by millions of dollars at December 1999. Corresponds to the sum of the Chilean firms' exports.
35 As in the rest of the world, common strains have been uprooted and replaced with fine vines. The strains that have increased most in Chile arepinot noir, cabernet sauvignon and merlot.
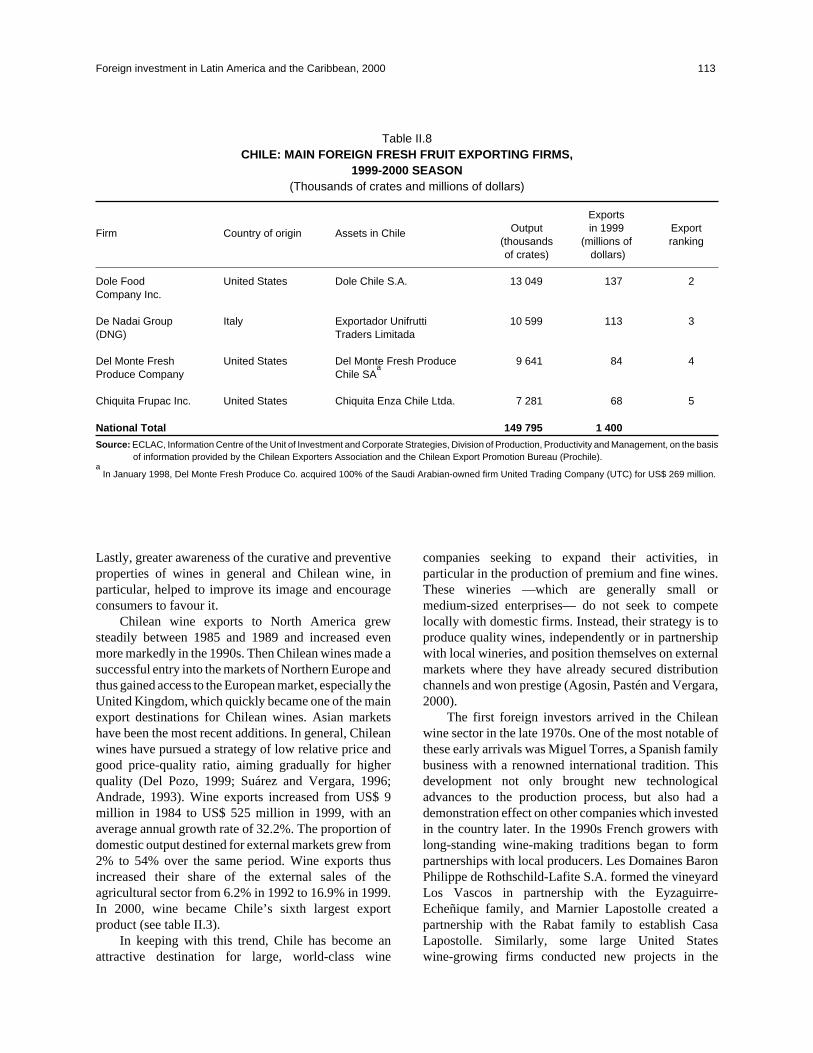
Lastly, greater awareness of the curative and preventiveproperties of wines in general and Chilean wine, inparticular, helped to improve its image and encourageconsumers to favour it.
Chilean wine exports to North America grewsteadily between 1985 and 1989 and increased evenmore markedly in the 1990s. Then Chilean wines made asuccessful entry into the markets of Northern Europe andthus gained access to the European market, especially theUnited Kingdom, which quickly became one of the mainexport destinations for Chilean wines. Asian marketshave been the most recent additions. In general, Chileanwines have pursued a strategy of low relative price andgood price-quality ratio, aiming gradually for higherquality (Del Pozo, 1999; Suárez and Vergara, 1996;Andrade, 1993). Wine exports increased from US$ 9million in 1984 to US$ 525 million in 1999, with anaverage annual growth rate of 32.2%. The proportion ofdomestic output destined for external markets grew from2% to 54% over the same period. Wine exports thusincreased their share of the external sales of theagricultural sector from 6.2% in 1992 to 16.9% in 1999.In 2000, wine became Chile’s sixth largest exportproduct (see table II.3).
In keeping with this trend, Chile has become anattractive destination for large, world-class wine
companies seeking to expand their activities, inparticular in the production of premium and fine wines.These wineries —which are generally small ormedium-sized enterprises— do not seek to competelocally with domestic firms. Instead, their strategy is toproduce quality wines, independently or in partnershipwith local wineries, and position themselves on externalmarkets where they have already secured distributionchannels and won prestige (Agosin, Pastén and Vergara,2000).
The first foreign investors arrived in the Chileanwine sector in the late 1970s. One of the most notable ofthese early arrivals was Miguel Torres, a Spanish familybusiness with a renowned international tradition. Thisdevelopment not only brought new technologicaladvances to the production process, but also had ademonstration effect on other companies which investedin the country later. In the 1990s French growers withlong-standing wine-making traditions began to formpartnerships with local producers. Les Domaines BaronPhilippe de Rothschild-Lafite S.A. formed the vineyardLos Vascos in partnership with the Eyzaguirre-Echeñique family, and Marnier Lapostolle created apartnership with the Rabat family to establish CasaLapostolle. Similarly, some large United Stateswine-growing firms conducted new projects in the
Foreign investment in Latin America and the Caribbean, 2000 113
Table II.8CHILE: MAIN FOREIGN FRESH FRUIT EXPORTING FIRMS,
1999-2000 SEASON(Thousands of crates and millions of dollars)
Firm Country of origin Assets in Chile
ExportsOutput in 1999 Export
(thousands (millions of rankingof crates) dollars)
Dole Food United States Dole Chile S.A. 13 049 137 2Company Inc.
De Nadai Group Italy Exportador Unifrutti 10 599 113 3(DNG) Traders Limitada
Del Monte Fresh United States Del Monte Fresh Produce 9 641 84 4Produce Company Chile SA
a
Chiquita Frupac Inc. United States Chiquita Enza Chile Ltda. 7 281 68 5
National Total 149 795 1 400
Source: ECLAC, Information Centre of the Unit of Investment and Corporate Strategies, Division of Production, Productivity and Management, on the basisof information provided by the Chilean Exporters Association and the Chilean Export Promotion Bureau (Prochile).
aIn January 1998, Del Monte Fresh Produce Co. acquired 100% of the Saudi Arabian-owned firm United Trading Company (UTC) for US$ 269 million.

country, such as Kendall Jackson, which created LaCalina vineyard, and Canandaigua Bands, whichacquired Viña Veramonte. One interesting case is theAustralian firm Mildara Blass Wines Inc. —which wasacquired by the beer group Fosters— and Viña SantaCarolina, which established the wine brandDallas-Conté as a joint venture on international markets.The Australian firm contributed technology anddistribution channels in the United States and the UnitedKingdom, while Viña Santa Carolina was responsible forproduction.
In general these partnerships have proven attractivefor local businesses because they offer access tofinancing, technology and know-how for fine wineproduction in addition to the distribution channels andprestige of their foreign partners. This combination hasmade it possible for Chilean producers to obtain betterprices on external markets. The local and internationalprospects for the wine industry are thus excellent, andboth exports and investments are likely to continue
growing. Output should increase by 40% by 2005, andthe value of exports is expected to exceed US$ 1 billion(70% of this figure corresponds to red wine), which willbring additional infrastructure investments of US$ 250million in the next three years. Increased wineproduction will also require a stronger drive to positionwines on international markets, entailing investments inadvertising of around US$ 178 million, rising to US$ 223million by 2005 (Estrategia, 10 July 2000, p. 20).
In summary, the wine industry has passed throughtwo distinct phases: investment in technology between1981 and 1986, and export development from 1987onward. Initially, Chilean wine featured a goodprice-quality ratio and entered markets at low pricelevels while diversifying its international destinations.Both quality and price have increased as the firms’strategies have gradually changed from market entry tomarket positioning, with the production of premium andultra-premium wines. Foreign firms have played anespecially active role in the latter stage.
2. Access to services markets: Chile as a stepping stone to Latin America
In the second half of the 1990s, the trend described aboveoverlapped with a completely new phenomenon in theChilean economy. At the international level, a new breedof firms were embarking on active strategies of mergersand acquisitions to consolidate their global, regional andlocal positions. This trend was particularly strong in theservices sector, in the wake of market opening,liberalization and changing competitive conditions inlocal markets. These corporations thus began to buyleading firms on different domestic markets, creating aninternational network that was increasingly global innature, in terms of both geographical coverage and therange of services offered. This trend was particularlymarked in Chile, especially in the sectors of electricalenergy, telecommunications, drinking water, sanitationand financial services (see table II.9).
Chilean firms have been identified as an excellentopportunity by transnational service corporationsseeking to position themselves as global players. First,Chilean firms are already accustomed to operating in acompetitive environment, as a result of the early reformsimplemented by the authorities at the beginning of the1970s. Second, the majority of the leading firms in thesesectors are financially solvent and have access tointernational capital markets. Third, they have acquired
valuable know-how and experience in their own spheresof operation. Fourth —and perhaps most significantly—they have conducted an ambitious strategy ofinternational expansion in Latin America by using theirexperience in the industry to acquire stakes in recentlyprivatized companies.
The transfer of privately-owned local groups —andin some cases public-sector companies— totransnational corporations has resulted in enormous FDIinflows (see figure II.1) and is beginning to shape a newcorporate panorama in Chile (see figure II.2). Between1995 and 2000 foreign companies disbursed overUS$ 16.3 billion in acquisitions in the Chilean servicessector (see table II.9). Sectors which were oncedominated by local business owners are now largelycontrolled by foreign investors, and through theseacquisitions, emerging transnational service corporationsare consolidating their positions in Latin America.
(a) Electricity transnationals: from Chile to therest of the region
The last two decades have been marked byfar-reaching changes in the Chilean electricity sectorwhich have culminated in the transfer of the sector’s
114 ECLAC

Foreign investment in Latin America and the Caribbean, 2000 115
Table II.9CHILE: LARGEST SERVICES ACQUISITIONS, 1995-2000
(Percentages and millions of dollars)
Date Firm Sector Buyer OriginPercen-
Amounttage
Dec-97 Enersis S.A. Electricity Endesa Españaa
Spain 64.0 2 629Apr-99
May-99 Empresa Nacional deElectricity S.A. (ENDESA) Electricity Enersis Spain 34.7 2 146
Dec-00 Gener S.A. Electricity The AES Corp. United States 95.6 1 300
Oct-00 Compañía Nacional deTransmisión Eléctrica S.A.(TRANSELEC S.A.) Electricity HydroQuebec Canada 100.0 1 076
Apr-99 Chilquinta Energía S.A. Electricity Sempra Energy United States 100.0 878Jan-00 (Enerquinta) (50%) / Public
Services EnterpriseGroup (PSEG)(50%)
Jul-97 Empresa Metropolitana Electricity Pennsylvannia United States 95.0 287Nov-99 de Electricidad (EMEL) Power and Light
(PP&L)
Aug-00 Empresa Eléctrica Colbún Electricity Tractebel S.A. Belgium 26.0 …
Dec-99 Empresa Nacional de Telecommu- Telecom Italia Italy 38.3 1 026Dec-00 Telecomuninications S.A. nications
(ENTEL)
Jun-00 Smartcom PCS Telecommu- Endesa Spain Spain 100.0 300nications
Apr-99 VTR Global Com S.A. Telecommu- United Global United States 60 258(ex- VTR Cablexpress S.A.) nications Com. Inc.
Dec-00 ENTEL PCS Telecommu- ENTELb
Italy 25.0 125nications
Oct-99 ENTEL Telefonía Personal Telecommu- BellSouth Corp. United States 100.0 90nications
May-00 Telefónica Manquehue S.A. Telecommu- National Grid United Kingdom 30.0 80nications Group Plc
c
Aug-99 Empresa Metropolitana de Sanitation Aguas deSep-99 Obras Sanitarias (EMOS) Barcelona (25.5%) / Spain / France 51.2 1 103
Suez Lyonnaise desEaux (25.5%)
Oct-00 Empresa de Servicios Sanitation Thames Water United Kingdom 42.0 282Sanitarios del Bío-Bío(ESSBIO)
Jul-00 Aguas Cordillera Sanitation EMOS Spain / Francia 100.0 193
Dec-98 Empresa Sanitaria de Sanitation Anglian Water Plcd
United Kingdom 40.0 138Jul-00 Valparaíso (ESVAL)
Nov-99 Empresa de Servicios Sanitation Thames Water Plc United Kingdom / 51.0 136Sanitarios del Libertador (50%) / Eletricidade Portugal(ESSEL) de Portugal (50%)
Jul-99 Empresa de Servicios Sanitation Iberdrola Spain 51.0 94Sanitarios de Los Lagos(ESSAL)
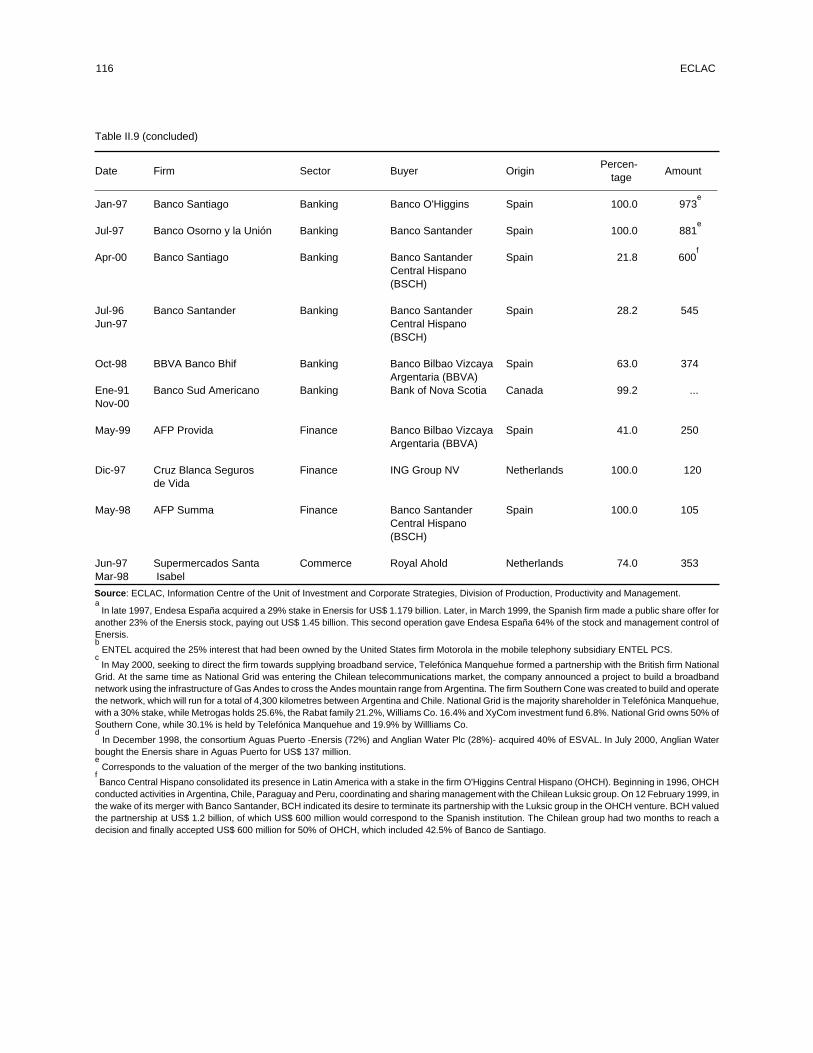
116 ECLAC
Table II.9 (concluded)
Date Firm Sector Buyer OriginPercen-
Amounttage
Jan-97 Banco Santiago Banking Banco O'Higgins Spain 100.0 973e
Jul-97 Banco Osorno y la Unión Banking Banco Santander Spain 100.0 881e
Apr-00 Banco Santiago Banking Banco Santander Spain 21.8 600f
Central Hispano(BSCH)
Jul-96 Banco Santander Banking Banco Santander Spain 28.2 545Jun-97 Central Hispano
(BSCH)
Oct-98 BBVA Banco Bhif Banking Banco Bilbao Vizcaya Spain 63.0 374Argentaria (BBVA)
Ene-91 Banco Sud Americano Banking Bank of Nova Scotia Canada 99.2 ...Nov-00
May-99 AFP Provida Finance Banco Bilbao Vizcaya Spain 41.0 250Argentaria (BBVA)
Dic-97 Cruz Blanca Seguros Finance ING Group NV Netherlands 100.0 120de Vida
May-98 AFP Summa Finance Banco Santander Spain 100.0 105Central Hispano(BSCH)
Jun-97 Supermercados Santa Commerce Royal Ahold Netherlands 74.0 353Mar-98 Isabel
Source: ECLAC, Information Centre of the Unit of Investment and Corporate Strategies, Division of Production, Productivity and Management.a
In late 1997, Endesa España acquired a 29% stake in Enersis for US$ 1.179 billion. Later, in March 1999, the Spanish firm made a public share offer foranother 23% of the Enersis stock, paying out US$ 1.45 billion. This second operation gave Endesa España 64% of the stock and management control ofEnersis.b
ENTEL acquired the 25% interest that had been owned by the United States firm Motorola in the mobile telephony subsidiary ENTEL PCS.c
In May 2000, seeking to direct the firm towards supplying broadband service, Telefónica Manquehue formed a partnership with the British firm NationalGrid. At the same time as National Grid was entering the Chilean telecommunications market, the company announced a project to build a broadbandnetwork using the infrastructure of Gas Andes to cross the Andes mountain range from Argentina. The firm Southern Cone was created to build and operatethe network, which will run for a total of 4,300 kilometres between Argentina and Chile. National Grid is the majority shareholder in Telefónica Manquehue,with a 30% stake, while Metrogas holds 25.6%, the Rabat family 21.2%, Williams Co. 16.4% and XyCom investment fund 6.8%. National Grid owns 50% ofSouthern Cone, while 30.1% is held by Telefónica Manquehue and 19.9% by Willliams Co.d
In December 1998, the consortium Aguas Puerto -Enersis (72%) and Anglian Water Plc (28%)- acquired 40% of ESVAL. In July 2000, Anglian Waterbought the Enersis share in Aguas Puerto for US$ 137 million.e
Corresponds to the valuation of the merger of the two banking institutions.fBanco Central Hispano consolidated its presence in Latin America with a stake in the firm O'Higgins Central Hispano (OHCH). Beginning in 1996, OHCH
conducted activities in Argentina, Chile, Paraguay and Peru, coordinating and sharing management with the Chilean Luksic group. On 12 February 1999, inthe wake of its merger with Banco Santander, BCH indicated its desire to terminate its partnership with the Luksic group in the OHCH venture. BCH valuedthe partnership at US$ 1.2 billion, of which US$ 600 million would correspond to the Spanish institution. The Chilean group had two months to reach adecision and finally accepted US$ 600 million for 50% of OHCH, which included 42.5% of Banco de Santiago.
main assets to foreign investors. The Chilean electricityfirms, which in the early 1980s operated strictly withinChile and were owned and managed almost entirely bythe public sector, are now strongly internationalizedthroughout Latin America and owned largely by majortransnational service corporations. The process by whichthis transformation came about was not linear, however,but occurred in several stages.• With the first privatizations in 1980, the State
transferred the ownership and management of themain electricity companies to local private investorsin a process which was completed during the first halfof the 1990s.
• Once in private hands, the main electricity companiesgrew rapidly and diversified widely at the nationallevel. There followed an active regional expansioneffort which significantly increased the geographicalcoverage of these firms.
• In the late 1990s, Chile’s leading electricity firms andconglomerates (Enersis, Endesa and Gener) began toencounter tough competition from extraregionaltransnational corporations. They were acquired in theperiod 1999-2000, giving rise to the current situationin which the sector is largely owned by major foreignplayers.
The first Chilean electricity privatizations occurredearly in comparison with the rest of Latin America, withthe public tender of two small firms in the southern partof the country in 1980 —Sociedad Austral deElectricidad (Satel) and Empresa Eléctrica de la Frontera(Fondel). In the second half of the 1980s this process wasconsolidated with the privatization of the country’s twolargest electricity companies —Empresa Nacional deElectricidad S.A. (Endesa) and Chilectra. By the late1980s most of Chile’s electricity generation,transmission and distribution facilities were owned bylocal private investors. In theory, the privatizationprocess was intended to generate competition in theindustry and avoid concentration of ownership. Thelarge companies were therefore divided into a series ofsubsidiaries and privatized through the sale of shares toinstitutional investors, public tenders of non-controllingpackages and direct sales of small share packages atdiscounted prices to company employees, members ofthe armed forces, civil servants in general and small localinvestors. These mechanisms and the subsequentregulatory system did not operate as envisaged,however, and some shareholders were able to makesuccessive purchases to secure much larger stakes in the
ownership and management of the main firms. Forexample, in the mid-1980s Enersis controlled the boardsof Endesa and Chilectra, which gave it control over asubstantial portion of Chilean generation andtransmission (Moguillansky, 1997).
The second stage of the transformation of theindustry took place once the Chilean electricitycompanies were consolidated in local private hands. Thisstage was associated with electricity privatizations inother countries of the region, a process which lasted untilthe mid-1990s. In the post-privatization period, Chileanelectricity companies embarked on plans to modernizeoperations, optimize resources and establish a corporatescheme in which parent companies invested throughvarious forms of financing in a set of relatedsubsidiaries.36 In this period the Chilean firms undertookan aggressive strategy of expansion andinternationalization as reform processes unfoldedthroughout Latin America. Despite increasingcompetition from transnational corporations fromoutside the region during this process, Chileancompanies such as Enersis —directly and through itsshare in Endesa— and Chilgener (now known as Gener)were able to establish a solid position in the region. Incombination with their knowledge of the region, thesefirms’ profits, their financial capacity and the experiencethey had gained in Chile’s private sector gave thempowerful advantages in the early phases of privatizationin the rest of Latin America. The main Chilean electricitycompanies were thus major players in the electricityprivatizations of several countries in the Southern Coneand Central America and came to control major assets inArgentina, Brazil, Colombia and Peru by the end of the1990s (see table II.10).
In the second half of the 1990s, the conditionswhich had made this expansion possible began tochange rapidly. On the one hand, Brazil’s electricityprivatization offered substantially larger assets —andtherefore required much greater resources to continuethe strategy of regional expansion— than previousprivatizations in other countries. On the other, majorelectricity companies from outside the region, whichhad a much larger financial capacity than the Chileanfirms, began to show a growing interest in LatinAmerica. These extraregional firms included EndesaEspaña, which already had assets in Argentina,Dominican Republic, Peru and Venezuela in themid-1990s, and AES Corporation of the United States,
Foreign investment in Latin America and the Caribbean, 2000 117
36 Forms of financing included companies’ own resources, bond and share issues on the domestic market, borrowing from domestic and foreignbanks, and issues of bonds and ADRs on international markets.
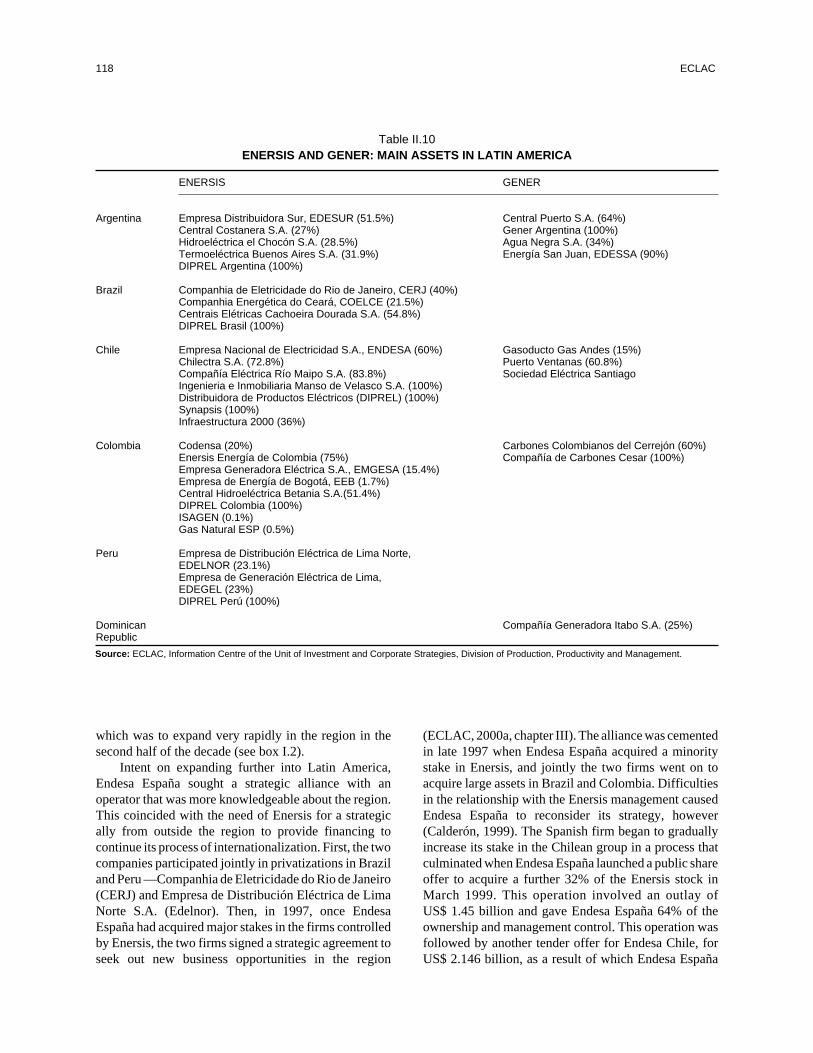
which was to expand very rapidly in the region in thesecond half of the decade (see box I.2).
Intent on expanding further into Latin America,Endesa España sought a strategic alliance with anoperator that was more knowledgeable about the region.This coincided with the need of Enersis for a strategically from outside the region to provide financing tocontinue its process of internationalization. First, the twocompanies participated jointly in privatizations in Braziland Peru —Companhia de Eletricidade do Rio de Janeiro(CERJ) and Empresa de Distribución Eléctrica de LimaNorte S.A. (Edelnor). Then, in 1997, once EndesaEspaña had acquired major stakes in the firms controlledby Enersis, the two firms signed a strategic agreement toseek out new business opportunities in the region
(ECLAC, 2000a, chapter III). The alliance was cementedin late 1997 when Endesa España acquired a minoritystake in Enersis, and jointly the two firms went on toacquire large assets in Brazil and Colombia. Difficultiesin the relationship with the Enersis management causedEndesa España to reconsider its strategy, however(Calderón, 1999). The Spanish firm began to graduallyincrease its stake in the Chilean group in a process thatculminated when Endesa España launched a public shareoffer to acquire a further 32% of the Enersis stock inMarch 1999. This operation involved an outlay ofUS$ 1.45 billion and gave Endesa España 64% of theownership and management control. This operation wasfollowed by another tender offer for Endesa Chile, forUS$ 2.146 billion, as a result of which Endesa España
118 ECLAC
Table II.10ENERSIS AND GENER: MAIN ASSETS IN LATIN AMERICA
ENERSIS GENER
Argentina Empresa Distribuidora Sur, EDESUR (51.5%) Central Puerto S.A. (64%)Central Costanera S.A. (27%) Gener Argentina (100%)Hidroeléctrica el Chocón S.A. (28.5%) Agua Negra S.A. (34%)Termoeléctrica Buenos Aires S.A. (31.9%) Energía San Juan, EDESSA (90%)DIPREL Argentina (100%)
Brazil Companhia de Eletricidade do Rio de Janeiro, CERJ (40%)Companhia Energética do Ceará, COELCE (21.5%)Centrais Elétricas Cachoeira Dourada S.A. (54.8%)DIPREL Brasil (100%)
Chile Empresa Nacional de Electricidad S.A., ENDESA (60%) Gasoducto Gas Andes (15%)Chilectra S.A. (72.8%) Puerto Ventanas (60.8%)Compañía Eléctrica Río Maipo S.A. (83.8%) Sociedad Eléctrica SantiagoIngenieria e Inmobiliaria Manso de Velasco S.A. (100%)Distribuidora de Productos Eléctricos (DIPREL) (100%)Synapsis (100%)Infraestructura 2000 (36%)
Colombia Codensa (20%) Carbones Colombianos del Cerrejón (60%)Enersis Energía de Colombia (75%) Compañía de Carbones Cesar (100%)Empresa Generadora Eléctrica S.A., EMGESA (15.4%)Empresa de Energía de Bogotá, EEB (1.7%)Central Hidroeléctrica Betania S.A.(51.4%)DIPREL Colombia (100%)ISAGEN (0.1%)Gas Natural ESP (0.5%)
Peru Empresa de Distribución Eléctrica de Lima Norte,EDELNOR (23.1%)Empresa de Generación Eléctrica de Lima,EDEGEL (23%)DIPREL Perú (100%)
Dominican Compañía Generadora Itabo S.A. (25%)Republic
Source: ECLAC, Information Centre of the Unit of Investment and Corporate Strategies, Division of Production, Productivity and Management.

gained control over the leading Chilean generator (seetable II.9).
A very similar sequence of events took place withdifferent players a year and a half later in connection withGener. Recognizing the need for an extraregional partnerto help it survive in highly competitive regional markets,in late October 2000 the Chilean electricityconglomerate announced a strategic alliance with theFrench petroleum company TotalFinaElf. The terms ofthe operation were immediately rejected by somemembers of the Gener board, however, and in earlyNovember AES Corporation of the United Stateslaunched a public share offer for 80% of the stock of theChilean conglomerate. TotalFinaElf withdrew from thealliance with Gener and instead negotiated an agreementwith AES Corporation. Under the terms of thisagreement, TotalFinaElf would not interfere with thepublic tender and, in return, the United States firm agreedto sell TotalFinaElf its Gener assets in Argentina in theevent of a successful tender (see table II.10). The Genershareholders approved the offer from AES Corporationon 13 December 2000, and a few days before the end ofthe year the United States firm acquired a stake of over95.6% in Gener with an outlay of over US$ 1.3 billion(see box I.2 and table II.9). In late January 2001, AESlaunched a second public tender for the remaining 4.4%,in compliance with new legislation on public shareoffers.
Despite their magnitude, these operations do notaccount for all the recent changes in the electricity sector.Although Endesa España and AES Corporation are themain actors in this process and the current leaders of theChilean electricity sector, other transnationalcorporations have also gained significant shares in somesegments. These include the United States firmPennsylvania Power and Light (PP&L), which controlsover 95% of Empresa Metropolitana de Electricidad(Emel), the country’s third largest distributor, followinga series of acquisitions. In late 2000 and early 2001,PP&L also acquired a stake in Compañía General deElectricidad (CGE) amounting to 7% of the fourthlargest electricity company in Chile by sales (see tableII.11). Another major player is the United States firmSouthern Energy, which was one of the first foreignfirms to invest in the Chilean electricity sector. In 1993Southern Energy acquired 35.1% of Empresa Eléctricadel Norte Grande S.A. (Edelnor) for US$ 73 million andsince then has raised its stake to 82.3% through a series of
other acquisitions and capital increases (Edelnor, 2000).Another two United States firms with significantinterests in Chile are Public Services Enterprise Group(PSEG) and Sempra Energy. Between April 1999 andJanuary 2000, they acquired 100% of Chilquinta Energíafor a total of US$ 878 million (see table II.9). Lastly, inOctober 2000 the Canadian firm HydroQuebec boughtCompañía Nacional de Transmisión Eléctrica(Transelec) outright from Endesa Chile for US$ 1.076billion.37
Over the last two years the Chilean electricityindustry has thus been shaped by an aggressivestrategy of market penetration and regionalconsolidation on the part of major transnationalcorporations from outside the region. By means of afew aggressive acquisitions, these transnationalplayers cut short the internationalization of theChilean electricity industry by local players and leftalmost the entire sector under the control of foreigninvestors (see table II.11). The main operationsinvolving Endesa España and AES Corporation werepart of a policy of rapid expansion in the rest of theregion which served to consolidate their regionalposition, particularly in the segment of generation, andsignificantly altered the ownership structure of theindustry in many countries of the region. Although thefinal outcome of this restructuring at the local andregional level is still far from clear, and a significantnumber of regional and foreign players remain indifferent niches, the industry has recently shown aclear tendency towards concentration in the hands of afew transnational corporations which operateregionally. This is the trend which underlies the recentacquisitions of Enersis, Endesa Chile and Gener.
(b) Chile: a testing ground for Europeantelecommunications operators?
The telecommunications industry has seen deeprestructuring throughout the 1990s at the world andregional levels and has become one of the mostdynamic sectors in the globalization process (seechapter IV). In Chile, telecommunications has beenone of the economy’s fastest growing sectors, withincreasing coverage and improved quantity andquality of services, technological advances and ratereductions. In fact, from 1.3% of GDP in 1989,telecommunications came to account for 3.5% in
Foreign investment in Latin America and the Caribbean, 2000 119
37 The board of Endesa Chile agreed to tender its 100% stake in Transelec in accordance with commitments made by Enersis as part of a plan toincrease transparency in the operation of the electricity sector. The decision was made owing to disagreements over vertical integration and thetransmission monopoly.
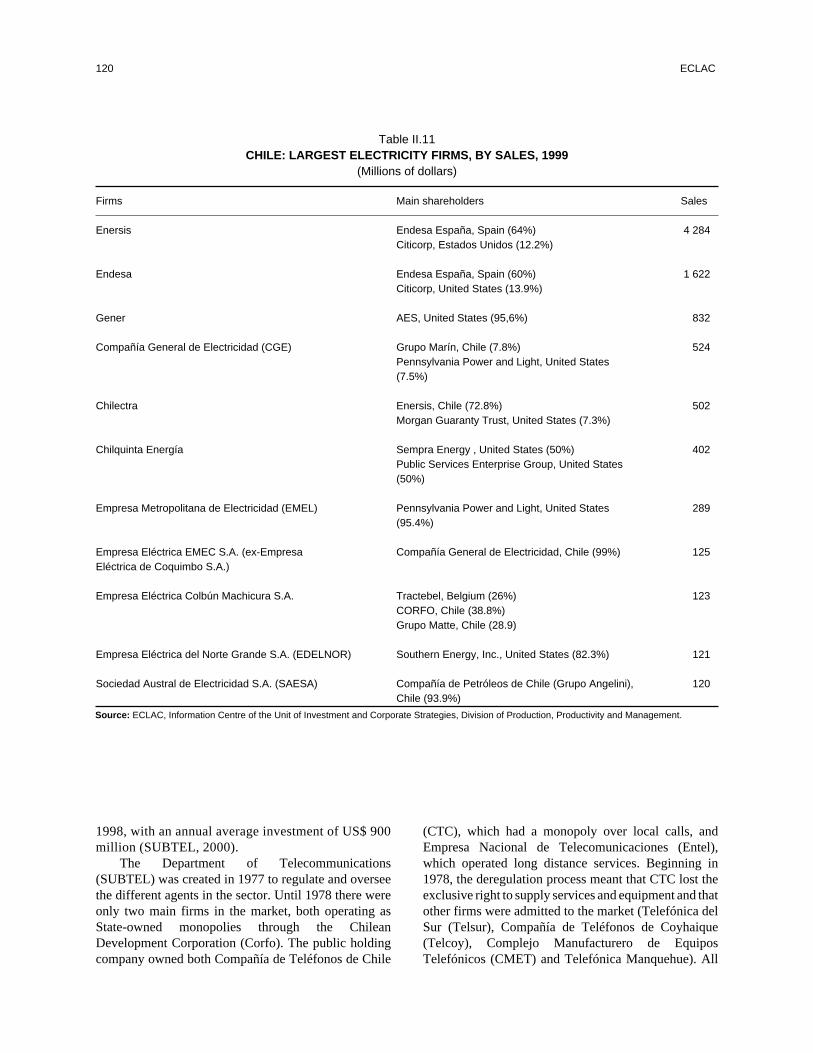
1998, with an annual average investment of US$ 900million (SUBTEL, 2000).
The Department of Telecommunications(SUBTEL) was created in 1977 to regulate and overseethe different agents in the sector. Until 1978 there wereonly two main firms in the market, both operating asState-owned monopolies through the ChileanDevelopment Corporation (Corfo). The public holdingcompany owned both Compañía de Teléfonos de Chile
(CTC), which had a monopoly over local calls, andEmpresa Nacional de Telecomunicaciones (Entel),which operated long distance services. Beginning in1978, the deregulation process meant that CTC lost theexclusive right to supply services and equipment and thatother firms were admitted to the market (Telefónica delSur (Telsur), Compañía de Teléfonos de Coyhaique(Telcoy), Complejo Manufacturero de EquiposTelefónicos (CMET) and Telefónica Manquehue). All
120 ECLAC
Table II.11CHILE: LARGEST ELECTRICITY FIRMS, BY SALES, 1999
(Millions of dollars)
Firms Main shareholders Sales
Enersis Endesa España, Spain (64%) 4 284Citicorp, Estados Unidos (12.2%)
Endesa Endesa España, Spain (60%) 1 622Citicorp, United States (13.9%)
Gener AES, United States (95,6%) 832
Compañía General de Electricidad (CGE) Grupo Marín, Chile (7.8%) 524Pennsylvania Power and Light, United States(7.5%)
Chilectra Enersis, Chile (72.8%) 502Morgan Guaranty Trust, United States (7.3%)
Chilquinta Energía Sempra Energy , United States (50%) 402Public Services Enterprise Group, United States(50%)
Empresa Metropolitana de Electricidad (EMEL) Pennsylvania Power and Light, United States 289(95.4%)
Empresa Eléctrica EMEC S.A. (ex-Empresa Compañía General de Electricidad, Chile (99%) 125Eléctrica de Coquimbo S.A.)
Empresa Eléctrica Colbún Machicura S.A. Tractebel, Belgium (26%) 123CORFO, Chile (38.8%)Grupo Matte, Chile (28.9)
Empresa Eléctrica del Norte Grande S.A. (EDELNOR) Southern Energy, Inc., United States (82.3%) 121
Sociedad Austral de Electricidad S.A. (SAESA) Compañía de Petróleos de Chile (Grupo Angelini), 120Chile (93.9%)
Source: ECLAC, Information Centre of the Unit of Investment and Corporate Strategies, Division of Production, Productivity and Management.
these new firms, which together covered 6% of thecountry, were set up by local investors (see table II.12).
In the early 1980s, ahead of other countries in theregion, the Chilean authorities undertook afar-reaching reform of the telecoms sector. TheGeneral Telecommunications Act was enacted in1982, creating a regulatory framework whoseprovisions remain in place today, with no more than afew alterations.38 In the mid-1980s the Statetelecommunications monopoly gave way to privatecapital investment in both the basic telephone networkand long-distance services. The privatization of CTCand Entel began in 1986 and involved both local andforeign investors.• In January 1998 almost 50% of the share capital of
CTC was transferred to the Australian group BondCorporation. This transaction caused some surprisegiven the Australian investor’s lack of experience inthe telecommunications sector; the firm bid thehighest price per share, however, and committed tocapital increase of US$ 270 million. Then, in the wakeof financial problems in Australia and unable to meetits commitments in Chile, Bond was obliged totransfer its share in CTC to the Spanish firmTelefónica de España in 1990, which paid US$ 388million for 42.6% of the stock. Telefónica currentlyholds a stake of 43.6% in CTC39 and has managementcontrol of the firm.
• Between 1986 and 1992 Entel was broken up and sold,mainly to local investors. In 1989, 33% was owned bycorporations and 24% by pension fund administrators,while the Chilean firm Chilquinta40 owned 20% of theshare capital and held management control. Thenforeign investors began to seek stakes in Entel. Thefirst was Telefónica de España, which was soonobliged to transfer its share to Telecom Italia due toinfractions of competition legislation. Telecom Italiacurrently has a 54.2% share and management controlof Entel, following a successful acquisition in late2000 (see table II.9).41
Since then, several foreign firms embarking on aninternational expansion effort —particularly Telefónicade España— have used the Chilean market as a testingground in which to weigh their possibilities of expandinginto the rest of the region. Not only does Chile offerfavourable conditions for foreign investment, butChilean telecommunications legislation is considered tobe one of the most open in the world (Moguillansky,1998). These conditions have compensated forinvestors’ lack of experience in the region and haveenabled them to adapt to the rapid changes in the sector atthe global level (see chapter IV). The telecoms sector inChile has thus seen the arrival of a significant number ofoperators in different segments of the industry, many ofthem from abroad (see table II.12). Although realcompetition is now steeper in the Chilean market, thebenefits to users continue to be the subject of somedebate.
Major strides have been made in the coverage ofbasic telephone services: the number of telephonelines per 100 inhabitants increased from 5.3 in 1989 to21.1 in 2000 (SUBTEL, 2000). At the end of 2000, 3.3million people had access to basic service lines (ElMercurio, 2 February 2001). A single firm (TelefónicaCTC Chile), however, still holds a market share ofaround 85%, which affords it great power, even innegotiations with government authorities. In August1999, Decree 187 was passed to regulate rates for afive-year period in activities defined asnon-competitive within the basic telephone servicessegment. Telefónica CTC Chile took legal action,claiming that the cuts were inconsistent with thetechnical and economic bases that had been agreedupon. According to the firm, real competition exists inthe Chilean market today for basic, mobile or any othertype of telephone service.42 The firm estimated that thenew legislation would cause a reduction of 24.7% in itsincome per line (Telefónica CTC Chile, 2000). This, incombination with the losses the company recorded in1999 and 2000, led Telefónica CTC Chile to announce
Foreign investment in Latin America and the Caribbean, 2000 121
38 Some alterations were made in 1987 to improve rate-setting —with provisions to regulate services operating in non-competitive environments—
and in 1994 to introduce competition into long-distance services through the multicarrier system. The Telecommunications Development Fund
was also created in 1994 to provide telecommunications services to marginalized and isolated sectors of the population.
39 In 1990 the name of the firm was changed to Compañía de Telecomunicaciones de Chile and, in 1999, to Telefónica CTC Chile as part of theSpanish parent company’s strategy of developing a global brand image, part of which was the generic term Telefónica (ECLAC, 2000a).
40 Chilquinta is a Chilean group which provides basic services and has concerns in the telecommunications, water and sanitation, property and
technological development sectors.
41 In December 2000, Telecom Italia conducted one of the year’s largest operations when it increased its stake in Entel by acquiring a 25.6% interest
owned by Chilquinta (US$ 820 million) and other smaller shares belonging to the Matte group (3.5% for US$ 85 million) and Consorcio
Nacional de Seguros (1.7% for US$ 27 million).
42 Some analysts reject this argument, maintaining that mobile telephony is not a substitute for basic services, but is instead complementary since,
in the first semester of 2000, 89.7% of traffic originated in the basic services networks and just 10.3% in mobile networks.

a freeze on investments in basic telephone servicesuntil a new rate decree was issued and a reductionmade in its overall investment plan from US$ 380million to US$ 80 million.43
The main long distance operator is Entel, whichinherited its leading position from the monopoly itenjoyed until 1994, when the multicarrier system cameon stream. Long distance traffic grew at an average rateof over 20% during the 1990s.44 Entel and its maincompetitor, Telefónica CTC Chile, increased theirmarket shares in national long distance at the expense ofsmaller operators. In international long-distanceservices, however, Entel saw its market share decrease,
as smaller operators won larger shares. This has beenreflected in a widening range of products and services onthe market, such as an automatic reverse charge systemand prepaid cards, and participation in projects aimed atimproving international connections (Entel, 2000 andTelefónica CTC Chile, 2000).
The number of subscribers to mobile telephoneservices recorded exponential growth, increasing from4,886 users in 1989 to 3.2 million in 2000 (SUBTEL,2000). In the late 1980s services in the 800 MHz band(cellular mobile telephony) were tendered out toTelefónica CTC Comunicaciones Móviles (formerlyStartel) and Bellsouth Chile, on the basis that
122 ECLAC
Table II.12CHILE: MAIN TELECOMMUNICATIONS FIRMS, BY SEGMENT
Basic local Long-distance MobilMain shareholder telephone telephone telephone
service service service
Telefónica CTC Chile S.A. Telefónica de España, Xa
Telefónica 188 Telefónica CTCSpain (43,6%) Mundo Comunicaciones
Móviles S.A
Compañía de Teléfonos de Grupo Luksic, Chile Xa
Coyhaique (TELCOY)
Complejo Manufacturero de Xa
Equipos Telefónicos (CMET)
Empresa Nacional de Telecom Italia, Italy (54%) ENTEL Xa
ENTEL PCSTelecomunicaciones (ENTEL) Grupo Luksic, Chile (14%) Phone
Telefónica del Sur (TELSUR) Grupo Luksic, Chile (74%) Xa
Telefónica delSur Carrier
Telefónica Manquehue National Grid, United Kingdom Xa
Manquehue(30%), Williams Co., Larga DistanciaEstados Unidos (14%),Grupo Rabat, Chile (21%)
BellSouth Chile BellSouth Corporation, Xa
BellSouthUnited States (100%) Celular
SmartCom (formerly Chilesat PCS) Endesa España, Spain Xa
(100%)
Source: ECLAC, Information Centre of the Unit of Investment and Corporate Strategies, Division of Production, Productivity and Management, on the basisof information from the Department of Telecommunications (SUBTEL).
aOperates in the segment under the same name as the parent company in Chile.
43 In January 2001 Telefónica CTC Chile made a presentation to the Antimonopoly Resolutory Commission requesting the liberalization of publicrates, i.e., metered local service, fixed charge and the rate and time-band structure. The firm argued that it was facing slow but inevitabledeterioration, because the rate rigidities had obliged it to reduce investment. Moreover, insofar as all Chilean operators depend to a greater orlesser extent on the Telefónica CTC Chile network, lower investment by the firm would adversely affect the performance of the entire industry(El Mercurio, 31 January 2001).
44 Between 1990 and 1999 switched national long-distance public traffic grew from 570.9 million minutes to 2,762.8 million minutes. Over thesame period switched international long-distance public traffic grew from 36 million minutes to 249.5 million minutes (SUBTEL, 2000).

profitability could only be maintained in a duopoly dueto technological limitations.45 Later, in 1997, three PCSdigital telephone licences with national coverage weretendered (1900 MHz band). Two of these were awardedto Entel and one to Chilesat PCS (now Smartcom),46
which had the effect of halving rates. In 1999 subscriberswere no longer required to pay for incoming calls, undera new system whereby the caller paid the full cost, andinvoices fell by 30%. The main operator at the nationallevel in 1999 was Telefónica CTC ComunicacionesMóviles, with 51.8% of the market, followed by EntelPCS (30%), BellSouth (16%) and Smartcom (2.7%)(Kalau Vom Hofe, 2000). Steeper competition hasresulted in better quality and a wider range of productsand services offered by operators. Chile has become oneof the Latin American countries in which this service hasgrown the most, with 18.8 subscribers per 100inhabitants in mid-2000. According to the Department ofTelecommunications, the number of cellular deviceswill equal the number of basic telephone service lines in2002 (Estrategia, 20 October 2000). In fact, thedifference was already almost negligible by late 2000,with the number of mobile telephony clients almostdrawing level with the basic lines in service (see figureII.6).
As one example of the entry of new operators to theChilean market, Endesa España acquired Smartcom inmid-2000 for some US$ 300 million (see table II.9). Thestrategy of this operator is to offer new services that willhave the effect of segmenting the market. To this effect,Endesa España has announced investments of overUS$ 100 million for the first months of operation (ElMercurio, 29 June 2000). This acquisition is part ofEndesa España’s strategy of moving into the telecomsbusiness by availing itself of its existing electricitydistribution networks and using Smartcom as a platformfrom which to compete in future cellular telephoneconcessions in Brazil and Argentina.
Another case which is interesting for similar reasonsis the British firm National Grid’s acquisition of a stakein Telefónica Manquehue in May 2000 (see table II.9).The purpose of this operation is to make the Chilean firmone of the leaders in broadband services (seewww.manquehue.cl). Annual investments of someUS$ 60 million are planned for the next five years to
bring the number of lines up to 350,000, and US$ 241million is to be invested in building a 4,300 km networkto join the main Argentine cities to Santiago(Convergencia Latina, 26 October 2000).
As in the main operators’ countries of origin,business strategies in Chile are being refocused. Overall,the specifications of each operator aside, there is a cleartrend toward the decentralization of activities controlledfrom different production units. In many cases thisentails separate ventures which give rise to corporatefirms, with parent companies and a series of subsidiarieslending different types of services. The subsidiary firmsbegin to adopt the same structure as the parentcompanies, establishing subsidiaries by market segment,which then start to interrelate vertically. Telecom ItaliaMobile (TIM), which is a subsidiary of Telecom Italia,owns a stake in Entel PCS, and Telefónica Móvil S.A., amobile telephone service subsidiary of Telefónica deEspaña, controls Telefónica CTC ComunicacionesMóviles.
In terms of technological development, the recentimplementation of Wireless Application Protocol(WAP) has made it possible to navigate on the Internetfrom a mobile telephone. The service is supplied byEntel PCS, Smartcom and Bellsouth, but has not beenvery successful and is likely to be rapidly superseded bythird generation (3G) telephony, the first licences forwhich have just been awarded in some Europeancountries (see chapter IV). The first half of 2001 will alsosee operating licences awarded for the wireless basictelephone service known as Wireless Local Loop(WLL), which permits copper and coaxial wires to bereplaced by fixed antennae. Several firms have alreadyexpressed an interest in participating, includingTelefónica CTC Chile, Entel and BellSouth. The mainadvantage of this system is that it enables services to besupplied in areas which are currently inaccessible. Themarket is also likely to be opened to third generationtelephone services in the future.
Internet services have also experienced stronggrowth recently. During 2000 the number of usersincreased from 650,000 to 1.8 million. The spread of theInternet has been accelerated by lower rates (TelefónicaCTC Chile rate decree), new plans, free access, theemergence of Chilean sites, the arrival of asymmetric
Foreign investment in Latin America and the Caribbean, 2000 123
45 Two concession zones for cellular telephony were established in the 800 MHz band. The first consisted of the Metropolitan area and the Fifth
Region, and the second of the rest of the country. Two licences were tendered in each zone, operating in the A and B bands of the radio spectrum,
respectively.
46 This firm is controlled by Endesa España in line with the electricity company’s strategy of moving into the telecommunications business, given
the potential economic viability of using electricity distribution networks for telecommunications services, which has already been proven to be
technically possible.
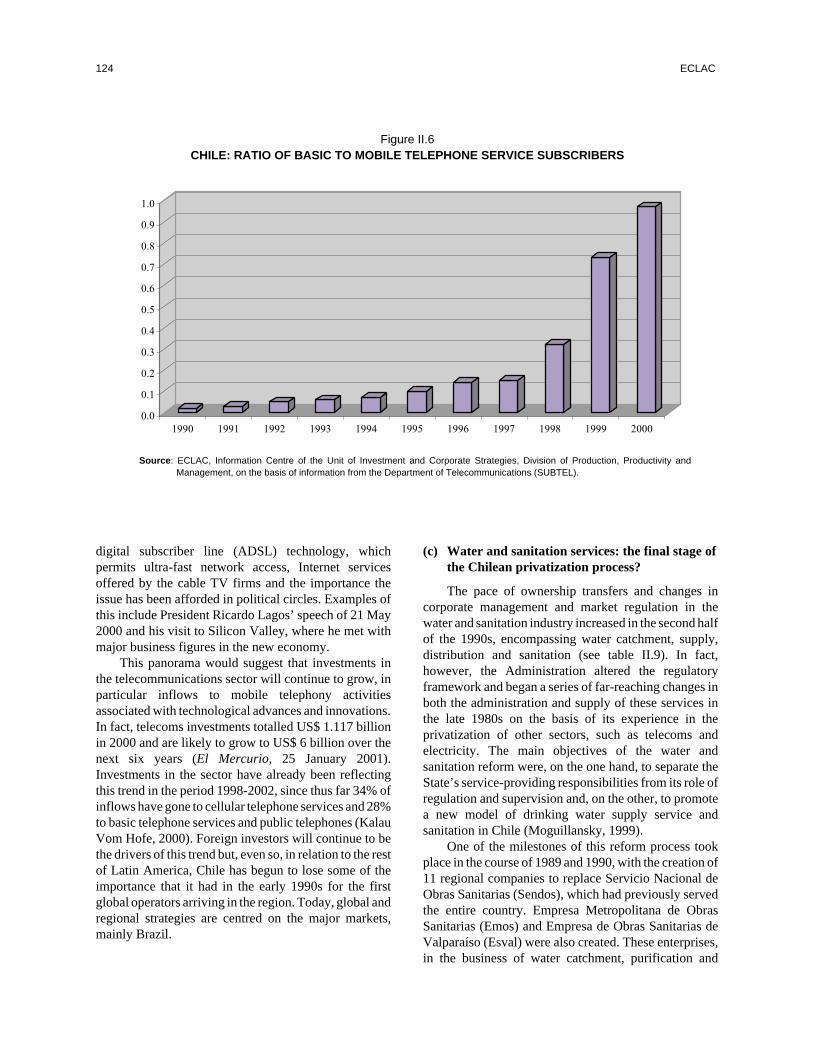
digital subscriber line (ADSL) technology, whichpermits ultra-fast network access, Internet servicesoffered by the cable TV firms and the importance theissue has been afforded in political circles. Examples ofthis include President Ricardo Lagos’ speech of 21 May2000 and his visit to Silicon Valley, where he met withmajor business figures in the new economy.
This panorama would suggest that investments inthe telecommunications sector will continue to grow, inparticular inflows to mobile telephony activitiesassociated with technological advances and innovations.In fact, telecoms investments totalled US$ 1.117 billionin 2000 and are likely to grow to US$ 6 billion over thenext six years (El Mercurio, 25 January 2001).Investments in the sector have already been reflectingthis trend in the period 1998-2002, since thus far 34% ofinflows have gone to cellular telephone services and 28%to basic telephone services and public telephones (KalauVom Hofe, 2000). Foreign investors will continue to bethe drivers of this trend but, even so, in relation to the restof Latin America, Chile has begun to lose some of theimportance that it had in the early 1990s for the firstglobal operators arriving in the region. Today, global andregional strategies are centred on the major markets,mainly Brazil.
(c) Water and sanitation services: the final stage ofthe Chilean privatization process?
The pace of ownership transfers and changes incorporate management and market regulation in thewater and sanitation industry increased in the second halfof the 1990s, encompassing water catchment, supply,distribution and sanitation (see table II.9). In fact,however, the Administration altered the regulatoryframework and began a series of far-reaching changes inboth the administration and supply of these services inthe late 1980s on the basis of its experience in theprivatization of other sectors, such as telecoms andelectricity. The main objectives of the water andsanitation reform were, on the one hand, to separate theState’s service-providing responsibilities from its role ofregulation and supervision and, on the other, to promotea new model of drinking water supply service andsanitation in Chile (Moguillansky, 1999).
One of the milestones of this reform process tookplace in the course of 1989 and 1990, with the creation of11 regional companies to replace Servicio Nacional deObras Sanitarias (Sendos), which had previously servedthe entire country. Empresa Metropolitana de ObrasSanitarias (Emos) and Empresa de Obras Sanitarias deValparaíso (Esval) were also created. These enterprises,in the business of water catchment, purification and
124 ECLAC
Figure II.6CHILE: RATIO OF BASIC TO MOBILE TELEPHONE SERVICE SUBSCRIBERS
0.0
0.1
0.2
0.3
0.4
0.5
0.6
0.7
0.8
0.9
1.0
1990 1991 1992 1993 1994 1995 1996 1997 1998 1999 2000
Source: ECLAC, Information Centre of the Unit of Investment and Corporate Strategies, Division of Production, Productivity andManagement, on the basis of information from the Department of Telecommunications (SUBTEL).
distribution, became more autonomous corporations,though ownership remained largely in the public sectorthrough Corfo. These 13 public-sector companies are thelargest in the country and supply drinking water andsewerage services to almost 90% of Chile’s population.
In 1989 the industry’s regulatory framework, theGeneral Sanitation Services Act (DFL 382), was alsoestablished and the regulatory body, the SanitationServices Superintendency, was created, reporting to theMinistry of Public Works (MOP). The regulatoryframework specifies the conditions under whichpublic-sector concessions may be applied for, awardedand operated. One of the basic provisions of thislegislation obliges the concession-holder to administerthe service in line with a 15- to 20-year development planthat includes annual investment targets set by theSanitation Services Superintendency. In 1994 a reformwas proposed to the institutional framework tostrengthen regulatory activity, make rate calculationmore transparent and increase the permitted stake ofprivate firms in waterworks to 65%. This initiativefinally went through in 1997.
Chile’s indicators show good coverage of drinkingwater and sewerage services today. Drinking watersupply reaches 90% of the population, and 80% have asewerage system. Of the urban population, 99% haveaccess to drinking water and 91% to sewerage services,and investment plans should ensure that the remainingshortfall is fully redressed by 2003. Even so, Chile’smajor outstanding task is in sewage treatment. Todayjust 22% of the population with access to a drinkingwater supply are also covered by a service to treat sewagebefore it is discharged into rivers, lakes, lagoons or thesea. This situation reflects a large investment lag, whichhas been one of the main reasons behind the increasedincentives for the domestic and foreign private sector toacquire stakes in public-sector firms in recent years. Infact, tenders stipulate a minimum level of futureinvestment on the part of firms, which gives theSanitation Services Superintendency a clear picture ofexpected coverage targets.47
A new alteration to the regulatory framework in1998 allowed the private sector to hold managementcontrol, in addition to stakes, in State-owned water andsanitation enterprises. The State may now awardconcessions in the areas of production or distribution ofdrinking water and sewage collection and disposal. In
addition, the public sector can reduce its ownership stakein these firms to a minimum of 35%.
During this period, the private sector has beenawarded concessions in several firms, involving sums ofover US$ 1.6 billion. The first company to bring inprivate capital was Empresa Sanitaria de Valparaíso(Esval). In December 1998 a consortium formed by thelocal Enersis group and the British firm Anglian WaterPlc (Aguas Puerto) acquired 40% of Esval. Ashareholders’ agreement gave control of Esval to thisconsortium. In July 2000 Anglian Water bought theEnersis stake in Aguas Puerto for US$ 137 million,which gave it control of Esval. In September 1999Empresa Metropolitana de Agua Potable (Emos) wasinvolved in two concessions. First, 43% of the firm wastransferred to a consortium formed by Aguas deBarcelona of Spain and Suez Lyonnaise des Eaux ofFrance, with a total investment of US$ 960 million(ECLAC, 2000a). Second, a concession for sewagetreatment in the southern part of Santiago was awarded tothe French firm Compagnie Générale des Eaux, whichinvolved a contract for US$ 42 million. Emos is thus toinvest some US$ 1.6 billion in the next 10 years, of which60% (US$ 960 million) will go to sewage treatment.
In 1999 another two major public-sector companiesin the sanitation sector were partly transferred to privateinvestors. In July, the Spanish firm Iberdrola acquired51% of the ownership of Empresa de ServiciosSanitarios de Los Lagos (Essal) for US$ 94 million. InNovember, a consortium consisting of the British firmThames Water Plc and Eletricidade de Portugal acquired51% of Empresa de Servicios Sanitarios del Libertador(Essel) for US$ 136 million (see table II.9).48
In 2000 the British firm Thames Water concludedthe purchase of a 42% share in Empresa de ServiciosSanitarios del Bío-Bío (Essbio) for US$ 282 million.This firm will hold significant stakes in sanitation firmsin both the Sixth and Eighth Regions (Essel and Essbio).Emos, which is controlled by a Franco-Spanishconsortium, enhanced its position on the Chilean marketwith the acquisition of Aguas Cordillera for US$ 193million and a 50% share in Aguas Manquehue (see tableII.9). In the wake of these acquisitions, Emos is studyingthe possibility of merging its operations, provided thatthe Antimonopoly Commission authorizes the purchaseof Aguas Cordillera. Lastly, the Government announcedthe privatization of Empresa de Servicios Sanitarios del
Foreign investment in Latin America and the Caribbean, 2000 125
47 Sanitation Services Superintendency projections show 27% coverage in sewage treatment services by December 2000, and a target of 69% in2005 and 99% in 2010.
48 The process includes the commitment to underwrite a capital increase for a 13% stake. The consortium will thus control 45% of the sanitationfirm, requiring an investment of US$ 112.5 million.
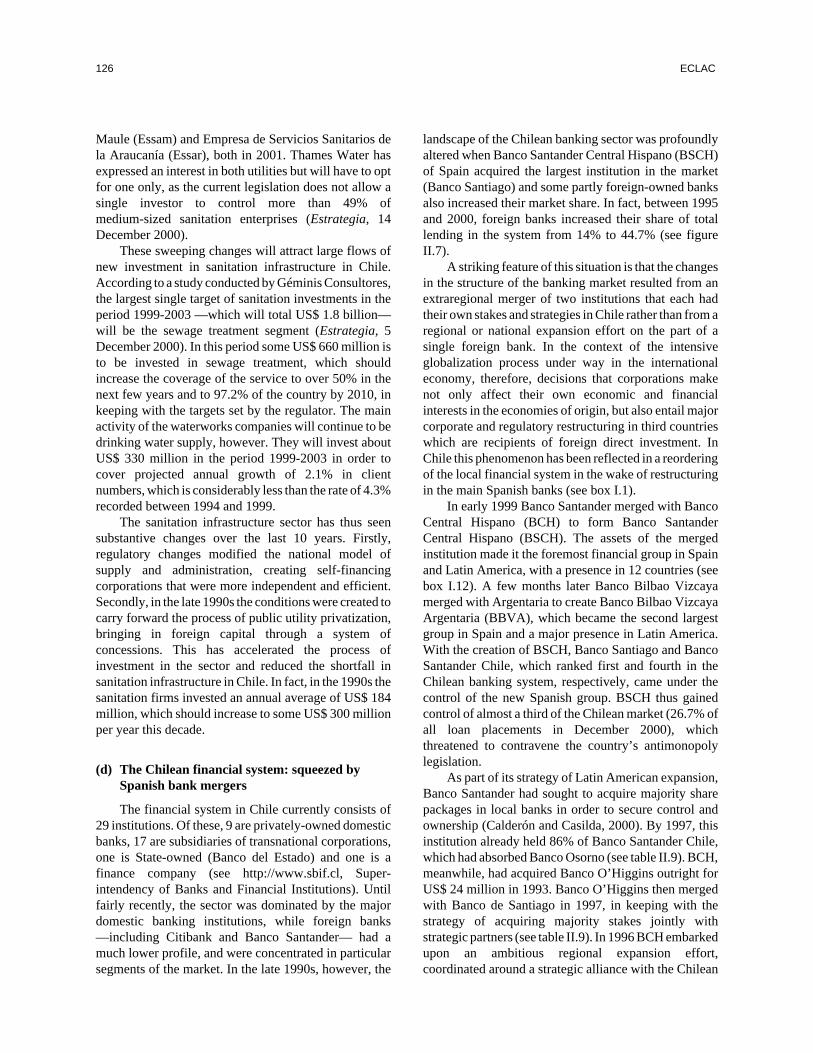
Maule (Essam) and Empresa de Servicios Sanitarios dela Araucanía (Essar), both in 2001. Thames Water hasexpressed an interest in both utilities but will have to optfor one only, as the current legislation does not allow asingle investor to control more than 49% ofmedium-sized sanitation enterprises (Estrategia, 14December 2000).
These sweeping changes will attract large flows ofnew investment in sanitation infrastructure in Chile.According to a study conducted by Géminis Consultores,the largest single target of sanitation investments in theperiod 1999-2003 —which will total US$ 1.8 billion—will be the sewage treatment segment (Estrategia, 5December 2000). In this period some US$ 660 million isto be invested in sewage treatment, which shouldincrease the coverage of the service to over 50% in thenext few years and to 97.2% of the country by 2010, inkeeping with the targets set by the regulator. The mainactivity of the waterworks companies will continue to bedrinking water supply, however. They will invest aboutUS$ 330 million in the period 1999-2003 in order tocover projected annual growth of 2.1% in clientnumbers, which is considerably less than the rate of 4.3%recorded between 1994 and 1999.
The sanitation infrastructure sector has thus seensubstantive changes over the last 10 years. Firstly,regulatory changes modified the national model ofsupply and administration, creating self-financingcorporations that were more independent and efficient.Secondly, in the late 1990s the conditions were created tocarry forward the process of public utility privatization,bringing in foreign capital through a system ofconcessions. This has accelerated the process ofinvestment in the sector and reduced the shortfall insanitation infrastructure in Chile. In fact, in the 1990s thesanitation firms invested an annual average of US$ 184million, which should increase to some US$ 300 millionper year this decade.
(d) The Chilean financial system: squeezed bySpanish bank mergers
The financial system in Chile currently consists of29 institutions. Of these, 9 are privately-owned domesticbanks, 17 are subsidiaries of transnational corporations,one is State-owned (Banco del Estado) and one is afinance company (see http://www.sbif.cl, Super-intendency of Banks and Financial Institutions). Untilfairly recently, the sector was dominated by the majordomestic banking institutions, while foreign banks—including Citibank and Banco Santander— had amuch lower profile, and were concentrated in particularsegments of the market. In the late 1990s, however, the
landscape of the Chilean banking sector was profoundlyaltered when Banco Santander Central Hispano (BSCH)of Spain acquired the largest institution in the market(Banco Santiago) and some partly foreign-owned banksalso increased their market share. In fact, between 1995and 2000, foreign banks increased their share of totallending in the system from 14% to 44.7% (see figureII.7).
A striking feature of this situation is that the changesin the structure of the banking market resulted from anextraregional merger of two institutions that each hadtheir own stakes and strategies in Chile rather than from aregional or national expansion effort on the part of asingle foreign bank. In the context of the intensiveglobalization process under way in the internationaleconomy, therefore, decisions that corporations makenot only affect their own economic and financialinterests in the economies of origin, but also entail majorcorporate and regulatory restructuring in third countrieswhich are recipients of foreign direct investment. InChile this phenomenon has been reflected in a reorderingof the local financial system in the wake of restructuringin the main Spanish banks (see box I.1).
In early 1999 Banco Santander merged with BancoCentral Hispano (BCH) to form Banco SantanderCentral Hispano (BSCH). The assets of the mergedinstitution made it the foremost financial group in Spainand Latin America, with a presence in 12 countries (seebox I.12). A few months later Banco Bilbao Vizcayamerged with Argentaria to create Banco Bilbao VizcayaArgentaria (BBVA), which became the second largestgroup in Spain and a major presence in Latin America.With the creation of BSCH, Banco Santiago and BancoSantander Chile, which ranked first and fourth in theChilean banking system, respectively, came under thecontrol of the new Spanish group. BSCH thus gainedcontrol of almost a third of the Chilean market (26.7% ofall loan placements in December 2000), whichthreatened to contravene the country’s antimonopolylegislation.
As part of its strategy of Latin American expansion,Banco Santander had sought to acquire majority sharepackages in local banks in order to secure control andownership (Calderón and Casilda, 2000). By 1997, thisinstitution already held 86% of Banco Santander Chile,which had absorbed Banco Osorno (see table II.9). BCH,meanwhile, had acquired Banco O’Higgins outright forUS$ 24 million in 1993. Banco O’Higgins then mergedwith Banco de Santiago in 1997, in keeping with thestrategy of acquiring majority stakes jointly withstrategic partners (see table II.9). In 1996 BCH embarkedupon an ambitious regional expansion effort,coordinated around a strategic alliance with the Chilean
126 ECLAC
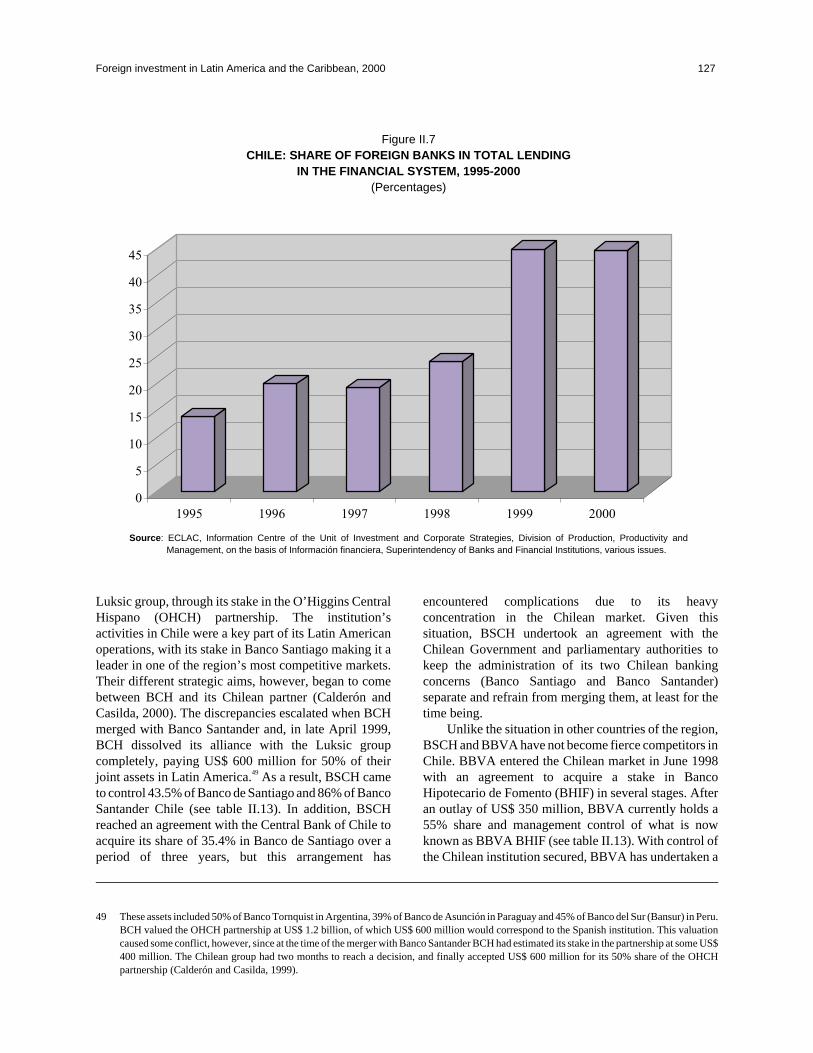
Luksic group, through its stake in the O’Higgins CentralHispano (OHCH) partnership. The institution’sactivities in Chile were a key part of its Latin Americanoperations, with its stake in Banco Santiago making it aleader in one of the region’s most competitive markets.Their different strategic aims, however, began to comebetween BCH and its Chilean partner (Calderón andCasilda, 2000). The discrepancies escalated when BCHmerged with Banco Santander and, in late April 1999,BCH dissolved its alliance with the Luksic groupcompletely, paying US$ 600 million for 50% of theirjoint assets in Latin America.49 As a result, BSCH cameto control 43.5% of Banco de Santiago and 86% of BancoSantander Chile (see table II.13). In addition, BSCHreached an agreement with the Central Bank of Chile toacquire its share of 35.4% in Banco de Santiago over aperiod of three years, but this arrangement has
encountered complications due to its heavyconcentration in the Chilean market. Given thissituation, BSCH undertook an agreement with theChilean Government and parliamentary authorities tokeep the administration of its two Chilean bankingconcerns (Banco Santiago and Banco Santander)separate and refrain from merging them, at least for thetime being.
Unlike the situation in other countries of the region,BSCH and BBVA have not become fierce competitors inChile. BBVA entered the Chilean market in June 1998with an agreement to acquire a stake in BancoHipotecario de Fomento (BHIF) in several stages. Afteran outlay of US$ 350 million, BBVA currently holds a55% share and management control of what is nowknown as BBVA BHIF (see table II.13). With control ofthe Chilean institution secured, BBVA has undertaken a
Foreign investment in Latin America and the Caribbean, 2000 127
Figure II.7CHILE: SHARE OF FOREIGN BANKS IN TOTAL LENDING
IN THE FINANCIAL SYSTEM, 1995-2000(Percentages)
0
5
10
15
20
25
30
35
40
45
1995 1996 1997 1998 1999 2000
Source: ECLAC, Information Centre of the Unit of Investment and Corporate Strategies, Division of Production, Productivity andManagement, on the basis of Información financiera, Superintendency of Banks and Financial Institutions, various issues.
49 These assets included 50% of Banco Tornquist in Argentina, 39% of Banco de Asunción in Paraguay and 45% of Banco del Sur (Bansur) in Peru.BCH valued the OHCH partnership at US$ 1.2 billion, of which US$ 600 million would correspond to the Spanish institution. This valuationcaused some conflict, however, since at the time of the merger with Banco Santander BCH had estimated its stake in the partnership at some US$400 million. The Chilean group had two months to reach a decision, and finally accepted US$ 600 million for its 50% share of the OHCHpartnership (Calderón and Casilda, 1999).
more active strategy of market positioning and hasintroduced many of the products that have given itexcellent returns in Spain and the rest of Latin America.Between 1997 and 2000, BBVA BHIF thus climbedfrom eighth to sixth place among the privately-ownedbanks in Chile and increased its market share from 5% to6.6%. The institution also acquired Chile’s largestpension fund administrator (AFP Provida) for US$ 250million, to become the foremost operator in this activityin the region, with a weighted market share of 26% interms of managed assets (Calderón and Casilda, 1999).
Not only Spanish groups have increased their stakesin the Chilean financial market, however. United Statesinstitutions such as Citicorp, BankBoston and, to a lesserextent, Chase Manhattan Bank have also expandedsteadily. The Canadian institution Bank of Novia Scotia(Scotiabank) has also pursued an interesting positioningstrategy. In the early 1990s this Canadian bank acquiredjust over a quarter share of Banco Sudamericano for alittle over US$ 20 million, as a strategic partner in thetraditional Chilean institution. In late 1999 Scotiabank
acquired a further 33% of the Banco Sudamericano stockfor US$ 116 million, which gave it a share of 61% andmanagement control of the Chilean bank. Finally, in2000 new acquisitions increased the Canadian bank’sstake to 99.2%. The new management has modernizedthe image of the bank, which offers integrated financialservices to a wider range of clients. These changes arelikely to increase the bank’s market share, similarly tothe experience of its United States rivals.
The process of concentration continues in thebanking sector, with the Luksic group gaining control ofBanco de Chile. In response to this trend, and in view ofthe ascribed intention on the part of the BSCH to mergeBanco Santander Chile with Banco Santiago, the Chileanauthorities attempted to establish upper limits on marketshares. Although the new public share offer legislationwas enacted without a clause which would have limitedbanking concentration to 20%, the authorities arecurrently studying alternatives that would at least givethem the right to veto operations that would increaseconcentration in the industry. Foreign banks are likely to
128 ECLAC
Table II.13CHILE: MAIN FULLY OR PARTLY FOREIGN-OWNED BANKS,
BY VALUE OF ASSETS, 1999-2000(Millions of dollars)
Place inlocal % of loans
ranking byBank
Assets Foreign Foreign Country of marketloans 1999 investor capital origin December
December (%) 2000a
2000a
1 1 Banco Santiago 13 933 Banco Santander 49.5 Spain / 15.44Central Hispano, United KingdomBSCH (43.5%) /Hong Kong andShanghai BankingCorporation, HSBC(5.9%)
2 4 Banco Santander 12 485 Banco Santander 86.0 Spain 11.28Chile Central Hispano,
BSCH
3 14 BankBoston Chile 6 261 BankBoston 100.0 United States 1.60
4 9 Citibank Chile 5 630 Citicorp 100.0 United States 3.77
5 20 The Chase Manhattan 5 566 Chase Manhattan 100.0 United States 0.44Bank Chile Corp.
6 7 BBVA Banco Bhif 4 521 Banco Bilbao 55.5 Spain 5.72Vizcaya Argentaria(BBVA)
7 11 Banco Sud Americano 4 398 Bank of Nova 99.2 Canada 3.47Scotia (Scotiabank)
8 15 ABN Amro Bank Chile 3 487 ABN Amro Holding 100.0 Netherlands 0.98
56 281 42.70
Source: ECLAC, Information Centre of the Unit of Investment and Corporate Strategies, Division of Production, Productivity and Management, on the basisof information from the Superintendency of Banks and Financial Institutions, América economía, Gazeta mercantil latinoamericana, Diarioestrategia and El diario.
aIncludes Banco del Estado and Financiera Conosur.
continue purchasing domestic financial institutions in2001, however. International corporations which haveexpressed an interest in this context include Citibank,
ABN Amro Bank and Deutsche Bank (El Mercurio, 29December 2000, p. B6).
C. CONCLUSIONS
FDI in Chile has taken different forms in keeping withthe changes that have occurred in the country. During theliberal regime that existed before the crisis of the 1930s,FDI went almost exclusively to mining activities.Beginning in the 1950s, in addition to these traditionalinvestments, increasing sums of FDI flowed intomanufacturing in the context of the import-substitutionindustrialization process (ISI). Later, the nationalizationof large-scale mining and the agrarian reform of the1960s and 1970s created an unfavourable environmentfor FDI. The political and social process underlying thistransformation ended violently with the military coup of1973, which opened the way to a new period of economicliberalism characterized by far-reaching market reformsand economic policies that were very favourable toforeign investment. Lastly, the return to democracy inthe 1990s left the broad principles of the existingeconomic policy unaltered and —in combination with agood macroeconomic performance— reinforced theperception of stability from the point of view of foreigninvestors.
In this context, FDI flows have been extremelydynamic, growing from an annual average of US$ 720million in the period 1985-1989 to almost US$ 5.5billion between 1996 and 2000. In addition, the 1990ssaw major changes in the modalities employed byforeign investors, the sectoral distribution ofinvestments and the origin of capital flows.• In the second half of the 1980s investors tended to use
debt conversion mechanisms (Chapter XIX), whichafforded heavy implicit subsidies. In the 1990s foreignfirms returned to more traditional modalities ofinvestment (DL 600). While in the first half of thedecade investments went mainly to new projects, FDIin the second half of the 1990s was directed largely atthe acquisition of existing assets.
• There were two clearly distinguishable investmentcycles in the 1990s. Between 1990 and 1995, FDIinflows continued to follow the patterns of the 1980sand went largely to natural resource extraction andprocessing activities, in which the country offeredenormous comparative advantages. Mining accounted
for 58% of total flows, services just 24% andmanufactures, many associated with resourceprocessing, 15% of the total. In the second half of thedecade, FDI streamed into acquisitions of local firmsin the services sector. In this period the share of miningin total flows fell to 24% and manufacturing activitiesaccounted for 10%.
• Between 1990 and 1995, two thirds of resources camefrom North America (United States and Canada) andjust 15% from the European Union. In the period1995-2000, however, flows from North Americarepresented only 37% of the total, while investmentfrom the European Union accounted for 45%. WithinEurope the largest investor was Spain, whichcontributed 30% of the flows received during the periodthrough major acquisitions of Chilean services firms.
In the mining sector, the large investments of thefirst half of the 1990s were attributable to the country’sexcellent natural advantages, a favourable regulatoryframework, technological advances in the industry andpromising market conditions during the period. Thesefactors dovetailed with the expansion strategies of majortransnational corporations, such as Phelps DodgeCorporation of the United States, Placer Dome,Falconbridge and Rio Alcom of Canada, Rio Tinto Zincand Anglo American of the United Kingdom and BrokenHill Proprietary of Australia, which invested heavily inChilean mining, particularly copper. These investmentshelped to expand Chilean copper production at an annualaverage rate of 12.3% during the 1990s, which increasedthe country’s share of the world copper market from 18%in 1990 to 30% in 1999.
Foreign investment has also been instrumental in thedevelopment and good export performance of otherresource-based activities. In the second half of the 1980sforeign investors were heavily involved in the forestrysector and the industry associated with its derivatives,particularly pulp. United States and New Zealand firmsused the debt conversion mechanism to formpartnerships with local groups to exploit forestryresources, and the sector and its exports expandedrapidly in the first half of the 1990s. In the second part of
Foreign investment in Latin America and the Caribbean, 2000 129

the decade, however, these partnerships came to an endand foreign investors withdrew almost entirely from theforestry sector. A similar situation arose in the fisheriessector, especially in low value-added activities such asfishmeal. Recently, foreign investors —from Norway,Netherlands and Canada— have streamed into the moredynamic segments, such as the salmon industry. In the1990s salmon exports increased sharply, from 1.8% oftotal Chilean exports in 1991 to 5.3% in 2000. In theagricultural sector, foreign investment targeted thesegment of fresh fruit for export and wine production.Major transnational firms played a key role in thestrong export development of the fresh fruit sector bycoordinating small and medium-sized domesticproducers, centralizing the processes of selection,packing, refrigeration and transport, and marketingfruit abroad. As a result, in the 1999-2000 season, thefour largest transnational corporations accounted foralmost 30% of fresh fruit exports, which representover 8% of total Chilean exports. FDI in the wineindustry has been mainly in the form of partnershipswith local vineyards to produce high quality wines.Foreign firms have thus withdrawn from activitiesthat are more sensitive to international commodityprices (pulp and fishmeal) and have sought to takeadvantage of opportunities in new segments withgreater value added and in which certificates oforigin represent a good in themselves, such as salmonand fine wines.
In the second half of the 1990s FDI inflows wereconcentrated in services activities. Unlike othercountries in the region, in Chile the main State-ownedservices firms were privatized early on —in the 1980sand early 1990s— and were subsequently managedmainly by private local investors. The recent wave offoreign investment in the sector has thus been directedlargely at acquisitions of private local groups. The mosttypical case is the electricity sector. Following theprivatization of the great majority of them in the late1980s, the main Chilean electricity firms embarked on astrong expansion drive in Chile and the region under themanagement of private Chilean capital, thus giving riseto conglomerates with a major subregional presence.These were precisely the features that attracted two of themain players of the electricity sector to the region:Endesa España of Spain and AES Corporation of theUnited States. In just two years, the regional expansionstrategies of the main transnational corporations thusradically transformed the ownership structure of theChilean electricity sector.
In the 1980s —which was early compared to the restof Latin America— the reform of the
telecommunications sector began with the privatizationof Empresa Nacional de Telecomunicaciones (Entel)and Compañía de Teléfonos de Chile (CTC). Entel wasprivatized between 1986 and 1992, an operation whichinvolved mainly local investors, and is now controlled byTelecom Italia. In 1988 CTC was transferred to theAustralian Bond group. Bond later sold its stake in CTCto Telefónica de España, which still controls it. Likeother major transnationals in the sector, in the 1990sTelefónica de España used Chile to evaluate itspossibilities of expansion in the rest of the region, as partof a trend which brought large investments into differentsegments of the telecommunications sector throughoutthe decade.
In the late 1990s banking and financial servicesreceived enormous FDI flows which substantiallyaltered the ownership structure of both activities. Thebanking sector was particularly marked by the effects ofan extraregional merger, which left a large portion ofthe market in the hands of a single operator. In early1999 Banco Santander and Banco Central Hispanomerged to create BSCH. Both institutions hadundertaken ambitious expansion efforts in LatinAmerica —using very different strategies— which hadplaced them at the respective helms of two of theleading banks in the Chilean market. With the merger,Banco Santander Chile and Banco Santiago thereforeboth came under the management of BSCH, whichgenerated tensions with the antimonopoly authorities.Meanwhile, the privatization of the main water andsanitation companies attracted new agents to theChilean market which, as in other services activities,sought to consolidate their regional presence throughthese acquisitions.
Investment in Chile in the last two decades has thusbeen highly concentrated in two areas. In the 1980s andthe first half of the 1990s FDI went mostly to developingexport activities related to resource extraction andprocessing, with investors in this area gradually shiftingtowards segments offering greater value added. In thesecond half of the 1990s, however, investments weredirectly mainly at acquiring firms in the main areas ofservices. Signs of depletion in some of the main activitiesassociated with resource processing and the fact that thecountry’s services sectors are already stronglytransnationalized, however, have raised somewell-founded concerns about the future trend of foreigninvestment and its potential impact on the country’sdevelopment. In response to these concerns the Chileanauthorities have undertaken some —still veryincipient— efforts to attract new investments in moretechnologically sophisticated sectors.
130 ECLAC
■
III. JAPAN: INVESTMENT AND CORPORATESTRATEGIES IN LATIN AMERICA ANDTHE CARIBBEAN
■
This year's version of chapter III, dealing with the experience of an investor country,
differs from those of previous years, which considered the United States and Spain,
because Japan is not one of the leading investors in Latin America and the Caribbean. In
fact the central question this year is why Japanese companies have invested so little in the
region. Official statistics provide only a partial answer to this because they suffer from
major deficiencies (see box III.1 below). The available data show that Japanese TNCs
made huge investments worldwide in the mid- to late 1980s; FDI outflows then declined
sharply in the early 1990s before picking up again from 1994 onward, but at levels well
below those of the late 1980s (see figure III.1). Japanese firms extended their international
production systems between 1985 and 1998, and the share of total sales achieved by their
foreign affiliates grew from under 5% to 14% during that period. Nonetheless, this was
still about half the level prevailing among United States and German transnationals
(UNCTAD, 2000, p. 40).
There is little doubt that the initial surge in JapaneseFDI worldwide was closely associated with thestrengthening of the yen against the United States dollar,following the Plaza Accord in 1985; but the exchange
rate does not explain the second wave in the mid- to late1990s. Moreover, the appreciation of the yen wasapparently not that important for Japanese FDI in LatinAmerica and the Caribbean (Goldberg and Klein, 1997),
Foreign investment in Latin America and the Caribbean, 2000 131
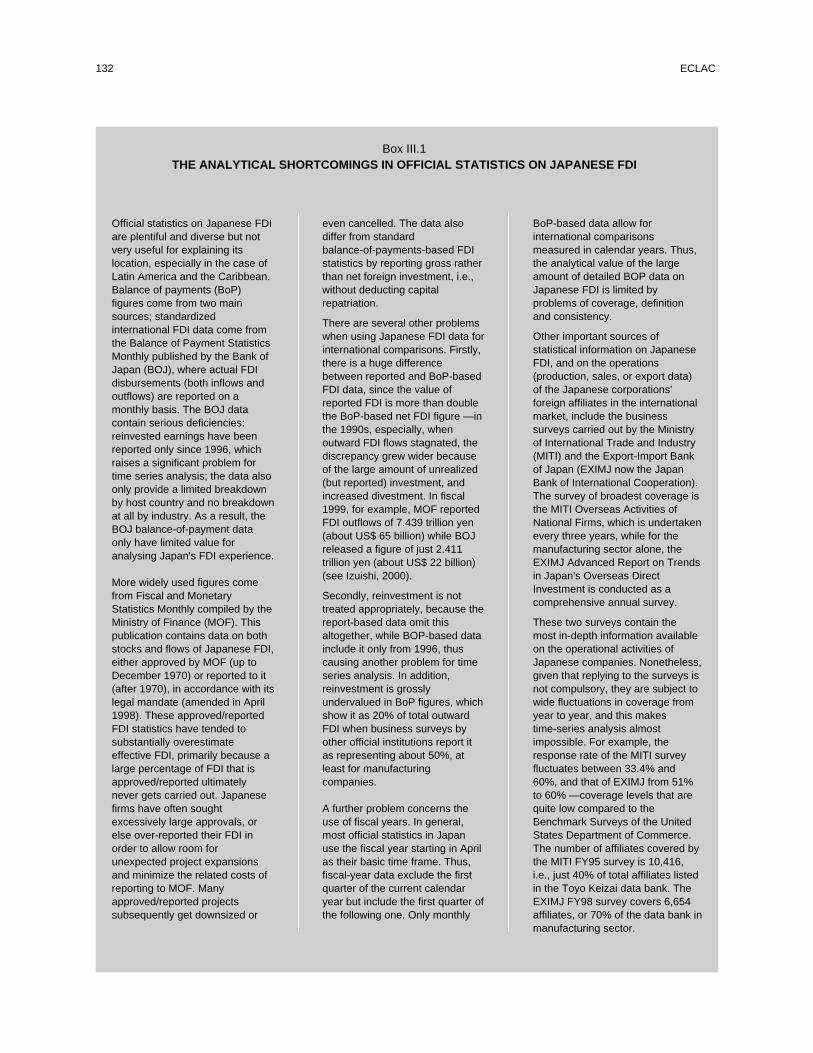
132 ECLAC
Official statistics on Japanese FDIare plentiful and diverse but notvery useful for explaining itslocation, especially in the case ofLatin America and the Caribbean.Balance of payments (BoP)figures come from two mainsources; standardizedinternational FDI data come fromthe Balance of Payment StatisticsMonthly published by the Bank ofJapan (BOJ), where actual FDIdisbursements (both inflows andoutflows) are reported on amonthly basis. The BOJ datacontain serious deficiencies:reinvested earnings have beenreported only since 1996, whichraises a significant problem fortime series analysis; the data alsoonly provide a limited breakdownby host country and no breakdownat all by industry. As a result, theBOJ balance-of-payment dataonly have limited value foranalysing Japan's FDI experience.
More widely used figures comefrom Fiscal and MonetaryStatistics Monthly compiled by theMinistry of Finance (MOF). Thispublication contains data on bothstocks and flows of Japanese FDI,either approved by MOF (up toDecember 1970) or reported to it(after 1970), in accordance with itslegal mandate (amended in April1998). These approved/reportedFDI statistics have tended tosubstantially overestimateeffective FDI, primarily because alarge percentage of FDI that isapproved/reported ultimatelynever gets carried out. Japanesefirms have often soughtexcessively large approvals, orelse over-reported their FDI inorder to allow room forunexpected project expansionsand minimize the related costs ofreporting to MOF. Manyapproved/reported projectssubsequently get downsized or
even cancelled. The data alsodiffer from standardbalance-of-payments-based FDIstatistics by reporting gross ratherthan net foreign investment, i.e.,without deducting capitalrepatriation.
There are several other problemswhen using Japanese FDI data forinternational comparisons. Firstly,there is a huge differencebetween reported and BoP-basedFDI data, since the value ofreported FDI is more than doublethe BoP-based net FDI figure —inthe 1990s, especially, whenoutward FDI flows stagnated, thediscrepancy grew wider becauseof the large amount of unrealized(but reported) investment, andincreased divestment. In fiscal1999, for example, MOF reportedFDI outflows of 7.439 trillion yen(about US$ 65 billion) while BOJreleased a figure of just 2.411trillion yen (about US$ 22 billion)(see Izuishi, 2000).
Secondly, reinvestment is nottreated appropriately, because thereport-based data omit thisaltogether, while BOP-based datainclude it only from 1996, thuscausing another problem for timeseries analysis. In addition,reinvestment is grosslyundervalued in BoP figures, whichshow it as 20% of total outwardFDI when business surveys byother official institutions report itas representing about 50%, atleast for manufacturingcompanies.
A further problem concerns theuse of fiscal years. In general,most official statistics in Japanuse the fiscal year starting in Aprilas their basic time frame. Thus,fiscal-year data exclude the firstquarter of the current calendaryear but include the first quarter ofthe following one. Only monthly
BoP-based data allow forinternational comparisonsmeasured in calendar years. Thus,the analytical value of the largeamount of detailed BOP data onJapanese FDI is limited byproblems of coverage, definitionand consistency.
Other important sources ofstatistical information on JapaneseFDI, and on the operations(production, sales, or export data)of the Japanese corporations'foreign affiliates in the internationalmarket, include the businesssurveys carried out by the Ministryof International Trade and Industry(MITI) and the Export-Import Bankof Japan (EXIMJ now the JapanBank of International Cooperation).The survey of broadest coverage isthe MITI Overseas Activities ofNational Firms, which is undertakenevery three years, while for themanufacturing sector alone, theEXIMJ Advanced Report on Trendsin Japan's Overseas DirectInvestment is conducted as acomprehensive annual survey.
These two surveys contain themost in-depth information availableon the operational activities ofJapanese companies. Nonetheless,given that replying to the surveys isnot compulsory, they are subject towide fluctuations in coverage fromyear to year, and this makestime-series analysis almostimpossible. For example, theresponse rate of the MITI surveyfluctuates between 33.4% and60%, and that of EXIMJ from 51%to 60% —coverage levels that arequite low compared to theBenchmark Surveys of the UnitedStates Department of Commerce.The number of affiliates covered bythe MITI FY95 survey is 10,416,i.e., just 40% of total affiliates listedin the Toyo Keizai data bank. TheEXIMJ FY98 survey covers 6,654affiliates, or 70% of the data bank inmanufacturing sector.
Box III.1THE ANALYTICAL SHORTCOMINGS IN OFFICIAL STATISTICS ON JAPANESE FDI

Foreign investment in Latin America and the Caribbean, 2000 133
Box III.1 (concluded)
The Japanese External TradeOrganization (JETRO) publishesan annual FDI white paper,containing detailed analysis ofoverall global investment trendsand Japanese inward-outwardFDI. Each issue carries a chapteron a special topic: industrialrestructuring through FDI (1997);new channels of investment inrelation to mergers andacquisitions, deregulation andprivatization (1998); the effect ofthe Asian crises on FDI (1999).
Although the white paper is quitecomprehensive, the data it uses isnot collected or prepared by itsown staff, except in the case ofoccasional surveys, such as amajor recent questionnaire on theadministrative situation ofJapanese companies located inLatin America (JETRO, 2000a).Thus, the non-BoP official data onJapanese FDI and corporateoperations also contain majoranalytical limitations.
Official statistics on Japan'soutward FDI in Latin America wouldhave us believe that the presenceof Japanese TNCs in the region ischaracterized by FDI concentratedin the Cayman Islands (finance)and Panama (ship registry). Thisclearly contradicts operational dataon Japanese corporations in LatinAmerica that paint a very differentpicture in which Mexico and Brazilare key elements. This chapterattempts to clarify the role of LatinAmerica in the internationalexpansion of Japanese firms.
Figure III.1JAPAN: OUTWARD FDI AND EXCHANGE RATE, 1970-1999
Chart III.1-Japan: Outward FDI and Exchange Rate, 1970-99
0
10
20
30
40
50
60
1970
1972
1974
1976
1978
1980
1982
1984
1986
1988
1990
1992
1994
1996
1998
billio
ns
of
US
do
llars
0
50
100
150
200
250
300
350
400
FDI outflows Y/US$ (inverted scale)
Source: UNCTAD, FDI/TNC database and IMF, International Financial Statistics
and other factors seem to have greater explanatorypower. These include secular macroeconomic instabilityor crisis; the very different policy environments inMexico and the Caribbean Basin (for efficiency-seekingFDI) and in South America (for TNCs seeking marketaccess in services); passive national policy, includingdiscontinuities and mismatches with global FDI waves;
and a lack of interest among Japanese TNCs in LatinAmerica's main FDI attractor, namely the sale of existingassets in privatization processes and through mergersand acquisitions. To better understand Japanese foreigndirect investment generally, and particularly in LatinAmerica, official FDI data need to be complementedwith other pertinent information and analysis.
A. WHAT HAS POWERED JAPANESE OUTWARD FDI?
The growth and modernization of Japan has been themost spectacular of all major countries during thetwentieth century, turning it into the world's secondlargest economy after the United States. Japan's percapita income grew at an impressive 5% a year for over50 years. Its "indigenous innovation" model in whichforeign technology was assimilated and improved uponby domestic firms, rather than channelled throughsubsidiaries of transnational corporations via FDI,represented a frontal assault on the dominant economiesof that time, by attacking them not where they were weakbut where they were strong. Good examples of thisinclude Japanese advances in relation to British textilesin the 1920s and 1930s, relative to United Statesconsumer electronics and mass-produced automobiles inthe 1970s and 1980s, and relative to German machinetools and luxury cars in the 1980s and 1990s (Lazonick,1994, p. 1).
The Japanese model excelled at industrial catch-upbecause that is precisely what it was designed for(Krause, 1991, pp. 6 and 9). The model's strong pointsincluded (i) the systemic application of innovativemanagement techniques that greatly enhanced thecountry's industrial competitiveness (e.g., the leanmanufacturing system) (UNCTC, 1990, pp. 2 and 12;Kaplinsky, 1995, pp. 58-59); (ii) corporatecross-shareholdings that sheltered Japanese managersfrom impatient shareholders and allowed them to take along-term view of investment; (iii) worker- or bottom-upparticipation in the production process, which wasencouraged by lifetime employment and helped achieveloyalty, high skill levels and better quality products; and(iv) high quality public services, especially education,which resulted in design and engineering excellence(The Economist, 10 April 1999, p. 69). A torrent of newliterature in the early 1990s saw the Japanesecompetitive steamroller as practically unstoppable, andargued that the only solution was to learn from its
example (Dertouzas, Lester and Solow, 1989; Thurow,1992; Krause, 1991, p. 6; Encarnation, 1992). The "FarEastern Method" for gaining competitiveness based onimproved industrial production techniques lay behindJapan's success (Kagami, 1995, chapter 2).
The competitive advantages of the new Japanesemanagement techniques (JMT), compared both to theiroriginal competitors and to their developing-countryimitators as of about 1990 are summarized in table III.1.It is worth highlighting some of these in order to fullyappreciate why Japanese firms took the lead in severalmajor industries during the latter half of the twentiethcentury. As regards arena of implementation, whileJapanese corporations made JMT a company-widephenomenon, many of their imitators applied thetechniques only in individual plants, and the traditionalmass-production competitors did not implement them atall at that time. In terms of organizational procedures, themodern Japanese firms integrated cellular, small-lot,small-batch production with just-in-time (JIT) and totalquality control (TQC) techniques, based on multi-skillteams pursuing continuous improvement. Many of theirimitators employed these organizational procedures onlypartially, while the traditional mass producers continuedto use old-fashioned procedures, such as standardizedproducts based on large-lot, large-batch production, in amore functional layout with extended division of labourincorporating just-in-case inventories. The newJapanese model depended on close and frequent contactswith suppliers and customers; many of its imitators hadrelatively little such contact, and the traditional massproducers tended to have adversarial relationships withsuppliers and customers. In short, modern Japanesecorporations converted these techniques into a systemiccharacteristic, evident at all enterprise levels (group,firm, factory, production, supervisory and team). Mostof their imitators could display certain aspects atdifferent levels (factory, production, supervisory and
134 ECLAC
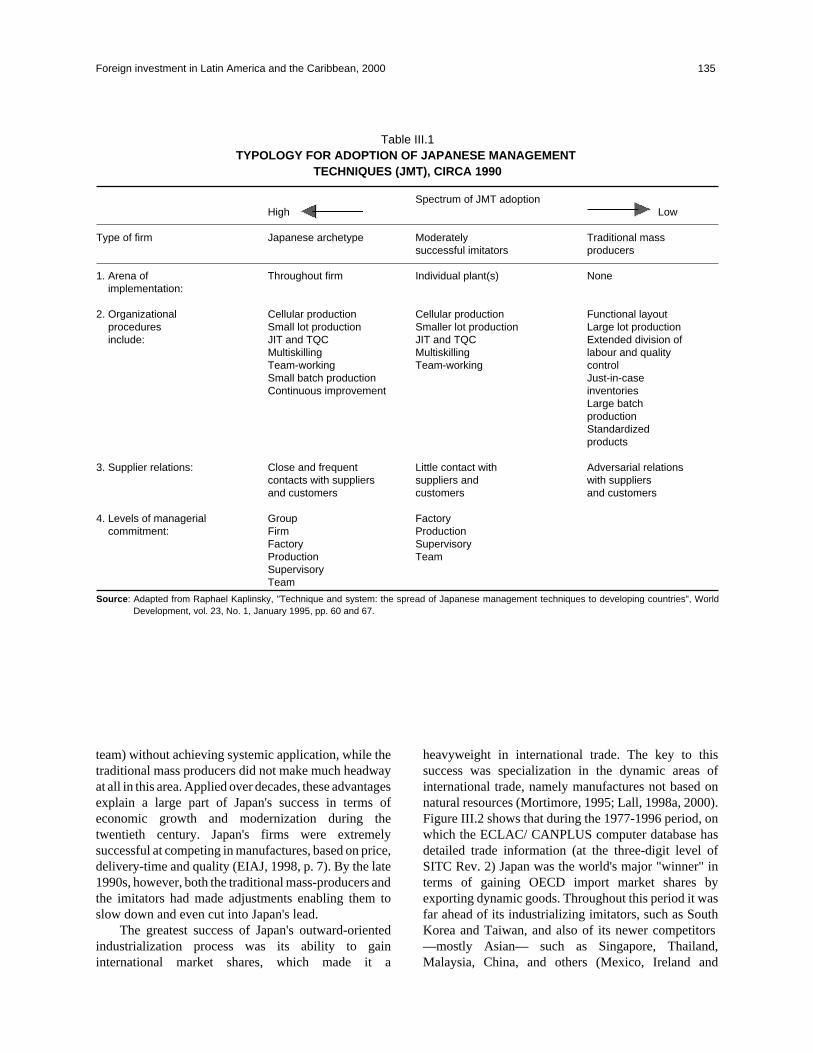
team) without achieving systemic application, while thetraditional mass producers did not make much headwayat all in this area. Applied over decades, these advantagesexplain a large part of Japan's success in terms ofeconomic growth and modernization during thetwentieth century. Japan's firms were extremelysuccessful at competing in manufactures, based on price,delivery-time and quality (EIAJ, 1998, p. 7). By the late1990s, however, both the traditional mass-producers andthe imitators had made adjustments enabling them toslow down and even cut into Japan's lead.
The greatest success of Japan's outward-orientedindustrialization process was its ability to gaininternational market shares, which made it a
heavyweight in international trade. The key to thissuccess was specialization in the dynamic areas ofinternational trade, namely manufactures not based onnatural resources (Mortimore, 1995; Lall, 1998a, 2000).Figure III.2 shows that during the 1977-1996 period, onwhich the ECLAC/ CANPLUS computer database hasdetailed trade information (at the three-digit level ofSITC Rev. 2) Japan was the world's major "winner" interms of gaining OECD import market shares byexporting dynamic goods. Throughout this period it wasfar ahead of its industrializing imitators, such as SouthKorea and Taiwan, and also of its newer competitors—mostly Asian— such as Singapore, Thailand,Malaysia, China, and others (Mexico, Ireland and
Foreign investment in Latin America and the Caribbean, 2000 135
Table III.1TYPOLOGY FOR ADOPTION OF JAPANESE MANAGEMENT
TECHNIQUES (JMT), CIRCA 1990
Spectrum of JMT adoptionHigh Low
Type of firm Japanese archetype Moderately Traditional masssuccessful imitators producers
1. Arena of Throughout firm Individual plant(s) Noneimplementation:
2. Organizational Cellular production Cellular production Functional layoutprocedures Small lot production Smaller lot production Large lot productioninclude: JIT and TQC JIT and TQC Extended division of
Multiskilling Multiskilling labour and qualityTeam-working Team-working controlSmall batch production Just-in-caseContinuous improvement inventories
Large batchproductionStandardizedproducts
3. Supplier relations: Close and frequent Little contact with Adversarial relationscontacts with suppliers suppliers and with suppliersand customers customers and customers
4. Levels of managerial Group Factorycommitment: Firm Production
Factory SupervisoryProduction TeamSupervisoryTeam
Source: Adapted from Raphael Kaplinsky, "Technique and system: the spread of Japanese management techniques to developing countries", WorldDevelopment, vol. 23, No. 1, January 1995, pp. 60 and 67.
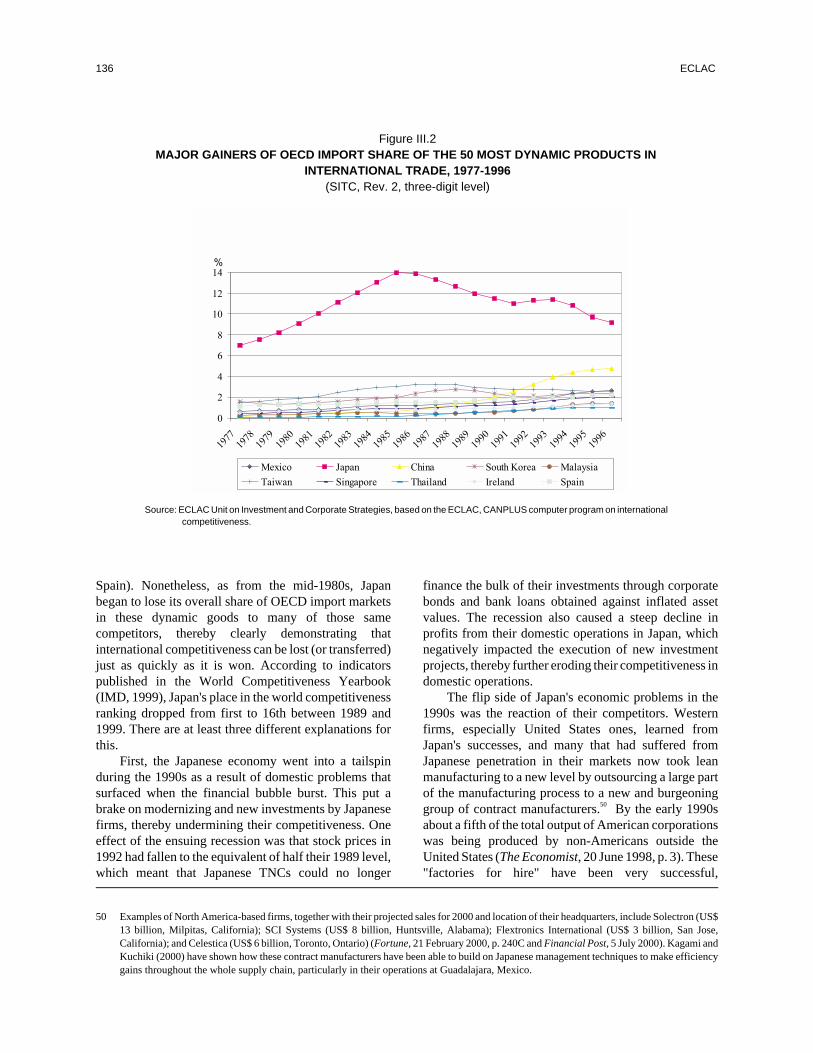
Spain). Nonetheless, as from the mid-1980s, Japanbegan to lose its overall share of OECD import marketsin these dynamic goods to many of those samecompetitors, thereby clearly demonstrating thatinternational competitiveness can be lost (or transferred)just as quickly as it is won. According to indicatorspublished in the World Competitiveness Yearbook(IMD, 1999), Japan's place in the world competitivenessranking dropped from first to 16th between 1989 and1999. There are at least three different explanations forthis.
First, the Japanese economy went into a tailspinduring the 1990s as a result of domestic problems thatsurfaced when the financial bubble burst. This put abrake on modernizing and new investments by Japanesefirms, thereby undermining their competitiveness. Oneeffect of the ensuing recession was that stock prices in1992 had fallen to the equivalent of half their 1989 level,which meant that Japanese TNCs could no longer
finance the bulk of their investments through corporatebonds and bank loans obtained against inflated assetvalues. The recession also caused a steep decline inprofits from their domestic operations in Japan, whichnegatively impacted the execution of new investmentprojects, thereby further eroding their competitiveness indomestic operations.
The flip side of Japan's economic problems in the1990s was the reaction of their competitors. Westernfirms, especially United States ones, learned fromJapan's successes, and many that had suffered fromJapanese penetration in their markets now took leanmanufacturing to a new level by outsourcing a large partof the manufacturing process to a new and burgeoninggroup of contract manufacturers.50 By the early 1990sabout a fifth of the total output of American corporationswas being produced by non-Americans outside theUnited States (The Economist, 20 June 1998, p. 3). These"factories for hire" have been very successful,
136 ECLAC
Figure III.2MAJOR GAINERS OF OECD IMPORT SHARE OF THE 50 MOST DYNAMIC PRODUCTS IN
INTERNATIONAL TRADE, 1977-1996(SITC, Rev. 2, three-digit level)
0
2
4
6
8
10
12
14
1977
1978
1979
1980
1981
1982
1983
1984
1985
1986
1987
1988
1989
1990
1991
1992
1993
1994
1995
1996
%
Mexico Japan China South Korea Malaysia
Taiwan Singapore Thailand Ireland Spain
Source: ECLAC Unit on Investment and Corporate Strategies, based on the ECLAC, CANPLUS computer program on internationalcompetitiveness.
50 Examples of North America-based firms, together with their projected sales for 2000 and location of their headquarters, include Solectron (US$13 billion, Milpitas, California); SCI Systems (US$ 8 billion, Huntsville, Alabama); Flextronics International (US$ 3 billion, San Jose,California); and Celestica (US$ 6 billion, Toronto, Ontario) (Fortune, 21 February 2000, p. 240C and Financial Post, 5 July 2000). Kagami andKuchiki (2000) have shown how these contract manufacturers have been able to build on Japanese management techniques to make efficiencygains throughout the whole supply chain, particularly in their operations at Guadalajara, Mexico.

Foreign investment in Latin America and the Caribbean, 2000 137
The wild flying-geese (WFG)pattern of development has beenseen as providing insights into thesuccessive development of Asiancountries in the 1980s, following inJapan's footsteps. Internationaldevelopment linkage was not,however, the main focus of theoriginal WFG model, and this newapplication only arose when the
East Asian Miracle drewinternational attention to it. Thetheory has undergone somereinterpretation since the Asiancrises of the 1990s, but it remainsa valuable analytical tool forunderstanding key aspects of theinternational expansion ofJapanese industry.
The flying geese metaphor wasintroduced in the pre-war period(Akamatsu, 1935) to explain theevolution of the wool industry inJapan, highlighting the sequence ofimports, followed by domesticproduction and, finally, exports.This pattern of development waslater conceived in the followingmanner (see diagram):
(1) For all industrial goods, there is a sequence running from imports, to domestic production, and later to exports;
(2) The time needed for the curves representing domestic production and exports to move beyond that of imports will come earlier in simple goodsand later in refined goods; and, similarly, earlier in consumer goods, and later in capital goods;
(3) The import curve falls in proportion to the rise of the domestic production curve. Sooner or later, the export curve will begin to fall in the case ofsimple or consumer goods, and domestic production curve of these goods will also decline in the future (Akamatsu, 1961,1962).
Wild geese fly in organized flocksforming an inverse V, likeairplanes in formation. This patternof wild geese flight wasmetaphorically applied to the threetime-series curves representingimports, domestic production, andexports of manufactured goods in
less-advanced countries.Akamatsu's earlier work, alongwith that of his followers,concentrated on the theoreticalsophistication and empiricalverification of the theory. Kojima(1960) introduced importantmodifications to explain the driving
force of this evolutionary processin terms of capital accumulation,and Yamazawa (1990) madedetailed studies of the cotton andsteel industries in Japan to identifythe WFG development patternempirically.
The Original WFG Scheme
Imports
Production
Exports
time
quantity
Box III.2THE WILD FLYING GEESE MODEL
particularly in the electronics industry, often exploitingthe rules of origin of the North American Free TradeAgreement (NAFTA) to gain an edge in supplying theUnited States market from plants in Mexico (TheEconomist, 12 February 2000, p. 61). The recentcompetitive decline of Japanese manufacturers in theUnited States, especially in the computer orsemiconductor industry, is reflected in their complaintsof "increased competition" in that market (JETRO,1999b, p. 1). Some Japanese firms, such as NEC, areselling their own manufacturing plants there to UnitedStates contract manufacturers, with a view tooutsourcing from them (Fortune, 21 February 2000,pp. 240B-240D).
Other competitors, mainly from developingcountries, have also managed to gain OECD importmarket shares from Japan. The more successful imitatorsof the systemic application of Japanese managementtechniques, such as South Korea and Taiwan, have
managed to undermine the competitive situation ofJapanese firms in the computer, semiconductor andconsumer electronics industries, and also in theautomotive sector, through the progress made by theirnational corporations (Hobday, 1995, chapters 4 and 5;ESCAP, 1994, chapter IV; Kagami, 1995, chapter 2). Inother countries, such as Malaysia, Singapore, Thailand,and China, as well as Ireland and Mexico, increased useof export processing zones (and science and technologyparks in Asia) has enabled transnational corporations toestablish and expand internationally integratedproduction systems, including contract manufacturers,and thereby cut into the lead enjoyed by the big Japaneseexporters (Lall, 1998b, Hobday, 1995, chapter 6;ESCAP, 1994, chapters II and V; Mortimore, 1998c). Inbrief, part of Japan's problems stemmed from its internalorganization, while another part came from the reactionof its competitors —old and new alike, transnational andnational— to its success in the international market.
138 ECLAC
Box III.2 (concluded)
The wild-geese concept gainedinternational recognition partlybecause of its similarity to theproduct cycle (PC) theory,although WFG had to do with thedeveloping-country catch-upprocess, and PC related to theprocess of technology diffusionfrom developed countries. In thecourse of debate, however, thefocus shifted from the evolution ofa given industry in a singlecountry to the international linkageof development through foreigninvestment and trade.
The rapid development of EastAsian economies (known as theEast Asian Miracle) seemed to fitthe WFG paradigm. Thesecountries underwent a remarkableindustrialization process, evolvingfrom non-durable consumer goodsto capital-goods in WFG fashion.This growth pattern was seen asfollowing the same path as Japan,first by the Asian newlyindustrializing economies (NIEs),and later by member countries ofthe Association of South East
Asian Nations (ASEAN). Theinternational linkage aspect of theWFG theory was first propoundedby former Japanese ForeignMinister, Saburo Okita. In hisaddress to the Fourth PacificEconomic CooperationConference (PECC) in 1985, heinvoked the WFG model to explainthe new pattern of internationaldivision of labour evident in thecatch-up process in countries ofdifferent industrial level (Okita,1986). Since then, the theory hasbecome increasingly popular, notonly with academics but alsoamong officials of government andinternational organizations, andwith business leaders.
The Asian crises of the 1990s ledto a reassessment of the WFGmodel. Some authors expressedserious criticism of the model'svalidity, while others tried to adaptit to demonstrate its continuingeffectiveness. Much of thecriticism was baseless in that itsimply treated the 1997 crises inthe East Asian economies as a
failure of the model, without reallyconsidering the analytical basis ofthe theory. Nonetheless, somemore penetrating critiques havealso been made. In response tothese, Kojima has argued that theAsian crisis was caused by amismanagement of financialliberalization, rather than a problemof industrialization in the realsector, and that the original WFGmodel remains valid in explainingdeveloping countries'industrialization catch-up process.
The most interesting aspect of theWFG concept is its simplicity andits approximation to empiricalevents in a specific historical timeframe. Its usefulness as ananalytical tool for understandingindustrial development -its originalpurpose- remains relevant to theEast Asian experience.Unfortunately, it has relativelylimited relevance for Latin Americaand the Caribbean, firstly becausethe region's countries followeddifferent development paths, andsecondly because Japanese FDIdid not play a significant role in anyof them.
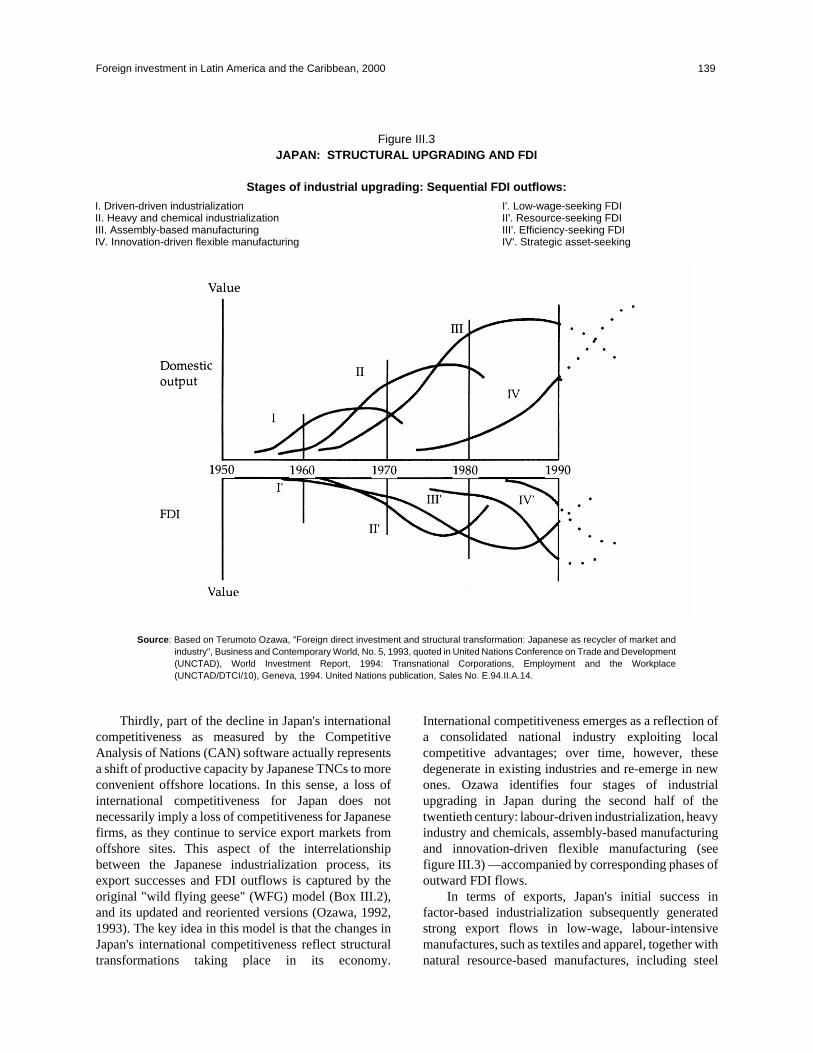
Thirdly, part of the decline in Japan's internationalcompetitiveness as measured by the CompetitiveAnalysis of Nations (CAN) software actually representsa shift of productive capacity by Japanese TNCs to moreconvenient offshore locations. In this sense, a loss ofinternational competitiveness for Japan does notnecessarily imply a loss of competitiveness for Japanesefirms, as they continue to service export markets fromoffshore sites. This aspect of the interrelationshipbetween the Japanese industrialization process, itsexport successes and FDI outflows is captured by theoriginal "wild flying geese" (WFG) model (Box III.2),and its updated and reoriented versions (Ozawa, 1992,1993). The key idea in this model is that the changes inJapan's international competitiveness reflect structuraltransformations taking place in its economy.
International competitiveness emerges as a reflection ofa consolidated national industry exploiting localcompetitive advantages; over time, however, thesedegenerate in existing industries and re-emerge in newones. Ozawa identifies four stages of industrialupgrading in Japan during the second half of thetwentieth century: labour-driven industrialization, heavyindustry and chemicals, assembly-based manufacturingand innovation-driven flexible manufacturing (seefigure III.3) —accompanied by corresponding phases ofoutward FDI flows.
In terms of exports, Japan's initial success infactor-based industrialization subsequently generatedstrong export flows in low-wage, labour-intensivemanufactures, such as textiles and apparel, together withnatural resource-based manufactures, including steel
Foreign investment in Latin America and the Caribbean, 2000 139
Figure III.3JAPAN: STRUCTURAL UPGRADING AND FDI
Stages of industrial upgrading: Sequential FDI outflows:
I. Driven-driven industrialization I'. Low-wage-seeking FDIII. Heavy and chemical industrialization II'. Resource-seeking FDIIII. Assembly-based manufacturing III'. Efficiency-seeking FDIIV. Innovation-driven flexible manufacturing IV'. Strategic asset-seeking
Source: Based on Terumoto Ozawa, "Foreign direct investment and structural transformation: Japanese as recycler of market andindustry", Business and Contemporary World, No. 5, 1993, quoted in United Nations Conference on Trade and Development(UNCTAD), World Investment Report, 1994: Transnational Corporations, Employment and the Workplace(UNCTAD/DTCI/10), Geneva, 1994. United Nations publication, Sales No. E.94.II.A.14.
and chemicals (Mortimore, 1993). As the country'sindustrialization process shifted towards a stage ofindustrial development that relied on large-scaleinvestments, more assembly-based, capital-intensiveexports, such as electronics and automobiles, weregenerated. These compensated for the loss of exportcompetitiveness in labour-intensive manufactures aslocal wages rose and took the place of naturalresource-based manufactures. Shipbuilding and thedesign and construction of chemical plants in foreigncountries provided other major sources of exportearnings. In fields as varied as toys, sewing machines,watches, photographic equipment and scientificinstruments, some Japanese corporations were able tocontinually upgrade their products, such that newtechnology or innovation offset declining wage-basedcompetitiveness and enabled them to defend their exportmarket shares. The industrialization process in theJapanese economy continued to evolve towardinnovation-driven flexible manufacturing, with newR&D-intensive exports being generated in sectors suchas machine tools. Finally, the export of manufacturesfrom the Japanese economy became increasinglydifficult because of competitive pressures from newplayers and the response of its original competitors; as aresult, Japan's overall international competitivenessdeclined.
As regards FDI outflows, Japan's initial foreigninvestment was aimed at securing its natural resourcesupplies. Japanese firms also attempted to maintain theirexports of light manufactures by investing in offshoreassembly facilities located in lower-wage developingcountries. The increasing internationalization ofmanufactured goods exporters later expresses itself inefficiency-seeking FDI to establish integrated regionaland international production systems aimed atmaintaining international competitiveness in capital-intensive exports, such as electronics and automobiles(Hamaguchi and Saavedra-Rivano, 1999). Theseexporters progressively establish internationallyintegrated production systems in order to consolidate theircompetitive advantage in all regions of the internationalmarket. Lastly, something similar happens with regard tocapital goods and R&D-intensive products, such asmachine tools. The difference here is that strategicalliances with the technology-generating firms are oftenmore important than implementing or consolidatinginternationally integrated production systems.
This highly simplified outline of theinterrelationship between Japan's industrialization (orindustrial upgrading) process and its internationalcompetitiveness provides important insights into the
nature of Japanese outward FDI, and is an extremelyuseful complement to official FDI statistics.
Although official Japanese FDI statistics containdeficiencies that detract from their power to explainJapanese outward investment, they do provide a generalorientation and are thus necessary but not sufficient. Theaccumulated stock of Japanese outward FDI during1965-1998 shows, surprisingly, that Latin America wasonce the single most important region, accounting forover 25% of the total in 1965. That soon changed,however, and during this period the stock of JapaneseFDI in Latin America (about 12% by 1998) wassurpassed not only by that of North America (rising from25% to 44% of the total), but also Asia (which grew from19% to 28% in 1977-1983 before slipping to about 20%)and Europe (which advanced from 3% to 24% in 1973before retreating to around 20%). The Japanese FDIstock in the Middle East collapsed from 23% in 1965 to1% in 1998. These figures suggest that the focus ofJapanese FDI during this period was North America,Asia and Europe, while there was a major withdrawalfrom the Middle East and a relative decline in LatinAmerica and the Caribbean. Regional sales data for theoverseas affiliates of Japanese firms in 1996 generallysupport this regional distribution, with North America(39%) in the lead, followed by Asia (27%) and Europe(25%) in the middle, and Latin America and theCaribbean a long way back at 4% (MITI, 1999).
Figures for Japanese outward FDI flows in themanufacturing sector show that the Latin American andCaribbean share has become even less significant thanwhat is suggested by the accumulated all-sector FDIstock. Table III.2 shows that in the early 1970s, LatinAmerica and the Caribbean (30% of total Japanese FDIoutflows) was surpassed only by Asia (40%) in terms ofregions receiving (then very small) Japanese FDI flowsin the manufacturing sector. North America (16%) andEurope (6%) were far behind. As Japanese outward FDIin the manufacturing sector exploded thereafter,however, to reach US$ 22.7 billion a year in 1995-99,North America (43%), Asia (27%) and Europe (23%)became the main targets, as Latin America's shareplummeted (5%) and the region ceased to be a majortarget for the international expansion of Japanesemanufacturing firms.
Figure III.4 shows that manufacturing output byJapanese corporations located in Asia is much moreexport-oriented (48.6% of total sales) than that of theircounterparts in Latin America (26.6%). Exports byJapanese firms located in Asia go mainly to Japan(25.3% of total sales) and other Asian countries (15.2%),while the much lower overall level of exports from thoselocated in Latin America is sent mostly to Japan (5.6%)
140 ECLAC
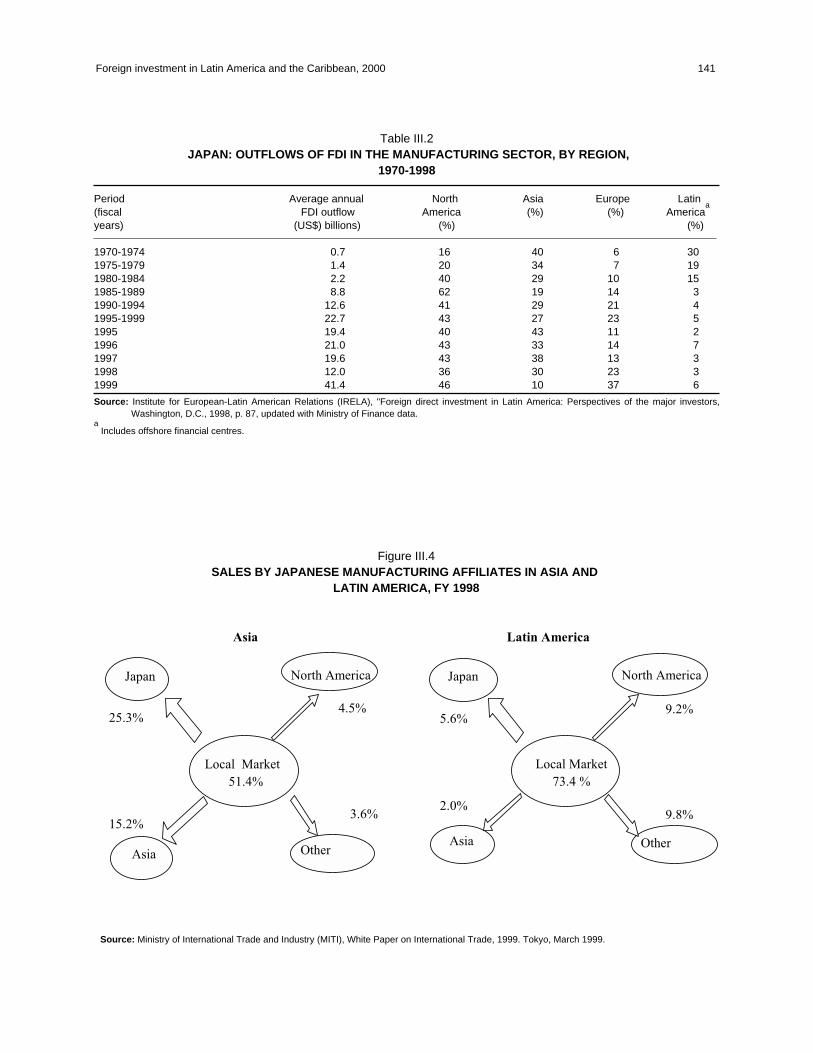
Foreign investment in Latin America and the Caribbean, 2000 141
Table III.2JAPAN: OUTFLOWS OF FDI IN THE MANUFACTURING SECTOR, BY REGION,
1970-1998
Period Average annual North Asia Europe Latin(fiscal FDI outflow America (%) (%) America
a
years) (US$) billions) (%) (%)
1970-1974 0.7 16 40 6 301975-1979 1.4 20 34 7 191980-1984 2.2 40 29 10 151985-1989 8.8 62 19 14 31990-1994 12.6 41 29 21 41995-1999 22.7 43 27 23 51995 19.4 40 43 11 21996 21.0 43 33 14 71997 19.6 43 38 13 31998 12.0 36 30 23 31999 41.4 46 10 37 6
Source: Institute for European-Latin American Relations (IRELA), "Foreign direct investment in Latin America: Perspectives of the major investors,Washington, D.C., 1998, p. 87, updated with Ministry of Finance data.
aIncludes offshore financial centres.
Figure III.4SALES BY JAPANESE MANUFACTURING AFFILIATES IN ASIA AND
LATIN AMERICA, FY 1998
Latin America
Local Market
73.4 %
Japan North America
5.6%9.2%
9.8%
OtherAsia
2.0%
Source: Ministry of International Trade and Industry (MITI), White Paper on International Trade, 1999. Tokyo, March 1999.
Asia
Local Market
51.4%
Asia
Japan North America
25.3%
15.2%
4.5%
Other
3.6%
and North America (9.2%), with a relatively minoramount going to all other countries (9.8%). This suggeststhat Japanese manufacturing enterprises have muchmore extensive regional systems of integratedproduction in Asia than in Latin America and theCaribbean.
In a comparative analysis of where transnationalcorporations (TNCs) have concentrated theirinternational operations among non-industrializedcountries, table III.3 (MITI data) shows that Japanese,American and European (German) transnationals havepursued different patterns of geographicalspecialization, as measured by their sales, number offirms and employees in 1996. Japanese TNCs havetended to specialize geographically in East Asia, whiletheir United States counterparts have concentrated inLatin America, and German ones have focused on Russiaand Central Europe. In Latin America, even theoperations of German transnationals are more significantthan those of their Japanese counterparts, according tothese figures.
Opinion surveys run by the Japan Bank forInternational Cooperation show that just two LatinAmerican countries are considered among the mostpromising FDI destinations for the medium and longerterm (Kaburagi, Noda and Ikehara, 2000). Only Braziland Mexico feature among the top 10 destinationsreported by the most internationally oriented Japanesemanufacturing corporations in 1995-1999; moreover,preference for these countries is mainly confined to theautomotive sector, and even then they tend to be at thebottom of the list. It is interesting to note that Mexicowas also ranked sixth in a similar survey of small- andmedium-sized Japanese manufacturers in 1999, whichsuggests that the larger corporations that alreadypossess internationally integrated production systemsinvolving Mexico may be convincing their Japanesesuppliers to accompany them in that country,presumably to meet the requirements of the NAFTArules of origin.
Latin America and the Caribbean is playing anincreasingly marginal role in Japan's foreign trade. In1970 the region accounted for 7.3% of Japan's totalimports and absorbed 6.2% of its exports, but by 1990those shares had fallen to 4% and 3.1%, respectively(Kuwayama, 1997). By mid-2000, the region's share ofJapanese exports had recovered to 4.5%, but its importshare had declined to 3.1%. More than half of Japan'simports from the region were concentrated in just six
commodities (aluminium, base metal ores andconcentrates, iron-ore concentrates, coffee, fresh fishand copper) sourced primarily from Brazil and Chile.Exports went mainly to Panama (manufactures) andMexico (inputs for the local assembly of manufacturedgoods).
Japanese outward FDI is undertaken by a variety ofdifferent agents, and the leading agent has changed overtime. An OECD study claims that:
During the early post-war period, tradingcompanies made a significant contribution toJapan's exports of relatively standardizedmanufactures, such as steel textiles andsundries. But with the growth of moresophisticated and highly differentiatedconsumer goods industries, notablyautomobiles and electronics products,dependence on trading companies began todecline as manufacturers set up their own salesnetworks overseas. … although their role asexport agents for Japanese manufacturersdiminished, the trading companies started toincrease third-country or offshore tradeintermediation. … the general tradingcompanies have turned into overseas projectorganizers for large-scale ventures in resourceand regional development. Moreover, theyhave come to play a key role in helpingJapanese manufacturers, and particularlysmall- and medium-sized enterprises, set upshop in labour-abundant developing countriesto produce technologically-mature, labour-intensive products by investing jointly andproviding needed infrastructural services.(OECD, 1984, p. 13, Italics added)Thus, the first two cycles of Japanese outward FDI
in the context of the country's outward-orientedindustrialization process (figure III.3) were carried outby or channelled through the leading trading companies,such as Mitsubishi, Mitsui, Itochu, Sumitomo, NisshoIwai and Marubeni, while the later stages wereimplemented by the more independent manufacturersand exporters of automobiles (e.g., Toyota and Honda),and electronics (Sony, Matsushita, Hitachi, NEC, Fujitsuand Canon).51
Two of the trading companies' main strengths weretheir influence over imports entering Japan, given theircontrol over national distribution, and the usefulness oftheir international sales systems in helping small and
142 ECLAC
51 Some major electronics and automotive firms (e.g., NEC in the Sumitomo group, Nissan in the Fuyo group) are elements of general tradingcompanies; others (Hitachi and Toyota), while formally part of general trading companies, have more independent relationships with them.
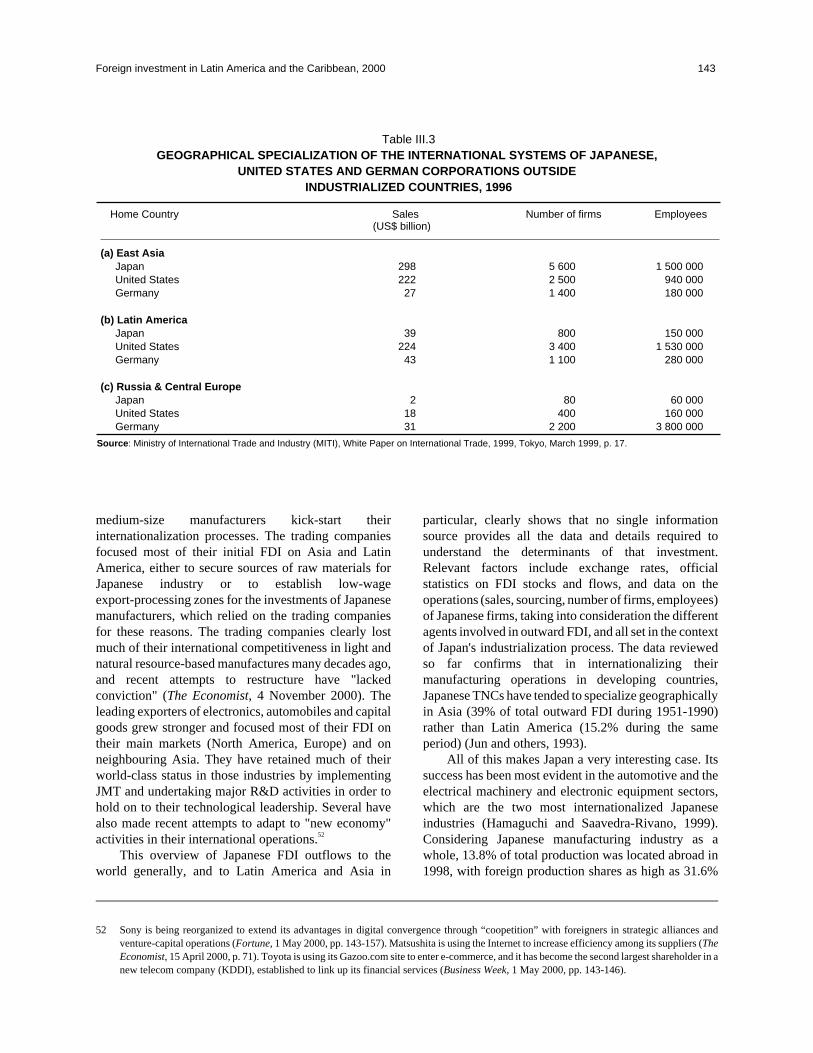
medium-size manufacturers kick-start theirinternationalization processes. The trading companiesfocused most of their initial FDI on Asia and LatinAmerica, either to secure sources of raw materials forJapanese industry or to establish low-wageexport-processing zones for the investments of Japanesemanufacturers, which relied on the trading companiesfor these reasons. The trading companies clearly lostmuch of their international competitiveness in light andnatural resource-based manufactures many decades ago,and recent attempts to restructure have "lackedconviction" (The Economist, 4 November 2000). Theleading exporters of electronics, automobiles and capitalgoods grew stronger and focused most of their FDI ontheir main markets (North America, Europe) and onneighbouring Asia. They have retained much of theirworld-class status in those industries by implementingJMT and undertaking major R&D activities in order tohold on to their technological leadership. Several havealso made recent attempts to adapt to "new economy"activities in their international operations.52
This overview of Japanese FDI outflows to theworld generally, and to Latin America and Asia in
particular, clearly shows that no single informationsource provides all the data and details required tounderstand the determinants of that investment.Relevant factors include exchange rates, officialstatistics on FDI stocks and flows, and data on theoperations (sales, sourcing, number of firms, employees)of Japanese firms, taking into consideration the differentagents involved in outward FDI, and all set in the contextof Japan's industrialization process. The data reviewedso far confirms that in internationalizing theirmanufacturing operations in developing countries,Japanese TNCs have tended to specialize geographicallyin Asia (39% of total outward FDI during 1951-1990)rather than Latin America (15.2% during the sameperiod) (Jun and others, 1993).
All of this makes Japan a very interesting case. Itssuccess has been most evident in the automotive and theelectrical machinery and electronic equipment sectors,which are the two most internationalized Japaneseindustries (Hamaguchi and Saavedra-Rivano, 1999).Considering Japanese manufacturing industry as awhole, 13.8% of total production was located abroad in1998, with foreign production shares as high as 31.6%
Foreign investment in Latin America and the Caribbean, 2000 143
Table III.3GEOGRAPHICAL SPECIALIZATION OF THE INTERNATIONAL SYSTEMS OF JAPANESE,
UNITED STATES AND GERMAN CORPORATIONS OUTSIDEINDUSTRIALIZED COUNTRIES, 1996
Home Country Sales Number of firms Employees(US$ billion)
(a) East AsiaJapan 298 5 600 1 500 000United States 222 2 500 940 000Germany 27 1 400 180 000
(b) Latin AmericaJapan 39 800 150 000United States 224 3 400 1 530 000Germany 43 1 100 280 000
(c) Russia & Central EuropeJapan 2 80 60 000United States 18 400 160 000Germany 31 2 200 3 800 000
Source: Ministry of International Trade and Industry (MITI), White Paper on International Trade, 1999, Tokyo, March 1999, p. 17.
52 Sony is being reorganized to extend its advantages in digital convergence through “coopetition” with foreigners in strategic alliances andventure-capital operations (Fortune, 1 May 2000, pp. 143-157). Matsushita is using the Internet to increase efficiency among its suppliers (TheEconomist, 15 April 2000, p. 71). Toyota is using its Gazoo.com site to enter e-commerce, and it has become the second largest shareholder in anew telecom company (KDDI), established to link up its financial services (Business Week, 1 May 2000, pp. 143-146).

and 24.1% in the transport equipment and electricmachinery industries, respectively. The largestJapanese corporations by foreign assets (table III.4)include some of the more dynamic manufacturersmainly in the automotive and electronic equipmentsectors (e.g., Toyota, Honda, Sony, Matsushita,Hitachi), together with the dominant tradingcompanies (e.g., Mitsubishi, Mitsui, Itochu,Sumitomo, Nissho Iwai and Marubeni). The numberof Japanese companies among the 100 largest TNCs,as measured by foreign assets, rose from 12 to 17 in1990-1998, Japan being the only member of the Triadeconomies (North America, Europe, Japan) to registeran increase. Toyota and Mitsubishi Motors were
among the 10 largest risers during 1997-1998, whileNissho Iwai, Itochu and Nissan were some of thelargest fallers. Many of these Japanese transnationalsoperate in the electronics and automotive industries,which were the two leading sectors among the 100largest TNCs, accounting for almost one third of totalforeign assets. The Japanese corporations included inthe list generally have transnationality indices belowthe average (53.9%).
In order to gain further insights into the evolution ofJapanese FDI generally, and in Latin America inparticular, the following sections provide a detailedanalysis of the strategies used by some of the leadingJapanese companies in these dynamic industries.
144 ECLAC
Table III.4LEADING JAPANESE CORPORATIONS BY FOREIGN ASSETS, 1998
(Billions of dollars and percentage)
World World TNI Foreign Total Foreign Totalrank rank 1998a Corporation Sector assets assets sales sales1998 1990
(Billions of dollars)
6 29 50.1 Toyota Automobiles 44.9 131.5 55.2 101.018 63 60.2 Honda Motor Automobiles 26.3 41.8 29.7 51.7
Co. Ltd.20 15 59.3 Sony Electronics n.a. 52.5 40.7 56.6
Corporation24 18 32.7 Mitsubishi Trading 21.7 74.9 43.5 116.1
Corporation25 46 42.6 Nissan Motor Automobiles 21.6 57.2 25.8 54.4
Co. Ltd.37 22 34.9 Mitsui & Co. Trading 17.3 56.5 46.5 118.545 40 21.5 Itochu Trading 15.1 55.9 18.4 115.3
Corporation46 n.a. 26.3 Sumitomo Trading 15.0 45.0 17.6 95.0
Corp.49 71 24.9 Nissho Iwai Trading 14.2 38.5 9.1 71.655 12 38.9 Matsushita Electronics 12.2 66.2 32.4 63.7
Electric56 n.a. 34.9 Fujitsu Ltd. Electronics 12.2 42.3 15.9 43.358 n.a. 21.4 Hitachi Ltd. Electronics 12.0 76.6 19.8 63.868 68 25.8 Marubeni Trading 10.6 53.8 31.4 98.9
Corp.88 n.a. 50.6 Mitsubishi Automobiles 8.4 25.4 16.6 29.1
Motors92 n.a. 52.3 Canon Electronics 7.4 23.4 17.8 24.4
Electronics93 79 58.2 Bridgestone Rubber /tires 7.4 14.7 11.3 17.1
100 64 23.3 Toshiba Corp. Electronics 6.8 48.8 14.5 44.6
Source: United Nations Conference on Trade and Development (UNCTAD), World Investment Report, 2000. Cross-border Mergers and Acquisitions andDevelopment (UNCTAD/WIR/(2000)), New York. United Nations publication, Sales No. E.00.II.D.20; World Investment Report, 1993:Transnational Corporations and Integrated International Production (ST/CTC/156), New York. United Nations publication, Sales No. E.93.II.A.14;and PT Smart Tbk, "The Asia Week 1000" (http://www.smart-corp.com/event/asiaweek.htm).
aThe transnationality index (TNI) is calculated as the average of three ratios: foreign assets to total assets, foreign sales to total sales and foreign
employment to total employment.
n.a. = not available.
B. THE JAPANESE CHALLENGE TO THE GLOBAL AUTOMOTIVE INDUSTRY:TOYOTA AND HONDA
The growth of the Japanese automotive industry duringthe second half of the twentieth century was quitespectacular (figure III.5). Between 1965 and 1990production skyrocketed from below 2 million units to13.5 million, and exports blossomed from 200,000 unitsto around 6 million. The export propensity of theautomotive industry jumped from 10% in 1965 to 55% in1985, before declining somewhat thereafter. By the early1990s the value of automobile sales was equivalent to31.4% of sales in the machinery industry and represented13.4% of total sales in the manufacturing sector as awhole. Motor vehicle exports accounted for about 20%of total exports (JAMA, 1998, p. 30). In 1962, Japan'sautomobile industry ranked sixth in the world in terms ofunits produced, but by 1980 it had climbed to first place,overtaking Italy (1963), France (1964), United Kingdom(1966), Germany (1967) and the United States (1980)along the way. The success of Japanese automobileexports is particularly evident in the ASEAN countries,where they have acquired a market share of about 80%,and in the United States (around 30%). In response to thetrade restrictions that their exports provoked in theUnited States and European markets, compounded byexchange-rate volatility and, later, domestic recessionfollowing the bursting of the financial bubble, Japaneseauto TNCs implemented aggressive internationalizationstrategies aimed at establishing competitiveinternationally integrated production systems.53
In 1999, the top ten vehicle manufacturers byworldwide sales consisted of five European firms (twofrom Germany, two from France and one from Italy),three from Japan, and two from the United States thatdominated the list (table III.5). These 10 firms accountedfor over three quarters of global automobile sales in thatyear. In the early 1990s, auto-sector TNCs with moreinternationalized production systems (defined as over40% of total production located outside their homecountry) were Ford (58.9%), General Motors (47.6%),Chrysler (45.7%) and Volkswagen (42.8%) (OECD,1996). Those with moderately internationalizedproduction systems (more than one fifth of total vehicleproduction located abroad in 1993) included Honda(33.1%), Nissan (31.2%), Fiat (25%), and Renault(23%). Toyota, the third largest motor vehicle
manufacturer in 1999, at that time had a productionstructure that was classified as "not veryinternationalized". The Japanese automobile industry isone of the major success stories of the 1990s (if not thesecond half of the twentieth century) � especiallycompanies such as Toyota and Honda (Mortimore,1997). In each of these firms the export cycle from theirJapanese production base was followed byinternationalization of their production systems via FDI.At the same time, the output for Japan's domesticautomotive market shrank from 13.5 million vehicles in1990 to 9.9 million in 1999.
The success of these Japanese automobilemanufacturers was based on superior products, qualityand techniques. Following the introduction of themoving assembly line by Henry Ford leading to massproduction in the 1920s, the next mainspring fordevelopment of the automobile industry in the twentiethcentury was the "lean production system" pioneered byToyota. This made economies of scale less crucial forcommercial success in the industry (although it wasToyota that stretched them to the limit with models suchas the Corolla) and new factors, such as continuous flowmanufacturing, constantly improving quality,development of a more efficient supply network, andvehicle customization to better match consumerpreferences, became increasingly important. Some of thekey elements of the Toyota Production System thatreflected Japanese Management Techniques anddistinguished it from the original Ford system can besummarized as follows Andersen Consulting, 1994: p.7;"Smoothing the Flow", http://www.global.toyota.com):• It is based on integrated single-piece production flow with
low inventories. Small batches are made just in time.• Defects are prevented rather than rectified.• Production is "pulled" by the customer rather than
"pushed" to suit machine loading.• Team work with flexible multi-skilled operators and
few indirect staff becomes the basic workorganization format.
• Active involvement in root-cause problem-solving isused to eliminate all non-value adding steps,interruptions and variability.
Foreign investment in Latin America and the Caribbean, 2000 145
53 It is remarkable that that some of the Japanese auto TNCs succeeded in doing this during the crisis in Japan. Asiaweek commented that "anycompany that managed to thrive despite the crisis is almost indestructible" mentioning Toyota and Honda by name. Asiaweek 1000 athttp://www.cnn.com/asiaweek/Asiaweek.
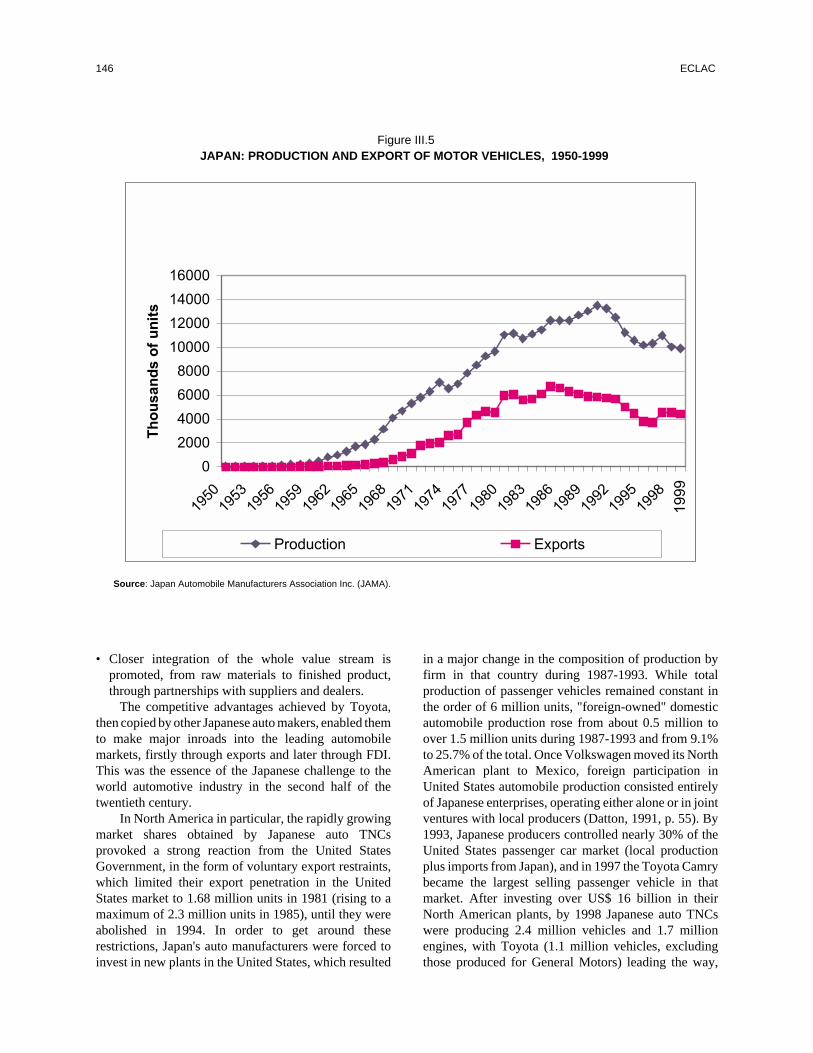
• Closer integration of the whole value stream ispromoted, from raw materials to finished product,through partnerships with suppliers and dealers.
The competitive advantages achieved by Toyota,then copied by other Japanese auto makers, enabled themto make major inroads into the leading automobilemarkets, firstly through exports and later through FDI.This was the essence of the Japanese challenge to theworld automotive industry in the second half of thetwentieth century.
In North America in particular, the rapidly growingmarket shares obtained by Japanese auto TNCsprovoked a strong reaction from the United StatesGovernment, in the form of voluntary export restraints,which limited their export penetration in the UnitedStates market to 1.68 million units in 1981 (rising to amaximum of 2.3 million units in 1985), until they wereabolished in 1994. In order to get around theserestrictions, Japan's auto manufacturers were forced toinvest in new plants in the United States, which resulted
in a major change in the composition of production byfirm in that country during 1987-1993. While totalproduction of passenger vehicles remained constant inthe order of 6 million units, "foreign-owned" domesticautomobile production rose from about 0.5 million toover 1.5 million units during 1987-1993 and from 9.1%to 25.7% of the total. Once Volkswagen moved its NorthAmerican plant to Mexico, foreign participation inUnited States automobile production consisted entirelyof Japanese enterprises, operating either alone or in jointventures with local producers (Datton, 1991, p. 55). By1993, Japanese producers controlled nearly 30% of theUnited States passenger car market (local productionplus imports from Japan), and in 1997 the Toyota Camrybecame the largest selling passenger vehicle in thatmarket. After investing over US$ 16 billion in theirNorth American plants, by 1998 Japanese auto TNCswere producing 2.4 million vehicles and 1.7 millionengines, with Toyota (1.1 million vehicles, excludingthose produced for General Motors) leading the way,
146 ECLAC
Figure III.5JAPAN: PRODUCTION AND EXPORT OF MOTOR VEHICLES, 1950-1999
0
2000
4000
6000
8000
10000
12000
14000
16000
1950
1953
1956
1959
1962
1965
1968
1971
1974
1977
1980
1983
1986
1989
1992
1995
1998
Th
ou
san
ds
of
un
its
Production Exports
1999
Source: Japan Automobile Manufacturers Association Inc. (JAMA).

followed by Honda (0.7 million) and Nissan (0.3million). Whereas Japanese auto TNCs had imported 3.4million of the 4.1 million vehicles they sold in the UnitedStates market in 1986, by 1998 they were importing only1.3 million out of a total of 3.7 million -in other words,two thirds came from local production. Moreover, about40% of United States vehicle exports (excluding exportsto Canada) were from Honda (25.8%), Toyota (6.6%)and other Japanese automakers operating in that country(see JAMA website http://www.japanauto.com/library/).
In Western Europe there was a similar trend but on asmaller scale. Several European countries (France, Italy,United Kingdom, Spain and Portugal) initially reacted tothe Japanese challenge by imposing trade restrictions.The implementation of the European Single Market ledto bilateral negotiations between the EuropeanCommission and Japan, starting in 1991, aimed atphasing out national restrictions over a transitionalperiod. The initial idea was to allow Japan to export 1.23million units to Europe annually until 1999, whenEuropean Union (EU) commitments to the World TradeOrganization (WTO) would require such traderestrictions to be eliminated (the total allowed for vehicleimports was later reduced). As a result, Japaneseautomobile companies began to invest in local plants,especially in the United Kingdom, with a view tosupplying Europe from within. By 1993, Japanese automanufacturers had captured significant market shares inmany European countries either through exports orthrough local production, or both: Sweden (20.3%),Germany (13.7%), United Kingdom (12.7%), France(4.4%), and Italy (4.2%) (OECD, 1994). Finally, evenbefore the new WTO rules outlawed their traderestrictions, some European governments (e.g., France,Italy) were subsidizing new passenger car sales in orderto support some of the local auto makers that were moredependent on national markets (e.g., Renault, PSA-
Peugeot Citroen, Fiat). Japanese vehicle production inEurope rose inexorably from 43,200 units in 1985 to223,200 in 1990 and 777,700 by 1997.
The new element in the Japanese challenge since themid-1980s has been the progressive establishment ofinternational production systems (Mortimore, 1997).This has been particularly clear in the strategiesimplemented by Toyota and Honda to expand and extendtheir international production systems and squeezeadditional competitiveness out of their organizationaladvantages.
The single most important aspect of the Japanesechallenge is represented by Toyota's new corporatestrategy "to rekindle the killer instinct", involving aninvestment of about US$ 13.5 billion during the late1990s. Toyota wanted to "create the industry's first realglobally organized player, a company able to use its cloutto customize vehicles for regional markets" with anoverall annual capacity in excess of 6 million units(Business Week, 7 April 1997, p. 104; The Economist, 5March 1997, p. 83-4). Toyota announced its aim ofovertaking Ford to become the world's second largestauto TNC (Business Week, 21 December 1998, p. 58).Although it has yet to reach 6 million units or overtakeFord, Toyota's successes are impressive. Its April 2000market valuation of US$ 197.7 billion is by far the highestof all TNCs in the automotive sector; it has the largestmarket share in Japan and Asia and is achieving recordsales in North America and Europe. Its Camry model hasbeen the largest seller in the United States market for threestraight years, and its new Yaris model won the Japan Carof the Year Award for 1999-2000 (just as the Prius andLexus IS had done in 1997-1999 and 1998-1999,respectively). Several of its plants in Japan and NorthAmerica have topped the production-quality ranking forvehicles sold in the United States market. Its Kentucky,California and Ontario, Canada, plants were voted three of
Foreign investment in Latin America and the Caribbean, 2000 147
Table III.5LEADING MOTOR VEHICLE MANUFACTURERS, BY WORLDWIDE SALES, 1999
(Millions of units)
Company Production Company Production
1. General Motors (USA) 8.3 6. Fiat (Italy) 2.6
2. Ford Motor Co. (USA) 7.2 7. PSA (France) 2.5
3. Toyota (Japan) 5.4 8. Honda (Japan) 2.4
4. Volkswagen (Germany) 4.9 9. Nissan (Japan) a 2.4
5. DaimlerChrysler (Germany) 4.8 10 Renault (France) a 2.3
Source: Toyota Motor Company and Automotive News, 2000.a
Renault acquired a 34% holding in Nissan in 1999.

the highest quality vehicle plants in North America. TableIII.6 shows that while Toyota's production system washeavily based on Japan in 1990 (86.1% of sales), by 1999the international dimension was becoming increasinglyevident (34.1% of sales), following major investmentsand North America, Europe and Asia.
In this period, Toyota invested a total of US$ 3.3billion in its North American operations to raiseproduction capacity of the Sienna minivan at itsKentucky plant from 380,000 to 500,000 units; toestablish a new US$ 700 million plant in Indiana forT100 pick-up trucks (production capacity 100,000); tostart a US$ 400 million engine plant in West Virginia;and to double Corolla production capacity (to 200,000)at the Ontario plant in Canada. This raised Toyota'sproduction capacity in North America to 1.2 millionvehicles. Recently, the company also decided tomanufacture the Lexus RX300 outside Japan for the firsttime, at its Ontario plant, shifting production of theCamry Solara to Kentucky and Sienna minivanproduction to the plant in Indiana. Sequoia SUVproduction capacity at this plant is also expected to bedoubled to 300,000.
A total of US$ 1.9 billion has also been invested inEurope to double production capacity (to 200,000 units)of Carina E sedans and wagons at the Burnaston plant inthe United Kingdom, and to set up a new passenger carplant at Lens, France. Yaris production (150,000 units) atthat plant is slated to come onstream in 2001, and thentotal capacity in Europe will exceed 400,000 units.
In Asia, the company has invested US$ 4.6 billion toraise Soluna sedan production capacity (to 190,000) atthe Gateway plant at Bangkok, Thailand; to set up an
integrated regional supplier network to feed its Thaiassembly plants; to set up an engine plant at Tianjin,China; and to open 500 new dealerships in Japan.Production capacity in Japan will rise to over 4 millionunits, and in the rest of Asia it is set to increase to 600,000units (equivalent to 25% of the South East Asian marketby the year 2000). Toyota has also obtained permissionto produce passenger cars in China and diesel-poweredfamily vehicles in India. With these investmentsextending its international production system, Toyotahas clearly thrown down the gauntlet to the rest ofautomobile industry, and this is provoking reactionsfrom other key players.
The evolution of Toyota's international vehicleproduction system has been superimposed on its twoexisting modes of international production. The older ofthe two consists of assembly plants to supply localmarkets, mainly in developing countries. The earlyplants in Latin America, Asia, and Africa all fall into thiscategory, but the small production scale and exportvolumes generated by such facilities afforded them nosignificant role in the global extension of the ToyotaProduction System. The key elements of the newinternationally-competitive international productionsystem generally carry the "Toyota MotorManufacturing" brand-name and involve large-scaleproduction, often generating significant export volumes.These include the NUMMI, TMMK, TMMC and TMMIplants in North America, along with the United Kingdomand French plants in Europe, and the Australian and Thaiplants in Asia (see table III.7).
Curiously, Toyota's first overseas productionfacility was established in Brazil in 1959 to produce a
148 ECLAC
Table III.6TOYOTA VEHICLE PRODUCTIONa BY REGION, 1990 AND 1999
1990 1990 1999 1999Region (thousand % (thousand %
units) units)
North America (USA and Canada) 382.3 7.8 1 061.9 22.5
Asia (incl. Middle East) & Pacific 199.4 4.0 282.5 5.9
Europe 7.1 0.2 181.5 3.8
Africa 83.8 1.7 68.4 1.4
Latin America & Caribbean 5.1 0.1 16.8 0.4
Overseas Total 677.7 13.9 1 611.0 34.1
Japan Total 4 212.4 86.1 3 118.2 65.9
World Total 4 890.1 100 4 729.2 100
Source: Toyota Motor Company.a
Excludes Daihatsu production.
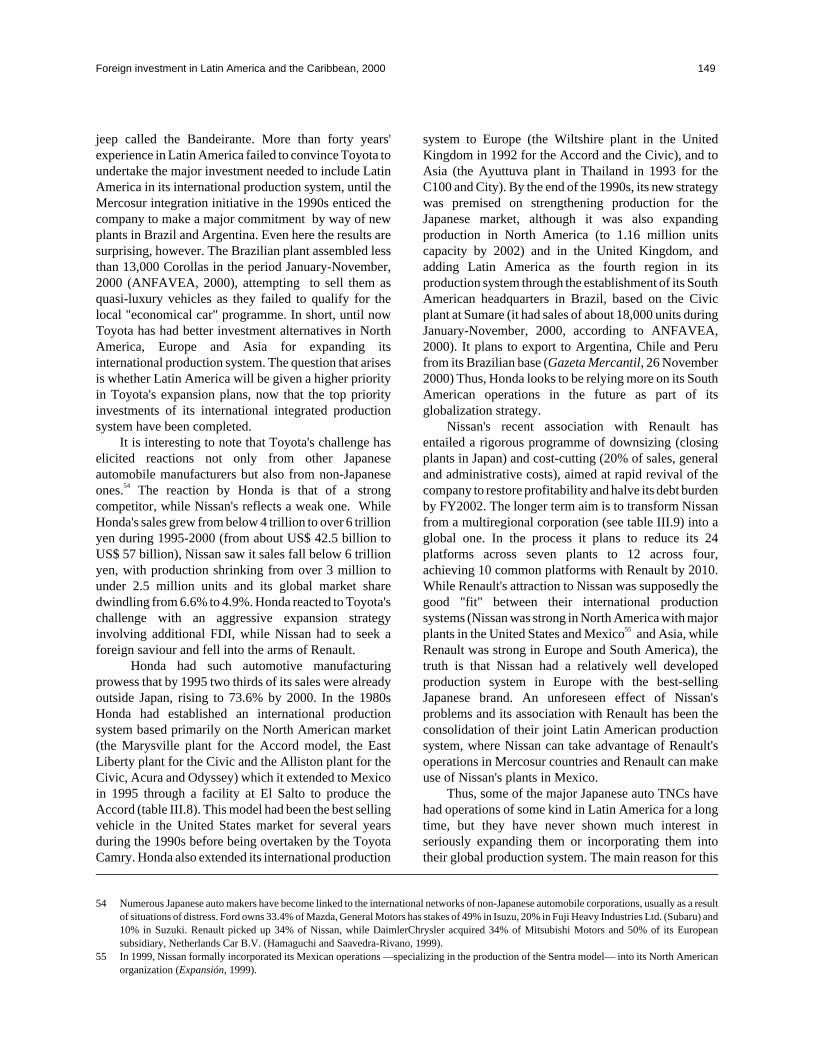
jeep called the Bandeirante. More than forty years'experience in Latin America failed to convince Toyota toundertake the major investment needed to include LatinAmerica in its international production system, until theMercosur integration initiative in the 1990s enticed thecompany to make a major commitment by way of newplants in Brazil and Argentina. Even here the results aresurprising, however. The Brazilian plant assembled lessthan 13,000 Corollas in the period January-November,2000 (ANFAVEA, 2000), attempting to sell them asquasi-luxury vehicles as they failed to qualify for thelocal "economical car" programme. In short, until nowToyota has had better investment alternatives in NorthAmerica, Europe and Asia for expanding itsinternational production system. The question that arisesis whether Latin America will be given a higher priorityin Toyota's expansion plans, now that the top priorityinvestments of its international integrated productionsystem have been completed.
It is interesting to note that Toyota's challenge haselicited reactions not only from other Japaneseautomobile manufacturers but also from non-Japaneseones.54 The reaction by Honda is that of a strongcompetitor, while Nissan's reflects a weak one. WhileHonda's sales grew from below 4 trillion to over 6 trillionyen during 1995-2000 (from about US$ 42.5 billion toUS$ 57 billion), Nissan saw it sales fall below 6 trillionyen, with production shrinking from over 3 million tounder 2.5 million units and its global market sharedwindling from 6.6% to 4.9%. Honda reacted to Toyota'schallenge with an aggressive expansion strategyinvolving additional FDI, while Nissan had to seek aforeign saviour and fell into the arms of Renault.
Honda had such automotive manufacturingprowess that by 1995 two thirds of its sales were alreadyoutside Japan, rising to 73.6% by 2000. In the 1980sHonda had established an international productionsystem based primarily on the North American market(the Marysville plant for the Accord model, the EastLiberty plant for the Civic and the Alliston plant for theCivic, Acura and Odyssey) which it extended to Mexicoin 1995 through a facility at El Salto to produce theAccord (table III.8). This model had been the best sellingvehicle in the United States market for several yearsduring the 1990s before being overtaken by the ToyotaCamry. Honda also extended its international production
system to Europe (the Wiltshire plant in the UnitedKingdom in 1992 for the Accord and the Civic), and toAsia (the Ayuttuva plant in Thailand in 1993 for theC100 and City). By the end of the 1990s, its new strategywas premised on strengthening production for theJapanese market, although it was also expandingproduction in North America (to 1.16 million unitscapacity by 2002) and in the United Kingdom, andadding Latin America as the fourth region in itsproduction system through the establishment of its SouthAmerican headquarters in Brazil, based on the Civicplant at Sumare (it had sales of about 18,000 units duringJanuary-November, 2000, according to ANFAVEA,2000). It plans to export to Argentina, Chile and Perufrom its Brazilian base (Gazeta Mercantil, 26 November2000) Thus, Honda looks to be relying more on its SouthAmerican operations in the future as part of itsglobalization strategy.
Nissan's recent association with Renault hasentailed a rigorous programme of downsizing (closingplants in Japan) and cost-cutting (20% of sales, generaland administrative costs), aimed at rapid revival of thecompany to restore profitability and halve its debt burdenby FY2002. The longer term aim is to transform Nissanfrom a multiregional corporation (see table III.9) into aglobal one. In the process it plans to reduce its 24platforms across seven plants to 12 across four,achieving 10 common platforms with Renault by 2010.While Renault's attraction to Nissan was supposedly thegood "fit" between their international productionsystems (Nissan was strong in North America with majorplants in the United States and Mexico55 and Asia, whileRenault was strong in Europe and South America), thetruth is that Nissan had a relatively well developedproduction system in Europe with the best-sellingJapanese brand. An unforeseen effect of Nissan'sproblems and its association with Renault has been theconsolidation of their joint Latin American productionsystem, where Nissan can take advantage of Renault'soperations in Mercosur countries and Renault can makeuse of Nissan's plants in Mexico.
Thus, some of the major Japanese auto TNCs havehad operations of some kind in Latin America for a longtime, but they have never shown much interest inseriously expanding them or incorporating them intotheir global production system. The main reason for this
Foreign investment in Latin America and the Caribbean, 2000 149
54 Numerous Japanese auto makers have become linked to the international networks of non-Japanese automobile corporations, usually as a resultof situations of distress. Ford owns 33.4% of Mazda, General Motors has stakes of 49% in Isuzu, 20% in Fuji Heavy Industries Ltd. (Subaru) and10% in Suzuki. Renault picked up 34% of Nissan, while DaimlerChrysler acquired 34% of Mitsubishi Motors and 50% of its Europeansubsidiary, Netherlands Car B.V. (Hamaguchi and Saavedra-Rivano, 1999).
55 In 1999, Nissan formally incorporated its Mexican operations —specializing in the production of the Sentra model— into its North Americanorganization (Expansión, 1999).

150 ECLAC
Table III.7TOYOTA's INTERNATIONAL PRODUCTION SYSTEM FOR MOTOR VEHICLES, 1999
Region/country Subsidiary/affiliate Vehicles assembled Production Exports
(1) North America-US New United Motor Manufacturing Corolla, Tacoma 317 129 7 033Inc.-NUMMI (1984)
United States Toyota Motor Manufacturing Avalon, Camry, Sienna 477 527 24 388Kentucky Inc.- TMMK (1988)
Canada Toyota Motor Manufacturing Camry, Solara, Corolla 211 081 167 569Canada Inc.-TMMC (1988)
United States Toyota Motor Manufacturing Tundra 56 164 2 545Indiana Inc.-TMMI (1998)
(2) Asia-Australia Toyota Motor Corp. Australia (1963) Camry, Corolla 91 003 34 668Thailand Toyota Motor Thailand (1964) Camry, Corona, Corolla, 84 606 12 202
Hilux, SolunaMalaysia Assembly Services Sbn. Bhd. (1968) Camry, Corolla, Dyna, Hiace, 13 966 -
Liteace, Hilux, Land Cruiser,TUV
Indonesia PT Toyota-Astra Motor (1970) Camry, Corolla, Crown, Dyna, 26 439 294Land Cruiser, TUV
Bangladesh Aftab Automobiles Ltd. (1982) Land Cruiser 772 -Taiwan Kuozui Motors Ltd. (1986) Corona, Tercel, TUV, Hiace 74 910 -Philippines Toyota Motor Philippines Corp. (1989) Camry, Corolla, TUV 18 455 -Pakistan Indus Motor Co. Ltd. (1993) Corolla, Hilux 10 116 -Turkey Toyotasa Toyota-Sabana (1994) Corolla 9 024 -Vietnam Toyota Motors Vietnam Co. (1996) Corolla, Hiace, Camry, TUV 2 301 -
(3) Europe-Portugal Salvador Caetano (1968) Dyna, Hiace, Optimo 6 020 74United Kingdom Toyota Motor Manufacturing Avensis, Corolla 178 571 143 363
United Kingdom Ltd. (1992)France Toyota Motor Manufacturing Yaris Under construction
France (2001)(4) Africa- S. Africa Toyota South Africa Motors (Pty) Camry, Corolla, Dyna, Hiace, 70 379 1 816
(1962) Hilux, Land Cruiser, TUVKenya Associated Vehicle Assemblers Dyna, Hilux, Land Cruiser, 680 -
Ltd. (1977) Hiace(5) Latin America-Brazil Toyota do Brasil S.A. (1959) Bandeirante, Corolla 11 528 646
Venezuela Toyota de Venezuela C. A. (1981) Corolla, Dyna, Land Cruiser 9 795 42Ecuador Manufacturera y Armadurias y Stout 655 -
Repuestos Ecuatorianos (1986)Colombia Soc. de Fabricación de Automo- Land Cruiser, Hilux 3 903 1 057
tores S.A. (1992)Argentina Toyota Argentina S.A. (1997) Hilux 13 218 4 543
Source: Toyota Motor Company.
Table III.8HONDA's INTERNATIONAL PRODUCTION SYSTEM FOR MOTOR VEHICLES, 1999
Region/country Subsidiary/affiliateVehicles
Production Employeesassembled
(1) N. America-U.S. Honda of America Mfg. Inc. Marysville, Ohio plant (1979) Accord n.a. 7 815U.S. East Liberty plant (1989) Civic n.a. 2 788Canada Honda Canada Inc. Alliston, Ontario plant (1986) Civic, Acura, Odyssey n.a. 3 946Mexico Honda de Mexico S.A. de C.V. El Salto plant (1995) Accord n.a. 1 208
(2) Asia-Thailand Honda Cars Mfg. (Thailand) Co. Ltd. Ayuttuya C100, City n.a. 1 338plant (1993)
Pakistan Honda Atlas Cars (Pakistan) Ltd. Lahore plant (1993) n.a. 238India Honda Siel Cars India Ltd. Gantanbudh plant (1997) n.a. 805
(3) Europe-U.K. Honda of the U.K. Mfg. Ltd. Wiltshire plant (1992) Accord, Civic n.a. 3 114(4) L. America-Brazil Honda Automotores do Sumare plant (1997) Civic n.a. 758
Brasil Ltda.
Source: Honda Motor Co.

is that they had better investment opportunities in whatthey saw as the more important markets of NorthAmerica, Asia and Europe. In Latin America, Mexicanoperations tend to be efficiency-seeking onesincorporated into the North American system, asopposed to the national market-seeking operations inMercosur (Mortimore, 1998a and b). Recently, Japaneseauto TNCs have been showing more interest in LatinAmerica with a view to establishing a new regionalsystem in South America (Honda); consolidating theirrelatively limited Mercosur subregional productionsystems (Toyota directly, Nissan through its newassociate, Renault); or further integrating their Mexicanoperations into the North America production system(Honda and Nissan).56
In sum, the Japanese automotive industry is a majorcontributor to the official statistics on outward FDI, with
Toyota and two other Japanese auto TNCs (Honda andNissan) particularly active in the 1990s. These companieshave followed somewhat different corporate strategies,however, while sharing the characteristic of establishinginternationally integrated production systems to servetheir primary markets (North America, Europe and Asia).Latin America did not play a significant role in thoseinvestments, and the internationally integrated productionsystems do not include any Latin American countries,aside from Mexico, and even then only in a relativelyminor way. Japan's automobile manufacturers haveconcentrated FDI in their priority markets, and LatinAmerica has not been among them. FDI by Japanese autoTNCs in Mercosur is a recent phenomenon, which hasbeen plagued with problems because of continuallychanging rules and the irregular performance of theindustry.
Foreign investment in Latin America and the Caribbean, 2000 151
Table III.9NISSAN's INTERNATIONAL PRODUCTION SYSTEM FOR MOTOR VEHICLES, 1999
Region/country Subsidiary/affiliate Vehicles assembled Production Employees
(1) North America- Nissan Motor Mfg. Corp. USAa (1959) Frontier, Xterra, Altima 348 214 5 771U.S.Mexico Nissan Mexicana SA de CVa Mexico D.F. (1966) Sentra, Lucino, Pickup, AD Wagon 216 140 9 080
(2) Asia- Taiwan Yulon Motor Co. Ltd, (1959) Sentra, Jin Yong, AD Resort n.a. 2 600Thailand Siam Motors & Nissan Co. Ltd. (1962) Sentra, AD Resort n.a. 321Philippines Universal Motors Corp. Manila (1972) Pathfinder, Patrol, Terrano, Caravan n.a. 156Malaysia Tan Chsong Motor Assemblies K. Lumpur (1976) Sentra, AD Resort, Vanette, Terrano n.a. 790
Sdn. Bhd.Thailand Siam Nissan Automobile (1977) Datsun (Big M) n.a. 1 196
Co. Ltd.a
Philippines Nissan Motor Philippines Inc. Santa Rosa (1983) Cefiro, Sentra, AD Resort, Ad Max, n.a. 531Vanette
Iran S.A.I.P.A. Co. Tehran (1983) Junior n.a. 3 000Iran Pars Khodro Co. Tehran (1987) Patrol n.a. 2 325China Zhengzhan Nissan Zhengzhan (1995) Datsun (Pi Ka) n.a. 2 400
Automobile Co. Ltd.Indonesia PT Ismac Nissan Mfg. West Java (1996) Cedric, Cefiro, Sentra, Terrano n.a. -Pakistan Ghaodhara Nissan Ltd. Lahore (1997) Sentra n.a. 165
(3) Europe- Spain Nissan Motor Ibérica SAa Barcelona (1983) Patrol, Terrano II, Vanette 105 245 3 900United Kingdom Nissan Motor Mfg. (UK) Ltd.a Sunderland (1986) Primera, Almera, March 288 865 4 200Spain Nissan Vehiculos Ind. S.A. Avila (1995) Trade, Cabster E, Altson, trucks n.a. 800
4) Africa- S. Africa Nissan South Africa (Pty) Ltd.a Pretoria (1963) Sentra, Sunny Truck, Datsun n.a. 3 395Egypt Nissan Egypt S.A.E. Six October (1977) Datsun n.a. 500Kenya Kenya Vehicle Manufacturers Thilea (1978) Caravan n.a. 400
Ltd.Zimbabwe Willowdale Mazda Motor Harare (1999) Datsun n.a. 740
Ind. Ltd.
Source: Nissan Motor Co.a
Indicates a major subsidiary as designated by Nissan.
56 Part of the impact of the Japanese auto industry in Latin America occurs indirectly. Mazda designed the legendary Ford plant at Hermosilla,Mexico. Nissan is to start production in Brazil using Renault’s infrastructure, while GM plans to bring Suzuki into some of its plants in the region,as it did with Isuzu. Nonetheless, this tends to occur at the request of their western associates, rather than on the independent initiative of theJapanese producers.
C. THE JAPANESE CONSUMER ELECTRONICS INDUSTRY: SONY ANDMATSUSHITA ELECTRIC INDUSTRIAL
In In 1970-1985 Japanese electronics firms challengedthe global electronics industry in a similar way to theircounterparts in the automotive industry. The spearheadof that challenge targeted the consumer electronicssector, but it also embraced semiconductors, computersand telecommunications equipment. One differencefrom the automotive industry, however, was that by themid-1990s the once formidable Japanese corporations-at least in the semiconductor and computer fields-seemed disorganized, dismayed and decidedly on thedefensive (Borrus, 1997, p. 2), with the major consumerelectronics firms reeling from the impact of the recessionin Japan. The previous recipe for success among Japan'selectronics firms, based on aggressive manufacturinginnovation and incremental product improvements, nolonger seemed sufficient for the new or renewedcompetition they now faced. By comparison, theconsumer electronics firms appear to have reacted in amore aggressive and ultimately more successful manner.
The electronics industry was at the forefront of theglobalization process in terms of its reliance oninternationally integrated production systems to feedinternational markets. Many electronics products hadbecome "high-tech commodities" combining thecharacteristics of mass production with extremely shortproduct cycles and periodic trajectory-disruptinginnovations (Ernst, 1997a, p. 6). Heightened competitionobliged producers to intensify specialization in theirinternationally integrated production systems, movingfrom partial to systemic organization; and it was here thatsome of the leading Japanese electronics manufacturersstumbled, while their competitors, old (from the UnitedStates) and new (from Asia), forged ahead.
This can be clearly seen in the production, exportand import figures for the Japanese electronics industry(figure III.6). For much of the 1990s production was flatand the rate of growth of imports (but not their level) wasgreater than that of exports. In the consumer electronicssegment (figure III.7) the competitive situation was moredifficult, since production and exports both fell steeplyduring the 1990s, while imports crept up. Lastly, in thecase of colour TVs (CTVs) � the spearhead of Japan'ssuccessful conquest of international markets (figuresIII.8 and III.9)� the 1990s saw rapid growth in overseasproduction (rising from 20 to 38 million units)accompanied by a slump in domestic production from13.2 to 3.5 million units. Furthermore, while the value ofexports plummeted from ¥ 207.1 to ¥ 112.6 billion, CTV
imports into Japan skyrocketed from ¥ 22.7 billion to¥ 152.9 billion. Clearly, a huge internationalizationeffort was in progress, and CTV imports overtookexports in 1996.
These industries are highly concentrated; in 1990the five largest companies held the following marketshares in domestic shipments: 63% in the case of colourTVs, 76% in the case of video cassette recorders (VCRs)and 88% in the camcorder segment (Ostry and Harianto,1995, p.13, note 2, quoting Hsu). The experiences of twocompanies � Sony and Matsushita Electric Industrial(hereinafter, Matsushita)— very much capture not onlythe essence of the changing competitive situation amongthe leading Japanese consumer electronics firms,especially as regards colour television sets, but also therole of FDI in establishing their internationallyintegrated production systems. Between 1990 and 1998,Sony —the more internationalized of the two— slippedfrom 15th to 20th and Matsushita —the more domesticmarket-oriented— slumped from 12th to 55th in theglobal ranking of corporations by foreign assets (tableIII.4). Matsushita was 24th and Sony the 30th largestcompany in the world by sales in 1999, and they tookthird (Matsushita) and fourth (Sony) place in revenueterms, behind Siemens and Hitachi but ahead of Toshibaand NEC in the Fortune Global 500 ranking ofelectronics and electrical equipment companies(http://www.fortune.com/fortune/global500/indsnap/).Meanwhile, AsiaWeek (http://asiaweek/asia1000/listing/) placed Matsushita tenth among the 1,000 largestAsian companies and first in Asia in the appliancessegment (http://asiaweek/asia1000/listing/), rankingSony 11th overall and first in Asia in the consumerelectronics segment. In short, these companies wereprominent in the global consumer electronics landscapeand among the leading players in the colour TVsegment.
Sony develops, designs, manufactures and sellsvarious kinds of electronic equipment, instruments anddevices for the consumer and professional markets. Ithad revenues of over US$ 60 billion in 1999 and a globalworkforce of about 190,000. The company has recentlybeen reorganized into five main subsidiaries: SonyComputer Entertainment, Sony Music EntertainmentInc., Sony Music Entertainment Japan Inc., SonyPictures Entertainment and Sony Life Insurance Co. Ltd.For several decades it enjoyed continuous success basedon innovation in the consumer electronics field
152 ECLAC
—transistor radios (1955), the Trinitron TV (1968), theWalkman personal stereo (1979) magnetic recordingtape (1979), the compact disc player (1982), the floppydisc (1983), the HandyCam camcorder (1985) thePlayStation (1994), the DVD player (1997) and theMemory Stick (1998)— but it ran into trouble when itentered the motion picture industry by purchasingColumbia Pictures (it wrote off about US$ 3 billion in1995), and its audio-video lead was eroded by itscompetitors during the 1990s. Currently, its PlayStationand PlayStation2 products are generating really solidgrowth (the latter sold 2 million units in three monthsfollowing its launch in Japan), as is the new FD TrinitronWega digital TV that has been selling well in Japan andthe United States. Nonetheless, Sony is staking its futureon the success of its multimedia approach toentertainment —in other words, the combination ofhardware, applications and content in a digital format.Despite the company's reorganization to put the
emphasis on "entertainment", 50% of its total assets and65% of its sales in 1999 were still in the electronics field.As part of the reorganization process, Sony announced astringent downsizing programme to cut staffing by 10%and reduce the number of plants from 70 to 55 by 2003, toenable it to compete more strongly.
Matsushita Electric Industrial produces electronicand electrical products usually marketed under thePanasonic, National, and Technics brand names (somesubsidiaries use the Quasar, Victor and JVC brands).Total revenues exceeded US$ 65 billion in 1999 and itemployed a global workforce of around 265,000. Thegroup consists of over 220 companies distributed across44 countries: five regional headquarters, 43manufacturing/sales companies, 98 manufacturingcompanies, 46 sales companies, 12 researchorganizations and five financial subsidiaries. Thesecover 16 business clusters and are organized into threemajor divisions as follows: Consumer Products (video
Foreign investment in Latin America and the Caribbean, 2000 153
Figure III.6JAPAN: PRODUCTION, EXPORTS AND IMPORTS OF ELECTRONICS, 1950-2000
Source: Electronics Industries Association of Japan (EIAJ), EIAJ Half-Centennial: A Look at 50 Years of the JapaneseElectronics Industry, Gravitas, Inc., Tokyo, May 1998. Updated with data from http://www.eiaj.or.jp/english/index.htm. Since November 2000 this website has belonged to the new Japanese Electronics andInformation Technology Industries Association (JEITA).
0
5
10
15
20
25
30
1950
1953
1956
1959
1962
1965
1968
1971
1974
1977
1980
1983
1986
1989
1992
1995
1998
Tri
llio
ns
of
ye
n
Production Exports Imports

154 ECLAC
Figure III.7JAPAN: PRODUCTION, EXPORTS AND IMPORTS OF CONSUMER ELECTRONICS
EQUIPMENT, 1950-2000
Source: Electronics Industries Association of Japan (EIAJ), EIAJ Half-Centennial: A Look at 50 Years of the Japanese ElectronicsIndustry, Gravitas, Inc., Tokyo, May 1998. Updated with data from http://www.eiaj.or.jp/english/index.htm . Since November2000 this website has belonged to the new Japanese Electronics and Information Technology Industries Association (JEITA).
Figure III.8JAPAN: DOMESTIC AND OVERSEAS PRODUCTION OF COLOUR TVs, 1990-1999
Source: Electronics Industries Association of Japan (EIAJ), EIAJ Half-Centennial: A Look at 50 Years of the Japanese Electronics Industry,Gravitas, Inc., Tokyo, May 1998. Updated with data from http://www.eiaj.or.jp/english/index.htm . Since November 2000 this websitehas belonged to the new Japanese Electronics and Information Technology Industries Association (JEITA).
0
10
20
30
40
50
1990 1991 1992 1993 1994 1995 1996 1997 1998 1999
Mill
ion
so
fu
nits
Domestic Overseas
0
0.5
1
1.5
2
2.5
3
3.5
4
4.5
5
1950
1952
1954
1956
1958
1960
1962
1964
1966
1968
1970
1972
1974
1976
1978
1980
1982
1984
1986
1988
1990
1992
1994
1996
1998
2000
Tri
llio
ns
of
ye
n
Production Exports Imports
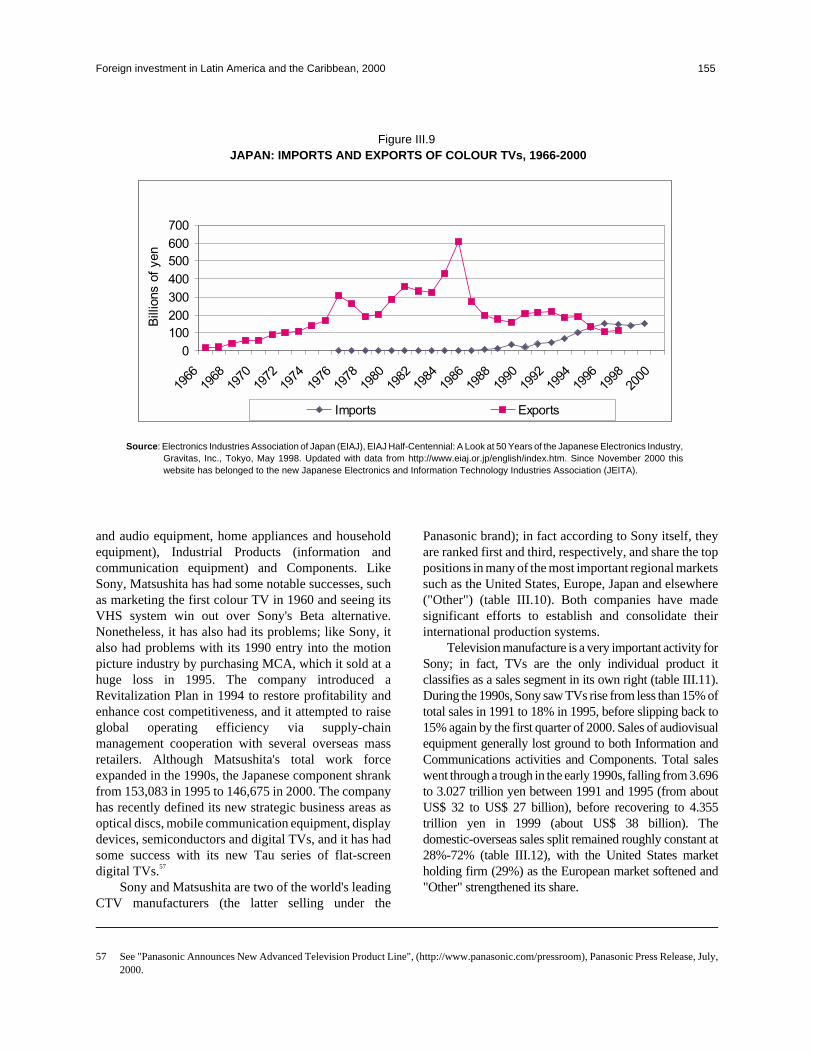
and audio equipment, home appliances and householdequipment), Industrial Products (information andcommunication equipment) and Components. LikeSony, Matsushita has had some notable successes, suchas marketing the first colour TV in 1960 and seeing itsVHS system win out over Sony's Beta alternative.Nonetheless, it has also had its problems; like Sony, italso had problems with its 1990 entry into the motionpicture industry by purchasing MCA, which it sold at ahuge loss in 1995. The company introduced aRevitalization Plan in 1994 to restore profitability andenhance cost competitiveness, and it attempted to raiseglobal operating efficiency via supply-chainmanagement cooperation with several overseas massretailers. Although Matsushita's total work forceexpanded in the 1990s, the Japanese component shrankfrom 153,083 in 1995 to 146,675 in 2000. The companyhas recently defined its new strategic business areas asoptical discs, mobile communication equipment, displaydevices, semiconductors and digital TVs, and it has hadsome success with its new Tau series of flat-screendigital TVs.57
Sony and Matsushita are two of the world's leadingCTV manufacturers (the latter selling under the
Panasonic brand); in fact according to Sony itself, theyare ranked first and third, respectively, and share the toppositions in many of the most important regional marketssuch as the United States, Europe, Japan and elsewhere("Other") (table III.10). Both companies have madesignificant efforts to establish and consolidate theirinternational production systems.
Television manufacture is a very important activity forSony; in fact, TVs are the only individual product itclassifies as a sales segment in its own right (table III.11).During the 1990s, Sony saw TVs rise from less than 15% oftotal sales in 1991 to 18% in 1995, before slipping back to15% again by the first quarter of 2000. Sales of audiovisualequipment generally lost ground to both Information andCommunications activities and Components. Total saleswent through a trough in the early 1990s, falling from 3.696to 3.027 trillion yen between 1991 and 1995 (from aboutUS$ 32 to US$ 27 billion), before recovering to 4.355trillion yen in 1999 (about US$ 38 billion). Thedomestic-overseas sales split remained roughly constant at28%-72% (table III.12), with the United States marketholding firm (29%) as the European market softened and"Other" strengthened its share.
Foreign investment in Latin America and the Caribbean, 2000 155
Figure III.9JAPAN: IMPORTS AND EXPORTS OF COLOUR TVs, 1966-2000
Source: Electronics Industries Association of Japan (EIAJ), EIAJ Half-Centennial: A Look at 50 Years of the Japanese Electronics Industry,Gravitas, Inc., Tokyo, May 1998. Updated with data from http://www.eiaj.or.jp/english/index.htm. Since November 2000 thiswebsite has belonged to the new Japanese Electronics and Information Technology Industries Association (JEITA).
0
100
200
300
400
500
600
700
1966
1968
1970
1972
1974
1976
1978
1980
1982
1984
1986
1988
1990
1992
1994
1996
1998
2000
Billions
of
yen
Imports Exports
57 See "Panasonic Announces New Advanced Television Product Line", (http://www.panasonic.com/pressroom), Panasonic Press Release, July,2000.
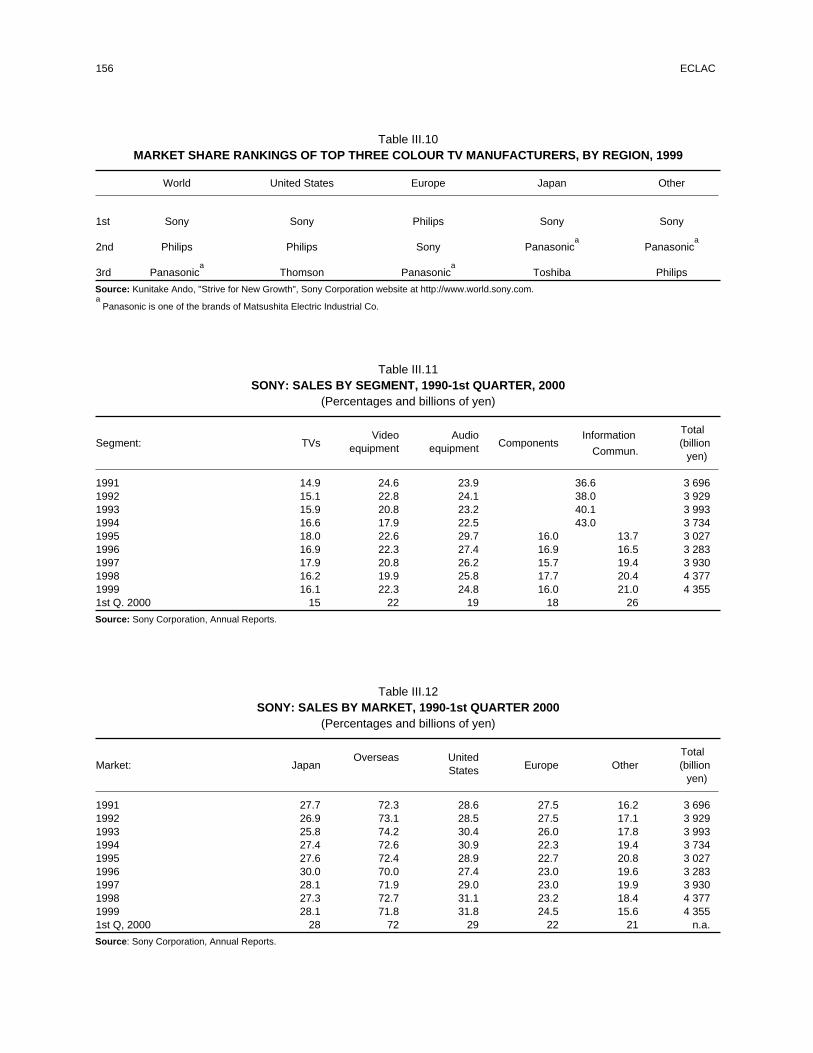
156 ECLAC
Table III.10MARKET SHARE RANKINGS OF TOP THREE COLOUR TV MANUFACTURERS, BY REGION, 1999
World United States Europe Japan Other
1st Sony Sony Philips Sony Sony
2nd Philips Philips Sony Panasonica
Panasonica
3rd Panasonica
Thomson Panasonica
Toshiba Philips
Source: Kunitake Ando, "Strive for New Growth", Sony Corporation website at http://www.world.sony.com.a
Panasonic is one of the brands of Matsushita Electric Industrial Co.
Table III.11SONY: SALES BY SEGMENT, 1990-1st QUARTER, 2000
(Percentages and billions of yen)
Video Audio Information TotalSegment: TVs equipment equipment Components (billion
Commun. yen)
1991 14.9 24.6 23.9 36.6 3 6961992 15.1 22.8 24.1 38.0 3 9291993 15.9 20.8 23.2 40.1 3 9931994 16.6 17.9 22.5 43.0 3 7341995 18.0 22.6 29.7 16.0 13.7 3 0271996 16.9 22.3 27.4 16.9 16.5 3 2831997 17.9 20.8 26.2 15.7 19.4 3 9301998 16.2 19.9 25.8 17.7 20.4 4 3771999 16.1 22.3 24.8 16.0 21.0 4 3551st Q. 2000 15 22 19 18 26
Source: Sony Corporation, Annual Reports.
Table III.12SONY: SALES BY MARKET, 1990-1st QUARTER 2000
(Percentages and billions of yen)
Overseas United TotalMarket: Japan States Europe Other (billion
yen)
1991 27.7 72.3 28.6 27.5 16.2 3 6961992 26.9 73.1 28.5 27.5 17.1 3 9291993 25.8 74.2 30.4 26.0 17.8 3 9931994 27.4 72.6 30.9 22.3 19.4 3 7341995 27.6 72.4 28.9 22.7 20.8 3 0271996 30.0 70.0 27.4 23.0 19.6 3 2831997 28.1 71.9 29.0 23.0 19.9 3 9301998 27.3 72.7 31.1 23.2 18.4 4 3771999 28.1 71.8 31.8 24.5 15.6 4 3551st Q, 2000 28 72 29 22 21 n.a.
Source: Sony Corporation, Annual Reports.
Sony had successfully built fully integrated localmanufacturing systems in Japan, North America, Europeand Asia, ranging from design and materials and partsprocurement to cathode ray tube (CRT) production andthe assembly of finished products such as colour TVs anddisplays. The North American component of Sony'sinternational integrated production system is the mostimportant. Sony entered the United States market in1960, establishing its first major overseas operation inNew York as Sony Corporation of America, which todayhas a work force of just under 26,000. In 1972 it began tomanufacture Triniton TVs in the United States, and overthe next 30 years the company developed a majorelectronics manufacturing base. Overall it has investedabout US$ 3.3 billion in its North American operations,which now account for nearly two-thirds of SonyCorporation of America's US$ 19.1 billion total sales(FY2000).
The North American system is based on two mainmanufacturing nodes: the Sony Manufacturing Center atSan Diego, California, linked to Mexican assemblyoperations in Tijuana; and the Sony Technology Centernear Pittsburgh, Pennsylvania. The San Diego facilityhas been rated as one of top 10 manufacturing plants inthe United States. Overall, Sony has invested over US$ 1billion in its San Diego operations and a further US$ 400million in its Mexican plants. At San Diego it employs4,000 people and has an annual production capacity of 6million colour TVs and CRTs. The San Diego plantsexport the world's most advanced Sony picture tubes toMexico, Brazil, the United Kingdom, China, Malaysiaand Japan. The FD Trinitron Wega HDTV was designed,developed and manufactured in the San Diego/Tijuanaregion. Several operations in Mexico employing a totalof 10,000 people are integrated into the San Diegomanufacturing node: Sony de Tijuana Este (over 3million TV units per year, plus computer displays,components and set-top boxes); Sony de Tijuana Oeste(VCRs, PlayStation, cellular phones); Sony de Mexicali(TVs and components); and Sony Magnético de México(audio tapes, floppy disks and lithium-ion batteries).Sony's other main manufacturing node is the SonyTechnology Center near Pittsburgh, which claims to be"the only television manufacturing facility in the worldcapable of going from sand to glass to cathode ray tube tocompleted television set in one location."58 Over 1million rear projection TVs have been manufacturedthere. By 2000, Sony had United States market shares of10.4% for colour TVs, 9.6% for combos (CTVs withintegrated VCRs) and 27.5% for projection TVs. The
Mexican operations are playing an increasing role in theNorth American manufacturing system.
The second major component of Sony'sinternational production system is in Asia, where 38companies, spread across 15 countries, account for 25%of the company's total production volume. Sony's Asianoperations are a mixture of local market assemblers(China, Vietnam and India) and specialized exportplatforms. In 1962, the company opened regional salesheadquarters in Hong Kong, and its first manufacturingoperation began in Taiwan in 1967. Following that, newregional headquarters were established in Singapore tocoordinate the Asian supply network, and productionfacilities were set up in Korea, Malaysia, Thailand andIndonesia. Nonetheless, the bulk of CTV productiontakes place at the Sony TV Ind. (M) Sdn Bnd operation inMalaysia.
In Europe, Sony established its regional integratedproduction system in evolutionary fashion, firstly settingup Sony Overseas (Switzerland) in 1960 to coordinatesales in Europe. An early attempt to establish amanufacturing base in Ireland in 1962 was unsuccessfuland the plant was closed in 1968. Sony did establish itselfsuccessfully in the United Kingdom, however, andeventually produced more than 10 million TVs andCRTs at its plants in Wales. Its other major TVmanufacturing facility in Europe was established inBarcelona, Spain, where it produced over 3 million units.Although a third TV assembly plant was set up inGermany, the main export operations were carried outfrom the facilities in Wales and Spain. Other specializedoperations were established in France (audio and videocassettes), Austria (optical storage disks, compactdisks), Italy (audio cassettes) and Hungary (VCR, CDplayers).
Apart from its substantial operations in Mexico,which form part of the North American manufacturingcentre, Sony has never had much of a network in LatinAmerica. With a regional headquarters located inMiami, it established a sales and marketing centre inPanama in 1970, and a sales and assembly operation inBrazil in 1972. Its operations in the Manaus industrialzone assembled colour TVs (over 1 million annually),audio equipment, car stereos and plastic molding for thelocal market. The main feature of Sony's operations inLatin America (aside from its Mexican plants), is theuse of free zones to import its products into nationalmarkets (Colon, Panama; Ushuaia, Argentina; Iquique,Chile; Manaus, Brazil; etc.). Sony has shown littleinterest in incorporating Latin America into its
Foreign investment in Latin America and the Caribbean, 2000 157
58 “Sony Technology Center Produces 1 millionth Projection TV”, Sony Engineering and Manufacturing News Release, 13 May 1999.
internationally integrated production system, and itsinvestments in the region are essentially aimed atnational market access.
Matsushita, by contrast, has a more complexinternational system in which four divisional companiesof Matsushita Electric Industrial Co., together with 11 ofits Japanese subsidiaries, have a total of over 220 (listed)foreign subsidiaries employing more than 265,000people in 44 countries. Overall sales declined from 7.45to 6.624 trillion yen (from about US$ 65 to US$ 59billion) in 1992-1994, before recovering to 7.3 trillionyen, or about US$ 69 billion, in 2000. It is difficult toseparate TV production from other activities as it issubsumed under Consumer Products in Matsushita'saccounts, but overall sales by the Consumer ProductsDivision slipped from 44.2% to 41.3% of total sales in1994-2000 (table III.13). The proportion of domestic tooverseas sales stayed roughly constant at 50% during thisperiod (table III.14), with the European marketdisplaying some momentum (rising from 9.6% to 12.4%of total sales). The Americas and Asia remain moreimportant in sales terms, however.
The North American arm of Matsushita'sinternationally integrated production system consists of36 subsidiaries —25 in the United States, nine in Mexicoand one each in Canada and Puerto Rico. It began in 1959with the establishment of Matsushita Electric Corp. ofAmerica, which today is listed as one of Matsushita's top10 subsidiaries worldwide. The company has investedover US$ 1.7 billion in local manufacturing facilitiesemploying 24,000 people (19,500 for Panasonicproducts), which generate sales of US$ 8.1 billion andexports of US$ 366 million (to Europe, Asia and LatinAmerica). Its TV production facilities (with a capacity of3 million units), like Sony's, are concentrated in the SanDiego, California/Tijuana, Mexico area. San Diego ishome to the design and engineering centre, the cathoderay tube plant, and components production. Facilities inTijuana, Mexico are responsible for producing othercomponents (deflection yoke, flyback transformer andtuner) and for final assembly. Production facilitiesoriginally located in Chicago and Toronto were moved tothe San Diego/Tijuana area in the mid-1980s; and there isanother modern CRT plant located in Troy, Ohio.Between 1993 and 2000 Matsushita increased its UnitedStates market shares from 2.3% to 7.3% in colour TVsand from 3.4% to 11.3% in the combo segment; its shareof the United States projection TV market rose to 7.1%.Operations in Mexico form part of its North Americanmanufacturing centre.
The second major element of Matsushita'sinternationally integrated production system is located inAsia, where it possesses "extensive local manufacturing"
and 119 listed subsidiaries: China (41), Malaysia (19),Thailand (14), Singapore (10), Indonesia (10), Taiwan(8), India (8), Philippines (3), Australia (2), Iran (1),United Arab Emirates (1) and New Zealand (1).Matsushita's first foreign plant, National Thai Co. Ltd.,was established in Thailand in 1961. Its TV production iscentred on South East Asia, where it has 30,000employees in Malaysia alone, and China. Of its 10leading foreign subsidiaries, Matsushita lists six in Asia.These include its regional headquarters —AsiaMatsushita Electric (S) Pte. Ltd.— along with two othersubsidiaries in Singapore (Matsushita Electronics (S)Pte. Ltd. and Matsushita Refrigeration Industries (S) Pte.Ltd.), two subsidiaries in Malaysia (MatsushitaTelevision Co. (M) Sdn. Bhd and Matsushita IndustrialCorporation Sdn. Bhd.) and one in Taiwan (MatsushitaElectric Taiwan Co. Ltd.). Its joint-venture CRT plant inChina (Beijing Matsushita Colour CRT Co. Ltd.)increased its exports from 10% of total sales in 1990 toabout 50% in 1998, and now supplies Matsushita'sinternational network in North America, Malaysia,Indonesia, Philippines, Thailand, Australia, Brazil, andeven Japan itself.
The third key element of the company'sinternationally integrated production system is inEurope, where Matsushita employs 13,000 people inproduction and sales, manufacturing locally about 50%of what it sells there. Its first European affiliate wasestablished in Germany in 1962, and it now has 55subsidiaries located mainly in the United Kingdom (15),Germany (14), Belgium (3), Spain (2) and Ireland (2). Its10 leading subsidiaries worldwide include its Europeanregional headquarters (Matsushita Electric Europe Ltd.),together with another subsidiary in the United Kingdom(Matsushita Electric (UK) Ltd.) and one in Spain(Matsushita Electric España). These are also the twomain CTV production bases (a new plant in the CzechRepublic also produces TVs).
In Latin America, where Matsushita Electric doesnot really have a regional system established, regionwidesales amounted to just US$ 1.1 billion in 1998, comparedto US$ 600 million in 1986. Its sales headquarters for theCaribbean and the Andean countries is located inPanama, supported from its Miami office. Thecompany's major manufacturing subsidiaries in Mexicoare incorporated into its North American productionsystem, as is the case with Sony. There are 11subsidiaries in the rest of Latin America, concentratedmainly in Brazil (3) and Peru (2), and their basic purposeis to obtain national market access. These mostlyproduce dry batteries, although colour TVs andcomponents and other products are also produced inBrazil, with some exports to neighbouring countries.
158 ECLAC

None of Matsushita's main worldwide subsidiaries islocated in the region.
Broadly speaking, Sony and Matsushita ElectricIndustrial have quite similar structures, share quitesimilar problems and have followed a broadly similarinternationalization process. Each company faithfullyreflects the three stages of the internationalization ofJapanese electronics corporations. The first phase, up tothe early 1980s, consisted of establishing salessubsidiaries in the leading markets, together withsomewhat reluctant investment in production bases formarkets that restricted imports of finished products fromJapan. This was a "mini-Matsus" system (Ernst, 1997b,p. 4). In general, this was a Japan-centric, relatively
closed system, in which sophisticated products andcomponents were manufactured in Japan, whilelower-end items were assembled for the local market byforeign subsidiaries. Although this system ofstand-alone subsidiaries generated increased sales inmodified wild-flying-geese fashion, the pace oftechnological upgrading in the overseas subsidiaries wasvery slow. In response to a revival of competition fromthe United States and emerging Asian competitors, theJapanese dual production system was intensified ratherthan rationalized, and it eventually lost competitiveness(Borrus, 1997, p. 11).
The boost given to Japan's competitors by the sharpappreciation of the yen led its producers to try to increase
Foreign investment in Latin America and the Caribbean, 2000 159
Table III.13MATSUSHITA ELECTRIC INDUSTRIAL: SALES BY SEGMENT, 1991-2000
(Percentages and billions of yen)
TotalSegment Consumer Industrial Components Entertainment (billion
yen)
1991 n.a. n.a. n.a. n.a.1992 n.a. n.a. n.a. n.a. 7 4501993 n.a. n.a. n.a. n.a.1994 44.2 28.0 19.0 8.8 6 6241995 43.5 28.4 19.3 8.8 6 9481996 46.0 32.9 21.0 - 6 7951997 44.8 35.5 19.7 - 7 6761998 42.6 37.6 19.9 - 7 8911999 43.1 37.5 19.4 - 7 6402000 41.3 37.8 21.0 - 7 300
Source: Matsushita Electric Industrial Corporation, Annual Reports.
Table III.14MATSUSHITA ELECTRIC INDUSTRIAL: SALES BY MARKET, 1991- 2000
(Percentages and billions of yen)
Asia/ TotalMarket Japan Overseas Americas Europe other (billion
yen)
1991 n.a. n.a. n.a. n.a. n.a. n.a.1992 n.a. n.a. n.a. n.a. n.a. n.a.1993 n.a. n.a. n.a. n.a. n.a. n.a.1994 50.8 49.2 n.a. n.a. n.a. 6 6241995 49.2 50.3 23.0 9.6 17.7 6 9481996 54.9 45.1 15.7 10.6 18.8 6 7951997 52.7 47.3 16.3 10.9 20.1 7 6761998 49.3 50.7 18.5 12.0 20.2 7 8911999 49.1 50.9 19.8 13.3 17.8 7 6402000 50.7 49.3 19.0 12.4 18.0 7 300
Source: Matsushita Electric Industrial Corporation, Annual Reports.
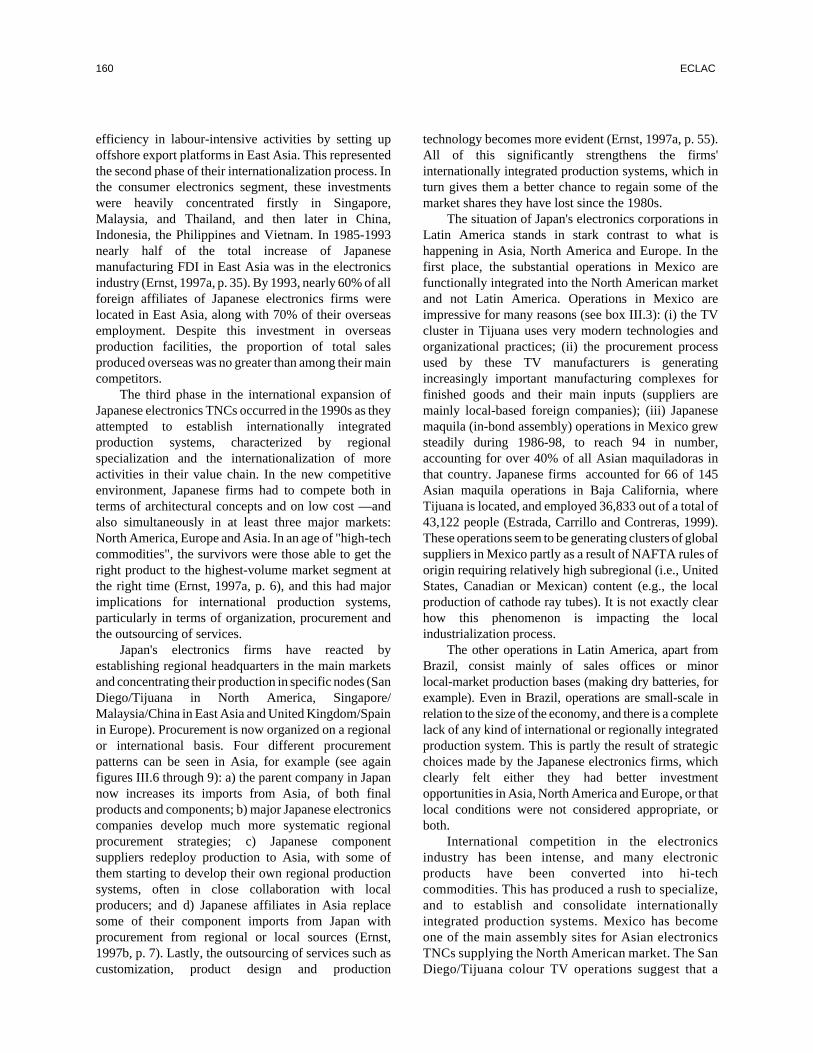
efficiency in labour-intensive activities by setting upoffshore export platforms in East Asia. This representedthe second phase of their internationalization process. Inthe consumer electronics segment, these investmentswere heavily concentrated firstly in Singapore,Malaysia, and Thailand, and then later in China,Indonesia, the Philippines and Vietnam. In 1985-1993nearly half of the total increase of Japanesemanufacturing FDI in East Asia was in the electronicsindustry (Ernst, 1997a, p. 35). By 1993, nearly 60% of allforeign affiliates of Japanese electronics firms werelocated in East Asia, along with 70% of their overseasemployment. Despite this investment in overseasproduction facilities, the proportion of total salesproduced overseas was no greater than among their maincompetitors.
The third phase in the international expansion ofJapanese electronics TNCs occurred in the 1990s as theyattempted to establish internationally integratedproduction systems, characterized by regionalspecialization and the internationalization of moreactivities in their value chain. In the new competitiveenvironment, Japanese firms had to compete both interms of architectural concepts and on low cost —andalso simultaneously in at least three major markets:North America, Europe and Asia. In an age of "high-techcommodities", the survivors were those able to get theright product to the highest-volume market segment atthe right time (Ernst, 1997a, p. 6), and this had majorimplications for international production systems,particularly in terms of organization, procurement andthe outsourcing of services.
Japan's electronics firms have reacted byestablishing regional headquarters in the main marketsand concentrating their production in specific nodes (SanDiego/Tijuana in North America, Singapore/Malaysia/China in East Asia and United Kingdom/Spainin Europe). Procurement is now organized on a regionalor international basis. Four different procurementpatterns can be seen in Asia, for example (see againfigures III.6 through 9): a) the parent company in Japannow increases its imports from Asia, of both finalproducts and components; b) major Japanese electronicscompanies develop much more systematic regionalprocurement strategies; c) Japanese componentsuppliers redeploy production to Asia, with some ofthem starting to develop their own regional productionsystems, often in close collaboration with localproducers; and d) Japanese affiliates in Asia replacesome of their component imports from Japan withprocurement from regional or local sources (Ernst,1997b, p. 7). Lastly, the outsourcing of services such ascustomization, product design and production
technology becomes more evident (Ernst, 1997a, p. 55).All of this significantly strengthens the firms'internationally integrated production systems, which inturn gives them a better chance to regain some of themarket shares they have lost since the 1980s.
The situation of Japan's electronics corporations inLatin America stands in stark contrast to what ishappening in Asia, North America and Europe. In thefirst place, the substantial operations in Mexico arefunctionally integrated into the North American marketand not Latin America. Operations in Mexico areimpressive for many reasons (see box III.3): (i) the TVcluster in Tijuana uses very modern technologies andorganizational practices; (ii) the procurement processused by these TV manufacturers is generatingincreasingly important manufacturing complexes forfinished goods and their main inputs (suppliers aremainly local-based foreign companies); (iii) Japanesemaquila (in-bond assembly) operations in Mexico grewsteadily during 1986-98, to reach 94 in number,accounting for over 40% of all Asian maquiladoras inthat country. Japanese firms accounted for 66 of 145Asian maquila operations in Baja California, whereTijuana is located, and employed 36,833 out of a total of43,122 people (Estrada, Carrillo and Contreras, 1999).These operations seem to be generating clusters of globalsuppliers in Mexico partly as a result of NAFTA rules oforigin requiring relatively high subregional (i.e., UnitedStates, Canadian or Mexican) content (e.g., the localproduction of cathode ray tubes). It is not exactly clearhow this phenomenon is impacting the localindustrialization process.
The other operations in Latin America, apart fromBrazil, consist mainly of sales offices or minorlocal-market production bases (making dry batteries, forexample). Even in Brazil, operations are small-scale inrelation to the size of the economy, and there is a completelack of any kind of international or regionally integratedproduction system. This is partly the result of strategicchoices made by the Japanese electronics firms, whichclearly felt either they had better investmentopportunities in Asia, North America and Europe, or thatlocal conditions were not considered appropriate, orboth.
International competition in the electronicsindustry has been intense, and many electronicproducts have been converted into hi-techcommodities. This has produced a rush to specialize,and to establish and consolidate internationallyintegrated production systems. Mexico has becomeone of the main assembly sites for Asian electronicsTNCs supplying the North American market. The SanDiego/Tijuana colour TV operations suggest that a
160 ECLAC
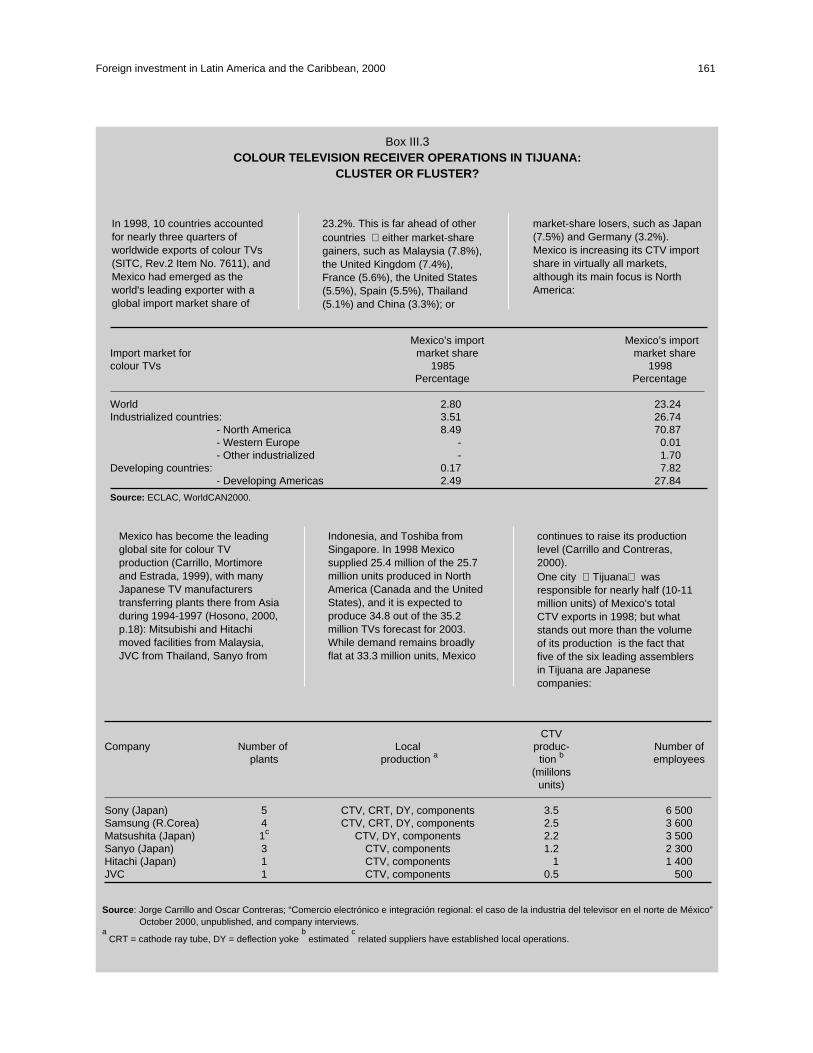
Foreign investment in Latin America and the Caribbean, 2000 161
In 1998, 10 countries accountedfor nearly three quarters ofworldwide exports of colour TVs(SITC, Rev.2 Item No. 7611), andMexico had emerged as theworld's leading exporter with aglobal import market share of
23.2%. This is far ahead of othercountries � either market-sharegainers, such as Malaysia (7.8%),the United Kingdom (7.4%),France (5.6%), the United States(5.5%), Spain (5.5%), Thailand(5.1%) and China (3.3%); or
market-share losers, such as Japan(7.5%) and Germany (3.2%).Mexico is increasing its CTV importshare in virtually all markets,although its main focus is NorthAmerica:
Mexico’s import Mexico’s importImport market for market share market sharecolour TVs 1985 1998
Percentage Percentage
World 2.80 23.24Industrialized countries: 3.51 26.74
- North America 8.49 70.87- Western Europe - 0.01- Other industrialized - 1.70
Developing countries: 0.17 7.82- Developing Americas 2.49 27.84
Source: ECLAC, WorldCAN2000.
Mexico has become the leadingglobal site for colour TVproduction (Carrillo, Mortimoreand Estrada, 1999), with manyJapanese TV manufacturerstransferring plants there from Asiaduring 1994-1997 (Hosono, 2000,p.18): Mitsubishi and Hitachimoved facilities from Malaysia,JVC from Thailand, Sanyo from
Indonesia, and Toshiba fromSingapore. In 1998 Mexicosupplied 25.4 million of the 25.7million units produced in NorthAmerica (Canada and the UnitedStates), and it is expected toproduce 34.8 out of the 35.2million TVs forecast for 2003.While demand remains broadlyflat at 33.3 million units, Mexico
continues to raise its productionlevel (Carrillo and Contreras,2000).One city � Tijuana� wasresponsible for nearly half (10-11million units) of Mexico's totalCTV exports in 1998; but whatstands out more than the volumeof its production is the fact thatfive of the six leading assemblersin Tijuana are Japanesecompanies:
CTVCompany Number of Local produc- Number of
plants production a tion b employees(mililons
units)
Sony (Japan) 5 CTV, CRT, DY, components 3.5 6 500Samsung (R.Corea) 4 CTV, CRT, DY, components 2.5 3 600Matsushita (Japan) 1c CTV, DY, components 2.2 3 500Sanyo (Japan) 3 CTV, components 1.2 2 300Hitachi (Japan) 1 CTV, components 1 1 400JVC 1 CTV, components 0.5 500
Box III.3COLOUR TELEVISION RECEIVER OPERATIONS IN TIJUANA:
CLUSTER OR FLUSTER?
Source: Jorge Carrillo and Oscar Contreras; “Comercio electrónico e integración regional: el caso de la industria del televisor en el norte de México”October 2000, unpublished, and company interviews.
aCRT = cathode ray tube, DY = deflection yoke
bestimated
crelated suppliers have established local operations.

new kind of manufacturing centre in the context ofNAFTA is replacing the existing export platform,based on the simple assembly of imported inputs underproduction sharing (United States) and maquila
(Mexico) policies. Operations in the rest of LatinAmerica are either sales outlets or relativelynon-competitive assembly operations, usually aimedsolely at supplying the national market.
D. BEYOND TRADING: MITSUBISHI CORPORATION
The Mitsubishi Corporation is an outstanding exampleamong Japanese trading companies, and is still thelargest in terms of foreign assets (table III.4), despitedropping from 18th to 24th place in the world rankingduring the 1990s. Traditionally, Japanese tradingcompanies operated as members of corporate groups thatundertook a wide variety of interrelated tasks—especially import-export activities— and werecharacterized by group coordination, and evencross-shareholding. They have been key elements inJapan's entry into (and increasing presence in) theinternational economy over the last 125 years. As alatecomer to international trade, Japan did not possessglobal companies that could act as "majors" in the mosttraded items; trading companies arose to meet the needfor a Japanese presence in the international market and to
resolve problems associated with languages, cultures,contacts and procedures. They imported much-neededraw materials, and their national distribution systemsgave them a major influence over what was brought intoJapan. They began mostly to export manufactures, andtheir global sales system became useful for helping smallJapanese manufacturers reach foreign customers.
Mitsubishi claims that it has not been a tradingcompany since at least 1996 (President's Message,Annual Report, 1996, p. 4), but in a formal sense this hasbeen the case since the end of World War II when AlliedForces obliged the dominant existing zaibatsu to bebroken up into separate entities. The companies thatcarry the Mitsubishi name or operate within the orbit ofthe Mitsubishi Group today are listed below(http://www.micus.com/docs/other):
162 ECLAC
While these production and tradedata suggest that CTV activity inTijuana is evolving from an exportplatform into more of an integratedmanufacturing centre, seriouscomplaints have also been voiced.The Japanese MaquilaAssociation, which represents 70Japanese firms with total sales ofUS$ 11 billion and 57,000employees in Mexico, is quitepessimistic about Tijuana'scompetitive future (MasafumaMatsunaga, "Presentation to 21stConvention of CANIETI", October,2000). It complains that Mexico'snew income tax regime will push
up production costs, thatincentives in Mexico are worsethan in most other globalproduction sites, and that thecountry's wage levels are pricing itout of the market. The minimummonthly wage in Mexico isUS$ 123.50, compared to US$90.60 in China and just US$ 32.30in Indonesia. Moreover,comparative production costs(Mexico = 100) are stated to be 93in China and 91 in Indonesia fortuners, and 79 in Indonesia in thecase of flyback transformers.From the producers' viewpoint,this suggests that Mexico is
becoming steadily less competitive.In addition, the local academiccommunity questions the impactthat maquila operations have on thelocal industrialization process,given that value-added in Mexico,wages notwithstanding, remainsvery small. It also believes the CTVindustry is taking too long to laydown local roots. There is a markedcontrast between the evidentsuccess of these operations asmeasured by past internationalcompetitiveness (i.e., import marketshares) and the opinions of thesetwo interested parties, each ofwhich points to serious but distinctshortcomings.
Box III.3 (concluded)
Asahi Glass Co. Ltd.The Bank of Tokyo-MitsubishiDai Nippon Toryo Co. Ltd.DC Card Co. Ltd.Kirin BeerMeiji Life Insurance CompanyMitsubishi Aluminum Co. Ltd.Mitsubishi Auto Credit-Lease CorporationMitsubishi Cable Industries, Ltd.Mitsubishi Chemical CorporationMitsubishi Construction Co., Ltd.Mitsubishi CorporationMitsubishi Electric CorporationMitsubishi Estate Co. Ltd.Mitsubishi Gas Chemical Company, Inc.Mitsubishi Heavy Industries, Ltd.Mitsubishi Kakoki Kaisha, Ltd.Mitsubishi Liquefied Petroleum Gas Co., Ltd.Mitsubishi Logistics CorporationMitsubishi Materials CorporationMitsubishi Nuclear Fuel Co., Ltd.
Mitsubishi Motors CorporationMitsubishi Office Machinery Co., Ltd.Mitsubishi Oil Co., Ltd.Mitsubishi Ore Transport Co., Ltd.Mitsubishi Paper Mills LimitedMitsubishi Petroleum Dev't Co., Ltd.Mitsubishi Plastics, Inc.Mitsubishi Precision Co., Ltd.Mitsubishi Rayon Co., Ltd.Mitsubishi Research Institute, Inc.Mitsubishi Shindoh Co., Ltd.Mitsubishi Space Software Co., Ltd.Mitsubishi Steel Mfg. Co. Ltd.The Mitsubishi Trust and Banking Corp.Nikon CorporationToyo Engineering Works, Ltd.Nippon Yusen Kabushiki KaishaShin Caterpillar Mitsubishi Ltd.The Tokio Marine & Fire Insurance Co. Ltd.Mitsubishi Heavy Air Conditioning and RefrigerationSystems Corp.
There is no single central holding company, and inprinciple these firms are independently owned andoperated; nonetheless, they still have many commonactivities, involving numerous joint projects, and they doa substantial volume of trade with each other. They alsohave important cross-shareholdings: for example, someof the main shareholders of Mitsubishi Corporation in2000 were group members like: The Tokio Marine andFire Insurance Co. Ltd. (6.11%), Meiji Life InsuranceCo. (5.14%), The Bank of Tokyo-Mitsubishi Ltd., (5%),The Mitsubishi Trust and Banking Corporation (4.7%),Mitsubishi Heavy Industries Ltd. (3.12%), TheMitsubishi Trust and Banking Corp. (Trust Account)(2.18%).
Perhaps the real sense of no longer being a generaltrading company has more to do with the need for changeand renewal in Mitsubishi Corporation than with itsformal structure and functions. Mitsubishi Corporationfell on hard times in the 1990s, mainly because theimport side of its import-export activities were hit hardby the prolonged economic crisis in Japan, and becausethe export side weakened as manufacturers steadily cutout intermediaries and established their owninternationally integrated production systems. Over the1992-2000 period, Mitsubishi Corporation's grosstrading profits went into a secular decline, with totalassets falling from 10.3 to 8.1 trillion yen (from aboutUS$ 81 to US$ 77 billion), and although totalshareholder equity rose from 727.7 to 1,171,6 billion yen(from US$ 6 billion to US$ 11 billion approximately) in1996, it had fallen back to 905.7 billion yen or about US$8.5 billion by 2000. The value of its total tradingtransactions dropped from 15.826 to 13.113 trillion yen(from about US$ 124 to US$ 121 billion) during1998-2000. In its 1996 annual report (p. 3), Mitsubishi
noted that competition had intensified in all its marketsand that it could no longer pursue a 'do everything'strategy. In its 2000 annual report (p. 3), MitsubishiCorporation stated,
"Manufacturers are attempting to deal directlywith customers, bypassing traditional channelsin the New Economy. In some quarters, peopleare of the opinion that the change beingwrought is so fundamental that it threatens thevery existence of intermediaries. Ourexistence."In the face of such difficult times, in 1996
Mitsubishi Corporation attempted to shift more of itsactivities into investments and investment-relatedbusiness. Nonetheless in October 1998 it was deemednecessary to implement a tough new business strategy—MC2000— in order to improve its dismalperformance, and by 2000, Mitsubishi Corporation stillfelt the need to shed its high cost structure and become aleaner, more goal-driven company.
To add insult to injury, some of the moreprominent members of the Mitsubishi Groupconfessed to questionable practices and dangerousproducts, which had the effect of undermining theMitsubishi brand. In August 2000, Mitsubishi Motorsadmitted to covering up customer complaints about itsvehicles for over 20 years (The Economist, 26 August2000, p. 50), and in September 2000 MitsubishiElectric recalled 45,000 defective television sets thatwere liable to catch fire (The Economist, 16 September2000). This appears to lend credence to the view thattrading companies have great difficulty emulatingsuccessful manufacturers.
In terms of its "core" activities, the MitsubishiCorporation's companies,
Foreign investment in Latin America and the Caribbean, 2000 163

"… operate predominantly in a single industrycommonly classified as general tradingcompanies. The companies' general tradingactivities consist principally of performingpurchasing and marketing functions in domesticand international markets, providing direct orindirect financing arrangements for purchasersand suppliers, and organizing and coordinatingindustrial projects primarily in conjunction withpurchasing and marketing activities. In theirgeneral trading activities, the companies deal ina wide variety of raw materials for and productsof the manufacturing, extractive, agriculturaland marine, and service industries." (MitsubishiCorporation, Annual Report 2000)In 1999 measured by sales, Mitsubishi Corporation
was the seventh largest corporation in the world (FortuneGlobal 500), the second largest Japanese and the secondlargest Asian company (Asian Week). By 2000,however, it was apparently no longer an advantage to beeither a general trading company or one of the world'smost diverse enterprises.
According to a statement posted on its own website,Mitsubishi Corporation believes it still has significantcompetitive advantages:
"Mitsubishi has decades of experience doingbusiness around the world, experience that hasmade it more than just a leader in internationaltrade. The company's extensive network andwide-ranging activities give it a decisive edgein gathering the timely, accurate marketinformation vital to success. The company's 7business groups � New Business Initiative, IT& Electronics Business, Fuels, Metals,Machinery, Chemicals and Living Essentials—work closely with clients to develop newbusiness opportunities. Project coordination,sourcing of raw materials, capital investmentsand development of sales channels are just afew of the ways that Mitsubishi Corporationcreate value for business partners, customersand shareholders."Figure III.10 gives an outline of the organizational
structure of Mitsubishi Corporation; a brief descriptionof each element follows.
The New Business Initiative Group represents anattempt to bring Mitsubishi Corporation into the NewEconomy, in this case with e-commerce activities, orwhat Mitsubishi Corporation calls "dot com business".The goal of this business group is to help modernize thecompany and develop new activities. The InformationSystems and Services Group deals with computers,
telecommunications and aerospace, among other things.It operates DIRECTV in Japan and provides satellitebroadcasting services. The Fuels Group works with theleading oil- and gas-producing countries and withmultinational oil conglomerates to ensure stable,long-term energy supplies to customers in Asia andaround the world. The Metals Group participates in allbusiness areas related to the iron and steel industries andnon-ferrous metals. These include natural resourcedevelopment, and the manufacture, marketing anddistribution of metal products. The Machinery Groupengages in a wide array of projects in large-scale powergeneration, chemical and steel plants, shipbuilding,automobiles, construction equipment, industrialmachinery and real-estate development. The ChemicalsGroup has activities ranging from basic and specialtychemicals to novel synthetic fibre materials,petrochemicals and non-organic chemicals andfertilizers. The Living Essentials Group is theconsolidation of the group' food-related, textiles andapparel operations, lumber and paper, and other businessfields.
Mitsubishi Corporation does not possess aninternationally integrated production system similar tothe large manufacturing transnationals, but instead has anetwork of subsidiaries, affiliates and businessinvestments corresponding to each of its BusinessGroups. In its global network as of 1 October, 1999,Mitsubishi Corporation had 72 foreign subsidiaries and82 overseas offices distributed as follows:
At that time, the New Business Group had threefinancial subsidiaries (located in the United States, theNetherlands and the United Kingdom). The IT &Electronics Group had two quite special subsidiaries -anIrish one specializing in aircraft leasing and financing,and a United States subsidiary dealing with ITinvestments. The Fuels Group comprises numerousfirms mainly in the raw materials field: in liquid naturalgas (LNG) (Brunei, Australia, Malaysia), liquidpetroleum gas (LPG) (China-2) and petroleum (HongKong, United States and Singapore). The Metals Group
164 ECLAC
Region Subsidiaries Offices
Asia & Pacific 22 34North & Central America 21 2Europe 14 18South America 10 3Africa 3 13Middle East 2 12Total 72 82
Source: Mitsubishi Corporation (http://www.mitsubishi.co.jp/outline2/en/network.html).
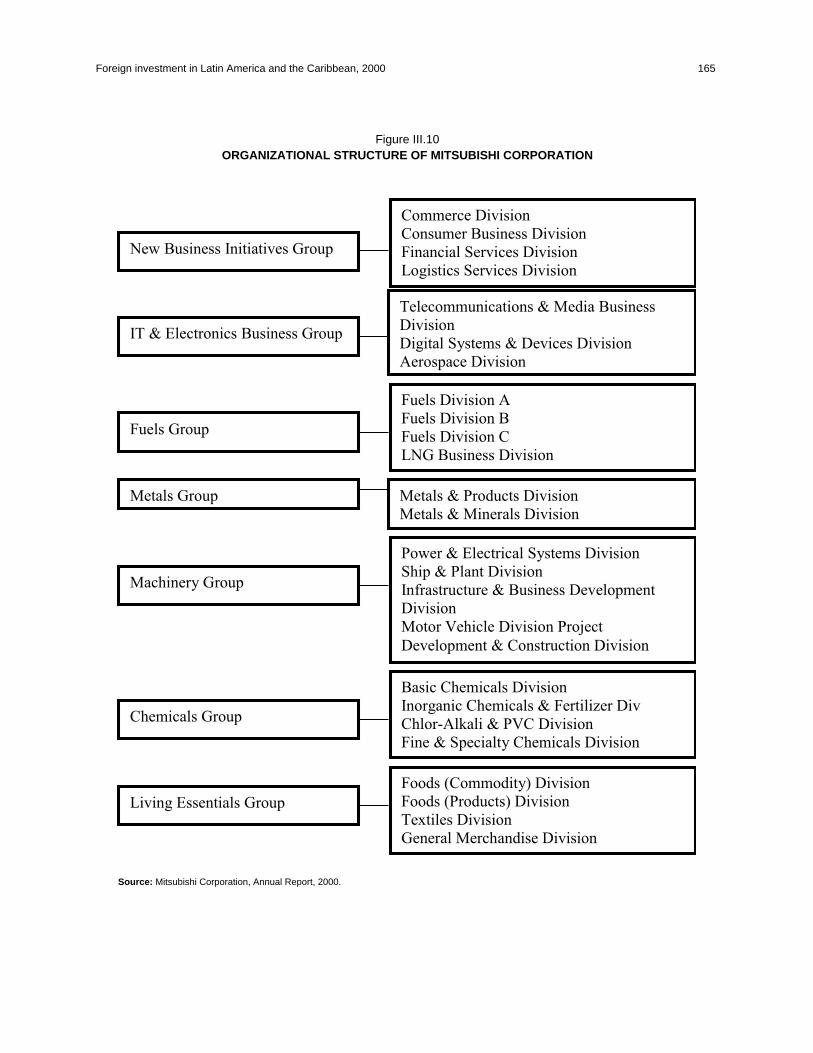
Foreign investment in Latin America and the Caribbean, 2000 165
New Business Initiatives Group
IT & Electronics Business Group
Commerce Division
Consumer Business Division
Financial Services Division
Logistics Services Division
Telecommunications & Media Business
Division
Digital Systems & Devices Division
Aerospace Division
Fuels Group
Metals Group
Fuels Division A
Fuels Division B
Fuels Division C
LNG Business Division
Metals & Products Division
Metals & Minerals Division
Machinery Group
Power & Electrical Systems Division
Ship & Plant Division
Infrastructure & Business Development
Division
Motor Vehicle Division Project
Development & Construction Division
Chemicals Group
Basic Chemicals Division
Inorganic Chemicals & Fertilizer Div
Chlor-Alkali & PVC Division
Fine & Specialty Chemicals Division
Living Essentials Group
Foods (Commodity) Division
Foods (Products) Division
Textiles Division
General Merchandise Division
Figure III.10ORGANIZATIONAL STRUCTURE OF MITSUBISHI CORPORATION
Source: Mitsubishi Corporation, Annual Report, 2000.

consists of a large number of enterprises involved in ironand steel (United States - 4, Canada - 2, China andThailand); copper (United States and Chile), aluminium(Australia - 2); coal (Australia) and metal dealing(United Kingdom). The Machinery Group encompassesnumerous companies in many and varied activities,including automotive-related (Thailand - 2, Philippines,Australia, Portugal, Germany, Indonesia and UnitedKingdom); and elevators (Colombia, South Africa andIndonesia). The Chemicals Group has subsidiaries forpetrochemicals in the United States, food containers inthe United States, solar salt in Mexico, methanol inVenezuela, and fluorochemicals in Italy. Finally, theLiving Essentials Group has subsidiaries for wood pulpin Canada (2), citric acid in Thailand, specialty vegetableoils, pork, cement, and printing and photographicmaterials in the United States, and food wholesaling inthe United Kingdom.
It is extremely difficult to assess the importance of thedifferent subsidiaries and affiliates within thistremendously diverse organizational structure.Nonetheless, the information posted on the MitsubishiCorporation website suggests that MitsubishiInternational Corporation, or MIC (United States),Mitsubishi Corporation (Singapore branch) andMitsubishi (China) are three of the most important foreignentities from an organizational perspective. MIC wasestablished in 1954 in New York, and in 1998 it had salesof US$ 7.2 billion (down from US$ 8.8 billion in 1997)and 650 employees. It engaged in two broad activities:global trading (commodities, consumer and industrialproducts, technology), and dealmaking (investing,financing, matchmaking and marketing, projectmanagement, technology transfer, and mergers andacquisitions). As well as reflecting the organizationalstructure of its parent company, MIC had additionalfunctions, such as running a Representational Office inWashington to liaise with international institutions(World Bank), as well as regional (Inter-AmericanDevelopment Bank) and national ones (US Export-ImportBank), and to oversee the Americas Task Force. This TaskForce brings together regional and sectoral/industrialspecialists with experts in finance, risk management andproject co-ordination in a targeted effort to seek out anddevelop large-scale infrastructural and other projects inLatin America. MIC's activities are an important elementin Mitsubishi Corporation's overall operations, reachingbeyond the North American market itself.
Since the 1970s, co-coordinated visits have beenmade to China by the presidents of numerous MitsubishiGroup companies (including Mitsubishi Corporation,Mitsubishi Heavy Industries, Bank of Mitsubishi,Mitsubishi Material, Mitsubishi Electric Industrial,
Asahi Glass, Mitsubishi Kasei). In 1984 a contract for ascience and technology exchange was signed between 32Mitsubishi Group companies and the Chinese Scienceand Technology Centre; and by September 2000Mitsubishi Corporation had one subsidiary, 14 offices,one investment company, four free trade zoneenterprises and 127 affiliates operating in the country. Ithas 72 affiliates operating in the manufacturing sector:food (14), apparel (11), chemical (13), metals (16),electronics (4), machinery/equipment (7) and other (7).The remainder are involved in logistics/warehousing(10), trading/retail/distribution (18), real estate (40),services (10), finance/insurance (30), and investmentand holding companies (10). Like MIC, the operations inChina are a major element in Mitsubishi Corporation'soverall activities, but unlike MIC they are limited to thehost market.
Mitsubishi Corporation has also taken on a majorcommitment in Singapore, where it has been operatingsince 1955. As well as representing the panoply ofMitsubishi Business Groups, its Singapore arm has alsobeen involved in a large amount of local infrastructuralwork (airport, satellite communications, sewerage,shipping and land transportation). It has also beenheavily involved in regional initiatives, such as industrialparks in Vietnam and China. Lastly, MitsubishiCorporation established subsidiaries in Singapore tocarry out distribution and financial functions (MC TranSingapore Pte. Ltd. and MC Capital Asia Pte Ltd.,respectively). The former provides total logistics andtrading services to its clients, ranging from thedevelopment of infrastructures for transporting rawmaterials to the distribution of finished products,launching JB Distripark and MK Distripark both in Johor(Malaysia) for that purpose. The direct investment thatMC Capital Asia Pte Ltd. undertakes in ASEAN membercountries, represents an important regional initiative byMitsubishi Corporation, not only in the context of theASEAN integration scheme but also further afield.
Latin America is clearly not a priority areacompared to Asia or North America, and in fact,Mitsubishi Corporation's main North Americansubsidiary co-ordinates much of its activities in theregion. The company's organization chart shows that itconsiders North America and Central America(including Mexico) as a single organizational unit. Evenso, Mitsubishi Corporation does have a few importantinterests in Latin America. In Chile, it has a 10% stake(through its JECO subsidiary) in the La Escondidacopper mine owned by BHP and Rio Tinto Zinc, and a15% holding (in association with Mitsubishi Materials)in the Las Pelambres copper mine belonging to the localLuksic group. The first of these is the world's largest
166 ECLAC

copper mine and accounts for more than one third ofChile's copper exports. The second is just starting itsactivities but will eventually become one of the tenlargest copper mines in the world. MitsubishiCorporation also has a 10% stake in the Antaminacopper/zinc mine in Peru, and sells its output to Japanand the rest of Asia. In the petroleum sector, MitsubishiCorporation in association with another Japanese tradingcompany, Itochu, signed a US$ 2.5 billion loanagreement to develop the Barracuda-Caratingadeepwater oil field owned by the Brazilian Statepetroleum company, Petrobras. It has also been involvedin a number of electric power generation projects inMexico, usually on a BOT (Build, Operate and Transfer)or BLT (Build, Lease and Transfer) basis.
Clearly, the kind of subsidiary, affiliate or businessventure that Mitsubishi has in Latin America is nothingcompared to what it possesses in other parts of the worldwhere its business is more concentrated, such as NorthAmerica (MCI) or Asia (China or Singapore, forexample). Although it participates in some important
natural resource projects in Chile, Peru and Brazil, alongwith electric power generation in Mexico, aside fromthese natural resource-seeking activities, MitsubishiCorporation's presence in the region is mainly limited totrading activities, and, like other major Japanese tradingcompanies, its primary interests lie elsewhere.
The foreign direct investment undertaken by thegeneral trading companies has a logic that is completelydifferent from that of the competitive manufacturers. It isbased on import-export operations and the search fornatural resources, rather than the establishment ofinternationally integrated production systems. Despitethese basic differences, FDI undertaken by the generaltrading companies and by the manufacturers shares thefact of being concentrated in their main markets, withlittle of it placed in Latin America. The Business Groupsin the trading company seem to operate independently inthe sense that corporate organization is functional ratherthan geographic. This means that Mitsubishi's FDI inLatin America is the sum of numerous separateinvestment decisions, rather than the execution of acomprehensive corporate strategy for the region.
E. AN INNOVATIVE NEWCOMER: NTT-DOCOMO POSITIONS ITSELF IN THEGLOBAL TELECOMS INDUSTRY
In a world where telephone companies have proved goodat voice communications but not so good at internet, andthe performance of the telecoms industry in general hasbecome more and more disappointing (see chapter IV ofthis report), NTT DoCoMo (hereinafter, simplyDoCoMo) has been the exception. DoCoMo is thelargest wireless telecommunications company in Japanwith 47 subsidiaries and 11 affiliates. Its activitiesinclude: mobile phone services (cellular, packetcommunications, satellite mobile, in-flight telephonesand equipment sales); Personal Handy Phone Services(PHS —a new kind of small, lightweight portabletelephone system particularly suitable for datacommunications which was developed in Japan andoperates like a cordless telephone base unit but with amuch larger transmission range); paging services; and
miscellaneous services such as international dialling.DoCoMo has been described as the "most successful Netphone company anywhere" (Business Week, 16 October2000), and its most successful application, "i-mode"59
could become the "biggest consumer phenomenon sinceSony's Walkman in the 1980s" (Fortune, 18 September2000). Its operating revenues shot up from 1.2 to 3.7trillion yen (from about US$ 12 billion to US$ 35 billion)between March 1996 and March 2000; and the figure forMarch 2001 is expected to come in at 4.6 trillion yen(around US$ 40 billion) (DoCoMo, Annual Reports, and"NTT DoCoMo Inc. First-half results for FY 2000", 14November 2000). Its cellular service subscribers grew innumber from 4.9 to 29.4 million during the same periodand are forecast to reach 35 million by March 2001. Theproportion of i-mode subscribers among all subscribers
Foreign investment in Latin America and the Caribbean, 2000 167
59 According to DoCoMo’s FY2000 Annual Report “i-mode services generally fall into two categories: (1) Communication - With i-mode,subscribers can communicate via conventional voice transmissions as well as e-mail (i-mode mail) using packet transmissions over the internet;and (2) Provision of Information - An i-mode handset is a gateway to the i-mode portal sites offered by partners that have agreements withDoCoMo as well as other non-partner sites designed to be compatible with i-mode. The i-mode recommended sites cover a broad spectrum ofservices covering transactions, information, databases, and entertainment.”
rose from 19.1% in March 2000 to an estimated 57.1% inMarch 2001. Such statistics speak for themselves.
Two other factors make DoCoMo special in thecontext of this report. Firstly, DoCoMo is a somewhatcurious latecomer (1992). The company emerged fromthe deregulation of the non-competitive and defensiveJapanese telecoms industry then dominated by thepartially privatized State telephone company, NipponTelegraph and Telephone (NTT). The latter isDoCoMo's parent company, holding two-thirds of itsshares. DoCoMo is an interesting case because, eventhough it is owned by a defensive and bureaucratic firmmajority-owned by the State (59%), it has managed toretain its dynamism and innovation to stay atop a rapidlychanging industry (The Economist, 15 March 1997; 3July 1999; 13 May 2000; 22 July 2000). In this sense,DoCoMo is really a merger of two companies: atraditional telecom business with heavy investment costsand long payoff periods, and a mobile-media enterprisewhere creativity and speed are of the essence (Fortune,18 September 2000). So far the combination has worked.
DoCoMo possesses clear competitive advantages—especially technological ones, which it is starting touse to establish a global footprint via an integratedinternational expansion policy. Furthermore, DoCoMo'sinternational expansion is backed by chip makers,software houses, systems integrators and Japan'smarketing and advertising industry (The Economist, 15December 2000). As a result, it has become a factor inJapan's foreign direct investment outflows.
DoCoMo's global strategy "Vision 2010" rests onthree characteristics: mobile, wireless and personal. Theessence of the strategy involves enhancing its core voicecommunications business and establishing mobilemultimedia as a second growth point. This entailsdeveloping its person-to-person (voice, e-mail),person-to-machine (net browsing, i-mode) andmachine-to-machine (tele-metering and automatic andremote control) communications. In its own words,DoCoMo's Vision 2010 is based on the following(DoCoMo Annual Reports found athttp://www.nttdocomo.com/ir/operate.html):• For the existing cellular and PHS services, DoCoMo
aims to achieve high levels of consumer satisfactionby maintaining and improving network quality,providing more advanced terminals and handsets, andoffering more attractive rates to customers.
• To respond to the continuously growing demandfor mobile multimedia, DoCoMo will furtherdevelop cellular phone handsets with Internetaccess and e-mail capabilities, and promote othernew services such as music distribution and videodistribution.
• To prepare for the launch of IMT-2000 services slatedfor the end of May 2001, which will be anindispensable part in being able to provide full-scalemobile multimedia in the future, DoCoMo is activelyconstructing the network infrastructure anddeveloping various applications and services that willbe offered on this network. Furthermore, DoCoMocontinues its research and development activities forthe fourth and subsequent generations of mobilecommunications technologies to further advance itsservices.
• To globalize its businesses, DoCoMo will seekopportunities to make investments in overseastelecommunications operators and/or multimedia-related businesses and form alliances with variousplayers in the field, in efforts to facilitate thedissemination of IMT-2000 and the introduction ofmobile media services.
DoCoMo's competitive advantages are manifoldand varied. It is large (with a market capitalization ofaround US$ 280 billion); it is cash-rich, thanks to itshighly profitable i-mode services (DoCoMo, "First HalfResults for FY2000", 14 November 2000); and it canafford a formidable research and investment effortemploying 1,000 R&D staff. According to companypresident, Keiji Tachikawa, "Mobile-voice-communications competition is basically over. When itcomes to coverage, tariff levels, and improved handsets,there is no real differentiation among competitors"(Fortune, 18 September 2000). DoCoMo seems to befocused on larger targets; its shorter-term advantages arecentred on getting benefits out of its i-mode technology,but its longer-term advantages are concerned withdefining future broadband standards.
DoCoMo's extraordinary success at implementingthe i-mode function in the value chain had more to dowith branding, marketing and content than frontiertechnology (Wieland, 2000). While DoCoMo claimsthat the "i" stands for interactive, internet andinformation, "i" in Japanese means love. The i-modeservice filled a void especially in the Japanese marketwhere, unlike North America and Europe, the high-costof fixed-line internet access made mobile phones a morefeasible option (The Economist, 15 December 2000).DoCoMo currently provides access to web sites, mailand internet, but the installation of Java as from 2001 willadditionally enable e-commerce, intranet access, newsand games. Other new services are expected to includemusic and video downloading, making i-mode afavourite among Japanese youth who have so far mainlyused it for paging and sophisticated text messages. Itspopularity derives from its ease of operation (two-digitcodes for messages), price (it is based on packet
168 ECLAC
transmission, rather than an open line) and content (itsHTML format enables linking by voluntary websites,which expanded from 5,052 to 18,259 between Januaryand July 2000). This makes it convenient for majorcomputer, advertising and telecom firms to includei-mode in their repertoire of services. In other words, in atelecommunications world replete with grandiose butunfulfilled schemes for "killer" applications, DoCoMohas designed and implemented an exceedingly practicaland functional service that has swept the Japanesemarket and could do the same internationally.
DoCoMo's broadband lead based on the W-CDMAtechnology alternative is what will probably providelong-term growth for the company (see "W-CDMA—The Technology that Makes Mobile Multimedia aReality" at http://www.nttDoCoMo.com/r_d/cdma.html).The new technology is fast (2MB per secondtransmission speed) and large (it is seen as the leadingcandidate to become a first global standard providing aseamless W-CDMA service network worldwide).DoCoMo was the first telephone company to apply for athird generation (3-G) license in Japan, which it acquiredfree of charge, thereby gaining a huge lead over others inthe field. Japanese competitors (KDDI and J-Phone) willbe hard pressed to match DoCoMo's 1 trillion yen capitalexpenditure programme to cover the entire Japanesemarket by March, 2004. Internationally, competitors inthe United States, for example, are unlikely to catch upfor another 6-8 years. DoCoMo is playing a major role inthe IMT-2000 common standards initiative of theInternational Telecommunication Union, by promotingthe W-CDMA protocol through its Freedom Of MobileMultimedia Access (FOMA) initiative. To consolidateits lead in broadband, DoCoMo has also established anew global strategy based partly on FDI in the operationsof its foreign associates.
DoCoMo's overall strategy is to become a majorplayer in the global cellular/mobile multimedia market,by exploiting its competitive advantages in order toestablish an international system. These advantagesinclude its business expertise in i-mode and otherservices, its superior R&D capabilities, its W-CDMAlead, the leverage its enjoys through its customer base,and its influence over standardization trends, supportedby its strong financial profile and ability to securefunding. The formal goals of its foreign investment areto establish partners in the W-CDMA infrastructure; toexpand operations and services, such as i-mode,worldwide; and to accelerate the mobile multimediarevolution (DoCoMo, FY2000 Report, 2000). Aninteresting aspect of DoCoMo's global strategy,considering the major role that mergers and acquisitionshave played in consolidating the telecoms industry over
the last few years, is that DoCoMo's initiative relies moreon strategic partners than acquiring their competitors.From this perspective, DoCoMo believes it can help itsstrategic partners make efficient investments based onthe transfer of its technology and know-how (therebystrengthening its management base, providing thetechnology and business expertise for i-mode and 3-Gnetworks as well as sharing content and/or applicationson demand) in return for royalties and opportunitiesrelated to access to their customer base (DoCoMo, "NTTDoCoMo. Inc.", September 2000).
DoCoMo's international expansion embraces avariety of elements and shows that the firm is carefullypositioning itself in the mobile/multimedia telecomsindustry. Its strategy includes collaboration in the JIMMforum with eight other major operators. It also hasalliances with Microsoft, Sun Microsystems, Symbian,3Com and America Online (AOL) (DoCoMo,"Partnership between NTT DoCoMo and AmericaOnline, Inc.", 27 September 2000). In addition, it hasventure-capital investments in Japan (Mobile InternetFund), Asia (Java Fund) and the United States (Advent,Century and Ignite); and it has fully-owned regionalsubsidiaries in Brazil (1994) for technology transfer;Europe (1998) for standardization; United States (1999)for research and development; China (2000) fortechnology and information; and a financial subsidiaryin the United Kingdom (2000). It is also establishing anew advisory board for its United States operations(DoCoMo, "NTT DoCoMo. Inc.", September 2000).Another particularly interesting aspect of DoCoMo'sinternational expansion is its policy of taking minoritystakes in the some of its strategic partners' most relevantactivities.
In this context, DoCoMo has made investments inAsia (Hong Kong and Taiwan), United States, Europe(Holland) and Latin America (Brazil) over the last fewyears. It paid 42 billion yen (about US$ 400 million) for a19% stake in Hutcheson Communications (Hong Kong)Limited-HTCL and initiated a i-mode type of service inMay 2000. It invested 60 billion yen (about US$ 570million) to acquire 20% of KG Telecom of Taiwan,thereby extending the W-CDMA presence in Asia(DoCoMo, "Global Strategy and Investments in UnitedStates and Taiwan", 30 November 2000). In Europe,DoCoMo paid 4 billion euro for a 15% stake in KPNMobile of the Netherlands, giving it access to KPN'smobile licenses not only in the Netherlands, but also—after establishing a joint venture with KPN inSeptember 2000— in Belgium, Germany, Ukraine,Hungary and Indonesia (and possibly also France). Thatinvestment, together with another on the order of £1.2billion for a 20% holding in Hutchison 3G (UK), gave
Foreign investment in Latin America and the Caribbean, 2000 169

DoCoMo a major influence on mobile communicationsin Europe through its strategic partners KPN Mobile andHutchison Whampoa. In the United States, DoCoMomade a major investment of approximately 1.08 trillionyen (around US$ 10 billion) to acquire 16% of AT&TWireless in November 2000, with the aim of jointlypromoting W-CDMA technology in that market (incompetition with the CDMA2000 alternative backed byQualcomm and Verizon Wireless) (Business Week, 11December 2000). The final piece in the DoCoMointernational system was actually one of the first to beexecuted, in September 1998: an investment of 95million Brazilian real for a 3.6% stake in the mobilesubsidiary formed by Telefónica de España (and others)to purchase the Telebras companies providing mobileservices in the Rio de Janeiro and Espíritu Santo regionof Brazil.
One problem that has arisen for DoCoMo is that itspolicy of international expansion based on acquiringminority stakes in its partners' operations, rather thansetting up its own subsidiaries, has not resulted in theexpected level of influence in its partners' management
and investment decisions. One impact of this could be toerode DoCoMo's advantage in 3-G technology (NikkeiBusiness, 2000).
Just as we saw in the analysis of corporate strategiesamong several others of the major firms making asignificant contribution to Japan's outward FDI, theLatin American component (Brazil) of DoCoMo'sintricately designed international expansion does notreally mesh with the rest of its strategy. This is becauseits level of participation does not give it a significantinfluence in management and technology decisions, andbecause its partners in Brazil are not the same as those inEurope. It will be interesting to see whether DoCoMoremains in the Brazilian market when the time comes torenew the license. DoCoMo has no presence in the rest ofLatin America, having largely missed the massiveprivatization and deregulation processes that took placethere during the 1990s, which suggests once again thatLatin America was not a priority. Better investmentalternatives were available for this Japanese telecomsmajor, and its expansion cycle did not coincide with theliberalization process in the region.
F. CONCLUSIONS ON JAPANESE INVESTMENT IN LATIN AMERICAAND THE CARIBBEAN
The performance of the Japanese economy during thesecond half of the twentieth century was veryimpressive, until it entered the prolonged crisis of the1990s. The nature and environment of Japan's economicevolution were quite different from those of othercountries, and they do not fit into simple categories. TheJapanese metaphor of wild flying geese (and its morerecent adaptations) was invoked in an attempt to capturethe special relationship between industrialization,international competitiveness and outward foreign directinvestment that characterized Japan's progress.Although the statistical information on Japanese FDI isplentiful, it is not very useful for understanding theoutward FDI process unless combined withcomplementary data on corporate strategies in specificindustries.
There have been at least three identifiable bursts ofJapanese FDI. One was centred on the naturalresource-seeking FDI of the general trading companies,such as Mitsubishi Corporation. The general tradingcompanies also facilitated the initial wave of FDI byJapanese manufacturers with export ambitions. Thesecond wave had more to do with the internationalization
of consumer electronic corporations, such as Sony andMatsushita Electric Industrial, and the third was based onthe establishment of internationally integratedproduction systems by automotive giants such as Toyotaand Honda. DoCoMo may represent the start of a fourthburst based on its positioning in the globalmobile-multimedia telecoms industry. The extent towhich these separate outflows have overlapped is notclear. Outward FDI by the general trading companiesmostly seems to have preceded that of the leadingexporters of manufactured goods. The FDI outflows bythe major manufacturers broadly consisted of two spurts:a smaller initial one in which they made market-seekinginvestments in national economies that were wholly orrelatively closed to imports of electronic and automotiveproducts; and a much larger second burst, in which theymade efficiency-seeking investments to establish exportplatforms or internationally integrated productionsystems to supply the main global markets.
Latin American countries seem to have received asubstantial portion of the relatively small initial FDIwave, in which the general trading companies played thepivotal role. But, except for Mexico, they did not receive
170 ECLAC

a significant part of any of the subsequent surges ofJapanese FDI. During the period of market-seekinginvestment by the major manufacturing exporters(1970-1990), particularly in the consumer electronicsand automotive industries, most Latin American countrieswere experiencing serious economic difficultiesstemming from the exhaustion of the import-substitutingindustrialization model, and later as a result of the debtcrisis. The subsequent explosion of efficiency-seekingFDI by the leading Japanese manufacturers, especially inthe consumer electronics sector, failed to reach LatinAmerica (apart from the maquila industries in Mexico)because the trade liberalization policies implemented bynearly all countries in the region made it feasible toexport to them. Exporting was the manufacturers'preferred alternative, and national industrial policies inthe region for the consumer electronic industry did notrequire them to expand their existing investments. Theautomotive industry was a special case since the twomain integration schemes in the region —the NorthAmerica Free Trade Agreement (NAFTA) and theSouthern Common Market (Mercosur)— each haddefined, but distinct, automotive policies. Most Japanesecorporations organize themselves regionally in a waythat includes their Mexican subsidiaries (and sometimesthose in Central America) as part of their NorthAmerican production systems. The fact that "LatinAmerica" often means South America for Japanesetransnationals reflects their view of opportunities in theregion. In telecoms, DoCoMo's FDI in Brazil seemssomewhat anomalous in the context of its well-definedglobal strategy.
Japan's transnationals had FDI cycles that did notcoincide well with the evolution of Latin Americaneconomies, except for Mexico's maquila programme.The manufacturers had better opportunities and differentpriorities for establishing both local market-servingaffiliates and subsidiaries for their integrated regionalproduction systems in North America, Europe and Asia.Inclusion of Mexico in the North American productionsystem reduced the overall size of the Latin Americanmarket compared to the three other regions mentionedabove. Apart from DoCoMo, which came on the scenelate, Japanese investors were not generally in tune withthe main attractors of inward FDI to South Americaduring the 1990s, namely privatization oftelecommunications, electric power generation anddistribution, and other infrastructural activities; andmergers and acquisitions among financial service or oilcompanies. There were also other factors discouragingthem from establishing export platforms or regionallyintegrated production systems in South America. First,the necessary inputs (a competitive environment, skilled
human resources, capable local suppliers, facilities forexport processing, modern telecommunications andinfrastructure) were not always sufficiently available,either in quantity or in quality. Secondly, the tariffliberalization process, coupled with a relaxation ofindustrial policy requirements, made it easier for atransnational to supply many national markets byexporting from other sites within its internationallyintegrated production system. Lastly, in the case ofgeneral trading companies, many of the core banks intheir keiretsu groups had been badly burned in the LatinAmerican debt crisis and did not have a very positiveopinion of FDI opportunities in the region. Moreover, theJapanese manufacturers increasingly carried out theirinternationalization process in an independent fashion,without relying on those general trading companies.
This interplay between factors driving the Japaneseoutward FDI, the availability of investmentopportunities elsewhere, and the policy environment inLatin America resulted in an extremely low level ofJapanese FDI in Latin America. Might different policieshave produced a different outcome? Aside from theobvious fact that fewer crises, coupled with bettermacroeconomic management and clearer nationalpolicies and priorities, would have helped, there are clearlimits to the impact of policy in this domain. A moreactive national policy (aside from better information andimproved image-making) would not necessarily have ledto greater natural resource-seeking FDI by the Japanesetrading companies or higher levels of nationalmarket-seeking FDI by its manufacturers. Both thegeneral trading companies and the manufacturerscontinually evaluate their investment alternatives, andthe main factors in their investment decisions are themagnitude of the natural resources or the national marketin question, compared to other possibilities. Policywould not normally make a significant difference here.
An active government policy might have made adifference to efficiency-seeking FDI by the leadingJapanese manufacturers. In Asia, Japanese corporationswere accustomed to active host country policies, both interms of macroeconomic management and in terms ofspecific industrial policies, such as the formation of localsupply chains (Kagami, 1995, pp. 44 and 47). Theinvestment calculus relies heavily on factors thatgovernments can influence, such as the competitivesituation of the country (a favourable businessenvironment, a functional foreign investment law,skilled human resources, capable local suppliers,facilities for export processing, moderntelecommunications and infrastructure), andmechanisms for channelling FDI to priority projects(financial or fiscal incentives). Although Mexico did not
Foreign investment in Latin America and the Caribbean, 2000 171

pursue an overly active policy in this regard, there wassignificant coincidence of interests between thecorporate strategies of the major Japanese consumerelectronics corporations and Mexico's export processingfacilities (maquilas), together with its privileged accessto the United States market (HTS 9802) and the benefitsof the North American Free Trade Area. NAFTA rules oforigin were also important in enticing the globalsuppliers of the Japanese manufacturers that hadinvested in Mexico to do the same. The Tijuanaelectronics cluster is a vivid example of this. Perhaps themost salient lesson for policymakers in Latin America isthat if industrial development is a priority objective ofFDI policy, then specific measures going beyond mereinvestment attraction are called for. Japanese investmentin Asia was very important for that region's industrialdevelopment, and Latin America sorely misses that kindof FDI (Kagami, 1995).
With regard to Japanese FDI in Latin America'sservice industries (excluding tax-haven and ship-registryactivities) the major new opportunity of recent years hasbeen in telecommunications. Unfortunately, thetelecoms deregulation cycle in Japan itself, and theemergence and international expansion of DoCoMo, didnot coincide well with the privatization and deregulation
cycle in Latin America. Although DoCoMo did catch thetail-end of that cycle via a minor participation in theTelefónica de España purchase of some of Telebras'mobile telephony subsidiaries, this initiative did notsquare well with its subsequent global strategy for rapidinternational expansion in 1999-2000. In view of this,now might be the right time for Latin American policymakers to reassess the degree to which their nationalgoals in the licensing of mobile operators coincide withthe corporate strategy displayed by DoCoMo, to seewhether a more active and focused policy might bewarranted.
Lastly, the Japanese Government has not generallybeen in favour of the plethora of free trade agreementssigned over the last decade, and has tended to prefer amultilateral approach. Nonetheless, it recognizes thatsuch agreements are an increasingly standard feature ofthe Latin American policy environment, and has takenseveral steps in this direction, including conversationswith Mexico (JETRO, 2000a; Solis, 2000) and a formalproject with Chile (JICA/Ministerio de Economía,Minería y Energía de Chile, 2000). Other LatinAmerican Governments might be well advised to takethese initiatives into account in designing policies topromote Japanese FDI in their respective economies.
172 ECLAC
■
IV. TELECOMMUNICATIONS: INVESTMENT ANDCORPORATE STRATEGIES IN LATIN AMERICA ANDTHE CARIBBEAN
■
A. TELECOMMUNICATIONS AND GLOBALIZATION
Since the late twentieth century the telecommunications industry has been one of the most
dynamic in the world. The spectacular development of this sector in the 1990s reflects the
best and worst of globalization. On the positive side, there are the impressive benefits that
this process can yield, such as the way it has turned telecommunications into a powerful
engine of growth, largely because of the enormous amounts of FDI this industry has
received.60 These benefits are demonstrated by the following figures: over the period
1990-2000 the number of main telephone lines increased from 520 million to 970 million,
international traffic rose from 33 billion to 110 billion minutes, the number of mobile
telephone subscribers increased from 11 million to 650 million and the number of Internet
users grew from 2.6 million to 385 million. Over the same period, total capital spending on
telecommunications services was in excess of US$ 1.637 trillion, a sum that reflects the
Foreign investment in Latin America and the Caribbean, 2000 173
60 According to information from the United Nations Conference on Trade and Development (UNCTAD), in the 1990s cross-border mergers and
acquisitions in the transport, storage and communications industry totalled US$ 302 billion, representing some 12% of the US$ 2.491 trillion of
cross-border mergers and acquisitions seen in all industries over the same period (UNCTAD, 2000). In 1999 alone, operations in the
telecommunications sector were worth almost US$ 168 billion, accounting for some 23% of the total for that year. FDI has been used not only to
carry out the large-scale mergers and acquisitions that have been a feature of the sector’s development, but also to finance vast expenditures on
equipment and services for the purpose of extending and upgrading networks and to purchase licences, particularly for third-generation (3G)
mobile telephony.

strength of the investment process. The annual sales of telecommunications companies
increased from US$ 396 billion to US$ 840 billion over the period and are expected to
stand at US$ 925 billion in 2002. Between 1990 and 2000 the proportion accounted for by
mobile telephony rose sharply —from under 3% to over 27%— while the share accounted
for by basic telephony fell from almost 90% to under 55% (ITU, 2001a). From the user’s
point of view, the main benefits yielded by the globalization of telecommunications
include falling prices, a greater range of services, better quality and wider geographical
coverage.
Outside the industry, too, the actual benefits aresignificant and the potential ones enormous.Modernization of telecommunications can lead to majorimprovements in the systemic competitiveness of thecountries concerned and enable them to integrate morerapidly and effectively into the international economy.These developments have therefore fostered hopes thatthe large gaps separating developed and developingcountries may be narrowed. According to 1999 data, theformer account for around two thirds of all maintelephone lines and mobile telephone subscribers, theother third being accounted for by developingcountries.61 Again, in developed countries telephonedensity ranges from 38.1% to 64.5% in the case of mainlines and from 21.9% to 44.9% in the case of mobiletelephones, while in developing countries theproportions range from 2.4% to 7.6% for main lines andfrom 1% to 8.1% for mobile telephones (ITU, 2001b).Mobile telephony is growing rapidly in bothindustrialized and developing countries, the differencebeing that in the former it generally supplementsfixed-line telephony while in the latter it is steadilysupplanting it (ITU, 1999). Mobile telephony nowaccounts for over a third of all telephone connections,and the number of mobile telephone users is very likelyto overtake the number of traditional fixed-linesubscribers over the next 10 years (Kelly, 2000c).
Recent developments in the telecommunicationsindustry also show up some of the worst aspects of theglobalization process, which are associated withfinancial instability and risk-taking by economic agentsand national governments. In an episode reminiscent ofthe rout of “dot com” companies in 2000 (when theGoldman Sachs Internet index fell from about 700 to 200or so), some of the largest transnational
telecommunications companies have lost more than 50%of their market value (Deutsche Telekom, BritishTelecom, AT&T Corporation and WorldCom) andothers around 25% (France Télécom, Telefónica deEspaña and Telecom Italia) (AHCIET, 2000a). From1999 to 2000 these companies increased theirborrowings so much that the share oftelecommunications companies in the Europeansyndicated loan market rose from 7.4% to over 35%,something that indicates an increase in the systemic riskof the industry (The Economist, 2000a). Again, a numberof transnationals in the sector (British Telecom,Deutsche Telekom, France Télécom and Telecom Italia)have had to dispose hurriedly of real estate and otherassets (Jacobs, 2001).
Among the main causes of this instability were theexceptionally high prices paid by companies inEuropean auctions for high-speed, high-capacity (3G)mobile telephony licences to ensure they were not leftout of the most dynamic and promising segment of thetelecommunications industry. It is estimated that thetotal cost of European licences to operate in this segmentcould reach US$ 150 billion, with total expenditure bythe industry, including infrastructure, totalling someUS$ 300 billion. Thus, it has been said that this process“…may prove to be the biggest gamble in businesshistory” (The Economist, 14 October 2000).62 Somethingdifferent, although possibly with similar effects, ishappening in the United States, where there has been anoverallocation of spectrum. Part of the bandwidthrequired for (3G) licences has already been allocated toultra-high frequency (UHF) television channels, whichcould make 3G licences very expensive (The Economist,2000b and Buckley, 2000). Leaving aside the spectrumproblem, it is significant that in the United States the first
174 ECLAC
61 The distribution of Internet servers is heavily concentrated in the United States (76.1%) and Europe (14.2%) (Beca, 2000).
auctions (January 2001) for second-generation (2G)PCS63 mobile telephony licences for blocks C and Fyielded almost US$ 17 billion (FCC, 2001). Auctioningoff mobile telephony licences has yielded substantialrevenue for governments but has brought greaterinstability to the sector and to the economy.
As has been seen, the development dynamic of thetelecommunications industry is complex, andglobalization of this industry is having both positiveeffects (particularly in terms of countries’ development)and negative ones (chiefly, greater instability and
financial risk). For this dynamic to be better understoodit is indispensable to have a clear view of exactly what theglobalization of telecommunications means. Thisprocess may be envisioned as a long-term tendencytowards the establishment of a single world market(Mortimore, 2000) and it has at least three main aspects:technological change, increased competition andtransnationalization of the largest companies.Analysing these three elements helps to clarify thenature of the telecommunications globalizationprocess.
1. Technological change
The telecommunications industry is clearly identifiedwith the “new economy”, and it played an important rolein modernizing and boosting the world economy towardsthe end of the twentieth century. Before this,telecommunications was a public fixed-line service(natural monopoly), was generally operated by the Stateor heavily regulated, relied on copper networks usinghybrid (analogue/digital)64 circuit-switched65 systems,charged by distance and by the minute, and operated inan environment where computers were a luxury item andinformation a scarce resource. In today’s “neweconomy”, computers are a consumer item, informationis plentiful and the new networks use fully digitalsystems based on broadband66 technology and packetswitching.67 These networks charge progressively bymegabyte regardless of distance, are generallyprivately controlled and run, and are subject to theoversight of independent supervisory authorities andto levels of regulation that vary by market segment and
the degree of competition (Kelly, 2000d and WorldBank, 2001).
The new telecommunications industry isinternational, and competition is increasing ineverything from basic telephony to new services (digitalmobile, cable television, Internet/multimedia). Itincludes more and more companies that operate inrelated fields, such as infrastructure and equipmentmanufacturing (satellites, submarine and overlandcables, networking equipment, mobile telephones and soon), software provision (e-mail, portals, m-commerce,etc.) and the supply of content (entertainment,transactions, etc.). It is important to distinguish betweenthese segments —basic, mobile and value-addedservices— of the telecommunications industry, as inmany cases premises or statements that are valid for oneof them will not be applicable to the rest.
Technological change provides transnationalcorporations with a powerful competitive advantage. In
Foreign investment in Latin America and the Caribbean, 2000 175
63 There are other opinions on this issue: “…for players that have not achieved success in 2G markets, it may be the last chance to make a significantbusiness in the mobile market of a given country. This rationale probably constitutes the primary driver for major European operators to bid for3G” (Goulam, 2000) and “Companies are spending the way they are for these licences because there is so much demand for growth in wirelessservices and because they think, rightly, that being left without a licence means being marginalized in five years’ time” (Runkle, 2001).
63 PCS (Personal Communications Service), which operates in the 1,850 MHz to 1,990 MHz frequency range in Latin America and North America,provides a wide range of new digital standards for mobile telephony. It has higher transmission speeds and greater geographical coverage, whichmeans that it allows greater mobility than traditional cellular service.
64 The analogue technology originally used for telephony works by converting air vibrations into analogue electrical sequences. Digital technology
is based on electronic circuits that accept and process binary data in accordance with the rules of Boolean logic (TechEncyclopedia,
www.techweb.com/encyclopedia/).
65 Circuit-switched networks use the old system of keeping an active line open between the two parties to a telephone conversation for the entireduration of the call. This is less efficient than the new packet-switched method, but is still more reliable for voice communications(TechEncyclopedia).
66 Lines or services with greater capacity, higher speeds or both (1.544 Mbps) (TechEncyclopedia).
67 Packet switching networks use a new system for sending communications (voice, data, video, Internet) broken up into individual packets.
Because these packets can be sent by different routes and reassembled on arrival, these networks are more efficient than those that require an
open line (circuit switching) (TechEncyclopedia).

the telecommunications industry, technological changehas been so rapid and fundamental that it has requiredcompanies to renew and upgrade their networks andinfrastructure constantly, if not to replace themaltogether. The transition from basic telephony to mobiletelephony and value-added services has increased thecompetitive pressure on companies in the industry.
In the basic telephony segment, one of the maindifferences between the “new” and “old”telecommunications networks lies in the progress madetowards digitalization and the increased capacityavailable for transmitting voice, data and pictures. The“old” fixed copper-wire networks are preventing the newconvergence from taking hold as rapidly as it mightbecause they physically restrict the spread of the digitalrevolution. The challenge for the leading companies inthe fixed telephony segment is to modernize theirnetworks, which they can do by investing heavily in newfibre optic networks,68 using DSL (digital subscriberline)69 technology or joining forces with televisionoperators that use cable, satellite or other transmissionsystems. For the companies that own the old copper-wirenetworks, technological renewal has becomeindispensable if they are to prevent the new alternativetechnologies from bypassing local networks to reach theend user (mobile telephony, wireless local loop or WLL70
and other systems).In the mobile telephony segment, the speed of
technological innovation has been much greater still.Replacing first-generation analogue networks with 2Gdigital systems led to phenomenal growth in thetelecommunications industry. This expansion broughtan unprecedented commercial, financial andstock-market bonanza to the companies leading theprocess, whose competitors were obliged to adopt thisnew technology in order to survive. Mobile telephonyservices are creating more and more options, not onlyfor providers (the ability to extend their networks to agrowing number of businesses, expand thegeographical footprint71 of their digital services andincrease capacity without forfeiting service quality)but for users (prepayment cards, international roamingand new mobile data services, among other things) and
countries (rapid modernization and faster access totelephony). It is expected that 3G technologies willprovide these benefits on an even greater scale asregards data transmission, entertainment services andcomputer networks, strengthening the links betweennetwork operators and the providers of applicationswith more value added, content and services. Some ofthe frenzy currently surrounding 3G licences stemsfrom the perception that companies that fail to enlargetheir digital footprint by purchasing new 3G licenceswill be unable to compete fully in the next stage. Oneof the basic premises driving today’s hugeinvestments is the idea that implementing 3G mobiletelephone technologies will permit the spectaculargrowth of the telecommunications industry to continue,once again yielding an unprecedented commercial,financial and stock-market bonanza for the mainparticipants.
One of the factors underlying the rapid progress ofthe telecommunications industry is technology. Incellular mobile telephony, three basic 2G technologiesare competing to dominate the transition to the thirdgeneration: GSM (global system for mobilecommunications), TDMA (time division multipleaccess) and CDMA (code division multiple access). Themain differences between these lie in the fact that GSM isan integrated cellular system whereas the other two aretechniques for sending multiple signals down a singleline simultaneously (multiplexing). The shift from 2G(basically voice transmission) to 3G (voice, data andhigh-speed multimedia) technologies entails anintermediate stage involving techniques to increase thespeed of data transmission, improve e-mail service andincrease the speed of Internet access. Each of thetechnologies is backed by transnational corporations orgroups of companies seeking to ensure that their option isthe one that ultimately prevails. Figure IV.1 shows thestages in the transition from 2G to 3G mobile telephony,as envisaged by the International TelecommunicationUnion (ITU).72
GSM, a cellular digital technology developed inEurope in the 1980s, was implemented there by sevencountries in 1992. It is a TDMA-compatible circuit
176 ECLAC
68 Fibre optic cables improve the transmission of digital information (voice, data, video). They may eventually use optical circuits instead of
electrical ones (TechEncyclopedia).
69 The digital subscriber line system is a way of increasing the capacity of existing fixed copper cables so that they can handle high-speed
transmissions.
70 With a wireless local loop the end user can be reached without the need to pass through the existing fixed line network.
71 The “footprint” of a wireless telephone services provider is the total geographical area within which it can supply services using its own facilities.
Operators with a large digital footprint can achieve greater efficiency and economies of scale than those with a smaller footprint.
72 The ITU International Mobile Telephony-2000 (IMT-2000) programme aims to achieve agreement on technical standards to facilitate
interoperability or compatibility between the different technologies. This would open the way to interconnection between local, cellular and
satellite systems, and thence to global coverage.
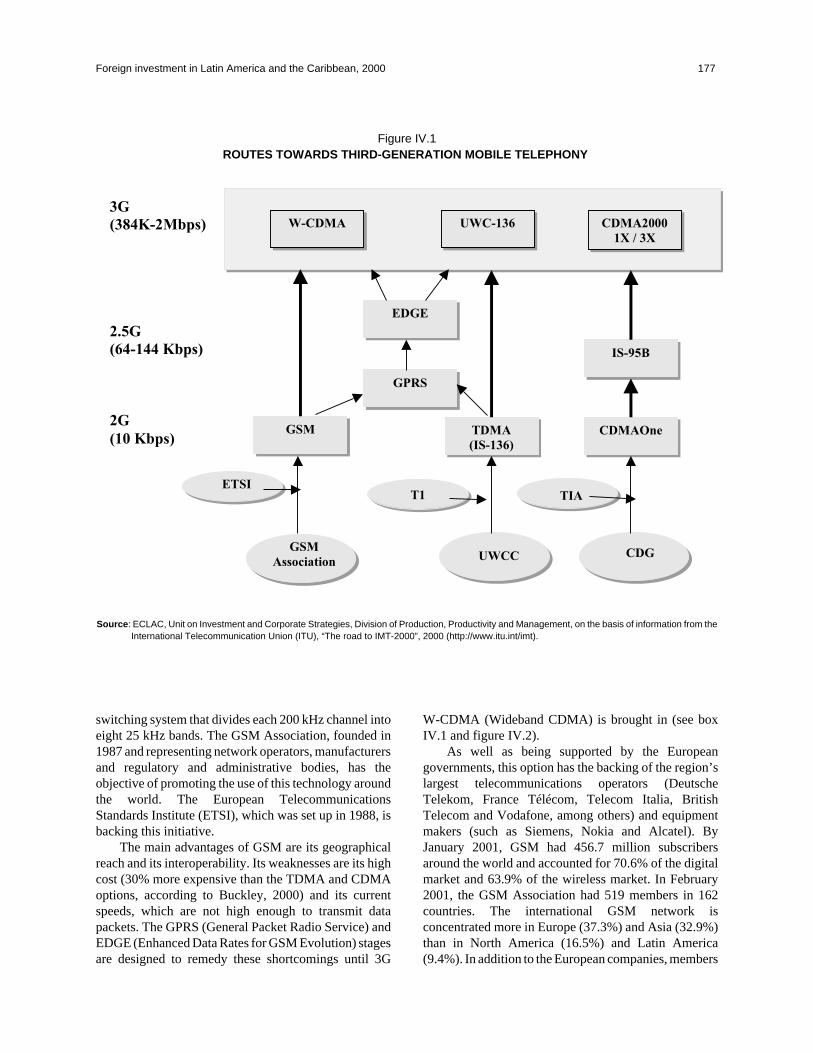
switching system that divides each 200 kHz channel intoeight 25 kHz bands. The GSM Association, founded in1987 and representing network operators, manufacturersand regulatory and administrative bodies, has theobjective of promoting the use of this technology aroundthe world. The European TelecommunicationsStandards Institute (ETSI), which was set up in 1988, isbacking this initiative.
The main advantages of GSM are its geographicalreach and its interoperability. Its weaknesses are its highcost (30% more expensive than the TDMA and CDMAoptions, according to Buckley, 2000) and its currentspeeds, which are not high enough to transmit datapackets. The GPRS (General Packet Radio Service) andEDGE (Enhanced Data Rates for GSM Evolution) stagesare designed to remedy these shortcomings until 3G
W-CDMA (Wideband CDMA) is brought in (see boxIV.1 and figure IV.2).
As well as being supported by the Europeangovernments, this option has the backing of the region’slargest telecommunications operators (DeutscheTelekom, France Télécom, Telecom Italia, BritishTelecom and Vodafone, among others) and equipmentmakers (such as Siemens, Nokia and Alcatel). ByJanuary 2001, GSM had 456.7 million subscribersaround the world and accounted for 70.6% of the digitalmarket and 63.9% of the wireless market. In February2001, the GSM Association had 519 members in 162countries. The international GSM network isconcentrated more in Europe (37.3%) and Asia (32.9%)than in North America (16.5%) and Latin America(9.4%). In addition to the European companies, members
Foreign investment in Latin America and the Caribbean, 2000 177
Figure IV.1ROUTES TOWARDS THIRD-GENERATION MOBILE TELEPHONY
3G
(384K-2Mbps)
2.5G
(64-144 Kbps)
2G
(10 Kbps)GSM
GPRS
TDMA
(IS-136)
T1
UWCC
IS-95B
CDMAOne
CDG
W-CDMA UWC-136 CDMA2000
1X / 3X
TIA
EDGE
GSM
Association
ETSI
Source: ECLAC, Unit on Investment and Corporate Strategies, Division of Production, Productivity and Management, on the basis of information from theInternational Telecommunication Union (ITU), “The road to IMT-2000”, 2000 (http://www.itu.int/imt).
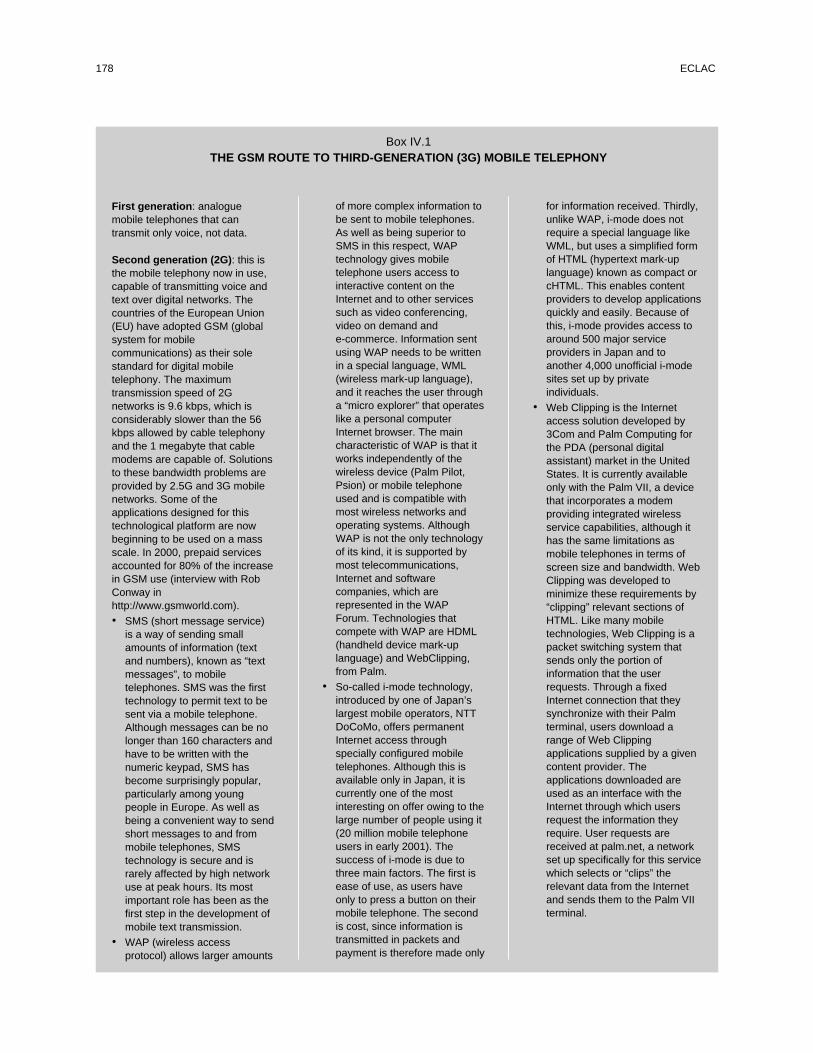
178 ECLAC
First generation: analoguemobile telephones that cantransmit only voice, not data.
Second generation (2G): this isthe mobile telephony now in use,capable of transmitting voice andtext over digital networks. Thecountries of the European Union(EU) have adopted GSM (globalsystem for mobilecommunications) as their solestandard for digital mobiletelephony. The maximumtransmission speed of 2Gnetworks is 9.6 kbps, which isconsiderably slower than the 56kbps allowed by cable telephonyand the 1 megabyte that cablemodems are capable of. Solutionsto these bandwidth problems areprovided by 2.5G and 3G mobilenetworks. Some of theapplications designed for thistechnological platform are nowbeginning to be used on a massscale. In 2000, prepaid servicesaccounted for 80% of the increasein GSM use (interview with RobConway inhttp://www.gsmworld.com).
• SMS (short message service)is a way of sending smallamounts of information (textand numbers), known as “textmessages”, to mobiletelephones. SMS was the firsttechnology to permit text to besent via a mobile telephone.Although messages can be nolonger than 160 characters andhave to be written with thenumeric keypad, SMS hasbecome surprisingly popular,particularly among youngpeople in Europe. As well asbeing a convenient way to sendshort messages to and frommobile telephones, SMStechnology is secure and israrely affected by high networkuse at peak hours. Its mostimportant role has been as thefirst step in the development ofmobile text transmission.
• WAP (wireless accessprotocol) allows larger amounts
of more complex information tobe sent to mobile telephones.As well as being superior toSMS in this respect, WAPtechnology gives mobiletelephone users access tointeractive content on theInternet and to other servicessuch as video conferencing,video on demand ande-commerce. Information sentusing WAP needs to be writtenin a special language, WML(wireless mark-up language),and it reaches the user througha “micro explorer” that operateslike a personal computerInternet browser. The maincharacteristic of WAP is that itworks independently of thewireless device (Palm Pilot,Psion) or mobile telephoneused and is compatible withmost wireless networks andoperating systems. AlthoughWAP is not the only technologyof its kind, it is supported bymost telecommunications,Internet and softwarecompanies, which arerepresented in the WAPForum. Technologies thatcompete with WAP are HDML(handheld device mark-uplanguage) and WebClipping,from Palm.
• So-called i-mode technology,introduced by one of Japan’slargest mobile operators, NTTDoCoMo, offers permanentInternet access throughspecially configured mobiletelephones. Although this isavailable only in Japan, it iscurrently one of the mostinteresting on offer owing to thelarge number of people using it(20 million mobile telephoneusers in early 2001). Thesuccess of i-mode is due tothree main factors. The first isease of use, as users haveonly to press a button on theirmobile telephone. The secondis cost, since information istransmitted in packets andpayment is therefore made only
for information received. Thirdly,unlike WAP, i-mode does notrequire a special language likeWML, but uses a simplified formof HTML (hypertext mark-uplanguage) known as compact orcHTML. This enables contentproviders to develop applicationsquickly and easily. Because ofthis, i-mode provides access toaround 500 major serviceproviders in Japan and toanother 4,000 unofficial i-modesites set up by privateindividuals.
• Web Clipping is the Internetaccess solution developed by3Com and Palm Computing forthe PDA (personal digitalassistant) market in the UnitedStates. It is currently availableonly with the Palm VII, a devicethat incorporates a modemproviding integrated wirelessservice capabilities, although ithas the same limitations asmobile telephones in terms ofscreen size and bandwidth. WebClipping was developed tominimize these requirements by“clipping” relevant sections ofHTML. Like many mobiletechnologies, Web Clipping is apacket switching system thatsends only the portion ofinformation that the userrequests. Through a fixedInternet connection that theysynchronize with their Palmterminal, users download arange of Web Clippingapplications supplied by a givencontent provider. Theapplications downloaded areused as an interface with theInternet through which usersrequest the information theyrequire. User requests arereceived at palm.net, a networkset up specifically for this servicewhich selects or “clips” therelevant data from the Internetand sends them to the Palm VIIterminal.
Box IV.1THE GSM ROUTE TO THIRD-GENERATION (3G) MOBILE TELEPHONY
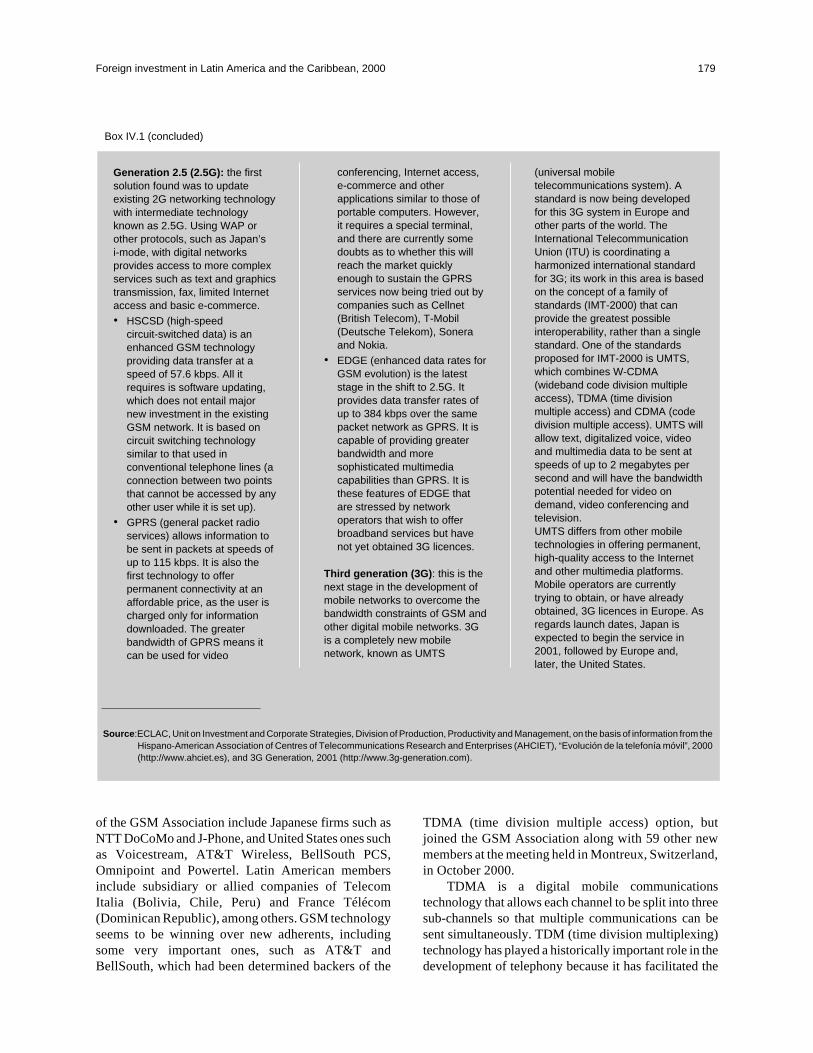
of the GSM Association include Japanese firms such asNTT DoCoMo and J-Phone, and United States ones suchas Voicestream, AT&T Wireless, BellSouth PCS,Omnipoint and Powertel. Latin American membersinclude subsidiary or allied companies of TelecomItalia (Bolivia, Chile, Peru) and France Télécom(Dominican Republic), among others. GSM technologyseems to be winning over new adherents, includingsome very important ones, such as AT&T andBellSouth, which had been determined backers of the
TDMA (time division multiple access) option, butjoined the GSM Association along with 59 other newmembers at the meeting held in Montreux, Switzerland,in October 2000.
TDMA is a digital mobile communicationstechnology that allows each channel to be split into threesub-channels so that multiple communications can besent simultaneously. TDM (time division multiplexing)technology has played a historically important role in thedevelopment of telephony because it has facilitated the
Foreign investment in Latin America and the Caribbean, 2000 179
Box IV.1 (concluded)
Generation 2.5 (2.5G): the firstsolution found was to updateexisting 2G networking technologywith intermediate technologyknown as 2.5G. Using WAP orother protocols, such as Japan’si-mode, with digital networksprovides access to more complexservices such as text and graphicstransmission, fax, limited Internetaccess and basic e-commerce.
• HSCSD (high-speedcircuit-switched data) is anenhanced GSM technologyproviding data transfer at aspeed of 57.6 kbps. All itrequires is software updating,which does not entail majornew investment in the existingGSM network. It is based oncircuit switching technologysimilar to that used inconventional telephone lines (aconnection between two pointsthat cannot be accessed by anyother user while it is set up).
• GPRS (general packet radioservices) allows information tobe sent in packets at speeds ofup to 115 kbps. It is also thefirst technology to offerpermanent connectivity at anaffordable price, as the user ischarged only for informationdownloaded. The greaterbandwidth of GPRS means itcan be used for video
conferencing, Internet access,e-commerce and otherapplications similar to those ofportable computers. However,it requires a special terminal,and there are currently somedoubts as to whether this willreach the market quicklyenough to sustain the GPRSservices now being tried out bycompanies such as Cellnet(British Telecom), T-Mobil(Deutsche Telekom), Soneraand Nokia.
• EDGE (enhanced data rates forGSM evolution) is the lateststage in the shift to 2.5G. Itprovides data transfer rates ofup to 384 kbps over the samepacket network as GPRS. It iscapable of providing greaterbandwidth and moresophisticated multimediacapabilities than GPRS. It isthese features of EDGE thatare stressed by networkoperators that wish to offerbroadband services but havenot yet obtained 3G licences.
Third generation (3G): this is thenext stage in the development ofmobile networks to overcome thebandwidth constraints of GSM andother digital mobile networks. 3Gis a completely new mobilenetwork, known as UMTS
(universal mobiletelecommunications system). Astandard is now being developedfor this 3G system in Europe andother parts of the world. TheInternational TelecommunicationUnion (ITU) is coordinating aharmonized international standardfor 3G; its work in this area is basedon the concept of a family ofstandards (IMT-2000) that canprovide the greatest possibleinteroperability, rather than a singlestandard. One of the standardsproposed for IMT-2000 is UMTS,which combines W-CDMA(wideband code division multipleaccess), TDMA (time divisionmultiple access) and CDMA (codedivision multiple access). UMTS willallow text, digitalized voice, videoand multimedia data to be sent atspeeds of up to 2 megabytes persecond and will have the bandwidthpotential needed for video ondemand, video conferencing andtelevision.UMTS differs from other mobiletechnologies in offering permanent,high-quality access to the Internetand other multimedia platforms.Mobile operators are currentlytrying to obtain, or have alreadyobtained, 3G licences in Europe. Asregards launch dates, Japan isexpected to begin the service in2001, followed by Europe and,later, the United States.
Source:ECLAC, Unit on Investment and Corporate Strategies, Division of Production, Productivity and Management, on the basis of information from theHispano-American Association of Centres of Telecommunications Research and Enterprises (AHCIET), “Evolución de la telefonía móvil”, 2000(http://www.ahciet.es), and 3G Generation, 2001 (http://www.3g-generation.com).

transition from analogue networks to digital ones bymaking it possible to use the existing long-distancenetwork. It has been backed by UWCC (UniversalWireless Communications Consortium) ever since thisassociation —which now has over 100 members— wasfounded in Washington in 1996. Moving TDMAtowards 3G status involves two stages: IS-136 and IS-41.In late 1998, efforts began to be made to achieve theconvergence of the TDMA and GSM technologies,which up until then had been rivals: on 11 December1998, an agreement was reached between UWCC andETSI (which backs GSM); on 19 December 2000, theConsortium recognized the ultimate goal of UMTS; on11 January 2001, the Global Roaming Forum of theGSM Association included TDMA as a central
component, and on 21 February 2001, at its worldconference in Cannes, France, the GSM Associationdeclared the wireless war over as a result of theabove-mentioned agreements.
TDMA has a number of advantages. According toUWCC, it is the most cost-efficient option for switchingfrom an analogue to a digital mobile system.Implementing TDMA-136 would require an investmentof US$ 155 million, as against a cost of US$ 272 millionfor CDMA (UWCC, 2001). Furthermore, itscompatibility with GSM means it has the potential forgreater worldwide coverage. It is not very suitable for datatransmission, however, without EDGE enhancement.
TDMA is the dominant technology in NorthAmerica and Latin America. The main operators that
180 ECLAC
Figure IV.2DEVELOPMENT OF GSM IN MOBILE TELEPHONY
57.6 Kbps
384
Functionality
and capacity
Multimedia
GSM+
Data
9.6 Kbps
Voice
EDGE
.
IMT-2000
(UMTS)
WCDMA
2 Mbps
Circuit
switching
Packet
services
GSM++GPRS
115 Kbps
1997 1998 1999 2000 2001 2002
Source: ECLAC, Unit on Investment and Corporate Strategies, Division of Production, Productivity and Management, on the basis of informationprovided by A. Macarrón, "La convergencia de Internet and las telecomunicaciones móviles: ¿la próxima 'killer application'?", PPT presentation,Cartagena de Indias Summit of the Hispano-American Association of Centres of Telecommunications Research and Enterprises (AHCIET), 6-7November 2000 (http://www.AHCIET.net.es).
support this option and that are represented on theUWCC Executive Committee are large United Statescorporations such as the partners in Cingular Wireless(SBC Communications and BellSouth) and AT&T(since October 2000, AT&T and BellSouth have alsobeen members of the GSM Association). Its promotersalso include the Latin American subsidiaries and alliedcompanies of these firms and of European enterprisessuch as Cable & Wireless, Telefónica de España andTelecom Italia. Some equipment manufacturers such asLucent Technologies, Nortel Networks, Motorola andthe United States subsidiaries of Nokia, Ericsson andAlcatel are also represented on the Executive Committeeof the Consortium. The number of TDMA subscribersrose from 9.2 million in 1997 to over 53 million in thethird quarter of 2000, and they are becomingincreasingly concentrated in North America (up from43.4% in 1997 to 51% in 2000) and Latin America (upfrom 29.3% in 1997 to 45% in 2000). By the end of 1999there were 18.3 million subscribers in the United States,accounting for 41% of all digital mobile telephones inthat country (FCC, 2000b). According to UWCC, LatinAmerica is the greatest potential market for the TDMAoption (UWCC, 2001).
CDMA (code division multiple access) is a digitaltechnology for mobile communications that allows thesignal to be combined with a code so that multiplemessages can be sent simultaneously. This initiative isbeing promoted by the CDMA Development Group(CDG), which was set up in 1995 in Costa Mesa,California, and currently has 120 members. CDG issupported by the Telecommunications IndustryAssociation (TIA), which was founded in Arlington,Virginia, in 1988.
According to McCaffery and Buckley, CDMA is abetter technology than GSM or TDMA; it would becheaper to implement, have greater capacity (betweenthree and five times the call capacity), be more secureand provide a simpler route to 3G, and it is virtually readynow (McCaffery, 2000; Buckley, 2000 and).Nonetheless, this option has not become the dominanttechnology. If it does prove to be the superior technologyand nonetheless fails to take the lead, the situation maybe reminiscent of the struggle between the VHS and Betatechnologies for video cassette recorders in the 1980s, inwhich VHS —the technologically inferior option—ultimately prevailed. The CDMA growth path to 3Gentails two stages: IS-95B and CDMA2000 (see figureIV.1). The latter stage consists of two phases, the first ofwhich is almost ready.
CDMA is most widely used in Asia, North Americaand Latin America. The main operators backing thisoption are the North American companies VerizonWireless (produced by the merger of Bell Atlantic andGTE, plus the assets of AirTouch, a United Statessubsidiary of the British company Vodafone),73 SprintPCS, BellSouth International, Bell Canada Mobility andLeap Wireless, along with Telmex of Mexico and anumber of Asian companies, including Hutchison ofHong Kong, SK Telecom and KT Freetel of the Republicof Korea, and KDDI of Japan. CDMA is also supportedby subsidiary and allied companies of these firms andaffiliates of others, such as Telefónica de España in LatinAmerica. A number of equipment manufacturers, suchas Lucent Technologies, Motorola, Nortel, Ericsson,Samsung, Hyundai and LG, are also with CDG. In 1997this technology had 4.3 million subscribers, a figure thathad risen to 71 million by September 2000. In 1997 thesesubscribers were mostly in Asia (79%) and, to a lesserextent, North America (21%), but growth wassubsequently faster in North and Latin America, and bySeptember 2000 these two regions had come to accountfor 37.2% and 14.2%, respectively, of all subscribers,whereas Asia’s share had fallen to 47.2%. In 1999, theCDMA option had 15.8 million subscribers in the UnitedStates, accounting for 36% of all digital mobiles in thatcountry, according to the Federal CommunicationsCommission (FCC). The promoters of CDMA2000 (thethird generation of CDMA) have recently been insistingthat their network will be ready for implementation fairlysoon in some Asian countries and the United States(before the UMTS network in Europe): during 2001 inThe Republic of Korea (SK Telecom and KT Freetel)and Japan (KDDI), and in 2002 in the United States(Verizon and Sprint) (TotalTelecom, 22 February 2001).Great efforts in this regard are also being made in LatinAmerica, particularly Brazil.
By late 2000 there were 637 million digitaloperating technology subscribers in all. The GSM optionaccounted for 440 million or 69.1% (as against 46million in 1996), TDMA/I-136 for 64 million or 10%(9.2 million in 1997) and CDMA for 82 million or 12.9%(4.3 million in 1997). As already mentioned, the GSMsystem is dominating in Europe and Asia, while in NorthAmerica and Latin America, TDMA and CDMA are thestrongest options.
If it is assumed that none of these technologies isintrinsically superior to the others, then the operators’strategies will ultimately be the deciding factor(Telecomunicaciones Online, 2000). From the point of
Foreign investment in Latin America and the Caribbean, 2000 181
73 Vodafone is carrying out GSM/CDMA interoperability trials in Europe.
view of corporate strategy, for example, the purchase ofthe United States company Voicestream by DeutscheTelekom is a concrete step towards establishing the GSMsystem worldwide, while the alliance forged by NTTDoCoMo with Hutchison 3G, KPN Mobile NV andTelecom Italia is an effort to establish the company’si-mode technology in Europe (see the section onDoCoMo in chapter III). The decision by Vodafone tointegrate its United States AirTouch assets into VerizonWireless could be a way of achieving a strong positionboth in GSM in Europe and Asia and in CDMA in NorthAmerica and Latin America. BellSouth may be aimingfor something similar by joining the GSM Associationwhile maintaining its position in TDMA in NorthAmerica and Latin America. It seems clear that thetechnological decisions being taken today will affect thecompetitiveness —and perhaps the survival— of theoperators of tomorrow.
Technological change thus provides a powerfulcompetitive advantage for the companies that drive it,while at the same time it increases the level of risk anduncertainty in the telecommunications industry. Ifsuccessful, the innovator threatens the position ofcompanies that do not quickly adopt the new technology,but it also takes the risk that its initiative may be acommercial failure. In telecommunications, the mostinnovative segment recently has been cellular mobiletelephony. In the space of just 15 years, the industry hasestablished first-generation analog mobile telephony andmoved on successfully to 2G digital telephony, and thelaunch of the third generation is in the offing. This moveto a more sophisticated generation has given rise to fiercecompetition between companies as they strain to keep upwith the pack or, in some cases, simply to avoid fallingprey to “killer applications”, i.e., commercially viableinnovations with so many competitive advantages thatthey literally destroy or “kill off” the competition,thereby introducing a destabilizing element into theindustry.74 The intense struggle being waged bytelecommunications operators in Europe to obtain acompetitive digital footprint for the third generation has
led them to spend vast sums of money on licences (towhich they will have to add the even vaster sums neededto build the infrastructure) and is destabilizing the entireindustry, as well as overshadowing the future of the thirdgeneration (Total Telecom, 2001b and Le Monde,2001a).
Operators’ efforts to be among the first to offer 3Gmobile services are intertwined with the competitionamong the different technological options being backedby the various companies. As has been seen, there are anumber of technological routes to the third generation,and the issue of which choice is to prevail is a highlystrategic one. Companies are striving to see theirtechnological option win out over the rest and thus toform part of the group that will help shape the industryand markets of the future and draw up the rules andstandards for the sector. In sectors that are highlytechnology-intensive, new types of knowledge-basedoligopolies are emerging (UNCTAD, 1999c). These newoligopolies are dynamic and seek to reduce risk anduncertainty by adopting a flexible approach that enablesthem to cope with inevitable change, rather than a rigiddetermination to defend the status quo. Instead ofconcentrating on ways of creating static entry barriersbased on size, they seek to take the lead in marking outthe shifting frontiers of the sector and in controlling andsetting the direction for technology, productionstandards and competition rules. They are made up ofnetworks of companies rather than individual firms, andstrategic alliances are what constitute their basicstructure and main building blocks (UNCTAD 1999c).
Competition among telecommunicationscompanies, both in the race towards 3G and in thestruggle to establish the different mobile telephonytechnologies, could drive the industry towards levels ofrisk and uncertainty that would threaten the stability ofthe world economy. As the ITU IMT-2000 initiativesuggests, it would be desirable for this competition to bechannelled into a quest for compatibility andinteroperability of the different technologies, somethingthat would also bring greater benefits to users.
2. Increased competition
Another factor driving the globalization of thetelecommunications industry has been its
attractiveness for FDI owing to the privatization ofalmost all the dominant national operators, which has
182 ECLAC
74 Not all “killer applications” are successful, and many of them have not yet borne fruit (video conferencing, video on demand, interactive
television, WebTV and others) (Macarrón, 2000).
lifted the entry barriers for private operators, and theauctioning of mobile telephony licences. Mostcountries are now at the stage of opening up the sectorto more competitors. The results have variedconsiderably, both between different telecom-munications market segments and between differentcountries and types of companies.
Competition has not emerged to the same degree inall market segments. In the local fixed-line segment,privatization of the dominant operator has generallyresulted in the public-sector monopoly being replaced bya private-sector one, even though the ultimate objectivemay be to open up the market to competition. In thelong-distance segment, competition has increasedaround the world, bringing down prices to such a degreethat this service has come to be classed by some as a“commodity” (TeleGeography, 2000 and Minges,1999). In the mobile telephony segment, competitionwas generally greater during the industry’s early years,as there was no need to use the networks of otheroperators. It might be concluded that there is an inverserelationship between the maturity of a segment and thelevel of competition to be found there; in other words, thenewer segments are more competitive (see figure IV.3).
Not only have the effects differed betweensegments, but change has not happened in the same wayor at the same time in major markets such as the UnitedStates and the European Union (EU). In Latin America,there have also been large differences betweencountries.
In the twentieth century, federal authorities in theUnited States questioned the dominance of AT&TCorporation in basic telecommunications (AT&T,2001). In 1913, AT&T was obliged under theKingsbury Agreement to give outside companiesaccess to its network and to dispose of its interests in theWestern Union telegraph company. In 1956, a rulingnegotiated between AT&T and the Department ofJustice restricted the company’s activities to regulatedtelephony in the national telephone system, prohibitingit from acting in other areas or industries. Theserestrictions were lifted in 1982, at which time it was
agreed that AT&T would be split up. As a result of thisbreak-up, which was implemented in 1984, thecompany’s regional basic telephony subsidiaries werespun off as independent corporations, giving rise to theRegional Bell Operating Companies (known as “BabyBells”).75 From then on, these new companies were toprovide basic telephony while AT&T specialized inlong-distance services. In 1993, the United StatesCongress ruled that competition should be a fundamentalobjective in what it termed “commercial mobile radioservices” (FCC, 2000b). In the new telecommunicationsact of 1996, an attempt was made to enhance this processby allowing greater competition between long-distanceand local telephony. In exchange for opening up theirmarkets to greater competition, local telephone operatorswere offered the chance to enter the long-distancesegment. Thus, competition was introduced into thebasic telephony segment of the United Statestelecommunications industry by way of a long,incremental process that centred on antitrust measuresand initiatives to promote greater competition in othersegments.
For all the efforts to boost competition in the UnitedStates, little has been achieved, although the results varybetween market segments.
In local telephony, the actual changes achievedwere far smaller than anticipated and did not match upto the expectations created by the 1996telecommunications act, one of whose objectives wasto stimulate competition among the seven Baby Bells intheir respective regional markets. What has actuallyhappened has been the complete reverse: instead oftrying to win market share in their rivals’ regions, theBaby Bells have merged with one another, with theresult that their number has now fallen to four,76 andhave confined themselves to their respective “domains”in regional local telephony.77 Newly enteringcompetitive local exchange carriers have not succeededin attaining a significant market share (in 1999 theyaccounted for less than 6.7% of all main lines) (FCC,2000a). The result is that service prices have barelychanged at all. In fact, according to FCC data, they
Foreign investment in Latin America and the Caribbean, 2000 183
75 In 1984, AT&T was split up into eight companies: a long-distance service provider (AT&T) and seven regional local service providers (the Baby
Bells). The Baby Bells were Ameritech, Southwestern Bell (SBC), Pacific Telesis, Nynex, Bell Atlantic, BellSouth and US West.
76 SBC bought Pacific Telesis and Ameritech, and Bell Atlantic bought Nynex. The four Baby Bells now remaining are Verizon (the name adopted
by Bell Atlantic after it absorbed GTE, another telecommunications company), SBC Communications, US West and BellSouth.
77 William Kennard, President of the United States Federal Communications Commission until early 2001, has said: “…In the United States, the
courts decreed that transmissions across our state lines, what we call long distance, be made competitive, but it took 15 years to make that a
reality. Now we are trying to create the same kind of competition in the local telephone market, inside our state borders. Today that market is
where long distance was 15 years ago, but we do not have the luxury of 15 more years to make this happen. The same industry that shook our
hands in 1996 handed us lawsuits in 1997. This year, some companies have used the budget process to try to undo agreements industry made with
us earlier in the year. Industry tries to achieve in a lawmaker’s office what they could not achieve in open hearings before our agency.” (Kennard,
2000).

actually rose by 3% over the 1990s (CNNfn, 2001a and2001b).
In long-distance telephony, the dominance ofAT&T as a service supplier has greatly decreased.Before 1984 the company had more than 90% of themarket, but by 1999 its share had fallen to less than half(40%), and new entrants had established a strongerpresence, with WorldCom accounting for 25% of themarket and Sprint for 10% (FCC, 2001). There had alsobeen a proliferation of smaller operators. This increasedcompetition has driven down prices substantially,particularly for international calls. Between 1992 and1999, average revenue per minute for operators in thelong-distance segment fell from US$ 1.04 to US$ 0.56 atcurrent prices for international calls, and from US$ 0.15to US$ 0.11 for national ones (FCC, 2001). Progresstowards a more competitive market in long-distancetelephony has been substantial, and althoughconcentration is still high (three large operators have75% of the market between them), there is no sign of anymovement towards consolidation among the firms thatare currently dominant. Rather, the tendency is towardsgreater fragmentation.
In the cellular mobile telephony market, wherecompetition between operators has been possible fromthe outset, 88% of the United States population cancurrently choose between three or more different mobiletelephony service options, but the tendency lately hasbeen for a few operators to take an increasingly largeshare of the market. Mergers and acquisitions have leftjust three companies with almost two thirds of allsubscribers: Verizon Wireless, owned by Verizon/Vodafone (30%); Cingular, owned by SBC/BellSouth(19.2%); and AT&T Wireless, owned by AT&T andDoCoMo (12.9%) (FCC, 2000b).78 Service rates hadfallen substantially (from US$ 96.83 a month inDecember 1987 to US$ 39.43 in December 1998), butthen began to trend upward in 1999. Recently, in January2001, 422 mobile telephony licences were auctioned offin the United States. The three main operators namedabove bought 236 of them for sums amounting to 80% ofthe total raised by the auction.79 To prevent too high aproportion of the licences from falling into the hands ofthe three dominant companies, FCC had placed some ofthem off limits by reserving them for small operators.The three companies circumvented this restriction,
however, by entering into partnerships with some ofthese small operators (CNNfn, 2001c).
Thus, although one of the countries that pioneeredcompetition in telecommunications has indeed madesome progress in this area, the results have varied bymarket segment and have not been entirely satisfactoryoverall. It is undeniable that the thrust of regulation in thesector has been to enhance competition, but the mergersand acquisitions carried out by the dominant companies,and endorsed by the authorities, have to some extentcancelled out the effects of this approach.
In the EU, by contrast with the United States, thedominant operators have traditionally been Statecompanies. Great Britain was the first country tointroduce competition when it awarded Mercury, aprivate-sector company owned by Cable & Wireless, alicence to operate the full range of services nationally.This step, which was taken in 1982, was followed in1984 by full privatization of British Telecom (BT). Thetwo companies —BT and Mercury— operated as aduopoly until 1991, when the market was opened up tocompetition (AHCIET, 1999). In addition, the concept of“asymmetrical regulation” was introduced to favour newentrants that had to compete with the establishedoperators. In other European countries, by contrast, thedominant operators were privatized later (second half ofthe 1990s) and in a gradual and incomplete fashion, andmarket opening was gradual. To counterbalance this,measures were introduced to limit anticompetitivepractices by the dominant basic telephony operators,which took the form of high charges and interconnectionfees and cross-subsidies. In 1997, regulatory changes inthe home countries of the main transnationaltelecommunications corporations were reflected at themultilateral level in the Fourth Protocol to the WorldTrade Organization (WTO) General Agreement on Tradein Services (GATS), which was signed by 69 countries.The aim of this protocol is to open the way, in the basictelephony segment, to privatization of dominantoperators, access to their facilities for outside companiesand greater competition through market liberalization.
The new regulations designed to encourage greatercompetition did affect price levels and supplyconcentration in the countries of the EU; between 1997and 1999, the national and international long-distancemarket shares of the dominant operators fellsubstantially (from 93% to 81% and from 97% to 88%,
184 ECLAC
78 Deutsche Telekom, which planned to enter the United States mobile telephony market by purchasing Voicestream, has been held up by the fact
that under United States law special approval from Congress is required in cases where companies are more than 25% State-owned (the German
Government owns a large share (over 50%) of the company).
79 Verizon paid US$ 8.8 billion for 113 licences, Cingular US$ 2.3 billion for 79 licences and AT&T US$ 2.9 billion for 44 licences (CNNfn,
2001c).

respectively). In local telephony, however, thechanges were smaller (from 99% to 96%). There wasalso an appreciable reduction in long-distance rates,particularly in the international segment. Between1997 and 2000, average prices in the EU countries,weighted by the number of inhabitants, fell by 32% orso for households and by 34% or so for businesses. Fornational long distance, the reduction was smaller, thefigures being 9.5% and 20%, respectively. Bycontrast, local telephony rates rose over the sameperiod, with the weighted average price of athree-minute call increasing by 15.1% and that of a10-minute call by 7.5% (European Commission,2000). The divergent paths taken by local andlong-distance rates are largely the result of moreaccurate cost allocation and the ending ofcross-subsidies between telephony segments, which hadmade local calls artificially inexpensive.
Since growth in cellular mobile telephony, bycontrast with fixed-line telephony, has not beenconstrained by the need to use the facilities of third
parties,80 progressively increasing competition has beena feature of the segment since the outset. The EU iscreating a universal mobile telecommunications systemwithin the framework of the ITU IMT-2000 initiative tosupport the introduction of coherent mobile systemsfrom 1 January 2002. As part of this process, 43 newlicences (four to six per country as a rule, valid for 15 to20 years) have been awarded (generally by auction, butin some cases by a comparative evaluation process) for3G mobile telephony81 (see table IV.1).
In Europe, the sector’s attention is focused entirelyon these new cellular mobile telephony licences and thecompanies that have purchased them. The mostprominent purchasers of these are two corporations thathave the potential to achieve a very large digital footprintin the EU: Vodafone (with eight licences, in Austria,Germany, Italy, the Netherlands, Portugal, Spain,Sweden and the United Kingdom) and France Télécom(with seven licences, in Austria, Germany, Italy, theNetherlands, Portugal, Sweden and the UnitedKingdom). At an intermediate level are four companies
Foreign investment in Latin America and the Caribbean, 2000 185
Figure IV.3TELECOMMUNICATIONS: THE COMPETITIVE SITUATION IN DIFFERENT SEGMENTS, 1999
(Percentages of countries)
0
10
20
30
40
50
60
70
80
Basic Service Celular Mobile PSI
Monopoly Duopoly Competition
Source: ECLAC, Information Centre of the Unit on Investment and Corporate Strategies, Division of Production, Productivity andManagement, on the basis of information provided by L. Mannisto, "Examining the Opportunities and Challenges for ISPs inDeveloping Countries", document presented at the ISP forum, IIR, Amsterdam, 30 November 1999 (http://www.itu.org).
80 Except for calls ending in the fixed-line network.
81 The latest auctions held in Italy, Switzerland and France did not attract many bidders, presumably because of the high cost involved and the
difficult financial situation of the main international operators, which have been severely affected by falling share prices.

186 ECLAC
Table IV.1THIRD-GENERATION (3G) LICENCES IN THE EUROPEAN UNION
Country / Total valueCompanies awarded Known corporate- Selection method (millions of Current situationlicences affiliation- Number of licences dollars)
- Validity (years) - per capita
Austria 714 Awarded in Connect Austriaa
France Télécom- auction - 88 November 2000 Hutchison Hutchison- 6 Tele.ring Vodafone- 20 Max.mobile
aDeutsche Telekom
Mobilkoma
Telekom Austria3G Mobile Telefónica (Spain)
France Suspended in- official evaluation January 2001
Germany 46 214 Awarded in T-Mobila
Deutsche Telekom- auction - 562 August 2000 Mobilcom
aFrance Telecom
- 6 VIAGa
British Telecom- 20 Group 3G Telefónica / Sonera
D2a
VodafoneE-Plus Hutchison
Italy 10 084 Awarded in Omnitela
Vodafone / Verizon- auction - 175 October 2000 Ipse Telefónica (Spain)- 5 Andala Hutchison- 15 Wind
aENEL / France Télécom
TIMa
Telecom Italia
Netherlands 2 515 Awarded in Libertela
Vodafone- auction - 160 July 2000 KPN Mobile
aKPN (Neth.) / DoCoMo
- 5 Dutchtonea
France Télécom- 15 Telfort
aBritish Telecom
3G Blue Deutsche Telekom
Portugal 357 Awarded in Telecela
Vodafone- official evaluation - 36 December 2000 TMN
aPortugal Telecom
- 4 Oni Way Varias- 15 Optimus
aFrance Télécom
Spain No cost Awarded in Telefónicaa
Telefónica (Spain)- official evaluation March 2000 Airtel
aVodafone
- 4 Retevisióna
Telecom Italia / Endesa- 20 Xfera Vivendi / Sonera
Sweden 0.04 Awarded in Europolitana
Vodafone- official evaluation December 2000 Tele2
aNetCom
- 4 Orange France Télécom- 15 Hi3G Access Hutchison
United Kingdom 35 411 Awarded in British Telecoma
British Telecom- auction - 595 April 2000 Vodafone Vodafone- 5 Orange France Télécom- 20 One-2-One Deutsche Telekom
TIW Hutchison / TIW (Can.)
EU total 95 29543 licences - 394
Source: ECLAC, Unit on Investment and Corporate Strategies, Division of Production, Productivity and Management, on the basis of information from theInternational Telecommunication Union (ITU), “Status of IMT-2000 (UMTS) 3G licensing in Western Europe: situation at February 2001”, 2000(http://www.itu.org), and 3G Generation, 2001 (http://www.3g-generation.com).
aExisting GSM operator.

with smaller digital footprints: Hutchison (UnitedKingdom), a subsidiary of the Hutchison WhampoaGroup based in Hong Kong SAR (with five licences, inAustria, Germany, Italy, Sweden and the UnitedKingdom), Deutsche Telekom (with four licences, inAustria, Germany the Netherlands and the UnitedKingdom), Telefónica de España (with four licences, inAustria, Germany, Italy and Spain) and British Telecom(with three licences, in Germany, the Netherlands andthe United Kingdom). Lastly, there are companies thathave just one or two licences and that have not been ableto put together Europe-wide systems.
Vodafone and France Télécom have significantcompetitive advantages over other operators, such asDeutsche Telekom and British Telecom. There are twomain reasons for this: on the one hand, they have morelicences, which gives them a larger digital footprint, andon the other, they have acquired not only licences with anextremely high per capita cost (Germany and the UnitedKingdom), but also some relatively cheap ones (Austria,Italy, the Netherlands, Portugal, Spain and Sweden),which means there is scope for cross-subsidizationbetween countries. By contrast, the 3G digital footprintsof Deutsche Telekom and British Telecom are heavilyconcentrated in countries where licences were veryexpensive. Another striking aspect of this process is theentry of Hutchison Whampoa Group from Hong KongSAR. While some analysts, such as Forrester Research(The Economist, 3 February 2001), suggest that themobile telephony industry in Europe will end up in thehands of just four operators (Vodafone, DeutscheTelekom, France Télécom and British Telecom),Hutchison’s partnership with DoCoMo of Japan andKPN Mobile of the Netherlands could give DoCoMo afoothold in the European 3G market. At the same time, itwould seem that the competitive position of companiessuch as Telefónica de España and Telecom Italia is not asstrong as it might be.
To sum up, it can be seen that in the United Statesand the EU, efforts have been made to foster greatercompetition in the telecommunications industry.Progress in this respect in long-distance telephony, forexample, has been substantial. By contrast, enhancingcompetition in basic telephony has proved moredifficult, despite the break-up of AT&T and theprivatization of dominant operators in Europe. Asregards mobile telephony, the extra competition createdby awarding new licences seems to have been partly
offset by a simultaneous process of consolidation amongthe leading companies. In other words, any evaluation ofprogress in strengthening competition in thetelecommunications sector needs to distinguish betweensegments, countries and companies.
The Latin America and Caribbean region has notbeen unaffected by the huge changes that have takenplace in the world telecommunications market. MostState-owned operators in Latin America have beenprivatized over the past 10 years, and the level ofprivate-sector involvement in the telecommunicationssector is extremely high, with the major internationaloperators playing a particularly important role (seeboxes IV.2, IV.3, IV.4 and chapter II). Between 1990 and1999, the telecommunications industry madeconsiderable progress in the main countries of the region.In almost all of them, the number of main and residentiallines per 100 inhabitants doubled over the period, whilein the case of Chile it almost trebled; the number ofcellular telephone subscribers per 100 inhabitants rosespectacularly; the number of faults per 100 inhabitantsfell, albeit less so in Chile; and service charges and coststended as a rule to decline in all the countries, although inArgentina monthly charges for business lines andcellular telephones rose in relative terms, while inMexico business connection charges remained high incomparative terms (see table IV.2). It can thus be seenthat, although with large differences between countries,the performance of the telecommunications industry inLatin America improved substantially during the 1990s.
In the early 1990s, the authorities saw privatizationof public-sector assets as an opportunity to improve thedelicate economic situation then existing in many of theregion’s countries. With the notable exception of Brazil,increasing competition was not one of the primeobjectives of privatization policy in the Latin Americantelecommunications sector.82 Rather, the aim was tomaximize FDI inflows and regain access to internationalfinancial markets (Argentina) or to defend an importantnational operator (Mexico) (see boxes IV.2 and IV.3). Infact, the long exclusivity periods granted to companiesparticipating in these processes ran counter to allrecommendations for achieving greater competition inthe sector. Generally speaking, furthermore, there wereno formal arrangements for policy analysis or evenregulation: the rules governing the sector were generallyestablished by decree; specific legislation and regulatoryauthorities were often created only after State
Foreign investment in Latin America and the Caribbean, 2000 187
82 In the case of Chile, which pioneered telecommunications privatization in Latin America, although the new legislation (1982) does not
countenance a legal monopoly in any service, in practice the market had monopoly characteristics until 1994 in long distance, and still does in
basic telephony. In an initial stage, which lasted until 1990, the emphasis of regulation was on the sale of State-owned enterprises. In a
subsequent stage, during the 1990s, the focus was on the structure of the sector, and particularly on competition (see chapter II).
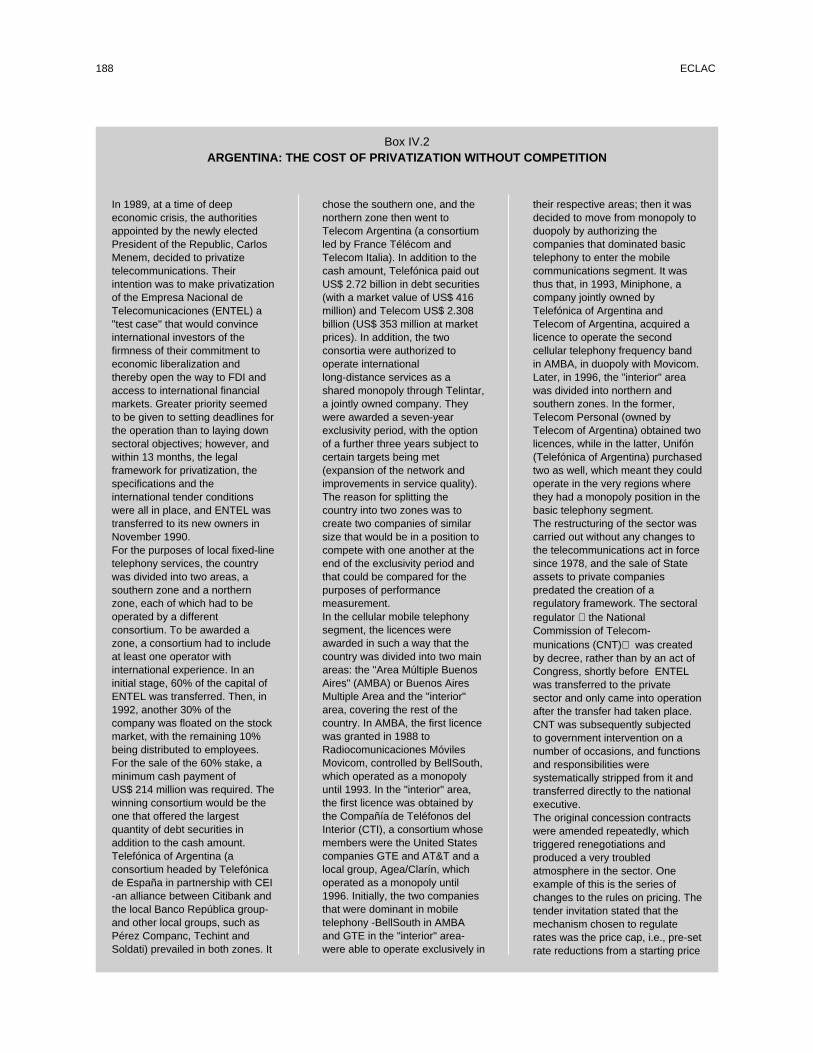
188 ECLAC
In 1989, at a time of deepeconomic crisis, the authoritiesappointed by the newly electedPresident of the Republic, CarlosMenem, decided to privatizetelecommunications. Theirintention was to make privatizationof the Empresa Nacional deTelecomunicaciones (ENTEL) a"test case" that would convinceinternational investors of thefirmness of their commitment toeconomic liberalization andthereby open the way to FDI andaccess to international financialmarkets. Greater priority seemedto be given to setting deadlines forthe operation than to laying downsectoral objectives; however, andwithin 13 months, the legalframework for privatization, thespecifications and theinternational tender conditionswere all in place, and ENTEL wastransferred to its new owners inNovember 1990.For the purposes of local fixed-linetelephony services, the countrywas divided into two areas, asouthern zone and a northernzone, each of which had to beoperated by a differentconsortium. To be awarded azone, a consortium had to includeat least one operator withinternational experience. In aninitial stage, 60% of the capital ofENTEL was transferred. Then, in1992, another 30% of thecompany was floated on the stockmarket, with the remaining 10%being distributed to employees.For the sale of the 60% stake, aminimum cash payment ofUS$ 214 million was required. Thewinning consortium would be theone that offered the largestquantity of debt securities inaddition to the cash amount.Telefónica of Argentina (aconsortium headed by Telefónicade España in partnership with CEI-an alliance between Citibank andthe local Banco República group-and other local groups, such asPérez Companc, Techint andSoldati) prevailed in both zones. It
chose the southern one, and thenorthern zone then went toTelecom Argentina (a consortiumled by France Télécom andTelecom Italia). In addition to thecash amount, Telefónica paid outUS$ 2.72 billion in debt securities(with a market value of US$ 416million) and Telecom US$ 2.308billion (US$ 353 million at marketprices). In addition, the twoconsortia were authorized tooperate internationallong-distance services as ashared monopoly through Telintar,a jointly owned company. Theywere awarded a seven-yearexclusivity period, with the optionof a further three years subject tocertain targets being met(expansion of the network andimprovements in service quality).The reason for splitting thecountry into two zones was tocreate two companies of similarsize that would be in a position tocompete with one another at theend of the exclusivity period andthat could be compared for thepurposes of performancemeasurement.In the cellular mobile telephonysegment, the licences wereawarded in such a way that thecountry was divided into two mainareas: the "Area Múltiple BuenosAires" (AMBA) or Buenos AiresMultiple Area and the "interior"area, covering the rest of thecountry. In AMBA, the first licencewas granted in 1988 toRadiocomunicaciones MóvilesMovicom, controlled by BellSouth,which operated as a monopolyuntil 1993. In the "interior" area,the first licence was obtained bythe Compañía de Teléfonos delInterior (CTI), a consortium whosemembers were the United Statescompanies GTE and AT&T and alocal group, Agea/Clarín, whichoperated as a monopoly until1996. Initially, the two companiesthat were dominant in mobiletelephony -BellSouth in AMBAand GTE in the "interior" area-were able to operate exclusively in
their respective areas; then it wasdecided to move from monopoly toduopoly by authorizing thecompanies that dominated basictelephony to enter the mobilecommunications segment. It wasthus that, in 1993, Miniphone, acompany jointly owned byTelefónica of Argentina andTelecom of Argentina, acquired alicence to operate the secondcellular telephony frequency bandin AMBA, in duopoly with Movicom.Later, in 1996, the "interior" areawas divided into northern andsouthern zones. In the former,Telecom Personal (owned byTelecom of Argentina) obtained twolicences, while in the latter, Unifón(Telefónica of Argentina) purchasedtwo as well, which meant they couldoperate in the very regions wherethey had a monopoly position in thebasic telephony segment.The restructuring of the sector wascarried out without any changes tothe telecommunications act in forcesince 1978, and the sale of Stateassets to private companiespredated the creation of aregulatory framework. The sectoralregulator � the NationalCommission of Telecom-munications (CNT)� was createdby decree, rather than by an act ofCongress, shortly before ENTELwas transferred to the privatesector and only came into operationafter the transfer had taken place.CNT was subsequently subjectedto government intervention on anumber of occasions, and functionsand responsibilities weresystematically stripped from it andtransferred directly to the nationalexecutive.The original concession contractswere amended repeatedly, whichtriggered renegotiations andproduced a very troubledatmosphere in the sector. Oneexample of this is the series ofchanges to the rules on pricing. Thetender invitation stated that themechanism chosen to regulaterates was the price cap, i.e., pre-setrate reductions from a starting price
Box IV.2ARGENTINA: THE COST OF PRIVATIZATION WITHOUT COMPETITION
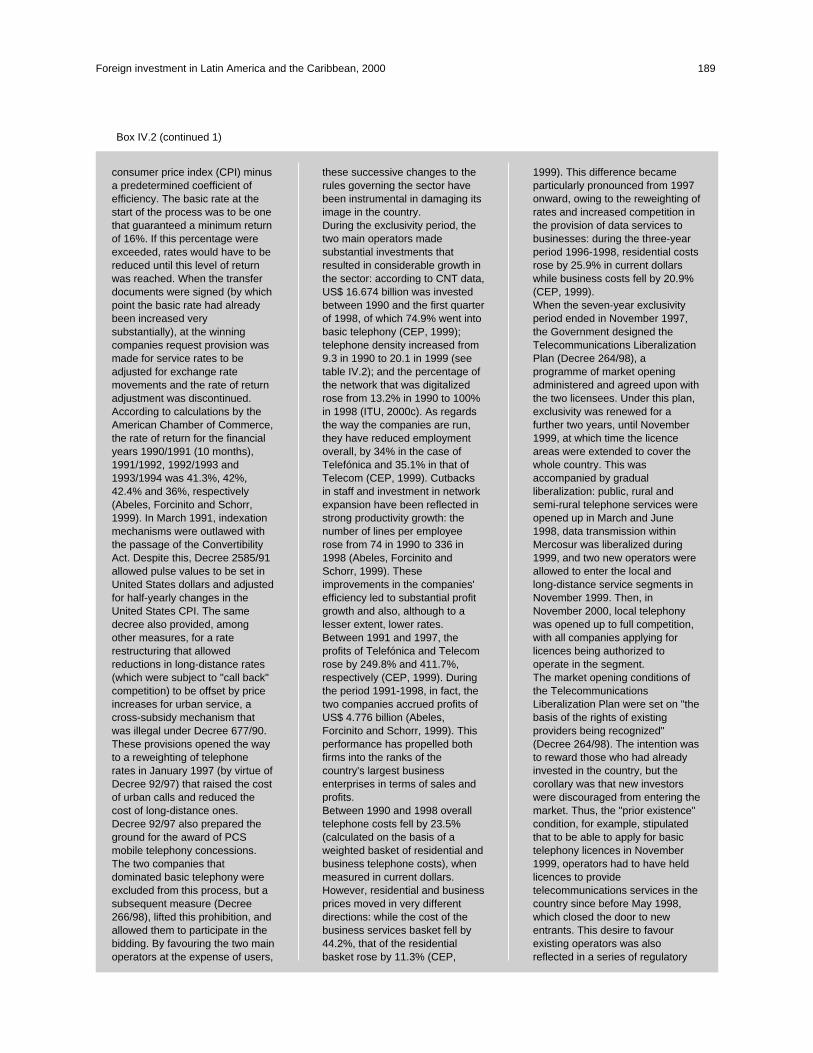
Foreign investment in Latin America and the Caribbean, 2000 189
consumer price index (CPI) minusa predetermined coefficient ofefficiency. The basic rate at thestart of the process was to be onethat guaranteed a minimum returnof 16%. If this percentage wereexceeded, rates would have to bereduced until this level of returnwas reached. When the transferdocuments were signed (by whichpoint the basic rate had alreadybeen increased verysubstantially), at the winningcompanies request provision wasmade for service rates to beadjusted for exchange ratemovements and the rate of returnadjustment was discontinued.According to calculations by theAmerican Chamber of Commerce,the rate of return for the financialyears 1990/1991 (10 months),1991/1992, 1992/1993 and1993/1994 was 41.3%, 42%,42.4% and 36%, respectively(Abeles, Forcinito and Schorr,1999). In March 1991, indexationmechanisms were outlawed withthe passage of the ConvertibilityAct. Despite this, Decree 2585/91allowed pulse values to be set inUnited States dollars and adjustedfor half-yearly changes in theUnited States CPI. The samedecree also provided, amongother measures, for a raterestructuring that allowedreductions in long-distance rates(which were subject to "call back"competition) to be offset by priceincreases for urban service, across-subsidy mechanism thatwas illegal under Decree 677/90.These provisions opened the wayto a reweighting of telephonerates in January 1997 (by virtue ofDecree 92/97) that raised the costof urban calls and reduced thecost of long-distance ones.Decree 92/97 also prepared theground for the award of PCSmobile telephony concessions.The two companies thatdominated basic telephony wereexcluded from this process, but asubsequent measure (Decree266/98), lifted this prohibition, andallowed them to participate in thebidding. By favouring the two mainoperators at the expense of users,
these successive changes to therules governing the sector havebeen instrumental in damaging itsimage in the country.During the exclusivity period, thetwo main operators madesubstantial investments thatresulted in considerable growth inthe sector: according to CNT data,US$ 16.674 billion was investedbetween 1990 and the first quarterof 1998, of which 74.9% went intobasic telephony (CEP, 1999);telephone density increased from9.3 in 1990 to 20.1 in 1999 (seetable IV.2); and the percentage ofthe network that was digitalizedrose from 13.2% in 1990 to 100%in 1998 (ITU, 2000c). As regardsthe way the companies are run,they have reduced employmentoverall, by 34% in the case ofTelefónica and 35.1% in that ofTelecom (CEP, 1999). Cutbacksin staff and investment in networkexpansion have been reflected instrong productivity growth: thenumber of lines per employeerose from 74 in 1990 to 336 in1998 (Abeles, Forcinito andSchorr, 1999). Theseimprovements in the companies'efficiency led to substantial profitgrowth and also, although to alesser extent, lower rates.Between 1991 and 1997, theprofits of Telefónica and Telecomrose by 249.8% and 411.7%,respectively (CEP, 1999). Duringthe period 1991-1998, in fact, thetwo companies accrued profits ofUS$ 4.776 billion (Abeles,Forcinito and Schorr, 1999). Thisperformance has propelled bothfirms into the ranks of thecountry's largest businessenterprises in terms of sales andprofits.Between 1990 and 1998 overalltelephone costs fell by 23.5%(calculated on the basis of aweighted basket of residential andbusiness telephone costs), whenmeasured in current dollars.However, residential and businessprices moved in very differentdirections: while the cost of thebusiness services basket fell by44.2%, that of the residentialbasket rose by 11.3% (CEP,
1999). This difference becameparticularly pronounced from 1997onward, owing to the reweighting ofrates and increased competition inthe provision of data services tobusinesses: during the three-yearperiod 1996-1998, residential costsrose by 25.9% in current dollarswhile business costs fell by 20.9%(CEP, 1999).When the seven-year exclusivityperiod ended in November 1997,the Government designed theTelecommunications LiberalizationPlan (Decree 264/98), aprogramme of market openingadministered and agreed upon withthe two licensees. Under this plan,exclusivity was renewed for afurther two years, until November1999, at which time the licenceareas were extended to cover thewhole country. This wasaccompanied by gradualliberalization: public, rural andsemi-rural telephone services wereopened up in March and June1998, data transmission withinMercosur was liberalized during1999, and two new operators wereallowed to enter the local andlong-distance service segments inNovember 1999. Then, inNovember 2000, local telephonywas opened up to full competition,with all companies applying forlicences being authorized tooperate in the segment.The market opening conditions ofthe TelecommunicationsLiberalization Plan were set on "thebasis of the rights of existingproviders being recognized"(Decree 264/98). The intention wasto reward those who had alreadyinvested in the country, but thecorollary was that new investorswere discouraged from entering themarket. Thus, the "prior existence"condition, for example, stipulatedthat to be able to apply for basictelephony licences in November1999, operators had to have heldlicences to providetelecommunications services in thecountry since before May 1998,which closed the door to newentrants. This desire to favourexisting operators was alsoreflected in a series of regulatory
Box IV.2 (continued 1)
190 ECLAC
provisions or omissions thatcreated major barriers to the entryof new competitors in bothbasicand mobile telephony. Thesebarriers included the rigorousrequirements and commitmentsimposed on new entrants(particularly the requirement toconstruct a network of their ownand provide a certain minimumlevel of coverage); highinterconnection fees and theabsence of number portability.The liberalization timetable andthe conditions that had to be metby new entrants were designed toprevent the problem of marketskimming, fragmentation thatmight prove counterproductive (interms of economies of scale andscope) as well as "ruinouscompetition", and to ensure thesolidity of the companiesoperating in the market. The endresult was that the companieswhich obtained local andlong-distance service licences inNovember 1999 were the twomobile telephony serviceproviders that were not linked toTelefónica or Telecom: Compañíade Teléfonos del Plata (created byBellSouth-Movicom) andCompañía Telefónica Integral(GTE-Clarín).Some five months previously, thesame four basic telephonylicensees had shared betweenthem the 12 PCS mobiletelephony licences auctioned off inJune 1999, which, in accordancewith Decree 266/98, covered theAMBA and the southern andnorthern zones of the "interior"area (four licences per area). Ofthe two highest-frequency bandsin the AMBA, one was acquired bya consortium led by Telefónica
and Telecom and the other by aconsortium headed by GTE. Thetwo lowest-frequency bands weresecured by Movicom (BellSouth)and Miniphone(Telefónica/Telecom). In thesouthern zone of the interior, thefirst two bands went to Telecomand Movicom, and the other twowere awarded to Unifón(Telefónica) and CTI. Lastly, in thenorthern zone, the high-frequencybands were awarded to Telefónicaand Movicom, and thelow-frequency ones to CTI andTelecom.The change of Administration inlate 1999 led to renewed debateover the methods used toliberalize the telecommunicationsmarket. The points at issue weremainly the licensing system,interconnection fees and numberportability. At length, in August2000, a new decree was signed,providing, among other measures,for liberalization of the licensingsystem to allow any operator toenter the market withoutpreconditions, a 53% cut ininterconnection fees, numberportability and the creation of aspecial Universal Service Fund, towhich operators were to contribute1% of their turnover. The licencesawarded are generaltelecommunications licencesunder which services and marketscan be integrated. By the monthchosen for market liberalization,November 2000, 20 newcompanies had obtained licencesto operate basic (local andlong-distance) telephony services.Of these, the most active areImpsat (an Argentine company),Techtel (alliance between Telmexand Techint) and Keytech (AT&T),
all of which were already providingdata transmission services tocompanies beforehand and which,now that the new regulatoryframework allows them to diversifyand introduce new services, arebuilding infrastructure that willenable them to providelong-distance services in the largercities and within Mercosur.According to official estimates,telecommunications investment in2000 totalled around US$ 4 billion,double the annual average for thesector over the previous five years.The Government expects the newentrants to invest between US$ 4billion and US$ 5 billion in 2001 and2002, on top of the investmentsmade by the established firms.After a decade characterized byexclusivity in basic telephony andlimited competition in mobiletelephony, the telecommunicationssector in Argentina is entering anew phase in which there will be nolegal impediments to the entry ofnew operators. The long period ofexclusivity in basic telephony haschiefly benefited two companies:Telefónica of Argentina andTelecom of Argentina, whichaccrued large monopoly profitswhile making major investmentsthat paved the way for substantialgrowth in the sector. The lack ofcompetition not only kept pricesrelatively high, but also allowedthese companies to establish aposition of solid dominance in thesector by building up substantialfirst-mover advantages that haveenabled them to construct highentry barriers. To improveconditions for new entrants at thecurrent stage of liberalization, oneof the priorities of the regulatoryauthorities should be to counteractthe first-mover advantages built upby the two dominant operators.
Source: ECLAC, Unit on Investment and Corporate Strategies, Division of Production, Productivity and Management, on the basis of informationprovided by Martín Abeles, Karina Forcinito and Martín Schorr, "Las telecomunicaciones en Argentina. Regulación, poder de mercado yganancias extraordinarias frente a la liberalización", Informe de coyuntura, year 9, No. 82, Buenos Aires, Buenos Aires Research Centre,September-October 1999; Daniel Azpiazu, "Las renegociaciones contractuales en los servicios públicos privatizados ¿Seguridad jurídica opreservación de rentas de privilegio?", Realidad económica, No. 164, Buenos Aires, 16 May to 30 June 1999; Marcelo Celani, "Determinantesde la inversión en telecomunicaciones en Argentina", Reformas económicas series, No. 9 (LC/L.1157), Santiago, Chile, EconomicCommission for Latin America and the Caribbean (ECLAC), November 1998; Production Research Centre (CEP), "Infraestructura: una reseñade los años 90", Buenos Aires, Secretariat of Industry, Commerce and Mining, 1999; Andrés Chambouleyron, "Las telecomunicaciones en
Box IV.2 (continued 2)
Foreign investment in Latin America and the Caribbean, 2000 191
Argentina y Chile: modelos diferentes con resultados diferentes", Informe de coyuntura, year 9, No. 82, Buenos Aires, Buenos Aires ResearchCentre, September-October 1999; Ahmed Galal and Bharat Nauriyal, "Regulating Telecommunications in Developing Countries: Outcomes,Incentives and Commitment", Policy Research Working Paper, No. 1520, Washington, D.C., Policy Research Department, World Bank,October 1995 (http://www.worldbank.org/html/dec/Publications/Workpapers/wps2136); Matías Kulfas, "La transformación de lastelecomunicaciones en la Argentina durante los años noventa: tendencias y perspectivas a partir del proceso de liberalización", Santiago,Chile, Unit on Investment and Corporate Strategies, Division of Production, Productivity and Management, Economic Commission for LatinAmerica and the Caribbean (ECLAC), January 2000, unpublished; Página 12, 9 November 2000 (http://www.pagina12.com.ar/), and "Aperturatelefónica", Cash supplement, 5 November 2000 (http://www.pagina12.com.ar/2000/suple/cash/); Luis Alberto Romero, "La telefonía celularen la República Argentina", Buenos Aires, National Commission of Communications, 2000 (http://www.AHCIET.net/inalambricos/IIFATICMS.asp); Guillermo Rozenwurcel, "El nuevo marco regulatorio de las telecomunicaciones en la Argentina: ¿A favor o encontra del desarrollo de la competencia?", Informe de coyuntura, year 9, No. 82, Buenos Aires, Buenos Aires Research Centre,September-October 1999; International Telecommunication Union (ITU), Yearbook of Statistics: Telecommunications Services ChronologicalTime Series, 1989-1998, Geneva, February 2000; Santiago Urbiztondo, "Las telecomunicaciones en la Argentina: aspectos salientes de laexperiencia reciente y perspectivas futuras", Informe de coyuntura, year 9, No. 82, Buenos Aires, Buenos Aires Research Centre,September-October 1999; United States Office of Telecommunications Technologies, "Argentina: telecommunications market", 2001(http://infoserv2.ita.doc.gov); and Scott Wallsten, "An empirical analysis of competition, privatization, and regulation in telecommunicationsmarkets in Africa and Latin America", Policy Research Working Paper, No. 2136, Washington, D.C., Policy Research Department, World Bank,June 1999 (http://www.worldbank. org/html/dec/Publications/Workpapers/wps2136).
Box IV.2 (concluded)
Teléfonos de México (Telmex) isthe largest company of its kind inMexico and one of the fewgenuinely nationaltelecommunications operatorsremaining in the region. Telmex isalso the only Latin Americantelecommunications company toappear on the list of the world'slargest telephony operators byrevenue (see table IV.3), where itfigures among the top performersin the fixed-line and internationaltelephony segments. It is also thelargest company on the Mexicanstock exchange. In 2000, Telmexsales were in excess of US$ 11.7billion, a figure not exceeded byany other Mexican company withforeign stakeholders, includingGeneral Motors of Mexico andDaimler-Chrysler of Mexico.Telmex has changed ownershipmany times. It began trading in1948 as a foreign-owned privatecompany (a subsidiary ofEricsson), before becoming aMexican-owned private companyin 1958. The State took a minorityshareholding in 1962, convertingthis into a majority holding in1972. Telmex was privatized in1990, becoming once again a
private telephone company. Whenthe Administration of PresidentSalinas de Gortari announced thefirm's privatization in 1989,reference was made to the needto improve services, extendcoverage and guarantee the rightsof Telmex workers. In order tofacilitate the privatizationarrangements, a substantialproportion of the company'soutstanding external debt wasconverted into national publicdebt. Under the existing sharedistribution system, theGovernment owned the class-AAshares, which had 51% of thevoting rights, while the remaining49% were traded on the stockmarket. This system was replacedby one involving the creation ofclass-L shares, which had limitedvoting rights and represented 60%of the company's assets by value,even though control remained inthe hands of class-AAshareholders. There were alsoclass-A shares, representing19.6% of the company's value.When Telmex was privatized in1990, the two main objectiveswere very clear: to extend andmodernize existing networks, and
to consolidate a local company asthe dominant telecommunicationsoperator before the market wasopened up to competition. In 1990,a consortium formed by theMexican Carso group (10.4%),Southwestern Bell (5%) and asubsidiary of France Télécom (5%)paid US$ 1.757 billion for theclass-AA shares that controlledTelmex voting rights. During theperiod 1990-1995, regulatoryfunctions were exercised, on adiscretionary basis, by theSecretariat of Communications andTransport. It awarded Telmex along-term concession to operatebasic telephony (up to 2026, withthe possibility of a further 15-yearextension), with a six-yearexclusivity period for the provisionof national long-distance andinternational services. Specificlimits were also placed on foreignshareholdings in telephonecompanies (a maximum of 49%and a limit of 10% for any oneinvestor). In return, the companyundertook to meet certain bindingtargets for investment inmodernizing and extending itsnational network. Telmex wasawarded all long-distance services
Box IV.3MEXICO: THE COST OF DEFENDING A NATIONAL CHAMPION
192 ECLAC
until August 1996, while for mobileservices it was granted ninelicences that enabled it to operatein every one of the country's nineregions through a subsidiary,Telcel. Since Telcel operated induopoly with different regionalcompanies, it was the onlyoperator capable of providingnational coverage. During thisinitial period, prices were adjustedin line with inflation, without regardto productivity improvements.In mid-1995, as the exclusivityperiod was drawing to an end, thenew TelecommunicationsDevelopment Programme wasimplemented. The aims of thisprogramme were to develop andmodernize the sector and to openit up gradually to competition. Thesectoral objectives were to fosterintegration and technologicalmodernization, to improve thequality and range of services, andto increase the number of users(through more accessible pricingand wider coverage). Theliberalization programme's goalsin this sector were to limitanticompetitive practices, chieflyby ending exclusive contracts, andto regulate use of the dominantoperator's networks andinterconnection fees. A newregulatory framework fortelecommunications was created,as was a regulatory body, theFederal Commission ofTelecommunications (Cofetel),whose immediate tasks were toimplement asymmetricalregulation in the concentratedsegments of the market and tobegin the gradual process ofopening up long-distance services(60 major cities in 1997, 100 in1998 and 150 in 1999). InFebruary 1998, as a result of thenew commitments entered into byMexico at WTO under the FourthProtocol to GATS, Telmex cameunder pressure to offer newinterconnection services, andforeign investors were allowed toacquire more than 49% of theassets of cellular telephonycompanies, subject to approval bythe National Foreign Investment
Commission. In the late 1990s,local telephony began to beopened up with the granting ofconcessions to new companies(Axtel, SPC, Amaritel) to operatein the segment, while in mobiletelephony, measures such as the"caller pays" system wereimplemented and new licenceswere awarded with a view toencouraging more operators toenter this market. Thus, in 1998four PCS concessions wereauctioned in each of the nineregions. Although Telmex onceagain obtained a licence in eachregion, this time it was not alonein doing so: Pegaso, a partnershipbetween a local group and theUnited States company LeapWireless International, alsoobtained the licences it needed toprovide national coverage.The new regulatory policy ofgradually opening up the sectorbegan to attract new operators inthe second half of the 1990s.Among those entering thelong-distance segment were theMexican Alfa and Bancomergroups, which formed Alestra inpartnership with AT&T, andBanamex-Accival, which joinedforces with MCI WorldCom tocreate Avantel. These newcompanies succeeded in reducingprices by 30% and capturing 25%of Telmex's market share. Newinvestments totalling aroundUS$ 5.6 billion were planned forinternational long-distanceservices in 1996-2001. Avantel,Alestra and Iusacell (a companyoperating in mobile telephony)invested in fibre optic cable, thebetter to compete with thedominant operator. Bell Atlanticwent into partnership with theIusacell group to provide cellulartelephony services andsubsequently, in 2001, Vodafonebecame a part-owner of Iusacellby purchasing the 34.5% share ofthat company held by the Peraltagroup. In 1998, Pegaso emergedas a strong competitor withnational mobile telephonycoverage, and in October 2000Telefónica de España paid
US$ 1.799 billion for Motorola's fourcellular licences in the north of thecountry, thus becoming anotherheavyweight competitor.When the experience of Mexico isevaluated, it can be said, firstly, thatthe goal of consolidating theposition of a local company as thedominant operator in the markethas been achieved: by 2000,Telmex still had very large marketshares, despite the new entrants:95% in local telephony, 66% in longdistance, 72% in mobile and 60% indata/Internet. As regards thesecond important goal, that ofextending existing networks,success has not been so great.Although Telmex, among otherinvestments, put over US$ 18billion into installing new lines andextending universal service duringthe 1990-1996 exclusivity periodand up to 1999, thereby doublingtelephone density (main lines per100 inhabitants), this progress doesnot look so impressive whencompared with what has beenachieved in other countries of theregion, particularly considering thehigh cost paid in terms of monopolyrevenue for the dominant company.Mexico started off in 1990 with thesame telephone density (6.5) asChile and Brazil (which restructuredits sector only in the late 1990s),but by 1999 it was lagging behindthese countries in this respect, thefigures being 11.2 in Mexico, 14.9in Brazil and 18.6 in Chile (seetable IV.2). Furthermore, if Mexicois compared with the members ofthe Organisation for EconomicCo-operation and Development(OECD), the country's prices arehigh and the disparity betweenpenetration levels is increasing. Interms of monopoly rents, Telmexhas been able to make substantialprofits thanks to advantages suchas tax incentives and an exclusivityperiod that enabled the company toconsolidate its network anddiversify and integrate its activities.Thus, when competition came, itwas able to charge highinterconnection fees (comparedwith the OECD countries) and applycross-subsidies (which enable it to
Box IV.3 (continued)
Foreign investment in Latin America and the Caribbean, 2000 193
cross-subsidies (which enable it todeal with competition in a moreopen segment by raising prices inless exposed ones, such as thelocal call segment).The dominant position of Telmex,which is the result of deliberatepolicy choices by the Mexicanauthorities, is now perceived as aserious obstacle to thedevelopment of competition in thetelecommunications market. Theregulatory body set up in 1995,one of whose goals was to createthe conditions for greatercompetition, has been heavilycriticized. In general terms, thecomplaints are that its operationslack transparency, that it is toodependent on the executive andthat it does not have the powersnecessary to oversee andregulate Telmex. Thus, inDecember 1997, the new FederalCommission of Competition (CFC)warned that Telmex had adominant position in five marketsegments (local telephony,interconnection service, nationallong distance, international longdistance and resale oflong-distance services), butCofetel did not have the powers itneeded to correct or alleviate thissituation. In 1999, when Cofeteltried to apply restrictions to
Telmex as the dominant operator,the company went to court andwon. The dominant position ofTelmex in Mexico has also hadadverse effects on the company'sinternational activities in theUnited States, on the one hand,while on the other it has causedserious international problems forthe Government of Mexico. Thus,the US FCC fined one of theUnited States subsidiaries ofTelmex US$ 100,000 because theparent company in Mexico wouldnot allow two competing jointventures, Alestra (AT&T) andAvantel (WorldCom), to connect toits network. Subsequently,Charlene Bershefsky, the formerUnited States TradeRepresentative, lodged acomplaint against the Governmentof Mexico at the WTO, allegingthat it had failed to exerciseregulatory control over Telmexpractices deemed to beanticompetitive, such as refusingto re-sell long distance servicesand charging high interconnectionfees that did not reflect its costs.In February 2001, the complaintwas suspended -but notwithdrawn- at the request of theUnited States, following thechange of Administration inMexico. In the
telecommunications industry,Mexico has succeeded in creatingand defending a national championthat has not only managed toextend and modernize the country'snetworks -although the resultscould have been better, as hasbeen seen- but that has alsotransnationalized by branching outinto the United States and otherLatin American countries(Argentina, Brazil and Guatemala)(see: Telecom América plusBellSouth, below). The price thecountry has paid has been themaintenance of a monopolisticmarket in almost all telephonysegments during the initialexclusivity stage, and a highlyconcentrated one in the followingstage which has meant that tariffshave been higher there than inother countries. Now that the sectoris being opened up, and Mexico isunder pressure to act on theinternational commitments it maderegarding competition in thetelecommunications market, thechallenge for Telmex is to find away to continue growing in anenvironment that can be expectedto become more and morecompetitive.
Box IV.3 (concluded)
Source: ECLAC, Unit on Investment and Corporate Strategies, Division of Production, Productivity and Management, on the basis of informationprovided by Rebeca Escobar de Medécigo, "El cambio estructural de las telecomunicaciones y la inversión: el caso de México", Reformaseconómicas series, No. 17 (LC/L.1174), Santiago, Chile, Economic Commission for Latin America and the Caribbean (ECLAC), November1999; United States Office of Telecommunications Technologies, "Mexico: telecommunications market", 2001 (http://infoserv2.ita.doc.gov);Organisation for Economic Co-operation and Development (OECD), "Regulatory reform in Mexico", OECD Reviews of Regulatory Reform,Paris, August 1999; Ahmed Galal and Bharat Nauriyal, "Regulating Telecommunications in Developing Countries: Outcomes, Incentives andCommitment", Policy Research Working Paper, No. 1520, Washington, D.C., Policy Research Department, World Bank, October 1995(http://www.worldbank.org/html/dec/Publications/Workpapers/wps2136); Scott Wallsten, "An Empirical Analysis of Competition,Privatization, and Regulation in Telecommunications Markets in Africa and Latin America", Policy Research Working Paper, No.2136,Washington, D.C., Policy Research Department, World Bank, June 1999 (http://www.worldbank.org/html/dec/Publications/Workpapers/wps2136); ECLAC, Foreign Investment in Latin America and the Caribbean, 1999 (LC/G.2061-P), Santiago,Chile, February 2000, United Nations publication, Sales No. E.00.II.G.4; and E. Melrose, "La telefonía móvil en América del Norte. El casode México", 2000 (http://www.AHCIET.net/inalambricos/IIFATICMS.asp.).
194 ECLAC
Telecommunications privatizationtook place later in Brazil than inother Latin American countries(except for Central America) andwas preceded by a longerpreparation and gestation period.In August 1995, the NationalCongress passed an amendmentto the Federal Constitution makingit permissible for private investorsto be awarded licences to operatetelecommunications services ofany kind. In July of the next year,Act 9,295 authorized the use ofprivate capital for the provision ofa range of services, includingcellular mobile telephony (in thiscase with majority Brazilianownership), data transmission andvalue added. A year later, in July1997, the GeneralTelecommunications Act waspassed, opening the way torestructuring and privatization ofthe Telebrás system and creatingthe National Agency ofTelecommunications (Anatel). Ayear after this, in July 1998,privatization of Telebrás began.Before privatization, the Telebrássystem belonged to a holdingcompany in which the FederalGovernment owned 51.79% of thevoting shares (the rest being heldby 6 million private shareholders)and 22% of the total equity. Thesystem comprised 27 telephonyoperators (fixed-line and band "A"mobile telephony services),Empresa Brasileira deTelecomunicações (Embratel),which provided long-distanceservices, and four independentoperators: one State and twomunicipal companies, and oneprivate firm controlled by a localgroup, Algar.In deciding how thetelecommunications sector was tobe organized, Brazil drew on theexperience of other countries inthe region, seeking to learn fromtheir successes and mistakes."Universalization of services andthe immediate introduction ofcompetition were stressed as keyreform objectives, to which the
objective of selling shareholdercontrol in the State companies forthe best possible price was to besubordinated" (Herrera, 1998a). Itwas believed that competition,rather than a temporary monopolyat the outset, offered the bestprospects for achieving theobjective of universal serviceprovision and that competitionwas very difficult to introducewhere there had once been alocal network monopoly.Between 1994 and 1997, prior toprivatization in 1998, Telebrásinvested close to US$ 20 billion(BNDES, 1997 and ITU, 2000c).Subsequently, but still prior toprivatization, two importantmeasures were taken: (i) Telebráswas broken up into 12independent companies: along-distance one (Embratel),three local fixed-line companies(Telesp, Tele Centro Sul and TeleNorte Leste) and eight band "A"cellular mobile telephonyenterprises; and (ii) the wholeradio spectrum was split intobands, and five differentfrequency bands were allocated tomobile telephony (from lowest tohighest, A, B, C, D and E). Then,between 1997 and 1998, 10 band"B" cellular mobile telephonylicences were auctioned off inaccordance with Act 9,295 for 10different geographical areas, andthe operators obtaining themcould therefore compete with theband "A" companies, which at thattime were still part of the Telebrássystem. The Governmentundertook not to award thehighest frequency bands in themobile telephony market beforethe end of 1999, and the first PCSlicences in bands "C", "D" and "E"are only being awarded now, inearly 2001.To introduce competition in basictelephony, four licences wereauctioned in 1999 so that fourcompanies (known as "mirror"companies) could be created tocompete with the four basictelephony operators privatized
from the Telebrás system: along-distance one and three localfixed-line firms. Until the end of2001, no area can have more thanone licensee and one mirrorcompany providing basic telephonyservices (long distance and local),except in the case of intraregionalservices, where there may be up tofour companies. From the end of2001 there will be no restrictions onthe number of licences for theprovision of basic telephonyservices.Lastly, it was decided that ninePCS mobile telephony licenceswould be auctioned off in threeoperations (bands "C", "D" and "E"at 1800-1900 MHz) betweenFebruary and March 2001. The firstauction (band "C") closed on 2February without any buyers havingcome forward (this would appear tohave been due in part to the factthat companies operating infixed-line telephony could notparticipate), so there will be afurther auction at a date to bedetermined. The second auction(band "D") was held on 13February, with more success. Atthe third (band "E"), which tookplace on 13 March, just one buyercame forward for one of the threelicences.Throughout the process ofreorganizing telecommunications inBrazil, one of the main concerns ofthe regulatory authorities has beento lay the foundations for a systemin which, as far as possible, there iscompetition in every segment of themarket. For example, the reason forbreaking up Telebrás was to bringinto being a number oftelecommunications companies thathad enough access infrastructure oftheir own and were on a sufficientlyequal footing to compete with oneanother. To supplement thismeasure and prevent it from beingneutralized by subsequent mergersand acquisitions, a number of ruleswere drawn up to restrictcross-ownership, expansion intonew areas and diversification. "TheGeneral Telecommunications Act
Box IV.4BRAZIL: THE BENEFITS OF LEARNING FROM OTHERS' MISTAKES
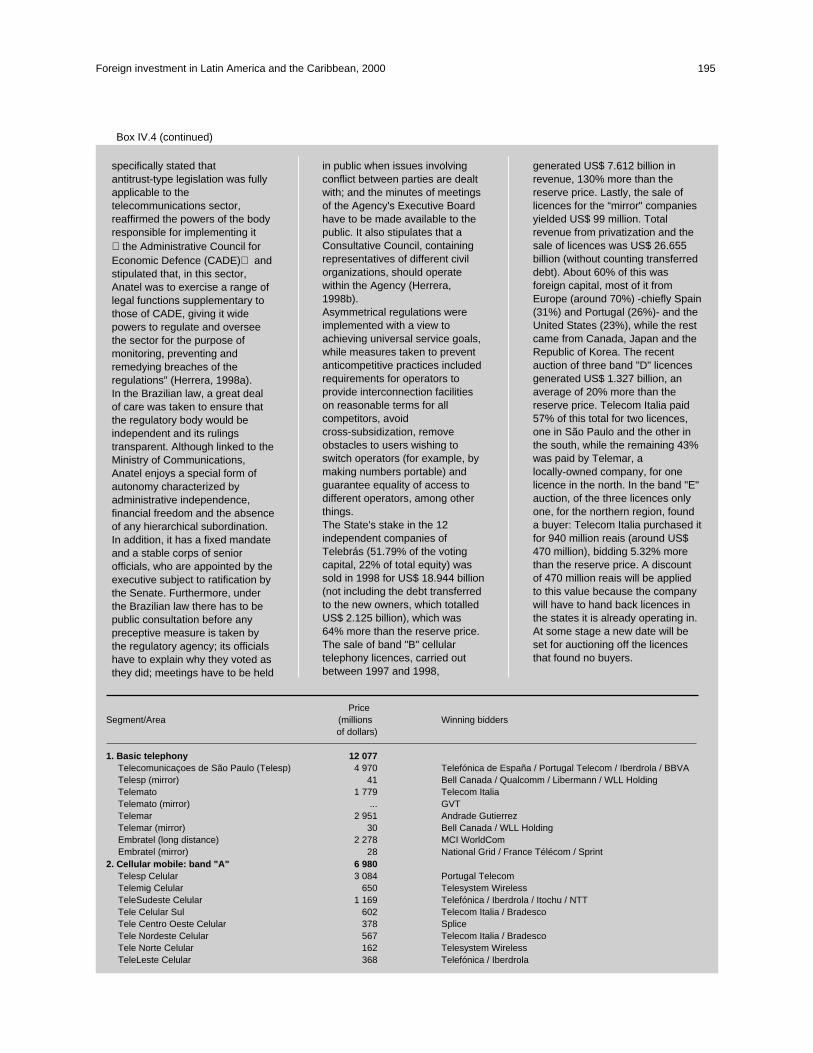
Foreign investment in Latin America and the Caribbean, 2000 195
specifically stated thatantitrust-type legislation was fullyapplicable to thetelecommunications sector,reaffirmed the powers of the bodyresponsible for implementing it� the Administrative Council forEconomic Defence (CADE)� andstipulated that, in this sector,Anatel was to exercise a range oflegal functions supplementary tothose of CADE, giving it widepowers to regulate and overseethe sector for the purpose ofmonitoring, preventing andremedying breaches of theregulations" (Herrera, 1998a).In the Brazilian law, a great dealof care was taken to ensure thatthe regulatory body would beindependent and its rulingstransparent. Although linked to theMinistry of Communications,Anatel enjoys a special form ofautonomy characterized byadministrative independence,financial freedom and the absenceof any hierarchical subordination.In addition, it has a fixed mandateand a stable corps of seniorofficials, who are appointed by theexecutive subject to ratification bythe Senate. Furthermore, underthe Brazilian law there has to bepublic consultation before anypreceptive measure is taken bythe regulatory agency; its officialshave to explain why they voted asthey did; meetings have to be held
in public when issues involvingconflict between parties are dealtwith; and the minutes of meetingsof the Agency's Executive Boardhave to be made available to thepublic. It also stipulates that aConsultative Council, containingrepresentatives of different civilorganizations, should operatewithin the Agency (Herrera,1998b).Asymmetrical regulations wereimplemented with a view toachieving universal service goals,while measures taken to preventanticompetitive practices includedrequirements for operators toprovide interconnection facilitieson reasonable terms for allcompetitors, avoidcross-subsidization, removeobstacles to users wishing toswitch operators (for example, bymaking numbers portable) andguarantee equality of access todifferent operators, among otherthings.The State's stake in the 12independent companies ofTelebrás (51.79% of the votingcapital, 22% of total equity) wassold in 1998 for US$ 18.944 billion(not including the debt transferredto the new owners, which totalledUS$ 2.125 billion), which was64% more than the reserve price.The sale of band "B" cellulartelephony licences, carried outbetween 1997 and 1998,
generated US$ 7.612 billion inrevenue, 130% more than thereserve price. Lastly, the sale oflicences for the “mirror" companiesyielded US$ 99 million. Totalrevenue from privatization and thesale of licences was US$ 26.655billion (without counting transferreddebt). About 60% of this wasforeign capital, most of it fromEurope (around 70%) -chiefly Spain(31%) and Portugal (26%)- and theUnited States (23%), while the restcame from Canada, Japan and theRepublic of Korea. The recentauction of three band "D" licencesgenerated US$ 1.327 billion, anaverage of 20% more than thereserve price. Telecom Italia paid57% of this total for two licences,one in São Paulo and the other inthe south, while the remaining 43%was paid by Telemar, alocally-owned company, for onelicence in the north. In the band "E"auction, of the three licences onlyone, for the northern region, founda buyer: Telecom Italia purchased itfor 940 million reais (around US$470 million), bidding 5.32% morethan the reserve price. A discountof 470 million reais will be appliedto this value because the companywill have to hand back licences inthe states it is already operating in.At some stage a new date will beset for auctioning off the licencesthat found no buyers.
Box IV.4 (continued)
PriceSegment/Area (millions Winning bidders
of dollars)
1. Basic telephony 12 077Telecomunicaçoes de São Paulo (Telesp) 4 970 Telefónica de España / Portugal Telecom / Iberdrola / BBVATelesp (mirror) 41 Bell Canada / Qualcomm / Libermann / WLL HoldingTelemato 1 779 Telecom ItaliaTelemato (mirror) ... GVTTelemar 2 951 Andrade GutierrezTelemar (mirror) 30 Bell Canada / WLL HoldingEmbratel (long distance) 2 278 MCI WorldComEmbratel (mirror) 28 National Grid / France Télécom / Sprint
2. Cellular mobile: band "A" 6 980Telesp Celular 3 084 Portugal TelecomTelemig Celular 650 Telesystem WirelessTeleSudeste Celular 1 169 Telefónica / Iberdrola / Itochu / NTTTele Celular Sul 602 Telecom Italia / BradescoTele Centro Oeste Celular 378 SpliceTele Nordeste Celular 567 Telecom Italia / BradescoTele Norte Celular 162 Telesystem WirelessTeleLeste Celular 368 Telefónica / Iberdrola
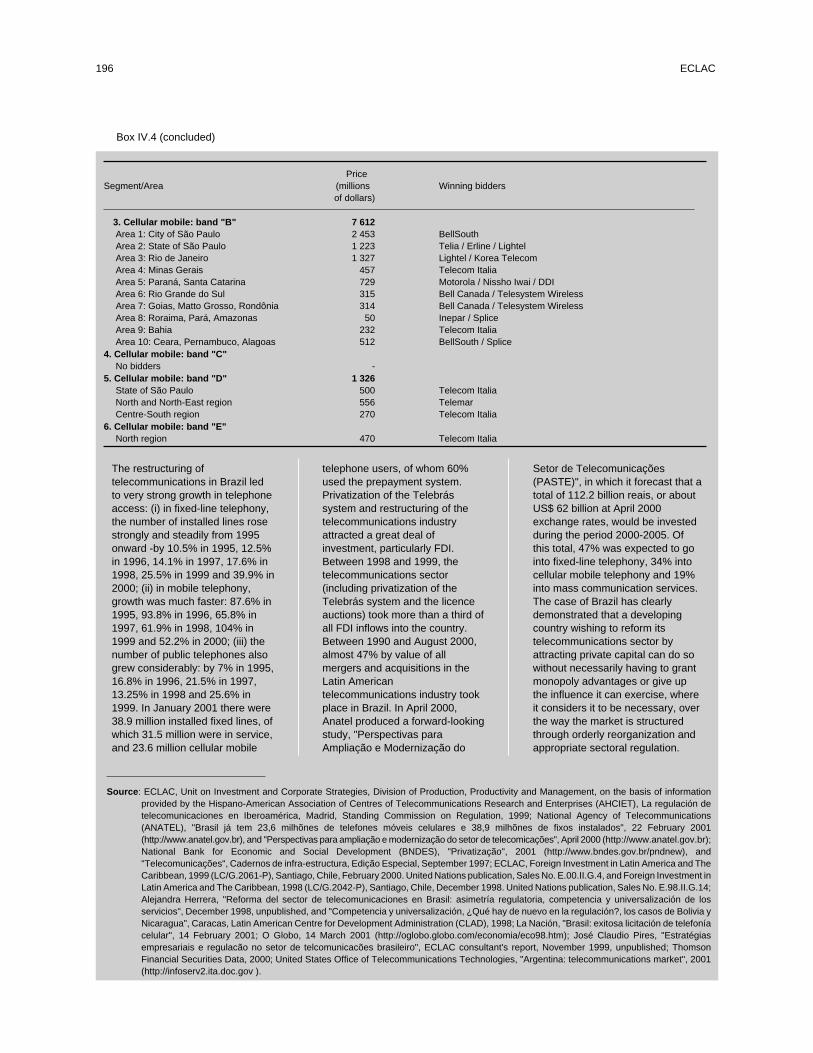
196 ECLAC
The restructuring oftelecommunications in Brazil ledto very strong growth in telephoneaccess: (i) in fixed-line telephony,the number of installed lines rosestrongly and steadily from 1995onward -by 10.5% in 1995, 12.5%in 1996, 14.1% in 1997, 17.6% in1998, 25.5% in 1999 and 39.9% in2000; (ii) in mobile telephony,growth was much faster: 87.6% in1995, 93.8% in 1996, 65.8% in1997, 61.9% in 1998, 104% in1999 and 52.2% in 2000; (iii) thenumber of public telephones alsogrew considerably: by 7% in 1995,16.8% in 1996, 21.5% in 1997,13.25% in 1998 and 25.6% in1999. In January 2001 there were38.9 million installed fixed lines, ofwhich 31.5 million were in service,and 23.6 million cellular mobile
telephone users, of whom 60%used the prepayment system.Privatization of the Telebrássystem and restructuring of thetelecommunications industryattracted a great deal ofinvestment, particularly FDI.Between 1998 and 1999, thetelecommunications sector(including privatization of theTelebrás system and the licenceauctions) took more than a third ofall FDI inflows into the country.Between 1990 and August 2000,almost 47% by value of allmergers and acquisitions in theLatin Americantelecommunications industry tookplace in Brazil. In April 2000,Anatel produced a forward-lookingstudy, "Perspectivas paraAmpliação e Modernização do
Setor de Telecomunicações(PASTE)", in which it forecast that atotal of 112.2 billion reais, or aboutUS$ 62 billion at April 2000exchange rates, would be investedduring the period 2000-2005. Ofthis total, 47% was expected to gointo fixed-line telephony, 34% intocellular mobile telephony and 19%into mass communication services.The case of Brazil has clearlydemonstrated that a developingcountry wishing to reform itstelecommunications sector byattracting private capital can do sowithout necessarily having to grantmonopoly advantages or give upthe influence it can exercise, whereit considers it to be necessary, overthe way the market is structuredthrough orderly reorganization andappropriate sectoral regulation.
Box IV.4 (concluded)
PriceSegment/Area (millions Winning bidders
of dollars)
3. Cellular mobile: band "B" 7 612Area 1: City of São Paulo 2 453 BellSouthArea 2: State of São Paulo 1 223 Telia / Erline / LightelArea 3: Rio de Janeiro 1 327 Lightel / Korea TelecomArea 4: Minas Gerais 457 Telecom ItaliaArea 5: Paraná, Santa Catarina 729 Motorola / Nissho Iwai / DDIArea 6: Rio Grande do Sul 315 Bell Canada / Telesystem WirelessArea 7: Goias, Matto Grosso, Rondônia 314 Bell Canada / Telesystem WirelessArea 8: Roraima, Pará, Amazonas 50 Inepar / SpliceArea 9: Bahia 232 Telecom ItaliaArea 10: Ceara, Pernambuco, Alagoas 512 BellSouth / Splice
4. Cellular mobile: band "C"No bidders -
5. Cellular mobile: band "D" 1 326State of São Paulo 500 Telecom ItaliaNorth and North-East region 556 TelemarCentre-South region 270 Telecom Italia
6. Cellular mobile: band "E"North region 470 Telecom Italia
Source: ECLAC, Unit on Investment and Corporate Strategies, Division of Production, Productivity and Management, on the basis of informationprovided by the Hispano-American Association of Centres of Telecommunications Research and Enterprises (AHCIET), La regulación detelecomunicaciones en Iberoamérica, Madrid, Standing Commission on Regulation, 1999; National Agency of Telecommunications(ANATEL), "Brasil já tem 23,6 milhõnes de telefones móveis celulares e 38,9 milhõnes de fixos instalados", 22 February 2001(http://www.anatel.gov.br), and "Perspectivas para ampliação e modernização do setor de telecomicações", April 2000 (http://www.anatel.gov.br);National Bank for Economic and Social Development (BNDES), "Privatização", 2001 (http://www.bndes.gov.br/pndnew), and"Telecomunicações", Cadernos de infra-estructura, Edição Especial, September 1997; ECLAC, Foreign Investment in Latin America and TheCaribbean, 1999 (LC/G.2061-P), Santiago, Chile, February 2000. United Nations publication, Sales No. E.00.II.G.4, and Foreign Investment inLatin America and The Caribbean, 1998 (LC/G.2042-P), Santiago, Chile, December 1998. United Nations publication, Sales No. E.98.II.G.14;Alejandra Herrera, "Reforma del sector de telecomunicaciones en Brasil: asimetría regulatoria, competencia y universalización de losservicios", December 1998, unpublished, and "Competencia y universalización, ¿Qué hay de nuevo en la regulación?, los casos de Bolivia yNicaragua", Caracas, Latin American Centre for Development Administration (CLAD), 1998; La Nación, "Brasil: exitosa licitación de telefoníacelular", 14 February 2001; O Globo, 14 March 2001 (http://oglobo.globo.com/economia/eco98.htm); José Claudio Pires, "Estratégiasempresariais e regulacão no setor de telcomunicacões brasileiro", ECLAC consultant's report, November 1999, unpublished; ThomsonFinancial Securities Data, 2000; United States Office of Telecommunications Technologies, "Argentina: telecommunications market", 2001(http://infoserv2.ita.doc.gov ).

monopolies had been privatized; and regulatoryauthorities were and still are subordinated to theexecutive. It was only once the exclusivity period hadended that the authorities concerned themselves withintroducing greater competition into the differentsegments of the market by enacting newtelecommunications laws. The exception is Brazil (seebox IV.4), whose authorities learned from the mistakesof the countries that had carried out these reforms earlier.In Brazil, the national monopoly was broken up into alarge number of independent operators in order to
promote competition. Universalization of services andthe immediate introduction of competition were laiddown as the central objectives of the reform, to which thegoal of obtaining the highest possible price from the saleof State assets was to be subordinated. The regulatorybody, the National Agency of Telecommunications(Anatel), which was created prior to privatization, wasmade independent and given wide powers to regulate andsupervise the sector (Herrera, 1998a).
Privatization of telecommunications in LatinAmerica opened the way to a capital inflow into the
Foreign investment in Latin America and the Caribbean, 2000 197
Table IV.2INDICATORS OF TELECOMMUNICATIONS SERVICE PERFORMANCE IN FOUR
LATIN AMERICAN COUNTRIES, 1990-2000
Country 1990 1995 1999
1. Main lines per 100 inhabitants Argentina 9.3 15.9 20.1Brazil 6.5 8.5 14.9Chile 6.5 12.7 18.6Mexico 6.5 9.4 11.2
2. Residential lines per 100 inhabitants Argentina 27.1 49.4 61.0d
Brazil 17.8 22.4 28.6d
Chile 22.4 45.3 66.2d
Mexico 23.7 35.3 34.5d
3. Cellular telephone subscribers per 100 inhabitants Argentina 0.04 0.98 12.12Brazil 0.02 a 0.83 8.95Chile 0.11 1.38 15.05Mexico 0.08 0.73 7.94
4. Faults per 100 main linesArgentina 42.4 b 29.5 17.3d
Brazil 4.7 3.2 3.8d
Chile 97 b 57 52.0d
Mexico 4.6 4.6d
5. Business line: monthly charge (dollars) Argentina 43.2 29.7 36.4d
Brazil 10.2 11.6d
Chile 19.6 16.3d
Mexico 12.1 13.7 19.3d
6. Cellular telephony: monthly charge (dollars) Argentina 67.3 34 43.00e
Brazil 29 14.81e
Chile 28.01e
Mexico 36 27 37.67e
7. Charge for residential connection (dollars) Argentina 2155 500 150d
Brazil 1215 43d
Chile 258 c 82 159d
Mexico 495 279 107d
8. Charge for business connection (dollars) Argentina 5388 750 150d
Brazil 1215 43d
Chile 258 c 182 159d
Source: ECLAC, Information Centre of the Unit on Investment and Corporate Strategies, Division of Production, Productivity and Management, on the basisof information from the International Telecommunication Union (ITU), Yearbook of Statistics: Telecommunications Services Chronological TimeSeries, 1989-1998, Geneva, February 2000, and Indicadores de telecomunicaciones de las Américas, Geneva, April 2000.
a1992 figures.
b1991 figures.
c1993 figures.
d1998 figures.
e2000 figures.
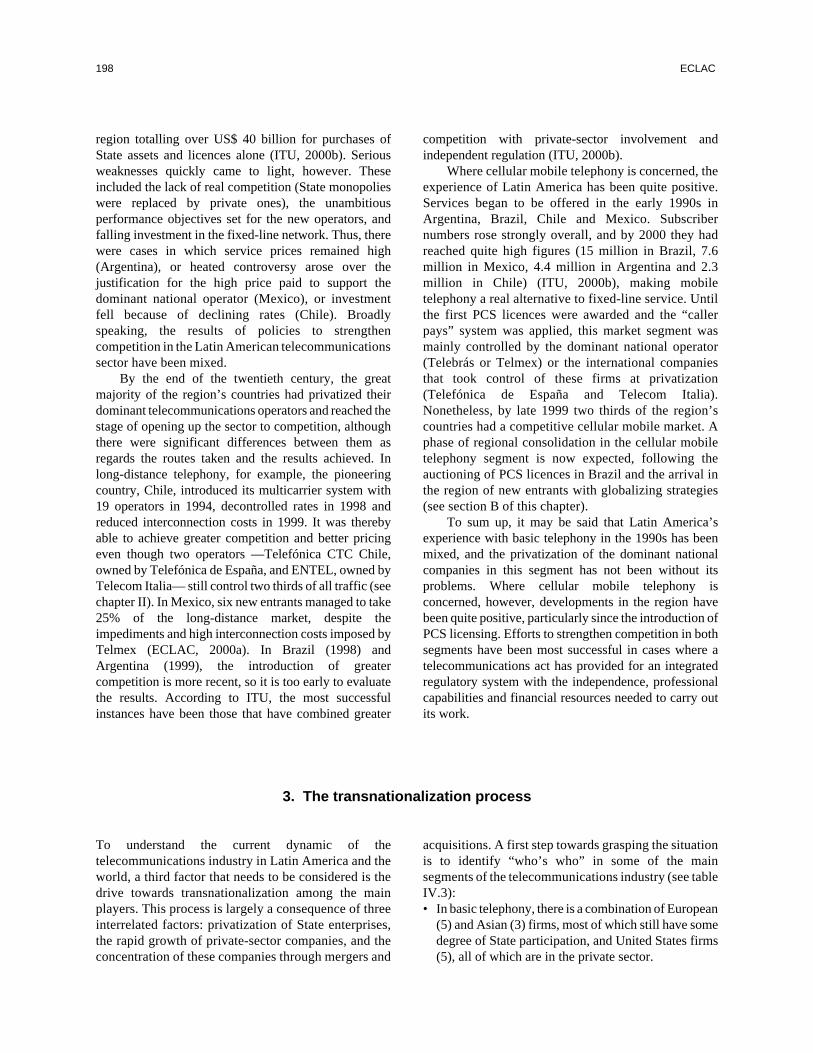
region totalling over US$ 40 billion for purchases ofState assets and licences alone (ITU, 2000b). Seriousweaknesses quickly came to light, however. Theseincluded the lack of real competition (State monopolieswere replaced by private ones), the unambitiousperformance objectives set for the new operators, andfalling investment in the fixed-line network. Thus, therewere cases in which service prices remained high(Argentina), or heated controversy arose over thejustification for the high price paid to support thedominant national operator (Mexico), or investmentfell because of declining rates (Chile). Broadlyspeaking, the results of policies to strengthencompetition in the Latin American telecommunicationssector have been mixed.
By the end of the twentieth century, the greatmajority of the region’s countries had privatized theirdominant telecommunications operators and reached thestage of opening up the sector to competition, althoughthere were significant differences between them asregards the routes taken and the results achieved. Inlong-distance telephony, for example, the pioneeringcountry, Chile, introduced its multicarrier system with19 operators in 1994, decontrolled rates in 1998 andreduced interconnection costs in 1999. It was therebyable to achieve greater competition and better pricingeven though two operators —Telefónica CTC Chile,owned by Telefónica de España, and ENTEL, owned byTelecom Italia— still control two thirds of all traffic (seechapter II). In Mexico, six new entrants managed to take25% of the long-distance market, despite theimpediments and high interconnection costs imposed byTelmex (ECLAC, 2000a). In Brazil (1998) andArgentina (1999), the introduction of greatercompetition is more recent, so it is too early to evaluatethe results. According to ITU, the most successfulinstances have been those that have combined greater
competition with private-sector involvement andindependent regulation (ITU, 2000b).
Where cellular mobile telephony is concerned, theexperience of Latin America has been quite positive.Services began to be offered in the early 1990s inArgentina, Brazil, Chile and Mexico. Subscribernumbers rose strongly overall, and by 2000 they hadreached quite high figures (15 million in Brazil, 7.6million in Mexico, 4.4 million in Argentina and 2.3million in Chile) (ITU, 2000b), making mobiletelephony a real alternative to fixed-line service. Untilthe first PCS licences were awarded and the “callerpays” system was applied, this market segment wasmainly controlled by the dominant national operator(Telebrás or Telmex) or the international companiesthat took control of these firms at privatization(Telefónica de España and Telecom Italia).Nonetheless, by late 1999 two thirds of the region’scountries had a competitive cellular mobile market. Aphase of regional consolidation in the cellular mobiletelephony segment is now expected, following theauctioning of PCS licences in Brazil and the arrival inthe region of new entrants with globalizing strategies(see section B of this chapter).
To sum up, it may be said that Latin America’sexperience with basic telephony in the 1990s has beenmixed, and the privatization of the dominant nationalcompanies in this segment has not been without itsproblems. Where cellular mobile telephony isconcerned, however, developments in the region havebeen quite positive, particularly since the introduction ofPCS licensing. Efforts to strengthen competition in bothsegments have been most successful in cases where atelecommunications act has provided for an integratedregulatory system with the independence, professionalcapabilities and financial resources needed to carry outits work.
3. The transnationalization process
To understand the current dynamic of thetelecommunications industry in Latin America and theworld, a third factor that needs to be considered is thedrive towards transnationalization among the mainplayers. This process is largely a consequence of threeinterrelated factors: privatization of State enterprises,the rapid growth of private-sector companies, and theconcentration of these companies through mergers and
acquisitions. A first step towards grasping the situationis to identify “who’s who” in some of the mainsegments of the telecommunications industry (see tableIV.3):• In basic telephony, there is a combination of European
(5) and Asian (3) firms, most of which still have somedegree of State participation, and United States firms(5), all of which are in the private sector.
198 ECLAC
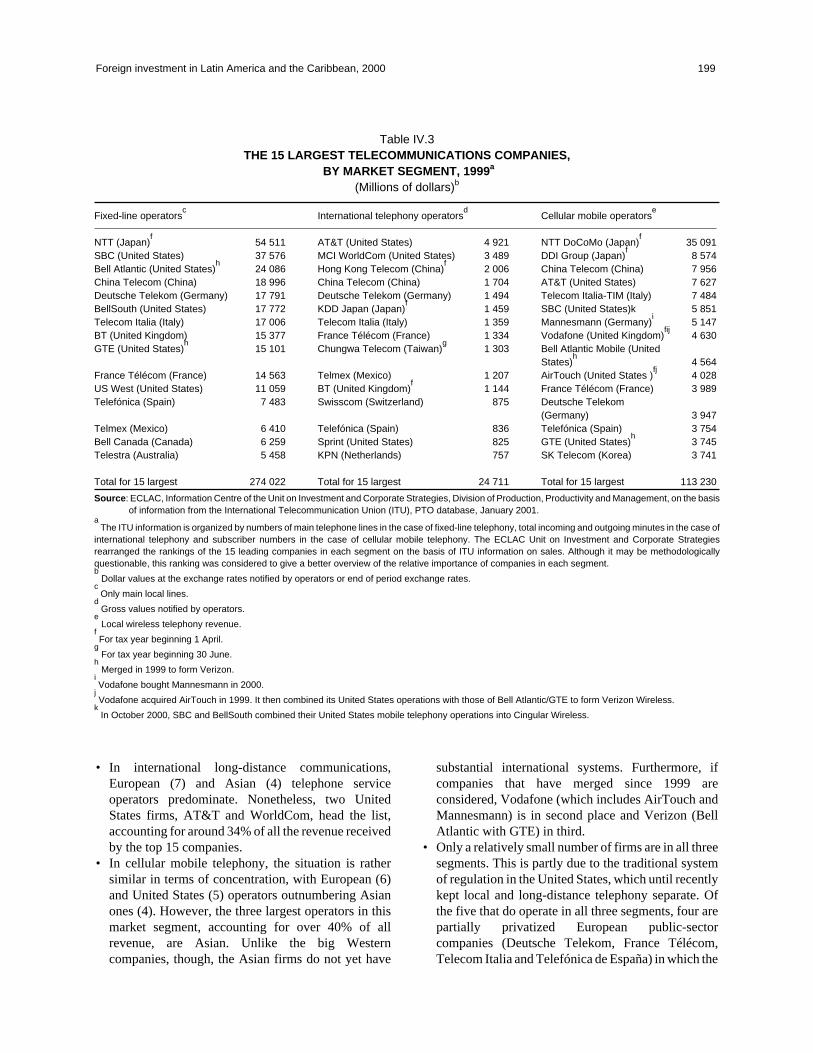
• In international long-distance communications,European (7) and Asian (4) telephone serviceoperators predominate. Nonetheless, two UnitedStates firms, AT&T and WorldCom, head the list,accounting for around 34% of all the revenue receivedby the top 15 companies.
• In cellular mobile telephony, the situation is rathersimilar in terms of concentration, with European (6)and United States (5) operators outnumbering Asianones (4). However, the three largest operators in thismarket segment, accounting for over 40% of allrevenue, are Asian. Unlike the big Westerncompanies, though, the Asian firms do not yet have
substantial international systems. Furthermore, ifcompanies that have merged since 1999 areconsidered, Vodafone (which includes AirTouch andMannesmann) is in second place and Verizon (BellAtlantic with GTE) in third.
• Only a relatively small number of firms are in all threesegments. This is partly due to the traditional systemof regulation in the United States, which until recentlykept local and long-distance telephony separate. Ofthe five that do operate in all three segments, four arepartially privatized European public-sectorcompanies (Deutsche Telekom, France Télécom,Telecom Italia and Telefónica de España) in which the
Foreign investment in Latin America and the Caribbean, 2000 199
Table IV.3THE 15 LARGEST TELECOMMUNICATIONS COMPANIES,
BY MARKET SEGMENT, 1999a
(Millions of dollars)b
Fixed-line operatorsc
International telephony operatorsd
Cellular mobile operatorse
NTT (Japan)f
54 511 AT&T (United States) 4 921 NTT DoCoMo (Japan)f
35 091SBC (United States) 37 576 MCI WorldCom (United States) 3 489 DDI Group (Japan)
f8 574
Bell Atlantic (United States)h
24 086 Hong Kong Telecom (China)f
2 006 China Telecom (China) 7 956China Telecom (China) 18 996 China Telecom (China) 1 704 AT&T (United States) 7 627Deutsche Telekom (Germany) 17 791 Deutsche Telekom (Germany) 1 494 Telecom Italia-TIM (Italy) 7 484BellSouth (United States) 17 772 KDD Japan (Japan)
f1 459 SBC (United States)k 5 851
Telecom Italia (Italy) 17 006 Telecom Italia (Italy) 1 359 Mannesmann (Germany)i
5 147BT (United Kingdom) 15 377 France Télécom (France) 1 334 Vodafone (United Kingdom)
fij4 630
GTE (United States)h
15 101 Chungwa Telecom (Taiwan)g
1 303 Bell Atlantic Mobile (UnitedStates)
h4 564
France Télécom (France) 14 563 Telmex (Mexico) 1 207 AirTouch (United States )fj
4 028US West (United States) 11 059 BT (United Kingdom)
f1 144 France Télécom (France) 3 989
Telefónica (Spain) 7 483 Swisscom (Switzerland) 875 Deutsche Telekom(Germany) 3 947
Telmex (Mexico) 6 410 Telefónica (Spain) 836 Telefónica (Spain) 3 754Bell Canada (Canada) 6 259 Sprint (United States) 825 GTE (United States)
h3 745
Telestra (Australia) 5 458 KPN (Netherlands) 757 SK Telecom (Korea) 3 741
Total for 15 largest 274 022 Total for 15 largest 24 711 Total for 15 largest 113 230
Source: ECLAC, Information Centre of the Unit on Investment and Corporate Strategies, Division of Production, Productivity and Management, on the basisof information from the International Telecommunication Union (ITU), PTO database, January 2001.
aThe ITU information is organized by numbers of main telephone lines in the case of fixed-line telephony, total incoming and outgoing minutes in the case of
international telephony and subscriber numbers in the case of cellular mobile telephony. The ECLAC Unit on Investment and Corporate Strategiesrearranged the rankings of the 15 leading companies in each segment on the basis of ITU information on sales. Although it may be methodologicallyquestionable, this ranking was considered to give a better overview of the relative importance of companies in each segment.b
Dollar values at the exchange rates notified by operators or end of period exchange rates.c
Only main local lines.d
Gross values notified by operators.e
Local wireless telephony revenue.fFor tax year beginning 1 April.
gFor tax year beginning 30 June.
hMerged in 1999 to form Verizon.
iVodafone bought Mannesmann in 2000.
jVodafone acquired AirTouch in 1999. It then combined its United States operations with those of Bell Atlantic/GTE to form Verizon Wireless.
kIn October 2000, SBC and BellSouth combined their United States mobile telephony operations into Cingular Wireless.
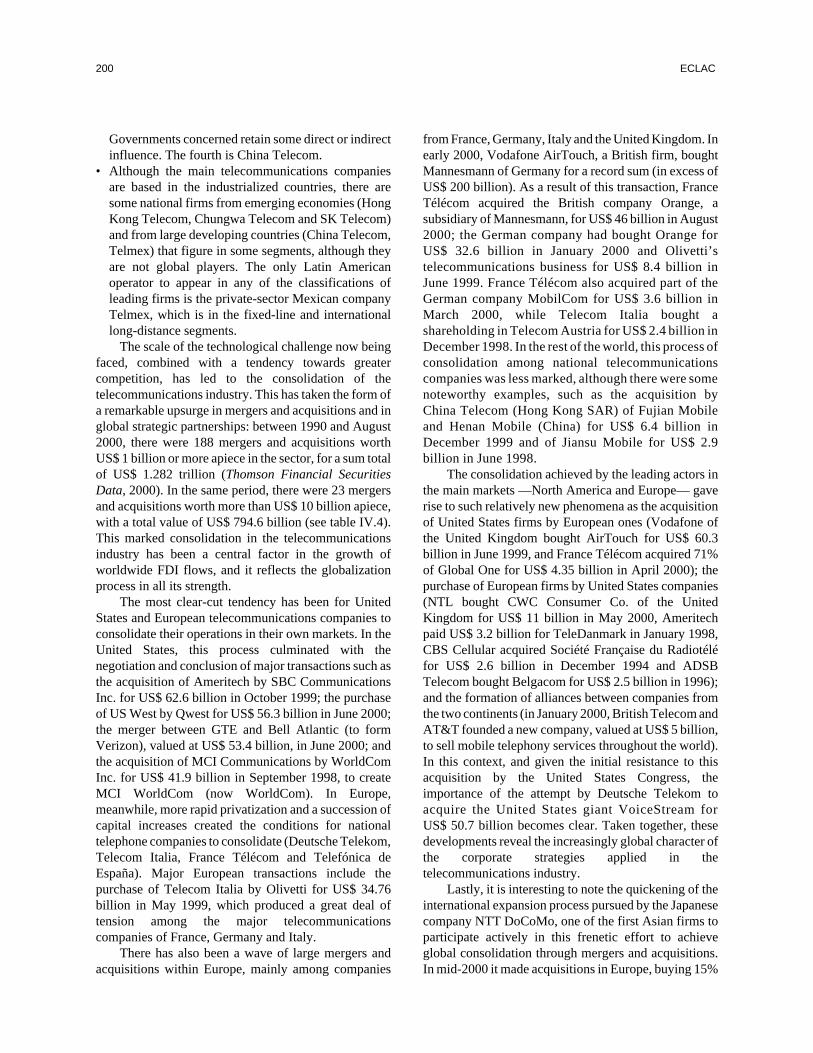
Governments concerned retain some direct or indirectinfluence. The fourth is China Telecom.
• Although the main telecommunications companiesare based in the industrialized countries, there aresome national firms from emerging economies (HongKong Telecom, Chungwa Telecom and SK Telecom)and from large developing countries (China Telecom,Telmex) that figure in some segments, although theyare not global players. The only Latin Americanoperator to appear in any of the classifications ofleading firms is the private-sector Mexican companyTelmex, which is in the fixed-line and internationallong-distance segments.
The scale of the technological challenge now beingfaced, combined with a tendency towards greatercompetition, has led to the consolidation of thetelecommunications industry. This has taken the form ofa remarkable upsurge in mergers and acquisitions and inglobal strategic partnerships: between 1990 and August2000, there were 188 mergers and acquisitions worthUS$ 1 billion or more apiece in the sector, for a sum totalof US$ 1.282 trillion (Thomson Financial SecuritiesData, 2000). In the same period, there were 23 mergersand acquisitions worth more than US$ 10 billion apiece,with a total value of US$ 794.6 billion (see table IV.4).This marked consolidation in the telecommunicationsindustry has been a central factor in the growth ofworldwide FDI flows, and it reflects the globalizationprocess in all its strength.
The most clear-cut tendency has been for UnitedStates and European telecommunications companies toconsolidate their operations in their own markets. In theUnited States, this process culminated with thenegotiation and conclusion of major transactions such asthe acquisition of Ameritech by SBC CommunicationsInc. for US$ 62.6 billion in October 1999; the purchaseof US West by Qwest for US$ 56.3 billion in June 2000;the merger between GTE and Bell Atlantic (to formVerizon), valued at US$ 53.4 billion, in June 2000; andthe acquisition of MCI Communications by WorldComInc. for US$ 41.9 billion in September 1998, to createMCI WorldCom (now WorldCom). In Europe,meanwhile, more rapid privatization and a succession ofcapital increases created the conditions for nationaltelephone companies to consolidate (Deutsche Telekom,Telecom Italia, France Télécom and Telefónica deEspaña). Major European transactions include thepurchase of Telecom Italia by Olivetti for US$ 34.76billion in May 1999, which produced a great deal oftension among the major telecommunicationscompanies of France, Germany and Italy.
There has also been a wave of large mergers andacquisitions within Europe, mainly among companies
from France, Germany, Italy and the United Kingdom. Inearly 2000, Vodafone AirTouch, a British firm, boughtMannesmann of Germany for a record sum (in excess ofUS$ 200 billion). As a result of this transaction, FranceTélécom acquired the British company Orange, asubsidiary of Mannesmann, for US$ 46 billion in August2000; the German company had bought Orange forUS$ 32.6 billion in January 2000 and Olivetti’stelecommunications business for US$ 8.4 billion inJune 1999. France Télécom also acquired part of theGerman company MobilCom for US$ 3.6 billion inMarch 2000, while Telecom Italia bought ashareholding in Telecom Austria for US$ 2.4 billion inDecember 1998. In the rest of the world, this process ofconsolidation among national telecommunicationscompanies was less marked, although there were somenoteworthy examples, such as the acquisition byChina Telecom (Hong Kong SAR) of Fujian Mobileand Henan Mobile (China) for US$ 6.4 billion inDecember 1999 and of Jiansu Mobile for US$ 2.9billion in June 1998.
The consolidation achieved by the leading actors inthe main markets —North America and Europe— gaverise to such relatively new phenomena as the acquisitionof United States firms by European ones (Vodafone ofthe United Kingdom bought AirTouch for US$ 60.3billion in June 1999, and France Télécom acquired 71%of Global One for US$ 4.35 billion in April 2000); thepurchase of European firms by United States companies(NTL bought CWC Consumer Co. of the UnitedKingdom for US$ 11 billion in May 2000, Ameritechpaid US$ 3.2 billion for TeleDanmark in January 1998,CBS Cellular acquired Société Française du Radiotéléfor US$ 2.6 billion in December 1994 and ADSBTelecom bought Belgacom for US$ 2.5 billion in 1996);and the formation of alliances between companies fromthe two continents (in January 2000, British Telecom andAT&T founded a new company, valued at US$ 5 billion,to sell mobile telephony services throughout the world).In this context, and given the initial resistance to thisacquisition by the United States Congress, theimportance of the attempt by Deutsche Telekom toacquire the United States giant VoiceStream forUS$ 50.7 billion becomes clear. Taken together, thesedevelopments reveal the increasingly global character ofthe corporate strategies applied in thetelecommunications industry.
Lastly, it is interesting to note the quickening of theinternational expansion process pursued by the Japanesecompany NTT DoCoMo, one of the first Asian firms toparticipate actively in this frenetic effort to achieveglobal consolidation through mergers and acquisitions.In mid-2000 it made acquisitions in Europe, buying 15%
200 ECLAC
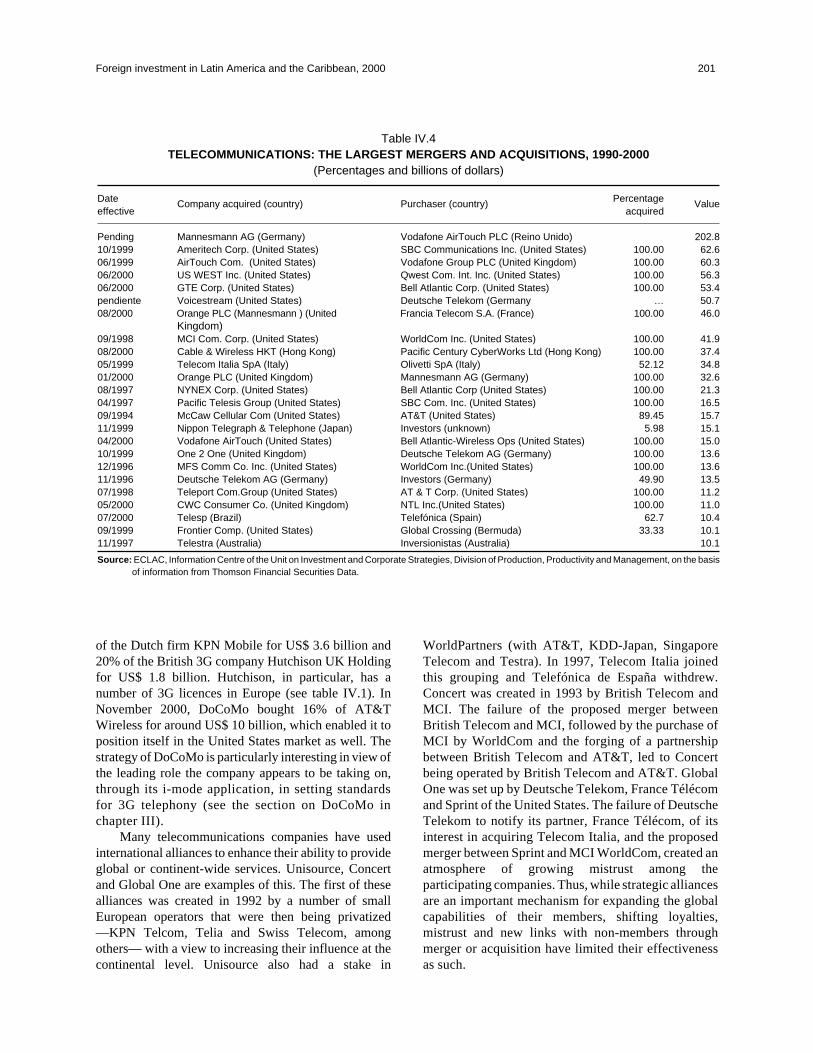
of the Dutch firm KPN Mobile for US$ 3.6 billion and20% of the British 3G company Hutchison UK Holdingfor US$ 1.8 billion. Hutchison, in particular, has anumber of 3G licences in Europe (see table IV.1). InNovember 2000, DoCoMo bought 16% of AT&TWireless for around US$ 10 billion, which enabled it toposition itself in the United States market as well. Thestrategy of DoCoMo is particularly interesting in view ofthe leading role the company appears to be taking on,through its i-mode application, in setting standardsfor 3G telephony (see the section on DoCoMo inchapter III).
Many telecommunications companies have usedinternational alliances to enhance their ability to provideglobal or continent-wide services. Unisource, Concertand Global One are examples of this. The first of thesealliances was created in 1992 by a number of smallEuropean operators that were then being privatized—KPN Telcom, Telia and Swiss Telecom, amongothers— with a view to increasing their influence at thecontinental level. Unisource also had a stake in
WorldPartners (with AT&T, KDD-Japan, SingaporeTelecom and Testra). In 1997, Telecom Italia joinedthis grouping and Telefónica de España withdrew.Concert was created in 1993 by British Telecom andMCI. The failure of the proposed merger betweenBritish Telecom and MCI, followed by the purchase ofMCI by WorldCom and the forging of a partnershipbetween British Telecom and AT&T, led to Concertbeing operated by British Telecom and AT&T. GlobalOne was set up by Deutsche Telekom, France Télécomand Sprint of the United States. The failure of DeutscheTelekom to notify its partner, France Télécom, of itsinterest in acquiring Telecom Italia, and the proposedmerger between Sprint and MCI WorldCom, created anatmosphere of growing mistrust among theparticipating companies. Thus, while strategic alliancesare an important mechanism for expanding the globalcapabilities of their members, shifting loyalties,mistrust and new links with non-members throughmerger or acquisition have limited their effectivenessas such.
Foreign investment in Latin America and the Caribbean, 2000 201
Table IV.4TELECOMMUNICATIONS: THE LARGEST MERGERS AND ACQUISITIONS, 1990-2000
(Percentages and billions of dollars)
Date Company acquired (country) Purchaser (country) Percentage Valueeffective acquired
Pending Mannesmann AG (Germany) Vodafone AirTouch PLC (Reino Unido) 202.810/1999 Ameritech Corp. (United States) SBC Communications Inc. (United States) 100.00 62.606/1999 AirTouch Com. (United States) Vodafone Group PLC (United Kingdom) 100.00 60.306/2000 US WEST Inc. (United States) Qwest Com. Int. Inc. (United States) 100.00 56.306/2000 GTE Corp. (United States) Bell Atlantic Corp. (United States) 100.00 53.4pendiente Voicestream (United States) Deutsche Telekom (Germany … 50.708/2000 Orange PLC (Mannesmann ) (United Francia Telecom S.A. (France) 100.00 46.0
Kingdom)09/1998 MCI Com. Corp. (United States) WorldCom Inc. (United States) 100.00 41.908/2000 Cable & Wireless HKT (Hong Kong) Pacific Century CyberWorks Ltd (Hong Kong) 100.00 37.405/1999 Telecom Italia SpA (Italy) Olivetti SpA (Italy) 52.12 34.801/2000 Orange PLC (United Kingdom) Mannesmann AG (Germany) 100.00 32.608/1997 NYNEX Corp. (United States) Bell Atlantic Corp (United States) 100.00 21.304/1997 Pacific Telesis Group (United States) SBC Com. Inc. (United States) 100.00 16.509/1994 McCaw Cellular Com (United States) AT&T (United States) 89.45 15.711/1999 Nippon Telegraph & Telephone (Japan) Investors (unknown) 5.98 15.104/2000 Vodafone AirTouch (United States) Bell Atlantic-Wireless Ops (United States) 100.00 15.010/1999 One 2 One (United Kingdom) Deutsche Telekom AG (Germany) 100.00 13.612/1996 MFS Comm Co. Inc. (United States) WorldCom Inc.(United States) 100.00 13.611/1996 Deutsche Telekom AG (Germany) Investors (Germany) 49.90 13.507/1998 Teleport Com.Group (United States) AT & T Corp. (United States) 100.00 11.205/2000 CWC Consumer Co. (United Kingdom) NTL Inc.(United States) 100.00 11.007/2000 Telesp (Brazil) Telefónica (Spain) 62.7 10.409/1999 Frontier Comp. (United States) Global Crossing (Bermuda) 33.33 10.111/1997 Telestra (Australia) Inversionistas (Australia) 10.1
Source: ECLAC, Information Centre of the Unit on Investment and Corporate Strategies, Division of Production, Productivity and Management, on the basisof information from Thomson Financial Securities Data.
In Latin America, the corporate map of thetelecommunications sector has some features that areworth noting, in particular a number of tendencies thatare beginning to emerge in the different segments of theindustry (see table IV.5). First, privatization has meantthat State companies have all but disappeared from thesector, the exceptions being Telecom Colombia and theUruguayan national telecommunications operator, theAdministración Nacional de Telecomunicaciones(Antel). In fact, where fixed-line telephony is concerned,all of today’s operators have their origin, directly orindirectly, in public assets transferred in this way (this istrue of only seven operators in the long-distance segmentand five in the cellular mobile telephony segment) (seetable IV.5). Second, up until 1999 the bulk of the sector’srevenue continued to come from fixed-line telephony
(US$ 24.742 billion, as compared with US$ 3.229 billionfrom international long distance and US$ 7.826 billionfrom cellular mobile telephony). Third, because of itsprivileged position in the Mexican market (see boxIV.3), the leading company in all segments is Telmex,which is controlled by the private group Carso, althougha minority stake is held by the United States firm SBCCommunications. Fourth, Telefónica de España has thebest regional coverage and holds a position of leadershipin all segments and in most Latin American countries,particularly in fixed-line telephony. Fifth, the only othercompany with a major presence in all segments and in asignificant number of countries is Telecom Italia, largelyowing to the active expansion strategy it has pursued inBrazil since 1996. Sixth, the United States companyVerizon (the result of a merger between Bell Atlantic and
202 ECLAC
Table IV.5LATIN AMERICA: THE LEADING TELECOMMUNICATIONS COMPANIES,
BY MARKET SEGMENT, 1999(Millions of dollars)
Basic telephony operators International telephony operators Cellular mobile telephony operators
TELMEX (Mexico) 6 410 TELMEX (Mexico) 949 TELMEX (Mexico) 1 364
Tele Norte Leste, Telemar 4 659 MCI EMBRATEL (Brazil) 534 Telesp Celular (Brazil) 1 236(Brazil) MCI WorldCom Portugal Telecom
Telesp (Brazil) Telefónica 2 559 Telintar (Argentina) Telefónica 484 Telcel (Venezuela) 1 051BellSouth
Telefónica Argentina 2 526 Telecom Colombia (Colombia) 420 Tele Sudeste Celular 833(Argentina) Telefónica (Brazil) Telefónica
Telecom (Argentina) France 2 310 CANTV (Venezuela) Verizon 340 Movicom (Argentina) 830Télécom - Telecom Italia BellSouth
CANTV (Venezuela) Verizon 2 099 Telefónica del Perú (Peru) 187 BCP (Brazil) BellSouth 694Telefónica
Tele Centro Sul (Brasil) 1 690 Telefónica CTC Chile (Chile) 123 CANTV (Venezuela) 670Telecom Italia Telefónica Verizon
Telefónica CTC Chile (Chile) 972 ANTEL (Uruguay) 118 Iusacell (Mexico) Verizon 440Telefónica
Telefónica del Perú (Perú) 882 Entel (Chile) Telecom Italia 74 TIM Celular (Brazil) 380Telefónica Telecom Italia
CRT (Brazil) Telecom Italia 635 CODETEL (Dominican Republic) … Celular CRT (Brazil) 328Verizon Telefónica
Total 10 leading companies 24 742 Total 10 leading companies 3 229 Total 10 leading companies 7 826
Source: ECLAC, Information Centre of the Unit on Investment and Corporate Strategies, Division of Production, Productivity and Management, on the basisof information from the International Telecommunication Union (ITU), Indicadores de telecomunicaciones de las Américas, Geneva, April 2000.

GTE), although it too has a presence in all segments,operates almost exclusively in one country, Venezuela,through the Compañía Anónima Nacional de Teléfonosde Venezuela (CANTV). Seventh, the United Statescompany BellSouth has become one of the region’s mainwireless telephony operators, disputing leadership in thissegment with Telmex, Telefónica de España, TelecomItalia and Verizon. Eighth, and perhaps mostimportantly, a substantial number of Latin America’sleading telecommunications companies are subsidiariesof transnational corporations that do not actually holdpositions of leadership in the industry at the world level.This suggests that profound changes would occur in the
region’s telecommunications industry were the leadingglobal firms to make an appearance.
What all this shows is that the structure of thetelecommunications industry in Latin America has beenstrongly influenced by changes of ownership. Byinternational standards, however, these operations arevery minor (see table IV.4). The only one to have comeclose to the enormous transactions seen recently in theglobal telecommunications industry was OperationVerónica, carried out by Telefónica de España inArgentina, Brazil and Peru, which involved sumstotalling US$ 19.778 billion (see table IV.6). In fact, oneof the transactions involved in this operation, in Brazil,
Foreign investment in Latin America and the Caribbean, 2000 203
Table IV.6LATIN AMERICA: LARGEST MERGERS AND ACQUISITIONS IN THE
TELECOMMUNICATIONS SECTOR, 1990-2000(Percentages and millions of dollars)
Date Company acquired (country) Purchaser (country) Percentage Valueeffective acquired
07/2000 Telesp (Brazil) Telefónica (Spain)a
62.7 10 423
07/1998 Telesp (Brazil) Telefónica (Spain) / Portugal Telecom/ 19.3 4 973Iberdrola (Spain)
b
07/2000 Telefónica of Argentina Telefónica (Spain)a
44.2 3 718
07/2000 Telefónica del Peru (ex ENTEL Perú) Telefónica (Spain)a
56.7 3 218
07/1998 Telesp Celular Portugal Telecomb
19.3 3 084
11/1990 Telefónica of Argentina Telefónica (Spain) 60.0 3 016
07/1998 Tele Norte Leste (TELEMAR) (Brazil) Grupo Andrade Gutierrez (Brazil)b
19.3 2 950
11/1990 Telecom Argentina France Télécom / Telecom Italia 60.0 2 578
08/1997 Licencia banda B para São Paulo BellSouth (United States)/Grupo Safra 100.0 2 453(Brazil)
07/2000 Tele Sudeste Celular S.A. (Brazil) Telefónica (Spain)a
73.4 2 419
07/1998 Embratel (Brazil) World Com (United States)b
19.3 2 278
05/1994 ENTEL Perú Telefónica (Spain) 35.0 2 002
12/1991 Cía. Anónima Nacional de Teléfonos Verizon (United States) 40.0 1 885de Venezuela (CANTV)
07/1998 Tele Centro Sul (TELEMATO) (Brazil) Telecom Italiab
19.3 1 781
12/1990 Teléfonos de México (TELMEX) Grupo Carso (México)/SBC (United States)/France Télécom 20.4 1 684
Source: ECLAC, Information Centre of the Unit on Investment and Corporate Strategies, Division of Production, Productivity and Management, on the basisof information from Thomson Financial Securities Data, electronic version, 2000.
aPart of Operation Verónica carried out by Telefónica de España in the first half of 2000.
bOperations carried out as part of the Telebrás privatization process.

ranks twenty-first in the list of the world’s largestmergers and acquisitions in the sector (see table IV.4).Meanwhile, privatization of the Telebrás system inmid-1998 enabled private investors to enter the region’slargest market. Thus, some European companies(Telefónica and Telecom Italia) consolidated theirregional position, and companies that were beginning toshape a global strategy found themselves obliged toinclude Latin America in their plans.
Thus, rapid technological change, thetransnationalization of telecommunications companiesand the application of sectoral deregulation andliberalization policies to increase competition are allfactors in the globalization process that the industry isgoing through in Latin America and the world, and theyall need to be considered if this process is to be better
understood. The benefits it has produced so far includelarge FDI flows, better service quality and coverage,lower prices and improvements in the systemiccompetitiveness of the recipient economies and in theextent and quality of their integration into theinternational economy. The negative consequencesinclude increased risk (reflected in the financialinstability of stock markets), systemic weakness infinancial systems and often unpredictable or irrationalbehaviour by operators, governments and regulatorsowing to the speed and uncertainty of the process. Allactors have an interest in strengthening the positiveeffects of this globalization process and avoiding itsnegative ones as far as possible. If this is to be achieved,the strategies of the main economic agents involved inthe telecommunications industry need to be taken intoaccount.
B. TRANSNATIONAL TELECOMMUNICATIONS COMPANIES IN LATIN AMERICAAND THE CARIBBEAN
1. The first wave: European State companies
This paper will now describe the business strategies ofthose international companies that have a long trackrecord in the region and are firmly established in LatinAmerican telecommunications markets. The greatmajority of them are European companies (Telefónica deEspaña, Telecom Italia and France Télécom) which, inthe South American countries, have focused their effortson fixed-line telephony, a segment they have longdominated. All these companies began their regionaloperations in the context of the privatizationprogrammes of the early 1990s. In the second part of thedecade, they strengthened their positions and moved intonew telecommunications segments.
(a) Telefónica de España: from Latin America toglobal operator?
This former State monopoly has become one of theleading operators in the competitive European market.
Telefónica was fully privatized in February 1997,although the Spanish State retained a golden share givingit a veto over the strategic decisions of the group. By late1999, Telefónica was one of the world’s 12 largesttelecommunications companies and ranked sixth inEurope, as well as being the main provider of services tothe world’s Spanish-speaking population and, recently,its Portuguese-speaking population too. Table IV.3places it twelfth in the fixed-line segment and thirteenthin both international long-distance and cellular mobiletelephony. Between 1996 and 1999, the companyachieved spectacular growth through an activeacquisition strategy, as a result of which its revenue hasalmost doubled and its stock market value has increasedmore than fivefold83 (Telefónica, 2000). Although it hasattempted a number of alliances, however, Telefónica isstill without a firm international partner, and this is adifficulty for the company at a time when concentrationin the world telecommunications market is increasing. In
204 ECLAC
83 In early 2000, the then Chairman of Telefónica, Juan Villalonga, said: “We want to be one of the world’s top five companies by stock market
capitalization” (The Wall Street Journal Americas, 8 May 2000). Although the goal is a long way from being achieved, this declaration reveals
the thinking that has guided executives of the Spanish firm, particularly its former Chairman.

fact, it is still a potential target for hostile takeover byanother international operator with global ambitions.
When liberalization of the sector in Spain and theEuropean Union was imminent, Telefónica, unlike otherlarge international operators, chose to focus itsexpansion strategy on Latin America, where it hasbecome the largest foreign company as measured by1999 consolidated sales (see table I.11). The firm wasseeking to improve its competitive position by achievingcritical mass on an international scale. From its point ofview, the opportunities that were beginning to emerge inthe region offered the ideal way of confronting thechallenges of globalization. On the one hand, this was amarket with high growth potential (unmet demand andinadequate infrastructure investment), while on theother, there was the prospect of achieving operatingsynergies by setting up common systems andstrengthening the company’s negotiating capacity(Calderón, 1999). This strategy has enabled Telefónicato grow in other markets whilst remaining supreme in itsown. By mid-2000, two years after the sector wasliberalized in Spain, Telefónica had seen its market sharefall by just 5% in its home country, while LatinAmerica’s contribution to total group revenues had risento about 50%.
In a very short space of time, Telefónica hastransformed itself from a telephony operator into acommunications firm, and from a public utility into asupplier of differentiated services to a wide range ofcustomers. In late 1998, it was decided that the companyneeded to change its image, and as a result the singlebrand name “Telefónica” was adopted to help integrateand consolidate the firm’s international activities. Inearly 1999, Telefónica de España began to implement abusiness segmentation strategy, supplemented by apolicy of selling off non-strategic assets. Thus, on 1January 1999, Telefónica de España became a separatecompany operating fixed-line telephony in Spain andacting as overall group head. Over the following months,separate stock market listings began to be obtained forTerra Networks (Internet), Telefónica Media (contentand media), TPI-Páginas Amarillas and Atento (callcentres) and the undersea cable company Emergia. Thesubsequent addition of Telefónica Móviles andTelefónica DataCorp. supplemented the group’s mainlines of business, in which traditional fixed-linetelephony accounts for a shrinking share.
By late 1999, Telefónica’s strong expansion in LatinAmerica stood in sharp contrast to its virtual absencefrom Europe, outside Spain. The company chose toremedy this, at the same time as it broke down itsvertically integrated structure into separate businessunits, by announcing new capital increases to finance amore global growth strategy in which it wouldconsolidate its presence in Latin America while takingpositions in the European market.84 To achieve this,Telefónica’s stock was used as currency (Cinco Días, 8July 2000). Considering that the wireless revolution inEurope could be more important for the future of theInternet than fixed-line broadband access, the maininternational operators began to work on the assumptionthat cellular telephones and other wireless devices mightbecome the main Internet access tools. This approachwas reflected by the great success of the Europeanauctions for new 3G (UMTS) licences held in 2000. Inthe meantime, fixed-line broadband provides analternative for international operators looking to createa strong position for themselves in Europeanconvergence markets in the short and medium term; bysome stage in 2001, half of all households in Germany,Italy, Spain and the United Kingdom should haveaccess to broadband. In view of this, Telefónica isimplementing a combined strategy to capitalize on thebusiness opportunities being opened up by theconvergence of mobile telephony and the Internet, asthe following facts demonstrate:• The strategic importance given to the 3G mobile
telephony licence auctions when these began to beheld throughout Europe (see table IV.1). In March2000, Telefónica obtained a licence in Spain free ofcharge. In the United Kingdom, it considered buyingthe mobile operator Orange, which already had a 3Glicence, although nothing ultimately came of this. InAugust 2000, acting in partnership with the Finnishcompany Sonera Oy, Telefónica paid US$ 7.69 billionfor one of the six UMTS licences in Germany. Thissum only covers market access, so the consortium willhave to invest a further US$ 3.6 billion or so to build itsnetwork, which should come into operation in 2002(Telefónica de España, 2000a). Further licences weresubsequently obtained in Italy and Austria. However,waning faith in the future of the UMTS system, whichwas reflected in the poor results of the auctions held inAustria, Italy and Switzerland, led Telefónica to pull
Foreign investment in Latin America and the Caribbean, 2000 205
84 In early 2000, Telefónica tried to merge with the Dutch company Royal KPN, an operation valued at US$ 60 billion. The attempt ultimately had
to be abandoned in view of the reservations of the Spanish Government and Telefónica’s core shareholders, Banco Bilbao Vizcaya Argentaria
(BBVA) and the savings bank La Caixa. Had it gone ahead, the merger would have created Europe’s fourth-largest telephone operator, with a
market value of over US$ 100 billion, and its third-largest wireless services provider, after Vodafone AirTouch and Telecom Italia Mobile
(TIM). As an Internet access provider for corporate customers, it would have been second only to WorldCom.

out of the Belgian and French auctions held in early2001.
• Since its creation, Terra Networks, Telefónica’sInternet business unit, has pursued an aggressiveacquisition strategy with the aim of achieving aleading position as an on-line portal, provider andsearch engine in Spanish-speaking markets. In early2000, it invested over US$ 80 million in an intensiveadvertising campaign to conquer theSpanish-speaking market of the United States.Subsequently, in May 2000, Terra announced theacquisition of Lycos, the fourth-largest portal in theUnited States, which also has a strong presence inEurope (France, Germany and the United Kingdom).The operation, valued at US$ 12.5 billion, was carriedout by means of a share swap. It marked a milestone inthe industry as the largest tie-up to date between atelecommunications operator and an Internet portal,producing the world’s third-largest Internet firm. Thefinal agreement awaits ratification by Lycosshareholders and the authorities of the United Statesand EU.
• In March 2000, Telefónica announced the acquisitionof one of Europe’s largest television producers,Endemol of the Netherlands, best known as the creatorof Big Brother, the rights to which have been sold to anumber of European broadcasters and to CBS in theUnited States. This operation, valued at some US$4.48 billion, was carried out by means of a share swap.The idea is for Endemol, among its other internationalactivities, to become one of the main content providers(television and Internet productions) for thedistribution platforms of all the Telefónica companies(Telefónica Media, Terra Networks and Terra Mobile)and for the group’s 3G mobile telephony arm,Telefónica Móviles, as well as for other platformssuch as call centres and future broadband initiatives.
By late 1999, having invested over US$ 11 billion inArgentina, Brazil, Chile, El Salvador, Guatemala, Peru,Puerto Rico and Venezuela, Telefónica had become theleading global operator in the Latin Americantelecommunications market, particularly the fixed-linetelephony segment (ECLAC, 2000a). This position wasfirmly consolidated by the company’s successfulparticipation in the Telebrás privatization process, whenit took control of the fixed-line telephony operator of thestate of São Paulo (Telesp) and of two cellular telephonyoperators (TeleSudeste Celular and TeleLeste Celular)(see table IV.7). By early 2000, Telefónica operatedmore telephone lines and had more mobile telephonycustomers in Latin America than in Spain (Telefónica deEspaña, 2000a, pp. 19 and 29). The result is that a third ofall telephone calls in Latin America are made over a line
belonging to one of the companies controlled byTelefónica (Gazeta Mercantil Latino-Americana, 31January to 6 February 2000).
By and large, corporate control has been a higherpriority in Telefónica’s investment decisions than price.A review of the sums the Spanish company has spent onacquiring Latin American assets leaves no doubt as to thestrategic value it sets on the region (Calderón, 1999). Inone early case, that of Peru, its bid was twice as high asthose submitted by other consortia, while in the morerecent case of Brazil, the sum Telefónica offered forTelesp was 64% higher than the reserve price and overUS$ 1.56 billion more than the second-highest bid.Furthermore, despite having secured a solid majority inthe companies it invested in at privatization in Argentina,Brazil, Chile and Peru, Telefónica has continued toincrease its equity holdings in these affiliates, first bybuying shares on the open market and then by launchinga number of takeover bids.
Telefónica firmly entrenched its regional position inJuly 2000, when it launched successful offers for all theequity in its Argentine, Brazilian and Peruvian affiliatesthat it did not already own. In this process, termed“Operation Verónica”, it offered a premium of 40% overthe average share prices of these Latin Americanaffiliates for the five days preceding the acquisitionproposal at the beginning of the year. It thus took controlof 96% of Telefónica of Argentina, 87.5% of Telesp,89.3% of TeleSudeste Celular and 95.5% of Telefónicaof Peru. The total cost of the operation, which took theform of a share swap, was US$ 19.778 billion. It was thelargest capital market operation every carried out inLatin America and it made Telefónica the region’slargest investor, with assets of some US$ 35 billion(Telefónica de España, 2000b).
Taking control of these Latin American affiliateswas vital to Telefónica’s strategy of operating by globalbusiness lines. The Spanish group will now be able tointegrate the wireless telephony units of these companiesinto a new firm, Telefónica Móviles, whose stock marketlaunch was scheduled for late 2000 (Cinco Días, 8 July2000). At the same time, the new capital increases meanthat Telefónica will become Europe’s fourth-largesttelecommunications company by stock market value,behind the British mobile telephony company VodafoneAirTouch and the former monopolies of the two mainEuropean countries, Deutsche Telekom and FranceTélécom.
In October 2000, Telefónica signed an agreementthat will enable it to complete its regional wirelessnetwork and establish itself firmly as Latin America’sleading telecommunications operator. It acquired fourmobile telephony companies, operating in northern
206 ECLAC
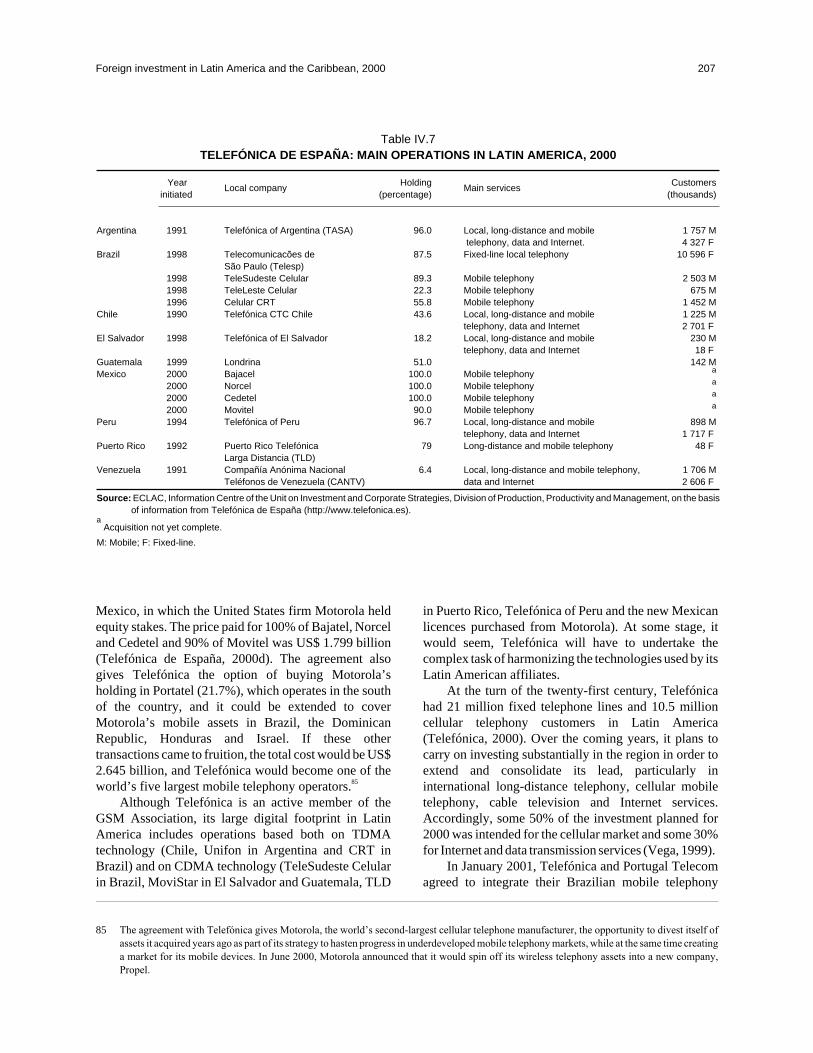
Mexico, in which the United States firm Motorola heldequity stakes. The price paid for 100% of Bajatel, Norceland Cedetel and 90% of Movitel was US$ 1.799 billion(Telefónica de España, 2000d). The agreement alsogives Telefónica the option of buying Motorola’sholding in Portatel (21.7%), which operates in the southof the country, and it could be extended to coverMotorola’s mobile assets in Brazil, the DominicanRepublic, Honduras and Israel. If these othertransactions came to fruition, the total cost would be US$2.645 billion, and Telefónica would become one of theworld’s five largest mobile telephony operators.85
Although Telefónica is an active member of theGSM Association, its large digital footprint in LatinAmerica includes operations based both on TDMAtechnology (Chile, Unifon in Argentina and CRT inBrazil) and on CDMA technology (TeleSudeste Celularin Brazil, MoviStar in El Salvador and Guatemala, TLD
in Puerto Rico, Telefónica of Peru and the new Mexicanlicences purchased from Motorola). At some stage, itwould seem, Telefónica will have to undertake thecomplex task of harmonizing the technologies used by itsLatin American affiliates.
At the turn of the twenty-first century, Telefónicahad 21 million fixed telephone lines and 10.5 millioncellular telephony customers in Latin America(Telefónica, 2000). Over the coming years, it plans tocarry on investing substantially in the region in order toextend and consolidate its lead, particularly ininternational long-distance telephony, cellular mobiletelephony, cable television and Internet services.Accordingly, some 50% of the investment planned for2000 was intended for the cellular market and some 30%for Internet and data transmission services (Vega, 1999).
In January 2001, Telefónica and Portugal Telecomagreed to integrate their Brazilian mobile telephony
Foreign investment in Latin America and the Caribbean, 2000 207
Table IV.7TELEFÓNICA DE ESPAÑA: MAIN OPERATIONS IN LATIN AMERICA, 2000
YearLocal company
HoldingMain services
Customersinitiated (percentage) (thousands)
Argentina 1991 Telefónica of Argentina (TASA) 96.0 Local, long-distance and mobile 1 757 Mtelephony, data and Internet. 4 327 F
Brazil 1998 Telecomunicacões de 87.5 Fixed-line local telephony 10 596 FSão Paulo (Telesp)
1998 TeleSudeste Celular 89.3 Mobile telephony 2 503 M1998 TeleLeste Celular 22.3 Mobile telephony 675 M1996 Celular CRT 55.8 Mobile telephony 1 452 M
Chile 1990 Telefónica CTC Chile 43.6 Local, long-distance and mobile 1 225 Mtelephony, data and Internet 2 701 F
El Salvador 1998 Telefónica of El Salvador 18.2 Local, long-distance and mobile 230 Mtelephony, data and Internet 18 F
Guatemala 1999 Londrina 51.0 142 MMexico 2000 Bajacel 100.0 Mobile telephony a
2000 Norcel 100.0 Mobile telephony a
2000 Cedetel 100.0 Mobile telephony a
2000 Movitel 90.0 Mobile telephony a
Peru 1994 Telefónica of Peru 96.7 Local, long-distance and mobile 898 Mtelephony, data and Internet 1 717 F
Puerto Rico 1992 Puerto Rico Telefónica 79 Long-distance and mobile telephony 48 FLarga Distancia (TLD)
Venezuela 1991 Compañía Anónima Nacional 6.4 Local, long-distance and mobile telephony, 1 706 MTeléfonos de Venezuela (CANTV) data and Internet 2 606 F
Source: ECLAC, Information Centre of the Unit on Investment and Corporate Strategies, Division of Production, Productivity and Management, on the basisof information from Telefónica de España (http://www.telefonica.es).
aAcquisition not yet complete.
M: Mobile; F: Fixed-line.
85 The agreement with Telefónica gives Motorola, the world’s second-largest cellular telephone manufacturer, the opportunity to divest itself of
assets it acquired years ago as part of its strategy to hasten progress in underdeveloped mobile telephony markets, while at the same time creating
a market for its mobile devices. In June 2000, Motorola announced that it would spin off its wireless telephony assets into a new company,
Propel.
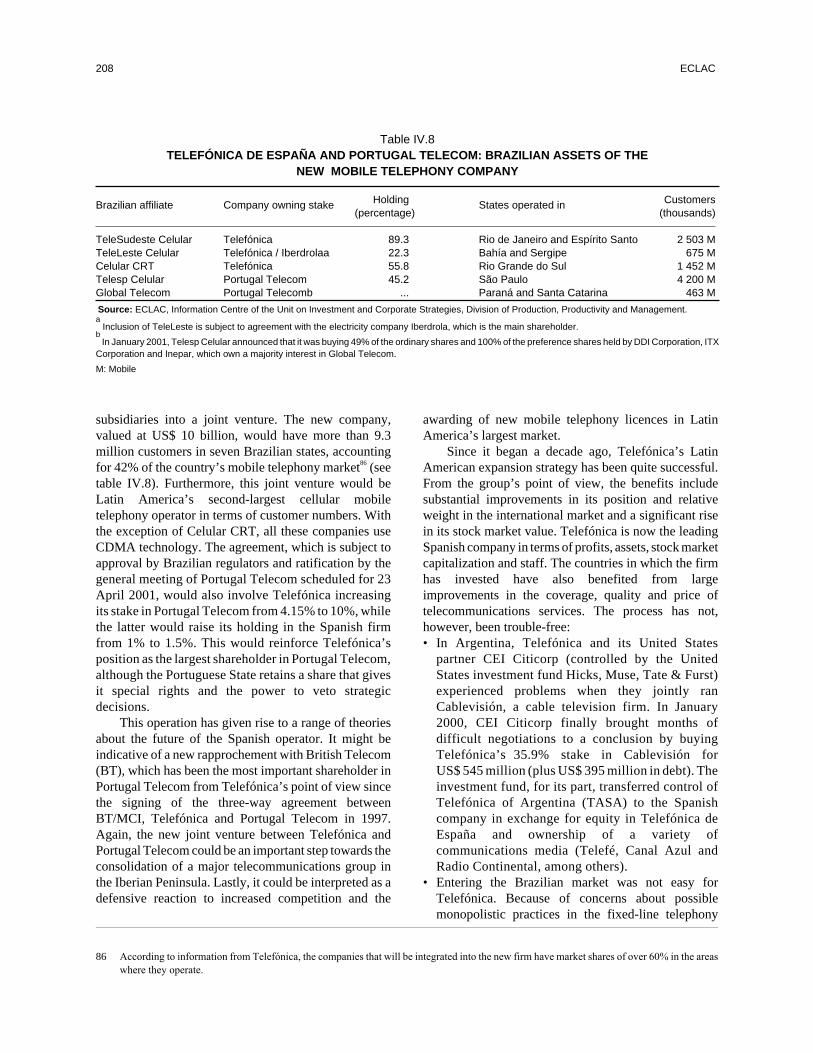
subsidiaries into a joint venture. The new company,valued at US$ 10 billion, would have more than 9.3million customers in seven Brazilian states, accountingfor 42% of the country’s mobile telephony market86 (seetable IV.8). Furthermore, this joint venture would beLatin America’s second-largest cellular mobiletelephony operator in terms of customer numbers. Withthe exception of Celular CRT, all these companies useCDMA technology. The agreement, which is subject toapproval by Brazilian regulators and ratification by thegeneral meeting of Portugal Telecom scheduled for 23April 2001, would also involve Telefónica increasingits stake in Portugal Telecom from 4.15% to 10%, whilethe latter would raise its holding in the Spanish firmfrom 1% to 1.5%. This would reinforce Telefónica’sposition as the largest shareholder in Portugal Telecom,although the Portuguese State retains a share that givesit special rights and the power to veto strategicdecisions.
This operation has given rise to a range of theoriesabout the future of the Spanish operator. It might beindicative of a new rapprochement with British Telecom(BT), which has been the most important shareholder inPortugal Telecom from Telefónica’s point of view sincethe signing of the three-way agreement betweenBT/MCI, Telefónica and Portugal Telecom in 1997.Again, the new joint venture between Telefónica andPortugal Telecom could be an important step towards theconsolidation of a major telecommunications group inthe Iberian Peninsula. Lastly, it could be interpreted as adefensive reaction to increased competition and the
awarding of new mobile telephony licences in LatinAmerica’s largest market.
Since it began a decade ago, Telefónica’s LatinAmerican expansion strategy has been quite successful.From the group’s point of view, the benefits includesubstantial improvements in its position and relativeweight in the international market and a significant risein its stock market value. Telefónica is now the leadingSpanish company in terms of profits, assets, stock marketcapitalization and staff. The countries in which the firmhas invested have also benefited from largeimprovements in the coverage, quality and price oftelecommunications services. The process has not,however, been trouble-free:• In Argentina, Telefónica and its United States
partner CEI Citicorp (controlled by the UnitedStates investment fund Hicks, Muse, Tate & Furst)experienced problems when they jointly ranCablevisión, a cable television firm. In January2000, CEI Citicorp finally brought months ofdifficult negotiations to a conclusion by buyingTelefónica’s 35.9% stake in Cablevisión forUS$ 545 million (plus US$ 395 million in debt). Theinvestment fund, for its part, transferred control ofTelefónica of Argentina (TASA) to the Spanishcompany in exchange for equity in Telefónica deEspaña and ownership of a variety ofcommunications media (Telefé, Canal Azul andRadio Continental, among others).
• Entering the Brazilian market was not easy forTelefónica. Because of concerns about possiblemonopolistic practices in the fixed-line telephony
208 ECLAC
Table IV.8TELEFÓNICA DE ESPAÑA AND PORTUGAL TELECOM: BRAZILIAN ASSETS OF THE
NEW MOBILE TELEPHONY COMPANY
Brazilian affiliate Company owning stake Holding States operated in Customers(percentage) (thousands)
TeleSudeste Celular Telefónica 89.3 Rio de Janeiro and Espírito Santo 2 503 MTeleLeste Celular Telefónica / Iberdrolaa 22.3 Bahía and Sergipe 675 MCelular CRT Telefónica 55.8 Rio Grande do Sul 1 452 MTelesp Celular Portugal Telecom 45.2 São Paulo 4 200 MGlobal Telecom Portugal Telecomb ... Paraná and Santa Catarina 463 M
Source: ECLAC, Information Centre of the Unit on Investment and Corporate Strategies, Division of Production, Productivity and Management.a
Inclusion of TeleLeste is subject to agreement with the electricity company Iberdrola, which is the main shareholder.b
In January 2001, Telesp Celular announced that it was buying 49% of the ordinary shares and 100% of the preference shares held by DDI Corporation, ITXCorporation and Inepar, which own a majority interest in Global Telecom.
M: Mobile
86 According to information from Telefónica, the companies that will be integrated into the new firm have market shares of over 60% in the areas
where they operate.
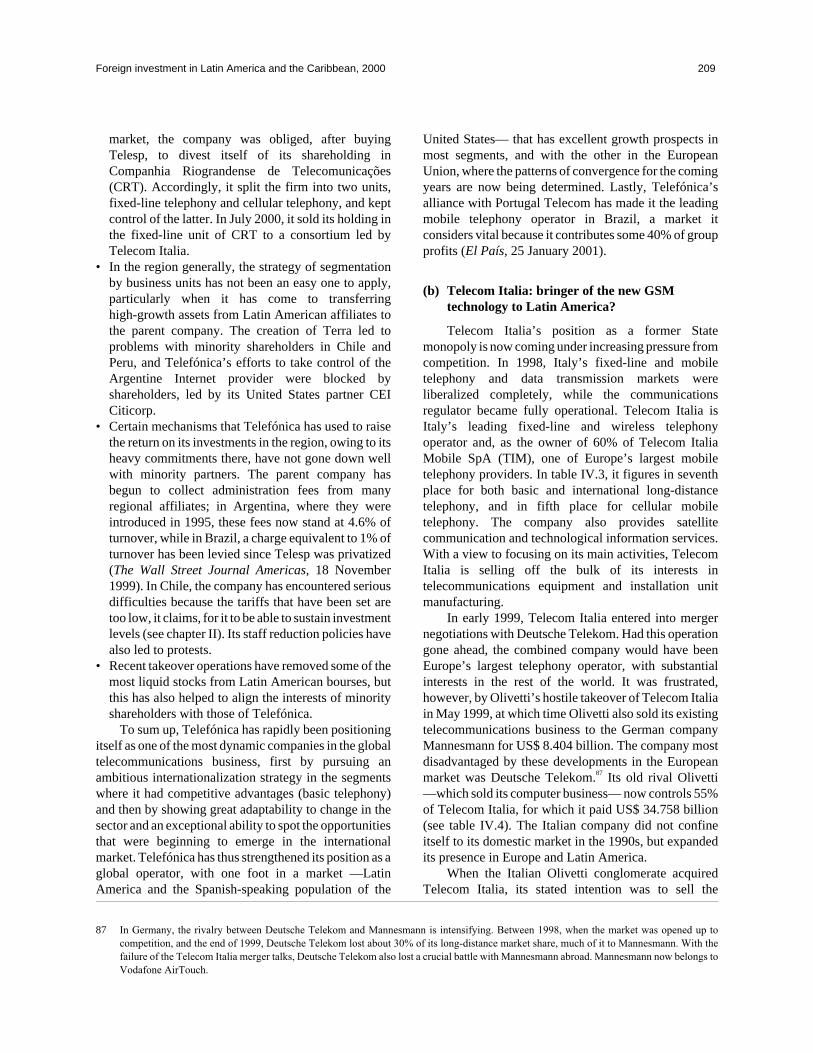
market, the company was obliged, after buyingTelesp, to divest itself of its shareholding inCompanhia Riograndense de Telecomunicações(CRT). Accordingly, it split the firm into two units,fixed-line telephony and cellular telephony, and keptcontrol of the latter. In July 2000, it sold its holding inthe fixed-line unit of CRT to a consortium led byTelecom Italia.
• In the region generally, the strategy of segmentationby business units has not been an easy one to apply,particularly when it has come to transferringhigh-growth assets from Latin American affiliates tothe parent company. The creation of Terra led toproblems with minority shareholders in Chile andPeru, and Telefónica’s efforts to take control of theArgentine Internet provider were blocked byshareholders, led by its United States partner CEICiticorp.
• Certain mechanisms that Telefónica has used to raisethe return on its investments in the region, owing to itsheavy commitments there, have not gone down wellwith minority partners. The parent company hasbegun to collect administration fees from manyregional affiliates; in Argentina, where they wereintroduced in 1995, these fees now stand at 4.6% ofturnover, while in Brazil, a charge equivalent to 1% ofturnover has been levied since Telesp was privatized(The Wall Street Journal Americas, 18 November1999). In Chile, the company has encountered seriousdifficulties because the tariffs that have been set aretoo low, it claims, for it to be able to sustain investmentlevels (see chapter II). Its staff reduction policies havealso led to protests.
• Recent takeover operations have removed some of themost liquid stocks from Latin American bourses, butthis has also helped to align the interests of minorityshareholders with those of Telefónica.
To sum up, Telefónica has rapidly been positioningitself as one of the most dynamic companies in the globaltelecommunications business, first by pursuing anambitious internationalization strategy in the segmentswhere it had competitive advantages (basic telephony)and then by showing great adaptability to change in thesector and an exceptional ability to spot the opportunitiesthat were beginning to emerge in the internationalmarket. Telefónica has thus strengthened its position as aglobal operator, with one foot in a market —LatinAmerica and the Spanish-speaking population of the
United States— that has excellent growth prospects inmost segments, and with the other in the EuropeanUnion, where the patterns of convergence for the comingyears are now being determined. Lastly, Telefónica’salliance with Portugal Telecom has made it the leadingmobile telephony operator in Brazil, a market itconsiders vital because it contributes some 40% of groupprofits (El País, 25 January 2001).
(b) Telecom Italia: bringer of the new GSMtechnology to Latin America?
Telecom Italia’s position as a former Statemonopoly is now coming under increasing pressure fromcompetition. In 1998, Italy’s fixed-line and mobiletelephony and data transmission markets wereliberalized completely, while the communicationsregulator became fully operational. Telecom Italia isItaly’s leading fixed-line and wireless telephonyoperator and, as the owner of 60% of Telecom ItaliaMobile SpA (TIM), one of Europe’s largest mobiletelephony providers. In table IV.3, it figures in seventhplace for both basic and international long-distancetelephony, and in fifth place for cellular mobiletelephony. The company also provides satellitecommunication and technological information services.With a view to focusing on its main activities, TelecomItalia is selling off the bulk of its interests intelecommunications equipment and installation unitmanufacturing.
In early 1999, Telecom Italia entered into mergernegotiations with Deutsche Telekom. Had this operationgone ahead, the combined company would have beenEurope’s largest telephony operator, with substantialinterests in the rest of the world. It was frustrated,however, by Olivetti’s hostile takeover of Telecom Italiain May 1999, at which time Olivetti also sold its existingtelecommunications business to the German companyMannesmann for US$ 8.404 billion. The company mostdisadvantaged by these developments in the Europeanmarket was Deutsche Telekom.87 Its old rival Olivetti—which sold its computer business— now controls 55%of Telecom Italia, for which it paid US$ 34.758 billion(see table IV.4). The Italian company did not confineitself to its domestic market in the 1990s, but expandedits presence in Europe and Latin America.
When the Italian Olivetti conglomerate acquiredTelecom Italia, its stated intention was to sell the
Foreign investment in Latin America and the Caribbean, 2000 209
87 In Germany, the rivalry between Deutsche Telekom and Mannesmann is intensifying. Between 1998, when the market was opened up to
competition, and the end of 1999, Deutsche Telekom lost about 30% of its long-distance market share, much of it to Mannesmann. With the
failure of the Telecom Italia merger talks, Deutsche Telekom also lost a crucial battle with Mannesmann abroad. Mannesmann now belongs to
Vodafone AirTouch.

telecommunications operator’s Latin American assets(Green, 2000). A few months later, however, thisstrategy changed radically, and not only have the LatinAmerican businesses been kept, but the plan is toincrease the company’s holdings in them. As ofmid-2000, 36.4% of all Telecom Italia’s investmentsoutside its home country were in Latin America (ElMercurio, special edition on Italy, 2 June 2000).
Telecom Italia’s presence in Latin America datesback to the early 1990s. In November 1991, the Italian
company and France Télécom founded the Nortelconsortium, which paid about US$ 2.5 billion88 for 60%of one of the two firms produced by the break-up ofArgentina’s Empresa Nacional de Telecomunicaciones(ENTEL) at the time of privatization (see box IV.2).Nortel thus secured management control of the new firm(Telecom Argentina), which has the exclusive right toprovide basic and long-distance services in the northernzone of the country (see tables IV.6 and IV.9). For muchof the 1990s, this was the consortium’s largest
210 ECLAC
Local telecommunicationsoperators are investing heavily toprovide Latin America's maincities with fibre optic rings, inorder to enhance and increasetheir data, voice and videotransfer capabilities. A majorproblem arises, however, withtransmissions beginning or endingoutside the local market, as thesehave to be sent via satellite, anexpensive and inefficient option.With the growth of the Internet,this "bottleneck" has become evenmore constrictive. To address theproblem, Telefónica, GlobalCrossing and the GlobenetCommunications Group are jointlyspending some US$ 4.6 billion toinstall undersea and landnetworks of fibre-optic cableconnecting Latin America with therest of the world. Thecommunications transmissioncapacity of the region will thusincrease dramatically over thenext two years.
• Globenet, a Canadian-basedoperator, is responsible for theAtlantica I project, a fibre-opticnetwork costing an estimatedUS$ 940 million which will linkthe United States with cities in
Argentina, Brazil andVenezuela.
• As part of the South AmericanCrossing (SAC) project, GlobalCrossing is now engaged inlaying a fibre-optic network thatwill link up the main cities ofSouth America early in 2001, ata cost of some US$ 2 billion.
• Telefónica is working inpartnership with the opticalsystems manufacturer TycoInternational to implement thepan-regional South America I(SAm-I or Emergia) project,which involves installing afibre-optic ring connecting upthe whole of Latin America, atan estimated cost of US$ 1.6billion.
Whereas Globenet hasconcentrated on the largest andsupposedly most lucrativemarkets, Global Crossing andTelefónica are building fibre-opticrings that will encircle the whole ofSouth America. Because theprojects of these two lattercompanies overlap in coverageand scope, a number of legaldisputes have arisen. Theobjective of both is to connect tothe continent at different points in
order to link up with the landnetworks of localtelecommunications companies,which will sell on access to theirhigh-performance optical landinfrastructure or "backbones". Withthese three major projects beingimplemented at the same time,scarcity in Latin America will giveway to abundance. By the end of2002, there will be 15 times asmuch telecommunicationsbandwidth capacity available asthere is now, which should give theregion some kind of protectionagainst any technological andregulatory changes in the mediumterm.The real winner in this situationseems to be Telefónica. TheSpanish group, unlike its rivals, alsocontrols an extensive local landnetwork through the companies itowns or part-owns in Argentina,Brazil, Chile, El Salvador,Guatemala, Peru, Puerto Rico,Venezuela, the United States and,more recently, Mexico, which canfeed traffic to SAm-I.
Box IV.5UNDERSEA CABLES: THE REAL-TIME LINK WITH THE REST OF THE WORLD
Source: ECLAC, Unit on Investment and Corporate Strategies, Division of Production, Productivity and Management, on the basis of information fromCarlos Molina, "Una guerra enredada", América economía, Santiago, Chile, 13 July 2000.
88 The payment consisted of US$ 100 million in cash plus US$ 2.308 billion in debt securities with a market value of US$ 353 million.
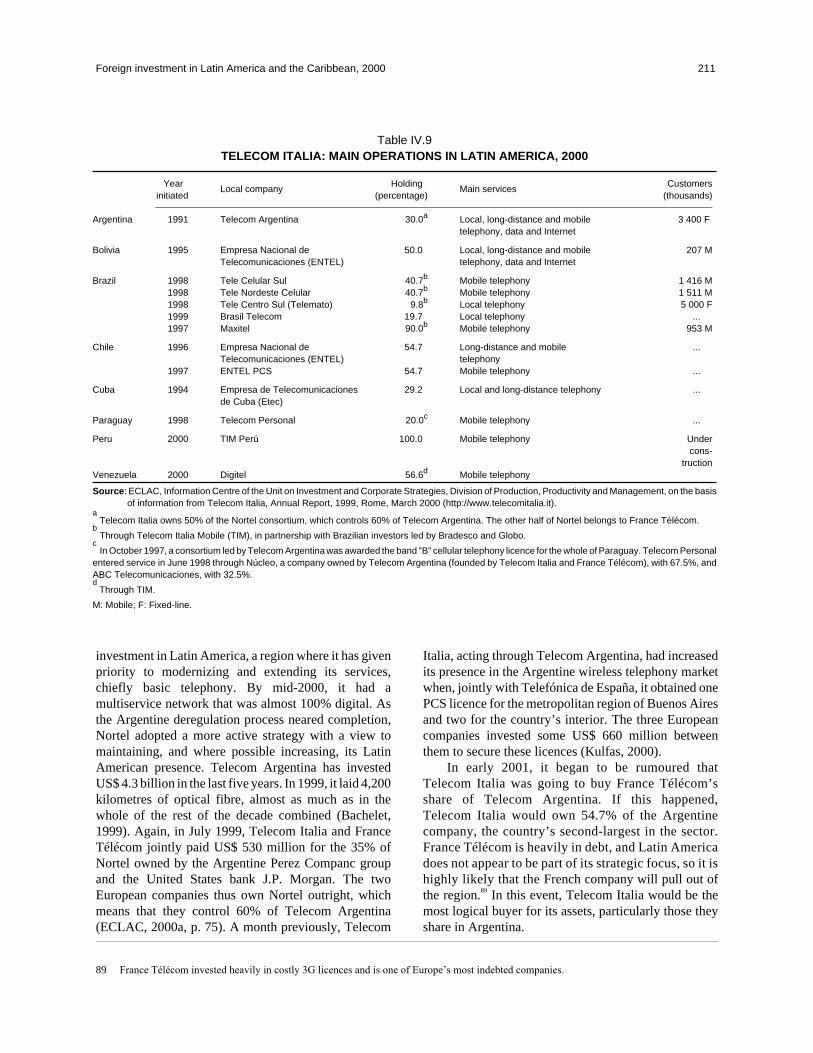
investment in Latin America, a region where it has givenpriority to modernizing and extending its services,chiefly basic telephony. By mid-2000, it had amultiservice network that was almost 100% digital. Asthe Argentine deregulation process neared completion,Nortel adopted a more active strategy with a view tomaintaining, and where possible increasing, its LatinAmerican presence. Telecom Argentina has investedUS$ 4.3 billion in the last five years. In 1999, it laid 4,200kilometres of optical fibre, almost as much as in thewhole of the rest of the decade combined (Bachelet,1999). Again, in July 1999, Telecom Italia and FranceTélécom jointly paid US$ 530 million for the 35% ofNortel owned by the Argentine Perez Companc groupand the United States bank J.P. Morgan. The twoEuropean companies thus own Nortel outright, whichmeans that they control 60% of Telecom Argentina(ECLAC, 2000a, p. 75). A month previously, Telecom
Italia, acting through Telecom Argentina, had increasedits presence in the Argentine wireless telephony marketwhen, jointly with Telefónica de España, it obtained onePCS licence for the metropolitan region of Buenos Airesand two for the country’s interior. The three Europeancompanies invested some US$ 660 million betweenthem to secure these licences (Kulfas, 2000).
In early 2001, it began to be rumoured thatTelecom Italia was going to buy France Télécom’sshare of Telecom Argentina. If this happened,Telecom Italia would own 54.7% of the Argentinecompany, the country’s second-largest in the sector.France Télécom is heavily in debt, and Latin Americadoes not appear to be part of its strategic focus, so it ishighly likely that the French company will pull out ofthe region.89 In this event, Telecom Italia would be themost logical buyer for its assets, particularly those theyshare in Argentina.
Foreign investment in Latin America and the Caribbean, 2000 211
Table IV.9TELECOM ITALIA: MAIN OPERATIONS IN LATIN AMERICA, 2000
YearLocal company
HoldingMain services
Customersinitiated (percentage) (thousands)
Argentina 1991 Telecom Argentina 30.0a Local, long-distance and mobile 3 400 Ftelephony, data and Internet
Bolivia 1995 Empresa Nacional de 50.0 Local, long-distance and mobile 207 MTelecomunicaciones (ENTEL) telephony, data and Internet
Brazil 1998 Tele Celular Sul 40.7b Mobile telephony 1 416 M1998 Tele Nordeste Celular 40.7b Mobile telephony 1 511 M1998 Tele Centro Sul (Telemato) 9.8b Local telephony 5 000 F1999 Brasil Telecom 19.7 Local telephony ...1997 Maxitel 90.0b Mobile telephony 953 M
Chile 1996 Empresa Nacional de 54.7 Long-distance and mobile ...Telecomunicaciones (ENTEL) telephony
1997 ENTEL PCS 54.7 Mobile telephony ...
Cuba 1994 Empresa de Telecomunicaciones 29.2 Local and long-distance telephony ...de Cuba (Etec)
Paraguay 1998 Telecom Personal 20.0c Mobile telephony ...
Peru 2000 TIM Perú 100.0 Mobile telephony Undercons-
tructionVenezuela 2000 Digitel 56.6d Mobile telephony
Source: ECLAC, Information Centre of the Unit on Investment and Corporate Strategies, Division of Production, Productivity and Management, on the basisof information from Telecom Italia, Annual Report, 1999, Rome, March 2000 (http://www.telecomitalia.it).
aTelecom Italia owns 50% of the Nortel consortium, which controls 60% of Telecom Argentina. The other half of Nortel belongs to France Télécom.
bThrough Telecom Italia Mobile (TIM), in partnership with Brazilian investors led by Bradesco and Globo.
cIn October 1997, a consortium led by Telecom Argentina was awarded the band "B" cellular telephony licence for the whole of Paraguay. Telecom Personal
entered service in June 1998 through Núcleo, a company owned by Telecom Argentina (founded by Telecom Italia and France Télécom), with 67.5%, andABC Telecomunicaciones, with 32.5%.d
Through TIM.
M: Mobile; F: Fixed-line.
89 France Télécom invested heavily in costly 3G licences and is one of Europe’s most indebted companies.

In 1998, Telecom Italia took a major step forwardwith its Latin American expansion plans byparticipating successfully in the telecommunicationsprivatization process in Brazil as a member of theconsortia that took control of two mobile telephonycompanies (Tele Celular Sul and Tele NordesteCelular)90 and of one of the three regional fixed-linetelephony firms (Tele Centro Sul/Telemato). Thesetransactions cost about US$ 2.95 billion, and thepremiums paid for some of these firms were amongthe highest in the whole process (ECLAC, 2000a,pp. 42-43). A few months previously, Telecom Italiahad secured three of Brazil’s 10 regional band “B”cellular telephony concessions (Minas Gerais, Bahíaand Sergipe) through Maxitel, a company in whichTelecom Italia holds a stake of approximately 43%.
Since 1999, Telecom Italia has run its wirelesstelephony operations through Telecom Italia Mobile(TIM). In Brazil, this Italian company has stakes in ninemobile telephony companies, all of which operate underthe TIM Celular brand, using the roaming system toprovide users with national coverage.
In early 2000, Telecom Italia grouped its fixed-lineinterests in the country into the holding company BrasilTelecom Participações,91 which controls two firms:Brasil Telecom, created through a merger of nine localoperators (Teleacre, Teleron, Telemat, Telems,Telegoiás, Telebrasília, Telepar, Telesc and CTMR),and Companhia Riograndense de Telecomunicações(CRT), which operates in part of the state of Rio Grandedo Sul.92 Brasil Telecom now has over 5 million fixedtelephone lines (70% of them residential) and providesdata transmission and local, long-distance andintraregional services. Its operations cover 30% ofBrazil’s land area and 17% of its population (includingthe capital Brasilia and other large cities), and it is on itsway to becoming one of the country’s largesttelecommunications companies. On top of this, in June2000, Telecom Italia paid US$ 810 million for 30% of aportal, Globo.com, with the aim of pioneering theintroduction of WAP (wireless application protocol)technology, which connects cellular mobile telephonesto the Internet.
In Latin America, Telecom Italia has a large digitalfootprint based on three different technologies: GSM(ENTEL-Bolivia, ENTEL-Chile and Telecom ItaliaMobile (TIM) in Peru), TDMA (Telecom Personal ofParaguay and Telecom Personal of Argentina) andCDMA (TeleNordeste Celular of Brazil). Telecom Italiaseems to have the region’s best GSM network, whichcould prove to be a major competitive advantage in thenear future.
Nonetheless, the situation in Brazil is far from easy.In seeking to expand in the mobile telephony market thatis so important to it, Telecom Italia has had to contendwith strong competition from Brasil Telecom, its partnerin fixed-line telephony. Their relationship hasdeteriorated so much, in fact, that Telecom Italia enteredthe bidding for the new mobile telephony licenceswithout its local partners, and even voted for BrasilTelecom to stay out of the auction93 (Vasconcellos andFonseca, 2001, p. 21). Despite this state of affairs, theItalian company is unlikely to disengage itself fromBrasil Telecom, as it would not be easy to find a buyer forits stake in the Brazilian operator. In February 2001,Telecom Italia paid US$ 780 million or so for twoBrazilian band “D” licences covering São Paulo (whereit will compete with Telefónica/Portugal Telecom andBellSouth) and regions in the south and west of thecountry (in competition with Telesystem Leap Wireless,Bell Canada and Splice). Under Brazilian regulations,Telecom Italia will have to sell its cellular unit TeleCelular Sul (or hand back its licence), as this subsidiaryoperates in the same region. By acquiring these twolicences, TIM became the only mobile telephonyoperator with a nationwide digital footprint in Brazil(http://www.investor.ti.it). More recently, in March2001, it also paid US$ 470 million for a band “E” licenceto operate in the northern region (see box IV.4).
In November 1995, as part of Bolivia’sCapitalization Plan, Telecom Italia secured a 50% stakein Empresa Nacional de Telecomunicaciones (ENTEL)and a six-year monopoly in basic and long-distancetelephony services in exchange for a US$ 610 millioninvestment. At the time of privatization, the potential ofthe Bolivian market more than justified the US$ 132
212 ECLAC
90 Tele Celular Sul operates band “A” mobile telephony in the states of Paraná and Santa Catarina, and in the Pelotas (RS) region, through Telepar
Celular (Curitiba), Telesc Celular (Florianopolis) and CTMR Celular (Pelotas). Tele Nordeste Celular operates band “A” in the states of
Alagoas, Ceará, Paraiba, Piauí, Pernambuco and Rio Grande do Norte, through Telepisa Celular (Teresina), Teleceará Celular (Fortaleza),
Telern Celular (Natal), Telpa Celular (João Pessoa), Telpe Celular (Recife) and Telasa Celular (Maceió).
91 This holding company is controlled by the Solpart consortium, which owns 51.8% of its voting capital. Solpart’s equity is held in turn by:
(i) Timepart (51%), a group created by investment funds managed by Opportunity, a bank; (ii) Stet International (38%), controlled by Telecom
Italia; and (iii) Techold (11%), a group founded by Brazilian pension funds and Opportunity.
92 In July 2000, Brasil Telecom Participações paid a consortium led by Telefónica de España US$ 800 million for a controlling interest in CRT (The
Wall Street Journal, 18 July 2000).
93 Although Telecom Italia is only a minority shareholder in Brasil Telecom, it has the power to veto its decisions.

million premium paid by Telecom Italia (ECLAC,2000a, p. 88). Besides, the idea behind the ENTELpurchase was to take advantage of Bolivia’s position inthe middle of South America by creating a regionalcommunications platform there (Green, 2000). Over thelast few years, ENTEL has invested around US$ 420million in a 4,000 kilometre-long fibre-optic ring linkingthe country’s main cities. The purpose of this investmentis to strengthen the company’s position in thelong-distance segment, continue to win market share forit in wireless telephony and create connections with theneighbouring countries (Argentina, Brazil, Chile,Paraguay and Peru).
Telecom Italia entered Chile in 1996 by purchasing19.9% of Empresa Nacional de Telecomunicaciones(ENTEL), the country’s leading national andinternational long-distance telecommunicationsoperator. At the last count, after buying up a number ofsmall shareholdings, it had accrued 25.6% of ENTEL’sshare capital. Together with the Chilean Chilquintagroup, it thus owns 52% of the company and hasmanagement control. The policy now being pursued is toexpand the company’s supply portfolio to includemobile telephony, Internet and local telephony serviceprovision through a number of subsidiaries. In March1998, ENTEL PCS (100% ENTEL) set up and beganoperating Latin America’s first GSM network, this beinga technological platform that is used most in Europe. InDecember 2000, negotiations between Telecom Italiaand the Chilquinta group ended with the former buyingout its Chilean partner. Telecom Italia now owns 54.7%of ENTEL and manages the company (see chapter II). Itsinterest in the Chilean firm (and the high price paid for it,over US$ 900 million) can be put down to the fact thatENTEL has a United States subsidiary, Americatel,which targets the population of Latin American origin inthat country. Thus, Telecom Italia has succeeded inentering the prized United States market.
In Peru, Telecom Italia, through TIM, paid US$ 180million in May 2000 for a concession to provide PCSservices, thereby becoming the country’s third-largestmobile telephony operator. TIM will begin operations
using GSM technology, investing an extra US$ 70million for the purpose (Gazeta MercantilLatino-Americana, 15 to 21 May 2000). In October2000, again through TIM, Telecom Italia took control ofthe Venezuelan mobile telephony operator Digitel.
Lastly, there is Telecom Italia’s holding in theCuban operator Empresa de Telecomunicaciones deCuba (Etec). In 1994, when this company was privatized,Telecom Italia took only a minority shareholding in theconsortium that controlled it. In June 1997, TelecomItalia increased its stake to 29.2% and took over themanagement of the Cuban firm, a step that led toproblems with the United States Government, largelybecause of the provisions of the Helms-Burton Act. In1999, the crisis caused by the interception of a lightaircraft by a Cuban air force jet led United Statestelecommunications operators, with the exception ofSprint, to suspend international traffic to and from theisland. Telecom Italia provided Etec with technical andoperational support that enabled it to re-routeinternational traffic, with beneficial effects for the Cubanoperator’s revenues (Telecom Italia, 2000).
To sum up, the strategy of Telecom Italia in LatinAmerica is to strengthen its existing positions andexpand its presence in the market areas that are growingmost strongly by pursuing organic growth and makingselective acquisitions in both fixed-line and mobiletelephony (Telecom Italia, 2000). The company’sstrategy has begun to show greater vigour and focus overrecent months as it has concentrated its efforts on theBrazilian market and on mobile telephony. Again, itspolicy of converting minority interests into full control,as in Chile and, possibly, Argentina, has enabled it toexpand its sphere of operations steadily.
The first wave of FDI in Latin Americantelecommunications, then, was brought by two Europeanfirms, Telefónica de España and Telecom Italia, whicharrived early and expanded from within the region. In thelate 1990s, they decided to enhance their presence yetfurther, so that by 1999 they ranked first andtwenty-fourth, respectively, among foreign firms inLatin America by consolidated sales.
2. Globalizers
Unlike the telecommunications firms that entered LatinAmerica by taking equity in dominant national operatorsat privatization and then diversified away from theirprimarily fixed-line activities into mobile, Internet
and multimedia services, globalizers aretelecommunications corporations that design andimplement worldwide strategies which lead them, atsome stage, to invest in Latin America. That stage has
Foreign investment in Latin America and the Caribbean, 2000 213

now come. These companies, which are still a fairly newforce in the region, could change the Latin Americantelecommunications industry dramatically in the nearfuture. Two revealing examples are Verizon/Vodafoneand Telecom Americas (plus BellSouth).
(a) Verizon/Vodafone: a regional partnershipbetween a “first wave” operator and a“globalizer”
In April 2000, Verizon Communications, the largestfixed-line and cellular telephony company in the UnitedStates, and Vodafone AirTouch, the world’s leadingmobile telephony operator, created a joint venture calledVerizon Wireless to provide wireless telecommu-nications services in the United States.
More recently, in January 2001, VodafoneAirTouch made its first sortie into the Latin Americanmarket by buying 34.5% of the Mexican wirelessservices firm Iusacell, controlled by VerizonCommunications. Drawing a parallel with the creation ofthe Verizon Wireless joint venture, whose objective is toexpand in the United States telecommunications market,it is worth asking whether the partnership between thetwo firms that Iusacell represents may not be the preludeto wider expansion in the Latin American market, whichis now opening up to competition. In that case, a “firstwave” firm (Verizon) would be joining forces with a“globalizer” (Vodafone).
The expansion paths of Verizon Communicationsand Vodafone AirTouch started out from totallydifferent geographical markets and industry segments.
(i) Verizon Communications
Verizon Communications is a United Statescompany that was created by Bell Atlantic’s takeoverof GTE, an operation that was completed in June2000.94 Both companies were regional providersoperating in a market segment —local fixed-linetelephony— that has traditionally been monopolisticand heavily regulated. In 1999, before the merger, BellAtlantic and GTE ranked third and ninth in the world,respectively, as fixed-line telephony providers, andninth and twenty-fourth as mobile telephony operators(see table IV.3).
The new telecommunications act of 1996, which, asmentioned earlier, sought to put an end to regionaloperators’ monopolies in their local fixed-line markets,
threw Bell Atlantic’s strategy into disarray. In response,the company embarked upon a spree of mergers,acquisitions and alliances with the aim of turning itselffrom a regional telephony operator into a multinationaltelecommunications firm offering a full range ofservices. Among the most important of these operationswere the 1996 takeover of Nynex, another regionaloperator, which enabled the company to connect to some37 million subscribers from Maine to Virginia (TheNando Times, 1996); the takeover of GTE, when themerged company changed its name to Verizon; and thealliance with Vodafone AirTouch in the mobiletelephony market, which took the form of a joint venture,Verizon Wireless, in which Verizon has a majorityinterest (55%). As a result of these steps, Verizon hasconsolidated its operations in the main segments of thetelecommunications market:• It has become the leading local telephony operator in
the United States, having combined the assets andlong experience of Bell Atlantic in this marketsegment with those of Nynex and GTE. Verizon nowcontrols 63 million basic telephony lines (Verizon,2001).
• It is also the United States leader in mobile telephony,thanks partly to the combination of Bell Atlantic’s andGTE’s assets, but mainly to its partnership with theworld’s leading mobile telephony company,Vodafone AirTouch, for which Verizon in turn hasprovided a way to enter the United States market, andperhaps to conquer the Latin American market as well.Verizon now has about 25 million mobile telephoneusers in the United States (Verizon, 2001). Recently,in January 2001, Verizon Wireless took part in amobile telephony licence auction in the United States,paying out US$ 8.8 billion for 113 licences, which willenable it to expand its coverage in the country(CNNfn, 2001d). Verizon is one of the main backersof the CDMA technology option for mobiletelephony.
• In the Internet segment, GTE’s assets give it access toa wide range of Internet-related services, e-commercebeing one example, and to a business connectioninfrastructure in the United States and worldwide.Verizon has become a leader in data transmissionservices and the world’s largest supplier of printed andon-line directories.
Verizon’s worldwide expansion plans have also ledthe company to invest heavily in what should eventuallybe a global network able to carry voice, data, pictures and
214 ECLAC
94 The merger was announced in July 1998 and approved by the annual meetings of both companies in May 1999 (Bell Atlantic, 2000 and GTE,
2000). On 30 June 2000, the final agreement was signed and it was decided that the new entity would be called Verizon Communications.

Internet applications at high speed between differentparts of the planet. Verizon International has a stake ofabout 30% in FLAG95 Telecom Holdings, the owner andoperator of a 28,000 kilometre-long undersea fibre-opticnetwork that runs from the United Kingdom to Japan,linking Europe and Asia with 16 stations in 13countries.96 FLAG is also engaged in a joint venture withGlobal Telesystems Group to lay a transatlantic cablethat will link America and Europe in the secondquarter of 2001, as well as a transpacific cable that willconnect America with Asia. In addition, Verizon isworking closely with Metromedia Fiber Network(MFN),97 a high-speed Internet access provider forbusinesses that owns a fibre-optic land networklinking a number of cities in the United States andEurope.
The combination of FLAG’s undersea networks andthe land networks of Verizon and MFN in the UnitedStates and Europe should enable Verizon to put togethera large high-speed point-to-point global commu-nications platform linking the world’s major cities.Recently, in February 2001, Verizon announced plans toinvest US$ 1 billion over five years to expand its globalnetwork. New York will be connected with six Europeancities (Amsterdam, Brussels, Frankfurt, London, Milanand Paris) during the second quarter of 2001, and itshould be possible to connect further cities in Europe(Geneva, Madrid and Zurich), Asia (Singapore) andLatin America (Buenos Aires, Caracas and Mexico City)to Verizon’s international network in 2003 (NetworkWorld Fusion News, 2001b).
Verizon has interests in telecommunications firmsin 21 European, Asian and Latin American countries.Verizon’s main presence in Latin America is provided bythe operations of GTE in Argentina, the DominicanRepublic, Puerto Rico and Venezuela, in all of which it isthe dominant operator in every market segment (see tableIV.10). These operations are supplemented by BellAtlantic’s involvement in the Mexican wirelesstelephony business.
In the Dominican Republic, GTE has controlled andoperated Compañía Dominicana de Teléfonos (Codetel)for over 40 years. This is the country’s largest telecom-munications firm, with a presence in all market segments.
In 1991, an international consortium led by GTEpaid US$ 1.885 billion for 40% of Compañía AnónimaNacional de Teléfonos de Venezuela (CANTV). Verizon
now owns 26.4% of CANTV, the country’s leadingtelecommunications firm, which had a monopoly in thebasic telephony segment from 1991 to 2000. To preparefor the arrival of competition in November 2000,CANTV has invested over US$ 5 billion in infrastructuremodernization (Wernick, 2000). The company nowprovides a full telecommunications service, includinglocal and long-distance fixed-line telephony, wirelesstelephony, paging, private networks, public telephones,data transmission, directories and other value-addedservices.
In Argentina, Verizon owns 58.5% of Compañía deTeléfonos del Interior (CTI), which provides wirelesstelephony services to about 840,000 customers innorthern and southern regions of the country. It alsoowns GTE PCS, a company created by GTE to operateone of the two PCS licences for the metropolitan BuenosAires region (with a potential market of 13 millioncustomers) which it secured in June 1999. Betweenthem, GTE PCS and CTI have the capacity to providewireless telephony services nationwide. Besides thewireless network, in 1999 GTE was awarded a licence toprovide national and international long-distance andlocal telephony services.
In Puerto Rico, GTE paid some US$ 300 million inMarch 1999 for 40% of Telecomunicaciones de PuertoRico (Telpri), a company that provides local,long-distance and wireless telephony services andInternet access. Over the rest of that year, a further US$222 million or so was spent on modernizing andexpanding the firm (GTE, 2000).
Besides GTE, Bell Atlantic is a part-owner ofIusacell, Mexico’s second-largest mobile telephonyoperator, which provides wireless telecommunicationsservices in four of the country’s nine central regions.Between October 1993 and June 1994, Bell Atlanticgradually raised its holding in Iusacell to just over 40%.In February 1997, it took over the management of thecompany (ECLAC, 2000a). Since 1993, Bell Atlantichas invested some US$ 1.2 billion in Iusacell (BellAtlantic, 2000).
As has been seen, Verizon’s Latin American assets—with the exception of those in Puerto Rico— wereacquired by its two constituent companies, Bell Atlanticand GTE, during the “first wave” of telecommunicationsFDI in the region. All its mobile telephony operationsuse CDMA technology.
Foreign investment in Latin America and the Caribbean, 2000 215
95 FLAG stands for Fiberoptic Link Around the Globe.
96 United Kingdom, Spain, Italy, Egypt (2), Jordan, Saudi Arabia, United Arab Emirates, India, Thailand, Malaysia, China (2), Republic of Korea
and Japan (2) (Verizon, 2001).
97 In October 1999, Bell Atlantic signed a US$ 550 million contract with Metromedia Fiber Network (MFN) entitling it to use that company’s
fibre-optic network in the United States and Europe. Bell Atlantic had previously invested US$ 1.7 billion in MFN (Verizon, 2001).
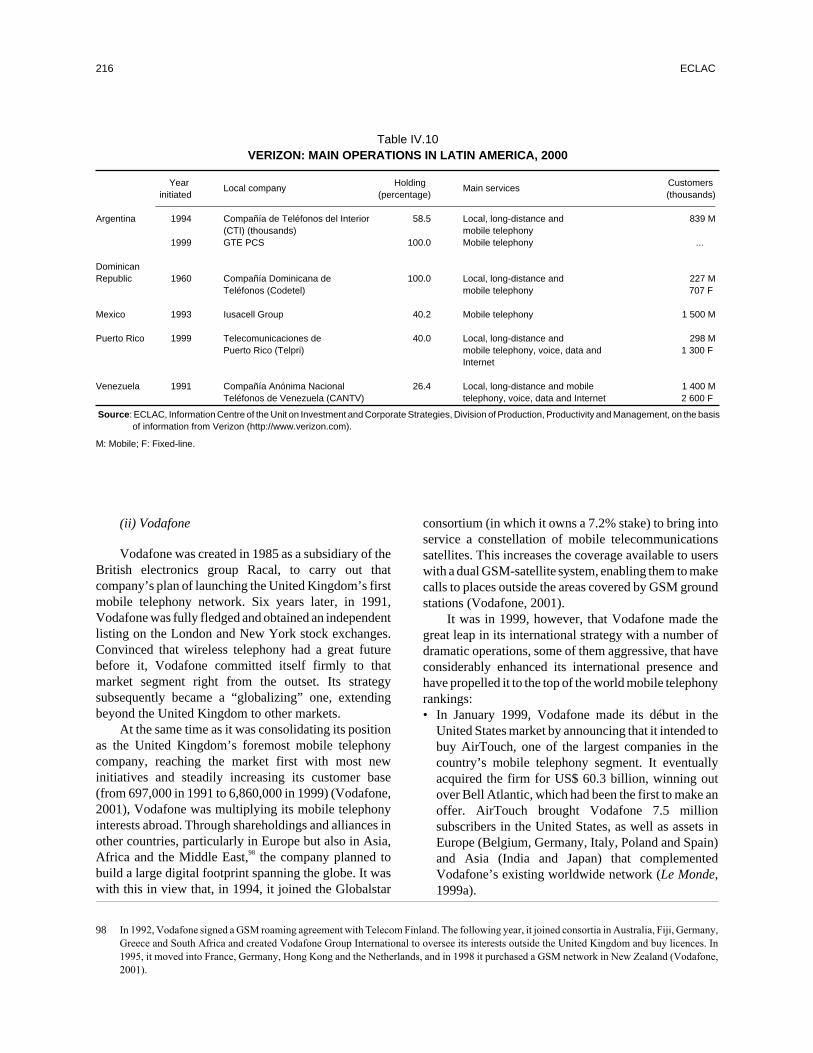
(ii) Vodafone
Vodafone was created in 1985 as a subsidiary of theBritish electronics group Racal, to carry out thatcompany’s plan of launching the United Kingdom’s firstmobile telephony network. Six years later, in 1991,Vodafone was fully fledged and obtained an independentlisting on the London and New York stock exchanges.Convinced that wireless telephony had a great futurebefore it, Vodafone committed itself firmly to thatmarket segment right from the outset. Its strategysubsequently became a “globalizing” one, extendingbeyond the United Kingdom to other markets.
At the same time as it was consolidating its positionas the United Kingdom’s foremost mobile telephonycompany, reaching the market first with most newinitiatives and steadily increasing its customer base(from 697,000 in 1991 to 6,860,000 in 1999) (Vodafone,2001), Vodafone was multiplying its mobile telephonyinterests abroad. Through shareholdings and alliances inother countries, particularly in Europe but also in Asia,Africa and the Middle East,98 the company planned tobuild a large digital footprint spanning the globe. It waswith this in view that, in 1994, it joined the Globalstar
consortium (in which it owns a 7.2% stake) to bring intoservice a constellation of mobile telecommunicationssatellites. This increases the coverage available to userswith a dual GSM-satellite system, enabling them to makecalls to places outside the areas covered by GSM groundstations (Vodafone, 2001).
It was in 1999, however, that Vodafone made thegreat leap in its international strategy with a number ofdramatic operations, some of them aggressive, that haveconsiderably enhanced its international presence andhave propelled it to the top of the world mobile telephonyrankings:• In January 1999, Vodafone made its début in the
United States market by announcing that it intended tobuy AirTouch, one of the largest companies in thecountry’s mobile telephony segment. It eventuallyacquired the firm for US$ 60.3 billion, winning outover Bell Atlantic, which had been the first to make anoffer. AirTouch brought Vodafone 7.5 millionsubscribers in the United States, as well as assets inEurope (Belgium, Germany, Italy, Poland and Spain)and Asia (India and Japan) that complementedVodafone’s existing worldwide network (Le Monde,1999a).
216 ECLAC
Table IV.10VERIZON: MAIN OPERATIONS IN LATIN AMERICA, 2000
YearLocal company
HoldingMain services
Customersinitiated (percentage) (thousands)
Argentina 1994 Compañía de Teléfonos del Interior 58.5 Local, long-distance and 839 M(CTI) (thousands) mobile telephony
1999 GTE PCS 100.0 Mobile telephony ...
DominicanRepublic 1960 Compañía Dominicana de 100.0 Local, long-distance and 227 M
Teléfonos (Codetel) mobile telephony 707 F
Mexico 1993 Iusacell Group 40.2 Mobile telephony 1 500 M
Puerto Rico 1999 Telecomunicaciones de 40.0 Local, long-distance and 298 MPuerto Rico (Telpri) mobile telephony, voice, data and 1 300 F
Internet
Venezuela 1991 Compañía Anónima Nacional 26.4 Local, long-distance and mobile 1 400 MTeléfonos de Venezuela (CANTV) telephony, voice, data and Internet 2 600 F
Source: ECLAC, Information Centre of the Unit on Investment and Corporate Strategies, Division of Production, Productivity and Management, on the basisof information from Verizon (http://www.verizon.com).
M: Mobile; F: Fixed-line.
98 In 1992, Vodafone signed a GSM roaming agreement with Telecom Finland. The following year, it joined consortia in Australia, Fiji, Germany,
Greece and South Africa and created Vodafone Group International to oversee its interests outside the United Kingdom and buy licences. In
1995, it moved into France, Germany, Hong Kong and the Netherlands, and in 1998 it purchased a GSM network in New Zealand (Vodafone,
2001).
• September 1999 saw the announcement of apartnership between Vodafone and Bell Atlantic in theUnited States mobile telephony business. Havingcompeted to buy AirTouch nine months previously,the two companies now declared their intention ofcreating a joint venture that would combine theirrespective wireless assets in the United States. Theoperation was completed in April 2000 with thecreation of Verizon Wireless, in which the BellAtlantic/GTE group, now called VerizonCommunications, had a controlling interest of 55%,while Vodafone held a 45% minority stake. With theassets of Bell Atlantic and GTE, the new company hadsome 25 million subscribers in 49 of the 50 states, andthus became the leading mobile telephony operator inthe United States (Network World Fusion News,2000). Both systems use CDMA technology.
• In November 1999, two months after the partnershipwith Bell Atlantic in the United States was announced,Vodafone AirTouch launched a hostile takeover bidworth an impressive US$ 110 billion forMannesmann, a German industrial group that hadsuccessfully refocused part of its business ontelecommunications. The two companies hadpreviously been linked by cooperation agreements inthe main European markets, where they had takenjoint shareholdings in the same telecommunicationsoperators. In October 1999, however, Mannesmannhad surprised Vodafone by purchasing Orange, theUnited Kingdom’s third-largest mobile telephonyoperator and a competitor to Vodafone. By taking thisstep, Mannesmann had implicitly broken thecooperation pact and, to make matters worse, had doneso in what Vodafone regarded as its own domain, theBritish market. Vodafone’s objective in cooperatingwith Mannesmann had been to achieve leadership inEuropean telecommunications. Since it viewedMannesmann’s action as a breach of the pact betweenthem and a threat to its position in the Europeanmarket, especially France, Germany and Italy, wherethe two companies had joint shareholdings intelecommunications operators, the only solution,ultimately, was to take over Mannesmann. Thisoperation, which met with strong resistance from theMannesmann board and caused an uproar in
Germany,99 was finally completed on 3 February 2000for a record sum (over US$ 200 billion).100
Vodafone had the world’s eighth-largest mobiletelephony customer base in 1999, before it boughtMannesmann and AirTouch, which ranked seventh andtenth respectively (see table IV.3). By acquiring thesetwo firms, it became the world’s leading mobiletelephony operator. Its strategy is to build a single globalplatform that will enable it to retain its leading position asan operator capable of providing a full range ofmultimedia mobile products, including advanced data,voice, graphics, messaging, information and Internetcommerce services. The objective is to achieve thegreatest possible worldwide coverage by takingcontrolling or minority stakes in different local operatorsor by acquiring licences in countries where Vodafonedoes not have an operator. The company’s goal is to beable to give its users the ability to send and receive callsand information, download content and carry outtransactions anywhere on the planet at any time(Vodafone, 2000).
In pursuit of this strategy, Vodafone has entered intoa number of alliances with companies such as SunMicrosystems and IBM (computing), Charles Schwab(stock market information), Sabre/Travelocity (travelinformation) and Infospace (news, weather forecasts,cinema programming, horoscopes and other services),and with equipment manufacturers such as Ericsson,Nokia and Palm Computing (Vodafone, 2001).
Vodafone currently operates in 15 countries inEurope, 3 in Africa and 6 in Asia and the Pacific, plus theUnited States, giving a total of 25 countries. It ownscontrolling interests in operators in 11 Europeancountries and in Australia and New Zealand. On 31March 2000, it had close to 40 million customers, notcounting users of its paging service (Vodafone, 2001). Ithas so far been absent from Latin America, but in January2001 it concluded an agreement with the Peralta group inMexico to buy that company’s shareholding in Iusacell.If this operation comes to fruition —approval still has tobe given by Mexican regulators and by the majorityshareholders of Iusacell, which is controlled by VerizonCommunications— Vodafone will pay US$ 973.4million for 34.5% of Iusacell’s equity (Network WorldFusion News, 2001a).
Foreign investment in Latin America and the Caribbean, 2000 217
99 In Germany, both politicians and unions mobilized in support of Mannesmann. The Chancellor, Gerhard Schröder, personally condemned “this
type of escapade…which destroys the culture of a business” (Le Monde, 1999b). The hostile takeover method, which is quite common in the
United States, clashes with the business culture of Europe generally but especially Germany’s, which is based on the principles of cooperative
management and consensus.
100 To overcome the opposition of the Mannesmann board and force it to agree to the acquisition, Vodafone allied itself with the French Vivendi
group, and in January 2000 the two companies founded a joint venture called Multi Access Portal (MAP) (50%/50%) with a view to creating a
multi-access portal for the whole of Europe that would compete with Yahoo (Le Monde, 2000a and 2000b).
Vodafone has committed itself heavily to 3G mobiletelephony, buying UMTS licences in a number ofEuropean countries through its local operators there. Insome cases, this has meant spending large sums: in June2000, the company paid about US$ 9.5 billion for aUMTS licence in the United Kingdom; in August thesame year, it acquired one in Germany throughMannesmann Mobilfunk, for about US$ 8 billion; inOctober, its participation in the Italian auction, throughOmnitel (76.12%), cost it about US$ 2 billion; morerecently, on 31 January 2001, it applied through SFR(31.86%) for one of the French licences, priced by thatcountry’s authorities at approximately US$ 4.6 billion(El País, 2000a and 2000b and Le Monde, 2001b).101
Enthusiasm for 3G mobile telephony, which ledtelecommunications firms to spend some US$ 100billion on licences in Europe alone between April 2000and January 2001, has since been replaced by numerousdoubts about the profitability of 3G operations and thefuture of the technology. Network installation102 andmarketing costs will have to be met on top of the highprices paid for the licences. The technology is stillunproven, and the equipment manufacturers, Nokia andEricsson,103 are having trouble meeting the deadline of 1January 2002 that they themselves set104 (The Economist,2001).
Compared to other companies that have committedthemselves to 3G mobile telephony in Europe, Vodafonehas some notable advantages: it has acquired licences inalmost all the European countries at widely varyingprices, which will enable it to cross-subsidize betweenthem;105 it already has a strong customer portfolio, whichwill mean lower marketing costs; and it has a muchhealthier financial structure than its competitors,106 so it isbetter placed to secure financing, at lower rates, and isless dependent on the stock market, which is verydepressed. If 3G technology can avoid the pitfalls ahead,Vodafone will be the best placed of the few firms wellenough equipped to stay in the latest-generation mobiletelephony race. According to a recent study by ForresterResearch, by 2008 only five companies will havesurvived the “UMTS effect”: Vodafone, T-Mobil
(Deutsche Telekom), France Télécom-Orange and BTCellnet, with low levels of risk, should be certainwinners, while the fifth place will be closely contestedamong KPN, Telefónica de España, Telecom Italia andNTT DoCoMo (Le Monde, 2001c).
By going into partnership with Verizon in theUnited States and, recently, in Latin America, Vodafonehas combined its global vision and long track record inmobile telephony with the United States company’sassets and early experience in the continent, whosecountries are thus being given the opportunity to connectup to its international mobile telephony platform.Vodafone has a solid GSM platform in Europe and Asiaand is building a CDMA platform for North and LatinAmerica. Its expansion strategy in the Americas is beingfirmly supported by Verizon, the leader in CDMA.
(b) Telecom Americas plus BellSouth: the firstdigital footprint in the Americas?
Telecom Americas was created by SBCCommunications, one of the largest operators in theUnited States, together with its partners Telmex and BellCanada International, in pursuit of an aggressive plan toestablish a strong, cohesive presence in the Americas.One of SBC’s main competitors in Latin America,BellSouth, is none other than its new partner in CingularWireless, into which the two companies have combinedtheir United States cellular mobile telephony assets. Asimilar merger in Latin America would create thehemisphere’s largest cellular mobile telephony operatorby far, with a substantial digital footprint based on theTDMA technology that the two firms promote.
Telecom Americas is a recent initiative that couldhave dramatic effects on the telecommunicationsindustry of the region, where it has already become theleading mobile telephony provider. It is a vehicle whosesole purpose is to combine the Latin American growthefforts of three major companies: SBCCommunications, the world’s third-largesttelecommunications company; América Móvil, anaffiliate of Telmex, the dominant operator in Latin
218 ECLAC
101 Through its operators, it also secured licences in Spain (March 2000), the Netherlands (July 2000), Austria (November 2000), Sweden
(December 2000) and Portugal (December 2000) (see table IV.1).
102 Unlike GPRS technology (also known as 2.5 G), which can work with existing infrastructure, 3G technology requires a costly new network (The
Economist, 2001).
103 On 26 January 2001, Ericsson announced that it would stop making cellular telephones and subcontract the work to Flextronics, a
Singapore-based firm, in an effort to reduce its costs (The Economist, 2001).
104 It is now being said that the UMTS network and mobile telephones will not actually be ready until 2003, or even 2004 (Le Monde, 2001d).
105 Unlike British Telecom and Deutsche Telekom, which have only bought expensive licences in Germany and the United Kingdom (Total
Telecom, 2001d).
106 Vodafone’s debt/equity ratio of 9.5% is very low compared to the figures for Telefónica (94%), Deutsche Telekom (127%), British Telecom
(113%) and France Télécom and KPN (over 200%) (Le Monde, 2001c).
America’s second-largest market; and Bell CanadaInternational, the vehicle through which Canada’sdominant operator is expanding in the region. It seemsthat SBC will be the driving force behind this initiative,since it is a part-owner of the other companies involved:Telmex (about 9% of voting shares since 1990), AméricaMóvil (11.4%) and BCI’s parent company, Bell CanadaEnterprises (20% since 1999). The project will involvelinking the North American platform of these firms withthe one that is being built up in Latin America, to create aconsolidated TDMA-based platform for the Americas.Each partner has an important contribution to make to thenew venture. In 2001, Telecom Americas showed itshand in the region, first by acquiring a Venezuelanlicence in January and then, in February, by taking astake (19.9%) in the Brazilian company Tess, whichoperates in the state of São Paulo (Total Telecom,2001c).
SBC Communications, which was created by thebreak-up of AT&T in the 1980s, has become one of theworld’s largest telecommunications companies, rankingsecond in the fixed-line segment and sixth in cellularmobile telephony in 1999 (see table IV.3). In that year,over three quarters of its revenue (76%) came from basictelephony, with cellular mobile telephony and theInternet contributing much less (14% and 10%,respectively). SBC’s strategic goals were to become afull service provider (including long distance and theInternet) and to enlarge its digital footprint nationallyand internationally. It largely achieved the first goal byacquiring Ameritech in 1999 (US$ 62.6 billion), thePacific Telesis Group in 1997 (US$ 16.5 billion),Southern New England Telecommunications in 1998(US$ 5.8 billion) and Prodigy (the third-largest Internetservices provider) in 1999. Ameritech brought with itsome major foreign assets, including holdings in BellCanada and TeleDenmark. On another front, SBC wasgiven permission by the United States FederalCommunications Commission to providelong-distance telephony services in other parts of thecountry. Again, the new alliance with WilliamsCommunications improved the company’s broadbandconnectivity, enabling it to become the foremostdigital subscriber line (DSL) provider in the UnitedStates. In 2000, SBC and BellSouth founded a jointventure called Cingular Wireless, combining the twofirms’ United States cellular telephony activities(about 19 million customers).107 Cingular Wireless,acting through Salmon PCS, was one of the mainbeneficiaries of the United States auctions for mobile
operating licences, paying out US$ 2.3 billion for 79 ofthese in January 2001.
By 1999, SBC’s international system had invested atotal of over US$ 22 billion in 24 countries, the greatestconcentration being in Canada (assets worth US$ 3.77billion), Mexico (US$ 906 million) (see table IV.11) andEurope, where the bulk of the company’s holdings camewith the 1999 acquisition of Ameritech. SBC thusbecame the largest outside investor in Europe’stelecommunications industry, with operations inBelgium, Denmark (assets worth US$ 3.019 billion),France, Germany and Norway. It also owns assets inother countries, such as Brazil, Israel, Puerto Rico, SouthAfrica and Taiwan Province of China. In 1999, jointlywith Telmex, it took an equity stake in the Brazilian firmAlgar Telecom Leste with a view to providing cellularmobile services in Rio de Janeiro and the state of EspíritoSanto. That same year, again in partnership with Telmex,it took over Cellular Communications of Puerto Rico.Although its system in Latin America (outside ofMexico) is still limited, SBC has a strong interest in theregion, as was demonstrated by the initiatives itundertook in partnership with Telmex in 2000-2001.
Telmex, Mexico’s former State monopoly, is LatinAmerica’s largest telephone company because it was notbroken up at privatization in 1990 (see box IV.3). In1999, it was the only Latin America-based telephonecompany to figure in the list of the industry’s largest,ranking thirteenth in the fixed-line segment and tenth inthe long-distance segment (see table IV.3), while in LatinAmerica it was the leader in all three telephonysegments, including cellular mobile (see table IV.5). In1990, Telmex was taken over by the Mexican Carsogroup in partnership with two major foreign companies,SBC Communications and a subsidiary of FranceTélécom. In 2000, France Télécom sold its stake becauseits strategy had focused once again on Europe. Telmexand SBC have recently strengthened the links betweentheir international expansion efforts.
Telmex is the dominant operator in Mexico, where ithas very substantial market shares in local (95%),long-distance (66%) and mobile (72%) telephony, and indata and Internet services (60%). It has 11.8 million fixedlines, between 10 and 11 million cellular telephonycustomers and a portal that it owns jointly with Microsoft(T1MSN). Telcel, its cellular mobile telephonysubsidiary, whose digital footprint is based on TDMAtechnology, was until recently the only operator toprovide a national service. Telmex’s internationalpresence is fairly small, consisting of interests in
Foreign investment in Latin America and the Caribbean, 2000 219
107 The priorities of Cingular Wireless are to gain a firmer foothold in data transmission, integrate its operations and expand geographically.

telecommunications firms in Guatemala (Teléfonos deGuatemala (Telgua)) and Ecuador (ConsorcioEcuatoriano de Telecomunicaciones (Conecel)) and insome prepaid cellular and long-distance telephonycompanies in the United States. It was included in SBC’sNorth American platform through its partnerships oralliances with Prodigy and Williams Communications.In 1999, it took part in SBC’s most important LatinAmerican initiatives, including the successful bid for alicence for Algar TeleLeste in Brazil and the takeover ofCompañía Celular de Puerto Rico (CCPR). Telmexbelieves that the “natural” way for it to grow is as a fullservice provider catering to Spanish-speaking customersin the Americas.
In 2000, Telmex restructured its assets to create twoindependent companies with totally different focuses,Telmex and América Móvil. Telmex specializes in basictelephony, including data and Internet services, whileAmérica Móvil was basically left with Telcel, cabletelevision and the group’s international assets (see tableIV.12). América Móvil, in which Carso and SBC holdstakes of 28% and 9%, respectively, has thus become oneof the region’s largest cellular mobile telephonyproviders and is in a good position to take advantage ofopportunities in Latin America.
Bell Canada International (BCI) is one of thecompanies that Canada’s leading telephone operator,Bell Canada Enterprises (in which SBC holds a 20%stake), has created to take advantage of the internationalopportunities it has identified. Bell Canada ranksfourteenth in the world as a fixed-line operator (see tableIV.3). Following some early investments in Asia (China,India, the Republic of Korea and Taiwan), BCI opted
firmly for Latin America (see table IV.13). Its strategyhas been to use partnerships with leading companies tomaximize scale and attain a better understanding of localmarkets. Its objective has been to invest solely in marketswhere it can secure a substantial shareholding in a majorcompany. It forms part of one of Latin America’s mainTDMA platforms.
In late 2000, SBC (11.4%) persuaded AméricaMóvil (44.3%) and BCI (44.3%) to combine their LatinAmerican expansion efforts into a new company,Telecom Americas, which would have the competitive,high-connectivity networks on both fixed and mobileplatforms that it needed to take advantage of cellularmobile telephony, broadband and Internet opportunitiesin South America. Telecom Americas was provided withUS$ 4 billion of assets and has US$ 2.2 billion cash eitheron hand or committed to it. Having acquired Techtel, aTelmex asset in Argentina, to supplement the operationsof América Móvil, the company has almost 15 millioncellular telephony customers in Latin America, with astrong presence in Argentina, Brazil, Colombia,Ecuador, Guatemala, Mexico, Puerto Rico andVenezuela.
As already mentioned, SBC and BellSouth havecombined their United States cellular mobile telephonyoperations into Cingular Wireless (of which they own60% and 40%, respectively), thereby creating one of theworld’s largest companies in this segment. The twopartners in Cingular Wireless are important backers ofthe TDMA option through their participation in theUniversal Wireless Communications Consortium(UWCC). BellSouth is the world’s sixth-largestfixed-line telephony operator (see table IV.3) and the
220 ECLAC
Table IV.11SBC COMMUNICATIONS: MAIN OPERATIONS IN THE AMERICAS, 2000
Year HoldingCustomers
initiatedLocal company
(percentage)Main services (thousands)
(2000)
Canada 1999 Bell Canada Enterprises 20.0 Local telephony, mobile telephony, 2 000 Mdata, Internet
Mexico 1990 Telmex 9.0 Local telephony, mobile telephony, 10 500 Mdata, Internet
Puerto Rico 1999 Cellular Communications of 50.0 Mobile telephony 487 MPuerto Rico (CCPR)
Brazil 1999 Algar Telecom Leste (ATL) 25.0 Mobile telephony 1 000 M
Source: ECLAC, Information Centre of the Unit on Investment and Corporate Strategies, Division of Production, Productivity and Management, on the basisof information from SBC Communications, Telmex and Bell Canada International (http://www.sbc.com; http://telmex.com.mx; andhttp://www.bci.ca).
M: Mobile
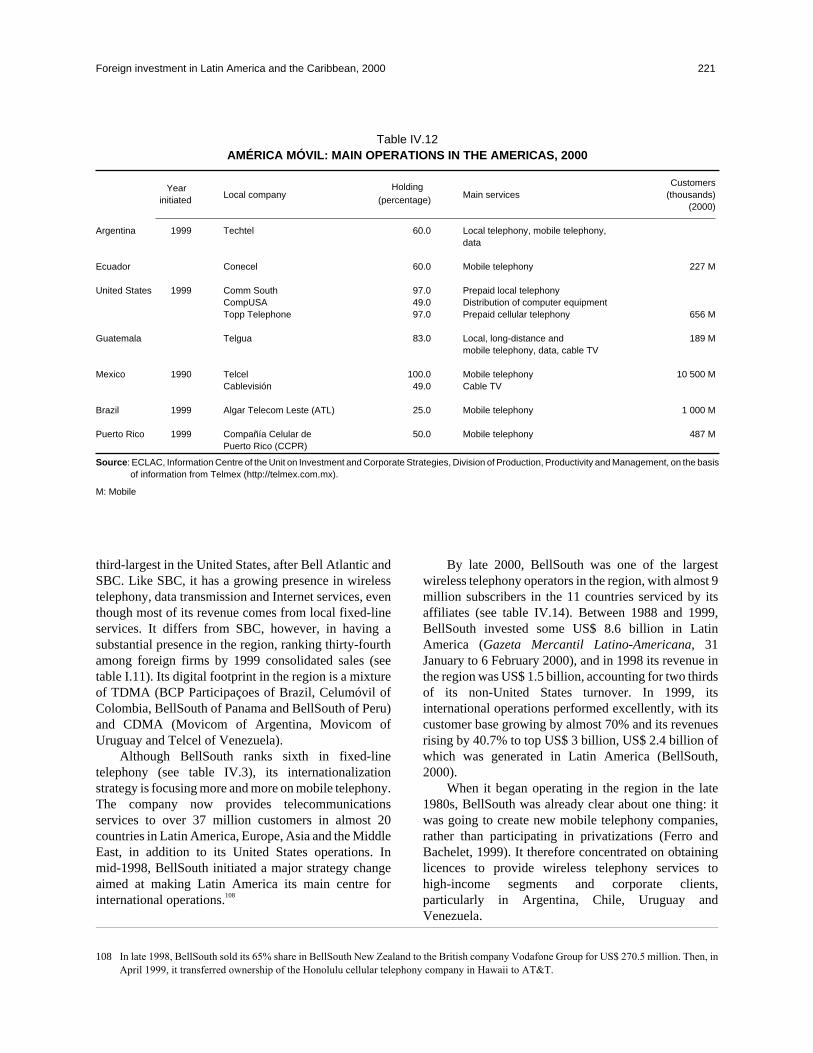
third-largest in the United States, after Bell Atlantic andSBC. Like SBC, it has a growing presence in wirelesstelephony, data transmission and Internet services, eventhough most of its revenue comes from local fixed-lineservices. It differs from SBC, however, in having asubstantial presence in the region, ranking thirty-fourthamong foreign firms by 1999 consolidated sales (seetable I.11). Its digital footprint in the region is a mixtureof TDMA (BCP Participaçoes of Brazil, Celumóvil ofColombia, BellSouth of Panama and BellSouth of Peru)and CDMA (Movicom of Argentina, Movicom ofUruguay and Telcel of Venezuela).
Although BellSouth ranks sixth in fixed-linetelephony (see table IV.3), its internationalizationstrategy is focusing more and more on mobile telephony.The company now provides telecommunicationsservices to over 37 million customers in almost 20countries in Latin America, Europe, Asia and the MiddleEast, in addition to its United States operations. Inmid-1998, BellSouth initiated a major strategy changeaimed at making Latin America its main centre forinternational operations.108
By late 2000, BellSouth was one of the largestwireless telephony operators in the region, with almost 9million subscribers in the 11 countries serviced by itsaffiliates (see table IV.14). Between 1988 and 1999,BellSouth invested some US$ 8.6 billion in LatinAmerica (Gazeta Mercantil Latino-Americana, 31January to 6 February 2000), and in 1998 its revenue inthe region was US$ 1.5 billion, accounting for two thirdsof its non-United States turnover. In 1999, itsinternational operations performed excellently, with itscustomer base growing by almost 70% and its revenuesrising by 40.7% to top US$ 3 billion, US$ 2.4 billion ofwhich was generated in Latin America (BellSouth,2000).
When it began operating in the region in the late1980s, BellSouth was already clear about one thing: itwas going to create new mobile telephony companies,rather than participating in privatizations (Ferro andBachelet, 1999). It therefore concentrated on obtaininglicences to provide wireless telephony services tohigh-income segments and corporate clients,particularly in Argentina, Chile, Uruguay andVenezuela.
Foreign investment in Latin America and the Caribbean, 2000 221
Table IV.12AMÉRICA MÓVIL: MAIN OPERATIONS IN THE AMERICAS, 2000
Year Holding Customers
initiatedLocal company
(percentage)Main services (thousands)
(2000)
Argentina 1999 Techtel 60.0 Local telephony, mobile telephony,data
Ecuador Conecel 60.0 Mobile telephony 227 M
United States 1999 Comm South 97.0 Prepaid local telephonyCompUSA 49.0 Distribution of computer equipmentTopp Telephone 97.0 Prepaid cellular telephony 656 M
Guatemala Telgua 83.0 Local, long-distance and 189 Mmobile telephony, data, cable TV
Mexico 1990 Telcel 100.0 Mobile telephony 10 500 MCablevisión 49.0 Cable TV
Brazil 1999 Algar Telecom Leste (ATL) 25.0 Mobile telephony 1 000 M
Puerto Rico 1999 Compañía Celular de 50.0 Mobile telephony 487 MPuerto Rico (CCPR)
Source: ECLAC, Information Centre of the Unit on Investment and Corporate Strategies, Division of Production, Productivity and Management, on the basisof information from Telmex (http://telmex.com.mx).
M: Mobile
108 In late 1998, BellSouth sold its 65% share in BellSouth New Zealand to the British company Vodafone Group for US$ 270.5 million. Then, in
April 1999, it transferred ownership of the Honolulu cellular telephony company in Hawaii to AT&T.
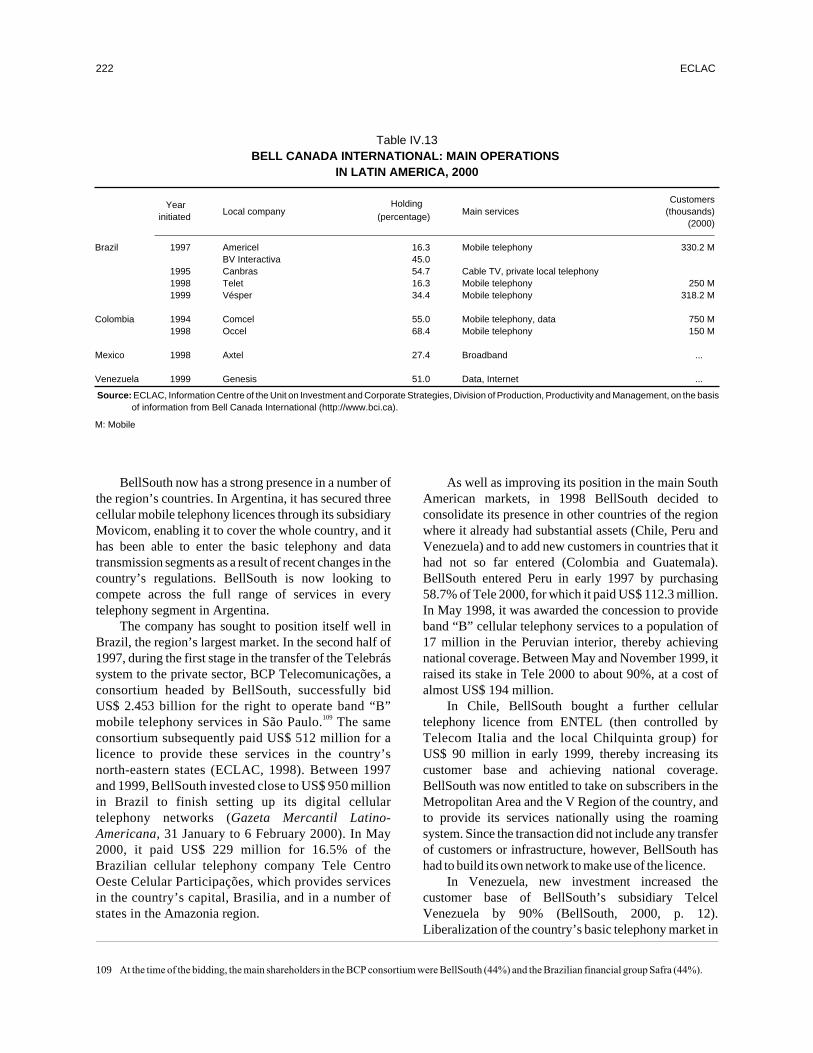
BellSouth now has a strong presence in a number ofthe region’s countries. In Argentina, it has secured threecellular mobile telephony licences through its subsidiaryMovicom, enabling it to cover the whole country, and ithas been able to enter the basic telephony and datatransmission segments as a result of recent changes in thecountry’s regulations. BellSouth is now looking tocompete across the full range of services in everytelephony segment in Argentina.
The company has sought to position itself well inBrazil, the region’s largest market. In the second half of1997, during the first stage in the transfer of the Telebrássystem to the private sector, BCP Telecomunicações, aconsortium headed by BellSouth, successfully bidUS$ 2.453 billion for the right to operate band “B”mobile telephony services in São Paulo.109 The sameconsortium subsequently paid US$ 512 million for alicence to provide these services in the country’snorth-eastern states (ECLAC, 1998). Between 1997and 1999, BellSouth invested close to US$ 950 millionin Brazil to finish setting up its digital cellulartelephony networks (Gazeta Mercantil Latino-Americana, 31 January to 6 February 2000). In May2000, it paid US$ 229 million for 16.5% of theBrazilian cellular telephony company Tele CentroOeste Celular Participações, which provides servicesin the country’s capital, Brasilia, and in a number ofstates in the Amazonia region.
As well as improving its position in the main SouthAmerican markets, in 1998 BellSouth decided toconsolidate its presence in other countries of the regionwhere it already had substantial assets (Chile, Peru andVenezuela) and to add new customers in countries that ithad not so far entered (Colombia and Guatemala).BellSouth entered Peru in early 1997 by purchasing58.7% of Tele 2000, for which it paid US$ 112.3 million.In May 1998, it was awarded the concession to provideband “B” cellular telephony services to a population of17 million in the Peruvian interior, thereby achievingnational coverage. Between May and November 1999, itraised its stake in Tele 2000 to about 90%, at a cost ofalmost US$ 194 million.
In Chile, BellSouth bought a further cellulartelephony licence from ENTEL (then controlled byTelecom Italia and the local Chilquinta group) forUS$ 90 million in early 1999, thereby increasing itscustomer base and achieving national coverage.BellSouth was now entitled to take on subscribers in theMetropolitan Area and the V Region of the country, andto provide its services nationally using the roamingsystem. Since the transaction did not include any transferof customers or infrastructure, however, BellSouth hashad to build its own network to make use of the licence.
In Venezuela, new investment increased thecustomer base of BellSouth’s subsidiary TelcelVenezuela by 90% (BellSouth, 2000, p. 12).Liberalization of the country’s basic telephony market in
222 ECLAC
Table IV.13BELL CANADA INTERNATIONAL: MAIN OPERATIONS
IN LATIN AMERICA, 2000
Year Holding Customers
initiatedLocal company
(percentage)Main services (thousands)
(2000)
Brazil 1997 Americel 16.3 Mobile telephony 330.2 MBV Interactiva 45.0
1995 Canbras 54.7 Cable TV, private local telephony1998 Telet 16.3 Mobile telephony 250 M1999 Vésper 34.4 Mobile telephony 318.2 M
Colombia 1994 Comcel 55.0 Mobile telephony, data 750 M1998 Occel 68.4 Mobile telephony 150 M
Mexico 1998 Axtel 27.4 Broadband ...
Venezuela 1999 Genesis 51.0 Data, Internet ...
Source: ECLAC, Information Centre of the Unit on Investment and Corporate Strategies, Division of Production, Productivity and Management, on the basisof information from Bell Canada International (http://www.bci.ca).
M: Mobile
109 At the time of the bidding, the main shareholders in the BCP consortium were BellSouth (44%) and the Brazilian financial group Safra (44%).

late 2000 is expected to lead to fierce competitionbetween Telcel Venezuela and CANTV, currently themain operator, which is controlled by Verizon, anotherUnited States firm. BellSouth has announced that it islooking to invest between US$ 300 million and US$ 500million within the next two years to build up a500,000-strong fixed-line telephony customer base inVenezuela (Wernick, 2000).
Colombia and Guatemala are very important newmarkets for BellSouth. In October 1999, a consortiumled by BellSouth successfully bid US$ 23 million for theright to provide wireless telecommunications services inGuatemala. In June 2000, it paid US$ 295 million for33.8% of Celumóvil, a firm that operates in six ofColombia’s 10 largest cities, including Bogota,Barranquilla and Cartagena. A few days later, thecompany bought a further 16.6%, raising its stake in
Celumóvil to 50.4%. Through this local operator,BellSouth also conducted negotiations with the ownersof Compañía Celular de Colombia (Cocelco), whichprovides services in the western region of the country,including the cities of Cali and Medellín. These talks ledto it buying Cocelco for US$ 370 million. With thistransaction, BellSouth was able to increase its stake inCelumóvil to 66% and take control. Together with theacquisition of Cocelco, this gave BellSouth the largestcellular telephony market share in Colombia.
To sum up, three main strands can be identified inBellSouth’s Latin American strategy. The company isseeking to enlarge its existing mobile telephonyoperating base, expand geographical coverage in theregion and develop new lines of business as deregulationprogresses there. The most important reason forBellSouth’s interest in Latin America —apart from the
Foreign investment in Latin America and the Caribbean, 2000 223
Table IV.14BELLSOUTH: MAIN OPERATIONS IN LATIN AMERICA, MAY 2000
Year Holding Customers
initiatedLocal company
(percentage)Main services (thousands)
(May 2000)
Argentina 1989 Movicom BellSouth 65.0 Mobile telephony, data, Internet 1 416.3 M
Brazil 1998 BCP Telecomunicações 44.5 Mobile telephony 2 185.3 M2000 Tele Centro Oeste Celular 16.5 Mobile telephony
Participações (TCO)
Chile 1991 BellSouth Chile 100.0 Mobile and long-distance 482.3 Mtelephony, Internet
Colombia 2000 Celumóvil 66.0 Mobile telephony 466 M2000 Compañía Celular de 100.0a Mobile telephony 215.0 M
Colombia (Cocelco)
Ecuador 1997 BellSouth Ecuador 89.4 Mobile telephony 199.1 M
Guatemala 2000 BellSouth Guatemalab 60.0 Mobile telephony
Nicaragua 1997 BellSouth Nicaragua 89.0 Mobile telephony 59.8 M
Panama 1996 BellSouth Panamab 42.0 Mobile telephony, Internet 158.2 M
Peru 1997 BellSouth Peru 93.9 Mobile telephony, 347.5 M(formerly Tele 2000) cable TV
Uruguay 1991 Movicom BellSouth 46.0 Mobile telephony, Internet 138.4 M
Venezuela 1991 Telcel Venezuela 78.0 Mobile telephony, Internet1998 Comtel Comunicaciones 60.0 Mobile telephony 3 078.5 M
Source: ECLAC, Information Centre of the Unit on Investment and Corporate Strategies, Division of Production, Productivity and Management, on the basisof information from BellSouth (http://www.bellsouth.com).
aThrough Celumóvil.
bBellSouth and the Panama-based Multi Holding Corporation (MHC) jointly own and operate BSC of Panama, a company that provides cellular telephony
services under the BellSouth brand name. MHC also owns 40% of BellSouth's operation in Guatemala.
M: Mobile
tremendous growth potential of its telecommunicationsmarket— is that in this part of the world, as in no other,the company has the opportunity to become a regionalpower. It has a common brand in most of the countriesand a substantial customer base, to which it can offer awider range of products and services (mobileconnection, common branding and data carriage) byintegrating its cellular telephony operations into acomprehensive telecommunications service. FromBellSouth’s point of view, then, wireless communicationis a platform that should enable it to provide a wide rangeof telecommunications services in the near future.
The decision by BellSouth and SBC to integratetheir United States cellular mobile telephony assets into anew firm, Cingular Wireless, suggests that there is alogic at work which may result in the same happening in
the region.110 BellSouth’s extensive system in SouthAmerica complements the mainly Mexican assets ofTelecom Americas, which suggests that the twocompanies could integrate easily. Apart from thefinancial and commercial logic, there is greattechnological affinity between these firms, as they all useTDMA technology, a 2G digital mobile telephonyvariant. If BellSouth’s Latin American network werecombined with that of Telecom Americas, not onlywould the resultant company instantly become theregion’s largest cellular mobile telephony operator, but itwould also have an integrated presence second to nonein many Latin American countries. This market segmentwould thus be consolidated under the control of one ofthe industry’s globalizers: Telecom Americas/BellSouth.
C. CONCLUSIONS
The globalization process has perhaps advanced more inthe telecommunications industry than in any other overrecent years. The effects, both positive and negative,have been extraordinary. In many countries, rapidmodernization and expansion of the sector, driven bycopious FDI inflows, is now an established fact, as is theindustry’s beneficial influence on systemiccompetitiveness. While this progress is easing countries’integration into the international economy, however, theless positive aspects, which include financial instabilityand imprudent behaviour by economic agents andnational governments, are also striking. There is a clearperception that the level of risk associated with the sectorhas increased significantly. It is in everyone’s interest toseek the greatest possible amount of common groundbetween the objectives of corporate strategies and thoseof national telecommunications policies, with a view topromoting the positive effects and minimizing thenegative ones.
Three basic factors —technological change,increased competition and the transnationalization ofeconomic agents— are driving developments in thetelecommunications industry. As it speeds up,technological change (digitalization, increased capacityvia broadband, 3G technologies associated with themobile/Internet/multimedia convergence) is holding outthe prospect of large profits for innovative companies
that succeed in coming up with “killer applications”, i.e.,commercially viable innovations that rout thecompetition. Other firms, however, could be destroyedby poor or ill-timed technology decisions. Greatercompetition boosts technological innovation but alsoincreases risk. Competition levels in the telecommu-nications industry vary greatly among segments, beingsomewhat low in fixed-line telephony, medium inmobile telephony and high in Internet services. Fewcountries have managed successfully to combine greatercompetition in each segment with greater private-sectorinvolvement and appropriate regulation. Thetransnationalization of economic agents has raised entrybarriers in the industry owing to the increasing scale ofthe investments required, and this in turn has led to around of mergers and acquisitions that have recentlyincreased concentration, first within regions (NorthAmerica and Europe) then, latterly, at the global level.The different strategies of transnational companies in thesector reflect their varying approaches to these changes,with Latin America playing a different role in each.
In the region, two waves of telecommunicationsindustry FDI can be identified. The first came with theprivatization of the dominant basic telephony operatorsin countries such as Argentina, Chile, Mexico, Peru andVenezuela. The few European companies that enteredthe region at this stage (Telefónica de España and
224 ECLAC
110 Merrill Lynch suggested the same thing in its October 2000 report on Telmex.

Telecom Italia were particularly active) started out infixed-line telephony then expanded their presence inthree ways: by entering other segments (mobile, Internet,data); by taking full ownership of local affiliates that theydid not already control outright; and by moving intoother markets, particularly Brazil. These firms, whichare second-ranking by world standards, have a verysubstantial part of their international systems in LatinAmerica. The second FDI wave may have begun becauseof the stances taken by globalizing companies.Vodafone’s entry into the Verizon Wireless venture(with the recently merged Bell Atlantic and GTE) seemsto give a certain logic to GTE’s holdings in LatinAmerica (which work with CDMA technology),considering Vodafone’s involvement with Iusacell(Mexico), a mobile telephony company controlled byVerizon. Another globalizing strategy that includesLatin America is the one being pursued by SBCCommunications in partnership with Telmex (AméricaMóvil) and Bell Canada International. These companiescreated Telecom Americas for the very purpose ofintegrating their Latin American platforms, especially inmobile telephony, on the basis of TDMA technology.Having unified their cellular mobile communicationsassets in the United States, SBC and BellSouth could goon to pool their networks in the region, where the latter
has a large digital footprint in mobile telephony. All thissuggests that the Latin American countries may haveanother opportunity to channel telecommunicationssector FDI towards objectives that accord with their ownnational priorities.
Latin America’s experience with the first wave oftelecommunications industry FDI was not whollypositive. The priorities of the time —to maximize theprivatization value of State assets or to support a nationalchampion— were not calculated to unlock the fullpotential of the sector. In exchange for investing toexpand national networks, buyers enjoyed longexclusivity periods during which they receivedmonopoly rents from basic telephony. In most countries,the national authorities were inexperienced and had noclear vision for the future of telecommunications, therewas no telecommunications act to provide a regulatoryframework, and independent regulatory institutions hadyet to be created, all of which meant that the resultsachieved fell short of the potential. A new wave oftelecommunications FDI would give the region’scountries a further opportunity to try to reconcile theobjectives of globalizing business strategies moreeffectively with their own mobile telephony policies. Forthese countries, this new opportunity represents aregulatory challenge.
Foreign investment in Latin America and the Caribbean, 2000 225

Foreign investment in Latin America and the Caribbean, 2000 227
Bibliography
Abeles, Martín, Karina Forcinito and Martín Schorr (1999), “Las telecomunicaciones en Argentina. Regulación,poder de mercado y ganancias extraordinarias frente a la liberalización”, Informe de coyuntura, year 9, No. 82,Buenos Aires, Buenos Aires Research Centre, September-October.
Abo, Tetsu (ed.) (1994), Hybrid Factory: The Japanese Production System in the United States, New York, OxfordUniversity Press.
Agosin, Manuel, Ernesto Pastén and Sebastián Vergara (2000), Joint ventures en la industria vitivinícola chilena,Santiago, Chile, University of Chile.
AHCIET (Asociación Hispanoamericana de Centros de Investigación y Empresas de Telecomunicaciones) (2000a),“La volatilidad en los mercados de capitales”, November (http://www.ahciet.net.es).(2000b), “Evolución de la telefonía móvil” (http://www.ahciet.es).(1999), La regulación de telecomunicaciones en Iberoamérica, Madrid, Permanent Commission on Regulation.
Akamatsu, Kaname (1962), “A historical pattern of economic growth in developing countries”, The DevelopingEconomies, Preliminary Issue, No. 1, Tokyo, Institute of Developing Economies (IDE), March-August.(1961), “A theory of unbalanced growth in the world economy,” Weltwirtschafiliches, Archiv 86, No. 1.(1935), “Wagakuni Yomo Kogyohinn no Boueki Susei (The Trend of Wool Industry in Japan)”, SyogyoKeizai Ronso, vol. 13, Nagoyakosho.
Alexander, Ian, C. Mayer and H. Weeds (1996), “Regulatory Structure and Risk: An International Comparison”,Washington, D.C., World Bank, December (http://worldbank.org).
América economía (2001), “Fusión Endesa-Iberdrola: más es menos”, Santiago, Chile, 21 January. (1999), “Uno para el otro: la alianza entre Renault y Nissan generará importantes sinergias en AméricaLatina, pero sus beneficios se demorarán en manifestarse”, Santiago, Chile, 6 May.
ANATEL (Agência Nacional de Telecomunicações) (2001), “Brasil já tem 23,6 milhõnes de telefones móveis celularese 38,9 milhõnes de fixos instalados”, 22 February (http://www.anatel.gov.br).(2000), “Perspectivas para ampliação de modernização do setor de telecomicações”, April (http://www.anatel.gov.br).
Andersen Consulting (1994), Worldwide Manufacturing Competitiveness Study: The Second Lean Enterprise Report,London.
Andrade, Carlos (1993), “Identidad, tipicidad y originalidad de los vinos chilenos”, Agroeconómico, Santiago, Chile,Fundación Chile.
ANFAVEA (Associação Nacional dos Fabricantes de Veículos Automotores) (2000), “Industria automobilísticabrasileira”, Carta de ANFAVEA, No. 175, São Paulo, December.
AT&T (2001), Oficial Web site (http://www.att.com).(2000a), “About AT&T. It´s All Within Your Reach”, September (http://www.att.com).(2000b), “About AT&T” (http://www.att.com).(1999), 1998 Annual Report (http://www.att.com).
Azpiazu, Daniel (1999), “Las renegociaciones contractuales en los servicios públicos privatizados ¿Seguridad jurídicao preservación de rentas de privilegio?”, Realidad económica, No. 164, Buenos Aires, 16 May to 30 June.
Bachelet, Pablo (1999), “El día después”, América economía, Santiago, Chile, 21 October.
228 ECLAC
Banco Central de Chile (1956), Inversiones extranjeras en Chile, Santiago, Chile, Department of Studies.Bande, Jorge, Isabel Marshall and Enrique Silva (1993), “Cambios estructurales en la industria del cobre y estrategias
de CODELCO después de la nacionalización: una interpretación”, Chile exporta minería, Iván Valenzuela(ed.), Santiago, Chile, Editores Editec Ltda.
Battistón, Oscar Alfredo (2000), “Modelos de implantación de la competencia en América Latina: presente y retos defuturo”, document presented at the First Forum on Regulation of the Hispano-American Association of Centersof Telecommunications Research and Enterprises (AHCIET) (San Salvador, 22-23 March) (http://www.ahciet.es).
Battat, Joseph, Isaiah Frank and Xiaofang Shen (1996), “Suppliers to Multinationals: Linkage Programs to StrengthenLocal Companies in Developing Countries”, FIAS Service Occasional Paper, No. 6, Washington, D.C., WorldBank, September.
Beca, R. (2000), “Internet en Latinoamérica: las economías emergentes y la nueva economía”, document presented atthe seminar Universidad Internacional Menéndez Pelayo (Santander, Spain, 4-7 September) (http://www.ahciet.es).
Bell Atlantic (2000), Bell Atlantic Annual Report 1999, New York, March.BellSouth (2000), More Ahead. 1999 Report to Shareholds, Atlanta (http://www.bellsouth.com).Benítez, D. and others (2000), “Are Cost Models Useful for Telecoms in Developing Countries?”, Washington, D.C.,
World Bank, July (http://worldbank.org).Bercovich, Néstor and Jorge Katz (1997), Reestructuración industrial y apertura económica. La industria de celulosa
y papel de Argentina, Brasil y Chile en los años 90, Buenos Aires, Alianza Editorial, May.Berríos, Rubén (2000), “Economic Relations between Japan and Latin America: Problems and Prospects at the End
of the Millennium”, V.R.F. series, No. 340, Tokyo, Institute of Developing Economies (IDE), Japan ExternalTrade Organization (JETRO), March.
Blomqvist, Hans C. (1995), “Intraregional foreign investment in East Asia”, ASEAN Economic Bulletin, vol. 11, No. 3.BNDES (Banco Nacional de Desenvolvimento Econômico e Social) (2001), “Privatização” (http://www.bndes.gov.br/
pndnew/).(1997), “Telecomunicações”, Cadernos de infra-estructura, special edition, September.
Bonetti, Luis Manuel (2000), “Welcome Addresses”, opening speech presented at the workshop on Foreign DirectInvestment in the Caribbean Basin and Latin America, organized by the Organisation for Economic Co-operation and Development (OECD) and the Office for the Promotion of Foreign Investment in the DominicanRepublic (OPI-RD) (Santo Domingo, 11-12 April).
Borrus, Michael (1997), “Left for Dead: Asian Production Networks and the Revival of US Electronics”, BRIEWorking Paper, No. 100, April.
Boylaud, Olivier and Giuseppe Nicoletti (2000), “Regulation, Market Structure and Performance inTelecommunications”, OECD Economics Department Working Papers, No. 237 (ECO/WKP(2000)10), Paris,12 April.
Buckley, S. (2000), “3G wireless: mobility scales new heights”, Telecommunications Online, October.Calderón, Álvaro (1999), “Las inversiones de la empresa española en América Latina: ¿una estrategia agresiva o
defensiva”, Economía exterior, No. 9, Madrid, Study Group on Foreign Policy, July.Calderón, Álvaro and Ramón Casilda (2000), “The Spanish banks’ strategies in Latin America”, CEPAL Review, No. 70
(LC/G.2095-P), Santiago, Chile, April.(1999), Grupos financieros españoles en América Latina: una estrategia audaz en un difícil y cambianteentorno europeo, Desarrollo productivo series, No. 59 (LC/L.1244-P), Santiago, Chile, Economic Commissionfor Latin America and the Caribbean (ECLAC), September. United Nations publication, Sales No. S.99.II.G.27.
Calderón, Alvaro and Stephany Griffith-Jones (1995), “Los flujos de capital extranjero en la economía chilena, accesorenovado y nuevos usos”, Desarrollo productivo series, No. 24 (LC/G.1868), Santiago, Chile, EconomicCommission for Latin America and the Caribbean (ECLAC), September.
Camilo, R. (2000), “Cinco principios para la maximización de los beneficios de la inversión extranjera”, documentpresented at the workshop on Foreign Direct Investment in the Caribbean Basin and Latin America, organizedby the Organisation for Economic Co-operation and Development (OECD) and the Office for the Promotionof Foreign Investment in the Dominican Republic (OPI-RD) (Santo Domingo, 11-12 April).
CARICOM (Caribbean Community) (2000), Caribbean Trade and Investment Report 2000: Dynamic Interface ofRegionalism and Globalisation, Georgetown.
Foreign investment in Latin America and the Caribbean, 2000 229
Carrasco Fuentealba, Rubén (2000), “Los precios y tarifas en un mercado de competencia”, document of EmpresaNacional de Telecomunicaciones de Chile (ENTEL) presented at the First Forum on Regulation of the Hispano-American Association of Centers of Telecommunications Research and Enterprises (AHCIET) (San Salvador,22-23 March) (http://www.ahciet.es).
Carrillo, Jorge and Óscar Contreras (2000), “Comercio electrónico e integración regional: el caso de la industria deltelevisor en el norte de México”, October, unpublished.
Carrillo, Jorge, Michael Mortimore and Jorge Alonso Estrada (1999), Competitividad y mercado de trabajo: empresasde autopartes y de televisores en México, Mexico City, Plaza y Valdés Editores, June.
Celani, Marcelo (1998), “Determinantes de la inversión en telecomunicaciones en Argentina”, Reformas económicasseries, No. 9 (LC/L.1157), Santiago, Chile, Economic Commission for Latin America and the Caribbean(ECLAC), November.
CEP (Centro de Estudios para la Producción) (1999), Infraestructura: una reseña de los años 90, Buenos Aires,Secretariat of Industry, Commerce and Mining.
Chambouleyron, Andrés (1999), “Las telecomunicaciones en Argentina y Chile: modelos diferentes con resultadosdiferentes”, Informe de coyuntura, year 9, No. 82, Buenos Aires, Buenos Aires Research Centre, September-October.
Chisari, Omar and Antonio Estache (1999), “Universal Service Obligations in Utility Concession Contracts and theNeeds of the Poor in Argentina’s Privatization”, Washington, D.C., World Bank, November (http://worldbank.org).
Chudnovsky, Daniel (1999), Investimentos externos no Mercosul, Campinas, Papirus, Institute of Economics, StateUniversity at Campinas (UNICAMP).
CITEL / ITU / AHCIET (Inter-American Telecommunications Conference / International Telecommunication Union/ Asociación Hispanoamericana de Centros de Investigación y Empresas de Telecomunicaciones) (2000),“Universal Service in the Americas” (OEA/Ser.L/XVII.6.2), Organization of American States (OAS), February.
CNET News (2000), “Congressmen press for next generation wireless services”, 29 August.CNNfn (2001a), “AT&T May End Local Service”, 8 February (http://cnniw.yellowbrix.com).
(2001b), “Telephone Deregulation’s Lost Promise”, 19 February (http://cnniw.yellowbrix.com).(2001c), “Federal Government Nets $16.9 Billion in Auction of U.S. Airwaves”, 27 January (http://cnniw.yellowbrix.com).(2001d), “FCC Delays Wireless Auction until September”, 31 January (http://cnniw.yellowbrix.com).(2001e), “Phone Act Puts Consumers on Hold”, 8 February (http://cnniw.yellowbrix.com).
COCHILCO (Comisión Chilena del Cobre) (1999), Estadísticas del cobre y otros minerales, 1989-1998, Santiago,Chile.
CORFO (Corporación de Fomento de la Producción) (1972), Análisis de las inversiones extranjeras en Chile, amparadaspor el Estatuto del inversionista, Santiago, Chile, Board of Financial Promotion, Foreign InvestmentDepartment, January.
Cowhey, Peter F. and Mikhail M. Klimenko (2000), “Policy arena: telecommunications reform in developing countriesafter the WTO agreement on basic telecommunications services”, Journal of International Development,vol. 12, No. 2, March.
Datton, D. (1991), “Foreign direct investment in the US automotive industry”, Foreign Investment in the UnitedStates, Washington, D.C., Department of Commerce, August.
Del Pozo, José (1999), La historia del vino chileno, Santiago, Chile, Editorial Universitaria.Dertouzas, Michael, Richard K. Lester and Robert M. Solow (1989), Made in America: Regaining the Productive
Edge, Cambridge, Massachusetts, The MIT Press.Development Centre (1984), Japan’s General Trading Companies: Merchants of Economic Development, Paris,
Organisation for Economic Co-operation and Development (OECD).Dussel, Enrique (2000), La inversión extranjera en México, Desarrollo productivo series, No. 80 (LC/L.1414-P),
Santiago, Chile, Economic Commission for Latin America and the Caribbean (ECLAC), October. UnitedNations publication, Sales No. S.00.II.G.104.
ECLAC (Economic Commission for Latin America and the Caribbean) (2000a), Foreign Investment in Latin Americaand the Caribbean, 1999 (LC/G.2061-P), Santiago, Chile, February. United Nations publication, SalesNo. E.00.II.G.4.

230 ECLAC
(2000b), Preliminary Overview of the Economies of Latin America and the Caribbean, 2000 (LC/G.2123-P),Santiago, Chile, December. United Nations publication, Sales No. E.00.II.G.138.(1998), Foreign investment in Latin America and the Caribbean; 1998 Report (LC/G.2042-P), Santiago,Chile, December. United Nations publication, Sales No. E.98.II.G.14.
EDELNOR (Empresa Eléctrica del Norte Grande S.A.) (2000), Memoria anual, Antofagasta, March.EIA (Energy Information Administration) (1999), “Electricity”, International Energy Outlook, 2000 (www.eia.doe.gov).EIAJ (Electronic Industries Association of Japan) (1998), EIAJ Half Centennial: A Look at 50 Years of the Japanese
Electronics Industry, Tokyo, Gravitas, Inc., May.El País (2000a), “La mayoría de países de la Unión Europea se decanta por subastar sus licencias”, 18 August (http:/
/www.elpais.es).(2000b), “La factura millonaria del UMTS”, 28 August (http://www.elpais.es).
Encarnation, Dennis J. (1993), “A common evolution?: a comparison of United States and Japanese transnationalcorporations”, Transnational Corporation, vol. 2, No. 1, February.(1992), Rivals Beyond Trade: America versus Japan in Global Competition, New York, Cornell UniversityPress.
ENTEL (Empresa Nacional de Telecomunicaciones) (2000), Informe anual 1999, Santiago, Chile.Ernst, D. (1997a), “From Partial to Systemic Globalization: International Production Networks in the Electronics
Industry”, BRIE Working Paper, No. 98, April.(1997b), “Partners for the China Circle? The Asian Production Networks of Japanese Electronics Firms”,BRIE Working Paper, No. 91, January.
ESCAP (Economic and Social Commission for Asia and the Pacific) (1994), Transnational Corporations andTechnology Transfer in Export Processing Zones and Science Parks (ST/ESCAP/1410), New York.
Escobar de Medécigo, Rebeca (1999), “El cambio estructural de las telecomunicaciones y la inversión: el caso deMéxico”, Reformas económicas series, No. 17 (LC/L.1174), Santiago, Chile, Economic Commission forLatin America and the Caribbean (ECLAC), November.
Estrada, Jorge Alonso, Jorge Carrillo and Óscar Contreras (1999), Trayectorias tecnológicas en empresas maquiladorasasiáticas y americanas en México, Desarrollo productivo series, No. 72 (LC/L.1323-P), Economic Commissionfor Latin America and the Caribbean (ECLAC), Santiago, Chile, August. United Nations publication, SalesNo. S.00.II.G.61.
European Commission (2000), “Sixth Report on the Implementation of the Telecommunications Regulatory Package”(COM (2000) 814), Brussels, 7 December.
Expansión (2000a), “Sistema financiero: fusiones, pequeños resultados”, Mexico City, 25 October.(2000b), “Banca extranjera: al acecho de las grandes presas”, Mexico City, 27 September.(2000c), “Telecomunicaciones: cuestión de reglas”, Mexico City, 22 November to 6 December.(1999), “Extraviada en la globalización”, Mexico City, 20 January to 3 February.(1998), “Sueños digitales”, Mexico City, 6 May.
FAO (Food and Agriculture Organization of the United Nations) (2000), The State of World Fisheries and Aquaculture,1999, Rome.
FCC (Federal Communications Commision) (2001), “Statistics of the Long Distance Telecommunications Industry”,January (http://www.fcc.gov).(2000a), “Local Telephone Competition: Status as of June 30 2000”, December (http://www.fcc.gov).(2000b), Fifth Report: Annual Report and Analysis of Competitive Market Conditions with Respect toCommercial Mobile Services (FCC 00-289), Washington, D.C., 18 August.
FCC News (2001), “C and F block broadband PCS spectrum auction raises $17 billion for US Treasury”, Washington,D.C., 26 January.
Ferro, Raúl and Pablo Bachelet (1999), “Doblan las campanas”, América economía, Santiago, Chile, 8 April.Ffrench-Davis, Ricardo (1999), Entre el neoliberalismo y el crecimiento con equidad, tres décadas de política
económica en Chile, Santiago, Chile, Dolmen Ediciones S.A.(1990), “Conversión de deuda-capital en Chile”, Cuadernos de economía, year 27, No. 82, Santiago, Chile,Catholic University of Chile, December.
Foders, F. (1996), “Mercosur: A New Approach to Regional Integration?”, Working Paper, No. 746, Kiel Institute ofWorld Economics.

Foreign investment in Latin America and the Caribbean, 2000 231
Ford, Stuart and Roger Strange (1999), “Where do Japanese manufacturing firms invest within Europe, and why?”,Transnational Corporations, vol. 8, No. 1 (UNCTAD/ITE/IIT/12), April.
Foxley, Alejandro (1980), “Hacia una economía de libre mercado: Chile 1970-1978”, Colección estudios CIEPLAN,No. 4, Santiago, Chile, November.
France Télécom (2000a), 1999 Annual Report, Paris, March.(2000b), “Where We Are in the Americas”, September (http://www.francetelecom.fr).
Froot, Kenneth A. (1991), “Japanese Foreign Direct Investment”, NBER Working Paper series, No. 3737, Cambridge,Massachusetts, National Bureau of Economic Research (NBER), June.
Fukasaku, Kiichiro (1992), “Economic Regionalisation and Intra-industry Trade: Pacific-Asian Perspectives”, TechnicalPapers, No. 53, Paris, Organisation for Economic o-operation and Development (OECD), February.
Galal, Ahmed and Bharat Nauriyal (1995), “Regulating Telecommunications in Developing Countries: Outcomes, Incentivesand Commitment”, Policy Research Working Paper, No. 1520 Policy Research Department, Washington, D.C.,World Bank, October (http://www.worldbank.org/html/dec/Publications/Workpapers/wps2136).
Goldberg, Linda S. and Michael W. Klein (1997), “Foreign Direct Investment, Trade and Real Exchange Rate Linkagesin Southeast Asia and Latin America”, NBER Working Paper series, No. 6344, Cambridge, Massachusetts,National Bureau of Economic Research (NBER), December.
González, R. (2000), “Tendencias regulatorias en comunicaciones inalámbricas”, document of the Federal Commissionof Telecommunications of Mexico presented at the First Forum on Regulation of the Hispano-AmericanAssociation of Centers of Telecommunications Research and Enterprises (AHCIET) (San Salvador, 22-23March) (http://www.ahciet.es).
Goulam, F. (2000), “A critical time for 3G”, Telecommunications Online, September.Government of Japan (2000), Monthly Statistics of Japan, No. 471, Statistics Bureau, September.
(1999), Japan Statistical Yearbook, 2000, Tokyo, Statistics Bureau, October.Green, Philip (2000), “¿En qué gasto mi dinero?”, América economía, Santiago, Chile, 23 March.GSM World (2000), “Providing a Global 3rd Generation Platform” (Mr. Rob ConwayInterview, President of the GSM Association), May (http://www.gsmworld.com).GTE (2000), GTE Corporation Annual Report 1999, Irving, Texas, March.Guasch, J. Luis and Robert W. Hahn (1997), “The Costs and Benefits of Regulation: Implications for Developing
Countries”, Washington, D.C., World Bank, June (http://worldbank.org).Gwynne, R. (1998), “Globalization, commodity chains and agriculture in Latin America”, ISS Rural Seminar Series,
The Hague, 16 February.Hachette, Dominique and Rolf Lüders (1992), La privatización en Chile, Santiago, Chile, International Center for
Economic Growth (ICEG).Hamaguchi, Nobuaki and Neantro Saavedra-Rivano (1999), “Globalization and Its Strategic Implications for Japanese
Industry: A Case Study of the Automobile and Electronics Industries”, unpublished.Herrera, Alejandra (1998a), “Reforma de sector de telecomunicaciones en Brasil: asimetría regulatoria, competencia
y universalización de los servicios”, December, unpublished.(1998b) “Competencia y universalización, ¿qué hay de nuevo en la regulación? Los casos de Bolivia yNicaragua”, Caracas, Latin American Centre for Development Administration (CLAD).
Hiramoto, A. (1995), “Overseas Japanese plants under global strategies: TV transplants in Asia”, Industrialization and LaborRelations: Contemporary Research in Seven Countries, S. Frenkel and J. Harrod (eds.), Ithaca, New York, ILR Press.
Hobday, Michael (1995), Innovation in East Asia. The Challenge to Japan, Hants, Edward Elgar.Hohei, Nishiyama, Hiroki Sekine and Yuriko Moritani (1998), “EXIM Japan FY 1997 Survey: the outlook of Japanese
foreign direct investment”, EXIM Review, Export Import Bank, 1 November.Hosono, Akio (2000), “Investment Opportunities in Latin America and the Asia Pacific”, December, unpublished.Hsu, Robert C. (1994), The MIT Encyclopedia of Japanese Economy, Cambridge, Massachusetts, The MIT Press.IDB/IRELA (Inter-American Development Bank / Institute for European-Latin American Relations) (1998), Foreign
Direct Investment in Latin America: Perspectives of the Major Investors, Washington, D.C.IDE/JETRO (Institute of Developing Economies/ Japan External Trade Organization (1998), “Can Asia Recover Its
Vitality? Globalization and the Roles of Japanese and U.S. Corporations”, document presented at theInternational Symposium “Developing Economies in the 21st Century. The Challenges of Globalization”(Tokyo, 26 January).
232 ECLAC
IIF (Institute of International Finance) (2000), Capital Flows to Emerging Market Economies, Geneva, September.IMD (International Institute for Management Development) (1999), The World Competitiveness Yearbook, Lausanne.ITU (International Telecommunication Union) (2001a), PTO database, Geneva.
(2001b), “Status of IMT-2000 (UTMS) 3G Licensing in Western Europe: Situation at February, 2001” (http://www.itu.org).(2000a), World Telecommunication Regulatory Database, Geneva.(2000b), Indicadores de telecomunicaciones de las Américas, Geneva, April.(2000c), Yearbook of Statistics: Telecommunications Services Chronological Time Series, 1989-1998, Geneva,February.(1999), World Telecommunication Development Report 1999. Mobile Cellular, Geneva, October.
Izaguirre, Ada Karina (1998), “Private partcipation in the electricity sector. Recent trends”, Public Policy for thePrivate Sector, Washington, D.C., World Bank, September.
Izuishi, Shiro (2000), “Commentary: trends of Japanese foreign direct investment (FDI) in fiscal 1999 (Immediatereport)”, JBIC Review, No. 2, November.
Jacobs, T. (2001), “Europe’s 3G dbt hangover”, Fool.Com, 4 January.JAMA (Japan Automobile Manufactures Association) (1999), The Motor Industry of Japan, 1999, Tokyo.
(1998), The Motor Industry of Japan, 1998, Tokyo.JETRO (Japanese External Trade Organization) (2000a), “Investigación del estado administrativo de las empresas
japonesas en países latinoamericanos”, Tokyo, March, unpublished.(2000b), Report on Closer Economic Relations Between Japan and Mexico, Tokyo, April.(2000c), Strategies for Japan-Mexico Trade, Tokyo, April.(2000d), JETRO White Paper on Foreign Direct Investment 2000. FDI Inflows to Japan Double, Tokyo.(1999a), White Paper on International Trade, 1999, Tokyo, Ministry of International Trade and Industry(MITI), March.(1999b), “Japanese manufacturing plants in U.S.”, Annual Survey, Tokyo.(1999c), JETRO White Paper on Foreign Direct Investment. Global FDI Grows Despite Asian Crisis, Tokyo.
JICA (Japan International Cooperation Agency)/ Ministerio de Economía, Minería y Energía de Chile (2000), “TheStudy for Promotion of Investments and Exports for the Balanced Economic Development in the Republicof Chile”, Progress Report, No. 1, Santiago, Chile, August.
Jun, Kwang W. and others (1993), “Japanese Foreign Direct Investment: Recent Trends, Determinants and Prospects”,Policy Research Working Paper, No. 1213, Washington, D.C., World Bank, November.
Kaburagi, S., H. Noda and S. Ikehara (2000), “The outlook of foreign direct investment by Japanese manufacturingcompanies: prospects of overseas operations after the Asian crisis”, JBIC Review, No. 1, Japan Bank forInternational Cooperation (JBIC), January.
Kagami, Mitsuhiro (1998), “Japan and Latin America”, Discussion Paper series, Tokyo, Institute of DevelopingEconomies (IDE), January.(1995), The Voice of East Asia: Development Implications for Latin America, Tokyo, Institute of DevelopingEconomies (IDE).
Kagami, Mitsuhiro and Akifumi Kuchiki (2000), “Silicon Valley of the South: New Management Networks Emergingin Guadalajara”, document presented at the Workshop organized by the Japan External Trade Organization(JETRO) and the Institute of Developing Economies (IDE) “A Study of International Networks in Asia”(Tokyo, 26-27 January).
Kagami, Mitsuhiro, John Humphery and Michael Piore (1998), Learning, Liberalization and Economic Adjustment,Tokyo, Institute of Developing Economies (IDE).
Kalau Vom Hofe, Matías (2000), Las telecomunicaciones en Chile: inversión proyectada y realizada durante los años1998, 1999 y perspectiva para después del 2000 (LC/R.1992), Santiago, Chile, Economic Commission forLatin America and the Caribbean (ECLAC), May.
Kamiyama, Kunio (1994), “The typical Japanese overseas factory”, Hybrid Factory: The Japanese Production Systemin the United States, T. Abo (ed.), New York, Oxford University Press.
Kaplinsky, Raphael (1995), “Technique and system: the spread of Japanese management techniques to developingcountries”, World Development, vol. 23, No. 1, January.
Foreign investment in Latin America and the Caribbean, 2000 233
Katz, Jorge, Giovanni Stumpo and F. Varela (2000), “El complejo forestal chileno”, Santiago, Chile, Division ofProduction, Productivity and Management, Economic Commission for Latin America and the Caribbean(ECLAC), unpublished.
Katz, Jorge, Jaime Cáceres and Kattia Cárdenas (2000), “Instituciones y tecnología en el desarrollo evolutivo de laindustria minera chilena”, Reformas económicas series, No. 53 (LC/L.1349), Santiago, Chile, EconomicCommission for Latin America and the Caribbean (ECLAC), March.
Keidanren (1999), “Report on the possible effects of a Japan-Mexico free trade agreement on Japanese industry”,Tokyo, 20 April.(1998), “Results of Survey on Japan-Mexico Economic Relations: Summary”, Tokyo, September.
Kelly, Tim (2000a), “Price Strategies for An Incumbent Operator: Part A- fixed Line”, document presented at theseminar of the International Telecommunication Union (ITU) (Bangkok, 11-15 September) (http://itu.org).(2000b), “Price Strategies for An Incumbent Operator: Part B- Mobile”, document presented at the seminarof the International Telecommunication Union (ITU) (Bangkok, 11-15 September) (http://itu.org).(2000c), “Mobile Overtakes Fixed: What Happens Next?” (http://www.itu.org).(2000d), “The World Is Moving from an Industrial to an Information Economy”, document presented at theEuropean Council of Economists (Geneva, 27-28 January) (http://www.itu.org).(2000e), “Price Comparisons: Purpose and Practice”, document presented at the seminar of the InternationalTelecommunication Union (ITU) (Bangkok, 11-15 September) (http://itu.org).
Kennard, W. (2000), “ITI-D: The Opportunity Alliance”, speech presented a the Symposium InternationalTelecommunication Union (ITU) (Geneva, 20 November) (http://www.fcc.gov).
Kenney, Martin and Richard Florida (1994), “Japanese maquiladoras: production, organization and global commoditychains”, World Development, vol. 22, No. 1.
Kerber, Víctor and Antonio Ocaranza (1989), “Las maquiladoras japonesas en la relación entre México, Japón y los EstadosUnidos”, Comercio exterior, vol. 39, No. 10, Banco Nacional de Comercio Exterior (BANCOMEXT), October.
Koido, Akihiro (1991), “The color television industry. Japanese-U.S. competition and Mexico’s maquiladoras”,Manufacturing across Borders and Oceans: Japan, the United States, and Mexico, Gabriel Szekely (ed.),San Diego, La Jolla, University of California.
Koike, Yoichi (1998), “Regional integration and multinational corporation: the case of automobile industry in Mercosur”,Globalism and Regionalism in Latin America, Nobuaki Hamaguchi (ed.), Tokyo, Institute of DevelopingEconomies (IDE).
Kojima, Kiyoshi (2000), “Gankogata Keizai Hattenron: Akamatsu Original (The theory of flying geese model ofdevelopment: original model of akamatsu)”, Sekai Keizai Hyoron, vol. 44, No. 3.(1998), “Higasiasia no Gankogata Keizai Hatten (Flying geese model of development of East Asian countries)”,Sekai Keizai Hyoron, vol. 42, No. 11.(1990), “Japanese Direct Investment Abroad”, Monograph series, No. 1, Ntaka, Tokyo, Social ScienceResearch Institute, International Christian University.(1985), “Japanese and American direct investment in Asia: a comparative analysis”, Hitotsubashi Journal ofEconomics, vol. 26, No. 1, June.(1960), “Capital accumulation and the course of industrialisation, with special reference to Japan”, EconomicJournal, vol. 70, No. 280, December.
Kojima, Kiyoshi and Terutomo Ozawa (1984), Japan’s General Trading Companies: Merchants of Economic Development,Paris, Development Centre, Organisation for Economic Co-operation and Development (OECD).
Kondo, M.J. and others (2000), “Reviving Japan’s economy”, The McKinsey Quarterly, No. 4, special edition.Kouzmine, Valentine (1999), América Latina en el mercado mundial de la harina de pescado: situación actual y
perspectivas futuras (LC/L.1222), Santiago, Chile, Economic Commission for Latin America and theCaribbean (ECLAC), August.
Krause, Lawrence B. (1991), “Japanese capitalism: a model for others?”, International Economic Insights, November-December.
Kulfas, Matías (2000), “La transformación de las telecomunicaciones en la Argentina durante los años noventa:tendencias y perspectivas a partir del proceso de liberalización”, Santiago, Chile, Unit on Investment andCorporate Strategies of the Division of Production, Productivity and Management, Economic Commissionfor Latin America and the Caribbean (ECLAC), January, unpublished.
234 ECLAC
Kumar, Nagesh (1997), Multinational Enterprises and Export-Oriented Industrialization in the Host Countries: AnEmpirical Analysis for the US and Japanese Affiliates, New York, Institute for New Technologies, UnitedNations University, September.
Kuwayama, Mikio (1997), El fomento de las relaciones económicas entre Japón y América Latina y el Caribe (LC/R.1718), Santiago, Chile, Economic Commission for Latin America and the Caribbean (ECLAC), 12 May.
La Nación (2001), “Brasil: exitosa licitación de telefonía celular”, 14 February.Lall, Sanjaya (2000), Desempeño de las exportaciones, modernización tecnológica y estrategias en materia de
inversiones extranjeras directas en las economías de reciente industrialización de Asia. Con especial referenciaa Singapur, Desarrollo productivo series, No. 88 (LC/L.1421-P), Santiago, Chile, Economic Commissionfor Latin America and the Caribbean (ECLAC), October. United Nations publication, Sales No. S.00.II.G.108.(1998a), “Exports of manufactures by developing countries: emerging patterns of trade and location”, OxfordReview of Economic Policy, vol. 14, No. 2, March.(1998b), “The technological structure and performance of developing country manufactruring exports, 1985-98”, Oxford Development Studies, vol. 28, No. 3.
Langhammer, Rolf J. and Rainer Schweickert (1995), “The Mexican Reform Process: Improving Long-run Perspectivesand Mastering Short-run Turbulences”, Discussion Paper, No. 255, Kiel Institute of World Economics.
Lara Rivero, Arturo (1998), Aprendizaje tecnológico y mercado de trabajo en las maquiladoras japonesas, Xochimilco,Mexico, Institute of Social Research Miguel Ángel Porrúa, National Autonomous University of Mexico(UNAM).
Lawrence, Robert Z. (1992), “Japan’s low levels of inward investment: the role of inhibitions on acquisitions”,Transnational Corporations, vol. 1, No. 3, December.
Lazonick, William (1994), “Indigenous Innovation and Industrialization: Foundations of Japanese Development andAdvantage”, June, unpublished.
Le Monde (2001a), “La grande panne du téléphone”, 25 January (http://www.lemonde.fr).(2001b), “Bouygues de retire de la course à l’UMTS”, 31 January (http://www.lemonde.fr).(2001c), “La dette transforme les télécommunications en secteur à risque”, 12 January (http://www.lemonde.fr).(2001d), “L’UMTS cherche son modèle économique désespérément”, 25 January (http://www.lemonde.fr).(2000a), “Vivendi et Vodafone créent une société commune à égalité dans l’Internet”, 31 January (http://www.lemonde.fr).(2000b), “Vivendi opte pour un développement sur Internet avec Vodafone”, 1 February (http://www.lemonde.fr).(1999a), “Avec Air Touch, Vodafone devient numéro un du téléphone portable”, 25 May (http://www.lemonde.fr).(1999b), “Vodafone lance son offre sur Mannesmann la veille de Noël”, 22 December (http://www.lemonde.fr).
Lii Sheng-Yann (1994), “Japanese foreign direct investment and trade flows in the Asia-Pacific region”, Asian EconomicJournal, vol. 48, No. 2.
Lima, E. (2000), “Las garantías de la competencia en los mercados”, El Salvador, General Superintendence of Electricityand Telecommunications (SIGET) (http://www.ahciet.es ).
Lipsey, Robert E. (1999), “Affiliates of U.S. and Japanese Multinationals in East Asian Production and Trade”, NBERWorking Paper series, No. 7292, August.
Macarrón, A. (2000), “La convergencia de Internet y las telecomunicaciones móviles: ¿la próxima ‘killer application’?”,document PPT presented at the summit of Cartagena de Indias of the Hispano-American Association ofCenters of Telecommunications Research and Enterprises (AHCIET) (6-7 November) (http://www.AHCIET.net.es).
Mannisto, L. (1999), “Examining the Opportunities and Challenges for ISPs in Developing Countries”, documentpresented at the forum ISP, IIR (Amsterdam, 30 November) (http://www.itu.org).
Matamoros, F. (2000), “Edenorte y Edesur: rentibilidad de las inversiones”, document presented at the workshop onForeign Direct Investment in the Caribbean Basin and Latin America, organized by the Organisation forEconomic Co-operation and Development (OECD) and the Office for the Promotion of Foreign Investmentin the Dominican Republic (OPI-RD) (Santo Domingo, 11-12 April).
McCaffery, R. (2000), “Wireless standards everywhere”, Fool.com., 31 August.
Foreign investment in Latin America and the Caribbean, 2000 235
Melrose, E. (2000), “La telefonía móvil en América del Norte. El caso de México” (http://www.AHCIET.net/inalambricos/IIFATICMS.asp.).
Merrill Lynch & Co. (2000), “Teléfonos de México: take it for a spin”, 20 October.Minges, M. (1999), “Trouble in Paradise: Challenges to International Telephone Traffic” (http://www.itu.org).Ministerio de Economía y Obras y Servicios Públicos (2000), “1999 y primeros tres trimestres de 2000”, Estimaciones
trimestrales del balance de pagos y de activos y pasivos externos, Buenos Aires, December.MITI (Ministry of International Trade and Industry), Basic Survey of Japanese Firms Foreign Activities, Tokyo,
various years.Miyazaki, Silvio Yoshiro (1997), “Foreign Direct Investment and Intra-firm Trade in East Asia by Japanese Multinational
Companies”, V.R.F. series, No. 307, Institute of Developing Economies (IDE).MOF (Ministerio de Finanzas) (1999), “Special issue of private financial inflow and outflow”, Ministry of Finance
Statistics Monthly, Tokyo.Moguillansky, Graciela (1999), La inversión en Chile: ¿el fin de un ciclo de expansión?, Santiago, Chile, Fondo de
Cultura Económica / Economic Commission for Latin America and the Caribbean (ECLAC), November.(1998), “Las reformas del sector de telecomunicaciones en Chile y el comportamiento de la inversión”,Reformas económicas series, No. 4 (LC/L.1137), Santiago, Chile, Economic Commission for Latin Americaand the Caribbean (ECLAC), August.(1997), “La gestión privada y la inversión en el sector eléctrico chileno”, Reformas económicas series, No. 1(LC/L.1070), Santiago, Chile, Economic Commission for Latin America and the Caribbean (ECLAC),September.
Molano Vega, D. (2000), “Instrumentos regulatorios para la competencia en el sector de las telecomunicaciones”,Commission for Regulation of Telecommunications (CRT), 22 March (http://www.ahciet.es).
Montes, Manuel F. (1997), “Direct foreign investment and technology transfer in ASEAN”, ASEAN Economic Bulletin,vol. 14, No. 2, November.
Mortimore, Michael (2000), “Corporate strategies for FDI in the context of Latin America’s new economic model”,World Development, vol. 28, No. 9, September.(1998a), “Corporate strategies and regional integration schemes in developing countries: the case of theNAFTA and Mercosur automobile industry”, Science, Technology and Development, vol. 16, No. 2, Universityof Strathclyde, August.(1998b), “Getting a lift: modernizing industry by way of Latin American integration schemes. The exampleof automobiles”, Transnational Corporations, vol. 7, No. 2 (UNCTAD/ITE/IIT/9), August.(1998c), “Mexico’s TNC-centric industrialization process”, Transnational Corporations and the GlobalEconomy, R. Kozul-Wright and R. Rowthorn (eds.), London, Macmillan Press Ltd.(1997), “The Asian challenge to the world automotive industry”, Revista de economia contemporânea, No. 2,Rio de Janeiro, Rio de Janeiro’s Federal University (UFRJ), July-December.(1995), “Paths towards international competitiveness: a CANalysis”, Desarrollo productivo series, No. 25(LC/G.1869), Santiago, Chile, Economic Commission for Latin America and the Caribbean (ECLAC), June.(1993), “Flying geese or sitting ducks? Transnational and industry in developing countries”, CEPAL Review,No. 51 (LC/G.1792-P), Santiago, Chile, June.
Mortimore, Michael and Wilson Peres (1998), Empresas transnacionales, procesos de restructuración industrial eindustrialización en economías pequeñas y abiertas: Costa Rica y República Dominicana, Buenos Aires,Alianza Editorial Argentina, October.
Mortimore, Michael, Henk Duthoo and José Alfredo Guerrero (1995), “Informe sobre la competitividad internacionalde las zonas francas en la República Dominicana”, Desarrollo productivo series, No. 22 (LC/G.1866), Santiago,Chile, Economic Commission for Latin America and the Caribbean (ECLAC), August.
Mortimore, Michael, Rudolf Buitelaar and José Luis Bonifaz (2000), México: un CANálisis de su competitividadinternacional, Desarrollo productivo series, No. 62 (LC/L.1268-P), Santiago, Chile, EconomicCommission for Latin America and the Caribbean (ECLAC), March. United Nations publication, SalesNo. S.00.II.G.32.
Moussa, Nicole (1999), El desarrollo de la minería del cobre en la segunda mitad del Siglo XX, Recursos naturales einfraestructura series, No. 4 (LC/L.1282-P), Santiago, Chile, Economic Commission for Latin America andthe Caribbean (ECLAC), November. United Nations publication, Sales No. S.99.II.G.54.

236 ECLAC
Murray, Warwick (1999), “La globalización de la fruta, los cambios locales y el desigual desarrollo rural en AméricaLatina: un análisis crítico del complejo de exportación de fruta chilena”, EURE Revista latinoamericana deestudios urbano regionales, vol. 25, No. 75, Santiago, Chile, Institute for Urban Studies, Arquitecture andFIne Arts School, Catholic University of Chile, September.
Naga, M. Masahiro (1995), “The Asia-Pacific region in the 21st century: future relations among the United States,Japan and Asia”, Interdependence and New Directions for Development Policy in East and Southeast Asia(Kitakyushu: International Centre for the Study of East Asian Development), F. Gerard Adams, TakeshiKatsuhara and Kenji Nogami (eds.), Tokyo.
Nakamura, K., H. Demes and H. Nagano (1994), “Work organization in Japan and Germany: a research report onVCR production (1)”, Miscellanea, No. 6, Philipp-Franz-von-Siebold-Stiftung, Detusches Institut furJapanstudien, Tokyo.
Nakamura, Shin-ya and Tsuyoshi Oyama (1998), “The Determinants of Foreign Direct Investment from Japan andthe United States to East Asian Countries, and the Linkage Between FDI and Trade”, Working Paper series,Bank of Japan, November.
Nakashima, Hiroyuki (1998), “Japan’s outward foreign direct investment for fiscal year 1991 to 1995”, EXIM Review,Export Import Bank, 2 November. (1995), “Japanese outward foreign direct investment during fiscal 1994. Expansion continues with the mainfocus on Asia ”, EXIM Review, Export Import Bank, 1 November.
Network World Fusion News (2001a), “Vodafone to Buy Its Way into Latin America”, 9 January (http://www.nwfusion.com).(2001b), “Verizon Unveils Global Network Plans”, 7 February (http://www.nwfusion.com).(2000), “Wireless Mergers Could Bolster Service Offerings”, 10 April (http://www.nwfusion.com).
Nikkei Business (2000), “Tokushu: “i” wa Nihon wo sukueruka (Will I save Japan?: the blind spot in the shadow ofsuccess)”, Tokyo, 18-25 December.
Nishio, M. (2000), “La cadena de valor del negocio de Internet”, document of Enelpunto/Tricom presented at theFirst meeting of operators and users of telecommunications services: towards a globalized society of theHispano-American Association of Centers of Telecommunications Research and Enterprises (AHCIET)(Buenos Aires, 6-7 April).
Nishiyama, Hohei, Teruyasu Kushima and Hidehiko Noda (1999), “The outlook of Japanese foreign direct investment(FDI). Asian crisis and the prospects of foreign direct investment by Japanese manufacturers”, EXIM Review,Tokyo, Export Import Bank, 1 November.
Noda, Hidehiko (1999), “The outlook of Japanese foreign direct investment”, Exim Japan FY 1998 Survey, Tokyo,Research Institute for International Investment and Development, Export Import Bank.
Núñez, L. (2000), “Recent Trends in FDI in the Dominican Republic”, document presented at the workshop onForeign Direct Investment in the Caribbean Basin and Latin America, organized by the Organisation forEconomic Co-operation and Development (OECD) and the Office for the Promotion of Foreign Investmentin the Dominican Republic (OPI-RD) (Santo Domingo, 11-12 April).
O Globo (2001), 14 March (http://oglobo.globo.com/economia/eco98.htm).ODEPLAN (Oficina de Planificación Nacional) (1972), Algunos aspectos de la inversión extranjera en Chile en el
período 1964-1968, Santiago, Chile, January.OECD (Organisation for Economic Co-operation and Development) (2000), “Telecommunications Regulations:
Institutional Structures and Responsibilities” (DSTI/ICCP/TISP(99)15/FINAL), Working Party onTelecommunication and Information Services Policies, 26 May. (1999a), “A Review of Market Openness and Trade in Telecommunications” (DSTI/ICCP/TISP(99)5/FINAL),Working Party on Telecommunication and Information Services Policies, 20 September.(1999b), “Regulatory reform in Mexico”, OECD Reviews of Regulatory Reform, Paris, August.(1998), “Foreign direct investment: survey of implementation of methodological standards”, Financial MarketTrends, No. 71, November.(1996), International Direct Investment Statistics Yearbook 1996, Paris.(1994), “Statistics on International Direct Investment of Dynamic Member Economies in Asia and LatinAmerica”, Working Paper, Paris.
Foreign investment in Latin America and the Caribbean, 2000 237
(1984), Japan’s General Trading Companies: Merchants of Economic Development, Paris.Okita, S. (1986), “Pacific development and its implication for the world economy”, The Pacific Basin: New Challenges
for the United States, J. Moley (ed.), New York, The Academy of Political Science.Olivera, M. (2000), “Unión Fenosa”, document presented at the workshop on Foreign Direct Investment in the Caribbean
Basin and Latin America, organized by the Organisation for Economic Co-operation and Development (OECD)and the Office for the Promotion of Foreign Investment in the Dominican Republic (OPI-RD) (Santo Domingo,11-12 April).
OPI-RD (Oficina para la Promoción de la Inversión Extranjera de la República Dominicana) (2000a), Boletíninformativo, No. 3, 31 January.(2000b), “Parque cibernético de Santo Domingo”, document presented at the workshop on Foreign DirectInvestment in the Caribbean Basin and Latin America, organized by the Organisation for Economic Co-operation and Development (OECD) and the Office for the Promotion of Foreign Investment in the DominicanRepublic (OPI-RD) (Santo Domingo, 11-12 April).
Ostry, Sylvia and Farid Harianto (1995), “The changing pattern of Japanese foreign direct investment in the electronicsindustry in East Asia”, Transnational Corporations, vol. 4, No. 1, April.
Ozawa, Terumoto (1993), “Foreign direct investment and structural transformation: Japanese as recycler of marketand industry”, Business and Contemporary World, No. 5.(1992), “Foreign direct investment and economic development”, Transnational Corporations, vol. 1, No. 1,February.(1982), “A newer type of foreign investment in third world resource development”, Rivista internazionale discineze economiche e commerciali, No. 29, December.
Página 12 (2000a), 9 November, Buenos Aires (http://www.pagina12.com.ar/).(2000b), “Apertura telefónica”, suplemento Cash, Buenos Aires, 5 November (http://www.pagina12,com.ar/2000/suple/cash/).
Pascale, Richard T. (1984), “The real story behind Honda’s success”, California Management Review, vol. 26, Spring.Pellerano, Fernando and Alejandra Herrera (2000), “Status Report: FDI – Dominican Republic”, document presented
at the workshop on Foreign Direct Investment in the Caribbean Basin and Latin America, organized by theOrganisation for Economic Co-operation and Development (OECD) and the Office for the Promotion ofForeign Investment in the Dominican Republic (OPI-RD) (Santo Domingo, 11-12 April).
Peña-Quiñones, Gustavo (2000), “El papel del regulador hacia una sociedad globalizada”, document of Regulatelpresented at the First Forum on Regulation of the Hispano-American Association of Centers ofTelecommunications Research and Enterprises (AHCIET) (San Salvador, 22-23 March) (http://www.ahciet.es).
Pires, José Claudio (1999), “Estratégias empresariais e regulação no setor de telcomunicacões brasileiro”, informeconsultor de la Economic Commission for Latin America and the Caribbean (ECLAC), November,unpublished.
Primo Braga, Carlos Alberto and Geoffrey Bannister (1994), “East Asian investment and trade: prospects for growingregionalization in the 1990s”, Transnational Corporations, vol. 3, No. 1, April.
Ramstetter, Eric D. (1997), “Export performance and foreign affiliate activity in Japan’s large machinery firms”,Transnational Corporations, vol. 6, No. 3 (UNCTAD/ITE/IIT/4), December.(1996), “Estimating economic activities by Japanese transnational corporations: how to make sense of thedata?”, Transnational Corporations, vol. 5, No. 2, August.(1994), “Comparisons of Japanese multinationals and other firms in Thailand’s non-oil manufacturingindustries”, ASEAN Economic Bulletin, vol. 11, No. 1, July.(1991), “United States direct investment in developing Asia and structural adjustment in United Statesmanufacturing industry”, Direct Foreign Investment in Asia’s Developing Economies and Structural Changein the Asia and Pacific Region, Eric D. Ramstetter (ed.), Boulder, Colorado, Westview Press.
Romero, Luis Alberto (2000), “La telefonía celular en la República Argentina”, Buenos Aires, National Commissionof Communications (http://www.AHCIET.net/inalambricos/IIFATICMS.asp).
Rozas, Hortencia (2000), “Obligaciones del operador establecido frente a la apertura del mercado”, document ofTelefónica Perú presented at the First Forum on Regulation of the Hispano-American Association of Centersof Telecommunications Research and Enterprises (AHCIET) (San Salvador, 22-23 March) (http://www.ahciet.es).
238 ECLAC
Rozas, Patricio (1992), Inversión extranjera y empresas transnacionales en la economía de Chile: 1974-1989; proyectosde inversión y estrategias de las empresas transnacionales, Estudios e informes de la CEPAL series, No. 85(LG/G.1677-P), Santiago, Chile, Economic Commission for Latin America and the Caribbean (ECLAC),August. United Nations publication, Sales No. S.92.II.G.7.
Rozenwurcel Guillermo (1999), “El nuevo marco regulatorio de las telecomunicaciones en la Argentina: ¿a favor o encontra del desarrollo de la competencia?”, Informe de coyuntura, year 9, No. 82, Buenos Aires, BuenosAires Research Centre, September-October.
Runkle, G. (2001), “Problems ring in Telecom industry”, Fool.com, 16 January.Sánchez, Fernándo, Georgina Ortiz and Nicole Moussa (1999), Panorama minero de América Latina a fines de los
años noventa, Recursos Naturales e infraestructura series, No. 1 (LC/L.1253-P), Santiago, Chile, EconomicCommission for Latin America and the Caribbean (ECLAC), September. United Nations publication, SalesNo. S.99.II.G.33.
Sazanami, Yoko (1996), “Globalization and regionalization: Japanese multinational enterprises in the Asia-Pacific”,Journal of Asian Economics, vol. 8, No. 1.(1995), “Japan’s Foreign Direct Investment and the Reconstruction of the International Division of Labor”,JETRO White Paper on FDI, Tokyo.(1991), “Report on results of FY1990 foreign direct investment survey”, EXIM Review, Tokyo, Export ImportBank, 1 November.
SBIF (Superintendencia de Bancos e Instituciones Financieras) (2000), Información financiera diciembre 1999,Santiago, Chile, March.
Shaiken, Harley and H. Brown (1991), “Japanese work organization in Mexico”, Manufacturing Across Borders andOceans: Japan, The United States and Mexico, Gabriel Székely (ed.), Monograph series, No. 36, San Diego,La Jolla, Center for US-Mexican Studies, University of California.
Silva, F. (1999), “La inversión en el sector agroindustrial chileno”, Reformas económicas series, No. 46 (LC/L.1291),Santiago, Chile, Economic Commission for Latin America and the Caribbean (ECLAC), November.
Solís, Mireya (2000), “Mexico and Japan: the Opportunities of Free Trade”, paper prepared for the Secretariat ofTrade and Industrial Promotion (SECOFI), April.
Srivastava, L. (2000), “Interconnexion Between Fixed and Mobile Networks”, document presented at the seminarMSU son Telecommunications in Europe, 18 July (http://www.itu.org).
Staple, G. (2000), “Negotiating Better Bandwidth Agreements: Legal and Regulatory Issues”, documento presentadoa un seminario de TeleGeography (Washington, D.C., 25 May) (http://www.telegeography.com).
Stumpo, Giovanni (1997), “Evolución, reestructuración y éxito exportador de la industria chilena de celulosa y papel”,Reestructuración industrial y apertura económica: la industria de celulosa y papel de Argentina, Brasil yChile en los años 90, Néstor Bercovich and Jorge Katz (eds.), Buenos Aires, Alianza Editorial, May.
Suárez, Fernando and Julio Vergara (1996), “La competitividad del vino chileno”, Competitividad: el gran desafío delas empresas chilenas, Raúl Fresno, Luis Hernán and Fernando Suárez (eds.), Santiago, Chile, Centre forPublic Studies (CEP).
SUBTEL (Subsecretaría de Telecomunicaciones) (2000), “Informe de estadísticas básicas del sector de lastelecomunicaciones en Chile”, Informe No. 1, Santiago, Chile, September.
Taddei Bringas, Cristina (1992), “Las maquiladoras japonesas: modelo de las maquiladoras posfordistas? Un análisisempírico”, Estudios sociales, vol. 3, No. 6, July-December.
Tejima, Shigeki (1995), “Future trends in Japanese foreign direct investment”, Transnational Corporations, vol. 4,No. 1, April.(1993), “Future prospects of Japanese foreign direct investment (FDI) in the 1990s, based on the trend andthe features of Japanese FDI in the 1980s”, EXIM Review, Export Import Bank, 1 November.(1992), “Japanese foreign direct investment in the 1980s and its prospects for the 1990s”, EXIM Review,Export Import Bank, 2 November.
Tejima, Shigeki and Hiroyuki Nakashima (1995), “The outlook of Japanese foreign direct investment in the 1990sbased on the EXIM Japan 1994 survey”, EXIM Review, Export Import Bank, 1 November.
Tejima, Shigeki and others (1994), “The recent trends of Japanese foreign direct investment (FDI) and prospects forJapanese FDI in the 1990s based on the Japan EXIM Bank’s Survey implemented in FY1993”, EXIM Review,Export Import Bank, 1 November.
Foreign investment in Latin America and the Caribbean, 2000 239
Telecom Italia (2000), 1999 Annual Report, Rome, March.Telecomunicaciones Online (2000), “GRPS: developing the 3G market”, April.Telefónica (2000), “La competencia en telecomunicaciones ante el nuevo milenio: ‘simetría o asimetría regulatoria’”,
document presented at the First Forum on Regulation of the Hispano-American Association of Centers ofTelecommunications Research and Enterprises (AHCIET) (San Salvador, 22-23 March) (http://www.ahciet.es).
Telefónica CTC Chile (2000), Informe anual 1999, Santiago, Chile.Telefónica de España (2000a), “Nota de prensa”, 17 August.
(2000b), “Nota de prensa”, 1 July.(2000c), Informe Anual 1999, Madrid, April.(2000d), “Nota de prensa”, 10 October.
TeleGeography, (2000) “Long distance carriers lose money as volumes rise”, 25 October.The Banker (2000), “Mexico’s new giant faces balancing act”, August.The Economist (2001), “Only fakirs need apply”, 1 February.
(2000a), “Telecoms in trouble”, 16 December.(2000b), “Battle of the airwaves”, 29 July.(2000c), “Killer applications”, 26 August.
The Nando Times (1996), “Baby Bells Agree to Biggest Telecomunications Merger Ever”, 22 April (http://www.nando.net).
The Wall Street Journal Americas (2000), “Las empresas Japonesas vuelven a realizar inversiones en el exterior”, 10 April.Thomson Finacial Securities Data (2000), electronic version.Thurow, Lester C. (1992), Head to Head: the Coming Economic Battle among Japan, Europe and America, New
York, William Morrow and Company.Total Telecom (2001a), “Caribbean States hit back at C&W”, 16 February.
(2001b), “Intel says teelcoms industry faces ‘bankrupcy’”, 23 February.(2001c), “Telecom Americas to buy stake in tess”, 13 February (http://ad.uk.doubleclick.net/adl/totaltele.com/).(2001d), “UMTS concerns for DT and BT”, 8 February.
Tsunekawa, Keiichi (1995), “Japanese investment in liberalizing Latin American economies: current pattern andpossible impacts of FTA initiatives”, Revista de economía política, vol. 15, No. 3, July-September.
Tsurumi, Yoshihiro (1976), The Japanese Are Coming, Cambridge, Masachusetts, Ballinger Publishing Company.UNCTAD (United Nations Conference on Trade and Development) (2000), World Investment Report 2000: Cross-
border Merger and Acquisitions and Development (UNCTAD/WIR/(2000)), New York. United Nationspublication, Sales No. E.00.II.D.20.(1999a), “Trends in International Investment Agreements: An Overview”, UNCTAD series on Issues inInternational Investment Agreements (UNCTAD/ITE/IIT/13), New York and Geneva. United Nationspublication, Sales No. E.99.II.D.23.(1999b), “Lessons from the MAI”, UNCTAD series on Issues in International Investment Agreements(UNCTAD/ITE/IIT/MISC.22), New York and Geneva. United Nations publication, Sales No. E.99.II.D.26.(1999c), World Investment Report, 1999: Foreign Direct Investment and the Challenge of Development(UNCTAD/WIR/1999), Geneva. United Nations publication, Sales No. E.99.II.D.3.(1994), World Investment Report, 1994: Transnational Corporations, Employment and the Workplace(UNCTAD/DTCI/10), Geneva. United Nations publication, Sales No. E.94.II.A.14.
UNCTC (United Nations Center on Transnational Corporations) (1990), “New approaches to best-practicemanufacturing: the role of transnational corporations and implications for developing countries”, UNCTCCurrent Studies, New York, October.
United Nations (1994), “Transnational Corporations and Technology Transfer in Export Processing Zones and ScienceParks”, New York, unpublished.
Urbiztondo, Santiago (1999), “Las telecomunicaciones en la Argentina: aspectos salientes de la experiencia recientey perspectivas futuras”, Informe de coyuntura, year 9, No. 82, Buenos Aires, Buenos Aires Research Centre,September- October.
US Office of Telecommunications Technologies (2001a), “Argentina: Telecommunications Market” (http://infoserv2.ita.doc.gov).(2001b), “Mexico: Telecommunications Market” (http://infoserv2.ita.doc.gov).
240 ECLAC
(2001c), “Brazil: Telecommunications Market” (http://www.infoserv2.ita.doc.gov).UWCC (Universal Wireless Communications Consortium) (2001), “The Competitive Advantages of TDMA” (http:/
/www.uwcc.com/).(2000), “UWCC-TDMA Marketplace Overview” (http://www.uwcc.com/).
Valente da Silva, Antonio Carlos (2000), “Régimen de licencias y administración de recursos escasos”, documentof the National Agency of Telecommunications (ANATEL) presented at the First Forum on Regulation ofthe Hispano-American Association of Centers of Telecommunications Research and Enterprises (AHCIET)(San Salvador, 22-23 March) (http://www.ahciet.es).
Vasconcellos, C. and D. Fonseca (2001), “El jinete sorpresa”, América economía, Santiago, Chile, 22 February.Vega, Francisca (1999), “Telefónica y su expansión en América Latina: ¡Mercados a la vista!”, El Mercurio, Santiago,
Chile, 27 November.Venegas, F. (2000), “Las telecomunicaciones en Chile: un sector que fomenta la inversión y el empleo”, document
presented at the First meeting of operators and users of telecommunications services: towards a globalizedsociety of the Hispano-American Association of Centers of Telecommunications Research and Enterprises(AHCIET) (Buenos Aires, 6-7 April).
Verizon (2001), Oficial Web site (http://www.verizon.com).Vicens, Lorenzo, Eddy M. Martínez and Michael Mortimore (1998), “La competitividad internacional de la industria
del vestuario de la República Dominicana”, Desarrollo productivo series, No. 45 (LC/G.1973), Santiago,Chile, Economic Commission for Latin America and the Caribbean (ECLAC), February.
Vodafone (2001), Oficial Web site (http://www.vodafone-airtouch-plc.com).(2000), “Vodafone AirTouch and Mannesmann, Building the World’s Leading Mobile Multimedia Operator”(http://www.vodafone-airtouch-plc.com).
Wallsten, S. (1999), “An Empirical Analysis of Competition, Privatization, and Regulation in TelecommunicationsMarkets in Africa and Latin America”, Washington, D.C., Policy Research Department, World Bank, June(http://www.worldbank.org/html/dec/Publications/Workpapers/wps2136).
WEF (World Economic Forum) (1995), The World Competitiveness Report, Geneva.Weinstein, David E. (1996), “Foreign Direct Investment and Keiretsu: Rethinking U.S. and Japanese Policy”, NBER
Working Paper series, No. 5612, June.Wernick, David (2000), “Monopolio imperturbable”, América economía, Santiago, Chile, 2 November.Wieland, K. (2000), “Who’s making money out of mobile data?”, Telecommunications, July.World Bank (2001), “WTO: The Impact of Telecoms Financing” (http://www.worldbank.org).
(2000), Global Development Finance 2000. Analysis and Summary Tables, vol. 1, Washington, D.C., April.(1998), “WTO: the Impact of Telecoms Financing” (http://www.worldbank.org).
WorldCom (2000), “Global Operations Overview” (http://www.wcom.com).Xavier, P. (2000a), “Commercial Value of International Benchmarking” (http://itu.org).
(2000b), “Pricing Strategies in the Context of Price Regulation” (http://itu.org).(2000c), “Pricing Principals and Practices in Competitive Circumstances” (http://itu.org).
Yamazawa, Ippei (1990), Economic Development and International Trade: The Japanese Model, East-West Center,Honolulu, Hawaii.
Yoshiro, Silvio and M. Miyazaki (1997), Foreign Direct Investment and Intra-firm Trade in East Asia by JapaneseMultinational Companies, Tokyo, Institute of Developing Economies (IDE), October.