Industrial districts, inward foreign investment and regional development
Upload
khangminh22Category
view
1download
0
Reliance Restricted
Section 2.2: Energy
National Strategy to
Increase Foreign Direct
Investment in Ukraine

Disclaimer
EY and USAID CEP owe no duty to the Recipient, whether in contract or
in tort or under statute or otherwise (including in negligence) in relation to
the Strategy, and the Recipient will not bring any actions, proceedings or
claims against EY and/or USAID CEP where such action, proceeding or
claim in any way relates to or concerns the use of, or reliance on, the
Strategy.
THE RECIPIENT AGREES THAT NEITHER EY NOR USAID CEP
SHALL HAVE ANY LIABILITY WHATSOEVER (INCLUDING, WITHOUT
LIMITATION, COMPENSATION OF LOSSES) TO THE RECIPIENT OR
ANY OF ITS REPRESENTATIVES, AFFILIATES, AGENTS, ETC.
RESULTING FROM THE RECIPIENT’S USE OF THE STRATEGY.
In these circumstances, the Recipient shall neither rely on the Strategy,
nor draw any conclusions or make any decisions solely on the basis of the
Strategy or claim that he/she has done so. The Recipient uses the
Strategy entirely at its own risk and no responsibility is taken or accepted
by EY and/or by USAID CEP for any losses which may result therefrom.
The Recipient cannot make any claims related to the quality of the
Strategy. We disclaim all responsibility for any consequence whatsoever
should any third party rely on the Strategy.
All quantitative data provided in this and other documents constituting the
entirety of the Strategy has been sourced from data available in public
domain or directly to EY, its subcontractors and EY global network of
firms, and has not been independently verified by EY, USAID CEP and/or
any of their affiliates.
This and other documents constituting the entirety of the Strategy were
prepared as of January 29, 2021. No further amendments to quantitative
data or recommendations therein were made after that date.
This National Strategy to Increase Foreign Direct Investment in Ukraine
became possible due to the support of the American People through the
United States Agency for International Development (USAID) under the
Competitive Economy Program in Ukraine.
The National Strategy to Increase Foreign Direct Investment in Ukraine
and its results do not necessarily reflect the views of the United States
Agency for International Development or the United States Government.
United States Agency for International Development (“USAID”)
Competitive Economy Program (“CEP”) through a contract with
Chemonics International engaged Ernst & Young LLC (“EY” or “we”) to
develop an actionable National Strategy (the “Strategy”) to Increase
Foreign Direct Investment in Ukraine (“Project”). USAID CEP leads the
Project and EY is the implementing partner of the Project.
The Strategy is being provided solely as a courtesy and without any
representation and warranty of any kind. If you’re reading the Strategy
(the “Recipient”), it means you do agree upon the caveats and disclaimers
relating to its use set out herein, otherwise you are not intended to review
the Strategy.
In view of the nature of the work performed under the Project, use of
professional judgment and the assessment of materiality for the purpose
of procedures and the Strategy means that matters may have existed that
would have been assessed differently by a third party. EY and USAID
CEP do not warrant or represent that the information herein is sufficient or
even appropriate for purposes of the Recipient.
The Strategy cannot in any way serve as a substitute for other enquiries
and procedures that the Recipient would (or should) otherwise undertake
for the purpose of satisfying itself.

National Strategy to Increase Foreign Direct Investment in Ukraine | Section 2.2: Energy | Page 3 of 88
Key terms and abbreviations (1/4)
Names and Companies
AGPU Association of Gas Producers of Ukraine
BP British Petroleum
CMU Cabinet of Ministers of Ukraine
EA SE “NNPC “Energoatom”
EBRD European Bank for Reconstruction and Development
EIB European Investment Bank
ENTSO-EEuropean Network of Transmission System Operators for
Electricity
EU European Union
GB Guaranteed buyer
GTSO Gas transmission system operator
IBRD The International Bank for Reconstruction and Development
IFI International financial institution
IMF International Monetary Fund
MEU Ministry of Energy of Ukraine
Naftogaz / NAK National Stock Company “Naftogaz of Ukraine”
NEURC National Energy and Utilities Regulation Commission
OECD Organisation for Economic Co-operation and Development
OPEC Organization of the Petroleum Exporting Countries
SSSU State Statistics Service of Ukraine
Ukrenergo National Energy Company “Ukrenergo”
World Bank, WB The World Bank Group
Periods
1H20XX, 2H20XX
Periods from January 1, 20XX to June 30, 20XX and from
July 1, 20XX to December 3, 20XX (unless stated otherwise)
1Q20XX, 3Q20XX
Periods from January 1, 20XX to April 31, 20XX or
September 30, 20XX (unless stated otherwise)
Power Plants types
BPP Biofuel power plant
CHPP Combined heat and power plant
HPP Hydro power plant
NPP Nuclear power plant
PSPP Pumped storage power plant
RES Renewable energy sources
SPP Solar power plant
TPP Thermal power plant
WPP Wind power plant
Nuclear power plants
KhNPP Khmelnytska nuclear power plant
RiNPP Rivnenska nuclear power plant
UuNPP Uzhnoukrainska nuclear power plant
ZaNPP Zaporizka nuclear power plant
Thermal power plants
BuTPP Burshtynska thermal power plant
DoTPP Dobrotvirska thermal power plant
KrTPP Kryvorizka thermal power plant
KuTPP Kurahivska thermal power plant
LaTPP Ladyzhynska thermal power plant
LuTPP Luhanska thermal power plant

National Strategy to Increase Foreign Direct Investment in Ukraine | Section 2.2: Energy | Page 4 of 88
Key terms and abbreviations (2/4)
MyTPP Myronivska thermal power plant
PdTPP Prydniprovska thermal power plant
SlTPP Sloviansk thermal power plant
StTPP Starobeshivska thermal power plant
TrTPP Trypilska thermal power plant
VuTPP Vuhlehirska thermal power plant
ZaTPP Zaporizka thermal power plant
ZmTPP Zmiivska thermal power plant
ZuTPP Zuivska thermal power plant
Combined heat and power plants
CHPP 5 Combined heat and power plant 5
CHPP-5 Combined heat and power plant - 5
CHPP-6 Combined heat and power plant - 6
Hydro and pumped storage power plants
DsHPP Dnistrovska hydro power plant
DsPSPP Dnistrovska pumped storage power plant
KaHPP Kanivska hydro power plant
KhHPP Kakhovska hydro power plant
KrHPP Kremenchutska hydro power plant
KyHPP-PSPP Kyivska HPP-PSPP
SdHPP Serednodniprovska hydro power plant
TshPSPP Tashlytska pumped storage power plant
Wind power plants
DE WPP “Drohobych Energy” wind power plant
OE WPP “Ovidiopol Energy” wind power plant
OvWPP Overianivska wind power plant
OV-2 WPP “Ovid-Wind 2” wind power plant
Pr-1 WPP “Prymorska-1” wind power plant
ThWPP Tylihulska wind power plant
VKT WPP “Wind Kraft Tavria” wind power plant
Solar power plants
IE SPP “Inhulets-Energo” solar power plant
KiSPP “Kilia” solar power plant
PE SPP “PodilskEnergo” solar power plant
TkSPP “Tokmak” solar power plant
VS SPP “Voskhod Solar” solar power plant
Countries
BY Republic of Belarus
CZ Czech Republic
DE Germany
FR France
HU Hungary
MD Republic of Moldova
PL Republic of Poland
RO Romania
RU Russian Federation
SK Slovak Republic
UAE United Arab Emirates
UK The United Kingdom of Great Britain and Northern Ireland
USA / US The United States of America

National Strategy to Increase Foreign Direct Investment in Ukraine | Section 2.2: Energy | Page 5 of 88
Key terms and abbreviations (3/4)
FDI Foreign direct investments
GDP Gross domestic product
GDP Gross domestic product
LIBOR London Interbank Offered Rate
LTI Long-term inflation
Other
ATO / JFO Anti-terrorist operation zone/Joint Forces operation
BEI Burshtyn energy island
BRP Balance Responsible Party
BSP Balancing Service Provider
DAM Day-ahead market
DER Distributed energy resources
DHC District heating and cooling
DSO Distribution System Operator
E&P Extraction and Production
EMIS Analytics agency
EUR Euro
GTS Gas transmission system
HHI Herfindahl-Hirschman Index
ICE Internal combustion engine
IDM Intra-day market
IPO Initial public offering
IPS Integrated power system (CIS)
JSC Joint stock company
JV Joint Venture
LLC Limited liability company
LNG Liquified natural gas
LPG Liquified petroleum gas
Units
°C Celsius
b Billions
bbl Barrel
cm cubic metres
gr Gram
GW, GWh Gigawatt, gigawatt-hour
ha Hectares
kcal/kg Kilocalorie per kilogram
km / km2 Kilometers / kilometers squared
kV Thousand volts
kW, kWh Kilowatt, kilowatt-hour
m / mln Millions
m2 / m3 Meter squared / meter cubic
mg/nm3 Milligram per nanogram cubic
Min Minute
mm Millimeter
MVA Mega volt-ampere
MW, MWh Megawatt, megawatt-hour
sec Second
t / tn Tons
ths / k Thousands
toe Tons of oil equivalent
TW, TWh Terawatt, terawatt-hour
Y years
Macroeconomics and Finance
CAGR Compound annual growth rate
CapEx Capital expenditures

National Strategy to Increase Foreign Direct Investment in Ukraine | Section 2.2: Energy | Page 6 of 88
Key terms and abbreviations (4/4)
M&A Mergers and Aqcuisitions
MMS Market Management System
N/A Not applicable
NES National Energy Strategy
NJSC National Joint Stock Company
P&U Power and Utility
PJSC Public Joint Stock Company
PrJSC Private Joint Stock Company
PSA Production Sharing Agreement
PSO Public service obligations
PU Power Unit
PVOUT Power output
R&D Research and development
RAB Regulatory asset base
RUB Russian ruble
SAIDI System Average Interruption Duration Index
SAIFI System Average Interruption Frequency Index
SE State Enterprise
SFEC Specific fuel equivalent consumption
SOE State owned enterprise
SoLR Supplier of Last Resort
TSO Transmission system operator
TUT Temporary uncontrolled territories
UAH Ukrainian hryvnia
UES Ukrainian Energy System
UGS Underground gas storage
UPS Uninterruptible power source
USD US dollar
WMP Wholesale market price

National Strategy to Increase Foreign Direct Investment in Ukraine | Section 2.2: Energy | Page 7 of 88
Section 2.2
Energy
National Strategy to Increase Foreign Direct Investment in Ukraine | Section 2.2: Energy | Page 8 of 88
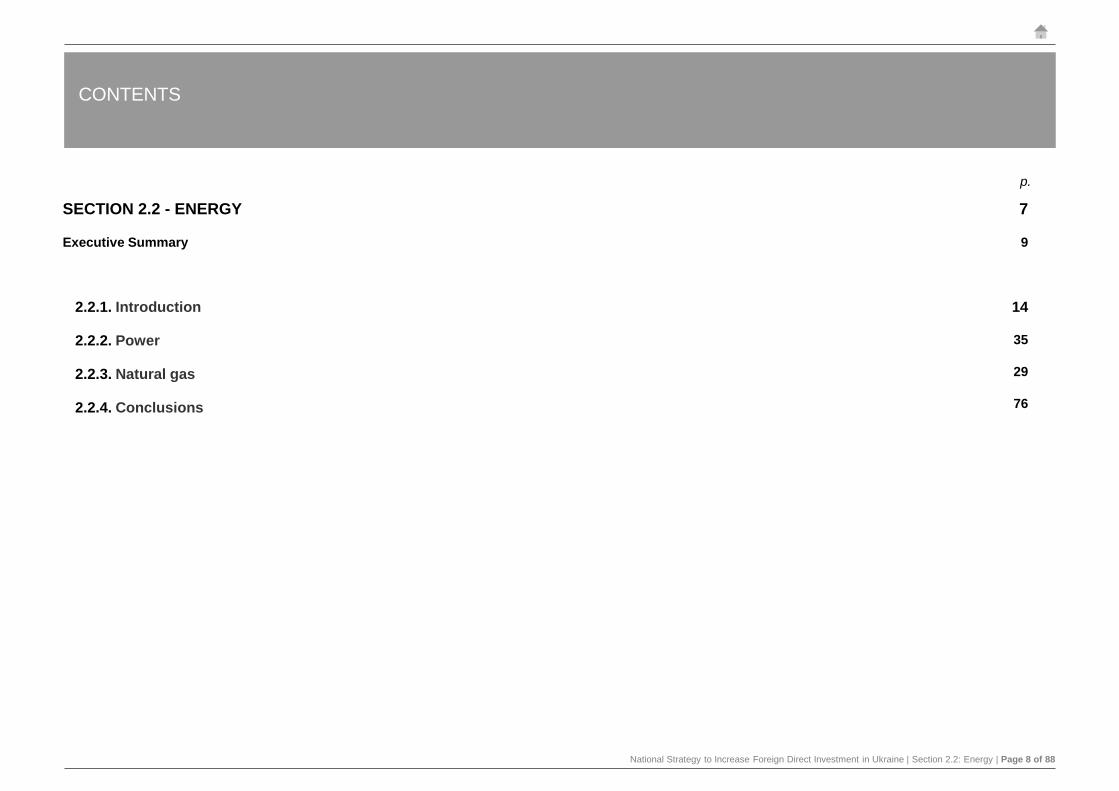
SECTION 2.2 - ENERGY
Executive Summary
2.2.1. Introduction
2.2.2. Power
2.2.3. Natural gas
2.2.4. Conclusions
CONTENTS
7
9
14
35
29
76
p.

National Strategy to Increase Foreign Direct Investment in Ukraine | Section 2.2: Energy | Page 9 of 88
Executive Summary

National Strategy to Increase Foreign Direct Investment in Ukraine | Section 2.2: Energy | Page 10 of 88
Executive Summary: Introduction
Energy is the lifeblood of an economy. As trivial and overused by
global media, as this statement is, it is an axiom: none of the
sectors of the economy, basic or cultured, run without energy – with
the exception of extreme wildlife tourism. Affordable energy
sources are essential for the development of internal
production and its viable competitiveness in foreign markets.
Moreover, the energy sector sufficiency and import independence
are crucial for national security; hence, continued investments are
critical for its going concern.
Global approach to energy, however, has been shifting dramatically
over the past decade, driven by two key factors: technological
progress unlocking the potential of diverse energy sources and a
global push for sustainability-driven by both material and
perceived effects of climate change on the global economy and
livelihood of the planet’s population.
By the end of 2020, in part due to COVID-19 shock therapy, several
key trends crystallized that we deem key to any analysis of the
sectoral potential. These are spread across the general sector
matrix we use in our analysis: coal, power (traditional generation,
renewables, transmission, distribution, retail), utilities (mainly district
heating), gas (extraction, transmission, distribution, processing,
storage, retail), oil (extraction, processing, transmission, retail).
Coal: As the world pursues the Paris Agreement target of 1.5°C rise
over the pre-industrial level, raising carbon price and changing
societal behavior, coal use is expected to inevitably decline as
an old-fashion and carbon intensive solution.
• Private initiatives against new plants: In 2020 General Electrics
and Net-Zero Asset Owner Alliance, incl. leading global insurers,
announced cease of new thermal coal plants supplying and
funding
• Growing competition: The decline in fossil energy consumption
entails greater competition among resource owners, increasing
the bargaining power of consumers
Oil: The drop in fuel consumption due to COVID-19, the ever-
growing share of electricity, biofuels and hydrogen used in
transport, phasing out fossil fuels, and new ICE technologies will
lead to the future reduction in global demand for oil.
• Demand reduction: Global demand for oil is steadily reducing,
primarily due to the increasing energy efficiency and
electrification of road transportation
• Innovations in transportation drive the market: The new energy
efficient ICE cars, development of electric robotaxi and
utilization of biofuels and hydrogen in aviation and marine
narrow the oil market
Natural gas: The global shift from fossil to renewable energy
sources leads to a gradual drop in natural gas use in the long
run, though its role of available and affordable low-carbon energy
source warrants steady natural gas demand in the mid-term
perspective.
• Role in decarbonization: The demand for gas is maintained by
its wide use within decarbonization initiatives, in conjunction
with carbon capture use and storage (CCUS) technology
• Growing LNG trade: Due to the carbon-to-gas shifting in the
course of economies decarbonization, the countries become
more dependent on the imported LNG

National Strategy to Increase Foreign Direct Investment in Ukraine | Section 2.2: Energy | Page 11 of 88
Executive Summary: Introduction
• Change in natural gas use among sectors: The projected
decrease in natural gas consumption in buildings is partially offset
by the gas used for power generation and blue hydrogen
production
Power: High carbon prices, falling costs of production, availability of
energy sources and stimulating national and regional policies
contribute to the robust growth in the renewable energy market,
restrained in the long run by growing balancing costs.
• Demand growth: Electricity consumption keeps growing across
all sectors due to road transport electrification and energy
efficiency measures in building and industry
• RES expansion: The need for reduction in the carbon intensity of
power generation leads to the rapid growth in renewable energy
use, primarily wind and solar power
• Need for balancing technologies: The intermittency of key RES
spawns the need for balancing solutions, i.e., HPPs, hydrogen,
gas with CCUS and bioenergy, to enable a steady supply
Utilities: New trends in energy consumption and societal behavior,
intense urbanization, new government programs and digital
technologies prompt the rapid global transformation of the
sector, disabling old solutions and revealing new niches
• Rise of DERs: Governmental policies, financial incentives and
customer demand drive the expansion of distributed energy
resources (e.g., rooftop solar panels, etc.)
• Decline of conventional technologies: Growing diversification of
energy sources spawns competition, requiring a rapid reduction
in losses and specific fuel consumption for conventional solutions
Within the framework of the overall FDI enhancement Strategy,
we consider the Ukrainian energy sector as a noticeably important
FDI target – the following pages will highlight niches and
directions we believe will carry the greatest mid-term potential for
investments, as well as explain why we see some of the
traditional sub-sectors long considered politically important
carrying lesser weight in the long-term and thus, less worthy of
FDI enhancement efforts.
However, much more importantly, we see it as that proverbial
lifeblood – the key economic enabler that in many instances
makes or breaks FDI potential of other sectors and the
investment destination attractiveness of Ukraine as a whole.
Hence, we deem it important to review and provide
recommendations regarding gaps and barriers beyond those that
are important for direct FDI into the sector.
Importantly, this analysis laser focuses on the mid-term success
of the sector both as an FDI target and as an economic enabler.
Hence, some of the longer-term trend niches, like the hydrogen
sub-sector, are not covered within this sectoral review – they are
included as part of the ‘Next 10 Big Ideas’ sub-section provided
later in the Strategy.
Ukraine’s energy sector is in many ways a remnant of the Soviet
critical infrastructure capabilities – and deficiencies. Coupled with
the country’s physical size and geographical positioning, this
means that the transformation and attractiveness of the sector are
not as easily achievable as with some of its geo-peers. Yet, the
potential is there; let’s see how strong a current runs through the
sector.

National Strategy to Increase Foreign Direct Investment in Ukraine | Section 2.2: Energy | Page 12 of 88
Executive Summary: Attractiveness Factors and Development Directions
Based on our analysis, we
identified the following
KEY FACTORS
influencing the potential
attractiveness of the power
subsector for investors
► elimination of PSO model for households in August
2020 and its expected cancellation for DHCs;
► unbundling of GTSO and its successful certification;
► introduction of electronic auctions for special permits;
► ongoing market development by GTSO and GSSO;
► improved market participants’ financial sustainability.
Promotion of PSA
mechanism armored by
government commitments
► implementation of new electricity market model;
► introduction of RAB-methodology for DSOs;
► upcoming full integration with ENTSO-e after 2025;
► expected elimination of PSO model for households;
► introduction of capacity auctions for maneuverable
capacity (gas peaking) and storages.
For power subsector: For natural gas subsector:
The energy sector in Ukraine
could be considered as an
attractive one for potential FDI.
We see the following
KEY DIRECTIONSConstruction of new maneuverable
capacity and storages underpinned
by transparent and competitive
capacity auctions
Privatization of the state-
owned DSOs accompanied
by the RAB-methodology
implementation
Commissioning of
biogas and biofuel
power plants
supported by the
justified feed-in tariff
Development of new
interconnectors as a
result of integration
with ENTSO-e
Privatization of PJSC
“Centrenergo”
reinforced by vertical
integration with state-
owned coal mines
IPO of NJSC “Naftogaz of
Ukraine” strengthened by the
expected full liberalization of
the natural gas market
Joint ventures for nuclear
power units construction

National Strategy to Increase Foreign Direct Investment in Ukraine | Section 2.2: Energy | Page 13 of 88
Executive Summary: Gaps, barriers and enablers
Based on our analysis, we
identified the following
KEY GAPS
limiting the potential
attractiveness of the power
subsector for investors
► ineffective PSO model for DHCs leads to a further
debt accumulation through the heat supply chain;
► unauthorized off-takes and unpaid imbalances
threaten the financial stability of the market;
► the low liquidity of the short-term market allows
market manipulations distorting price mechanism;
► inefficient permit procedure for subsoil use;
► inconsistency between currency and PSA regulations.
► unreasonable price caps for day-ahead and balancing
markets distort sustainable business model;
► defective design of PSO model for households blurs
price and investment signals for market players;
► cross-border trading restrictions (import bans and
dispatching charge for export) limit competition;
► ongoing debt accumulation aggravates the problems;
► inefficient RES support model disappoints investors.
For power subsector: For natural gas subsector:
Sectoral FDI
activators
Near-
shoring
FDI-
through-
trade
activation
Auxiliary
Sectors
Activation
Lean /
additive
production
Industrial
and tech
parks
Digitizing
infrastructure
and
services
Supply chain
optimization
solutions
Private
professional
education
Localization
incentives
Inbound
R&D
Incentives
Enabling
International
Technical
Agreements
Nevertheless, gaps and barriers
could be effectively mitigated,
underpinned by the following
KEY ENABLERS

National Strategy to Increase Foreign Direct Investment in Ukraine | Section 2.2: Energy | Page 14 of 88
2.2.1. Introduction

National Strategy to Increase Foreign Direct Investment in Ukraine | Section 2.2: Energy | Page 15 of 88
For sectoral analysis, we identified the following key subsectors for the
Ukrainian energy industry: power, utilities, energy coal, oil, natural gas
Energy
Coal
UtilitiesDistrict heating
Water supply
and sewage
Oil Extraction
Processing
Transmission
Retail
Gas
Extraction
Transmission
Distribution
Processing
Storage
Retail
PowerGeneration
Transmission
Distribution
Retail
Conventional
Renewables
Storage
Nuclear
Hydro
Thermal
Maneuverable
capacities
Solar
Wind
Biomass
Hydrogen
Utilities, oil, and coal subsectors are not covered in detail within the sectoral analysis as we do not see clear
FDI potential for them in Ukraine. Nevertheless, we provided an overview of the global trends for each
subsector and also explained our logic for its exclusion from the analysis.
Waste
management
2.2.1. Introduction

National Strategy to Increase Foreign Direct Investment in Ukraine | Section 2.2: Energy | Page 16 of 88
Global trends: Coal
4
As the world pursues the Paris Agreement target
of 1.5°C rise over the pre-industrial level, raising
carbon price and changing societal behavior,
coal use is expected to inevitably declineas an old-fashion and carbon intensive solution.
Share in consumption, EJ Key driver
CoalActual BP’s scenario
Business-as-usual
BP’s scenario
Rapid
BP’s scenario
Net Zero
Exxon
123
Growing competition
The decline in fossil energy consumption entails
greater competition among resource owners,
increasing the bargaining power of consumers
56
Actual BP’s scenario
Business-as-usual
BP’s scenarios
Rapid and Net Zero
Carbon price,
USD per t
Major consumers by 2050*
1. Regions with relatively higher % of source in projected energy consumption
Minimum consumption by 2050
Despite the decarbonization trend, the absolute coal
consumption is partially maintained by the growing
energy use, mainly in the quickly urbanizing regions
Private initiatives against new plants
In 2020 General Electrics and Net-Zero Asset Owner
Alliance, incl. leading global insurers announced cease
of new thermal coal plants supplying and fundingIndia
5-40%in energy use(per various BP’s
scenarios)
Asia is considered the key market
Though Asia, esp. China is expected to contribute
greatly to coal use reduction, it will remain the key
market in 2050, given the growing demand for energy
Impact of COVID-19
The effect of a global pandemic on coal consumption
stems from a general reduction in energy demand in
connection with a decrease in global GDP
Power and industry drive fall in coal use
Sill, upon the reduction in coal consumption during
the next 30 years, the remaining coal use is
projected to concentrate in the power sector and H2
production
Source: BP Energy Outlook by 2050, ExxonMobil Outlook for Energy by 2040, EY analysis
25%27% 25% 17% 22%
4%22%
2%
23% 20%
395
575617
725
606 625 611 625 643712
2000
2005
2010
2015
2018
2025
2030
2040
2050
2025
2030
2040
2050
2025
2030
2040
2050
2025
2030
2040
Coal Oil Natural gas NPP, HPP and RES
3.6 10.2 27
66
39
100
159
200
238 250
0.0 0.2 339
312
38
100
138 175
Developed economies Emerging economies
2.2.1. Introduction

National Strategy to Increase Foreign Direct Investment in Ukraine | Section 2.2: Energy | Page 17 of 88
Global trends: Oil
6
4
The drop in fuel consumption due to COVID-19,
the ever-growing share of electricity, biofuels and
hydrogen used in transport, phasing out fossil
fuels, and new ICE technologies will lead to the
future reduction in global demand for oil.
Share in consumption Key driver
Oil
123
5
Actual BP’s scenario
Business-as-usual
BP’s scenario
Rapid
BP’s scenario
Net Zero
Exxon Actual Exxon BP’s scenarios
BAU Rapid Net Zero
IEA’s scenarios
SG Net Zero
Share of non-fossil
fuel in transport
Growing competition
The US tight oil sector is expected to quickly revive
from COVID crisis and rule the market, though it
will be partially phased out by the OPEC in long-run
Developed countries lead in oil use fall
Major drop is expected in the OECD and China while
developing Asia and Africa with growing transportation
needs, and key oil suppliers keep the market
Innovations in transport drive the market
The new energy efficient ICE cars, development of
electric robotaxi and utilization of biofuels and
hydrogen in aviation and marine narrow the oil market
Demand reduction
Global demand for oil is steadily reducing, primarily
due to the increasing energy efficiency and
electrification of road transportation
Potential of non-combusted use of oil
The oil market is expected to gain a certain degree
of support from non-combusted use, primarily as a
feedstock in the petrochemicals sector
Major consumers by 2050*
1. Regions with relatively higher % of source in projected energy consumption
Share in consumption, EJ
Impact of COVID-19
Among all energy sources, oil is considered to
undergo the sufficient effect of the pandemic,
mainly due to reduction in transport use
Middle East
17-29%in energy use(per various BP’s
scenarios)
Source: BP Energy Outlook by 2050, ExxonMobil Outlook for Energy by 2040, IEA World Energy Outlook by 2030, EY analysis
39%33% 31%
24% 30%
14%
30%
7%
32% 30%
395
575617
725
606 625 611 625 643712
2000
2005
2010
2015
2018
2025
2030
2040
2050
2025
2030
2040
2050
2025
2030
2040
2050
2025
2030
2040
Coal Oil Natural gas NPP, HPP and RES
11%
33%42%
5% 5% 6%9%
17%
52%
73%
42%
58%
2018 2025 2030 2040 2050 2050 2050 2030 2030
Electricity Biofuels Hydrogen (applicable only for BP)
2.2.1. Introduction

National Strategy to Increase Foreign Direct Investment in Ukraine | Section 2.2: Energy | Page 18 of 88
Global trends: Natural gas
4
The global shift from fossil to renewable energy
sources leads to a gradual drop in natural gas
use in the long run, though its role of available
and affordable low-carbon energy source
warrants steady NG demand in the
medium term.
Share in consumption Key driver
Natural Gas
123
56
Actual BP’s scenario
Business-as-usual
BP’s scenario
Rapid
BP’s scenario
Net Zero
Exxon Actual BP’s scenario
Business-as-usual
BP’s scenario
Rapid
BP’s scenario
Net Zero
Natural gas use
Global competition
While the demand side is represented primarily by
the Asian market, the LNG supply is rather
diversified, including the US, Middle East, Russia
and Africa.
Change in NG use among sectors
The projected decrease in natural gas consumption
in buildings is partially offset by the gas used for
power generation and blue hydrogen production
Role in decarbonization
The demand for gas is maintained by its wide use
within decarbonization initiatives, in conjunction with
carbon capture use and storage (CCUS) technology
Major consumers by 2050*
1. Regions with relatively higher % of source in projected energy consumption
Share in consumption, EJ
Growing demand for other gases
The tightening of environmental requirements and
technological advancements entail the rise in demand
for biogas, biomethane and hydrogen
Key markets unchanged
Despite the reduced gas use, Russia and the Middle
East remain the key consumers, though Asia raises gas
consumption as the cheaper decarbonization option
Growing LNG trade
Due to the carbon-to-gas shifting in the course of
economies decarbonization, the countries become
more dependent on the imported LNGRussia
23-57%in energy use(per various BP’s
scenarios)
Source : BP Energy Outlook by 2050, ExxonMobil Outlook for Energy by 2040, EY analysis
22%
24% 25% 26% 25%
21%
24%
13%
25% 26%395
575617
725
606 625 611 625 643712
2000
2005
2010
2015
2018
2025
2030
2040
2050
2025
2030
2040
2050
2025
2030
2040
2050
2025
2030
2040
Coal Oil Natural gas NPP, HPP and RES
5462
68 72 72 6773
6553 59 53
20 20
411 10
28
2018 2025 2030 2040 2050 2025 2030 2040 2050 2025 2030 2040 2050
Power generation, EJ Hydrogen production, EJ
2.2.1. Introduction

National Strategy to Increase Foreign Direct Investment in Ukraine | Section 2.2: Energy | Page 19 of 88
Global trends: Power
4
High carbon prices, falling costs of production,
availability of energy sources and encouraging
national and regional policies contribute to the
robust growth in the renewable energy
market, restrained in the long run by growing
balancing cost.
Share in consumption Key driver
Power
123
56
Actual BP’s scenario
Business-as-usual
BP’s scenario
Rapid
BP’s scenario
Net Zero
Exxon
Need for balancing technologies
The intermittency of key RES spawns the need for
balancing solutions, i.e., HPPs, hydrogen, gas with
CCUS and bioenergy, to enable a steady supply
Electricity grids retard the growth
Emerging markets encounter disparity between the
spendings required for smart and flexible networks
and the revenues available to grid operators
Demand growth
Electricity consumption keeps growing across all
sectors due to road transport electrification and
energy efficiency measures in building and industry
RES expansion
The need for reduction in the carbon intensity of
power generation leads to the rapid growth in
renewable energy use, primarily wind and solar
power
Market localization
Electricity and hydrogen are more costly to transport
compared to hydrocarbons, which entails energy
markets being more localized
Improved access to electricity
Within the Sustainable Development initiative, the
UN promotes improved access to electricity
including, decentralized and off-grid power
generation
Major consumers by 2050*
1. Regions with relatively higher % of source in projected energy consumption
Share in consumption, EJ
WPP and SPP capacity
growth funding
Actual BP’s scenario
Business-as-usual
BP’s scenario
Rapid
BP’s scenario
Net Zero
EU
51-88%in energy use(per various BP’s
scenarios)
Source : BP Energy Outlook by 2050, ExxonMobil Outlook for Energy by 2040, EY analysis
14%
15% 19%33%
22%
60%
24%
78%
20%24%
395
575617
725
606 625 611 625 643712
2000
2005
2010
2015
2018
2025
2030
2040
2050
2025
2030
2040
2050
2025
2030
2040
2050
2025
2030
2040
Coal Oil Natural gas NPP, HPP and RES
137 168229 277 290 245
331
663
366 269
522
974
385282335 347 356 324
463 474
756
349
580
721
1,032
354
2018 2025 2030 2040 2050 2025 2030 2040 2050 2025 2030 2040 2050
Increase in capacity, GW Investments, USD b (5Y rolling averages)
2.2.1. Introduction

National Strategy to Increase Foreign Direct Investment in Ukraine | Section 2.2: Energy | Page 20 of 88
Global trends: Utilities
4
New trends in energy consumption and societal
behavior, intense urbanization, new government
programs and digital technologies prompt the
rapid global transformation of the sector,disabling old solutions and revealing new niches.
Share in consumption CAGR per resource for buildings
Utilities
123
56
Benefits of digitalization
Smart metering technologies and smart appliances,
e.g. boilers or heat pumps, will raise energy efficiency
and flexibility, addressing the load shift issue
Impact of COVID-19
Lockdown measures due to pandemic led to the drop
in consumption, especially by industry and commerce,
growth in bad debts and supply chain frictions
Rise of DERs
Governmental policies, financial incentives and
customer demand drive the expansion of distributed
energy resources (e.g., rooftop solar panels, etc.)
Growing investments in infrastructure
Funds are spent on the proliferation of DERs, esp.
those involving RES, and advanced metering
systems
New opportunities
The involvement of utilities in smart city programs
and the increasing need for electric vehicles
charging infrastructure shape new growth prospects
Energy use in buildings
Actual BP’s scenario
Business-as-usual
BP’s scenario
Rapid
BP’s scenario
Net Zero
Actual BP’s scenario
Business-as-usual
BP’s scenario
Rapid
BP’s scenario
Net Zero
Exxon
Decline of conventional technologies
Growing diversification of energy sources spawns
competition, requiring a rapid reduction in losses and
specific fuel consumption for conventional solutions
United States
Rapid digitalization makes cyber
security a key priority in P&U sector
China
800+ smart city programs driven by
the government modify P&U sector
EU
Utilities benefit from robust prices and
green and sustainability-linked funding
Source : BP Energy Outlook by 2050, ExxonMobil Outlook for Energy by 2040, EY analysis
169186
200220
234
183 189 188 179 183 188 190177
1.6%1.4% 1.4%
1.0%0.6%
1.1%
0.7%
0.0%
-0.5%
1.2%
0.5%
0.1%
-0.7%
2018 2025 2030 2040 2050 2025 2030 2040 2050 2025 2030 2040 2050
Energy consumption, EJ CAGR
0.0%
-0.2%
-0.5% -0.7%-0.7%
0.4%
0.1%
-0.5%
-0.9%
0.5%
-0.1% -0.2%-0.2% -0.2%
1.2%1.1%
0.8% 0.8%
2.1%
0.1%
0.3%
0.0%0.1%
-0.6%
1995-2018 2018-2050 2018-2050 2018-2050 2017-2040
Oil Natural gas Coal
Electricity Hydrogen Other
2.2.1. Introduction

National Strategy to Increase Foreign Direct Investment in Ukraine | Section 2.2: Energy | Page 21 of 88
Source: “Ukraineinvest”
Note: Unlocked FDI is already released in the Ukrainian economy. Declared FDI is still not
invested in the Ukrainian economy, but approved and declared.
Energy sector FDI has been predominantly focused on renewables, driven
mainly by feed-in-tariffs and increased interest from foreign investors
Unlocked FDI, 2015-2020
$1.9bDeclared FDI, 2015-2020
$4.9bSource: “Ukraineinvest”
$960 m $900 m
Wind energy Solar energytemporary uncontrolled territories
"The Nikopol solar power plant will become the largest
solar power generator in Ukraine and Europe. The joint
work of DTEK and CMEC will be an example of
cooperation for other Ukrainian and Chinese
companies.”
Mr. Zhang Chun Chairman of China
Machinery Engineering Corporation
“When the IMF prioritized renewable energy in
Ukraine, we recognized that the core competencies of
Canada created considerable investment
opportunities for us in Ukraine. We see strong
parallels between Ukraine’s current energy
independence efforts and the 1980s-2010s
hydrocarbons boom in Canada.”
Michael Yurkovich
TIU Canada CEO
Unlocked FDI from Brands, 2015-2020
New production
facilities
(solar and wind)
Jobs created since
2015
30 500
2.2.1. Introduction

National Strategy to Increase Foreign Direct Investment in Ukraine | Section 2.2: Energy | Page 22 of 88
The coal mining subsector is not considered as attractive for investments
due to high production costs, decreasing demand and environmental issues
2,068 2,160
2,727 2,727
3,135
4,258
1,0381,200
1,370
1,7302,000
2,2002,425 2,425 2,535
2,800
2015 2016 2017 2017 2018
Cost of production Coal price
CoalOld-fashioned technology
Need for significant
capital investment
Social tension in the
coal-mining sector
Total number of Ukrainian coal minesReasons for omitting subsector analysis
148102 – state-owned 46 – private
67 Located on the
temporary
uncontrolled
territory
33 Operating
coal mines 2 Non operating
coal mines
Dynamics of energy coal production by
private and state-owned mines, mln t
Source: Ministry of Energy
Dynamics of coal production costs and coal
price for state-owned mines, UAH/t
2015 2016 2017 2018 2019
Source: Ministry of Energy
Subsidies for the coal industry, UAH m
400
1,120
1,729
1,400
- -
1,094
306
568
2,630
3,563
- - -
753 660 660
2015 2016 2017 2018 2019 2020
Governmental support of coal mining and partial coverage of expenses
Coal industry restructuring
Liquidation of unprofitable coal enterprises
Source: state budget
As the coal production of state-owned mines has been decreasing, the gap between market price and production costs is widening. The government is forced to spend additional budget resources to smooth the social tension.
4.8 4.2 3.9 3.6 2.7
26.6 28.324.2 23.9
22.2
31.4 32.5
28.127.5
24.9
2015 2016 2017 2018 2019
Private mines State-owned mines
2.2.1. Introduction
National Strategy to Increase Foreign Direct Investment in Ukraine | Section 2.2: Energy | Page 23 of 88
2.1 3.64.3 5.0
51.878.4
14.8
568.1
Ukraine Romania Italy Denmark UK Norway Other Europe Russian Federation
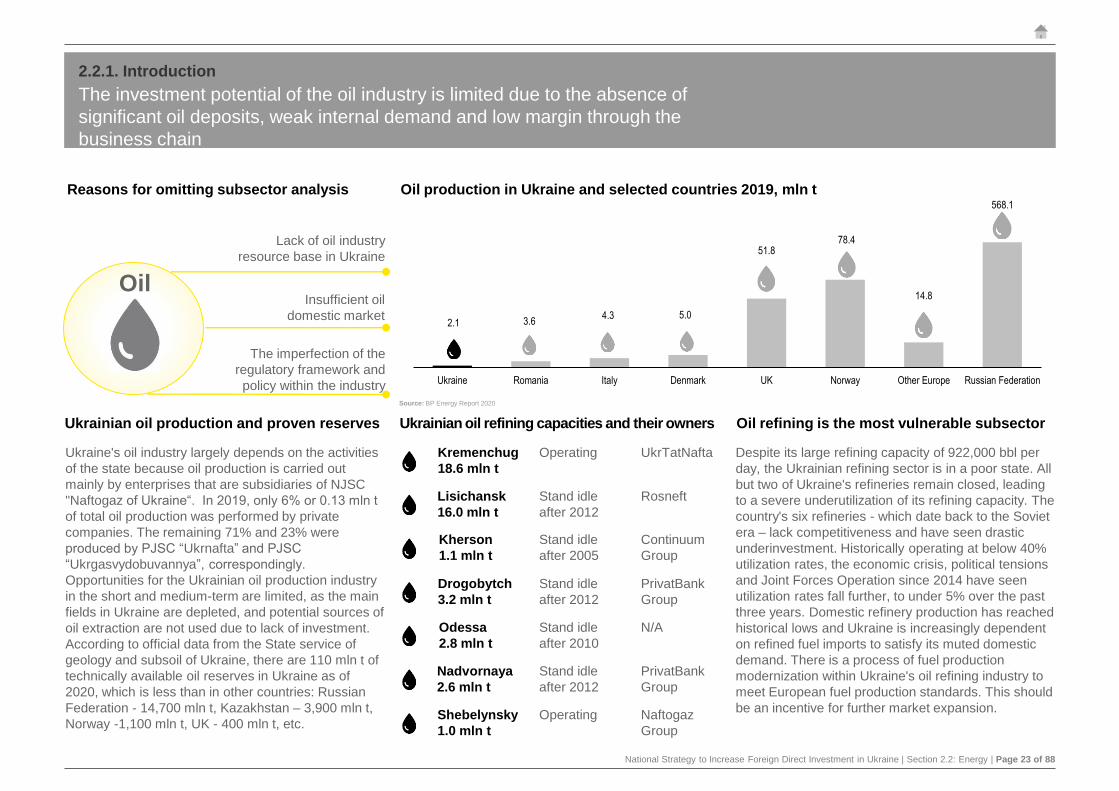
The investment potential of the oil industry is limited due to the absence of
significant oil deposits, weak internal demand and low margin through the
business chain
Reasons for omitting subsector analysis
OilInsufficient oil
domestic market
Lack of oil industry
resource base in Ukraine
The imperfection of the
regulatory framework and
policy within the industry
Oil production in Ukraine and selected countries 2019, mln t
Ukrainian oil production and proven reserves
Ukraine's oil industry largely depends on the activities
of the state because oil production is carried out
mainly by enterprises that are subsidiaries of NJSC
"Naftogaz of Ukraine“. In 2019, only 6% or 0.13 mln t
of total oil production was performed by private
companies. The remaining 71% and 23% were
produced by PJSC “Ukrnafta” and PJSC
“Ukrgasvydobuvannya”, correspondingly.
Opportunities for the Ukrainian oil production industry
in the short and medium-term are limited, as the main
fields in Ukraine are depleted, and potential sources of
oil extraction are not used due to lack of investment.
According to official data from the State service of
geology and subsoil of Ukraine, there are 110 mln t of
technically available oil reserves in Ukraine as of
2020, which is less than in other countries: Russian
Federation - 14,700 mln t, Kazakhstan – 3,900 mln t,
Norway -1,100 mln t, UK - 400 mln t, etc.
Ukrainian oil refining capacities and their owners
Source: BP Energy Report 2020
Lisichansk
16.0 mln t
Oil refining is the most vulnerable subsector
Kremenchug
18.6 mln t
Despite its large refining capacity of 922,000 bbl per
day, the Ukrainian refining sector is in a poor state. All
but two of Ukraine's refineries remain closed, leading
to a severe underutilization of its refining capacity. The
country's six refineries - which date back to the Soviet
era – lack competitiveness and have seen drastic
underinvestment. Historically operating at below 40%
utilization rates, the economic crisis, political tensions
and Joint Forces Operation since 2014 have seen
utilization rates fall further, to under 5% over the past
three years. Domestic refinery production has reached
historical lows and Ukraine is increasingly dependent
on refined fuel imports to satisfy its muted domestic
demand. There is a process of fuel production
modernization within Ukraine's oil refining industry to
meet European fuel production standards. This should
be an incentive for further market expansion.
Operating UkrTatNafta
Stand idle
after 2012
Rosneft
Kherson
1.1 mln t
Stand idle
after 2005
Continuum
Group
Drogobytch
3.2 mln t
Stand idle
after 2012
PrivatBank
Group
Odessa
2.8 mln t
Stand idle
after 2010
N/A
Nadvornaya
2.6 mln t
Stand idle
after 2012
PrivatBank
Group
Shebelynsky
1.0 mln t
Operating Naftogaz
Group
2.2.1. Introduction

National Strategy to Increase Foreign Direct Investment in Ukraine | Section 2.2: Energy | Page 24 of 88
The absence of investment stimulus, dependence from local authorities and
regulation gaps discourages investors from entering the utilities subsector
Utilities
Reasons for omitting subsector analysis
Lack of investment
incentives
The imperfection of the
regulatory framework and
policy within the subsector
District heating is divided into 3 separate activities, i.e.,
heat production by heating plants and cogeneration
(CHPs, TPPs, NPPs and cogeneration units),
transportation comprising heating transmission and
distribution networks with heat points and heat supply.
According to Law 1682-III, “On Natural Monopolies,”
heat transportation services refer to the natural
monopolists’ scope of operations, while production
and supply services are considered adjacent markets.
Both categories are subject to state regulation that is
performed by NEURC and by local authorities. The
key goal of NEURC’s tariff regulation is to enable
DHCs to function under self-financing.
As of 31 July 2020, 108 entities in Ukraine have valid
NEURC licenses. Among them, 27 DHCs engage in
heat generation, transportation and supply, 7 – in heat
transportation and supply, 2 – only in heat supply and
72 – solely in cogeneration. The entities include state-
owned, municipal, public, limited liability companies.
21 thousands of boilers
21thousands km of heat networks
44.5% of boilers
that are used
over 30 years
needs
reconstruction
83.9% of heat
networks that are
used over 25 years
needs reconstruction
According to the NEURC’s estimates, one of the key
issues in district heating in Ukraine is the high degree
of physical depreciation. Meanwhile, the reduction in
heat output entails a decrease in funding compared to
the amounts envisaged in investment programs. In
2019, actual funding by depreciation and investments
in profit was 22% and 32% lower, respectively, than
the planned one. Apart from investment programs,
reconstruction projects are funded by external
resources provided by the international financial
institutions, including the World Bank, EBRD and
NEFCO. Currently, these institutions provide funding
for seven projects involving eight NEURC licensees in
the amount of USD 147.2 m and EUR 56.7 m. Interest
payments, as well as other expenses related to IFIs’
funding, are included in the tariff structure as financial
expenses. The projects typically include the
reconstruction of boilers and heat networks, as well as
the installation of individual heat points and biofuel
boilers. In 2019, the share of IFIs in total DHCs’
equipment reconstruction funding amounted to 64.6%.
Dependence on
local authorities
7.4bcm of gas consumption by DHCs in 2019
DHC consumption for
households' need
equals to 4.6 bcm, for
needs of industrial
clients - 2.8 bcm
Weaknesses of the Ukrainian DHCs
Tariffs level adequacy
Insufficient level of payments from consumers
Potentially required support from local authorities
The key driver of tariffs for heat is the price for natural gas, given the share of gas, cost amounts to about 80% in tariffs. The growth in gas price may potentially lead to the excess of DHCs’ costs over the tariffs assigned that entails losses for DHCs.
DHCs face the problem of insufficient level of payments from
consumers, in particular from the households, which resulted in a
low percentage of payments for natural gas consumed by DHCs.
In 2019, the subsidies from the local budget were reduced to zero.
However, some DHCs are still accumulating losses due to the low
level of collections, thus some support may still be required.
2.2.1. Introduction

National Strategy to Increase Foreign Direct Investment in Ukraine | Section 2.2: Energy | Page 25 of 88
2.2.2. Power

National Strategy to Increase Foreign Direct Investment in Ukraine | Section 2.2: Energy | Page 26 of 88
Within the operational flow of the power subsector, the analysis was
focused on the electricity generation, transmission, distribution and
consumption (retail)
Natural gas
exploration
and
production
Mining of
uranium,
resins
Coal
mining
Primary
enrichment
TPP-CHPP
Biomass
NPP
Solar Wind
Hydro
There are three primary energy sources that
could be used for power generation: mining of
uranium for NPPs, mining of coal for TPPs,
exploration and production of natural gas for
CHPs and CCGTs. Additionally, lithium can be
mined and used for battery production.
Gas coal should be enriched at processing plant
to be used in power generation. Anthracite could
be delivered directly to the power plant. Natural
gas is also used at coal TPPs as a backlight.
Raw materials production
and primary enrichment
Electricity generation is a conversion of sources of
energy such as coal, natural gas, oil, nuclear
power, and so on to electricity. Electricity
generated through renewable energy sources
such as hydro, wind, solar, biomass and biogas is
called “green.” At the same time, electricity
produced at NPPs and CCGTs could also be
called “green” as their emissions almost zero.
Another important and quite new type - storages
and maneuverable capacity is rapidly evolving.
Electricity generation
The electricity that power plants generate is
delivered to consumers over transmission and
distribution power lines (high voltage transmission
minimizes the number of power losses as
electricity flows from one location to the next).
This complex system is called the “grid” and
includes substations, transformers, and power
lines that connect electricity producers and
consumers. DSOs purchase electricity by a
regional transmission reliability organization.
Transmission, distribution and
consumption of electricity
Ukrenergo
TSO Oblenergo
DSOs
IndustryHouseholds
Infrastructure
Other
consumers
AgricultureStorage
2.2.2. Power

National Strategy to Increase Foreign Direct Investment in Ukraine | Section 2.2: Energy | Page 27 of 88
Current legislative framework and legislative initiatives (1/2)
Association Agreement between the European Union and Ukraine
► Provides that Parties should not adopt or maintain a measure resulting in a higher price for
exports of energy goods to the other Party than the price charged for such goods when intended
for domestic consumption
► Customs duties and quantitative restrictions on the import and export of energy goods and all
measures having equivalent effect are prohibited between the Parties
► Sets priority on the integration of energy systems
Energy Community Treaty
► Under the Treaty, Ukraine undertakes to follow the missions of the
Community:
► Establishment of a stable regulatory and market framework
capable of attracting investment in power generation and
networks
► Creation of an integrated energy market allowing for cross-
border energy trade and integration with the EU market
► Enhancing the security of supply to ensure stable and
continuous energy supply
► Improvement of the environmental situation in relation to
energy supply, renewable energy, and energy efficiency
Energy Charter Treaty
Law of Ukraine "On Electricity Market"
► Establishes the regulatory framework for the electricity market
and its governing authority - the National Energy and Utilities
Regulatory Commission of Ukraine (NEURC)
► Says which infrastructural objects can be owned privately by the
companies and/or individuals and which ones are exclusively in
the public ownership. For instance, the power production and
DSOs can be privately owned, whereas the transmission grid is
entirely state-owned. Concession and privatization of the
transmission grid is prohibited
► Introduces a mechanism of state support to incentivize
construction of generation capacity under the tender procedure
Law of Ukraine "On Alternative Energy Sources"
Introduces the feed-in tariff as a policy incentive for the renewable energy producers, providing the
higher rate for purchasing the “green” energy by a designated state-owned enterprise
Market Rules, approved by Resolution of the NEURC No. 307 dated 14
March 2018 Determines the procedure for registration of market participants, resolution of disputes between
market participants and other parties, and balancing the forecasted and actual energy outputs as
well as the procedure for ensuring the proper discharge of obligations under the agreements on the
settlement of electricity imbalances
Regulation on Tender Procedure for the Distribution of Support Quotas,
approved by Resolution of the CMU No. 1175 dated 27 December 2019
Supplements the Law of Ukraine "On Alternative Energy Sources" by specifying the mechanism
for operation of “green capacity auctions” and the bidding procedure where the new renewable
energy producers can compete for the state support in the form of the support quotas (higher feed-
in tariff)
Transmission System Code, approved by Resolution of the NEURC No. 309
dated 14 March 2018
Governs the relationships between the TSO and other market participants and establishes the
procedure for equal access to the transmission grid for all market players. TSO should carry out its
business impartially and competitively
Distribution Systems Code, approved by Resolution of the NEURC No. 310
dated 14 March 2018
► Governs relationships between the distribution system operators and other market players
► Establishes the procedure for granting access to the distribution grid
► Sets out the general rules on the operation of the distribution grid
Provides a multilateral framework for energy cooperation. It is designed to promote energy security
through the operation of more open and competitive energy markets while respecting the principles of
sustainable development and sovereignty over energy resources.
Has rules and mechanisms covering:
► Protection of foreign investments, based on the extension of national treatment or most-favored
national treatment (whichever is more favorable) and protection against key non-commercial risks
► Non-discriminatory conditions for trade in energy materials, products, and energy-related
equipment based on WTO rules and provisions to ensure reliable cross-border energy transit flows
through pipelines, grids, and other means of transportation
► Resolution of disputes between participating states, and - in the case of investments - between
investors and host states
► Promotion of energy efficiency and attempts to minimize the environmental impact of energy
production and use
2.2.2. Power

National Strategy to Increase Foreign Direct Investment in Ukraine | Section 2.2: Energy | Page 28 of 88
Current legislative framework and legislative initiatives (2/2)
Regulation on the Imposition of Special Responsibilities
on Participants of the Electricity Market to Ensure the
Public Interest in the Operation of the Electricity Market,
approved by Resolution of the CMU No. 483 dated 5 June
2019
Sets state-regulated tariffs on electricity for household consumers in
the form of PSO for major state-owned power producers, state-owned
TSO and suppliers
Regulation on Tender Procedure for the Construction of Generation Capacity and
Implementation of Demand Management Measures, approved by Resolution of the
CMU No. 677 dated 10 July 2019
Sets out a tender procedure for granting governmental support for the construction of generation
capacity to cover the demand for electricity in a certain area
Rules of the Electricity Retail Market, approved by Regulation of the NEURC No.
312 dated 14 March 2018
Govern relationships between the market participants and consumers, provide the relevant sample
contracts for these arrangements
Regulations Governing the Activity of the Guaranteed Buyer and Purchase of
Electricity at the “Feed-in" Tariff and at the Auction Price, approved by Resolution
of the NEURC No. 641 dated 26 April 2019
► Establishes the contractual procedure, terms and conditions for trading in the “green” energy at
a feed-in tariff
► Standardizes power purchase agreement (PPA) in respect to the “green” energy and sets forth
the auction rules
Amendments to the Procedure on Determining the Regulatory Asset Base of the
Natural Monopolies in the Electricity Sector, approved by Resolution of the NEURC
No. 1607 dated 26 August 2020
► Establish a higher tariff (regulatory asset base (RAB) tariff) for the operators of the distribution
grid to encourage investment in renovation and renewal of such grids
► Set out a tariff rate of 16.74% of the assets value of the electricity distribution facilities under
construction
► Set out a tariff rate of 3% of the assets value of the existing electricity distribution facilities
Procedure on the Introduction of Tariffs on the Electricity Distribution Services,
approved by Resolution of the NEURC No. 1175 dated 5 October 2018
Specifies how tariffs for the electricity distribution services, including RAB tariffs, can be established
Energy Strategy of Ukraine for the Period up to 2035 "Security, Energy Efficiency,
Competitiveness" :
► Provides for liberalization of the energy market and reduction of government-run monopolies.
Transparency, alignment with the EU legal framework and enhancement of regulatory mechanisms
are seen as key preconditions for attracting investments
► Provides for implementation of a reliable and predictable renewable energy policy
► Aims to introduce a mechanism to attract the investments in the state program on replacement of
obsolete facilities with new infrastructure, especially in respect of large combustion plants
► Further stresses the need to develop the RES sector and attract new businesses in RES
► Envisages the development of “Smart Grids" energy network
► Establishes the policy priorities to encourage the development of innovative technological parks in
the energy sector
Legislative initiatives:
► Establishment of energy storage regulation. Draft Law No. 2582 sets out general rules relating
to the energy storage technology and its operators, allowing its use in the balancing of the state
energy market. It has not been adopted in the first reading yet. The review of the Draft Law has
pointed out several deficiencies, particularly inconsistency with the EU Directive 2019/944 on
common rules for the internal market for electricity
► Unbundling of TSO in accordance with ISO model of EU Directive 2009/72/EC is proposed by
the Draft Laws No. 3267 and No. 3364-1. This will create preconditions for acquiring a full
membership in ENTSO-e, accessing the joint financing mechanisms, adopting the joint mechanism
for compensation of costs from the cross-border transmission of electricity to the requirements of
EU Regulation 838/2010, and for performing the international obligations of Ukraine, in particular,
those relating to the TSO certification
► Shortening of terms of the tender procedure for generation capacity construction (from 6 to 3
months on publication of tender condition) is envisaged by Draft Law No. 3657
► Draft Law of Ukraine “On Amendments to Certain Legislation of Ukraine Regarding the
Improvement of the Procedure for the Use of Land Plots under Energy Facilities” simplifies access
to electricity facilities by reducing the timeframes for allocation of the land plots under such facilities
and granting land easements. The Draft Law has been made available on the MEU’s web site for
public discussion since 29 September 2020
► Ban on purchase of electricity from Russia is proposed by the Draft Law No. 3262-1
2.2.2. Power

National Strategy to Increase Foreign Direct Investment in Ukraine | Section 2.2: Energy | Page 29 of 88
The national power system is one of the largest in Europe, but is still
technically integrated with former USSR countries, which limits its potential
Installed generation capacity, 2019
52.8GWCross-border capacity, 2019
5.5GWGeneration output, 2019
154.0TWhSource: NEC “Ukrenergo”
The Ukrainian Energy System (UES) is integrated with IPS/UPS (Russia, Moldova, Belarus) but the part of the system (so-called “Burshtynska TPP Island”) is functioning
in parallel with ENTSO-E, which allows to export/import electricity to/from the EU (Hungary, Romania, Slovakia). According to Ukrainian Energy Strategy 2035, the
integration with ENTSO-E is expected in 2025. The majority of electricity companies (TPPs and DSOs – oblenergo’s) were privatized during 2010-2013. NPPs, HPPs and
some DSOs and TPPs are state-owned. NEC “Ukrenergo” is a transmission system operator responsible for dispatching and cross-border flows of electricity.
Electricity industry is regulated by two main authorities: Ministry of Energy and Environmental Protection of Ukraine (MEU, develops energy policy, including strategy,
main laws, and also conducts the supervision of state-owned energy enterprises) and National Energy and Utilities Regulation Commission (NEURC, the Regulator
implements energy policy, develops secondary legislation, monitors the activity of natural monopolies, approves investment programs and sets tariffs). The Energy and
Utilities Committee of the Parliament plays an active role as well (considers draft laws which must be approved by the Parliament and makes necessary amendments).
RU
RU
RU
BYBY
PL
SK
HU
RO
MD
MD
DoTPP
510MW
RiNPP
2,835MW
DE WPP
50MWBuTPP
2,351MW
KhNPP
2,000MW
KiSPP
50MW
OE WPP
120MW
OV-2 WPP
51MW
DsHPP
702MW
DsPSPP
972MW
PE SPP
50MW
LaTPP
1,800MW
ThWPP
500MW
VS SPP
60MW
TshPSPP
302MWUuNPP
3,000MW
IE SPP
55MW
KyHPP-PSPP
675.5MWCHPP-6
500MWCHPP-5
700MW
TrTPP
1,825MW
KaHPP
482.5MWKrHPP
636.2MW
CHPP 5
470MW
ZmTPP
2,275MW
PdTPP
910MW
SdHPP
388MW
SITPP
880MW
VuTPP
3,600MW
MyTPP
275MW
KuTPP
1,532MW
ZaNPP
6,000MW
TkSPP
50MW
KrTPP
2,079MW
KhHPP
334.8MW
VKT WPP
69.3MWOvWPP
300MW
Pr-1 WPP
100MW
1
23
4 5Nuclear power plant
Thermal power plant/Combined Heat and Power Plant
Hydro power plant/Pumped storage power plant
Wind power plant*
Solar power plant*
Cross-border line
“Burshtynska TPP Island”
temporary uncontrolled territories
ZaTPP 2,850MW1
DnHPP2 925MW2
DnHPP1 627MW3
UKU I WPP 500MW4
BtWPP 200MW5
*power plants with installed capacity more than 50MW
2.2.2. Power

National Strategy to Increase Foreign Direct Investment in Ukraine | Section 2.2: Energy | Page 30 of 88
Despite the decrease of consumption of recent years, stable growth is
expected, underpinned by electrification, EV and appliances penetration
Consumption Generation
2014
2015
2016
2017
2018
2019
2035
182
158
155
155
159
154
195
122
120
119
118
119
135
NPP
TPP
CHPP
HPP
RES
Industries and Construction
Households
Public utility
Transport
Other non-industrial
Agriculture
Source: NPC “Ukrenergo”, EY analysis and calculations
Generation and consumption of electricity in Ukraine, TWh
153
The sharp decrease in a generation (from 181.9 TWh in 2014 to 157.7 TWh in
2015) was caused by a drop in consumption due to armed conflict in the Donbas
region (Crimea annexation mainly influenced data for 2013-2014, there was
another drop in generation up to 11.6 TWh for that period). Moreover, in 2014 and
2015, NPC “Ukrenergo” technically was limiting consumption during peak periods
as the lack of coal led to a generation capacity deficit. Nevertheless, a generation
has stabilized since 2016 and NPC “Ukrenergo” expects it will reach 195 TWh in
2035 (+26.6% compared to 2019, CAGR 1.5%, according to NPC “Ukrenergo”).
The significant increase in generation in 2035 is explained by the increasing
demand for conditioning due to global climate change, the development of the agro-
industrial sector and armament industry, transport electrification, the realization of
infrastructure projects, implementation of robot-assisted automation.
The decline in consumption was driven by conflict in the Donbas region. The
Ukrainian economy has lost large industrial enterprises, which were stopped or
were left on the temporarily uncontrolled territory. Difficult economic situation and
an increase in electricity prices both for industrial consumers and households have
placed additional pressure on the level of consumption. Nevertheless, consumption
has stabilized since 2016 at the level of ~118-122 TWh and is going to reach 153
TWh in 2035 (+27.5% compared to 2019, CAGR 1.5% according to the target
scenario of NEC “Ukrenergo”). The main share belonged to industrial consumers,
43.4% in 2019. The share of households was equal to 29.3% in 2019. Warm winter
resulted in a moderate decline in electricity consumption in 2019. Consumption
drivers till 2035 would be the following: the increasing penetration of electrical
appliances, the increasing energy efficiency, and the electrification of the economy.
CAGR 2035-2019: 1.5% CAGR 2035-2019: 1.5%
9.7 10.2 10.9 11.0 10.6 10.1 9.1 8.9 8.9 9.4 9.3 8.9
Oct-19 Nov-19 Dec-19 Jan-20 Feb-20 Mar-20 Apr-20 May-20 Jun-20 Jul-20 Aug-20 Sep-20
12.2 13.0 14.1 14.0 13.1 12.8 11.0 10.6 10.5
8.5 11.1 11.0
Oct-19 Nov-19 Dec-19 Jan-20 Feb-20 Mar-20 Apr-20 May-20 Jun-20 Jul-20 Aug-20 Sep-20
2.2.2. Power

National Strategy to Increase Foreign Direct Investment in Ukraine | Section 2.2: Energy | Page 31 of 88
Growth of trading operations could be achieved, especially with Europe
considering interconnectors and installed generation capacity surplus
Slovak Republic
Capacity: 400 MW
Max flow: 3,504 GWh
Belarus
Capacity :900 MW
Max flow: 7,884 GWh
Russia
Capacity: 3,000 MW
Max flow: 26,280 GWh
Moldova
Capacity: 700 MW
Max flow: 6,132 GWh
Romania
Capacity: 400 MW
Max flow: 3,504 GWh
Total net export (TWh) and technical indicators for interconnectors
Source: Ukrenergo
2019
2018
2017
2016
2015
2014
4.56.1
5.1
3.9
1.3
7.9
4,235 3,553 3,056 3,138 3,8003,026
686
957 895
1,4101,410
7311,134
956956
2,401
(178)(2,296)
-430-507
2014 2015 2016 2017 2018 2019
EU Imp.
Belarus Imp.
Russia Imp.
Belarus Exp.
Russia Exp.
Moldova Exp.
Poland Exp.
EU Exp.
Source: Ukrenergo
Export and import of electricity, breakdown by countries, GWh
Companies are able to supply electricity to all neighboring countries. For such
purposes, they need to buy the right to use cross-border capacity from TSO. The
supply to Poland is carried out directly from DoTPP. The supply to ENTSO-e (HU,
RO, SK) is ensured mainly by BuTPP. The available capacity of mentioned TPPs
has a direct impact on the ability of companies to export electricity. Cross-border
capacity is allocated by TSO during yearly, monthly and daily electronic auctions.
According to Ukrainian Energy Strategy, till 2035, UES should be integrated into
ENTSO-e not later than 2025 (connections with IPS/UPS will be terminated).
Export to Moldova and Belarus became unprofitable in 2015 as the government
decided to include subsidies in the price of electricity sold by SOE “Energorynok” to
exporters. As a result, the price rose by 30% and Ukrainian companies were
replaced by Russian suppliers. Export to Moldova was renewed in April 2017.
The main EU export direction is Hungary – prices there are higher than in Romania
and Slovakia. The volume of export to the EU has been decreasing in 2016-2017 as
the prices for electricity and cross-border capacities in Ukraine have been rising.
Before July 2019 import of electricity was prohibited for private companies, but now
it is actively used by traders. Import from Russia and Belarus was allowed after the
new market model introduction but now is being banned due to political tensions.
Import from Russia due to a deficit of fuel (anthracite) for TPPs caused by the antiterrorist operation in the eastern part of Ukraine.
Hungary
Capacity: 650 MW
Max flow: 5,694 GWh
Poland
Capacity: 235 MW
Max flow: 2,059 GWh
2.2.2. Power
National Strategy to Increase Foreign Direct Investment in Ukraine | Section 2.2: Energy | Page 32 of 88
Ukrainian government is going to finish the construction of two power units
at KhNPP and considers involvement of the foreign investors for the Project
21%
22%
43%
14%
13.8 GW
Rivne NPPKhmelnytskyi NPP
South-Ukraine NPPZaporizhzhya NPP
1,000 MWextended to
2028
1,000 MWto
2035
1,000 MWto
2020
1,000 MWextended to
2028
1,000 MWto
2026
1,000 MWextended to
2025
1,000 MWextended to
2026
1,000 MWextended to
2027
1,000 MWextended to
2023
1,000 MWextended to
2025
1,000 MWto
2030
420 MWextended to
2030
415 MWextended to
2031
1,000 MWextended to
2037
1,000 MWto
2035
!
Capacity of PUUseful life
Nuclear power generation capacity in Ukraine
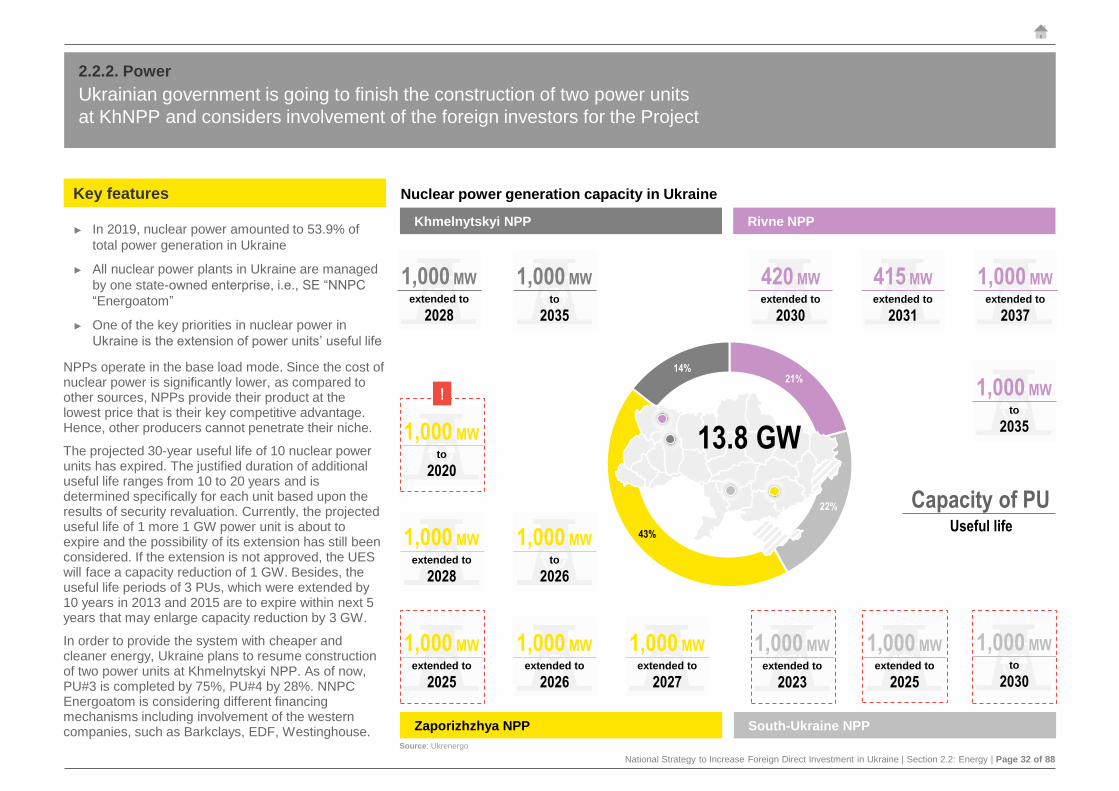
NPPs operate in the base load mode. Since the cost of nuclear power is significantly lower, as compared to other sources, NPPs provide their product at the lowest price that is their key competitive advantage. Hence, other producers cannot penetrate their niche.
The projected 30-year useful life of 10 nuclear power units has expired. The justified duration of additional useful life ranges from 10 to 20 years and is determined specifically for each unit based upon the results of security revaluation. Currently, the projected useful life of 1 more 1 GW power unit is about to expire and the possibility of its extension has still been considered. If the extension is not approved, the UES will face a capacity reduction of 1 GW. Besides, the useful life periods of 3 PUs, which were extended by 10 years in 2013 and 2015 are to expire within next 5 years that may enlarge capacity reduction by 3 GW.
In order to provide the system with cheaper and cleaner energy, Ukraine plans to resume construction of two power units at Khmelnytskyi NPP. As of now, PU#3 is completed by 75%, PU#4 by 28%. NNPC Energoatom is considering different financing mechanisms including involvement of the western companies, such as Barkclays, EDF, Westinghouse.
Key features
► In 2019, nuclear power amounted to 53.9% of
total power generation in Ukraine
► All nuclear power plants in Ukraine are managed
by one state-owned enterprise, i.e., SE “NNPC
“Energoatom”
► One of the key priorities in nuclear power in
Ukraine is the extension of power units’ useful life
Source: Ukrenergo
2.2.2. Power

National Strategy to Increase Foreign Direct Investment in Ukraine | Section 2.2: Energy | Page 33 of 88
Additional 3 GW of hydro capacity should be commissioned by 2026 to
ensure the security of supply, but involvement of investors is not considered
Though hydro power is the essential driver of power
balance, the installed capacity is not provided with
sufficient hydro resources for efficient load regulation.
In fact, the output in 2019 was the minimum for the past
four years due to the abnormally high temperature in
winter 2019-2020, as well as the lack of precipitation
and the absence of snow banks. Meanwhile, the
demand for balancing services increases, driven by the
transition to the new market model and growth in RES
capacity. This entails the active involvement of HPPs in
balancing.
According to the TSO’s 10Y Development Plan,
Ukraine is going to increase the capacity of HPPs by
112 MW via reconstruction of existing plants, i.e., Kaniv
HPP, Kremenchuk HPP, Dnieper HPP and Middle
Dnieper HPP. Furthermore, the plan includes the
launch of the 4th hydroelectric generating unit of Dnister
PSPP and the construction of Kaniv PSPP with the
launch of two units. Initially, the Plan envisaged the
construction of Kakhovka HPP-2, but currently, the
project is still pending regarding the environmental
issues. Overall, the hydro power generation capacity of
Ukraine is expected to increase by nearly 3,000 MW.
Key features
► In 2019, hydro power amounted to 5.1% of total
power generation in Ukraine
► All operating hydro power plants and pumped
storage power plants are managed by state-
owned enterprise PJSC “Ukrhydroenergo”
► HPPs and PSPPs are the most flexible peak
power producers in Ukraine
the Dnieper River
the Black Sea
Hydro power generation capacity in Ukraine
Kyiv HPP-PSPP
675.5 MW
Kaniv HPP
493.0 MW
Kremenchuk HPP
700.4 MW
Middle Dnieper HPP
388.0 MW
Dnieper HPP 2
928.5 MW
Dnieper HPP 1
629.6 MW
Kakhovka HPP
334.8 MW
the Dnister River
Dnister HPP
702.0 MW
Dnister PSPP
972.0 MW
6.3 GW
Total HPP
capacity
12 %
In UES
capacity
8 TWh
Average
generation
Source: PJSC “Ukrhydroenergo”
2.2.2. Power

National Strategy to Increase Foreign Direct Investment in Ukraine | Section 2.2: Energy | Page 34 of 88
4 out of 5 companies engaged in TPPs operation in Ukraine are private.
Privatization of state-owned PJSC “Centrenergo” is expected in 2Q2021
There are five companies engaged in TPPs operation presented as follows:
Installed capacity (excl. gas and fuel oil power units, and power units located on the TUT)
880 MW 4,800 MW 4,661 MW 5,940 MW 3,027 MW
lost TPPs, located on the TUT
PJSC “Donbasenergo”
Sloviansk TPP
PJSC “Donbasenergo” is a private
power generating company: 60.9%
belongs to PJSC “Energoinvest
Holding”, whereas the state owns
25%+1 share of the company. In
2017 Donbasenergo lost control
over Starobeshivska TPP, which is
located on the TUT. Therefore,
Sloviansk TPP is the only one
operating TPP of Donbasenergo.
PJSC “Zakhidenergo” “Skhidenergo” LLC PJSC “Dniproenergo”
Luhanska TPP
Kurakhivska TPP
Kryvorizka TPP
Prydniprovska TPP
Zaporizka TPP
Burshtynska TPP
Dobrotvirska TPP
Ladyzynska TPP
DTEK is a vertically integrated holding developing four business streams in the energy sector – its companies
produce coal and natural gas, generate electricity at TPPs, SPPs and WPPs, distribute and supply heating and
electricity to final consumers, and provide energy services. It is a part of the financial and industrial group
System Capital Management which is owned by the richest Ukrainian citizen – Rinat Akhmetov. TPPs were
built mainly during 1958-1977, but the company invested in the complex retrofitting program during 2010-2017.
Given the scope of operations, DTEK is fairly secured in terms of electricity generation business (the coal
extracted at the company’s mines is used in electricity generation). However, TUT imposes certain limitations
on the company’s activities – the control over Zuivska TPP, as well as anthracite mines of DTEK located on the
TUT, was lost in 2017. As a result, DTEK began to import coal from Poland, the USA, South Africa and Russia
(Russia hsa blocked the supply in 2019). It also has already switched 4 power units from Anthracite to coal G.
Vuhlehirska TPP
PJSC “Centrenergo”
Trypilska TPP
Zmiivska TPP
PJSC “Centrenergo” is a state-
owned company operating 3 TPPs
with a total installed capacity of
coal-fired power units (4,690 MW)
and gas and fuel-oil power units
(3,000 MW). TPPs were built
mainly during 1960-1973. In 2018
the government tried to privatize
the company, but as of now, this
process is not finished.
Starobeshivska TPP
Zuivska TPP
2019
2015
average
utilization
rate: 39%
average
utilization
rate: 22%
2019
2015
average
utilization
rate: 34%
average
utilization
rate: 23%
average
utilization
rate: 34%
2019
2015
2019
2015
2019
2015
2.2.2. Power
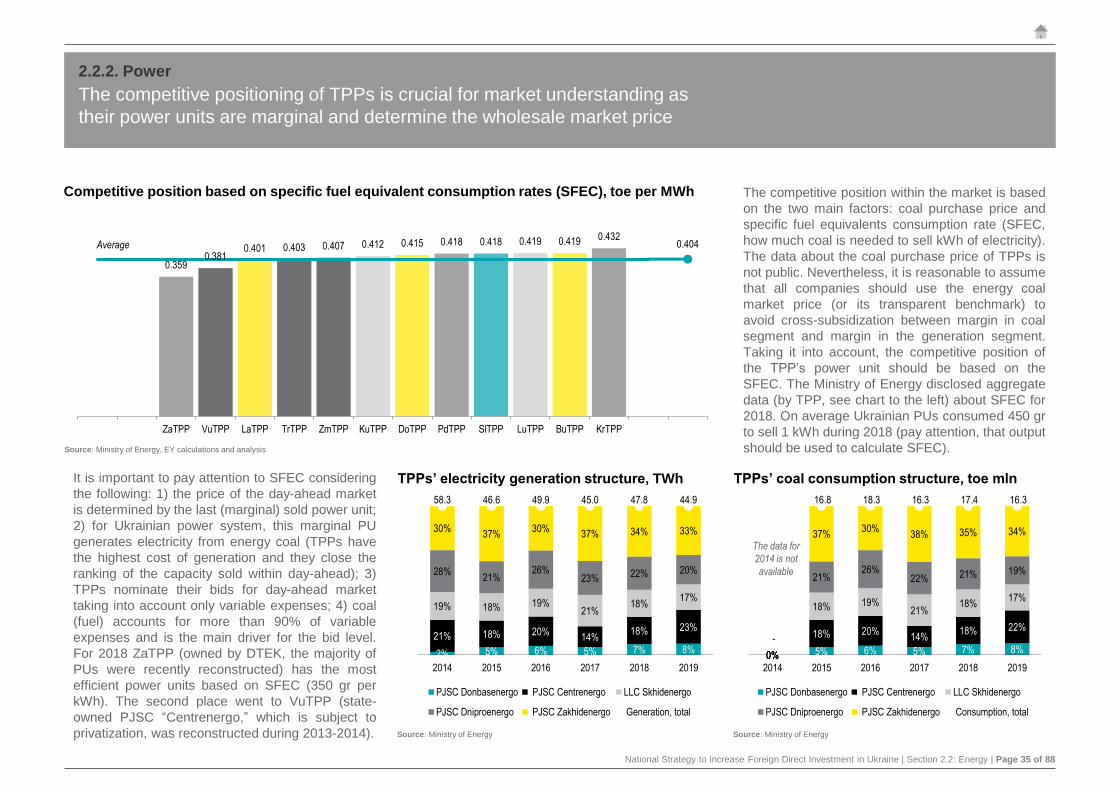
National Strategy to Increase Foreign Direct Investment in Ukraine | Section 2.2: Energy | Page 35 of 88
0.3590.381
0.401 0.403 0.407 0.412 0.415 0.418 0.418 0.419 0.419 0.4320.404
ZaTPP VuTPP LaTPP TrTPP ZmTPP KuTPP DoTPP PdTPP SlTPP LuTPP BuTPP KrTPP
0% 5% 6% 5% 7% 8%0%
18% 20%14%
18% 22%
0%
18% 19%21%
18%17%
0%
21%26%
22% 21% 19%
0%
37%30%
38% 35% 34%
-
16.8 18.3 16.3 17.4 16.3
2014 2015 2016 2017 2018 2019
PJSC Donbasenergo PJSC Centrenergo LLC Skhidenergo
PJSC Dniproenergo PJSC Zakhidenergo Consumption, total
The competitive positioning of TPPs is crucial for market understanding as
their power units are marginal and determine the wholesale market price
Source: Ministry of Energy
TPPs’ coal consumption structure, toe mln
Competitive position based on specific fuel equivalent consumption rates (SFEC), toe per MWh
Source: Ministry of Energy
TPPs’ electricity generation structure, TWhIt is important to pay attention to SFEC considering
the following: 1) the price of the day-ahead market
is determined by the last (marginal) sold power unit;
2) for Ukrainian power system, this marginal PU
generates electricity from energy coal (TPPs have
the highest cost of generation and they close the
ranking of the capacity sold within day-ahead); 3)
TPPs nominate their bids for day-ahead market
taking into account only variable expenses; 4) coal
(fuel) accounts for more than 90% of variable
expenses and is the main driver for the bid level.
For 2018 ZaTPP (owned by DTEK, the majority of
PUs were recently reconstructed) has the most
efficient power units based on SFEC (350 gr per
kWh). The second place went to VuTPP (state-
owned PJSC “Centrenergo,” which is subject to
privatization, was reconstructed during 2013-2014).
The competitive position within the market is based
on the two main factors: coal purchase price and
specific fuel equivalents consumption rate (SFEC,
how much coal is needed to sell kWh of electricity).
The data about the coal purchase price of TPPs is
not public. Nevertheless, it is reasonable to assume
that all companies should use the energy coal
market price (or its transparent benchmark) to
avoid cross-subsidization between margin in coal
segment and margin in the generation segment.
Taking it into account, the competitive position of
the TPP’s power unit should be based on the
SFEC. The Ministry of Energy disclosed aggregate
data (by TPP, see chart to the left) about SFEC for
2018. On average Ukrainian PUs consumed 450 gr
to sell 1 kWh during 2018 (pay attention, that output
should be used to calculate SFEC).
The data for
2014 is not
available
Source: Ministry of Energy, EY calculations and analysis
2% 5% 6% 5% 7% 8%
21% 18% 20%14%
18% 23%
19% 18% 19%21%
18%17%
28%21%
26%23% 22% 20%
30%37%
30%37% 34% 33%
58.3 46.6 49.9 45.0 47.8 44.9
2014 2015 2016 2017 2018 2019
PJSC Donbasenergo PJSC Centrenergo LLC Skhidenergo
PJSC Dniproenergo PJSC Zakhidenergo Generation, total
Average
2.2.2. Power

National Strategy to Increase Foreign Direct Investment in Ukraine | Section 2.2: Energy | Page 36 of 88
RES achieved abnormal growth in recent years, but now investors are
suffering from untimely payments and technological limitations of load
Solar power (SPP)
4.94 GWInstalled generation capacity
Wind power (WPP)
1.07 GWInstalled generation capacity
Biomass and biogas (BPP)
177 MWInstalled generation capacity
Hydro power (Small HPP)
184 MWInstalled generation capacity
Considering the significant resource base and state support for renewable energy producers, Ukraine is a very promising market for renewable energy sources. In fact, it
has areas with great wind energy potential, which include regions near the Black Sea and the Azov Sea, the Carpathians and elevated terrains in Donetsk, Luhansk and
Dnipro regions. As well, the regions near the Black Sea and the Azov Sea have a high photovoltaic power potential – up to 1314-1387 kWh/kWp (long term average
PVOUT for 1994-2015, according to the World Bank data. These factors drive the growth in both RES capacity and output.
In 2019, renewable power amounted to 3.6% of total generation in Ukraine. Moreover, during the past 3 years, renewable power generation was growing by 54.2%
annually, on average. The most significant increment was observed in 2019 (more than by 2 times, as compared to the previous year). The key drivers of such growth
were solar power and wind power. In fact, 2,667 MW of SPPs and 704 MW of WPPs were placed into operation in 2019 (466 MW and 61 MW, respectively, in 2018).
During the first half of 2020, the SPPs’ capacity increased by 21.1%, while the WPPs’ and BPPs’ capacity grew by 2.7% and 19.6%, respectively. The output of RES
sources is seasonal based on weather factors. HPPs produce the most electricity during spring, which is caused by an increased level of river water due to snow melting.
As well, the speed of the wind is the fastest during winter, and irradiation is higher in summer.
According to the National Energy Strategy of Ukraine, until 2035, “Security, energy efficiency, the competitive ability,” the share of renewable power in a total generation
is expected to grow to 25% in 2035. At present, the investment attractiveness of the RES industry in Ukraine is questionable, as a result of the feed-in tariff restructuring
process in 2020 and the debt accumulation by Guaranteed Buyer (the level of settlement with producers eligible for a feed-in tariff is 40.6% for 2020).
2.2.2. Power

National Strategy to Increase Foreign Direct Investment in Ukraine | Section 2.2: Energy | Page 37 of 88
The unreasonably high feed-in tariff skyrocketed the investments and RES
capacity commissioning, which led to loss-loss situation for all stakeholders
Feed-in tariff
► Feed-in tariff as a supporting scheme for RES
was introduced in 2009 when Ukrainian
Parliament adopted the new legislation. It was
established to encourage the commissioning
of new RES capacities upon joining European
Energy Community, Ukraine committed that
RES reached 11.0% of total consumption.
► The state guarantees that after the feed-in
restructuring process in July 2020 the feed-in
tariff will not be changed or canceled (but it
guaranteed the same before restructuring).
𝑻 = 𝑲 ∗ 𝑭 ∗ (1 + 𝑷)
Feed-in tariff value for each
generation type
The coefficient, dependent
upon power unit capacity
and its commissioning time.
Generally, the coefficient
decreases with the increase
in capacity being installed
and the time of installation
Premium for the usage of Ukrainian
equipment (local premium)
Level of usage Premium
No less than 30% 5%
No less than 50% 10%
Source: the Law of Ukraine “On electricity market”
Fixed rate set by NEURC on
December 23, 2008 equals
EUR 0.05385 per kWh
Feed-in tariff formula
6.46
18.85
11.63 12.39
5.82
15.99
10.45 11.15
5.82
15.03
10.45 12.39
5.17
13.52
9.42 11.15
4.52
12.01
8.35 9.91
11.31
46.53
19.39
12.39 10.18
30.53
17.45
12.39 10.18
15.03 17.45
12.39
9.05
13.52 15.73
11.15
7.92
12.01 13.95
9.91
prior to2015
2015 -2016
2017 -2019
2020 -2024
2025 -2029
1. Tariff varies depending on the capacity being installed. Therefore, ranges for each commissioning time are presented.
Source: NEURC, EY calculations and analysis
SPP
WPP
BPP
Small HPP
Feed-in tariff1 for different generation types depending on the commissioning period, Eurocent/kWh
The absence of competition between RES combined with the high outdated feed-in tariff linked to Euro currency resulted in
rapid SPPs and WPPs commissioning during 2019-2020. It revealed anomalies of the support mechanism followed by the
crisis of payments for electricity produced by eligible RES. Moreover, in some situation, TSO limited the RES load (due to
lack of maneuverable reserves), but unsold output still should have been paid, which contradicts the interests of consumers
(actually, the government did not pay for limitations, as the relevant secondary legislation has not been adopted yet). As a
consequence, the government initiated the discussion about the feed-in tariff mechanism restructuring process. On July 21,
2020, the Parliament passed the Law “On Amendments to Certain Laws of Ukraine on the Improvement of Support of the
Generation of Electricity from Alternative Energy Sources.” The Law came into force on August 1, 2020.
2.2.2. Power
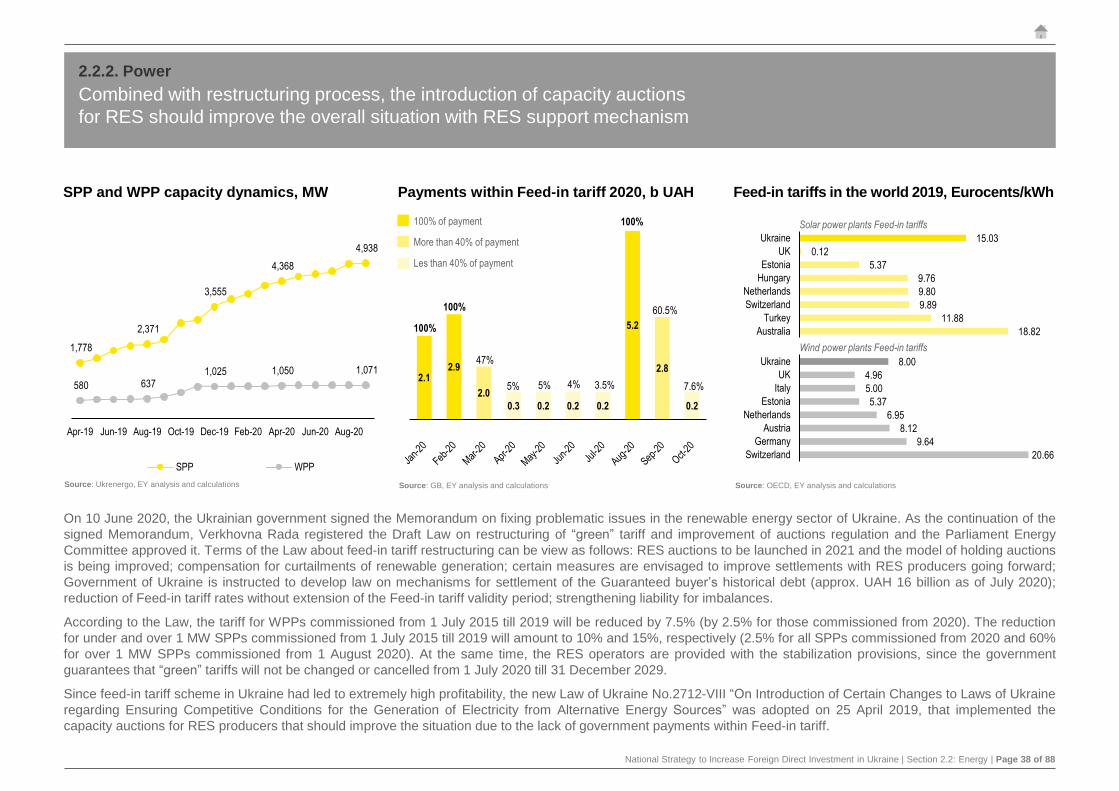
National Strategy to Increase Foreign Direct Investment in Ukraine | Section 2.2: Energy | Page 38 of 88
Combined with restructuring process, the introduction of capacity auctions
for RES should improve the overall situation with RES support mechanism
Payments within Feed-in tariff 2020, b UAH
2.12.9
2.0
0.3 0.2 0.2 0.2
5.2
2.8
0.2
100%
100%
100%
47%
60.5%
7.6%3.5%5% 5% 4%
100% of payment
More than 40% of payment
Les than 40% of payment
1,778
2,371
3,555
4,368
4,938
580 637 1,025 1,050 1,071
Apr-19 Jun-19 Aug-19 Oct-19 Dec-19 Feb-20 Apr-20 Jun-20 Aug-20
SPP WPP
SPP and WPP capacity dynamics, MW
On 10 June 2020, the Ukrainian government signed the Memorandum on fixing problematic issues in the renewable energy sector of Ukraine. As the continuation of the
signed Memorandum, Verkhovna Rada registered the Draft Law on restructuring of “green” tariff and improvement of auctions regulation and the Parliament Energy
Committee approved it. Terms of the Law about feed-in tariff restructuring can be view as follows: RES auctions to be launched in 2021 and the model of holding auctions
is being improved; compensation for curtailments of renewable generation; certain measures are envisaged to improve settlements with RES producers going forward;
Government of Ukraine is instructed to develop law on mechanisms for settlement of the Guaranteed buyer’s historical debt (approx. UAH 16 billion as of July 2020);
reduction of Feed-in tariff rates without extension of the Feed-in tariff validity period; strengthening liability for imbalances.
According to the Law, the tariff for WPPs commissioned from 1 July 2015 till 2019 will be reduced by 7.5% (by 2.5% for those commissioned from 2020). The reduction
for under and over 1 MW SPPs commissioned from 1 July 2015 till 2019 will amount to 10% and 15%, respectively (2.5% for all SPPs commissioned from 2020 and 60%
for over 1 MW SPPs commissioned from 1 August 2020). At the same time, the RES operators are provided with the stabilization provisions, since the government
guarantees that “green” tariffs will not be changed or cancelled from 1 July 2020 till 31 December 2029.
Since feed-in tariff scheme in Ukraine had led to extremely high profitability, the new Law of Ukraine No.2712-VIII “On Introduction of Certain Changes to Laws of Ukraine
regarding Ensuring Competitive Conditions for the Generation of Electricity from Alternative Energy Sources” was adopted on 25 April 2019, that implemented the
capacity auctions for RES producers that should improve the situation due to the lack of government payments within Feed-in tariff.
Feed-in tariffs in the world 2019, Eurocents/kWh
Source: Ukrenergo, EY analysis and calculations Source: GB, EY analysis and calculations
15.03
0.12
5.37
9.76
9.80
9.89
11.88
18.82
Ukraine
UK
Estonia
Hungary
Netherlands
Switzerland
Turkey
Australia
8.00
4.96
5.00
5.37
6.95
8.12
9.64
20.66
Ukraine
UK
Italy
Estonia
Netherlands
Austria
Germany
Switzerland
Wind power plants Feed-in tariffs
Solar power plants Feed-in tariffs
Source: OECD, EY analysis and calculations
2.2.2. Power

National Strategy to Increase Foreign Direct Investment in Ukraine | Section 2.2: Energy | Page 39 of 88
Procedure for executing a PPA with State Company “Guaranteed Buyer”
Background
► The feed-in tariff is a special tariff purchased by the State Company “Guaranteed Buyer” of Electricity Produced from RES. This tariff was established in 2008 by Amendments to the Law on Alternative
Energy Sources and was subject to major limitations during the recent years
► In April 2019 the Law of Ukraine “On Amendments to Certain Laws of Ukraine for Ensuring Competitive Conditions for Electricity Production from Alternative Energy Sources” aiming to reduce the financial
burden of feed-in tariff by introducing the competitive principle of selection of an electricity producer through auctions with a decrease in price (“green capacity auctions”) was adopted
► In July 2020 the Law of Ukraine “On Amendments to Certain Laws of Ukraine on Improving the Conditions for Supporting Electricity Production from Alternative Energy Sources” further limited the
application of feed-in tariff by reducing its rate with respect to plants commissioned before 2020 and by imposing financial liability for the imbalance of actual and accepted (forecasted)
schedules of power production. After these changes (Article 9-1 of the Law of Ukraine on Alternative Energy Sources), the feed-in tariff is available for the power plants that are: 1. Commissioned before
1 January 2020 regardless of the installed capacity, 2. Commissioned after 1 January 2020 and are exempted from auctions under the law (small plants with total capacity < 5 MW for wind power plants, < 1
MW for solar power plants and small HPPs), 3. Defined in the PPAs at feed-in tariff executed before 31 December 2019 and will be put in operation within two or three years (for solar power plants) from the
date of execution of these PPAs
► From 1 January 2020 producers of wind energy (with capacity > 5 MW) and sun energy (with capacity > 1 MW) can execute PPAs at auction price (Article 9-3 of the Law of Ukraine “On Alternative
Energy Sources“). Small power plants are exempted from the auction procedure, but may participate in auctions voluntarily
The procedure for executing the PPA at auction price
► The Procedure for Holding Auctions for the Distribution of the Support Quota provides for the best
price offer mechanism for entering into the PPA at auction price with the State Company
“Guaranteed Buyer” based on supported quotas that are annually defined by the CMU (firsts
support quotas shall be set up in December 2020)
► The scope of quotas depends on how many new capacities the state needs and is ready to
embrace in its energy market. Proposals for them are prepared to take into account international
obligations for the development of renewable energy, Ukraine’s Energy Strategy, the sufficiency of
generation capacity, state of implementation of already approved projects, etc. The total quotas are
divided into three lots - sun, wind, and other RES. The competition takes place between projects in
one category (although the law provides for the possibility of technology-neutral auctions)
► The auctions are based on principle that bidder offering the lowest price wins. The auctions should
be held twice per year by the end of 2029
► The starting price is the level of feed-in tariff established by the law. The auction participants further
offer the lower tariffs at the reduced rates in their bids
► Winner gets the opportunity to build the new energy capacities and sell electricity to the state at the
price determined under the auction for 20 years from the date of commissioning a power station
The procedure for executing the PPA at feed-in tariff
► RES producer enters into the PPA at feed-in tariff with the State Company “Guaranteed Buyer”
under the Procedure specified by the NEURC
► Note: as of 1 January 2020 PPAs at the feed-in tariff are not executed in respect of the facilities
producing electricity from wind energy with a capacity of > 5 MW, facilities with three wind turbines,
regardless of the installed capacity, and facilities producing electricity from solar radiation with a
capacity > 1 MW
RES producer fills in
and submits electronic
application and provides
supportive documents
(including bank
guarantee)
Within 10 business days after the auction
minutes are published in electronic tender
system, the RES producer submits
documents for PPA execution and the Buyer
audit documents submitted by automatically
defined winner (based on the lowest price)
Within 15 business
days the RES producer
signs the auction
protocol and executes
the PPA at auction price
based on the template
approved by the
NEURC
RES producer submits
the paper application
with supportive
documents to the Buyer.
The entities with FDI can
set out an arbitration
clause
Within 10 business days the Buyer
considers submitted documents and
prepares draft PPA based on the template
approved by the NEURC
The RES producer signs
two draft PPAs and
sends them to the Buyer
within 3 business days
2.2.2. Power
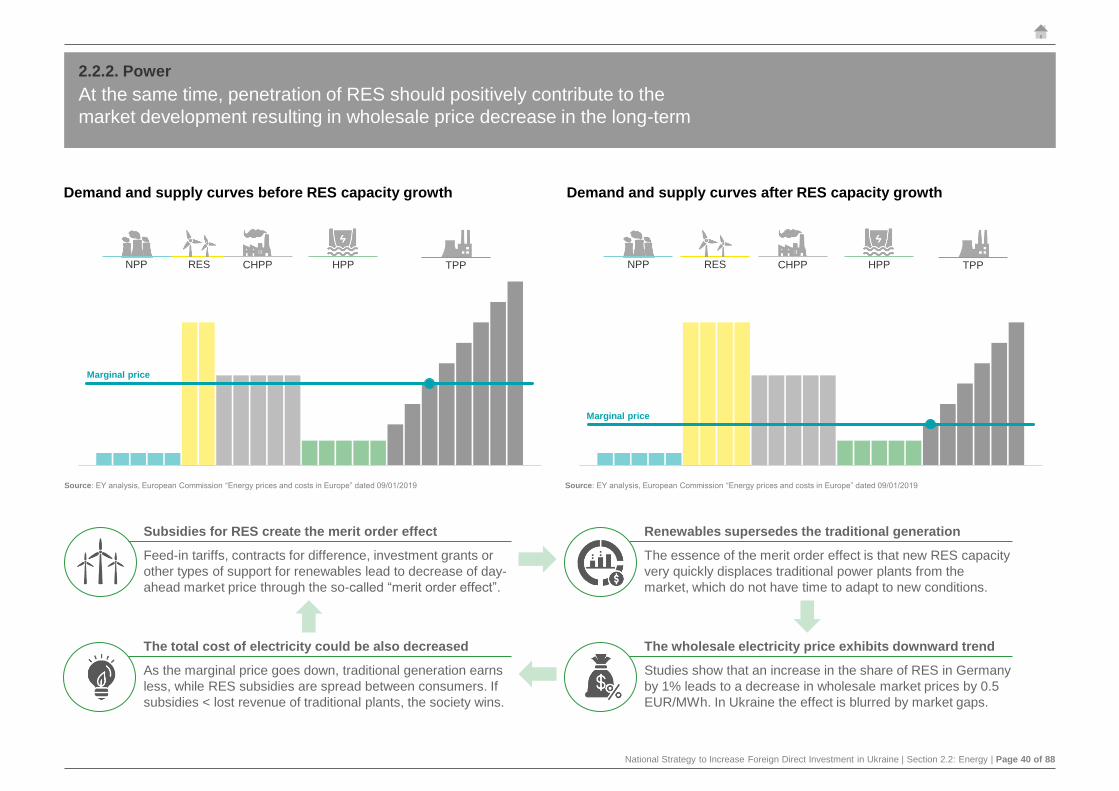
National Strategy to Increase Foreign Direct Investment in Ukraine | Section 2.2: Energy | Page 40 of 88
At the same time, penetration of RES should positively contribute to the
market development resulting in wholesale price decrease in the long-term
RES
Demand and supply curves before RES capacity growth Demand and supply curves after RES capacity growth
Source: EY analysis, European Commission “Energy prices and costs in Europe” dated 09/01/2019 Source: EY analysis, European Commission “Energy prices and costs in Europe” dated 09/01/2019
Marginal price
NPP HPP TPPCHPP
Marginal price
NPP RES CHPP HPP TPP
Subsidies for RES create the merit order effect
Feed-in tariffs, contracts for difference, investment grants or
other types of support for renewables lead to decrease of day-
ahead market price through the so-called “merit order effect”.
The total cost of electricity could be also decreased
As the marginal price goes down, traditional generation earns
less, while RES subsidies are spread between consumers. If
subsidies < lost revenue of traditional plants, the society wins.
Renewables supersedes the traditional generation
The essence of the merit order effect is that new RES capacity
very quickly displaces traditional power plants from the
market, which do not have time to adapt to new conditions.
The wholesale electricity price exhibits downward trend
Studies show that an increase in the share of RES in Germany
by 1% leads to a decrease in wholesale market prices by 0.5
EUR/MWh. In Ukraine the effect is blurred by market gaps.
%
2.2.2. Power
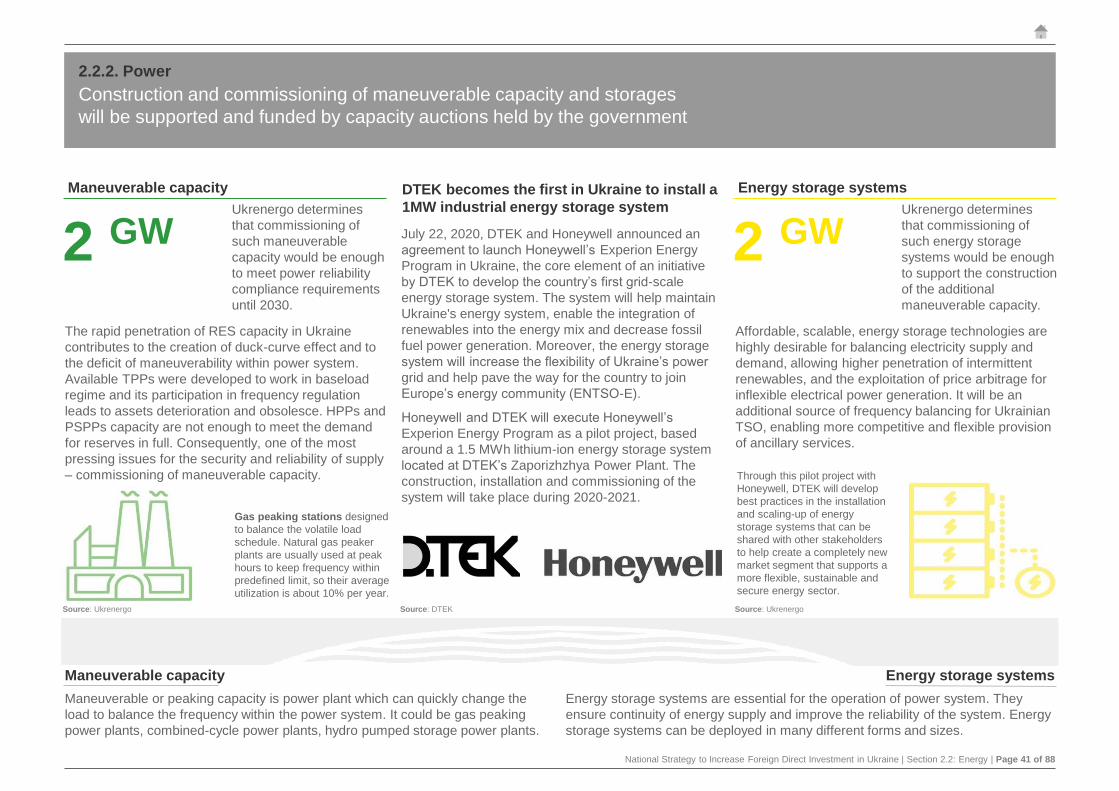
National Strategy to Increase Foreign Direct Investment in Ukraine | Section 2.2: Energy | Page 41 of 88
Construction and commissioning of maneuverable capacity and storages
will be supported and funded by capacity auctions held by the government
Maneuverable or peaking capacity is power plant which can quickly change the
load to balance the frequency within the power system. It could be gas peaking
power plants, combined-cycle power plants, hydro pumped storage power plants.
Maneuverable capacity
The rapid penetration of RES capacity in Ukraine
contributes to the creation of duck-curve effect and to
the deficit of maneuverability within power system.
Available TPPs were developed to work in baseload
regime and its participation in frequency regulation
leads to assets deterioration and obsolesce. HPPs and
PSPPs capacity are not enough to meet the demand
for reserves in full. Consequently, one of the most
pressing issues for the security and reliability of supply
– commissioning of maneuverable capacity.
Maneuverable capacity
2 GWUkrenergo determines
that commissioning of
such maneuverable
capacity would be enough
to meet power reliability
compliance requirements
until 2030.
Energy storage systems
2 GWUkrenergo determines
that commissioning of
such energy storage
systems would be enough
to support the construction
of the additional
maneuverable capacity.
Energy storage systems are essential for the operation of power system. They
ensure continuity of energy supply and improve the reliability of the system. Energy
storage systems can be deployed in many different forms and sizes.
Energy storage systems
Affordable, scalable, energy storage technologies are
highly desirable for balancing electricity supply and
demand, allowing higher penetration of intermittent
renewables, and the exploitation of price arbitrage for
inflexible electrical power generation. It will be an
additional source of frequency balancing for Ukrainian
TSO, enabling more competitive and flexible provision
of ancillary services.
DTEK becomes the first in Ukraine to install a
1MW industrial energy storage system
July 22, 2020, DTEK and Honeywell announced an
agreement to launch Honeywell’s Experion Energy
Program in Ukraine, the core element of an initiative
by DTEK to develop the country’s first grid-scale
energy storage system. The system will help maintain
Ukraine's energy system, enable the integration of
renewables into the energy mix and decrease fossil
fuel power generation. Moreover, the energy storage
system will increase the flexibility of Ukraine’s power
grid and help pave the way for the country to join
Europe’s energy community (ENTSO-E).
Honeywell and DTEK will execute Honeywell’s
Experion Energy Program as a pilot project, based
around a 1.5 MWh lithium-ion energy storage system
located at DTEK’s Zaporizhzhya Power Plant. The
construction, installation and commissioning of the
system will take place during 2020-2021.
Gas peaking stations designed
to balance the volatile load
schedule. Natural gas peaker
plants are usually used at peak
hours to keep frequency within
predefined limit, so their average
utilization is about 10% per year.
Through this pilot project with
Honeywell, DTEK will develop
best practices in the installation
and scaling-up of energy
storage systems that can be
shared with other stakeholders
to help create a completely new
market segment that supports a
more flexible, sustainable and
secure energy sector.
Source: Ukrenergo Source: UkrenergoSource: DTEK
2.2.2. Power

National Strategy to Increase Foreign Direct Investment in Ukraine | Section 2.2: Energy | Page 42 of 88
Even for TSO as a natural monopoly FDI potential could be considered
through the mechanism of cross-border interconnectors construction
Key features
► The Ukrainian Energy System (UES) of Ukraine is one of the
biggest power pools in Europe
► The UES comprises 6 regional energy systems and 33 DSOs.
► The functions of TSO are performed by NPC “Ukrenergo”
Transmission system: power lines
23.0 k km4.9 k km 13.4 k km 4.0 k km 0.7 k km
400-750 kV 330 kV 220 kV 25-110 kV
The core of power grid is the 220-750 kV bulk-power and international
transmission networks which transmit electricity from power units to
regional distribution grids and facilitate exports and imports of power.
The voltage transformation is provided by 750/500 kV, 750/330 kV,
330/220 kV, 400/330 kV, 330/110(150) kV, 220/110(150) kV and
150/110 kV autotransformers and transformers with the total capacity
of 78,553.1 MVA.
Transmission system: transforming sub-stations
750 kV 500 kV 400 kV 330 kV 220 kV 110 kV
137 units8 2 2 88 33 4
Distribution system
0.4-150 kV overhead power lines and cables: > 1,000 k km
6-150 kV transforming sub-stations: ~ 200 k units
NPC “Ukrenergo”
Ukrenergo is the transmission system operator of Ukraine with the functions of operational and technological control of the Integrated Power
System of Ukraine (IPS), transmission of electricity via trunk power grids from generation to distribution
networks, as well as commercial metering administrator and settlement administrator of the
electricity market of Ukraine.
Dnipro ES
Regional energy systems (ES) and power grid in Ukraine
Source: Ukrenergo
17.3% of transforming sub-station equipment and 66.7% of power lines have been used for over 40 years that results in power losses in the transmission systems and risk to the reliability of the UES. To mitigate such risk, Ukraine has launched the Program for reconstruction, automation, and modernization of sub-stations that comprises all regional systems and is funded by EIB, EBRD, KfW, and IBRD. The completion of projects within the program in 2021-2023 is expected to reduce power loss at sub-stations by 30-35%. Furthermore, according to its 10Y Development Plan, Ukrenergo is going to build/reconstruct 3.3 k km of power lines during the next 10 years.
As stated in the 10-year Network Development Plan, the part of Central ES and Northern ES possess a deficit in load and electricity due to: 1) the use of its TPPs in the coverage of irregularities in the daily load; 2) fuel shortage. Other parts of ES possess a surplus in load and electricity, so the deficit is covered by the electricity inflow from adjacent energy systems. To reduce losses, TSO is planning to complete the construction of sub-stations in 2020 and 2023.
TSO is state-owned enterprise and its full or partial privatization is strictly prohibited.
Western ES
Central ES
Southern ES
South-Western ES
Northern ES
750 kV power lines
500 kV power lines
330 kV power lines
planned / under construction
750 kV sub-stations
500 kV sub-stations
330 kV sub-stations
One of the additional option is
a “UA-EU energy bridge”
project – electricity supply
from KhNPP to Poland – was
canceled in 2020 but could be
potentially considered.
2.2.2. Power

National Strategy to Increase Foreign Direct Investment in Ukraine | Section 2.2: Energy | Page 43 of 88
The upcoming technical integration with ENTSO-e will unlock the unlimited
potential of European electricity market for Ukrainian energy companies
ENTSO-e Transmission System Map
Source: ENTSO-e
ENTSO-E member
Observer member
Ukraine
Other countries
Integration into ENTSO-e
On June 28, 2017 in Brussels
Agreement on the Conditions for Future Interconnections of Power
System of Ukraine with Power System of Continental Europe was
signed. Integration of the Ukrainian power system and ENTSO-e
continental Europe zone in an operational mode is expected by 2025.
Agreement took effect July 7, 2017. The agreement contains:
► Catalogue of Measures
► List of necessary additional researches
► Road Map
The deadline for the implementation of all activities of the Catalogue of Measures
is 5 years. Another year is needed to work in an isolated mode (technically
disconnected from the systems of the Russian Federation, Belarus and ENTSO-e).
Under the agreement, Ukrainian TSO NPC “Ukrenergo” undertakes to implement
the technical provisions contained in the catalogue of measures, and to check the
island mode of operation of the integrated power system.
The implementation of all activities and operation in an island mode should be a
condition for a positive decision of ENTSO-e to switch to parallel work with Ukraine
and Moldova. It is also a key goal of Ukrainian National Energy Strategy till 2035.
Benefits of integration of the IPS of Ukraine into ENTSO-e
Significant increase
of stability and
flexibility of Ukrainian
power system
Opportunity to receive
emergency assistance from
the power systems of
ENTSO-E member countries
Increase in electricity
trade with Europe – from
today’s 4-5 billion kWh
up to 18-20 billion kWh
2.2.2. Power

National Strategy to Increase Foreign Direct Investment in Ukraine | Section 2.2: Energy | Page 44 of 88
Privatization of DSOs accompanied by RAB-methodology implementation
will be one of the most attractive factors for FDI in electricity subsector
Electricity distribution system operators in Ukraine
DTEK DSOs
VS Energy DSOs
State-owned DSOs
Other private-owned DSOs
Large Privatization Objects
The List of large privatization objects was
approved. For sale will be offered:
● OJSC Ternopiloblenergo,
● PJSC Zaporizhzhiaoblenergo,
● JSC Kharkivoblenergo,
● JSC Mykolaivoblenergo,
● PJSC Khmelnytskoblenergo,
● JSC Cherkasyoblenergo
Energy Standard
In order to comply with the Law “On electricity market”, in 2018 there was a legal unbundling of electricity distribution activities from other activities of vertically integratedeconomic entities. As of December 2019, 33 electricity distribution system operators were functioning (compared to 25 originally created in 2018), which will also performthe function of the universal service supplier (supply electricity to households under regulated prices) within the assigned territory. In October 2020, NEURC has pre-agreed RAB (regulatory asset base) tariffs for several electricity distribution system operators: Ternopiloblenergo, Rivneoblenergo, and Kirovogradoblenergo. InNovember 2020, it has been pre-agreed RAB tariff for additional 19 DSOs. Total profits in 2020 for 22 DSOs set according “cost+” methodology were equal to UAH 1.5billion compared to UAH 7.2 billion in 2021 pre-agreed according to RAB methodology. RAB tariff is a system of long-term tariff design aimed primarily at encouraginginvestment in the expansion and modernization of infrastructure. Global experience have shown that RAB-based tariff regulation for the electric grid sector has severaladvantages for both companies and customers over the existing cost-plus tariff system. Companies within the RAB-tariff provide a secure payback and return oninvestment sufficient to service loans and generate profits. Under this methodology, they are stimulated to reduce their costs, as RAB methodology allows them to retainthe funds resulting from cost-cutting, unlikely to Ukraine’s conventional cost-plus methodology. As for customers, the RAB system’s advantages are a more reliablepower supply and services of better quality. It is achieved by requirements regarding SAIDI and SAIFI indicators decreasing to receive RAB tariffs. According to theapproved methodology, rate of return for the new asset-base - 16.74%, for the old asset-base - 3% (50% of which is compulsive reinvesting as CapEx of DSOs).
SAIDI indicators for European countries 2019, min
Source: State Property Fund of Ukraine
Source: NEURC, CEER
683
361
192
187
84
74
33
20
12
12
Ukraine
Romania
Poland
Slovak Republic
Chezh Republic
Hungary
Austria
Netherlands
Denmark
Germany
The System Average Interruption Duration Index
(SAIDI) is commonly used as a reliability indicator
by electric power utilities. SAIDI is the average
outage duration for each customer served. SAIDI is
measured in units of time, often minutes or hours. It
is usually measured over the course of a year.
RAB tariffs rates of return for European countries 2019*
13.0%
6.9%
7.7%
5.3%
10.3%
6.2%
9.0%
6.7%
5.6%
6.9%
Ukraine
Romania
Poland
Slovenia
Chezh Republic
Hungary
Austria
Netherlands
Denmark
Germany
Source: NEURC, CEER Report 2020Note: Rate of return on equity before taxes in EUR. Ukrainian rate of return was recalculated to EUR through LTI
FDI potential could be
unlocked through M&A as
well. Foreign investors actively
express its interest to DSOs
considering RAB-methodology
implementation.
2.2.2. Power

National Strategy to Increase Foreign Direct Investment in Ukraine | Section 2.2: Energy | Page 45 of 88
RAB-tariffs
Procedure of obtaining RAB-tariff and incentives for construction of power
generation facilities
On 26 August 2020, the National Energy and Utility Regulatory Commission (“NEURC”) approved a
new methodology for incentive pricing (regulatory asset base regulation) for distribution system
operators (“DSOs”). At present, Ukraine uses the cost-plus-tariff setting system for DSOs, which
reportedly has negative consequences for the condition of power networks. The relevant Methodology
provides for a rate of return of 16.74% on the new asset base and a rate of return of 3% on the old
asset base. However, according to the approved Methodology, 50% of funds that are revenues to the
old asset base must be reinvested in the modernization of networks of distribution system operators.
The market rate of return on the new asset base creates new opportunities for distribution system
operators to attract investment through new instruments in capital markets (both equity and debt).
Pursuant to the Procedure for Introduction (Development) of Tariffs for Electricity Distribution Services
(paragraph 2.2), in order to reconsider the tariff according to RAB-model a DSO should submit to the
NEURC an application supplemented by the following documents:
► Report on an independent valuation of assets conducted in accordance with the approved
methodology
► Review of the report on the independent valuation of assets by the competent state authority
► Copy of the procedure on the distribution of assets, expenses and income within different types of
commercial activity
► Copy of audit statements of economic activity and the order on its approval
► Calculation of the regulatory base of assets
► Calculation of basic controlled operating costs and uncontrolled operating costs in respect of the
electricity distribution activities
► Action plan to ensure the reliability of data for monitoring of the quality of services
The application with the attached documents should be submitted to the NEURC not later than 90 days
before the beginning of a regulatory period when the tariffs will be effective. NEURC reviews results of
an independent valuation of assets and may request additional supportive documents. After reviewing
the application and supporting documents NEURC takes decision on reconsidering the tariffs no later
than 20 days before the beginning of a year when they are expected to come into force. The tariffs are
set based on resolution of NEURC
Incentives for construction of power generation facilities
The following incentives can be provided to the investors for construction of a power generation facility:
► Provision of payment for the service of the generation capacity development
► Application of PPP mechanisms
► Provision of state aid from the state or municipal resources
Specific incentives applicable to each particular case will be determined by the CMU in its tender
decision. Investor cannot benefit from both payment and state aid incentives
The tender procedure is governed by the CMU’s Regulation No. 677 dated 10 July 2019
The Ministry of Energy prepares the draft decision on tender conditions, approves it with the NEURC
and submits it to the CMU within 90 calendar days from the date of receipt of conclusions and
proposals of the TSO
CMU takes decision on tender based on proposal from the Ministry of Energy and determines the
terms of the tender and technical requirements. One of the main requirements is that an applicant must
have experience in installation of the generation capacity of at least 20 MW. Ministry of Energy
establishes a tender committee which approves the tender documents (including documents on land
plot and project documentation) prepared by the TSO within three months from the date of the CMU’s
decision
The participant should provide a guarantee (security) for participation in the tender in the equivalent of
EUR 10k for 1 MW of capacity in UAH and submit technical and financial proposals
The tender consists of two stages:
► Qualification of participants in accordance with the requirements set forth by the tender
documentation within 30 calendar days
► Selection of winner based on the financial bids of the qualified participants within 20
calendar days from the date of publication of the decision on the results of qualification
The winner should make the guaranteed payment equivalent to EUR 30k for 1 MW of generating
capacity in UAH and provide an irrevocable bank guarantee to ensure the fulfillment of obligations and
conclude agreement with TSO
If the PPP mechanism is used to develop generating capacity and demand management measure the
tender is conducted in accordance with the Law on PPP
TSO monitors performance of investor’s obligations under the agreement on construction of generation
capacity
On implementation of demand management measures if the available power generation facilities are
insufficient to meet and cover the projected demand for electricity (Article 29 of the Law of Ukraine "On
Electricity Market"). Competitive procedures are used to ensure the security of the electricity supply.
CMU initiates these tenders based on the offer from the Ministry of Energy
2.2.2. Power

National Strategy to Increase Foreign Direct Investment in Ukraine | Section 2.2: Energy | Page 46 of 88
Ukraine has scored 63 out of 100 points in Doing Business Getting
electricity Ranking in 2020 which is far below leading EU countries
Position of Ukraine and other EU countries in Doing Business (getting electricity)
Getting electricity
In Report Doing Business 2020 was mentioned that Ukraine made getting electricity easier by streamlining the issuance of technical conditions and by
implementing a geographic information system. Ukraine also improved the reliability of power supply by introducing an outage compensation mechanism.
Source: Doing Business
Note: Data for EU countries presented for 2020
Procedures, time, and cost to get connected to the electrical grid; the reliability of the electricity supply; and the transparency of tariffs
59 63 63
54
83 82
99 97 9890
75
Ukraine 2019 Ukraine 2020 Hungary Romania Slovak Republic Poland Germany UK Russian Federation Belarus Moldova
All connections to the grid are regulated by the main Law of Ukraine No. 2019 “On electricity market” and by secondary legislation. Consumers have two options for connection to the grid: 1) connection to the transmission system; 2) connection to the distribution system.
Payment for connection to the transmission system iscalculated by NPC “Ukrenergo” (TSO) individually for eachcase taking into account available system capacity. TSOpublished on its website the detailed connection costcalculator, which takes into account: region, substation, indexof network voltage, type of power line, distance to the grid.
There are two types of connection to the distribution system:standard (up to 50 kW and less than 300 m from availableline) and non-standard (more than 50 kW and more than 300m from available line). Payments for both are regulated byNEURC and should be approved for every calendar year foreach distribution system operator.
2.2.2. Power

National Strategy to Increase Foreign Direct Investment in Ukraine | Section 2.2: Energy | Page 47 of 88
In July 2019 the new competitive and transparent electricity market model
was introduced, which converged market rules to European legislation
07/01/19 the current market has become functioning. It includes a few segments: day-ahead and intraday markets (managed by the market operator and regulated
by “day-ahead rules”), balancing and ancillary services markets (managed by the transmission system operator and regulated by “market rules”), and bilateral
contracts. Generating companies are able to sell electricity to anyone at any price (excluding NPPs and HPPs under PSO model) and all suppliers are able to buy at
any price. Only natural monopolies like TSO and DSO are regulated. Consumers got a right to choose the supplier, and the cross-subsidization (when industrial
consumers are charged at higher prices to subsidize the lower prices of households) was partially eliminated (it was transformed to PSO model). The transition
period was introduced for the purpose of smoothing the hike in electricity prices. It was achieved by additional fees paid by NPPs and HPPs to cover feed-in tariffs
(consumers are not paying for RES support scheme) and to support low-income households (PSO model). It is unclear when the transition period will be canceled.
Current market model overview:
1. Limitations during transition period:
After 07/01/2019 state-owned generating companies are eligible to sell
electricity via bilateral market only by using electronic auction;
Until 2021 the duration of bilateral contracts should not exceed 1y;
Generating companies have to sell at least 10% of electricity via DAM.
2. Supply peculiarities:
All consumers will be able to buy electricity directly from generating
companies (only if such consumers are responsible for their balance);
New universal suppliers will be appointed after the end of the transition
period. They will be selected during the contest by the price criterion.
3. Features of RES support during transition period:
RES will sell all electricity to the guaranteed buyer at the feed-in tariff.
Then guaranteed buyer will have to sell it at day-ahead market. The
difference between feed-in tariff and market price will be covered by
NPPs (calculated by guaranteed buyer; approved by the Regulator).
07.01.19 ???Previous Model Transition Period Current Market Model
TPP
generating companies
HPP
NPP
RES
CHPP
Independent
suppliers
Supplier of
“last resort”
Consumers (2)
TSOtransmission transmission
DSO
Universal
supplier
Day-Ahead Market (1)
Traders
Intraday Market
Balancing Market
Ancillary Services
Bilateral Contracts (1)
guaranteed
buyer (3)
Legend:
physical flows
commercial relationships
2.2.2. Power

National Strategy to Increase Foreign Direct Investment in Ukraine | Section 2.2: Energy | Page 48 of 88
Wholesale electricity prices in Ukraine are higher compared to European
markets as a result of regulation loopholes and cross-border limitations
Poland
DAM: 45.3 EUR/MWh
IDM: 42.5 EUR/MWh
Finland
DAM: 26.9 EUR/MWh
Estonia
DAM: 31.8 EUR/MWh
Romania
DAM: 36.7 EUR/MWh
IDM: 37.4 EUR/MWh
Slovak Republic
DAM: 31.6 EUR/MWh
IDM: 35.5 EUR/MWh
Average DAM and IDM prices 2020, EUR/MWh
Source: Ukrenergo, HUPX
Ukrainian DAM and IDM prices and monthly volume dynamics
-
1,000
2,000
3,000
4,000
5,000
6,000
0
10
20
30
40
50
60
70
7/1/2019 10/1/2019 1/1/2020 4/1/2020 7/1/2020
Mon
thly
vol
ume
Pric
e
IDM, EUR/MWh DAM, EUR/MWh DAM volume, GWh IDM volume, GWh
DAM Ukraine, EUR/MWh
41.3IDM Ukraine, EUR/MWh
40.7
The state company «Market Operator» established on June 18, 2019, inaccordance with the Law of Ukraine «On Electricity Market». The company isresponsible for the organization of sale and purchase of electricity on the Day-Ahead Market and the Intraday Market.
At the Day-Ahead Market (DAM), electricity is sold and bought on the next day afterthe auction. Market prices at the DAM have a clear seasonal trend and dependenton weather conditions. The highest prices are observed in January (increase indemand due to increased use of heaters) and in August (increase in demand due toincreased use of air conditioners). The price are typically low during March-April,when the water levels increase due to floods, so the generation of hydroelectricpower plants creates a surplus of power energy output. In addition, DAM pricesalways decrease on weekends and holidays due to declining demand and increaseduring scheduled repairs of large power plants.
At the Intraday Market (IDM), electricity is sold and bought continuously after day-ahead auctions and after the physical supply of electricity have been completed. Itis worth mentioning that prices on DAM and IDM differ: In case of low demand andaccess supply, IDM prices are lower than DAM, and vise versa.
Average daily prices on the Ukrainian DAM and ID markets for the period from July2019 till October 2020 ranged from 20.79 to 61.98 EUR\MWh and on average werehigher compared to adjacent markets. It is explained by different market gaps,including rigor price caps, ban of electricity import from Russia and Belarus,ineffective bidding under PSO model. Still, even considering higher prices powergeneration companies (NPPs, TPPs, RES) experienced losses or cash deficit.
Source: Market operatorCzech Republic
DAM: 31.2 EUR/MWh
IDM: 33.4 EUR/MWh
Hungary
DAM: 36.2 EUR/MWh
Austria
DAM: 30.6 EUR/MWh
France
DAM: 29.7 EUR/MWh
2.2.2. Power

National Strategy to Increase Foreign Direct Investment in Ukraine | Section 2.2: Energy | Page 49 of 88
COVID-19 impact on power subsector resulted in decreasing electricity
consumption but influence on prices is unclear due to market gaps
9.3 9.4 9.1 9.7 10.2 10.9 11.0 10.6 10.1 9.1 8.9 8.9 9.4 9.3 8.9
55 57 58 56
48 45
50
44 47
41 39 40
38 38
44
Jul-19 Aug-19 Sep-19 Oct-19 Nov-19 Dec-19 Jan-20 Feb-20 Mar-20 Apr-20 May-20 Jun-20 Jul-20 Aug-20 Sep-20
Electricity consumption, TWh DAM, EUR/MWh
Beginning of the COVID-19
strict nationwide lockdown
Electricity prices and consumption before and after COVID-19 lockdown
Source: Market Operator, Ukrenergo, EY analysis and calculations
The COVID-19 strict nationwide lockdown was enacted from March 12 till May 11,
2020. During this time, the electricity consumption (temperature-adjusted) has
decreased by 5% compared to the previous year. At the same time, the DAM price
dropped following a decrease in DAM demand. It was identified that DAM demand
decrease was faster than overall consumption reduction (explained by UAH FX rate
depreciation and changes to the balancing market rules from March 1, 2020 which
led to flow of demand from DAM to IDM and resulted in DAM price decrease).
In April 2020, the first month after the implementation of the strict lockdown in
Ukraine, overall electricity consumption and load decreased by 7% and 11%,
correspondingly, compared to April 2019. The most significant drop was noticed in
industry consumption - 10%. Moreover, consumer demand has flown to a
household subsector of consumption that shown increase equal to 7%. The strict
lockdown was abolished, electricity consumption and load in September 2020 was
resumed almost in full - decreased by 2% and 1% compared to the previous year.
COVID-19 impact
DAM prices and Generation 6-months relative change
0
5
10
15
20
25
30
35
40
0
10
20
30
40
50
60
70
Ukraine Hungary SlovakRepublic
CzechRepublic
Romania Poland France
Price, Oct-19, EUR/MWh Price, Apr-20, EUR/MWh Generation, Oct-19, TW/h Generation, Apr-20, TW/h
-25% -56%
-54%-50%
-56%-37%
-65%
Source: Market Operator, Ukrenergo, ENTSO-E, HUPX, EY analysis and calculations
► The decrease of DAM demand and DAM price during March 2020-June 2020
was mostly driven by changes to the market rules in March 2020. The COVID-
19 lockdown effects did contribute as well but did not have a decisive role.
► Linking the measures targeted at the electricity market and the epidemiological
situation in Ukraine seems to be irrational, as the situation after the lockdown
being gradually lifted did not affect the market performance, and DAM demand
continued to decrease. The market situation was mostly driven by problems in
the PSO design and balancing market rules, not the quarantine measures.
► he DAM price and peak load decrease in Ukraine were also lower if compared
to other EU countries. This confirms that Ukraine’s wholesale market price is not
a product of effective competition but rather a product of administrative
regulation in a highly concentrated market.
Conclusions
Source: Low Carbon Ukraine “Monitoring of Electricity Market Opening”
2.2.2. Power

National Strategy to Increase Foreign Direct Investment in Ukraine | Section 2.2: Energy | Page 50 of 88
Electricity market opening was aimed at shifting to a competitive liberalized
model in accordance with European legislation and best practices, but…
Current market-wide bid caps encumber long-
term investment signals.
66%
53%
BEI
IPS
Prices at cap
12-month hourly prices distribution
33 33 37 38
5867
48 49 50
26 27 28 28 31 33 34 3441
Peak Offpeak
Source: Low Carbon Ukraine “Monitoring of Electricity Market Opening”
Average DAM prices in European countries,
Jul19-Jun20, EUR/MWh
UA
Price caps design Cross-border trading limitationsMarket power goes uncheckedDesign of the PSO for households
The existing PSO design does not correspond
to liberalized market model. It violates the EU
acquis and provides for the large distortions:
The Ukrainian electricity market is highly
concentrated and resembles an oligopoly
structure.
Regulation of market power is not executed
evenly and affects only state-owned
companies.
State-owned companies are obliged to
disclose information due to existing
regulations which allow unburdened market
participants to amend their strategies.
Because energy from RES is marketed by a
solo market off-taker, it does not increase the
competition level within the market.
DTEK is able to exercise market power across
various market segments due to its vertically
integrated structure. It gives the possibility to
influence both demand and supply.
However, the market power is obvious in the
BEI trading zone, it is not yet regulated.
In the IPS, imports from Russia are a political
problem and are now forbidden. Competition
with Russian and Belarusian imports can be
effective by reducing the market power of
existing companies, given that Ukraine's
security of supply is not jeopardized.
DTEK exercises its market power and covers
more than 70% of demand in the BEI, due to
the small size of the trading zone, existing
balancing restraints and cross-border auctions
rules, which are under development.
During some periods, both demand and
supply in the DAM exceeded the BEI’s total
load. It may be related to re-export activities
and may indicate profit shifts to other
jurisdictions or schemes of tax optimization.
950
725
1,000
750
600
650
700
750
800
850
900
950
1,000
1,050
Energoatom Ukrhydroenergo
De-facto occurred minimum price cap for
state-owned generators based on their
operational cost of production in 1H2020
It provides opportunities for manipulation
for DSOs and universal services suppliers
(USSs) within one vertically integrated
group and offers them a competitive
advantage over other suppliers, giving
exclusive access to cheap electricity.
1
Changes policy decision-making process,
by simulating the administration towards
price regulations.
2
Constraints competition in terms of
different market segments
3
It gives an advantage to market players,
which are not under PSO regulation and
allows for strategic bidding and arbitrage
across market segments.
4
95%77% 70%
5%23% 30%
min load max-summer max-winter
DTEK non-DTEK
Implementation of price caps is an effective
tool to restrain rapid price growth. Whereas,
imposition of such measures provides for
dictation of market prices in a highly
concentrated market.
Despite price caps effectively limit prices at the
predefined level, the average prices are higher
than the ones at the European markets.
As market players are able to adjust and bid
close to price caps due to tight market
concentration, there is no real competition.
Price caps inefficiently shape demand
patterns as they do not reflect scarcity.
Potential coverage of BEI demand
0
1,000
2,000
3,000
4,000
Jan20 Feb20 Mar20 Apr20 May20 Jun20
Low ModerateHigh [IPS] Supply[IPS] Demand [BEI] Supply[BEI] Demand
HHI market concentration index on DAM
UAH/MWh
Additional issue is a charge for dispatching
set for all export volumes which creates extra
financial pressure on traders and contradicts
European market rules.
2.2.2. Power

National Strategy to Increase Foreign Direct Investment in Ukraine | Section 2.2: Energy | Page 51 of 88
…with a lot of restrictions, market gaps and distortions, the market
performance is still far from perfect and further improvements are required
The origin of some debts is still unaddressed, which affects
the new market model.
Debts accumulation
Because of the improvident political decisions and inefficient
market regulations new debt has accumulated too fast.
PSO for households’ debt and RES debt are difficult to fund
through established mechanisms due to the GB dilemma and
political reluctance to direct costs on final consumers.
Inefficient market design, price caps and delays in MMS
software implementation are the reasons behind balancing
market debt
To prevent market collapse where small players are hurt the
hardest, debts’ sources must be addressed and financed.
RES Duck curve
Source: Low Carbon Ukraine “Monitoring of Electricity Market Opening”
Debts accumulation scheme
Other problems of market design
PS
OB
ala
ncin
g M
ark
et
TS
O T
ariff Consumers
Ukrenergo
BRP BSP
Other
EA GB
1.3 2.5
0.2 0.5 0 1.4
GB
0.2 1.4 0.2 1.7 0 1.7
0 7.7
1.4 19.1
RES
0 15.9
Debts in UAH bn (VAT incl.) as at
01/01/20 07/01/20
0
2,000
4,000
6,000
8,000
10,000
12,000
14,000
16,000
18,000
0 2 3 4 5 6 7 8 9 10 11 12 13 14 15 16 17 18 19 20 21 22 23
NPPs CHPPs TPPs HPPs PSPPs RES
Daily load as of 8/23/2020, MW
Source: NPC “Ukrenergo”
The output of RES should be limited, whereas payments for
generated electricity are to be made in full. To solve this issue
highly-maneuverable capacities need to be installed.
There are peak and off-peak electricity consumption periods
within a day, during which consumption sharply changes. To
balance this changing demand, power generating companies
ramp up and down power plants to control their load and meet
the existing demand.
Stations on RES are limited in working hours. As RES meets
more demand during the day, less conventional energy is
needed. However, RES production decreases at night,
conventional energy needs to ramp up quickly to meet
demand in the evening. Due to that reason, other power
plants are underloaded, during the working hours of RES.
Potential abuse in auctions rules for state-
owned power generation companies
Existing auction rules for state-owned companies
contain significant flows that can lead to collusion
and / or corruption. It may result in shortfall of
revenue or even losses for state-owned
enterprises. The design of the auction allows to
create fictitious barriers to entry, restricts access to
electricity for small players (to the benefit of the
larger ones), and significantly decreases market
competition. It leads to lower sales prices and
distorted market signals. The average sales price
of the state-owned PJSC «Centrenergo» was 10%
below the DAM price, which could indicate a
potential abuse of the auction design. This spread
could have enabled buyers to resell electricity with
a high margin in the future. The same situation can
be observed for Energoatom. Only corporatization
and implementation of best corporate governance
practices will eliminate such abuses.
Market design encourages gaming/strategic
bidding and market manipulations
Balancing and reactive regulatory changes have
created gaps in the market. Although the first
loophole was eliminated in March 2020,
inefficiencies remain. Existing regulations were
insufficient to prevent strategic biddings. Ensuring
and intensifying downward regulation in a
balancing market is not representative of actual
physical regulation; i.e. turning generating units off.
Balancing market rules, together with the design of
price caps, create the possibility for manipulation
and distort DAM. DAM can be used by market
participants to get a profitable BM price below their
marginal cost. Strategic biding is possible due to
restrictions for Energoatom and GB compared to
other market participants. Existing market
regulations have shortcomings and can lead to
increased CO2 and system costs.
2.2.2. Power
National Strategy to Increase Foreign Direct Investment in Ukraine | Section 2.2: Energy | Page 52 of 88
Legal barriers for investments in power subsector
Limitations in application of feed-in tariff
► Debts under the PPAs. Reportedly, the State Company
“Guaranteed Buyer” had difficulties paying its debts under the
PPAs at feed-in-tariff due to the insurmountable debt of NPC
“Ukrenergo” and issues with financing from the state budget
► Feed-in tariff rate reduction. In 2020, the law retrospectively
reduced the feed-in tariff, which caused widespread discontent of
investors leading to potential arbitrations
► Uncertainty in the procedure for setting support quotas for
RES. A new system of RES development incentives is based on
support quotas. According to the Law of Ukraine "on Alternative
Energy Sources“ (Article 9-3) and Procedure for Holding
Auctions for the Distribution of Support Quotas the quotas and
auction schedule for each year are determined by the CMU by 1
December based on an application from the Ministry of Energy.
The preparatory stage for setting quotas has uncertainties in the
stakeholder coordination mechanism (regarding terms of
approvals and provision of comments). Complexities in multiple
stages of the procedure make it prone to the risk of not meeting
the respective deadlines, which may in turn lead to delays in
auctions
► Potential remedies: initiatives to address the aforementioned
issues may include (i) ensuring settlement of debts under the
PPAs at feed-in tariffs, (ii) regaining investor’s trust by
introducing doable guarantees with clear possibility of their
transparent application in the nearest mid-term perspective (iii)
streamlining the quota establishment procedure
Suspended privatization of “Oblenergos”
► Due to the pandemic, the auctions for the privatization of large
objects, including five state-owned distribution system operators,
were suspended for the quarantine period under the law
► Potential remedies: unlock the privatization considering the
investment enabler: RAB-tariff
Uncertainty with PSO tariff at electricity market
► The tariffs for households are set by the governmental
regulations establishing PSO (effective until 1 April 2021) for
State Company “Guaranteed Buyer”, electricity producers, and
universal service providers. These tariffs are not quite feasible
from an economic perspective and lead to the reduction of
income generated by the major state-owned generation
companies - SE “NNEGC Energoatom” and PJSC
“Ukrhydroenergo” as well as universal service providers
► It is not clear whether the PSO system will be extended for the
next year and further
► Potential remedies: we understand that the PSO mechanism
was meant to be transitional and would eventually move on to a
market model. Development and communication of the transition
plan from PSO to market model would be advisable in this
respect
2.2.2. Power

National Strategy to Increase Foreign Direct Investment in Ukraine | Section 2.2: Energy | Page 53 of 88
Considering described analysis we identified the following key factors
influencing the potential attractiveness of the subsector for investors
4% 4% 4% 5% 5%0
10,000
20,000
30,000
40,000
50,000
2021 2022 2023 2024 2025 2026 2027 2028 2029 2030
NPP HPP CHPP Gas-fired TPP TPP Maneuverable
Implementation of the new electricity market model
The competitive European model became functioning in July 2019
including: DAM, IDM, balancing market and ancillary services. Now
consumers have a right to choose supplier without any limitations.
Introduction of the RAB-methodology for DSOs
In August 2020 NEURC adopted the new methodology for DSOs’
tariffs calculation to encourage investments in the modernization of
DSOs’ assets. 22 DSOs have already got new tariffs in November.
Upcoming full integration with ENTSO-e after 2025
TSO is leading the ongoing process of full technical integration with
ENTSO-e which will unlock the unlimited potential of European
electricity market for power generation companies and traders.
Expected elimination of PSO model for households
The cross-subsidization of households should have been canceled
as a result of implementation of the new market model, but it was
transformed to PSO. Its elimination will heal existing market gaps.
Capacity auctions for maneuverable capacity and storages
According to TSO, UES needs up to 2 GW of peaking maneuverable
capacity and 2 GW of storages. Its construction will be supported by
the government through the mechanism of open capacity auctions.
The difference in profits envisaged by RAB and cost+ methodologies
Comparison of tariffs for household for different countries, EUR\MWh
Installed capacity of traditional generation, TSO’s target scenario, MW
1,176 1,562 1,174 1,693 1,437 1,936
915
1,256
694
968 887
1,197
2020, cost+ 2021, RAB 2020, cost+ 2021, RAB 2020, cost+ 2021, RAB
Ternopiloblenergo Rivneoblenergo Kirovogradoblenergo
Profit, UAH m Tariff, UAH/MWh
0.05 0.15 0.15 0.10 0.17 0.11 0.22 0.30 0.19 0.22 0.18
0.21
0.17
Ukraine Poland Romania Hungary Slovakia Moldova UK Germany France Spain Sweden
EU average tariff (27 countries) Median through chosen countries
2.2.2. Power

National Strategy to Increase Foreign Direct Investment in Ukraine | Section 2.2: Energy | Page 54 of 88
2.2.3. Natural gas

National Strategy to Increase Foreign Direct Investment in Ukraine | Section 2.2: Energy | Page 55 of 88
Ukrainian natural gas potential is still not revealed, and ongoing market
liberalization could benefit both society and business in the long run
Exploration and production include the search for
potential underground or underwater fields of
crude oil and natural gas, drilling of post holes, as
well as further drilling and operation of drilling
wells, production of crude oil, and natural gas.
The exploration and production sector includes
gas production from non-traditional sources.
Gathering, processing, transportation, and storage
of crude oil and natural gas make up the
midstream sector. Fractional plants that remove
gas condensate liquids from oil and gas streams
are generally considered to be components of the
Transportation, Storage, and Processing sector.
Sales of crude oil and natural gas are also taking
place in this business segment.
Oil refinery and sales of petroleum products
include refinement of crude oil, crude natural gas,
natural-gas stripping as well as distribution and
marketing of products derived from crude oil and
natural gas. Products in this sector reach
consumers through petroleum products such as
gasoline, kerosene, jet fuel, diesel fuel, fuel oil,
liquid fuels, lubricants, wax, asphalt, natural gas,
and LNG, as well as hundreds of petrochemical
products.
Exploration and productionTransportation, storage
and gas processing
Oil refining and sale of
oil products and gas
Exploration Drilling ProductionElectricity
production
Filling stations
Industry Jet fuel
Asphalt
processing
Heating
…Other consumers
Gathering
StorageStorage
Oil processing Gas processing
Gathering
2.2.3. Natural gas

National Strategy to Increase Foreign Direct Investment in Ukraine | Section 2.2: Energy | Page 56 of 88
Current legislative framework and legislative initiatives (1/2)
Association Agreement between the European Union
and UkraineProvides for integration of gas sector of Ukraine into EU and
harmonization of market rules. Key provisions relate to operation of
the gas and oil market, equal competition in the market, transparent
price and tariff policies, safety requirements, information about gas
supplies, buyers and consumers
The Code of Ukraine on Subsoil
► Provides that mineral resources of state significance (including those with oil and gas potential)
may only be transferred into temporary use based on permit for subsoil use
► Sets out various rules regarding the subsoil use (key terms and conditions, powers of state
authorities, grounds for termination/suspension of subsoil use)
Law of Ukraine "On Oil and Gas"
permits to use oil and gas resources are issued based on competitive procedure involving
evaluation of financial, technological and other capabilities of candidates. Rights under the permit
may not be alienated, transferred or delegated to other parties
Law of Ukraine "On Natural Gas Market"
► Establishes the rules on competition in the gas market
► Stipulates that the courts settling disputes in his area should take into account precedents,
cases and practice of EU Court, European Commission and Secretariat of Energy Community
► Provides that transportation, storage and supply of gas are all subject to licensing
► Sets out special limitations on ownership of energy infrastructure: privatization or concession
of GTS objects owned by the state is prohibited, GTS cannot be privatized, gas storages may
be privately owned
Law of Ukraine "On Customs Tariffs" sets customs tariff on imported gas at 0% rate
Procedure for Issuing Special Permits for Subsoil Use, approved by
Resolution of the CMU No. 124 dated 19 February 2020
Provides terms and conditions for issuing special permits for subsoil use without a tender and the
list of respective categories of usage for which such permits can be granted
Procedure for Conducting Auctions for the Sale of Special Permits for
Subsoil Use, approved by Resolution of the CMU No. 993 dated 23
September 2020
Sets the rules of procedure for carrying out electronic auctions for the sale of special permits for
subsoil use
Order of the MFU "On Approval of Amendments to Regulation of the Ministry
of Finance of Ukraine" No. 292 dated 27 February 2017
Provides that starting from 2017 the gas storage facilities will be subject to the regime of the customs
warehouses. This means that the gas that owned by a foreign or Ukrainian entity is stored under
customs control, with conditional full exemption from customs duties and without the application of the
non-tariff regulations
Licensing Conditions for Conducting Economic Activity on the Natural Gas
Market approved by Resolution of NEURC No. 201 dated 16 February 2017
sets out the rules for obtaining a license for transportation, storage (injection, off-taking), distribution
and supply of natural gas
Gas Transmission System Code approved by Resolution of the NEURC No.
2493 dated 30 September 2015
► Sets forth the market rules for gas transmission services
► Stipulates that a GTS operator provides services to a gas market participant on contractual
basis
► Introduces the principle of balancing neutrality and balancing neutrality charges
► Stipulates that interconnectors’ capacities are distributed via electronic auction
Gas Distribution Systems Code approved by Resolution of the NEURC No.
2494, dated 30 September 2015
► Provides that a gas distribution system operator is an entity that carries out activities on
distribution of natural gas by the gas distribution system based on license for the benefit of third
parties (customers) and specifies the principles of the operator’s business
► The gas distribution systems can be private
► The operators carry out their activities based on principles of equal competition and goodwill
Gas Storages Code approved by Resolution of the NEURC No. 2495 dated
30 September 2015
► Governs the activity of market participants in respect of use of gas storages
► Sets out safety regulations
► Provides that gas storage facilities operate based on principles of equal competition and
goodwill
2.2.3. Natural gas

National Strategy to Increase Foreign Direct Investment in Ukraine | Section 2.2: Energy | Page 57 of 88
Current legislative framework and legislative initiatives (2/2)
Short haul
In 2019 Section IX of the GTS Code was supplemented with
Subsection 8 introducing a new type of service provided by
LLC “Gas TSO of Ukraine” – “short haul” or “facility with
limitations”, allowing foreign gas traders to use Ukrainian GTS
for transmission of gas between European countries
“Short haul” may be combined with use of gas storages under the regime of customs
warehouse for up to 1095 days without payment of taxes and duties. The service allows
to transmit gas between Poland, Romania, Slovakia and Hungary. In order to use short-
haul, shippers should sign a template contract with TSO, register on TSO’s informational
platform, receive a separate shipper-code for the short-haul product, book a monthly
product or work on a day-ahead basis and prepare a preliminary customs declaration
Law of Ukraine "On Amendments to Certain Legislation of Ukraine on
Deregulation in the Oil and Gas Industry"
Cancelled 20 permits required for subsoil use in 2018, particularly, mining allotment for
oil and gas production
Law of Ukraine "On Amendments to the Law of Ukraine "On Public
Procurement" Regarding the Purchase of Natural Gas"
Adopted by the Parliament on 2 December 2020 and will be come in force after its
promulgation, and certain provisions on 1 July 2021. This law reconsiders the approach to
accessing gas commodity exchange allowing the GTS Operator (GTSOU) to make daily
purchases on the gas trading exchange to balance the system better, based on
production and technological costs. Access is granted to gas commodity trading platform
for purchasing gas for balancing purpose. This is expected to improve balancing
procedure and secure transparent pricing of balancing neutrality charge
Draft Law of Ukraine No. 2553
introduces kW as a gas measurement unit to indicate the total calorific value of gas sold
and transported. In this way, consumers will pay not for the volume of gas consumed, but
for the energy consumed, because gas differs in its chemical and physical characteristics.
However, the gas itself must meet the standards and requirements of energy efficiency,
so such a change will not lead to a significant increase in quality, but rather aims to
harmonize Ukrainian market regulations with EU legislation
Draft Law of Ukraine No. 3800
Envisages the possibility of using bank guarantees to ensure payment for natural gas
transmission services and introduce special accounts that will automatically distribute
consumers’ payments between the GTS operator and DSOs
Draft Laws of Ukraine No. 4187 and No. 4187-1 regarding the simplification
of subsoil use
► Provide for creation of interactive map of minerals of Ukraine
► Ban investors from Russian Federation from subsoil use
► Stipulate that documents for tender should be submitted in electronic form only
► Abolish the procedure for approving the allocation of land by a local council
► Allow alienation (including sale) of permits for subsoil use
► Amend the list of rights and obligations of a subsoil user and slightly change the
grounds for termination and suspension of a permit
New Code of Ukraine on Subsoil
Ministry of Environmental Protection and Natural Resources of Ukraine developed and
published for public consideration the new edition of the Code of Ukraine on Subsoil
aimed at boosting the development of extraction industry in Ukraine and eliminating the
existing drawbacks in the area of the subsoil use. The new version of the Code:
► Implements EU Directive № 94/22 on the conditions for granting and using
authorizations for the prospection, exploration and production of hydrocarbons
► Provides for digitization of geological information and free access to it
► Amends provisions in respect of geological exploration of subsoil
► Changes the validity terms for permits for subsoil use
► Introduces the transparent procedures for the allocation of permits for subsoil use
through auctions as well as separate non-auction procedures
2.2.3. Natural gas

National Strategy to Increase Foreign Direct Investment in Ukraine | Section 2.2: Energy | Page 58 of 88
84 89 91 84 79 79 45 37 37 37 38 36 35 31 33 33 33 25
102 104 109 10997 96 102 102 96 93 85
76 76 79 72 76 80 76
May-19 Jun-19 Jul-19 Aug-19 Sep-19 Oct-19 Nov-19 Dec-19 Jan-20 Feb-20 Mar-20 Apr-20 May-20 Jun-20 Jul-20 Aug-20 Sep-20 Oct-20
Ukraine Europe
Ukraine has enough natural gas reserves to materially substitute import
and in case of domestic production increase to become net-exporter
Source: BP Report 2020, EY analysis
Despite the country’s more than 100-year history of
oil and gas production, Ukraine remains rich in
conventional gas reserves and possesses vast
untapped unconventional potential. The R/P ratio is
close to 56 years illustrate that there are very
substantial remaining resources. This suggests that
Ukraine has the geological potential not only to
achieve energy self-sufficiency, but also itself to
become a major gas supplier to Europe. In Ukraine,
only 2% of natural gas reserves are extracted every
year, versus at least 4% as in other countries.
Plentiful resources, extensive gas transportation
infrastructure and the low intensity of natural gas
extraction indicate a huge opportunity to increase
natural gas production in Ukraine to cover local
demand and support future gas exports to Europe.
Top EU countries by proven natural gas
reserves and their factor of production, bcm
Places of natural gas occurrence
2% 8% 14% 20% 10% 4%
1,136 1,500 200 200 100 100
Ukraine Norway Netherlands UK Romania Poland
Shebelynka gas field
Zakhidno Krestischenske
gas fieldEfremivske gas fieldYablunovske gas field
Melekhovske gas field
level of depletion: 82%
level of depletion: 89%
level of depletion: 82% level of depletion: 90%
level of depletion: 79%
Ukrainian Gas fields
Quantity of active drilling rigs in Ukraine vs Europe*
Source: Baker Hughes, EY analysis
Note: At the initiative of the AGPU, Ukraine was included in the world-famous index of operating drilling rigs Baker Hughes Rig Count in May 2019.
The most prospective areas for the discovery of
new deposits in southern Ukraine are the waters
of the Black and Azov Seas. In the
western/eastern parts of Ukraine- undiscovered
deposits at great depths in the Dnipro-Donetsk
and Precarpathian oil and gas regions.
Precarpathian gas region
Black Sea gas region
Azov Sea gas region
Dnipro-Donetsk gas region
2.2.3. Natural gas

National Strategy to Increase Foreign Direct Investment in Ukraine | Section 2.2: Energy | Page 59 of 88
Internal natural gas market is currently balanced and closely connected
with European adjacent markets through import and transit activities
29.9Supply side
14.2Import
20.7Extraction
-5.0Gas storage
7.0Private
7.2“Naftogaz”
14.9“Ukrgazvy-
dobuvannia”
1.2 “Uknafta”
4.6Other
29.9Demand side
25.4Consumption
4.5Technological
consumption
14.1Households
8.1Industry
0.4Public and religious organizations
2.8DHCs for industry, public and religious organizations
1.9“Ukrtransgaz”
0.9 Distribution networks
1.3“Ukrgazvydobuvannia”
0.4“Ukrnafta”
9.5
Households directly
4.6
DHCs - households
The state of the gas market and actions performed by market participants are defined by a gas balance – a final quantitative correspondence between supply and
demand (the general equation of the gas balance is shown above). At the same time, TSO is responsible for balancing supply and demand of gas in the GTS.
Equation of the gas balance
Source: Naftogaz
89.6Natural gas transit
21
114
4028
10 5 5 4 3 7
Gas extraction benchmarking 2019, bcm
25
5
79
37
11
8971
20
43 36
Gas consumption benchmarking 2019, bcm
2.2.3. Natural gas

National Strategy to Increase Foreign Direct Investment in Ukraine | Section 2.2: Energy | Page 60 of 88
Demand for natural gas in Ukraine shows a steady decline due to the warm
weather, reduction in industrial production volumes, efficiency improvement
0.8
20.9
10.6 32.3 15.4
9.4
2.8
4.7
2.5% 64.7% 32.8% 100% 47.7% 29.1% 8.7% 14.6%
20.5
14.1 34.6 15.8
9.3
2.4
4.4
2.7
7.8%59.2% 40.8% 100% 45.7% 26.9% 6.9% 12.7%
20.7
14.2 5.0
29.9 14.1
11.3
4.5
69.2% 47.5% -16.7% 100% 47.2% 37.8% 15.1%
In 2019, Ukrainian companies produced 20.7 bcm of
gas: 80% was provided by the companies owned by
NJSC “Naftogaz of Ukraine” (Ukrgazvydobuvannya,
Ukrnafta and Chornomornaftogaz) and 20% by private
producers (DTEK, Burisma, UNB, PNGV and others).
As historically the total consumption was above the
production, traders and suppliers used to cover the
lack of domestic resources by import. Gas imports to
Ukraine grew to 14.2 bcm, which is 34.9% higher
compared to 2018. Ukraine has been importing gas
exclusively from the European market for more than
four years. Additionally, some part of gas was
withdrawn from gas storages (5.0 bcm). These three
sources define the supply side (29.9 bcm).
Use of gas begins with technological consumption of the E&P companies that transform the production volumes into marketable ones. Together with imported volumes and natural gas withdrawn from storages, they are transported by TSO (high-pressure pipelines) to DSOs networks entry points (low-pressure pipelines), adjacent TSO cross-border entry points (export of natural gas could be performed by traders and suppliers) and in some cases to direct consumers. The process of gas transportation is also accompanied by technological consumption, so TSO must buy natural gas to cover its own consumption at free competitive prices. DSOs (44 companies, 20 of them belong to one group RGC) must cover its technological consumption as well. Together, the technological consumption (E&P, TSO, DSOs) amounted up to 4.5 bcm in 2019.
As a result, marketable volumes are converted to consumed volumes (25.4 bcm in 2019), which could be divided in four main groups: households (incl. DHCs that consume gas for households needs); industrial enterprises; public and religious organizations; and DHCs (consuming gas for non-households needs). To ensure the reliability of the supply, the technical part must be in line with the commercial one, which could be divided into wholesale and retail segments. On the wholesale market, E&P companies sell gas to market participants, traders buy gas from other participants as well as from foreign traders, DSOs and TSO buy gas to cover their technological consumption, and suppliers buy gas to cover the demand of its consumers. On the retail market, the different types of final consumers buy gas from its suppliers.
20192017 2018
Supply sideSupply side Demand sideDemand side Supply side Demand side
Source: Naftogaz, EY analysis
Gas system balance, bcm
Extraction Import Balance Households Industry Other consumers Gas for technological needs UGS
2.2.3. Natural gas

National Strategy to Increase Foreign Direct Investment in Ukraine | Section 2.2: Energy | Page 61 of 88
Internal gas production is not enough to cover the demand, so one of the
key targets is to stimulate additional investments, including through PSA
14.5 14.6 15.3 15.5 14.9
1.5 1.3 1.1 1.1 1.2
3.9 4.2 4.1 4.4 4.6
19.9 20.1 20.5 21.0 20.7
2015 2016 2017 2018 2019
Private companies Ukrnafta Ukrgasvydobuvannya
Structure of Ukrainian gas production, bcm
Source: Naftogaz, EY analysis
In 2019, UGV, which is part of Naftogaz, produced
70.9% of Ukraine’s total gas volume. This includes 1.3
bcm used for technological consumption. The decline
in production by 1.5 bcm in comparison with 2018 was
due to gas reserves depletion in major fields.
As at May 29, 2019, UGV and Vermilion signed a
memorandum of joint participation in tenders for
PSAs, which will be held at several sites in
accordance with the decisions of the CMU of
December 18, 2018, as well as about the prospects for
further cooperation. Nevertheless, as of now expected
PSA is not signed. Also the company is considering
the option to go public (IPO) which potentially could be
a great opportunity for FDI attraction.
UGV production in 2019 by enterprise
56%39%
5%
56%
39%
5%
56%
39%
5%
Shebelynkagazvydobuvannya
Poltavagazvydobuvannya
Lvivgazvydobuvannya
2019
2017
2018
Source: Naftogaz, EY analysis
2019
14.9 bcm
In 2019, Ukrnafta, 50%+1 share is owned by Naftogaz
Group, increased gas production to 1.16 bcm, which is
7% more compared to 2018. The volume of
marketable gas was 830.8 tcm. The Company
operating fund includes 24 drilling rigs, owns one of
the largest filling stations network in Ukraine. As of
January 1, 2020, Ukrnafta had 537 filling stations.
Ukrgasvydobuvannya UNBUkrnafta
DTEK Oil&Gas is the largest private gas company in
Ukraine. DTEK Oil&Gas produced 1.66 bcm of natural
gas in 2019, up by 0.66% year on year, which broke
the record both for the company and private gas
production sector of Ukraine.
DTEK Oil&Gas Burisma
Burisma Group is a vertically integrated holding
engaged in the exploration, production, service, and
sale of hydrocarbons. (15% - market share among
private gas producers). Gross year production in 2019
was equal to 0.7 bcm (1.1 bcm in 2018).
Production by private companies 2019, mcm
1,660
735
697
369
281210
131
517
Total production by private
companies in 2019 was
equal to 4.6 bcm.
DTEK Oil&Gas
UNB
Burisma
Smart
Energy
PPCGeo
Alliance
KUB-
GAS
Others
Gas sector in Ukraine distinguishes
itself by low market competition level.
Internal gas production is not enough
to meet the existing demand in full.
That is why, natural gas is imported
from Europe to cover the gap.
Source: Naftogaz, EY analysis
PrJSC "MC "Uknaftoburinnya" is one of the leading
private oil and gas production companies in Ukraine.
The company operating fund includes 28 wells with
depth of 3 800 - 5 750 m. Sakhalin field is located in
the Krasnokutsk area of Kharkov region and belongs
to medium-sized fields with a complex geological
structure.
2.2.3. Natural gas

National Strategy to Increase Foreign Direct Investment in Ukraine | Section 2.2: Energy | Page 62 of 88
Procedure for executing PSAs
Submission of information
about the winner to the
CMU. Determination of
the winner by the CMU
Within two months
after the CMU’s
decision, the
Interdepartmental
Commission
publishes the
announcement notice
21
Winner is determined taking
into account participant’s
financial security and
international experience,
proposed financing conditions
and technological solutions,
level of rational use of natural
resources and proposed
environmental measures
CMU takes decision to hold a
tender, which determines, inter alia,
its term, conditions and procedure,
subsoil areas in respect of which
the tender is announced, deadline
for applications, tender fees and list
of tender documents
Deadline for
application must not
be shorter than one
month after
publication of the
tender announcement
notice
Closing of the application
procedure for participation in
tender
The term of tender
(until determination
of the winner by the
CMU) should not
exceed three
months from the
deadline for
submission of
tender applicationsExecution of
the PSA
The period between
the recognition of the
winner and signing of
the PSA should not
exceed 12 months
Under PSA the Government grants to the investor access to exploration and extraction of minerals,
including natural gas in a certain area (areas) of subsoil, and the investor performs the assigned work
at its own expense and at its own risk, with a subsequent compensation of expenses and receipt of
payment (remuneration) in the form of a portion of profitable products
PSAs may be executed in respect of certain subsoil areas within which deposits of mineral resources
are located, including subsoil areas within the continental shelf and the exclusive (maritime) economic
zone of Ukraine
The validity term of PSA is determined by the parties, but may not exceed fifty years from the date of its
signing
The state grants and ensures issuance of all necessary permits and provides the land for
implementation of the PSA
The PSA is executed on a competitive basis based on the results of tender initiated by the CMU or
upon the request of the investor to the CMU or to the special Interdepartmental Commission (such
request should be considered within three months)
Tender for a particular subsoil area is held if any of the following conditions are met (paragraph 2 of
Article 6 of the PSA Law):
1. It is unprofitable for the subsoil users and the state to continue the development of mineral deposits
due to existing factors; 2. Lack of state funding and technical means for development of new large
mineral deposits; 3. Need to attract special high-cost technologies; 4. Need to provide the regions with
their own fuel and energy raw materials or to create new jobs in the areas with low employment rate; 5.
Need to introduce the latest technologies and equipment; 6. Need to develop mineral deposits, the
development of which is carried out in particularly difficult conditions (sea areas, hard-to-reach deposits
etc.); 7. Need for additional exploration, additional or in-depth exploration of the subsoil area.
In the case of subsoil deposits with a small forecasted margin, PSA may be executed without a tender
Draft PSA should be prepared by investor or Interdepartmental Commission (upon decision of the
CMU) within three months following official publication of the tender results and is subject to mandatory
examination of financial, legal and other issues. Procedure for preparing a PSA is governed by the
Instruction for Drafting, Negotiating and Signing a Production Sharing Agreement
After submission of draft PSA to the Interdepartmental Commission (if investor prepared the PSA
independently) the Commission registers it. The Commission provides the investor with conclusions,
comments, results of examinations regarding the draft PSA or with a new version of the draft PSA that
should be further reviewed by the investor. At the completion stage the draft PSA is approved by
investor, CMU and respective local councils where targeted deposits are located. The final draft is
submitted to the CMU and investor for signing
Tender procedure (according to the Articles 7, 10, 11 of the PSA Law and Instruction for Organizing a Tender for the Execution of a PSA)
3 5 64
Recent investment
Aspect Energy and SigmaBleyzer
(acting jointly through a special-
purpose project company Ukrainian
Energy, L.L.C.) signed the PSA
with the State of Ukraine on 14
January 2021
The contract period is 50 years for
the Varvynska block comprising
approximately 3,500 km2
USD 39 m of investments are
expected during the first years of
the exploration period
2.2.3. Natural gas
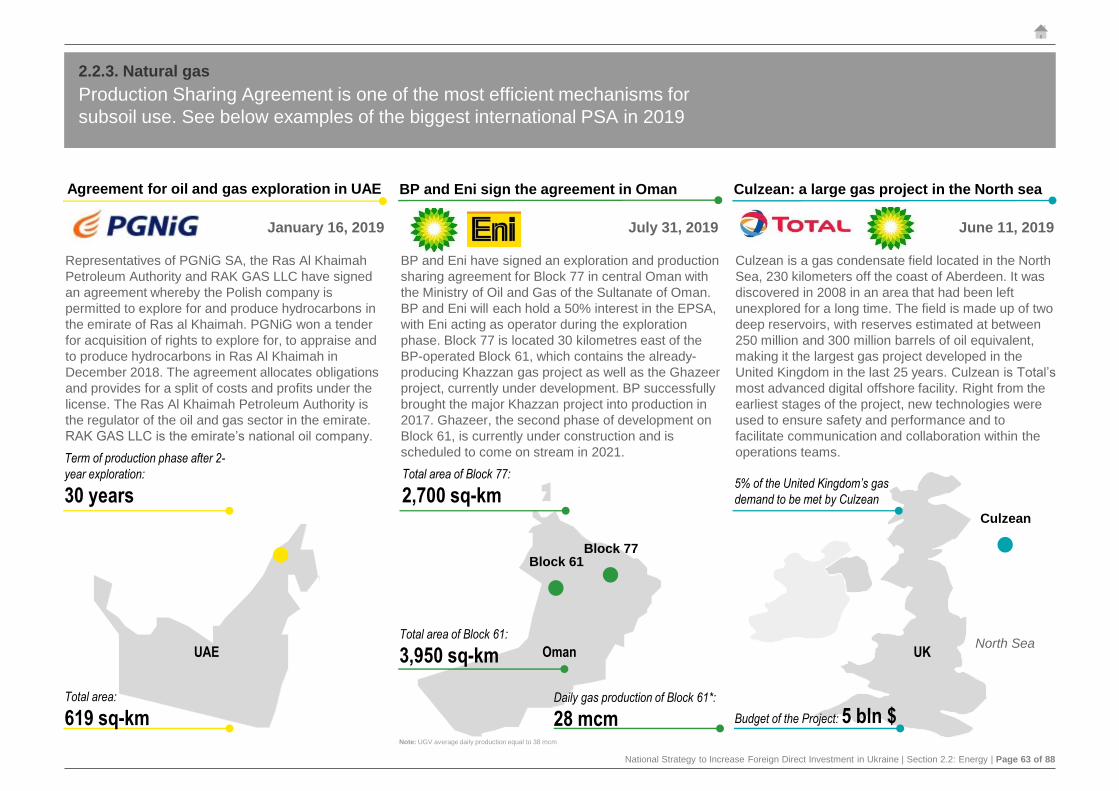
National Strategy to Increase Foreign Direct Investment in Ukraine | Section 2.2: Energy | Page 63 of 88
Production Sharing Agreement is one of the most efficient mechanisms for
subsoil use. See below examples of the biggest international PSA in 2019
Agreement for oil and gas exploration in UAE
Representatives of PGNiG SA, the Ras Al Khaimah
Petroleum Authority and RAK GAS LLC have signed
an agreement whereby the Polish company is
permitted to explore for and produce hydrocarbons in
the emirate of Ras al Khaimah. PGNiG won a tender
for acquisition of rights to explore for, to appraise and
to produce hydrocarbons in Ras Al Khaimah in
December 2018. The agreement allocates obligations
and provides for a split of costs and profits under the
license. The Ras Al Khaimah Petroleum Authority is
the regulator of the oil and gas sector in the emirate.
RAK GAS LLC is the emirate’s national oil company.
January 16, 2019
BP and Eni sign the agreement in Oman
July 31, 2019
BP and Eni have signed an exploration and production
sharing agreement for Block 77 in central Oman with
the Ministry of Oil and Gas of the Sultanate of Oman.
BP and Eni will each hold a 50% interest in the EPSA,
with Eni acting as operator during the exploration
phase. Block 77 is located 30 kilometres east of the
BP-operated Block 61, which contains the already-
producing Khazzan gas project as well as the Ghazeer
project, currently under development. BP successfully
brought the major Khazzan project into production in
2017. Ghazeer, the second phase of development on
Block 61, is currently under construction and is
scheduled to come on stream in 2021.
Culzean: a large gas project in the North sea
June 11, 2019
Culzean is a gas condensate field located in the North
Sea, 230 kilometers off the coast of Aberdeen. It was
discovered in 2008 in an area that had been left
unexplored for a long time. The field is made up of two
deep reservoirs, with reserves estimated at between
250 million and 300 million barrels of oil equivalent,
making it the largest gas project developed in the
United Kingdom in the last 25 years. Culzean is Total’s
most advanced digital offshore facility. Right from the
earliest stages of the project, new technologies were
used to ensure safety and performance and to
facilitate communication and collaboration within the
operations teams.
Culzean
North SeaUK
5% of the United Kingdom’s gas
demand to be met by Culzean
Budget of the Project: 5 bln $
Oman
Block 77Block 61
Total area of Block 77:
2,700 sq-km
Total area of Block 61:
3,950 sq-km
Daily gas production of Block 61*:
28 mcm
UAE
Total area:
619 sq-km
Term of production phase after 2-
year exploration:
30 years
Note: UGV average daily production equal to 38 mcm
2.2.3. Natural gas

National Strategy to Increase Foreign Direct Investment in Ukraine | Section 2.2: Energy | Page 64 of 88
Subsoil use charge, especially for new wells, should be determined to make
investments in the E&P activities attractive compared to other countries
6%3.5%
1.5%
12%
56%
7%
30%
13%
3% 0.8%
Ukraine Norway Netherlands UK Romania Poland RussianFederation
Subsoil use charges for natural gas extraction in Ukraine and other
countries
Ukrainian natural gas subsoil use charges
Source: Global oil and tax guide, EY analysis and calculations
Subsoil use charge for the use of resources for the production of minerals
(royalties) are payable by all subsoil users producing mineral resources in Ukraine
(including during the exploration stage). Charges on hydrocarbons are calculated
as a percentage of the value of produced hydrocarbons. The value of produced
gas is determined as the average customs value of imported natural gas in the
reporting period calculated by the State Fiscal Service. In addition, the
Government of Ukraine introduced a ban for five years (till 1 January 2023) on
raising subsoil use charges for natural gas extracted from new wells.
Subsoil use charges:
We have selected top-5 European countries with the biggest proven reserves of
natural gas and the Russian Federation as the neighboring country with the
greatest reserves of natural gas all over the world to compare their tax legislation
regarding natural gas extraction
Two possible options for attracting foreign investors in the industry of gas
exploration and production are the introduction of a low level of subsoil use charges
for natural gas extraction or the Production Sharing Agreements (PSA). It was
noticed that PSA is applicable to countries with a higher level of royalties and
conversely.
PSA is
applicable
PSA is not
applicable
PSA is not
applicable
PSA is
applicable
PSA is
applicable
PSA is not
applicable
PSA is
applicable
Norway natural gas subsoil use charges
A company involved in extractive (upstream) activities within Norwegian territorial
borders or on the Norwegian continental shelf is subject to a tax rate of 56%
resource rent tax on the net operating profits derived from its extractive activities.
Netherlands natural gas subsoil use charges
The amount of charges depends on the
turnover. It is determined by multiplying
the units produced (mcm) with the
arm’s-length price at which the units are
sold. Subsoil use charges are paid on a
return basis. The ultimate filing date is 1
April of the year following the calendar
year in question.
Bracket, units of mcm Gas royalty
0-199 0%
200-599 2%
600-1,199 3%
1,200-1,999 4%
2,000-3,999 5%
4,000-7,999 6%
8,000 and above 7%
Russian Federation natural gas subsoil use charges
The fiscal regime applied in Russia to the petroleum industry provides for a
combination of charges (called mineral extraction tax (MET). Natural gas charge
equals RUB 35 (0.4 EUR) per tcm adjusted by coefficients. The rate of 0.8% was
calculated by the use of Gazprom's average natural gas price 2020 per tcm to
compare tax rates within countries under analysis.
29%
14% 12%6%
<5 km, current wells
>5 km, current wells
<5 km, new wells
>5 km, new wells
2.2.3. Natural gas

National Strategy to Increase Foreign Direct Investment in Ukraine | Section 2.2: Energy | Page 65 of 88
Preparation stage
► Preparation of tender proposals based on applications and supporting materials
► Reconciliation of the proposals for auction lots between the State Service of Geology and Mineral
Resources of Ukraine and the Ministry of Ecology and Natural Resources of Ukraine
► Issuance of an order approving a list of subsoil areas
► Issuance of a decision on holding the auction
Bidding stage
► Auction should be carried out via the system of electronic bidding in 90 calendar days following
the date of its announcement (for oil and natural gas)
► Registration of participant via web (electronic) platform and payment of the guarantee fee in the
amount of 20% of the lot price are required
► The auction is a repetitive process of raising prices, in three rounds in real time
► The winner is the bidder that submitted the highest bid for the lot, if it made at least one step of
the auction or, in the case of identical bids, – a bidder that submitted the bid earlier
► If the first auction is unsuccessful, the second auction should be scheduled with a reduction of
the lot’s price by 50%. If this auction does not result in the sale of permit, an auction with a step-by-
step reduction of price should be appointed
Closing stage
► Upon completion of the auction, electronic system automatically generates the auction minutes
for each lot and makes them publicly available through electronic platform
►The winner signs a protocol and pays the remaining price of the lot
► If the winner fails to sign minutes, pay the price or register a representative office in Ukraine (for
foreign companies), the electronic system automatically generates minutes designating second
best bidder as the winner
►Winner applies to the State Service of Geology and Mineral Resources of Ukraine with a proposal
to enter into the agreement on sale of permit. This agreement should be executed within 20
business days after issuance of the electronic auction minutes
Obtaining permits for subsoil use
According to the Code of Ukraine on Subsoil natural gas extraction should be carried out after
obtaining a special permit for subsoil use
In 2018 the permit procedure was simplified by the Law of Ukraine “On Amendments to Certain
Legislation of Ukraine on Deregulation in the Oil and Gas Industry”. Changes provide that investor can
either choose a subsoil area from Investment Atlas of Subsoil User issued by the CMU or pick another
one on its own by submitting application to the State Service of Geology and Mineral Resources of
Ukraine
Pursuant to the Procedure for Issuing Special Permits for Subsoil Use permits can be granted for
different validity terms:
► 10 years - for geological exploration of oil and gas bearing subsoil, including pilot
development of oil and gas fields
► 20 years - for oil and gas extraction
► 30 years - for oil and gas extraction on the continental shelf and within the exclusive
(maritime) economic zone of Ukraine
There are tender and non-tender procedures for obtaining a permit. State Service of Geology and
Mineral Resources of Ukraine can grant permits for subsoil use in respect of the natural gas without
holding a tender in the following cases:
► Extraction, if applicant at its own expense carries out a geological study of the subsoil area
and a calculation of the mineral reserves
► One-time expansion of the subsoil area by no more than 50%
► Geological exploration of subsoil at the expense of the state budget
► Carrying out operations under PSAs
To obtain a permit under a non-tender procedure an applicant should submit the documents specified
in the respective regulation in both paper and electronic form to the State Service of Geology and
Mineral Resources of Ukraine. Within 30 days after the documents are provided, State Service of
Geology and Mineral Resources of Ukraine takes decision on issuing a permit
Permit under the non-tender procedure is granted within 20 business days after payment of full amount
of the administrative charge
In case of PSA the Interdepartmental Commission carries out the administrative formalities on behalf of
investor(s)
Permits for subsoil use in other cases are granted through an electronic tender. A foreign legal entity
can also take part in such tender
Tenders are governed by the newly approved Procedure for Tenders for the Sale of Special Subsoil
Use Permits dated 23 September 2020
2.2.3. Natural gas

National Strategy to Increase Foreign Direct Investment in Ukraine | Section 2.2: Energy | Page 66 of 88
0.71
1.44
0.71
1.55
0.71
1.48
0.71
1.40
0.25
0.38
0.25
0.30
0.25
0.35
0.25
0.31
PL-UA
UA-PL
SK-UA
UA-SK
HU-UA
UA-HU
RO-UA
UA-RO
12
34
Tariff standard, EUR/MWh Tariff "short-haul", EUR/MWh
Short-haul and custom warehouse services is an important step in a
strategy to integrate into the EU gas market and create a gas hub
2.7
3.7 3.3
1.8
2.6
3.7
2.5
1.6 1.3 1.9
6.8
3.3
Import of other market participants Import Naftogaz Ukraine
Russian gas for Ukraine
Ukraine contemplates the direct purchase of
Russian gas at a discount, given that all terms
of the Minsk Agreements, signed in December
2019 by both sides, will be fulfilled
Stockholm court decisions
By its first decision on Naftogaz-Gasprom case
in 2017, the SAC* fully satisfied the demands
of the Naftogaz, savings for Ukraine $1.8 b for
the gas purchase. In 2019, SAC obliged
Gasprom to pay in favor of Naftogaz $ 2.9 b.
Five-year transit agreement
Under the newly reached five-year agreement,
transit volumes of Russian gas through the
GTS of Ukraine to Europe will amount up to 65
bcm in 2020 and is expected to decrease up
to 40 bmc annually during 2021-2024
Natural gas import*, bcm
Source: Naftogaz, EY analysis
Note: Last available information for 1Q2020
Ukraine remains heavily reliant on gas imports. In
January-September 2020, natural gas imports from the
EU reached 14.8 bcm. This is 3.2 bcm, or 28%, more
than in the same period previous year. That is also
26% more than the average in 2016-2019. During the
nine first months of 2020, imports from Slovakia were
about 9.7 bcm (+33% compared to the same period
last year), from Hungary – 3.7 bcm (+14%), from
Poland – 1.5 bcm (+33%). It should be noted that
import volumes also include a virtual reverse on Polish,
Slovak and Hungarian routes, which became available
for the first time since this year – 6.9 bcm. As of today,
all imported volumes of natural gas come exclusively
from EU countries. Since November 2015, Ukraine has
not been importing gas from the Russian Federation.
Gas transit volumes through the territory of Ukraine
grew with a CAGR 7.6% during 2015-2019, reaching
90 bcm in 2019 and 40 bcm as of October 2020.
Short-haul services
Short-haul – is a special service, which allows
discounted transmission between dedicated
interconnection points with adjacent countries. The
short-haul service provides the instrument for traders
and shippers to use the capacities under very attractive
tariffs, reaching the markets of Poland, Hungary,
Slovakia, and Romania via Ukrainian GTS. This
product is only for transit services and does not provide
access to the Ukrainian VTP and internal market.
Increase in gas inflow from EU countries is explained
by growing demand for a new short-haul service, which
Gas TSO of Ukraine has launched since 2020. In
January-September, Ukraine received 6.1 bcm of gas
throughout short-haul (from Hungary – 25%, from
Poland – 8%, from Slovakia – 67%). It should be noted,
that traders allocated all these volumes to storage in
Ukrainian UGS in the “customs warehouse” mode.
Tariffs comparison
Source: GTSO, EY analysis
Russia to transit 65 bcm of gas through
Ukraine in 2020 under new deal of Gazprom
In 2017, Ukraine's gas transmission system operator
launches the specified customs regime allows
Customers to store natural gas in 10 underground gas
storage facilities of Ukraine within 1095 days without
paying taxes and customs duties.. The storage
services are offered at the most competitive tariffs in
Europe (approx. 0.4 EUR/MW per storage cycle). The
launch of the сustom warehouse services in Ukraine is
an important step in long-term strategy to integrate into
the European gas market and create an Eastern
European gas hub based on Ukraine's vast and reliable
gas transmission and storage infrastructure. Currently
demand for the service exceeds expectations.
Custom warehouse servicesNote: SAC – Stockholm Arbitration Court
2.2.3. Natural gas

National Strategy to Increase Foreign Direct Investment in Ukraine | Section 2.2: Energy | Page 67 of 88
Ukrainian gas transmission system ensures the reliable and secure transit
of gas to Europe as well as access to gas storages and interconnectors
Main entry points
Main enter points
Sudzha
at the entry: 107,5Valuyki
at the entry: 25,5
Pisarivka
at the entry: 48,5
Sokhranivka
at the entry: 46,0
Platove
at the entry: 5,3
Prokhorovka
at the entry: 3,3at the exit: 32,5
Serebryanka
at the entry: 13,0
Mozyr
at the entry: 6,0
Kobrin
at the entry: 28,9
Drozdovichi
at the entry: 2,1
на виході: 5,0
Uzhgorod
at the entry: 15,5
at the exit: 92,6
Beregove
at the entry: 6,2
at the exit: 13,2
Tekove
на виході: 4,5
Oleksiyivka
at the exit: 3,5
Orlivka
at the exit: 26,8
2.4 th km
33.1 th km
Distribution gas pipelines
Gas transmission pipelines
Capacity of the gas transmission system of Ukraine and volumes of transported gas, bcm
Source: UTG
The gas transmission system of Ukraine is one of the
most powerful networks of the trunk gas pipelines in
the world. It performs two main functions:
transmission of natural gas to domestic customers,
as well as the transit of natural gas through the
territory of Ukraine to the countries of Western and
Central Europe. Moreover, GTS Operator of Ukraine
is responsible for scheduling, balancing, natural gas
metering, and exchange of information, procedures
related to nominations / renominations, provision of
other services to market participants.
The main components of the gas transmission
system are a network of gas pipelines, compressor
stations, gas metering stations and gas distribution
stations, which is the entire technological complex
that functions in continuous operation. The Ukrainian
GTS is interconnected with natural gas transmission
systems of Russia, Belarus, Poland, Slovakia,
Hungary, Romania and Moldova.
The key challenges in this area are the reduction in
gas consumption in Ukraine, off-takes of natural gas,
high level of depreciation of gas pumping units (60-
80%) and ensuring of natural gas transit after 2024.
Stable operation of the GTSO is possible in the case
when the GTSO is remunerated in full for the efficient
costs caused by transmission of natural gas: 1)
capital and operating expenses required for
transmission must be compensated through the tariff;
2) balancing - as payment for imbalances (including
neutrality fee). The potential problem arises when
TSO is not fully compensated for these costs due to
the unauthorized off-takes and unpaid imbalances.
57Annual entry point capacity
281 bcm
Annual exit point capacity
146 bcm
Compressor stations
Gas metering stations
33
2.2.3. Natural gas

National Strategy to Increase Foreign Direct Investment in Ukraine | Section 2.2: Energy | Page 68 of 88
Unbundling and certification of the independent GTSO in 2019 brought
Ukrainian subsector legislation in compliance with the main EU acquis
ТОВ «Оператор
ГТС України»
Ministry of
Finance of
Ukraine
From January 1, 2020
September 16, 2014 April 9, 2015 July 1, 2016
December 1, 2017
July 1, 2019 September 18, 2019 January 1, 2020
Ratification of the EU Agreement
By signing and ratifying the Association Agreement
with the EU, Ukraine was obliged to implement the
provisions of the Third Energy Package, in particular,
Directive 2009/73/EU on common rules for the
internal gas market, primarily to ensure the
independence of the domestic GTS operator to
promote non-discriminatory infrastructure access to
the network and market transparency.
Adoption of the Law of Ukraine “On the
Natural Gas Market”
The law sets obligations to the ownership structure of
GTSO. Controlling stake of the entity must be owned
by the state and the minority share - by GTS Partners,
who meet certain requirements. The law in question
regulates the certification process of GTSO according
to the OU (GTSO is the owner of TSO) and ISO
models (the state remains the owner of the GTS).
Approval of Restructuring plan of NJSC
“Naftogaz of Ukraine”
The plan provided for the establishment of JSC "Main
Gas Pipelines of Ukraine", which was wholly owned by
the State. At the same time, corporate rights were
managed by the Ministry of Energy. JSC "Main Gas
Pipelines of Ukraine" was determined as the subject of
property management, which belonged to the state.
Assets accounted for on the balance of UTG and was
used in the field of the transportation and storage.
Establishment of a branch of GTSO
Start of GTSO operation
Before January 1, 2020 GTSO was a fully-owned
subsidiary of UTG responsible for GTS technical
maintenance under SLA agreement. The branch "GTS
Operator of Ukraine", as a licensee for transmission and
transit, carries out commercial activities, dispatching,
procurement and coordination of the process of natural
gas transmission.
Approval of the Action Plan to comply
with the requirements for the unbundling
and independence of GTSO
The plan contains a list of necessary steps to ensure
the full performance of GTSO as an functional
operator. It provides for the procedure for obtaining
state-owned assets used in the process of natural gas
transmission activities, in particular.
Start of GTSO functioning
After confirmation of certification by the NEURC and
the Energy Community, as well as after the expiration
of the current gas transit contract with PJSC
Gazprom, GTSO started an independent natural gas
transmission services in Ukraine.
2.2.3. Natural gas

National Strategy to Increase Foreign Direct Investment in Ukraine | Section 2.2: Energy | Page 69 of 88
6.4
3.3 3.3 3.3 3.2
7.5-10.5
Ukraine CzechRepublic
Austria SlovakRepublic
Hungary Poland
12.39.1 10.3 11.6
17.6 16.517.114.5
16.9 17.2
21.8
28.3
2015 2016 2017 2018 2019 2020
Gas injection Maximum level of filling of the UGS
55%48%
55% 56%
67%
27% 25% 24% 28%
46%
2015/2016 2016/2017 2017/2018 2018/2019 2019/2020
At the beginning of the withdrawal season At the end of the withdrawal season
The capacity of Ukrainian underground gas storages facilities is the largest
in Europe and could be actively used by foreign traders throughout the year
► Ukraine has the most powerful network of underground gas storage facilities in Europe with the total capacity of 30 bcm. The capacity of Ukrainian gas storages is equal to a quarter of the EU’s storage capacity.
► 10 out of 12 UGS facility are located on the basis of gas and condensate deposits (Chervonopartizanskeand Olyshivske UGS are created in water formation). Most underground gas storages were put into operation in the 70s and 80s of the last century, but due to the short period of use of the equipment during the year, the overall level of depreciation is 23.3%.
► Currently, 2 underground gas storage facilities are out of operation. Vergunske, which is located on the temporarily uncontrolled territories, and Olyshivske, which (since the 2012/2013 season) is not used due to unfavorable geological conditions in the natural gas reservoir.
► The level of filling of the underground gas storage facilities as of the end of Q3 2020 was 91% of the design capacity under the results of monitoring by the NEURC. However, it was the largest level for this period in comparison with Q3 of 2018 and 2019.
Bilche-Volitsko-
Usherko Olyshivske
Solokhivske
Proletarske
Krasnopopivske
Vergunske
Bogorodchanske
Dashavske
Oparske
Usherko XIV-XV
Chervonopartizanske
Kegychivskenominal: 17.1
workload: 16.9
nominal: 0.3
workload: 0.1
nominal: 1.3
workload: 0.9
nominal: 0.4
workload: 0.1
nominal: 0.4
workload: 0.2
nominal: 1.5
workload: 1.4
nominal: 0.7
workload: 0.7nominal: 1.9
workload: 1.3
nominal: 2.2
workload: 2.7
nominal: 2.3
workload: 2.2
nominal: 1.9
workload: 1.0
nominal: 1.0
workload: 0.7
Total nominal
volume
Total workload
volume
31.0
28.2
Underground gas storages volume and exploitation as November 2020, bcm
UGS services tariffs, EUR/MWh
Source: Naftogaz Source: Naftogaz Source: UTG, RWE, MMBM, Gas Storage Poland
In 2020, Ukrainian UGS facilities have accumulated a
record gas volumes for the last 10 years - 28.3 bcm.
91%Germany
max load: 21.8
utilization: 91%
Italy
max load: 18.8
utilization: 90%
France
max load: 12.3
utilization: 91%
Netherlands
max load: 13.4
utilization: 81%
Dynamics of utilized capacity of Ukrainian UDG
2.2.3. Natural gas

National Strategy to Increase Foreign Direct Investment in Ukraine | Section 2.2: Energy | Page 70 of 88
Total length of Ukrainian distribution system
Widespread gas distribution system operated by DSOs ensures the
connection and natural gas supply for more than 12 million consumers
Gas distribution system operators in Ukraine
Naftogaz Group DSOs
RGK Group DSOs
Other Private DSOs
Source: GTSO
DSOs work as the intermediary between TSO and final consumers in terms of physical gas
delivery. As the end of 2019, there are 44 DSOs, 20 of them belong to one group - Regional Gas
Company. Part of the shares of 15 DSOs was state-owned. KryvorizhGas is fully-owned by the
government and KremenchukGas with a government stake of 51%. Only KirovogradGas on
71.54% owned by Naftogaz Group. The remaining shares of DSOs are owned by other legal
entities and individuals. Operation of obsolete networks is accompanied by high level of gas
consumption for technological needs and normative gas losses in distribution system. To ensure
the reliable and safe operation of Ukraine's gas distribution system in accordance with European
standards, it is necessary to fully modernize the gas networks including installed equipment. Such
modernization requires large amounts of investment. As of November 2020 DSOs exhibit the
following issues: correct technological consumption assessment for tariff calculation, justified
approach and procedure to tariff revision, reasonable adjustment of the DSOs’ tariff calculation
methodology, etc.
290 thousands km
Comparison of investment programs, EUR/km of GDS
16
36
64
4,600
6,838
6,124
22
72
38
4,692
7,122
Kirovogradgaz Lvivgaz Poltavagaz Eesti Gaas(Estonia)
Germanyaverage
Cadent (UK)
2018 2019
Average annual spending under
investment program of analyzed
Ukrainian DSOs was much less
than the funds invested by
analyzed European DSOs in
2018-2019
Source: NEURC
Level of gas consumption for technological needs and
normative gas losses dynamics, bcm
0.98
0.96
1.02
1.38
2016
2017
2018
2019
Source: NEURC
Technological consumption:
it is the most disputable
DSO issue, as the national
methodologies are too
complicated, and
calculations are not
transparent.
In the long-term RAB-methodology
could be implemented for all
natural monopolies, including gas
DSOs. It will make the subsector
more attractive for FDI.
2.2.3. Natural gas

National Strategy to Increase Foreign Direct Investment in Ukraine | Section 2.2: Energy | Page 71 of 88
After PSO elimination the competition should increase, but price will be still
determined by import parity making producers indifferent about pricing
Natural gas market in Ukraine
Retail market model
Please, see the next
slide
Wholesale market model
The wholesale segment is a
set of relations for the sale
of natural gas between
sellers and buyers, for
example suppliers, traders,
E&P companies, TSO and
DSOs (up to 347 companies
in 2019, no need to get the
license).
Regulated market segment
Before August 2020 the regulated segment was
functioning under the Clause 11 of the Law “On
natural gas market”, taking into account the PSO
Regulation (defines the general conditions of PSO
regime) and CMU Regulation No. 293 dated of
03.04.2020 (envisages the obligation of NJSC
“Naftogaz of Ukraine” to sell natural gas under
PSO regime at prices below the regulated level).
According to the PSO Regulation:
• The state-owned E&P companies JSC
“Ukrgasvydobuvannya” and JSC “Chornomornaftogaz” are
obliged to sell the natural gas to Naftogaz at regulated price
• Naftogaz is obliged to buy the natural gas from the state-
owned companies at regulated price as well as from other
market participants at free competitive to ensure sufficient
gas volumes, necessary for PSO fulfillment
• Naftogaz is obliged to sell the natural gas to regional
suppliers under regulated price (then they sell it to final
customers with mark-up equal to or less than 2.5%).
PSO Regulation was abolished
starting from August 1, 2020
• From the August 1, 2020 for regional suppliers the PSO
model was eliminated and regional suppliers have to buy
natural gas at free competitive prices. At the same time, the
switch of customers between suppliers has become more
flexible, so now they are able to choose the supplier with
the most suitable and beneficial terms.
Unregulated market segment
On the unregulated segment of the gas market the
relations between its participants are determined
by contracts regarding the volumes, prices and
delivery specifications of gas supplies. Wholesale
prices in the unregulated market segment depend
on seasonality, increasing during the heating
season. During 2018-2019, average gas prices in
Ukraine were decreasing following EU trend.
Average wholesale Ukrainian and European natural gas prices dynamics, EUR/tcm
Source: World Bank, UEEX, Naftogaz Group, EY analysis and calculations
257
352
281
459
272
133
157 191 191
291
169
54 0
50
100
150
200
250
300
350
400
450
500
Nov-15 May-16 Nov-16 May-17 Nov-17 May-18 Nov-18 May-19 Nov-19 May-20
Monthly NAK wholesale gas prices, EUR/tcm Monthly TTF gas prices, EUR/tcm
Source: Naftogaz, Capital IQ
Price determinants on the
regulated wholesale market
Until October 2018, the PSO system envisaged two possible
options of natural gas price, i.e. 4,942 UAH per tcm or the import
parity price in case the latter exceeds the former by more than
10%. Since November 2018, the calculation methodology for
natural gas price under PSO regime was amended and until April
2019 the price at which NJSC “Naftogaz of Ukraine” was obliged
to supply gas to heat production companies and DSOs for the
needs of households had been calculated by applying the
discount factor to the average gas price in 3Q2018. The discount
factor was determined by the CMU at 0.6943 and was expected
to increase to 0.8 since May 2019. Nevertheless, the price
calculation methodology was amended once again in April 2019
to increase the flexibility of the market and still protect consumers
against the gas price fluctuations. According to the new
methodology, the PSO price is the minimum among the import
price, the UEEX price, the previous month price applied in
transactions envisaging advanced payments and the price
calculated under the former methodology.
2.2.3. Natural gas

National Strategy to Increase Foreign Direct Investment in Ukraine | Section 2.2: Energy | Page 72 of 88
Moreover, elimination of PSO for households should unlock the retail
market potential and to establish correct price signals for investors
Regulated market segment
Since August 1, 2020, the new rules became effective, the gas market was opened, and the mark-up establish at
supplier’s discretion (see gas prices before and after elimination of the PSO below).
Gas prices for regulated segment before and after the elimination of PSO, UAH per mcm
The elimination of the PSO model resulted in an increase in gas prices of all suppliers under the analysis. In addition to
establishing higher mark-up for consumers, increased prices were affected by a new regulation – reduction in the
amount of permissible deviation from nomination (tolerance) from 10% to 3%.
Source: NEURC
Unregulated market segment
Average retail Ukrainian and European natural gas prices dynamics*, EUR/tcm
Source: NEURC, Eurostat
Note: Households is regulated segment of the retail market, industry - unregulated
5,580
4,738
4,075
3,476
2,731 2,571 2,757
3,575
4,695 4,695
6,330 5,868
5,005
4,326
3,712
2,948 2,784 2,975
4,495
5,495
6,665
8,819
Jan-20 Feb-20 Mar-20 Apr-20 May-20 Jun-20 Jul-20 Aug-20 Sep-20 Oct-20 Nov-20
PSO (NAK Trading after August 1, 2020) Poltavagas zbut' Kyivenergy' Odesagas-postachannya'
Elimination of the PSO model
Natural gas market in Ukraine
Retail market model
The retail segment covers interactions between final consumers (up to 12.57 m, incl. households 12.46, industrial consumers 0.11 m, 152 Direct consumers) and suppliers (up to 249 companies in 2019, incl. 37 under PSO regime, all of them should have a license)
Wholesale market model
Please, see the
previous slide
110 155 159
207 198 185 177 193 218 175
533 573
497 519 469
518 472
544 497
547
320 296
223 235 272 253 265
343
268 204
1H2015 2H2015 1H2016 2H2016 1H2017 2H2017 1H2018 2H2018 1H2019 2H2019
Ukrainian Households, EUR/tcm European Households, EUR/tcm Ukrainian Industry, EUR/tcm European Industry, EUR/tcm
From August 1, 2020, the natural gas
market was opened
Before August 1, 2020, the significant share of
sales of regional suppliers took place in a
regulated market part (varied from 72% to 94%),
where suppliers could not influence sale prices. As
the share of the unregulated part was insignificant,
companies did not have enough profit received
from the unregulated part to cover losses and
obligations arisen in the regulated part of regional
suppliers' business. Now they are free to set prices
and payment terms without limitations, but the
fierce competition within the market under the new
rules is expected.
2.2.3. Natural gas

National Strategy to Increase Foreign Direct Investment in Ukraine | Section 2.2: Energy | Page 73 of 88
248
222
187
128
207
157
128
71
96
146
NAK gas price, EUR/tcmTTF, EUR/tcm
Despite the price drop in spring-summer, COVID-19 impact on natural gas
subsector is blurred by seasonal factors and high utilization rate of storages
13.57
3.47 3.38
9.67
11.39
4.08 3.83
8.99
10.86
4.80
1Q2018 2Q2018 3Q2018 4Q2018 1Q2019 2Q2019 3Q2019 4Q2019 1Q2020 2Q2020
Gas consumption volumes dynamics in Ukraine, bcm
Source: NEURC, EY analysis and calculations
In 2020, the industry was affected by mild winter (gas prices in Europe were
abnormally low during the heating season), high storages utilization rates and a
decline in production due to severe quarantine in spring and early summer.
The gross consumption of natural gas in the 2Q2020 was equal to 4.8 mcm, which
is 56% less comparing 1Q2020 and 17.6% more than in the same period a year
before. COVID-19 lockdown was enacted from March to October when there were
no demand for heating services and the overall gas consumption level in the 2Q
and 3Q is lower compared to the 4Q and 1Q of each period annually. Due to
seasonal factors, the ability to evaluate the effect of the COVID-19 pandemic on
gas consumption is limited.
Gas demand has been falling since 2010, dropping to 29.9 bcm in 2019. According
to the Economist Intelligence Unit, there is an expected further drop in consumption
in 2020 owing to the coronavirus by 7.4% compared to 2019 with modest growth of
0.2% each year from 2021 till 2029.
COVID-19 impact
Price changes compared to 2019:
Apr NAK: -25%, TTF: -55%
Aug NAK: -42%, TTF: -25%
Ukrainian and European price dynamics before and after lockdown
Beginning of the COVID-
19 strict lockdown in
Ukraine
Natural gas prices have decreased due to the declining business activity and
energy sources demand by reason of beginning of the COVID-19 strict lockdown.
Moreover, low prices for natural gas make gas processing less profitable within the
full process chain. A decline in natural gas extraction volume will result in a
decrease in local and state budget revenue. TTF has partly recovered in August
2020 compared to the Ukrainian price. Naftogaz's price continued dropping since
April 2020 with the lowest point in June 2020.
The second wave of the coronavirus pandemic and a possible new lockdown could
hurt Ukraine's gas production industry. As of October, the number of active drilling
rigs decreased by almost 70% compared to 2019. As the result, the second
lockdown will bring more losses to the economy. AGPU executive director
broadcasted that situation is difficult for industry and the help of the government
would be necessary to cope with it. Moreover, gas producers have pointed out that
the industry needs government support in the form of fiscal incentives for investing
acceleration. Otherwise, the stagnation of the gas industry is inevitable.
Source: Naftogaz, Capital IQ,, EY analysis and calculations
2.2.3. Natural gas

National Strategy to Increase Foreign Direct Investment in Ukraine | Section 2.2: Energy | Page 74 of 88
Despite the outstanding reform path in the natural gas subsector, it is still
struggling from inefficient PSO model for DHCs and unpaid gas imbalances
The absence of an intraday gas market lead
to market manipulations
There are positive and negative gas imbalances in the GTS. Most
of the positive imbalances arose during the 1Q2020 of operation
of the GTSO and amounted to 648 mcm (79% of the total amount
of positive imbalances during 8 months of 2020). At this time, the
amount of negative unbalances was small, which led to a positive
monthly balance. Starting from March 2020, the balance turned
negative, with the gap between the unbalances constantly
widening. Thus, by the middle of the year (the period from June to
August), 1,128 mсm of negative unbalances were accumulated,
which amounted to 59.5% of the total volume of negative
imbalances during 8 months of 2020.
Volume of gas imbalances (monthly), mcm
-124 -111
-246
-115-173
-328
-536
-264
278 206 164 62 27 19 24 39
154 94-83 -53 -145 -309
-512-225
Jan-20 Feb-20 Mar-20 Apr-20 May-20 Jun-20 Jul-20 Aug-20
Positive imbalances Negative imbalances Net imbalance
Traditionally, volumes of gas imbalances depend on prices – in
case when the base gas price for the imbalance is lower than the
market one, network users take benefits by creating negative
imbalances and buy gas from GTSO. Otherwise, if the base price
is higher than the market one, network users create positive
imbalances and sell gas to GTSO. 1Q2020 was quite unusual as
due to sharp drop in gas prices, trader could create positive
imbalances (by making quasi-sale to GTSO) to benefit from
higher compensation for positive balance. However as soon as
price dynamics changed and corrective measures were
introduced, "usual normal" (negative imbalances) became
frequent.
Deviant off-takes of natural gas from the GTS
affect the financial standing of the GTSO
1. DSOs' failure to fulfill their balancing responsibilities
2. Contradictions in the PSO regime
3. Non-automatic transfer of consumers to the SoLR
4. Non-application of allocation of neutrality charges
5. Unequal levels of late payment penalties for commercial
market participants and household consumers
6. Tariffs level adequacy
7. Metering and consumption norms
8. Insufficient level of payments from consumers
9. Accumulated debts and sources for penalties coverage
10. Quality of consumption forecasts and related imbalances
11. Absence of effective options to collect debts
12. Statutory prohibition to cut-off certain protected consumers
Accumulated off-take debt, due to the GTSO, UAH m
Summary list of reasons for issues with deviant off-takes
PSO regime for DHCs and households*
including debts under PSO
The collation of TTF Hub+ price, the price under PSO regime
and the cost of natural gas, UAH per tcm
Commercial relationships within both wholesale and retail
segments used to be regulated to provide natural gas at
affordable prices (PSO regime), but they are gradually being
eliminated and simplified for the sake of development of the
competitive and transparent natural gas market. As it was
previously mentioned, PSO regime for households has been
abolished starting from August 1, 2020. The new rules initiated
the gas market open and free mark-up establishment, unlike it
was during PSO. As of November 2020, indebtness to NAK for
the natural gas amount to UAH 70.4 billion, incl. debts under PSO
Regulation - UAH 66.6 billion.
Nevertheless, PSO abolishment did not solve the problem of
significant accumulated debts under the Regulations. The
analysis has shown regional suppliers’ debts higher than
consumers’ ones. Therefore, even the full repayment of
consumers' debt would be not enough to ensure financial stability
and cover all obligations of suppliers. Most of the regional
suppliers operate at a loss and continue to accumulate their
debts. Secondly, PSO regime for DHCs remains valid until May,
2021. At the same time, the Government does not carry out its
duty regarding compensation of fulfillment of PSO obligations by
NAK. As of December 31, 2019, the amount of compensation to
be paid equaled UAH146 billion, according to NAK.
0
2,000
4,000
6,000
8,000
10,000
Jan-
17
Mar
-17
May
-17
Jul-1
7
Sep
-17
Nov
-17
Jan-
18
Mar
-18
May
-18
Jul-1
8
Sep
-18
Nov
-18
Jan-
19
Mar
-19
May
-19
Jul-1
9
Sep
-19
Nov
-19
TTF, Hub+ PSO price Tariff: households
Tariff: public organizations Tariff: other Tariff: religious organizations
580
290
231 30
(44)(56)
1,031
326
Jan-20 Feb-20 Mar-20 Apr-20 May-20 Jun-20 1H2020 3Q2020
Accumulated off-takes New off-takes (labelled)
2.2.3. Natural gas
National Strategy to Increase Foreign Direct Investment in Ukraine | Section 2.2: Energy | Page 75 of 88
Legal barriers for investments in natural gas subsector
Need to streamline permit procedure for subsoil use
► Complicated procedure on cancelation “sleeping licenses” on subsoil use.
It is reported that the companies that obtained a permit for a particular subsoil
area in certain cases do not carry out the necessary works for a long time,
reserving the subsoil area for later use. Such practice unfairly restricts other
investors from accessing these mineral resources. Both the CMU and the
National Association of Extractive Industries of Ukraine have admitted this issue.
From a formal perspective, Ukrainian legislation already has the rules which may
be applied to address this procedural issue. Specifically, the Code of Ukraine on
Subsoil says that if a subsoil user has not started to perform works specified in
the permit for subsoil use (for oil and gas-promising areas and oil and gas fields)
without a proper reason within 180 calendar days, its permit should be
terminated. However, such procedure is not always provided in time due to the
moratoriums on audits, the procedure of permit cancelation is underregulated
and time consuming due to lack of the State Service for Geology and Subsoil of
Ukraine and lengthy court proceedings on the appeal of the permit cancelation
decisions
► Absence of qualification requirements. Current Procedure for Conducting
Auctions on Sale of Permits for Special Use of Subsoil, like previous procedural
rules, does not take into account the experience and technical ability to carry out
gas extraction works as the criteria for admission to the tender. Reportedly, in
practice this leads to the situation where permits for subsoil use are granted to
companies unable to perform any gas extraction. Because of this procedural
deficiency, the investors willing and able to produce gas at such subsoil areas
are prevented from doing business there since the relevant areas are occupied
by unqualified users with valid permits
► Investor cannot transfer permit for subsoil use. Ukrainian legislation (article
14 of Law of Ukraine "On Oil and Gas") does not allow to transfer a permit for
subsoil use to another party. Such limitation is burdensome for investors, since
in case of failure of a project they will be deprived of the opportunity to recoup
part of the investment by selling a permit to another company. This option would
also allow a buyer of a permit to obtain a subsoil site with a certain stage of
development
► Potential remedies. 1 Strengthening of the State Service for Geology and
Subsoil of Ukraine authorities and streamline the audit procedure; 2. Including a
qualification and/or relevant experience requirements for potential subsoil users;
3. There are draft laws allowing the transfer of permits on subsoil (Draft laws No.
4187 and No. 4187-1). Such procedural rules are common in Kazakhstan,
Romania, and Poland
Inconsistency between currency and PSA regulations
► The PSA Law sets certain special rules and benefits for investors operating under
a production sharing agreement, including in terms of applicable currency control
regime for foreign investors (Article 33 provides for the special regime for
investors’ account for PSA operations, Article 34 has several guarantees for a
foreign investor, including the exemption from the 365-day term of mandatory
settlement under export and import transactions)
► Since 2012, when the effective PSA regime was established, a number of other
laws and regulations were changed. These changes do not always take into
account the peculiarities of the PSA Law, including in currency control area. The
root of the problem is that the PSA Law sets out the prevailing effect of the
currency control rules of the PSA Law, and at the same time the Law on Currency
Control says that only its rules may deal with all currency control issues, which
also reflects the prevailing effect of the provisions of the Law on Currency Control
► Currency control guarantees are important for the foreign investors since they
ensure free circulation of the obtained foreign currency under the PSA. These
provisions are not reflected in the Law on Currency Control and respective
subsidiary regulations of the National Bank of Ukraine that have been recently
amended to clarify certain rules for control of PSA transactions. Current
inconsistencies regarding the status of the bank accounts and limitation on
mandatory settlement of the cross-border transactions create uncertainty of the
applicable currency control rules to PSA, for example:
► There is no guarantee for foreign investors to be exempted from obligatory
currency sale if this protective measure is established by the NBU
► Subordinate regulations do not provide a viable mechanism for exemption
from the term of mandatory settlement under export and import transactions
► Subordinate regulation only stipulates that legal regime of bank account of
representative office of foreign PSA investor is equal to one of resident legal
entities. At the same time the provisions on respective legal regime do not
grant any privileges provided by the PSA Law
► Potential remedies: we suggest reconciling the provisions of the PSA Law and
the Law on Currency Control to eliminate the inconsistencies in application of the
PSA guarantees, as well as further amendments of the subordinate regulations.
While the extent of the guarantees provided is a sovereign decision of the state,
in order to encourage investments in PSAs it is paramount that the guarantees
that are provided by the law on paper are practically implemented
2.2.3. Natural gas

National Strategy to Increase Foreign Direct Investment in Ukraine | Section 2.2: Energy | Page 76 of 88
2.2.4. Conclusions
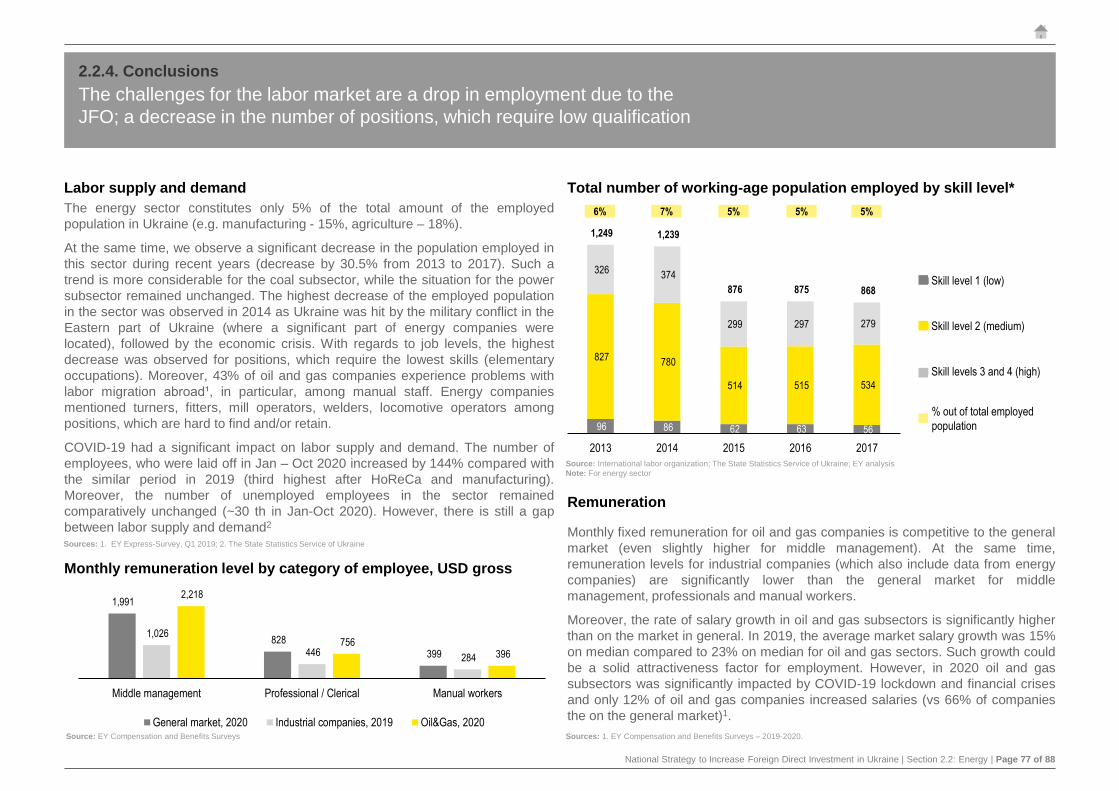
National Strategy to Increase Foreign Direct Investment in Ukraine | Section 2.2: Energy | Page 77 of 88
1,991
828
399
1,026
446 284
2,218
756 396
Middle management Professional / Clerical Manual workers
General market, 2020 Industrial companies, 2019 Oil&Gas, 2020
The challenges for the labor market are a drop in employment due to the
JFO; a decrease in the number of positions, which require low qualification
The energy sector constitutes only 5% of the total amount of the employed
population in Ukraine (e.g. manufacturing - 15%, agriculture – 18%).
At the same time, we observe a significant decrease in the population employed in
this sector during recent years (decrease by 30.5% from 2013 to 2017). Such a
trend is more considerable for the coal subsector, while the situation for the power
subsector remained unchanged. The highest decrease of the employed population
in the sector was observed in 2014 as Ukraine was hit by the military conflict in the
Eastern part of Ukraine (where a significant part of energy companies were
located), followed by the economic crisis. With regards to job levels, the highest
decrease was observed for positions, which require the lowest skills (elementary
occupations). Moreover, 43% of oil and gas companies experience problems with
labor migration abroad¹, in particular, among manual staff. Energy companies
mentioned turners, fitters, mill operators, welders, locomotive operators among
positions, which are hard to find and/or retain.
COVID-19 had a significant impact on labor supply and demand. The number of
employees, who were laid off in Jan – Oct 2020 increased by 144% compared with
the similar period in 2019 (third highest after HoReCa and manufacturing).
Moreover, the number of unemployed employees in the sector remained
comparatively unchanged (~30 th in Jan-Oct 2020). However, there is still a gap
between labor supply and demand2
Total number of working-age population employed by skill level*
Monthly remuneration level by category of employee, USD gross
Source: EY Compensation and Benefits Surveys
Monthly fixed remuneration for oil and gas companies is competitive to the general
market (even slightly higher for middle management). At the same time,
remuneration levels for industrial companies (which also include data from energy
companies) are significantly lower than the general market for middle
management, professionals and manual workers.
Moreover, the rate of salary growth in oil and gas subsectors is significantly higher
than on the market in general. In 2019, the average market salary growth was 15%
on median compared to 23% on median for oil and gas sectors. Such growth could
be a solid attractiveness factor for employment. However, in 2020 oil and gas
subsectors was significantly impacted by COVID-19 lockdown and financial crises
and only 12% of oil and gas companies increased salaries (vs 66% of companies
the on the general market)1.
Sources: 1. EY Compensation and Benefits Surveys – 2019-2020.
Sources: 1. EY Express-Survey, Q1 2019; 2. The State Statistics Service of Ukraine
Labor supply and demand
96 86 62 63 56
827 780
514 515 534
326 374
299 297 279
1,249 1,239
876 875 868
2013 2014 2015 2016 2017
Skill level 1 (low)
Skill level 2 (medium)
Skill levels 3 and 4 (high)
% out of total employed
population
6% 7% 5% 5% 5%
Source: International labor organization; The State Statistics Service of Ukraine; EY analysis
Note: For energy sector
Remuneration
2.2.4. Conclusions
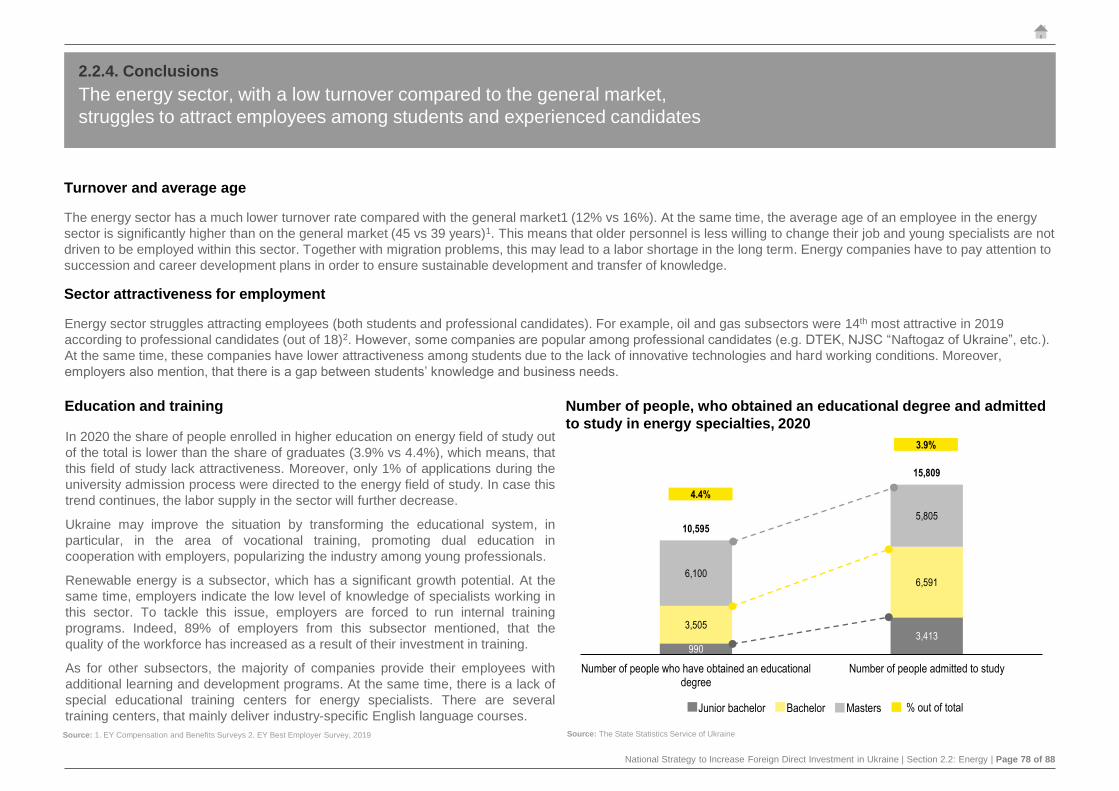
National Strategy to Increase Foreign Direct Investment in Ukraine | Section 2.2: Energy | Page 78 of 88
The energy sector, with a low turnover compared to the general market,
struggles to attract employees among students and experienced candidates
In 2020 the share of people enrolled in higher education on energy field of study out
of the total is lower than the share of graduates (3.9% vs 4.4%), which means, that
this field of study lack attractiveness. Moreover, only 1% of applications during the
university admission process were directed to the energy field of study. In case this
trend continues, the labor supply in the sector will further decrease.
Ukraine may improve the situation by transforming the educational system, in
particular, in the area of vocational training, promoting dual education in
cooperation with employers, popularizing the industry among young professionals.
Renewable energy is a subsector, which has a significant growth potential. At the
same time, employers indicate the low level of knowledge of specialists working in
this sector. To tackle this issue, employers are forced to run internal training
programs. Indeed, 89% of employers from this subsector mentioned, that the
quality of the workforce has increased as a result of their investment in training.
As for other subsectors, the majority of companies provide their employees with
additional learning and development programs. At the same time, there is a lack of
special educational training centers for energy specialists. There are several
training centers, that mainly deliver industry-specific English language courses.
Source: 1. EY Compensation and Benefits Surveys 2. EY Best Employer Survey, 2019
Number of people, who obtained an educational degree and admitted
to study in energy specialties, 2020
Source: The State Statistics Service of Ukraine
990
3,4133,505
6,5916,100
5,805
10,595
15,809
Number of people who have obtained an educationaldegree
Number of people admitted to study
Junior bachelor Bachelor Masters
The energy sector has a much lower turnover rate compared with the general market1 (12% vs 16%). At the same time, the average age of an employee in the energy
sector is significantly higher than on the general market (45 vs 39 years)1. This means that older personnel is less willing to change their job and young specialists are not
driven to be employed within this sector. Together with migration problems, this may lead to a labor shortage in the long term. Energy companies have to pay attention to
succession and career development plans in order to ensure sustainable development and transfer of knowledge.
Turnover and average age
Sector attractiveness for employment
Energy sector struggles attracting employees (both students and professional candidates). For example, oil and gas subsectors were 14th most attractive in 2019
according to professional candidates (out of 18)2. However, some companies are popular among professional candidates (e.g. DTEK, NJSC “Naftogaz of Ukraine”, etc.).
At the same time, these companies have lower attractiveness among students due to the lack of innovative technologies and hard working conditions. Moreover,
employers also mention, that there is a gap between students’ knowledge and business needs.
Education and training
4.4%
3.9%
% out of total
2.2.4. Conclusions
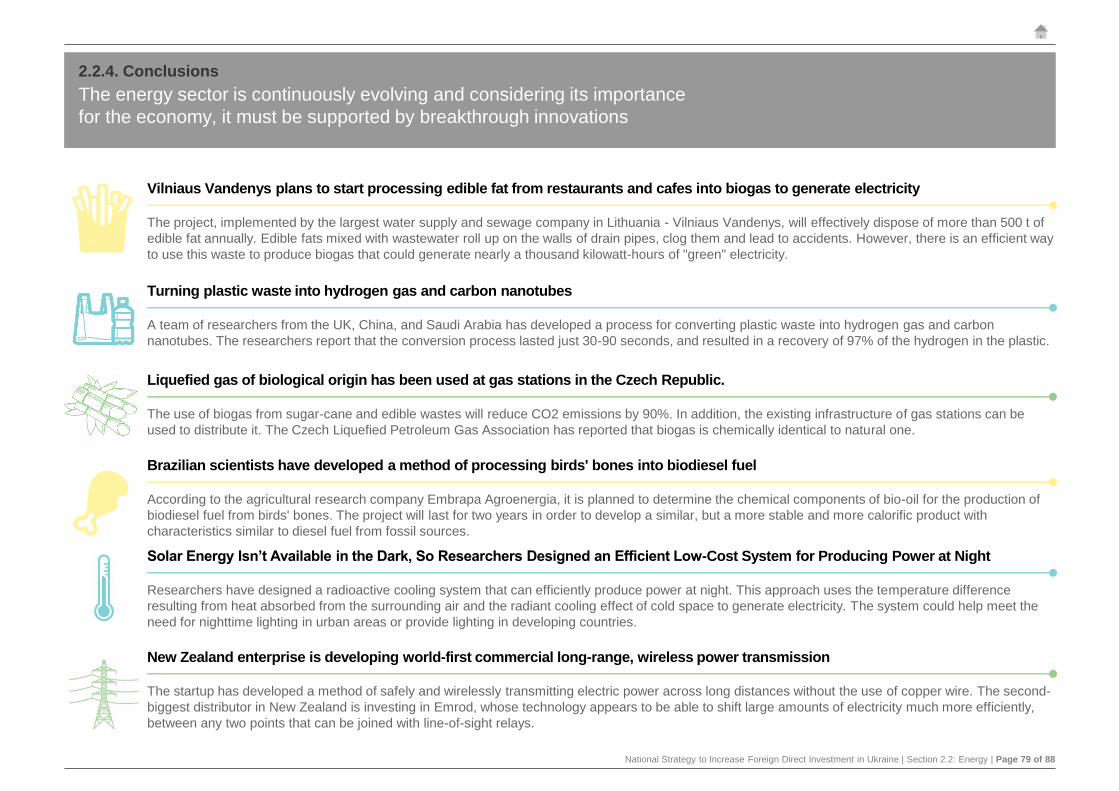
National Strategy to Increase Foreign Direct Investment in Ukraine | Section 2.2: Energy | Page 79 of 88
The energy sector is continuously evolving and considering its importance
for the economy, it must be supported by breakthrough innovations
Vilniaus Vandenys plans to start processing edible fat from restaurants and cafes into biogas to generate electricity
The project, implemented by the largest water supply and sewage company in Lithuania - Vilniaus Vandenys, will effectively dispose of more than 500 t of
edible fat annually. Edible fats mixed with wastewater roll up on the walls of drain pipes, clog them and lead to accidents. However, there is an efficient way
to use this waste to produce biogas that could generate nearly a thousand kilowatt-hours of "green" electricity.
Turning plastic waste into hydrogen gas and carbon nanotubes
A team of researchers from the UK, China, and Saudi Arabia has developed a process for converting plastic waste into hydrogen gas and carbon
nanotubes. The researchers report that the conversion process lasted just 30-90 seconds, and resulted in a recovery of 97% of the hydrogen in the plastic.
Liquefied gas of biological origin has been used at gas stations in the Czech Republic.
The use of biogas from sugar-cane and edible wastes will reduce CO2 emissions by 90%. In addition, the existing infrastructure of gas stations can be
used to distribute it. The Czech Liquefied Petroleum Gas Association has reported that biogas is chemically identical to natural one.
Brazilian scientists have developed a method of processing birds' bones into biodiesel fuel
According to the agricultural research company Embrapa Agroenergia, it is planned to determine the chemical components of bio-oil for the production of
biodiesel fuel from birds' bones. The project will last for two years in order to develop a similar, but a more stable and more calorific product with
characteristics similar to diesel fuel from fossil sources.
Solar Energy Isn’t Available in the Dark, So Researchers Designed an Efficient Low-Cost System for Producing Power at Night
Researchers have designed a radioactive cooling system that can efficiently produce power at night. This approach uses the temperature difference
resulting from heat absorbed from the surrounding air and the radiant cooling effect of cold space to generate electricity. The system could help meet the
need for nighttime lighting in urban areas or provide lighting in developing countries.
New Zealand enterprise is developing world-first commercial long-range, wireless power transmission
The startup has developed a method of safely and wirelessly transmitting electric power across long distances without the use of copper wire. The second-
biggest distributor in New Zealand is investing in Emrod, whose technology appears to be able to shift large amounts of electricity much more efficiently,
between any two points that can be joined with line-of-sight relays.
2.2.4. Conclusions

National Strategy to Increase Foreign Direct Investment in Ukraine | Section 2.2: Energy | Page 80 of 88
Considering surplus of installed generation capacity and GTS availability
hydrogen may become the new unifying force between Ukraine and Europe
Pro
du
ctio
nT
ran
spo
rtat
ion
Sto
rag
eU
sag
e
Grey H2Blue H2
Green hydrogen (H2) is expected to play the key role in providing clean,
secure and affordable energy. Though currently the H2 production is
based primarily on fossil fuels, the share of green H2 keeps growing.
H2
ElectrolysisRenewable energy Water Hydrogen
Compressed
gas cylinders
Liquid
tankersPipelinesBlended with
natural gas
Tanks Solid
materialsSalt cavern Depleted gas
reservoirAquifer
RefiningFuelPower generationHeating
Benefits
4 kWh + 500 ml ≈ 1 m³
Green H2
Flexibility Abundance Heating value
Once produced, H2 can be instantly
used in energy, industry and utilities
H2 is available anywhere, so the price
will not rise due to scarcity
HV per mass for H2 exceeds that of
common fuels (3x that of gasoline)
Closed life cycle Storage Decarbonization
The only by-product received upon
hydrogen usage is water again
Hydrogen is a scalable long-term
storage solution capable of load shifting
No harmful emissions in course of
hydrogen production and usage
Initiatives and plans
EU: Carbon neutrality by 2050 France
40GW capacity and 10m t output by 2030 (6GW/1m t by 2024): industrial value
chain enhancing, demand boosting, regulation improvement, R&D promotion
EUR 7b plan for 6.5GW of green H2
plants and industry decarbonization
Germany Poland Slovak Republic
5GW and 10GW of green H2 plants
by 2030 and 2040, respectively
2-4 GW capacity by 2030. Now is the 5-
th largest grey H2 producer in the world
EU-funded WPP and green H2 plant,
blue H2 plant and H2 filling stations
Potential in Ukraine
Institutions
Ukrainian Hydrogen Council
Department for low-carbon H2 technology (MoE)
Working group (National Security and Defense Council)
Sci-tech council “Hydrogen Energy” (MoE)
Regulation
The Draft Ukrainian Green Deal and the Energy
Strategy till 2035 envisage the H2 sector growth, now
limited by fragmented legal base and scarce incentives
Demand
Primary hydrogen usage options in Ukraine include
fueling and blending with natural gas (RGC’s tests since
July 2020). Large local energy companies, i.e. DTEK,
“Naftogaz of Ukraine”, support H2-related researches
Capacity
The estimated H2 capacity in Ukraine is 505b m³ and
exceeds the demand, so the EU market is considered
for Ukrainian H2 with GTSO-based transfer option
July 2020 August 2020 August 2020 September 2020 October 2020 Future
Regional Gas Company
(Ukrainian distributor) started
testing hydrogen use in gas
networks
NBT (Norway) announced its
plans to build 800MW WPP
and 200MW hydrogen facilities
in Ukraine
Ukrainian NNEGC “ENERGOATOM”
and THE H2 LLC executed a
memorandum of cooperation on H2
plant (USD 300m) and data center
construction
As of September 2020, there is
only one green H2 plant in
Ukraine, developed by Ukrainian
scientists and launched in Kyiv
region in 2019
The Minister of Energy met
Siemens and other German
companies to discuss their
H2-related practice
Ministry of Energy (MoE) is
going to develop the national
strategy for hydrogen
implementation
+
Low-Carbon Low-Carbon High-Carbon
Renewable Non-Renewable Non-Renewable
2.2.4. Conclusions

National Strategy to Increase Foreign Direct Investment in Ukraine | Section 2.2: Energy | Page 81 of 88
During recent years some foreign companies have a negative experience
when trying to invest, caused by government obligations’ non-fulfillment
AES paid USD 70 million during the privatization of 75% stake in Kyivoblenergo
and overbid Electricite de France for a 75% stake in Rivneoblenergo. The US-
based company announced in 2013 that it had agreed to sell two regional electricity
distributors to a Russian group VS Energy for a total of USD 113 million.
AES Executive Vice President Tom O’Flynn explained the decision to sell both
Ukrainian assets as follows: “We continue to exit markets that are not part of our
strategic vision. This transaction represents another step in the process to simplify
our structure so we can focus on creating value in markets where we have a
compelling competitive advantage.”
In 2001, AES won the tender for the Kyivoblenergo and Rivneoblenergo
In 2013, Shell signed the PSA with Ukraine for unconventional gas extraction in the
Eastern part of the country. This was Ukraine’s first big project with a large
multinational company in the oil and gas sector, and Chevron was likely to follow
suit later. Nevertheless, in 2015 Royal Dutch Shell has notified Ukraine that it will
pull out of a shale gas exploration project in the east of the country, where
government forces are battling Russian-backed separatists. The company’s
decision follows heightened geopolitical risk and a sharp plunge in global oil prices,
which has made costly shale gas exploration projects less attractive.
Shell said it “has been prevented from performing its commitments under
production sharing agreement Yuzivska for an extensive period of time due to force
majeure, ie circumstances beyond Shell’s control”.
Ukraine signs landmark USD 10 billion shale gas deal with Shell
In 2019, UGV and Vermilion Energy submitted joint applications for participation in
4 tenders for conclusion of PSAs. In July 2019, Balakliiska and Ivanivska areas
were submitted under UGV and Vermilion after winning the tender. UGV and
Vermilion are obliged to make investments and share the gained profits in equal
proportion, but the agreement has not signed yet. In the end of November 2020,
Vermilion Energy has pulled out of the joint project with UGV.
According to the Chairman of the board of directors NJSC “Naftogaz of Ukraine”
Kobolev, one of the controversial issues is the equivalent of the state's share of the
produced products in the form of money or hydrocarbons. "It is necessary to make
a decision on how the mutual settlement will look like. It should be further
discussed whether companies should pay to the state either in gas or in money",
he said.
UGV and Vermilion participated in 4 tenders for conclusion of PSA
Ukrainian Feed-in-tariffs’ struggles
According to the effective legislation in Ukraine, the state guarantees the payments
under the “feed-in tariff” mechanism till the end of 2029. Nevertheless, there were a
few cases when the Ukrainian parliament was adopting changes to the main Law
which led to the decrease of the applied feed-in coefficients: in 2015 and 2016.
Due to the sharp decrease in available electricity capacity caused by armed conflict
in the Donbas region, NEURC adopted Resolution No. 492 that decreased the
feed-in tariff for electricity producers that use alternative energy sources by 50-
55%. This Resolution was valid for only one month and was canceled on March 3,
2015. As result, private and public investors suited NEURC and won their cases
which resulted in compensation payments for the mentioned period.
On 10 June, 2020, the Memorandum of Understanding on the Settlement of
Problematic Issues of the Ukrainian RES was signed by the Prime Minister of
Ukraine. On July 21, 2020, the Law on Feed-in Tariff Restructuring was passed by
the Ukrainian Parliament. Nevertheless, after the enactment of the Memorandum
and the Law, the State has not fulfilled the prescribed obligations towards investors.
2.2.4. Conclusions

National Strategy to Increase Foreign Direct Investment in Ukraine | Section 2.2: Energy | Page 82 of 88
Сapacity and technological base are a strong point of Ukraine in global
energy ratings, whereas regulatory-based metrics are the weak ones
Top countries by Bloomberg New Energy Finance research 2019
Ukraine takes 8th place among 104 emerging markets in the attractiveness of
investments in renewable energy sources
2.93 2.85 2.76 2.59 2.52 2.51 2.49 2.47 2.41 2.39
India Chile Brazil China Kenya Jordan Argentina Ukraine Peru Morocco
Climatescope takes into accounts 167 indicators to create a composite overall
score for each of the 104 countries in the survey.
Source: Bloomberg New Energy Finance research 2019
Top countries by World Energy Trilemma Index 2020
The World Energy Council’s Energy Trilemma Index tool ranks countries on their
ability to provide sustainable energy through 3 dimensions: Energy security, Energy
equity (accessibility and affordability), Environmental sustainability. Index should be
used to assess the sustainability of national energy policies.
68.984.3 84.2 84 82.1 82.1 81.7 81.7 81.5 80.9 80.5 79.8 79.5
Ukraine’s overall rank is 50th , which is decomposed to 12th in terms of energy security rank, 74th
in terms of energy equity rank and 49th in terms of environmental sustainability rank
Source: Bloomberg New Energy Finance research 2019
Top countries by Baker Hughes Rig Count October 2020
7770
40 38 37 3629 27 27 25 24
India SudiArabia
UAE Oman China Mexico Kuwait Indonesia Iraq Ukraine Algeria
Ukraine takes 9th place among 105 countries in the international monthly rig count
performed by energy technology company – Baker Hughes
Source: Bloomberg New Energy Finance research 2019
The Baker Hughes Rig Counts are an important business barometer for the drilling
industry and its suppliers initiated in 1975.
Top countries by Cedigaz Underground gas storages Report 2019, bcm
136
75
32 28 24 18 13 10 12 3
Source: Cedigaz Insights 2019
The top five countries (United States, Russia, Ukraine, Canada, and Germany)
account for 70% of the worldwide underground gas storage facilities capacity.
Ukraine has 11 UGS depleted fields and 2 aquifers which allow storing large
volumes of gas and is mainly used to balance seasonal swing in gas demand.
Top ten countries compose 83% of the global UGS volume that is equal to 421 bcm
2.2.4. Conclusions

National Strategy to Increase Foreign Direct Investment in Ukraine | Section 2.2: Energy | Page 83 of 88
The Energy Community Secretariat is responsible for review of the progress made
by the countries in transposition and implementation of the European energy law
incorporated by the Energy Community Treaty. Annual report reflects progress
made by each Contracting Country. This is an important indicator for the overall
assessment of the implementation of European regulations.
In 2020, Ukraine has advanced in the following indicators based on Annual
Implementation Report 2019: Gas - by 36%, Oil - by 25%, Environment - by 3%,
Climate - by 24%, Infrastructure - by 8%, and Statistics - by 12%. The main
accelerator for the improvement in the gas sector was the Law on the Gas Market
and certification of a new transmission system operator - GTSOU. A draft law on
minimal stocks of crude oil and petroleum products, which is currently undergoing
approval by the State authorities resulted in advances within the oil sector. In terms
of environmental and climate safety, one of the main challenges is the reduction in
emissions from outdated coal plants, which should be resolved by the adoption of
the National Emission Reduction Plan (instead of complying with the emission limit
values on an individual basis).
Annual Implementation Report of Energy Community Secretariat positively
recognized the progress of sector reforms, especially compared to peers
Ukraine Summary Implementation
Transposition
assessment
Implementation
statusDescriptionsIndicators
Electricity
Gas
Oil
Renewable Energy
Energy Efficiency
Environment
Climate
Infrastructure
Statistics
Cybersecurity
49%
84%
35%
52%
67%
64%
51%
8%
81%
35%
Implementation in the
electricity sector of Ukraine is
moderately advanced
Implementation in the gas
sector of Ukraine is almost
completed
Implementation in the oil
sector of Ukraine is still at an
early stage
Implementation in the RES of
Ukraine is moderately
advanced
Implementation in the energy
efficiency sector of Ukraine is
well advanced
Implementation in the
environment sector of Ukraine
is well advanced
Implementation in the climate
sector of Ukraine is
moderately advanced
Implementation in the
infrastructure sector of
Ukraine is yet to begin
Implementation in the
statistics sector of Ukraine is
almost completed
Implementation in the
cybersecurity sector of
Ukraine is at an early stage
61%54%
39%36%
45%
69%
56%
+12% +7% +3% +12% +1% +6% +0%
0%
10%
20%
30%
40%
50%
60%
70%
80%
90%
Ukraine Albania Bosnia andHerzegovina
Georgia Moldova Montenegro Serbia
Implementation Ratio Electricity Implementation Ratio Gas
Implementation Ratio Oil Implementation Ratio Sustainability
Overall Score 2020 Annual change
Implementation performance of Ukraine and its peers
Source: Energy Community
2.2.4. Conclusions
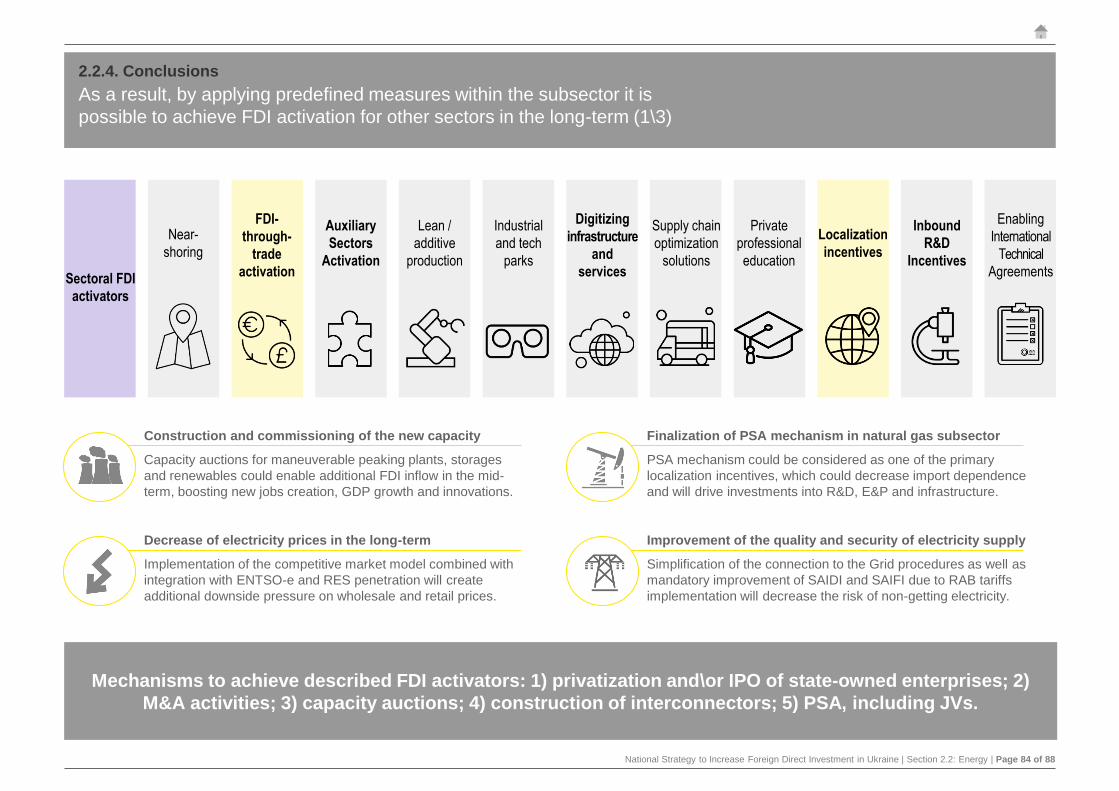
National Strategy to Increase Foreign Direct Investment in Ukraine | Section 2.2: Energy | Page 84 of 88
As a result, by applying predefined measures within the subsector it is
possible to achieve FDI activation for other sectors in the long-term (1\3)
Construction and commissioning of the new capacity
Capacity auctions for maneuverable peaking plants, storages
and renewables could enable additional FDI inflow in the mid-
term, boosting new jobs creation, GDP growth and innovations.
Decrease of electricity prices in the long-term
Implementation of the competitive market model combined with
integration with ENTSO-e and RES penetration will create
additional downside pressure on wholesale and retail prices.
Improvement of the quality and security of electricity supply
Simplification of the connection to the Grid procedures as well as
mandatory improvement of SAIDI and SAIFI due to RAB tariffs
implementation will decrease the risk of non-getting electricity.
Finalization of PSA mechanism in natural gas subsector
PSA mechanism could be considered as one of the primary
localization incentives, which could decrease import dependence
and will drive investments into R&D, E&P and infrastructure.
Sectoral FDI
activators
Near-
shoring
FDI-
through-
trade
activation
Auxiliary
Sectors
Activation
Lean /
additive
production
Industrial
and tech
parks
Digitizing
infrastructure
and
services
Supply chain
optimization
solutions
Private
professional
education
Localization
incentives
Inbound
R&D
Incentives
Enabling
International
Technical
Agreements
Mechanisms to achieve described FDI activators: 1) privatization and\or IPO of state-owned enterprises; 2)
M&A activities; 3) capacity auctions; 4) construction of interconnectors; 5) PSA, including JVs.
2.2.4. Conclusions

National Strategy to Increase Foreign Direct Investment in Ukraine | Section 2.2: Energy | Page 85 of 88
As a result, by applying predefined measures within the subsector it is
possible to achieve FDI activation for other sectors in the long-term (2\3)
Increase of natural gas, uranium and lithium mining
Expected investments in storages, gas-peaking maneuverable
capacity, and nuclear power units will create additional demand
for the primary energy resources considering its availability.
Stimulation of auxiliary industries grows and evolution (1\2)
Production of turbines, generators, transformers, switchgears,
boilers, and other equipment could be boosted as a result of
additional investments by generating companies and DSOs.
Stimulation of auxiliary industries grows and evolution (2\2)
Pipelines, booster compressor stations, gas-compressor units
and other modern equipment could be added to the existing
infrastructure under investments according to PSA mechanism.
Acceleration of electric and hybrid vehicles penetration
Green energy transition trend combined with electrification and
decarbonization will positively affect the retail segment of the
energy market and activate demand for EVs and charge stations.
Sectoral FDI
activators
Near-
shoring
FDI-
through-
trade
activation
Auxiliary
Sectors
Activation
Lean /
additive
production
Industrial
and tech
parks
Digitizing
infrastructure
and
services
Supply chain
optimization
solutions
Private
professional
education
Localization
incentives
Inbound
R&D
Incentives
Enabling
International
Technical
Agreements
Mechanisms to achieve described FDI activators: 1) privatization and\or IPO of state-owned enterprises; 2)
M&A activities; 3) capacity auctions; 4) construction of interconnectors; 5) PSA, including JVs.
2.2.4. Conclusions

National Strategy to Increase Foreign Direct Investment in Ukraine | Section 2.2: Energy | Page 86 of 88
As a result, by applying predefined measures within the subsector it is
possible to achieve FDI activation for other sectors in the long-term (3\3)
Geology requires breakthrough and modern technologies
Growth of drilling activities will require additional investments in
advanced seismological and geological analysis supported by
comprehensive IT-solutions which could be created locally.
Evolution of hydrogen as a next-generation energy source
With reasonable investments hydrogen could become a truly
breakthrough technology for local energy sector combining
elaboration of both Ukrainian power and natural gas markets.
Facilitation of R&D and innovations within the industry
Considering the advance nature of the subsector, additional
investments in capacity and other assets will accelerate value-
added innovations and R&D through the whole business chain.
Development of IT-infrastructure and value-added services
Penetration of distributed generation, smart metering, smart
grids, electric vehicles and demand-response technologies will
enable the rapid growth IT-related infrastructure and solutions.
Sectoral FDI
activators
Near-
shoring
FDI-
through-
trade
activation
Auxiliary
Sectors
Activation
Lean /
additive
production
Industrial
and tech
parks
Digitizing
infrastructure
and
services
Supply chain
optimization
solutions
Private
professional
education
Localization
incentives
Inbound
R&D
Incentives
Enabling
International
Technical
Agreements
Mechanisms to achieve described FDI activators: 1) privatization and\or IPO of state-owned enterprises; 2)
M&A activities; 3) capacity auctions; 4) construction of interconnectors; 5) PSA, including JVs.
2.2.4. Conclusions

National Strategy to Increase Foreign Direct Investment in Ukraine | Section 2.2: Energy | Page 87 of 88
International foreign investment conferences and other industry events
Event Location Place Next dates Description
WECA XOver 800 senior Oil & Gas executives joined WECA from
across the globe
London,
UK
30 November-02
December 2020
The meeting place for senior energy executives, investors, and financiers to
find investment and do deals
WindEnergy HamburgIt is one of the largest 4-days wind energy event that is
organized every two years
Hamburg,
Germany01-04 December 2020
It is a global trade fair for the wind energy sector that promotes the entire
value chain in the onshore and offshore sectors
European Gas ConferenceThe most important, geopolitical discussion in the
midstream gas calendarVienna, Austria 26-28 January 2021 The annual meeting place for an exclusive network of C-Level executives
Ukrainian Energy ForumRepresentatives of 128 energy companies from 38
countries and a wide range of visitors
Kyiv,
Ukraine
February 2021
(TBD)
The annual event to hear first-hand about the reform process from Ministers,
Regulators, Law-makers, and CEOs of state energy companies
CERAWeekThe top conference includes 840 speakers, 85 countries,
650 CEOs, 5,500 delegates
Houston,
USA01-05 March 2021
For nearly forty years, CERAWeek has been providing an integrated
framework for understanding what’s ahead for global energy markets,
geopolitics, and technology.
Energy Storage EuropeExhibitors from 60 counties as well as experts and
representatives.
Dusseldorf,
Germany16-18 March 2021
The event will turn to the most pressing current issues, focusing on
decarbonization and sustainability, integrated energy, improving the security
of supply
DistribuTECH Conference The conference includes 400 speakers, 520 exhibitors, and
13,000 attendees across the globeOrlando, USA 30 March-01 April 2021
The Conference is the leading annual transmission and distribution event that
offers information, products, and services related to electricity delivery
automation
Powergen InternationalThe exhibition includes 340 speakers, 900 exhibitors, and
14,000 attendees across the globeOrlando, USA 30 March-01 April 2021
International exhibition and summit serve as a business and networking hub
for electricity generators, utilities, and solution-providers engaged in power
generation
Caspian Oil & Gas ConferenceRepresentatives of 212 energy companies and a wide
range of visitorsBaku, Azerbaijan
01-03 June
2021
An event is a meeting place for leading oil, gas, and energy professionals
where memoranda, agreements, and contracts for future cooperation are
signed
ETCSEEThe event featuring over 50 high-level speakers and over
400 attendees
Prague, Czech
Republic
15 June
2021
The conference explored all major developments in the power and gas
traded markets, market supervision, and renewable energy
Hydrovision InternationalParticipants from 48 countries across a range of roles and
hydropower segmentPortland, USA
15-17 June
2021The event is the largest gathering of hydro professionals worldwide
World Gas ConferenceCompanies and visitors from 90 countries, 12,000
participants, and 500 speakersDaegu, Korea
21-25 June
2021
The exhibition at the world’s largest natural gas conference will cover the
entire spectrum of the gas industry including producers, buyers, solution
providers
ERTCThe event includes 98 speakers, 251 refiners, 650
attendees across the globeMadrid, Spain 15-18 November 2021
It is Europe’s largest meeting place for the downstream leaders, bringing
together refineries and technology providers to address issues affecting the
industry
Enlit EuropeThe event includes 450 speakers, 800 exhibitors, 18,000
attendees across the globeMilan, Italy
30 November-02
December 2021
Enlit is a series of energy events that for 365-days a year will collaborate and
innovate to solve the most pressing energy-related issues
Source: organizers' websites and other open sources
2.2.4. Conclusions

EY | Building a better working world
EY exists to build a better working world, helping to create long-term value for clients, people and society and build trust in the capital markets.
Enabled by data and technology, diverse EY teams in over 150 countries provide trust through assurance and help clients grow, transform and operate.
Working across assurance, consulting, law, strategy, tax and transactions, EY teams ask better questions to find new answers for the complex issues facing our world today.
EY refers to the global organization, and may refer to one or more, of the member firms of Ernst & Young Global Limited, each of which is a separate legal entity. Ernst & Young Global Limited, a UK company limited by guarantee, does not provide services to clients. Information about how EY collects and uses personal data and a description of the rights individuals have under data protection legislation are available via ey.com/privacy. EY member firms do not practice law where prohibited by local laws. For more information about our organization, please visit ey.com.
© 2021 Ernst & Young LLC. All Rights Reserved.
ED None.
This publication contains information in summary form and is therefore intended for general guidance only. It is not intended to be a substitute for detailed research or the exercise of professional judgment. Neither EYGM Limited nor any other member of the global EY organization can accept any responsibility for loss occasioned to any person acting or refraining from action as a result of any material in this publication. On any specific matter, reference should be made to the appropriate advisor.
ey.com/ua
Copyright © 2022 FDOKUMEN