Foreign Direct Investment and Economic Growth in Bangladesh Economy
12
The World Economy (2007) doi: 10.1111/j.1467-9701.2007.01055.x © 2007 The Author Journal compilation © 2007 Blackwell Publishing Ltd, 9600 Garsington Road, Oxford, OX4 2DQ, UK and 350 Main Street, Malden, MA 02148, USA 1843 Blackwell Publishing Ltd Oxford, UK TWEC World Economy 0378-5920 © 2006 The Author Journal compilation © Blackwell Publishers Ltd. 2006 XXX Original Articles FDI AND ECONOMIC GROWTH IN EP AND IS COUNTRIES YOHANE KHAMFULA Foreign Direct Investment and Economic Growth in EP and IS Countries: The Role of Corruption Yohane Khamfula South African Revenue Service Corruption is understood as an act in which the power of public office is used for personal gain in a manner that contravenes the rules established by the governing structures of a society. This study attempts to offer an extension to the empirical model employed by Balasubramanyam et al. (1996) by analysing how FDI determines economic growth within the new growth theory framework when the degree of corruption is considered. Thus, the study seeks to examine the way in which corruption can have an impact on the economic growth of developing countries whose trade strategies differ (either IS and EP). It suggests that further insight can be gained by considering how corruption might interact with the trade policy in affecting economic growth. This is examined using a fixed-effects, simultaneous equation model for 17 countries over the period 1994–2004. The results show that the level of corruption strongly and negatively influences foreign direct investment in both IS and EP countries. However, when the corruption index is interacted with domestic investment, the influence on foreign direct investment is positive and significant for IS countries only. The most interesting outcome of the study is the effect of the interaction term between foreign direct investment and the corruption perception index on economic growth, which is found to be greater in magnitude for the EP countries than for the IS countries. 1. INTRODUCTION O VER the past decade, attempts have been made to empirically analyse the role of foreign direct investment (FDI) in the growth process. For example, Balasubramanyam, Salisu and Sapsford (henceforth, BSS) (1996) investigated, within the new growth theory framework, the impact of FDI on economic growth in the context of developing countries that fall into two categories of trade policy regimes – export promotion (EP) and import substitution (IS). 1 Using cross-section data from developing countries the study tested the hypothesis propounded by Bhagwati (1978), which states that the growth-enhancing effects of FDI are stronger in countries which pursue an EP policy than in those imple- menting an IS one. The empirical evidence in that study seems to provide a degree of support for Bhagwati’s hypothesis. Our study here attempts to offer an extension to the empirical model employed by BSS (1996) by analysing how FDI determines growth within the new growth theory framework when the degree of corruption is taken into account. Thus, this study recognises Bhagwati’s hypothesis that links trade strategy to both the mag- nitude of FDI individual developing countries are able to attract and its efficiency in promoting economic growth. It adopts (or proposes) a new hypothesis The author wishes to thank the two anonymous referees who offered help in pointing out several mistakes and suggesting ways of improvement in the first draft of the paper. 1 According to Bhagwati (1978), the EP strategy is one that equates the average effective exchange rate on exports to the average effective exchange rate on imports – it is trade neutral or bias free. The IS strategy is one where the effective exchange rate on imports exceeds the effective exchange rate on exports and is biased in favour of import substitution activities.
-
Upload
independent -
Category
Documents
-
view
0 -
download
0
Transcript of Foreign Direct Investment and Economic Growth in Bangladesh Economy

The World Economy
(2007)doi: 10.1111/j.1467-9701.2007.01055.x
© 2007 The AuthorJournal compilation © 2007 Blackwell Publishing Ltd, 9600 Garsington Road,Oxford, OX4 2DQ, UK and 350 Main Street, Malden, MA 02148, USA
1843
Blackwell Publishing LtdOxford, UKTWECWorld Economy0378-5920© 2006 The Author Journal compilation © Blackwell Publishers Ltd. 2006XXXOriginal ArticlesFDI AND ECONOMIC GROWTH IN EP AND IS COUNTRIESYOHANE KHAMFULA
Foreign Direct Investment and
Economic Growth in EP and IS
Countries: The Role of Corruption
Yohane Khamfula
South African Revenue Service
Corruption is understood as an act in which the power of public office is used for personal gain in a manner that contravenes the rules established by the governing structures of a society. This study attempts to offer an extension to the empirical model employed by Balasubramanyam et al. (1996) by analysing how FDI determines economic growth within the new growth theory framework when the degree of corruption is considered. Thus, thestudy seeks to examine the way in which corruption can have an impact on the economic growth of developing countries whose trade strategies differ (either IS and EP). It suggests that further insight can be gained by considering how corruption might interact with the trade policy in affecting economic growth. This is examined using a fixed-effects, simultaneous equation model for 17 countries over the period 1994–2004. The results show thatthe level of corruption strongly and negatively influences foreign direct investment in both IS and EP countries. However, when the corruption index is interacted with domestic investment, the influence on foreign direct investment is positive and significant for IS countries only. The most interesting outcome of the study is the effect of the interaction term between foreign direct investment and the corruption perception index on economic growth,which is found to be greater in magnitude for the EP countries than for the IS countries.
1. INTRODUCTION
O
VER the past decade, attempts have been made to empirically analyse therole of foreign direct investment (FDI) in the growth process. For example,
Balasubramanyam, Salisu and Sapsford (henceforth, BSS) (1996) investigated,within the new growth theory framework, the impact of FDI on economic growthin the context of developing countries that fall into two categories of tradepolicy regimes – export promotion (EP) and import substitution (IS).
1
Usingcross-section data from developing countries the study tested the hypothesispropounded by Bhagwati (1978), which states that the growth-enhancing effectsof FDI are stronger in countries which pursue an EP policy than in those imple-menting an IS one. The empirical evidence in that study seems to provide adegree of support for Bhagwati’s hypothesis.
Our study here attempts to offer an extension to the empirical model employedby BSS (1996) by analysing how FDI determines growth within the new growththeory framework when the degree of corruption is taken into account. Thus, thisstudy recognises Bhagwati’s hypothesis that links trade strategy to both the mag-nitude of FDI individual developing countries are able to attract and its efficiencyin promoting economic growth. It adopts (or proposes) a new hypothesis
The author wishes to thank the two anonymous referees who offered help in pointing out severalmistakes and suggesting ways of improvement in the first draft of the paper.
1
According to Bhagwati (1978), the EP strategy is one that equates the average effective exchangerate on exports to the average effective exchange rate on imports – it is trade neutral or bias free.The IS strategy is one where the effective exchange rate on imports exceeds the effective exchangerate on exports and is biased in favour of import substitution activities.

1844 YOHANE KHAMFULA
© 2007 The AuthorJournal compilation © Blackwell Publishing Ltd. 2007
that hinges on the potential of a corruption atmosphere to discourage FDI as anecessary engine of economic growth. We incorporate this new hypothesis byemploying fixed effects simultaneous-equation models in the context of develop-ing countries characterised by two different categories of trade policy regimes –export promotion (EP) and import substitution (IS).
It is hypothesised that the volume and efficacy of incoming FDI will vary inaccordance to whether a country is following the EP or the IS strategy (Bhagwati,1978). On balance, given all other factors influencing FDI flows and theirefficacy, an EP strategy is likely to attract higher volumes of FDI and promotemore efficient utilisation than is an IS strategy. Since the EP strategy is trade-neutral, it does not provide artificial and transitory incentives to FDI. Because itwould be limited by the character of the host-country market which induces it inthe first place, the magnitude of IS-induced FDI would not be as large as EP-oriented FDI. It should also be noted that EP-induced FDI is likely to be muchmore efficient in promoting growth since it is allowed to operate in a distortion-free environment.
There are two components of the Bhagwati hypothesis: (i) EP countries attracta greater volume of FDI; and (ii) EP countries enjoy greater efficiency (socialreturns). Balasubramanyam and Salisu (1991) report evidence in support of thevolume effect. BSS (1996) investigate the efficiency effect of the Bhagwatihypothesis by estimating a real growth model for several developing countriesby ordinary least squares and generalised instrumental variables estimatormethods. The objective of this paper is to test the efficiency effect component ofBhagwati’s hypothesis by estimating a real growth model by using a fixed-effectsmodel to analyse average cross-section data from a selected number of develop-ing countries when corruption is taken into account.
Thus, the current study seeks to examine the way in which corruption can havean impact on the economic growth of developing countries whose trade strategiesdiffer (either IS and EP). In doing so, it attempts to build on a paper by BSS(1996) that employs a new economic growth theory model designed to highlightwhat affects the level of FDI in countries. It suggests that further insight can begained by considering how corruption might interact with the trade policy inaffecting growth. This is examined using a fixed-effects, simultaneous equationmodel for 17 countries over the period 1994–2004. The results show that corrup-tion is more harmful in an IS world than in an EP one.
The rest of the paper is organised as follows. Section 2 reviews the newgrowth theory and foreign direct investment. We also discuss the implications ofcorruption on the growth process in this section. Section 3 presents our empiricalmodel of economic growth, which is determined by a number of factors. InSection 4, we present the empirical results and some analysis. We finallyconclude in Section 5.

FDI AND ECONOMIC GROWTH IN EP AND IS COUNTRIES 1845
© 2007 The AuthorJournal compilation © Blackwell Publishing Ltd. 2007
2. FOREIGN DIRECT INVESTMENT AND CORRUPTION IN THE NEW GROWTH THEORY
a. The New Growth Theory and Foreign Direct Investment
According to Bhagwati (1978 and 1994), Bhagwati and Srinivasan (1975 and1979), Krueger (1975) and Greenaway and Nam (1988), there are severalinefficiencies the IS trade regime imposes on the economy: it heavily relies ontariffs and quotas on trade as major instruments of the strategy; it encourages theadoption of methods of production widely at variance with the factor endowmentsof the economy; it provides widespread incentives for rent seeking and directlyunproductive profit-seeking (DUPS) activities; it magnifies income disparities;and while promoting resource misallocation, it also encourages X-inefficiency.On the other hand, the EP strategy emphasises on neutrality of policy as betweenthe import and export sectors of the economy. In this regard, its principal virtueis that it allows for a free play of market forces and the allocation of resourceson the basis of comparative advantage. Also, it does not offer any incentive forrent seeking and DUPS that the IS strategy provides. However, allocation ofresources on the basis of comparative advantage and market forces promotesspecialisation and economies of scale.
Pack (1994) identifies the same factors that new growth theory emphasises.This suggests that the new growth theory has significant implications for theefficiency of FDI in EP relative to IS countries. BSS (1996) stress that theconcern of new growth theories is with endogenising the growth rate of GDP andthis in turn requires the rate of investment to be endogenised, since it is factoraccumulation that ultimately accounts for growth. The growth of factor accumu-lation, however, requires that the return to the capital stock in the aggregateshould not diminish, although returns to single acts of investment may diminish.This implies that the social rate of return must exceed the private rate of return.Also, there are several types of knowledge spillover effects and externalities thatcontribute to growth in the aggregate. Romer (1986 and 1987) assumes thatinvestment in knowledge or R&D is subject to diminishing returns, but theutilisation of such knowledge in production activity results in increasingreturns. New growth theory also puts emphasis on learning by doing and theinput of capital may not also experience diminishing returns. Thus, externalities,human capital and learning by doing form the principal springs of endogenousgrowth theory.
BSS (1996) state that many of the growth-promoting factors identified by newgrowth theory can be initiated and nurtured to promote growth through FDI. Ithas long been realised that FDI is a major source of technology and know-howto developing countries. FDI has the ability to transfer production know-how andmanagerial skills, which distinguishes it from all other forms of investment. FDI
1846 YOHANE KHAMFULA
© 2007 The AuthorJournal compilation © Blackwell Publishing Ltd. 2007
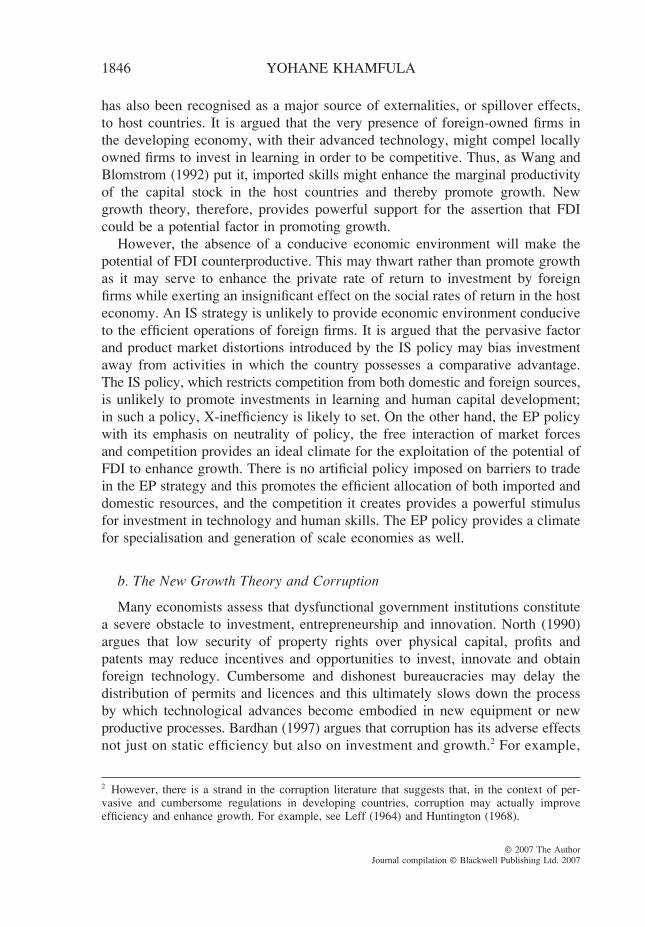
has also been recognised as a major source of externalities, or spillover effects,to host countries. It is argued that the very presence of foreign-owned firms inthe developing economy, with their advanced technology, might compel locallyowned firms to invest in learning in order to be competitive. Thus, as Wang andBlomstrom (1992) put it, imported skills might enhance the marginal productivityof the capital stock in the host countries and thereby promote growth. Newgrowth theory, therefore, provides powerful support for the assertion that FDIcould be a potential factor in promoting growth.
However, the absence of a conducive economic environment will make thepotential of FDI counterproductive. This may thwart rather than promote growthas it may serve to enhance the private rate of return to investment by foreignfirms while exerting an insignificant effect on the social rates of return in the hosteconomy. An IS strategy is unlikely to provide economic environment conduciveto the efficient operations of foreign firms. It is argued that the pervasive factorand product market distortions introduced by the IS policy may bias investmentaway from activities in which the country possesses a comparative advantage.The IS policy, which restricts competition from both domestic and foreign sources,is unlikely to promote investments in learning and human capital development;in such a policy, X-inefficiency is likely to set. On the other hand, the EP policywith its emphasis on neutrality of policy, the free interaction of market forcesand competition provides an ideal climate for the exploitation of the potential ofFDI to enhance growth. There is no artificial policy imposed on barriers to tradein the EP strategy and this promotes the efficient allocation of both imported anddomestic resources, and the competition it creates provides a powerful stimulusfor investment in technology and human skills. The EP policy provides a climatefor specialisation and generation of scale economies as well.
b. The New Growth Theory and Corruption
Many economists assess that dysfunctional government institutions constitutea severe obstacle to investment, entrepreneurship and innovation. North (1990)argues that low security of property rights over physical capital, profits andpatents may reduce incentives and opportunities to invest, innovate and obtainforeign technology. Cumbersome and dishonest bureaucracies may delay thedistribution of permits and licences and this ultimately slows down the processby which technological advances become embodied in new equipment or newproductive processes. Bardhan (1997) argues that corruption has its adverse effectsnot just on static efficiency but also on investment and growth.
2
For example,
2
However, there is a strand in the corruption literature that suggests that, in the context of per-vasive and cumbersome regulations in developing countries, corruption may actually improveefficiency and enhance growth. For example, see Leff (1964) and Huntington (1968).

FDI AND ECONOMIC GROWTH IN EP AND IS COUNTRIES 1847
© 2007 The AuthorJournal compilation © Blackwell Publishing Ltd. 2007
a payment of bribes by a foreign investor to get an investment licence clearlydiminishes the incentive to invest in the host developing country. Arguably, inthe taxation system of many countries, losses can be subtracted from taxableinvestment income, but there is no corresponding loss offset in the case ofbribes, so that the latter are particularly harmful for risk-taking in the contextof innovation. Innovators are particularly at the mercy of corrupt public officials,because new producers need government-supplied goods like permits and licencesmore than established producers. Romer (1994) suggests that corruption as a taxon
ex post
profits may in general stifle entry of new goods (or technology), whichrequire an initial fixed cost investment.
Mauro (1995) finds a significant negative effect of the corruption index on theinvestment rate or the rate of growth (even after controlling for some otherdeterminants of the latter, and correcting for possible endogeneity bias in thedata). The negative relation seems to hold even in subsamples of countries wherebureaucratic regulations are reported to be cumbersome, which is an indicationthat corruption as a way of bypassing these regulations may not have been verybeneficial.
Using a general equilibrium approach, Acemoglu and Verdier (1998) consideran economy where contracts are necessary to encourage investments. Contractenforcement requires that a fraction of the agents work in the public sector anddo not accept bribes. These results point to three conclusions: (i) it may beoptimal to allow some corruption and not enforce property rights fully; (ii) lessdeveloped economies may choose lower levels of property right enforcement andmore corruption; and (iii) there may exist a ‘free lunch’ such that over a certainrange it is possible simultaneously to reduce corruption, increase investment andachieve a better allocation of talent.
Mo’s (2001) study introduces a new perspective on the role of corruption ineconomic growth and provides quantitative estimates of the impact of corruptionon the growth and importance of the transmission channels. It employs the ordi-nary least squares estimation technique and finds that a one per cent increase inthe corruption level reduces the growth rate by about 0.72 per cent; in otherwords, a one-unit increase in the corruption index reduces the growth rate by0.545 percentage points. One important channel through which corruption affectseconomic growth is political instability, which accounts for about 53 per cent ofthe total effect. The study also finds that corruption decreases the level of humancapital and the share of private investment.
Our study sets out to determine how the presence of corruption enhances FDIor not in regard to the two trade regimes (EP and IS policies). A testable hypoth-esis is that, in the presence of corruption, the change in economic growth withrespect to FDI is higher in countries following an EP policy than in countriesfollowing an IS strategy. This is so because bureaucratic regulations are expectedto be more cumbersome in IS countries than those in EP countries.

1848 YOHANE KHAMFULA
© 2007 The AuthorJournal compilation © Blackwell Publishing Ltd. 2007
3. MODEL SPECIFICATION AND DATA
Our task in this section is to specify an empirical model with which we willbe able to test the hypothesis that, other things equal, economic growth in devel-oping countries will increase with respect to an increase in FDI more in EPcountries than in countries following an IS strategy, when the degree of corruptionis included. Our empirical model is derived from a production function in whichFDI is introduced as an input in addition to labour and domestic capital. FDI isthe principal source of human capital and new technology to developing coun-tries. This variable is included in the production function in order to take intoaccount spillover effects and learning by doing associated by FDI. Anothervariable included in the equation to be tested is exports, which has been foundto highly influence economic growth by existing studies that investigate theexport-led growth hypothesis (see Greenaway and Sapsford, 1994). We includethe crucial factor, corruption index, to determine the extent FDI influenceseconomic growth. A useful conclusion on this question will be drawn from theinteraction variable between the corruption perception index and FDI.
The production function can be written as follows:
3
Y
=
g
(
L
,
K
,
C
,
F
·
C
,
X
,
t
). (1)
In equation (1),
Y
is the real gross domestic product (real GDP),
L
the labourinput,
K
the domestic capital stock,
C
the corruption perception index,
F · C
thestock of foreign capital interacted with corruption,
X
the exports and
t
the timetrend, capturing technical progress. If equation (1) is assumed to be linear innatural logarithms, we obtain the following expression on taking logs:
ln
Y =
β
0
+
β
1
ln
L
+
β
2
ln
K
+
β
3
ln
C
+
β
4
ln [
F · C
] +
β
5
ln
X
+
u
. (2)
Equation (2) gives the determinants of the growth rate of GDP. These determin-ants are given as the rates of growth of the individual variables.
β
1
to
β
5
are,respectively, output elasticities of labour, domestic capital, domestic-countrycorruption, foreign capital interacted with domestic-country corruption, and exports;
u
is the disturbance term. The parameter
β
4
is of particular interest in our empiricaltests that follow. In the context of low-income countries, there are problemsassociated with the measurement of the capital stock. To deal with such problems,we approximate the rate of growth of the capital stock by the share of investmentin GDP. Taking into account the corruption perception index, our growth equationcan now be written as follows:
3
This is a modified version of the production function used by BSS (1996). The new element hereis the variable
C
, which represents the degree of corruption.

FDI AND ECONOMIC GROWTH IN EP AND IS COUNTRIES 1849
© 2007 The AuthorJournal compilation © Blackwell Publishing Ltd. 2007
∆
ln
RY
=
β
0
+
β
1
∆
ln
L
+
β
2
[
HI
/
Y
] +
β
3
C
+
β
4
[
FDI
/
Y
]
+
β
5
[
FDI
/
Y
]
· C
+
β
6
ln
X
+
θ
D
+
u
, (3)
where
HI
stands for home-country (domestic) investment, ln
RY
is the natural log ofreal GDP,
FDI
represents foreign direct investment,
D
represents a vector of dummiesthat influence ln
RY
(year dummies and 1997 Asian financial crisis dummy) and
u is the random error term. FDI/Y replaces F in equation (2). The ratio of foreigndirect investment (FDI ) to nominal GDP (Y ) is determined as follows:
FDI/Y = γ0 + γ1 ∆ ln L + γ2(HI/Y ) + γ3C
+ γ4 ∆ ln RY + γ5 ∆ ln X + θD + ω, (4)
where ω is the random error term. It should be noted that equations (3) and (4) include the first differences of the
logs of real income (RY ), labour input (L) and export (X ) variables, which arestationary (or integrated of order zero). We can then specify our fixed-effectssimultaneous-equation model as follows:
∆ ln RYit = β0 + β1 ∆ ln Lit + β2[(HI/Y )]it + β3Cit + β4[(FDI/Y )]it
+ β5[(FDI/Y ) · C]it + β6 ∆ ln Xit + θDt + vi + εit (5)
and
[FDI/Y ]it = γ0 + γ1 ∆ ln Lit + γ2[(HI/Y )]it + γ3C
+ γ4 ∆ ln RYit + γ5 ∆ ln Xit + θDt + υi + ωit. (6)
In equations (5) and (6), {vi + εit} and {υi + ωit} are composite residual termsand we have little interest in them; we want the estimates of β ’s and γ ’s. Basedon observed data on ∆ ln RY and [FDI/Y ] and the independent variables, ∆ ln L,HI/Y, C, (FDI/Y) · C and ∆ ln X, the method of two-stage least squares can be usedto estimate β. vi and υi are the unit-specific residuals or fixed-effects terms; eachof them differs between units, but, for any particular unit, its value is constant.For the present data set, for example, a country that has underdeveloped infra-structure would have a very small economic growth year after year, and so wouldhave a negative vi. The residual terms, εit and ωit, have the usual properties (mean0, uncorrelated with themselves, uncorrelated with the exogenous variables,uncorrelated with v or υ, and homoscedastic).
In equation (5), we expect the effect of (FDI/Y ) · C on the economic growth variableto be positive and numerically larger for EP countries than for IS countries. Whetherthis effect is greater in magnitude than that of domestic investment, HI/Y, in the EP

1850 YOHANE KHAMFULA
© 2007 The AuthorJournal compilation © Blackwell Publishing Ltd. 2007
countries is ambiguous. The outcome will depend on the degree of corruption in theEP countries. One outcome is certain for the EP countries: because of the spillovereffects and externalities associated with human capital, and the higher rate oftechnical innovation associated with foreign direct investment (unlike domesticinvestment), foreign direct investment is expected to generate more economicgrowth than that of domestic investment if the degree of corruption tends to zero.
Our data set spans the period 1994–2004. The variables for which data are sourcedinclude: nominal gross domestic product, foreign direct investment, domestic invest-ment, labour, corruption perception index and exports value. In this study, asclassified by the World Bank, the IS countries include India, Argentina, Pakistan,Egypt, Peru, Philippines, Indonesia, Colombia and Mexico. The EP countries areas follows: Jamaica, Malaysia, Singapore, Thailand, Brazil, Sri Lanka, Chile,Nicaragua and South Korea. The sources of these data are the IMF InternationalFinance Statistics, the World Bank and International Labour Statistics.
Our corruption perception index (CPI) is sourced from the Centre for Corrup-tion Research. The CPI is a composite index and is compiled from surveys ofbusinesspeople and assessments by country analysts from independent institutions.All sources use a homogeneous definition of ‘extent of corruption’. The assess-ments are collected from experienced respondents and, as such, boost our graspof real levels of corruption. Moreover, non-parametric statistics are employed forstandardising the data and for determining the accuracy of the scores. The scoreof the CPI ranges between 10 (highly clean) and 0 (highly corrupt).
4. EMPIRICAL RESULTS AND ANALYSIS
We start by estimating equation (6) using the OLS method at the first stage.Table 1 gives the results of fixed-effects regressions for the ratio of FDI andnominal gross domestic product (NGDP) for three categories – IS countries, EPcountries and overall group of countries. The parameter estimates for the corrup-tion perception index, CI, have the correct signs and are significant at the fiveper cent level of significance in both IS and EP countries. That is, less corruptionactivity is followed by high economic growth.4 This outcome is also maintainedwhen both groups are combined, as can be seen from the estimated coefficientsof this variable in the last column of Table 1. The negative and significantcoefficient on the log of exports for IS countries is in line with a priori expecta-tion of the effect of this variable on foreign direct investment in such economies:the IS strategy discourages imports of goods and services, which includes FDI.Thus, as IS countries export more, this trade progress will be accompanied by a
4 We reiterate that the score of the CPI lies between 10 – highly clean – and 0 – highly corrupt.

FDI AND ECONOMIC GROWTH IN EP AND IS COUNTRIES 1851
© 2007 The AuthorJournal compilation © Blackwell Publishing Ltd. 2007
reduction in the flow of direct investment into the economy. The parameter effectof the interaction term between domestic investment ratio and corruption percep-tion index, [hi/ngdp] · CI, is positive and significant for the IS countries andoverall group of countries.
Unlike the IS group, the EP and overall group of countries have most of theyear dummies significant at the five per cent level of significance. This meansthat the flows of foreign direct investment into EP and the overall group of
TABLE 1First-stage Fixed-effects Regressions: IS Countries, EP Countries and All Countries
(Dependent variable: FDI/NGDP)
Regressor IS Countries EP Countries All Countries
∆ log labour −0.0095** −0.0175* −0.0317**(−1.97) (−1.83) (−2.62)
hi/ngdp 0.0461** 0.0918** 0.0892**(2.87) (3.76) (5.86)
CI 0.0018** 0.0106** 0.0165**(6.79) (5.67) (7.34)
[hi/ngdp] · CI 0.0956** 0.0263 0.0514**(3.11) (1.32) (2.28)
∆ log exports −0.0016** −0.0014 −0.0026(−1.98) (−0.86) (−0.68)
d95 −0.0004 −0.0019 −0.0019(−0.19) (−0.35) (−0.72)
d96 0.0008 0.0064 0.0134(0.68) (0.72) (0.66)
d97 0.0052* 0.0215** 0.0231**(2.09) (2.15) (2.11)
d98 0.0091 0.0321** 0.0137**(1.03) (3.63) (2.88)
d99 0.0153 0.0414* 0.0225**(1.63) (3.45) (3.37)
d00 0.0067* 0.1265** 0.0142**(1.75) (3.06) (2.91)
d01 0.0032 0.0216** 0.0109**(1.05) (2.32) (2.35)
d02 0.0805 0.0311** 0.0134**(0.79) (2.55) (2.84)
d03 0.0033 0.0168** 0.0093**(0.69) (2.81) (2.39)
d04 0.0009 0.0214** 0.0152**(0.82) (2.68) (2.73)
d fincrisis97 −0.0017 −0.0172** −0.0191**(−1.22) (−5.56) (−5.69)
Constant 0.0612** 0.0393** 0.0604**(4.46) (3.34) (4.27)
Notes:* Significant at the 10 per cent level only; ** significant at the 5 per cent level; t-statistics are in parentheses.Adjusted R-squared for IS, EP and overall groups are, respectively, 0.91, 0.89 and 0.90.

1852 YOHANE KHAMFULA
© 2007 The AuthorJournal compilation © Blackwell Publishing Ltd. 2007
countries, between different years, are statistically different. The 1997 Asianfinancial crisis dummy ( fincrisis97) also made a difference in the flow of foreigndirect investment into all groups of countries.
Table 2 reports the results of the second-stage fixed-effects regressions for IS,EP and the overall group. We can see that the variable for changes in economic
TABLE 2Second-stage Fixed-effects Regressions: IS Countries, EP Countries and All Countries
(Dependent variable: ∆ log real/GDP)
Regressor IS Countries EP Countries All Countries
∆ log labour −0.1506 0.7913** 0.7118**(−1.87) (8.11) (3.27)
hi/ngdp 1.0916** −0.7821 −1.9459(2.92) (−0.63) (−1.44)
CI 0.2614** 1.8336** 0.8132**(4.32) (2.06) (4.39)
[ fdi/ngdp] · CI 0.1153** 0.9915** 2.8573**(2.56) (3.34) (4.63)
[hi/ngdp] · CI 2.9148** 0.6194 1.6192(2.44) (1.08) (1.87)
∆ log exports 0.1663 0.2626** 0.1955**(0.82) (3.22) (2.33)
d95 −0.1521 0.2511 0.2142(−0.63) (0.68) (0.35)
d96 0.3682 −0.0614 0.0832(0.71) (−0.36) (0.23)
d97 0.6815 −0.1516 0.5513(1.32) (−0.52) (0.65)
d98 0.7221 −0.3268 −0.2256(1.17) (−1.73) (−0.44)
d99 0.9348* −0.4153 0.1868(1.83) (−0.66) (0.56)
d00 0.8911* −0.0791 0.2119(1.76) (−0.41) (0.38)
d01 0.9253 −0.5253 −0.3949(1.11) (−1.35) (−0.73)
d02 0.6726 −0.5119 −0.6276(1.03) (−1.56) (−1.27)
d03 0.6812 −0.6211 −0.6254(0.92) (−1.67) (−0.76)
d04 0.7366 −0.6351* −0.5634(0.95) (−1.84) (−0.92)
d fincrisis97 −0.2613 −0.2513 −0.9082**(−0.83) (−0.91) (−2.82)
Constant 3.9152 −4.6771* −3.6783*(1.84) (−6.11) (−1.82)
Notes:* Significant at the 10 per cent level only; ** significant at the 5 per cent level; t-statistics are in parentheses.Adjusted R-squared for IS, EP and overall groups are, respectively, 0.72, 0.83 and 0.68.
FDI AND ECONOMIC GROWTH IN EP AND IS COUNTRIES 1853
© 2007 The AuthorJournal compilation © Blackwell Publishing Ltd. 2007
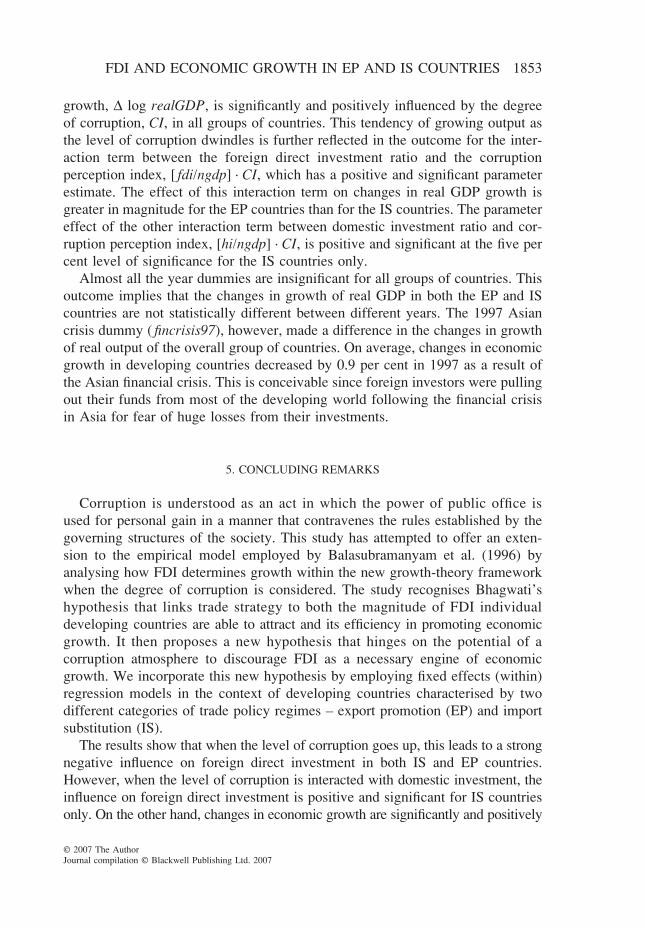
growth, ∆ log realGDP, is significantly and positively influenced by the degreeof corruption, CI, in all groups of countries. This tendency of growing output asthe level of corruption dwindles is further reflected in the outcome for the inter-action term between the foreign direct investment ratio and the corruptionperception index, [ fdi/ngdp] · CI, which has a positive and significant parameterestimate. The effect of this interaction term on changes in real GDP growth isgreater in magnitude for the EP countries than for the IS countries. The parametereffect of the other interaction term between domestic investment ratio and cor-ruption perception index, [hi/ngdp] · CI, is positive and significant at the five percent level of significance for the IS countries only.
Almost all the year dummies are insignificant for all groups of countries. Thisoutcome implies that the changes in growth of real GDP in both the EP and IScountries are not statistically different between different years. The 1997 Asiancrisis dummy ( fincrisis97), however, made a difference in the changes in growthof real output of the overall group of countries. On average, changes in economicgrowth in developing countries decreased by 0.9 per cent in 1997 as a result ofthe Asian financial crisis. This is conceivable since foreign investors were pullingout their funds from most of the developing world following the financial crisisin Asia for fear of huge losses from their investments.
5. CONCLUDING REMARKS
Corruption is understood as an act in which the power of public office isused for personal gain in a manner that contravenes the rules established by thegoverning structures of the society. This study has attempted to offer an exten-sion to the empirical model employed by Balasubramanyam et al. (1996) byanalysing how FDI determines growth within the new growth-theory frameworkwhen the degree of corruption is considered. The study recognises Bhagwati’shypothesis that links trade strategy to both the magnitude of FDI individualdeveloping countries are able to attract and its efficiency in promoting economicgrowth. It then proposes a new hypothesis that hinges on the potential of acorruption atmosphere to discourage FDI as a necessary engine of economicgrowth. We incorporate this new hypothesis by employing fixed effects (within)regression models in the context of developing countries characterised by twodifferent categories of trade policy regimes – export promotion (EP) and importsubstitution (IS).
The results show that when the level of corruption goes up, this leads to a strongnegative influence on foreign direct investment in both IS and EP countries.However, when the level of corruption is interacted with domestic investment, theinfluence on foreign direct investment is positive and significant for IS countriesonly. On the other hand, changes in economic growth are significantly and positively
1854 YOHANE KHAMFULA
© 2007 The AuthorJournal compilation © Blackwell Publishing Ltd. 2007
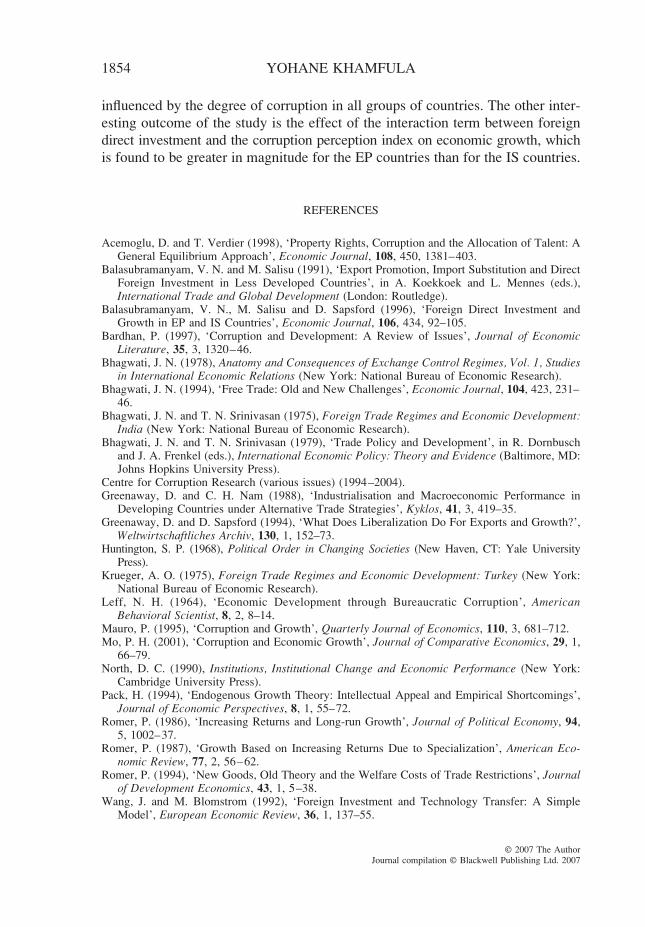
influenced by the degree of corruption in all groups of countries. The other inter-esting outcome of the study is the effect of the interaction term between foreigndirect investment and the corruption perception index on economic growth, whichis found to be greater in magnitude for the EP countries than for the IS countries.
REFERENCES
Acemoglu, D. and T. Verdier (1998), ‘Property Rights, Corruption and the Allocation of Talent: AGeneral Equilibrium Approach’, Economic Journal, 108, 450, 1381–403.
Balasubramanyam, V. N. and M. Salisu (1991), ‘Export Promotion, Import Substitution and DirectForeign Investment in Less Developed Countries’, in A. Koekkoek and L. Mennes (eds.),International Trade and Global Development (London: Routledge).
Balasubramanyam, V. N., M. Salisu and D. Sapsford (1996), ‘Foreign Direct Investment andGrowth in EP and IS Countries’, Economic Journal, 106, 434, 92–105.
Bardhan, P. (1997), ‘Corruption and Development: A Review of Issues’, Journal of EconomicLiterature, 35, 3, 1320–46.
Bhagwati, J. N. (1978), Anatomy and Consequences of Exchange Control Regimes, Vol. 1, Studiesin International Economic Relations (New York: National Bureau of Economic Research).
Bhagwati, J. N. (1994), ‘Free Trade: Old and New Challenges’, Economic Journal, 104, 423, 231–46.
Bhagwati, J. N. and T. N. Srinivasan (1975), Foreign Trade Regimes and Economic Development:India (New York: National Bureau of Economic Research).
Bhagwati, J. N. and T. N. Srinivasan (1979), ‘Trade Policy and Development’, in R. Dornbuschand J. A. Frenkel (eds.), International Economic Policy: Theory and Evidence (Baltimore, MD:Johns Hopkins University Press).
Centre for Corruption Research (various issues) (1994–2004).Greenaway, D. and C. H. Nam (1988), ‘Industrialisation and Macroeconomic Performance in
Developing Countries under Alternative Trade Strategies’, Kyklos, 41, 3, 419–35.Greenaway, D. and D. Sapsford (1994), ‘What Does Liberalization Do For Exports and Growth?’,
Weltwirtschaftliches Archiv, 130, 1, 152–73.Huntington, S. P. (1968), Political Order in Changing Societies (New Haven, CT: Yale University
Press).Krueger, A. O. (1975), Foreign Trade Regimes and Economic Development: Turkey (New York:
National Bureau of Economic Research).Leff, N. H. (1964), ‘Economic Development through Bureaucratic Corruption’, American
Behavioral Scientist, 8, 2, 8–14.Mauro, P. (1995), ‘Corruption and Growth’, Quarterly Journal of Economics, 110, 3, 681–712.Mo, P. H. (2001), ‘Corruption and Economic Growth’, Journal of Comparative Economics, 29, 1,
66–79.North, D. C. (1990), Institutions, Institutional Change and Economic Performance (New York:
Cambridge University Press).Pack, H. (1994), ‘Endogenous Growth Theory: Intellectual Appeal and Empirical Shortcomings’,
Journal of Economic Perspectives, 8, 1, 55–72.Romer, P. (1986), ‘Increasing Returns and Long-run Growth’, Journal of Political Economy, 94,
5, 1002–37.Romer, P. (1987), ‘Growth Based on Increasing Returns Due to Specialization’, American Eco-
nomic Review, 77, 2, 56–62.Romer, P. (1994), ‘New Goods, Old Theory and the Welfare Costs of Trade Restrictions’, Journal
of Development Economics, 43, 1, 5–38.Wang, J. and M. Blomstrom (1992), ‘Foreign Investment and Technology Transfer: A Simple
Model’, European Economic Review, 36, 1, 137–55.