Foreign Direct Investment in South Africa: the BRIC perspective
22
1 Foreign Direct Investment in South Africa: the BRIC perspective by Ron Sandrey tralac Working Paper February 2013 Please consider the environment before printing this publication www.tralac.org | [email protected] | Twitter @tradelawcentre | Copyright © tralac, 2013. Readers are encouraged to quote and reproduce this material for educational, non-profit purposes, provided the source is acknowledged. All views and opinions expressed remain solely those of the authors and do not purport to reflect the views of tralac WORKING PAPER
-
Upload
khangminh22 -
Category
Documents
-
view
1 -
download
0
Transcript of Foreign Direct Investment in South Africa: the BRIC perspective
1
Foreign Direct Investment in South
Africa: the BRIC perspective
by Ron Sandrey
tralac Working Paper
February 2013 ���� Please consider the environment before printing this publication
www.tralac.org | [email protected] | Twitter @tradelawcentre | Copyright © tralac, 2013.
Readers are encouraged to quote and reproduce this material for educational, non-profit purposes, provided the source is
acknowledged. All views and opinions expressed remain solely those of the authors and do not purport to reflect the views of tralac
WO
RK
ING
PA
PE
R

2
Copyright © tralac, 2013.
Readers are encouraged to quote and reproduce this material for educational, non-profit purposes,
provided the source is acknowledged. All views and opinions expressed remain solely those of the
authors and do not purport to reflect the views of tralac
This publication should be cited as: Sandrey, R. 2013.
Foreign Direct Investment in South Africa: the BRIC perspective. Stellenbosch: tralac.
This publication has been financed by the National Agricultural Marketing Council (NAMC). NAMC
does not necessarily share the views expressed in this material. Responsibility for its contents rests
entirely with the author.
www.tralac.org | [email protected] | Twitter @tradelawcentre
Readers are encouraged to quote and reproduce this material for educational, non-profit purposes,
provided the source is acknowledged. All views and opinions expressed remain solely those of the authors
and do not purport to reflect the views of tralac.

Foreign Direct Investment in South Africa: the BRIC perspective
tralac Working Paper | February 2013
1
Foreign Direct Investment in South Africa: the BRIC perspective
by Ron Sandrey
Investment is the fuel of economic growth, and in a closed economy domestic savings are the only
source of investment. However, in an open economy these domestic savings may be augmented by
borrowing from abroad (the savings of others). The objective for this chapter is to present a recent
view of investment for South Africa, both in inflows (liabilities) and outflows (assets), with a
concentration of the role of the BRIC countries (Brazil, Russia, India and China) in these flows.
There are three categories of investment recorded by the South African Reserve Bank. These are:
1. Foreign direct investment (FDI) as defined by the net inflow of investment to acquire a lasting
management interest (10% or more of voting stock) in an enterprise operating in an economy
other than that of the investor. It is the sum of equity capital, reinvestment of earnings, other
long-term capital, and short-term capital as shown in a country’s balance of payments.
2. FDI is distinct from portfolio investment, which is considered to be the purchase of stocks,
bonds, and money market instruments by foreigners for the purpose of realising a financial
return, which does not result in foreign management, ownership, or legal control.
3. In general terms, any foreign investment that is not direct or portfolio investment is
considered ‘other’ investment (loans, trade finance, currency and deposits and other assets
with unaffiliated parties), and, in contrast to FDI, both foreign portfolio and ‘other’
investments have no controlling interest in their investment.
In summary, we find that South Africa has somewhat less of a call on funds held offshore (assets)
than others have on their funds held in South Africa for each of the three years from 2008 to 2010
examined. Based on 2010 data Europe was the main destination for assets (59.8%) and the main
source for liabilities (63.3%), with this followed by the Americas for both. Both Africa and Asia are
more important as an investment destination than as an investment source. Changes over the period
show that Asia had the biggest increase in assets by percentage but that Europe’s increase by value
remained the largest. For liabilities or inbound, Europe again displayed the largest increase but in
percentage terms Europe, Americas and Asia were very similar. In 2010 most of the total

Foreign Direct Investment in South Africa: the BRIC perspective
tralac Working Paper | February 2013
2
South African assets (43%) were held in portfolio assets abroad, followed almost equally by direct
and other investments. By region, most of the 2010 portfolio is held in Europe (77%) while in Africa,
Asia, the Middle East and Oceania it is predominantly direct investment. The comparable picture for
liabilities (investments held in South Africa by others) shows that overall more is held in portfolio
than in direct investment for each year. European and Asian money in South Africa is held more in
direct investment (54% and 69% respectively), while the American money (85%) is concentrated in
portfolio investments. Examining the BRIC countries we find that China was the fourth most
significant destination for South African assets held abroad, with most of these assets direct
investments associated with banks. A very similar position is found for Chinese investments in
South Africa (ranked at number nine in 2010), where the majority are direct investments associated
with banks. South African investments in Brazil are predominantly portfolio investments associated
with banks, while in India they are more associated with ‘other’ investments and banks.
The overall picture for South African Foreign Direct Investment
We will start by an examination of FDI and then move to portfolio and ‘other’.
Firstly, we need a discussion on the data and its interpretation used in this chapter. The data is stock
data and it has been sourced directly from the South African Reserve Bank. It is the results of their
survey data to assess the values of foreign assets in South Africa (liabilities resulting from inflows of
foreign capital) and South African assets abroad (assets resulting from outflows of South African
capital). This data is the stocks. The other data series available from the South African Reserve Bank
is the annual flows, or the values of capital inflows (liabilities) and outflows (assets) to (a) FDI
investment, (b) portfolio investment or (c) ‘other’ investment as defined above.
From the stocks data we have analysed the annual changes to the liabilities and assets for
South Africa. This is not flows, but reported annual changes to stocks whether they be in foreign
firms in South Africa or in South African firms abroad. An important factor here is that by definition
the stocks given by the Reserve Bank are denominated in South African rand, while the actual values
of these stocks are, of course, in the host foreign country when they are held abroad. Consequently,
the foreign currency value of the stocks held abroad will reflect recent currency fluctuations, but

Foreign Direct Investment in South Africa: the BRIC perspective
tralac Working Paper | February 2013
3
they should not influence the foreign stocks in South Africa to the same extent.1 In addition, there
are profit/loss adjustments and other related factors that need to be considered.
Inward Foreign Direct Investment (liabilities)
The next series of tables present the data2 for South Africa FDI inflows. Table 1 starts by showing the
cumulative FDI inflows (stocks of FDI) denominated in R1,000 million3. These stocks increased from
R81,000 million in 1997 through to R1,016,000 million in 2010. The dominance of Europe as a source
can be seen from viewing the table, with the United Kingdom (UK), Netherlands, Germany and
Switzerland all in the top five stock totals for 2010. Also shown are the totals from Europe4, with
these ranging from a low of 71.5% in 1998 to a high of 89.6% in 2001 and a total average of 83.5%
over the period shown. Much has been made of the role of China as a source of FDI for South Africa,
but Table 1 shows that, while certainly increasing over recent years, these stocks are still relatively
modest.
Table 1: South African FDI stocks, R1,000 million
Total Europe UK Neth US Germ Swiss China Japan Malay Lux
1997 81.5 61.1 37.1 4.6 12.1 10.0 3.8 0.0 1.1 3.5 0.4
1998 91.9 65.7 36.6 4.8 13.8 10.5 7.6 0.0 1.3 7.0 0.3
1999 318.6 288.0 248.3 5.4 17.3 16.8 8.4 0.0 0.9 6.6 0.7
2000 328.9 292.6 242.9 11.0 19.6 19.1 10.3 0.1 1.5 6.8 0.8
2001 370.7 332.2 281.2 10.7 18.9 22.4 6.8 0.2 2.0 6.5 2.5
2002 264.4 211.1 158.1 12.8 23.9 22.0 6.0 0.2 3.4 7.1 3.0
2003 311.2 245.7 188.3 16.1 29.5 22.9 6.1 0.2 7.1 10.0 1.8
2004 362.9 294.0 227.9 16.2 31.2 25.8 6.4 0.3 7.4 2.4 1.9
2005 499.6 425.1 350.4 14.1 32.1 29.9 10.6 0.3 9.9 2.3 2.2
2006 611.7 535.4 440.3 22.1 37.4 34.1 12.3 0.5 14.7 2.4 1.9
2007 751.9 655.9 524.2 29.0 46.3 41.4 21.3 0.5 12.9 2.3 8.6
2008 632.6 492.2 342.5 32.2 47.2 47.0 29.2 26.8 17.0 12.8 8.4
2009 866.7 691.9 468.0 91.4 55.8 58.1 28.8 34.0 17.5 14.6 10.7
2010 1,016 842.8 504.3 177.9 62.7 60.9 46.1 37.3 19.3 17.2 15.8
Source: South African Reserve Bank
1 These same fluctuations will, of course, influence the value for the mirror image of the source country’s stock in South
Africa when they are viewed from that country’s perspective. 2 As at January 2012 from the South African Reserve Bank (Pieter Swart, personal communication). Neth is the
Netherlands, Germ is Germany, Swiss is Switzerland, Malay is Malaysia and Lux is Luxemburg. 3 We use the so-called ‘short’ billion of one thousand million rather than the more uncommon ‘long’ billion of one million
million rand. 4 As defined by total Europe, not just European Union.

Foreign Direct Investment in South Africa: the BRIC perspective
tralac Working Paper | February 2013
4
Of more interest is the changes to these resource stocks (note that these are not ‘flows), and the
highlights of these changes are shown in Table 2 (again in thousand million – or billion – rand). These
changes will reflect new inflows (investment) or outflows (disinvestment) by the foreign firms as well
as adjustments such as profit/loss data. Column 2 shows the total annual changes with the
penultimate row showing the grand total change over the period and the bottom row showing the
percentage of the total change from that source. The grand total change from 1998 has been
R934 billion, with some distinct variations apparent. The period through to 2005 was especially
volatile, with solid increases in 1999 but major decreases in 2002 with modest changes in the other
periods. From 2005 onwards there were significant increases with the exception of decreases in
2008. The dominance of Europe is again apparent, although note the European (mostly UK) changes
during the 2002 and the 2008 years where these changes were strong enough to dictate the overall
result. China was an important source of FDI for South Africa in 2008.
Table 2: Inward FDI, year on year changes, R1,000 million (billion)
Total Europe UK Neth Germ US Swiss China Japan Lux
1998 10.4 4.6 -0.5 0.2 0.6 1.7 3.8 0.0 0.2 -0.1
1999 226.8 222.4 211.6 0.6 6.3 3.5 0.8 0.0 -0.4 0.5
2000 10.2 4.6 -5.3 5.6 2.3 2.3 1.9 0.1 0.7 0.0
2001 41.8 39.6 38.2 -0.3 3.3 -0.7 -3.5 0.1 0.5 1.7
2002 -106.3 -121.1 -123.1 2.0 -0.4 5.0 -0.8 0.1 1.5 0.5
2003 46.8 34.6 30.2 3.3 0.8 5.6 0.1 0.0 3.7 -1.1
2004 51.7 48.3 39.6 0.1 2.9 1.7 0.3 0.1 0.3 0.1
2005 136.7 131.1 122.5 -2.1 4.1 0.9 4.2 0.0 2.5 0.2
2006 112.1 110.3 89.9 8.0 4.2 5.2 1.6 0.1 4.8 -0.3
2007 140.2 120.6 83.9 6.8 7.2 9.0 9.1 0.0 -1.8 6.7
2008 -119.3 -163.8 -181.7 3.3 5.6 0.8 7.9 26.3 4.1 -0.2
2009 234.0 199.7 125.6 59.2 11.1 8.6 -0.5 7.2 0.4 2.3
2010 148.9 151.0 36.2 86.5 2.8 6.9 17.4 3.3 1.8 5.1
total 934.1 781.8 467.2 173.3 50.9 50.6 42.3 37.2 18.2 15.4
% total 100% 83.7% 50.0% 18.6% 5.4% 5.4% 4.5% 4.0% 1.9% 1.7%
Source: South African Reserve Bank
Other major investors not shown over the period have been Malaysia (R10.4 billion in 2008), France,
Bermuda and Russia. At the other extreme, Saudi Arabia disinvested slightly more than a billion rand
over the period in total, with a variation between reasonable investments some years and

Foreign Direct Investment in South Africa: the BRIC perspective
tralac Working Paper | February 2013
5
disinvestments in other. Panama and ‘other Central America’ are the other two main disinvesting
sources, although these are relatively small players.
Much has been made of the so-called BRICs as a source of FDI. The data shown in Table 3 suggests
that these changes are important, with China being a major FDI source in both 2008 and 2009. In
particular, Chinese investments offset disinvestment from other sources in 2008. Russia is the
second most important BRIC source (inflows/increases in 2004, 2005 and 2009 but
outflows/decreases in 2006), followed by India (2009) and a modest contribution from Brazil.
Table 3: South African FDI annual changes from BRICs, R1,000 million
Year end Total China Russia India Brazil BRICs
Dec flows % total
1998 10.4 0.0 0.0 0.0 0.0 0.1%
1999 226.8 0.0 0.0 0.0 0.0 0.0%
2000 10.2 0.1 0.0 0.0 0.0 0.8%
2001 41.8 0.1 0.0 0.0 0.0 0.2%
2002 -106.3 0.1 0.0 0.0 0.1 0.1%
2003 46.8 0.0 0.0 0.0 0.0 0.0%
2004 51.7 0.1 6.9 0.0 0.0 13.6%
2005 136.7 0.0 4.2 0.0 0.1 3.1%
2006 112.1 0.1 -11.1 0.1 0.0 9.7%
2007 140.2 0.0 0.0 0.3 0.0 0.2%
2008 -119.3 26.3 0.0 0.3 0.0 22.3%
2009 234.0 7.2 5.4 1.5 0.0 6.0%
2010 148.9 3.3 1.7 0.2 0.2 3.6%
Source: South African Reserve Bank
Outward FDI (assets)
We next turn to the reverse ‘mirror’ side of FDI, that of the value of investment from South Africa to
control business activity elsewhere in the world. The stock data for this is shown in Table 4, again in
R1 000 million. These stocks will reflect both the initial investments and changes to the values of
these investments over time from currency changes and other factors (such as unremitted
profits/losses). Again, Europe dominates as a destination, but not as comprehensively as it does for

Foreign Direct Investment in South Africa: the BRIC perspective
tralac Working Paper | February 2013
6
foreign assets (liabilities) held in South Africa. Luxemburg is the main destination, but from there the
trail is likely to be a little hard to decipher as this destination is somewhat akin to a flag of
convenience that shipping countries use. Using the International Monetary Fund (IMF) guidelines the
Reserve Bank only reports on the ‘first port of call’ for these funds.
Table 4: South African FDI foreign stocks by destination, R1,000 million (billion)
Year end Total Lux UK China Mauritius US Austria Nigeria
Dec
1997 113 42 32 0 1 3 0 0
1998 157 44 45 0 1 4 0 0
1999 203 42 79 -0 2 6 11 0
2000 245 58 77 0 3 11 2 0
2001 213 60 62 0 6 10 18 0
2002 190 48 36 0 3 21 27 0
2003 181 44 44 0 4 15 11 0
2004 220 51 66 2 8 15 17 5
2005 238 75 72 4 3 14 18 5
2006 354 106 80 16 34 22 22 10
2007 449 122 93 33 33 24 23 32
2008 465 54 115 29 44 27 28 28
2009 536 66 87 101 49 35 17 30
2010 593 103 99 93 53 29 25 24
Source: South African Reserve Bank
Table 5 examines the annual changes to stocks from South African outward FDI as represented by
the annual changes from Table 6. Again, this will represent both new investments and valuation
changes to existing investments. There has been much variation in these changes, with the first
three years showing consistent increases and then three years of decreases. This is followed by
seven years of increases albeit with aggregate variations from lows in 2005 and 2008 and a high in
2006. An examination of the data shows considerable annual variations in the individual destinations
with some significant increases taking place in some countries while others have shown major
decreases. For example, 2009 shows increases (mostly investments in this instance) of R72 billion in
China and large disinvestments in the UK and to a lesser extent Austria, while there were
disinvestments of R68 billion in Luxemburg during 2008.

Foreign Direct Investment in South Africa: the BRIC perspective
tralac Working Paper | February 2013
7
Table 5: Outbound South African FDI changes by destination, R1,000 million
Total Europe Africa China UK Lux Maur US Austria Nigeria
1998 44 40 3 0 13 2 0 1 0 -0
1999 46 38 1 -0 34 -2 1 2 11 0
2000 42 32 2 0 -1 16 1 5 -9 0
2001 -31 -31 3 0 -16 1 3 -1 15 -0
2002 -23 -35 -2 0 -26 -12 -3 11 9 0
2003 -9 -5 3 0 8 -4 1 -6 -16 0
2004 40 29 8 2 22 7 4 0 6 5
2005 18 24 -5 2 6 24 -5 -1 1 -0
2006 116 48 40 12 8 32 30 7 4 5
2007 94 38 25 17 13 16 -1 2 0 22
2008 16 -23 18 -4 22 -68 11 4 6 -3
2009 71 -31 13 72 -28 12 5 7 -12 2
2010 58 61 6 -9 12 36 4 -6 9 -6
total 480 184 116 93 68 61 53 25 25 24
total% 100% 38% 24% 19% 14% 13% 11% 5% 5% 5%
Source: South African Reserve Bank
Recent balance of payment flow data
Table 6 shows the annual balance of payment data as published by the South African Reserve Bank
for international investment flow data, where ‘liabilities’ are outflows, ‘assets’ are inflows, ‘net’ is
the balance for each sector, and balance’ is the overall balance as shown. Note that an increase in
liabilities (inflow of capital) is denoted by a positive value, while a decrease in liabilities (outflow of
capital) is denoted by a negative value. For assets, the position is reversed: an increase is a negative
value (South African money leaving the country) while a decrease is an inflow of capital denoted by a
positive value. Also note that this data is denoted in rand (million) and not in billion as in the series
of tables above.
The first segment is FDI, where there was an outflow of FDI during 2006 as liabilities declined, and
for most years assets abroad increased as indicated by the negative signs. The central segment
shows that except for 2008 there have been significant portfolio inflows into South Africa, and these
are generally greater than the outflows of portfolio investment going offshore. Note also that this
portfolio flow is generally greater than the comparable FDI values, and sometimes significantly so.

Foreign Direct Investment in South Africa: the BRIC perspective
tralac Working Paper | February 2013
8
Finally, the lower segment shows the ‘other’ category as discussed above, and the totals here are
also variable and often significant. The bottom row is literally ‘the bottom line’ and shows the total
effects.
Table 6: Overall update on balance of payment data for South Africa, R million (Flows)
Year 2003 204 2005 2006 2007 2008 2009 2010
Direct Invest
Liabilities 5,550 5,155 42,270 -3,567 40,120 74,403 45,465 8,993
Assets -4,275 -8,271 -5,916 -41,058 -20,896 25,888 -9,757 554
Net direct 1,275 -3,116 36,354 -44,625 19,224 100,291 35,708 9,547
Portfolio Invest
Liabilities 7,548 46,262 36,188 144,501 97,485 -71,540 107,234 107,876
Assets -1,001 -5,946 -6,123 -15,044 -24,026 -63,325 -13,470 -33,374
Net direct 6,547 40,316 30,065 129,457 73,459 -134,865 93,764 74,502
Other Invest
Liabilities 14,594 10,944 32,735 60,750 58,711 47,730 -39,956 7,899
Assets -36,919 -3,555 -2,895 -38,823 2,119 82,983 23,703 -22,138
Net direct -22,325 7,389 29,840 21,927 60,830 130,713 -16,253 -14,239
Balance -14,503 44,589 96,259 106,759 153,513 96,139 113,219 69,810
Source: South African Reserve Bank, Quarterly Bulletin, December 2011
Recent global FDI patterns and the BRICs
The Organisation for Economic and Cooperation Development (OECD) regularly report on global FDI
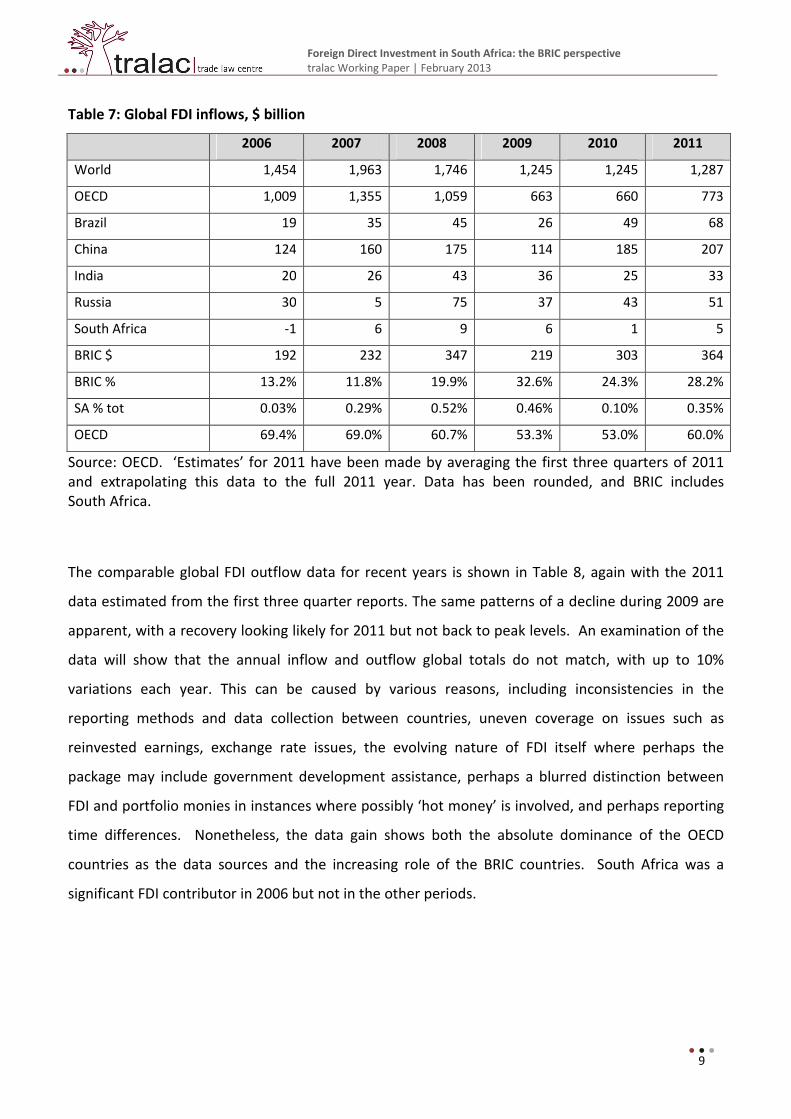
data and trends, and Table 7 below duplicates the data from its January 2011 update to put the
BRICs in a global perspective. It shows global figures for the years 2006 through to 2010 and for 2011
data/forecasts. Flows for 2009 were down considerably on the previous three ‘pre-crash’ years,
although flows have increased over 2010 and our ‘estimates’ for 2011 have not reached pre-crash
levels. OECD countries continue to be the main attraction for FDI inflows, but the third-from-bottom
line of Table 7 shows that the BRICs are becoming increasingly attractive to investors. The
penultimate line shows that as a percentage of global inflows South Africa peaked at 0.52% in 2008,
while the bottom line shows that OECD countries while still the destination for over half of the flows
are becoming less attractive as a destination.
Foreign Direct Investment in South Africa: the BRIC perspective
tralac Working Paper | February 2013
9
Table 7: Global FDI inflows, $ billion
2006 2007 2008 2009 2010 2011
World 1,454 1,963 1,746 1,245 1,245 1,287
OECD 1,009 1,355 1,059 663 660 773
Brazil 19 35 45 26 49 68
China 124 160 175 114 185 207
India 20 26 43 36 25 33
Russia 30 5 75 37 43 51
South Africa -1 6 9 6 1 5
BRIC $ 192 232 347 219 303 364
BRIC % 13.2% 11.8% 19.9% 32.6% 24.3% 28.2%
SA % tot 0.03% 0.29% 0.52% 0.46% 0.10% 0.35%
OECD 69.4% 69.0% 60.7% 53.3% 53.0% 60.0%
Source: OECD. ‘Estimates’ for 2011 have been made by averaging the first three quarters of 2011
and extrapolating this data to the full 2011 year. Data has been rounded, and BRIC includes
South Africa.
The comparable global FDI outflow data for recent years is shown in Table 8, again with the 2011
data estimated from the first three quarter reports. The same patterns of a decline during 2009 are
apparent, with a recovery looking likely for 2011 but not back to peak levels. An examination of the
data will show that the annual inflow and outflow global totals do not match, with up to 10%
variations each year. This can be caused by various reasons, including inconsistencies in the
reporting methods and data collection between countries, uneven coverage on issues such as
reinvested earnings, exchange rate issues, the evolving nature of FDI itself where perhaps the
package may include government development assistance, perhaps a blurred distinction between
FDI and portfolio monies in instances where possibly ‘hot money’ is involved, and perhaps reporting
time differences. Nonetheless, the data gain shows both the absolute dominance of the OECD
countries as the data sources and the increasing role of the BRIC countries. South Africa was a
significant FDI contributor in 2006 but not in the other periods.

Foreign Direct Investment in South Africa: the BRIC perspective
tralac Working Paper | February 2013
10
Table 8: Global FDI outflows, $ billion
2006 2007 2008 2009 2010 2011
World 1,376 2,170 1,902 1,122 1,355 1,536
OECD 1,188 1,932 1,636 903 1,063 1,343
Brazil 28 7 21 -10 12 -14
China 21 17 54 44 60 47
India 14 17 19 16 15 16
Russia 23 46 56 44 53 61
South Africa 6 3 -3 1 0 -1
BRIC $ 92 90 147 95 140 108
BRIC % 6.7% 4.1% 7.7% 8.5% 10.3% 7.0%
SA % tot 0.44% 0.14% 0.16% 0.11% 0.01% 0.07%
OECD 86.3% 89.0% 86.0% 80.5% 78.5% 87.4%
Source: OECD. ‘Estimates’ for 2011 have been made by averaging the first three quarters of 2011
and extrapolating this data to the full 2011 year. Data has been rounded, and BRIC includes South
Africa.
To put the BRIC FDI data in perspective we show data for flows as a percentage of the Gross
Domestic Product (GDP) for the OECD, BRICs and South Africa over the 2006-2010 periods in Table 9
and the stocks as a percentage of GDP over the same periods in Table 10. The left-hand side of the
tables shows the inflows and the right-hand side the outflows in each table. FDI inflows for the BRICs
are generally above the developed OECD average while outflow values are more variable.
Table 9: FDI flows as % of GDP
Inflows
Outflows
2006 2007 2008 2009 2010 2006 2007 2008 2009 2010
OECD 2.7 3.3 2.4 1.6 1.5 3.1 4.7 3.7 2.2 2.5
Brazil 1.7 2.5 2.7 1.6 2.3
2.6 0.5 1.2
0.6
China 4.6 4.6 3.9 2.3 3.1 0.8 0.5 1.2 0.9 1.0
India 2.2 2.2 3.4 2.8 1.6 1.6 1.5 1.5 1.3 1.0
Russia 3.0 4.2 4.5 3.0 2.9 2.3 3.5 3.3 3.6 3.5
South Africa 2.0 3.3 2.0 0.3 2.3 1.0 0.4
Source: OECD (Negative values are not calculated)

Foreign Direct Investment in South Africa: the BRIC perspective
tralac Working Paper | February 2013
11
The stocks for FDI inflows into South Africa as a percentage of GDP are higher than the other values
shown, while for outflows South Africa is positioned between the mature OECD average and the
developing BRICs – with the exception of Russia.
Table 10: FDI stocks as % of GDP
Inflows
Outflows
2006 2007 2008 2009 2010 2006 2007 2008 2009 2010
OECD 26.0 29.0 26.0 30.4 30.0 30.5 34.4 33.1 39.3 39.4
Brazil 20.2 22.5 17.4 25.0 22.6
10.4 10.1 9.4 10.3 9.1
China 22.6 20.1 20.3 26.4 25.1 3.3 3.3 4.1 4.9 5.3
India 7.7 9.2 9.9 13.2 12.9 3.0 3.8 5.0 6.2 6.1
Russia 26.9 37.8 13.0 31.0 33.3 21.9 28.5 12.4 24.8 24.9
South Africa 33.6 38.6 24.7 41.5 42.1 19.5 23.0 18.1 25.7 24.6
Source: OECD (Note that the South African data for 2008 appears to be an outlier)
The African picture
The IMF (2011) found that a reorientation toward new markets is underway in sub-Saharan Africa,
with nontraditional partners now accounting for about 50% of the region’s exports and almost 60%
of its imports. This is driven mostly by Brazil, India, and China, but it is augmented by increasing
trade within the region, and the rise of emerging partners is broadly homogeneous across the
various sub-Saharan African country subgroups. A similar reorientation is also taking place in
investment flows, with China now accounting for 16% of total FDI flows to the region and other
emerging countries also making considerable investments in sub-Saharan Africa. Chinese investment
is geographically spread, while most Indian investment is concentrated in Mauritius, and Brazil’s
investment is focused on Angola, Mozambique and, more recently, Liberia. Top destinations of
Chinese investment in the region are South Africa, Nigeria, Zambia, Niger, Ethiopia, and the
Democratic Republic of the Congo. While most of the emerging partners’ investments are in mining,
Chinese investment is also directed toward manufacturing, construction, finance, agriculture and
services while India has significant investment in Mauritius’ manufacturing sector. The Chinese FDI
profile is interesting, with packages that can involve large state-owned enterprises linking
investment in natural resources with related infrastructure projects to adroitly avoid political
interference and corruption – the so-called ‘Angolan model’. This is not the complete picture,
however, as the IMF reports that the Export-Import Bank of China estimated that of the 800 Chinese

Foreign Direct Investment in South Africa: the BRIC perspective
tralac Working Paper | February 2013
12
companies operating in Africa in 2006, approximately 85% were privately owned and were small or
medium-sized enterprises (SMEs).
Gelb (2010) warns of the problems associated with obtaining reliable data on Chinese FDI in South
Africa, and decries much of the published literature on the subject as being of very limited value.5
This data problem is echoed by Grimm (2011), who likens obtaining accurate information on Chinese
overseas development aid (ODA) to ’putting together a jigsaw puzzle’. While concentrating on
Chinese ODA, Grimm expands on the very real issue of how, for a variety of reasons, Chinese ODA
and FDI become blurred, and how these problems are accentuated in Africa. Gelb (2010) outlines the
problems associated with assessing FDI stock data of the respective two-way positions in both South
Africa and China and explains how the different reporting practices led to much confusion on actual
data. These problems include the use of survey data methodology used in South Africa that may be
incomplete in addition to giving the option of valuations at book value or market value, the use of
approvals in China where these projects may or may not eventuate, and the general problem of FDI
routed through a third country. His assessment is that South African data probably substantially
underestimates the stock of Chinese FDI in South Africa but significantly overstates South African
stocks in China. Conversely, he considers that Chinese data seems reasonable for Chinese stocks in
South Africa but seriously underestimates South African FDI in China.
Using the EDGE FDI Database, Gelb reports that ‘there are more than 4,100 operations of foreign
firms in South Africa, of which only 47 (just over 1%) are Chinese. In addition, 19 Chinese firms
entered South Africa but subsequently withdrew while twelve firms have signalled their intention to
enter but are yet to do so, making a total of 78 Chinese firms recorded. The database also records
over 3,500 operations of South African firms (including ‘émigrés’) in the rest of the world, of which a
mere 32 are in China (also about 1%). Another seven South African firms entered China but later
withdrew, and there are nine possible future entries, making a total of 48 firms. For Chinese stocks
in South Africa, the Industrial and Commercial Bank of China (ICBC) with its 20% holding in Standard
Bank is the largest Chinese FDI holding, followed by six Chinese mining companies with their
investments in mining and metal manufacturing. Conversely, only four ‘genuinely’ South African
companies had holdings in China: Bidvest, Sappi, Sasol and Naspers (Gelb, 2010).
5 He specifically states that ‘much of the information presented is erroneous, incomplete or outdated’ (Gelb 2010: 2).

Foreign Direct Investment in South Africa: the BRIC perspective
tralac Working Paper | February 2013
13
South Africa’s Foreign Investment Position: portfolio and ‘other’
The discussion to date has concentrated upon South Africa’s FDI policies and positions over recent
years. This section will expand upon that analysis by extending the three broad categories of FDI,
portfolio and ‘other’ investment for both assets (South African investment abroad) and liabilities
(investments in South Africa by other countries) and to give a more detailed analysis of the
destination for assets and sources of liabilities. Again the data is sourced from the South African
Reserve Bank (this will not be acknowledged in the individual tables), and all data is expressed in
R100 million amounts for the respective December years. The data is stock data, derived from the
Reserve Bank surveys. We will present both this stock data and changes to the stock data, and again
we emphasise that these changes to the stocks are NOT flows, but merely changes to the annual
stock positions. Flows are the data for new monies coming into South Africa for liabilities and leaving
South Africa for assets abroad. Any information given in this paper relating to changes to stock data
will include these flows and also changes in stocks from changes such as those from currency
valuations profit/loss amounts that may or may not be remitted, and other factors.
In summary, we find that most of the South African investments abroad (assets) are held in Europe
with these investments followed by the Americas. Other destinations and sources are much less
significant. The total assets abroad are very evenly split between the three categories of direct,
portfolio and ‘other’ investment. The most recent 2010 data for liabilities shows that portfolio
investments are somewhat more significant than direct investments with ‘other’ investments a more
distant third.
The big picture
Table 12 starts by giving the broad overall aggregate position for the December years 2008 through
to and including 2012 for both assets and liabilities. The ‘Change10/08’ is the amount with which the
investment position changed in 2012 from the 2008 position, while ‘Change%10/08’ is the relevant
percentage change for that same period. The ‘%share2010’ denotes the relevant shares of the total
for 2010. The term ‘IntOrg’ is the investment position relating to International Organisations.

Foreign Direct Investment in South Africa: the BRIC perspective
tralac Working Paper | February 2013
14
Table 12: South African investment assets and liabilities, R100 million
Assets Total Europe America Africa Asia IntOrg MidEast Oceania
2008 Totals 17,138 9,837 4,312 1,414 489 642 218 226
2009 Totals 18,137 10,352 3,781 1,528 1,203 769 253 252
2010 Totals 20,358 12,172 4,058 1,622 1,173 779 285 269
Change 3,221 2,335 -253 208 684 136 68 43
Change % 15.8% 19.2% -6.2% 12.9% 58.3% 17.5% 23.7% 16.0%
% share 2010 100% 59.8% 19.9% 8.0% 5.8% 3.8% 1.4% 1.3%
Liabilities Total Europe America Asia Africa IntOrg MidEast Oceania
2008 Totals 18,189 11,509 4,472 917 825 314 112 40
2009 Totals 20,899 13,354 5,402 1,010 707 257 135 35
2010 Totals 24,845 15,718 6,697 1,182 840 202 117 88
Change 10/08 6,656 4,209 2,226 265 16 -112 5 48
Change 10/08% 26.8% 26.8% 33.2% 22.5% 1.9% -55.6% 3.9% 54.5%
% share 2010 100% 63.3% 27.0% 4.8% 3.4% 0.8% 0.5% 0.4%
Source: South African Reserve Bank
The table highlights that:
• South Africa has somewhat less of a call on funds held offshore (assets) than others have on
their funds held in South Africa for each of the three years.
• Based on 2010 data Europe was the main destination for assets (59.8%) and the main source
for liabilities (63.3%), followed by the Americas for both.
• Both Africa and Asia are more important as an investment destination than an investment
source, while IntOrg is the destination for a modest 3.8% of South African foreign investments.
• MidEast and Oceania hold 1.4% and 1.3% of the assets respectively but are minor sources for
the liabilities.
• Changes over the period show that Asia had the biggest increase in assets by percentage but
Europe retained the largest increase by value. For liabilities or inbound, Europe again displayed
the largest increase but in percentage terms Europe, the Americas and Asia were very similar.

Foreign Direct Investment in South Africa: the BRIC perspective
tralac Working Paper | February 2013
15
In Table 13 the three investment categories of FDI, portfolio and ‘other’ are shown by region for
assets for the years 2008-2010 by total and then 2010 by (a) percentage share held by each region in
the three categories in 2010 and then in the lower part of the table, and (b) percentage share held
by each region of the three categories in 2010.
Table 13: South African foreign investment abroad (assets) by region & category
Total Europe America Africa Asia IntOrg MidEast Oceania
Assets R100 million
2008 Direct 4,648 2,537 341 1,022 335 1 200 214
2008 Portfolio 6,018 4,242 1,640 103 20 1 9 4
2008 Other 6,471 3,059 2,331 289 134 640 9 8
2008 Total 17,138 9,837 4,312 1,414 489 642 218 226
2009 Direct 5,357 2,228 462 1,157 1,057 1 230 221
2009 Portfolio 7,126 5,380 1,593 88 36 8 12 9
2009 Other 5,655 2,744 1,727 283 110 759 10 22
2009 Total 18,137 10,352 3,781 1,528 1,203 769 253 252
2010 Direct 5,932 2,834 431 1,218 971 1 245 232
2010 Portfolio 8,696 6,737 1,768 92 45 11 28 15
2010 Other 5,730 2,602 1,859 313 156 766 12 22
2010 Total 20,358 12,172 4,058 1,622 1,173 779 285 269
Assets – (a) % share held by each region in the three categories in 2010
Direct 29% 23% 11% 75% 83% 0% 86% 86%
Portfolio 43% 55% 44% 6% 4% 1% 10% 6%
Other 28% 21% 46% 19% 13% 98% 4% 8%
2010 Total 100% 100% 100% 100% 100% 100% 100% 100%
Assets – (b) % share held by each region of the three categories in 2010
Direct 100% 48% 7% 21% 16% 0% 4% 4%
Portfolio 100% 77% 20% 1% 1% 0% 0% 0%
Other 100% 45% 32% 5% 3% 13% 0% 0%
2010 Total 100% 60% 20% 8% 6% 4% 1% 1%
Source: South African Reserve Bank
In 2010 most of the total South African assets (43%) were held in portfolio assets abroad, followed
almost equally by direct and other investments. In 2008, however, there was more held in ‘other’
than in portfolio. By region, most of the 2010 portfolio is held in Europe (77%) while in Africa, Asia,

Foreign Direct Investment in South Africa: the BRIC perspective
tralac Working Paper | February 2013
16
the Middle East and Oceania it is predominantly direct. Investment held in International
Organisations are almost exclusively ‘other’.
The comparable picture for liabilities (investments held in South Africa by others) is shown in
Table 14 for 2008-2010 and by percentage shares for 2010 as in Table 13. Overall, there is more held
in portfolio than in direct for each year. European and Asian money is held more in direct (54% and
69% respectively), while the American money (85%) is concentrated in portfolio investments. The
International Organisation money is almost exclusively ‘other’, and ‘other’ is also the main African
investment.
Table 14: Foreign investment in South Africa (liabilities) by region & category
Liabilities Total Europe America Africa Asia IntOrg MidEast Oceania
R 100 million
2008 Direct 6,326 4,922 652 52 619 1 64 16
2008 Portfolio 7,971 4,149 3,406 267 139 0 3 7
2008 Other 3,891 2,439 414 505 159 312 46 17
2008 Total 18,189 11,509 4,472 825 917 314 112 40
2009 Direct 8,667 6,973 801 59 721 2 95 16
2009 Portfolio 9,337 4,551 4,353 278 140 1 5 8
2009 Other 2,895 1,830 248 370 148 255 35 10
2009 Total 20,899 13,354 5,402 707 1,010 257 135 35
2010 Direct 10,155 8,499 735 66 810 2 28 15
2010 Portfolio 11,923 5,621 5,691 306 197 1 43 63
2010 Other 2,767 1,598 271 468 175 199 45 10
2010 Total 24,845 15,718 6,697 840 1,182 202 117 88
Liabilities – % share held by each region in the three categories in 2010
Direct 41% 54% 11% 8% 69% 1% 24% 17%
Portfolio 48% 36% 85% 36% 17% 0% 37% 72%
Other 11% 10% 4% 56% 15% 99% 39% 11%
2010 Total 100% 100% 100% 100% 100% 100% 100% 100%
Liabilities – % share held by each region of the three categories in 2010
Direct 100% 84% 7% 1% 8% 0% 0% 0%
Portfolio 100% 47% 48% 3% 2% 0% 0% 1%
Other 100% 58% 10% 17% 6% 7% 2% 0%
2010 Total 100% 63% 27% 3% 5% 1% 0% 0%
Source: South African Reserve Bank

Foreign Direct Investment in South Africa: the BRIC perspective
tralac Working Paper | February 2013
17
The investment positions for the seven main individual countries for assets and liabilities over the
2008-2010 periods are shown in Table 15. The UK and the US are the two main destinations and
sources, while Luxemburg and China are three and four for assets. Also note that Mauritius is a
popular destination for South African funds, and more will be shown on these investments later.
Assets in the US have declined over the period (recall that currency fluctuations may play a part in
this) while those in both China and Bermuda have increased sharply. The Netherlands is the third
main caller on foreign investments (liabilities) in South Africa as these investments increased by
some 77.8% over the period. Not shown is that for liabilities China ranked at number nine in 2010.
Table 15: Investment positions for the seven main countries in both assets & liabilities
Assets Total UK US Lux China Berm IntOrg Maur
2008 17,138 6,266 3,744 996 312 426 628 468
2009 18,137 6,924 2,827 1,115 1,035 800 758 536
2010 20,358 8,213 2,995 1,513 959 866 762 586
Change 3,221 1,947 -749 517 646 440 134 117
Change % 15.8% 23.7% -25.0% 34.2% 67.4% 50.8% 17.5% 20.0%
Liabilities Total UK US Neth German Swiss Belgium Lux
2008 18,189 7,148 4,248 406 914 686 433 383
2009 20,899 8,494 5,129 966 884 701 397 446
2010 24,845 9,279 6,569 1,829 904 854 740 695
Change 10/08 6,656 2,131 2,321 1,424 -10 168 307 313
Change 10/08% 26.8% 23.0% 35.3% 77.8% -1.1% 19.7% 41.5% 45.0%
Lux is Luxemburg, Berm is Bermuda, Maur is Mauritius and Neth is Netherlands
The investment patterns for the world as shown in Table 16 are a more complex picture, although
most, but certainly not all, of the capital is associated with the private sector. Assets held abroad
with Monetary Authorities in Europe, America and International Organisations are significant, as are
the liabilities associated with South African banks.

Foreign Direct Investment in South Africa: the BRIC perspective
tralac Working Paper | February 2013
18
Table 16: Details on assets and liability investment for world, R100 million at 2010
Europe America Africa Oceania MidEast Asia IntOrg Total
2010 Assets
Direct total 2,834 431 1,218 232 245 971 1 5,932
Public corporations 0 0 35 0 0 5 0 40
Banks 0 0 0 0 0 2 0 3
Private sector 2,833 431 1,182 232 245 964 1 5,889
Portfolio total 6,737 1,768 92 15 28 45 11 8,696
Banks 159 98 37 4 0 12 0 309
Private sector 6,578 1,670 55 11 28 33 11 8,387
Other total 2,602 1,859 313 22 12 156 766 5,730
Monetary authority 793 1,554 1 0 0 0 751 3,098
Public corporations 14 16 63 0 0 0 0 93
Banks 1,589 182 153 14 7 117 14 2,076
Private sector 167 108 97 7 5 39 1 424
Liabilities 2010
Direct total 8,499 735 66 15 28 810 2 10,155
Banks 624 69 0 0 0 382 0 1,075
Private sector 7,875 666 66 15 28 428 2 9,080
Portfolio total 5,621 5,691 306 63 43 197 1 11,923
Public authorities 1,180 868 41 0 0 51 0 2,141
Public corporations 140 33 9 0 0 1 0 183
Banks 504 519 74 0 3 17 1 1,118
Private sector 3,796 4,271 183 63 40 127 0 8,480
Other total 1,598 271 468 10 45 175 199 2,767
Monetary authority 0 0 40 0 0 0 191 231
Public authorities 188 0 0 0 0 1 1 190
Public corporations 207 13 96 0 0 34 0 350
Banks 956 82 277 3 40 46 7 1,411
Private sector 246 176 56 7 5 94 1 585
Source: South African Reserve Bank
Foreign Direct Investment in South Africa: the BRIC perspective
tralac Working Paper | February 2013
19
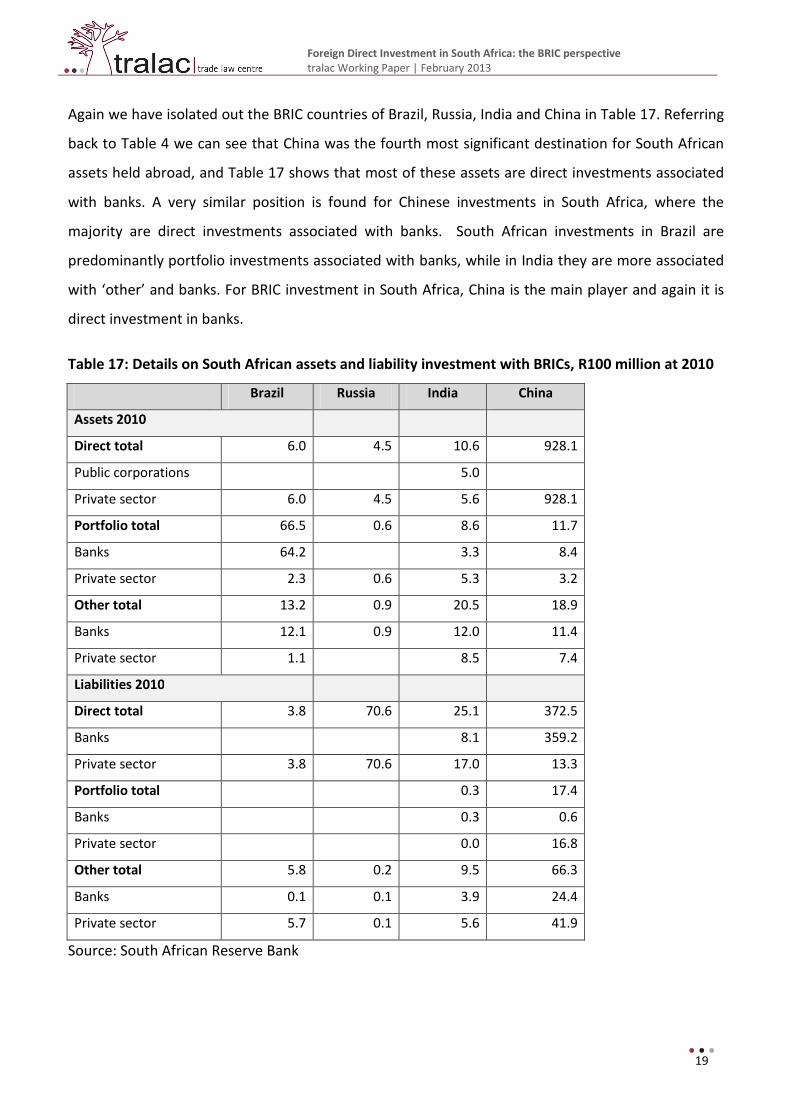
Again we have isolated out the BRIC countries of Brazil, Russia, India and China in Table 17. Referring
back to Table 4 we can see that China was the fourth most significant destination for South African
assets held abroad, and Table 17 shows that most of these assets are direct investments associated
with banks. A very similar position is found for Chinese investments in South Africa, where the
majority are direct investments associated with banks. South African investments in Brazil are
predominantly portfolio investments associated with banks, while in India they are more associated
with ‘other’ and banks. For BRIC investment in South Africa, China is the main player and again it is
direct investment in banks.
Table 17: Details on South African assets and liability investment with BRICs, R100 million at 2010
Brazil Russia India China
Assets 2010
Direct total 6.0 4.5 10.6 928.1
Public corporations
5.0
Private sector 6.0 4.5 5.6 928.1
Portfolio total 66.5 0.6 8.6 11.7
Banks 64.2
3.3 8.4
Private sector 2.3 0.6 5.3 3.2
Other total 13.2 0.9 20.5 18.9
Banks 12.1 0.9 12.0 11.4
Private sector 1.1
8.5 7.4
Liabilities 2010
Direct total 3.8 70.6 25.1 372.5
Banks
8.1 359.2
Private sector 3.8 70.6 17.0 13.3
Portfolio total
0.3 17.4
Banks
0.3 0.6
Private sector
0.0 16.8
Other total 5.8 0.2 9.5 66.3
Banks 0.1 0.1 3.9 24.4
Private sector 5.7 0.1 5.6 41.9
Source: South African Reserve Bank

Foreign Direct Investment in South Africa: the BRIC perspective
tralac Working Paper | February 2013
20
References
Gelb, S. and Black, A. 2007. Foreign Direct Investment in South Africa. [Online]. Available:
http://www.dfid.gov.uk/R4D/PDF/Outputs/CNEM/drc07_south_africa.pdf.
Gelb, S. 2010. Foreign Direct Investment Links between South Africa and China. Paper prepared for
the African Economic Research Consortium project on China-Africa Economic Relations. 2010.
[Online]. Available: www.aercafrica.org.
Creamer, T. 2011. FDI inflows to SA slumped 70% in 2010, recovery expected in 2011. Polity.org.za,
26 July. [Online]. Available: http://www.polity.org.za/article/unctad-2011-07-26.
Grimm, S. 2011. Transparency of Chinese aid: an analysis of the published information on Chinese
external financial flows. Stellenbosch: Centre for Chinese Studies.
IMF. 2011. Sub-Saharan Africa: sustaining the expansion. World Economic and Financial Surveys,
Regional Economic Outlook, 2011 Washington, D.C.: International Monetary Fund. October.
OECD. 2012. FDI in figures. Secretariat of the OECD Investment Committee, Investment Division.
South African Reserve Bank. 2011a. Annual Economic Report.
South African Reserve Bank. 2011b. Quarterly Economic Bulletin.
- - -