Non-Tariff Barriers in services trade, Foreign Direct Investment ...
231
HAL Id: tel-03675215 https://tel.archives-ouvertes.fr/tel-03675215 Submitted on 23 May 2022 HAL is a multi-disciplinary open access archive for the deposit and dissemination of sci- entific research documents, whether they are pub- lished or not. The documents may come from teaching and research institutions in France or abroad, or from public or private research centers. L’archive ouverte pluridisciplinaire HAL, est destinée au dépôt et à la diffusion de documents scientifiques de niveau recherche, publiés ou non, émanant des établissements d’enseignement et de recherche français ou étrangers, des laboratoires publics ou privés. Non-Tariff Barriers in services trade, Foreign Direct Investment and international trade Amara Zongo To cite this version: Amara Zongo. Non-Tariff Barriers in services trade, Foreign Direct Investment and international trade. Economics and Finance. Université de Bordeaux, 2022. English. NNT : 2022BORD0147. tel-03675215
-
Upload
khangminh22 -
Category
Documents
-
view
1 -
download
0
Transcript of Non-Tariff Barriers in services trade, Foreign Direct Investment ...

HAL Id: tel-03675215https://tel.archives-ouvertes.fr/tel-03675215
Submitted on 23 May 2022
HAL is a multi-disciplinary open accessarchive for the deposit and dissemination of sci-entific research documents, whether they are pub-lished or not. The documents may come fromteaching and research institutions in France orabroad, or from public or private research centers.
L’archive ouverte pluridisciplinaire HAL, estdestinée au dépôt et à la diffusion de documentsscientifiques de niveau recherche, publiés ou non,émanant des établissements d’enseignement et derecherche français ou étrangers, des laboratoirespublics ou privés.
Non-Tariff Barriers in services trade, Foreign DirectInvestment and international trade
Amara Zongo
To cite this version:Amara Zongo. Non-Tariff Barriers in services trade, Foreign Direct Investment and internationaltrade. Economics and Finance. Université de Bordeaux, 2022. English. �NNT : 2022BORD0147�.�tel-03675215�

THÈSE PRÉSENTÉE
POUR OBTENIR LE GRADE DE
DOCTEURDE L'UNIVERSITÉ DE BORDEAUX
ECOLE DOCTORALE ENTREPRISES, ÉCONOMIE ET SOCIÉTÉ (ED 42)
SPÉCIALITÉ SCIENCES ÉCONOMIQUES
Par Amara ZONGO
Non-Tari� Barriers in Services Trade, Foreign Direct
Investment and International Trade
Sous la direction de : Michel DUPUY, Professeur des Universitéset Jean-Marie CARDEBAT, Professeur des Universités
Soutenue le 12 Avril 2022
Membres du jury :
M. Michel DUPUY
Professeur des Universités, Université de Bordeaux, Directeur de thèse
M. Jean-Marie CARDEBAT
Professeur des Universités, Université de Bordeaux, Co-DirecteurM. Fabien CANDAU
Professeur des Universités, Université de Pau et des Pays de l'AdourCenter for the Analysis of Trade and Economic Transition, Président et RapporteurMme. Charlotte EMLINGER
Assistant Professor, Virginia Tech, Department of Agricultural and Applied Economics, RapporteureM. José-Antonio MONTEIRO
Economist, World Trade Organization, Examinateur
M. Jaroslaw MROWIEC
Policy Analyst, Organization for Economic Cooperation and Development, Examinateur

Dedication
"To my dad and my brother, in loving memory."

Remerciements
Au terme de cette thèse, je tiens à formuler mes sincères remerciements à mes deux directeurs
de thèse, Michel DUPUY et Jean-Marie CARDEBAT pour leur incroyable soutien durant ces
cinq dernières années. Leurs conseils, suggestions et les différentes discussions m’ont stimulé
et poussé á me passionner pour la recherche. Je les remercie également pour la confiance
qu’ils m’ont accordée en acceptant de superviser ce sujet très novateur. Ils m’ont appris à
toujours travailler dur et à me dépasser. Cette thèse n’aurait pu aboutir à des publications
scientifiques sans leur aide et leurs commentaires.
Je suis très reconnaissant à Charlotte EMLINGER et Fabien CANDAU pour l’honneur qu’ils
m’ont fait en rapportant cette thèse, ainsi qu’à José-AntonioMONTEIRO et JaroslawMROWIEC
pour avoir accepté de faire partie du jury. Je tiens également à remercier les économistes du
Département de la Recherche Economique et des Statistiques, ainsi que du Département du
Commerce des Services et de l’Investissement de l’OMC. En particulier, mes remerciements
vont à José-Antonio MONTEIRO, mon superviseur qui m’a permis de mieux appréhender les
principes régissant le commerce international, Eddy BEKKERS qui m’a aidé à mieux com-
prendre le modèle GTAP pendant mes 6 mois de stage à l’OMC. Mes échanges avec Joscelyn
MAGDELEINE ont accru mes connaissances sur le commerce des services.
Mes remerciements vont également à l’équipe de Bordeaux School of Economic (Ex LAREFI),
le centre de recherche où j’ai réalisé cette thèse. Je tiens à remercier tout particulièrement
Jean-Marie CARDEBAT (Directeur), les enseignants-chercheurs et le personnel administratif
(Christel CHAINEAUD et Cyril MESMER), pour leur attention et leur disponibilité, qui ont
offert un cadre convivial pour mener à bien cette thèse. Je tiens à remercier Raphaël CHIAP-
PINI qui, à travers les nombreuses discussions, m’a permis d’améliorer cette thèse.
Je tiens à remercier également mes collègues de Bordeaux School of Economic avec lesquels
j’ai bien progressé. Je pense en particulier à Whelsy, Myriam, Mehdi et Olie, mes collègues
depuis la première année de thèse, je les remercie pour les longs discours sur la thèse, pour
les moments agréables hors cadre universitaire et pour leurs différents soutiens. Je tiens à
remercier Safilidin, Doriane et Younes pour leur soutien.
En dehors du cadre universitaire, j’ai eu la chance extraordinaire de pouvoir compter sur le
soutien continu demes parents, demes frères et sœurs sans qui cette thèse n’aurait pas été pos-
sible. J’ai eu le soutien de mes amis de longue date, en particulier Frédéric, Dénis, Ozias, Alain,
Samuel, Luc. Un grand merci à mon pays le Burkina Faso (au Ministère de l’Enseignement
Supérieur) pour m’avoir accordé une bourse doctorale pour mener à bien ce projet de thèse.

Acknowledgments
At the end of this thesis, I would like to formulate my sincere thanks to my two supervisors,
Michel DUPUY and Jean-Marie CARDEBAT for their incredible support during these last five
years. Their advice, suggestions and the different discussions have stimulated and pushed me
to be passionate about research. I also thank them for the trust they have placed in me by
accepting to supervise this very innovative topic. They taught me to always work hard and
to excel. This thesis could not have been successful with the scientific publications without
their help and comments.
I am very grateful to Charlotte EMLINGER and Fabien CANDAU for the honor of reviewing
this thesis, as well as to José-Antonio MONTEIRO and Jaroslaw MROWIEC for agreeing to
serve on the jury. I would also like to thank the economists of the Economic Research and
Statistics Department, as well as the Trade in Services and Investment Department at the
WTO. In particular, my thanks go to José-Antonio MONTEIRO, my supervisor who helped
me to better understand the principles governing international trade, Eddy BEKKERS who as-
sisted me to better understand the GTAP model during my 6 months internship at the WTO.
My exchanges with Joscelyn MAGDELEINE have increased my knowledge on trade in ser-
vices.
My thanks also go to Bordeaux School of Economic team (Ex LAREFI), the research center
where I conducted this thesis. I would like to thank in particular Jean-Marie CARDEBAT
(Director), researchers and administrative staff (Christel CHAINEAUD and Cyril MESMER),
for their attention and availability, which provided a convivial framework for the successful
completion of this thesis. I wish to thank Raphaël CHIAPPINI who, through the numerous
discussions, helped me to improve this thesis.
I would like to thank my colleagues of Bordeaux School of Economic with who I have made
good progress. I think in particular to Whelsy, Myriam, Mehdi and Olie, my colleagues since
the first year of my thesis, I thank them for their long speeches on the thesis, for the nice
moments in a non-academic setting and for their different supports. I would like to thank
Safilidin, Doriane and Younes for their support.
Outside the university framework, I was extraordinarily lucky to be able to count on the con-
tinuous support of my parents, my brothers and sisters without whom this thesis would not
have been possible. I had the support of my long-time friends, especially Frédéric, Dénis,
Ozias, Alain, Samuel. Many thanks to my country Burkina Faso (Ministry of High Education)
for granting me a doctoral fellowship to carry out this thesis project.

Résumé
Cette thèse de doctorat étudie les effets des Barrières Non Tarifaires (BNT) au commerce des
services sur les échanges commerciaux mondiaux. Elle contribue à l’analyse empirique des ef-
fets des restrictions sectorielles au commerce des services sur les échanges commerciauxmon-
diaux. Dans le premier chapitre, nous examinons empiriquement les impacts des BNT dans les
services et la disparité règlementaire (transports, logistiques, distribution, financiers et secteur
du business) sur les échanges commerciaux de biens alimentaires entre les pays membres de
l’OCDE. Les résultats suggèrent des effets négatifs des restrictions sectorielles sauf dans le
secteur de la distribution sur le commerce des biens alimentaires. Cependant, la disparité rè-
glementaire entre les pays a un impact négatif et significatif sur le commerce des produits
alimentaires. Cet impact diminue lorsque le pays exportateur est fermé aux prestataires de
services. Dans le deuxième chapitre, nous analysons empiriquement les impacts des restric-
tions dans le secteur des IDE (Investissements Direct à l’Etranger) sur les investissements
transfrontaliers entre les pays développés (OCDE) et les pays émergents. Nous concluons que
les restrictions dans le secteur des services des IDE sont des obstacles aux investissements
transfrontaliers entre pays avancés et émergents. Plus loin, les restrictions dans les services
entravent les investissements transfrontaliers entre pays développés et celles dans le secteur
primaire, manufacturier et ressources naturelles constituent un frein aux IDE entrants dans
les pays émergents. Dans le dernier chapitre, nous étudions à travers un modèle théorique les
gains de la libéralisation des services sur le commerce intra-Africain dans le cadre de la Zone
de Libre-Echange Continentale Africaine (ZLECA). Les résultats montrent des effets positifs
de la libéralisation des services sur la croissance du PIB, du revenu, sur le bien-être et sur le
commerce intra-africain plus précisément le commerce de biens manufacturiers et ressources
naturelles. L’accord ZLECA crée à la fois des créations et des détournements de commerce,
mais le gain en bien-être reste positif et significatif à long terme en Afrique.
Mots clés: Barrières Non Tarifaires (BNT); Commerce des services; Commerce des biens
alimentaires; Investissements Directs à l’Etranger (IDE); Zone de Libre-Echange Continentale
Africaine (ZLECA).

Abstract
This thesis studies the effects of Non-Tariff Barriers (NTBs) to trade in services on interna-
tional trade. It contributes to the empirical analysis of the effects of sectoral restrictions in
services trade onworld trade. In the first chapter, we empirically examine the impacts of NTBs
in services and regulatory disparity (transport, logistics, distribution, financial and business)
on food trade among OECD countries. The results suggest negative effects of sectoral restric-
tions except in the distribution sector on trade in food products. However, the regulatory
disparity between countries has a significant negative impact on food trade. This impact de-
creases when the exporter country is closed to service providers. In the second chapter, we
empirically analyze the impacts of FDI restrictions on cross-border investment between ad-
vanced (OECD) and emerging countries. We conclude that restrictions in the services sector
of FDI impede cross-border investment across advanced and emerging countries. Further-
more, restrictions in the services sector hinder cross border investment between advanced
countries and restrictions in the primary, manufacturing and natural resources sector ham-
per inward FDI in emerging countries. In the last chapter, we use a theoretical model to study
the gains of services liberalization on intra-African trade in the context of the African Conti-
nental Free Trade Area (AfCFTA). The results show positive effects of services liberalization
on GDP growth, income, welfare and intra-African trade, particularly trade in manufacturing
goods and natural resources. The AfCFTA agreement creates both long-term trade creation
and diversion, but the welfare gain is still positive and significant over the long term in Africa.
Keywords: Non-Tariff Barriers (NTMs); Services trade; Food trade; Foreign Direct Invest-
ment (FDI); African Continental Free Trade Area (AfCFTA)
List of Figures
1 Evolution of employment by sectors (% of total employment) . . . . . . . . . . 2
2 Share of exports of goods and services of total world exports, 2010-2020 . . . . 3
3 FDI inflows, global and by economic group, 2007-2018 (Billions of US$) . . . . 9
4 FDI inflows, global and by economic group, 2017-2018 (Billions of US$) . . . . 10
5 Correlation between service imports and STRI, 2019 . . . . . . . . . . . . . . . 14
1.1 Tariff rate, applied, simple mean, all products (%) . . . . . . . . . . . . . . . . . 24
1.2 OECD countries’ annual export growth from 2005 to 2017 . . . . . . . . . . . . 26
1.3 US import, export and volume of credit from 2005 to 2017 . . . . . . . . . . . . 28
1.4 OECD countries’ sectoral STRIs in 2017 . . . . . . . . . . . . . . . . . . . . . . 38
2.1 Inward FDI flows, % of GDP, 2010-2018 . . . . . . . . . . . . . . . . . . . . . . 63
2.2 Inward FDI in advanced countries as % of GDP, 2010-2018 . . . . . . . . . . . . 64
2.3 Inward FDI in emerging countries as % of GDP, 2010-2018 . . . . . . . . . . . . 64
2.4 Correlation between FDI and restrictive meausres, 2019 . . . . . . . . . . . . . 73
2.5 OECD and Emerging countries FDI Regulatory Restrictiveness Index in 2019 . 77
3.1 African goods exports by trading partners (% of total African exports), 2016-2020 94
3.2 Cost to import and export in US$ (border compliance and documentary com-
pliance) by region, 2019 . . . . . . . . . . . . . . . . . . . . . . . . . . . . . . . 102
3.3 NTM frequency and coverage ratio . . . . . . . . . . . . . . . . . . . . . . . . 103
3.4 Non-tariff measures by region: number of notification . . . . . . . . . . . . . . 104
3.5 Goods and services sector value added (% of GDP), 2015-2019 . . . . . . . . . . 105
3.6 ECOWAS and SADC services exports in % of total services . . . . . . . . . . . 106
3.7 Share of services in total SADC services exports, 2005-2017 . . . . . . . . . . . 106
3.8 Share of services in total ECOWAS services exports, 2005-2017 . . . . . . . . . 106
3.9 Share of services value-added in African goods and services exports, 2015 . . . 107
3.10 Share of services value-added in goods and services exports by region, 2015 . . 109
3.11 Intra-African exports of goods (% of total trade), 2016-2020 . . . . . . . . . . . 118
3.12 The effects of NTB reductions in services on Africa’s exports (US$ millions) . 136
3.13 The Effects of services liberalization on intra-African exports by country (in
millions of US dollars) . . . . . . . . . . . . . . . . . . . . . . . . . . . . . . . . 137
3.14 The Effects of services liberalization on intra-African exports by country (in
millions of US dollars) . . . . . . . . . . . . . . . . . . . . . . . . . . . . . . . . 138

viii List of Figures
C.1 Circular flows in a regional economy . . . . . . . . . . . . . . . . . . . . . . . 192
C.2 Production structure . . . . . . . . . . . . . . . . . . . . . . . . . . . . . . . . . 192
C.3 Marketing margins for imported commodities . . . . . . . . . . . . . . . . . . 197
C.4 Structure of Domestic Margins on Exported Commodities . . . . . . . . . . . . 198
C.5 Status of AfCFTA Ratification in 2021 . . . . . . . . . . . . . . . . . . . . . . . 200

List of Tables
1 Value added by activity in 2019 (% of GDP) . . . . . . . . . . . . . . . . . . . . 2
2 Services exports by sector (% of Total), 2015-2020 . . . . . . . . . . . . . . . . . 4
3 Inward FDI stocks (% of GDP), 2017-2020 . . . . . . . . . . . . . . . . . . . . . 6
4 Value and number of net cross-borderM&As, by sector and selected industries,
2017-2018 . . . . . . . . . . . . . . . . . . . . . . . . . . . . . . . . . . . . . . . 6
5 Announced greenfield projects, cross-border M&As and international project
finance deals, by group of economies, 2019-2020 . . . . . . . . . . . . . . . . . 8
6 Commercial services exports and imports by economies and partners (Millions
of US$), 2019 . . . . . . . . . . . . . . . . . . . . . . . . . . . . . . . . . . . . . 9
7 Trade Cost Index, 2010-2018 . . . . . . . . . . . . . . . . . . . . . . . . . . . . 11
8 Evolution of Services Trade Restrictiveness Index (STRI), 2014-2020 . . . . . . 13
9 The 5 least and most restrictive service sectors by region . . . . . . . . . . . . 14
10 Bilateral service exports (US Dollar, Millions), 2018-2019 . . . . . . . . . . . . 17
1.1 Food miles by transport method in 2010 . . . . . . . . . . . . . . . . . . . . . . 27
1.2 OECD average intermediate consumption in agriculture, industry and services
in 2015 : Input-Output Table . . . . . . . . . . . . . . . . . . . . . . . . . . . . 31
1.3 Average intermediate consumption of food, beverages and tobacco in service
in 2015: Input-Output Table . . . . . . . . . . . . . . . . . . . . . . . . . . . . . 32
1.4 The impacts of bilateral STRIs on cross-border exports of food commodities . . 47
1.5 The impacts of bilateral STRIs on cross-border exports of food commodities:
Continued . . . . . . . . . . . . . . . . . . . . . . . . . . . . . . . . . . . . . . 48
1.6 The effects of country specific STRIs on export values . . . . . . . . . . . . . . 51
1.7 OECD bilateral food trade in thousands of US dollars . . . . . . . . . . . . . . 52
1.8 The effects of heterogeneity regulatory on cross-border exports of food com-
modities (all food products): PPML . . . . . . . . . . . . . . . . . . . . . . . . . 56
1.9 Change in bilateral trade from a 0.05 point change in STRI heterogeneity (%) . 57
1.10 Annual average change in STRIs from 2014 to 2018 . . . . . . . . . . . . . . . 58
2.1 OECD outward and inward FDI stocks by sector (% of total FDI) . . . . . . . . 77
2.2 OECD outward and inward FDI by service sector (% of service FDI) . . . . . . 82
2.3 Exports of primary and manufacturing goods (millions of US dollars) from
2015-2019 . . . . . . . . . . . . . . . . . . . . . . . . . . . . . . . . . . . . . . . 83
2.4 The impacts of restrictive measures on FDI stocks: Intra-OECD countries . . . 87

x List of Tables
2.5 The impacts of restrictive measures on FDI stocks: OECD vs. Emerging countries 88
2.6 The Impacts of Restrictive Measures on FDI Stocks: OECD vs. African countries 89
3.1 Africa regional integration: average scores in the five dimensions . . . . . . . 92
3.2 Intra and inter-regional trade in percent of total African trade (all products) . . 93
3.3 Growth rate of commercial services exports by economic integration area . . . 105
3.4 Changes in Real GDP (in percent) . . . . . . . . . . . . . . . . . . . . . . . . . 113
3.5 Changes in Real GDP (in USD millions): The impact of services liberalization . 115
3.6 Regional household income (changes in percent) . . . . . . . . . . . . . . . . . 117
3.7 Agricultural exports (changes in percent): Long run impact . . . . . . . . . . . 120
3.8 Manufactured exports (changes in percent): Long run impact . . . . . . . . . . 122
3.9 Processed foods exports (changes in percent): Long run impact . . . . . . . . . 124
3.10 Fossil fuels exports (changes in percent): Long run impact . . . . . . . . . . . . 126
3.11 Energy-intensive manufacturing exports (changes in percent): Long run impact 128
3.12 Wood and paper exports(changes in percent): Long run impact . . . . . . . . . 130
3.13 Textiles and wearing apparel exports (changes in percent): Lon run impact . . 132
3.14 The impact of intra-African free trade agreement (AfCFTA) on intra-African
exports (changes in USD millions) . . . . . . . . . . . . . . . . . . . . . . . . . 133
3.15 The impact of services liberalisation on exports (changes in USD millions) . . 134
3.16 Continued . . . . . . . . . . . . . . . . . . . . . . . . . . . . . . . . . . . . . . 135
3.17 Welfare decomposition ($U.S. millions) . . . . . . . . . . . . . . . . . . . . . . 140
A.1 List of countries: OECD, non OECD, EEA, major net food exporting-importing
and high-low value-added service countries . . . . . . . . . . . . . . . . . . . . 173
A.2 Cross-correlation table of STRI . . . . . . . . . . . . . . . . . . . . . . . . . . . 174
A.3 Descriptive statistics: Country STRI and regulatory heterogeneity score . . . . 175
A.4 Country-STRI and other control variables . . . . . . . . . . . . . . . . . . . . . 176
A.5 Impact of disaggregated sectoral STRIs on cross-border exports of food Com-
modities . . . . . . . . . . . . . . . . . . . . . . . . . . . . . . . . . . . . . . . 177
A.6 Major exporter-importers countries, OECD-emerging countries, high-low ser-
vices value added countries, economic integretation and heterogeneity regu-
latory . . . . . . . . . . . . . . . . . . . . . . . . . . . . . . . . . . . . . . . . . 178
B.1 List of countries: OECD, emerging and Africa countries . . . . . . . . . . . . . 179
B.2 Variable description and sources . . . . . . . . . . . . . . . . . . . . . . . . . . 180
B.3 Descriptive statistics . . . . . . . . . . . . . . . . . . . . . . . . . . . . . . . . . 181
B.4 Cross-correlation table . . . . . . . . . . . . . . . . . . . . . . . . . . . . . . . 182
B.5 Splitting the time into two sub-periods (continued): 2010-2014 . . . . . . . . . 183

List of Tables xi
B.6 Splitting the time into two sub-periods (continued): 2015-2019 . . . . . . . . . 184
B.7 The Impacts of restrictivemeasures on FDI stocks: OECD vs. BRICS and others
emerging countries . . . . . . . . . . . . . . . . . . . . . . . . . . . . . . . . . 185
B.8 The impact of FDI restrictions in the services sector on FDI stocks: Intra-OECD 186
B.9 The Impact of FDI restrictive measures in the agricultural and manufacturing
sectors on FDI stocks: OECD vs. emerging countries . . . . . . . . . . . . . . . 187
B.10 The Impact of FDI restrictive measures in the agriculuture and mining sectors
on FDI stocks: OECD vs. African countries . . . . . . . . . . . . . . . . . . . . 188
C.1 Sets escription . . . . . . . . . . . . . . . . . . . . . . . . . . . . . . . . . . . . 194
C.2 Trade policy variables in GTAP: Tax rates description . . . . . . . . . . . . . . 195
C.3 International trade and transport variables . . . . . . . . . . . . . . . . . . . . 195
C.4 Regional aggregation: GTAP concordance . . . . . . . . . . . . . . . . . . . . . 203
C.5 Continued . . . . . . . . . . . . . . . . . . . . . . . . . . . . . . . . . . . . . . 204
C.6 GTAP sector concordance . . . . . . . . . . . . . . . . . . . . . . . . . . . . . . 204
C.7 Intra-African agricultural and industrial tariffs . . . . . . . . . . . . . . . . . . 205
C.8 Non-tariff measures in Africa: number of notification . . . . . . . . . . . . . . 206
C.9 Ad valorem equivalents of non-tariffs measures in Africa: agricultural and
manufacturing products . . . . . . . . . . . . . . . . . . . . . . . . . . . . . . . 207
C.10 Ad Valorem Equivalents (AVEs) by services sector and geographical region . . 207
C.11 Estimated ad valorem equivalents of services restrictions: Individual countries 208
C.12 Estimated ad valorem equivalents of services restrictions: Regional area . . . . 209
C.13 GTAP closures . . . . . . . . . . . . . . . . . . . . . . . . . . . . . . . . . . . . 209

Contents
Dedication ii
Remerciements iii
Acknowledgments iv
Résumé v
Summary vi
List of Figures vii
List of Tables ix
General Introduction 1
1 The impact of services trade restrictiveness on food trade 241.1 Introduction . . . . . . . . . . . . . . . . . . . . . . . . . . . . . . . . . . . . . 24
1.2 Literature review . . . . . . . . . . . . . . . . . . . . . . . . . . . . . . . . . . . 32
1.2.1 Service trade restrictiveness index (STRI) and service trade: Gravity
analysis . . . . . . . . . . . . . . . . . . . . . . . . . . . . . . . . . . . 33
1.2.2 Service regulation, manufacturing firm performance and service ex-
ports: Firm-level data . . . . . . . . . . . . . . . . . . . . . . . . . . . . 34
1.3 STRIs and food exports : Augmented gravity models . . . . . . . . . . . . . . . 36
1.4 Data sources . . . . . . . . . . . . . . . . . . . . . . . . . . . . . . . . . . . . . 39
1.5 Econometric issues . . . . . . . . . . . . . . . . . . . . . . . . . . . . . . . . . 41
1.5.1 Multilateral resistances and disaggregated trade data . . . . . . . . . . 41
1.5.2 Zero trade flows and heteroskedasticity of trade data . . . . . . . . . . 42
1.5.3 Bilateral trade costs and adjustment to trade policy changes . . . . . . 43
1.5.4 Endogeneity of trade policy . . . . . . . . . . . . . . . . . . . . . . . . 44
1.5.5 Unilateral and non-discriminatory trade policy . . . . . . . . . . . . . 44
1.6 Empirical results and discussion . . . . . . . . . . . . . . . . . . . . . . . . . . 45
1.7 Regulatory differences in services and food trade . . . . . . . . . . . . . . . . . 53
1.8 Robustness check . . . . . . . . . . . . . . . . . . . . . . . . . . . . . . . . . . 58
1.9 Conclusion . . . . . . . . . . . . . . . . . . . . . . . . . . . . . . . . . . . . . . 59

Contents xiii
2 The effects of restrictive measures on cross-border investment: Evidencefrom OECD and emerging countries 622.1 Introduction . . . . . . . . . . . . . . . . . . . . . . . . . . . . . . . . . . . . . 62
2.2 Literature review . . . . . . . . . . . . . . . . . . . . . . . . . . . . . . . . . . . 66
2.3 Theoretical gravity model for FDI . . . . . . . . . . . . . . . . . . . . . . . . . 68
2.4 Model and estimation issues . . . . . . . . . . . . . . . . . . . . . . . . . . . . 71
2.5 Data description . . . . . . . . . . . . . . . . . . . . . . . . . . . . . . . . . . . 72
2.6 FDI gravity results and discussion . . . . . . . . . . . . . . . . . . . . . . . . . 75
2.6.1 Baseline results . . . . . . . . . . . . . . . . . . . . . . . . . . . . . . . 76
2.6.2 Robustness check . . . . . . . . . . . . . . . . . . . . . . . . . . . . . . 80
2.7 Conclusion . . . . . . . . . . . . . . . . . . . . . . . . . . . . . . . . . . . . . . 84
2.8 Appendix: Baseline results . . . . . . . . . . . . . . . . . . . . . . . . . . . . . 86
3 Modeling the impact of non-tariff barriers in services on intra-African trade:Global Trade Analysis Project model 903.1 Introduction . . . . . . . . . . . . . . . . . . . . . . . . . . . . . . . . . . . . . 90
3.2 Literature review . . . . . . . . . . . . . . . . . . . . . . . . . . . . . . . . . . . 96
3.2.1 Removal of tariffs on intra-AfCFTA trade . . . . . . . . . . . . . . . . . 96
3.2.2 Removal of tariffs and NTBs on intra-AfCFTA trade . . . . . . . . . . . 98
3.2.3 Removal of tariffs and NTBs on intra-AfCFTA trade and implementa-
tion of TFA . . . . . . . . . . . . . . . . . . . . . . . . . . . . . . . . . . 99
3.3 Non-tariff barriers, service sector and Africa trade . . . . . . . . . . . . . . . . 101
3.4 Data . . . . . . . . . . . . . . . . . . . . . . . . . . . . . . . . . . . . . . . . . . 109
3.4.1 Different shocks and scenarios . . . . . . . . . . . . . . . . . . . . . . . 110
3.5 Simulation results and discussion . . . . . . . . . . . . . . . . . . . . . . . . . 111
3.5.1 Macroeconomic impacts of AfCFTA . . . . . . . . . . . . . . . . . . . . 111
3.5.2 Change in percentage GDP and regional income . . . . . . . . . . . . . 111
3.5.3 Results on bilateral trade . . . . . . . . . . . . . . . . . . . . . . . . . . 117
3.5.4 Welfare decomposition . . . . . . . . . . . . . . . . . . . . . . . . . . . 139
3.6 Conclusion and policy recommendations . . . . . . . . . . . . . . . . . . . . . 140
General Conclusion 146
Bibliography 149
Appendices 171
A Appendix of Chapter 1 172

xiv Contents
Appendix of Chapter 1 172
B Appendix of Chapter 2 179
C Appendix of Chapter 3 189C.1 GTAP model: desciption . . . . . . . . . . . . . . . . . . . . . . . . . . . . . . . 189
C.1.1 Sets and trade variables in GTAP . . . . . . . . . . . . . . . . . . . . . 192
C.1.2 Technical details code: International trade and transport variables in
GTAP . . . . . . . . . . . . . . . . . . . . . . . . . . . . . . . . . . . . . 195
C.1.3 Introduction of margin activities: domestic trade and transport margins 196
C.2 Data sources . . . . . . . . . . . . . . . . . . . . . . . . . . . . . . . . . . . . . 201
C.3 Tables . . . . . . . . . . . . . . . . . . . . . . . . . . . . . . . . . . . . . . . . . 203


General Introduction
In recent decades, there has been an increase in the use of Non-Tariff Measures (NTMs) while
tariff barriers have significantly decreased due to the implementation of many trade agree-
ments (Melo and Nicita, 2018). As a result, NTMs are center stage in trade policy debates. The
existing literature on the impacts of NTMs has mainly focused on agricultural and manufac-
turing goods, excluding the services sector. Several studies have found negative and positive
effects of NTMs in the goods sector on trade. For example, Disdier et al. (2008) find a negative
impact of sanitary and phytosanitary measures (SPS) and technical barriers to trade (TBT)
on agricultural trade. Bao and Qiu (2010) analyze the influence of China’s technical barriers
on imports. By using the frequency index and coverage ratio to quantify technical barriers
to trade, they find that technical barriers reduce trade in agricultural products but increase
trade in manufactured goods. Crivelli and Gröschl (2016) find a negative impact of SPS mea-
sures on the probability of trade (extensive margin) and a positive impact on the volume of
trade in agricultural and food products (intensive margin). The effects of these trade barriers
are heterogeneous depending on the sector and the level of development of countries. For
example, Fontagné et al. (2005) find that SPS and TBT measures have a positive impact on
industrial goods and a negative impact on manufactured goods. Developing countries are the
most affected by these measures imposed by importers. Disdier et al. (2008) highlight that
exports from developing countries are significantly more affected than those from developed
countries. Yet, services are becoming a key determinant of economic growth in both advanced
and emerging countries, however, the study of NTMs in services and its effects on economic
and social aspects is still in its infancy.
So, what characterizes trade in services and what distinguishes it from goods andcommodities trade?
The main characteristic of trade in services is the intangible nature of many transactions.
Unlike physical goods, which must cross borders and thus are subject to customs procedures
and tariffs, services often involve direct transactions between the consumer and the producer
(Konan and Maskus, 2006). Trade in services requires the interaction between the producer
and the consumer, unlike goods, where cross-border trade is possible without the consent
of the consumer. A key characteristic of most services is the joint production requirement
that consumption and production must be simultaneous (Hill, 1997). Services are a key de-
terminant of countries’ participation in the global economy, including in global value chains.
Indeed, services include a wide range of sectors from communication, distribution, finance,

2 General Introduction
transport, ICT, tourism and environmental services. It contributes to nearly 65% of global
GDP in 2019, 50% of GDP in China , 64.17% in Colombia, 72% in the European Union, nearly
70% of GDP in South Africa and 80% in the USA (see Table 1). The employment in the services
sector is significant compared to the other activity sector (nearly 50% of total employment in
China, 70% in the European Union and nearly 80% in the USA, World Development Indica-
tors data). Employment in services has increased over the past decade, especially in low- and
middle-income countries (see Figure 1 and WTO, 2017).
Table 1: Value added by activity in 2019 (% of GDP)
Countries Agriculture, forestry Manufacturing Servicesand fishing
China 7.42 N/A 53.42
Colombia 7.06 12.06 64.17
European Union 1.77 16.61 72.98
South Africa 2.12 13.22 68.7
USA 0.95 11.34 80.21
World 3.5 14 65
Source: OECD and World Development Indicators databases
Figure 1: Evolution of employment by sectors (% of total employment)
3.4
23.5
73.2
3.1
23.0
73.9
2.8
22.8
74.5
64.1
10.1
25.8
61.7
10.3
28.0
59.8
10.3
29.9
36.2
23.8
40.0
32.1
24.3
43.6
29.4
23.9
46.8
020
40
60
80
100
perc
ent
High income Low income Middle income
2011 2015 2019 2011 2015 2019 2011 2015 2019
Agriculture forestry and fishing Manufacturing
Services
Source: World Development Indicators, World Bank
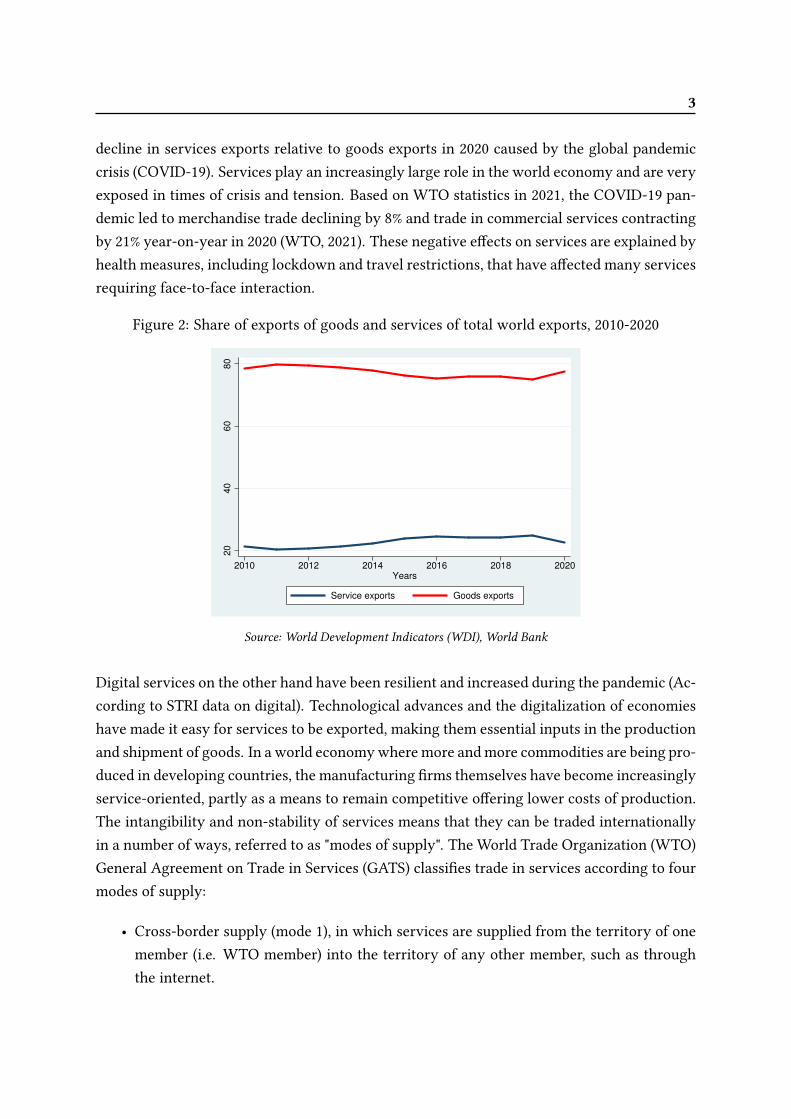
In terms of trade, services are the most dynamic component of world trade. Figure 2 high-
lights the evolution of goods and services exports and shows two trends: a growth in services
exports relative to goods exports between 2013 and 2019 due to the internet boom and a
3
decline in services exports relative to goods exports in 2020 caused by the global pandemic
crisis (COVID-19). Services play an increasingly large role in the world economy and are very
exposed in times of crisis and tension. Based on WTO statistics in 2021, the COVID-19 pan-
demic led to merchandise trade declining by 8% and trade in commercial services contracting
by 21% year-on-year in 2020 (WTO, 2021). These negative effects on services are explained by
health measures, including lockdown and travel restrictions, that have affected many services
requiring face-to-face interaction.
Figure 2: Share of exports of goods and services of total world exports, 2010-2020
20
40
60
80
2010 2012 2014 2016 2018 2020Years
Service exports Goods exports
Source: World Development Indicators (WDI), World Bank
Digital services on the other hand have been resilient and increased during the pandemic (Ac-
cording to STRI data on digital). Technological advances and the digitalization of economies
have made it easy for services to be exported, making them essential inputs in the production
and shipment of goods. In a world economywheremore andmore commodities are being pro-
duced in developing countries, the manufacturing firms themselves have become increasingly
service-oriented, partly as a means to remain competitive offering lower costs of production.
The intangibility and non-stability of services means that they can be traded internationally
in a number of ways, referred to as "modes of supply". The World Trade Organization (WTO)
General Agreement on Trade in Services (GATS) classifies trade in services according to four
modes of supply:
• Cross-border supply (mode 1), in which services are supplied from the territory of one
member (i.e. WTO member) into the territory of any other member, such as through
the internet.

4 General Introduction
• Consumption abroad (mode 2), in which services are provided in the territory of one
member to a consumer of any other member, such as tourism.
• Commercial presence (mode 3), in which services are delivered by a supplier of one
member through commercial presence in the territory of any other member, such as
establishing a controlled affiliate in a foreign country to serve the local market.
• Presence of natural persons (mode 4), in which a supplier of one member provides ser-
vices through the presence of natural persons in the territory of another member, such
as consultants.
Commercial presence in another country (mode 3) is the dominant mode of supply for trad-
ing services globally, representing almost 60% of trade in services in 2017 (WTO, 2019). For
example, a foreign owned retailer or bank supplies services to local consumers. In 2017 sales
through the establishment of foreign-controlled affiliates worldwide were $7.8 trillion and
financial and distribution services together account for around half of this value. It was
followed by cross-border supply (mode 1), consumption abroad (mode 2) and presence of
individuals in another country (mode 4), which accounted for about 30%, 10% and 3% of
total services exports, respectively (WTO, 2019). Cross-border services transactions (mode
1), including through electronic means, totalled $3.7 trillion in 2017. Cross-border trade is
widespread across different services sectors, including transport, professional and business
services, distribution services and communications services, as well as computer services and
related activities. Table 2 presents the cross-border export of services by category (mode 1).
It shows that the transportation sector (land, air, sea, rail) and other business sectors (R&D,
legal services, accounting, management consulting, architectural services, etc.) are the most
important, accounting for almost 40% of total cross-border services exports worldwide. Ex-
ports of financial services represent 10% and telecommunications, computer and information
services nearly 10%.
Table 2: Services exports by sector (% of Total), 2015-2020
Sectors 2015 2016 2017 2018 2019 2020
Transport 17.92 16.94 17.08 17.01 16.72 16.65
Other business services 21.75 22.41 22.24 22.21 22.61 26.85
Financial services 9.11 8.9 8.79 8.55 8.32 10.83
Telecommunications, computerand information services 9.57 9.58 9.67 10.41 10.96 14.25
Source: UNCTAD

5
Services consumed in other countries (mode 2) accounted for $1.4 trillion, with tourism ac-
counting for more than 60% of the value in 2017 (WTO estimates, 2019). Only $0.4 trillion
are traded worldwide through the temporary movement of workers (mode 4), but this share
may vary for individual economies or sectors (WTO, 2019). The financial and distribution
sectors are the largest traded services globally due to their importance in world trade. Indeed,
wholesalers and retailers have a crucial role in international trade, connecting producers and
consumers worldwide, thus ensuring consumer’ access to a variety of goods at competitive
prices. The financial sector is the backbone of the economy, and one of its key functions is
to enable international transactions, facilitating the smooth exchange of goods and services
between countries, while managing the risks associated with these flows. The transport ser-
vices play also a significant role in both world trade in goods and services. They facilitate the
delivery of products from production to distribution points, the trade of global value chains,
and the movement of people (with a greater impact on the tourism sector). Trade in transport
services has grown in recent years due to the rise of low-cost airlines (low barriers to entry
into the sector), coupled with the multiplication of direct routes, especially at the regional
level. However, transportation service is still a vulnerable sector to macroeconomic shocks.
Indeed, "about half of world trade in transport services is driven by trade in goods, including
both goods that directly reach consumers and those that are used as inputs in production pro-
cesses (WTO, 2019). This makes the transport sector vulnerable, as freight shipping rates are
volatile and fluctuate with global demand."
Mode 3 of trade in services is made possible by foreign direct investment (FDI). Indeed, FDI de-
termines the mode 3 of services trade. According to the WTO definition of mode 3 of trade in
services, the service is provided within a country by a locally-established affiliate, subsidiary
or representative office of a foreign-owned and -controlled company (bank, hotel group, con-
struction company, etc.). FDI has significantly increased in recent years which has increased
the mode 3 of trade in services. In 2018, inward FDI positions in the EU(27) accounted for
nearly 53% of European GDP, almost 15 percentage points higher than before the financial
crisis. In the United Kingdom, they accounted for almost 68% in 2018, lower than in 2017 due
to the effects of the Brexit (see Table 3). About 40% of total inward FDI in Europe came from
United States, the largest investor in Europe before Switzerland, Canada and Japan (WTO,
2019). China (including Hong Kong) is the fifth investor in Europe, with 3.5% all of FDI posi-
tions. Focusing onMerger and Acquisition (M&A) flows, which represent the majority of FDI,
the amount of cross-border foreign investment has increased in the last years. The value of
net cross-border M&As rose 18% to $816 billion, recovering ground after the 22% fall in 2017
(see Table 4).1The increase was driven by large deal sizes, especially in the chemicals industry
1The value and number of net cross-border M&A activity worldwide is highest in the manufacturing and

6 General Introduction
and the services sector, while the number of deals actually declined (UNCTAD, 2019).
Table 3: Inward FDI stocks (% of GDP), 2017-2020
Region 2017 2018 2019 2020
United Kingdom 70.66 67.56 72.24 81.43
USA 39.94 35.64 43.68 51.97
OECD 44.13 41 46.41 56.48
EU (27) 59.17 52.87 57.4 75.48
Source: OECD and WDI databases
Table 4: Value and number of net cross-border M&As, by sector and selected industries, 2017-
2018
Value Growth Number Growth
(Billions of US$) rate rate
Sector/industry 2017 2018 (%) 2017 2018 (%)
Total 694 816 18 6967 6821 -2Primary 24 39 60 550 406 -26
Manufacturing 327 307 -6 1 690 1 600 -5
Services 343 469 37 4727 4 815 2
Top 10 industries in value termsChemicals and chemical products 65 149 129 198 211 7
Business activities 107 112 5 1 817 1 848 2
Financial and insurance activities 59 108 84 617 599 -3
Information and communication 39 90 131 611 612 0.2
Food, beverages and tobacco 88 55 -37 227 205 -10
Transportation and storage 23 47 109 306 269 -12
Electrical and electronic equipment 26 42 65 307 257 -16
Mining, quarrying and petroleum 23 38 70 466 329 -29
Electricity, gas and water 54 38 -30 171 191 12
Trade 12 35 188 486 501 3
Source: UNCTAD, cross-border M&A data
Moreover, the COVID-19 pandemic caused a dramatic drop in global foreign direct investment
(FDI) in 2020, bringing FDI flows back to the level seen in 2005. The crisis has had an immense
negative impact on the most productive types of investments, namely greenfield investments
in industrial and infrastructure projects (UNCTAD, 2021). Global FDI flows dropped by 35%
to $1 trillion, from $1.5 trillion in 2019. This is almost 20% lower than the level of observed
services sectors.

7
in 2009 after the global financial crisis (UNCTAD, 2021). The decline was heavily skewed to-
ward developed economies, where FDI fell by 58%, partly because of fluctuations caused by
corporate transactions and intra-firm financial flows. FDI in developing economies declined
by a more moderate 8%, mainly because of resilient flows in Asia (see Table 5). It is there-
fore important to understand the relationship between FDI and trade in order to analyze FDI
correctly:
Is there complementarity between trade and FDI or are they substitutable?
Indeed, if they are complements, trade and FDI should exhibit a positive relationship, and a
negative correlation in the case of substitutes (Belke and Domnick, 2021). Foreign investment
and tradewould be complementary in the casewhere the production process of multinationals
is distributed across countries (vertical FDI), and substitutable for horizontal FDI (commercial
presence, thus avoiding trade costs by "tariff jumping", Andrenelli, A. et al., 2019). However,
the growth of global value chains (GVCs) through the fragmentation of production has ac-
centuated the interdependencies of trade and FDI. Traditional exports of goods and services
as final products to consumers abroad account for only about 30% of total trade in goods
and services in today’s global economy. Firms organize their production on a global scale
through a combination of trade and investment. In reality, about 70% of international trade
today involves GVCs, as services, raw materials, parts and components cross borders- often
numerous times (OECD’s Trade in Value Added (TiVA) database). The two components are
complementary, and the COVID-19 crisis highlighted their importance in the globalization of
trade.
According to TISMOS (i.e. Trade in Services by Mode of Supply)2, trade in services has ex-
panded by 5.4% per year on average since 2005, faster than the 4.6% yearly expansion of trade
in goods. However, a disparity in the growth of services trade exists around the world. The
contribution of services to economic growth depends on the region or country. So the ques-
tion is:
Who trades services?
Between 2005 and 2017, developing economies, excluding Least Developed Countries (LDCs),
gained over 10 percentage points in their share in global trade, reaching $3.4 trillion in world
services exports (from 14.7% in 2005 to 25.2% in 2007 according to WTO estimates in 2019)
and $4.5 trillion in world services imports (from 23% to 34.4% between 2005 and 2017). This
impressive increase is due to the process of structural economic transformation and success-
ful trade diversification from goods to services in several developing economies, particularly
2It is an "experimental" dataset produced by the WTO. These data use both official figures and estimates to
cover services exports and imports for some 200 economies from 2005 to 2017.

8 General Introduction
Table 5: Announced greenfield projects, cross-border M&As and international project finance
deals, by group of economies, 2019-2020
Value Growth Number Growth
(Billions of US$) rate rate
Group of economies Type of FDI 2019 2020 (%) 2019 2020 (%)
Cross-border M&As 424 379 -11 5 802 5 225 -10
Developed economies Greenfield projects 346 289 -16 10 331 8 376 -19
International
project finance 243 175 -28 543 587 8
Cross-border M&As 82 84 2 1 201 907 -24
Developing economies Greenfield projects 454 255 -44 7 240 4 233 -42
International
project finance 365 170 -53 516 443 -14
Cross-border M&As 1 12 716 115 69 -40
Transition economies Greenfield projects 46 20 -58 697 371 -47
International
project finance 26 21 -18 59 31 -47
Source: UNCTAD, cross-border M&A database (www.unctad.org/fdistatistics) for M&As, infor-
mation from the Financial Times Ltd, FDI Markets (www.fDimarkets.com) for announced greenfield FDI
projects and Refinitiv SA for international project finance deals.
in Asia, and new ways to trade in services (WTO, 2019). Moreover, the participation of devel-
oping economies in services trade is not yet inclusive. Indeed, the data analysis shows that
trade in services is very concentrated, with the same five developing economies that are ma-
jor exporters also being major importers of services. In 2017, China was the largest trader in
services, followed by Hong Kong (China), the Republic of Korea, Singapore and India. These
five Asian economies accounted for 56.7% of developing economies’ exports and 58.1% of im-
ports in 2017 (WTO, 2019). They are the main drivers of the impressive trade performance
of developing economies, with services exports rising by over 12% on annual average since
2005, almost three times faster than in developed economies.
By contrast, in the same period, LDCs increased their share in global services exports by 0.1
percentage points. In 2017, LDCs accounted for only 0.3% of world services exports, or $38.3
billion and, in imports, their participation was at less than 1%, with services imports totaling
$124.1 billion (WTO, 2019). The advanced economies have the largest shares in cross-border
trade in services worldwide. The United Kingdom and the United States have the highest share
of services exports in the world, with nearly $853 billion and $401 billion respectively in 2019,
while imports amount to $567 billion and $272 billion (see, Table 6). The largest EU exporters
are Germany and France, with $341 billion and $293 billion in services exports, respectively.
Imports from the two countries are around $369 billion and $270 billion. Developed country
FDI flows have declined since 2015 leading to a drop in global FDI (see Figure 3). The drop is

9
more pronounced from 2017 to 2018 mainly due to large repatriations of accumulated foreign
earnings by the United States multinational enterprises (MNEs) in the first two quarters of
2018, following tax reforms introduced at the end of 2017.
Table 6: Commercial services exports and imports by economies and partners (Millions of
US$), 2019
World Partners
Countries Exports Imports Exports Imports
United States 853842 567121 Ireland 57421 United Kingdom 62059
of America Canada 69035 Canada 38476
Switzerland 45256 Germany 31764
Mexico 32330 Switzerland 24821
Singapore 25266 Bermuda 23709.00
United Kingdom 401429.53 272717.26 EU(27) 153093.05 EU(27) 129479.40
United States of America 101616.56 United States of America 53195.81
Switzerland 15054.02 India 8429.44
Australia 9874.34 Japan 7325.34
Japan 8670.68 Switzerland 7478.51
Germany 341078.14 369368.38 United States of America 50053.94 United States of America 46858.96
United Kingdom 29060.44 United Kingdom 29499.27
Switzerland 29614.58 Netherlands 20497.58
France 25544.17 Ireland 17768.30
Netherlands 20531.16 France 22649.21
France 293568.76 269940.01 United States of America 33948.07 Germany 35618.32
United Kingdom 33399.52 United Kingdom 30418.36
Germany 30054.53 United States of America 27429.36
Switzerland 20608.41 Belgium 14834.16
Belgium 20315.10 Ireland 14311.36
Source: WTO (Integrated Trade Intelligence Portal)
Figure 3: FDI inflows, global and by economic group, 2007-2018 (Billions of US$)
0500
1000
1500
2000
2005 2010 2015 2020Year
World Developed economies
Developing economies Transition economies
Source: UNCTAD, FDI/MNE database

10 General Introduction
Indeed, FDI flows to developed economies reached their lowest point since 2004, falling by
20% from 2017 to 2018. FDI flows to Europe more than halved to $217 billion, while those to
North America remained more resilient, falling by 2% to $6.4 billion. FDI flows to developing
economies were stable, declining by almost 0.2% with significant differences across regions
(see Figures 3 and 4). Developing Asia and Latin America and the Caribbean recorded lower
FDI flows in 2018, while inward FDI to Africa rose significantly (nearly 21% between 2017 and
2018).
Figure 4: FDI inflows, global and by economic group, 2017-2018 (Billions of US$)
0 500 1,000 1,500 2,000
Latin America and the Caribbean
Northern America
Africa
Asia
Developed economies
Developing economies
Europe
Transition economies
World
FDI−2017 FDI−2018
Source: UNCTAD, FDI/MNE database
Services accounts for a large share of GDP in developed and emerging countries but for only
20% of world trade (Figure 2). The reason is that barriers to international trade in services ap-
pear to be high compared to trade in goods and commodities (Francois and Hoekman, 2010;
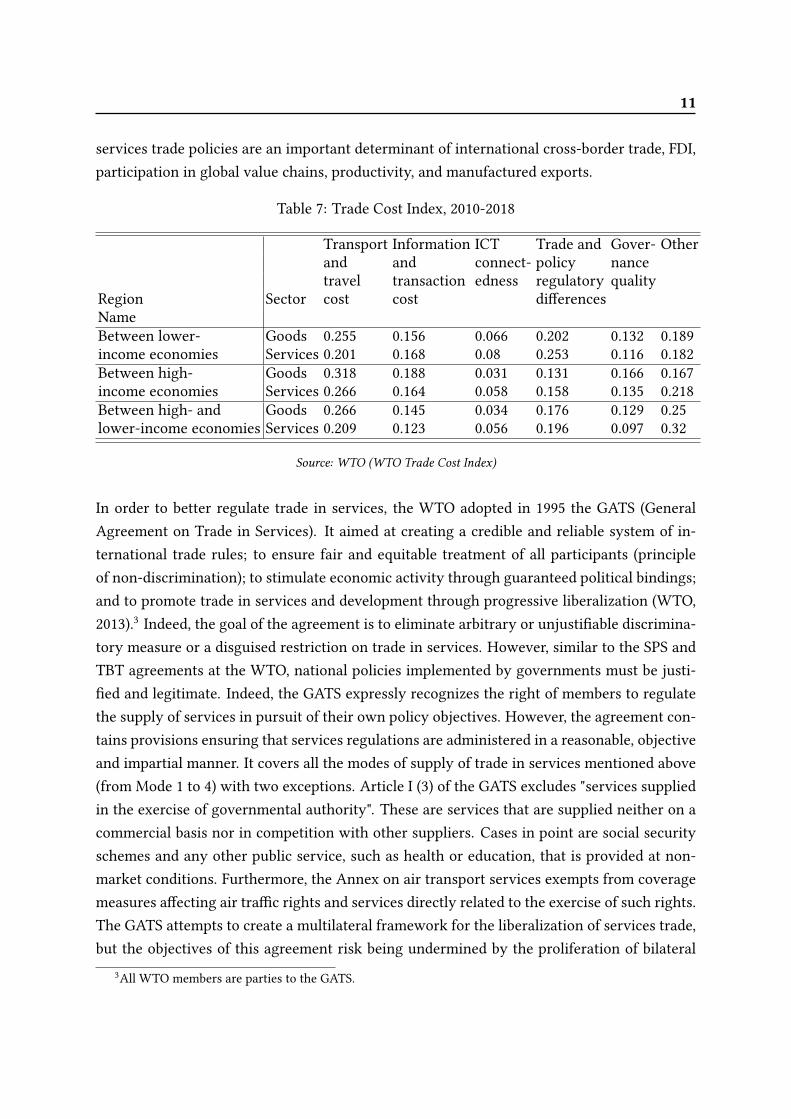
WTO, 2019). TheWTO Trade Cost Index highlights the evolution of trade costs over time, the
impact of trade costs between economies and sectors (goods and services). It shows significant
trade costs in the services sector. Trade in goods is more affected by transport, information
and transaction costs and trade in services is more impacted by trade policies and regula-
tory heterogeneity and ICT connectedness (see Table 7). Several restrictive measures exist
and have a significant impact on trade in services: barriers to entry, barriers to competition,
discriminatory measures, etc. Barriers to entry to service suppliers are wide-ranging and af-
fect both the supplier, its equipment, its activities and the movement of people. In 2001, the
European Commission issued a report on remaining barriers to trade in services (European
Commission, 2001). The report revealed that a majority of European firms were facing diffi-
culties to export their services because they were facing heavy regulatory barriers. As a result,
11
services trade policies are an important determinant of international cross-border trade, FDI,
participation in global value chains, productivity, and manufactured exports.
Table 7: Trade Cost Index, 2010-2018
Transport Information ICT Trade and Gover- Other
and and connect- policy nance
travel transaction edness regulatory quality
Region Sector cost cost differences
Name
Between lower- Goods 0.255 0.156 0.066 0.202 0.132 0.189
income economies Services 0.201 0.168 0.08 0.253 0.116 0.182
Between high- Goods 0.318 0.188 0.031 0.131 0.166 0.167
income economies Services 0.266 0.164 0.058 0.158 0.135 0.218
Between high- and Goods 0.266 0.145 0.034 0.176 0.129 0.25
lower-income economies Services 0.209 0.123 0.056 0.196 0.097 0.32
Source: WTO (WTO Trade Cost Index)
In order to better regulate trade in services, the WTO adopted in 1995 the GATS (General
Agreement on Trade in Services). It aimed at creating a credible and reliable system of in-
ternational trade rules; to ensure fair and equitable treatment of all participants (principle
of non-discrimination); to stimulate economic activity through guaranteed political bindings;
and to promote trade in services and development through progressive liberalization (WTO,
2013).3Indeed, the goal of the agreement is to eliminate arbitrary or unjustifiable discrimina-
tory measure or a disguised restriction on trade in services. However, similar to the SPS and
TBT agreements at the WTO, national policies implemented by governments must be justi-
fied and legitimate. Indeed, the GATS expressly recognizes the right of members to regulate
the supply of services in pursuit of their own policy objectives. However, the agreement con-
tains provisions ensuring that services regulations are administered in a reasonable, objective
and impartial manner. It covers all the modes of supply of trade in services mentioned above
(from Mode 1 to 4) with two exceptions. Article I (3) of the GATS excludes "services supplied
in the exercise of governmental authority". These are services that are supplied neither on a
commercial basis nor in competition with other suppliers. Cases in point are social security
schemes and any other public service, such as health or education, that is provided at non-
market conditions. Furthermore, the Annex on air transport services exempts from coverage
measures affecting air traffic rights and services directly related to the exercise of such rights.
The GATS attempts to create a multilateral framework for the liberalization of services trade,
but the objectives of this agreement risk being undermined by the proliferation of bilateral
3All WTO members are parties to the GATS.

12 General Introduction
and regional trade agreements, most of which now include provisions on services. However,
discriminatory treatment may distort services trade and reduce efficiency gains (Lehmann et
al., 2003). December 2021, 67 WTO members accounting for over 90% of global trade in ser-
vices, have successfully concluded the negotiations on Services Domestic Regulation. This
agreement aimed to reduce administrative costs and creating a more transparent operating
environment for service providers hoping to do business in foreign markets.
Services trade policies are crucial in international trade. Indeed, barriers to global services
trade however, remain pervasive, as national trade and regulatory policies in individual ser-
vices sectors are often developed with limited regard for economy-wide impacts. Moreover,
due to the intangible nature of services, quantifying restrictions in services is difficult and it
is only recently that the OECD and the World Bank have launched services trade restrictive-
ness indices (STRI).4Indeed, the implementation of policies promoting services trade requires
the assessment of the level of services restrictions. Theses indices are unique, evidence-based
tools that provide information on regulations affecting trade in services in several service
sectors. These databases highlight the restrictions that most impede trade, providing them
with data on current trade policies and businesses the key market access information about
compliance requirements. One important question is:
What is the level of restrictions in the services sector after the GATS agreement? Are we head-ing towards a progressive liberalization of services or, on the contrary, more and more restrictivepolicies?
The report of the OECD’s Services Trade Restrictiveness Index trend (OECD, 2020) shows that
barriers to services trade are rising. The index data demonstrate an accelerated shift toward
increasing trade restrictive measures across most services sectors. The level of services trade
restrictions in 2019 was 30% higher. At the same time, the pace of services trade liberalisation
slowed by 60% compared to 2018. In addition the new restrictions are impacting the entire
economy affecting foreign investment, conditions related to business establishment, and the
temporary movement of service providers. The digital sector has encountered growing re-
strictions in 2019 affecting digital trade. Indeed, analysis of the index reveals an increasing
level of restrictiveness affecting trade in digitally enabled services in 2019.
4STRI= Services Trade Restrictiveness Index. The OECD also launched the FDI Regulatory Restrictiveness
Index (FDI RRI) that measures statutory restrictions on foreign direct investment (FDI).

13
Table 8: Evolution of Services Trade Restrictiveness Index (STRI), 2014-2020
Sectors Countries 2014 2019 2020 Change Change
in points in points
(2014-2020) (2019-2020)
OECD countries 0.134 0.144 0.145 0.011 0.001
Digital Emerging countries 0.276 0.343 0.339 0.063 -0.004
OECD countries 0.212 0.212 0.212 0 0
Logistics Emerging countries 0.397 0.383 0.384 -0.013 0.001
OECD countries 0.282 0.281 0.282 0 0.001
Transport Emerging countries 0.459 0.447 0.448 -0.011 0.001
OECD countries 0.286 0.287 0.288 0.002 0.001
Accounting Emerging countries 0.493 0.5 0.502 0.001 0.002
OECD countries 0.355 0.357 0.359 0.004 0.002
Legal Emerging countries 0.484 0.488 0.487 0.003 -0.001
OECD countries 0.276 0.28 0.281 0.005 0.001
Broadcasting Emerging countries 0.461 0.476 0.479 0.018 0.003
Source: OECD STRI database
Trade restrictive measures affected key service sectors that play an important role in enabling
digital trade, such as telecommunications services, computer services, and audio-visual ser-
vices. The European Economic Area (EEA) services market continues to liberalise. Indeed,
the liberalisation through EU/EEA and domestic reforms of EU member states affected cargo
handling, commercial banking and insurance services. However, Mustilli and Pelkmans (2013)
find that despite significant services liberalization within the single European Market, a high
level of regulatory heterogeneity prevails among countries in several sectors, notably in pro-
fessional services (legal, accounting). Restrictions in services have increased from 2014 to
2020 and remained higher in emerging markets.5Sectors such as transportation and logistics
affected by the health crisis experienced growth in restrictions from 2019 to 2020 (see Table
8). However, the restrictions to trade in digital services have dropped in 2020, in order to
facilitate remote working and online business operations caused by the COVID-19 pandemic.
The most open sectors in advanced countries are distribution, telecommunication, insurance,
logistics freight forwarding and motion pictures while in emerging countries the sectors are
sound recording, engineering, computer and logistics. In addition, we find a similarity in the
more restrictive sectors in both advanced and emerging countries: air transport, rail freight,
5Emerging countries include Brazil, China (People’s Republic of), India, Indonesia, Kazakhstan, Malaysia,
Peru, Russia, South Africa, and Thailand.

14 General Introduction
accounting, legal and broadcasting (see Table 9). Moreover, there is a negative correlation
between the level of services restrictions and services imports. Indeed, the countries that
are most closed to services suppliers are those that import fewer services, such as Thailand,
Malaysia, South Africa, Brazil (see Figure 5).
Table 9: The 5 least and most restrictive service sectors by region
Region Sectors with Low STRI Values Sectors with High STRI ValuesDistribution 0.18 Rail freight transport 0.26
Telecom 0.19 Broadcasting 0.28
OECD Insurance 0.19 Accounting 0.29
members Logistics freight forwarding 0.2 Legal 0.36
Motion pictures 0.2 Air transport 0.41
Sound recording 0.28 Broadcasting 0.48
Engineering 0.29 Air transport 0.48
Emerging Computer 0.31 Legal 0.49
countries Logistics customs brokerage 0.32 Accounting 0.5
Logistics freight forwarding 0.32 Rail freight transport 0.59
Source: STRI database
Figure 5: Correlation between service imports and STRI, 2019
AUSAUT
BEL
BRA
CAN
CHL
CHN
IND
IDN
KAZ
MYS
PER
RUS
ZAF
SWE
CHE
THA
TUR
GBR
USA
0200
400
600
Serv
ice im
port
s in b
illio
ns o
f U
S d
olla
rs (
curr
ent prices)
.25 .3 .35 .4 .45 .5STRI
Source: UNCTAD and OECD databases
Figures 3 and 4 show that trade in services is more pronounced in advanced countries. There-
fore, the importance of services in economies depends on the level of development of coun-

15
tries. These results suggest a positive correlation between the wealth of nations and the per-
formance of services sector. Indeed, the 2019 World Trade Report (WTO, 2019) notes com-
mercial services production in LDCs represents, on average, 40% of GDP, well below middle-
income economies (over 50%) and high-income economies (typically over 70%). The same
report highlights that as the income of a country increases, richer consumers spend increas-
ingly larger amounts on skill-intensive services, such as financial and insurance services, and
richer countries tend to specialize in the production of these services. The traditional trade
theory can explain this fact. Indeed, Francois and Reinert (1996) note that the importance of
services in relative terms increases as countries become richer, and that this is also reflected
in an increasing variety of market services (product differentiation).6They also observe that
even if services are not traded directly, they are embodied in the output of both tradable and
non-tradable activities, and thus are a key determinant of overall employment and productiv-
ity. The rise in the share of services in production as countries become richer can be explained
by the fact that differences in services endowments lead to a specialization of countries, par-
ticularly advanced countries.7This specialization will subsequently lead to the exchange of
services through the market ("outsourcing") with an associated increase in variety and quality
that may raise the productivity of firms and welfare of final consumers.8This will increase
demand for purchased services and competitiveness of countries (Siggel 2006).
The comparative advantages in services described above are similar to those in the goods sec-
tor. The endowment factor behind the comparative advantage of advanced countries in trade
in services is, however, difficult to explain. Indeed, the heterogeneity of services means that
for some services, specificmodes of supply are either technically impossible (e.g., construction
services via mode 2) or virtually excluded. With factors of production whose mobility deter-
mines the tradability of services and with immobile factors which are defined locally rather
than nation-wide, it is difficult to explain the comparative advantage in services through la-
bor or capital endowments (Langhammer, 2004). The literature has identified a broad range of
factors determining the comparative advantages of services trade. First, domestic policy mea-
sures in the host country explain this comparative advantage. Indeed, trade policy in services
is essentially determined by domestic policies but not through border measures. The domes-
tic regulation of services affects the export performance of services. Hence, when services
are supplied through movement of capital (mode 3 of supply), the impact of trade policies on
comparative advantage will depend on whether foreign companies are allowed to supply their
6They use the input-output tables to analyze the contribution of services activities to user industries and final
(consumer) demand.
7Capital and skilled labor endowments can explain the specialization in services of advanced countries.
8This refers to the theory of Revealed Comparative Advantage (RCA) of Ricardo (1817) and Heckscher and
Ohlin (1991).

16 General Introduction
services to local residents through subsidiaries or affiliates in consuming countries (market
access) and which conditions they face relative to domestic competitors once they are in the
domestic market (national treatment).
When services are provided through mode 4 of trade in services, it is critical whether the
temporary presence of foreign service providers in the country of consumption is allowed
and not discredited as a circumvention of restrictive migration policies (market access), and
whether or not foreign providers are treated less favourably in the domestic market than local
competitors (national treatment). Trade policies limiting market access through cross-border
supply (mode 1) are rarer, for instance by hindering local demand from using the Internet or
by suppressing foreign providers’ access to local demand (Langhammer, 2004). Domestic poli-
cies related to services trade are relevant to explain the comparative advantage of advanced
countries.9Moreover, Table 10 shows that North-North trade (between advanced countries) is
more significant than North-South trade (between advanced and emerging countries). Nearly
60% of US services exports go to OECD countries, compared with 26% to emerging countries.
The attractiveness of national policies for trade in services in advanced countries would be
the source of this comparative advantage. The United States have a comparative advantage
in services exports because the regulations of other advanced countries are very attractive
and competitive. However, emerging countries are restrictive to foreign service suppliers and
some emerging and developing countries are still in the process of industrialization.
9Domestic policies can include market access policies, tax policies, labour legislation, rules referring to cor-
porate governance and policies regulating the repatriation of investment income etc.

17
Table 10: Bilateral service exports (US Dollar, Millions), 2018-2019
Partners
2018 2019
World OECD Emerging World OECD Emerging
Economies Values values % values % values values % values %
United States
of America 862433 536186 62.17 225580 26.16 875826 549617 62.75 224922 25.68
United Kingdom 409415.7 319001.915 77.92 79744.95 19.48 416307.4 320969.56 77.1 52012.58 12.49
World OECD Emerging World OECD Emerging
Values Values % Values % Values Values % Values %
UE (27) 2175216 1059434 48.70 N/A N/A 2195627 1065482 48.53 N/A N/A
Source: OECD database (International Balanced Trade Statistics)

18 General Introduction
Second, the quality of institutions and legal systems are key factors explaining services trade.
The quality of institutions as a source of comparative advantage is based on the idea that in-
stitutions are not the same everywhere, so political and legal systems are different from one
country to another, creating uncertainty on the relations with foreign partners. This uncer-
tainty increases transaction costs (Belloc, 2006). The link between institutional quality, legal
systems and trade in services may be observed in the insurance sector. Indeed, insurance
services require that the client trust that contracts will be honoured if a claim is made. Thus,
differences in legal and regulatory systems affect the degree of confidence that a foreign client
has in a firm, and this can affect its export success. For example, Djankov et al. (2007) highlight
the fact that the lengthy resolution of simple business disputes can work against the interests
of entrepreneurs. Yue et al. (2010) find that sound contract enforcement and a good quality
legal system enhance the export activities of firms. The findings of Gani and Clemes (2016)
reveal a statistically significant positive correlation of rule of law and regulatory quality with
the exports and imports of insurance and financial services. Referring to the World Bank’s
indicators of good governance data (Kaufmann et al., 2010), we note a huge gap in rule of
law achievements between developing and advanced economies. The quality of institutions
in advanced countries would therefore be a comparative advantage in trade in services.
Finally, an additional factor explaining the comparative advantage of advanced countries’
trade in services would be the demographic change such as aging of the population. Accord-
ing to the United Nations’ 2015 world population prospects report, the number of persons
aged 60 or more has increased significantly in recent years in most countries and regions and
this trend will continue in the near future (United Nations, 2015). It shows that the aging
process is most advanced in high-income countries. Japan is home to the world’s most aged
population: 33% were aged 60 years or over in 2015. Japan is followed by Germany (28% aged
60 years or over), Italy (28%) and Finland (27%). Aging of the population gradually changes
the composition of service demand in many countries (UNCTAD, 2018). Oliveira et al. (2005)
estimate, by using OECD data, that aging of the population leads to a rise in the demand
shares for health care, followed by energy consumption and housing expenditures, in most of
the countries in their sample. Similarly, Bodier (1999), by using French expenditure surveys,
finds that the consumption patterns of young and old generations are different. While young
people tend to consume equipment, older people are more likely to spend a larger share of
their consumption expenditures on leisure, health care, or private services.
These factors explaining the comparative advantage of trade in services are important to un-
derstand or assess the negative impacts of NTBs in services on trade. An empirical literature
examines the effects of domestic services regulation and services trade. These studies that

19
used country-level data on bilateral trade in services from OECD countries show that do-
mestic regulations in the origin and destination country have a strong negative impact on
aggregate exports of services (Nicoletti et al., 2003; Kox and Nordås (2007); Lennon, 2009;
van der Marel and Shepherd, 2013; Nordås and Rouzet, 2016). Other studies control for the
firm-level determinants of export performance. Using firm-level data, they show the effects
of domestic services regulation on international trade in professional services. Their results
show a robust and sizeable negative impact of domestic regulations on both the decision to
export and the values exported by each firm (Crozet et al., 2016). Other authors focused on
the FDI sector, showing the negative effects of restrictive measures on cross-border invest-
ment, particularly in the secondary and tertiary sectors (Mistura and Roulet, 2019; Gregori
and Nardo, 2021). In addition, others have linked service sector reforms and the productivity
of manufacturing industries relying on service inputs. Using firm-level data, they show the
interdependence of the two sectors. Reforms liberalizing upstream services have positive ef-
fects on the productivity of downstream manufacturing firms (Arnold et al., 2011; Duggan et
al., 2013; Ariu et al., 2019; Ariu et al., 2020).
The study of the impact of services liberalization is relevant because the gains are higher than
those of goods. Services are used as both key inputs in the goods sector and key interme-
diate inputs in the production of all services, if we consider financial, communication and
professional services. A reduction in trade costs could improve overall productivity (Lipsey,
2001; Markusen, 1989). The literature about the gains from services liberalization is still recent
and most authors assess the effects of liberalization through computable general equilibrium
(CGE)models. Most studies focus on developing and emerging countries due to the large gains
from services liberalization in these countries relative to advanced countries (WTO, 2019). Au-
thors such as Konan and Maskus (2006) quantify the impact of services liberalization (FDI) on
welfare, output and factor prices in Tunisia. They compare these effects to those of goods liber-
alization. They find that goods-trade liberalization yields a modest gain in aggregate welfare.
Reducing service barriers generate relatively large welfare gains and low adjustment costs.
Services liberalization increases economic activity in all sectors and raise the real returns to
both capital and labor.10
Using a CGE model, Balistreri et al. (2009) examine the impact of
liberalization of regulatory barriers against foreign and domestic business service providers
in Kenya. The ad valorem equivalent of barriers to foreign direct investment has been es-
timated based on detailed questionnaires completed by specialists in Kenya. They conclude
that Kenya gains very significantly from regulatory liberalization in business services and ad-
ditional gains from uniform tariffs. The estimated gains increase to 50% of consumption in the
10These findings confirm those of Hoekman and Djankov (1996), who note the potentially large gains in well-
being for Tunisian citizens of services liberalization.

20 General Introduction
long run. The largest gains for Kenya will derive from the liberalization of costly regulatory
barriers that are non-discriminatory in their impact between Kenyan and multinational ser-
vice providers. The study by Jensen, Rutherford and Tarr (2010), very similar to Balistreri et al
(2009), assesses the impact of liberalization of regulatory barriers against foreign and domes-
tic business service providers in Tanzania. Using the same methodology as above, the authors
find significant gains to Tanzania from services liberalization, particularly in the banking,
maritime, and road transportation sectors. Decomposition exercises reveal that the largest
gains would derive from the liberalization of non-discriminatory regulatory barriers. Latorre
(2016) investigates the impact on female and male workers of tariff reform and the reduction
of regulatory barriers faced by domestic and foreign firms operating in business services in
Tanzania. Using the same methodology as Jensen, Rutherford and Tarr (2010), she find that
FDI liberalization in services benefits both males and females, but it benefits males more, due
to the greater skill levels required in business services. Jensen, Rutherford, and Tarr (2007)
use a computable general equilibrium model of the Russian economy to assess the impact of
accession to the World Trade Organization (WTO), which encompasses improved market ac-
cess, tariff reductions and reduction of barriers against multinational service providers. They
estimate that Russia will gain about 7.2% of the value of Russian consumption in the medium
term from WTO accession and up to 24% in the long term. They find that the largest gains to
Russia will derive from liberalization of barriers against multinational service providers.
The impact of services liberalization on employment is crucial because services accounted
for nearly 65% of total employment in 2019 (WDI, data). However, few studies examined the
link between services trade liberalization and employment. This literature, both theoretical
and empirical, analyzes the effects of services liberalization on employment. Indeed, by using
CGEmodel, Konan andMaskus (2006) argue that lower adjustment costs in the services sector
contribute to relatively higher employment gains from service trade liberalisation compared
to those from goods trade. Even after the liberalisation, they argue, services will continue
to be provided locally and thus support domestic employment. Manning and Aswicahyono
(2012) compare the contribution of exports on employment by sector in Indonesia. By using
input-output tables, the study estimates that exports account for almost two-thirds of the new
jobs created in the country during the period 1995-2005. The study by UNCTAD (2018) similar
to the previous ones examines the link between employment and trade in services by using
theWorld Trade Organization and Organization for Economic Cooperation and Development
Trade in Value Added (WTO-OECD TiVA) database . It finds a greater percentage increase
in employment in merchandise exports compared with services exports; in absolute terms,
services have the potential to create a higher number of jobs than the manufacturing sector.

21
In sum, NTMs in services are higher than in goods and have a greater impact on trade. Indeed,
trade in services has traditionally faced higher costs compared to trade in goods, largely due
to the "proximity burden" of services trade (i.e., the necessity for suppliers and consumers of
services to be in close physical contact), and more complex policy regimes than those applied
to goods trade (WTO, 2019). NTBs in services seem to be the major impediment to trade in
advanced and emerging countries. Interestingly, the literature suggests that the gains from
liberalization in services are larger than those in goods and services are crucial inputs into
the productivity of manufacturing firms. However, this literature does not study in detail
the contribution of disaggregated services to production and trade. Most studies so far have
focused on aggregate services. The revealed comparative advantage of trade in services de-
pends on the level of development of countries but also on the type of services considered. The
COVID-19 crisis had a greater impact on certain service sectors such as restaurants, tourism,
travel and transport sector than on the financial and computer services, which grew during
the lockdown (WTO, 2021).
Although most studies on services trade focus on emerging and developing countries, very
few cover the African continent. The effects of services liberalization on intra-African trade
remain poorly developed. Indeed, most African studies focus on agriculture and manufac-
turing with a limited coverage on services. Yet, most African countries are moving from
agriculture-based economy to service-based economy, by passing amanufacturing-based econ-
omy. Africa is still the continent with a marginal share of services trade, accounting for about
2% of world services exports in 2018 according to UNCTAD data. This is partly due to very
high restrictions in the services sector and higher intra-block trade. The proportion of employ-
ees in the services sector continues to increase in both developed and developing economies.
At the same time, the proportion of workers in agriculture and manufacturing sectors is de-
clining or stagnating (WTO, 2017). Interestingly, over the last few years, Africa has been
growing along a very different trajectory. As Hoffman et al. (2019) point out, across the re-
gion, agriculture’s share of GDP has declined and manufacturing has stagnated. Services, in
contrast, are increasing as a share of total employment and GDP, driving value addition and
providing critical inputs to boost other economic activities. The African Continental Free
Trade Area (AfCFTA) project will become the largest trade area in the world, with an esti-
mated population of more than 1.30 billion, which is expected to reach 1.68 billion in 2030
and 2.48 billion in 2050, with a combined gross domestic product (GDP) estimated at $2.5
trillion (Ekobena et al., 2021). By significantly reducing tariffs and non-tariff barriers, this
agreement could boost intra-African trade, investment and production. Most studies assessed
the effects of this agreement on welfare, GDP, and intra-African trade, focusing on the agri-
cultural and manufacturing sectors, leaving the services sector (Vanzetti, Peters, and Knebel,

22 General Introduction
2018; Abrego et al., 2019; Bengoa et al., 2021).11
This thesis contributes to the literature by investigating the effects of sectoral restrictions in
services on international trade. Should services trade be more liberalized in order to stimulatetrade in goods? The objective of this thesis is to firstly investigate the effects of sectoral restric-
tions in services on trade and FDI and finally to examine the gains of services liberalization
on trade. Therefore, it is organized around 3 main chapters.
In the first chapter, I empirically examine, using a gravity model, the impact of service re-
strictions and regulatory disparity on agri-food trade between OECD countries from 2014 to
2018. This chapter extends the literature about the effects of restrictions in services on manu-
facturing trade. Ariu et al. (2019) explore the interaction between international trade products
and restrictions on services in Belgium using firm-level data. Ariu et al. (2020) investigate the
importance of services in the exports of Belgian manufacturing firms. However, this chapter
differs from previous studies because it focuses on the food sector, which is still a manu-
facturing sector highly dependent on services and whose contribution to the GDP of OECD
countries is significant. To our knowledge, this chapter is the first to examine the effects of
non-tariff barriers in services on food trade. Using the OECD input-output table, we find that
the food sector is one of the manufacturing sectors that uses more services as inputs. We
consider four service sectors (transportation, distribution, logistics, finance, and other busi-
ness sectors) that are highly relevant to food production. The results confirm the findings
of previous studies that restrictions in services impede trade in manufacturing goods. Inter-
estingly, restrictions in the distribution sector have positive and significant effects on both
exports and imports of food products. However, the regulatory disparity between countries
has a significant negative impact on food trade. This impact decreases when the exporter
country is closed to service providers.
The second chapter empirically assesses through a gravity model the effects of restrictive
measures on cross-border investment in advanced and emerging countries from 2010 to 2019.
Indeed, FDI is important because it is the source of mode 3 of supply of trade in services.
Therefore, the study of FDI restrictions is relevant. However, the effects of NTBs on FDI de-
pend on both the FDI sector and the level of development of countries. Indeed, as mentioned
above, inward FDI in advanced countries is larger than in developing countries. Moreover,
inward FDI is more important in the manufacturing and services sectors, so NTBs will have
more negative effects in these sectors than in others. This chapter examines the real impact
of global and sectoral restrictive measures on FDI depending on whether the FDI destina-
11They find that African nations enjoy growth in gross domestic product, employment, and intra-African
trade.

23
tion country is an advanced, large, or small emerging country. The literature focuses only on
the effects of types of restrictions on cross-border FDI among advanced and large emerging
countries. It provides an explanation of the sectoral restrictive measures that hamper foreign
investment across countries at different levels of development. The results show that NTMs
in services hinder cross-border FDI between advanced countries. Moreover, NTMs in primary
and manufacturing FDI are obstacles to foreign investment in large emerging countries. Re-
strictions on FDI in natural resources hamper foreign investment in African countries.
In the third chapter, the objective is to evaluate the gains from services trade liberalization.
It aims to answer the following research question: Could restrictive barriers to entry for foreignsuppliers be the reason for Africa’s marginal share of world trade? It consists of assessing the
effects of the African Continental Free Trade Area (AfCFTA) agreement on intra-African trade
in the short and long term. In this chapter, we highlight the role of service sector in intra-
African trade. Most studies on the effects of AfCFTA have focused on the goods sector. To the
extent of our knowledge, chapter 3 is one of the first studies to identify the impact of services
liberalization on intra-African trade through a CGE model. The effects are observed on trade
in agricultural products, manufactured goods, processed food, natural resources, wood and
paper products, textiles and clothing. This chapter shows a significant contribution of ser-
vices to economic growth and intra-African trade. The manufacturing and natural resources
sectors are the most affected by the reduction of barriers to services trade in Africa. Moreover,
this trade agreement creates both long-term trade creation and diversion, but the welfare gain
is still positive and significant over the long term in Africa.
Overall, the three chapters highlight the positive impact of services liberalization on inter-
national trade. The reduction of barriers to entry for service suppliers increases the export
performance of manufacturing and services industries. Services significantly contribute to
the growth of countries’ GDP and trade at all levels of development.


Chapter 1
The impact of services traderestrictiveness on food trade∗
1.1 Introduction
Since the GATT agreements in 1948 (General Agreement on Tariffs and Trade), tariffs have
decreased significantly in world trade. For decades, high tariffs were the main obstacle to
trade. However, under many implemented trade agreements (multilateral, bilateral and re-
gional), tariffs have fallen to low levels (the simple average world tariff rate declined from
10.13% in 2000 to less than 7% in 2015, see Figure 1.1). At the same time, we have observed
a huge increase in Non-Tariff Barriers (NTBs), particularly production standards, which rep-
resent the main obstacle to global economic growth (Kee et al., 2009). Indeed, market access
that depended on traditional trade policies (tariffs and quotas) is now subject to compliance
with regulatory measures (UNCTAD, 2013).
Figure 1.1: Tariff rate, applied, simple mean, all products (%)
2000 2002 2004 2006 2008 2010 2012 2014 2016 2018
5
6
7
8
9
10
11
Source: World Integrated Trade Solution database
Non-tariff barriers include a diverse array of measures from trade policy instruments (quotas,
∗This chapter has been published in International Economics., vol. 166(C), pp. 71-94.

1.1. Introduction 25
subsidies, export restrictions) to non-trade policy instruments, for example technical mea-
sures (SPS and TBT).1These latter measures, considered as rules that establish production
characteristics and procedures, aim at optimizing the reliability of products and ensuring food
safety, animal and plant health, and environmental protection. Although they are important
to address legitimate market failures, these measures have restrictive effects on international
trade in food products (UNCTAD, 2013). These technical, health and quality regulations gen-
erate high compliance costs (product adaptation costs, costs related to equipment, technology
and necessary skills). Therefore, the existence of fixed costs may influence the decision to ex-
port (WTO, 2005).
Services are also affected by national regulations and trade in services is more impacted by
these restrictions than trade in goods (Kox and Nordås, 2007). For commodities, production
and quality requirements only apply to goods. For services, they encompass the supplier, its
foreign personnel and equipment. For some authors, the level or stringency of service re-
strictions is not an obstacle, but regulatory heterogeneity between countries appears to be
restrictive (Kox and Nordås, 2007). However, it is not the level of regulation that discour-
ages foreign suppliers, but rather the difference in regulations between origin and destination
markets. Thus, additional compliance costs to establish a firm in a foreign country would be
minimal if standards and qualifications were recognized in the home country. Service restric-
tions not only prevent foreign providers from accessing domestic service markets, but may
also deter them from making new investments once they are established in the market; this is
the so-called behind the border regulations (maintenance costs or operational restrictions
2).
The food, manufacturing, and services sectors in OECD countries have registered significant
export growth since 2015 (see Figure 1.2) and the services sector is a key factor in the produc-
tion and distribution of agricultural and manufactured goods. Table 1.2 describes the average
intermediate consumption by industry for OECD countries in 2015. It shows that consump-
tion by the food, beverages, and tobacco industry in services is larger than manufacturing and
agriculture inputs excluding the service sector. Average consumption is around 37% for ser-
vices, followed by 34% for industrial goods and 30% for agriculture, forestry and fishing goods.
1Sanitary and Phytosanitary Measures and Technical Barriers to Trade.
2Maintenance costs include costs related to the tax burden, the social security system, limiting the variety of
services, imposing fixed prices for certain services.

26 Chapter 1. The impact of services trade restrictiveness on food trade
The food, beverages and tobacco sector has services as a significant input among industrial
sub-sectors. As shown in Table 1.3, in 2015, the food industry in OECD countries consumed
more than half of all intermediate consumption in distribution services, 12% in transport and
logistics, and nearly 20% in financial, insurance and other business sectors.
Figure 1.2: OECD countries’ annual export growth from 2005 to 2017
2006 2008 2010 2012 2014 2016 2018-0.25
-0.2
-0.15
-0.1
-0.05
0
0.05
0.1
0.15
0.2
Food products
Manufactured goods
Services
Source: UNCTAD database
The food sector requires a lot of transport and logistics services to carry out efficient and cost-
effective import or export operations: the so-called "transit time". It provides vital distribution
for production, as well as essential personal mobility, connecting companies to global markets.
Exports of food products require more transport and logistics for the movement, storage and
warehousing of products (example of the seeds and perishable products that are most often
transported by airplane, meat and dairy products are often shipped in refrigerated containers
and trucks). The quality of food products will depend on themode and regulation of transport,
as well as the efficiency of logistics, especially for perishable products. These sectors have
a significant impact on the food supply chain. Maritime and road transport are the most
important modes of transport for the food industry (see Table 1.1).

1.1. Introduction 27
Table 1.1: Food miles by transport method in 2010
Transport Tonne kilometers %
mode (tkm)
Air 15.00 million tkm 0.16
Rail 930.00 million tkm 9.9
Road 2.91 billion tkm 30.97
Water 5.54 billion tkm 58.97
Source : Poore, J and Nemecek, T. (2018)
As the basic link between producer and consumer, the distribution sector is vital to the func-
tioning of amarket economy. Optimal regulation of this highly competitive sector has positive
effects on consumer welfare through a wide choice of food products and associated services
at attractive prices. Financial and insurance services facilitate transactions and provide access
to financing for investments and for food export and import activities. These sectors address
the risks of food trade activities. Indeed, food trade is risky, as importers may not pay after
receiving the goods and exporters may not deliver if they pay in advance. To reduce the risks
inherent to international trade, banks offer trade-specific finance products, the most common
of which are letters of credit (LC) and documentary collections (Amiti and Weinstein, 2011;3
Paravisini et al., 20144).
Using monthly US import data, Chor and Manova (2012) find that countries with higher in-
terbank rates and stricter credit conditions exported less to the United States during the crisis.
These effects were particularly pronounced in sectors that require significant external financ-
ing. Moreover, Bricongne et al (2010) find that French firms’ exports in the sectors most
dependent on external financing were more affected by the recent global crisis. The global
financial crisis is an example of a strong impact of credit on trade (see Figure 1.3).
3They showed that, in Japan, firms linked to under-performing banks reduced their exports.
4They found that a reduction in credit supply to firms led to a decline in exports in Peru.

28 Chapter 1. The impact of services trade restrictiveness on food trade
Figure 1.3: US import, export and volume of credit from 2005 to 2017
Source: World Bank, World Development Indicators data
Legal and accounting services are part of the institutional framework required to support a
healthy market economy (OECD, 2008). Accounting has emerged as a standardized service.
It enables the management of the food industry through tracking revenues and expenses, en-
suring compliance with legislation and providing investors with information on the financial
situation, which can be used to make business decisions. Restrictions in this sector lead to
high transaction costs.
This paper examines the effects of service restrictions on food trade between OECD countries
from 2014 to 2018 and discusses how to mitigate these restrictive impacts. Some studies have
focused on the effects of the liberalization of services on economic growth (e.g. Francois and
Schuknecht, 2000; Mattoo, Rathindran and Subramanian, 2001). Authors such as Doove et
al. (2001) have examined the impacts of regulatory policies in services on the service sector
performance (productivity, prices, and quality of services). Other authors have investigated
the effects of services regulation on trade in services (Nordås and Rouzet 2016; Borchert, I et
al., 2012; Van der Marel and Shepherd, 2013) and on the performance of manufacturing firms
(Arnold et al., 2011; Duggan et al., 2013). Few studies have highlighted the effects of service
restrictions on food trade.
Our study makes three main contributions to the existing literature on the impacts of restric-
tions in services on international trade. First, we use a gravity model to assess the effects of
restrictions in services on food trade. This paper is the first to investigate the effects of non-

1.1. Introduction 29
tariff barriers in services on food trade. Most works using gravity as an empirical framework
focused on the effects of restrictions on trade in services. Second, to examine the effects of
restrictions on trade, we use the Services Trade Restriction Index (STRI) and the Regulatory
Heterogeneity Index of the OECD. The first captures the level of restrictions in 22 service
sectors in 48 countries while the second measures the disparity of regulatory policy in these
sectors across country pairs, ranging from 0 (less restrictive) to 1 (closed to service providers).
This index is more recent (2014-2020) and more sectoral than theWorld Bank’s Services Trade
Restrictions Database, which includes 13 services sectors in 103 countries from 2012-2016.
The last contribution relates to the structure of our dependent variable: we study the effects
of NTBs in services on both the pooled and disaggregated food trade among OECD countries.
The pooled food data provide a sample large enough, for which the assumption of homoge-
neous effects across commodities for the restrictiveness index would not be too great (Niven,
W et al., 2012). Disaggregated food data allow the estimation of sector-specific gravity equa-
tions in the food industry.
Our results suggest that higher restrictions in the logistics and transport sector lead to lower
exports of food commodities. Also restrictions in the financial and other business sectors are
associated with lower imports. Interestingly, restrictions in the distribution sector have posi-
tive and significant effects on both exports and imports. A reduction of 0.05 points in STRI in
logistics and transport increases exports by 36 percent in the short-run, that in the financial
and other business sectors rises imports by 24 percent, while deregulation in the distribution
sector reduces exports and imports respectively by 17.5 and 40 percent. The most strongly
affected sectors are food, live animals and perishable products (milk, eggs and meat). Regula-
tory disparity in the logistics sector is a barrier to trade, but disparity in the transport sector
boosts food exports. The overall disparity in the services sector has a significant negative
impact on food trade. The result suggests that a 0.05 point lower regulatory heterogeneity is
associated with a 10 percent rise on average in food trade across all sectors. Moreover, regu-
latory differences have a less significant marginal impact on trade flows the higher the level
of trade restrictiveness in the exporting country. Indeed, the negative effect of regulatory dis-
parity decreases when the exporter country is closed to foreign service providers.
The remainder of this paper is structured as follows. In the first part, we review the literature
on the effects of these restrictive measures on trade flows. In the second part, we describe our

30 Chapter 1. The impact of services trade restrictiveness on food trade
econometric model with data, sources, types of regressions and methodology used. The last
section presents our different results and the discussion.

1.1.Introduction
31
Table 1.2: OECD average intermediate consumption in agriculture, industry and services in 2015 : Input-Output Table
Sectors in colum Agriculture sector Manufacturing sector Service sector
Agriculture, Food products, Mining Textiles, wearing, Wood, Petroleum, Metal Electronics, Construction Services
Intermediate forestry beverages apparel leather Leather Chemicals Computers,
Products in row fishing and tobacco and related and Paper and Plastics Transport
products equipment
products and others
Agriculture, forestry Consumption
and fishing (millions US) 190957.9 649047 894.1 10249.7 51008.2 21060.7 1424.91 6297.4 8316.8 92203.4
Ratio(%) 23.6051 29.5546 0.2300 3.0020 6.8831 0.6651 0.0003 0.1024 0.2977 0.4483
Consumption
Manufacturing (millions US) 325868.8 743497.2 273054.9 196298.8 433633.5 2107019.8 367813053.9 4254438.9 1791808.7 4179606.8
Ratio(%) 40.2820 33.8554 70.2463 57.4941 58.5150 66.5411 94.3329 69.2253 64.1558 20.3234
Consumption
Services (millions US) 292140.1 803548.2 114761.5 134875.3 256420.9 1038412.1 22094825.91 1885048.2 992774.2 15601237.1
Ratio(%) 36.1127 36.5899 29.5236 39.5037 34.6017 32.7937 5.6666 30.6722 35.5463 75.8612
Total (millions US) 808966.8 2196092.4 388710.5 341423.8 741062.6 3166492.6 389909304.7 6145784.5 2792899.7 19873047.3
Source: Data computed by the author with the OECD Input-Output Table, In 2015 (2018 edition) using the GTAP’s sectoral aggregation

32 Chapter 1. The impact of services trade restrictiveness on food trade
Table 1.3: Average intermediate consumption of food, beverages and tobacco in service in
2015: Input-Output Table
Food, beveragesServices and tobaccoWholesale and retail trade Consumption (millions US) 467526.4
repair of motor vehicles Ratio(%) 58.1827
Transportation and storage Consumption (millions US) 98997.2
Ratio(%) 12.3200Accomodation and food services Consumption (millions US) 5404.3
Ratio(%) 0.6725Publishing, audiovisual and Consumption (millions US) 1036.6
broadcasting activities Ratio(%) 1.2904Telecommunications Consumption (millions US) 5138.9
Ratio(%) 0.6395IT and other information services Consumption (millions US) 8281.3
Ratio(%) 1.0305Financial and insurance activities Consumption (millions US) 34595.9
Ratio(%) 4.3053Real estate activities Consumption (millions US) 13048.1
Ratio(%) 1.6238Other business sector services Consumption (millions US) 122488.9
Ratio(%) 15.2435Public administration and defence Consumption (millions US) 5801.9
compulsory social security Ratio(%) 0.7220Education Consumption (millions US) 3828.5
Ratio(%) 0.4764Human health and social work Consumption (millions US) 22472.5
Ratio(%) 2.7966Arts, entertainment, recreation Consumption (millions US) 5594,7
and other service activities Ratio(%) 0.6962Private households with employed persons Consumption (millions US) 0
Ratio(%) 0Total (million US) 2196092.4
Source: Data computed by the author with the OECD Input-Output Table, In 2015 (2018 edition) using the GTAP’ssectoral aggregation
1.2 Literature review
Studies that examine the impact of restrictions in services on international trade use two
main methods: analysis of bilateral trade and firm-level data. Indeed, the economic literature
that investigates the impact of standards in services on international trade uses the OECD
and World Bank Trade Restrictiveness Index. The first analysis focuses on the impacts of

1.2. Literature review 33
these indices on bilateral trade and the second on service exports and the performance of
manufacturing firms through firm-level data.
1.2.1 Service trade restrictiveness index (STRI) and service trade: Grav-ity analysis
The existing literature on service restrictions and trade is exclusively empirical. To evaluate
the effects of regulatory barriers in services on international trade as measured by the sectoral
STRI index, we use a gravity model. Although specific to trade flows in goods and commodi-
ties, it has been applied by some authors to services and has been found to be adapted to trade
in services (Head et al., 2009; Walsh, 2008). However, Kox and Nordås (2009) using a gravita-
tional approach, it is possible to examine trade flows in transport and business services, and
their interaction with an overall regulatory indicator. The analysis by Kox and Nordås (2007)
considers financial services and other business services in their model.
Nordås and Rouzet (2016); Nordås (2016) apply the gravity model to analyze the impacts of
the STRI index and the regulatory heterogeneity index on trade in services. Based on a grav-
ity model with aggregate data and the PPML (Pseudo-Maximum Likelihood Estimator) as the
estimation method, they find that the most restrictive countries in the service secto, import
and export significantly fewer services. In addition, the negative impact of restrictions in
services on exports is about twice as large as on imports. The most affected sectors are the
banking, financial and transport sectors, considered as service providers. Examining the reg-
ulatory disparity between countries, they find that regulatory heterogeneity in services has
negative impacts on cross-border trade in services. In this case, countries trade more with
partners with similar regulations. A low heterogeneity index (harmonization or convergence
of standards) is associated with a strong stimulation of trade in services. According to their
study, if the STRIs of importer and exporter countries are low, harmonization stimulates trade
in services, but if the STRIs are high, harmonization attempts to limit this trade.
Another approach that differs from the first is the analysis by Borchert, I et al., 2012. They
use the restrictiveness index developed by theWorld Bank, rather than the OECDmeasure, to
capture the impact of regulatory policies on trade in services.5Through the PPML estimate,
they find that higher levels of STRI discourage investment. Van der Marel and Shepherd’s
5Foreign investment inflows and access to financial services through the provision of bank lending.

34 Chapter 1. The impact of services trade restrictiveness on food trade
(2013) analysis (very similar to the previous one) also finds a negative relationship between
theWorld Bank’s bilateral restrictiveness index and cross-border trade in transport and finan-
cial services. Riker, D (2015) highlights the impact of restrictions on foreign suppliers (import
restrictiveness index) and cross-border trade in services. He also finds negative effects of the
latter on cross-border trade in services. Further, his study simulates the effect that would be
made on U.S. financial services exports if its trading partners eliminated restrictions on these
imports from all countries. He notes that while China and India do not apply any barriers
to market entry, the United States has recorded a significant rise in its financial services ex-
ports, both in dollars ($186.0 million and $42.2 million) and rate change (10.14% and 3.76%).
On the other hand, in a country like Germany, US exports have increased slightly (7.7 million
dollars or 0.23%). Indeed, according to Riker, in the financial services sector, Germany is a
relatively large export market for the United States, after the United Kingdom, but the impact
on trade is lower because the level of restrictiveness in this country is relatively low compared
to countries like China or India.
1.2.2 Service regulation, manufacturing firm performance and ser-vice exports: Firm-level data
Several previous studies estimated the effects of services regulation on manufacturing firm
performance and service exports through firm-level data. The study of Arnold et al. 2011
highlights the link between services sector reforms and the productivity of manufacturing
industries that depend on services inputs. Many aspects of services reform are considered,
namely the presence of foreign suppliers, privatization and the level of competition. The re-
sults, based on firm-level data from the Czech Republic, show a positive relationship between
services sector reforms and the performance of domestic firms in downstream manufacturing
sectors. Reforms that allow foreign entry into service industries appear to be the key channel
through which services liberalization contributes to improving the performance of manufac-
turing sector.
Duggan et al. (2013) investigate the extent to which policy restrictions on foreign direct in-
vestment in the Indonesian services sector affected the performance of manufacturers over
the period 1997-2009. They use firm-level data on manufacturers’ total factor productivity
and the OECD index on regulatory restrictions on foreign direct investment, combined with
data from Indonesia’s input-output tables regarding the intensity with which manufacturing

1.2. Literature review 35
sectors use service inputs. Controlling for firm-level fixed effects and other relevant policy
indicators, they find that policy relaxing FDI policies in the services sector is associated with
improved manufacturing sector performance.
Bas (2014) analyzes the relationship between the reform of energy, telecommunications, and
transport services in India in the mid-1990s and manufacturing firms’ export performance.
The empirical analysis relies on exogenous indicators of the regulation of Indian service sec-
tors and detailed firm-level data for India in 1994-2004 period. It finds that reform of the
upstream services sector has increased the probability of exporting and the export sales share
of downstream manufacturing industries. The results suggest that the effect of services liber-
alization onmanufacturing firms’ export performance is stronger for initially more productive
firms. The analysis of Arnold et al. (2016) similar to the above looks at the link between re-
forms in services and the productivity of manufacturing firms in India. Using panel data on
about 4,000 Indian firms for the period 1993-2005, they find that banking, telecommunications,
insurance, and transportation reforms all had significant positive effects on the productivity
of manufacturing firms. Services reforms benefited both foreign and domestic manufacturing
firms, but the effects on foreign firms tended to be stronger.
The study by Crozet et al. (2016) different from those above examines the impacts of domestic
services regulations on values exported and the probability of export by French professional
services firms over three years of observations (1999, 2003, 2007). Their analysis combines
the OECD Domestic Regulation Index (Non-Manufacturing Regulations) and French data on
firm-level bilateral exports of professional services. Their results show that French firms are
less likely to export to highly regulated markets. Controlling for the export probability, the
values exported decrease with the level of regulation in the destination market. These results
hold when we focus on importing countries from the European Union, where French firms do
not face discriminatory barriers. The average ad valorem tariff equivalent of domestic regu-
lation was 60% in 2007.
Ariu et al. (2018) explore the interaction between international trade products and restrictions
on services. They consider data from Belgian firms from 1995 to 2005, PMR index (Product
Market Regulation) data and that on customs duties on goods and services. The results sug-
gest that a joint good-service liberalization would boost Belgian imports from the US by 22%
for goods and 11% for services. Assuming the same increase for the whole of the EU would

36 Chapter 1. The impact of services trade restrictiveness on food trade
imply an increase in imports of respectively, 60 and 24 billion dollars. An important element
in their results is that the gains from liberalizing both goods and services together are higher
than the sum of liberalizing goods and services separately. Ariu et al. (2020) investigate the
importance of services in the exports of Belgian manufacturing firms from 1997 to 2005. The
analysis is conducted on firms that export goods and those that export both goods and services
(bi-exporters). The results show that the provision of services accounts for up to 22.4% of the
manufacturing exports of bi-exporters and 11.8% of overall goods exports from Belgium.
This analysis shows that restrictions in services have negative impacts on trade flows. Re-
strictions in banking, transportation, and logistics have a significant impact on trade flows.
The divergence of regulations between countries has a significant negative impact on trade.
Our work is a extension of previous studies that have addressed the issue of standards in
international trade.
1.3 STRIs and food exports : Augmented gravity models
To conduct an empirical analysis of the effects of restrictive measures on trade flows, we use
the gravitymodel developed byAnderson (1979), which has established itself as theworkhorse
framework in international trade. The general formulation of the gravity equation is as fol-
lows:
Xij,t=Gtπi,tΦj,t
Tij,t∀i, j
Xij,t is the value of exports from country i to country j at time t, Tij,t denotes all bilateral
frictions between i and j, which may include transportation costs, trade policies, etc.; πi,t and
Φj,t capture all possible exporter and importer characteristics, respectively, e.g. country size
andmultilateral resistance terms of Anderson and VanWincoop (2003). Finally,Gt is a gravity
constant whose structural interpretation is as a function of the value of output in the world
at time t.
To estimate this equation, we need to linearize it. Using the logarithm of each variable in the
model, the equation becomes:
LnXij,t = a0 + a1lnYi,t + a2lnYj,t + a3lntij,t + a4lnΠi + a5lnPj + εij,t (1.1)

1.3. STRIs and food exports : Augmented gravity models 37
Where a0 is the constant, a3= 1- σ, Yi,t and Yj,t the GDP of exporting and importing countries
at time t, tij,t bilateral costs between our pairs of countries, Πi terms measuring barriers to
trade between each country and the rest of the world, Pj the price index of the importing
country, εij,t the error term.
Using the model of Anderson and Van Wincoop (2003); Anderson and Van Wincoop (2004),
our baseline regression equation is the following:
Xkij,t = exp[β0,k+β1Zij,t+β2tij+β3STRIsi,t+β4STRIsj,t+µi,t+γj,t+αt+αs]+εijk,t (1.2)
Xkij,t denotes the nominal exports of food commodities in sector (k) from exporter (i) to im-
porter (j) in year (t). We use nominal exports and not those deflated by U.S. aggregate price
indices to avoid bias problems. Since there are global trends in inflation rates, the inclusion
of this term probably creates biases via spurious correlations (Baldwin and Taglioni, 2006).
Zij,t is a time-variant vector of bilateral variables. We have a binary variable that equals 1 if
i and j share the same regional trade agreement (RTA) and 0 otherwise, and average custom
tariffs imposed by the importer country on the exporter country on food products in year t
(ln(1 + tariffji,t)). tij is the vector of the time-invariant bilateral control variables: bilat-
eral distance (Ln dist), common language (lang), common border (border).6 STRIsi,t and
STRIsj,t are the STRI indices of respectively the exporter and the importer on a scale of 0 to
1, they represent our explanatory variables of interest and capture the level of restrictions in
exporter and importer countries in the service sector s. As shown in Table 1.3 and Figure
1.4 show, we use restrictiveness indices in four service sectors (transport, logistics, distribu-
tion, finance and other business sectors) considered as crucial inputs in the food industry, and
the restrictions are still significant. The logistics sector includes cargo handling, storage and
warehouse, freight forwarding, and customs brokerage logistics. The transport sector com-
prises air, maritime, road and rail freight transport. The financial and other business sector
covers accounting, banking and insurance. The distribution sector covers general wholesale
and retail sales of consumer goods, and e-commerce. µit and γjt are other variables that vary
respectively according to exporter and importer country in year, αt is a year fixed effect (cap-
turing the global macroeconomic cycle), αs reflects the sector fixed effects and εijk,t is an error
term. β3 and β4 are our coefficients of interest and are negative according to the literature.
6Dummy variables equal 1 if countries share a common border and common language and 0 otherwise.

38 Chapter 1. The impact of services trade restrictiveness on food trade
Figure 1.4: OECD countries’ sectoral STRIs in 2017
Logistics ca
rgo-
hand
ling
Logistics stor
age
and
war
ehou
se
Logistics fre
ight
forw
arding
Logistics cu
stom
s br
oker
age
Accou
nting
Archite
ctur
e
Enginee
ring
Lega
l
Mot
ion
pictur
es
Broad
casting
Sound
reco
rding
Telec
om
Air tra
nspo
rt
Mar
itim
e tra
nspo
rt
Roa
d fre
ight
tran
spor
t
Rail fre
ight
tran
spor
t
Cou
rier
Distri
butio
n
Com
mer
cial b
anking
Insu
ranc
e
Com
pute
r
Con
stru
ction
0.1
0.2
0.3
0.4
0.5
0.6
0.7
0.8
0.9
1
ST
RI
Source: OECD STRI database
The inclusion of exporter and importer STRIs in the equation is relevant because restric-
tions in both countries have a significant impact on trade. Many restrictions in the exporter
country’s services have negative effects on production and trade through network services
(transports, logistics, etc.). Once a food product arrives at the frontier of the importer coun-
try, logistics services are required, particularly storage, warehousing and customs services,
as well as transport for the delivery of the product to distribution services. Also, we cannot
include both individual STRIs and country time fixed effects because the latter absorbs the
former and we cannot perceive the effects of the STRI. We therefore include an interaction
term between the STRI of the two countries as follows:
Xkij,t = exp[β0,k + β1Zij,t + β2tij + β3STRIsij,t + µit,k + γjt,k] + εijk,t (1.3)
With STRIsij,t= STRIGDPservi/GDPserv(i+j)
i,st ∗ STRIGDPservj/GDPserv(i+j)
j,st . Where GDPservi
and GDPservj are the value added of services as a % of GDP in exporter and importer coun-
tries. The bilateral variable STRIsij,t is the geometric average of the importer’s index and
the exporter’s index, weighted by the respective shares of their services in the value added of
services in joint (% of GDP). µit,k and γjt,k are dummy variables representing the exporter and

1.4. Data sources 39
importer country’s sector time fixed effects. The variable of interest STRIsij,t has negative
effects on food exports, i.e. restrictions in services in both countries have limiting effects on
trade.
Moreover, the importer and exporter country’s STRI have the same impact on trade, i.e. lim-
iting imports of services. Considering the bilateral STRI in equation (1.3) can be ambiguous.
The main drawback of such an approach is that it assumes that the impacts of the importer’s
and exporter’s regulations are symmetrical given the added value of their services (Nordås
and Rouzet, 2016). In addition, the two countries may have different restrictions on the ser-
vices sector (one more restrictive and the other less restrictive or vice-versa) rendering the
results difficult to interpret. To address this issue, we estimate country-specific STRIs with
international and intra-national trade as follows:
Xij,t = exp[β0 + β1Zij,t + β2tij + β3STRIsi,t−1 ∗ INTLij+
β4STRIsj,t−1 ∗ INTLij + µit + γjt + πii] + εij,t(1.4)
WhereXij,t denotes nominal food trade flows, which include international and intra-national
trade (Xii,t) in year t. INTLij is an "international trade" dummy variable. It takes a value
of one for international trade between countries i and j ̸= i, and zero otherwise (i.e. when
the exporer and the importer are the same country, therefore trade is intra-national). The
interaction terms STRIsi,t−1 ∗ INTLij and STRIsj,t−1 ∗ INTLij represent respectively the
effect of changes in the STRI score of exporter i and importer j in sector s on the estimated
flow of food exports from country i to country j relative to the consumption of domestically
sourced food commodities in country i and j and πii represents the intra-national trade fixed
effects.
1.4 Data sources
As mentioned above, our paper attempts to analyze the effects of restrictive measures in ser-
vices on food trade. We use panel data on trade in food products between 36 OECD countries
from 2014 to 2018.7
Our dependent variable is pooled bilateral food trade between OECD countries. We use infor-
mation about bilateral food exports (annual frequency) from the United Nations Conference
7The data for 2014-2018 are based on the implementation and evolution of the STRI index.

40 Chapter 1. The impact of services trade restrictiveness on food trade
on Trade and Development database (UNCTADstat), which uses the Classification Standard
International Trade (SITC Rev.3).8The food industry has four sectors (SITC 0+1+22+4): food
and live animals, beverages and tobacco, oil seeds and oleaginous fruits, animal and vegetable
oils, fats and waxes.
It is difficult to have data on intra-national food trade between 2014 and 2018. We therefore
compute intra-national trade as the difference between gross production value data and total
exports. Gross production data by food industry are extracted from the OECD STAN indus-
trial database (Structural Analysis Database)9and total exports from the UNCTAD database.
However, the sectoral classification of the food industry in the STAN (ISIC Rev.4, less aggre-
gated) differs from the UNCTAD classification (SITC Rev.3, more aggregated). The analysis
of international and intra-national trade will therefore be done on the total aggregated food
trade (SITC 0+1+22+4).
As independent variables, we have an index that captures the level of restrictions in these
service sectors (STRI). The STRI Index provides a database of regulations affecting trade in
22 service sectors in 50 countries.10
For each sector the database covers 5 policy areas: re-
strictions on the entry of foreigners, restrictions on the movement of people, other discrimi-
natory measures, barriers to competition and regulatory transparency. The qualitative infor-
mation on these 5 areas has been converted into quantitative indices by sector ranging from
0 to 1 (where 0 corresponds to no restrictions and 1 to a sector completely closed to service
providers) (Geloso Grosso et al., 2014). Data are available from the OECD STRI database.11The
data on bilateral tariffs on food products are extracted from World Integrated Trade Solution
Trade Stats (WITS) of the World Bank. Bilateral resistance variables such as the bilateral dis-
tance between the two capitals, common border, and language, are from the Centre d’ Etudes
Prospectives et d’ Informations Internationales (CEPII), with binary variables that materialize
regional trade agreements extracted from the WTO (Regional Trade Agreements Information
8Data can be accessed at: https://unctadstat.unctad.org/wds/TableViewer/
dimView.aspx.9The STAN database provides data on industrial performance in different countries. It includes annual mea-
sures of production, labor input and investment.
1036 OECD countries plus Brazil, People’s Republic of China, Colombia, Costa Rica, India, Indonesia, Malaysia,
Russia, South Africa, Thailand and Singapore.
11https://stats.oecd.org/Index.aspx?DataSetCode=STRI.

1.5. Econometric issues 41
System, RTA-IS).12
1.5 Econometric issues
Several questions related to the estimation of the standard gravity equation are considered in
our study. Recently, researchers have identified eight problems inherent to gravitational mod-
els. The most important in this study are terms of multilateral trade resistance, gravity with
disaggregated data, zero trade flows, heteroskedasticity of trade data, bilateral trade costs, ad-
justment to trade policy changes, endogeneity of trade policy and non-discriminatory trade
policy (Yotov et al., 2016; Piermartini and Yotov, 2016).
This section reviews the main problems and highlights relevant solutions that have been pro-
posed in the literature to address these challenges.
1.5.1 Multilateral resistances and disaggregated trade data
Multilateral resistance terms (Πi andPj) are theoretical constructs and are not directly observ-
able. A gravity estimation without proper control of its resistance terms leads to an omitted
variable bias ("Gold Medal Mistake", Baldwin and Taglioni, 2006).
The first solution is provided by Anderson and van Wincoop (2003) who use custom non-
linear least squares iterative programming to account for multilateral resistances in a static
framework. They first estimate trade cost parameters without controlling for multilateral
resistances. Next, they use the estimated trade costs to construct a first set of multilateral
resistances. Finally, they re-estimate the gravity model to obtain a new set of trade costs...
until convergence is achieved. The second solution is an approximation of multilateral resis-
tance terms by remoteness indices constructed as a function of bilateral distance and gross
domestic product (GDP) (Baier and Bergstrand, 2009). Head and Mayer (2014) criticize such
reduced-form approaches as they bear little resemblance to the theoretical counterpart of the
multilateral terms. For some authors the multilateral resistance terms can be controlled using
appropriate ratios based on the structural gravity equation (Head et al., 2010 and Novy, 2013).
The recommended approach is that of Hummels (2001) and Feenstra (2016). They suggest
the use of directional (exporter and importer) fixed effects in cross-sectional estimates. More
12We use trade agreements on both goods and services, as we study the effects of restrictions in services on
food products.

42 Chapter 1. The impact of services trade restrictiveness on food trade
recently, Olivero and Yotov (2012) demonstrated that multilateral resistance terms should be
accounted for by export-time and import-time fixed effects in a dynamic gravity estimation
framework with panel data.
In addition to accounting for unobservable multilateral resistance terms, the exporter and
importer time fixed effects will also absorb the size variables (GDP, population, etc.) of the
structural gravity model as well as all other observable and unobservable country-specific
characteristics which vary across these dimensions, including various national policies, in-
stitutions, and exchange rates. Our dependent variable is sectoral. Taking into account the
terms of resistances must be sectoral in order to deal with the problems of gravity estimation
with disaggregated data (Larch and Yotov, 2016; Yotov et al., 2016). Our exporter and importer
time fixed effects become country time sector fixed effects.
1.5.2 Zero trade flows and heteroskedasticity of trade data
The estimation of the gravity equation is conducted with an OLS estimator. However, the
results of this estimator may constitute a bias in the presence of "Zero trade" in the presence
of heteroskedasticity, and the OLS estimation may not be consistent. Indeed, this estima-
tor, which does not include countries not trading with each other, compromises our results,
because zero trade reveals crucial information (lack of information, high transport costs, land-
locked countries), so omitting it can constitute a considerable bias in our study.13
Problems
with zeros become more pronounced when the trade data are disaggregated. This is the case
in our paper.
Futhermore, the Tobit model proposed by Martin and Pham (2008) as an econometric solution
to the presence of zero trade causes a disconnect between estimation and theory; Helpman
et al. (2008) developed a two-stage estimation procedure that focuses both on the extensive
estimation (export decision from i to j) and the intensive margins (export volume) of trade.
While this approach offers a better understanding of the determinants of trade flows, it pro-
vides biased estimates in the presence of heteroskedasticity in the trade data (Santos Silva and
Tenreyro, 2013). To avoid biased estimation results, we use the Pseudo-Maximum Likelihood
estimator (PPML) suggested by Santos Silva and Tenreyro (2006). The PPML is used in our
case in order to deal with the constraints of zero trade between States, and also estimates
13Indeed, zero commerce is associated with high bilateral fixed costs of trade.

1.5. Econometric issues 43
the non-linear shape of the gravity model in the presence of heteroskedasticity. However, an
important assumption of the PPML estimator is equidispersion, which means that the condi-
tional variance of the dependent variable and its conditional mean are equal. PPML estimation
can be assessed by solving the following condition:∑p
[Xp − exp(Zpβ)] = 0 (1.5)
Where p is the country pair, Xpis unilateral trade (i.e. exports or imports) between country
pairs in non-logarithmic levels andZpis the complete vector of the gravity equation as defined
above.
1.5.3 Bilateral trade costs and adjustment to trade policy changes
The standard gravity model requires the introduction of bilateral trade costs, (1 − α)lntij;t.
Moreover, these must be replaced by series of observable variables in the gravity estimation
(bilateral distance, common border, common language, regional trade agreements, bilateral
tariffs).
The implementation of trade policies does not have an instantaneous effect on trade. Indeed,
the establishment of rules in a specific sector does not have an immediate effect; there is an
adaptation period before a measure comes into force. Trefler (2004) criticizes trade estimates
pooled over consecutive years. As Cheng and Wall (2005) point out, the estimation of fixed
effects applied to pooled data over consecutive years is sometimes criticized on the grounds
that dependent and independent variables cannot fully adjust in a single year’s time.
In order to account for this issue, some authors have used panel data with intervals instead of
data pooled over consecutive years: Trefler (2004) uses 3-year intervals, Anderson and Yotov
(2016) use 4-year intervals, and Baier and Bergstrand (2007) use 5-year intervals. Through
empirical studies, Olivero and Yotov (2012) show that gravity estimates obtained with 3-year
and 5-year interval trade data are very similar, while estimates performed with panel pooled
over consecutive years produce suspicious estimates of trade cost elasticity parameters. Our
data are spread over 5 years and an estimate over 3-year and 5-year intervals is difficult to
perform, we will conduct estimates with two-year intervals.

44 Chapter 1. The impact of services trade restrictiveness on food trade
1.5.4 Endogeneity of trade policy
The gravity specification stipulates that trade policy variables RTA and bilateral tariffs are en-
dogenous, because it is possible that trade policy may be correlated with unobservable cross-
sectional trade costs. For instance, trade policy variables may suffer from "reverse causality",
because, all else equal, a given country is more likely to liberalize its trade with another coun-
try that is already a significant trade partner.
The estimation of the gravity model without taking into account the endogeneity of the RTA
produces biased estimated coefficients. As a result, the RTA dummy variables are poten-
tially correlated with the error term. The first authors to attempt to consider the endogeneity
of trade policy variables in cross-sectional analysis used the instrumental variable approach
(Trefler, 1993 and Lee and Swagel, 1997). However, Magee (2003) finds that the instrumental
variable approach is not efficient in addressing the issue of endogeneity bias of the RTA due to
its binary form. The appropriate method to control for the potential endogeneity issue of RTA
is to estimate the gravity model including country pair fixed effects in panel data (Baier and
Bergstrand, 2007). Indeed, these country pair fixed effects eliminate or account for, respec-
tively, unobservable links between the endogenous trade policy covariate and the error term
in the gravity regressions. Moreover, they will absorb all bilateral time-invariant covariates
(e.g. bilateral distance, common language, common border, etc.), but will have the advantage
of accounting for any unobservable time-invariant component of trade costs (Egger and Nigai,
2015; Agnosteva et al., 2014).14
1.5.5 Unilateral and non-discriminatory trade policy
Non-discriminatory and unilateral trade policies such as export subsidies, most-favored na-
tion (MFN) tariffs or restrictions in services are important and their estimation of trade flows
using the gravity equation remains difficult. Indeed, the issue with non-discriminatory trade
policy covariates is that they are exporter-and/or importer-specific and therefore they will be
absorbed, respectively, by the exporter-time and by the importer-time fixed effects that need
to be used to control formultilateral resistance in the structural gravitymodel. More generally,
in the presence of importer and exporter fixed effects, the gravity model can no longer esti-
14They show that country pair fixed effects are a better measure of bilateral trade costs than the standard set
of gravity variables.

1.6. Empirical results and discussion 45
mate the impact of any variable (i) affecting exporters’ propensity to export to all destinations
(e.g. being an island); (ii) affecting imports without regard to origin (e.g. country-level aver-
age applied tariff); and (iii) representing sums, averages, and differences of country-specific
variables (Head and Mayer, 2014).
We use the approach proposed by Heid et al. (2017) to estimate the effects of STRI on trade
flows. It consists in estimating the structural gravity model with international and intra-
national trade flows by capitalizing on the fact that while non-discriminatory trade policies
are country-specific, they do not apply to intra-national trade. As a result, the inclusion of
intra-national trade implies that country-specific STRIs variables become bilateral in nature,
making their identification and estimation possible.
As noted by Heid et al. (2017), the estimates of non-discriminatory trade policies in the struc-
tural gravity model are less likely to be subject to endogeneity concerns as compared to their
bilateral counterparts for two reasons. First, it is unlikely that a non discriminatory trade pol-
icy will be influenced by any bilateral trade flow. Second, the directional fixed effects in the
structural gravity model will absorb much of the unobserved correlation between the non-
discriminatory trade policy covariates and the gravity error term. This approach resolves the
"distance puzzle" in trade, by measuring the effects of distance on international trade relative
to the effects of distance on internal trade (Yotov, 2012)
1.6 Empirical results and discussion
We estimate the effects of restrictions in four service sectors on food trade between OECD
countries from 2014 to 2018. Tables 1.4 and 1.5 present the baseline gravity model results for
food trade using sectoral bilateral STRIs (equation 3). Table 1.4 presents the results on pooled
trade in food goods (columns 1 to 6). In the other cases, we have the results on disaggregated
food trade according to the SITC classification. We use the OLS as the estimation method
and, to account for heteroskedasticity and zero trade, we apply the PPML estimator. We also
include the importer and exporter sector fixed effects to control for structural multilateral re-
sistances and omitted variables.
In the different estimates, we find the following effects: standard gravity model variables such
as distance, common language, and common border have the expected signs and magnitudes

46 Chapter 1. The impact of services trade restrictiveness on food trade
and are statistically significant. our dummy variable, representing the regional trade agree-
ments, has positive and significant impacts on food trade among OECD countries. Tariffs on
food products imposed by the importer country on the exporter country have significant neg-
ative effects on food exports (Niven, W et al., 2012).
In terms of variables of main interest- Service Trade Restrictiveness Indices (STRI)- we find
that restrictions in both countries have a significant negative impact on food trade. The results
suggest that more barriers in services, particularly in logistics, financial and other business
sectors, lead to a reduction in the value of overall food exports. However, restrictions in the
distribution sector have positive effects on exports. The resulting coefficients range between
-7.3 for logistics services, -6.6 for financial and other business sectors and 8.75 for the distri-
bution sector. The transport sector has non-significant effects on trade (Column 6 of Table
1.4).15
The coefficients are significant at 1 percent level. PPML and OLS estimates give the
same effects.
15PPML estimation results with country time and sector fixed effects. Similar results with Column 5.

1.6.Em
piricalresultsand
discussion47
Table 1.4: The impacts of bilateral STRIs on cross-border exports of food commodities
Specification OLS-PPML EstimateDependant variable All Food Products (Pooled) Disaggregated Food Items
Food and Live Animal Beverage and TobaccoSITC 0+1+22+4 SITC 0 SITC 1
Log-linear OLS Poisson-PML Poisson-PML Poisson-PMLModel (1) (2) (3) (4) (5) (6) (7) (8) (9) (10)
STRIijt,Logistics -2.2040∗∗∗
-3.6592∗∗∗
-3.5890∗∗∗
1.1673 -7.6906∗∗∗
-7.3176∗∗∗
1.0270 -8.7171∗∗∗
0.3956 -3.9922∗∗
(0.8417) (1.0686) (0.8872) (1.0627) (1.8916) (1.5895) (1.2753) (1.9182) (1.7309) (1.8484)
STRIijt,F inancial−Business -3.7262∗∗∗
-7.4321∗∗∗
-8.2251∗∗∗
-5.4759∗∗∗
-6.8823∗∗∗
-6.6244∗∗∗
-5.7850∗∗∗
-5.5933∗∗
-0.2720 -9.2144∗∗
(1.0393) (1.6834) (1.4040) (1.4605) (2.3890) (2.0004) (1.7260) (2.4400) (1.8983) (3.8924)
STRIijt,T ransports -2.6893∗∗∗
0.1284 0.3055 0.3198 1.9993 2.1451 0.1760 1.0772 0.2431 4.5805
(0.9855) (1.0304) (0.8870) (1.3027) (2.3698) (2.1118) (1.5091) (2.4268) (2.3164) (3.6618)
STRIijt,Distribution 0.6063 3.3974∗∗∗
3.7232∗∗∗
-0.1561 9.7833∗∗∗
8.7531∗∗∗
-0.4111 9.8613∗∗∗
-1.5779 3.7368
(1.1014) (1.1616) (0.9812) (1.0055) (2.0444) (1.7437) (1.2266) (1.9847) (1.4468) (2.4762)
RTAij,t 0.8347∗∗∗
0.5558∗∗∗
0.5546∗∗∗
0.7477∗∗∗
0.3806∗∗∗
0.4912∗∗∗
1.0001∗∗∗
0.6635∗∗∗
-0.0452 -0.0973
(0.1087) (0.1210) (0.1021) (0.1755) (0.1156) (0.1059) (0.2186) (0.1245) (0.2939) (0.1771)
Ln(1 + tariffji,t) -0.2838∗∗∗
-0.3402∗∗∗
-0.3242∗∗∗
-0.1216∗∗∗
-0.2962∗∗∗
-0.3299∗∗∗
-0.0970∗
-0.3430∗∗∗
-0.3427∗∗∗
-0.2363∗∗
(0.0335) (0.0431) (0.0354) (0.0444) (0.0542) (0.0470) (0.0522) (0.0517) (0.0601) (0.1004)
Ln distij -1.4801∗∗∗
-2.6728∗∗∗
-2.7729∗∗∗
-1.0980∗∗∗
-1.8028∗∗∗
-1.8199∗∗∗
-1.0622∗∗∗
-1.8171∗∗∗
-1.1017∗∗∗
-1.6341∗∗∗
(0.0988) (0.1621) (0.1517) (0.1454) (0.1036) (0.0936) (0.1736) (0.1091) (0.2211) (0.1787)
langij 0.2324 0.3663∗∗∗
0.3947∗∗∗
0.0175 0.2071∗∗
0.2379∗∗∗
0.0107 0.2145∗∗
0.3403 0.5555∗∗∗
(0.1415) (0.1386) (0.1076) (0.1519) (0.1049) (0.0867) (0.1763) (0.1038) (0.2484) (0.1127)
borderij 1.8042∗∗∗
1.4345∗∗∗
1.4196∗∗∗
0.8916∗∗∗
0.7335∗∗∗
0.7499∗∗∗
0.9583∗∗∗
0.8148∗∗∗
0.3435 0.1775
(0.1207) (0.1402) (0.1355) (0.1579) (0.0876) (0.0810) (0.1842) (0.0916) (0.2640) (0.1529)
Exporter-Importer Controls Yes No No Yes No No Yes No Yes No
Time-FE Yes No No Yes No No Yes No Yes No
Sector-FE Yes Yes No Yes Yes No No No No No
Exporter-time-FE No Yes No No Yes No No Yes No Yes
Importer-time-FE No Yes No No Yes No No Yes No Yes
Exporter-time-sector-FE No No Yes No No Yes No No No No
Importer-time-sector-FE No No Yes No No Yes No No No No
R20.563 0.670 0.753 0.686 0.922 0.9396 0.688 0.943 0.465 0.857
Observations 21314 21314 21314 24867 24867 24763 6217 6217 6217 6217
Chi− 2 2321.34∗∗∗
Notes: The dependent variable is nominal bilateral food product from i to j at to t in sector k as in equation (1.3). Regression 6 is performed using the ppmlhdfe
STATA command written by Correia, Guimarães, Zylkin (2019). It is a Pseudo-Maximal Likelihood Poisson estimator (PPML) with multi-way fixed effects.
Exporter-importer controls are the GDP of both countries. Standard errors are reported in parentheses and clustered by country-pair level. *, **, *** denote
significance at the 10% 5% and 1% level respectively.

48Chapter
1.The
impactof
servicestrade
restrictivenesson
foodtrade
Table 1.5: The impacts of bilateral STRIs on cross-border exports of food commodities: Continued
Specification Poisson-PML EstimateDependant variable Disaggregated Food Products: Continued
Animal and Vegetable Oil Oils Seeds and Oleaginous Fruits Perissable Products Agricultural Raw MaterialsSITC 4 SITC 22 SIT 01+02+03 SITC 2-22-27-28
Model (1) (2) (3) (4) (5) (6) (7) (8)
STRIijt,Logistics 5.5133∗
-9.1559∗∗
1.7973 1.8751 -2.0541 -5.8127∗∗∗
-0.6668 -4.5768∗∗
(2.8967) (4.4723) (3.2355) (5.3077) (1.6099) (1.7456) (1.9363) (1.7919)
STRIijt,F inancial−Business -4.9304 -11.8046∗∗
-22.3322∗∗∗
-9.6235∗
-2.7303 -7.7929∗∗∗
-7.1694∗∗∗
-0.7987
(4.0123) (5.6818) (5.1395) (5.4747) (1.9420) (2.9628) (2.3205) (2.3679)
STRIijt,T ransports -0.8465 10.1418∗
3.1490 8.0895 -2.8991 2.3046 4.5795∗∗
1.2332
(3.0821) (5.7410) (5.0761) (7.3048) (1.8701) (3.0008) (1.9481) (2.5449)
STRIijt,Distribution -1.5097 4.9427 10.9460∗∗∗
3.0329 -2.3521 10.8735∗∗∗
0.9511 -1.6446
(2.4359) (4.4101) (2.6604) (6.1658) (1.6748) (2.3696) (1.5969) (3.1360)
RTAij,t 0.3047 -0.4210 -0.0584 -0.4036 1.0733∗∗∗
0.9627∗∗∗
0.4598∗∗
0.3697∗∗∗
(0.3820) (0.2625) (0.3233) (0.3388) (0.2534) (0.1753) (0.2117) (0.1432)
Ln(1 + tariffji,t) -0.2305∗
-0.2962∗∗∗
0.3657∗∗∗
-0.5692∗∗
-0.0812 -0.4023∗∗∗
0.0204 -0.3178∗∗∗
(0.1203) (0.1008) (0.0977) (0.2458) (0.0666) (0.0771) (0.0612) (0.0785)
Ln distij -1.8587∗∗∗
-2.7756∗∗∗
-0.9175∗∗
-0.9930∗∗
-0.7795∗∗∗
-1.4888∗∗∗
-1.3007∗∗∗
-1.4064∗∗∗
(0.2992) (0.3036) (0.3601) (0.4222) (0.1823) (0.1479) (0.2275) (0.1469)
langij -0.2381 -0.2388 -0.7881∗∗∗
-0.3022 0.0869 0.4280∗∗∗
-0.0483 -0.1192
(0.3161) (0.1850) (0.2980) (0.3665) (0.1879) (0.1182) (0.2260) (0.1830)
borderij 0.8501∗∗∗
0.8630∗∗∗
1.6517∗∗∗
1.2367∗∗∗
0.8593∗∗∗
0.7475∗∗∗
0.9749∗∗∗
1.0363∗∗∗
(0.2898) (0.1843) (0.3843) (0.2165) (0.1834) (0.1021) (0.2422) (0.1035)
Exporter-Importer Controls Yes No Yes No Yes No Yes No
Time-FE Yes No Yes No Yes No Yes No
Exporter-time-FE No Yes No Yes No Yes No Yes
Importer-time-FE No Yes No Yes No Yes No Yes
R20.395 0.875 0.381 0.782 0.553 0.878 0.637 0.959
Observations 6217 6217 6216 6112 6217 6217 6217 6217
Notes: The dependent variable is nominal bilateral food product from i to j at to t in sector k as in equation (1.3). Exporter-importer controls are the GDP
of both countries. Standard errors are reported in parentheses and clustered by country-pair level. *, **, *** denote significance at the 10% 5% and 1% level
respectively.

1.6. Empirical results and discussion 49
Moreover, these results are difficult to interpret because the effects of STRI in the two coun-
tries are assumed to be symmetrical. The marginal impact is only relevant when the combined
STRIs of the two trading parties increase or decrease, which may be a wrong assumption. This
is mitigated by estimating equation (1.4), i.e. the impacts of country-specific STRIs on total
food trade, including intra-national trade and PPML as an estimator (Table 1.6). Both coun-
tries may introduce more restrictions in services if they face more competition. This will
result in the reverse causality problem between our interest variables and trade. To solve this
problem, we use the one-year lagg of the STRI (STRIt−1). The logistics and transport sectors
are considered as one sector to avoid the correlation between these variables, which emerge
as two quite similar sectors.16
Columns (1) and (2) present results over the entire sample to
identify the short-term effects of STRIs and (3) and (4) over two-year intervals to address the
issue of adjustment to trade policy changes. Columns (1) and (3) include intra-national fixed
effects to control for country-specific intra-national trade costs and "home bias" effects and
any other country-specific time-invariant characteristics that may drive a wedge between in-
ternal and international trade. Columns (2) and (4) include bilateral country-pair fixed effects
to control for the endogeneity of trade policy and time-invariant bilateral trade costs (Baier
and Bergstrand, 2007; Egger and Nigai, 2015).
The results show different effects of country-specific STRIs on food trade and have the ex-
pected signs and effects when including the country-pair fixed effects. The first result which
is novel suggests that restrictions in logistics and transportation sectors have negative im-
pacts on food exports (negative and significant coefficient of the exporter country’s STRI).
A higher STRI in logistics and transport services is associated with significantly lower food
exports with a negative and significant coefficient on food exports. The result interpreted in
terms of liberalization shows that a 0.05 point reduction of the STRI in these services in a
country would increase its food exports by 36 percent in the short-run.17The strong negative
relationship between the STRI in these sectors and food exports could be explained by the fact
that the STRI captures barriers to competition and also that the lack of foreign competition
in the transport and logistics sectors. The absence of foreign competition makes the prices of
16The logistics sector includes the transport of goods, but also relate to storage, handling, packaging and
inventory.
17The percentage change in exports and imports from a 0.05 points reduction in the STRI index in services sec-
tor is calculated as follows: [exp(-0.05*coefficient)-1]*100= [exp(-0.05*(-6.1449))-1]*100=35.96%. The calculation
is based on the regression data described in Table 1.6 column 1.

50 Chapter 1. The impact of services trade restrictiveness on food trade
transport and logistics services high and therefore export prices. Local food companies have
less incentive to expand beyond local markets because it is more expensive to produce and
sell abroad. Restrictions exclude small exporters from foreign markets.

1.6. Empirical results and discussion 51
Table 1.6: The effects of country specific STRIs on export values
Specification Poisson-PML EstimateDependant variable Total Food Exports
SITC 0+1+22+4(Xij,t +Xii,t)
Consecutive Panel Intervals2014-2018 2014, 2016, 2018
Country-FE ENDG Country-FE ENDG(1) (2) (3) (4)
STRIi,t−1 ∗ INTLij -6.1449∗∗
-8.5200∗∗∗
-4.5252 -9.8905∗∗
Logistics− Transports (2.5107) (1.5201) (2.9205) (3.8505)
STRIi,t−1 ∗ INTLij 2.4745 2.2301 0.3865 0.0066
Financial −Business (2.3869) (2.1168) (3.7695) (6.0382)
STRIi,t−1 ∗ INTLij 3.8415∗∗∗
4.1779∗∗∗
6.5643∗∗∗
6.9934∗∗∗
Distribution (0.6415) (0.4953) (0.8792) (0.8440)
STRIj,t−1 ∗ INTLij -4.3400∗∗∗
-3.1463∗∗∗
-7.2997∗∗∗
-5.4550∗∗∗
Financial −Business (0.6835) (0.6589) (1.0499) (0.6875)
STRIj,t−1 ∗ INTLij 1.2727 1.2151∗
1.1318 0.6990
Logistics− Transports (0.8281) (0.7306) (1.0153) (0.7720)
STRIj,t−1 ∗ INTLij 10.2138∗∗∗
8.8493∗∗∗
14.8791∗∗∗
14.0966∗∗∗
Distribution (1.1053) (1.0532) (1.5875) (1.3761)
RTAij,t 0.6449∗∗∗
-0.0938 0.6093∗∗∗
0.0083
(0.1363) (0.0576) (0.1324) (0.1916)
Ln(1 + tariffji,t) -0.4544∗∗∗
-0.1384 -0.4941∗∗∗
-0.7562∗∗
(0.0596) (0.0895) (0.0622) (0.3838)
langij 0.2139∗∗
0.2325∗∗
(0.1048) (0.1068)
borderij 0.9990∗∗∗
1.0034∗∗∗
(0.0944) (0.0963)
Ln distanceij -1.0400∗∗∗
-1.0215∗∗∗
(0.1044) (0.1138)
Country-pair-FE No Yes No Yes
Intra-national
fixed effects Yes No Yes No
R21.00 1.00 1.00 1.00
Observations 6328 6324 3763 3759
Chi-2 1531.40∗∗∗
303.29∗∗∗
1405.13∗∗∗
393.71∗∗∗
Notes: The dependent variable is aggregated bilateral trade flows of food products (Xij,t), including domestic
trade (Xii,t). Constructed domestic trade flows are set to missing if negative. All regression are performed using
the ppmlhdfe STATA command written by Correia, Guimarães, Zylkin (2019). All regressions include exporter-
year and importer-year fixed. In addition, columns (2) and (4) also add pair fixed effects. Columns (1) and (3)
include intra-national fixed effects. Standard errors are reported in parentheses and clustered by country-pair
level. *, **, *** denote significance at the 10%, 5% and 1% level respectively.
52 Chapter 1. The impact of services trade restrictiveness on food trade
The second finding is that the estimated impact on food trade of the importer’s STRI in the
financial and other business sectors is negative and significant (significant at 1 percent level
in the different specifications). Indeed, countries that impose restrictive regulations in these
sectors discourage cross-border imports of food products. Deregulation policies leading to a
0.05 point reduction of the STRI in these services would increase a country’s food imports
by 24 percent in the short-run (column 1 of Table 1.6). A high STRI is associated with lower
competition in the market, so incumbent financial institutions raise the interest rates, the cost
of accounting and auditing services, and insurance premiums in order to increase their profit
margins (Rouzet and Spinelli, 2016). The consequence would be a reduction in credit and
insurance to finance trade and household consumption expenditures. The impact is negative
and significant on food imports as they are more important in bilateral trade among OECD
countries (see Table 1.7).
Table 1.7: OECD bilateral food trade in thousands of US dollars
2014 2015 2016 2017
Importations 6.57E+08 5.97E+08 6.09E+08 6.55E+08
Exportations 6.43E+08 5.75E+08 5.87E+08 6.33E+08
Source: Source: UNCTAD database
The last result, which is striking and counterintuitive, suggests that the restrictions in the
distribution sector have significant and positive effects on both exports and imports of food
commodities (positive and significant coefficient of the exporter and importer country’s STRI
at 1 percent level in the different specifications). A 0.05 point increase in STRI in the distribu-
tion sector is associated with a rise in exports and imports respectively by 17.5 and 40 percent
in the short-run, the impact on imports appears to be strongest (column 1 of Table 1.6). This
sector is vital because it links buyers and sellers and therefore the pricing of food commodi-
ties. The positive correlation between STRIs and food trade flows is explained by wholesalers’
and retailers’ profit margins (Rouzet and Spinelli, 2016). A high STRI is associated with more
barriers to investment18and competition.
19Indeed, a high STRI in this sector increases the
food prices and thus the profit margins of wholesalers and retailers while limiting competi-
18More foreign ownership restrictions and, in some cases, a legal monopoly on the distribution of certain
products or a product reserved for domestic distributors.
19Store hours and price regulations.

1.7. Regulatory differences in services and food trade 53
tion in the production markets. It is beneficial to import food products when the prices in
the distribution market are high. The study by Cheptea, Emlinger, and Karine (2018) shows a
positive relationship between the establishment of distribution services and the export activ-
ity of French agri-food firms.
These results confirm those found above that the restrictions in both countries have signif-
icant effects on trade in food commodities. Based on the results in Tables 1.4 and 1.5, the
most affected food sectors are food, live animals and perishable products. These products are
the most traded between OECD countries and are very sensitive to time and to the quality of
logistics and transports. Perishable products are the most widely sold in retail and wholesale
markets. This study shows the detrimental impact of restrictions in services on food global
value chains and quality of products. The novel conclusion is that the food industry is strongly
linked to services that are used as inputs in production and trade. It also shows that regula-
tion of a country’s services sector has negative effects on its export performance and import
penetration.
1.7 Regulatory differences in services and food trade
In this section, we investigate the impact of the regulatory differences in services between
pairs of countries on food exports. Following Kox and Nordås (2007), the regulatory differ-
ence between pairs of countries emerges as the most restrictive trade policy compared to
individual country restrictions. Indeed, this regulatory disparity is considered as a bilateral
trade cost and affects trade through gravity estimation.
Using the index of regulatory heterogeneity between country pairs of OECD countries in ser-
vices, we estimate its effects on food exports. The index is constructed as follows: from the
database of country-specific STRIs, for each sector we create a matrix where each cell contains
countries i and j for measure m.20If the pair of countries has the same answer for measure m,
the cell is scored as zero and 1 otherwise. For each country pair and each measure, a hetero-
geneity index is created by computing a weighted average of these scores (an average of the
5 measures).
We have two types of index, one based on qualitative responses in the presence or absence of
20Barriers to entry, competition, restrictions on movement of persons, other discrimination, regulatory trans-
parency.
54 Chapter 1. The impact of services trade restrictiveness on food trade
regulations and another on the score that highlights the restrictiveness of regulations. Simi-
larly to the individual STRI measures, they are scored on a scale of 0 to 1 (less restrictive to
completely closed to foreign suppliers).
To capture the effect of the regulatory difference on bilateral food flows, we construct an
interaction variable between the individual STRI variables (exporter and importer) and the
regulatory heterogeneity variable. Indeed, regulatory disparity has lower effects on trade if
the importer or exporter country is completely closed to service providers, and significant
impacts if the countries are open to services (Nordås and Rouzet, 2016). Our gravity equation
is as follows: small
Xkij,t = exp[α0 + α1STRIij,t + α2STRIij,t ∗ STRIi,t + α3STRIij,t ∗ STRIj,t+
α4tij + α5Zij,t + µik,t + γjk,t + εijt](1.6)
With STRIij,t the overall regulatory difference between country pair (ij) in the four service
sectors at year t,21; STRIi,t, STRIj,t are STRIs of exporter and importer countries
22; µik,t,
γjk,t dummy variables that represent the exporter-importer sector-time fixed effects (inward
and outward multilateral resistance).
The results with PPML as an estimator are presented in Table 1.8. Columns 1 to 3 represent
the results of the sectoral regulatory disparity on trade flows, columns 4 to 6 the impacts of
overall regulatory heterogeneity, columns 7 to 10 the effects of our interaction terms. Column
10 includes country-pair fixed effects to control for the endogeneity of the trade policy vari-
ables.
The regulatory difference in logistics has negative and significant values in our regression.
In addition, the disparity in the transportation sector has positive and significant effects on
exports. The positive sign is explained by the small disparity in the transport sector between
European Union member countries (the index ranging from 0.06213 to 0.25915 with an aver-
age of 0.14659, a lower than logistics index, see table A.3). The overall regulatory disparity
index has significant negative effects. This result suggests that regulatory heterogeneity is
indeed negatively associated with cross-border food trade. A 0.05 point lower regulatory het-
erogeneity is associated with a 10 percent rise on average in food exports across all sectors.23
21We use the score index to compare it to each country’s STRI score.
22We consider the overall STRI and regulatory disparity index in the four service sectors for the analysis of
our intercation terms.
23[Exp(-0.05*(-1.9580))-1]*100=10.28 percent. The calculation is based on the regression data described in Table

1.7. Regulatory differences in services and food trade 55
Moreover, regulatory differences have a less significant marginal impact on trade flows the
higher the level of trade restrictiveness both in the exporting and the importing country.
1.8 column 6.

56Chapter
1.The
impactof
servicestrade
restrictivenesson
foodtrade
Table 1.8: The effects of heterogeneity regulatory on cross-border exports of food commodities (all food products): PPML
Sectoral Regulatory Overall Regulatory Overall Country STRIHeterogeneity Score Heterogeneity Score and Heterogeneity Score
Pair-FEModel (1) (2) (3) (4) (5) (6) (7) (8) (9) (10)
Heterogeneity scoreijt,logistics -5.9116∗∗∗
-5.8123∗∗∗
-5.2440∗∗∗
(1.0388) (1.3934) (1.2148)
Heterogeneity scoreijt,F inancial−Business -2.1577 0.0433 -0.4160
(1.3699) (1.1906) (1.0131)
Heterogeneity scoreijt,T ransports 7.4262∗∗∗
4.5802∗∗∗
4.5382∗∗∗
(0.9063) (1.5053) (1.3335)
Heterogeneity scoreijt,Distribution -2.6660∗∗
-0.0478 -0.1760
(1.2635) (1.2973) (1.1358)
Overall Heterogeneity scoreij,t -0.7853 -1.9970∗∗
-1.9580∗∗
-3.6875 -10.5709∗∗∗
-10.5012∗∗∗
5.5081
(1.4684) (0.9403) (0.7790) (2.5580) (4.0161) (3.6055) (3.7381)
Overal Heterogeneity scoreij,t ∗STRIi,t1.7509 24.4309
∗24.7319
∗∗3.5286
(6.3114) (12.7066) (10.1811) (9.8911)
Overal Heterogeneity scoreij,t ∗STRIj,t7.1538 13.6079 13.1989 -28.1474
∗
(5.2705) (11.8198) (11.3372) (14.7670)
RTAij,t 0.4871∗∗∗
0.2976∗∗
0.4308∗∗∗
0.6589∗∗∗
0.3469∗∗∗
0.4748∗∗∗
0.5916∗∗∗
0.3624∗∗∗
0.4876∗∗∗
-0.1041
(0.1688) (0.1251) (0.1169) (0.1711) (0.1204) (0.1127) (0.1767) (0.1196) (0.1116) (0.0879)
Ln(1 + tariffji,t) -0.2104∗∗∗
-0.3201∗∗∗
-0.3496∗∗∗
-0.1444∗∗∗
-0.3055∗∗∗
-0.3335∗∗∗
-0.1609∗∗∗
-0.2592∗∗∗
-0.2875∗∗∗
-0.0137
(0.0438) (0.0527) (0.0470) (0.0413) (0.0548) (0.0488) (0.0425) (0.0600) (0.0533) (0.0127)
Ln distij -1.3052∗∗∗
-1.7233∗∗∗
-1.7478∗∗∗
-1.0835∗∗∗
-1.6728∗∗∗
-1.6967∗∗∗
-1.0834∗∗∗
-1.6838∗∗∗
-1.7086∗∗∗
(0.1466) (0.1127) (0.1023) (0.1592) (0.1127) (0.1006) (0.1612) (0.1119) (0.1001)
langij 0.0362 0.1300 0.1800∗∗
-0.0065 0.1336 0.1756∗∗
0.0022 0.1562 0.1977∗∗
(0.1256) (0.0983) (0.0857) (0.1543) (0.1011) (0.0890) (0.1516) (0.1004) (0.0884)
borderij 0.8252∗∗∗
0.7224∗∗∗
0.7311∗∗∗
0.9329∗∗∗
0.7606∗∗∗
0.7735∗∗∗
0.9195∗∗∗
0.7523∗∗∗
0.7654∗∗∗
(0.1355) (0.0793) (0.0751) (0.1631) (0.0850) (0.0799) (0.1600) (0.0832) (0.0786)
Exporter-Importer Controls Yes No No Yes No No Yes No No No
Time-FE Yes No No Yes No No Yes No No No
Sector-FE Yes Yes No Yes Yes No Yes Yes No No
Exporter-time-FE No Yes No No Yes No No Yes No No
Importer-time-FE No Yes No No Yes No No Yes No No
Exporter-time-Sector-FE No No Yes No No Yes No No Yes Yes
Importer-time-Sector-FE No No Yes No No Yes No No Yes Yes
Country-pair-sector-FE No No No No No No No No No Yes
R20.732 0.923 0.9374 0.666 0.919 0.9361 0.671 0.920 0.9365 0.9935
Observations 24867 24867 24763 24867 24867 24763 24867 24867 24763 23091
Chi-2 2196.98∗∗∗
1848.69∗∗∗
1925.97∗∗∗
5.88
Notes: The dependent variable is nominal bilateral food product from i to j at to t in sector k as in equation (1.3). Regressions 3, 6, 9 10 are performed using
the ppmlhdfe STATA command written by Correia, Guimarães, Zylkin (2019). Exporter-importer controls are the GDP of both countries. Standard errors are
reported in parentheses and clustered by country-pair level. *, **, *** denote significance at the 10% 5% and 1% level respectively.

1.7. Regulatory differences in services and food trade 57
Interestingly, our interaction variables have positive and significant signs between the ex-
porter’s STRI and the regulatory heterogeneity index. The negative sign of the regulatory
difference and the positive sign of our interaction term suggest that the negative effect of the
regulatory difference on food exports decreases with exporter country restrictions. Indeed,
the impacts of regulatory heterogeneity decrease if the exporter country is closed to service
providers (Table 1.9).24
The regulatory difference has significant effects on trade in services if both countries are
open to service providers and less significant effects if they are completely closed (Nordås
and Rouzet, 2016). In this case, the restrictions imposed by each country are still the main
barrier to entry for service providers. In the food industry, the regulation of services in the
exporter country is a barrier to trade. The services of the exporter country are key factors for
production and export: if a country is closed to service providers, that will impact its export
performance. This explains the positive and non-significant sign of the second interaction
term. These results become non-significant when including country-pair fixed effects. The
reason is that the annual change in regulatory disparity between country-pairs and specific
STRIs is lower in many sectors (see Table 1.10).
Table 1.9: Change in bilateral trade from a 0.05 point change in STRI heterogeneity (%)
STRIi Change inbilateraltrade (%)
0.05 37.07
0.1 33.06
0.15 28.79
0.2 24.25
0.25 19.41
0.3 14.28
0.35 8.81
0.4 2.99
Source: Author’s calculation
24The percentage change in exports from a 0.05 points reduction in the STRI heterogeneity index is : -
[exp(0.05*(-10.5012 + 24.7316*STRIi))- 1]*100. The calculation in Table 1.9 is based on the regression data
described in Table 1.8 column 9. We consider the exporter’s STRI because the coefficient of the importer’s STRI
is not significant.

58 Chapter 1. The impact of services trade restrictiveness on food trade
Table 1.10: Annual average change in STRIs from 2014 to 2018
Time Regulatory Heterogeneity STRI exporter STRI importerValues Change in points Values Change in points Values Change in points
2014 0.2291 0.2309 0.2334
2015 0.2288 -0.0003 0.2329 0.002 0.2329 -0.0005
2016 0.2257 -0.0031 0.2332 0.0003 0.2332 0.0003
2017 0.221 -0.0047 0.2323 -0.0009 0.2323 -0.0009
2018 0.2213 0.0003 0.2313 -0.001 0.2322 -0.0001
Source: Author’s calculation using OECD STRI database
1.8 Robustness check
Our main estimates of the gravity model suggest significant negative results of restrictions in
logistics and transport sectors on food exports. A high STRI in the finance and other business
sectors is associated with low food imports. In addition, restrictions in the distribution sector
have positive effects on trade. We performed various robustness tests to assess the sensitivity
of our results.
The first tests focus on the effects of individual importer and exporter country restrictions
on bilateral food exports. We study the effects of country-specific restrictions on food trade.
Adding the importer and exporter STRIs into our equation, we examine their effects on trade.
Both indices have significant and negative effects on food trade (column 3 of Table A.4), but
the STRI of the exporter country has much greater impacts than the importer country’s STRI:
A 0.05 point increase in the STRI leads to a decrease in food exports and imports respectively
by 15.74 and 7.40 percent. The results are carefully considered because we did not consider
the country sector time fixed effects to control for the omitted variables. If we compare these
results with those of our terms of interactions we can see that the exporting country’s restric-
tions have a higher significant negative impact on food trade (Nordås and Rouzet, 2016).25
The same results are found when controlling for omitted variables.
The second test includes other control variables. We consider dummy variables that control
for economic integration such as the EEA, and NAFTA.26We also consider economic integra-
25These authors find that the STRI has more negative effects on the performance of services exports than
imports.
26We include dummy variables that represent the European Economic Area (Intra EEA) to control for the
deeper integration in services, and North American Free Trade Agreement (NAFTA), which is a major trade
agreement on commodities.

1.9. Conclusion 59
tion agreements (EIA) with provisions for harmonization of SPS and TBT standards.27We find
the same effects observed above (see columns 4, 5, 6 and 7 of Table A.4).
The analysis of the sectoral bilateral STRI shows negative and significant impacts in the sec-
tors of cargo-handling, freight forwarding and customs brokerage logistics. In the financial
and other business sector, the banking and accounting sectors have limiting and significant
effects on food trade. In transportation, the restrictions in road freight and sea are barriers to
food trade. Overall, restrictions in logistics, financial, other business sectors and distribution
sectors have more significant effects on food trade (Table A.5).
The last robustness tests attempt to study the performance of our results on the negative
impacts of regulatory disparity on food exports. To evaluate these results, we consider the
regulatory disparity between net food exporter and net food importer countries according to
UNCTAD classification, and the regulatory disparity between OECD countries and emerging
countries, which is still greater than the disparity between OECD countries (see Table A.3).
The disparity between the ten countries with high and low value added of services to GDP ac-
cording toWorld Development Indicators data and that between EEA and EU countries (lower
restrictions) are evaluated. The results are presented in Table A.6. Overall, the disparities in
logistics, finance, and other business sectors have negative effects, while transport has pos-
itive effects on exports. Disparities between net exporting and net importing countries and
between OECD and emerging market countries do not have significant effects on the sectors
considered, although the free movement of goods, services and people in the EU and EEA
countries, the regulatory disparity in logistics, finance and other business sectors are barriers
to trade in food products.
1.9 Conclusion
This study is an extension of previous studies on the impacts of services restrictions on inter-
national trade. However, it differs from earlier studies because we examine restrictions in the
services sector on food trade, a topic not widely studied in the literature. Our analysis sug-
gests that deregulation of the services sector and harmonization policy are highly beneficial
for food trade.
27The EIA database was compiled by Baier and Bergstrand (http://www.nd.edu/~jbergstr/). It
provides detailed and useful information on EIAs and links to the legal text of the agreements.

60 Chapter 1. The impact of services trade restrictiveness on food trade
Our paper, which investigates the impacts of service regulations on food trade, presents a tool
for quantifying service restrictions and assesses these effects on trade flows. We start with a
gravity analysis using panel data on pooled bilateral trade in food products between OECD
countries from 2014 to 2018. To estimate restrictions in services, we use the Service Trade
Restrictiveness Index and the Regulatory Heterogeneity Index of the OECD. Restrictions in
logistics, transportation, financial, other business sectors, and distribution are considered in
our study.
We found that the STRI in the logistics and transportation sector is negatively associated
with food exports. Restrictions in the financial and other business sectors limit food imports.
Moreover, restrictions in distribution have positive and significant effects on exports and im-
ports. The most affected sectors are food, live animals and perishable products (milk, eggs,
and meat). Regulatory disparity in the logistics sector is a barrier to trade, but disparity in the
transport sector has positive and significant effects on food exports. By contrast, the overall
disparity in the services sector has a significant negative impact on food trade. This impact
decreases when the exporting country is closed to service providers.
The results appear robust to alternative specifications. Several different aspects were an-
alyzed. First, we estimate the effects of country-specific STRIs on food trade. Second, other
control variables are introduced in our estimates. The restrictions have greater negative effects
on exports than on imports and confirm our findings that restrictions in logistics, distribution,
finance and other business sectors have significant effects on trade flows. A sectoral analysis
shows that restrictions in cargo-handling, freight forwarding, customs brokerage, banking,
accounting, road freight and sea transport are barriers to food trade. The effects of regula-
tory disparity on exports are tested further. Regulatory disparity was analyzed between net
exporting and net importing countries, the ten countries with high and lower services value
added to GDP, between OECD and emerging countries, and EEA and EU member countries.
The results show that regulatory disparities in logistics, finance, and other business sectors
have significant negative effects, while regulatory disparity in transportation has positive ef-
fects.
Our study differs from the existing literature, but is limited by the data. Indeed, service re-
striction indices are time-invariant composite measures for some sectors, and the data are also
short-run in order to capture the effects (2014-2018). Regulations are adjustment policies that
1.9. Conclusion 61
require time for firms or exporters to comply with them. Therefore, the data do not capture
the effects on trade over the long run. However, we can improve our study by considering
the Intra-EEA regulation of services in our study in order to take into account the effect on
trade of preferential treatment subject to service providers in economic integration areas. It
will be interesting to see the effects of the disaggregated STRI in the distribution sector on
food trade. The effects of STRI may vary depending on the type of index used.
This study on the impacts of services restrictions on food products shows that services regu-
lation has detrimental effects on export performance and import penetration in OECD coun-
tries. The novel conclusion is that regulatory cooperation in services between countries has
become a relevant factor in global food trade. Regulatory harmonization in economic inte-
gration zones significantly boosts trade flows.


Chapter 2
The effects of restrictive measures oncross-border investment: Evidence from
OECD and emerging countries†
2.1 Introduction
Foreign direct investment (FDI) has become more and more important in economic growth
and globalization in the last years. Indeed, FDI can increase productivity and change the
comparative advantage of host countries. The establishment of multinational firms, capital
accumulation, or delocalization can reduce unemployment, income inequality, poverty, im-
prove technology transfer, and increase product variety through innovation (Hale and Xu,
2016; Dritsaki and Stiakakis, 2014). The empirical literature suggests a positive correlation
between FDI and economic growth (Iamsiraroj and Doucouliagos, 2015). However, several
factors determine the massive inflow of FDI into a country and its effectiveness in economic
growth (Alfaro et al., 2004; Li and Liu, 2005; Batten and Vo, 2009; Desbordes and Vicard,
2009). A strong macroeconomic framework with competitive and effective policies is neces-
sary and contributes to attracting more FDI into a country (tax rates, restrictions on financial
transactions, legal framework, economic and political stability, etc.). Indeed, an investment
environment that considers the local institutions, regulations and policies in which compa-
nies operate, stimulates economic growth by encouraging the firms to invest. In this case, the
regulation has an impact on job creation and sustainability (World Bank, 2005). The positive
link between FDI and growth is stronger in open economies with an educated workforce and
developed financial markets (Bodman and Le, 2013). Moreover, some analyses have showed
the positive link between FDI inflows and low economic policy uncertainty (Gulen and Ion,
2015).
Studies showing the relationship between FDI and regulation suggested that the FDI sector is
†This chapter has been accepted for publication in the The World Economy, forthcoming.

2.1. Introduction 63
far less liberalized than trade in goods and services (Ghosh et al., 2012). Although regional,
bilateral, and multilateral trade and investment agreements have reduced formal barriers, re-
strictions are still significant in some countries and affect FDI. The regulatory framework
plays a key role in FDI flows. Indeed, the regulation has a profound and durable impact on a
firm’s financial choices and is seen as a crucial driver of investment. To encourage FDI, the
authorities must reduce the costs, minimize the risks associated with investment, and create
an appropriate climate for the domestic economy. The regulation must be both optimal and
competitive, protecting the investors from potential risks, promoting competition among the
firms across borders, and protecting consumers from higher prices.
In 2018, inward FDI represented about 2% of GDP in the EU and 1.3% of GDP in OECD region
(see Figure 2.1). But we note that between 2016 and 2018, foreign investments have dropped
by around 3.2 to 2% of GDP in the EU and by almost 2.7 to 1.3% on average in the OECD area,
which is contrary to the acceleration of GDP and trade growth. These trends are more sig-
nificant in advanced countries than emerging countries (see Figures 2.2 and 2.3). In this year,
some 55 economies introduced at least 112 measures affecting foreign investment. Two thirds
of these measures sought to liberalise, promote and facilitate new investment (falling since
2016). Almost a third of thesemeasures are new restrictions (increasing since 2016) (UNCTAD,
2019). How can we explain the decline in foreign investment? Is it a consequence of restric-
tive or sub-optimal policies? What is the real impact of restrictive measures on investment?
Did the restrictions stimulate capital accumulation in the markets?
Figure 2.1: Inward FDI flows, % of GDP, 2010-2018
2010 2011 2012 2013 2014 2015 2016 2017 20181
1.5
2
2.5
3
3.5
4
European Union
OECD
Source: OECD database

64Chapter 2. The effects of restrictive measures on cross-border investment:
Evidence from OECD and emerging countriesFigure 2.2: Inward FDI in advanced countries as %
of GDP, 2010-2018
2010 2011 2012 2013 2014 2015 2016 2017 2018-1
0
1
2
3
4
5
6
7
8
France
Germany
United Kingdom
USA
Source: OECD database
Figure 2.3: Inward FDI in emerging countries as %
of GDP, 2010-2018
2010 2011 2012 2013 2014 2015 2016 2017 20180
2
4
6
8
10
12
Argentina
Brazil
Chile
Indonesia
Mexico
Turquey
Source: OECD database
This paper examines the effects of global and sectoral restrictive measures on FDI among 49
advanced and emerging countries from 2010 to 2019. The existing empirical literature on
the effects of restrictions on FDI has shown negative impacts of restrictive measures on FDI
(Nicoletti et al., 2003; Ghosh et al., 2012). Some studies have underlined the restrictive ef-
fects of measures on cross-border M&A in the secondary sector and non-financial services
(Gregori and Nardo, 2021). Others have highlighted the negative effects of these measures
on cross-border M&A in the services sector (Mistura and Roulet, 2019). Mistura and Roulet
(2019) investigate the impacts of restrictions on global inward FDI and cross-border M&A
across 60 advanced and emerging countries from 1997 to 2016, and Gregori and Nardo (2021)
analyze the effects on EU member countries from 2011 to 2018. Few studies have empirically
measured the impact of sectoral restrictive measures on overall inward FDI between advanced
and emerging countries.
Our paper contributes to the literature about the effects of restrictive measures on FDI in ad-
vanced and emerging countries. However, it is innovative in 3 aspects .
First, similar to Mistura and Roulet (2019), we estimate through an augmented gravity model
the effects of restrictive measures on cross-border FDI in 49 developed and emerging countries
from 2010 to 2019. We use the OECD FDI Regulatory Restrictiveness Index that captures bar-
riers to FDI entry in 22 economic sectors across 69 countries. The indexmeasures institutional

2.1. Introduction 65
factors that could influence FDI, such as restrictions on equity or key personnel for foreign
investors, limitations on the establishment of branches, and clauses on profit and capital repa-
triation. Moreover Mistura and Roulet (2019) investigate the effects of restrictions on global
FDI across advanced and emerging countries in 2001 to 2012 and onM&A from 2001-2016. Our
paper provides a more recent analysis of the effects of restrictions on global FDI among ad-
vanced and emerging countries from 2010 to 2019. It considers the latest international guide-
lines for compiling foreign direct investment (FDI) statistics.1Second, Mistura and Roulet
(2019); Gregori and Nardo (2021) study the effects of different types of restrictive measures
on FDI. Our model examines in more details the impact of global and sectoral restrictive mea-
sures on cross-border FDI.We consider FDI restrictions in the primary, secondary, and tertiary
sectors, and further investigate the more disaggregated sectoral effects. The last contribution
relates to the type of country considered. Contrary to Mistura and Roulet (2019), who ana-
lyze the effects of restrictions on FDI between OECD and non-OECD countries, we examine
these effects at three levels: first, a study on FDI between advanced countries (intra-OECD),
then among OECD countries and emerging countries (BRICS and some Latin American and
Asian countries), and finally between OECD countries and middle-income countries (North
African countries and South Africa).2Indeed, depending on type of economy, the impacts
of sectoral measures are different. OECD countries have a more service-oriented economy,
emerging countries have a manufacturing and primary sector-based economy and the econ-
omy of African countries depends on agriculture and natural resources.
Our results suggest that overall restrictive measure has negative and non-significant effects
on cross-border FDI across OECD countries, while restrictions in the services sector are neg-
atively and significantly associated with inward FDI. Indeed, an increase of 0.05 points in FDI
restrictions in this sector decreases inward FDI by about 12.29%. Moreover, the overall re-
strictive measures and those in the primary, secondary and tertiary sectors have negative and
significant effects on inward FDI among OECD and emerging countries. A 0.05 point increase
in global and sector-specific restrictions is associated with a decrease in inward FDI by 15.24,
10.67, 15.77 and 13.07% respectively. The restrictions in the primary sector are a main obstacle
to inward FDI in the big emerging countries. In addition, global and sectoral restrictions do
1In 2014, many countries implemented the latest international guidelines for compiling foreign direct invest-
ment (FDI) statistics (OECD, 2015).
2The countries with FDI restrictive measures data available in our sample are North African countries and
South Africa, see Table B.1.

66Chapter 2. The effects of restrictive measures on cross-border investment:
Evidence from OECD and emerging countries
not have a significant effect on FDI between advanced and African countries. The analysis of
disaggregated sectoral restrictive measures shows that the restrictions in business and other
financial services are negatively associated with intra-OECD FDI, while those in the banking
and insurance sector have non-significant effects on inward FDI. This paper also shows the
restrictive impact of services sector measures on intra-OECD FDI using the OECD’s Services
Trade Restrictiveness Index (STRI). Furthermore, the restrictive measures in the manufactur-
ing sector have restrictive impacts on inward FDI in emerging countries, most pronounced in
the BRICS countries, and those in the mining, quarrying, and oil extraction sector are barriers
to inward FDI in African countries. Reforms to liberalize sectoral restrictions by country have
positive effects on FDI, but deregulation of the services sector has beneficial effects on inward
FDI from developed and emerging countries.
The remainder of this paper is structured as follows. The next section documents recent lit-
erature on the effects of FDI regulation on investment. In the second part, we describe our
econometric model with data, sources, and the type of regression used. The third section
presents and discusses the results and formulates policy recommendations.
2.2 Literature review
Empirical studies that examine the impact of restrictivemeasures on FDI use twomain indices.
Some authors study the effects of restrictions on FDI using the FDI Regulatory Restrictiveness
Index of OECD and others the indexes of capital account restrictions based on IMF’s AREAER
database.3
Authors such as Nicoletti et al (2003), based on the original version of the index created by
Golub (2003)4and the OECD’s PMR
5, explore the effects of FDI restrictions and other policies
on foreign direct investment in a panel of 28 OECD countries between 1980 and 2000. The pa-
per uses a gravity model to control bilateral outward FDI flows and a dynamic panel model to
explain total multilateral inward FDI stocks. Their results suggest that FDI restrictions could
reduce bilateral outward FDI stocks by between 10% and 80% on average, depending on the
3Database on the exchange rates and trade regimes of all members of the International Monetary Fund (cur-
rently 189 countries) and three territories (Aruba, Hong Kong SAR, and Curaa̧o and Sint Maarten - formerly the
Netherlands Antilles).
4The first to construct the aggregate index of FDI restrictions.
5Product Market Regulation index.

2.2. Literature review 67
type of restriction. Inward FDI stocks are also impacted by FDI restrictions, but the results
should be treated carefully due to the lack of variability of restrictions across OECD member
countries. The analysis of Ghosh et al (2012) similar to the previous one shows the impact of
restrictions on inward FDI stocks using panel data (1981-2004) for 23 OECD countries. Based
on the FDI Restrictiveness Index of Golub (2003) and Koyama and Golub (2006) and a gravity
model, they find significant negative effects of restrictions on inward FDI stocks. To deter-
mine the short- and long-run effects of the restrictions, they use an autoregressive distributed
lag model. Their results show that the short-run elasticity estimated was between 0.06 and
-0.14, and the long-run elasticity between -0.64 and -1.49.
The analysis of Ahrend and Goujard (2012) indicates that FDI restrictions may contribute to
greater risks of financial crisis. Indeed, higher restrictions in OECD countries, measured by
OECD indexes, and anti-competitive product market regulation have contributed to reduced
financial stability. That is due to a rise of countries’ debt over FDI or capital investment.
By contrast, more stringent capital regulations for banks and more openness to foreign bank
entry have reduced the vulnerability to financial contagion. Fournier (2015) examines the de-
terminants of foreign direct investment (FDI) from 1998 to 2013, including FDI restrictions.
Using gravity models and the recent version of the OECD FDI restrictiveness index, he finds a
significant negative impact of restrictions on FDI stocks after controlling for various political
and structural determinants of bilateral FDI.
Recent studies examining the impacts of restrictive measures on FDI through the OECD FDI
Regulatory Restrictiveness Index are those by Mistura and Roulet (2019) and Gregori and
Nardo (2021). They differ from those mentioned above because they examine the effects of
restrictions on aggregate FDI, sectoral FDI, and M&A. They also examine the impact of differ-
ent types of restrictions such as foreign equity limitations, screening or approval mechanisms,
restrictions on the employment of foreigners as key personnel and operational restrictions.
Mistura and Roulet (2019) find that reforms liberalising FDI restrictions by about 10 percent
could increase bilateral FDI in stocks by 2.1 percent on average.The effects are greater for FDI
in the services sector, but also in manufacturing sectors which are typically open to FDI. The
effect of reducing foreign equity limitations is the strongest, and foreign investment screening
policies significantly curb FDI, but to a much lower extent. Gregori and Nardo (2021) show
that the presence of formal screening procedures does not negatively affect cross-border in-

68Chapter 2. The effects of restrictive measures on cross-border investment:
Evidence from OECD and emerging countries
vestment on average. Other restrictive policies, such as licensing requirements, quantitative
limitations, restrictions to the market access and activity of foreign companies limit M&A
flows. This is particularly relevant in the manufacturing and non-financial services indus-
tries, where M&A flows are negatively affected by restrictions on foreign personnel being
employed in key positions, and restrictions on the establishment of branch offices, land ac-
quisition, or profit and capital repatriations. Their results are also in line to the literature
about the effects of regulation on trade in services. Indeed Van der Marel and Shepherd’s
(2013) examine the relationship between trade in services and regulation. They find a nega-
tive relationship between regulatory restrictiveness and trade flows, with the effects varying
across sectors. Nordås and Rouzet (2017) confirm this result by explicitly excluding FDI.6In
their gravity model relating trade in services with regulatory restrictions, tighter restrictions
decrease trade, with the exports of services more impacted than imports.
Contrary to the above studies, Binici, Hutchison and Schindler (2009) apply an index of capital
restrictions based on IMF’s AREAER information, by asset class and covering 74 countries over
the period 1995-2005. They study the effects of FDI and equity portfolio investment restric-
tions on total inward and outward FDI and equity portfolio investment. The results suggest
that restrictions control capital outflows, not inflows. The study of Arbatli (2011) similar to
the previous one, uses capital account restriction indices based on IMF’s AREAER database.
Through a binary index of FDI restrictions, he investigates the determinants of FDI flows into
emerging economies. The author creates two binary indicators of FDI restrictions: one that
assesses the existence of any restrictions on FDI inflows; and one that captures restrictions
on the liquidation of direct investment. He uses a dynamic panel model approach to model
FDI flows and data for 46 countries over 20 years. The results suggest that FDI capital restric-
tions have a significant negative effect on inward FDI, but no significant effect was found for
restrictions on the liquidation of investment.
2.3 Theoretical gravity model for FDI
Gravity model, is increasingly used when investigating determinants of FDI flows.7Head
and Ries (2008) provide theoretical micro-foundations for a gravitational model of FDI and
6They consider three modes of service supply (cross-border supply, consumption abroad and movement of
people).
7Wei (2000) or Bénassy-Quéré et al. (2007).

2.3. Theoretical gravity model for FDI 69
motivate its application for modelling bilateral FDI as well as trade flows.
The framework used in this paper is based on recent advances in the literature on gravitational
models (see Yotov et al., 2016). In particular, we apply the gravity modeling approach for FDI
developed by Anderson et al (2016, 2017). Indeed, their model shows how trade and FDI are
linked and how they respond to natural or man-made barriers to trade and investment.
In particular, Anderson et al (2016, 2017) model focuses on the interpretation of FDI based on
technological capital or knowledge capital. A given stock of technological capital (patents,
plans, management skills, etc.) can be used simultaneously in more than one country. The
value of knowledge capital increases when it can be "leased" to other countries as FDI. Since
knowledge capital flows are largely intangible and therefore difficult to measure, bilateral FDI
stock will be used as a proxy indicator of knowledge capital flows between two countries.
FDI from country i to country j is as follows: FDIstockij . It is positively influenced by the size of
source country (Ei), as large economies tend to invest more in technological capital. The stock
of bilateral FDI is also positively influenced by the size of destination country (Yj), as large
economies can in principle absorb more foreign technology. If the size of the aggregate stock
of technological capital in country i is denoted byMi, the ratioYi
Mican be considered as a gross
measure of the potential absorptive capacity of country j for FDI-related technological capital
from country i. FDI flows are impeded by obstacles or frictions. For FDI, the relative openness
of country j to foreign technologies can be represented by wij , which has values from 0 to 1.
If wij = 1, country j is fully open to the entry of technological capital from country i, while
in the case of wij = 0, no technological capital from country i is allowed. All these factors are
the main determinants of the bilateral stock of FDI.8The general formulation is as follows:
FDIstockij = wηij
αEi
Pi
Yi
Mj(2.1)
With Ei measures the size of country i as a total expenditure, including expenditures for
the development of technological capital; Yj is a measure of the size of host country j. The
parameter η is the elasticity of FDI revenue flows with respect to the measure of openness.
More openness in country j will lead to more frequent use of the technology stock, which
will lead to an increase of FDI revenues. The other elements of equation (2.1) come from the
8Time indices are omitted in this representation.

70Chapter 2. The effects of restrictive measures on cross-border investment:
Evidence from OECD and emerging countries
structural gravity system for trade, in which the FDI determinants are integrated. α groups
a set of fixed parameters from the theoretical model.9Finally, Pi is the inward multilateral
resistance term of the gravity trade model. They aggregate the bilateral trade costs of country
i with all other countries:
Pi =
[N∑j=1
(tjiΠj
)1−σYj
Y
] 11−σ
(2.2)
With tji represents the bilateral trade-cost frictions (bilateral distance, having different lan-
guages, common border..) that increase bilateral trade cost. Y =∑
Yj is world production
or world GDP, used to normalize the size of destination country (Yj), and σ is the elasticity of
substitution from CES functions used to aggregate multilateral resistance (MR) terms.10
World trade is a fully integrated system, equation (2.2) also contains the termΠj , which repre-
sents the outward multilateral trade resistances of country j. It aggregates the bilateral trade
costs of country j with respect to all other countries. The gravity system of the FDI becomes:
Πj =
[N∑j=1
(tji¶i
)1−σEi
Y
] 11−σ
(2.3)
The intuition for understanding the relation of equation (2.3) with bilateral FDI is that higher
relative trade costs in host country j increase its domestic prices and thus lower the country’s
real potential for absorbing foreign technology capital (FDI).
The first authors who estimated bilateral FDI using a gravity model are Bénassy-Quéré et
al. (2005). They study the impacts of FDI determinants on horizontal FDI. In their model,
bilateral FDI stocks depend on both economies’ GDP, the determinants of supply and demand,
and the distance between capital. However, recent theoretical developments have provided
other foundations for the application of a gravity model to other FDI models (Kleinert and
Toubal, 2010; Bergstrand and Egger, 2007; Head and Ries, 2008; De Sousa et al., 2012; Heid
and Larch, 2016 and Nordås and Rouzet, 2017).11
Bergstrand and Egger (2007) implement a
9These include parameters such as the depreciation rate, the utility function discount factor and other pa-
rameters that are used in the underlying theoretical model (see Anderson et al., 2016, 2017).
10With σ > 1, the elasticity of substitution shows that all countries have a preference for a variety of products
and technological capital by origin country.
11The studies combine both horizontal and vertical FDI.

2.4. Model and estimation issues 71
gravity model of FDI by including several aspects of FDI (foreign direct investment (FDI),
foreign affiliate sales (FAS) and multinational companies (MNEs). However, Head and Ries
(2008) develop a gravity model of FDI by considering the M&A process, in which the holding
company tries to control the assets abroad.
2.4 Model and estimation issues
In our empirical analysis, we examine the impacts of restrictions on FDI stocks betweenOECD
and emerging countries. Using the model of Anderson and Van Wincoop (2003); Anderson et
al (2016, 2017), our baseline regression equation is the following:
FDIij,t = exp[β0 + β1Ln(FDIij,t−1) + β2FDI RIsj,t−1 + β3tij,t−1+
β4Ln(GDPi,t−1) + β5Ln(GDPj,t−1) + β6Xj,t−1 + αi + ϕj+
γt + εij,t]
(2.4)
With FDIij,t represents FDI positions (stocks) from country i (the reporting or source coun-
try) to country j (the partner or host country) in period t (2010-2019)=FDIij,t
GDPdeflator(ij,t). FDI
are calculated by dividing FDI stocks (in U.S. dollars) by the average of the source and host
country GDP deflators to remove inflation. FDIij,t−1 is one-year lagged dependent variable
(Egger and Merlo, 2007).12Following Mistura and Roulet (2019), all explanatory variables are
lagged by one year to reduce potential endogeneity issues. FDI RIsj,t−1 is our interest vari-
able (FDI Regulatory Restrictiveness Index), i.e. the restrictive measures on FDI implemented
in the destination country j at the time t-1 in the sector s (s= primary, secondary and tertiary
sectors). It is measured by the OECD FDI restrictiveness index. tij,t−1 includes time-invariant
bilateral control variables, i.e. bilateral distance, common language, common border, colonial
links (Blonigen and Piger, 2014)13and time varying variables such as regional trade agree-
ments (RTA), bilateral investment treaties (BIT) and human capital dissimilarity (HCDij,t).
According to Ethier and Markusen (1996), the difference in factor endowments can affect in-
ward FDI.14
We include standard gravity variables, specifically the GDP of both the origin
12They argue that ignoring the dynamic nature of FDI could lead to an overestimation of the effect of bilateral
factors.
13They identify as main enabling factors for inward FDI the traditional gravity variables such as cultural
distance, difference in labor endowment, and the presence of trade agreements.
14Golub et al. (2003) define human capital dissimilarity as the difference in absolute value between the hu-
man capital index in the destination country and that in the source country HCDij,t =| (ln(educationjt −ln(educationit) |.

72Chapter 2. The effects of restrictive measures on cross-border investment:
Evidence from OECD and emerging countries
country and the destination country. Xjt covers destination country specific characteristics
such as regulatory quality (Bénassy-Quéré et al., 2007) and FDI determinants in destination
country such as trade openess15, productivity, labour freedom index (Nordin et al., 2019), tax
burden (Djankov, Ganser, McLiesh, Ramalho, and Shleifer, 2010).16The variables used are de-
tailed in Table B.2. αi and ϕj represent source-host country fixed effect (dummy variables that
control the inward and outward multilateral resistance terms). γt is a time fixed effect (cap-
turing the global macroeconomic cycle) and εijt is a error term. Standard errors are clustered
by country pairs to control for potential heteroskedasticity and to limit the potential effect of
persistence over time of FDI stock levels in each pair of countries, see Fournier (2015). β2 is the
coefficient of interest; according to the litterature it is negative (Ghosh et al., 2012; Fournier,
2015; Mistura and Roulet, 2019).
Some values of our dependent variable are zero and the estimation using OLS leads to a bias
(zero FDI is associated with high bilateral fixed costs). To avoid biased estimation results, we
use the Pseudo-Maximum Likelihood estimator (PPML) suggested by Santos Silva and Ten-
reyro (2006) as in Chapter 1. We include in the estimation fixed effects by origin country to
control for unobservable multilateral resistance terms (Olivero and Yotov, 2012).17
2.5 Data description
To analyse the effects of restrictive measures on FDI stocks between OECD and emerging
countries, we use panel data across 49 countries from 2010 to 2019. Indeed, we consider OECD
countries because inward and outward FDI account for a large share of GDP and we include
emerging countries due to the high level of restrictions in FDI (see Figure 2.4). Annual data
from 2010-2019 to explain the decline in inward FDI since 2016, and to consider the new FDI
statistics introduced in 2014. Our dependent variable is aggregate bilateral FDI stock. The
data are collected on OECD Foreign Direct Investment Statistics.18
The data cover a range
of advanced and emerging countries in terms of origin and destination. However, we use
15Chakrabarti (2001) finds that a country’s degree of openness to international trade is a relevant determinant
of the FDI decision, because most investment projects concern the tradable sector.
16They estimate, using cross-sectional survey data for 85 developed and developing countries, that corporate
taxes always have a negative and significant effect on FDI inflows.
17We also estimated the model using destination country’s dummies, but the model presents convergence
issues (Santos Silva and Tenreyro, 2011).
18Data can be accessed at: https://stats.oecd.org/Index.aspx?DataSetCode=FDI_
POS_CTRY.
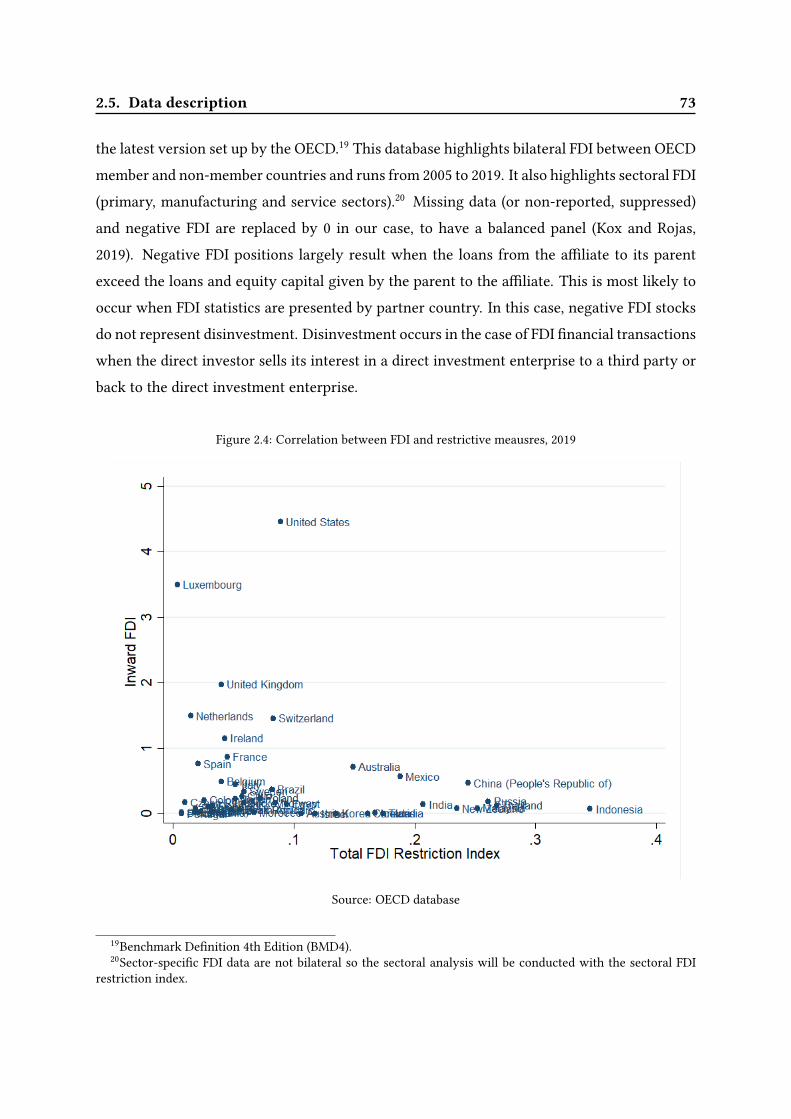
2.5. Data description 73
the latest version set up by the OECD.19This database highlights bilateral FDI between OECD
member and non-member countries and runs from 2005 to 2019. It also highlights sectoral FDI
(primary, manufacturing and service sectors).20
Missing data (or non-reported, suppressed)
and negative FDI are replaced by 0 in our case, to have a balanced panel (Kox and Rojas,
2019). Negative FDI positions largely result when the loans from the affiliate to its parent
exceed the loans and equity capital given by the parent to the affiliate. This is most likely to
occur when FDI statistics are presented by partner country. In this case, negative FDI stocks
do not represent disinvestment. Disinvestment occurs in the case of FDI financial transactions
when the direct investor sells its interest in a direct investment enterprise to a third party or
back to the direct investment enterprise.
Figure 2.4: Correlation between FDI and restrictive meausres, 2019
Source: OECD database
19Benchmark Definition 4th Edition (BMD4).
20Sector-specific FDI data are not bilateral so the sectoral analysis will be conducted with the sectoral FDI
restriction index.

74Chapter 2. The effects of restrictive measures on cross-border investment:
Evidence from OECD and emerging countries
Our interest variable captures the level of restrictiveness in FDI. We use FDI Regulatory Re-
strictiveness Index of OECD. Indeed, this variable measures the restrictiveness of the policies
implemented in the FDI sector in 70 countries (36 OECD countries and 34 non-OECD coun-
tries). It gauges the restrictiveness of a country’s FDI rules by looking at the four main types
of restrictions on FDI:
• Foreign equity limitations.
• Screening or approval mechanisms.
• Restrictions on the employment of foreigners as key personnel.
• Operational restrictions, e.g. restrictions on branching and on capital repatriation or on
land ownership.
The restrictions are also quantified in three sectors of activity: primary, secondary and ter-
tiary. Restrictions are evaluated on a 0 (open) to 1 (closed) scale. Data are available for 1997,
2003 and 2006 and uninterrupted annual data for the period 2010-2019. Data collected from
OECD FDI Regulatory Restrictiveness Index database. In addition, bilateral resistance vari-
ables such as the bilateral distance between the two capitals and binary variables (common
border, language and colonial links) come from CEPII (Centre d’ Etudes Prospectives et d’
Informations Internationales) database. Binary variables such as regional trade agreements
are obtained from the WTO (Regional Trade Agreements Information System, RTA-IS) and
information on the signing and ratification of bilateral investment treaties is taken from on
UNCTAD’s International Investment Agreements database. We consider the specific char-
acteristics of the destination country that affect inward FDI such as regulatory quality (data
available on Worldwide Governance Indicators). It refers to perceptions of the ability of the
government to formulate and implement sound policies and regulations that permit and pro-
mote private sector development. The indicator is estimated yearly at the country level, in
units of a standard normal distribution, ranging from approximately -2.5 to 2.5.
FDI determinants in destination countries such as tax burden and labour freedom index are
collected on The Heritage Foundation database.21
Tax burden is a composite measure that
reflects marginal tax rates on both personal and corporate income and the overall level of
21https://www.heritage.org/index.

2.6. FDI gravity results and discussion 75
taxation (including direct and indirect taxes) imposed by all levels of government as a per-
centage of gross domestic product (GDP). The labor freedom component is a quantitative
measure that considers various aspects of the legal and regulatory framework of a country’s
labor market, including regulations concerning minimum wages, laws inhibiting layofs, sev-
erance requirements, and measurable regulatory restraints on hiring and hours worked, plus
the labor force participation rate as an indicative measure of employment opportunities in the
labor market. These two indices are graded on a scale of 0 (less flexible) to 100 (more open or
flexible). Productivity are collected on OECD database.22
Human capital index is taken from
Penn World Table database of Groningen Growth and Development Centre.23
Trade open-
ness, GDP of exporting and importing countries are extracted from the World Bank database
(World Development Indicators)
2.6 FDI gravity results and discussion
This section presents and analyzes the empirical results. We estimate the effects of restrictive
measures on FDI stocks between OECD, emerging and Africa countries from 2010 to 2019.
Tables 2.4, 2.5 and 2.6 present the baseline gravity model results for cross-border FDI using
the OECD FDI restrictiveness index. Table 2.4 presents the results of restrictions on bilateral
FDI among advanced countries (intra-OECD) and Tables 2.5 and 2.6 respectively the results
on cross-border FDI among advanced and big emerging countries and between OECD and
middle-income emerging countries (African).24
In order to determine whether the effects of
FDI restrictions can be expected to differ for developed and developing economies, we include
a dummy variable equals 1 if the destination country is an OECD member in year t and an
interaction term with the variable of interest capturing their level of FDI restrictiveness (re-
sults presented in Tables 2.5 and 2.6). We confirmed the validity of our results using a series
of robustness tests presented in Tables B.5 to B.10. We apply the PPML estimator to control
for the zero FDI and heteroskedasticity issues, we also include country fixed effects to control
for structural multilateral resistance. It controls for unobserved heterogeneity, but does not
entirely resolve the "gold medal mistake" (Baldwin and Taglioni, 2006), because we need to
22It measured by GDP per hour worked (U.S dollars).
23This index refers to the number of years of schooling and return on education.
24The estimated coefficients from regressions pooling wealthy and poor economies may fail to capture the
true relationship between FDI and the explanatory variable of interest (Blonigen and Wang’s, 2004).

76Chapter 2. The effects of restrictive measures on cross-border investment:
Evidence from OECD and emerging countries
include time-varying country fixed effects, which is not possible in our analysis because it
significantly reduces the model’s degrees of freedom (Raphael and François, 2020). Therefore,
to better capture multilateral resistance and produce unbiased estimates, we include country
and time fixed effects separately. In order to see the impacts of our fixed effects, we include
in our first estimates all fixed effects (country and time) and secondly only the country fixed
effects. Due to the high multicollinearity between the primary, secondary and tertiary sectors
(Table B.4), we include only one of the three sector-specific indicators in the estimations.
2.6.1 Baseline results
In terms of variables of main interest - the FDI restrictiveness indices - we find that global FDI
restrictions have a negative and non-significant effect on intra-OECD FDI (Columns 1 and 2 of
Table 2.4). The reason is that the sectoral FDI regulation index is larger than the global index
(see Figure 2.5). Moreover, these restrictions represent a barrier to cross-border FDI among
OECD countries and the big emerging countries (Columns 1 and 2 of Table 2.5). The results
are robust without time fixed effects. The introduction of reforms leading to a 0.05 point re-
duction in level of FDI restrictiveness could increase bilateral FDI inward stocks by around
15.24 percent on average (column 1).25The interaction between our dummy variable and the
restrictive measures does not have a significant effect on FDI. The combined negative and
significant effect of global restrictive measures and non-significant effect of our interaction
term suggests that the negative effects of restrictions on FDI tend to be more accentuated for
emerging economies.26
This result confirms the findings of Mistura and Roulet (2019). Fur-
ther, global restrictive measures do not significantly affect cross-border FDI between OECD
and African countries (Table 2.6).27
The sectoral analysis of FDI restrictive measures shows significant negative effects of restric-
tions in the services sector on intra-OECD FDI. The effect of a 0.05 point reduction in FDI
restrictions in services is associated with a 12.29 percent increase in inward FDI (column 7
of Table 2.4). This is explained by the fact that services are the largest sector for inward FDI
in the OECD area and also one of the most restrictive compared to other sectors (see Table
2.1 and Figure 2.5). Indeed, the manufacturing sector, excluding defense and military goods,
25As in Chapter 1, the percentage change in inward FDI from a 0.05 point reduction in the FDI restrictiveness
index is calculated as follows: [exp(-0.05*coefficient)-1]*100.
26The reason is that global and sectoral restrictions, especially in services, are very high in emerging countries.
27We have a limited sample of African countries, which could explain these results.
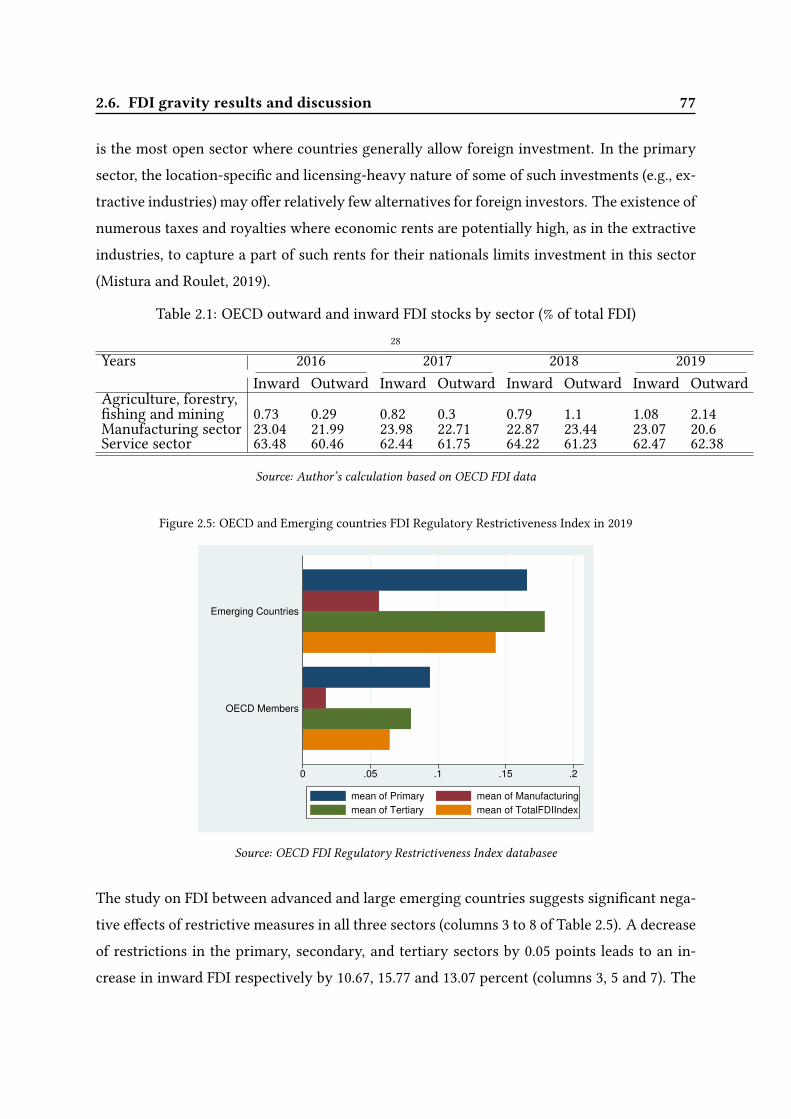
2.6. FDI gravity results and discussion 77
is the most open sector where countries generally allow foreign investment. In the primary
sector, the location-specific and licensing-heavy nature of some of such investments (e.g., ex-
tractive industries) may offer relatively few alternatives for foreign investors. The existence of
numerous taxes and royalties where economic rents are potentially high, as in the extractive
industries, to capture a part of such rents for their nationals limits investment in this sector
(Mistura and Roulet, 2019).
Table 2.1: OECD outward and inward FDI stocks by sector (% of total FDI)
28
Years 2016 2017 2018 2019
Inward Outward Inward Outward Inward Outward Inward Outward
Agriculture, forestry,
fishing and mining 0.73 0.29 0.82 0.3 0.79 1.1 1.08 2.14
Manufacturing sector 23.04 21.99 23.98 22.71 22.87 23.44 23.07 20.6
Service sector 63.48 60.46 62.44 61.75 64.22 61.23 62.47 62.38
Source: Author’s calculation based on OECD FDI data
Figure 2.5: OECD and Emerging countries FDI Regulatory Restrictiveness Index in 2019
0 .05 .1 .15 .2
OECD Members
Emerging Countries
mean of Primary mean of Manufacturing
mean of Tertiary mean of TotalFDIIndex
Source: OECD FDI Regulatory Restrictiveness Index databasee
The study on FDI between advanced and large emerging countries suggests significant nega-
tive effects of restrictive measures in all three sectors (columns 3 to 8 of Table 2.5). A decrease
of restrictions in the primary, secondary, and tertiary sectors by 0.05 points leads to an in-
crease in inward FDI respectively by 10.67, 15.77 and 13.07 percent (columns 3, 5 and 7). The

78Chapter 2. The effects of restrictive measures on cross-border investment:
Evidence from OECD and emerging countries
effects are most pronounced in the secondary sector. Indeed, the greenfield investments and
cross-border M&As in the world are significant in the manufacturing sector. In 2019, cross-
border M&A sales in manufacturing are valued at $243 billion, compared to $227 billion in
services and $37 billion in the primary sector. The greenfield investments in the manufactur-
ing sector are estimated at $402 billion, compared to $422 billion in services and $21 billion
in the primary sector (UNCTAD, 2021). The top industries in value terms are energy and gas
supply, information and communication, electronics and electrical equipment, food, bever-
ages and tobacco and pharmaceuticals. Interestingly, these restrictions have a greater impact
on inward FDI in emerging countries than in advanced countries. This is particularly relevant
when considering restrictions in the primary sector (columns 3 and 4). However, restrictive
measures in all three sectors do not significantly affect FDI between advanced and African
countries (columns 3 to 8 of Table 2.6).
The negative impacts of restrictive measures in FDI are due to high entry costs in the different
sectors. In addition to acting as a barrier to entry, this result may also underscore a potential
signaling effect of restrictions about the difficulties in doing business as a foreign investor,
including outside of the restricted sectors. Services are the sectors that receive the most FDI
and thus are the most affected by these restrictions.
In the different specifications, we also find the following effects: the standard gravity model
variables such as distance, common language and colonial links have the expected signs and
magnitudes and are statistically significant. Indeed, distance has negative and significant ef-
fects on cross-border FDI inflows among advanced and emerging countries as in the theory
(Bénassy-Quéré et al., 2005; Basile et al., 2008). Binary variables such as common language and
colonial links have positive and more significant effects on FDI between OECD and emerging
countries. Moreover, the common border has negative and significant impacts on FDI inflows,
which is contrary to the theory. This negative and significant sign is due to the substitutabil-
ity between trade and FDI, especially between countries that share the same border (Gregori
and Nardo, 2021).29
This can be explained by the European Monetary Union (Brouwer et al.,
2008, Martínez-San Román et al., 2016) and the single currency (Camarero et al., 2018; Alfieri,
2021). Regional trade agreements (RTAs) have significant positive effects on cross-border FDI.
The impacts tend to be more meaningful between OECD and emerging countries. Our results
support the idea developed by Carr et al. (2001) and Jang (2011). Bilateral investment treaties
29There is also a complementarity between trade and FDI.

2.6. FDI gravity results and discussion 79
(BITs) have negative and significant effects on cross-border FDI, more pronounced effects on
FDI across OECD and emerging countries. The BIT has different characteristics than the RTA,
it protects the investor against risks in the market receiving the FDI. It therefore establishes
transparency on the host country (Bergstrand and Egger, 2013). These agreements among ad-
vanced countries and emerging or developing countries (North-South investment) have much
greater effects than North-North agreements (Kox and Rojas, 2019). BITs affect negatively FDI
inflows when the political risk in a country is high whereas the opposite occurs when the risk
level is low (Tobin and Rose-Ackerman, 2005).30
This variable has negative and significant
effects if the quality of institutions is bad.
If we consider the determinants and explanatory factors of FDI, the regulatory quality variable
is positively related to cross-border FDI, highlighting the proactive role that public adminis-
tration can exert to stimulate foreign investment (Gregori and Nardo, 2021). Trade openness
attracts investment because of a complementarity between FDI and trade (Belke and Clemens,
2018). The dynamism of the destination economy has positive and significant impacts on FDI.
These results confirm that the size of the destination country’s market boosts cross-border
investments by creating additional market shares, economies of scale, or reducing production
costs for foreign investors (Eicher et al., 2012). Likewise, the dynamism of investing country
is positively related to cross-border flows (Gregori and Nardo, 2021). The productivity mea-
sured by the GDP per hour employed is positively associated with FDI. Like the GDP of the
destination country, productivity in the destination economy creates economies of scale and
reduces production costs, which attracts cross-border FDI. The difference in relative human
capital endowment has a negative and non-significant effect. As Gregori and Nardo (2021), the
tax indicator does not have a significant effect on FDI flows, explained by the predominance
of market factors over institutional aspects in driving cross-border investments (Gherghina,
Simionescu and Hudea, 2019). Labor market flexibility attracts cross-border FDI. Indeed, la-
bor market standards and regulations or any limitation placed on employment lead to labor
market rigidity, which imposes costs on firms (Nordin et al., 2019).31
30They find negative and more significant effects of BITs on cross-border FDI among advanced and emerging
countries (where the political risk is higher).
31Their study argues that the growth-effect of FDI is possibly influenced by the flexibility of the labor market
in the host country.

80Chapter 2. The effects of restrictive measures on cross-border investment:
Evidence from OECD and emerging countries
2.6.2 Robustness check
In this section, we performed several robustness tests to confirm our baseline results. First, we
split our sample in two periods (2010-2014) and (2015-2019) and examine the different effects
of restrictive measures on FDI between advanced and emerging countries including African
countries. This test highlights two trends: the effects of the policy on international guidelines
for the compilation of foreign direct investment (FDI) statistics implemented in many coun-
tries in 2014 and the impacts of the 2008-2009 financial crisis that led to a stagnation of FDI.32
We consider the different trends between 2010-2014 (effect of the crisis) and 2015-2019 (effect
of the new policy for the compilation of FDI statistics). The results are presented in Table B.5
and Table B.6 and show more significant effects from 2015 to 2019 due to the financial crisis
effects and confirm our results found above. However, during this period, global restrictive
measures and those in the secondary sector are negatively and significantly associated with
FDI across OECD countries. The effects in the secondary sector refer to the existing literature
on the effects of restrictions in services on the performance of manufacturing firms (Ariu et
al., 2019; Ariu et al., 2020; Amara, 2021). Indeed, restrictions on FDI in services have an im-
pact on the productivity of manufacturing firms (increased costs of sourcing services) as they
increasingly use services as an important input of manufacturing value added.
Interestingly, restrictive measures in the secondary sector boost FDI between OECD and
African countries (2010 to 2014), with greater effects on inward FDI for African countries
(Table B.5). The reason is that the index in this sector measures FDI restrictions in the food,
chemical, metal, and electronics industries. Contrary to OECD countries where these sectors
are developed with more competition, they are still nascent in North and South Africa with
lower competition. An increase in restrictions in this sector leads to a rise in economic rents
from FDI (Rouzet and Spinelli, 2016).
The second test investigates the effects of restrictive measures firstly on FDI between ad-
vanced countries and the BRICS countries33, considered as large emerging countries, and
finally between the OECD and the non-BRICS emerging countries in our sample. This test
shows whether the effects are different depending on emerging countries’ economic weight.
The results presented in the Table B.7 show that the global restrictions and those in the three
32Gregori and Nardo (2021) observed a stagnation of inward M&As in EU countries during 2011-14.
33Brazil, Russia, India, China and South Africa.

2.6. FDI gravity results and discussion 81
sectors have negative and more significant impacts on the BRICS than on the other emerging
countries.
The third test analyzes the robustness of the negative effects of restrictive measures in the
service sector on inward FDI between OECD countries. We use the OECD’s Services Trade
Restrictiveness Index (STRI) as an alternative index to measure restrictions in the services
sector.34
The two indicators (STRI and FDI RI) are very similar in that they capture the re-
strictions affecting trade in services. Both indexes include in the overall measure the control
on foreign entry perceived as very restrictive.35The basic difference between the two indexes
is that for the STRI, information was collected by looking into each country’s laws and reg-
ulations currently in force and identifying relevant restrictions, while the OECD FDI RI does
not take into account the actual implementation of legal restrictions. It is based on statutory
measures as reflected in official OECD instruments or identified in OECD Investment Policy
Reviews and yearly monitoring reports. Therefore, the OECD STRI is broadly defined, cap-
turing restrictions on any of the channels of international services trade, not just FDI (mode 3
"commercial presence" defined by theWTO). Our results presented in Table B.8 show negative
and significant effects of both indicators on inward FDI in OECD countries.36
This test con-
firms the negative effect of restrictive measures in the services sector on inward FDI among
OECD countries (Jungmittag and Marschinski, 2020).37
OECD inward and outward FDI in the services sector are the highest in comparison to the
other two sectors (accounts for almost 60% of total FDI, see Table 2.1) and considering Table
2.2, foreign investments in the financial sector are the most significant of cross-border FDI in
services. We then look at the effects of restrictions in the financial services sector on intra-
OECD FDI. Using the two indexes in financial services, we find that the restrictions in this
sector are negatively and non-significantly correlated with inward FDI (columns 3 and 4 of
table B.8). Contrary to the financial sector, restrictive measures in the business sector have
significant negative effects on intra-OECD FDI (columns 5 and 6).38A decline of the index by
34The STRI information was outlined in Chapter 1, We use the measure of restrictions on foreign entry in the
services sector.
35Foreign equity limitations in FDI RI.
36We considered the sample from 2014 to 2019 to compare the results between the two indexes because the
STRI index ranges from 2014 to 2020.
37They find that services trade restrictions (STRI) represent a significant barrier to bilateral greenfield FDI
between 42 destination countries and 41 source countries from 2014 to 2018.
38The business sector encompasses legal services, audit, accountancy, architectural and engineering. This
sector is very restrictive due to high entry costs such as expertise, qualifications and nationality requirements.

82Chapter 2. The effects of restrictive measures on cross-border investment:
Evidence from OECD and emerging countries
0.05 point in this sector is associated with an increase in inward FDI by 7 percent (column
5). The analysis of the disaggregated financial sector restrictions shows significant negative
effects in the other finance sectors and non-significant effects in the banking and insurance
sector. A 0.05 point decrease in other finance sectors restrictions leads to a rise in OECD FDI
by 6.22 percent.39
Table 2.2: OECD outward and inward FDI by service sector (% of service FDI)
Years 2015 2016 2017 2018 2019
Financial Inward 60.57 62.2 62.04 55.07 59.57
and insuranceactivities Outward 65.44 65.71 66.87 65.19 68.25
Wholesale and retail Inward 11.89 11.49 13.79 12.57 13.6
trade repair of motorvehicles and motorcycles Outward 8.7 8.94 8.56 9.03 7.83
Transportation Inward 2.25 2.38 2.56 2.98 2.59
and storage Outward 1.58 1.52 1.59 1.88 1.77
Source: Author’s calculation based on OECD FDI data
The two tests below estimate the effects of restrictive measures on FDI between OECD and
emerging countries by type of economy. The big emerging countries have economies more
oriented to the manufacturing and agricultural sectors than the North and South African
countries where the main economic activity is agriculture and natural resources (see Table
2.3). In the first part, we study the effects of restrictions in the agricultural and manufacturing
sectors on FDI between OECD countries and large emerging economies (results reported in
Table B.9) and the second the effects of restrictions in the agricultural and natural resources
sectors (mining, oil and gas, etc.) on FDI among OECD and African countries (Table B.10).
39The other finance sectors cover other financial services activities whose primarily concerned with distribut-
ing funds other than by making loans: factoring activities - writing of swaps, options and other hedging arrange-
ments, venture capital companies, investment clubs etc.
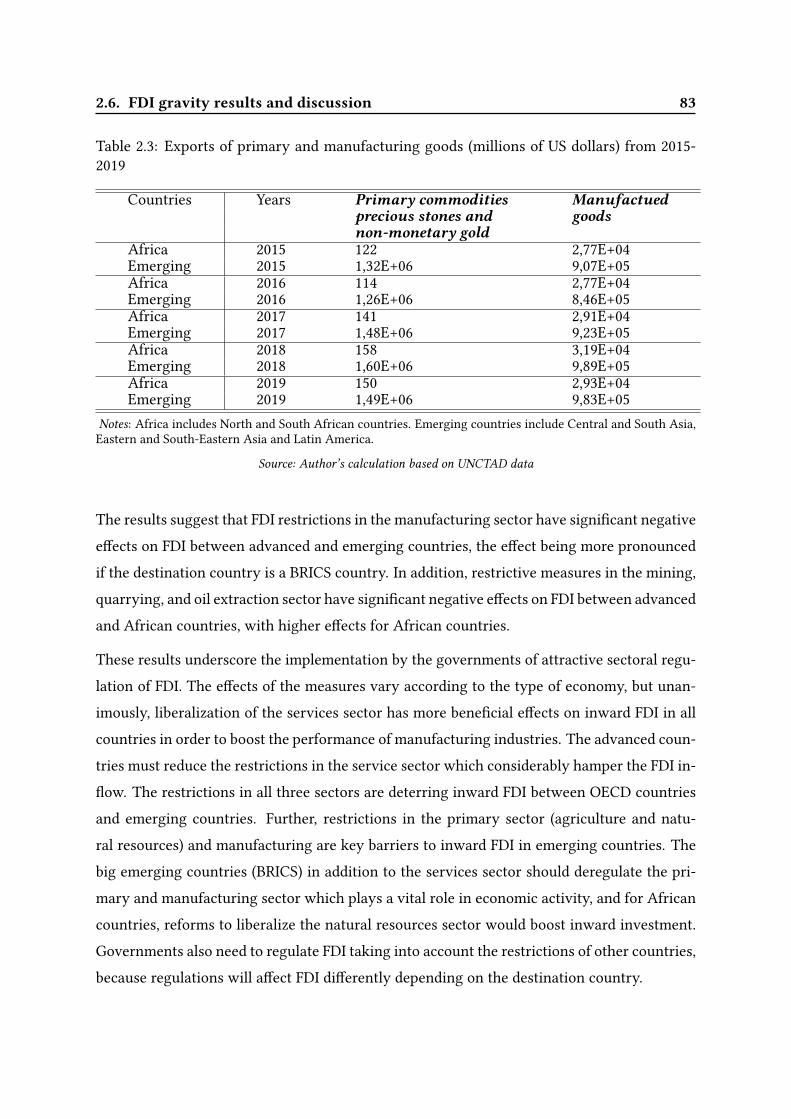
2.6. FDI gravity results and discussion 83
Table 2.3: Exports of primary and manufacturing goods (millions of US dollars) from 2015-
2019
Countries Years Primary commodities Manufactuedprecious stones and goodsnon-monetary gold
Africa 2015 122 2,77E+04
Emerging 2015 1,32E+06 9,07E+05
Africa 2016 114 2,77E+04
Emerging 2016 1,26E+06 8,46E+05
Africa 2017 141 2,91E+04
Emerging 2017 1,48E+06 9,23E+05
Africa 2018 158 3,19E+04
Emerging 2018 1,60E+06 9,89E+05
Africa 2019 150 2,93E+04
Emerging 2019 1,49E+06 9,83E+05
Notes: Africa includes North and South African countries. Emerging countries include Central and South Asia,
Eastern and South-Eastern Asia and Latin America.
Source: Author’s calculation based on UNCTAD data
The results suggest that FDI restrictions in the manufacturing sector have significant negative
effects on FDI between advanced and emerging countries, the effect being more pronounced
if the destination country is a BRICS country. In addition, restrictive measures in the mining,
quarrying, and oil extraction sector have significant negative effects on FDI between advanced
and African countries, with higher effects for African countries.
These results underscore the implementation by the governments of attractive sectoral regu-
lation of FDI. The effects of the measures vary according to the type of economy, but unan-
imously, liberalization of the services sector has more beneficial effects on inward FDI in all
countries in order to boost the performance of manufacturing industries. The advanced coun-
tries must reduce the restrictions in the service sector which considerably hamper the FDI in-
flow. The restrictions in all three sectors are deterring inward FDI between OECD countries
and emerging countries. Further, restrictions in the primary sector (agriculture and natu-
ral resources) and manufacturing are key barriers to inward FDI in emerging countries. The
big emerging countries (BRICS) in addition to the services sector should deregulate the pri-
mary and manufacturing sector which plays a vital role in economic activity, and for African
countries, reforms to liberalize the natural resources sector would boost inward investment.
Governments also need to regulate FDI taking into account the restrictions of other countries,
because regulations will affect FDI differently depending on the destination country.

84Chapter 2. The effects of restrictive measures on cross-border investment:
Evidence from OECD and emerging countries
2.7 Conclusion
This paper, which investigates the effects of restrictive measures on FDI, contributes to the lit-
erature on the impact of restrictions on FDI, but differs from recent studies because it examines
the sectoral effects of FDI restrictions on cross-border FDI between advanced and emerging
countries.
Using a gravity model we examined the effects of global and sectoral restrictive measures
on FDI among OECD countries, between advanced and large emerging countries and finally
between advanced and African countries from 2010 to 2019. Our results suggest that global
restrictive measures do not significantly affect cross-border FDI in OECD countries, while
restrictions in the service sector have negative and significant effects on FDI. Moreover, the
overall restrictive measures and those in the primary, secondary and tertiary sector negatively
impact inward FDI among OECD and big emerging countries. The restrictions in the primary
sector are a main obstacle to inward FDI in big emerging countries. In addition, global and
sectoral restrictions do not have a significant effect on FDI between advanced and African
countries.
The results are robust to the baseline results. Several tests are performed. First, we estimated
the effects of global and sectoral restrictions between advanced and emerging countries in the
period 2010 to 2014 and 2015 to 2019. The results confirmed our baseline results and showed
more significant effects in the period 2015 to 2019. The second test examined the impacts of
restrictive measures on the BRICS and on emerging countries excluding the BRICS, the results
are more significant on the BRICS than on other emerging countries. The third test assessed
the robustness of the restrictive effects of measures in services on intra-OECD FDI using the
STRI. The results show negative and significant effects of restrictions in services and non-
significant effects in the global financial sector on intra-OECD FDI. Restrictive measures in
the business sector have significant negative impacts on intra-OECD FDI. We also estimate
the effects of disaggregated financial services restrictions on intra-OECD FDI. The results in-
dicate that restrictions in other finance services are negatively associated with cross-border
FDI in OECD countries. The last two tests showed that restrictive measures in the manu-
facturing sector have restrictive impacts on inward FDI in emerging economies, particularly
in the BRICS, and that restrictions in the mining, quarrying, and oil extraction sector are an
obstacle to inward FDI in African countries.

2.7. Conclusion 85
We could improve our study by considering financial FDI such as M&A. However, there are
some important limitations, mainly related to the data. First, FDI restrictions have some lim-
itations, notably that they are time-invariant for some sectors. Second, it would be really
interesting to also examine the effects of these restrictive measures on domestic investment
in future research.
This paper highlighted the detrimental impact of restrictive measures on cross-border FDI. It
showed the negative impacts of sectoral restrictions depending on the type of economy re-
ceiving the FDI. From this study, we conclude that the drop of inward FDI in OECD countries
since 2016 is due to a rise of restrictive and protectionist policies in order to protect local firms,
the exit of the United Kingdom from the EU (Brexit). It is also the result of Donald Trump’s tax
cuts since 2017. This measure led to repatriation of profits into United States. This decrease
is probably due to the trade war between China and United States, which has a considerable
effect on production and investment in global value chains.

86Chapter 2. The effects of restrictive measures on cross-border investment:
Evidence from OECD and emerging countries
2.8 Appendix: Baseline results

2.8. Appendix: Baseline results 87
Table 2.4: The impacts of restrictive measures on FDI stocks: Intra-OECD countries
Specification PPML EstimateDependant variable
FDIij,tGDPdeflatorij,t
Years 2010-2019Global FDI RI Sectoral FDI RI
Primary Secondary Tertiary
Model (1) (2) (3) (4) (5) (6) (7) (8)
FDI RI Globalj,t−1 -1.4577 -1.5775
(1.2565) (1.2897)
FDI RI Primaryj,t−1 0.4801 0.5091
(0.5756) (0.5922)
FDI RI Secondaryj,t−1 -1.5998 -1.7959
(1.2417) (1.2573)
FDI RI Tertiaryj,t−1 -2.3188∗∗
-2.5034∗∗
(1.0835) (1.1179)
Ln FDIij,t−1 0.7409∗∗∗
0.6660∗∗∗
0.7410∗∗∗
0.6648∗∗∗
0.7398∗∗∗
0.6648∗∗∗
0.7363∗∗∗
0.6628∗∗∗
(0.0642) (0.0627) (0.0643) (0.0624) (0.0645) (0.0629) (0.0641) (0.0625)
Ln distanceij,t−1 -0.6828∗∗∗
-0.7486∗∗∗
-0.7330∗∗∗
-0.8060∗∗∗
-0.7003∗∗∗
-0.7672∗∗∗
-0.6650∗∗∗
-0.7278∗∗∗
(0.1065) (0.1110) (0.1125) (0.1155) (0.1101) (0.1147) (0.1118) (0.1179)
Common borderij,t−1 -0.2408∗∗
-0.2492∗∗
-0.2804∗∗
-0.2916∗∗
-0.2459∗∗
-0.2539∗∗
-0.2119∗∗
-0.2182∗∗
(0.1096) (0.1138) (0.1118) (0.1167) (0.1080) (0.1122) (0.1070) (0.1110)
Common langij,t−1 0.1198 0.1324 0.0915 0.1010 0.1186 0.1319 0.1372 0.1508
(0.1004) (0.1060) (0.1049) (0.1112) (0.1026) (0.1083) (0.0980) (0.1031)
Colonial linksij,t−1 0.2322∗∗
0.2398∗∗
0.2376∗∗
0.2454∗∗
0.2293∗∗
0.2361∗∗
0.2075∗
0.2131∗
(0.1159) (0.1181) (0.1180) (0.1204) (0.1154) (0.1174) (0.1141) (0.1162)
RTAij,t−1 0.2427∗∗
0.1999 0.1997∗
0.1490 0.2347∗∗
0.1921 0.2678∗∗
0.2287∗
(0.1136) (0.1238) (0.1098) (0.1175) (0.1155) (0.1258) (0.1229) (0.1346)
BITij,t−1 -0.1987 -0.2181 -0.1561 -0.1712 -0.2021 -0.2244 -0.2715∗
-0.2968∗
(0.1425) (0.1500) (0.1298) (0.1364) (0.1396) (0.1469) (0.1533) (0.1614)
Ln GDPi,t−1 -0.2783 0.2175∗∗∗
-0.2764 0.2175∗∗∗
-0.2778 0.2171∗∗∗
-0.2797 0.2172∗∗∗
(0.1864) (0.0255) (0.1872) (0.0255) (0.1869) (0.0254) (0.1865) (0.0255)
Ln GDPj,t−1 1.5614∗∗∗
1.6049∗∗∗
1.5618∗∗∗
1.6064∗∗∗
1.5452∗∗∗
1.5853∗∗∗
1.5315∗∗∗
1.5716∗∗∗
(0.1427) (0.1455) (0.1489) (0.1522) (0.1406) (0.1434) (0.1407) (0.1429)
Trade opennessj,t−1 0.9049∗∗∗
0.9315∗∗∗
0.9404∗∗∗
0.9704∗∗∗
0.9143∗∗∗
0.9403∗∗∗
0.8830∗∗∗
0.9067∗∗∗
(0.1001) (0.1011) (0.1008) (0.1029) (0.1013) (0.1029) (0.0999) (0.1007)
Regulatory qualityj,t−1 0.1206∗∗∗
0.1755∗∗∗
0.1153∗∗∗
0.1700∗∗∗
0.1248∗∗∗
0.1798∗∗∗
0.1220∗∗∗
0.1770∗∗∗
(0.0442) (0.0425) (0.0443) (0.0425) (0.0443) (0.0426) (0.0434) (0.0416)
Ln productivityj,t−1 0.8190∗
0.6613 0.8967∗∗
0.7373∗
0.8190∗
0.6605 0.6804 0.5220
(0.4410) (0.4474) (0.3917) (0.3986) (0.4290) (0.4360) (0.4529) (0.4586)
Ln tax burdenj,t−1 0.1611 0.0588 -0.0651 -0.1839 0.0521 -0.0548 0.3485 0.2633
(0.6004) (0.6089) (0.6268) (0.6360) (0.6178) (0.6255) (0.5897) (0.5996)
HCDij,t−1 -0.0398 0.2990 -0.0491 0.2798 -0.1181 0.2037 -0.1558 0.1665
(1.1792) (1.2344) (1.1885) (1.2520) (1.1749) (1.2316) (1.1968) (1.2514)
Ln labor freedomj,t−1 1.7763∗∗∗
1.9088∗∗∗
1.6486∗∗∗
1.7742∗∗∗
1.7963∗∗∗
1.9325∗∗∗
1.8512∗∗∗
1.9828∗∗∗
(0.4482) (0.4627) (0.4310) (0.4467) (0.4472) (0.4606) (0.4502) (0.4640)
Time-FE Yes No Yes No Yes No Yes No
Country-FE Yes Yes Yes Yes Yes Yes Yes Yes
R20.8371 0.8330 0.8369 0.8328 0.8371 0.8330 0.8378 0.8339
Observations 12391 12391 12391 12391 12391 12391 12391 12391
Notes: The dependent variable is bilateral FDI stocks. Columns (1) and (2) represent the results of the impact of
global FDI restrictiveness index on cross-border investment and (3) to (8) the results of sector-specific restric-
tiveness of FDI. Standard errors are reported in parentheses and clustered by country- pair level. *, **, *** denote
significance at the 10% 5% and 1% level respectively.

88Chapter 2. The effects of restrictive measures on cross-border investment:
Evidence from OECD and emerging countries
Table 2.5: The impacts of restrictive measures on FDI stocks: OECD vs. Emerging countries
Specification PPML EstimateDependant variable
FDIij,tGDPdeflatorij,t
Years 2010-2019Global FDI RI Sectoral FDI RI
Primary Secondary Tertiary
Model (1) (2) (3) (4) (5) (6) (7) (8)
FDI RI Globalj,t−1 -2.8372∗∗∗
-2.7090∗∗∗
(0.8605) (0.8676)
FDI RI Primaryj,t−1 -2.0281∗∗∗
-2.1037∗∗∗
(0.7121) (0.7126)
FDI RI Secondaryj,t−1 -2.9298∗∗
-2.5940∗∗
(1.1595) (1.1635)
FDI RI Tertiaryj,t−1 -2.4579∗∗∗
-2.3285∗∗∗
(0.7285) (0.7253)
OECD dumj ∗ FDI RI Globalj,t−1 1.8073 1.0522
(1.9091) (1.6975)
OECD dumj ∗ FDI RI Primaryj,t−1 2.9714∗∗∗
2.8354∗∗∗
(0.9868) (0.9619)
OECD dumj ∗ FDI RI Secondaryj,t−1 1.4257 0.4349
(1.9882) (1.9221)
OECD dumj ∗ FDI RI Tertiaryj,t−1 0.2982 -0.2638
(1.7310) (1.5068)
OECD dumj 1.6942∗∗∗
0.2383 1.5349∗∗∗
-0.0551 2.0036∗∗∗
0.4249∗
1.6686∗∗∗
0.3481
(0.5514) (0.2899) (0.5476) (0.2592) (0.6000) (0.2227) (0.5323) (0.3008)
Ln FDIij,t−1 0.1037∗∗
0.2169∗∗∗
0.1026∗∗
0.2153∗∗∗
0.1070∗∗
0.2199∗∗∗
0.1032∗∗
0.2155∗∗∗
(0.0482) (0.0449) (0.0490) (0.0459) (0.0480) (0.0449) (0.0466) (0.0436)
Ln distanceij,t−1 -1.1267∗∗∗
-1.0958∗∗∗
-1.1832∗∗∗
-1.1587∗∗∗
-1.1335∗∗∗
-1.1114∗∗∗
-1.1049∗∗∗
-1.0739∗∗∗
(0.1373) (0.1336) (0.1430) (0.1381) (0.1393) (0.1349) (0.1404) (0.1362)
Common borderij,t−1 -0.4442∗∗∗
-0.4240∗∗∗
-0.4733∗∗∗
-0.4674∗∗∗
-0.4400∗∗∗
-0.4242∗∗∗
-0.4130∗∗∗
-0.3917∗∗∗
(0.1512) (0.1497) (0.1526) (0.1543) (0.1494) (0.1478) (0.1482) (0.1465)
Common langij,t−1 0.2863∗
0.3148∗∗
0.2537∗
0.2767∗
0.2883∗
0.3176∗∗
0.3079∗∗
0.3332∗∗
(0.1499) (0.1485) (0.1538) (0.1535) (0.1510) (0.1488) (0.1452) (0.1440)
Colonial linksij,t−1 0.3773∗∗
0.3702∗∗
0.3724∗∗
0.3726∗∗
0.3730∗∗
0.3640∗∗
0.3535∗∗
0.3450∗∗
(0.1575) (0.1551) (0.1588) (0.1596) (0.1550) (0.1524) (0.1553) (0.1516)
BITij,t−1 -0.3391∗
-0.3866∗∗
-0.3312∗∗
-0.3581∗∗
-0.3560∗∗
-0.4056∗∗
-0.4001∗∗
-0.4456∗∗
(0.1782) (0.1730) (0.1688) (0.1677) (0.1741) (0.1698) (0.1864) (0.1785)
RTAij,t−1 0.3363∗∗
0.3709∗∗∗
0.2911∗∗
0.3216∗∗
0.3343∗∗
0.3641∗∗
0.3576∗∗
0.3910∗∗∗
(0.1447) (0.1398) (0.1433) (0.1359) (0.1491) (0.1438) (0.1527) (0.1477)
Ln GDPi,t−1 -0.1195∗
0.2004∗∗∗
-0.1292∗
0.2039∗∗∗
-0.1278∗
0.1951∗∗∗
-0.1003 0.1997∗∗∗
(0.0702) (0.0300) (0.0669) (0.0305) (0.0689) (0.0289) (0.0689) (0.0300)
Ln GDPj,t−1 2.4201∗∗∗
2.4362∗∗∗
2.3949∗∗∗
2.4413∗∗∗
2.3809∗∗∗
2.3937∗∗∗
2.3738∗∗∗
2.3840∗∗∗
(0.1279) (0.1315) (0.1319) (0.1336) (0.1268) (0.1278) (0.1267) (0.1287)
Trade opennessj,t−1 1.4140∗∗∗
1.4634∗∗∗
1.4541∗∗∗
1.5245∗∗∗
1.3993∗∗∗
1.4574∗∗∗
1.3697∗∗∗
1.4159∗∗∗
(0.1158) (0.1156) (0.1152) (0.1150) (0.1149) (0.1128) (0.1154) (0.1139)
Regulatory qualityj,t−1 0.1654∗∗
0.1847∗∗∗
0.1719∗∗∗
0.1920∗∗∗
0.1715∗∗∗
0.1955∗∗∗
0.1606∗∗
0.1750∗∗∗
(0.0650) (0.0632) (0.0638) (0.0624) (0.0649) (0.0635) (0.0644) (0.0624)
Ln productivityj,t−1 0.7602∗∗∗
0.2163∗∗∗
0.7376∗∗∗
0.1715∗∗
0.7752∗∗∗
0.1973∗∗∗
0.7316∗∗∗
0.2356∗∗∗
(0.1843) (0.0730) (0.1731) (0.0673) (0.2013) (0.0724) (0.1807) (0.0749)
Ln tax burdenj,t−1 -0.1956 -0.3006 -0.4863 -0.6821 -0.2571 -0.4280 0.0994 0.0189
(0.6736) (0.6583) (0.7052) (0.6814) (0.6988) (0.6728) (0.6739) (0.6609)
HCDij,t−1 -0.4566 -1.0753 -0.4359 -1.0308 -0.7512 -1.4080 -0.5248 -1.1206
(1.1578) (1.1411) (1.1496) (1.1393) (1.1487) (1.1218) (1.1549) (1.1448)
Ln labor freedomj,t−1 2.4041∗∗∗
2.3610∗∗∗
2.3065∗∗∗
2.2481∗∗∗
2.4131∗∗∗
2.3772∗∗∗
2.4688∗∗∗
2.4125∗∗∗
(0.5323) (0.5189) (0.5141) (0.5001) (0.5344) (0.5196) (0.5368) (0.5224)
Time-FE Yes No Yes No Yes No Yes No
Country-FE Yes Yes Yes Yes Yes Yes Yes Yes
R20.7993 0.7877 0.7992 0.7874 0.7989 0.7874 0.8002 0.7889
Observations 19449 19449 19449 19449 19449 19449 19449 19449
Notes: The dependent variable is bilateral FDI stocks. Columns (1) and (2) represent the results of the impact of
global FDI restrictiveness index on cross-border investment and (3) to (8) the results of sector-specific restric-
tiveness of FDI. Standard errors are reported in parentheses and clustered by country- pair level. *, **, *** denote
significance at the 10% 5% and 1% level respectively.

2.8. Appendix: Baseline results 89
Table 2.6: The Impacts of Restrictive Measures on FDI Stocks: OECD vs. African countries
Specification PPML EstimateDependant variable
FDIij,tGDPdeflatorij,t
Years 2010-2019Global FDI RI Sectoral FDI RI
Primary Secondary Tertiary
Model (1) (2) (3) (4) (5) (6) (7) (8)
FDI RI Globalj,t−1 -1.6162 -0.9225
(3.7637) (3.5504)
FDI RI Primaryj,t−1 -1.7933 -1.4645
(2.7210) (2.6931)
FDI RI Secondaryj,t−1 7.5160 6.7006
(6.5403) (6.5831)
FDI RI Tertiaryj,t−1 -2.1809 -1.4656
(3.2296) (2.9692)
OECD dumj ∗ FDI RI Globalj,t−1 -0.0712 -0.7046
(4.4800) (4.2073)
OECD dumj ∗ FDI RI Primaryj,t−1 2.7402 2.4152
(2.8935) (2.8643)
OECD dumj ∗ FDI RI Secondaryj,t−1 -9.8175 -9.1310
(6.8840) (6.9126)
OECD dumj ∗ FDI RI Tertiaryj,t−1 -0.7473 -1.2855
(3.8747) (3.5207)
OECD dumj 1.9968∗
1.1963∗∗
1.8211∗
1.0080∗∗
2.2279∗∗
1.3780∗∗∗
1.8155∗
1.2257∗∗
(1.1026) (0.5064) (1.0318) (0.4575) (1.1136) (0.5073) (0.9783) (0.5345)
Ln FDIij,t−1 0.0983∗∗
0.1970∗∗∗
0.0975∗
0.1959∗∗∗
0.0987∗∗
0.1965∗∗∗
0.0976∗∗
0.1973∗∗∗
(0.0489) (0.0460) (0.0501) (0.0471) (0.0484) (0.0456) (0.0471) (0.0445)
Ln distanceij,t−1 -1.0968∗∗∗
-1.0735∗∗∗
-1.1746∗∗∗
-1.1498∗∗∗
-1.1073∗∗∗
-1.0828∗∗∗
-1.0706∗∗∗
-1.0439∗∗∗
(0.1550) (0.1492) (0.1611) (0.1557) (0.1578) (0.1510) (0.1607) (0.1530)
Common borderij,t−1 -0.4014∗∗
-0.3946∗∗
-0.4484∗∗∗
-0.4416∗∗∗
-0.4025∗∗
-0.3938∗∗
-0.3609∗∗
-0.3534∗∗
(0.1602) (0.1593) (0.1631) (0.1636) (0.1580) (0.1571) (0.1562) (0.1557)
Common langij,t−1 0.2564∗
0.2730∗
0.2143 0.2302 0.2646∗
0.2834∗
0.2771∗
0.2911∗∗
(0.1530) (0.1535) (0.1590) (0.1591) (0.1539) (0.1533) (0.1477) (0.1484)
Colonial linksij,t−1 0.3816∗∗
0.3795∗∗
0.3776∗∗
0.3767∗∗
0.3741∗∗
0.3704∗∗
0.3540∗∗
0.3544∗∗
(0.1581) (0.1585) (0.1604) (0.1622) (0.1555) (0.1550) (0.1552) (0.1549)
BITij,t−1 -0.3486∗
-0.3623∗
-0.3073 -0.3237∗
-0.3727∗
-0.3898∗∗
-0.4400∗∗
-0.4437∗∗
(0.2064) (0.2012) (0.1903) (0.1890) (0.2000) (0.1960) (0.2196) (0.2120)
RTAij,t−1 0.3800∗∗
0.4031∗∗
0.3066∗∗
0.3327∗∗
0.3851∗∗
0.4108∗∗
0.4156∗∗
0.4374∗∗∗
(0.1650) (0.1568) (0.1560) (0.1485) (0.1688) (0.1618) (0.1792) (0.1693)
Ln GDPi,t−1 0.1099 0.2211∗∗∗
0.1096 0.2211∗∗∗
0.1102 0.2213∗∗∗
0.1319 0.2206∗∗∗
(0.1160) (0.0310) (0.1060) (0.0309) (0.1091) (0.0309) (0.1111) (0.0308)
Ln GDPj,t−1 2.4123∗∗∗
2.4428∗∗∗
2.4029∗∗∗
2.4308∗∗∗
2.3865∗∗∗
2.4128∗∗∗
2.3537∗∗∗
2.3794∗∗∗
(0.1469) (0.1431) (0.1544) (0.1466) (0.1451) (0.1411) (0.1440) (0.1418)
Trade opennessj,t−1 1.4150∗∗∗
1.4650∗∗∗
1.4696∗∗∗
1.5170∗∗∗
1.4214∗∗∗
1.4672∗∗∗
1.3665∗∗∗
1.4114∗∗∗
(0.1235) (0.1161) (0.1237) (0.1128) (0.1229) (0.1128) (0.1221) (0.1159)
Regulatory qualityj,t−1 0.1628∗∗
0.1623∗∗
0.1593∗∗
0.1601∗∗
0.1760∗∗∗
0.1746∗∗∗
0.1608∗∗
0.1563∗∗
(0.0675) (0.0645) (0.0663) (0.0633) (0.0675) (0.0649) (0.0664) (0.0634)
Ln productivityj,t−1 0.8370∗∗
0.5537∗∗∗
0.8586∗∗
0.5842∗∗∗
0.8153∗∗
0.5379∗∗∗
0.7563∗∗
0.5367∗∗∗
(0.3921) (0.1551) (0.3456) (0.1444) (0.3668) (0.1515) (0.3673) (0.1614)
Ln tax burdenj,t−1 -0.0404 -0.0989 -0.3721 -0.4222 -0.1807 -0.2216 0.2596 0.2073
(0.7608) (0.7090) (0.7968) (0.7418) (0.7773) (0.7242) (0.7521) (0.7089)
HCDij,t−1 -0.1014 -0.5337 -0.1689 -0.6342 -0.2021 -0.6500 -0.1914 -0.6324
(1.5285) (1.5348) (1.5313) (1.5437) (1.5239) (1.5281) (1.5324) (1.5434)
Ln labor freedomj,t−1 2.6334∗∗∗
2.5221∗∗∗
2.4726∗∗∗
2.3632∗∗∗
2.6698∗∗∗
2.5734∗∗∗
2.7264∗∗∗
2.5983∗∗∗
(0.5807) (0.5548) (0.5549) (0.5301) (0.5769) (0.5535) (0.5837) (0.5584)
Time-FE Yes No Yes No Yes No Yes No
Country-FE Yes Yes Yes Yes Yes Yes Yes Yes
R20.8039 0.7955 0.8040 0.7956 0.8043 0.7959 0.8051 0.7966
Observations 15213 15213 15213 15213 15213 15213 15213 15213
Notes: The dependent variable is bilateral FDI stocks. (1) and (2) represent the results of the impact of global FDI
restrictiveness index on cross-border investment and (3) to (8) the results of sector-specific restrictiveness of FDI.
Standard errors are reported in parentheses and clustered by country- pair level. *, **, *** denote significance at
the 10% 5% and 1% level respectively.


Chapter 3
Modeling the impact of non-tariffbarriers in services on intra-Africantrade: Global Trade Analysis Project
model
3.1 Introduction
On the 7th of July 2019, Nigeria became 53rd signatory to African Continental Free Trade
Agreement (AfCFTA) in Niamey, Niger republic.1The AfCFTA major objectives are to estab-
lish a single continental market for goods and services including the unhindered movement
of business persons and investments which will ultimately open the way for the creation of
the Customs Union (CU) in Africa. Once the AfCFTA (full tariff elimination) is effective, it
could generate welfare gains of $16.1 billion, at the cost of $4.1 billion in trade revenue losses
(or 9.1% of current tariff revenues). GDP and employment are expected to grow by 0.97%
and 1.17%, respectively in long-term. Intra-African trade growth is estimated at 33% and the
continent’s trade deficit is expected to drop by 50.9% (Saygili, Peters, and Knebel, 2018). This
agreement will help stimulate intra-African trade, which remains highly fragmented and less
competitive on a global scale. As a major fallout of this agreement, the issue of tariff re-
duction and possible elimination of tariff on goods and services have taken the center stage.
However, the issues surrounding Non-Tariff Barriers (NTBs) have not been given a deserved
attention, especially its effects on components of trade in services among African countries.
Studies have identified the importance of trade in service for merchandise trade, economic
performance and trade diversification (Hoekman, 2017). Consequently, policies and efforts to
promote intra-African merchandise trade with reduction in tariff and NTBs under AfCFTA
should not just be extended to trade in service on paper but through active implementation.
NTBs are categorized as restrictive or legitimate. NTBs that aim to protect consumers against
1To date, 54 countries have signed the agreement, Eritrea has not signed and 34 countries including South
Africa and Nigeria have both signed and approved ratification of the agreement, see Figure C.5.

3.1. Introduction 91
poor quality or to protect the environment are legitimate, non-restrictive, but must be justified
by the government according to the WTO’s SPS and TBT agreements. Moreover, unjustified,
discriminatory measures for the purpose of trade protection are trade restrictive measures.
NTBs have been identified as a major contributor to high cost of intra-African trade. In this
regard, Hamilton (2018) described NTBs as the main obstacles to trade between African coun-
tries. According to Vanzetti, Peters and Knebel (2017), African countries could gain $20 billion
each year by eliminating NTBs at the continental level and this is much more than $3.6 billion
that could benefit by eliminating tariffs. This simply suggests that competitiveness of African
countries lie in addressing the NTBs prevalent in the continent. This will go a long way po-
sitioning them for both African and global relevance. In this same report, the distribution of
welfare gains across African countries associated with the elimination of NTBs is positive all
over the continent. This is a sharp contrast to the elimination of tariff in the continent that
will lead to welfare loss for some countries in the continent. This clearly underscores the
imperativeness of NTBs elimination for a successful.
Just like trade in goods, trade in services also encounters NTBs in forms of national regula-
tions. The impact of these regulations sometimes cut across supplier, personnel and equip-
ment and usually with significant cost implication (Kox and Nordås, 2007). The prevalence
and stringency of these regulations are not considered as the major hindrance but their het-
erogeneity between origin and destination markets (Kox and Nordås, 2007). Based on Trade
Cost Index data2, trade costs for services are higher than for agricultural products. The trade
costs for manufactured goods are the lowest. This emphasis the need to go beyond identifi-
cation of regulations that impact on trade in service but working towards harmonization of
national regulations across African countries as a major way to improving intra-African trade
in service.
African trade analysis shows a very concentrated trade in free trade areas. Indeed, intra-
African trade is much more significant between member countries of the same regional eco-
nomic community (free trade agreement or customs union). Eight Regional Economic Com-
munity areas (REC) exist in Africa, and inter-community trade is very poorly developed. Ntara
2As mentioned in the general introduction, the WTO Trade Cost Index illustrates the evolution of trade costs
over time, the incidence of trade costs across economies and sectors (Economy-Sector), for different household
income groups, by gender, firms size and skill groups (Economic Agents) as well as identify the main factors
determining trade costs (Determinants). Data can be accessed at: http://tradecosts.wto.org/. Formore information, see Egger, Larch, Nigai and Yotov (2021).

92Chapter 3. Modeling the impact of non-tariff barriers in services on intra-African
trade: Global Trade Analysis Project model
(2016) shows that the main economic and trading blocks in Africa are the Economic Organiza-
tion ofWest African States (ECOWAS),3the CommonMarket for Eastern and Southern Africa
(COMESA),4the Southern African Development Community (SADC),
5and the Community
of Sahel and Sahara States (CENSAD).6Other regional trading blocks are the East African
Community (EAC), the Economic Community of Central African States (ECCAS), the Inter-
governmental Authority on Development (IGAD) and the Arab Maghreb Union (AMU).
According to the Africa Regional Integration Index report of 2016, among the eight regional
trading blocks in Africa, SADC and ECOWAS have higher than average REC (Regional Eco-
nomic Communities) scores on regional integration overall. SADC has higher than average
REC scores across the dimensions of regional infrastructure, free movement of people and fi-
nancial andmacroeconomic integration. ECOWAS has higher than average REC scores across
the dimensions of free movement of people and financial and macroeconomic integration (see
Table 3.1). Moreover, intra-regional trade is more significant than inter-regional trade. Trade
between ECOWAS and SADC member countries accounts for more than 50% of intra-African
trade. However, bilateral trade between these two trading blocs is about 30% and 4% of intra-
African trade (see Table 3.2).
Table 3.1: Africa regional integration: average scores in the five dimensions
REC Trade Regional Productive Integration Free Financial and Average
(Regional integration infrastructure integration movement of macroeconomic REC scores
Economic people integration
Communities)
CEN-SAD 0.353 0.251 0.247 0.479 0.524 0.3708
COMESA 0.572 0.439 0.452 0.268 0.343 0.4148
EAC 0.780 0.496 0.553 0.715 0.156 0.54
ECCAS 0.526 0.451 0.293 0.400 0.599 0.4538
ECOWAS 0.442 0.426 0.265 0.800 0.611 0.5088
IGAD 0.505 0.630 0.434 0.454 0.221 0.4488
SADC 0.508 0.502 0.350 0.530 0.397 0.4574
UMA 0.631 0.491 0.481 0.493 0.199 0.459
Average
of eight RECs 0.540 0.461 0.384 0.517 0.381
Source: Africa Regional Integration Index Report (2016). Scores range from 0 (low) to 1 (high)
3It is composed of Western Africa nations.
4It groups Central and Eastern African states.
5It brings together Southern African countries.
6Composed of Northern, Central and Western African states.

3.1. Introduction 93
Table 3.2: Intra and inter-regional trade in percent of total African trade (all products)
Intra-ECOWAS trade Trade with SADCRECs (% of total Africa trade) (% of total Africa trade)
2017 2018 2019 2017 2018 2019
ECOWAS 60 51 52 28 40 40
Intra- SADC trade Trade with ECOWAS(% of Total Africa trade) (% of total Africa trade)
2017 2018 2019 2017 2018 2019
SADC 87 86 87 4.4 4.2 4
Source: Data extracted and compiled by the author’s from the UNCTAD database
This is explained by trade cost factors such as distance, various languages, restrictive customs
procedures, high tariffs and barriers to entry into services. Therefore, the African Continental
Free Trade Area can provide a platform of dialogue and negotiation among the eight regional
economic communities in order to boost inter-regional trade. Indeed, the goal of the AfCFTA
is to progressively reduce tariff, non-tariff barriers and trade facilitation bottlenecks. The ob-
jective is to create a liberalized market for goods and services through successive rounds of
negotiations. The agreement foresaw in 2021 a 90% reduction of tariff lines and a 50% reduc-
tion of NTBs in the goods and services sector with measures to facilitate trade through the
implementation of the WTO Trade Facilitation Agreement (TFA). In 2025 an additional 7% re-
duction in tariffs. In order to boost intra-African trade, this agreement should stimulate trade
among regional trading blocs in Africa.
The goal of this paper is to assess the effect of AfCFTA (removal of import tariffs, non-tariff
barriers in the goods and services sector) on intra-African trade. In line with the AfCFTA
modalities, the paper examines the effects of a tariff elimination on 90% of tariff lines on
goods and a reduction on 50% of non-tariff barriers on goods and services on a most favored
nation (MFN) basis. We do not consider the effects of measures that facilitate trade through
implementation of a Trade Facilitation Agreement (TFA). We consider the service sector to
critically analyze its impacts and to formulate policy suggestions and recommendations. In-
deed, services accounted for 23% of world trade in 2018 and represent an important part of
economic activity and production in Africa (UNCTAD, 2019b). Finally, services are the most
protected sectors compared to the agricultural and manufacturing sectors, which are more
liberalized (WTO, 2019).

94Chapter 3. Modeling the impact of non-tariff barriers in services on intra-African
trade: Global Trade Analysis Project model
Several studies have examined the impact of trade liberalization (reduction of tariffs and non-
tariff barriers) on the performance of the agricultural sector in African trading blocks (Nin-
Pratt and Diao, 2014; Elbushra et al., 2011). Others have assessed the impact of AfCFTA on
GDP and total intra-African trade (AfDB, 2019; Abrego et al., 2019). Some studies have inves-
tigated the effects of services liberalization on the economic growth in African (Tekin, 2012;
Maune, 2019). Few studies have examined the impact of AfCFTA on export performance by
considering the services sector. Our study contributes to the existing literature on the quan-
titative impacts of the African Continental Free Trade Area in three ways.
Figure 3.1: African goods exports by trading partners (% of total African exports), 2016-2020
010
20
30
40
2016 2017 2018 2019 2020Years
Europe United States of America
China Africa
Source: UNCTAD
First, we study the impact of services trade liberalization on intra-African trade in goods and
on trade betweenAfrica and its trading partners (Europe, China and the United States).7While
the papers that have assessed the effects of AfCFTA on intra-African trade have focused on
liberalisation of goods trade, our study examines the effects of NTBs reduction in services
on bilateral trade in goods. We consider the agriculture, manufacturing, agri-food, natural
resources, wood and textile sectors as the most important for African economies. We also
highlight the contribution of services to economic growth and income in African countries.
Second, for modeling restrictions in services, we use the tariff equivalents (AVEs) of entry
7China, Europe and the United States are the main trading partners of Africa because they account for almost
60% of total African exports (see Graph 3.1).

3.1. Introduction 95
barriers established by Jafari and Tarr (2017). They estimate the AVEs of restrictions on 11
services sectors in 103 countries including African countries. These AVEs are more sectoral
with a range of countries than the ones established by Benz and Jaax (2020) which covers 5
sectors in 46 countries (OECD and emerging countries). Third, in order to evaluate the ef-
fects of services sector liberalisation on intra-African trade, we use the latest version of the
GTAP model (v10) with 2014 as the reference year.8Indeed, the GTAP database is a consistent
representation of the world economy for a pre-determined reference year. Underlying the
database there are several data sources, including among others: national input-output (I-O)
tables, trade, macroeconomic, energy and protection data. The GTAP 10 database describes
the world economy for 4 reference years (2004, 2007, 2011, and 2014) and distinguishes 65
sectors, up from 57 in the previous release (GTAP v9), in each of the 141 countries/regions.
The 121 countries in the database account for 98% of world GDP and 92% of world popula-
tion. For each country/region, the database reports production, intermediate and final uses,
international trade and transport margins, and taxes/subsidies. This database underlies most,
if not all, applied global general equilibrium models.
Our study suggests that reducing tariff lines by 90% and NTBs by 50% in the agricultural and
manufacturing sectors is associated with a rise in African GDP by 0.22% and 0.95% respec-
tively in the short and long run. Regional income decreases by 0.1% and increases by 0.52% in
the short and long term, respectively. The services liberalisation increases the GDP by 0.47%
and 1.07% and a drop in regional income by 0.74% and 0.39% respectively in the short and long
term. Reducing NTBs in services increases African GDP by about $20.68 billion on average in
the long run.
The analysis of trade in goods shows that the reduction of services trade barriers contributes to
the growth of intra-African exports of agricultural products, manufactures, processed foods,
and fossil fuels by 18.39%, 63.86%, 36.79% and 22.13% respectively in the long run. We also
find an increase in exports of energy-intensive products, wood and paper products, and tex-
tiles and apparel by about 37.25%, 37.67%, and 122.79% respectively. Services liberalization
increases intra-African exports of agricultural goods by 1.62% (nearly $69.97 million), manu-
facturing goods by 16.37% (nearly $827.3 million), processed foods by 3.45% (almost $116.93
million), and fuel products by 4.92% (about $290.52 million). Energy-intensive products also
8GTAP (Global Trade Analysis Project) is a global network of researchers and policy makers conducting
quantitative analysis of international policy issues.

96Chapter 3. Modeling the impact of non-tariff barriers in services on intra-African
trade: Global Trade Analysis Project model
increased by 8.02% (approximately $515.23 million), wood and paper products by 5.49% (ap-
proximately $32.26 million) and textiles and apparel by 13.73% (around $126.26 million). The
reduction of entry barriers to service providers is contributing to an increase of African ex-
ports to its trading partners (Europe, China and the United States) and the AfCFTA leads to
a long-term trade creation and diversion. The welfare gains from this trade agreement are
positive with the exception of Benin and Mauritius.
The remainder of this paper is structured as follows. In the first part, we review the literature
on the effects of AfCFTA on intra-Africa trade. Second, we would describe the weight of non-
tariff barriers and service sector in Africa trade. The third part highlights our GTAP model
with data, sources, types of methodology and scenarios used. The last section presents our
different results, the discussion and policy recommendations.
3.2 Literature review
The existing literature on the quantitative impacts of the African Continental Free Trade
Agreement (AfCFTA) has mainly focused on the effects of the reduction of tariffs and non-
tariff barriers (NTBs), as well as trade facilitation measures, also on the African welfare.
Among those studies of impact, the computable general equilibrium approach through the
Global Trade Analysis (GTAP) model is the widely used. Moreover, some analyses also use
the TASTE model (Tariff Analytical and Simulation Tool for Economists) to investigate the
impacts of cuts in tariff lines. Other authors apply the MIRAGE-e CGE (Computable General
Equilibrium) model with GTAP data to examine the impacts of tariffs, NTBs, and trade cost
reduction.
3.2.1 Removal of tariffs on intra-AfCFTA trade
The authors who analyzed the effects of tariff reduction on intra-African trade are Mevel and
Karingi (2012). They use a MIRAGE (Modeling International Relations in Applied General
Equilibrium) CGE model with GTAP data (v7, 2004 being the base year). They assume an re-
moval of all tariff barriers on goods within the African continent and see the effects relative
to the baseline scenario in 2017. They find that the establishment of a Continental Free Trade
Area (CFTA) would boost Africa’s exports to the world, relative to the baseline scenario in
2022 by 4.0% (or $25.3 billion) an increase in GDP of almost 0.2%. At the sectoral level, it is in
3.2. Literature review 97
agriculture and food that African exports would rise the most with the adoption of the agree-
ment, with +9.4% (or $5.0 billion), as compared to the reference scenario in 2022. Moreover,
the establishment of a CFTA would result in a significant rise in intra-African trade, increas-
ing by 52.3% ($34.6 billion). Most of the increase is in manufacturing products ($27.9 billion)
with most of the rest in agriculture.
The study by Jensen and Sandrey (2015), which is very similar to the previous one, first exam-
ines the effects of the full elimination of tariffs (all intra-African tariffs going to zero) applied
to goods on intra-African trade in 2025. It uses a GTAP model similar to the MIRAGE model9
but with 2011 as the base year for its simulation (GTAP v9). They find that total African ex-
ports increase by nearly 3.11% in 2025, with intra-African trade increasing by about 4.3%. GDP
grows by nearly 0.70%.
Saygili, Peters, and Knebel (2018) also investigate the impact of tariff reductions on intra-
African trade following the African Free Trade Agreement (AFTA). As before, they use a GTAP
model and analyze the impacts across two scenarios in long run, which differs from the stud-
ies above. The first is the full elimination of tariffs on goods in the FTA. They found that GDP
increased by almost 0.97%, intra-African trade rose by 33%, and Africa’s total trade deficit
was cut in half. Also, the vast majority of individual countries gained from the FTA. The sec-
ond scenario assumes the elimination of tariffs on all product categories, exempting certain
sensitive products from liberalization. They assumed that the exempted products currently
exhibit relatively high tariffs and significant imports. Their simulations showed lower GDP
growth than the first scenario (0.82%). Intra-African trade would increase by 24%, but Africa’s
overall trade deficit only shrinks by 3.8%. However, the simulations showed that more coun-
tries experience welfare losses if sectors with high current tariff revenues are permanently
excluded from liberalization. Vanzetti, Peters, and Knebel (2018) study the quantitative im-
pacts of AfCFTA from tariff reduction through 2 shocks: (1) full tariff elimination; (2) tariff
elimination with exemptions for 5% of sensitive products. The results on intra-African trade
show an increase in intra-African exports of about 1 and 0.4% respectively under scenarios 1
and 2.
By using a GTAP (v10) model, the African Development Bank in their study (AfDB, 2019)
showed that the removal of bilateral tariffs led to an increase in African intraregional trade by
9The only difference is the sectoral aggregation.

98Chapter 3. Modeling the impact of non-tariff barriers in services on intra-African
trade: Global Trade Analysis Project model
14.6% (+$10.1 billion) andGDP by 0.10% (+$2.8 billion). Also, because the share of intraregional
trade in total trade is small, intraregional trade relative to total trade increases only from 12%
to 13.6%. There is a modest trade deviation - Africa exports somewhat less to the rest of the
world ($-4.3 billion), and the rest of the world exports a bit less to Africa, with reductions of
about 0.8%. The World Bank study (World Bank, 2020) is similar to the African Development
Bank study (AfDB, 2019) in that it uses a GTAP (v10) CGE model and analyzes the long-run
effects of a gradual removal of 97% of tariffs on intra-AfCFTA trade. The results suggested
a growth in African exports and imports of goods to the world by respectively 1.78% (or $35
billion) and 2.31% (or $41 billion). Intra-African trade increased by 21.76% ($131 billion) and
the GDP grew by 0.13% (or $12 billion).
3.2.2 Removal of tariffs and NTBs on intra-AfCFTA trade
The literature on trade liberalization has increasingly focused on the effects of non-tariff bar-
riers (NTBs) on trade. It showed that reducing NTBs makes a significant contribution to
economic welfare. In the second part of their study, Jensen and Sandrey (2015) estimate the
effects of a total reduction in tariffs and a 50% reduction in NTBs in the goods sector using
the GTAP model. The tariff equivalent of NTBs is taken from the World Bank. The estimates
indicated an increase in total African exports and intra-African trade by 6.28% and 7.26% re-
spectively. GDP grew by 1.6%. Overall, the 50% reduction in NTBs contributes to about 3%
growth in total exports and intra-African trade and 0.9% growth in GDP.
Vanzetti, Peters, and Knebel (2018) in their study through the third scenario highlights the
effects of NTB reduction in goods on intra-African trade. The AVEs of NTBs are taken from
Cadot et al. (2015). Their study is different from others because they consider a reduction in
NTBs in goods without a reduction in tariffs. They find that more significant gains in exports
are associated with addressing non-tariff measures (an increase in intra-African exports of
almost 2 percent). The greatest increase in exports is recorded by Cameroon, Ivory Coast,
Rwanda, and South Africa. This reflects the composition of exports, with these countries ex-
porting a larger share of goods that attract NTMs, such as livestock products and fruits and
vegetables.
Abrego et al. (2019) in the context of AfCFTA, examine the welfare effects of the full elimi-
nation of import tariffs and a partial but substantial reduction in NTBs (35% reduction) for 45

3.2. Literature review 99
African countries. Contrary to the other studies, they do not use a GTAP CGE model but a
multi-country, multi-sector general equilibriummodel based onCostinot and Rodriguez-Clare
(2014). Data on applied effective tariffs come from the Global Trade Analysis Project (GTAP)
Africa database (2014). The Ad valorem equivalents of NTBs are obtained from the Economic
and Social Commission for Asia and the Pacific (ESCAP) and World Bank database for 2016.
The results show significant potential welfare gains from trade liberalization in Africa (an in-
crease of 2.1% compared with the baseline). As intra-regional import tariffs in the continent
are already low, the bulk of these gains come from the lowering of NTBs. Intra-African trade
increased by 8.40%. They argue that the size of the potential gains that may be obtained from
AfCFTA is largely dependent on the degree of openness, the initial level of trade barriers, and
the strength of initial trade linkages among African countries. In their scenario nine of them
with gains of 5% or more.
The second scenario in the AfDB study (AfDB, 2019) adds to the tariff removal an elimina-
tion of 50% of NTBs in goods and services. The observed effects on intra-African trade are
as follows: the elimination of tariffs and NTBs on imports of goods and services into Africa
leads to a large boost in intra-African trade of about 107% (+$74.3 billion). This increase in
intra-African trade is accompanied by a large 44% (+$107.2 billion) increase in exports to the
rest of the world. GDP increased by 1.25% (+$37 billion). Under this scenario, intra-African
trade as a share of total African exports rises from 12% in the reference solution to 17.2%.
Compared to scenario 1 of this study, NTBs contribute to an increase in trade of nearly 92.6%.
Besides a gradual reduction of 97% of tariffs, the World Bank study (World Bank, 2020) adds
in its second scenario, a reduction of 50% of NTBs in goods and services. AVEs of NTBs for
goods are taken from Kee, Nicita, and Olarreaga (2009). The results suggest an increase in
intra-African trade and exports to the rest of the world by 51.85% and 18.84% respectively.
GDP increased by 2.24%. Compared to the first scenario, NTBs contribute to an increase of
almost 24% in intra-African trade.
3.2.3 Removal of tariffs and NTBs on intra-AfCFTA trade and imple-mentation of TFA
A part of the literature on the effects of AfCFTA considers the WTO trade facilitation agree-
ment. The first is the AfDB study (AfDB, 2019). In addition to the reduction of tariffs and
NTBs, the study examines the effects of trade facilitation measures on an MFN basis. The

100Chapter 3. Modeling the impact of non-tariff barriers in services on intra-African
trade: Global Trade Analysis Project model
measure considered is that of time reduction in customs from applying the provisions of the
TFA (Melo and Sorgho, 2019). The analysis uses estimates of Melo and Sorgho (2019), who
apply a model that predicts observed time in customs as a function of basic structural vari-
ables (GDP, Logistics Performance Index, and Infrastructure Quality Index); policy variables
(World Governance Indicators); and the trade facilitation variables captured by the trade facil-
itation indicator (row L). Row L is a weighted average of the following components: (1) infor-
mation availability; (2) involvement of the trade community; (3) advance rulings; (4) appeal
procedures; (5) fees and charges; (6) formalities involving documents; (7) formalities involv-
ing automation; (8) formalities involving procedures; (9) internal border agency cooperation
(10) external border agency cooperation; and (11) governance and impartiality. The model
shows, after controlling for the structural and policy variables, that a higher trade facilitation
indicator score reduces the probability of a longer time in customs. The model provides esti-
mates of the time reductions in customs as a result of full implementation of the TFA. Those
reductions are then translated into ad valorem equivalents of barriers using the methodology
of Hummels and Schaur (2013).
The implementation of the TFA, in addition to reducing tariffs and NTBs, also adds a signifi-
cant boost to trade. African trade grows by 51% (an increase of $295.6 billion), with a higher
multiplier effect on intra-African trade (up 132.7% or $92 billion) than on trade with the rest of
the world (up 40% or $203.6 billion). The share of intra-African trade thus increases to 18.5%.
The GDP is up by almost 3.50%, i.e., an increase of US$100 billion. Compared to the effects
of the reduction in tariffs and NTBs, the implementation of the FTA contributes to a rise in
overall intra-African trade by 24% (+US$17.7 billion) and in GDP by 2.25% (+US$63 billion).
The effect of the FTA is greater than the impact of the tariff reduction in Africa.
Similar to the previous study, the World Bank analysis (World Bank, 2020) investigates the
effects of the implementation of the WTO Trade Facilitation Agreement. The study considers
the same measure of TFA as above, namely the time reduction in customs procedures. The
results show that the gradual elimination of 97% of tariffs on intra-African trade, a 50% reduc-
tion in NTBs, and the implementation of TFA significantly increases intra-African trade by
92.07% (+$556 billion). Total African exports rise by 28.64% (+$560 billion) and GDP by 4.20%
(+$413 billion). The implementation of the TFA compared to the reduction of tariffs and NTBs
contributes to an increase of almost 40% in intra-African trade and 2.95% in GDP growth, a

3.3. Non-tariff barriers, service sector and Africa trade 101
higher effect than the reduction of intra-African tariffs.
In addition to the welfare gains, this continental free trade agreement will boost intra-African
trade with the rest of the world. It will render intra-African trade more resilient to global price
shocks. African countries will also trade among themselves a more diverse set of goods and
products because trade with non-regional partners tends to be highly concentrated and fo-
cused on primary commodities. Finally, deeper regional integration, such as AfCFTA, also cre-
ates opportunities for a further reduction of trade barriers and potential to generate economies
of scale (Ahmed et al., 2018).
3.3 Non-tariff barriers, service sector and Africa trade
There are three main categories of obstacles to intra-African trade (UNCTAD, 2019). First,
weak productive capacities and limited economic diversification, which restrict the range of
intermediate and final goods that can be traded and inhibit the development of regional value
chains. Second, tariff-related trade costs associated with the slow implementation of tariff
liberalization schedules (free trade agreements), and third, high non-tariff-related trade costs
that impede the competitiveness of firms and economies in Africa. In this last category we
have high trade costs, related to business and trade facilitation, can be explained in terms
of the hard and soft infrastructure deficits, trade transaction costs that result from customs
administrations, documentation requirements, and border procedures in Africa that have an
impact on transport and transit costs and border and behind-the-border costs (UNCTAD, 2009;
United Nations Economic Commission for Africa et al., 2017). The latter category takes into
account non-tariff measures and rules of origin. This category is more restrictive than the
first two categories. Indeed, the World Bank’s 2001 report (World Bank, 2001) shows that
the effect of tariff costs is relatively becoming less important, while non-tariff factors, such
as regulatory barriers, the business environment, infrastructure, the institutional quality and
economic freedom, are becoming major determining factors of trade flows.
Figure 3.2 highlights two indicators of trade facilitation in different regions. We note that Sub-
Saharan Africa has the highest cost to export and import compared with all other regions.10
10Border compliance captures the cost associated with compliance with the economy’s customs regulations
and with regulations relating to other inspections that are mandatory in order for the shipment and reception to
cross the economy’s border, as well as the cost for handling that takes place at its port or border. Documentary
compliance captures the time and cost associated with compliance with the documentary requirements of all

102Chapter 3. Modeling the impact of non-tariff barriers in services on intra-African
trade: Global Trade Analysis Project model
It is followed by Latin America and the Caribbean, based on border compliance, and South
Asia, based on documentary compliance.
Considering non-tariff trade costs, Africa has the highest incidence of non-tariff measures.
Figure 3.3 shows the frequency and ratio index of NTBs applied by different parties.11
The
frequency index shows that nearly 30% of products are affected by one or more NTMs.12
Figure 3.2: Cost to import and export in US$ (border compliance and documentary compli-
ance) by region, 2019
0400
200
600
800
Wor
ld
Sub−S
ahar
an A
frica
South
Asia
Nor
th A
mer
ica
Latin
Am
erica
and
Car
ibbe
an
Europ
ean
Union
East A
sia
and
Pacific
Cost to export: border compliance Cost to import: border compliance
Cost to export: documentary compliance Cost to import:documentary compliance
Source: World Development Indicators Database (WDI, World Bank)
government agencies of the origin economy, the destination economy and any transit economies (World Bank,
WDI data).
11The figure describes the NTBs on imports and exports.
12The frequency index, which accounts only for the presence or absence of an NTM, summarizes the percent-
age of products i to which one or more NTMs are applied.

3.3. Non-tariff barriers, service sector and Africa trade 103
Figure 3.3: NTM frequency and coverage ratio
0 10 20 30 40 50
Africa
World
World excluding Africa
NTM Frequency Ratio NTM Coverage Ratio
Source: World Integrated Trade Solution database: data from 2012 to 2016
In-terms of trade flows affected, on average 50% of trade flows are impacted by these mea-
sures.13
Indeed, 40% of exports and 55% of imports of African goods are covered by these
measures, i.e., approximately $4.6 million and $13.7 million respectively. Figure 3.4 shows
that SPS and TBT measures are the most important NTBs in Africa (both account for nearly
30% of total NTBs). In comparison, Africa’s SPS and TBT standards are higher than for Eu-
rope, and Asia is the continent with the most SPS and TBT measures in the world (almost
8,000 SPS and 11,000 TBT measures). The West Africa is one of the regions in Africa with a
lower number of SPS and OTC measures compared to the Southern Africa region (see Table
C.8). The tariff equivalents associated with these measures show significant SPS measures
in the agricultural, food, beverage, and tobacco sectors in Africa (Table C.9). TBT standards
have mainly affected mineral products, labor-intensive and resource-intensive manufactures
(paper, textiles and clothing, stone and glass), and low- and medium-skill and technology
intensive manufactures (machinery, arms, vehicles, etc..)
13The coverage ratio measures the percentage of trade subject to NTMs for the importing country j.
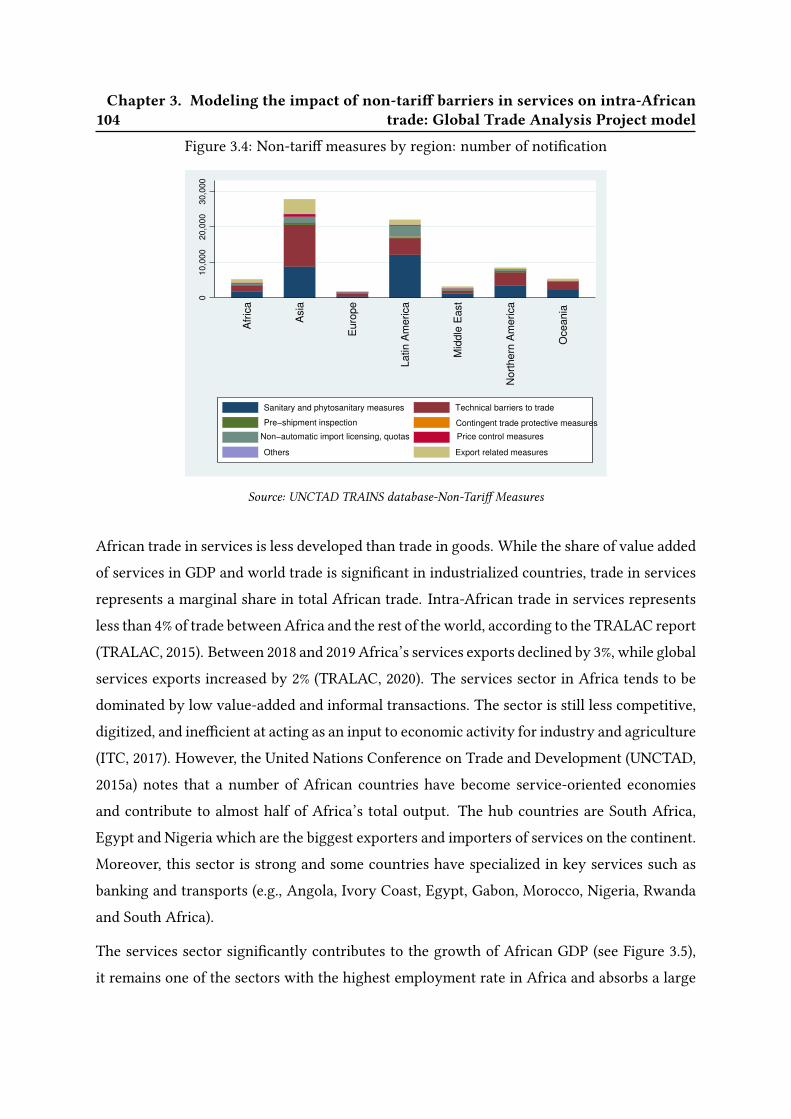
104Chapter 3. Modeling the impact of non-tariff barriers in services on intra-African
trade: Global Trade Analysis Project model
Figure 3.4: Non-tariff measures by region: number of notification
020,0
00
10,0
00
30,0
00
Afr
ica
Asia
Euro
pe
Latin A
merica
Mid
dle
East
Nort
hern
Am
erica
Oceania
Sanitary and phytosanitary measures Technical barriers to trade
Pre−shipment inspection Contingent trade protective measures
Non−automatic import licensing, quotas Price control measures
Others Export related measures
Source: UNCTAD TRAINS database-Non-Tariff Measures
African trade in services is less developed than trade in goods. While the share of value added
of services in GDP and world trade is significant in industrialized countries, trade in services
represents a marginal share in total African trade. Intra-African trade in services represents
less than 4% of trade betweenAfrica and the rest of theworld, according to the TRALAC report
(TRALAC, 2015). Between 2018 and 2019 Africa’s services exports declined by 3%, while global
services exports increased by 2% (TRALAC, 2020). The services sector in Africa tends to be
dominated by low value-added and informal transactions. The sector is still less competitive,
digitized, and inefficient at acting as an input to economic activity for industry and agriculture
(ITC, 2017). However, the United Nations Conference on Trade and Development (UNCTAD,
2015a) notes that a number of African countries have become service-oriented economies
and contribute to almost half of Africa’s total output. The hub countries are South Africa,
Egypt and Nigeria which are the biggest exporters and importers of services on the continent.
Moreover, this sector is strong and some countries have specialized in key services such as
banking and transports (e.g., Angola, Ivory Coast, Egypt, Gabon, Morocco, Nigeria, Rwanda
and South Africa).
The services sector significantly contributes to the growth of African GDP (see Figure 3.5),
it remains one of the sectors with the highest employment rate in Africa and absorbs a large

3.3. Non-tariff barriers, service sector and Africa trade 105
share of youth employment and plays a major role in gender parity (UNCTAD, 2015a; Maune,
2019). The growth rate of commercial services has increased significantly since 2017 in almost
all regional blocks (see Table 3.3).
Figure 3.5: Goods and services sector value added (% of GDP), 2015-20190
20
40
60
2015 2016 2017 2018 2019
Agriculture, forestry and fishing Manufacturing
Services
Source: World Development Indicators Database (World Bank)
Table 3.3: Growth rate of commercial services exports by economic integration area
Years 2010 2011 2012 2013 2014 2015 2016 2017 2018 2019
REC
AMU 3.74 -0.25 0.11 -4.21 7.14 -11.85 -0.67 8.04 9.82 4.39
CEN-SAD 7.25 -7.74 8.29 -8.29 8.78 -0.66 -7.06 19.21 13.38 5.77
COMESA 11.94 -7.76 13.97 -7.34 8.11 -9.07 -14.59 20.55 17.93 3.62
EAC 23.19 19.82 22.66 7.17 0.24 -4.19 -1.95 5.45 10.95 1.85
ECCAS 11.33 16.89 -14.53 27.45 10.51 -18.91 -10.75 11.4 -2.59 6.14
ECOWAS 13.01 9.07 12.4 -6.48 -8.75 54.5 8.88 11.56 10.49 8.09
IGAD 26.49 28.49 22.55 12.94 3.26 -2.84 -6.09 9.3 16.5 -0.05
SADC 15.05 10.29 7.16 -3.68 5.15 -9.09 -4.91 10.68 2.31 -4.11
Average growth 14.95 8.81 9.98 2.18 4.1 0.71 -5.32 12.8 9.98 2.99
Africa 11.35 1.45 7.3 -4.37 5.49 -4.09 -6.05 14.23 10.83 2.61
Source: Data extracted from the UNSTADstat database. Commercial services cover all service categories, except
trade in government goods and services.
The most exported services by SADC and ECOWAS are financial services, information and
communications, and distribution (retail and wholesale trade). About 50% of the total exports
of ECOWASmember countries are information and communication services (49%). The SADC
countries export a lot of financial and insurance services (33%, see Figure 3.6). The share

106Chapter 3. Modeling the impact of non-tariff barriers in services on intra-African
trade: Global Trade Analysis Project model
of exports of financial services, distribution and information and communication services in
total exports has been stable since 2011 (see Figures 3.7 and 3.8).14Services with high export
value added (EVA) are distribution, finance and insurance, other business sectors, ICT services
(Information and Technology) and the transportation sector.
Figure 3.6: ECOWAS and SADC services exports in % of total services
Source: WTO database on trade in services by sector and mode 3 supply (TIMOS), Basis: ISIC rev. 4, Years: 2005-2017)
Figure 3.7: Share of services in total SADC
services exports, 2005-2017
2005 2007 2009 2011 2013 2015 2017
0
5
10
15
20
25
30
35
40
45
Construction
Distribution and others
Transportation and storage
Information and communication
Financial and insurance
Other business services
Figure 3.8: Share of services in total
ECOWAS services exports, 2005-2017
2005 2007 2009 2011 2013 2015 2017
0
10
20
30
40
50 Construction
Distribution and others,
Transportation and storage
Information and communication
Financial and insurance
Other business services
Source: TIMOS database
14Mode of supply of services in this database is mode 3 (Commercial presence).

3.3. Non-tariff barriers, service sector and Africa trade 107
Services in Africa is one of the most closed sectors with high barriers to entry. It is one of the
continents with the most restrictions in the services sector. Although goods and commodi-
ties are subject to low tariffs, sectors such as telecommunications have tariff equivalents of
about 200% (Jafari and Tarr, 2017). Looking at Table C.10, which highlights the tariff equiv-
alents of restrictions in services based on the World Bank’s Services Trade Restrictiveness
Index (STRI)15, we see that AVEs in Sub-Saharan Africa area are the largest compared to other
regions. The sectors closed to service providers are fixed line telecommunications, legal ser-
vices, and rail transport, and those opened remain mobile line and distribution.
Figure 3.9 highlights the importance of services in goods and services exports. We note a
significant contribution of services to exports of goods, particularly manufactured products.
Services contributed to almost 30% of African exports of manufactured goods in 2015. Also the
share of services as inputs in mining exports is important compared to other sectors (about
5%).16
The agricultural sector, the backbone of the African economy, is a sector that uses
few inputs in services. This graph shows a high degree of servicification of African trade in
product.17
Figure 3.9: Share of services value-added in African goods and services exports, 2015
020
40
60
Agriculture, forestry and fishing Mining and quarrying
Manufacturing Food products, beverages
Textiles and wearing apparel Wood and paper products
Basic metals Transport equipment
Services
Source: OECD TiVA database (2018)
15It measures the level of restrictiveness in services. This score includes three modes of supply of services
under the General Agreement on Trade in Services (GATS). These are cross-border supply (mode 1), commercial
presence (mode 3) and presence of natural persons (mode 4). It ranges from 0 to 100, where 0 indicates that none
of the restrictions underlying the index is applied, and 100 means that the sector/mode is completely closed to
foreign services and service providers.
16The services value added in our case is foreign sourced. Africa includes Morocco, Tunisia and South Africa.
17The phenomenon called "servicification" was used in the WTO report (WTO, 2019), it stipulated a high
contribution of services in the production and exports of manufacturing products.

108Chapter 3. Modeling the impact of non-tariff barriers in services on intra-African
trade: Global Trade Analysis Project model
The share of services inmanufacturing trade in Africa remained relatively stable between 2005
and 2015. The contribution of foreign service suppliers to manufacturing exports in emerg-
ing economies (Asia and Latin America) is the largest compared to advanced economies (see
Figure 3.10). Liberalization of services will not only lead to beneficial gains for emerging coun-
tries and African countries, but also to an important place for these countries in the global
value chain (GVC). Indeed, at the regional level, intra-African trade in value-added is low (9%),
compared to 45% in Asia and 18% in Latin America (Slany, 2019) and services could boost this
intra-regional trade.
Theoretically, services can participate in GVC in two main ways: backward integration and
forward integration (Efogo, 2020). Backward integration refers to countries (or firms) that
export or import raw materials or intermediate products entering as inputs in heavy indus-
tries. Backward integration refers to countries (or firms) exporting processed intermediate or
final goods and services through international distribution networks. Trade in services can
contribute to the integration of countries into GVCs. Services can be the object of a GVC
whatever the entry mode (Baldwin and Venables, 2013). This type of GVC exists in various
sectors such as financial services, tourism, education, health, information (Heuser and Mat-
too, 2017; Miroudot, 2016). Services can also be an element of the GVC (UNCTAD, 2013),
particularly as a raw material, as a backward activity or as a forward activity (design, logis-
tics, transport, marketing, and so forth). They can likewise be an input into the production
of other products or services. Services as inputs are supporting the export activities of man-
ufacturing products through transport, logistics and financial services, but are also factors in
Africa’s export competitiveness. For example, services account for 83% of the final price of
Ethiopian roses in the Netherlands (AfDB, 2015). Services may be a key input into environ-
mental service exports. Indeed, business and financial services can promote the production of
environmental services such as BioTrade18to achieve sustainable development goals. Services
would contribute to the creation of environmental service providers such as ecotourism and
REDD+ projects (UNCTAD, 2021).19
18BioTrade encompasses activities related to the collection, production, transformation and commercialization
of goods and services derived from biodiversity (genetic resources, species and ecosystems) under environmen-
tal, social and economic sustainability criteria (UNCTAD, 2020a).
19REDD: Reducing Emissions from Deforestation and Forest Degradation.

3.4. Data 109
Figure 3.10: Share of services value-added in goods and services exports by region, 2015
020
40
60
80
100
Africa Asia Latin America OECD Countries
2005 2015 2005 2015 2005 2015 2005 2015
Agriculture, forestry and fishing Manufacturing
Services
Source: OECD TiVA database (2018)
3.4 Data
The core data for this study are sourced from the Global Trade Analysis Project (GTAP)
database -see Appendix C. These data provide a snapshot of the global economy in 2014,
including domestic interindustry flows and bilateral trade flows. The full database covers 141
regions, of which 121 are individual countries, and 65 sectors. For this analysis, the 141 re-
gions are aggregated into 36 regions, including all 32 regions in Africa that are part of the
database (see Tables C.4 and C.5). Of those 32 regions, 26 are individual countries, with the
remaining countries grouped into six regional components.20
The 65 sectors are aggregated
into 8 sectors (see Table C.6).21
The core data are supplemented by additional information.
The study incorporates estimates of the ad-valorem equivalents (AVEs) of non-tariff trade
barriers.22AVEs of NTBs for goods are taken from the World Bank’s World Integrated Trade
Solution (WITS) database and documented by Kee, Nicita, and Olarreaga (2009). They are
aggregated to the model’ s regional and sectoral aggregation using trade weights. Estimates
20Rest of Central Africa = Central African Republic, Chad, Congo, Equatorial Guinea, Gabon, and São Tomé
and Príncipe; Rest of East Africa = Burundi, Comoros, Djibouti, Eritrea, Mayotte, Seychelles, Somalia, Sudan;
Rest of North Africa = Algeria, Libya, Western Sahara; Rest of South African Customs Union = Eswatini, Lesotho;
Rest of West Africa = Cabo Verde, Guinea-Bissau, Liberia, Mali, Mauritania, Niger, Saint Helena, Sierra Leone,
The Gambia; South Central Africa = Angola, Democratic Republic of the Congo.
21The first 45 sectors (1-45) are aggregated into agricultural and manufacturing sectors and the last 20 (46-65)
into service sectors.
22To model the impacts of non-tariff barriers for goods and services, we need the data on ad-valorem equiva-
lents.

110Chapter 3. Modeling the impact of non-tariff barriers in services on intra-African
trade: Global Trade Analysis Project model
for missing countries and regions are simple averages of available estimates. AVEs of NTBs
for services are sourced from Jafari and Tarr (2015). The average of the AVEs across the 11
services is the overall AVE for the services sector (Tables C.11 and C.12 ). Modeling services
trade in Africa is tricky because bilateral services trade data are scarce and AVEs for African
countries are mostly based on extrapolations. These data sources are incorporated into the
2014 baseline.
3.4.1 Different shocks and scenarios
We simulate the creation of a free trade area between African countries by reducing tariff and
non-tariff barriers in goods and services. To evaluate these effects, two shocks or scenarios
have been developed. Shocked variable is rTMS(i, r, s). This exogenous variable represents
the import tariff rate on trade goods or services (i) imported by country (s) from country (r).
This parameter has three dimensions: it is defined for the set of traded goods or services (i);
the set of source countries (r); and the set of destination countries (s). The rTMS is a per-
centage target rate.
We have two different scenarios in our study: (1) a reduction of tariff lines by 90% and NTBs
by 50% only in the agricultural and manufacturing sectors, (2) we consider the first scenario
but including a 50% reduction of NTBs in all services sector. The goal of the AfCFTA is to
eliminate tariffs on 90% of tariff lines (tariffs on non-sensitive goods). Non-least developed
countries liberalize tariffs on non-sensitive goods over 5 years and least developed countries
(LDCs) over 10 years. Second, a 7% reduction in tariff lines on sensitive goods. Non-least-
developed countries liberalize tariffs on sensitive products over 10 years and LDCs over 13
years. finally, 3% of tariff lines can be excluded from liberalization. The value of these imports
may not exceed 10% of total intra-African imports. In our study, we assume a liberalization of
90% of the total number of tariff lines. The implementation of the AfCFTA leads to a reduction
of the trade costs associated with NTBs by creating a common set of rules for participating
countries in areas such as competition, technical barriers to trade, and sanitary and phytosan-
itary standards. Implementing reforms in these areas by reducing trade costs is a difficult task.
In line with the objectives of the AfCFTA, we assume that the scenario of 50% of NTBs are ac-
tionable (reduced). Indeed, only a fraction of NTBs are actual barriers that could be actionable
(i.e., politically feasible in a trade agreement); the rest are assumed to be beyond the reach of

3.5. Simulation results and discussion 111
politically viable trade policies (World Bank, 2020). This assumption is consistent with pre-
vious studies on AfCFTA (AfDB, 2019 and World Bank, 2020) and other deep agreements,
such as the Trans-Pacific Partnership study by Petri and Plummer (2016). The NTB changes
are assumed to apply to MFN countries, i.e., they apply as well to imports from non-African
countries (AfDB, 2019 and World Bank, 2020).23
The two scenarios highlight the effects of NTBs reduction in services on intra-African trade.
The effects are observed on macroeconomic variables such as GDP, regional household in-
come, trade variables of interest and welfare decomposition.
To model the NTBs in the GTAP model, we will build a new tax named "Altertax". This tax
will take both the tariffs and the NTB (AVE) of goods or services i imposed by each country.
Indeed, it will be the sum of the two types of tax (AVE + customs tariff).
3.5 Simulation results and discussion
The results generated from our different scenarios are analyzed in this section. We evaluated
our results on macroeconomic variables: change in GDP and household income, bilateral
exports and welfare decomposition.
3.5.1 Macroeconomic impacts of AfCFTA
The AfCFTA’s goal is to reduce progressively tariff and non-tariff trade costs to boost intra-
African trade. In our analysis we consider two micro-closures to take into account the short-
and long-term effects: the capital stock is exogenous in the first case and endogenous in the
second.24However, we will focus on the long-term effects.
3.5.2 Change in percentage GDP and regional income
The tables above describe the effects of our two scenarios on the change in real GDP and re-
gional income in the short and long term. Real GDP increases with the introduction of the two
policies in the short and long term (see Table 3.4). Moreover, the effects are more significant
in the long term. Interestingly, GDP growth rises with the liberalisation of the services sector.
Indeed, a reduction in tariff lines by 90% and NTBs by 50% in the agricultural and manufactur-
23Africa’s trading partners: China, Europe and the United States.
24For more details, see appendix C1.

112Chapter 3. Modeling the impact of non-tariff barriers in services on intra-African
trade: Global Trade Analysis Project model
ing sectors is associated with an increase in African GDP by 0.22% and 0.95% respectively in
the short and long run. The liberalisation of services leads to an increase in GDP by 0.47 and
1.07% in the short and long run, respectively.25In comparison, the study by AfDB (2019) high-
lights an increase in African GDP by 1.25% and the study byWorld Bank (2020) a rise by 2.24%
following the reduction of tariffs and NTBs. The services play a key role in intra-African trade
because they have a positive impact on the performance of African manufacturing firms. The
increase in GDP following the reduction in tariffs and NTBs for goods is more pronounced in
West African countries (Guinea, Ivory Coast, Burkina Faso, Ghana, etc.). The reason is that the
GDP growth of these countries is larger, their intra-African exports of goods are significant,
and finally, these countries have the highest import tariffs on the continent (see Table C.7),
contrary to Northern and Southern African countries. Moreover, the contribution of services
to long-term economic growth is more pronounced in Southern African countries. Countries
that are highly restrictive to trade in services are experiencing significant GDP growth rates
as a result of services liberalization (Ethiopia, Kenya and Mozambique).
Interestingly, the gains are unevenly spread. Indeed, the effect of liberalization of trade in
goods has low or no impact on long-term GDP growth in countries such as Mauritius, Malawi
and Madagascar.26This result confirms those of World Bank, (2020). These findings are partly
explained by the fact that these countries have previously liberalized their tariffs and there
are no further gains to be had. Their neighbors are catching up with them, so the countries
that liberalized first appear to become relatively worse off (Vanzetti, Peters and Knebel, 2017).
Benin was the country that recorded a decline in GDP growth following the liberalization of
goods and services. This can be explained by the fall in capital goods investment. Indeed,
Benin was one of the countries where the share of capital goods in imports is the lowest in
Africa in 2015 (nearly 15%, AfDB, 2019). This low share has a negative impact on the indus-
tries’ productivity and even the share of industries in Benin’s GDP. Indeed, imports of capital
goods play a key role in the structural change and growth in export-led industries. Countries
where imports have focused on upstream, capital-intensive products and industries have been
more likely to see accelerated growth, increased industrialization, improved trade balances,
and lower external debt following an increase in exports and import substitution compared to
25These results are obtained by the difference between the average GDP growth in column 2 and 1 for the
short run and that in column 4 and 3 for the long run.
26Negative effects on long-run GDP growth in Botswana.

3.5. Simulation results and discussion 113
countries in which initial imports were driven mostly by the final consumption sectors (AfDB,
2019).
Table 3.4: Changes in Real GDP (in percent)
Types of ScenarioShort run Long run
AfCFTA 1 AfCFTA 2 AfCFTA 1 AfCFTA 2
Reduction Reduction Reduction Reduction
of tariffs of tariffs of tariffs of tariffs
and NTBs in and NTBs in and NTBs in and NTBs in
all sectors all sectors all sectors all sectors
except including except including
services services services services
Countries (1) (2) (3) (4)
Guinea 1.24 1.88 6.48 10.37
Rest of Eastern Africa 2.95 3.23 8.43 9.02
Rest of South African Customs 0.18 1.36 0.9 4.94
South central Africa -0.06 1.51 0.01 4.54
Mozambique -0.06 2.08 0.14 4.3
Burkina Faso 0.13 0.9 1.4 3.84
Togo 1.31 1.7 2.66 3.11
Senegal 0.19 0.24 2.47 2.19
Ghana 0.08 1.02 0.71 2.08
Rest of Central Africa -0.13 0.79 0.28 2.08
Namibia 0.14 0.32 1.27 1.88
Rest of West Africa 0.02 0.94 0.59 1.62
Ivory Coast 0.68 0.78 1.4 1.52
Ethiopia 0.02 0.75 0.06 1.39
Uganda 0.04 0.57 0.3 1.34
Kenya 0.01 0.57 0.12 1.34
Malawi -0.01 0.87 0.11 1.24
Tanzania 0.17 0.69 0.47 1.23
Zimbabwe -0.1 0.42 0.23 1.13
Zambia 0.04 0.34 0.32 1
Tunisia 0.03 0.23 0.63 0.92
South Africa 0.14 0.19 0.71 0.84
Botswana 0 0.21 -0.25 0.75
Rwanda 0.06 0.37 0.22 0.66
Madagascar 0 0.65 0 0.64
Egypt 0.02 0.12 0.15 0.53
Morocco 0.04 0.1 0.28 0.4
Cameroon 0.17 0.17 0.33 0.34
Nigeria 0.02 0.06 0.08 0.3
Mauritius 0 0.12 0.08 0.26
Rest of North Africa 0 0.16 0.05 0.21
Benin -0.13 -1.11 -0.12 -1.22
Average (%) 0.22 0.69 0.95 2.02
Source: GTAP model, GTAP v10, AfCFTA database

114Chapter 3. Modeling the impact of non-tariff barriers in services on intra-African
trade: Global Trade Analysis Project model
Reducing NTBs in services increases African GDP by about $20.68 billion on average in the
long run (see Table 3.5). The contribution of services to GDP is higher in service-oriented
economies such as Nigeria, Egypt, and South Africa with an increase of $1.319 billion, $1.255
billion, and $478 million respectively. Services liberalization has a lower impact on GDP in
West African countries than in North, South, and East Africa. South Africa and Nigeria ac-
count for nearly 32% of African GDP in 2018 (UNCTAD data, 2018) and are the largest ex-
porters and importers of services in Africa followed by Angola, Egypt andMorocco (TRALAC,
2015). Reducing barriers to entry for service providers has positive and significant effects in
these economies. However, services trade-restrictive countries such as Ethiopia, Mozambique,
and Kenya registered significant GDP growth (+$1.045 billion, $906 million and $848 million
respectively). As mentioned above, Benin registered a decline in GDP in US$ millions. In
addition, liberalization of trade in services led to a decline in Senegal’s GDP. The tourism
and telecommunications sectors are the service sectors that contribute significantly to GDP
growth (nearly 11% and 5% of GDP respectively in 2014, BCEAO, 2014). Tourism appears to
be the largest single foreign exchange earner, but since the 2010s, the sector’s share of GDP
growth has been falling. Liberalization of the telecommunications sector could have negative
effects on the profit margins of providers, potentially explaining the drop in GDP (Rouzet and
Spinelli, 2016).27
27They find that a higher broadband density is associated with lower profit margins, which suggests that
mark-ups tend to fall as markets mature.

3.5. Simulation results and discussion 115
Table 3.5: Changes in Real GDP (in USD millions): The impact of services liberalization
Types of ScenarioLong run
AfCFTA 1 AfCFTA 2
Reduction Reduction Service
of tariffs of tariffs contribution
and NTBs in and NTBs in (1) - (2)
all sectors all sectors
including except
services services
Countries (1) (2) (3)
South central Africa 8785.44 22.89 8762.55
Nigeria 1814.88 495.63 1319.25
Rest of Central Africa 1513.41 201.05 1312.36
Egypt 1758.31 502.78 1255.53
Ethiopia 1094.14 49.12 1045.02
Mozambique 937.97 31.04 906.93
Kenya 929.27 80.49 848.78
Rest of Eastern Africa 8972.33 8381.66 590.67
Ghana 893.25 305.91 587.34
South Africa 3112.38 2633.53 478.85
Rest of West Africa 748.2 274.07 474.13
Rest of North Africa 580.63 136.13 444.5
Tanzania 680.03 258.87 421.16
Burkina Faso 524.61 192.07 332.54
Uganda 403.6 89.02 314.58
Rest of South African Customs 373.18 68.35 304.83
Guinea 794.6 496.85 297.75
Zambia 289.04 91.36 197.68
Botswana 124.57 -41.26 165.83
Tunisia 463.93 314.77 149.16
Zimbabwe 184.42 37.69 146.73
Morocco 454.05 317.73 136.32
Namibia 263.87 178.47 85.4
Malawi 84.49 7.52 76.97
Madagascar 77.29 0.37 76.92
Ivory Coast 555.94 511.46 44.48
Rwanda 60.58 20.54 40.04
Mauritius 35.62 10.52 25.1
Togo 158.54 135.47 23.07
Cameroon 115.77 113.29 2.47
Senegal 395.7 446.47 -50.77
Benin -149.89 -14.92 -134.97
Total in USD millions 37030.15 16348.94 20681.21
Source: GTAP model, GTAP v10, AfCFTA database. The change in millions of GDP is calculated using the column
Ch/%Ch. It measures the change as the difference between the post-shock and pre-shock value of GDP.
Considering the income variable is very capital because an increase in this component has ef-

116Chapter 3. Modeling the impact of non-tariff barriers in services on intra-African
trade: Global Trade Analysis Project model
fects on consumption, savings and thus investment and trade. The results on regional house-
hold income growth are presented in Table 3.6. They show that regional household income
decreases in the short run (-0.1%). In the long run, income increases by 0.52%. We note an
increase in income by 1.25% and 2.4% after the reduction of tariffs and NTBs respectively in
the studies by AfDB (2019) and World Bank (2020). Moreover, the liberalization of services
contributes to reducing income by 0.74% and 0.39% in the short and long run. Individually,
all countries experienced a decline in regional household income as a result of services lib-
eralization, except for some highly trade-restrictive services countries such as Mozambique
and Zambia. These results are explained by lower margins for service providers as a result of
reduced barriers to entry. Restrictive regulations are enabling firms to charge higher mark-
ups in a majority of service sectors, generating large margins (Rouzet and Spinelli, 2016). The
reduction of NTBs in services will reduce margins and thus household income because em-
ployment in the services sector accounted for more than 50% of total employment in 2015
(WDI data).

3.5. Simulation results and discussion 117
Table 3.6: Regional household income (changes in percent)
Types of ScenarioShort run Long run
AfCFTA 1 AfCFTA 2 AfCFTA 1 AfCFTA 2
Reduction Reduction Reduction Reduction Long run
of tariffs of tariffs of tariffs of tariffs Service
and NTBs in and NTBs in and NTBs in and NTBs in contribution
all sectors all sectors all sectors all sectors (4)-(3)
except including except including
services services services services
Countries (1) (2) (3) (4) (5)
Guinea 3.9 3.02 8.77 10.86 2.09
Rest of South African Customs 0.76 0.92 1.25 3.22 1.97
Mozambique -0.43 0.19 -0.29 1.46 1.75
Zambia 1.78 2.4 1.93 2.94 1.01
Burkina Faso -0.4 -0.76 0.56 1.44 0.88
Ghana 0.15 0.4 0.22 0.54 0.32
Botswana -0.25 -0.8 -0.4 -0.37 0.03
Rwanda 0.13 0.07 0.21 0.11 -0.1
South central Africa -1.11 -1.04 -1.13 -1.23 -0.1
Madagascar -0.11 -0.26 -0.11 -0.26 -0.15
Namibia 2.4 1.98 2.67 2.45 -0.22
South Africa 1.5 1.24 1.74 1.51 -0.23
Tunisia 0.73 0.43 1.05 0.81 -0.24
Uganda 0.19 -0.38 0.33 -0.03 -0.36
Morocco 0.89 0.43 1.04 0.62 -0.42
Kenya -0.15 -0.85 -0.12 -0.58 -0.46
Ivory Coast 4.55 4.02 4.31 3.82 -0.49
Malawi 0.14 -0.3 0.1 -0.39 -0.49
Egypt 0.43 -0.21 0.51 0.01 -0.5
Cameroon -0.19 -0.94 -0.17 -0.89 -0.72
Tanzania 0.82 -0.04 0.95 0.16 -0.79
Togo 3.94 3.05 3.22 2.42 -0.8
Nigeria 0.31 -0.66 0.33 -0.6 -0.93
Zimbabwe -1.2 -2.29 -1.15 -2.16 -1.01
Rest of Central Africa -0.99 -2.5 -0.76 -1.79 -1.03
Rest of Eastern Africa 1.88 0.69 2.45 1.42 -1.03
Rest of North Africa -0.15 -1.29 -0.14 -1.31 -1.17
Ethiopia -0.54 -1.98 -0.42 -1.65 -1.23
Mauritius -0.02 -1.39 0.01 -1.34 -1.35
Senegal 2.95 1.54 3.75 2.32 -1.43
Rest of West Africa -0.53 -2.17 -0.15 -1.74 -1.59
Benin -0.79 -5.65 -1.42 -5.24 -3.82
Average (%) 0.64 -0.1 0.91 0.52 -0.39
Source: GTAP model, GTAP v10, AfCFTA database
3.5.3 Results on bilateral trade3.5.3.1 Agriculture, forestry and fish
The results of the impact of AfCFTA among African countries on bilateral trade in agricultural
products are shown in Table 3.7. Agriculture is still one of the main economic activities in
a majority of African countries. Intra-African exports of agricultural commodities are still
higher than other products (see Figure 3.11) and this sector provides the employment for

118Chapter 3. Modeling the impact of non-tariff barriers in services on intra-African
trade: Global Trade Analysis Project model
about two-thirds of the continent’s workforce population and contributes an average of 15%
of GDP and about 70% of value of exports in 2017.28
In 2019, total intra-African agricultural
trade was valued at $23 billion ($11.6 billion exports and $10.7 billion imports) representing
some 17% of total intra-African exports and 16% of intra-African imports. Only 23% of Africa’s
total agricultural exports are intra-Africa exports, while only 15% of Africa’s total agricultural
imports are sourced from within the continent (TRALAC, 2020). The AfCFTA increases intra-
African exports of agricultural goods by 18.39% in the long run. Moreover, a decrease in
exports to non-AfCTA partners has been observed (-1.95% to China, -1.59% to Europe, and
-1.88% to the USA, see Table 3.7). Services liberalisation increases intra-African exports by
1.62% (nearly $69.97 million, see Table 3.15), exports to China by 1.01% (an increase of nearly
$44.42 million), exports to Europe by 1.02% (about $148.43 million), and exports to the USA
by 1.02% (about $20.73 million).
Figure 3.11: Intra-African exports of goods (% of total trade), 2016-2020
010
20
30
40
50
2016 2017 2018 2019 2020Years
Primary commodities Food proucts
Ores and metals Fuels
Manufactured goods Textile fibres, yarn, fabrics and clothing
Cork and wood
Source: UNCTAD
Individually, South Africa is the country with the highest growth rate in intra-African exports
of primary goods (an increase of almost 61.27%), followed by Ethiopia (+47.27), Egypt (+39.49)
(considered as the largest exporters of food goods in Africa). In terms of value, South Africa
is the largest intra-African exporter of primary commodities under goods and services liber-
alization, with an increase of $408.6 million, followed by Ivory Coast (+$200.66 million) and
28UNCTADstat and World Development Indicators data in 2015.

3.5. Simulation results and discussion 119
Ethiopia (+$134.59 million, see Table 3.14). Countries such as Burkina Faso, Guinea, Togo, and
Rwanda have seen their exports decline as a result of the liberalization of goods and services.
South African exports accounted for almost 30% of intra-African food exports in 2018 (Data
from UNCTADStat in 2018). Citrus, tables grapes, apples and pears accounted for the largest
exports by value. South Africa also exports nuts, corn, wool, etc. Rwanda, Botswana and
Mauritius have the lowest growth rates.29
Inmonetary terms, the reduction of NTBs in services increase intra-African exports of agricul-
tural products by almost $408 million for South Africa, $189.6 million for Ivory Coast, $126.92
million for Ethiopia, almost $12 and $9 million for Egypt and Nigeria, respectively (see Table
3.15).30Services liberalization significantly contributes to the export growth of large African
agricultural exporters relative to small exporters, which explains the decline in exports of
many African countries. Interestingly, African exports of agricultural products to trading
partners could increase following the liberalization of trade in services. Indeed, we note an
increase in exports to China (+$48.42 million), Europe (+$148.43 million) and the United States
(+$20.73 million). Exports to Europe are the most important because it is still Africa’s largest
trading partner (see Figure 3.1).
29The economies that are already relatively open (World Bank, 2020).
30These countries accounted for about 43% of intra-African exports of primary products in 2015 (UNCTAD
data).

120Chapter 3. Modeling the impact of non-tariff barriers in services on intra-African
trade: Global Trade Analysis Project model
Table 3.7: Agricultural exports (changes in percent): Long run impact
Long runTypes of Scenario
AfCFTA 1 AfCFTA 2
Reduction of tariffs and NTBs Reduction of tariffs and NTBs
in all sectors except services in all sectors including services
Partners (Importing region)
No AfCFTA No AfCFTA
Intra-Africa China EU-EFTA USA Intra-Africa China EU-EFTA USA
Exporters Trade Trade
(1) (2) (3) (4) (5) (6) (7) (8)
South Africa 60.04 -5.82 -5.16 -5.59 61.27 -5.29 -4.66 -5.08
Rest of North Africa 48.4 1.22 1.43 1.33 54.4 5.01 5.06 5.08
Ethiopia 37.69 0.6 0.85 0.73 44.27 5.07 5.22 5.28
Egypt 37.26 -1.85 -1.49 -1.76 39.49 -0.56 -0.25 -0.45
South central Africa 36.31 6.72 7.37 7.4 38.9 8.4 9.18 9.23
Morocco 28.76 -3.63 -2.84 -3.18 29.98 -3.01 -2.29 -2.63
Rest of Eastern Africa 23.83 1.25 1.53 1.4 28.04 4.3 4.65 4.51
Nigeria 21.42 -1.71 -1.47 -1.61 26.74 2.38 2.72 2.54
Tunisia 25.51 -3.44 -2.8 -3.03 26.47 -3.06 -2.45 -2.7
Ghana 24.95 -2.57 -2.4 -2.56 24.05 -3.31 -3.14 -3.34
Kenya 20.32 0.29 0.53 0.41 23.67 2.84 2.92 3.02
Cameroon 20.4 0.63 0.9 0.79 22.96 2.52 2.83 2.82
Benin 13.51 1.91 2.23 2.15 22.83 9.61 10.17 10.36
Zimbabwe 20.49 1.75 1.89 1.88 21.71 2.65 2.72 2.78
Rest of Central Africa 18.82 3.28 3.7 3.67 20.76 4.42 4.92 4.9
Rest of West Africa 15.17 -0.78 -0.5 -0.72 19.03 2.1 2.34 2.37
Ivory Coast 16.69 -10.24 -10.19 -10.53 17.86 -9.62 -9.54 -9.89
Mozambique 20.49 -0.4 -0.14 -0.3 15.52 -4.55 -4.33 -4.72
Madagascar 14.73 0.22 0.5 0.36 15.13 0.4 0.7 0.55
Malawi 11.18 -2.27 -2.03 -2.19 13.46 -0.57 -0.28 -0.46
Uganda 9.96 -1.7 -1.44 -1.62 11.64 -0.57 -0.21 -0.47
Senegal 5.97 -12.89 -11.18 -13.17 10.07 -9.83 -8.44 -10.02
Namibia 9.13 -7.76 -6.68 -7.72 9.28 -7.78 -6.69 -7.76
Tanzania 3.68 -4.85 -4.69 -4.87 6.95 -2.18 -1.94 -2.13
Rwanda 2.01 -1.41 -1.13 -1.27 3.69 -0.12 0.17 -0.09
Mauritius 1.62 -0.23 0.06 -0.09 3.32 1.19 1.4 1.22
Zambia 5.53 -7.49 -7.13 -7.87 3.03 -9.85 -9.45 -10.38
Botswana 1.67 -0.85 -0.58 -0.72 2.7 -0.13 0.16 -0.02
Rest of South
African Customs 3.16 -4.69 -3.89 -4.69 -0.02 -8 -6.83 -8.08
Togo -1.7 -7.61 -7.41 -7.68 -0.28 -6.64 -6.4 -6.69
Burkina Faso 2.04 -2.87 -2.58 -2.86 -0.86 -5.87 -5.54 -5.96
Guinea -22.39 -27.51 -28.65 -28.99 -27.67 -32.31 -33.6 -33.98
Average (%) 16.77 -2.96 -2.61 -2.9 18.39 -1.95 -1.59 -1.88
Source: GTAP model, GTAP v10, AfCFTA database
3.5.3.2 Manufactured goods
The manufacturing sector accounts for a significant share of intra-African trade. It repre-
sented almost 46% of intra-African trade in 2015. Approximately 57% of intra-Africa exports
are neither commodities nor agricultural products and include flexible tubing, vessels, electri-
cal energy, diamonds, motor vehicles and cement (TRALAC, 2020). The largest exporters
are South Africa, Egypt and Nigeria according to the Global Manufacturing Competitive-
ness Index. Liberalisation of this sector will be beneficial for newer players such as Ethiopia,

3.5. Simulation results and discussion 121
Morocco, Rwanda, Ghana and Ivory Coast31and boost intra-African trade in manufacturing
goods. Themanufacturing sector includes medium-high skill and technology intensive manu-
factures. The establishment of the AfCFTAwould rise intra-African exports of manufacturing
products by 63.86% in the long run, with a 9.91% increase in exports to China, 10.7% to Europe,
and 10.33% to the United States (Table 3.8). The growth is significant in the manufacturing
sector due to the effect of the reduction in trade barriers (World Bank, 2020). Indeed, the aver-
age trade-weighted NTBs for goods amounts to 30%, with the highest levels in manufacturing
(37%), followed by agriculture (30%) and natural resources (15%). Services liberalisation in-
creases intra-African exports by 16.37%, or nearly $827.3 million, exports to China by 9.07%
(an increase of nearly $187.5 million), exports to the Europe by 9.53% (about $961.41 million),
and exports to the United States by 9.35% (about $149.44 million, see Table 3.15). We find
a significant dependence of the manufacturing sector on services (servicification) in Africa.
These results refer to the existing literature on the effects of restrictions in services on the
performance of manufacturing firms (Ariu et al., 2019 ; Ariu et al., 2020).
Benin, Ethiopia, Ivory Coast and Nigeria are the countries that are recording a high growth
rate in intra-African exports of manufacturing goods (an increase of nearly 97.92, 96.7, 95.64
and 92.53%, respectively, see Table 3.8). In monetary terms, South Africa is the biggest intra-
African exporter ofmanufactured goods (+$3.417 billion), followed byNigeria, Morocco, Egypt
and Ivory Coast with increases of $698.26million, $533.81million, $416.65million, and $349.02
million respectively as a result of reductions in trade barriers (Table 3.14). Countries such as
Malawi, Mauritius, Namibia and Zambia which have low intra-African manufacturing ex-
ports, registered lower growth rates after AfCFTA’s establishment.32
The liberalization of
services would be beneficial to the largest exporters of manufacturing goods (South Africa,
Nigeria, Morocco, Egypt, see Table 3.15 and Figure 3.13) rather than to small exporters. In-
deed, in many African countries, services exports are limited to direct exports of services,
while for others, services exports also include exports incorporated in goods and other ser-
vices, through their forward linkages (Sáez, McKenna and Hoffman, 2015). For example, in
the most advanced African economies, the contribution of services to manufactured exports
is more important than their contribution to the domestic value added of manufacturing, so
31All of whom have recently adopted policies promoting manufacturing and industrial development (Sun
Yuan, 2017).
32According to UNCTAD data, they contribute almost 3% of intra-African exports of manufactured goods in
2018.

122Chapter 3. Modeling the impact of non-tariff barriers in services on intra-African
trade: Global Trade Analysis Project model
services liberalization would positively affect the largest exporters of manufactured goods. As
before, African exports of manufactured goods to its trading partners are increasing with the
liberalization of services. The rise is significant when considering exports to Europe (Europe
accounts for nearly 30% of total African manufacturing exports, UNCTAD data).
Table 3.8: Manufactured exports (changes in percent): Long run impact
Long runTypes of Scenario
AfCFTA 1 AfCFTA 2
Reduction of tariffs and NTBs Reduction of tariffs and NTBs
in all sectors except services in all sectors including services
Partners (Importing region)
No AfCFTA No AfCFTA
Intra-Africa China EU-EFTA USA Intra-Africa China EU-EFTA USA
Countries Trade Trade
(1) (2) (3) (4) (5) (6) (7) (8)
Rest of Eastern Africa 0 56.73 60.67 61.23 163.31 70.7 76.28 76.79
South central Africa 69.7 5.75 6.21 6.04 135.39 48.69 51.58 51.43
Benin 46.54 5.5 5.68 5.48 97.92 18.43 18.8 18.39
Ethiopia 45.71 2.84 3.15 2.97 96.7 29.89 31.39 31
Ivory Coast 51.42 -16.65 -16.48 -16.75 95.64 -13.97 -13.54 -13.94
Nigeria 76.87 -1.25 -1.02 -1.24 92.53 6.29 6.87 6.71
Ghana 68.43 8.73 8.89 8.77 88.82 13.64 14.06 13.79
Togo 80.45 -5.04 -4.84 -4.98 83.99 -0.06 0.48 0.11
Guinea 64.37 -11.78 -11.79 -12.67 81.17 -2.24 -1.77 -2.25
Rest of North Africa 82.99 0.93 1.14 0.96 79.67 8.11 8.44 8.16
Rest of West Africa 91.36 2.79 3.04 2.67 79.67 13.5 14.04 12.76
Rest of Central Africa 63.35 5.33 5.41 5.1 76.07 19.96 19.89 19.05
Senegal 28.56 -5.1 -4.94 -5.13 74.33 -0.86 -0.34 -0.7
Cameroon 78.73 2.02 2.24 2.09 69.73 7.01 7.51 7.28
Kenya 21.38 1.33 1.64 1.44 58.21 8.94 9.93 9.54
Rest of South
African Customs 22.55 -5.15 -4.91 -5.06 53.49 6.85 7.41 6.98
Tunisia 32.92 -1.97 -1.77 -1.97 52.98 0.17 0.71 0.35
Egypt 26.67 -0.92 -0.66 -0.85 52.94 4.64 5 4.67
South Africa 34.05 -5.06 -4.86 -5.04 51.89 -3.52 -3.03 -3.37
Mozambique 12.69 0.57 0.83 0.63 50.07 14.38 14.93 14.57
Madagascar 17.12 0.57 0.81 0.62 49.43 5.8 6.33 5.98
Morocco 43.63 -3.62 -3.31 -3.51 47.4 -1.57 -1.01 -1.37
Burkina Faso 48.62 5.7 5.94 5.71 45.15 20.92 21.49 20.97
Tanzania 56.78 -3.39 -3.39 -3.57 41.7 3.91 4.76 4.39
Zimbabwe 29.56 6.34 6.5 6.34 38.91 15.48 15.84 15.55
Uganda 29.53 -0.2 -0.02 -0.15 36.88 12.21 13.48 13.05
Botswana 17.01 -0.82 -0.58 -0.77 32.26 2.44 2.98 2.61
Rwanda 51.09 -0.45 -0.21 -0.4 31.22 4.2 4.75 4.37
Malawi 65.02 0.46 0.69 0.5 29.55 12.71 13.19 12.69
Namibia 68.27 -7.91 -7.65 -7.75 21.66 -3.08 -2.55 -2.87
Zambia 56.39 -9.47 -9.33 -9.53 19.65 -9.73 -9.32 -9.68
Mauritius 37.76 -0.01 0.23 0.04 15.16 3.33 3.84 3.49
Average (%) 47.49 0.84 1.17 0.98 63.86 9.91 10.7 10.33
Source: GTAP model, GTAP v10, AfCFTA database
3.5.3.3 Processed foods
We consider the processed food sector because it represented a significant share of intra-
Africanmanufactured exports (about 44% of total manufacturing exports in 2018) and is highly

3.5. Simulation results and discussion 123
dependent on the services sector (Amara, 2021). Also at the continental level, the average trade
weight tariffs are at about 5%, with the highest tariffs imposed on processed foods, textiles and
wearing apparel. The manufacturing sector accounts for 12.6% of employment, of which 42%
is in food processing (World Bank, 2020). The AfCFTAwould increase intra-African exports of
processed foods by 36.79% in the long run, exports to China by 3.37%, to the Europe by 3.84%,
and to the United States by 3.59% (Table 3.9). Services liberalisation increases intra-African
exports by 3.45%, or nearly $116.93 million, a 4.28% increase in exports to China (an increase
of nearly $37.81 million), a 4.51% increase in exports to the Europe (about $298.89 million),
and a 4.39% increase in exports to the United States (about $30 million, see Table 3.15).
South Africa, Egypt, Nigeria andMorocco countries are the countries with the highest growth
rates in intra-African exports of agri-food goods after the implementation of the agreement
(considered to be the major exporters in Africa). South Africa is experiencing an increase
in intra-African processed food exports of about $1.2 billion, followed by Morocco, Egypt
and Nigeria (+$389.55 million; +$329.64 million; and +$305.48 million, respectively) following
the reduction of NTBs in the services (Table 3.15). As mentioned above, the liberalization of
services boosts exports from the major food exporting countries in Africa (see, Figure 3.13).
African food exports to Europe increase significantly as a result of services liberalization.

124Chapter 3. Modeling the impact of non-tariff barriers in services on intra-African
trade: Global Trade Analysis Project model
Table 3.9: Processed foods exports (changes in percent): Long run impact
Long runTypes of Scenario
AfCFTA 1 AfCFTA 2
Reduction of tariffs and NTBs Reduction of tariffs and NTBs
in all sectors except services in all sectors including services
Partners (Importing region)
No AfCFTA No AfCFTA
Intra-Africa China EU-EFTA USA Intra-Africa China EU-EFTA USA
Countries Trade Trade
(1) (2) (3) (4) (5) (6) (7) (8)
Rest of North Africa 102.21 1.7 1.88 1.78 106.42 5.42 5.81 5.61
South Africa 99.37 -4.41 -4.18 -4.33 97.85 -3.4 -2.94 -3.21
Egypt 96.34 -1.35 -1.09 -1.22 97.82 1 1.4 1.15
South central Africa 43.05 6.06 6.19 6.06 62.54 23.04 23.2 22.91
Nigeria 55.86 -1.82 -1.58 -1.69 61.52 3.5 3.87 3.57
Morocco 58.96 -3.15 -2.91 -3.06 58.3 -2.05 -1.59 -1.86
Mozambique 52.86 1.97 2.16 2 56.26 6.03 6.41 6.09
Ghana 52.86 -2.36 -2.16 -2.28 50.79 -2.22 -1.79 -2.03
Rest of Eastern Africa 44.58 17.71 18.58 19.02 50.64 24.35 25.81 26.32
Tunisia 46.05 -1.95 -1.71 -1.84 45.37 -1 -0.54 -0.8
Rest of West Africa 36.39 0.84 1.04 0.92 43.2 7.41 7.81 7.62
Kenya 35.91 0.81 0.99 0.88 43.03 7.86 8.01 7.96
Cameroon 34.93 1.71 1.89 1.74 36.33 4.37 4.76 4.43
Ivory Coast 34.48 -10.86 -10.79 -10.89 35.35 -9.04 -8.73 -8.95
Ethiopia 16.8 1.69 1.97 1.82 31.09 15.12 16.26 15.76
Senegal 28.71 -6.16 -5.95 -6.19 31.01 -3.12 -2.69 -2.99
Benin 20.82 2.64 3.02 2.89 30.67 12.22 13.5 13.26
Rest of Central Africa 20.81 4.53 4.62 4.43 28.13 12.65 12.79 12.35
Namibia 27.22 -6.32 -6.12 -6.32 27.47 -4.67 -4.24 -4.55
Zimbabwe 23.93 3.5 3.66 3.52 27.15 7.79 8.15 7.85
Rest of South
African Customs 23.72 -4.27 -3.87 -3.98 25.43 -1.29 -0.79 -1.04
Uganda 16.21 -0.35 -0.14 -0.27 22.64 6.88 7.12 6.99
Malawi 16.8 -0.95 -0.74 -0.87 21.51 4.63 5.08 4.83
Togo 18.93 -5.22 -4.75 -4.88 19.37 -3.28 -2.67 -2.94
Tanzania 15.03 -3.14 -2.88 -3.06 18.52 1.33 1.75 1.52
Mauritius 13.21 0.01 0.22 0.09 13.59 1.88 2.32 2.07
Madagascar 12.25 0.26 0.47 0.34 11.8 1.37 1.79 1.55
Guinea 6.99 -12.56 -12.52 -12.77 11.65 -7.54 -7.21 -7.53
Burkina Faso 7.59 0.64 0.84 0.72 9.53 3.91 4.29 4.1
Zambia 4.07 -7.09 -6.85 -7.16 1.39 -8.24 -7.77 -8.22
Botswana 0.26 -0.42 -0.2 -0.34 0.45 1.25 1.66 1.44
Rwanda -0.37 -0.7 -0.48 -0.6 0.42 1.56 1.99 1.72
Average (%) 33.34 -0.91 -0.67 -0.8 36.79 3.37 3.84 3.59
Source: GTAP model, GTAP v10, AfCFTA database
3.5.3.4 Fossil fuels
The fossil fuel sector in Africa is vital as the continent struggles to implement renewable
energy policies. The African economy is highly dependent on fossil fuels and Africa has a
enormous potential of fossil fuels, accounting for about 9.5%, 8% and 4% of the total proven
reserves of crude oil, natural gas and coal in the world, respectively (BP, 2011). In 2018, Nige-
ria and South Africa account for nearly 50% of intra-African fuel exports and 10% of global
fuel exports come from Africa (UNCTAD data, 2018).

3.5. Simulation results and discussion 125
The AfCFTA would increase intra-African fossil fuel exports by 22.13% in the long term, a
1.96% increase in exports to China, 2.21% to the Europe, and 2.32% to the United States (Ta-
ble 3.10). The Services liberalisation would boost intra-African exports by 4.92%, or nearly
$290.52 million, exports to China by 4.07% (an increase of nearly $992.24 million), exports to
the Europe by 4.32% (about $1.422 billion), and exports to the United States by 4.25% (about
$324.41 million, see Table 3.15). Senegal, Ethiopia, Morocco and Egypt countries would record
a large growth rate in intra-African trade in the long term. South Africa and Nigeria registered
a significant increase in intra-African fossil fuel exports by $857.59 million, $593.47 million
respectively after the implementation of the agreement (Table 3.14). South Africa and Nigeria
recorded significant growth in fossil fuel exports, increasing by $857.46 million and $592.34
million respectively, as a result of services liberalization (see, Table 3.15 and Figure 3.13). In-
terestingly, services liberalization led to a significant increase in Africa’s fossil fuel exports to
its trading partners (see, Figure 3.12). Indeed, Europe and China are the top destination coun-
tries for Africa’s fossil fuels (respectively nearly 40% and 20% of total African fuel exports,
UNCTAD data).

126Chapter 3. Modeling the impact of non-tariff barriers in services on intra-African
trade: Global Trade Analysis Project model
Table 3.10: Fossil fuels exports (changes in percent): Long run impact
Long runTypes of Scenario
AfCFTA 1 AfCFTA 2
Reduction of tariffs and NTBs Reduction of tariffs and NTBs
in all sectors except services in all sectors including services
Partners (Importing region)
No AfCFTA No AfCFTA
Intra-Africa China EU-EFTA USA Intra-Africa China EU-EFTA USA
Countries Trade Trade
(1) (2) (3) (4) (5) (6) (7) (8)
Senegal 87.29 2.18 2.25 2.27 89.49 2.9 2.98 3.24
Ethiopia 5.92 4.02 4.16 4.11 78.69 75.1 75.27 75.66
Rest of North Africa 61.22 -0.19 -0.04 -0.1 63.6 0.83 1.08 1.16
Morocco 53.55 -0.95 -0.79 -0.87 54.41 -0.81 -0.6 -0.49
Egypt 35.98 -1.13 -0.99 -1.07 37 -0.64 -0.39 -0.27
South Africa 35.11 -7.45 -7.32 -7.61 35.92 -7.27 -7.05 -7.15
Ghana 17.18 -3.51 -3.37 -3.54 33.79 9.6 9.89 10.4
Tunisia 27.14 -0.73 -0.57 -0.63 27.9 -0.65 -0.45 -0.37
Cameroon 24.49 0.79 0.95 0.88 25.56 1.31 1.58 1.65
Rest of Eastern Africa 23.07 1.52 1.69 1.61 24.77 2.45 2.76 2.81
Rest of Central Africa 22.11 0.72 0.87 0.81 24.26 1.88 2.14 2.22
Togo 17.12 -14.77 -14.46 -15.01 22.87 -10.98 -10.64 -10.89
Rest of West Africa 20.72 -0.6 -0.44 -0.5 22.66 0.69 0.87 0.93
Benin 10.3 -5.93 -5.73 -5.84 19.92 2.2 2.41 2.53
Zimbabwe 15.74 9.66 9.62 9.8 19.59 12.81 12.78 13.25
Nigeria 16.05 -0.87 -0.72 -0.78 17.06 -0.34 -0.09 -0.01
Namibia 8.72 -12.2 -11.65 -12.11 16.37 -6.17 -5.77 -5.85
Kenya 8.74 0.7 0.86 0.8 14.31 5.48 5.72 5.84
Guinea 12.88 -0.19 -0.05 -0.1 12.84 -0.52 -0.3 -0.2
South central Africa 7.88 0.38 0.53 0.47 11.54 3.23 3.49 3.57
Burkina Faso 7.65 0.37 0.52 0.46 8.81 1.16 1.41 1.49
Ivory Coast 6.32 -27.77 -26.84 -26.84 7.5 -27.28 -26.33 -26.22
Rwanda 2.65 -0.32 -0.17 -0.23 7.4 3.85 4.11 4.19
Uganda 5.59 -0.35 -0.2 -0.26 7.28 0.83 1.09 1.17
Zambia 6.43 -2.21 -2.07 -2.13 6.58 -2.5 -2.26 -2.19
Rest of South
African Customs 3.71 -1.13 -0.98 -1.04 4.22 -1 -0.75 -0.68
Mauritius -0.21 -0.67 -0.52 -0.58 3.81 2.98 3.19 3.32
Botswana 2.16 -2.49 -2.54 -2.62 3.03 -2.27 -2.06 -1.98
Malawi 1.08 -0.33 -0.18 -0.24 2.65 0.85 1.11 1.19
Tanzania 5.39 -0.95 -0.8 -0.86 2.46 -4.15 -3.91 -3.83
Madagascar 0.41 -0.15 0 -0.06 0.91 -0.04 0.22 0.29
Mozambique -1.63 -2.84 -2.67 -2.92 0.9 -0.92 -0.69 -0.53
Average (%) 17.21 -2.11 -1.93 -2.02 22.13 1.96 2.21 2.32
Source: GTAP model, GTAP v10, AfCFTA database
3.5.3.5 Energy-intensive manufacturing
The energy-intensive manufacturing sector is still dynamic in Africa due to the abundance of
natural resources (minerals and precious metals). In addition, about 30% of the world’s min-
eral reserves are in Africa. The continent’s proven oil reserves constitute 8% of the world’s
stock and natural gas reserves at 7%. Minerals account for an average of 70% of total African
exports and about 28% of GDP. However, only 10% of Africa’s global mineral and precious
stone exports are to Africa, 30% are destined for Europe, 33% for China and 7% for the USA in

3.5. Simulation results and discussion 127
2018 (UNCTAD data).33
Following the agreement, intra-African exports of minerals, ferrous metals and metals would
increase by 37.25% in the long term, with a 7.54% increase in exports to China, 8.01% to the
Europe, and 8.08% to the United States (Table 3.11). Ghana and Ethiopia are the countries with
the highest growth rates in intra-African exports (Table 3.11). In monetary terms, the large
increase is observed in major exporting countries such as South Africa, South Central Africa
countries (Angola, Democratic Republic of Congo), Ivory Coast and Morocco (account for al-
most 80% of intra-African exports of energy-intensive manufactured goods in 2019, UNCTAD
data). The liberalisation of services would increase intra-African exports by 8.02% (nearly
$515.23 million), a 7.56% increase in exports to China (almost $1.249 billion), a 8.01% increase
in exports to the Europe (about $1.854 billion), and a 7.82% increase in exports to the United
States (about $139.17 million, see Table 3.16). Exports to Europe and China are the most sig-
nificant (World Bank, 2020). Indeed, almost 70% of Africa’s total exports of energy-intensive
manufactured goods are destined for Europe and China (UNCTAD data). Ivory Coast, South
Africa, andMorocco would have significant increases in intra-African exports by $384million,
$270.66 million, $238.45 million, and $113.35 million, respectively, following the reduction in
NTBs in services (see, Table 3.16 and Figure 3.14).
33This is because most of the global value chains that use minerals and precious stones are located outside of
Africa.

128Chapter 3. Modeling the impact of non-tariff barriers in services on intra-African
trade: Global Trade Analysis Project model
Table 3.11: Energy-intensive manufacturing exports (changes in percent): Long run impact
Long runTypes of Scenario
AfCFTA 1 AfCFTA 2
Reduction of tariffs and NTBs Reduction of tariffs and NTBs
in all sectors except services in all sectors including services
Partners (Importing region)
No AfCFTA No AfCFTA
Intra-Africa China EU-EFTA USA Intra-Africa China EU-EFTA USA
Countries Trade Trade
(1) (2) (3) (4) (5) (6) (7) (8)
Ghana 78.64 0.76 1.01 0.87 82.05 3.87 4.55 4.64
Ethiopia 48.47 2.18 2.52 2.23 76.64 21.72 24.07 22.39
Rest of West Africa 62.45 1.79 2.04 1.91 74.88 10.7 11.55 11.66
Rest of North Africa 65.71 0.69 0.83 0.71 74.79 7.69 7.74 8.02
Rest of Eastern Africa 62.15 30.39 32.28 32.73 72.37 39.65 42.26 43.23
South central Africa 31.39 3.93 4.09 3.97 70 37.66 37.91 38.23
Tunisia 64.48 -2.11 -2 -2.07 65.59 -0.26 -0.04 0.02
Nigeria 53.07 -0.74 -0.61 -0.76 57.82 3.88 4.25 4.41
Morocco 55.5 -3.12 -2.89 -2.87 56.6 -1.76 -1.53 -1.4
Egypt 46.44 -1.11 -1.03 -1.08 51.85 3.38 3.87 3.62
Rest of Central Africa 31.02 3.75 4.06 3.75 47.1 17.34 18.33 17.57
Mozambique 12.04 0.41 0.58 0.44 35.82 22.89 23.19 23.55
Senegal 31.84 -3.96 -3.86 -3.95 34.68 -0.76 -0.57 -0.49
Benin 21.1 4.58 4.84 4.52 33.9 17.12 17.76 17.09
South Africa 33.56 -3.99 -3.97 -4.1 33.57 -2.87 -2.75 -2.68
Cameroon 25.71 2.13 2.24 2.11 27.58 4.88 4.95 5.04
Zimbabwe 22.58 3.97 4.23 4.11 27.53 9.4 9.87 10
Namibia 24.91 -3.66 -3.54 -3.89 27.13 -0.49 -0.28 -0.21
Ivory Coast 24.59 -12.64 -13.3 -12.72 26.34 -10.5 -10.96 -10.33
Rest of South
African Customs 18.3 -3.55 -3.68 -3.8 25.56 2.89 3.37 3.45
Burkina Faso 14.01 3.35 3.52 3.39 22.41 12.48 12.76 12.88
Kenya 15.69 0.77 0.91 0.79 22.01 7.47 7.45 7.77
Botswana 19.68 -0.16 -0.01 -0.14 20.65 1.91 2.21 2.29
Malawi 8.49 0.1 0.25 0.12 19.9 12.1 12.2 12.65
Tanzania 12.66 -2.33 -2.26 -2.49 18.5 3.92 4.29 4.59
Guinea 6.19 -9.94 -9.71 -9.47 17.42 -0.46 -0.25 -0.18
Togo 13.28 -5.1 -5.08 -5.17 17.31 -0.39 -0.18 -0.11
Uganda 8.31 -0.64 -0.49 -0.64 16.47 8.01 8.27 8.66
Madagascar 5.95 0.58 0.76 0.62 14.5 9.75 10.35 10.45
Mauritius 9.18 0.24 0.39 0.26 9.87 2.09 2.24 2.36
Zambia 7.03 -5.29 -5.14 -5.27 8.24 -2.94 -2.74 -2.67
Rwanda 1.05 -0.91 -0.8 -0.88 2.87 1.76 2.09 2.01
Average (%) 29.23 0.01 0.19 0.1 37.25 7.57 8.01 8.08
Source: GTAP model, GTAP v10, AfCFTA database
3.5.3.6 Wood and paper products
The wood and paper sector is important in African trade. Indeed, according to the Food and
Agriculture Organization (FAO) Africa’s forests and woodlands are estimated to cover 650
million hectares, or 21.8% of the continent’s land area (FAO, 2003). Using the FAO (2003)
estimation, African forests and woodlands are unevenly distributed among sub-regions and
countries. Central Africa has the largest proportion of African forest (37.1%), followed by
Southern Africa (28.0%), Eastern Africa (13.2%), Western Africa (11.1%) and Northern Africa

3.5. Simulation results and discussion 129
(10.5%). Central Africa has the second largest area of tropical forest in the world and the ex-
ploitation of this forest for wood is an important economic activity. Cork and wood exports
from Cameroon, the Democratic Republic of Congo and Gabon (the world’s second largest
forest area) accounted for almost 22% of intra-African exports in 2018, 22% of global exports
from these countries go to Europe and 60% to China (UNCTAD data).
The forestry sector does not entail only wood production. It is associated with food security
and better nutrition (AfDB, 2018). Indeed, it contributes directly to subsistence food produc-
tion due to the richness of forest soils. It provides energy, especially for cooking. Income
and employment generation; and the provision of ecosystem services (soil fertility enhance-
ment, water storage, pollination, windbreaks, shelter). The AfCFTA would lead to a 37.67%
increase in intra-African exports of wood and paper products, a 5.78% increase in exports to
China, a 6.38% increase to Europe, and a 5.98% increase to the United States in the long term
(Table 3.12). Northern, Southern, and Eastern African countries have the highest long-term
growth rates for intra-African exports. South Africa, Egypt and Tunisia recorded a significant
increase in their intra-African wood and paper exports following the implementation of the
agreement (respectively an increase of $161.92, $112.72 and $86.09 million). Services liberal-
isation increases intra-African exports by 5.49% (nearly $32.26 million), a 6.26% increase in
exports to China (an increase of nearly $38.85 million), a 6.63% increase in exports to the Eu-
rope (about $74.15 million), and a 6.45% increase in exports to the United States (about $11.69
million, see Table 3.16). South Africa, Egypt, Morocco and Tunusia recorded significant in-
creases in intra-African exports by $160.96, $105.8, $91.2 and $82.7 million respectively (Table
3.16).

130Chapter 3. Modeling the impact of non-tariff barriers in services on intra-African
trade: Global Trade Analysis Project model
Table 3.12: Wood and paper exports(changes in percent): Long run impact
Long runTypes of Scenario
AfCFTA 1 AfCFTA 2
Reduction of tariffs and NTBs Reduction of tariffs and NTBs
in all sectors except services in all sectors including services
Partners (Importing region)
No AfCFTA No AfCFTA
Intra-Africa China EU-EFTA USA Intra-Africa China EU-EFTA USA
Countries Trade Trade
(1) (2) (3) (4) (5) (6) (7) (8)
Rest of North Africa 72.16 0.79 0.99 0.82 78.9 6.68 7.21 6.94
Egypt 68.47 -1.12 -0.87 -1.07 76.46 6.19 6.41 6.11
Tunisia 71.46 -1.74 -1.48 -1.7 70.12 -0.51 0.07 -0.33
Rest of Eastern Africa 59.56 34.15 34.25 34.04 69.11 45.21 45.77 45.25
South central Africa 32.88 5.11 5.36 5.18 65.18 32.38 33.39 32.97
Rest of West Africa 49.05 0.98 1.19 1.02 60.78 10.85 11.52 11.21
Cameroon 58.06 1.46 1.67 1.48 60.57 4.98 5.58 5.16
Rest of Central Africa 40.32 4.41 4.63 4.44 52.3 15.03 15.7 15.25
Ghana 53.19 -2.25 -2.03 -2.21 50.93 -1.82 -1.26 -1.65
South Africa 50.76 -5.16 -4.93 -5.18 49.53 -4.15 -3.58 -4.01
Morocco 49.46 -3.44 -3.11 -3.5 48.94 -2.03 -1.4 -1.91
Senegal 44.94 -3.89 -3.56 -3.74 47.64 -0.21 0.35 -0.05
Kenya 40.22 0.86 1.06 0.86 46.65 7.72 8.27 7.72
Ethiopia 29.27 2.96 3.15 2.96 46.07 18.54 19.11 18.59
Nigeria 37.35 -1.62 -1.46 -1.73 43.4 4.17 4.88 4.73
Togo 37.26 -6.75 -6.54 -6.6 38.64 -4.2 -3.65 -3.97
Burkina Faso 28.39 7.5 7.58 7.5 38.17 17.81 18.12 17.94
Benin 20.56 3.41 3.73 3.64 37.73 19.23 20.61 20.71
Rest of South
African Customs 27.16 -4.83 -4.38 -4.48 33.61 2.33 2.76 2.32
Mauritius 29.06 -0.29 -0.09 -0.27 29.01 1.84 2.32 2
Ivory Coast 25.73 -15.56 -15.49 -15.71 26.53 -13.68 -13.29 -13.68
Tanzania 19.07 -3.97 -3.96 -4.09 23.98 1.69 2.35 1.93
Madagascar 19.62 0.45 0.64 0.45 22.01 4.14 4.6 4.18
Botswana 16.37 -0.39 -0.18 -0.36 16.5 1.82 2.38 1.94
Zimbabwe 12.04 4.1 4.32 4.11 15.32 9.49 10.13 9.65
Uganda 8.94 -0.28 -0.13 -0.25 15.09 7.61 8.08 7.66
Mozambique 10.66 -0.13 0.09 -0.09 14.22 4.94 5.66 5.31
Malawi 6.41 -0.34 -0.14 -0.33 12.26 7 7.67 7.47
Zambia 16.52 -8.26 -7.94 -8.69 12.12 -9.99 -9.32 -10.36
Namibia 3.38 -7.77 -6.91 -7.63 4.5 -4.7 -3.77 -4.47
Rwanda 0.15 -0.3 -0.15 -0.27 1.81 3.29 3.73 3.18
Guinea -8.69 -13.45 -13.37 -13.52 -2.78 -6.62 -6.14 -6.5
Average(%) 32.18 -0.48 -0.25 -0.47 37.67 5.78 6.38 5.98
Source: GTAP model, GTAP v10, AfCFTA database
3.5.3.7 Textiles and wearing apparel
African countries have a comparative advantage in labor-intensive light manufacturing, such
as textiles sector. However, the textile and apparel sector represents a low share of intra-
African trade. Intra-African exports of textiles and clothing represent only 14% of total African
exports in 2018, with almost 50% of exports to Europe and 13% to the United States. South
Africa is the leading exporter of textiles and clothing in Africa with nearly 30% of intra-African
exports, followed by Egypt (8%) and Morocco (3%) according UNCTAD data.

3.5. Simulation results and discussion 131
The textile and clothing industry can drive Africa’s industrial transformation and create many
jobs. It is estimated that up to 600% of the value can be created along the cotton value chain:
from cotton production, spinning and twisting into yarn, to weaving and knitting into fabric,
and then to dyeing, printing and design (Moungar and Gregorio, 2018). The implementation
of the AfCFTA would lead to an increase in intra-African exports of textiles and clothing by
122.79% in the long run, an increase of 8.6% in exports to China, 9.03% to the Europe, and
8.77% to the United States (see Table 3.13). Individually, Nigeria, Ghana Ethiopia and South
Africa are experiencing high long-term intra-African trade growth rates. Services liberalisa-
tionwould increase intra-African exports by 13.73%, or nearly $126.26million, a 8.42% increase
in exports to China (an increase of nearly $284.61 million), a 8.64% increase in exports to the
Europe (about $599.33 million), and a 8.53% increase in exports to the United States (about
$324.28 million, see Table 3.16). Nigeria, South Africa and Morocco are recording significant
increases in intra-African exports of about $364.46, $185.31 and $146.18 million, respectively
following the reduction of NTBs in the services. As above, the liberalization of services would
boost exports of textiles and wearing apparel from the most advanced African countries (see,
Figure 3.14). Tunisia, Zimbabwe and Burkina Faso would increase their exports to China, Eu-
rope and the United States. Europe is the main trading partner of Burkina and Tunisia for
textile products. It accounts for nearly 47% of total exports of textile products from Burkina
Faso (38% from Tunisia), compared to 0.3% of Burkina’s intra-African exports and 20% for
Tunisia in 2017 (UNCTAD data).
In summary, the liberalization of the primary, secondary, and tertiary sectors has positive ef-
fects on intra-African trade, thus creating long-term trade (Table 3.14). Moreover, except for
agricultural exports, where we find trade creation, Tables 3.8-3.13 show an increase in goods
trade between Africa and its trading partners, which represents a trade diversion. However,
the rise in intra-African trade is greater than the growth with trading partners. Trade in man-
ufactured goods, energy-intensive manufactured products, wood, and textiles would create
more trade diversion than other sectors as a result of the AfCFTA (Tables 3.8, 3.11, 3.12 and
3.13).

132Chapter 3. Modeling the impact of non-tariff barriers in services on intra-African
trade: Global Trade Analysis Project model
Table 3.13: Textiles and wearing apparel exports (changes in percent): Lon run impact
Long runTypes of Scenario
Reduction of tariffs and NTBs Reduction of tariffs and NTBs
in all sectors except services in all sectors including services
Partners (Importing region)
No AfCFTA No AfCFTA
Intra-Africa China EU-EFTA USA Intra-Africa China EU-EFTA USA
Countries Trade Trade
(1) (2) (3) (4) (5) (6) (7) (8)
South central Africa 229.48 6.58 6.75 6.57 352.81 54.57 54.98 54.72
Rest of North Africa 263.34 0.92 1.1 0.91 286.62 9.3 9.75 9.4
Nigeria 234.98 -2.45 -2.27 -2.42 255.99 5.32 5.7 5.35
Rest of West Africa 159.42 1.51 1.67 1.52 182.76 13.02 13.37 13.3
Ghana 182.68 -2.86 -2.69 -2.83 181.33 -1.42 -1.03 -1.3
Ethiopia 119.24 2.59 2.77 2.58 164.18 25.56 26.1 25.71
Rest of Eastern Africa 148.21 33.8 34.27 34.36 163.2 44.65 45.53 45.58
South Africa 161.46 -6.66 -6.4 -6.6 160.87 -5.08 -4.63 -4.93
Morocco 161.53 -4.73 -4.43 -4.63 160.57 -3.7 -3.22 -3.52
Rest of Central Africa 125.58 9.38 9.5 9.36 144.53 21.29 21.59 21.4
Kenya 123.04 1.39 1.57 1.36 141.93 12.03 12.47 11.92
Tunisia 137.06 -2.23 -2.03 -2.21 138.36 0.15 0.54 0.25
Togo 139.49 4.24 4.54 4.45 137.16 5.41 5.97 5.8
Egypt 124.74 -2.2 -2 -2.17 135.33 4.52 4.84 4.53
Cameroon 126.1 1.89 2.04 1.84 131.77 6.43 6.77 6.4
Burkina Faso 110.87 15.12 15.11 15.18 126.87 27.07 27.18 27.34
Rest of South
African Customs 105 -1.94 -1.74 -1.91 125.73 10.59 10.84 10.5
Senegal 113.6 -5.72 -5.54 -5.79 120.51 -0.88 -0.5 -0.79
Ivory Coast 106.27 -15.44 -14.93 -14.93 108.22 -12.95 -12.3 -12.43
Benin 92.43 3.69 3.95 3.78 107.4 13.72 14.5 14.25
Uganda 72.29 -0.41 -0.24 -0.42 90.38 12.86 13.36 13.14
Mauritius 71.09 0.1 0.27 0.09 72.86 2.94 3.31 3.02
Madagascar 58.47 0.81 0.98 0.8 61.45 4.07 4.44 4.14
Malawi 44.48 0.86 1.05 0.85 53.8 9.37 10 9.39
Mozambique 37.96 0.48 0.67 0.48 49.61 10.96 11.35 11.35
Botswana 47.75 -0.77 -0.6 -0.76 49.17 2.11 2.5 2.13
Guinea 29.05 -13.67 -13.17 -13.29 44.15 -0.94 -0.54 -0.81
Rwanda 40.18 -0.2 -0.09 -0.21 44.13 4.85 5.2 4.84
Tanzania 35.41 -5.86 -5.73 -5.8 43.32 1.48 1.88 1.56
Zimbabwe 32.92 4.64 4.78 4.66 38.86 11.34 11.68 11.51
Namibia 35.03 -8.28 -8.07 -8.31 38.51 -3.92 -3.52 -3.83
Zambia 20.17 -8.76 -8.63 -8.8 16.87 -9.42 -9.09 -9.36
Average (%) 109.04 0.18 0.39 0.24 122.79 8.6 9.03 8.77
Source: GTAP model, GTAP v10, AfCFTA database

3.5. Simulation results and discussion 133
Table 3.14: The impact of intra-African free trade agreement (AfCFTA) on intra-African ex-
ports (changes in USD millions)
Long run
Agriculture Manufacruring Processed Fossil fuels Energy-intensive Wood and Textiles and
foods manufacturing paper wearing
products apparel
Benin 4.22 41.97 11.95 6.33 22.1 0.39 3.75
Botswana 0.63 17.91 2.08 0.1 -11.63 1.16 0.87
Burkina Faso -3.64 35.84 5.11 2.9 65.12 0.4 8.1
Cameroon 16.78 20.59 -3.27 180.39 6.78 12.17 2.16
Egypt 10.94 416.65 334 60.92 92.3 112.72 78.24
Ethiopia 134.59 0.87 3.93 0 50.74 0.8 9.15
Ghana 10.76 243.61 200.56 77.44 95.91 20.44 62.95
Guinea -1.05 33.98 1.99 1.22 476.17 1.2 0.33
Ivory Coast 200.66 349.02 263.82 310.72 477.04 53.46 68.94
Kenya 29.94 129.82 24.2 6.91 21.88 8.77 32.79
Madagascar 3.2 -17.01 0.94 1.33 0.32 0.14 7.72
Malawi 25.58 11.82 12.54 1.06 0.53 5.26 0.99
Mauritius 0.96 8.68 0.97 0.05 -0.78 2.01 14.28
Morocco 21.75 533.81 489.28 59.12 139.19 94.92 148.79
Mozambique 14.08 25.68 22.89 49.87 8.57 1.58 1.37
Namibia 4.95 151.18 63.38 0.01 39.12 11.94 12.15
Nigeria 8.58 698.26 315.12 593.47 33.74 4.13 366.67
Rest of Central Africa 2.77 104.27 10.01 16.66 20.56 18.78 1.51
Rest of Eastern Africa 25.33 94.28 29.82 46.02 48.96 1.04 53.31
Rest of North Africa 1.98 26.29 40.4 172.96 14.38 1.16 6.68
Rest of South
African Customs -1.32 245.13 19.83 1.17 3.39 4.82 44.42
Rest of West Africa 14.57 65.02 139.25 47.49 5.08 7.6 17.36
Rwanda -0.19 5.41 8.51 2.53 16.93 0.04 2.09
Senegal 8.43 99.46 137.45 89.63 50.65 4.21 13.54
South Africa 408.66 3417.87 1213.32 857.59 224.92 161.92 185.73
South central Africa 10.65 136.48 74.87 215.71 283.1 5.85 24
Tanzania 0.41 82.55 411.46 0.08 21.21 -0.02 21.66
Togo -0.73 142.73 4.62 0.98 24.22 6.79 85.69
Tunisia 3.35 202.17 103.96 1.16 99.58 86.09 56.28
Uganda 22.66 17.11 47.98 4.94 69.57 2.7 8.21
Zambia 7.37 156.74 81.3 22.4 34.21 2.73 1.93
Zimbabwe 7.85 20.55 50.49 2.52 23.97 5.82 4.65
All Africa 994.72 7518.74 4122.76 2833.68 2457.83 641.02 1346.31
Source: GTAP model, GTAP v10, AfCFTA database. AfCFTA included the liberalisation of goods and services
sector.

134 Chapter
3.Modeling
theim
pactofnon-tariff
barriersin
serviceson
intra-African
trade:GlobalT
radeAnalysis
Projectmodel
Table 3.15: The impact of services liberalisation on exports (changes in USD millions)
Long runAgriculture Manufacturing Processed foods Fossil fuels
AfCFTA No AfCFTA AfCFTA No AfCFTA AfCFTA No AfCFTA AfCFTA No AfCFTA
Intra-Africa China EU-EFTA USA Intra-Africa China EU-EFTA USA Intra-Africa China EU-EFTA USA Intra-Africa China EU-EFTA USA
Countries Trade Trade Trade Trade
(1) (2) (3) (4) (5) (6) (7) (8) (9) (10) (11) (12) (13) (14) (15) (16)
Benin 2.66 0.11 1.56 0.19 22.69 2.85 89.74 9.94 -24.98 0.21 2.98 0.34 -128.47 16.43 517.21 37.88
Botswana -9.02 0.55 9.27 0.65 -318.88 2.81 136.14 10.84 -326.78 0.61 9.89 2.23 -59.59 0.99 21.28 0.58
Burkina Faso -25.59 0.19 8.11 0.62 -483.41 5.79 160.1 10.58 -490.38 0.65 22.7 1.92 -56.09 0.01 0.35 0.01
Cameroon 12.91 0.02 0.76 0.05 -175.08 1.55 142.94 4.01 -111.12 0.15 4.32 0.69 179.23 0 1.38 0.14
Egypt 12.31 2.04 0.59 0.03 283.58 0.01 0.49 0.2 329.64 0 0.33 0.02 60.07 0 0 0
Ethiopia 126.92 0.4 3.7 0.13 -86.87 0.1 1.35 0.88 -125.02 0.91 7.88 0.2 -88.59 0 0.04 0
Ghana 3.42 0.67 18.49 2.32 -383.78 2.54 13.3 2.48 -90.42 0.06 11.17 1.53 -498.76 5.51 213.84 25.48
Guinea -0.32 -0.18 -0.67 -0.05 5.26 0.01 2.53 0.16 0.27 0.07 0.11 0.02 -0.02 0 0 0
Ivory Coast 189.6 -1.69 -8.94 -1.31 118.38 0.43 4.11 0.59 56.17 0.02 2.27 0.1 305.25 78.65 200.15 0.36
Kenya -171.21 0.74 12.24 4.49 -196.73 0.77 9.84 2.3 -235.34 0.28 26.47 5.4 -290.01 0 0.69 0.13
Madagascar -13.02 4.44 13.25 0.12 -33.32 0.19 4.92 0.91 4.7 0.03 2.96 0.43 -172.4 1.52 5.57 0.34
Malawi 25.84 -3.53 -1.51 -0.23 -13.92 0.27 7.4 0.42 7.82 0.06 0.5 0.07 -1.27 0.63 4.3 1.41
Mauritius -1.7 15.6 2.06 0.44 -26.61 0.04 0.79 0.08 -7.91 0.28 0.81 0.2 -5.5 0 0 0
Morocco 9.17 -1.63 -1.25 -0.07 351.9 -0.02 0 -0.01 389.55 -0.69 -0.82 -0.04 37.5 0 0 0
Mozambique -7.73 1 5.82 0.49 23.43 1.12 4.31 1.21 -11.33 0.49 9.15 1.09 46.63 2.41 10.53 4.37
Namibia 9.72 6.45 9.72 2.21 83.82 1.49 4.3 1.61 -329.39 1.16 18.8 1.73 -0.09 0 -0.02 0
Nigeria 9.52 0.02 0.53 0.29 693.08 0.02 0.17 0.17 305.48 0.01 0.07 0.04 592.34 2.48 10.18 3.95
Rest of Central Africa -14.99 -16.82 -1.01 -0.73 94.07 125.9 8.65 1.37 -10.62 0.21 17.14 0.42 -5.35 0.27 4.12 0.12
Rest of Eastern Africa 24.89 0.02 0.43 0.15 90.68 0.46 8.18 2.08 29.14 0.11 12.44 1 45.99 0 0 0
Rest of North Africa -20.98 0.15 0.72 0.42 18.99 0.03 0.25 0.03 33.07 0.76 24.25 2.03 172.27 0.54 2.34 0.97
Rest of South
African Customs -4.57 0.06 0.51 0.14 262.85 0.74 3.13 0.57 18.65 0.04 2.81 0.03 0.06 0.09 0.73 0.42
Rest of West Africa -6.26 0.76 24.8 3.04 -10.89 0.79 5.54 1.47 128.97 0.85 16.63 1.96 43.06 0.01 0.08 0.01
Rwanda -105.55 18.74 27.27 5.21 14.47 5.11 17.18 1.94 6.2 1.5 1.88 0.87 2.53 0 0.01 0
Senegal 1.28 0.35 0.68 0.04 87.43 0.23 1.07 0.61 104.82 23.78 11.39 0.85 87.53 0 0.01 0
South Africa 408.11 0.01 0.01 0.01 3407.92 3.19 9.08 1.69 1211.7 0.04 1.22 0.05 857.46 0 0 0
South central Africa 6.7 -0.01 -0.02 0 -5.97 3.78 8.04 1.95 14.47 0.18 7.23 0.18 215.71 0 0.01 0
Tanzania -383.28 2.81 9.17 0.7 -3198.76 8.86 129.85 52.21 -817.91 1.4 14.23 2.13 -816.13 1.31 3.65 0.23
Togo -14.6 6.89 4.68 0.31 91.72 5.2 94.35 8.01 -117.15 2.14 22.24 1.2 -44.14 0.3 13.91 23.76
Tunisia -7.25 1.31 1.02 0.21 137.39 9.79 30.02 10.17 42.65 0.99 8.3 1.45 -163.4 753.21 352.18 185.77
Uganda 19.93 4.75 1.1 0.18 -6.13 1.09 51.02 18.66 39.79 0.27 1.42 0.82 -8.45 68.68 58.81 37.99
Zambia 7.42 -0.21 -0.2 0 46.23 0.68 2.49 0.43 67.99 0.01 5.29 0.66 21.37 0.06 0.46 0.28
Zimbabwe -14.36 4.41 5.54 0.68 -66.24 1.68 10.13 1.88 24.2 1.23 32.83 0.38 -38.22 59.14 0.58 0.21
All Africa (Total) 69.97 48.42 148.43 20.73 827.3 187.5 961.41 149.44 116.93 37.81 298.89 30 290.52 992.24 1422.39 324.41
Source: GTAP model, GTAP v10, AfCFTA database
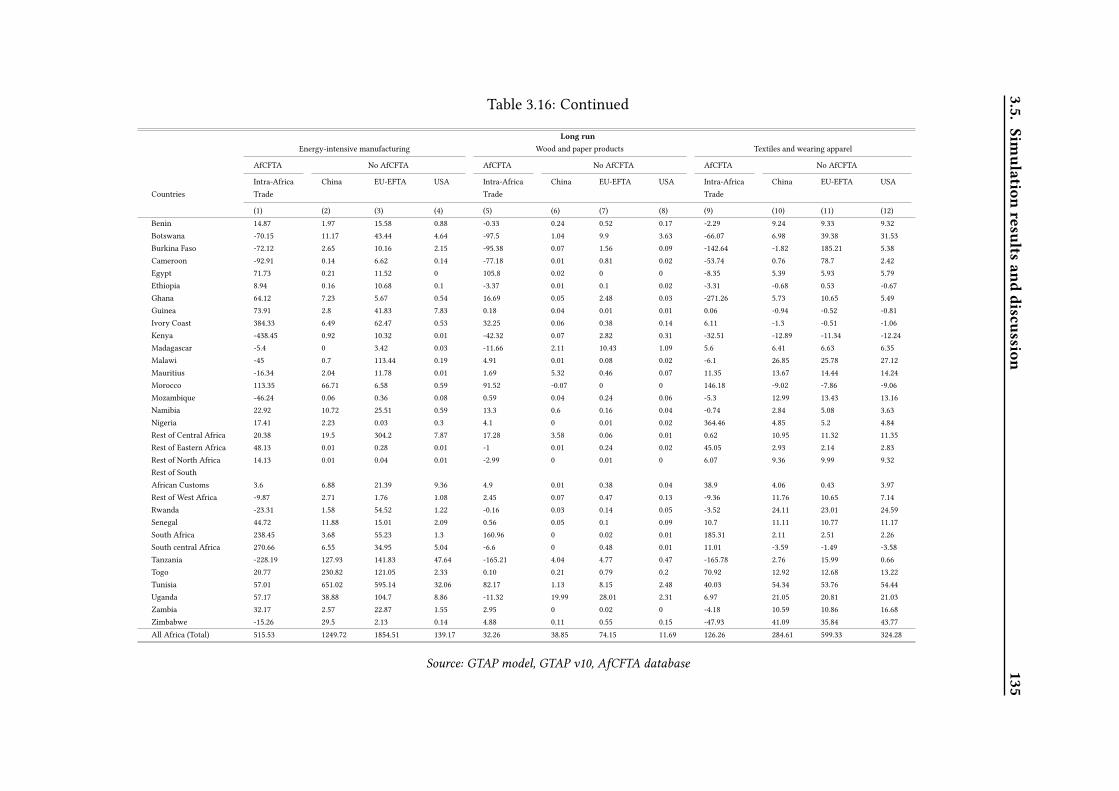
3.5.Sim
ulationresults
anddiscussion
135Table 3.16: Continued
Long runEnergy-intensive manufacturing Wood and paper products Textiles and wearing apparel
AfCFTA No AfCFTA AfCFTA No AfCFTA AfCFTA No AfCFTA
Intra-Africa China EU-EFTA USA Intra-Africa China EU-EFTA USA Intra-Africa China EU-EFTA USA
Countries Trade Trade Trade
(1) (2) (3) (4) (5) (6) (7) (8) (9) (10) (11) (12)
Benin 14.87 1.97 15.58 0.88 -0.33 0.24 0.52 0.17 -2.29 9.24 9.33 9.32
Botswana -70.15 11.17 43.44 4.64 -97.5 1.04 9.9 3.63 -66.07 6.98 39.38 31.53
Burkina Faso -72.12 2.65 10.16 2.15 -95.38 0.07 1.56 0.09 -142.64 -1.82 185.21 5.38
Cameroon -92.91 0.14 6.62 0.14 -77.18 0.01 0.81 0.02 -53.74 0.76 78.7 2.42
Egypt 71.73 0.21 11.52 0 105.8 0.02 0 0 -8.35 5.39 5.93 5.79
Ethiopia 8.94 0.16 10.68 0.1 -3.37 0.01 0.1 0.02 -3.31 -0.68 0.53 -0.67
Ghana 64.12 7.23 5.67 0.54 16.69 0.05 2.48 0.03 -271.26 5.73 10.65 5.49
Guinea 73.91 2.8 41.83 7.83 0.18 0.04 0.01 0.01 0.06 -0.94 -0.52 -0.81
Ivory Coast 384.33 6.49 62.47 0.53 32.25 0.06 0.38 0.14 6.11 -1.3 -0.51 -1.06
Kenya -438.45 0.92 10.32 0.01 -42.32 0.07 2.82 0.31 -32.51 -12.89 -11.34 -12.24
Madagascar -5.4 0 3.42 0.03 -11.66 2.11 10.43 1.09 5.6 6.41 6.63 6.35
Malawi -45 0.7 113.44 0.19 4.91 0.01 0.08 0.02 -6.1 26.85 25.78 27.12
Mauritius -16.34 2.04 11.78 0.01 1.69 5.32 0.46 0.07 11.35 13.67 14.44 14.24
Morocco 113.35 66.71 6.58 0.59 91.52 -0.07 0 0 146.18 -9.02 -7.86 -9.06
Mozambique -46.24 0.06 0.36 0.08 0.59 0.04 0.24 0.06 -5.3 12.99 13.43 13.16
Namibia 22.92 10.72 25.51 0.59 13.3 0.6 0.16 0.04 -0.74 2.84 5.08 3.63
Nigeria 17.41 2.23 0.03 0.3 4.1 0 0.01 0.02 364.46 4.85 5.2 4.84
Rest of Central Africa 20.38 19.5 304.2 7.87 17.28 3.58 0.06 0.01 0.62 10.95 11.32 11.35
Rest of Eastern Africa 48.13 0.01 0.28 0.01 -1 0.01 0.24 0.02 45.05 2.93 2.14 2.83
Rest of North Africa 14.13 0.01 0.04 0.01 -2.99 0 0.01 0 6.07 9.36 9.99 9.32
Rest of South
African Customs 3.6 6.88 21.39 9.36 4.9 0.01 0.38 0.04 38.9 4.06 0.43 3.97
Rest of West Africa -9.87 2.71 1.76 1.08 2.45 0.07 0.47 0.13 -9.36 11.76 10.65 7.14
Rwanda -23.31 1.58 54.52 1.22 -0.16 0.03 0.14 0.05 -3.52 24.11 23.01 24.59
Senegal 44.72 11.88 15.01 2.09 0.56 0.05 0.1 0.09 10.7 11.11 10.77 11.17
South Africa 238.45 3.68 55.23 1.3 160.96 0 0.02 0.01 185.31 2.11 2.51 2.26
South central Africa 270.66 6.55 34.95 5.04 -6.6 0 0.48 0.01 11.01 -3.59 -1.49 -3.58
Tanzania -228.19 127.93 141.83 47.64 -165.21 4.04 4.77 0.47 -165.78 2.76 15.99 0.66
Togo 20.77 230.82 121.05 2.33 0.10 0.21 0.79 0.2 70.92 12.92 12.68 13.22
Tunisia 57.01 651.02 595.14 32.06 82.17 1.13 8.15 2.48 40.03 54.34 53.76 54.44
Uganda 57.17 38.88 104.7 8.86 -11.32 19.99 28.01 2.31 6.97 21.05 20.81 21.03
Zambia 32.17 2.57 22.87 1.55 2.95 0 0.02 0 -4.18 10.59 10.86 16.68
Zimbabwe -15.26 29.5 2.13 0.14 4.88 0.11 0.55 0.15 -47.93 41.09 35.84 43.77
All Africa (Total) 515.53 1249.72 1854.51 139.17 32.26 38.85 74.15 11.69 126.26 284.61 599.33 324.28
Source: GTAP model, GTAP v10, AfCFTA database

136Chapter 3. Modeling the impact of non-tariff barriers in services on intra-African
trade: Global Trade Analysis Project model
Figure 3.12: The effects of NTB reductions in services on Africa’s exports (US$ millions)
Source: The author’s construction using GTAP v10 data

3.5. Simulation results and discussion 137
Figure 3.13: The Effects of services liberalization on intra-African exports by country (in mil-
lions of US dollars)
Source: The author’s construction using GTAP v10 data

138Chapter 3. Modeling the impact of non-tariff barriers in services on intra-African
trade: Global Trade Analysis Project model
Figure 3.14: The Effects of services liberalization on intra-African exports by country (in mil-
lions of US dollars)
Source: The author’s construction using GTAP v10 data
In monetary terms, the liberalization of services led to a significant increase in intra-African
exports of manufacturing products, natural and energy resources (fossil fuels, metals and
precious stones, etc.), textiles and processed foods products (see Figure 3.12). Moreover, the
agricultural and wood sectors are less dependent on services in Africa. These results confirm
those of Figure 3.9, which highlighted the significant servicification of the manufacturing,
mining and quarrying, and food sectors. Under the AfCFTA scenario by World Bank (2020),
manufacturing exports gain themost, 62% in overall terms, with intra-African trade increasing
by 110% and exports to the rest of the world by 46%. There are smaller gains in agriculture,
49% and 10% for intra- and extra-African trade, respectively. Indeed, of the $2.5 trillion in
exports projected for Africa, $823 billion are in manufactured goods, $690 billion in natural
resources, $191 billion in agriculture

3.5. Simulation results and discussion 139
Further on, Services liberalization contribute to a higher growth of African exports of fossil
fuels, energy-intensive manufactured and textiles products to its trading partners (see Figure
3.12). As a result, services liberalization generates trade diversion. This is explained by the
fact that these products are important raw materials for manufacturing industries in Europe,
United States and China. Intra-African exports of energy resources and mining products are
low compared to those with its trading partners (UNCTAD data) and, thus services liberaliza-
tion generates more benefits through extra-Africa trade.
3.5.4 Welfare decomposition
Table 3.17 describes the effects of AfCFTA on consumer welfare. These welfare effects are
quantified in the GTAP model. Indeed, the model includes a utility that decomposes the
equivalent variation (EV) welfare effect of an economic shock. It is a money metric mea-
sure, comparing the cost of pre- and post-shock levels of consumer utility, both valued at base
year prices. The utility disaggregates the total welfare effect into seven components: resource
allocation (efficiency) effect, endowment effects due to changes in factor supplies, technical
change due to productivity gains or losses, the effects of population growth, change in terms
of trade for goods, change in terms of trade for investment-savings, and change in preferences
(the structure of aggregate demand).
The trade creation from the reduction of tariff and non-tariff barriers has improved the effi-
ciency of resource allocation in production, consumption, import and export. Factor endow-
ments increase in the long run due to labor immigration and education (which leads to an
increase in the number of skilled workers and capital inflows).34The terms of trade for goods
are negative in almost all African countries over the long term due to trade diversion (in-
crease in imports from AfCFTA partners), except for large African economies such as South
Africa, Ivory Coast and Morocco. Trade creation induced by trade liberalization has negative
effects on the investment-savings terms of trade of most African countries. Indeed, the in-
come growth generated by trade creation leads to a considerable rise in household savings
instead of investment. Moreover, overall welfare is positive over the long run in all African
countries except Mauritius and Benin.35
African economic giants such as South Africa and
Nigeria have recorded the largest welfare gains on the African continent.
34We find a positive growth in all countries except Benin.
35Mauritius is one of the most liberalized African countries in terms of trade.

140Chapter 3. Modeling the impact of non-tariff barriers in services on intra-African
trade: Global Trade Analysis Project model
Table 3.17: Welfare decomposition ($U.S. millions)
Long runReduction of tariffs and NTBs in
all sectors including services
Resource Endowment Technical Population Terms of Terms of Preference TotalAllocation Effect Change Growth Trade Trade ChangeEffect (goods) (Investment-
Saving)Africa
South central Africa 3084.11 3780.06 0 0 -940.89 871.72 0 6795.01
Rest of Eastern Africa 4283.56 3464.58 0 0 -462.27 -508.48 0 6777.4
South Africa 1229.23 1229.91 0 0 719.33 -7.01 0 3171.46
Nigeria 496.43 949.18 0 0 -182.26 217.33 0 1480.68
Egypt 567.64 1047.65 0 0 -200.81 -175.1 0 1239.38
Rest of Central Africa 766.33 556.89 0 0 -328.59 208.71 0 1203.34
Ivory Coast 309.68 133.9 0 0 270.29 8.04 0 721.91
Guinea 332.86 407.83 0 0 6.2 -30.51 0 716.39
Mozambique 559.73 261.92 0 0 -130.45 -101.08 0 590.12
Ghana 513.28 173.48 0 0 -63.43 -51.06 0 572.27
Morocco 171.1 206.71 0 0 123.6 40.42 0 541.82
Ethiopia 598.07 377.3 0 0 -147.38 -288.3 0 539.69
Tanzania 436.21 152.17 0 0 -17.46 -64.93 0 505.99
Kenya 400.23 433.57 0 0 -112.83 -291.97 0 429
Burkina Faso 213.19 236.8 0 0 -52.88 19.68 0 416.79
Tunisia 185.4 226.79 0 0 -0.71 -2.39 0 409.1
Zambia 103.8 132.49 0 0 131.85 7.43 0 375.57
Senegal 135.35 180.24 0 0 10.89 6.85 0 333.33
Uganda 174.27 182.2 0 0 -35.07 11.11 0 332.51
Rest of West Africa 526.97 164.03 0 0 -254.03 -133.55 0 303.42
Rest of South African Customs 158.21 154.9 0 0 -41.54 -1.54 0 270.04
Namibia 85.12 114.85 0 0 11.77 9.99 0 221.74
Togo 99.93 27.03 0 0 9.87 -3.81 0 133.03
Rest of North Africa 452.67 90.65 0 0 -288.71 -193.79 0 60.82
Malawi 62.57 13.72 0 0 -15.07 -5.54 0 55.68
Madagascar 77.24 0 0 0 -25.3 0.16 0 52.11
Rwanda 37.35 17.32 0 0 0.93 -3.63 0 51.97
Botswana 44.85 59.08 0 0 -63.49 2.01 0 42.44
Cameroon 67.39 33.77 0 0 -43.73 -19.9 0 37.54
Zimbabwe 84.04 66.26 0 0 -88.69 -44.35 0 17.25
Mauritius 19.78 9.74 0 0 -32.72 -10.72 0 -13.93
Benin -124.83 -10.98 0 0 -44.66 -234.33 0 -414.81
All Africa 16151.76 14874.04 0 0 -2288.24 -768.54 0 27969.06
No AfCFTA (Partners)
China -309.41 0 0 0 303.93 230.55 0 225.07
Europe 1167.49 0 0 0 4554.51 -50.92 0 5671.09
USA 172.38 0 0 0 1360.86 354.09 0 1887.33
Rest of World (ROW) -601.61 0 0 0 -3976.49 240.3 0 -4337.8
Source: GTAP model, GTAP v10, AfCFTA database
3.6 Conclusion and policy recommendations
This paper contributes to the literature about the impacts of AfCFTA on intra-African trade.
We examine the effects by highlighting the contribution of services sector to economic growth
and intra-African trade in two scenarios. The contribution of services to economic growth in
Africa is significant, providing large jobs and used as inputs in production and exports. How-
ever, barriers to entry are significant and therefore impede intra-African trade.
To assess the impacts of this FTA on intra-African trade, we use the GTAPmodel and to model
the restrictions in services with, we consider the ad valorem equivalents of NTBs in services
of Jafari and Tarr (2017). AVEs of NTBs for goods are taken from the World Bank’s World
Integrated Trade Solution (WITS) database and documented by Kee, Nicita, and Olarreaga

3.6. Conclusion and policy recommendations 141
(2009). The effects are observed in the short and long term with a focus on the long term.
We find that AfCFTA is associated with an increase in GDP in the short and long run, with
a larger effect in the long run. Regional income declines in the short term and rises over the
long term. The liberalization of services stimulates GDP growth in the short and long term.
However, it leads to a decline in African regional income over the short and long term. The
reduction of NTBs in services leads to a rise in intra-African exports of agricultural prod-
ucts, manufactured goods, processed food, fuel, energy-intensive products, wood and paper
products, textiles and clothing in the long run. The "servicification" is still important in intra-
African exports of manufacturing goods. Moreover, this trade agreement creates both long-
term trade creation and diversion, but the welfare gain is still positive and significant over the
long run.
This paper is the first to quantify the effects of services liberalisation on intra-African trade,
however it has shortcomings. The AVEs constructed by Jafari and Tarr (2017) do not account
for the regulatory disparity between pairs of countries. Indeed, AVEs measure restrictions on
services entry in each country and not bilateral restrictions between pairs of countries. It is
important to have bilateral measures in the case of a CGE study. The measure of Benz and
Jaax (2020) is bilateral and addresses this problem however it does not include African coun-
tries with the exemption of South Africa. This study does not address the issue of whether
liberalization of services increases or decreases rents for foreign providers. This measure of
Jafari and Tarr (2017) does not decompose AVE into economic rents for the exporter and the
importer. The solution might be to use the approach of Francois et al (2013), who allocates an
average of 60% of the estimated AVEs to trade efficiency cost and assumed that one-third of
the remaining 40% were appropriately described as economic rents to exporter and two-thirds
as economic rents to importer.
Services liberalisation has positive effects on economic growth and intra-African trade. How-
ever, several challenges need to be addressed to ensure that the establishment of AfCFTA has
beneficial effects on intra-African trade. These challenges should be in the form of support
policies. We formulate five policy recommendations:
• Transportation and logistics services are essential inputs in the production and commer-
cialization of manufacturing products. Moreover, competitive transport and logistics
services are key to reduce trade costs, in particular in the food sector (Amara, 2021).

142Chapter 3. Modeling the impact of non-tariff barriers in services on intra-African
trade: Global Trade Analysis Project model
Also, information and communication infrastructure play a key role in intra-African
trade. Indeed the study by Bankole et al. (2015) examined the impact of informa-
tion and communication technology infrastructure on intra-African trade. Their results
suggested that information and communication infrastructure and institutional quality
have a robust positive effect on intra-African trade. The first policy to consider would be
the development of regional transport, communication and energy infrastructure to fa-
cilitate the movement of goods, people and trade in services. Government cooperation
with financial actors, particularly the African Development Bank, should continue to
invest in transport infrastructure projects and in new information and communication
technologies in order to boost intra-African trade.
• Customs services are a crucial sector in intra-African trade. The OECD Services Trade
Restrictiveness Index (STRI) estimated the level of restrictions in the customs services
sector in SouthAfrica at 0.28, compared to an average of 0.046 in the European Economic
Area in 2018, which is significant. Reforms aimed at simplifying customs procedures
are to be implemented (Kouty Manfred, 2021).36
Measures ranging from the digitaliza-
tion of these services to the publication of information on trade activities and border
customs procedures should be implemented to reduce trade costs.37
The reduction of
trade costs can be achieved through the WTO’s Trade Facilitation Agreement (TFA).38
The agreement entered into force on 22 February 2017 aims to simplify, modernize and
harmonize export and import processes to promote trade (WTO, 2020). WTO estimates
show that the full implementation of TFA could reduce trade costs by an average of
14.3% and boost global trade by up to $1 trillion per year, with the largest gains in the
poorest countries. Melo and Sorgho (2019) found that one extra day in customs is equiv-
alent to a 1.3% extra tariff at destination, based on ocean trade flows to the United States.
The World Bank study showed the gains from implementing TFA simulated by apply-
ing econometric estimates of ad valorem equivalents of the time lost in customs (World
Bank, 2020). The results suggested that African importers see a roughly 7 percentage
36It shows that trade procedures such as the number of documents required to import goods and border
compliance negatively affect intra-African trade.
37Godwin et al. (2020) find that digitalization (mobile subscriptions, internet users and broadband subscrip-
tions) has a positive contribution to the economic growth in Sub Saharan Africa.
38The implementation of trade facilitation measures through cooperation of African countries is included in
Phase I of AfCFTA objectives.

3.6. Conclusion and policy recommendations 143
point decline in the iceberg costs of importing, with minor variations across sectors and
source regions. African exporters see roughly the same improvement in their iceberg
costs of exporting.39
• The production and commercialization of goods and services in Africa is dependent
on the financial sector (banking intermediation).40
Moreover, lack of trade finance is
a significant non-tariff barrier to trade, particularly (but not exclusively) in develop-
ing countries (WTO, 2016). Restrictions in the banking sector hamper the provision of
massive credit in Africa and the trade finance gap is very large in Africa compared to
other regions (WTO, 2016). The African Development Bank in its report "Trade finance
in Africa" published in 2014 (AfDB, 2014), surveyed the trade activities of 276 African
commercial banks operating in 45 African countries. It found that the market for bank
intermediated trade finance was between $330-350 billion, an amount that would have
been high had a significant share of financing requests from traders not been rejected.
Among the rejected requests, the value of unmet demand for trade finance in Africa was
$110 billion in 2011 and $120 billion in 2012. The main reasons for rejecting financing
requests were lack of creditworthiness or credit history, insufficient limits granted by
endorsing banks to local African issuing banks, small balance sheets and limited capital
of African banks, and insufficient U.S. dollar liquidity. Lack of access to finance is the
main concern when operating in international markets. The WTO study (WTO, 2016)
indicates that lack of access to finance is a major obstacle for traders, especially small
and medium-sized exporters in Africa. For an intra-African free trade area to be bene-
ficial, the African Development Bank’s Trade Finance Facilitation Program, as well as
those of other development finance institutions (multilateral financial institutions, ex-
port credit agencies etc.), are needed to boost intra-African trade. Also regulating the
banking system in order to implement policies to boost the banking rate in Africa, with
a wide range of financial services such as online payments, and connecting the financial
sector to mobile payments (highly developed in sub-Saharan Africa).
• Fourth, the professional services sector can play a major role in intra-African trade
through the mobility of skilled labor i.e., legal, accounting, scientific and technical ac-
39The "iceberg" trade cost assumption implies that a fraction of the good is lost in transport due to transporta-
tion costs.
40Almost 80% of global trade is supported by trade finance or credit insurance (WTO, 2016).
144Chapter 3. Modeling the impact of non-tariff barriers in services on intra-African
trade: Global Trade Analysis Project model
tivities (high value-added services).41
This sector is very restrictive due to high entry
costs such as expertise and qualifications, nationality requirements, etc. The liberal-
ization of this sector should be supported by a skilled labor and policies to support
higher education to exploit this knowledge-intensive trade. Measures to promote inter-
university exchange programs (e.g. ERASMUS program in Africa), visiting researchers
to share expertise and knowledge in order to stimulate the professional services sec-
tor. These policies can be implemented through the Skills Initiative for Africa (SIFA)
initiated by the African Union Commission (AUC) and the African Union Development
Agency (AUDA-NEPAD) with the support of the German government and the Euro-
pean Union. In collaboration with the International Labour Organization (ILO), it pro-
motes the occupational prospects of young Africans through the support of innovative
skills development programs and close cooperation with the private sector, as a key
stakeholder in the creation of jobs. It aims to reduce the under-utilization of existing
skills at the workplace, as well as limited portability of skills and qualifications across
African countries. The funding project has to date been launched in 7 out of 8 partic-
ipating countries42and should be expanded across the continent to enable the sharing
of knowledge, skills and expertise without barriers to entry.
• Last, political and economic crises in regional trading blocs can impede the gains from
trade liberalization in Africa. Indeed, political instability in certain regions of Africa
has a negative effect on economic activities. The study by Yushi and Borojo (2019)
shows that intra-African trade and overall trade in Africa are robustly determined by
the quality of institutions, border and transport efficiency, and physical and commu-
nication infrastructure. The estimates also indicate that the marginal effect of insti-
tutional quality, physical and communication infrastructure on trade flows appears to
be increasing in GDP per capita. Political instability and lack of good governance are
impediment to economic growth and to the implementation of free trade agreements,
including AfCFTA, regional cooperation in Africa should therefore be strengthened.
COVID-19 highlighted the strong relationship between global trade, particularly ser-
41In its study, the International Labor Organization (ILO) finds that around one in five of all jobs in a sample of
40 countries (EU countries, G20 countries and some additional high-income countrie) are linked to international
trade (ILO, 2015a), and intensifying trade restrictions could have a significant impact on employment in the
countries concerned.
42Cameroon, Ethiopia, Ghana, Kenya, Nigeria, South Africa, Togo and Tunisia.

3.6. Conclusion and policy recommendations 145
vices trade, and the health system. Africa’s global trade was negatively impacted by
the crisis in 2020, and a large part of its population remains unvaccinated (WTO, 2021).
Access to the vaccine in Africa has been made possible through the COVAX initiative
(COVAXAMC). Moreover, of the 6.4 billion vaccine doses administeredworldwide, only
2.5% have been administered in Africa-although the continent accounts for a little over
17% of the world’s population (World Health Organization data). The unequal access to
vaccines is due to poor health systems in Africa, ranging from a lack of trained medical
personnel to inadequate health and transportation infrastructure (including adequate
vaccine storage facilities). Reducing barriers to trade in services should boost trade in
services, especially transport and logistics. The establishment of the AfCFTA should
be supported by the cooperation of governments in public investments in the African
health system (hospital infrastructure, investment in research and development (R&D),
reduction of barriers to intellectual property (IP) rights, and technology transfer) in or-
der to address potential health crises that could affect African economic growth.43
43Cooperation on investment, intellectual property rights and competition policy are among the objectives
(Phase II) of the AfCFTA.


General Conclusion
This thesis investigated the impacts of Non-Tariff Barriers in services on trade. First, it high-
lighted the negative effects of restrictions in services on trade and FDI and second, the gains
from services liberalization. Therefore, the dissertation is organized into three chapters. In
the first chapter, we study the effects of restrictions in services on food trade between OECD
countries. By using a gravity model of trade, the OECD indices of individual country restric-
tions (STRI) and regulatory differences by country pair to capture the level of restrictions in
these sectors, we highlight the different impacts of NTBs in services (transport, logistics, dis-
tribution, financial and other business sectors) on food trade. The second chapter explores the
effects of global and sectoral FDI restrictions on cross-border investment between advanced
and emerging countries. Based on a gravity analysis as before, we use the OECD’s FDI regu-
latory restriction index, which quantifies the level of restriction on foreign direct investment
(FDI). This chapter highlights the sectoral restrictions (primary, secondary and tertiary) that
impede inward FDI in countries by level of development (advanced, large and small emerging
countries). The third chapter examines the gains from services trade liberalization. It consid-
ers the African Continental Free Trade Area (AfCFTA) agreement. The particularity of this
chapter is that it studies the effects of services liberalization on economic growth and intra-
African trade. Using a CGE model (GTAP v10), it analyzes the effects of NTB reductions in
the goods and services sector on intra-African trade in the short and long term.
The results of the first chapter suggested that higher restrictions in the logistics and transport
sector lead to lower exports of food commodities. Also, restrictions in the financial and other
business sectors are associated with lower imports. Interestingly, restrictions in the distribu-
tion sector have positive and significant effects on both exports and imports of food products.
The sectors most affected by these restrictions are food, live animals and perishable products
(milk, eggs and meat). The regulatory disparity has a significant negative impact on food
trade. This impact decreases when the exporter country is closed to service providers. The
deregulation or harmonization of these measures would be highly beneficial to food trade.
In the second chapter we found that global restrictive measures do not significantly affect
cross-border FDI in OECD countries, while restrictions in the service sector have significant
negative effects on FDI. Moreover, the overall restrictive measures and those in the primary,

147
secondary and service sectors negatively impact inward FDI amongOECD and large emerging
countries. Restrictions in the primary sector are a main obstacle to inward FDI in large emerg-
ing countries. In addition, global and sectoral restrictions do not have a significant effect on
FDI between advanced and African countries. The analysis of disaggregated sectoral restric-
tive measures shows that restrictions in business and other financial services are negatively
associated with intra-OECD FDI. We also find that restrictions in the manufacturing sector
have restrictive impacts on inward FDI in large emerging countries and that restrictions in the
mining, quarrying, and oil extraction sector hinder inward FDI in African countries. Reforms
to liberalize sectoral restrictions by country have positive effects on FDI, but deregulation of
the service sector has beneficial effects on inward FDI from advanced and emerging countries.
The findings of the third chapter showed that African Continental Free Trade Area (AfCFTA)
is associated with an increase in regional GDP and income in the long run. Moreover, services
liberalisation boosts the regional GDP in the long run. The reduction in NTBs in services is
leading to an increase in intra-African exports of agricultural products, manufactured goods,
processed food products, fuels, energy-intensive products, wood and paper products, and tex-
tiles and apparel in the long run. The manufacturing and natural resources sectors are the
most affected by the reduction of barriers to services trade in Africa. Moreover, this trade
agreement creates both long-term trade creation and diversion, but the welfare gain is still
positive and significant over the long term in Africa.
The three chapters of this thesis aim to contribute to the understanding of how NTBs in ser-
vices trade, especially disaggregated services affect FDI and international trade. This thesis
highlights the importance of the services sector to economic growth and trade. As mentioned
above, in each chapter, interesting policy implications are identified in order to enhance global
trade. Overall, the interpretation of the results suggests that liberalization of the services
sector would boost trade in food products. Deregulation of restrictive measures in FDI, par-
ticularly in manufacturing and services, would be attractive to inward FDI in advanced and
emerging countries. Africa should be opening its markets to service suppliers in order to
boost trade in goods, reduce poverty and increase GDP.
Our present work could be improved by further research. First, it would be interesting to ex-
amine the impacts of restrictions in the information technology (IT) sector on trade in goods.
The global economy is increasingly digitized and the digitalization of the economy has posi-

148 General Conclusion
tive impacts on economic growth and trade for both advanced and emerging countries (God-
win et al. 2020; Dahlman, Mealy and Wermelinger, 2016). The Covid-19 pandemic crisis has
shown the importance of IT services on economic activity through remote work. The pre-
dictions of the WTO show that the sector that has experienced significant growth during the
crisis. Statistics show a growth from 23% in 1993 to almost 80% in 2012 in computer usage
and from 18% in 1997 to about 76% in 2016 for internet usage in the US (World Bank, 2018).
However, many restrictions weigh on this sector that blocks trade in digital (OECD, 2020).
Moreover, most studies focused on the link between the digital sector and trade in services,
and very few studies highlighted the relationship between trade in goods and restrictions in
the digital sector.
The second area of future research would be to study the effects of services liberalization on
regional block trade in Africa. Indeed, the effects of AfCFTA on intra-African trade in our third
chapter show heterogeneous effects of services liberalization on intra-African trade. Some
countries experience significant growth in GDP and trade compared to others. The findings
of Ekobena et al. (2021) show that the reduction in tariff barriers under the AfCFTA will lead
to a decrease in tariff revenues in some Central African countries in the short term. However,
in the long run, these losses are largely offset by the socio-economic benefits generated by
the implementation of the agreement, particularly in terms of economic growth and the well-
being of the region’s population. They therefore encourage Central African countries to ratify
and implement the AfCFTA. The question arises: Would services liberalization increase trade
between countries in the same trading bloc? orwould services liberalization reduce intra-regional
trade in Africa? Intra-African trade is characterized by trade between countries within the
same trading bloc. Conducting a study of this kind will be useful in order to see whether
certain regional blocs in Africa would benefit from signing this agreement or not.
Finally, it would be interesting to use other indices of restrictiveness to trade in services to
conduct the empirical studies related to the first chapter. The World Bank services trade
restrictiveness indices is alternative to the OECD STRI.

Bibliography
Abrego, Lisandro, Maria Alejandra Amado, Tunc Gursoy, Garth Nicholls, and Hector Perez-
Saiz. (2019). The African Continental Free Trade Agreement: Welfare Gains Estimates from
a General Equilibrium Model. IMF Publications.
Adams, P., Huff, K., McDougall, R., Pearson , K. and Powell, A. (1996). Medium- and Long-run
Consequences for Australia of an APEC Free Trade Area: CGE Analyses using the GTAP and
MONASH Models. Centre of Policy Studies/IMPACT Centre Working Papers from Victoria
University.
African Development Bank (AfDB). (2014). Trade finance in Africa. 3 December 2014, Abid-
jan: African Development Bank.
African Development Bank (AfDB). (2015). The Africa Competitiveness Report 2015. African
Development Bank.
African Development Bank (AfDB). (2018). How Forestry contributes to the African Develop-
ment Bank’s High 5 Priorities: challenges and opportunities. Prepared by the African Natural
Resources Centre, African Development Bank.
African Development Bank (AfDB). (2019). African Economic Outlook 2019. Abidjan, Ivory
Coast.
Africa Regional Integration Index. (2016). Report, United Nations Economic Commission for
Africa.
Agnosteva, D., Anderson, J. E. and Yotov, Y. V. (2014). Intra-National Trade Costs: Measures
and Aggregation. Cambridge, MA, National Bureau of Economic Research, NBER Working
Paper No. 19872.
Ahmed, Lesley; Renee, Berry; Mark, Brininstool and Jennifer, Catalano. (2018). U.S. Trade
and Investment with Sub-Saharan Africa: Recent Developments. Washington, DC: U.S. In-
ternational Trade Commission.

150 Bibliography
Ahrend, R. and Goujard, A. (2012). International Capital Mobility and Financial Fragility:
Part 3. How do Structural Policies Affect Financial Crisis Risk? Evidence from Past Crises
Across OECD and Emerging Economies. OECD Economics Department Working Papers No.
966, OECD Publishing: Paris.
Alfaro, Laura; Chanda, Areendam; Kalemli-Ozcan, Sebnem and Sayek, Selin. (2004). FDI and
economic growth: the role of local financial markets. Journal of International Economics, vol.
64(1), pp. 89-112.
Alfieri, L. (2021). Heterogeneity of financial institutions in the process of economic and mon-
etary integration in East Asia. The World Economy, Vol. 44(4), pp. 1053-1076.
Amiti, Mary and David E. Weinstein. (2011). Exports and Financial Shocks. The Quarterly
Journal of Economics, 126 (4), pp. 1841-1877.
Anderson, J. E. (1979). A Theoretical Foundation for Gravity Equation. American Economic
Review, 69[1], pp. 106-16.
Anderson, J. E. and Van Wincoop, E. (2003). Gravity with gravitas: A solution to the border
puzzle. The American Economic Review, 93[1], pp. 170-192.
Anderson, J. E. and VanWincoop, E. (2004). Trade costs. Journal of Economic Literature. 42[3],
pp. 691-751.
Anderson, J. E., M. Larch, and Y. V. Yotov . (2016). Trade Liberalization, Growth, and FDI: A
Structural Estimation Framework. Boston College and NBER, Vol. 77, 2016.
Anderson, J. E. and Yotov, Y. V. (2016). Terms of Trade and Global Efficiency Effects of Free
Trade Agreements, 1990-2002. Journal of International Economics 99[C], pp. 279-298.
Anderson, J. E., M. Larch, and Y. V. Yotov. (2017). Trade and Investment in the Global Econ-
omy. NBER Working Paper 23757, National Bureau of Economic Research.
Andrenelli, A. et al. (2019). Micro-Evidence on Corporate Relationships in Global Value
Chains: The Role of Trade, FDI and Strategic Partnerships. OECD Trade Policy Papers, No.
227, OECD Publishing, Paris.

Bibliography 151
Arbatli, E. (2011). Economic policies and FDI inflows to emerging market economies. IMF
Working Paper No. 192.
Arnold, Jens Matthias, Javorcik, Beata and Mattoo, Aaditya. (2011). Does services liberalisa-
tion benefit manufacturing firms? Evidence from the Czech republic. Journal of International
Economics, 85 [1], pp. 136-146.
Ariu, A. (2016). Services Versus Goods Trade: A Firm Level Comparison. Review of World
Economics 152 [1], pp. 19-41.
Ariu, Andrea; Breinlich, Holger; Corcos, Gregory and Mion, Giordano. (2019). The inter-
connections between services and goods trade at the firm-level. Journal of International Eco-
nomics, Elsevier, vol. 116(C), pp. 173-188.
Ariu, Andrea; Mayneris, Florian; Parenti, Mathieu. (2020). One way to the top: How services
boost the demand for goods. Journal of International Economics, vol. 123(C).
Arnold, Jens Matthias; Beata Javorcik and Aaditya Mattoo. (2011). Does Services Liberalisa-
tion Benefit Manufacturing Firms? Evidence from the Czech Republic. Journal of Interna-
tional Economics 85 (1), pp. 136-46.
Arnold, Jens Matthias; Beata Javorcik; Aaditya Mattoo and Molly Lipscomb. (2016). Services
Reform and Manufacturing Performance. Evidence from India. Economic Journal, 126 (590),
pp. 1-39.
Avinash G. Mulky. (2013). Distribution challenges and workable solutions. IIMBManagement
Review, Vol. 25, Iss. 3, pp. 179-195.
Baier, Scott L., and JeffreyH. Bergstrand. (2007). Do Free Trade Agreements Actually Increase
Members’ International Trade?. Journal of International Economics, 71(1), pp. 72-95.
Baier, Scott L., and Jeffrey H. Bergstrand. (2009). Estimating the effects of free trade agree-
ments on international trade flows using matching econometrics. Journal of International
Economics, vol. 77, Iss. 1, pp. 63-76.
Baldwin, R. and Taglioni, D. (2006). Gravity for dummies and dummies for gravity equations.
NBER Working Paper No12516.

152 Bibliography
Baldwin, R. and Venables, A. J. (2013). Spiders and snakes: Offshoring and agglomeration in
the global economy. , 90(2), 245-254.
Balistreri, Edward J.; Rutherford, Thomas F. and Tarr, David G. (2009). Modeling services
liberalization: The case of Kenya. Economic Modelling, vol. 26[3], pp. 668-679.
Bankole, F.O., Osei-Bryson, K., and Brown, I. (2015). The impacts of telecommunications
infrastructure and institutional quality on trade efficiency in Africa. Information Technology
for Development, 21(1), pp. 29-43.
Banque Centrale des Etats de l’Afrique de l’Ouest (BCEAO). (2014). Balance des Paiements
et Position Extérieur Global: Sénégal. BCEAO.
Bao, X. and L. D. Qiu. (2010). Do Technical Barriers to Trade promote or restrict trade? Evi-
dence from China. Asia-Pacific Journal of Accounting and Economics, 17(3), pp. 253-278.
Bas, Maria. (2014). Does Services Liberalisation Affect Manufacturing Firms’ Export Perfor-
mance? Evidence from India. Journal of Comparative Economics, 42 (3), pp. 569-89.
Basile, R., Castellani, D. and Zanfei, A. (2008). Location choices of multinational firms in
Europe: The role of EU cohesion policy. Journal of International Economics, 74, pp. 328-340.
Bekkers, Eddy, Alessandro Antimiani, Caitlyn Carrico, Dorothee Flaig, Lionel Fontagne,
Jean Foure, Joseph Francois, Ken Itakura, Zornitsa Kutlina-Dimitrova, William Powers, Bert
Saveyn, Robert Teh, Frank Van Tongeren, and Marinos Tsigas. (2020). Modelling Trade and
Other Economic Interactions Between Countries in Baseline Projections. Journal of Global
Economic Analysis, Vol. 5, No 1.
Belke, Ansgar and Domnick, Clemens. (2021). Trade and capital flows: Substitutes or com-
plements? An empirical investigation. Review of International Economics, Vol. 29, Iss. 3, pp.
573-589.
Belloc, M. (2006). Institutions and International Trade: A Reconsideration of Comparative
Advantage. , Vol. 20, No.1, pp. 3-26.
Bénassy-Quéré, Agnes; Fontagne, Lionel and Lahreche-Revil, Amina. (2005). How Does FDI
React to Corporate Taxation?. International Tax and Public Finance, Vol. 12, No. 5.

Bibliography 153
Bénassy-Quéré, Agnes; Coupet, Maylis and Mayer, Thierry. (2007). Institutional Determi-
nants of Foreign Direct Investment. The World Economy, Vol. 30, No. 5, pp. 764-782.
Bengoa Marta , Mathur Somya , Narayanan Badri and Norberg Hanna. (2021). "Environ-
mental Effects of the African Continental Free Trade Agreement: A Computable General
Equilibrium Model Approach. Journal of African Trade, forthcoming.
Benz, S. and A. Jaax. (2020). The costs of regulatory barriers to trade in services: New esti-
mates of ad valorem tariff equivalents. OECDTrade Policy Papers, No. 238, OECDPublishing,
Paris.
Bergstrand, J. and Egger, P. (2007). A Knowledge-and-Physical-Capital Model of Interna-
tional Trade Flows, Foreign Direct Investment, and Multinational Enterprises. Journal of
International Economics, 73, pp. 278-308.
Bergstrand, J. and P. Egger. (2013). What Determines BITs?. Journal of International Eco-
nomics, 90(1), pp. 107-122.
Bernard Hoekman and Simeon Djankov. (1996). Catching Up With Eastern Europe? The
European Union’s Mediterranean Free Trade Initiative. Working Papers 9612, Economic Re-
search Forum.
Beverelli, Cosimo; Fiorini, Matteo ; Hoekman, Bernard. (2017). Services trade policy and
manufacturing productivity: The role of institutions. Journal of International Economics, vol.
104(C), pp. 166-182.
Binici, M., Hutchison, M. and Schindler, M. (2009). Controlling capital? Legal restrictions
and the asset composition of international financial flows. IMF Working Paper No. 208.
Blonigen, B. A andWang, Miao. (2004). Inappropriate Pooling ofWealthy and Poor Countries
in Empirical FDI Studies. National Bureau of Economic Research, Cambridge, Working Paper
10378.
Blonigen, B. A and Piger, J. (2014). Determinants of foreign direct investment. Canadian
Journal of Economics, 47(3), pp. 775- 812.
Bodier M. (1999). Les effets d’Age et de Génération sur le Niveau et la Structure de la Con-
sommation. Economie et Statistique, 324-325, pp. 163-180.

154 Bibliography
Bodman, P and Le, T. (2013). Assessing the roles that absorptive capacity and economic dis-
tance play in the foreign direct investment-productivity growth nexus. Applied Economics,
45(8), pp. 1027-1039.
Borchert, Ingo. Batshur, G. and Aaditya, M. (2012). Guide to the Services Trade Restrictions
Database. World Bank Policy Research Working Paper WPS6108.
Bricongne, J.C., Fontagné, L., Gaulier, G., Taglioni, D., Vicard, V. (2010). Firms and the global
crisis: French exports in the turmoil. Journal of International Economics, 87(1), pp. 134-146.
Brouwer, J., Paap, R and Viaene, J. M. (2008). The trade and FDI effects of EMU enlargement.
Journal of International Money and Finance, 27(2), pp. 188-208.
Burfisher, M. (2017). Introduction to Computable General EquilibriumModels (2nd ed.). Cam-
bridge: Cambridge University Press.
Cadot O, Asprilla A, Gourdon J, Knebel C and Peters R. (2015). Deep Regional Integration
and Non-Tariff Measures: A Methodology for Data Analysis. UNCTAD, Geneva.
Camarero, M., Gómez - Herrera, E., and Tamarit, C. (2018). New evidence on Trade and FDI:
How large is the Euro effect?. Open Economies Review, 29(2), pp. 451-467.
Carr, L., R. Markusen and E. Maskus. (2001). Estimating the Knowledge-Capital Model of the
Multinational Enterprise. American Economic Review, 91, 3, pp. 693-708.
CEPII. (2005). Geographic and Bilateral Distance Database. Paris: Centre d’Etudes rospec-
tives et d’Informations Internationales.
Chakrabarti, A. (2001). The determinants of foreign direct investment: Sensitivity analysis
of cross-country regressions. Kyklos, 54(1), pp. 89-114.
Cheng, I.-H. andWall, H. J. (2005). Controlling for Heterogeneity in Gravity Models of Trade
and Integration. Federal Reserve Bank of St.Louis Review 87[1], pp. 49-63.
Cheptea Angela, Emlinger Charlotte and Latouche Karine. (2018). Do exporting firms ben-
efits from retail internationalization. Evidence from France. Journal of Economics and Man-
agement Strategy, Vol. 28, Iss. 3, pp.561-582.

Bibliography 155
Chiappini, Raphael and Viaud François. (2020). Macroeconomic, institutional, and sectoral
determinants of outward foreign direct investment: Evidence from Japan. Pacific Economic
Review, 2020; forthcoming.
Chor, Davin and Manova, Kalina. (2012). Off the cliff and back? Credit conditions and inter-
national trade during the global financial crisis. Journal of International Economics, Elsevier,
vol. 87(1), pp. 117-133.
Correia, Sergio, Paulo Guimarães and Thomas Zylkin. (2019). ppmlhdfe: Fast Poisson Es-
timation with High-Dimensional Fixed Effects. Papers 1903.01690, arXiv.org, revised Aug
2019.
Crivelli, P. and J. Gröschl. (2016). The impact of Sanitary and Phytosanitary measures on
market entry and trade flows. The World Economy, 39(3), pp. 444-473.
Crozet, Matthieu, Milet, Emmanuel, Mirza, Daniel. (2016). The impact of domestic regula-
tions on international trade in services: evidence from firm-level data. Journal of Compara-
tive Economics, 44 (3), pp. 585-607.
Dahlman, C., Mealy, S., and Wermelinger, M. (2016). Harnessing the digital economy for
developing countries. OECD.
deMelo, J. D. and Nicita, A. (2018). Non-TariffMeasures: Scope and Overview. In The Unseen
Impact of Non-Tariff Measures: Insights from a new database. United Nations Conference
on Trade and Development and World Bank.
de Melo, J. and Z. Sorgho. (2019). The Landscape of Rules of Origin across African RECs in a
comparative Perspectives with Suggestions for Harmonization. Fondation pour Les Études
et Recherches sur le Développement International (FERDI), Clermont-Ferrand, France.
De Sousa, J., Mayer, T and Zignago, S. (2012). Market access in global and regional trade.
Regional Science and Urban Economics, 42(6), pp. 1037- 1052.
Desbordes, Rodolphe and Vicard, Vincent. (2009). Foreign direct investment and bilateral in-
vestment treaties: An international political perspective. Journal of Comparative Economics,
vol. 37(3), pp. 372-386.

156 Bibliography
Disdier, A.-C. andHead, K. (2008). The Puzzling Persistence of the Distance Effect on Bilateral
Trade. Review of Economics and Statistics 90[1], pp. 37-48.
Disdier, A.-C., L. Fontagné, and M. Mimouni. (2008). The impact of regulations on agricul-
tural trade: evidence from the SPS and TBT agreements. American Journal of Agricultural
Economics, 90(2), pp. 336-350.
Djankov, S., McLiesh, C and Shleifer, A. (2007). Private credit in 129 countries. Journal of
Financial Economics, 84 (2), pp. 299-329.
Djankov, S., Ganser, T., McLiesh, C., Ramalho, R. and Shleifer, A. (2010). The effect of cor-
porate taxes on invest-ment and entrepreneurship. American Economic Journal: Macroeco-
nomics, 2(3), pp. 31-64.
Dritsaki, C., and Stiakakis, E. (2014). Foreign Direct Investments, Exports, and Economic
Growth in Croatia: A Time Series Analysis. Procedia Economics and Finance, 14, pp. 181-190.
Doove, S., O, Gabbitas, D. Nguyen-Hong and J.Owen. (2001). Price Effects of Regulation:
Telecommunications, Air Passenger Transport and Electricity Supply. Commission Staff Re-
search Paper, AusInfo, Canberra.
Duggan, Victor, Rahardja, Sjamsu and Varela, Gonzalo. (2013). Service Sector Reform and
Manufacturing Productivity : Evidence from Indonesia. The World Bank. Policy Research
Working Paper Series 6349.
Efogo Okah FranÇoise. 2021. Does trade in services improve African participation in global
value chains. African Development Review, Vol. 32, Iss. 4.
Egger, Peter; Larch, Mario; Nigai, Sergey and Yotov, Yoto. (2021). Trade costs in the global
economy: Measurement, aggregation and decomposition.WTO StaffWorking Papers ERSD-
2021-2, World Trade Organization (WTO), Economic Research and Statistics Division.
Egger, P. and Nigai, S. (2015). Structural Gravity With Dummies Only: Constrained ANOVA-
Type Estimation of Gravity Models. Journal of International Economics 97[1], pp. 86-99.
Egger, Peter and Valeria Merlo. (2007). The Impact of Bilateral Investment Treaties on FDI
Dynamics. The World Economy, vol. 30(10), pp. 1536-1549.

Bibliography 157
Eicher, T. S., Helfman, L., and Lenkoski, A. (2012). Robust FDI determinants: Bayesian model
averaging in the presence of selection bias. Journal of Macroeconomics, 34(3), pp. 637-651.
Ekobena, Simon; Coulibaly, Adama; Keita, Mama; Pedro, Antonio. (2021). Potentials of the
African Continental Free Trade Area: A combined partial and general equilibrium modeling
assessment for Central Africa. African Development Review, Vol. 3, Iss. 3, pp. 452-465.
Elbushra, A. A., Karim, I. E. A., and Suleiman, I. (2011). The role of COMESA in promot-
ing intra-regional agricultural trade: Case study of Sudan. Journal of the Saudi Society of
Agricultural Sciences, Vol. 10, Iss. 2.
Food and Agriculture Organization (FAO). (2003). Forestry Outlook Study for Africa." Re-
gional Report-Opportunities and challenges towards 2020. FAO Forestry Paper 141. Rome.
Italy.
European Commission, T. (2001). Barriers to Trade in Business Services. World Trade Report
2019.
Ethier and Markusen. (1996). Multinational Firms, Technology Diffusion and Trade. Journal
of International Economic. Vol. 41, No. 1-2, pp. 1-28.
Feenstra, R. C. (2004). Advanced International Trade: Theory and Evidence. Princeton Uni-
versity Press, Princeton, N.J.
Feenstra, R. C. (2016). Advanced International Trade: Theory and Evidence. Princeton Uni-
versity Press, Princeton, N.J.
Fernando Mistura and Caroline Roulet. (2019). The determinants of Foreign Direct Invest-
ment: Do statutory restrictions matter?. OECDWorking Papers on International Investment
2019/01, OECD Publishing.
Fontagné, L., M. Mimouni, and J.-M. Pasteels. (2005). Estimating the impact of environmental
SPS and TBT on international trade. Integration and Trade Journal, 22(3).
Fournier, J.M. (2015). The negative effect of regulatory divergence on foreign direct invest-
ment. OECD Economics Department Working Papers 1268, OECD Publishing.

158 Bibliography
Francois, J. F., B. J. MacDonald, and H. Nordström. (1996). Trade Liberalisation and Capital
Accumulation in the GTAP Model. GTAP Technical Paper No 7.
Francois, Joseph and Kenneth Reinert. (1996). The Role of Services in the Structure of Produc-
tion and Trade: Stylized facts from Cross-Country Analysis. Asia-Pacific Economic Review, 2,
pp. 35-43.
Francois, Joseph F., MiriamManchin, Hanna Norberg, Olga Pindyuk, and Patrick Tomberger.
(2013). Reducing Transatlantic Barriers to Trade and Investment: An Economic Assessment.
London: Center for Economic Policy Research.
Francois, Joseph F. and L. Schuknecht. (2000). International Trade in Financial Services,
Competition, And Growth Performance. Centre For International Economics Studies (CIES),
Working Paper No. 6.
Gani, Azmat and Clemes, Michael D. (2016). Does the strength of the legal systems matter
for trade in insurance and financial services?. Research in International Business and Finance,
vol. 36(C), pp. 511-519.
Geloso Grosso, M. et al. (2014). Services Trade Restrictiveness Index (STRI): Scoring and
Weighting Methodology. OECD Trade Policy Working Papers, No. 177, OECD.
Gherghina, S., Simionescu, L., and Hudea, O. (2019). Exploring foreign direct investments -
Economic growth nexus. Empirical evidence from Central and Eastern European countries.
Sustainability, 11(19), 5421.
Ghosh, M., Syntetos, P. and Wang, W. (2012). Impact of FDI restrictions on inward FDI in
OECD countries. Global Economy Journal, Vol 12(3).
Gilbert, John. (2001). Annex B: GTAP Model Analysis: Simulating the Effects of a Korea-
US FTA Using Computable General Equilibrium Modelling Techniques, in Inbom Choi and
Jeffrey J. Schott, Free Trade Between Korea and the United States? Washington: Institute for
International Economics.
Golub, S. et al. (2003). The Influence of Policies on Trade and Foreign Direct Investment.
OECD Economic Studies, No. 36, pp. 7-83.

Bibliography 159
Gregori, Wildmer and Nardo, Michela. (2021). The effect of restrictive measures on
cross-border investment in the European Union. The World Economy, Forthcoming,
https://doi.org/10.1111/twec.13104.
Gulen, H and Ion, M. (2015). Policy uncertainty and corporate investment. Rev. Financ. Stud.
29 (3), pp. 523-564.
Hale, G and Xu, M. (2016). FDI effects on the labor market of host countries. Federal Reserve
Bank of San Francisco, working paper series, pp. 2016-25.
Hamilton, P. C. (2018). Tear down this wall: non-tariff measures and regional integration. In
International Trade Forum, No. 4, pp. 16-17, International Trade Centre (ITC).
Head, Keith and Ries, John. (2008). FDI as an outcome of the market for corporate control:
Theory and evidence. Journal of International Economics, vol. 74(1), pp. 2-20.
Head, K., Mayer, T. and Ries, J.. (2009). How remote is the offshoring threat?. European Eco-
nomic Review, 53(4), pp. 429-444.
Head, K., Mayer, T. and Ries, J. (2010). The Erosion of Colonial Trade Linkages After Inde-
pendence. Journal of International Economics, 81(1), pp. 1-14.
Head, K and Mayer, T. (2014). Gravity Equations: Workhorse,Toolkit, and Cookbook. Hand-
book of International Economics, vol. 4, pp. 131-195.
Heckscher, Eli Filip, and Bertil Gotthard Ohlin. (1991). Heckscher-Ohlin trade theory. The
MIT Press, Cambridge.
Heid, B and Larch, M. (2016). Gravity with unemployment. Journal of International Eco-
nomics, 101, pp. 70- 85.
Heid, Benedikt., Larch, Mario and Yotov, Yoto. (2017). Estimating the Effects of Non-
discriminatory Trade Policies within Structural Gravity Models. School of Economics Work-
ing Paper Series 2017-10, LeBow College of Business, Drexel University.
Hertel, W. T and Tsigas, E, M. (1998). Global Trade Analysis Modeling and Application. Cam-
bridge University Press 13-30.

160 Bibliography
Heuser, C. and Mattoo, A. (2017). Services trade and global value chains. In World Bank
Group, IDE-JETRO, OECD, UIBE, and WTO (Eds.), Measuring and analyzing the impact of
GVCs on economic development. Global Value Chain Development Report 2017, pp.141-159,
World Bank.
Hill, T.P. (1977). On goods and services. The Review of Income and Wealth, 23, pp. 315-338.
Hoekman, B. (2017). Trade in Services Opening Markets to Create Opportunities.(UNU-
WIDERWorking Paper 2017/31). United Nations UniversityWorld Institute for Development
Economics Research, Helsinki, Finland.
Hoffman, Barak; McKenna, Miles and Sáez Sebastián. (2019). Valuing Services Trade within
Africa. Services for Trade Competitiveness: Country and Regional Assessments of Services
Trade. Washington DC: World Bank, 2019.
Hummels, D. (2001). Toward a Geography of Trade Costs. unpublished, retrieved from
http://www.krannert.purdue.edu/faculty/hummelsd/research/toward/tgtc.pdf.
Hummels, David L., and Georg Schaur. (2013). Time as a Trade Barrier. American Economic
Review, 103(7), pp. 2935-59.
Iamsiraroj, S and Doucouliagos, H. (2015). Does Growth Attract FDI?. Economics, 9(19), 1.
International Labour Organization (ILO). (2015a). World Employment and Social Outlook
2015: The changing nature of jobs. International Labour Organization (Geneva).
International Trade Centre (ITC). (2017). SMEs [Small and medium-sized enterprises] Com-
petitiveness Outlook 2017: The region-A door to global trade. SME Competitiveness Outlook
Series (United Nations publication. Sales No. E.17.III.T.2. Geneva).
Jang, Y. J. (2011). The impact of bilateral free trade agreements on bilateral foreign direct
investment among developed countries. The World Economy, 34(9), pp. 1628-1651.
Jensen, H.G. and Sandrey, R. (2015). The Continental Free Trade Area- A GTAP assessment.
Trade Law Centre and The U.S. Agency for International Development, 2015.

Bibliography 161
Jensen, Jesper; Rutherford, Thomas and Tarr, David. (2007). The impact of liberalizing barri-
ers to foreign direct investment in services: the case of Russian accession to the world trade
organization. Review of Development Economics, 11 (3), pp. 482-506.
Jensen, Jesper; Rutherford, Thomas and Tarr, David. (2010). Modeling Services Liberalization:
The Case of Tanzania. Journal of Economic Integration, 25, 4, pp. 644-75.
Jonathan Batten and Xuan Vinh Vo. (2009). An analysis of the relationship between foreign
direct investment and economic growth. Applied Economics, Taylor and Francis Journals, vol.
41(13), pp. 1621-1641.
Jungmittag, Andre and Marschinski, Robert. (2020). Service Trade Restrictiveness and For-
eign Direct Investment-Evidence from Greenfield FDI in Business Services. JRC Working
Papers JRC122116, Joint Research Centre.
Kaleeswaran Kalirajan. (2000). Restrictions on Trade in Distribution Services. Staff Research
Paper, Australian Productivity Commission.
Kaufmann, D., Aart, K. and Massimo, M. (2010). Woldwide Governance Indicators. Policy
Res. Work. Pap. 5430. Washington, DC World Bank.
Kee, Hiau Looi, Alessandro Nicita, and Marcelo Olarreaga. (2009). Estimating Trade Restric-
tiveness Indices. Economic Journal, vol. 119, Iss. 534, pp. 172-199.
Kleinert, J. and Toubal, F. (2010). Gravity for FDI. Review of International Economics, 18, pp.
1-13.
Konan, Denise Eby and Maskus, Keith E. (2006). Quantifying the Impact of Services Liberal-
ization in a Developing Country. Journal of Development Economics, 81, pp. 142-162.
Kouty Manfred. (2021). Implementing the African Continental Free Trade Area (AfCFTA):
The Effects of Trade Procedures on Trade Flows. Research in Applied Economics , Vol. 13, No.
1.
Kox, H and Nordås, H. K . (2007). Services Trade and Domestic Regulation. OECD Trade
Policy Working Paper 49.

162 Bibliography
Kox, H. and H.k. Nordås. (2009). Regulatory Harmonization and Trade in Services: Volume
and choice of mode. FREIT Trade Working Paper No. 040, 2009.
Kox, Henk and Rojas-Romagosa, Hugo. (2019). Gravity Estimations with FDI Bilateral Data:
Potential FDI Effects of Deep Preferential Trade Agreements. Robert Schuman Centre for
Advanced Studies Research.
Koyama, T. and Golub, S. (2006). OECD’s FDI Regulatory Restrictiveness Index: Revision and
extension to more economies. OECD Working Paper on International Investment.
Langhammer, Rolf J. (2004). Revealed comparative advantages in the services trade of the
United States, the European Union and Japan: what do they tell us?. The journal of world
investment and trade, Vol. 5, Iss. 6, pp. 887-896.
Larch, Mario and Yotov, Yoto. (2016). General Equilibrium Trade Policy Analysis with Struc-
tural Gravity. School of EconomicsWorking Paper Series 2016-9, LeBow College of Business,
Drexel University.
Latorre, MariÁ. C. (2016). A CGE analysis of the impact of foreign direct investment and
tariff reform on female and male workers.World Development, 77, pp. 346-366.
Lee, J. W., and and Swagel, P. (1997). Trade Barriers And Trade Flows Across Countries And
Industries. The Review of Economics and Statistics, MIT Press, vol. 79(3), pp. 372-382.
Lehmann Alexander, Tamirisa Natalia T. andWieczorek Jaroslaw. (2003). International Trade
in Services. Implications for the IMF. IMF Policy Discussion Papers 2003/006, International
Monetary Fund.
Lennon, C. (2009). Trade in Services and Trade in Goods: Differences and Complementarities.
The Vienna Institute for International Economic Studies Working Papers 53.
Li, X., and Liu, X. (2005). Foreign direct investment and economic growth: an increasingly
endogenous relationship.World development, 33 (3), pp. 393-407.
Lipsey, Robert. (2001). The new economy: theory and measuremen. Paper for 27th Annual
PAFTADConference: TheNewEconomy: Challenges for East Asia and the Pacific, Canberra,
Australia.

Bibliography 163
Magee, C. S. (2003). Endogenous Preferential Trade Agreements: an Empirical Analysis. Con-
tributions to Economic Analysis and Policy 2[1].
Markusen, James R. (1989). Trade in producer services and in other specialized intermediate
inputs. American Economic Review, vol 79, pp. 85-95.
Martin, W. J. and Pham, C. S. (2008). Estimating the Gravity Equation When Zero Trade
Flows Are Frequent. Melbourne, Deakin University, School of Accounting, Economics and
Finance, Working Paper No. 2008-03.
Martínez - San Román, V., Bengoa, M., and Sánchez - Robles, B. (2016). Foreign direct invest-
ment, trade integration and the home bias: Evidence from the European Union. Empirical
Economics, 50(1), pp. 197-229.
Mattoo, Aaditya; Rathindran, Randeep and Subramanian, Arvind. (2001). Measuring services
trade liberalization and its impact on economic growth : an illustration". Policy Research
Working Paper Series 2655, The World Bank.
Maune Alexander. (2019). Trade in Services-Economic Growth Nexus: An Analysis of the
Growth Impact of Trade in Services in SADC Countries. Journal of Economics and Behavioral
Studies, Vol.11, No. 2, pp. 58-78.
Mevel, S and S. Karingi. (2012). Deepening regional integration in Africa: A computable
general equilibrium assessment of the establishment of a continental free trade area followed
by a continental customs union. in 7th African Economic Conference, Kigali, Rwanda.
Miroudot, S. (2016). Services in global value chains: From inputs to value creating activities.
Trade Policy Paper, OECD, Paris.
Moungar, Vanessa and Gregorio, Emanuela. (2018). Textile and Clothing industries can drive
Africa’s industrialization, benefit women. African Development Bank, Gender Department.
Mustilli, Federica, and Jacques Pelkmans. (2013). Access Barriers to Services Markets: Map-
ping, tracing, understanding and measuring. CEPS, Special Report No 77, June 2013.
Myovella, Godwin ; Karacuka, Mehmet and Haucap, Justus. (2020). Digitalization and
economic growth: A comparative analysis of Sub-Saharan Africa and OECD economies.
Telecommunications Policy, vol. 44(2).

164 Bibliography
Narayanan, B., Aguiar A. andMcDougall R. (2012). Global Trade, Assistance, and Production:
The GTAP 8 Data Base. Center for Global Trade Analysis, Purdue University, West Lafayette.
Nicoletti, G., Golub, S. S., Hajkova, D., Mirza, D. and Yoo, K.-Y. (2003). The Influence of Poli-
cies on Trade and Foreign Direct Investment. OECD Economic Studies No. 36, 2003/1, OECD
Publishing.
Nin-Pratt, Alejandro and Diao, Xinshen. (2014). Regional Integration of Agricultural Trade
in Southern Africa : Infatuation or Real Need?. Journal of Economic Integration, vol. 29, pap.
520-562.
Niven, Winchester et al. (2012). The Impact of Regulatory Heterogeneity on Agri-food Trade.
The World Economy, vol. 35(8), pp. 973-993.
Nordås, HK. (2016). Services Trade Restrictiveness Index (STRI): The Trade Effect of Regula-
tory Differences. OECD Trade Policy Papers, no189, OECD Publishing.
Nordås, HK and Rouzet, D. (2017). The Impact of Services Trade Restrictiveness on Trade
Flows. The World Economy, Vol. 40, Iss. 6, pp. 1155-1183.
Ntara, K. C. (2016). African Trading Blocs and Economic Growth: A Critical Review of the
Literature. International Journal of Developing and Emerging Economies, Vol.4, No.1, pp. 1-21.
Nurnaddia Nordin; Nurhaiza Nordin; Murni Yunus Mawar and orzalina Zainudin. (2019).
Growth Effect Of Foreign Direct Investment: The Role Of Labor Market Flexibility. Economic
Journal of Emerging Markets, vol. 11(1), pp. 19-31.
Novy, D. (2013). Gravity Redux: Measuring International Trade Costs With Panel Data. Eco-
nomic Inquiry 51(1), pp. 101-121.
OECD . (2008). The Contribution of Services To Development and The Role Of Trade Liber-
alisation and Regulation. OECD Global Forum on International Investment.
OECD. (2015). Implementing the latest international standards for compiling foreign direct
investment statistics. OECD.
OECD. (2020). OECD Services Trade Restrictiveness Index: Policy trends up to 2020. OECD.

Bibliography 165
Oliveira MJ, Gonand F, Antolin P, de la Maisonneuve C and Yoo KY. (2005). The Impact of
Ageing on Demand, Factor Markets and Growth. OECD Economics Department Working
Papers, No. 420, OECD Publishing.
Olivero, M. P. and Yotov, Y. V. (2012). Dynamic Gravity: Endogenous Country Size and Asset
Accumulation. Canadian Journal of Economics 45[1], pp. 64-92.
Paravisini, Daniel et al. (2014). Dissecting the Effect of Credit Supply on Trade: Evidence
from Matched Credit-Export Data. Review of Economic Studies, 2014, 82(1), pp. 333-359.
Peterson, Everett. 2006. GTAP-M: A GTAP Model and Data Base that Incorporates Domestic
Margins. GTAP Technical Paper No. 26.
Petri, Peter A., and Michael G. Plummer. (2016). The Economic Effects of the Trans-Pacific
Partnership: New Estimates. Working Paper 16-2, Peterson Institute for International Eco-
nomics, Washington.
Piermartini, Roberta, and Yoto Yotov. (2016). Estimating Trade Policy Effects with Structural
Gravity. WTO Working Paper ERSD-2016-10.
Poore, J. and Nemecek, T. (2018). Reducing food’s environmental impacts through producers
and consumers. Science, 360(6392), pp. 987-992.
Ricardo, D. (1817). On the Principles of Political Economy and Taxation. John Murray, Lon-
don. In: Sraffa, P., Ed., The Works and Correspondence of David Ricardo, Vol. 1, Cambridge
University Press, Cambridge, 1951.
Rouzet, D and al. (2014). Services Trade Restrictiveness Index (STRI): Financial Services.
OECD Publishing.
Rouzet, D. and F. Spinelli. (2016). Services Trade Restrictiveness, Mark-Ups and Competition.
OECD Trade Policy Papers, No. 194, OECD Publishing, Paris.
Sáez, Sebastián; McKenna, Miles and Hoffman, Barak. (2015). Valuing Trade in Services in
Africa. World Bank and World Economic Forum, the Africa Competitiveness Report 2015,
Geneva.

166 Bibliography
Saygili, M; Peter, R. and Knebel, C. (2018). African Continental Free Trade Area: Challenges
and Opportunities of Tariff Reductions. UNCTAD Research Paper No. 15.
Santos Silva, J and Silvana Tenreyro. (2006). The Log of Gravity. The Review of Economics and
Statistics, 88(4), pp. 6416-658.
Santos Silva, J. and Tenreyro, S. (2011). Poisson: Some convergence issues. The Stata Journal,
11(2), pp. 207-212.
Santos Silva, J and Silvana Tenreyro, S. (2013). Trading Partners and Trading Volumes: Im-
plementing the Helpman-Melitz-Rubinstein Model Empirically. Oxford bulletin of economics
and statistics.
Siggel, Eckhard. (2006). International Competitiveness and Comparative Advantage: A Sur-
vey and a Proposal for Measurement. Journal of Industry, Competition and Trade, 6, pp. 137-
59.
Slany, A. (2019). The role of trade policies in building regional value chains- Some prelimi-
nary evidence from Africa. South African Journal of Economics, 87(3), pp. 326-353.
Sun, I. Y. (2017). The Next Factory of the World: How Chinese Investment Is Reshaping
Africa. Harvard Business Review, Iss. 122-129.
Tekin, R. B. (2012). Development aid, openness to trade and economic growth in least devel-
oped countries: Bootstrap panel granger causality analysis. Procedia-Social and Behavioral
Sciences, Vol.62, pp. 716-721.
Tobin, J. and S. Rose-Ackerman. (2005). Foreign Direct Investment and the Business Environ-
ment in Developing Countries: the Impact of Bilateral Investment Treaties. Center for Law,
Economics and Public Policy, Research Paper No. 293.
TRALAC. (2015). Trade in Services in Africa. Tralac Special Report, No S15SR01/2015.
TRALAC. (2020). The African Continental Free Trade Agreement. Tralac guide.
Trefler, D. (1993). Trade Liberalization and the Theory of Endogenous Protection: an Econo-
metric Study of U.S. Import Policy. Journal of Political Economy, 101[1], pp. 138-160.
Bibliography 167
Trefler, D. (2004). The Long and the Short of the Canada-U.S. Free Trade Agreement. Ameri-
can Economic Review, 94[4], pp. 870-895.
United Nations. (2015). World Population Ageing. Department of Economic and Social Af-
fairs, Population Division, New York.
UNCTAD . (2009). Economic Development in Africa Report 2009: Strengthening Regional
Economic Integration for Africa’s Development. United Nations publication. Sales No.
E.09.II.D.7. New York and Geneva.
United Nations Conference on Trade and Development (UNCTAD). (2013). Global value
chains: Investment and trade for development . World Investment Report, United Nations
Conference on Trade and Development, United Nations Publishing.
United Nations Conference on Trade and Development (UNCTAD. (2013). Non-Tariff Mea-
sures to Trade: Economic and Policy Issues for Developing Countries. United Nations Con-
ference on Trade and Development (UNCTAD/DITC/TAB/2012/1), Geneva.
United Nations Conference on Trade and Development (UNCTAD. (2014). Non-Tariff Mea-
sures: UNCTAD Programme on Non-Tariff Measures in World Trade.
United Nations Conference on Trade and Development (UNCTAD. (2015a). Unlocking the
potential of Africa’s services trade for Growth and development. Economic Development in
Africa Report, UN, NY.
United Nations Conference on Trade and Development (UNCTAD). (2018). Trade in Services
and Employment. United Nations, New York and Geneva, UNCTAD/DITC/TNCD/2018/1.
UNCTADStats. (2018). https://unctadstat.unctad.org/FR/.
United Nations Conference on Trade and Development (UNCTAD). (2019). Economic Devel-
opment in Africa Report: Made in Africa-Rules of Origin for Enhanced Intra-African Trade.
United Nations Conference on Trade and Development, Geneva.
United Nations Conference on Trade andDevelopment (UNCTAD). (2019).World Investment
Report 2019. United Nations Conference On Trade and Development.

168 Bibliography
United Nations Conference on Trade and Development (UNCTAD). (2019b). Services key to
revving up economic growth and development. United Nations Conference on Trade and
Development, Geneva.
United Nations Conference on Trade and Development (UNCTAD). (2020a). BioTrade Princi-
ples and Criteria for Terrestrial, Marine and Other Aquatic Biodiversity-Based Products and
Services. United Nations Conference on Trade and Development, Geneva.
United Nations Conference on Trade and Development (UNCTAD). (2021). Implications of
the African Continental Free Trade Area for Trade and Biodiversity: Policy and Regulatory
Recommendations. United Nations Conference on Trade and Development, Geneva
United Nations Conference on Trade andDevelopment (UNCTAD). (2021).World Investment
Report 2021. United Nations Conference On Trade and Development.
United Nations Economic Commission for Africa, African Union and African Development
Bank. (2017). Assessing Regional Integration in Africa VIII: Bringing the Continental Free
Trade Area About. Addis Ababa.
Van der Marel Erik and Shepherd Ben. (2013). Services Trade, Regulation and Regional Inte-
gration: Evidence from Sectoral Data. The World Economy, 36, no11 (2013), PP. 1393-1405.
Vanzetti, David; Ralph Peters and Christian Knebel. (2016). Sand In The Wheels: Non-Tariff
Measures And Regional Integration In SADC. UNCTAD Blue Series Papers 71, United Na-
tions Conference on Trade and Development, Geneva.
Vanzetti, David; Ralf Peters, and Christian Knebel. (2018). Non-Tariff Measures: Lifting
AfCFTA and ACP Trade to the Next Level. UNCTAD Research Paper No. 14, United Nations
Conference on Trade and Development, Geneva.
Walmsley, Terrie. L. (1998). Long-Run Simulations with GTAP: Illustrative Results from
APEC Trade Liberalisation. GTAP Technical Paper No. 9.
Walsh, K. (2008). Trade in Services: Does Gravity Hold?. Journal of World Trade, 42 (2), pp.
315-334 .
Wei, Shang-Jin. (2000). How Taxing is Corruption on International Investors?. Review of Eco-
nomics and Statistics, 82 (1), PP. 1-11.

Bibliography 169
World Bank. (2001). Global economic prospects and the developing countries 2002: Making
trade work for the poor. Washington, D.C.
World Bank. (2005). A better investment climate for everyone. World development report.
Washington, DC : World Bank Group.
World Bank. (2016). The Unexplored Potential of Trade in Services in Africa. Working Paper.
World Bank. (2018). The World Bank annual report 2018. The World Bank.
World Bank. (2020). The African Continental Free Trade Area : Economic and Distributional
Effects". Washington, DC: World Bank. The World Bank.
World Trade Organization (WTO). (2005). Analysis of the links between trade, trade stan-
dards and the WTO. World Trade Report, WTO.
World Trade Organization (WTO). (2013). The General Agreement On Trade in Services: An
Introduction. Trade in Services Division.
World Trade Organization (WTO). (2016). Trade finance and SMEs Bridging the gaps in pro-
vision. World Trade Organization.
World Trade Organization (WTO). (2017).World Trade Report: An Introduction: Trade, tech-
nology and jobs. World Trade Organization (WTO).
World Trade Organization (WTO). (2019). The future of services trade. Trade in Services
Division. World Trade Report 2019.
World Trade Organization (WTO). (2020). Annual Report: The Trade Facilitation Agreement
Facility. World Trade Organization.
World Trade Organization (WTO). (2021). World Trade Statistical Review. World Trade Or-
ganization (WTO).
Yaghoob Jafari and David G. Tarr. (2017). Estimates of Ad Valorem Equivalents of Barriers
Against Foreign Suppliers of Services in Eleven Services Sectors and 103Countries. TheWorld
Economy, vol. 40(3), pp. 544-573.

170 Bibliography
Yotov, Y. V. (2012). A Simple Solution to the Distance Puzzle in International Trade. Economics
Letters 117[3], pp. 794-798.
Yotov, Y.V., Piermartini, R., Monteiro, J-A., Larch, M. (2016). An advanced guide to trade
policy analysis: The structural gravity model. United Nations andWorld Trade Organization.
Geneva.
Yuan, Wen Jin and Mary, Burfisher. (2021). Comparing Trade Balance Closures in the GTAP-
Recursive Dynamic (GTAP-RD) Model Framework. U.S. International Trade Commission,
Working Paper 2021-01-A, Washington, DC.
Yue, M., Qu., B and Zhang, Y. (2010). Judicial quality, contract intensity and trade: firm level
evidence from developing and transition economies. Journal of Comparative Economics, 38
(2), pp. 146-159.
Yushi, J. and Borojo, D. G. (2019). The impacts of institutional quality and infrastructure on
overall and intra-Africa trade. Economics, 13(1).
Zongo Amara. (2021). The Impact of Services Trade Restrictiveness on Food Trade. Interna-
tional Economics, Vol 166, pp. 71-94.

Appendices

Appendix A
Appendix of Chapter 1

173Table A.1: List of countries: OECD, non OECD, EEA, major net food exporting-importing and high-low value-added service coun-
tries
OECD Non-OECD EEA countries Major net High valuecountries (Emerging countries) food-exporting -added service
economies countries
Australia China Austria Australia Belgium
Austria (People’s Republic of) Belgium Belgium France
Belgium Colombia Czech Republic Canada Greece
Canada Costa Rica Denmark Denmark Israel
Chile India Estonia Hungary Japan
Czech Republic Indonesia Finland Iceland Luxembourg
Denmark Malaysia France Ireland Netherlands
Estonia Russia Germany Mexico Switzerland
Finland South Africa Greece Netherlands United Kingdom
France Thailand Hungary New-Zealand United States
Germany Iceland Norway of America
Greece Ireland Poland
Hungary Italy Spain
Iceland Latvia Thailand
Ireland Lithuania Turkey
Israel Luxembourg United States
Italy Netherlands of America
Japan Norway
Korea Poland
Latvia Portugal Major net Low valueLithuania Slovak Republic food-importing -added service
Luxembourg Slovenia countries countriesMexico Spain
Netherlands Sweden Austria Chile
New-Zealand Switzerland Czech Republic Czech Republic
Norway United Kingdom Estonia Hungary
Poland Finaland Irealnd
Portugal France Korea
Slovak Republic Germany Norway
Slovenia Greece Poland
Spain Israel Slovak Republic
Sweden Italy Slovenia
Switzerland Japan Turkey
Turkey Korea
UnitedKingdom Latvia
United States of America Lituania
Luxembourg
Portugal
Slovak Republic
Slovenia
Sweden
Switzerland
United Kingdom

174 Appendix of Chapter 1
Table A.2: Cross-correlation table of STRI
Variables STRI STRI STRI STRILogistics Financial-Business Transports Distribution
STRI-Logistics 1.000
STRI-Financial-Business 0.416 1.000
STRI-Transports 0.401 0.758 1.000
STRI-Distribution 0.404 0.372 0.221 1.000

175
Table A.3: Descriptive statistics: Country STRI and regulatory heterogeneity score
Country STRI
Emerging OECD
Variables obs. Mean Std. Dev. Min Max obs. Mean Std. Dev. Min Max
STRI-Logistics 1,800 0.37385 0.11775 0.2425 0.675 1,800 0.20745 0.06984 0.125 0.4825
STRI-Transports 1,800 0.41395 0.13319 0.225 0.6425 1,800 0.28058 0.06861 0.1825 0.4875
STRI-Financial-Business 1,800 0.4134 0.15926 0.23 0.67666 1,800 0.22714 0.06699 0.13 0.43666
STRI-Distribution 1,800 0.3116 0.14642 0.14 0.67 1,800 0.17127 0.04641 0.11 0.33
Heterogeneity score
OECD-Emerging Intra-OECD
Heterogeneidty score-logistics 1,800 0.33301 0.09296 0.14377 0.6092 6,300 0.21940 0.07590 0.061 0.50807
Heterogeneity score-Transports 1,800 0.36088 0.07870 0.1793 0.57766 6,300 0.22296 0.08885 0.06213 0.4946
Heterogeneity score-Financial-Business 1,800 0.38069 0.10480 0.1582 0.6029 6,300 0.24674 0.06564 0.05766 0.49766
Heterogeneity score-Distribution 1,800 0.31243 0.13367 0.0952 0.7131 6,300 0.18634 0.05335 0.058 0.364
Overall Heterogeneity-score 1,800 0.35237 0.07193 0.1896 0.51926 6,300 0.22522 0.06782 0.07632 0.44353
Country STRI
Intra-EEA EU
Variables obs. Mean Std. Dev. Min Max obs. Mean Std. Dev. Min Max
STRI-Logistics 3,250 0.20221 0.05515 0.1175 0.405 2,530 0.19013 0.04099 0.1175 0.2875
STRI-Transports 3,250 0.25721 0.05166 0.14 0.40666 2,530 0.24661 0.04146 0.14 0.3275
STRI Financial-Business 3,250 0.21846 0.05680 0.13 0.35666 2,530 0.20704 0.04881 0.13 0.31
STRI-Distribution 3,250 0.17646 0.0534 0.11 0.37 2,530 0.16434 0.03988 0.11 0.28
Heterogeneity score
Heterogeneity score logistics 3,250 0.17735 0.05054 0.061 0.34445 2,530 0.16449 0.03978 0.061 0.2879
Heterogeneity score-Transports 3,250 0.15623 0.04210 0.06213 0.29 2,530 0.14659 0.03484 0.06213 0.25915
Heterogeneity score-Financial-Business 3,250 0.21157 0.04702 0.05766 0.36 2,530 0.20088 0.04204 0.05766 0.30966
Heterogeneity score-Distribution 3,250 0.16266 0.04735 0.058 0.364 2,530 0.15029 0.03462 0.058 0.239
Overall Heterogeneity-score 3,250 0.17904 0.04279 0.07632 0.32367 2,530 0.16743 0.03291 0.07632 0.26495

176 Appendix of Chapter 1
Table A.4: Country-STRI and other control variables
Specification Poisson-PML Estimate: 2014-2019Dependant variable All Food Products (Pooled)
Baseline Country-STRI Other control variablesModel (1) (2) (3) (4) (5) (6) (7)
STRIijt,Logistics -7.6906∗∗∗
-7.3176∗∗∗
-7.8344∗∗∗
-7.1746∗∗∗
-7.9510∗∗∗
-8.1397∗∗∗
(1.8916) (1.5895) (1.8738) (1.6509) (1.9764) (1.7900)
STRIijt,F inancial−Business -6.8823∗∗∗
-6.6244∗∗∗
-7.3817∗∗∗
-7.5066∗∗∗
-6.7848∗∗∗
-6.5539∗∗∗
(2.3890) (2.0004) (2.4483) (2.1036) (2.4149) (2.0977)
STRIijt,T ransports 1.9993 2.1451 3.1682 3.3905 1.9463 1.9549
(2.3698) (2.1118) (2.3736) (2.1755) (2.4513) (2.1959)
STRIijt,Distribution 9.7833∗∗∗
8.7531∗∗∗
9.1919∗∗∗
8.7872∗∗∗
9.9410∗∗∗
9.6181∗∗∗
(2.0444) (1.7437) (2.1922) (1.8512) (2.1317) (1.8891)
STRIj,t -1.4287∗∗∗
(0.4794)
STRIi,t -2.9249∗∗
(1.3305)
RTAij,t 0.3806∗∗∗
0.4912∗∗∗
0.7647∗∗∗
(0.1156) (0.1059) (0.1014)
Intra− EEA 1.2530∗∗∗
1.3279∗∗∗
(0.2045) (0.1878)
NAFTA 0.1689 0.4014∗
(0.2475) (0.2254)
EIA− SPS harmonizationij,t -0.1510 -0.2364
(0.1499) (0.1462)
EIA− TBT harmonizationij,t 0.3147∗∗
0.4901∗∗∗
(0.1502) (0.1410)
Ln(1 + tariffji,t) -0.2962∗∗∗
-0.3299∗∗∗
-0.1038∗∗∗
-0.0058 -0.0344 -0.3120∗∗∗
-0.3329∗∗∗
(0.0542) (0.0470) (0.0338) (0.0519) (0.0472) (0.0624) (0.0593)
Ln distij -1.8028∗∗∗
-1.8199∗∗∗
-1.0412∗∗∗
-1.7563∗∗∗
-1.7552∗∗∗
-1.8469∗∗∗
-1.8754∗∗∗
(0.1036) (0.0936) (0.1075) (0.1088) (0.0996) (0.1052) (0.0978)
langij 0.2071∗∗
0.2379∗∗∗
0.0074 0.2532∗∗
0.3026∗∗∗
0.2172∗∗
0.2551∗∗∗
(0.1049) (0.0867) (0.0898) (0.1050) (0.0860) (0.1056) (0.0885)
borderij 0.7335∗∗∗
0.7499∗∗∗
0.9706∗∗∗
0.7356∗∗∗
0.7403∗∗∗
0.7162∗∗∗
0.7209∗∗∗
(0.0876) (0.0810) (0.0921) (0.0890) (0.0820) (0.0880) (0.0826)
Exporter-importer controls No No Yes No No No No
Sector-FE Yes No Yes Yes No Yes No
Time-FE No No Yes No No No No
Exporter-time-FE Yes No No Yes No Yes No
Importer-time-FE Yes No Yes No Yes No
Exporter-sector-time-FE No Yes No No Yes No Yes
Importer-sector-time-FE No Yes No No Yes No Yes
R20.922 0.9396 0.664 0.925 0.9404 0.922 0.9372
Observations 24867 24763 24867 24867 24763 24867 18651
Chi-2 2321.34∗∗∗
2337.29∗∗∗
2314.19∗∗∗
Notes: The dependent variable is nominal bilateral food product from i to j at to t in sector k as in equation (1.3).
Regressions 2, 4 ,6, 8 and are performed using the ppmlhdfe STATA command written by Correia, Guimarães,
Zylkin (2019). Exporter-importer controls are the GDP of both countries. Standard errors are reported in paren-
theses and clustered by country-pair level except regression 7 where they are clustered by importer and exporter.
*, **, *** denote significance at the 10% 5% and 1% level respectively.

177
Table A.5: Impact of disaggregated sectoral STRIs on cross-border exports of food Commodi-
ties
Specification Poisson-PML Estimate: 2014-2019Dependant variable All Food Products (Pooled)Model (1) (2) (3) (4) (5) (6) (7) (8)
RTAij,t 0.2262∗∗
0.3428∗∗∗
0.3453∗∗∗
0.4686∗∗∗
0.4276∗∗∗
0.5232∗∗∗
0.3058∗∗
0.3885∗∗∗
(0.1123) (0.1074) (0.1129) (0.1045) (0.1181) (0.1108) (0.1216) (0.1163)
Ln(1 + tariffji,t) -0.3078∗∗∗
-0.3384∗∗∗
-0.3045∗∗∗
-0.3369∗∗∗
-0.2986∗∗∗
-0.3345∗∗∗
-0.2822∗∗∗
-0.3206∗∗∗
(0.0567) (0.0492) (0.0566) (0.0497) (0.0585) (0.0538) (0.0569) (0.0515)
Ln distij -1.7712∗∗∗
-1.7945∗∗∗
-1.7551∗∗∗
-1.7764∗∗∗
-1.7604∗∗∗
-1.7711∗∗∗
-1.7965∗∗∗
-1.8121∗∗∗
(0.1074) (0.0970) (0.1029) (0.0941) (0.1114) (0.1007) (0.1123) (0.1002)
langij 0.1989∗
0.2326∗∗∗
0.1610 0.1987∗∗
0.1441 0.1826∗
0.1462 0.1820∗
(0.1061) (0.0882) (0.1054) (0.0890) (0.1272) (0.1091) (0.1247) (0.1046)
borderij 0.7141∗∗∗
0.7333∗∗∗
0.7432∗∗∗
0.7616∗∗∗
0.7603∗∗∗
0.7772∗∗∗
0.7512∗∗∗
0.7673∗∗∗
(0.0864) (0.0799) (0.0903) (0.0833) (0.0950) (0.0894) (0.0921) (0.0854)
Logistics Sector
STRIijt,Storage−warehouse 5.9945 6.7194∗
5.9192 7.2951∗
(4.5835) (3.9413) (4.5935) (4.1567)
STRIijt,Freight forwarding -4.5174∗∗∗
-4.1346∗∗∗
-2.7968 -2.5256
(1.7025) (1.5321) (1.7150) (1.6271)
STRIijt,Cargo handling -6.0579∗
-7.5224∗∗
-11.4078∗∗∗
-13.9262∗∗∗
(3.5519) (3.2490) (4.4234) (4.0578)
STRIijt,Customer brokerage -2.6590∗∗
-2.2604∗∗
-3.9983∗∗∗
-3.8399∗∗∗
(1.0789) (0.9650) (1.3223) (1.2337)
Financial-Other Business Sectors
STRIijt,Accounting -1.8437∗∗∗
-1.7654∗∗∗
-1.6123 -1.4688∗
(0.6868) (0.5489) (1.0528) (0.8198)
STRIijt,Banking -5.8073∗∗∗
-4.9442∗∗∗
-0.3606 1.2212
(1.6360) (1.4730) (3.5872) (3.1779)
STRIijt,Insurance -0.6933 -1.0485 1.8728 1.0154
(2.1983) (1.7472) (3.1965) (2.6514)
Transports and Distribution Sectors
STRIijt,Air transport -0.9819 -0.9214 -0.7750 -0.6197
(1.3218) (1.2366) (1.5283) (1.4134)
STRIijt,Rail freight transport -0.9889 -1.1404 0.1235 -0.2401
(0.9119) (0.7521) (1.2034) (0.8972)
STRIijt,Road freight transport -2.9675∗∗
-2.6602∗∗
3.5031∗
3.4020
(1.1906) (1.1050) (2.1079) (2.0891)
STRIijt,sea transport -6.1879∗∗
-5.0457∗
-1.0913 0.4768
(3.0645) (2.6837) (3.5028) (2.9614)
STRIijt,Distribution 9.4034∗∗∗
7.9703∗∗∗
9.4635∗∗∗
8.6681∗∗∗
(2.5192) (2.1428) (2.1409) (1.8466)
Sector-FE Yes No Yes No Yes No Yes No
Exporter-time-FE Yes No Yes No Yes No Yes No
Importer-time-FE Yes No Yes No Yes No Yes No
Exporter-sector-time-FE No Yes No Yes No Yes No Yes
Importer-sector-time-FE No Yes No Yes No Yes No Yes
R20.923 0.917 0.927 0.930
Observations 24867 24763 24867 24763 15996 15996 15996 15996
Chi-2 2253.54∗∗∗
2113.76∗∗∗
1972.41∗∗∗
2177.10∗∗∗
Notes: The dependent variable is nominal bilateral food product from i to j at to t in sector k as in equation (1.3).
Regressions 2, 4, 6, 8 are performed using the ppmlhdfe STATA command written by Correia, Guimarães, Zylkin
(2019). Exporter-importer controls are the GDP of both countries Standard errors are reported in parentheses
and clustered by country-pair level. *, **, *** denote significance at the 10% 5% and 1% level respectively.

178Appendix
ofChapter
1Table A.6: Major exporter-importers countries, OECD-emerging countries, high-low services value added countries, economic
integretation and heterogeneity regulatory
Specification Poisson-PML Estimate: 2014-2019Dependant variable Export of Food Products (Pooled)
Net Food Exporting OECD-Emerging High services value added Vs Intra-EEA European UnionImporting countries countries Low services value added Countries Countries
Model (1) (2) (3) (4) (5) (6) (7) (8) (9) (10)
Heterogeneity scoreijt,logistics -3.8681 -4.3965* -3.6917 -0.3897 0.1005 0.2688 -3.8588** -3.9080** -3.3777* -3.4764*
(2.4214) (2.4164) (4.1156) (1.9373) (3.9748) (3.8356) (1.7619) (1.6664) (1.9130) (1.8180)
Heterogeneity scoreijt,F inancial−Business -0.5337 -0.3509 -0.8464 1.2619 3.2450* 3.3032** -3.4637*** -3.4275*** -3.3689*** -3.2980***
(1.5046) (1.4992) (3.0913) (1.9871) (1.7972) (1.5785 (1.0526) (0.9792) (1.0949) (1.0109)
Heterogeneity scoreijt,T ransports 1.6938 2.1404 4.1827 3.1601* 7.6636 7.7216* 6.2900*** 6.2427*** 5.6697*** 5.6745***
(2.6602) (2.4901) (2.7422) (1.9195) (5.2431) (4.2441) (2.0520) (1.9372) (2.1753) (2.0524)
Heterogeneity scoreijt,Distribution -1.1836 -1.0213 -3.7817 -4.4993** -11.0001*** -10.9903*** -0.4756 -0.4091 -0.8273 -0.7673
(2.0846) (2.0976) (3.0041) (1.8964) (3.4409) (2.7686) (1.2267) (1.1888) (1.2178) (1.1579)
RTAij,t 0.8740*** 0.9283*** 0.3247 0.3230* (0.3784) (0.3903)
(0.2120) (0.2097) (0.1991) (0.1681) (0.1251) (0.1169)
Ln(1 + tariffji,t) -0.4081*** -0.4116*** -0.3824*** -0.3832*** -0.3201*** -0.3496*** -0.1264** -0.1361** -0.1310* -0.1407**
(0.0883) (0.0888) (0.1008) (0.0839) (0.1286) (0.1339) (0.0634) (0.0622) (0.0722) (0.0684)
Ln distij -1.5199*** -1.5297*** -2.7729*** -2.7365*** -2.6195*** -2.7295*** -1.6911*** -1.6914*** -1.7259*** -1.7261***
(0.1901) (0.1870) (0.4369) (0.3592) (0.3459) (0.3511) (0.1351) (0.1357) (0.1318)
langij 0.1574 0.1796 0.8255*** 1.0013*** 1.0179*** 1.0263*** 0.5935*** 0.5890*** 0.6130*** 0.6129***
(0.1391) (0.1243) (0.2954) (0.2185) (0.3128) (0.2881) (0.1119) (0.1088) (0.1217) (0.1180)
borderij 0.7671*** 0.7810*** 1.3295*** 1.2305*** 0.5277* 0.5752** 0.6572*** 0.6601*** 0.6525*** 0.6551***
(0.1191) (0.1187) (0.3862) (0.2324) (0.0793) (0.0751) (0.0812) (0.0793) (0.0816) (0.0794)
Sector-FE Yes No Yes No Yes No Yes No Yes No
Exporter-time-FE Yes No Yes No Yes No Yes No Yes No
Importer-time-FE Yes No Yes No Yes No Yes No Yes No
Exporter-sector-time-FE No Yes No Yes No Yes No Yes No Yes
Importer-sector-time-FE No Yes No Yes No Yes No Yes No Yes
R20.935 0.9482 0.541 0.9434 0.983 0.9740 0.946 0.9514 0.949 0.9545
Observations 6336 6257 6700 6537 1952 1952 13000 12925 10120 10120
Chi-2 630.98*** 194.35*** 1481.19!*** 884.04*** 875.01***
Notes: he dependent variable is nominal bilateral food product from i to j at to t in sector k as in equation (1.3). Regressions 2, 4, 6, 10 are performed using
the ppmlhdfe STATA command written by Correia, Guimarães, Zylkin (2019). Exporter-importer controls are the GDP of both countries. Standard errors are
reported in parentheses and clustered by country-pair level. *, **, *** denote significance at the 10% 5% and 1% level respectively.

Appendix B
Appendix of Chapter 2
Table B.1: List of countries: OECD, emerging and Africa countries
OECD countries Emerging countries Africa countriesAsutralia Argentina Egypt
Austria Brazil Morocco
Belgium China South Africa
Canada Colombia Tunisia
Chile India
Czech Republic Indonesia
Denmark Malaysia
Estonia Russia
Finland South Africa
France Thailand
Germany
Greece
Hungary
Iceland
Ireland
Israel
Italy
Japan
Korea
Latvia
Lithuania
Luxembourg
Mexico
Netherlands
New Zealand
Norway
Poland
Portugal
Slovak Republic
Slovenia
Spain
Sweden
Switzerland
Turkey
United Kingdom
United States

180Appendix
B.Appendix
ofChapter
2
Table B.2: Variable description and sources
Variables Description Source
FDIij,t Aggregate bilateral greeneld investments OECD.stat
RTAij,t Is a dummy that indicates whether both countries
have a trade agreement in force WTO (RTA-IS)
BITij,t Is a dummy that indicates whether both countries
have an investment agreement in force UNCTADinvestment
borderij Takes the value 1 when countries share
a common border, and 0 otherwise CEPII
langij Takes the value 1 when countries share
a common language CEPII
colonial linksij Takes the value 1 when two countries share
colonial links and 0 otherwise CEPII
Distanceij Distance in kilometers between country capitals CEPII
FDI RI Globalj,t Overall FDI Regulatory Restrictiveness Index of OECD
captures the level of restrictiveness in FDI on all sectors in the host country OECD.stat
FDI RI Primaryj,t FDI Regulatory Restrictiveness Index of OECD
captures the level of restrictiveness in FDI on manufacturing sector in the host country OECD.stat
FDI RI Secondaryj,t FDI Regulatory Restrictiveness Index of OECD
captures the level of restrictiveness in FDI on secondary sector in the host country OECD.stat
FDI RI Tertiaryj,t FDI Regulatory Restrictiveness Index of OECD
captures the level of restrictiveness in FDI on tertiary sector in the host country OECD.stat
GDPi,t Home country GDP (constant 2010 US) World Bank database
GDPj,t Host country GDP (constant 2010 US) World Bank database
Trade openessj,t Sum of destination country’s imports and exports normalized by GDP World Bank database
Regul qualityj,t Index that captures the ability of the government of the host
country to formulate and implement sound policies and regulations World Governance indicators
Productivityj,t Labour productivity measured by GDP per hour worked (U.S dollars) OECD.stat
Tax burdenj,t Measures the tax burden imposed by the government of host country Heritage Foundation
Labour freedomj,t Index that measures the legal and regulatory framework
of a host country’s labour market Heritage Foundation
Educationj,t Index that measures the average years of schooling in host country Penn World database

181
Table B.3: Descriptive statistics
Variables obs. Mean Std. Dev. Min Max
Bilateral FDIFDIij,t 21,960 7345.433 44071.73 0 1056271
Traditional variables of the gravity modelBITij,t 21,960 0.5297814 0.4991236 0 1
RTAij,t 21,960 0.6142077 0.486793 0 1
borderij 21,960 0.0441712 0.20548 0 1
langij 21,960 0.0619308 0.2410353 0 1
colonial linksij 21,960 0.0350638 0.1839452 0 1
Ln distanceij 21,960 3.613527 0.4664477 1.775372 4.29195
Ln GDPj,t 21,960 11.65486 0.6676412 10.1362 13.26245
Ln GDPi,t 21,960 10.85451 2.929926 1.011451 13.26245
Host country specific characteristicsRegul qualityj,t 21,960 0.9679318 0.739656 -1.074257 2.088636
FDI determinants in Host countryProductivityj,t 21,959 7476.289 15497.5 19.43301 59390.48
Tax burdenj,t 21,960 68.28214 12.28882 35.9 93.6
Labour freedomj,t 21,960 62.14343 14.75172 21.7 98.5
Educationj,t 21,864 3.165414 0.4624206 1.750288 3.89154
Educationi,t 21,760 3.121759 0.5139138 1.750288 3.89154
Trade openessj,t 21,864 0.9518639 0.6097027 0.2248623 4.08362
FDI Regulatory Restrictiveness IndexFDI RI Globalj,t 21,960 0.089699 0.0878699 0.004 0.435
FDI RI Primaryj,t 21,960 0.1192143 0.1168962 0 0.495
FDI RI Secondaryj,t 21,960 0.0403809 0.0612678 0 0.295
FDI RI Tertiaryj,t 21,960 0.1095849 0.1073558 0.007 0.506

182Appendix
B.Appendix
ofChapter
2
Table B.4: Cross-correlation table
Variables FDI BIT RTA border lang colonial Ln dis Product Tax Labour Regul Ln Ln FDI RI FDI Pri FDI Secon FDI Tert Educa Educa Trade
links tance ivity burden freedom quality GDPj GDPi Global mary dary iary tioni tionj openess
FDI 1.000
BIT -0.039 1.000
RTA -0.015 0.290 1.000
border 0.110 0.096 0.105 1.000
lang 0.150 -0.097 -0.008 0.202 1.000
colonial links 0.105 0.006 -0.016 0.224 0.269 1.000
Ln distance -0.105 -0.428 -0.527 -0.393 -0.048 -0.088 1.000
Productivity -0.052 -0.059 -0.250 -0.044 -0.002 0.017 0.199 1.000
Tax burden -0.063 -0.070 -0.105 -0.056 -0.041 -0.015 0.142 0.320 1.000
Labor freedom 0.068 -0.157 -0.159 -0.032 0.077 0.004 0.144 -0.130 0.017 1.000
Regulatory quality 0.069 0.018 0.162 0.051 0.034 -0.004 -0.137 -0.705 -0.339 0.296 1.000
Ln GDPj 0.124 -0.056 -0.237 0.019 0.069 0.053 0.173 0.047 -0.244 0.176 -0.044 1.000
Ln GDPi 0.002 -0.027 -0.108 -0.009 0.020 0.013 0.065 0.127 0.050 -0.034 -0.122 -0.015 1.000
FDI RI Overal -0.042 -0.166 -0.316 -0.076 0.018 -0.025 0.311 0.390 0.272 0.136 -0.391 0.227 0.073 1.000
FDI RI Primary -0.005 -0.146 -0.255 -0.077 0.021 -0.011 0.307 0.264 0.141 0.122 -0.288 0.277 0.054 0.886 1.000
FDI RI Secondary -0.040 -0.151 -0.241 -0.051 0.026 -0.028 0.254 0.192 0.160 0.226 -0.180 0.070 0.036 0.841 0.694 1.000
FDI RI Tertiary -0.052 -0.154 -0.332 -0.076 0.013 -0.025 0.298 0.469 0.341 0.100 -0.467 0.237 0.083 0.970 0.801 0.743 1.000
Educationi 0.112 0.024 0.128 0.066 0.021 -0.003 -0.180 0.181 0.066 -0.035 -0.155 0.014 -0.025 0.102 0.081 0.055 0.117 1.000
Educationj 0.082 0.035 0.045 0.082 -0.014 0.012 -0.147 -0.463 -0.223 0.354 0.665 0.028 -0.132 -0.326 -0.302 -0.119 -0.375 -0.127 1.000
Trade openess 0.049 0.170 0.196 0.044 0.011 -0.041 -0.270 -0.239 0.043 -0.060 0.289 -0.529 -0.061 -0.303 -0.290 -0.232 -0.294 -0.050 0.232 1.000

183Table B.5: Splitting the time into two sub-periods (continued): 2010-2014
Specification PPML EstimateDependant variable
FDIij,tGDPdeflatorij,t
2010-2014OECD OECD vs OECD vs
Emerging AfricaModel (1) (2) (3) (4) (5) (6) (7) (8) (9) (10) (11) (12)
FDI RI Globalj,t−1 -0.8035 -2.9042*** 1.7913
(1.5949) (0.8700) (3.6596)
FDI RI Primaryj,t−1 0.0044 -2.4616*** -1.4672
(0.8509) (0.7176) (3.3615)
FDI RI Secondaryj,t−1 -2.6420 -2.3422** 11.0598*
(1.6668) (1.1919) (6.4950)
FDI RI Tertiaryj,t−1 -1.1087 -2.6442*** 1.3884
(1.4766) (0.7351) (3.0024)
OECD dumj ∗ FDI RI Globalj,t−1 2.6453 -2.6827
(1.9471) (4.2966)
OECD dumj ∗ FDI RI Primaryj,t−1 2.5668** 1.5468
(1.0440) (3.4361)
OECD dumj ∗ FDI RI Secondaryj,t−1 0.2670 -13.8955**
(2.1579) (6.8324)
OECD dumj ∗ FDI RI Tertiaryj,t−1 2.2358 -2.4663
(1.7983) (3.5851)
R20.7646 0.7645 0.7654 0.7647 0.7692 0.7693 0.7689 0.7695 0.7740 0.7739 0.7752 0.7741
Observations 6161 6161 6161 6161 9679 9679 9679 9679 7568 7568 7568 7568
Notes: The dependent variable is bilateral FDI stocks. For space reasons, the results of the other control variables are omitted and the estimations include
both country and time fixed effects. Standard errors are reported in parentheses and clustered by country-pair level. *, **, *** denote significance at the 10%
5% and 1% level respectively.

184Appendix
B.Appendix
ofChapter
2Table B.6: Splitting the time into two sub-periods (continued): 2015-2019
Specification PPML EstimateDependant variable
FDIij,tGDPdeflatorij,t
2015-2019OECD OECD vs OECD vs
Emerging AfricaModel (1) (2) (3) (4) (5) (6) (7) (8) (9) (10) (11) (12)
FDI RI Globalj,t−1 -0.6455** -2.9875*** -1.1660
(0.2530) (1.0427) (4.3533)
FDI RI Primaryj,t−1 0.2143 -1.9664** -1.7187
(0.1394) (0.8713) (2.5014)
FDI RI Secondaryj,t−1 -0.6751** -3.6110*** 8.0324
(0.2847) (1.3830) (8.1735)
FDI RI Tertiaryj,t−1 -0.8726*** -2.4465*** -1.7553
(0.2180) (0.8774) (3.9527)
OECD dumj ∗ FDI RI Globalj,t−1 1.4609 -0.8639
(2.2472) (5.2328)
OECD dumj ∗ FDI RI Primaryj,t−1 3.4158*** 3.1809
(1.1541) (2.7398)
OECD dumj ∗ FDI RI Secondaryj,t−1 2.3114 -9.9196
(2.3449) (8.6866)
OECD dumj ∗ FDI RI Tertiaryj,t−1 -0.6981 -1.9940
(1.9666) (4.7030)
R20.9522 0.9521 0.9522 0.9523 0.8342 0.8344 0.8338 0.8357 0.8398 0.8404 0.8398 0.8417
Observations 6230 6230 6230 6230 9770 9770 9770 9770 7645 7645 7645 7645
Notes: The dependent variable is bilateral FDI stocks. For space reasons, the results of the other control variables are omitted and the estimations include
both country and time fixed effects. Standard errors are reported in parentheses and clustered by country-pair level. *, **, *** denote significance at the 10%
5% and 1% level respectively.

185
Table B.7: The Impacts of restrictive measures on FDI stocks: OECD vs. BRICS and others
emerging countries
Specification PPML EstimateBRICS countries Emerging excluding BRICS
Model (1) (2) (3) (4) (5) (6) (7) (8)
FDI RI Globalj,t−1 -3.6988∗∗∗
-0.5836
(1.0036) (1.4247)
FDI RI Primaryj,t−1 -2.5263∗∗∗
-0.3120
(0.8008) (1.1461)
FDI RI Secondaryj,t−1 -3.4788∗∗∗
-0.1522
(1.2470) (3.2038)
FDI RI Tertiaryj,t−1 -3.3924∗∗∗
-0.4613
(0.8787) (1.0990)
OECD dumj ∗ FDI RI Globalj,t−1 2.5939 -1.0063
(1.9748) (2.3426)
OECD dumj ∗ FDI RI Primaryj,t−1 3.4919∗∗∗
1.1969
(1.0356) (1.3935)
OECD dumj ∗ FDI RI Secondaryj,t−1 1.8378 -1.8887
(2.0256) (3.7328)
OECD dumj ∗ FDI RI Tertiaryj,t−1 1.1257 -2.3157
(1.8107) (2.0006)
OECD dumj 1.1180∗
1.0801∗
1.6544∗∗
0.9982∗
2.7841∗∗∗
2.5764∗∗∗
2.7809∗∗∗
2.7468∗∗∗
(0.6439) (0.6379) (0.7930) (0.5878) (0.8244) (0.8213) (0.8495) (0.7731)
Ln FDIij,t−1 0.1003∗∗
0.0998∗∗
0.1057∗∗
0.0989∗∗
0.0955∗
0.0949∗
0.0962∗∗
0.0951∗∗
(0.0479) (0.0488) (0.0478) (0.0462) (0.0490) (0.0502) (0.0487) (0.0472)
Ln distanceij,t−1 -1.1124∗∗∗
-1.1687∗∗∗
-1.1137∗∗∗
-1.0909∗∗∗
-1.1058∗∗∗
-1.1821∗∗∗
-1.1226∗∗∗
-1.0782∗∗∗
(0.1413) (0.1469) (0.1435) (0.1446) (0.1519) (0.1577) (0.1539) (0.1569)
Common borderij,t−1 -0.4245∗∗∗
-0.4526∗∗∗
-0.4156∗∗∗
-0.3928∗∗∗
-0.4216∗∗∗
-0.4687∗∗∗
-0.4247∗∗∗
-0.3811∗∗
(0.1530) (0.1550) (0.1515) (0.1498) (0.1590) (0.1609) (0.1565) (0.1552)
Common langij,t−1 0.2685∗
0.2329 0.2697∗
0.2911∗∗
0.2776∗
0.2391 0.2820∗
0.2965∗∗
(0.1515) (0.1556) (0.1519) (0.1466) (0.1528) (0.1587) (0.1548) (0.1480)
Colonial linksij,t−1 0.3781∗∗
0.3738∗∗
0.3744∗∗
0.3540∗∗
0.3791∗∗
0.3748∗∗
0.3725∗∗
0.3523∗∗
(0.1569) (0.1588) (0.1545) (0.1542) (0.1592) (0.1614) (0.1570) (0.1565)
BITij,t−1 -0.3301∗
-0.3219∗
-0.3519∗∗
-0.3940∗∗
-0.3570∗
-0.3211∗
-0.3696∗
-0.4417∗∗
(0.1831) (0.1728) (0.1785) (0.1923) (0.2012) (0.1874) (0.1966) (0.2128)
RTAij,t−1 0.3362∗∗
0.2882∗
0.3359∗∗
0.3603∗∗
0.3958∗∗
0.3274∗∗
0.3906∗∗
0.4289∗∗
(0.1495) (0.1476) (0.1541) (0.1584) (0.1618) (0.1551) (0.1651) (0.1743)
Ln GDPi,t−1 -0.0899 -0.1078 -0.1060 -0.0668 -0.1296 -0.1495∗
-0.1290 -0.0988
(0.0837) (0.0786) (0.0880) (0.0810) (0.0933) (0.0870) (0.0910) (0.0895)
Ln GDPj,t−1 2.4323∗∗∗
2.4014∗∗∗
2.3799∗∗∗
2.3865∗∗∗
2.4128∗∗∗
2.4074∗∗∗
2.3869∗∗∗
2.3555∗∗∗
(0.1325) (0.1382) (0.1321) (0.1310) (0.1402) (0.1478) (0.1400) (0.1381)
Trade opennessj,t−1 1.4381∗∗∗
1.4759∗∗∗
1.4139∗∗∗
1.3941∗∗∗
1.4125∗∗∗
1.4669∗∗∗
1.4174∗∗∗
1.3649∗∗∗
(0.1160) (0.1164) (0.1164) (0.1156) (0.1187) (0.1196) (0.1195) (0.1176)
Regulatory qualityj,t−1 0.1869∗∗∗
0.1940∗∗∗
0.1941∗∗∗
0.1820∗∗∗
0.1597∗∗
0.1570∗∗
0.1668∗∗
0.1587∗∗
(0.0673) (0.0663) (0.0671) (0.0668) (0.0661) (0.0650) (0.0660) (0.0653)
Regulatory qualityj,t−1 0.1869∗∗∗
0.1940∗∗∗
0.1941∗∗∗
0.1820∗∗∗
0.1597∗∗
0.1570∗∗
0.1668∗∗
0.1587∗∗
(0.0673) (0.0663) (0.0671) (0.0668) (0.0661) (0.0650) (0.0660) (0.0653)
Ln productivityj,t−1 0.6638∗∗∗
0.6636∗∗∗
0.7136∗∗∗
0.6291∗∗∗
0.8445∗∗∗
0.8415∗∗∗
0.8257∗∗∗
0.7738∗∗∗
(0.2233) (0.2121) (0.2701) (0.2076) (0.3029) (0.2768) (0.3045) (0.2956)
Ln tax burdenj,t−1 -0.2544 -0.5505 -0.2974 0.0501 -0.0828 -0.4093 -0.1988 0.2111
(0.6799) (0.7124) (0.7118) (0.6783) (0.7308) (0.7681) (0.7555) (0.7257)
HCDij,t−1 -0.4411 -0.4441 -0.8780 -0.4459 0.0522 0.0046 -0.0536 -0.0699
(1.2010) (1.2021) (1.1987) (1.1991) (1.4662) (1.4609) (1.4588) (1.4752)
Ln labor freedomj,t−1 2.5584∗∗∗
2.4446∗∗∗
2.5430∗∗∗
2.6364∗∗∗
2.6242∗∗∗
2.4776∗∗∗
2.6600∗∗∗
2.7083∗∗∗
(0.5395) (0.5204) (0.5407) (0.5435) (0.5673) (0.5444) (0.5654) (0.5718)
R20.7938 0.7936 0.7932 0.7950 0.8041 0.8041 0.8042 0.8052
Observations 16627 16627 16627 16627 16275 16275 16275 16275
Notes: The dependent variable is bilateral FDI stocks. Columns (1) to (4) represent the results of the impact
of FDI restrictiveness index on cross border investment between OECD and BRICS countries and (5) to (8) the
results on FDI among OECD and emerging excluding BRICS countries. All regressions include both country
and time fixed effects. Standard errors are reported in parentheses and clustered by country pair level. *, **, ***
denote significance at the 10% 5% and 1% level respectively.

186Appendix
B.Appendix
ofChapter
2
Table B.8: The impact of FDI restrictions in the services sector on FDI stocks: Intra-OECD
Specification PPML EstimateDependant variable
FDIij,tGDPdeflatorij,t
Tertiary Overall financial Business Disaggregated financialsector sector sector sector
Banking Insurance Otherfinance
FDI RI STRI FDI RI STRI FDI RI STRI FDI RI STRI FDI RI STRI FDI RI
Model (1) (2) (3) (4) (5) (6) (7) (8) (9) (10) (11)
RI Tertiaryj,t−1 -1.5445*** -1.7513***
(0.4171) (0.4302)
RI Financialj,t−1 -0.2896 -0.2154
(0.5813) (0.2762)
RI Businessj,t−1 -1.3532*** -1.1480***
(0.3224) (0.2816)
RI Bankingj,t−1 0.0475 0.0538
(0.3788) (0.4581)
RI Insurancej,t−1 0.3112 -0.1989
(0.5472) (0.2085)
FDI RI Other financej,t−1 -1.2082**
(0.5260)
R20.9311 0.9523 0.9306 0.9521 0.9316 0.9523 0.9306 0.9306 0.9306 0.9521 0.8377
Observations 7490 6230 7490 6230 7490 6230 7490 7490 7490 6230 12391
Notes: The dependent variable is bilateral FDI stocks. Column (1) and (2) represent the effects of FDI restrictions in the services sector on bilateral FDI
using the two indexes (FDI RI and STRI). Column (3) and (4) show the results of the impact of global financial sector restrictiveness indexes on cross-border
investment (FDI RI and STRI) and (5)-(6) the impacts of FDI restrictions in business sector (FDI RI and STRI). (7) to (11) the impacts of disaggregated financial
sector. For space reasons, the results of the other control variables are omitted. All regressions include both country and time fixed effects. STRI in the
financial sector includes banking and insurance. Standard errors are reported in parentheses and clustered by country- pair level. *, **, *** denote significance
at the 10% 5% and 1% level respectively.

187
Table B.9: The Impact of FDI restrictive measures in the agricultural and manufacturing sec-
tors on FDI stocks: OECD vs. emerging countries
Total Emerging countries BRICS countriesBaseline Sectoral FDI RI Baseline Sectoral FDI RI
Model (1) (2) (3) (4) (5) (6) (7) (8)
FDI RI Primaryj,t−1 -2.0281∗∗∗
-2.5263∗∗∗
(0.7121) (0.8008)
FDI RI Secondaryj,t−1 -2.9298∗∗
-3.4788∗∗∗
(1.1595) (1.2470)
FDI RI Agriculturej,t−1 -0.7443 -0.2949
(0.5993) (0.8292)
FDI RI Manufacturingj,t−1 -2.7421∗∗
-4.7903∗∗∗
(1.2997) (1.5484)
OECD dumj ∗ FDI RI Primaryj,t−1 2.9714∗∗∗
3.4919∗∗∗
(0.9868) (1.0356)
OECD dumj ∗ FDI RI Secondaryj,t−1 1.4257 1.8378
(1.9882) (2.0256)
OECD dumj ∗ FDI RI Agriculturej,t−1 -0.3501 -0.7999
(0.9768) (1.1046)
OECD dumj ∗ FDI RI Manufacturingj,t−1 3.3403 5.2760∗∗
(2.1408) (2.3046)
OECD dumj 1.5349∗∗∗
2.0036∗∗∗
2.3798∗∗∗
2.2267∗∗∗
1.0801∗
1.6544∗∗
2.3161∗∗
1.8287∗∗
(0.5476) (0.6000) (0.6674) (0.6702) (0.6379) (0.7930) (1.0030) (0.8650)
Ln FDIij,t−1 0.1026∗∗
0.1070∗∗
0.1067∗∗
0.1077∗∗
0.0998∗∗
0.1057∗∗
0.1077∗∗
0.1051∗∗
(0.0490) (0.0480) (0.0494) (0.0491) (0.0488) (0.0478) (0.0495) (0.0489)
Ln distanceij,t−1 -1.1832∗∗∗
-1.1335∗∗∗
-1.0737∗∗∗
-1.1571∗∗∗
-1.1687∗∗∗
-1.1137∗∗∗
-1.0611∗∗∗
-1.1340∗∗∗
(0.1430) (0.1393) (0.1400) (0.1378) (0.1469) (0.1435) (0.1440) (0.1414)
Common borderij,t−1 -0.4733∗∗∗
-0.4400∗∗∗
-0.4142∗∗∗
-0.4733∗∗∗
-0.4526∗∗∗
-0.4156∗∗∗
-0.3966∗∗
-0.4446∗∗∗
(0.1526) (0.1494) (0.1567) (0.1551) (0.1550) (0.1515) (0.1590) (0.1570)
Common langij,t−1 0.2537∗
0.2883∗
0.2719∗
0.2625∗
0.2329 0.2697∗
0.2560∗
0.2371
(0.1538) (0.1510) (0.1519) (0.1552) (0.1556) (0.1519) (0.1531) (0.1569)
Colonial linksij,t−1 0.3724∗∗
0.3730∗∗
0.4156∗∗∗
0.3885∗∗
0.3738∗∗
0.3744∗∗
0.4166∗∗∗
0.3907∗∗
(0.1588) (0.1550) (0.1501) (0.1604) (0.1588) (0.1545) (0.1512) (0.1597)
BITij,t−1 -0.3312∗∗
-0.3560∗∗
-0.3306∗
-0.3217∗
-0.3219∗
-0.3519∗∗
-0.3287∗
-0.3019∗
(0.1688) (0.1741) (0.1696) (0.1695) (0.1728) (0.1785) (0.1738) (0.1733)
RTAij,t−1 0.2911∗∗
0.3343∗∗
0.3615∗∗
0.3038∗∗
0.2882∗
0.3359∗∗
0.3557∗∗
0.3034∗∗
(0.1433) (0.1491) (0.1501) (0.1444) (0.1476) (0.1541) (0.1557) (0.1481)
Ln GDPi,t−1 -0.1292∗
-0.1278∗
-0.1340∗
-0.1491∗∗
-0.1078 -0.1060 -0.1224 -0.1381
(0.0669) (0.0689) (0.0738) (0.0742) (0.0786) (0.0880) (0.1027) (0.0936)
Ln GDPj,t−1 2.3949∗∗∗
2.3809∗∗∗
2.3437∗∗∗
2.4117∗∗∗
2.4014∗∗∗
2.3799∗∗∗
2.3381∗∗∗
2.4161∗∗∗
(0.1319) (0.1268) (0.1248) (0.1286) (0.1382) (0.1321) (0.1315) (0.1318)
Trade opennessj,t−1 1.4541∗∗∗
1.3993∗∗∗
1.3733∗∗∗
1.4183∗∗∗
1.4759∗∗∗
1.4139∗∗∗
1.3789∗∗∗
1.4358∗∗∗
(0.1152) (0.1149) (0.1144) (0.1157) (0.1164) (0.1164) (0.1185) (0.1171)
Regulatory qualityj,t−1 0.1719∗∗∗
0.1715∗∗∗
0.1537∗∗
0.1575∗∗
0.1940∗∗∗
0.1941∗∗∗
0.1678∗∗∗
0.1796∗∗∗
(0.0638) (0.0649) (0.0633) (0.0647) (0.0663) (0.0671) (0.0645) (0.0668)
Ln productivityj,t−1 0.7376∗∗∗
0.7752∗∗∗
0.8211∗∗∗
0.8252∗∗∗
0.6636∗∗∗
0.7136∗∗∗
0.7924∗∗
0.8001∗∗∗
(0.1731) (0.2013) (0.2299) (0.2218) (0.2121) (0.2701) (0.3378) (0.2932)
Ln tax burdenj,t−1 -0.4863 -0.2571 -0.2734 -0.3513 -0.5505 -0.2974 -0.2948 -0.3569
(0.7052) (0.6988) (0.7175) (0.7177) (0.7124) (0.7118) (0.7441) (0.7305)
HCDij,t−1 -0.4359 -0.7512 -0.5557 -0.6742 -0.4441 -0.8780 -0.6868 -0.8459
(1.1496) (1.1487) (1.1727) (1.1729) (1.2021) (1.1987) (1.2478) (1.2232)
Ln labor freedomj,t−1 2.3065∗∗∗
2.4131∗∗∗
2.1618∗∗∗
2.2691∗∗∗
2.4446∗∗∗
2.5430∗∗∗
2.2268∗∗∗
2.4126∗∗∗
(0.5141) (0.5344) (0.5327) (0.5222) (0.5204) (0.5407) (0.5405) (0.5256)
R20.7992 0.7989 0.7985 0.7982 0.7936 0.7932 0.7923 0.7928
Observations 19449 19449 19449 19449 16627 16627 16627 16627
Notes: The dependent variable is bilateral FDI stocks. Columns (1) to (4) represent the results of the impact on
total emerging countries and (5) to (8) the results on BRICS countries . All regressions include both country and
time fixed effects. Standard errors are reported in parentheses and clustered by country-pair level.*, **, *** denote
significance at the 10% 5% and 1% level respectively.

188 Appendix B. Appendix of Chapter 2
Table B.10: The Impact of FDI restrictive measures in the agriculuture and mining sectors on
FDI stocks: OECD vs. African countries
Specification PPML EstimateDependant variable
FDIij,tGDPdeflatorij,t
Years 2010-2019Baseline Sectoral FDI RI Baseline Sectoral FDI RI
Model (1) (2) (3) (4) (5) (6)
FDI RI Primaryj,t−1 -1.7933 -1.4645
(2.7210) (2.6931)
FDI RI Agriculturej,t−1 -1.5426 -1.3464
(2.1777) (2.1032)
FDI RI Mining Quarryingj,t−1 -35.3048∗∗
-30.6203∗∗∗
(13.7942) (11.6918)
OECD dumj ∗ FDI RI Primaryj,t−1 2.7402 2.4152
(2.8935) (2.8643)
OECD dumj ∗ FDI RI Agriculturej,t−1 0.2821 0.1228
(2.3552) (2.2759)
OECD dumj ∗ FDI RI Mining Quarryingj,t−1 33.8347∗∗
29.0494∗∗
(13.9026) (11.7729)
OECD dumj 1.8211∗
1.7866 1.6747 1.0080∗∗
1.0890∗∗
0.8699∗
(1.0318) (1.0909) (1.0543) (0.4575) (0.4797) (0.4469)
Ln FDIij,t−1 0.0975∗
0.0949∗
0.0988∗∗
0.1959∗∗∗
0.1947∗∗∗
0.1972∗∗∗
(0.0501) (0.0498) (0.0485) (0.0471) (0.0467) (0.0455)
Ln distanceij,t−1 -1.1746∗∗∗
-1.0699∗∗∗
-1.0983∗∗∗
-1.1498∗∗∗
-1.0455∗∗∗
-1.0729∗∗∗
(0.1611) (0.1592) (0.1541) (0.1557) (0.1532) (0.1484)
Common borderij,t−1 -0.4484∗∗∗
-0.4091∗∗
-0.3844∗∗
-0.4416∗∗∗
-0.3989∗∗
-0.3743∗∗
(0.1631) (0.1652) (0.1570) (0.1636) (0.1654) (0.1551)
Common langij,t−1 0.2143 0.2463 0.2411 0.2302 0.2601∗
0.2597∗
(0.1590) (0.1557) (0.1537) (0.1591) (0.1559) (0.1528)
Colonial linksij,t−1 0.3776∗∗
0.4088∗∗∗
0.3821∗∗
0.3767∗∗
0.4088∗∗∗
0.3791∗∗
(0.1604) (0.1520) (0.1559) (0.1622) (0.1541) (0.1552)
BITij,t−1 -0.3073 -0.2894 -0.3270∗
-0.3237∗
-0.3047 -0.3433∗
(0.1903) (0.1928) (0.1905) (0.1890) (0.1910) (0.1876)
RTAij,t−1 0.3066∗∗
0.3955∗∗
0.3376∗∗
0.3327∗∗
0.4189∗∗∗
0.3613∗∗
(0.1560) (0.1676) (0.1664) (0.1485) (0.1580) (0.1592)
Ln GDPi,t−1 0.1096 0.1295 0.1066 0.2211∗∗∗
0.2236∗∗∗
0.2212∗∗∗
(0.1060) (0.1129) (0.1100) (0.0309) (0.0314) (0.0309)
Ln GDPj,t−1 2.4029∗∗∗
2.4414∗∗∗
2.4611∗∗∗
2.4308∗∗∗
2.4607∗∗∗
2.4935∗∗∗
(0.1544) (0.1507) (0.1605) (0.1466) (0.1442) (0.1541)
Trade opennessj,t−1 1.4696∗∗∗
1.4521∗∗∗
1.4526∗∗∗
1.5170∗∗∗
1.4914∗∗∗
1.5015∗∗∗
(0.1237) (0.1258) (0.1270) (0.1128) (0.1144) (0.1156)
Regulatory qualityj,t−1 0.1593∗∗
0.1318∗∗
0.1550∗∗
0.1601∗∗
0.1324∗∗
0.1561∗∗
(0.0663) (0.0646) (0.0654) (0.0633) (0.0630) (0.0627)
Ln productivityj,t−1 0.8586∗∗
0.7436∗∗
0.8481∗∗
0.5842∗∗∗
0.5108∗∗∗
0.5630∗∗∗
(0.3456) (0.3786) (0.3641) (0.1444) (0.1577) (0.1491)
Ln tax burdenj,t−1 -0.3721 -0.3073 -0.1461 -0.4222 -0.3260 -0.1814
(0.7968) (0.8071) (0.7641) (0.7418) (0.7493) (0.7109)
HCDij,t−1 -0.1689 0.1813 -0.1272 -0.6342 -0.2537 -0.5453
(1.5313) (1.5170) (1.5073) (1.5437) (1.5211) (1.5102)
Ln labor freedomj,t−1 2.4726∗∗∗
2.3810∗∗∗
2.6912∗∗∗
2.3632∗∗∗
2.2692∗∗∗
2.5914∗∗∗
(0.5549) (0.5712) (0.5914) (0.5301) (0.5566) (0.5638)
Time− FE Yes Yes Yes No No No
Country − FE Yes Yes Yes Yes Yes Yes
R20.8040 0.8044 0.8042 0.7956 0.7960 0.7958
Observations 15213 15213 15213 15213 15213 15213
Notes: The dependent variable is bilateral FDI stocks. Standard errors are reported respectively at the 10%
in parentheses and clustered by country- pair level. *, **, *** denote significance at the 10% 5% and 1% level
respectively.

Appendix C
Appendix of Chapter 3
C.1 GTAP model: desciption
To evaluate the impact of AfCFTA on intra-Africa trade, we use a GTAP model. It is a multi-
region, multi-sector, multifactor model, and a computable general equilibrium model with
the assumptions of perfect competition and Constant Returns to Scale (CRS) of production.
Production in each sector and each region is represented by a nested Constant Elasticity of
Substitution (CES) function. The model incorporates the Armington assumptions that each
firm uses a CES composite of domestically produced and imported intermediate goods in fixed
proportions with a value-added CES composite, based on five endowed factors of production
(land, natural resources, unskilled-skilled labor, and capital).
In detail, production generates income accruing to the regional household and then spent
on three sources of final demand: private expenditures, government spending, and savings,
which subsequently translate into investment spending. Each source of spending, as well as
purchases of intermediate goods, comprises both domestic and imported purchases, thereby
generating both domestic and export sales by firms (see Figure C.1). On the demand side, total
income is allocated using fixed value shares across government household and savings expen-
ditures. The household maximizes a Constant Difference Elasticity (CDE) objective function,
which is calibrated to differing income and price elasticities of demand in each region and
allows a detailed description of final demand. In each case, consumption is a CES composite
of locally produced and imported goods. The production (a) combines a set of intermediate
goods and factors to produce output. Similar to many CGEmodels, the production structure is
based on a sequence of nested Constant Elasticity of Substitution (CES) functions that aim to
reproduce the substitution possibilities across the full set of inputs. Figure C.2 describes this
process and identifies 3 nests. The first top-level nest is composed of two aggregate compos-
ite bundles - intermediate demand and value added (the key substitution elasticity is ESUBT,
typically assumed to be zero). The second-level nests decompose each of the two aggregate
nests into their components - the demand for individual intermediate goods c (at the Arming-

190 Appendix C. Appendix of Chapter 3
ton level, key substitution elasticity is ESUBC whose default value is 0) and the demand for
individual factors.1A final nest decomposes the demand for the composite good into domestic
and imported components. The key substitution elasticity is ESUBD the so-called (top-level)
Armington elasticity that determines the degree of substitutability between domestic and im-
ported goods.
Innovative aspects of this model include: the treatment of private household preferences us-
ing the non-homothetic Constant Difference of Elasticities (CDE) functional form, an explicit
treatment of international trade and transport margins, and global banking sector which inter-
mediates between global savings and consumption. The GTAP Model also gives users a wide
range of closure options, including unemployment, tax revenue replacement and fixed trade
balance closures, and a selection of partial equilibrium closures (which facilitate comparison
of results to studies based on partial equilibrium assumptions (Hertel and Tsigas, 1998).
In the GTAP model, a fundamental element is the closure of the model, i.e., defining the en-
dogenous and exogenous variables of the model. We decide to use two microeconomic clo-
sures: first, a closure based on the neoclassical approach - fixing the capital stock (exogenous)
and allowing the rate of return on capital to adjust (endogenous factors). This type of closure
is interpreted as representing the short term (John .P , 2001).2Indeed in all of the small coun-
tries regions (i.e., developing countries), the inputs to capital creation are import-intensive and
subject to large tariffs. Therefore, in these regions, the removal of tariffs due to AfCFTA tends
to reduce the capital costs, and thus the capital rent, relative to the general price of output
(Adams et al., 1997). The second is a model for an analysis of long-run effects (see, Walmsley,
1998). Here, the rate of return on capital is fixed exogenously and the level of the capital stock
is adjusted (Francois et al., 1996, see Table C.13). In this closure, percentage changes in capital
stocks are equated to percentage changes in investment (where EXPAND(”capital”, r)3 is
exogenously equal to 0).
EXPAND(i, r) = qcgds(r)− qo(i, r) (C.1)
1The key substitution elasticity is ESUBVA which is differentiated by activity a and region r (although the
default is that this is region generic).
2The period considered is not long enough for new investments to come online as productive capital.
3Note that although written in upper case, EXPAND(”capital”, r) is a percentage change variable.

C.1. GTAP model: desciption 191
Where: i = "capital", r=country
As a result, investment (qcgds(r)) and capital stocks (kb(r)) change by the same amount.
Thus the percentage change, in the solution period, of the growth rate of capital equals zero
and the growth rate of capital in each region returns to that rate which prevailed prior to the
shock. When the initial database is a grow-less steady state, the growth rate of capital returns
to a rate of zero percent. The result is a change in the steady state levels of capital and income
(Walmsley, 1998). The long run approach is defined as that period of time long enough for
capital stocks to have adjusted to the shock and be available for production in the region.
For the macroclosure, we apply the methodology developed by Walmsley (1998) consisting
in adjusting the trade balance (endogenous) and fixing the savings rate (exogenous). The
fixed assumption of the saving rate is the default macroclosure in the GTAP model, i.e., the
savings rate (percentage of income that is saved) is assumed to be exogenous and constant,
so the quantity of the saving changes whenever income changes. Investment spending then
changes to accommodate the change in supply of savings. A model with this closure is called
"savings-driven" because changes in savings drive changes in investment. An advantage of
this closure is that a nation’s savings rate remains the same as the rate observed in the base
year (Burfisher. M, 2017). By adjusting the trade balance variable, capital moves across regions
and regions’ trade balances change accordingly, thus the percentage changes in the expected
rates of return do equate across regions (Yuan and Burfisher, 2021; Walmsley, 1998).4
4Bekkers et al. (2020) explore the trade balance closures in detail.

192 Appendix C. Appendix of Chapter 3
Figure C.1: Circular flows in a regional economy
Source: GTAP
Figure C.2: Production structure
Source: GTAP
C.1.1 Sets and trade variables in GTAP
Sets define relevant groupings of entities over which we will be performing operations in
the model. At the aggregated model "AfCFTA36*8" has eight sectors and 36 regions, the set

C.1. GTAP model: desciption 193
of traded commodities consists of agriculture, fossil fuels, processed foods, wood and paper
products, textiles and wearing apparel, energy-intensive manufacturing, manufactures, ser-
vices and they can be traded between regions. The set of produced commodities contains
capital goods (CGDS) in addition to the traded commodities. Capital goods refers to the in-
vestment column of the national input-output tables and reprsents purchases of goods and
equipment designated for investment. Land, labour (unskilled and skilled), capital, natural re-
sources are endowment commodities, whereas labor and capital are mobile (perfectly mobile
across industries within each region) and land and natural resources are immobile. A detailed
list of the sets defined is presented in the Table C1.
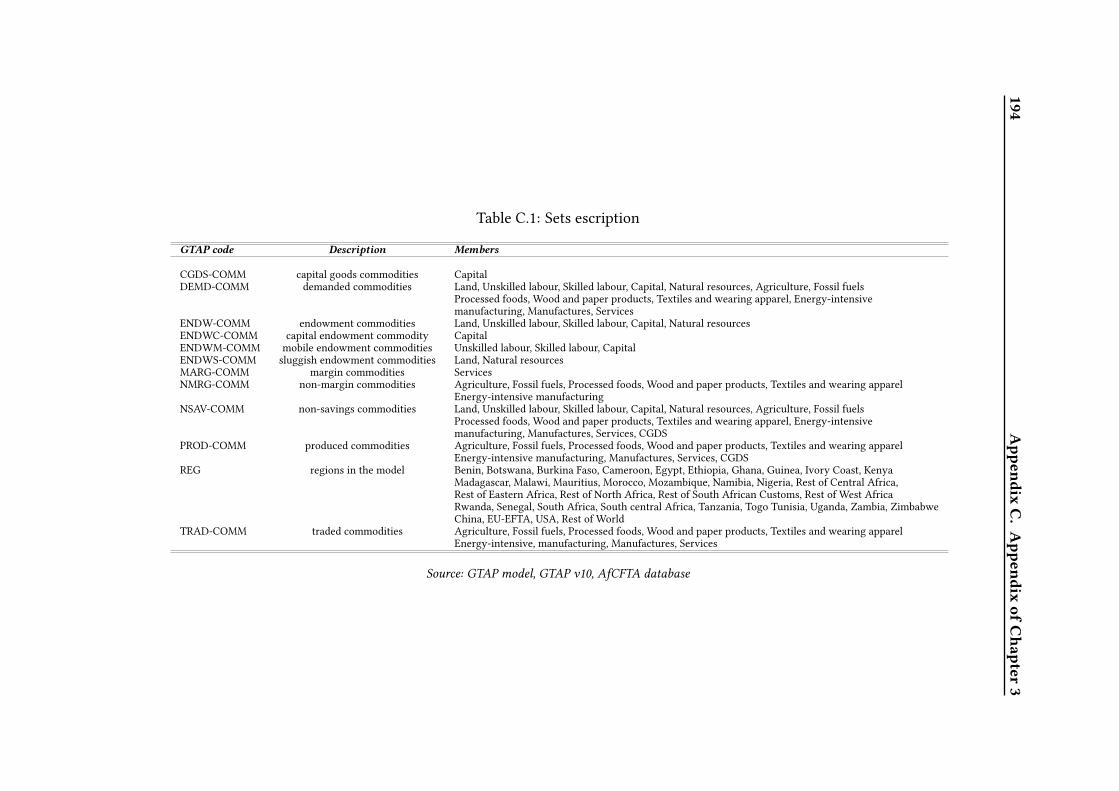
194Appendix
C.Appendix
ofChapter
3
Table C.1: Sets escription
GTAP code Description Members
CGDS-COMM capital goods commodities Capital
DEMD-COMM demanded commodities Land, Unskilled labour, Skilled labour, Capital, Natural resources, Agriculture, Fossil fuels
Processed foods, Wood and paper products, Textiles and wearing apparel, Energy-intensive
manufacturing, Manufactures, Services
ENDW-COMM endowment commodities Land, Unskilled labour, Skilled labour, Capital, Natural resources
ENDWC-COMM capital endowment commodity Capital
ENDWM-COMM mobile endowment commodities Unskilled labour, Skilled labour, Capital
ENDWS-COMM sluggish endowment commodities Land, Natural resources
MARG-COMM margin commodities Services
NMRG-COMM non-margin commodities Agriculture, Fossil fuels, Processed foods, Wood and paper products, Textiles and wearing apparel
Energy-intensive manufacturing
NSAV-COMM non-savings commodities Land, Unskilled labour, Skilled labour, Capital, Natural resources, Agriculture, Fossil fuels
Processed foods, Wood and paper products, Textiles and wearing apparel, Energy-intensive
manufacturing, Manufactures, Services, CGDS
PROD-COMM produced commodities Agriculture, Fossil fuels, Processed foods, Wood and paper products, Textiles and wearing apparel
Energy-intensive manufacturing, Manufactures, Services, CGDS
REG regions in the model Benin, Botswana, Burkina Faso, Cameroon, Egypt, Ethiopia, Ghana, Guinea, Ivory Coast, Kenya
Madagascar, Malawi, Mauritius, Morocco, Mozambique, Namibia, Nigeria, Rest of Central Africa,
Rest of Eastern Africa, Rest of North Africa, Rest of South African Customs, Rest of West Africa
Rwanda, Senegal, South Africa, South central Africa, Tanzania, Togo Tunisia, Uganda, Zambia, Zimbabwe
China, EU-EFTA, USA, Rest of World
TRAD-COMM traded commodities Agriculture, Fossil fuels, Processed foods, Wood and paper products, Textiles and wearing apparel
Energy-intensive, manufacturing, Manufactures, Services
Source: GTAP model, GTAP v10, AfCFTA database

C.1. GTAP model: desciption 195
The Table above presents the trade policy variables through the taxation variables included
in the GTAP model. The shocked interest variable is RTMS.
Table C.2: Trade policy variables in GTAP: Tax rates description
Variables GTAP Dimension NameRTO NSAV-COMM*REG % ad valorem rate, output (or income) tax in region r
RTF ENDW-COMM*PROD-COMM*REG % ad valorem rate, taxes on primary factors
RTPD TRAD-COMM*REG % ad valorem rate, private domestic consumption taxes
RTPI TRAD-COMM*REG % ad valorem rate, private import consumption taxes
RTGD TRAD-COMM*REG % ad valorem rate, government domestic purchases taxes
RTGI TRAD-COMM*REG % ad valorem rate, government import purchases taxes
RTFD TRAD-COMM*PROD-COMM*REG % ad valorem rate, taxes on firms’ domestic purchases
RTFI TRAD-COMM*PROD-COMM*REG % ad valorem rate, taxes on firms’ imports purchases
RTXS TRAD-COMM*REG*REG % ad valorem rate, export taxes, by destination
RTMS TRAD-COMM*REG*REG % ad valorem rate, import taxes, by source (variable of interest)
Source: GTAP model, GTAP v10, AfCFTA database
C.1.2 Technical details code: International trade and transport vari-ables in GTAP
This section highlights the variables related to international trade and transport in GTAP
model.
Table C.3: International trade and transport variables
Variables Descriptionpms(i,r,s) domestic price for good i supplied from r (source countries) to
region s (destination countries)
qxs(i,r,s) export sales of commodity i from r to region s (variable of interest)VIMS(i,r,s) imports of i from r to s valued at domestic market prices
VIMS(i,r,s) = pms(i,r,s) * qxs(i,r,s)
pcif(i,r,s) CIF world price of commodity i supplied from r to sVIWS(i,r,s) imports ofi from r to s valued CIF (tradeables only)
VIWS(i,r,s) pcif(i,r,s) *qxs(i,r,s)
pfob(i,r,s) FOB world price of commodity i supplied from r to sVXWD(i,r,s) exports of i from rto s valued FOB (tradeables only)
VXWD(i,r,s) = pfob(i,r,s) * qxs(i,r,s)
VXMD(i,r,s) exports of ifrom r to s valued at market prices (tradeables only)
VXMD(i,r,s) = pm(i,r)* qxs(i,r,s)
qst(m,r) sales of m from r to international transport
VST(m,r) exports of m (margin commodities) from r for international transportvalued at market prices (tradeables only)
VST(m,r) =pm(m,r) * qst(m,r)
Source: GTAP model, GTAP v10, AfCFTA database

196 Appendix C. Appendix of Chapter 3
C.1.3 Introduction of margin activities: domestic trade and transportmargins
Margin activities (transport and distribution called "marketing services") plays an important
role in most economies.5Indeed, the demands for the marketing services are associated with
the following uses: intermediate or firm purchases of imported goods; firm purchases of do-
mestic goods; private household purchases of imported goods; private household purchases
of domestic goods; government purchases of imported goods; government purchases of do-
mestic goods; and exports of all commodities. The incorporation of these activities changes
the structure of the GTAP model. The main modifications to the standard GTAP model oc-
cur in the preference structure for the private household and the government, the production
structure for firms, determining the FOB value of exports, the market clearing conditions, the
computation of taxes, and the decomposition of welfare changes (Peterson, 2006). We con-
sider only changes in the value of exports in our analysis.
To allow some generality in the modeling of domestic marketing margins, substitution pos-
sibilities are allowed between the commodity and an aggregate marketing service as well as
between marketing services (Peterson, 2006). To illustrate this, consider the nested CES struc-
ture of domestic marketing margins for imported commodities in Figure C.3.
5Margin activities in GTAP v10 are wholesale and retail trade, other transport, air transport and water trans-
port. This is one of the innovative aspect of the GTAP model.
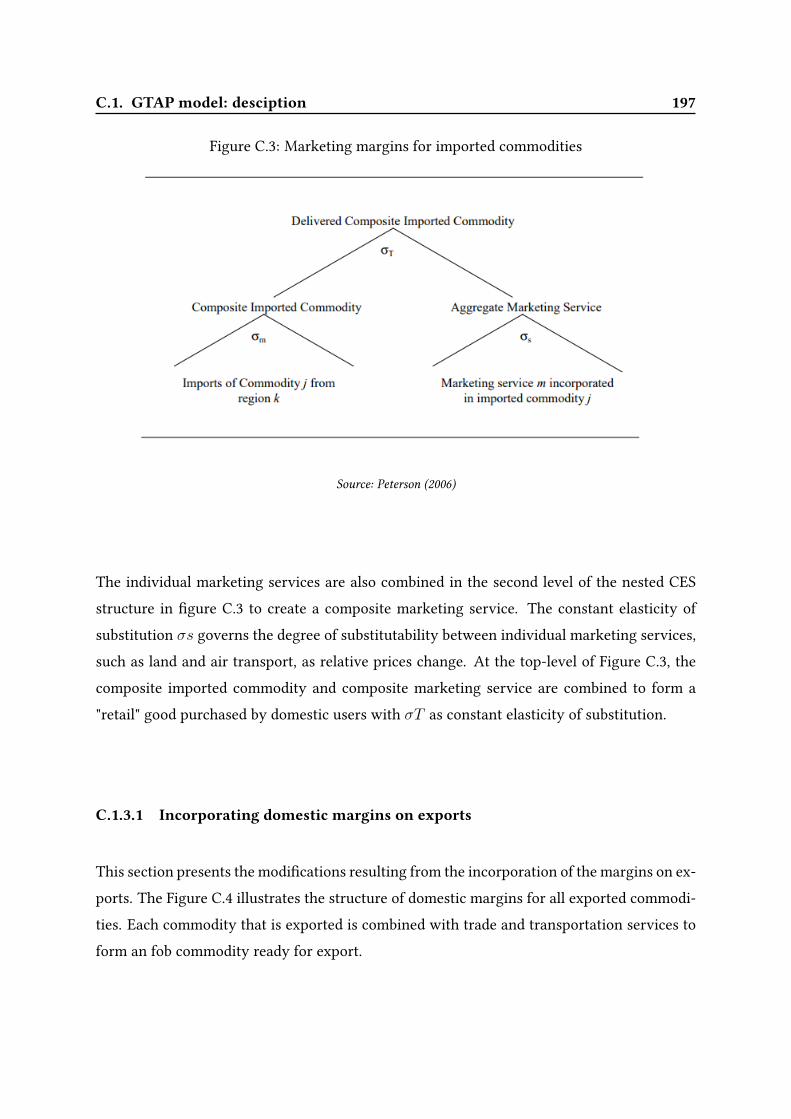
C.1. GTAP model: desciption 197
Figure C.3: Marketing margins for imported commodities
Source: Peterson (2006)
The individual marketing services are also combined in the second level of the nested CES
structure in figure C.3 to create a composite marketing service. The constant elasticity of
substitution σs governs the degree of substitutability between individual marketing services,
such as land and air transport, as relative prices change. At the top-level of Figure C.3, the
composite imported commodity and composite marketing service are combined to form a
"retail" good purchased by domestic users with σT as constant elasticity of substitution.
C.1.3.1 Incorporating domestic margins on exports
This section presents the modifications resulting from the incorporation of the margins on ex-
ports. The Figure C.4 illustrates the structure of domestic margins for all exported commodi-
ties. Each commodity that is exported is combined with trade and transportation services to
form an fob commodity ready for export.

198 Appendix C. Appendix of Chapter 3
Figure C.4: Structure of Domestic Margins on Exported Commodities
Source: Peterson (2006)
Incorporating domestic margins on exports requires four new quantity and two new price
variables and equations be added to the standard GTAP model. Beginning at the bottom of
the Figure C.4, the quantity of themth individual marketing service associatedwith the export
of commodity i from region r to region s is defined as:
qnxd(m, i, r, s) = qrxd(i, r, s)− anxd(m, i, r, s) + ESUBXL(i) ∗ {prxd(i, r, s)+anxd(m, i, r, s)− pm(m, r)
(C.2)
Where prxd(i, r, s) and qrxd(i, r, s) are the aggregate price and quantity of marketing ser-
vices associated with the export of commodity i from region r to region s, ESUBXL(i) is
the elasticity of substitution amongmarketing services, anxd(m, i, r, s) is the biased technical
change variable for themth marketing service and pm(m, r) market price ofmth individual
marketing service in region r. The value of the mth individual marketing service associated
with the export of commodity i is defined as:
V NDX(m, i, r, s) = pm(m, r) ∗ qnxd(m, i, r, s) (C.3)
The aggregate price and quantity of marketing services associated with the export of com-
modity i are defined as:
qrxd(i, r, s) = qxls(i, r, s)− arxd(i, r, s) + ESUBXR(i) ∗ {pxfs(i, r, s)+arxd(i, r, s)− prxd(i, r, s)
(C.4)

C.1. GTAP model: desciption 199
and
prxd(i, r, s) =∑m
XRSHR(m, i, r, s) ∗ [pm(m, r)− anxd(m, i, r, s)](C.5)
Where qxls(i, r, s) is the delivered quantity of commodity i exported from region r to re-
gion s, arxd(i, r, s) is a neutral technical change variable, ESUBXR(i) is the elasticity
of substitution between the composite marketing service and the export commodity, and
XRSHR(m, i, r, s) is the cost share of the mth marketing service. The value of all mar-
keting services associated with the export of commodity i from region r to region s is defined
as:
VMARG(i, r, s) = prxd(i, r, s) ∗ qrxd(i, r, s) (C.6)
The final new export quantity and price variables are qxbs(i, r, s) and qxls(i, r, s), the basic
and delivered quantities of commodity i exported from region r to region s, and pxfs(i, r, s),
the export-tax-free price of commodity i exported from region r to region s. The formal
definitions of these variables are as follows:
qxbs(i, r, s) = qxls(i, r, s) + ESUBXR(i) ∗ {pxfs(i, r, s)− pm(i, r)} (C.7)
and
pxfs(i, r, s) =∑m
[XFRSHR(i, r, s) ∗ prxd(i, r, s) + (1−XFRSHR(i, r, s)) ∗ pm(i, r)]
(C.8)
Where XFRSHR(i, r, s) is the cost share of all marketing services in the delivered cost of
commodity i that is being exported, pm(i, r) is market price of commodity i in region r. Note
that pxfs(i, r, s) is not the FOB price, which is redefined to equal:
pfob(i, r, s) = pxfs(i, r, s)− tx(i, r)− txs(i, r, s) (C.9)
Where tx(i, r) is power of the variable export tax on exports of tradable commodity i from re-
gion r (destination generic) and txs(i, r, s) power of the tax on exports of tradable commodity
i from source r to destination r. The value of commodity i exported from region r to region
s at market prices [V XMD(i, r, s)] and the margin inclusive value of exports of commodity
i [V XFD(i, r, s)] are defined as:
V XMD(i, r, s) = pm(i, r) ∗ qxbs(i, r) (C.10)
and
V XFD(i, r, s) = pxfs(i, r, s) ∗ qxls(i, r, s) (C.11)

200 Appendix C. Appendix of Chapter 3
Figure C.5: Status of AfCFTA Ratification in 2021
Source: TRALAC

C.2. Data sources 201
C.2 Data sources
The main source of data for this analysis is the Global Trade Analysis Project (GTAP) database
coordinated by the Center for Global Trade Analysis in the department of agricultural eco-
nomics at Purdue University. This analysis uses the latest GTAP version (10). In addition two
modifications of the standard GTAP aggregate are introduced as changes to the baseline data:
1. Introduction of AVE estimates of non-tariff barriers (NTBs) to traded goods, based on esti-
mates from Kee, Nicita, and Olarreaga (2009).
2. Incorporation of estimates of the quantification of barriers in services trade based on esti-
mates from Jafari and Tarr (2017).
C.2.0.1 Quantification of non-tariff barriers in goods
AVE estimates of non-tariff barriers for goods are taken from the World Bank’s World Inte-
grated Trade Solution (WITS) database, based on the methodology developed by Kee, Nicita
and Olarreaga (2009). They transform the quantity impact of NTBs into price-equivalents.
The original data cover 78 developing and developed countries and goods at the Harmonized
System 6 (HS6) level. These estimates are converted to the 7 aggregate goods sectors of the
GTAP database (by simple average). The aggregated NTB database is in a CSV format (AVE-
GTAP-Data.csv) with three fields: the country’s ISO (International Organization for Stan-
dardization) code, the GTAP sector code, and the value of the NTB estimates. The coverage of
African countries in this database is limited to Algeria (DZA), Burkina Faso (BFA), Cameroon
(CMR), Ivory Coast (CIV), Arab Republic of Egypt (EGY), Ethiopia (ETH), Gabon (GAB) Ghana
(GHA), Kenya (KEN), Madagascar (MDG), Malawi (MWI), Mali (MLI), Mauritius (MUS), Mo-
rocco (MAR), Nigeria (NGA), Rwanda (RWA), Senegal (SEN), SouthAfrica (ZAF), Sudan (SDN),
Tanzania (TZA), Tunisia (TUN), Uganda (UGA) and Zambia (ZMB). For the missing countries
and regions (individual and aggregate regions), we use simple averages of the available coun-
try estimates.
C.2.0.2 Quantification of non-tariff barriers in services
Services have a specific characteristic contrary to goods. They are intangible and restrictions
are qualitative information. The authors that estimated tariff equivalents of services restric-
tions use information’s from theOECD andWorld Bank’s Services Trade Restrictiveness Index

202 Appendix C. Appendix of Chapter 3
(STRI) database. The most recent is the tariff equivalent estimated by Benz and Jaax (2020).
They include only OECD and emerging countries, not African countries except South Africa.
The estimate by Jafari and Tarr (2017) is the most complete as it covers Africa countries.
The country coverage for Africa consists of Algeria (DZA), Botswana (BWA), Burundi (BDI),
Cameroon (CMR), Ivory Coast (CIV), the Democratic Republic of Congo (COD), the Arab
Republic of Egypt (EGY), Ethiopia (ETH), Ghana (GHA), Kenya (KEN), Lesotho (LSO), Mada-
gascar (MDG), Malawi (MWI), Mali (MLI), Mauritius (MUS), Morocco (MAR), Mozambique
(MOZ), Namibia (NAM), Nigeria (NGA), Rwanda (RWA), Senegal (SEN), South Africa (ZAF),
Tanzania (TZA), Tunisia (TUN), Uganda (UGA), Zambia (ZMB), and Zimbabwe (ZWE).The
missing data include rest of North Africa (XNF), which is mapped to North Africa (NAF) as
shown in table F.1. Benin, Burkina Faso, Guinea, Togo, rest of West Africa, rest of Central
Africa (XCF), rest of South-Central Africa (XAC), rest of East Africa (XEC), and rest of SACU
(South African Customs Union) are all mapped to the Sub-Saharan (SSA). They estimate the
ad valorem equivalents of the discriminatory barriers against foreign suppliers of services
in 11 service sectors in 103 countries. The estimates are based on recent available data on
discriminatory regulatory barriers against foreign suppliers of services in these sectors and
countries, produced by the World Bank (Brochert et al.,2014).
The World Bank’s STRI database focuses exclusively on discriminatory barriers faced by for-
eign suppliers of services. However, Jafari and Tarr (2017) reconstruct STRI indices from the
World Bank database based on a series of studies supported by the Australian Productivity
Commission. This modification ignores, except for EU countries, preferential commitments
and focuses exclusively on MFN barriers. Indeed, in the case of EU countries, the transfor-
mation of the World Bank database includes the weighting of intra-EU and extra-EU services
regulatory regimes.
The authors regress a measure of the price or costs of services against their STRIs and other
relevant variables in a cross-country regression at a point in time to determine the impact the
regulatory barriers on the price of services. Through these regressions, the authors finally
estimate the ad valorem equivalents of regulatory barriers in the countries in their sample.
The simple average of the AVEs of the 11 sectors constitutes the overall AVE of the service
sector.

C.3. Tables 203
C.3 Tables
Table C.4: Regional aggregation: GTAP concordance
Region GTAP concordance1 Egypt, Arab Rep. (EGY) Egypt, Arab Rep. (EGY)
2 Morocco (MAR) Morocco (MAR)
3 Tunisia (TUN) Tunisia (TUN)
4 Rest of North Africa (XNF) Algeria (DZA), Libya (LBY), Western Sahara (ESH)
5 Benin (BEN) Benin (BEN)
6 Burkina Faso (BFA) Burkina Faso (BFA)
7 Cameroon (CMR) Cameroon (CMR)
8 Ivory Coast (CIV) Ivory Coast (CIV)
9 Ghana (GHA) Ghana (GHA)
10 Guinea (GIN) Guinea (GIN)
11 Nigeria (NGA) Nigeria (NGA)
12 Senegal (SEN) Senegal (SEN)
13 Togo (TGO) Togo (TGO)
14 Rest of West Africa (XWF) Cape Verde (CPV), Gambia, Guinea-Bissau (GNB), Liberia (LBR), Mali (MLI)
Mauritania (MRT), Niger (NER), Saint Helena (SHN), Sierra Leone (SLE)
15 Rest of Central Africa (XCF) Central African Republic (CAF), Chad (TCD), Congo (COG),
Equatorial Guinea (GNQ), Gabon (GAB), Sao Tome and Principe (STP)
16 South Central Africa Angola (AGO), Democratic Republic of the Congo (COD)
17 Ethiopia (ETH) Ethiopia (ETH)
18 Kenya (KEN) Kenya (KEN)
19 Madagascar (MDG) Madagascar (MDG)
20 Malawi (MWI) Malawi (MWI)
21 Mauritius (MUS) Mauritius (MUS)
22 Mozambique (MOZ) Mozambique (MOZ)
23 Rwanda (RWA) Rwanda (RWA)
24 Tanzania (TZA) Tanzania (TZA)
25 Uganda (UGA) Uganda (UGA)
26 Zambia (ZMB) Zambia (ZMB)
27 Zimbabwe (ZWE) Zimbabwe (ZWE)
28 Rest of East Africa (XEC) Burundi (BDI), Comoros (COM), Djibouti (DJI), Eritrea (ERI),
Mayotte(MYT), Seychelles(SYC), Somalia (SOM), Sudan (SDN)
29 Botswana (BWA) Botswana (BWA)
30 Namibia (NAM) Namibia (NAM)
31 South Africa (ZAF) South Africa (ZAF)
32 Rest of South African
Customs Union (XSC) Eswatini (SWZ), Lesotho (LSO)

204 Appendix C. Appendix of Chapter 3
Table C.5: Continued
Region GTAP concordance33 China (CHN) China (CHN)
34 United States (USA) United States of America (USA)
35 European Union + EFTA (weu) Austria (AUT), Belgium (BEL), Cyprus (CYP), Czech Republic (CZE), Denmark (DNK),
Estonia (EST), Finland (FIN), France (FRA), Germany (DEU), Greece (GRC), Hungary (HUN),
Ireland (IRL), Italy (ITA), Latvia (LVA), Lithuania (LTU), Luxembourg (LUX), Malta (MLT),
Netherlands (NLD), Poland (POL), Portugal (PRT), Slovakia (SVK), Slovenia (SVN), Spain (ESP),
Sweden (SWE), United Kingdom (GBR), Switzerland (CHE), Norway (NOR), rest of EFTA (XEF)
, Bulgaria (BGR), Croatia (HRV), Romania (ROU)
36 Rest of the world (row) Australia (AUS), New Zealand (NZL), rest of Oceania (XOC), Bangladesh (BGD), India (IND),
Nepal (NPL), Pakistan (PAK), Sri Lanka (LKA), rest of South Asia (XSA), Canada (CAN),
Mexico (MEX), rest of North America (XNA), Argentina (ARG), Bolivia (BOL), Brazil (BRA),
Chile (CHL), Colombia (COL), Ecuador (ECU), Paraguay (PRY), Peru (PER), Uruguay (URY),
Venezuela (VEN), rest of South America (XSM), Costa Rica (CRI), Guatemala (GTM),
Honduras (HND), Nicaragua (NIC), Panama (PAN), El Salvador (SLV), rest of Central America (XCA),
Dominican Republic (DOM), Jamaica (JAM), Puerto Rico (PRI),Trinidad and Tobago (TTO),
rest of Caribbean (XCB), Albania (ALB), Belarus (BLR), Russian Federation (RUS), Ukraine (UKR),
rest of East Europe (XEE), rest of Europe (XER), Kazakhstan (KAZ), Kyrgyzstan (KGZ),
Tajikistan (TJK), rest of former Soviet Union (XSU), Armenia (ARM), Azerbaijan (AZE),
Georgia (GEO), Bahrain (BHR), Iran, Islamic Rep. (IRN), Israel (ISR), Jordan (JOR),
Kuwait (KWT), Oman (OMN), Qatar (QAT), Saudi Arabia (SAU), Turkey (TUR),
United Arab Emirates (ARE), rest of Western Asia (XWS), Rest of East Asia (XEA), Hong Kong, SAR,
China (HKG), Japan (JPN), Mongolia (MNG), Republic of Korea (KOR), Taiwan, China (TWN),
rest of East Asia (XEA), Brunei Darussalam (BRN), Cambodia (KHM), Indonesia (IDN),
Lao PDR (LAO), Malaysia (MYS), Philippines (PHL), Singapore (SGP), Thailand (THA),
Vietnam (VNM), rest of Southeast Asia (XSE), Antarctica, Bouvet Island,
British Indian Ocean Territory, French Southern Territories.
Note: EFTA = European Free Trade Association.
Source: GTAP model, GTAP v10, AfCFTA database.
Source: GTAP model, GTAP v10, AfCFTA database
Table C.6: GTAP sector concordance
Sector name (aggregated) GTAP concordance1 Agriculture (AGR) Paddy rice (PDR); wheat (WHT); cereal grains, NEC (GRO); vegetables, fruit, nuts (V-F);
oilseeds (OSD); sugar cane, sugar beet (C-B); plant-based fibers (PFB); crops, NEC (OCR);
bovine cattle, sheep and goats, horses (CTL); animal products, NEC (OAP);
raw milk (RMK); wool, silkworm, cocoons (WOL); forestry (FRS)
2 Fossil fuels (FFL) Coal (COA); oil (OIL); gas (GAS); petroleum, coal products (P-C)
3 Energy-intensive manufacturing (KE5) Mineral products, NEC (NMM); ferrous metals (I-S); metals, NEC (NFM);
Other extraction (formerly other manufacturing (omn), minerals, NEC) (OXT)
4 Processed foods (PFD) Bovine meat products (CMT); meat products, NEC (OMT); vegetable oils and fats (VOL);
dairy products (MIL); processed rice (PCR); sugar (SGR); food products, NEC (OFD);
beverages and tobacco products (B-T)
5 Textiles and wearing apparel (TWP) Textiles (TEX); wearing apparel (WAP); leather products (LEA)
6 Wood and paper products (WPP) Wood products (LUM); paper products, publishing (PPP)
7 Manufactures, NES (XMN) Chemical, rubber, and plastic products (CRP); Chemical products (CHM);
basic pharmaceutical products (BPH); rubber and plastic products (RPP); Metal products (FMP);
computer, electronic, and optical products (ELE); electrical equipment (EEQ);
machinery and equipment, NEC (OME); motor vehicles and parts (MVH);
transport equipment, NEC (OTN); manufactures, NEC (OMF)
8 Services Electricity (ELY); gas manufacture, distribution (GDT); construction (CNS); trade (TRD);
accommodation, food, and service activities (AFS); warehousing and support activities (WHS);
transport, NEC (OTP); water transport (WTP); air transport (ATP); communication (CMN)
financial services, NEC (OFI); insurance (formerly ISR) (INS); real estate activities (RSA);
business services, NEC (OBS); water (WTR); recreational and other service;
public administration and defense (OSG); education (EDU);
human health and social work activities (HHT); dwellings (DWE)
Source: GTAP model, GTAP v10, AfCFTA database

C.3.
Tables205
Table C.7: Intra-African agricultural and industrial tariffs
Countries Agriculture Manufacturing Processed Fossil Energy-intensive Wood and Textiles and
foods fuels manufacturing paper wearing
apparel
Benin 4.3 7.9 6.6 2.5 5.7 4.5 10.8
Botswana 0.5 1.9 0.6 0.2 0.7 0.2 5.6
Burkina Faso 3.5 8.2 4.3 2.3 4.9 5.7 8.4
Cameroon 5.2 9.9 11 2.8 5 9.1 12.8
Egypt 1.4 2.7 2.9 0.1 2.4 0.8 3.8
Ethiopia 3.3 12 7.3 0.6 7.5 6.7 18.9
Ghana 2.5 6.5 6.4 2.1 6.3 8.2 7.4
Guinea 2.5 6.1 8.1 2.3 5.6 7.5 8.2
Ivory Coast 3.8 7.8 6.5 2 5.3 5.8 8.3
Kenya 3.6 4 6.3 0.9 2.5 3 6.3
Madagascar 0.9 2.3 3.5 0.2 1.4 2.7 4.1
Malawi 0.2 3.6 1.2 0.2 3.3 1.1 5.4
Mauritius 0 0.3 0.2 0 0.9 0.6 0.9
Morocco 3.5 4.4 3.9 0.1 1.8 4.5 4.8
Mozambique 2.2 4.7 4.8 0.7 1.3 1.6 5
Namibia 0.3 2.7 0.8 0.4 0.1 0.8 7
Nigeria 7.1 9.1 10.6 2.8 8.7 8.3 8.6
Rest of Central Africa 10.1 13 13.1 4.4 7.9 13.6 18.1
Rest of Eastern Africa 3.5 8.2 5 1.5 4.1 2.8 7.8
Rest of North Africa 5.6 4.5 6 0.3 1.6 3.9 5.5
Rest of South
African Customs 1.3 1.4 1.9 0.2 1.2 1 3.3
Rest of West Africa 5.7 9.4 8.2 4.5 7.1 5.9 12.8
Rwanda 1.4 3.9 5.1 0.3 5.5 4.4 14.7
Senegal 4.7 8 7.3 1.7 7.6 5.9 7.3
South Africa 1.5 2.5 3.8 0.2 2.5 3.1 14.2
South central Africa 15.4 10 16.5 4.2 10.9 14.7 13
Tanzania 4.2 6.7 14 0.8 5.8 5.1 17.9
Togo 4.3 6.1 4.8 2.3 5.4 5.5 7.4
Tunisia 4.3 3.6 8.9 0 0.6 4.1 4.5
Uganda 3 6.3 6.7 0.8 4.4 3.6 13.9
Zambia 1.2 3.8 2.1 1.2 1.3 2.4 5.6
Zimbabwe 0.7 4.7 2.1 0.9 1.3 2.1 6.3
Source: GTAP model, GTAP v10, AfCFTA database

206 Appendix C. Appendix of Chapter 3
Table C.8: Non-tariff measures in Africa: number of notification
Countries CTPM EXP INSP OTH PC QC SPS TBTBenin 20 12 3 5 20 27 34
Burkina Faso 14 3 2 1 8 39 5
Cabo Verde 3 1 3 8 4 31 28
Ivory Coast 3 14 1 4 8 69 7
Ghana 35 7 7 26 20 25
Guinea 75 7 3 22 7 35 19
Liberia, Republic of 45 2 2 10 21 23 21
Mali 68 3 4 8 17 34 27
Niger 12 3 4 9 14 21
Nigeria 3 1 1 15 51 26
Senegal 23 28 2 10 70 13
The Gambia 4 2 5 16 77 50
Togo 23 2 6 32 10 23
Total (West Africa) 3 339 68 21 83 193 500 299Algeria 13 4 1 1 34 114 122
Tunisia 87 21 12 46 36 96 117
Morocco 42 4 1 6 35 208 91
Mauritania 42 4 7 4 23 98 55
Total (North Africa) 184 33 21 57 128 516 385Cameroon 90 10 29 42 51
Ethiopia 139 1 7 3 32 103 213
Total (Central and East Africa) 229 1 7 13 61 145 264Mauritius 40 12 2 7 40 318 358
Zimbabwe 75 6 1 21 31 169 407
Botswana 58 1 2 1 18 61 85
Total (Southern Africa) 173 19 5 29 89 548 850Source: UNCTAD TRAINS database-Non-Tariff Measures. CTPM: Contingent trade protective measures; EXP:
Export-related measures, INSP: Inspection and other formalities; OTH: Other measures; PC: Price control mea-
sures; QC: Quality control measures, SPS: Sanitary and phytosanitary, TBT: Technical barriers to trade.

C.3. Tables 207
Table C.9: Ad valorem equivalents of non-tariffs measures in Africa: agricultural and manu-
facturing products
Sectors SPS TBT Others Total NTMAnimals 9.5 4.2 4.6 18.3
Vegetables 14.2 2.7 2.3 19.2
Fats and oils 7.8 0.2 3.9 11.9
Beverages and tobacco 11.4 5.8 2.9 20.1
Minerals 4.6 8.2 1.8 14.6
Chemicals 5.6 5.8 2.9 14.3
Plastics 0.1 8.1 1.3 9.5
Leather 5.4 5.5 3.6 14.5
Wood product 4.3 6.7 0.6 11.6
Paper 0 9 0.8 9.8
Textile and clothing 0 6.4 2.5 8.9
Footwear 0 9.2 3.3 12.5
Stone and glass 0 8.3 4.3 12.6
Pearls 0 3.1 6.2 9.3
Metals 0 9.6 4.8 14.4
Machinery 0 11.3 10.4 21.7
Vehicles 0 9.2 4 13.2
Optical 0 11.1 6.1 17.2
Arms 0 5.9 9.5 15.4
Miscellaneous 0 12.6 3.9 16.5
Source: AVEs data compiled by Cadot et al. (2015)
Table C.10: Ad Valorem Equivalents (AVEs) by services sector and geographical region
AVEs estimations
Region North Europe and East Asia South Latin America Middle East sub-Saharan
America Central and the Asia and Caribbean and North Africa
Asia Pacific Africaf
Accounting 36 26 38 34 27 45 33
Legal services 34 34 48 58 33 63 46
Air transport 10 24 31 58 37 59 23
Rail transport 28 49 45 67 41 66 53
Road transport 18 19 35 35 31 56 26
Banking 1 8 12 16 12 32 16
Insurance 18 22 21 29 27 34 28
Fixed line 16 7 90 388 60 30 545
Mobile line 0 0 1 2 1 1 3
Retail 2 2 3 4 3 5 3
Maritime transport 8 16 30 67 34 57 18
AVEs Average 15.55 18.82 32.18 68.91 27.82 40.73 72.18
Source: Jafari and Tarr (2017)

208Appendix
C.Appendix
ofChapter
3Table C.11: Estimated ad valorem equivalents of services restrictions: Individual countries
Countries Accounting Legal Air Rail Road Banking Insurrance Fixed Mobile Retail Maritime Average
transport transport transport line line
Botswana 21 35 75 65 65 18 23 64 1 2 n/a 36.9
Cameroon 26 34 0 56 37 1 25 29 0 2 0 19.09
Democratic
of the Congo 29 36 0 84 62 3 104 915 1 2 58 117.64
Egypt 56 73 69 84 0 44 35 18 1 1 39 38.18
Ethiopia 19 73 84 62 84 106 105 915 37 14 82 143.73
Ghana 29 25 0 26 0 34 26 915 1 2 65 102.09
Ivory Coast 51 56 0 84 60 17 13 1 0 31.33
Kenya 26 73 0 84 0 2 38 915 1 1 0 103.64
Lesotho 16 13 0 84 0 1 16 109 1 2 n/a 24.2
Madagascar 25 40 0 62 70 18 23 915 2 1 n/a 115.6
Malawi 33 49 59 42 5 18 21 915 6 2 n/a 115
Mali 60 50 0 20 20 4 21 915 2 1 n/a 109.3
Mauritius 10 65 0 84 42 17 2 1 0 0 n/a 22.1
Morocco 27 47 0 0 0 2 26 13 1 1 73 17.27
Mozambique 20 20 0 37 20 1 2 915 2 1 0 92.55
Nambibia 41 55 0 68 56 18 27 63 2 1 0 30.09
Nigeria 30 27 37 84 0 2 48 35 0 3 0 24.18
Rwanda 21 15 0 84 5 14 27 915 3 7 109.1
Senegal 46 65 81 84 0 13 13 60 1 1 0 33.09
South Africa 32 73 70 0 0 6 29 23 1 1 0 21.36
Tanzania 44 52 54 72 0 13 33 915 1 1 61 113.27
Tunisia 79 69 69 68 60 10 29 12 1 6 75 43.45
Uganda 40 49 0 18 0 2 16 915 4 1 n/a 104.5
Zambia 26 27 0 0 53 5 24 915 2 1 n/a 105.3
Zimbabwe 39 48 69 77 75 23 31 267 2 11 n/a 64.2
Source: Jafari and Tarr (2017) AVEs estimated.

C.3. Tables 209
Table C.12: Estimated ad valorem equivalents of services restrictions: Regional area
North Africa Sub-Saharan Rest of East Western Rest of the
(NAF) Africa (SSA) Asia Europe world
Accounting 54 31 43 28 32
Legal 60 45 63 28 41
Air 55 23 46 16 38
Rail 59 59 57 18 50
Road 36 31 45 24 33
Banking 17 15 17 2 16
Insurance 29 31 26 11 26
Fixed line 13 546 134 4 75
Mobile 1 3 1 1 1
Retail 5 2 4 1 3
Maritime 67 12 40 7 30
Average 36 72.55 43.27 12.73 31.36
Source: Jafari and Tarr (2017) AVEs estimated.
Table C.13: GTAP closures
Short-run Long-run
Exogenous qo(capital) or kb EXPANDEndogenous EXPAND qo(capital)
DTBAL is endogenous DTBAL is endogenous
Source: Walmsley (1998)
qo(capital) or kb: beginning-of-period capital stock
EXPAND: change in investment levels relative to endowment stock
DTBAL: change in trade balance


Barrières Non Tarifaires dans le commerce des services, Investissement DirectEtranger et commerce international
Résumé: Cette thèse de doctorat étudie les effets des Barrières Non Tarifaires (BNT) au commercedes services sur les échanges commerciaux mondiaux. Elle contribue à l’analyse empirique des effetsdes restrictions sectorielles au commerce des services sur les échanges commerciaux mondiaux. Dansle premier chapitre, nous examinons empiriquement les impacts des BNT dans les services et ladisparité règlementaire (transports, logistiques, distribution, financiers et secteur du business) surles échanges commerciaux de biens alimentaires entre les pays membres de l’OCDE. Les résultatssuggèrent des effets négatifs des restrictions sectorielles sauf dans le secteur de la distribution sur lecommerce des biens alimentaires. Cependant, la disparité règlementaire entre les pays a un impactnégatif et significatif sur le commerce des produits alimentaires. Cet impact diminue lorsque le paysexportateur est fermé aux prestataires de services. Dans le deuxième chapitre, nous analysons em-piriquement les impacts des restrictions dans le secteur des IDE (Investissements Direct à l’Etranger)sur les investissements transfrontaliers entre les pays développés (OCDE) et les pays émergents.Nous concluons que les restrictions dans le secteur des services des IDE sont des obstacles auxinvestissements transfrontaliers entre pays avancés et émergents. Plus loin, les restrictions dans lesservices entravent les investissements transfrontaliers entre pays développés et celles dans le secteurprimaire, manufacturier et ressources naturelles constituent un frein aux IDE entrants dans les paysémergents. Dans le dernier chapitre, nous étudions à travers un modèle théorique les gains de lalibéralisation des services sur le commerce intra-Africain dans le cadre de la Zone de Libre-EchangeContinentale Africaine (ZLECA). Les résultats montrent des effets positifs de la libéralisation desservices sur la croissance du PIB, du revenu, sur le bien-être et sur le commerce intra-africain plusprécisément le commerce de biens manufacturiers et ressources naturelles. L’accord ZLECA crée àla fois des créations et des détournements de commerce, mais le gain en bien-être reste positif etsignificatif à long terme en Afrique.
Mots-clés : Barrières Non Tarifaires (BNT); Commerce des services; Commerce des biens alimen-taires; Investissements Directs à l’Etranger (IDE); Zone de Libre-Echange Continentale Africaine(ZLECA)
Non-Tariff Barriers in services trade, Foreign Direct Investment and international trade
Abstract: This thesis studies the effects of Non-Tariff Barriers (NTBs) to trade in services oninternational trade. It contributes to the empirical analysis of the effects of sectoral restrictions inservices trade on world trade. In the first chapter, we empirically examine the impacts of NTBsin services and regulatory disparity (transport, logistics, distribution, financial and business) onfood trade among OECD countries. The results suggest negative effects of sectoral restrictionsexcept in the distribution sector on trade in food products. However, the regulatory disparitybetween countries has a significant negative impact on food trade. This impact decreases when theexporter country is closed to service providers. In the second chapter, we empirically analyze theimpacts of FDI restrictions on cross-border investment between advanced (OECD) and emergingcountries. We conclude that restrictions in the services sector of FDI impede cross-border investmentacross advanced and emerging countries. Furthermore, restrictions in the services sector hindercross border investment between advanced countries and restrictions in the primary, manufacturingand natural resources sector hamper inward FDI in emerging countries. In the last chapter, weuse a theoretical model to study the gains of services liberalization on intra-African trade in thecontext of the African Continental Free Trade Area (AfCFTA). The results show positive effects ofservices liberalization on GDP growth, income, welfare and intra-African trade, particularly trade inmanufacturing goods and natural resources. The AfCFTA agreement creates both long-term tradecreation and diversion, but the welfare gain is still positive and significant over the long term in Africa.
Keywords: Non-Tariff Barriers (NTBs); Services trade; Food trade; Foreign Direct Investment(FDI); African Continental Free Trade Area (AfCFTA)
BSE "Bordeaux School of Economics" (EA2954)UMR 6060 Université de Bordeaux, Bâtiment H, 33 608 Pessac Cedex, France