Data infrastructure for managing Population Health - IBM
14
Thought Leadership White Paper Data infrastructure for managing Population Health Flexible, scalable, long-term solutions to support population health goals and adapt to on- going needs
-
Upload
khangminh22 -
Category
Documents
-
view
0 -
download
0
Transcript of Data infrastructure for managing Population Health - IBM
Thought Leadership White Paper Data infrastructure for managing
Population Health
Flexible, scalable, long-term solutions to support population health goals and adapt to on-going needs
Contents
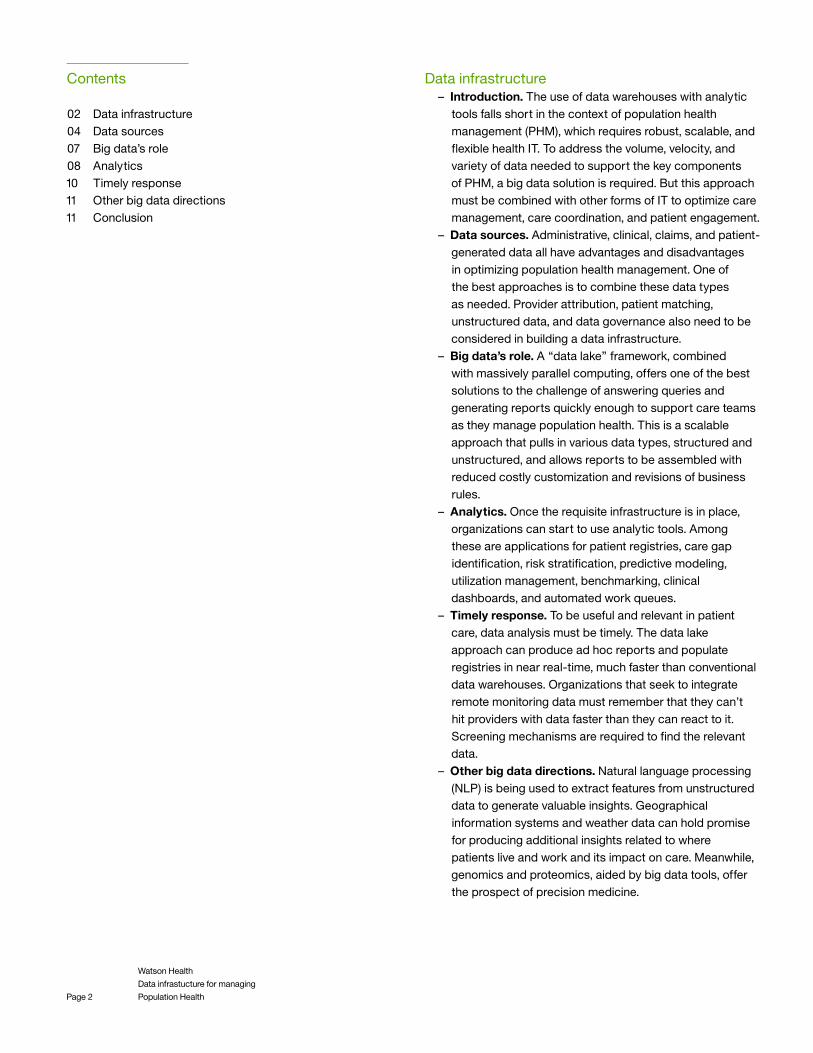
02 Data infrastructure04 Data sources07 Big data’s role08 Analytics10 Timely response11 Other big data directions11 Conclusion
Page 2
Watson Health
Data infrastucture for managing
Population Health
Data infrastructure– Introduction. The use of data warehouses with analytic
tools falls short in the context of population health management (PHM), which requires robust, scalable, and flexible health IT. To address the volume, velocity, and variety of data needed to support the key components of PHM, a big data solution is required. But this approach must be combined with other forms of IT to optimize care management, care coordination, and patient engagement.
– Data sources. Administrative, clinical, claims, and patient-generated data all have advantages and disadvantages in optimizing population health management. One of the best approaches is to combine these data types as needed. Provider attribution, patient matching, unstructured data, and data governance also need to be considered in building a data infrastructure.
– Big data’s role. A “data lake” framework, combined with massively parallel computing, offers one of the best solutions to the challenge of answering queries and generating reports quickly enough to support care teams as they manage population health. This is a scalable approach that pulls in various data types, structured and unstructured, and allows reports to be assembled with reduced costly customization and revisions of business rules.
– Analytics. Once the requisite infrastructure is in place, organizations can start to use analytic tools. Among these are applications for patient registries, care gap identification, risk stratification, predictive modeling, utilization management, benchmarking, clinical dashboards, and automated work queues.
– Timely response. To be useful and relevant in patient care, data analysis must be timely. The data lake approach can produce ad hoc reports and populate registries in near real-time, much faster than conventional data warehouses. Organizations that seek to integrate remote monitoring data must remember that they can’t hit providers with data faster than they can react to it. Screening mechanisms are required to find the relevant data.
– Other big data directions. Natural language processing (NLP) is being used to extract features from unstructured data to generate valuable insights. Geographical information systems and weather data can hold promise for producing additional insights related to where patients live and work and its impact on care. Meanwhile, genomics and proteomics, aided by big data tools, offer the prospect of precision medicine.
Page 3
The certified electronic health records (EHRs) required for meaningful use include foundational elements of the IT infrastructure needed in population health management. For example, the structured data in these EHRs supplies part of the information needed to identify individual care gaps, alert providers about them, and stratify a population by health risks. Certified EHRs can generate and exchange care summaries at transitions of care, although more work needs to be done on actualizing that capability. And they include patient portals that are a key conduit for patient engagement.
Nevertheless, healthcare organizations need a much more sophisticated data infrastructure to do PHM effectively and at scale. Among other things, their systems must be able to:
– Aggregate comprehensive, timely, and accurate clinical and financial data;
– Attribute this data accurately to the correct patients and their accountable providers;
– Aid care managers with workflow support, clinical content, decision support, and information on community resources;
– Track care plans and make them accessible to all stakeholders;
– Coordinate care in real time, including notification of care transitions;
– Support medication management across care settings;– Track chronic disease prevention and management;– Provide wellness and disease management reminders at
the point of care;– Engage patients with educational content and lists of
community resources;– Manage patient-entered and/or device-uploaded data;– Integrate other patient-generated data, including health
risk assessments;– Evaluate the performance of the organization, its care
delivery sites, and its individual providers;– Generate insights into the total cost of care, utilization of
services, and out-of-network costs;– Identify high-risk and rising-risk patient cohorts using
predictive analytics;– Alert providers and other stakeholders about high-risk
patients;– Do financial modeling to support contract negotiations;– Calculate payment distributions and track disbursals.1
Healthcare organizations face several major challenges in developing this kind of data infrastructure. To start with, their data may be housed in proprietary databases across dozens of separate systems or “data silos” that can’t communicate with one another. If an organization serves as a hub for a clinically integrated network (CIN), that network usually includes community providers that are using many different kinds of EHRs, some with very limited interoperability, increasing the number of these “data silos”.
Moreover, a large healthcare system, CIN, or Accountable Care Organization (ACO) will generate a huge amount of data as it scales up to full population health management. As the organization moves down that road, it quickly discovers that the sheer volume of data can exceed the capabilities of its traditional information systems.
“Once the volume of data increases, the need to scale exists, and if funding is available, the organization can upgrade to a more sophisticated, automated, and integrated solution,” noted Jacquelyn S. Hunt and her colleagues in a recent article in Population Health Management.2
The conventional response to these challenges is to build an enterprise data warehouse that usually includes analytic applications. As of 2013, a HIMSS Analytics survey found more than half of healthcare systems used either a data warehouse or a more limited type of data aggregation system called an operational data store. Forty-six percent of the organizations used clinical and business intelligence applications, and half of those entities had data warehouses.3
Initially, many organizations use enterprise data warehouses to analyze data retrospectively – that is, they harness analytics to find out how patients and subpopulations fared in the past. That can be useful in constructing a baseline for quality improvement and utilization management, but it can have limited value in care management, because patients’ health needs are constantly evolving. The retrospective descriptive approach also is not designed to predict the future health status of patients or the cost of their care. This kind of forecasting is essential to organizations that plan to take on financial risk across their PHM activities.
The more advanced data warehouses include predictive modeling software that can help forecast potential health risks for patients and dashboards that show up-to-date population health trends. They also include or are linked to registries that can help providers and care managers address the emerging needs of individual patients.
Watson Health
Data infrastucture for managing
Population Health
Page 4
But, as you’ll see, the majority of these platforms fall short in terms of comprehensiveness and flexibility. So when healthcare organizations reach the stage where they need to address the full range of PHM requirements, it may be time for them to consider a big data solution.
The volume of data is one of three dimensions that necessitate the use of big data techniques in population health management. The other dimensions are velocity, or how fast organizations must deal with new data, and variety, which refers to the many kinds of data needed to inform PHM and financial risk management.4 One source adds a fourth “v”: veracity, defined as the “uncertainty of data,” or judgments about the accuracy of data.5 Anil Jain, MD, Watson Health™ will occasionally describe a 5th “v” when discussing big data in the context of PHM: “value”.6
Whatever form a big data solution takes, it does not eliminate the need for elements of traditional “small data” approaches to care management, care coordination, and patient engagement. In many cases, these may be registry-based solutions that can be linked to automated reminder and alert systems. Automation tools, such as patient outreach applications, can enable care teams to close care gaps rapidly and inexpensively while creating some of the return on investment that organizations are seeking.7
As this whitepaper explains, healthcare organizations must build a data infrastructure that will enable them to jump into population health management as quickly and as efficiently as possible. The infrastructure must enable the organization to adapt to changing business models in reimbursement, care delivery, and collaborations with other providers and health plans. More importantly, it must supply the insights the organization needs to deliver value, defined as higher-quality care at lower cost, to their customers, including patients, plans and payers (government and employer).
Data sourcesThe first step in building a data infrastructure is to determine what data an organization needs, where that data resides, and how it can be accessed and aggregated with other information. Data acquisition also involves other issues such as data accuracy, provider attribution, patient matching, and extraction of key information embedded in unstructured data (e.g., discharge summaries, procedure reports, physician notes, test results, etc.).
The main types of healthcare data are administrative, clinical, claims, and patient-generated. The inclusion of each of these data types has advantages and disadvantages; but for population health management purposes, it is typically best to have as much data as possible and to be able to combine different data types as needed. An organization must also be able to convert the raw data stream into viable information in near-real time.
Administrative dataBilling and patient demographic data are stored in many ambulatory care, acute care, and post-acute care systems. Demographic information is necessary – though not sufficient
– for accurate patient matching. It is also required for data analysis that involves age, gender, or place of residence and for patient engagement.
Billing data has been used to create registries that help physician practices identify and reach out to patients with gaps in preventive and chronic care. But billing information has inherent limitations. It can’t be used to identify certain subpopulations, such as patients with certain clinical findings (e.g., elevated blood pressure or patients with abnormally high HbA1c values). In addition, not all clinical activity is billable, and, even when it is, physicians do not always submit a code for each service they perform even when warranted. Poor charge capture not only impacts revenue, but can also decrease the value of administrative data in population health management. In addition, billing data may have other artifacts that arise because they are typically pre-adjudicated, e.g, they may contain errors that are later corrected or have redundancy.
Clinical dataClinical data arising from the EHR data is often much richer than billing or claims data. It contains clinical information, such as laboratory test results and vital signs, that is not found in billing records. EHR data also tends to be more timely than claims data as they are generally generated in near real time through the care process. Ambulatory care notes, including updated medication and problem lists, are available as soon as they’re entered into the system, although occasionally they may require the physicians to “sign and close” them. Testing and laboratory results that come into the EHR electronically are also available virtually without delays.
Watson Health
Data infrastucture for managing
Population Health
Page 5
Because of the lack of true interoperability between disparate EHRs, EHR data is generally limited to the organization in which it’s recorded. If a patient receives a service outside that organization or network, that service will usually be documented in a different EHR or practice management system (PMS) rather than in the enterprise EHR system. Since data on that care event is missing, it cannot be used in clinical decision support and is not part of the database used in registries or for analytic purposes, putting limits on some PHM activities that can be supported by enterprise EHR systems.
Recently, it has become possible to exchange summaries of care between providers with disparate EHRs. When that happens, some clinical data from outside the organization may be added to the enterprise EHR. Health information exchanges (HIE) may also provide additional clinical data that can be useful in patient care. Nevertheless, this kind of information exchange has evolved more slowly than has the adoption of the EHR. Where this exchange frequently occurs, many of these exchange summaries do not consistently convey discrete structured information easily amenable for inclusion into information systems.8
Clinical EHR data also contains artifact. “Garbage in, garbage out” is a real issue when busy clinicians are a key source of EHR data. Problem list diagnoses, accurate medication lists and conflicting sources of clinical histories from various providers all challenge those who need to leverage this data. Thus, great care is required to validate and choose which EHR data is usable in the setting of PHM.
Claims dataPaid claims data from health plans provides one of broadest views of the care that a patient has received from all their providers. This data is typically available from several sources. Self-insured health systems may find that their third-party administrators (TPAs) are willing to provide the paid claims data for employee patients. CMS provides claims data periodically to ACOs that participate in the Medicare Shared Savings Program (MSSP). Finally, commercial insurers collaborating with a particular healthcare organization may provide their claims data to the health system. Health plans with which the organization has contracts that would require the health system to take on risk for their PHM activities are those most likely to share claims data.
By informing clinicians about the care that a patient has received outside their enterprise, claims data can improve medical decision-making, fill treatment gaps, and avoid redundant testing. This data can also aid organizations in
contract negotiations. Moreover, it can alert ACOs and other risk-bearing organizations when a patient seeks care outside their network, either because of lack of access in-network, physician referral patterns, or patient convenience. This out-of-network care can impact financial performance of the ACO, patient and provider loyalty, and limit the ability to manage costs.
A big disadvantage of claims data is that it’s not timely. Adjudicated commercial claims data is usually not complete until thirty days after the date of service; the time lag for Medicare varies, but may be up to three months for complete claims. So, while claims data can fill in the retrospective picture, it is not immediately helpful for the care team trying to manage a high-risk patient who has just been released from the hospital.
Claims data often contains errors, either because the billing information is inaccurate or because of the multiple times the charges are bounced back and forth between the health system and the payer. So it is important to reconcile claims data with clinical data to weed out the misinformation. In addition, because it is not as rich as clinical data, claims data alone fails to provide a granular picture of clinical situations. Nevertheless, claims data remains the “gold standard” for population health management by many stakeholders today.
Patient-generated dataPatient-generated data includes many different kinds of information, ranging from health risk assessments and online medical histories to functional-status surveys and remote monitoring data. Although this kind of data has not traditionally been an important source of information on the health of a patient, that is rapidly changing.
Health risk assessments, for example, can help predict a patient’s health risk, which is a basic building block of population health management. Online medical histories can increase the efficiency of provider documentation and provide additional information about a patient. Functional status surveys are one of the best sources of outcomes data. And as mobile health apps and wearable sensors proliferate, clinicians’ interest in remote patient monitoring is starting to grow.9
CMS’ stage 3 meaningful use final rule specifically mentions patient-generated data. The proposal would require 5 percent of patients seen during the reporting period to contribute patient-generated health data or data from a nonclinical setting into an EHR.10 Monitoring data from home and mobile devices is already being entered into EHRs through platforms such as Apple HealthKit and Validic.11
Watson Health
Data infrastucture for managing
Population Health
Page 6
Provider attributionWithout a method of attributing patients to a particular physician, a practice, an ACO, a CIN, or a healthcare system cannot evaluate the provider’s performance or apportion any financial gains or losses to that provider from a shared-risk or bundled payment contract. Moreover, correct attribution is necessary to risk stratify the patients on a primary care physician’s panel and to assign patients to care teams.12 Finally, patients respond more favorably to patient outreach activities when messaging is attributed to their provider rather than a large nebulous entity.
Attributing a provider to a patient can be challenging. Perhaps a patient doesn’t have a regular primary care doctor but regularly sees a nurse practitioner or sees various primary care providers in a practice, depending on availability. Also, some patients see internal medicine subspecialists who double as primary care physicians. And some high-risk and other patients seek “primary care” in the emergency department. Moreover, many patients may split care among many health systems, complicating attribution.
To prevent incorrect attribution, some practices have schedulers ask patients for the name of their primary care physician each time they call for an appointment. In addition, some insurers attribute patients to particular providers. Unfortunately, the provider who has the relationship with the patient may not necessarily be the “accountable” provider assigned by the health plan, creating challenges for physicians and care teams.
Provider attribution rules may follow a certain set of steps. For example, for the purposes of identifying an accountable provider, a health system may be asked to choose the primary care provider who most frequently sees the patient. However, if a patient has seen two physicians an equal number of times, the health system must choose the provider who had the most recent encounter with the patient.
Some attribution models may allow more than one provider to be accountable in shared care models. For example, the attribution model may assign responsibility to an endocrinologist if the patient has diabetes, a nephrologist in the case of kidney disease, or both if the patient has both conditions.
As quality measures are developed and require flexibility to account for type of provider and specialty, time periods, encounter types and practice locations to satisfy the requirements for most PHM programs, attribution models may evolve.
Patient matchingAnother prerequisite of a PHM data infrastructure is a reliable method of matching patients accurately with their health data. This is not trivial, because each provider has different medical record numbers, and patient names may be entered in different ways that lead to errors. For example, a middle initial or Jr. may be omitted, resulting in one person being mistaken for another.
National estimates of matching accuracy rates within healthcare organizations range from 80 percent to 90 percent or higher. But those rates drop to 50 percent to 60 percent when data is swapped between organizations, according to one recent report.13
Some healthcare organizations have improved patient matching by using enterprise master patient index (EMPI) software. These applications, which are included in some EHRs, use probabilistic algorithms to raise the accuracy rate.
One drawback of EMPI algorithms is that they’re limited to the data available within a single enterprise. When a probabilistic algorithm is applied to communitywide data, including claims data, the accuracy of patient matching can be much higher. In some client implementations, a big data approach like the one described in this paper, can achieve correct patient matches in nearly 98 percent of the cases.
Unstructured dataRoughly 80 percent of EHR data is unstructured, trapped in free text, textual documents, images, and other areas outside of discrete fields.14 As a result, this information is unavailable for use in analysis or clinical decision support.
Some of this unstructured data is information that was not entered in the appropriate fields of the EHR. For example, the completeness of problem lists varies greatly,15 and a study of EHR-derived quality data in primary care practices found that preventive care services had been undercounted by a significant margin.16 Nevertheless, the missing data can often be found in unstructured progress notes that were dictated or typed into free text boxes.
Natural language processing (NLP) is being used to extract structured data from unstructured text in some organizations. NLP has improved significantly over the years, and some EHR vendors have used it with speech recognition to categorize certain kinds of medical terms in their EHRs.17
NLP has also been helpful in specific clinical situations, such as extracting the ejection fraction from echocardiogram reports.18
Watson Health
Data infrastucture for managing
Population Health
Page 7
Data governanceData governance is a compliance and quality control discipline for assessing, managing, improving, monitoring, maintaining, and protecting organizational information. To achieve data governance, a healthcare organization or a network such as an ACO or a CIN agrees on a model that describes who can take what actions with what information, under what circumstances, using specified methods.
Data governance is also a formal set of processes for managing important data assets throughout an organization. It seeks to verify that data can be trusted and that people are held accountable for adverse events that occur because of poor data quality. It applies to both data entry by individuals and to automated processes that bring data into a system.
Many healthcare organizations lack a data governance model, a recent Deloitte study found. Along with the lack of a clear strategy and an effective budgeting model, this is one of the gaps they need to fill before they can expand their use of analytics. “Organizations with a centralized strategy and governance structure will likely be best positioned to move from the promise of analytics to superior performance,” Deloitte’s report stated.19
Needless to say, the data governance model must comply with Health Insurance Portability and Accountability Act (HIPAA) and the Health Information Technology for Economic and Clinical Health (HITECH), state and local regulatory provisions on what can be shared and with whom in these types of collaborative programs. Additional regulatory concerns for the ACO and CIN that might impact data governance include Stark, anti-kickback status (AKS), etc. Because of complexity in this space, CINs generally seek legal opinions regarding data governance.
Big data’s rolePopulation health management, as mentioned earlier, requires a data infrastructure capable of delivering a vast amount of information to clinicians, care teams, clinical and business leaders, and others quickly, accurately, and at the scale of a patient population that might include tens of thousands of people. Even advanced enterprise data warehouses may not be capable of doing this, because they lack the technical capabilities to handle the volume, velocity, and variety of data.
For example, a PHM-capable system must be able to respond quickly to a wide variety of queries. These might range from how many and which patients in the population have hypertension to how many ER visits were made in a given time period by people with asthma who have inhaler prescriptions.
There are two methods of addressing such queries. In a conventional data warehouse, stored data is “bound” to business rules that are implemented as algorithms, calculations, or inferences. This data binding may be done for calculating lengths of stay, attributing providers to patients, or defining disease states that are included in patient registries. Data can be bound to patient identifiers, provider identifiers, service locations, gender, or specific diagnosis and procedure codes. Combinations of these bound data elements are used in responding to queries.
What this means is that programmers must pre-select the data elements needed to deliver analytic reports to users. If an organization could predict all the queries it was likely to receive in advance and the breadth of data collected was static, such a data warehouse could suffice. But population health management is very complex, and there will be a substantial number of requested reports that the system has not been programmed to generate and increasingly more diverse types of data being collected.
To enable the system to respond to new queries and perform other functions not envisioned in the original business rules, the software applications must be constantly modified. In a large healthcare organization, this process can take twelve to eighteen months to complete, if ever at all. And, by the time the changes have been made, the use cases may have changed, requiring a new set of modifications. Not only is this process very time-consuming, but it also may fail to meet the needs of users for information that can be acted on while it is still relevant to patient care.
Data lake approachAlternatively, a healthcare organization can select a big data infrastructure based on a data lake approach. In contrast to the relational databases used in many data warehouses, this approach often employs the Hadoop software framework for distributed storage and distributed processing of large datasets in cloud-based computer clusters. (Other non-relational database frameworks include NoSQL and Scale-Out MPP.20) Data can be stored and aggregated much more quickly and cost efficiently than in traditional data warehouses because of the speed and lower cost of massively parallel processing and storage.
Data is stored in the data lake in its native format until it is needed, and each data element has a metadata tag for efficient retrieval. This method allows far more flexibility than the conventional data warehouse approach because data is not bound to business rules or vocabularies when a particular query is received or a function must be activated.
Watson Health
Data infrastucture for managing
Population Health
Page 8
Consequently, the software application’s data interface does not need to be rewritten to accommodate new kinds of queries or use cases. An analysis or report can quickly be assembled from using configuration files that identify the business rules at
“run-time” rather than at “design-time”.As a result, responses are ad hoc rather than
predetermined, and reports based on new requirements can be delivered in days or weeks rather than months or years. Moreover, a clinical data analyst or a tech-savvy clinician can format a report without requiring the assistance of a software developer or a database administrator; consequently, necessary adjustments can be made quickly by users with PHM domain expertise.
The data lake framework also has other advantages. First, data storage can be increased by simply adding more common computer servers into the big data cluster. That process is inexpensive to manage and makes the data lake approach very scalable. Second, data doesn’t have to be
“cleansed” until it is needed. So rather than cleaning an entire database – which, as we’ve seen, can be very labor intensive – data analysts can just make sure that all of the data elements required for a particular use case are present and accurate. Also, the definition of clean data, which can vary from one type of analysis to another, need not be agreed upon beforehand.
To deal with the velocity of data created in the course of population health management, the healthcare organization situates a physical health data gateway to the data lake cloud platform within its data center or a virtual health data gateway at community provider practices. The gateway identifies data across the enterprise and serves it up to the cloud-based data lake in a protected manner. In the cloud platform, tools to map, standardize, and link disparate data within the data lake are constantly producing information and insights to drive the use cases. If that platform is disconnected, the health data gateway continues to pull data from the organization’s systems. When the cloud platform is reconnected, the gateway automatically sends it the data collected during the downtime.
Data normalizationThe data lake approach also allows the normalization of data from a variety of sources, including administrative, clinical, claims, and patient-generated. Specialized software algorithms can be used to integrate different kinds of data. For example, if data from disparate EHRs is aggregated, a particular kind of algorithm can normalize it by applying standard ontologies to a common nomenclature set. These may include RxNorm for ordered medications, Systematized Nomenclature of Medicine (SNOMED) for pharmaceutical subclasses, and National Drug Codes (NDC) for medications dispensed by pharmacies. By comparing the data available in
these three clinical languages, the engine can determine with a high degree of accuracy which medications were prescribed to a certain patient by providers using disparate EHRs.
Similarly, the organization can use Current Procedural Terminology (CPT) and Healthcare Common Procedure Coding System (HCPCS) codes for procedures and ICD-9, ICD-10, and SNOMED CT for diagnoses. Logical Observation Identifiers Names and Codes (LOINC) can be used for vital signs and lab tests as well as standardized tests for depression screening. Health systems should be able to standardize 90 percent or more of the content, given the high adoption of these standard terminologies. However, custom and local codes remain problematic.
Because of the time lag between claims and clinical data, other algorithms are needed to reconcile these two kinds of information. At a high level, this process looks at the dates of service associated with each piece of data, along with demographic data, the provider of record, and the type of service rendered to make sure the claims and clinical data apply to the same patient and the same service.
AnalyticsAfter an organization has built the data infrastructure it needs to aggregate, normalize, and query data efficiently, it can start to use analytic tools. Among these are applications for patient registries, care gap identification, risk stratification, predictive modeling, utilization management, benchmarking, clinical dashboards, and automated work queues.21
Big data analytics have a wide range of techniques for describing patient populations and evaluating how well organizations or providers perform against evidence-based guidelines. They can also be used to construct risk models that predict patient utilization and costs. Some healthcare organizations have used predictive modeling to forecast who is likely to be readmitted to the hospital.22
The first step in using analytics for PHM is to describe the population. For example, the organization may want to know how many patients have complex, chronic conditions such as diabetes and heart failure; the number of ER visits and hospitalizations by people with certain conditions or in particular age groups; how many of them are in the highest risk group for utilization; the differences among practice sites in the prevalence of certain diseases; or how the burden of disease is related to factors such as the payer mix or the age distribution of patients.
The next step is to combine different characteristics of the population to describe a specific cohort. For example, an organization might want to see how many people who have a lab value of greater than 8 percent on an HbA1c test have been diagnosed as diabetic and those that do not carry a
Watson Health
Data infrastucture for managing
Population Health
Page 9
diagnosis despite a confirmatory blood test. In the US, 28 percent of people with diabetes are undiagnosed.23 In some of these cases, the HbA1c test was done when these patients went to the ER for some other complaint, and the lab value went unnoticed or was reported to the patient, who did not seek follow-up. PHM requires that patient cohorts be defined with direct evidence of conditions (diagnosis codes referring to diabetes) and indirect evidence of conditions (laboratory evidence of a diabetic condition) otherwise, an entire group of patients can be missed.
RegistriesAn indispensable tool for population health management, a patient registry, contains data that helps enable providers to improve population health. Among other things, a registry lists the services that each patient has received, when the services were provided and by whom, the patient’s recent lab values, and when the patient is due for preventive and/or chronic disease care.
Registries can also be used to compile lists of subpopulations that need particular kinds of care, such as annual mammograms for women in a particular age group or HbA1c tests for diabetic patients at specified intervals.
Analytics using evidence-based guidelines and applied to a registry can reveal care gaps both on the individual and population levels. Patient-focused analytics can be used to alert providers and care teams so that they can make sure that a patient with a care gap receives the necessary attention. Population-based analytics provide a management tool that population health managers can use to evaluate how the organization is doing in comparison with past performance or benchmarks based on data from similar organizations. Some PHM dashboards allow care managers to drill down into the data to see which patients might need prompt attention.
Registries may also be combined with outreach tools. These applications enable organizations to automatically message patients, who have given their consent, for example, to remind them they need to make an appointment for necessary care.
Although leading EHRs include registries, along with some analytic and automation tools, these applications are most optimally designed to be used by a single healthcare organization, which may not have all of the data on a patient when care occurred outside that health system. Moreover, many EHR registries may not be designed to integrate non-EHR data such as claims data and when they are able to, considerable work needs to be performed by the EHR
implementation team to match patients with members. Also, EHR registries are generally still not as robust as the high quality PHM registry solutions, which may be stand-alone, part of a data warehouse, or linked to a cloud-based data lake platform.
Advanced registries integrate a broad variety of data, including clinical, claims, and patient-generated data. Besides generating meaningful intelligence for providers, they include financial and operational information that can help population health management teams plan their strategies.
Work listsProviders and care managers need lists of patients who meet certain criteria. For instance, a registry can be used to identify every diabetic patient who hasn’t had a foot exam, so that care teams can queue up those services on the patients’ next visit to their doctor.
Registry-based work lists can be used to alert care managers about high-risk patients who might require a higher level of attention. For instance, a care manager might call these patients to identify their barriers in getting appropriate care, or the work list can be used to trigger automated phone calls or send out letters to these people. The work list can also be cross-referenced with patients who have been readmitted to the hospital so that care managers can focus on preventing potential readmissions.
For a work list to be useful, it must be integrated into the workflow of the care team so that each member of the team has his or her tasks queued up for efficient care delivery.
Predictive modelingPredictive modeling is an advanced use case for the data infrastructure investment for population health management. This type of analytics uses algorithms to predict who is most likely to get sick or sicker or who will likely consume the greatest health resources. Because many of the most common predictive algorithms were developed to support prospective payment system, contracting, and benchmarking among payers, predictive modeling is still most often used with claims data. For example, the Hierarchal Condition Category (HCC) model is used with demographic and diagnosis data found in claims to generate a risk score to support reimbursement and benchmarking in Medicare Advantage plans. But the latest predictive analytics software can integrate clinical data, as well, enhancing the predictive model. And some of these tools have been applied to large public databases to draw inferences about individual patients’ health risks.
Watson Health
Data infrastucture for managing
Population Health
Page 10
Because of the need for timely, rich data in predictive modeling, a combination of clinical, claims, and patient-generated data typically provides substrate for such modeling. Predictive modeling also benefits from advanced machine learning algorithms that data scientists construct using the massively parallel computing infrastructure found in big data implementations.
Predictive modeling is also essential to financial risk management. Organizations that take financial risk can use predictive modeling to project how many of their patients are likely to be high utilizers and how much their care is likely to cost. At the individual level, such forecasts tend to be the most accurate for high-risk patients. Additionally, there are reliable methods of actuarially predicting the risk of entire populations.
It is also possible to predict the variability in costs using big data algorithms. The larger the data set, the more detailed these kinds of predictions can be. One model, for instance, has been shown to predict 70 percent of the variability in cost for any given Medicare patient, which is nearly twice as much as traditional models can forecast.24
The key to getting value from the power of predictive analytics is to select the right model for the outcome being predicted. Medicare and commercial insurance models for utilization are different from each other based on the population; so are models for financial and clinical risk which are used in different settings. If one is engaged in a hospital re-admission program, a different kind of model is required – a model that uses hospitalization criteria to predict the risk of re-admission within 30 days. If the goal is to not only predict, but mitigate risk, the criteria that are chosen should be modifiable so that interventions can be designed.
Risk stratificationRisk stratification, a subset of predictive modeling, classifies patients by their current or prospective health risk. This is important for organizations to know, because it forms the basis for deciding how to manage individual patients’ health. High-risk patients will typically receive the personal attention of care managers between visits, while those at lower risk levels may receive only online educational materials about their conditions and alerts about type of care they should consider seeking.
Risk stratification can help organizations decide where they might want to focus their resources. For example, if a large number of the sicker people in a population are obese and smoke, those are two significant areas for the organization to concentrate on.
Risk stratification is tied closely to risk adjustment, which uses algorithms to make data sets comparable by adjusting for the severity of illness of the patients referenced in each data set. Risk adjustment can be used for the evaluation of provider performance and variations in care. It also is essential to the sophisticated analysis of costs or utilization.
Performance evaluationThe population health data can be mined to show organizations how their physicians are doing in relation to evidence-based care guidelines, such as what percentage of their patients with diabetes had their feet checked at the last visit. When this data is fed back to providers, they’re usually interested in comparing their performance with that of their peers. Often, this transparency leads to greater awareness and modest improvements in performance without significant investment and is a necessary first step for most quality improvement initiatives.
Organizations can also use analytics to measure the variations in care among physicians and sites, both internally and in comparison to national benchmarks. These variations are often markers for inefficiency; for example, some doctors may be ordering a test for patients with a particular condition that does not help them diagnose the condition any better or faster than other physicians who don’t order that test. The Dartmouth Atlas of Healthcare has documented huge variations in care for a number of conditions across the US.25
Timely responseTo be useful and relevant in patient care, data analytics must be timely. Timeliness is obviously not possible if a report must be customized to answer a query. Even if the query matches a prebuilt report in an enterprise data warehouse, the response will not be helpful to a clinician if the patient data in the warehouse is not up to date. For example, test results or information on patient outreach should be available within a day of being documented so that clinicians can receive timely alerts.
Conventional data warehouses can’t aggregate and normalize clinical information this quickly. In ACOs and CINs that include many different business entities using multiple EHRs, the challenge is exponentially greater. For this reason, some healthcare organizations prefer to use stand-alone registries that can ingest and integrate the latest information more rapidly.26
Watson Health
Data infrastucture for managing
Population Health
The data lake approach, which encompasses registries, is even better for this purpose. The requested data can be quickly assembled in an ad hoc report in less than 24 hours, which is generally adequate for population health management. Admission/discharge/transfer alerts and some other kinds of data need to be available in less time than that, however, so additional solutions may be required.
The opposite problem can occur when data comes at physicians faster than they can react to it. Remote monitoring data, for example, needs to be screened so that doctors receive only alerts about relevant data regarding a patient’s health condition. For example, if an insulin-dependent patient has a continuous blood sugar monitoring device, it might be measuring his or her blood sugar every few minutes. Physicians would find it nearly impossible to look at or respond to dozens of readings an hour. In this example, the most critical information for the patient and provider to know is whether the patient is stable or is potentially at risk for a hypoglycemic crisis, and whether sharp variations in blood sugar indicate that the patient’s insulin dose should be adjusted. In some cases, those analytics may be embedded into the device for prompt feedback to the patient, and in other cases, the clinician may need to interpret the clinical situation before making a recommendation to a patient.
Other big data directionsBig data techniques are starting to be applied in several other areas that are important in population health management. For example, natural language processing is being used to extract valuable insights from unstructured data. It can also be used for pattern matching that may be useful in certain aspects of value-based care. NLP has already improved greatly in its ability to interpret medical terms within the context in which they’re used. Big data computational techniques are continuing to boost NLP capabilities in healthcare.
Big data analytics can also be used to create various kinds of risk models. These models use patients’ demographics, conditions, medications, the procedures they’ve had done on them, and other variables to calculate risk scores that predict how much individual patients will likely cost in healthcare resources. By aggregating these risk scores, organizations can determine their staffing needs; risk-adjust their cost, quality, and performance data; or figure out whether they can live within the terms of a capitation contract.
Meanwhile, geographical information systems (GIS) are being rapidly developed in a number of industries.27 Contemporary GIS, which use a big data approach to derive insights from where people live and work, are expected to be valuable in healthcare someday. For example, they might
show a correlation between residence in certain areas of a city where mold is a problem and the incidence of asthma in those areas. That kind of knowledge could be used in efforts to link social determinants of health with patient engagement strategies. Moreover, combining clinical and GIS types of data with another source, weather data, could lead to better management strategies for asthmatics who may be at risk of exacerbations. This mash-up of disparate data sets is a key value driver for big data strategies that efficiently allow for these types of analyses.
Big data is also being used in the rapidly growing field of precision medicine. Phenotypes based on EHR data are being correlated with genotypes derived from genomic sequencing. For example, researchers at Penn Medicine in Philadelphia recently found that small genetic differences among individuals can determine the varying effects on them of a particular antidiabetic drug.28 It seems likely that precision medicine will become mainstream. But first, physicians are likely to need an automated mechanism to help them interpret the meaning of genomic data in the context of the medical literature balancing value-driven insights with the reality of tipping clinicians into even more information overload and alert fatigue.
ConclusionA healthcare organization’s data infrastructure is critical to its success in population health management. Such an infrastructure must be robust, scalable, flexible, and capable of meeting the organization’s needs for many years. A holistic view of a patient is needed to support medical decision-making and avoid wasteful redundancy. Scalability is needed because of the huge data requirements of managing a large patient population. Flexibility is essential to provide a wide range of ad hoc reports quickly with limited customization. And the data infrastructure must be adaptable to changing conditions and new types of data to allow the organization’s health IT investment to evolve.
Because it can aggregate and normalize a wide variety of data, including data from disparate EHRs, claims data, and patient-generated data, a data lake affords a robust view of patient care. A data lake architecture is very scalable because the ability to store and process data can be quickly ramped up by adding computer clusters. The data lake’s ability to generate ad hoc reports without the need to bind data to business rules in advance provides far more flexibility than many conventional data warehouses offer. And the use of big data techniques that can accommodate data volume, velocity, and variety, provides a certain level of confidence that organizations will be able to use this kind of infrastructure now and as they grow.
Page 11
Watson Health
Data infrastucture for managing
Population Health

About IBM Watson HealthIn April 2015, IBM launched IBM Watson Health and the Watson Health Cloud platform. The new unit will work with doctors, researchers and insurers to help them innovate by surfacing insights from the massive amount of personal health data being created and shared daily. The Watson Health Cloud can mask patient identities and allow for information to be shared and combined with a dynamic and constantly growing aggregated view of clinical, research and social health data.
For more information on IBM Watson Health, visit: ibm.com/watsonhealth.
Page 12
Watson Health
Data infrastucture for managing
Population Health

Page 13
Footnotes
1. Jacquelyn S. Hunt, Richard F. Gibson,
John Whittington, Kitty Powell, Brad
Wozney, and Susan Knudson, “Guide for
Developing an Information Technology
Investment Road Map for Population
Health Management,” Population
Health Management, Vol. 18, No. 3,
2015, http://www.ncbi.nlm.nih.gov/
pubmed/25607932
2. Ibid, 2015.
3. Ken Terry, “Hospitals in Early Stage
of Analytics Usage,” InformationWeek
Healthcare, Sept. 11, 2013, accessed
at http://www.informationweek.com/
healthcare/clinical-information-systems/
hospitals-in-early-stage-of-analytics-
usage/d/d-id/1111502?
4. Terry, “Is Healthcare Big Data Ready
for Prime Time?” Information Week
Healthcare, Feb. 12, 2013, accessed at
http://www.informationweek.com/big-
data/big-data-analytics/is-healthcare-
big-data-ready-for-prime-time/d/d-
id/1108628.
5. IBM, “The Four V’s of Big Data,”
http://www.ibmbigdatahub.com/
infographic/four-vs-big-data.
6 Anil Jain, M.D, Mind your Ps and Qs
to make use of big data in healthcare,
TechTarget, Community Blog, 8/28/2013,
http://searchhealthit.techtarget.com/
healthitexchange/CommunityBlog/mind-
your-ps-and-qs-to-make-use-of-big-
data-in-healthcare/
7. Institute for Health Technology
Transformation, “Population Health
Management: A Roadmap for
Provider-Based Automation in a New
Era of Healthcare,” accessed at http://
ihealthtran.com/pdf/PHMReport.pdf
8 d’Amore J et al, Are Meaningful
Use Stage 2 certified EHRs ready for
interoperability? Findings from the
SMART C-CDA Collaborative, Journal
of the American Medical Informatics
Association, Nov. 2014, 21 (6) 1060-
1068; http://www.ncbi.nlm.nih.gov/
pubmed/24970839
9. IMS Health, press release,
“Patient Options Expand as Mobile
Healthcare Apps Address Wellness
and Chronic Disease Treatment
Needs,” Sept. 17, 2015, accessed at
http://www.businesswire.com/news/
home/20150917005044/en/IMS-
Health-Study-Patient-Options-Expand-
Mobile#VfrhjevxtNx
10. CMS, “Medicare and Medicaid
Programs; Electronic Health Records
Incentive Program-Stage 3 and
Modifications to Meaningful Use in
2015 Through 2017,” Federal Register,
80 FR 62761,Oct. 16, 2015, accessed
at https://www.federalregister.gov/
articles/2015/10/16/2015-25595/
medicare-and-medicaid-programs-
electronic-health-record-incentive-
program-stage-3-and-modifications
11. Terry, “Remote patient monitoring:
Fulfilling its promise,” Medical
Economics, Sept. 3, 2015, accessed
at http://medicaleconomics.
modernmedicine.com/medical-
economics/news/remote-
patient-monitoring-fulfilling-its-
promise?page=0,0
12. Colorado Beacon Consortium,
“Predict, Prioritize, Prevent: Nine things
practices should know about risk
stratification and panel management,”
Issue Brief, Vol. 2, Issue 2, 2013,
accessed at www.rmhpcommunity.org/
sites/default/files/resource/Vol.%20
2%20Issue%202%20Predict,%20
Prioritize,%20Prevent.pdf
13. Office of the National Coordinator
for Health IT, “Patient Identification and
Matching Final Report,” Feb. 7, 2014, 8,
accessed at http://www.healthit.gov/
sites/default/files/patient_identification_
matching_final_report.pdf
14. Mike Millard, “IBM unveils new
Watson-based analytics,” Healthcare IT
News, Oct. 25, 2011, accessed at http://
www.healthcareitnews.com/news/ibm-
unveils-new-watson-based-analytics-
capabilities
15. Adam Wright, Justine Pang, Joshua C.
Feblowitz, Francine L. Maloney, Allison
R. Wilcox, Karen Sax McLoughlin, Harley
Ramelson, Louise Schneider, and David
W. Bates, “Improving completeness
of electronic problem lists through
clinical decision support,” Journal of
the American Medical Informatics
Association (2012). doi:10.1136/
amiajnl-2011– 000521, http://www.ncbi.
nlm.nih.gov/pubmed/22215056
16. Amanda Parsons, Colleen
McCullough, Jason Wang, and Sarah
Shih, “Validity of electronic health
record-derived quality measurement
for performance monitoring,” Journal
of the American Medical Informatics
Association(2012). doi:10.1136/
amiajnl-2011– 000557, http://www.ncbi.
nlm.nih.gov/pubmed/22249967
17. Terry, “Natural Language Processing
Takes Center Stage in EHRs,”
InformationWeek Healthcare, March 2,
2012, http://www.informationweek.com/
healthcare/electronic-health-records/
natural-language-processing-takes-
center-stage-in-ehrs/d/d-id/1103163
18. JH Garvin, SL DuVall, BR South, BE
Bray, D Bolton, J Heavirland, S Pickard,
P Heidenreich, S Shen, C Weir, M
Samore, and MK Goldstein, “Automated
extraction of ejection fraction for
quality measurement using regular
expressions in Unstructured Information
Management Architecture (UIMA) for
heart failure,” Journal of the American
Medical Informatics Association,2012
Sep-Oct;19(5):859-66. doi: 10.1136/
amiajnl-2011-000535. Epub 2012
Mar 21, http://www.ncbi.nlm.nih.gov/
pubmed/22437073
19. Deloitte, “Health system analytics:
The missing key to unlock value-based
care,” 2015, accessed at http://www2.
deloitte.com/content/dam/Deloitte/us/
Documents/life-sciences-health-care/
us-dchs-provider-analytics-report.pdf
20. “5 Ways Data Lakes Improve
Healthcare Processes, Outcomes,”
Health Data Management, Sept.
21, 2015, accessed at http://www.
healthdatamanagement.com/gallery/5-
ways-data-lakes-improve-healthcare-
processes-outcomes-51260-1.html?utm_
21. Institute for Health Technology
Transformation,“Analytics: The Nervous
System of IT-Enabled Healthcare,” 2013,
accessed at http://ihealthtran.com/pdf/
iHT2analyticsreport.pdf?__
22. Ibid, 2013.
23. American Diabetes Association,
“Statistics About Diabetes,” http://www.
diabetes.org/diabetes-basics/statistics/
24. Anil Jain, MD, Watson Health,
personal communication, http://www.
ibm.com/common/ssi/cgi-bin/
25. The Dartmouth Atlas of Health Care,
http://www.dartmouthatlas.org
26. “Analytics: The Nervous System of
IT-Enabled Healthcare”, op. cit., 2013.
27. Christopher Jones, Geographical
Information Systems and Computer
Cartography. New York: Routledge,
2013, xiii.
28. Penn Medicine, “Genetic Variation
Determines Protein’s Response to Anti-
diabetic Drug,” July 2, 2015, accessed
at http://www.uphs.upenn.edu/news/
News_Releases/2015/07/lazar/
Watson Health
Data infrastucture for managing
Population Health
medium=email&ET=healthdatamanagement:
e5183565:3696614a:&utm_source=
newsletter&utm_campaign=daily-sep
%2021%202015&st=email
© Copyright IBM Corporation 2016
IBM Corporation
Software Group
Route 100
Somers, NY 10589
Produced in the United States of America
June 2016
IBM, the IBM logo, ibm.com, and Watson
Health are trademarks of International
Business Machines Corp., registered
in many jurisdictions worldwide. Other
product and service names might be
trademarks of IBM or other companies.
A current list of IBM trademarks is
available on the Web at “Copyright and
trademark information” at:
ibm.com/legal/copytrade.shtml
This document is current as of the initial
date of publication and may be changed
by IBM at any time. This document is
current as of the initial date of publication
and may be changed by IBM at any time.
Not all offerings are available in every
country in which IBM operates.
The information in this document is provided “as is” without any warranty, express or implied, including without any warranties of merchantability, fitness for a particular purpose and any warranty or condition of non-infringement.
IBM products are warranted accor-
ding to the terms and conditions of
the agreements under which they
are provided.
Statement of Good Security Practices:
IT system security involves protecting
systems and information through
prevention, detection and response
to improper access from within and
outside your enterprise. Improper access
can result in information being altered,
destroyed or misappropriated or can resu
lt in damage to or misuse of your systems,
including to attack others.
No IT system or product should be
considered completely secure and no
single product or security measure can
be completely effective in preventing
improper access. IBM systems and
products are designed to be part of
a comprehensive security approach,
which will necessarily involve additional
operational procedures, and may require
other systems, products or services to
be most effective. IBM does not warrant
that systems and products are immune
from the malicious or illegal conduct of
any party.
HP
W03
039-
US
EN
-02