Data-Driven Multiobjective Analysis of Manganese Leaching from Low Grade Sources Using Genetic...
17
PLEASE SCROLL DOWN FOR ARTICLE 7KLV DUWLFOH ZDV GRZQORDGHG E\ >,QGLDQ ,QVWLWXWH RI 7HFKQRORJ\ .KDUDJSXU@ 2Q $SULO $FFHVV GHWDLOV $FFHVV 'HWDLOV >VXEVFULSWLRQ QXPEHU @ 3XEOLVKHU 7D\ORU )UDQFLV ,QIRUPD /WG 5HJLVWHUHG LQ (QJODQG DQG :DOHV 5HJLVWHUHG 1XPEHU 5HJLVWHUHG RIILFH 0RUWLPHU +RXVH 0RUWLPHU 6WUHHW /RQGRQ :7 -+ 8. 0DWHULDOV DQG 0DQXIDFWXULQJ 3URFHVVHV 3XEOLFDWLRQ GHWDLOV LQFOXGLQJ LQVWUXFWLRQV IRU DXWKRUV DQG VXEVFULSWLRQ LQIRUPDWLRQ KWWSZZZLQIRUPDZRUOGFRPVPSSWLWOHaFRQWHQWW 'DWD'ULYHQ 0XOWLREMHFWLYH $QDO\VLV RI 0DQJDQHVH /HDFKLQJ IURP /RZ *UDGH 6RXUFHV 8VLQJ *HQHWLF $OJRULWKPV *HQHWLF 3URJUDPPLQJ DQG 2WKHU $OOLHG 6WUDWHJLHV $ULMLW %LVZDV D 2JLHU 0DLWUH E 'HEDQJD 1DQGDQ 0RQGDO D 6\DPDO .DQWL 'DV F 3URGLS .XPDU 6HQ D 3LHUUH &ROOHW E 1LUXSDP &KDNUDERUWL D D 'HSDUWPHQW RI 0HWDOOXUJLFDO DQG 0DWHULDOV (QJLQHHULQJ ,QGLDQ ,QVWLWXWH RI 7HFKQRORJ\ .KDUDJSXU ,QGLD E (TXLSH )RXLOOH GH 'RQQ«HV HW %LRLQIRUPDWLTXH 7K«RULTXH /DERUDWRLUH GHV 6FLHQFHV GH O,PDJH GH O,QIRUPDWLTXH HW GH OD 7«O«G«WHFWLRQ 8QLYHUVLW« GH 6WUDVERXUJ 6WUDVERXUJ )UDQFH F 0LQLVWU\ RI (DUWK 6FLHQFHV 1HZ 'HOKL ,QGLD 2QOLQH SXEOLFDWLRQ GDWH $SULO 7R FLWH WKLV $UWLFOH %LVZDV $ULMLW 0DLWUH 2JLHU 0RQGDO 'HEDQJD 1DQGDQ 'DV 6\DPDO .DQWL 6HQ 3URGLS .XPDU &ROOHW 3LHUUH DQG &KDNUDERUWL 1LUXSDP 'DWD'ULYHQ 0XOWLREMHFWLYH $QDO\VLV RI 0DQJDQHVH /HDFKLQJ IURP /RZ *UDGH 6RXUFHV 8VLQJ *HQHWLF $OJRULWKPV *HQHWLF 3URJUDPPLQJ DQG 2WKHU $OOLHG 6WUDWHJLHV 0DWHULDOV DQG 0DQXIDFWXULQJ 3URFHVVHV ٢ 7R OLQN WR WKLV $UWLFOH '2, 85/ KWWSG[GRLRUJ Full terms and conditions of use: http://www.informaworld.com/terms-and-conditions-of-access.pdf This article may be used for research, teaching and private study purposes. Any substantial or systematic reproduction, re-distribution, re-selling, loan or sub-licensing, systematic supply or distribution in any form to anyone is expressly forbidden. The publisher does not give any warranty express or implied or make any representation that the contents will be complete or accurate or up to date. The accuracy of any instructions, formulae and drug doses should be independently verified with primary sources. The publisher shall not be liable for any loss, actions, claims, proceedings, demand or costs or damages whatsoever or howsoever caused arising directly or indirectly in connection with or arising out of the use of this material.
Transcript of Data-Driven Multiobjective Analysis of Manganese Leaching from Low Grade Sources Using Genetic...

PLEASE SCROLL DOWN FOR ARTICLE
Full terms and conditions of use: http://www.informaworld.com/terms-and-conditions-of-access.pdf
This article may be used for research, teaching and private study purposes. Any substantial orsystematic reproduction, re-distribution, re-selling, loan or sub-licensing, systematic supply ordistribution in any form to anyone is expressly forbidden.
The publisher does not give any warranty express or implied or make any representation that the contentswill be complete or accurate or up to date. The accuracy of any instructions, formulae and drug dosesshould be independently verified with primary sources. The publisher shall not be liable for any loss,actions, claims, proceedings, demand or costs or damages whatsoever or howsoever caused arising directlyor indirectly in connection with or arising out of the use of this material.

Materials and Manufacturing Processes, 26: 415–430, 2011Copyright © Taylor & Francis Group, LLCISSN: 1042-6914 print/1532-2475 onlineDOI: 10.1080/10426914.2010.544809
Data-Driven Multiobjective Analysis of ManganeseLeaching from Low Grade Sources Using Genetic
Algorithms, Genetic Programming, and Other Allied Strategies
Arijit Biswas1, Ogier Maitre2, Debanga Nandan Mondal1, Syamal Kanti Das3,Prodip Kumar Sen1, Pierre Collet2, and Nirupam Chakraborti1
1Department of Metallurgical and Materials Engineering, Indian Institute of Technology, Kharagpur, India2Equipe Fouille de Données et Bioinformatique Théorique Laboratoire des Sciences de l’Image,
de l’Informatique et de la Télédétection, Université de Strasbourg, Strasbourg, France3Ministry of Earth Sciences, New Delhi, India
Data-driven models are constructed for leaching processes of various low grade manganese resources using various nature inspired strategiesbased upon genetic algorithms, neural networks, and genetic programming and subjected to a bi-objective Pareto optimization, once again usingseveral evolutionary approaches. Both commercially available software and in-house codes were used for this purpose and were pitted against eachother. The results led to an optimum trade-off between maximizing the recovery, which is a profit oriented requirement, along with a minimizationof the acid consumption, which addresses the environmental concerns. The results led to a very complex scenario, often with different trendsshown by the different methods, which were systematically analyzed.
Keywords Evolutionary algorithm; Genetic algorithms; Genetic programming; Leaching; Manganese; Multiobjective optimization; Oceannodules; Optimization; Pareto frontier.
IntroductionThe work presented here pertains to our recent
efforts [1–3] towards optimizing the manganese leachingprocess from low grade and unconventional sources usingan evolutionary approach. Considering the significantcurrent and projected demand of manganese, both inthe energy and steel sectors, formulating an optimizationstudy of the extraction processes of manganese fromthe low grade ores and unconventional sources, oceannodules [2, 3] for example, are immensely important.To date, such research is highly limited. The systemsthat we have studied in this work are (i) acid leachingof manganese carbonate ore [4] and (ii) leaching ofmanganiferous ore with sulfuric acid and lactose [5], withsulfuric acid and glucose [6], also with sulfuric acidand sucrose [7]. Following the strategies adopted in ourearlier work [1], data-driven models were constructed ineach case, followed by multiobjective optimization [8].The models were constructed using the recently proposedevolutionary neural network (EVO-NN) [1, 8] that treatsthe network training procedure as a multiobjective geneticalgorithm problem [9]. The objective functions constructedthis way were optimized through a modified predator–prey genetic algorithm described elsewhere [8]. Similardata driven models were also constructed through a genetic
Received July 2, 2010; Accepted November 22, 2010Address correspondence to Nirupam Chakraborti, Department of
Metallurgical & Materials Engineering, Indian Institute of Technology,Kharagpur 721 302, India; E-mail: [email protected]
programming procedure [10] to be detailed in this study.Several modules available in the commercial softwaremodeFRONTIERTM [11] were also utilized, both for modelbuilding and optimization. The major difference betweenthis work and its predecessor [1] lies in the fact that itattempts to analyze manganese carbonate leaching data [3]as well, which was not considered in the earlier task.It also presents a thorough comparison between variousstrategies of data-driven modeling and multiobjectiveanalysis. This is to comprehend their efficacy and tocritically examine the ubiquitous differences between theirpredictions, for a complex problem like the one in hand.More traditional kinetic models were also considered in ourearlier analyses [1] and are not repeated here consideringthe specific focus of the present study.The optimization process will be taken up in detail after
introducing the associated leaching processes.
Leaching of low grade manganese sourcesThe leaching experiments of low grade manganese
carbonate ore were conducted by Ma and Ek [3]. Theore contained 32.24–34.50% Mn, 10% CaO, 2.5% Al2O3,2.5–3.5% Fe, and 7–14% Si. The rest being the volatilematter. The leaching experiments were conducted in asulfuric acid medium stirred at 1200 rpm, using a beakerplaced in a water bath with very precise temperature control.The studied variables were (i) initial manganese content ofthe ore, (ii) particle size, and (iii) initial acid concentration.Manganiferous ores were also leached in the presence
of sulfuric acid [5–7], and either glucose [6], sucrose [7],or lactose [5] were used as an additional reactant. As
415
Downloaded By: [Indian Institute of Technology Kharagpur] At: 09:24 11 April 2011

416 A. BISWAS ET AL.
Figure 1.—Efficacy of carbonate leaching models using various strategies.
Figure 2.—The impact of acid concentration variations on the network for Mn recovery.
discussed in our earlier work [1], here the MnO2 is reducedto manganese sulfate, and the other metallic sulfates arereduced to their respective divalent states. Typically pHneeds to be maintained between 2 and 3. The basicdissolution reactions are as follows:
C6H12O6 + 12MnO2 + 12H2SO4 ! 6CO2 + 12MnSO4
+18H2O !Glucose medium"
C12H22O11 + 24MnO2 + 24H2SO4 ! 12CO2 + 24MnSO4
+35H2O !Lactose/Sucrose medium"#
The activation energy for the glucose case is repartedas 55 ± 1 kJ/mol [6], while the corresponding values forlactose and sucrose are 64#3 ± 0#8 kJ/mol [5] and 53 ±2 kJ/mol [7], respectively. Thus, the leaching in lactosemedium kinetically, is expected to be slightly less favorablethan the other two. The experimental studies [4–7] onmanganiferous ore leaching considered variation of anumber of parameters, namely, (i) the initial concentrationof reactants (acid and glucose or lactose or sucrose), (ii)temperature of leaching, and (iii) particle size. The modelingstrategy used earlier for these systems [1] was furtherenhanced here using genetic programming (GP) [10]. Thedetails of the data-driven optimization task are presentedbelow.
Downloaded By: [Indian Institute of Technology Kharagpur] At: 09:24 11 April 2011

DATA-DRIVEN MULTIOBJECTIVE ANALYSIS 417
Figure 3.—The impact of manganese concentration variation on the network for Mn recovery.
Figure 4.—The impact of particle size variation on the network for Mn recovery.
Constructing the data-driven modelsModeling the leaching data for subsequent usage as
an objective function was conducted using the followingapproaches: (i) multiobjective EVO-NN [1, 8], (ii)GP [12], and also (iii) the neural network and geneticprogramming modules available in modeFRONTIERTM.A brief description is presented here for these diversestrategies.
Multiobjective EVO-NNAmong the used strategies, the EVO-NN deals with
a population of neural networks, with variable topologyand weights in the lower part of the network, and fixedarchitecture in its upper part, that gets trained through alinear least square algorithm. Each member of the neuralnetwork population represents a possible data-driven modelfor the system in hand, with its own combination of trainingerror and model complexity. With increasing network
complexity, the training error goes down, but overfittingof data remains a potential problem. Conversely, forvery sparse networks with low model complexity, trainingerror goes up and underfitting of data becomes a likelyconsequence. In the former case, the model unnecessarilystarts picking up the noise in the data; in the latter caseit misses some of the real trends. The idea behind theevolutionary neural net is, therefore, to work out theoptimum trade-off between the training error and modelcomplexity. Since these are two conflicting requirements,a Pareto frontier [9] emerges between them, where eachmember denotes a unique and optimum model for thesystem, out of which a particular network is chosen using thewell-known Corrected Akaike criteria and the likes [1, 13].The total number of connections in the lower part ofthe network, excluding the biases, was taken as a simplemeasure of complexity, and the training error was expressedin a root mean square error (MSE) form. A crossoveroperation is performed in the lower portion of the network,
Downloaded By: [Indian Institute of Technology Kharagpur] At: 09:24 11 April 2011

418 A. BISWAS ET AL.
Figure 5.—Pareto frontiers for carbonate leaching computed for 60 minutes of leaching time.
Figure 6.—Pareto frontiers obtained for carbonate leaching by ranking the best solutions of all strategies. Relative contributions of various strategies are shownas insets.
and the weights are mutated, as discussed earlier [8]. Theupper portion of the network was intentionally left out ofthe evolutionary network, as the upper layer receives nearlyoptimized input from the lower layer, and in this situation,the gradient-based searches are expected to converge muchbetter than any genetic approaches.
GPEffectively a competitor for the neural networks for the
task of constructing a data-driven model, GP [10] attemptsto construct a mathematical function relating the outputsand the inputs, using a function set and a terminal setprovided by the user. The relevant mathematical operations,addition or subtraction for example, are provided in thefunction set, and the terminal set consists of the variablesand the constants. In this case, GP deals with a population
of mathematical functions (called individuals) encoded asa tree. Crossover takes place between a pair of parenttrees, and the resulting child is then mutated. The waythe population of trees is initialized is also very important.Usually, a maximum depth is prescribed for each tree. Ina procedure known as Full, the nodes are chosen from thefunction set till the tree reaches its maximum depth, and onlythe terminal nodes are added after that. An alternate is theGrow procedure, where nodes of both function and terminalsets are chosen till the tree reaches its maximum depth,beyond which only the terminal nodes are selected. Bothprocedures are mixed in a Ramped half and half way thatwas adopted in this study as it is the standard procedure usedin GP to create maximum diversity in the initial populationof individuals. Here, the tree depths are varied from 2 to theprescribed maximum, and equal number of trees are created
Downloaded By: [Indian Institute of Technology Kharagpur] At: 09:24 11 April 2011

DATA-DRIVEN MULTIOBJECTIVE ANALYSIS 419
Figure 7.—Efficacy of glucose leaching models using various strategies.
Figure 8.—Pareto frontiers for leaching with glucose computed for 15 minutes of leaching time.
using both Full and Grow procedures. Further details areavailable elsewhere [10].In this study, we chose to utilize the conventional tree-
based GP of ECJ (ECJ_GP) (a Java based evolutionaryoptimization library) [12] with some modifications to suitthe requirements of the problem. During evolution, somenodes can return invalid values, as the subtrees below themcalculate values unacceptably large or small, forcing theexecution to stop. In such situations, the rogue subtreeis replaced by another subtree of the same size andevaluated for any abnormalities. The procedure is continuedtill a normal subtree is grown, or a prescribed numberof attempts are reached, whichever earlier and in case anormal subtree could not be grown within a prescribed
number of attempts, a very low fitness is attributed to theconcerned individual. Another common problem was thatin some cases the outputs produced by the trees wouldmake very little physical sense. Such problems were tackledby assigning some constraints in the output space. Thesolutions which violated such constraints were penalizedfollowing a standard procedure.
modeFRONTIERTM
This is a professional multiobjective optimizationsoftware developed by Esteco Srl. [11]. Being ameticulously designed software, modeFRONTIERTM offersthe users several user friendly modules and the usersdecides on the flow path of their computations, selecting
Downloaded By: [Indian Institute of Technology Kharagpur] At: 09:24 11 April 2011

420 A. BISWAS ET AL.
Figure 9.—The impact of initial glucose concentration variation on the network for Mn recovery.
Figure 10.—The impact of initial acid concentration variation on the network for Mn recovery in glucose leaching.
the appropriate modules out of several alternates ina Graphics Users Interface (GUI). For example, inorder to construct a data-driven model, the usercan choose between a neural network module andmodule of GP. Similarly, the task of multiobjectiveoptimization can be carried out by choosing between thegenetic algorithms like Multi-objective Genetic Algorithm(MOGA) [14] and Non-dominated Sorting GeneticAlgorithm II (NSGA II) [8] or Multi-objective ParticleSwarm Optimization (MOPSO) [15]. After selecting thesuitable modules, the user gets to construct an executionflow chart for the task, which essentially the softwarefollows and provides adequate graphical support for theoutput data.
The optimization taskUsing the data-driven models as objective functions,
bi-objective optimization tasks were carried out. The ideawas to minimize the initial acid input and to simultaneouslymaximize the recovery of manganese for a fixed periodof leaching taken systematically between the minimumand maximum durations of the experiments. Similaroptimizations were carried for the acid leaching of carbonateores, as well as for the acid leaching of the manganiferousores in the presence of glucose, sucrose, or lactose. Sincethe two objective functions are conflicting to each other,they could not be optimized to their best individual values.This leads to the concept of Pareto-optimality [9] wherethe optimum is not just one particular solution, but rather
Downloaded By: [Indian Institute of Technology Kharagpur] At: 09:24 11 April 2011
DATA-DRIVEN MULTIOBJECTIVE ANALYSIS 421
Figure 11.—The impact of particle size variation on the network for Mn recovery in glucose leaching.
Figure 12.—The impact of leaching temperature variation on the network for Mn recovery in glucose leaching.
a family of solutions denoting the best possible trade-offs between the conflicting objectives. Collectively, theyconstitute the Pareto-frontier, and no member in the feasiblesolution space could be better than any one of them in termsof both objectives, or even, as good as in terms of oneand better in terms of the other. The members of Pareto-frontier are considered nondominating to each other, andany solution dominating them has to be infeasible.Here the Pareto-frontiers were constructed using various
strategies and results were compared.
Analyzing carbonate leachingThe carbonate leaching data [4] were generated for
various leaching times as a function of three importantvariables: (i) the particle size of the ore (ii) its Mn content,
and (iii) initial concentration of acid. Figure 1 presentsa comparison between the models constructed using (i)ECJ_GP [12], (ii) EVO-NN [8], (iii) neural network modulein modeFRONTIERTM (MD-ANN) [11], and also the (iv)GP module in modeFRONTIERTM (MD_GP) [11]. Themodel predictions are pitted against the actual experimentaldata and the corresponding MSE are also shown. Thedata representation strategy in Fig. 1 is similar to ourearlier work [1]. Here the data are plotted systematically,one complete experiment after another. The ascendingregions in the leaching data plots show the progress ofmanganese recovery as function of time for a particularexperiment. The descending lines simply connect the lastobservation of a particular experiment with the first inthe subsequent one, performed with a different variable
Downloaded By: [Indian Institute of Technology Kharagpur] At: 09:24 11 April 2011
422 A. BISWAS ET AL.
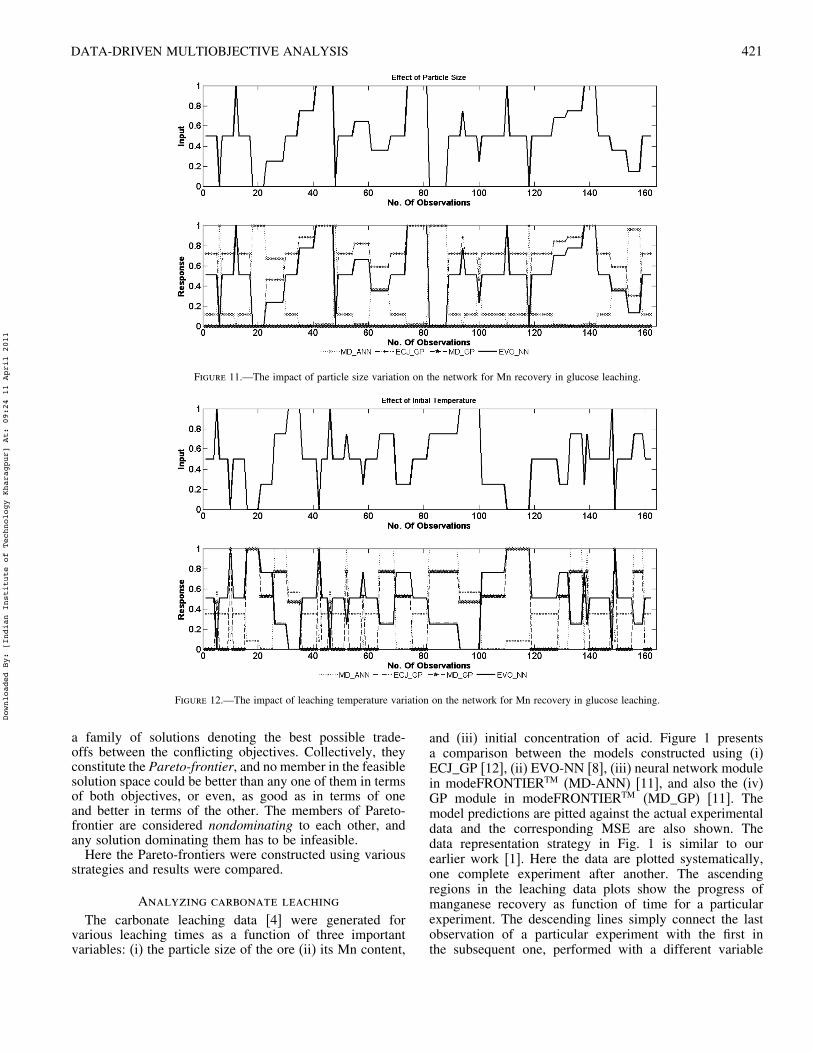
Figure 13.—Pareto frontiers obtained for leaching with glucose by ranking the best solutions of all strategies. Relative contributions of various strategies areshown as insets.
Figure 14.—Efficacy of lactose leaching models using various strategies.
setting. This mode of representation not only preserves thecontinuity in the data structure, but also allows identifyingand analyzing the performance of the model for eachof the individual experiments. This would be difficult toobtain from the overall scatter plots, more commonly usedfor fitted data representation. Although models could besuccessfully constructed using all the approaches, the MSEvalue remained smallest for the neural network module inmodeFRONTIERTM, while it was the highest for the GPmodule of that software. Chances are the former is a caseof slight overfitting and the latter possibly underfits the dataa bit. The MSE values for the remaining two strategies arein between these two extremes and the EVO-NN attempts
to safeguard against any over- and underparameterizations,as discussed earlier.One also needs to make sure whether the variables
influencing leaching are correlated to each other or not.We assessed it in a systematic way, following a strategydeveloped in our previous work [16]. Some trend plotswere constructed during that analysis, which are detailedin [17] and are not reproduced here. Those plots indicatedmutual dependence between any pair of variables amongthe three, in this case, adding further complications to themodeling task. It is, therefore, imperative that we attemptto investigate how the different models have correlated thevariation of the individual inputs to the output. A procedureadopted in our earlier studies [16, 18] has been effectively
Downloaded By: [Indian Institute of Technology Kharagpur] At: 09:24 11 April 2011

DATA-DRIVEN MULTIOBJECTIVE ANALYSIS 423
Figure 15.—Pareto frontiers for leaching with lactose computed for 15 minutes of leaching time.
Figure 16.—The impact of initial lactose concentration variation on the network for Mn recovery.
utilized for the purpose. The idea is to provide somearbitrary systematic variation in one of the input variables ata time, keeping the others at the base level. The systematicvariation includes some sharp increase and decrease inthe concerned variable, along with the regions of constantvalues. If the output response shows a qualitatively similarpattern of variation, then the particular input is directlycorrelated with the output. Alternately, an inverse responsein the output pattern would lead to an inverse correlation.No such explicit correlations may be discernable in somecases. The whole set of data was given to the models tocompute all the output responses at once. Therefore, themodels attempted to adjust to the entire set given to them,not to any individual observation in particular.In Fig. 2, the top panel shows the variation pattern for
the initial acid concentration, keeping the rest at the baselevel. The lower panel shows the corresponding response in
the productivity values obtained through various methods.In Figs. 3 and 4, similar plots are constructed, respectively,for Mn content and particle size variations. The natureof the input–output responses obtained from Figs. 2–4 issummarized in Table 1.It is evident from Table 1 that significant disparities
exist between various strategies in terms of the nature
Table 1.—The nature of input–output responses for various models ofcarbonate leaching.
MD_ANN ECJ_GP MD_GP EVO-NN
Acid Concentration Inverse Direct Direct InverseMn content Direct Inverse Inverse DirectParticle size Direct Inverse Inverse Inverse
Downloaded By: [Indian Institute of Technology Kharagpur] At: 09:24 11 April 2011

424 A. BISWAS ET AL.
Figure 17.—The impact of initial acid concentration variation on the network for Mn recovery in lactose leaching.
Figure 18.—The impact of particle size variation on the network for Mn recovery in lactose leaching.
of input–output correlations. Without the intricate mutualinteractions between the input variables, one would expectthe productivity to be directly correlated with the acidconcentration and the Mn content and inversely withparticle size. Except for the neural network model ofmodeFRONTIERTM, every other strategy has suggested aninverse correlation of productivity with the particle size.All the models suggest a complex interplay between theremaining two variables and, interestingly, the trends shownfor them are similar for both the neural networks and thoseare just reverse of the two GP models. In such a scenario,one should use any data driven model with caution, and anyattempt to overfit the data could be quite counterproductive.Next, the Pareto frontiers between the two objectives,
Mn recovery (F1) and Initial acid concentration (F2)
are computed using various strategies, namely, (i) GPand NSGAII [9] modules in modeFRONTIERTM(MD_GP_NSGA2), (ii) GP and MOGAII [14] modules inmodeFRONTIERTM(MD_GP_MOGA2), (iii) GP andMultiobjective Particle Swarm Optimization [15] modulesin modeFRONTIERTM (MD_GP_MOPSO), (iv) GP ofECJ and NSGAII (ECG_GP_NSGA2), (v) GP of ECJand MOGAII (ECJ_GP_MOGA2), (vi) GP of ECJand Multiobjective Particle Swarm Optimization (ECJ_GP_MOPSO), (vii) GP of ECJ and Multiobjective Predator–Prey Genetic Algorithm [8] (ECJ_GP_PPGA), (viii)EVO-NN with Predator–Prey Genetic Algorithm [1, 8](EVONN_PPGA), (ix) neural network and NSGAII [8]modules in modeFRONTIERTM (MD_ANN_NSGA2),(x) neural network and MOGAII [14] modules
Downloaded By: [Indian Institute of Technology Kharagpur] At: 09:24 11 April 2011

DATA-DRIVEN MULTIOBJECTIVE ANALYSIS 425
Figure 19.—The impact of temperature variation on the network for Mn recovery in lactose leaching.
Figure 20.—Pareto frontiers obtained for leaching with lactose by ranking the best solutions of all strategies. Relative contributions of various strategies areshown as insets.
in modeFRONTIERTM (MD_ANN_MOGA2), and (xi)neural network and Multiobjective Particle SwarmOptimization [15] modules in modeFRONTIERTM
(MD_ANN_MOPSO).For carbonate leaching, the Pareto-frontiers were
computed for 5, 15, 20, and 60 minutes of leaching times.Only the paradigm case of 60 minutes is presented in Fig. 5.The rest are available elsewhere [17]. The density andspread are two important indexes for the Pareto solutions [9]that varied from one strategy to another, as evident fromFig. 5.
For the ease of analysis, in Table 2, the performancesof various strategies are qualitatively classified as “Good,”“Sparse,” and “Poor.” A careful analysis would revealthat among the modeFRONTIERTM modules, GeneticProgramming worked well in combination with bothNSGAII and MOGAII, its performance, however, haddeteriorated, once the MOPSO module in the softwarewas used instead. The neural network model in themodeFRONTIERTM, however, had performed poorly onall occasions. The ECJ_GP worked well in combinationwith NSGAII or Predator–Prey Genetic Algorithm(PPGA), there was, however, some deterioration of
Downloaded By: [Indian Institute of Technology Kharagpur] At: 09:24 11 April 2011
426 A. BISWAS ET AL.
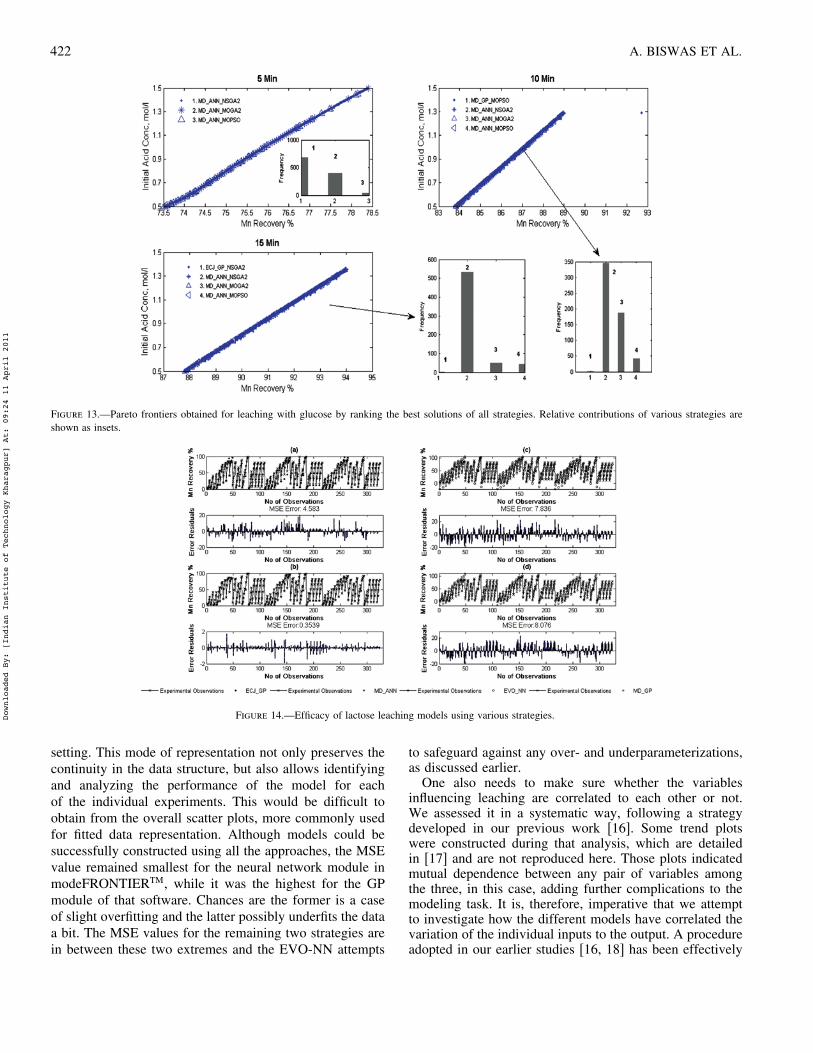
Figure 21.—Efficacy of sucrose leaching models using various strategies.
Figure 22.—Pareto frontiers for leaching with sucrose computed for 15 minutes of leaching time.
performance when MOGAII or MOPSO were used instead.The (EVONN_PPGA) combination worked well on alloccasions.The members of Pareto set varied slightly from one
strategy to another. The results obtained through variousstrategies consistently giving “Good” performance (Table 2)were, therefore, mixed together, and a Fonseca ranking [19]was done on them to determine the ultimate Paretofrontiers for different periods of leaching, as presented inFig. 6. Frequency plots of various strategies are shownas insets, showing their relative contributions to theseultimate Pareto frontiers. In most cases, strategies connectedwith both EVONN and ECJ_GP could contribute there:the former produced a more number of Pareto solutions,while the latter showed a better spread. Among themodeFRONTIERTM strategies, the GP module worked onlyin case of 60 minutes, with MD_GP_MOGA2 showing thehighest number of nondominated solutions.
Table 2.—Gradation of various strategies on the basis of density and spreadof carbonate leaching Pareto frontiers.
5 minutes 15 minutes 20 minutes 60 minutes
MD_GP_NSGA2 Good Good Good GoodMD_GP_MOGA2 Good Good Good GoodMD_GP_MPSO Sparse Sparse Sparse SparseECJ_GP_NSGA2 Good Good Good GoodECJ_GP_MOGA2 Sparse Sparse Sparse GoodECJ _GP_MOPSO Sparse Sparse Good GoodECJ _GP_PPGA Good Good Good GoodEVONN_PPGA Good Good Good GoodMD_ANN_NSGA2 Poor Poor Poor PoorMD_ANN_MOGA2 Poor Poor Poor PoorMD_ANN_MOPSO Poor Poor Sparse Sparse
Analyzing the leaching of manganiferous oresAll the modeling and optimization strategies described
above for the carbonate leaching case were extended to the
Downloaded By: [Indian Institute of Technology Kharagpur] At: 09:24 11 April 2011

DATA-DRIVEN MULTIOBJECTIVE ANALYSIS 427
Figure 23.—The impact of initial sucrose concentration variation on the network for Mn recovery.
Figure 24.—The impact of initial acid concentration variation on the network for Mn recovery in sucrose leaching.
leaching of manganiferous ores as well. The findings aresummarized for leaching with (i) glucose, (ii) lactose, and(iii) sucrose, respectively.
Leaching with GlucoseIn this case, through an analysis detailed elsewhere [17],
the input variables are found to be reasonably independentof each other. Performance of various models is checkedagainst the input data in Fig. 7. It seems that MD_ANN hasproduced a training error roughly an order of magnitudelower than the other strategies. This, in all probability,exhibits a pronounced tendency of overfitting, which isperhaps not desirable in the situation when the data are notfree from the experimental noise. Here the Pareto-frontierswere computed for 5, 10, and 15 minutes of leaching times
using various strategies. Only the typical case of 15 minutesis presented in Fig. 8. The rest are available elsewhere [17].Responses of Mn recovery to the individual variations
of (i) initial glucose concentration, (ii) initial acidconcentration, (iii) particle size, and (iv) temperature are
Table 3.—Variable responses for glucose leaching obtained through differentstrategies.
MD_ANN ECJ_GP MD_GP EvoNN
Glucose Direct Direct Mixed DirectInitial acid Direct Direct Direct DirectParticle size Inverse Direct No Response DirectTemperature Direct Inverse Direct Inverse
Downloaded By: [Indian Institute of Technology Kharagpur] At: 09:24 11 April 2011

428 A. BISWAS ET AL.
Figure 25.—The impact of leaching temperature variation on the network for Mn recovery in sucrose leaching.
Figure 26.—Pareto frontiers obtained for leaching with sucrose by ranking the best solutions of all strategies. Relative contributions of various strategies areshown as insets.
shown in Figs. 9–12. In each figure, the remaining twovariables are kept constant at the base level. The responsesobtained using various strategies are summarized in Table 3.Expectedly, the Mn recovery should be directly correlatedwith all the three variables other than the particle size, forwhich an inverse correlation is deemed to be appropriate. Itseems MD_ANN is the only strategy that could pick up allthe trends correctly. This has happened more by chance thanthe general superiority of the strategy, as we will shortlyexplore that in most other cases the MD_ANN strategyreally could not perform as well as it has done here forglucose leaching.The ultimate Pareto frontier formed by ranking a mixed
population of best solutions provided by all the strategies is
shown in Fig. 13. In this case, the major representation in thefrontiers came from the various MD_ANN–based strategies.The converged frontiers, however, present a differentregion of the functional space than what was obtainedearlier through EVO_ANN_PPGA strategy [1]. Therefore,although the solutions obtained by various MD_ANN–based strategies dominated the solutions created by theother strategies, it actually could not generate sufficientspread in the solution space, which appears to be a directconsequence of the overfitting tendency of the ANN moduleof modeFRONTIERTM: the model is so tightly bound to thetraining data set that it is unable to exhibit enough flexibilitywhile in the predictive mode.
Downloaded By: [Indian Institute of Technology Kharagpur] At: 09:24 11 April 2011

DATA-DRIVEN MULTIOBJECTIVE ANALYSIS 429
Table 4.—Variable responses for lactose leaching obtained through differentstrategies.
MD_ANN ECJ_GP MD_GP Evo-NN
Lactose Erratic Direct Direct DirectInitial acid Mostly direct Direct Direct DirectParticle size Direct Mixed Inverse No ResponseTemperature Direct Direct Direct Direct
Leaching with LactoseSimilar analyses were performed for leaching with
lactose, and the results are presented in Figs. 14–20. Likethe glucose case, the variables here are also found tobe basically independent of each other [17]. Once again,among the models constructed, the MD_ANN has showna training error that is an order of magnitude less than theother strategies, leading once again to the possibilities ofoverfitting. In this case, the Pareto frontiers were computedfor 5, 10, and 15 minutes of leaching time. Some typicalresults for 15 minutes are presented in Fig. 15. The restare available elsewhere [17]. A close examination of thePareto frontiers computed for lactose reveals that a numberof strategies could produce a good distribution of Paretopoints, while a few actually failed to do so. Strategies likeEVONN_PPGA and ECJ_GP_PPGA belong to the formercategory, while MD_ANN_MOGA2 andMD_ANN_MPSObelong to the latter. The nature of the individual variableresponses presented in Figs. 15–19 are summarized inTable 4. It seems that MD_GP has provided correctresponses for all the variables, while MD_ANN failed todo so. Both EVO_ANN and ECJ_GP produced correctresponses for the variables, initial lactose concentrationtemperature, and initial acid concentration, while for particlesize, EVO_ANN could not pick up any responses, and theresponse shown by ECJ_GP was a little ambiguous. In theultimate Pareto frontiers (Fig. 20), although a large fractionof points came through the MD_GP strategy, their spreadand diversity in the functional space are often not adequate.
Leaching with SucroseIn case of sucrose, we have one variable less, as the
impact of particle size variation was not studied. Theremaining three variables, temperature of leaching, and theinitial concentrations of acid and sucrose are somewhatcorrelated to each other [17]. Also, like in the previouscases, the MD_ANN model once again has shown anorder of magnitude less training error (Fig. 21). ThePareto frontiers created through different methods variedsomewhat. Figure 22, constructed for a leaching time of 15minutes, denotes a representative case. The correspondingresults for 5 and 10 minutes are available elsewhere [17].Here the ECJ_GP_MOGA2 strategy failed to produce anysignificant diversity of solutions in the functional space.The nature of the individual variable responses (Figs. 23–
25) is summarized in Table 5. In case of MD_ANN responsetowards the variation of initial acid concentration was a bitambiguous; however, it presented the correct trends for theremaining two variables, the initial concentration of sucrose,and the temperature of leaching. The trends predicted
Table 5.—Variable responses for sucrose leaching obtained through differentstrategies.
MD_ANN ECJ_GP MD_GP Evo-NN
Sucrose Direct Direct Direct DirectInitial Acid Mixed Direct Direct DirectTemperature Direct Direct Direct Direct
by the remaining three strategies, ECJ_GP, MD_GP, andEvoNN were, however, correct for all the three variables.In the ultimate Pareto frontiers (Fig. 26) a very significantcontribution came from the various strategies related tomodeFRONTIERTM, the diversity of the solutions, however,is not always very satisfactory.
Concluding remarksThe method of analysis demonstrated here would enable
one to make the right choice of operating conditionsfor the leaching of low grade Mn sources, satisfyingsome conflicting requirements. Genetic algorithms–basedPareto analysis abounds in the recent literature pertainingto materials processing [20–24], and strategies like GPare being significantly introduced as emerging techniques[25–29], which, in principle, could be rivals of evolutionaryneural net, despite its demonstrated success in the industrialscenario [30]. An extensive comparison between suchpromising alternates, as attempted in this study, has not beentried out so far and is long overdue. In view of the widediscrepancies between the results obtained through variousestablished methods, as demonstrated in this study, suchcomparisons, however, are absolutely essential. Althougha number of methods have been successful in sendingoptimum solutions to the ultimate Pareto frontiers likeFigs. 6, 13, 20, and 26, there is no obvious or clear-cut winner. For noisy experimental or industrial data,the best strategy would be to simultaneously use morethan one strategy, and to construct the ultimate optimacombining the best solutions provided by each, whichremain the motivation behind constructing the ultimatePareto frontiers in this study. The processing of lowgrade and unconventional resources of Mn is now gainingimportance [31] for which such a useful mode of analysis isyet to be explored fully. A real-life system usually behavesin a far more complex way than what could be described interms of some set mathematical functions, and any attemptsof constructing a data driven model or optimization forthem, as this study tends to indicate, needs to proceed withutmost caution.
AcknowledgmentAB, NC, PKS, acknowledge financial support from the
Ministry of Earth Sciences, India. AB also acknowledgesfinancial support from the Science and Technology Serviceof French Embassy in India through the SandwichPh.D./Post-doc scholarship program.
References1. Pettersson, F.; Biswas, A.; Sen, P.K.; Saxén, H.; Chakraborti,
N. Analyzing leaching data for low-grade manganese ore using
Downloaded By: [Indian Institute of Technology Kharagpur] At: 09:24 11 April 2011
430 A. BISWAS ET AL.
neural nets and multiobjective genetic algorithms. Mater. Manuf.Process 2009, 24, 320–330.
2. Biswas, A.; Chakraborti, N.; Sen, P.K. A genetic algorithmbased multi-objective optimization approach applied to ahydrometallurgical circuit for ocean nodules. Miner. Process Extr.M. 2009, 30, 163–189.
3. Biswas, A.; Chakraborti, N.; Sen, P.K. Multi-objectiveoptimization of manganese recovery from sea nodules usinggenetic algorithms. Mater. Manuf. Process 2009, 24, 22–30.
4. Ma, Z.; Ek, C. Rate processes and mathematical modelling ofthe acid leaching of manganese carbonate ore. Hydrometallurgy1991, 27, 125–139.
5. Veglio, F.; Trifoni, M.; Pagnanelli, F.; Toro, L. Shrinking coremodel with variable activation energy: A kinetic model ofmanganiferous ore leaching with sulphuric acid and lactose.Hydrometallurgy 2001, 60, 167–179.
6. Veglio, F.; Trifoni, M.; Toro, L. Leaching of manganiferousores by glucose in a sulfuric acid solution: Kinetic modelingand related statistical analysis. I and EC Research 2001, 40,3895–3901.
7. Beolchini, F.; Petrangelipanpini, M.; Toro, L.; Trifoni, M.;Veglio, F. Acid leaching of manganiferous ores by sucrose:kinetic modelling and related statistical analysis. Miner. Eng.2001, 14, 175–184.
8. Pettersson, F.; Chakraborti, N.; Saxén, H. A genetic algorithmsbased multiobjective neural net applied to noisy blast furnacedata. Appl. Soft. Comput. 2007, 7, 387–397.
9. Deb, K. Multi-Objective Optimization by EvolutionaryAlgorithms; John Wiley & Sons: Chichester, 2001.
10. Collet, P. Genetic programming. In: Handbook of Research onNature Inspired Computing for Economics and Management, Vol.1, Rennard, J.-P. (Ed.); Idea: Hershey, PA, 2007, pp. 59–73.
11. Poles, S.; Vassileva, M.; Sasaki, D. Multiobjective optimizationsoftware. In: Multiobjective Optimization, Interactive andEvolutionary Approaches, Lect. Notes Comput. Sc.; Branke,J., Deb, K., Miettinnen, K., S!owinski, R. (Eds.); Springer:Heidelberg, 2008, 5252, 329–348.
12. Laboratory, E.E.C.: Ecj: Version 18. Available at: http://cs.gmu.edu/"eclab/projects/ecj/ (accessed March 17, 2011).
13. Bhattacharya, B.; Kumar, G.R.D.; Agarwal, A; Erkoç, S.; Singh,A.; Chakraborti, N. Analyzing Fe-Zn system using moleculardynamics, evolutionary neural nets and multi-objective geneticalgorithms. Comp. Mater. Sci. 2009, 46, 821–827.
14. Poles, S.; Geremia, P.; Campos, F.; Weston, S.; Islam,M. MOGA-II for an automotive cooling duct optimizationon distributed resources. In: Evolutionary Multi-CriterionOptimization, Springer, Heidelberg, Lect. Notes Comput. Sc.Springer: Berlin-Heidelberg, 2007, 4403, 633–644.
15. Mostaghim, S.; Teich, J. Strategies for finding good localguides in multi- objective particle swarm optimization (MOPSO).In: 2003 IEEE Swarm Intelligence Symposium Proceedings,IEEE Service Center: Indianapolis, Indiana, USA, 2003,pp. 26–33.
16. Helle, M.; Pettersson, F.; Chakraborti, N.; Saxén, H. Modelingnoisy blast furnace data using genetic algorithms and neuralnetworks. Steel Res. Int. 2006, 77, 75–81.
17. Biswas, A. Optimization of process flowsheets for extraction ofnon ferrous metals from lean manganese bearing ores, DoctoralDissertation, Indian Institute of Technology, Kharagpur, 2011.
18. Govindan, D.; Chakraborty, S.; Chakraborti N. Analyzing thefluid flow in continuous casting through evolutionary neural netsand multi-objective genetic algorithms. Steel Res. Int. 2010, 81,197–203.
19. Fonseca, C.M. Multiobjective Genetic Algorithms withApplications to Control Engineering Problems. PhD thesis,Department ofAutomatic Control and Systems Engineering,University of Sheffield, Sheffield, UK, 1995.
20. Dulikravich, G.S.; Egorov, I.N.; Colaco, M.J. Optimizingchemistry of bulk metallic glasses for improved thermal stability.Model. Simul. Mater. Sc. 2008, 16, 7, Article Number: 075010.
21. Pettersson, F.; Saxén, H.; Deb, K. Genetic algorithm-basedmulticriteria optimization of ironmaking in the blast furnace.Mater. Manuf. Process 2009, 24, 343–349.
22. Gujarathi, A.M.; Babu, B.V. Improved multiobjective differentialevolution (MODE) approach for Purified Terephthalic Acid (PTA)oxidation process. Mater. Manuf. Process 2009, 24, 303–319.
23. Mitra, K.; Majumder, S.; Runkana, V. Multiobjective paretooptimization of an industrial straight grate Iron ore indurationprocess using an evolutionary Algorithm. Mater. Manuf. Process2009, 24, 331–342.
24. Jourdan, L.; Schutze, O.; Legrand, T.; Talbi, E.G.; Wojkiewicz,J.L. An Analysis of the effect of multiple layers in themulti-objective design of conducting polymer composites. Mater.Manuf. Process 2009, 24, 350–357.
25. Kovacic, M. Genetic Programming and Jominy test modeling.Mater. Manuf. Process 2009, 24, 806–808.
26. Baumes, L.A.; Collet, P. Examination of genetic programmingparadigm for high-throughput experimentation and heterogeneouscatalysis. Comp. Mater. Sci. 2009, 45, 27–40.
27. Baumes, L.A.; Blansche, A.; Serna, P.; Tchougang, A.; Lachiche,N.; Collet, P.; Corma, A. Using genetic programming foran advanced performance assessment of industrially relevantheterogeneous catalysts. Mater. Manuf. Process 2009, 24,282–292.
28. Kovacic, M.; Sarler, B. Application of the genetic programmingfor increasing the soft annealing productivity in steel industry.Mater.Manuf. Process 2009, 24, 369–374.
29. Dimitriu, R.C.; Bhadeshia, H.K.D.H.; Fillon, C.; Poloni,C. Strength of ferritic steels: neural networks and geneticprogramming. Mater. Manuf. Process 2009, 24, 10–15.
30. Agarwal, A.; Tewari, U.; Pettersson, F;,Das, S.; Saxén, H.;Chakraborti, N. Analysing blast furnace data using evolutionaryneural network and multiobjective genetic algorithms. Ironmak.Steelmak 2010, 37, 353–359.
31. Sen, P.K. Metals and Materials from deep sea nodules. Anoutlook for the future. Int. Mater. Rev. 2010, 55, 364–391.
Downloaded By: [Indian Institute of Technology Kharagpur] At: 09:24 11 April 2011