
Multiobjective Genetic Algorithm-Based Fuzzy Clustering
15
IEEE TRANSACTIONS ON EVOLUTIONARY COMPUTATION, VOL. 13, NO. 5, OCTOBER 2009 991 Multiobjective Genetic Algorithm-Based Fuzzy Clustering of Categorical Attributes Anirban Mukhopadhyay, Ujjwal Maulik, Senior Member, IEEE, and Sanghamitra Bandyopadhyay, Senior Member, IEEE Abstract —Recently, the problem of clustering categorical data, where no natural ordering among the elements of a categorical attribute domain can be found, has been gaining significant attention from researchers. With the growing demand for cat- egorical data clustering, a few clustering algorithms with focus on categorical data have recently been developed. However, most of these methods attempt to optimize a single measure of the clustering goodness. Often, such a single measure may not be appropriate for different kinds of datasets. Thus, consideration of multiple, often conflicting, objectives appears to be natural for this problem. Although we have previously addressed the problem of multiobjective fuzzy clustering for continuous data, these algorithms cannot be applied for categorical data where the cluster means are not defined. Motivated by this, in this paper a multiobjective genetic algorithm-based approach for fuzzy clustering of categorical data is proposed that encodes the cluster modes and simultaneously optimizes fuzzy compactness and fuzzy separation of the clusters. Moreover, a novel method for obtaining the final clustering solution from the set of resultant Pareto- optimal solutions in proposed. This is based on majority voting among Pareto front solutions followed by k -nn classification. The performance of the proposed fuzzy categorical data-clustering techniques has been compared with that of some other widely used algorithms, both quantitatively and qualitatively. For this purpose, various synthetic and real-life categorical datasets have been considered. Also, a statistical significance test has been conducted to establish the significant superiority of the proposed multiobjective approach. Index Terms— Categorical attributes, fuzzy clustering, multi- objective genetic algorithm, Pareto optimality. I. I NTRODUCTION C LUSTERING [1]–[3] is a popular unsupervised pattern- classification approach in which a given dataset is par- titioned into a number of distinct groups based on some similarity/dissimilarity measures. If each data point is assigned to a single cluster, then the clustering is called crisp clustering. On the other hand, if a data point has certain degrees of belongingness to each cluster, the partitioning is called fuzzy. Manuscript received February 19, 2008; revised October 27, 2008; accepted December 16, 2008. Current version published September 30, 2009. A. Mukhopadhyay is with the Department of Computer Science and Engineering, University of Kalyani, Kalyani-741235, India (e-mail: anirban@ klyuniv.ac.in). U. Maulik is with the Department of Computer Science and Engineer- ing, Jadavpur University, Kolkata-700032, India (e-mail: drumaulik@cse. jdvu.ac.in). S. Bandyopadhyay is with the Machine Intelligence Unit, Indian Statistical Institute, Kolkata-700108, India (e-mail: [email protected]). Color versions of one or more of the figures in this paper are available online at http://ieeexplore.ieee.org. Digital Object Identifier 10.1109/TEVC.2009.2012163 Most of the clustering algorithms are designed for datasets where the dissimilarity between any two points of the dataset can be computed using standard distance measures such as Euclidean distance. However, many real-life datasets are cat- egorical in nature, where no natural ordering can be found among the elements in the attribute domain. In such situations, the clustering algorithms, such as K-means [1], fuzzy C-means (FCM) [4], etc., cannot be applied. The K-means algorithm computes the center of a cluster by computing the mean of the set of feature vectors belonging to that cluster. However, as categorical datasets do not have any inherent distance measure, computing the mean of a set of feature vectors is meaningless. A variation of the K-means algorithm, namely partitioning around medoids (PAM) or K-medoids [3], has been proposed for such datasets. In PAM, instead of the cluster center, the cluster medoid, i.e., the most centrally located point in a cluster, is determined. Unlike cluster center, a cluster medoid must be an actual data point. Another extension of the K-means is the K-modes, algorithm [5], [6]. Here, the cluster centroids are replaced by cluster modes (described later). A fuzzy version of the K-modes algorithm, i.e., fuzzy K-modes, is also proposed in [7]. Recently, a Hamming distance (HD) vector-based categorical data clustering algorithm (CCDV) has been developed in [8]. Hierarchical algorithms, such as average linkage [1], are also widely used to cluster categorical data. Some other developments in this area are available in [9]– [11]. However, all these algorithms rely on optimizing a single objective to obtain the partitioning. A single objective function may not work uniformly well for different kinds of categorical data. Hence, it is natural to consider multiple objectives that need to be optimized simultaneously. Genetic algorithms (GAs) [12]–[14] are popular search and optimization strategies guided by the principle of Darwinian evolution. Although genetic algorithms have been previously used in data clustering problems [15]–[17], as earlier, most of them use a single objective to be optimized, which is hardly equally applicable to all kinds of datasets. To solve many real- world problems, it is necessary to optimize more than one objective simultaneously. Clustering is an important real-world problem, and different clustering algorithms usually attempt to optimize some validity measure such as the compactness of the clusters, separation among the clusters, or a combination of both. (The problem of clustering categorical data poses an ad- ditional level of complexity because it is not possible to define the mean of a cluster.) However, as the relative importance of different clustering criteria is unknown, it is better to optimize 1051-8215/$26.00 © 2009 IEEE Authorized licensed use limited to: INDIAN INSTITUTE OF INFORMATION TEHNOLOGY. Downloaded on November 28, 2009 at 23:17 from IEEE Xplore. Restrictions apply.
Transcript of Multiobjective Genetic Algorithm-Based Fuzzy Clustering
IEEE TRANSACTIONS ON EVOLUTIONARY COMPUTATION, VOL. 13, NO. 5, OCTOBER 2009 991
Multiobjective Genetic Algorithm-Based FuzzyClustering of Categorical Attributes
Anirban Mukhopadhyay, Ujjwal Maulik, Senior Member, IEEE,and Sanghamitra Bandyopadhyay, Senior Member, IEEE
Abstract— Recently, the problem of clustering categorical data,where no natural ordering among the elements of a categoricalattribute domain can be found, has been gaining significantattention from researchers. With the growing demand for cat-egorical data clustering, a few clustering algorithms with focuson categorical data have recently been developed. However, mostof these methods attempt to optimize a single measure of theclustering goodness. Often, such a single measure may not beappropriate for different kinds of datasets. Thus, considerationof multiple, often conflicting, objectives appears to be naturalfor this problem. Although we have previously addressed theproblem of multiobjective fuzzy clustering for continuous data,these algorithms cannot be applied for categorical data where thecluster means are not defined. Motivated by this, in this papera multiobjective genetic algorithm-based approach for fuzzyclustering of categorical data is proposed that encodes the clustermodes and simultaneously optimizes fuzzy compactness and fuzzyseparation of the clusters. Moreover, a novel method for obtainingthe final clustering solution from the set of resultant Pareto-optimal solutions in proposed. This is based on majority votingamong Pareto front solutions followed by k-nn classification. Theperformance of the proposed fuzzy categorical data-clusteringtechniques has been compared with that of some other widelyused algorithms, both quantitatively and qualitatively. For thispurpose, various synthetic and real-life categorical datasets havebeen considered. Also, a statistical significance test has beenconducted to establish the significant superiority of the proposedmultiobjective approach.
Index Terms— Categorical attributes, fuzzy clustering, multi-objective genetic algorithm, Pareto optimality.
I. INTRODUCTION
CLUSTERING [1]–[3] is a popular unsupervised pattern-classification approach in which a given dataset is par-
titioned into a number of distinct groups based on somesimilarity/dissimilarity measures. If each data point is assignedto a single cluster, then the clustering is called crisp clustering.On the other hand, if a data point has certain degrees ofbelongingness to each cluster, the partitioning is called fuzzy.
Manuscript received February 19, 2008; revised October 27, 2008; acceptedDecember 16, 2008. Current version published September 30, 2009.
A. Mukhopadhyay is with the Department of Computer Science andEngineering, University of Kalyani, Kalyani-741235, India (e-mail: [email protected]).
U. Maulik is with the Department of Computer Science and Engineer-ing, Jadavpur University, Kolkata-700032, India (e-mail: [email protected]).
S. Bandyopadhyay is with the Machine Intelligence Unit, Indian StatisticalInstitute, Kolkata-700108, India (e-mail: [email protected]).
Color versions of one or more of the figures in this paper are availableonline at http://ieeexplore.ieee.org.
Digital Object Identifier 10.1109/TEVC.2009.2012163
Most of the clustering algorithms are designed for datasetswhere the dissimilarity between any two points of the datasetcan be computed using standard distance measures such asEuclidean distance. However, many real-life datasets are cat-egorical in nature, where no natural ordering can be foundamong the elements in the attribute domain. In such situations,the clustering algorithms, such as K-means [1], fuzzy C-means(FCM) [4], etc., cannot be applied. The K-means algorithmcomputes the center of a cluster by computing the mean ofthe set of feature vectors belonging to that cluster. However,as categorical datasets do not have any inherent distancemeasure, computing the mean of a set of feature vectors ismeaningless. A variation of the K-means algorithm, namelypartitioning around medoids (PAM) or K-medoids [3], hasbeen proposed for such datasets. In PAM, instead of the clustercenter, the cluster medoid, i.e., the most centrally located pointin a cluster, is determined. Unlike cluster center, a clustermedoid must be an actual data point. Another extension of theK-means is the K-modes, algorithm [5], [6]. Here, the clustercentroids are replaced by cluster modes (described later). Afuzzy version of the K-modes algorithm, i.e., fuzzy K-modes,is also proposed in [7]. Recently, a Hamming distance (HD)vector-based categorical data clustering algorithm (CCDV)has been developed in [8]. Hierarchical algorithms, such asaverage linkage [1], are also widely used to cluster categoricaldata. Some other developments in this area are available in [9]–[11]. However, all these algorithms rely on optimizing a singleobjective to obtain the partitioning. A single objective functionmay not work uniformly well for different kinds of categoricaldata. Hence, it is natural to consider multiple objectives thatneed to be optimized simultaneously.
Genetic algorithms (GAs) [12]–[14] are popular search andoptimization strategies guided by the principle of Darwinianevolution. Although genetic algorithms have been previouslyused in data clustering problems [15]–[17], as earlier, most ofthem use a single objective to be optimized, which is hardlyequally applicable to all kinds of datasets. To solve many real-world problems, it is necessary to optimize more than oneobjective simultaneously. Clustering is an important real-worldproblem, and different clustering algorithms usually attempt tooptimize some validity measure such as the compactness ofthe clusters, separation among the clusters, or a combination ofboth. (The problem of clustering categorical data poses an ad-ditional level of complexity because it is not possible to definethe mean of a cluster.) However, as the relative importance ofdifferent clustering criteria is unknown, it is better to optimize
1051-8215/$26.00 © 2009 IEEE
Authorized licensed use limited to: INDIAN INSTITUTE OF INFORMATION TEHNOLOGY. Downloaded on November 28, 2009 at 23:17 from IEEE Xplore. Restrictions apply.
992 IEEE TRANSACTIONS ON EVOLUTIONARY COMPUTATION, VOL. 13, NO. 5, OCTOBER 2009
compactness and separation separately rather than combiningthem into a single measure to be optimized. Motivated by thisfact, in this paper, the problem of fuzzy partitioning of categor-ical dataset is modeled as one of multiobjective optimizations(MOOs) [13], [18]–[20], where search is performed over anumber of often conflicting objective functions. Multiobjectivegenetic algorithms (MOGAs) are used in this regard in orderto determine the appropriate cluster centers (modes) and thecorresponding partition matrix. Non-dominated sorting GA-II(NSGA-II) [21], which is a popular elitist MOGA, is usedas the underlying optimization method. The two objectivefunctions, i.e., the global fuzzy compactness of the clusters andfuzzy separation, are optimized simultaneously. Unlike singleobjective optimization, which yields a single best solution,in MOO the final solution set contains a number of Pareto-optimal solutions, none of which can be dominated or furtherimproved on any one objective without degrading another [13],[18]. This paper also proposes a novel method for selecting thefinal clustering solution from the set of Pareto-optimal solutionbased on majority voting among the Pareto front solutions,followed by k-nn classification.
Multiobjective optimization has recently been gaining pop-ularity. There are some instances in the literature that ap-plied multiobjective techniques for data clustering. One ofthe earliest approaches in this field is found in [22], whereobjective functions representing compactness and separationof the clusters were optimized in a crisp clustering contextand with a deterministic method. In [23], a tabu search-basedmultiobjective clustering technique has been proposed, wherethe partitioning criteria are chosen as the within-cluster sim-ilarity and between-cluster dissimilarity. This technique usessolution representation based on cluster centers, as in [15].However, experiments are mainly based on artificial distancematrices. A series of works on multiobjective clustering hasbeen proposed in [24]–[26], where the authors have adoptedchromosome encoding of length equal to the number of datapoints. The two objectives that were optimized are overalldeviation (compactness) and connectivity. The algorithm in[24] is capable of handling categorical data, whereas the othertwo papers deal with numeric and continuous datasets. Thesemethods have advantages that they can automatically evolvethe number of clusters and can also be used to find non-convex shaped clusters. It may be noted that the chromosomelength in these works is equal to the number of points to beclustered. Hence, as discussed in [27], when the length of thechromosomes becomes equal to the number of points n to beclustered, the convergence becomes slower for the large valuesof n. This is due to the reason that the chromosomes, and hencethe search space, in such cases become large. However, in [25],a special mutation operator is used to reduce the effectivesearch space by maintaining a list of L nearest neighbors foreach data point, where L is a user-defined parameter. Thisallows faster convergence of the algorithm toward the globalPareto optimal front, making it scalable for larger datasets. Thealgorithm needs to compute the cluster means, which is com-putationally less costly than computation of cluster modes, tofind the value of one of the objective functions (overall clusterdeviation). Moreover, this algorithm uses special initialization
routines based on the minimum spanning tree method and isintended for crisp clustering of continuous data. In contrast,the method proposed in this paper uses a center (mode) basedencoding strategy for fuzzy clustering of the categorical data.The computation of the cluster modes in costlier than that ofthe cluster means, and the algorithm needs to compute thefuzzy membership matrices that takes a reasonable amountof time. However, as fuzzy clustering is better equipped tohandle overlapping clusters [28], the proposed technique canhandle both overlapping and non-overlapping clusters. Theexperimental results also indicate that the incorporation offuzziness significantly improves the performance of clustering.
In the context of multiobjective fuzzy clustering, in [29], amultiobjective evolutionary technique has been proposed thatintegrates NSGA-II with FCM clustering to simultaneouslyreduce the dimensionality and find the best partitioning.However, this method does not use NSGA-II in the clusteringstep directly (where FCM is used in its traditional form).NSGA-II is used on the upper level to determine the featuresto be selected as well as the parameters of FCM. Moreover,this method is only applicable for continuous numericdatasets, not for categorical data. In [19] and [30], we haveaddressed the problem of multiobjective fuzzy clustering usingNSGA-II with a similar center-based encoding technique.These algorithms optimize two cluster validity measures,namely, FCM error function Jm [4] and Xie-Beni (XB)index [31]. The selection of the solution from the finalnon-dominated set has been done using a third cluster validitymeasure, such as I index [2] or Silhouette index [32], andthus, it is sensitive to the choice of the third validity measure.Most importantly, these techniques can only be applied forclustering continuous data, such as remote sensing imagery[19] and microarray gene expression data [30], and cannotbe applied for clustering categorical data where the clustermeans are not defined.
The main contribution of the present paper is that it proposesa fuzzy multiobjective algorithm for clustering categoricaldata. As far as our knowledge goes, none of the previous workshas addressed the issue of multiobjective fuzzy clustering inthe categorical domain. Unlike the works in [19] and [30],where chromosomes encode the cluster means (centers), here,the chromosomes encode the cluster modes, and hence, theydiffer in the chromosome updation process. Two fuzzy objec-tive functions, viz., fuzzy compactness and fuzzy separation,have been simultaneously optimized resulting in a set of non-dominated solutions. Subsequently, a novel technique basedon majority voting among the non-dominated Pareto-optimalsolutions followed by k-nn classification is proposed to obtainthe final clustering solution from the set of non-dominated so-lutions. Thus, the requirement of the third cluster validity mea-sure for selecting the final solution from the Pareto-optimal setand the resulting bias are eliminated. Moreover, unlike [29],where NSGA-II is used to select the clustering parameters ofFCM (which is essentially a single objective clustering thatminimizes cluster variance), here, NSGA-II has directly beenused in the clustering stage. This enables the algorithm tocome out of the local optima, whereas FCM is known tooften fall in local optima. Furthermore, the use of NSGA-II in
Authorized licensed use limited to: INDIAN INSTITUTE OF INFORMATION TEHNOLOGY. Downloaded on November 28, 2009 at 23:17 from IEEE Xplore. Restrictions apply.
MUKHOPADHYAY et al.: MULTIOBJECTIVE GENETIC ALGORITHM-BASED FUZZY CLUSTERING OF CATEGORICAL ATTRIBUTES 993
the clustering stage allows the method to suitably balance thedifferent characteristics of clustering, unlike single objectivetechniques. Thus, by using NSGA-II directly for clustering, aPareto optimal front of non-dominated solutions is generated,which allows us to use k-nn classification to find the mostpromising clustering solution from it.
The major purpose of this paper is to establish that theproblem of fuzzy clustering of categorical data can be posed asone of multiobjective optimization of fuzzy compactness andseparation, and this leads to improved performance. NSGA-IIis a widely used multiobjective optimization technique whichis applied in this regard. However, any other multiobjectiveoptimization technique within the evolutionary computationframework, such as SPEA2 [33] or AMOSA [20], could havebeen used.
Experiments have been carried out for four synthetic andfour real-life categorical datasets. Comparison has been madeamong different algorithms, such as fuzzy K-modes, K-modes,K-medoids, average linkage, CCDV, the single objective GA(SGA)-based clustering algorithms, and the proposed NSGA-IIbased multiobjective fuzzy clustering scheme. The superiorityof the multiobjective algorithm has been demonstrated bothquantitatively and visually. Also, statistical significance testsare conducted in order to confirm that the superior perfor-mance of the proposed technique is significant and does notoccur by chance.
The rest of the paper is organized as follows: the next sec-tion describes the problem of fuzzy clustering for categoricaldata. Section III discusses the basic concepts of multiobjectiveoptimization. In Section IV, the proposed multiobjective fuzzyclustering technique is described in detail. Section V describessome clustering algorithms used for the comparison purpose.The experimental results are provided in Section VI. In Sec-tion VII, results for statistical significance tests are reported.Finally, Section VIII concludes the paper.
II. FUZZY CLUSTERING OF CATEGORICAL DATA
This section describes the fuzzy K-modes clustering algo-rithm [7] for categorical datasets. The fuzzy K-modes algo-rithm is the extension of the well-known FCM [4] algorithmin categorical domain. Let X = {x1, x2, . . . , xn} be a set ofn objects having categorical attribute domains. Each objectxi , i = 1, 2, . . . , n is described by a set of p attributesA1, A2, . . . , Ap. Let DOM(A j ), 1 ≤ j ≤ p denote thedomain of the j th attribute, and it consists of different q j
categories such as DOM(A j ) = {a1j , a2
j , . . . , aq jj }. Hence, the
i th categorical object is defined as xi = [xi1, xi2, . . . , xip],where xij ∈ DOM(A j ), 1 ≤ j ≤ p.
The cluster centers in the FCM are replaced by clustermodes in the fuzzy K-modes clustering. A mode is definedas follows: Let Ci be a set of categorical objects belongingto cluster i . Each object is described by attributes A1,A2, . . . , Ap. The mode of Ci is a vector mi = [mi1, mi2, . . . ,mip], mij ∈ DOM(A j ), 1 ≤ j ≤ p such that the followingcriterion is minimized:
D(mi , Ci ) =∑x∈Ci
D(mi , x). (1)
Here, D(mi , x) denotes the dissimilarity measure betweenmi and x . Note that mi is not necessarily an element of set Ci .
The fuzzy K-modes algorithm partitions the dataset X intoK clusters by minimizing the following criterion:
Jm(U, Z : X) =n∑
k=1
K∑i=1
umik D(zi , xk). (2)
For probabilistic fuzzy clustering, the following are theconditions that must hold while minimizing Jm :
0 ≤ uik ≤ 1, 1 ≤ i ≤ K , 1 ≤ k ≤ n (3)
K∑i=1
uik = 1, 1 ≤ k ≤ n (4)
and
0 <
n∑k=1
uik < n, 1 ≤ i ≤ K (5)
where m is the fuzzy exponent. U = [uik] denotes theK ×n fuzzy partition matrix, and uik denotes the membershipdegree of the kth categorical object to the i th cluster. Z ={z1, z2, . . . , zK } represents the set of cluster centers (modes).
Fuzzy K-modes algorithm is based on an alternating opti-mizing strategy. This involves iteratively estimating the par-tition matrix followed by computation of new cluster centers(modes). It starts with random initial K modes, and then, atevery iteration, it finds the fuzzy membership of each datapoint to every cluster using the following equation [7]:
uik = 1∑Kj=1
(D(zi ,xk )D(z j ,xk )
) 1m−1
, for 1 ≤ i ≤ K , 1 ≤ k ≤ n.
(6)Note that while computing uik using (6), if D(z j , xk) is
equal to zero for some j , then uik is set to zero for all i =1, . . . , K , i �= j , while u jk is set equal to 1.
Based on the membership values, the cluster centers(modes) are recomputed as follows. If the membership valuesare fixed, then the locations of the modes that minimize theobjective function in (2) will be [7] zi = [zi1, zi2, . . . , zip],where zij = ar
j ∈ DOM(A j ), and∑k,xkj=ar
j
umik ≥
∑k,xkj=at
j
umik, 1 ≤ t ≤ q j , r �= t. (7)
The algorithm terminates when there is no noticeable im-provement in Jm value (2). Finally, each object is assignedto the cluster to which it has the maximum membership.The main disadvantages of the fuzzy K-modes clusteringalgorithms are that 1) it depends heavily on the initial choiceof the modes, and 2) it often gets trapped into some localoptimum.
III. MULTIOBJECTIVE OPTIMIZATION USING
GENETIC ALGORITHMS
In many real-world situations, there may be several objec-tives that must be optimized simultaneously in order to solve acertain problem. This is in contrast to the problems tackled by
Authorized licensed use limited to: INDIAN INSTITUTE OF INFORMATION TEHNOLOGY. Downloaded on November 28, 2009 at 23:17 from IEEE Xplore. Restrictions apply.
994 IEEE TRANSACTIONS ON EVOLUTIONARY COMPUTATION, VOL. 13, NO. 5, OCTOBER 2009
conventional GAs, which involve optimization of just a singlecriterion. The main difficulty in considering multiobjectiveoptimization is that a single optimum solution does not exist,and therefore, it is difficult to compare one solution withanother. In general, these problems admit multiple solutions,each of which is considered acceptable and equivalent whenthe relative importance of the objectives is unknown. The bestsolution is subjective and depends on the need of the designeror the decision maker.
As evolutionary algorithms are population-based methods, itis straightforward to extend them to handle multiple objectives.On the contrary, it is difficult to extend the traditional searchand optimization methods such as gradient descent search, andother non-conventional ones, such as simulated annealing, tothe multiobjective case, since they deal with a single solution.
The multiobjective optimization can be formally stated asfollows [18]. Find the vector x̄∗ = [x∗
1 , x∗2 , . . . , x∗
n ]T of thedecision variables that will satisfy the m inequality constraints
gi (x̄) ≥ 0, i = 1, 2, . . . , m (8)
and the p equality constraints
hi (x̄) = 0, i = 1, 2, . . . , p (9)
and optimizes the vector function
f (x̄) = [ f1(x̄), f2(x̄), . . . , fk(x̄)]T . (10)
The constraints given in (8) and (9) define the feasibleregion F which contains all the admissible solutions. Anysolution outside this region is inadmissible since it violatesone or more constraints. The vector x̄∗ denotes an optimalsolution in F . In the context of multiobjective optimization,the difficulty lies in the definition of optimality, since it isonly rarely that we will find a situation where a single vectorx̄∗ represents the optimum solution with respect to all theobjective functions.
The concept of Pareto optimality comes handy in thedomain of multiobjective optimization. A formal definition ofPareto optimality from the viewpoint of minimization problemmay be given as follows. A decision vector x̄∗ is called Paretooptimal if and only if there is no x̄ that dominates x̄∗, i.e., thereis no x̄ such that
∀i ∈ {1, 2, . . . , k}, fi (x̄) ≤ fi (x̄∗) and
∃i ∈ {1, 2, . . . , k}, fi (x̄) < fi (x̄∗).
In words, x̄∗ is Pareto optimal if there exists no feasiblevector x̄ that causes a reduction of some criterion without asimultaneous increase in at least another. In general, Pareto op-timum usually admits a set of solutions called non-dominatedsolutions.
There are different approaches to solving multiobjectiveoptimization problems [13], [18], e.g., aggregating, popula-tion based non-Pareto, and Pareto-based techniques. In ag-gregating techniques, the different objectives are generallycombined into one using weighting or goal-based method.Vector evaluated genetic algorithm (VEGA) is a technique inthe population-based non-Pareto approach in which differentsubpopulations are used for the different objectives. Multiple
objective GA (MOGA), non-dominated sorting GA (NSGA),and niched Pareto GA (NPGA) constitute a number of tech-niques under the Pareto-based non-elitist approaches [13].NSGA-II [21], SPEA [34], and SPEA2 [33] are some recentlydeveloped multiobjective elitist techniques. The present paperuses NSGA-II as the underlying multiobjective algorithm fordeveloping the proposed fuzzy clustering method.
IV. MULTIOBJECTIVE FUZZY CLUSTERING FOR
CATEGORICAL ATTRIBUTES
In this section, the method of using NSGA-II for evolvinga set of near-Pareto-optimal non-degenerate fuzzy partitionmatrices is described.
A. Chromosome Representation
Each chromosome is a sequence of attribute values repre-senting the K cluster modes. If each categorical object has pattributes {A1, A2, . . . , Ap}, the length of a chromosome willbe K × p, where the first p positions (or genes) represent thep-dimensions of the first cluster mode, the next p positionsrepresent that of the second cluster mode, and so on. As anillustration let us consider the following example. Let p = 3and K = 3. Then, the chromosome
c11 c12 c13 c21 c22 c23 c31 c32 c33
represents the three cluster modes (c11, c12, c13), (c21, c22,c23), and (c31, c32, c33), where cij denotes the j th attributevalue of the i th cluster mode. Also, cij ∈ DOM(A j ), 1 ≤ i ≤K , 1 ≤ j ≤ p.
B. Population Initialization
The initial K cluster modes encoded in each chromosomeare chosen as K random objects of the categorical dataset.This process is repeated for each of the P chromosomes inthe population, where P is the population size.
C. Computation of Objective Functions
In this paper, the global compactness π [35] of the clustersand the fuzzy separation Sep [35] have been considered as thetwo objectives that need to be optimized simultaneously. Forcomputing the measures, the modes encoded in a chromosomeare first extracted. Let these be denoted as z1, z2, . . . , zK . Themembership values uik, i = 1, 2, . . . , K and k = 1, 2, . . . , nare computed as follows [7]:
uik = 1∑Kj=1
(D(zi ,xk )D(z j ,xk )
) 1m−1
, for 1 ≤ i ≤ K , 1 ≤ k ≤ n
(11)where D(zi , xk) and D(z j , xk) are as described earlier. mis the weighting coefficient. [Note that while computing uik
using (11), if D(z j , xk) is equal to zero for some j , thenuik is set to zero for all i = 1, . . . , K , i �= j , while ujk
is set equal to 1.] Subsequently, each mode encoded in a
Authorized licensed use limited to: INDIAN INSTITUTE OF INFORMATION TEHNOLOGY. Downloaded on November 28, 2009 at 23:17 from IEEE Xplore. Restrictions apply.

MUKHOPADHYAY et al.: MULTIOBJECTIVE GENETIC ALGORITHM-BASED FUZZY CLUSTERING OF CATEGORICAL ATTRIBUTES 995
chromosome is updated to zi = [zi1, zi2, . . . , zip], wherezij = ar
j ∈ DOM(A j ) [7], and∑k,xkj=ar
j
umik ≥
∑k,xkj=at
j
umik, 1 ≤ t ≤ q j , r �= t. (12)
This means that the category of the attribute A j of the clus-ter centroid zi is set to the category value that attains themaximum value of the summation of uij (the degrees ofmembership to the i th cluster) over all categories. Accordingly,the cluster membership values are recomputed as per (11).
The variation σi and fuzzy cardinality ni of the i th clusteri = 1, 2, . . . , K are calculated using the following equa-tions [35]:
σi =n∑
k=1
umik D(zi , xk), 1 ≤ i ≤ K (13)
and
ni =n∑
k=1
uik, 1 ≤ i ≤ K . (14)
The global compactness π of the solution represented bythe chromosome is then computed as [35]
π =K∑
i=1
σi
ni=
K∑i=1
∑nk=1 um
ik D(zi , xk)∑nk=1 uik
. (15)
To compute the other fitness function fuzzy separation Sep,the mode zi of the i th cluster is assumed to be the center ofa fuzzy set {z j |1 ≤ j ≤ K , j �= i}. Hence, the membershipdegree of each z j to zi , j �= i is computed as [35]
μij = 1∑Kl=1,l �= j
( D(z j ,zi )D(z j ,zl )
) 1m−1
, i �= j. (16)
Subsequently, the fuzzy separation is defined as [35]
Sep =K∑
i=1
K∑j=1, j �=i
μmij D(zi , z j ). (17)
Note that in order to obtain compact clusters, the measureπ should be minimized. On the contrary, to get well-separatedclusters, the fuzzy separation Sep should be maximized. As inthis paper the multiobjective problem is posed as minimizationof both the objectives, the objective is to minimize π and1/Sep simultaneously.
As multiobjective clustering deals with simultaneous op-timization of more than one clustering objective, its per-formance depends highly on the choice of these objectives.Careful choice of objectives can produce remarkable results,whereas arbitrary or unintelligent objective selection can un-expectedly lead to bad situations. The selection of objectivesshould be such so that they can balance each other criticallyand are possibly contradictory in nature. Contradiction inthe objective functions is beneficial since it guides to globaloptimum solution. It also ensures that no single clusteringobjective is optimized leaving the other probable significantobjectives unnoticed.
Although several cluster validity indices exist, a carefulstudy reveals that most of these consider the cluster com-pactness and separation in some form [2], [36]. Hence, inthis paper, we have chosen to optimize the global clustervariance π (reflective of cluster compactness) and the fuzzyseparation Sep (reflective of cluster separation). The purposeof this paper is to establish the effectiveness of the basicprinciple of multiobjective fuzzy clustering for categoricaldata. However, an exhaustive study involving two or moreother powerful fuzzy cluster validity indices will constitute anarea of interesting future work.
D. Selection, Crossover, and Mutation
The popularly used genetic operations are selection, cross-over, and mutation. The selection operation used here isthe crowded binary tournament selection used in NSGA-II.After selection, the selected chromosomes are put in themating pool. Conventional single-point crossover dependingon crossover probability μc has been performed to generatethe new offspring solutions from the chromosomes selectedin the mating pool. For performing the mutation, a mutationprobability μm has been used. If a chromosome is selectedto be mutated, the gene position that will undergo mutationis selected randomly. After that, the categorical value of thatposition is replaced by another random value chosen fromthe corresponding categorical domain. The most characteristicpart of NSGA-II is its elitism operation, where the non-dominated solutions among the parent and child populationsare propagated to the next generation. For details on thedifferent genetic processes, see [13]. The near-Pareto-optimalstrings of the last generation provide the different solutions tothe clustering problem.
E. Selecting a Solution From the Non-dominated Set
As discussed earlier, the multiobjective GA-based categor-ical data clustering algorithm produces near-Pareto-optimalnon-dominated set of solutions in the final generation. Hence,it is necessary to choose a particular solution from amongthe set of non-dominated solutions N. This problem has beenaddressed in several recent research works [37]–[41], wheresearch is focussed to identify the solutions situated at the“knee” regions of the non-dominated front. In [25], the authorsproposed a post-processing approach, where the most completePareto front approximation set is obtained first, and then, itis reduced to a single solution. The method is motivated byGAP statistic [42] and makes use of several domain-specificconsiderations.
The technique adopted in this paper is used to search forthe complete approximated Pareto front and apply a post-processing to identify the solution that shares most informationprovided by all the non-dominated solutions. In this approach,all the non-dominated solutions have been given equal impor-tance, and the idea is to extract the combined clustering infor-mation. In this regard, a majority voting technique followedby k-nearest neighbor (k-nn) classification has been adoptedin order to select a single solution from the set of the non-dominated solutions.
Authorized licensed use limited to: INDIAN INSTITUTE OF INFORMATION TEHNOLOGY. Downloaded on November 28, 2009 at 23:17 from IEEE Xplore. Restrictions apply.

996 IEEE TRANSACTIONS ON EVOLUTIONARY COMPUTATION, VOL. 13, NO. 5, OCTOBER 2009
First, the clustering label vectors are computed from theunique non-dominated solutions produced by the proposedmultiobjective technique. This is done by assigning each ofthe data points to the cluster to which it has the highestmembership. Subsequently, a majority voting technique hasbeen applied to the label vectors, and the points that are labeledwith same class by at least 50% solutions are identified. Beforeapplying the majority voting, we ensure the consistency amongthe label vectors of the different solutions, i.e., cluster i of thefirst solution should match the cluster i of all other solutions.This is done as follows.
Let X = {l1, l2, . . . , ln} be the label vector of the firstnon-dominated solution, where each li ∈ {1, 2, . . . , K } isthe cluster label of the point xi . At first, X is relabeled sothat the first point is labeled 1 and the subsequent points arelabeled accordingly. To relabel X , first a vector L of lengthK is formed that stores the unique class labels from X inthe order of their first appearance in X . The vector L iscomputed as follows:
k = 1, Lk = l1, lab = {L1}for i = 2, . . . , n
if li /∈ lab thenk = k + 1.
Lk = li .
lab = lab ∪ {li }.end if
end for
Then a mapping M:L → {1, . . . , K } is defined as follows:
∀i = 1, . . . , K ,M[Li ] = i. (18)
Next a temporary vector T of length n is obtained byapplying the above mapping on X as follows:
∀i = 1, 2, . . . , n, Ti = M[li ]. (19)
After that, X is replaced by T . This way X is relabeled.For example, let initially X = {33111442}. After relabeling,it would be {11222334}.
Now, the label vector of each of the other non-dominatedsolutions is modified by comparing it with the label vectorof the first solution as follows. Let N be the set of non-dominated solutions (label vectors) produced by the proposedmultiobjective clustering technique and X be the relabeledcluster label vector of the first solution. Suppose Y ∈ N \ X(i.e., Y is a label vector in N other than X ) is another labelvector which is to be relabeled in accordance with X . This isdone as follows: First, for each unique class label l in X , allthe points Pl that are assigned the class label l in X are found.Thereafter, observing the class labels of these points from Y ,we obtain the class label b from Y , which is assigned for themaximum number of points in Pl . Then, a mapping Mapb isdefined as Mapb : b → l. This process is repeated for eachunique class label l ∈ {1, . . . , K } in X . After getting all themappings Mapb for all unique class labels b ∈ {1, . . . , K }in Y , these are applied on Y to relabel Y in accordance with
X . All the non-dominated solutions Y ∈ N \ X are relabeledin accordance with X as discussed above.
Note that the mapping Map should be one to one to ensurethat after relabeling, Y contains all the K class labels. Thisconstraint may be violated while finding b, especially in casesof ties. This situation is handled as follows. If a one-to-onemapping cannot be obtained, we try to match all possiblerelabelings, i.e., K ! number of relabelings of Y and find thebest match with X . The best matched relabeling of Y is kept.
Consider the following example. Let X be {11222334}and two other label vectors be Y = {22444113} and Z ={42333221}. If Y and Z are relabeled to make them consistentwith X , then relabeled Y becomes {11222334}, and relabeledZ becomes {13222334}.
After relabeling all the label vectors, majority voting isapplied for each point. The points that are voted by atleast 50% of the solutions to have a particular class labelare now taken as the training set for the remaining points.The remaining points are assigned a class label according tok-nn classifier. That is, for each unassigned points, k-nearestneighbors are computed, and the point is assigned a classlabel that is obtained by the majority voting of the k-nearestneighbors. The value for k is selected as 5.
Application of majority voting followed by k-nn classi-fication produces a new cluster label vector X that sharesthe clustering information of all the non-dominated solutions.Thereafter, the percentage of matching with X is computed foreach of the label vectors corresponding to each non-dominatedsolution. The label vector of the non-dominated solution thatmatches best with X is chosen from the set of the non-dominated solutions.
V. CONTESTANT METHODS
This section describes the contestant clustering algorithmsthat are used for the purpose of performance comparison.
A. K-medoids
Partitioning around medoids (PAM), which is also called theK-medoids clustering [3], is a variation of the K-means withthe objective to minimize the within cluster variance W(K)
W (K ) =K∑
i=1
∑x∈Ci
D(mi , x). (20)
Here, mi is the medoid of cluster Ci , and D(.) denotes adissimilarity measure. A cluster medoid is defined as the mostcentrally located point within the cluster, i.e., it is the pointfrom which the sum of distances to the other points of thecluster is minimum. Thus, a cluster medoid always belongs tothe set of input data points X . The resulting clustering of thedataset X is usually only a local minimum of W (K ). The ideaof PAM is to select K representative points, or medoids, in Xand to assign the rest of the data points to the cluster identifiedby the closest medoid. Initial medoids are chosen randomly.Then, all points in X are assigned to the nearest medoid. Ineach iteration, a new medoid is determined for each clusterby finding the data point with minimum total dissimilarity to
Authorized licensed use limited to: INDIAN INSTITUTE OF INFORMATION TEHNOLOGY. Downloaded on November 28, 2009 at 23:17 from IEEE Xplore. Restrictions apply.

MUKHOPADHYAY et al.: MULTIOBJECTIVE GENETIC ALGORITHM-BASED FUZZY CLUSTERING OF CATEGORICAL ATTRIBUTES 997
all other points of the cluster. Subsequently, all the points inX are reassigned to their clusters in accordance with the newset of medoids. The algorithm iterates until W (K ) no longerchanges.
B. K-modes
K-modes clustering [6] is the crisp version of the fuzzyK-modes algorithm. The K-modes algorithm works similar tothe K-medoids with the only difference that here, instead ofmedoids, modes are used to represent a cluster. The K-modesalgorithm minimizes the following objective function:
TC(K ) =K∑
i=1
∑x∈Ci
D(mi , x). (21)
Here, mi denotes the mode of the cluster Ci . The mode ofa set of points P is a point (not necessarily belongs to P)whose j th attribute value is computed as the most frequentvalue of the j th attribute over all the points in P . If thereare more than one most frequent value, one of them is chosenarbitrarily. The iteration steps are similar to K-medoids andonly differ in center (mode) updating process.
C. Hierarchical Agglomerative Clustering
Agglomerative clustering techniques [1] begin with single-ton clusters and combine two least distant clusters at everyiteration. Thus, in each iteration, two clusters are merged, andhence, the number of clusters is reduced by one. This proceedsiteratively in a hierarchy, providing a possible partitioning ofthe data at every level. When the target number of clusters(K ) is achieved, the algorithms terminate. Single, average, andcomplete linkage agglomerative algorithms differ only in thelinkage metric used, i.e., they differ in computing the distancebetween two clusters. For the single linkage algorithm, thedistance between two clusters Ci and C j is computed as thesmallest distance between all possible pairs of data points xand y, where x ∈ Ci , and y ∈ C j . For the average and thecomplete linkage algorithms, the linkage metrics are taken asthe average and largest distances, respectively.
D. Clustering Categorical Data Based on Distance Vectors
Clustering categorical data based on distance vectors(CCDV) [8] is a recently proposed clustering algorithm forcategorical attributes. CCDV sequentially extracts the clustersfrom a given dataset based on the Hamming distance (HD)vectors, with automatic evolution of number of clusters. Ineach iteration, the algorithm identifies only one cluster, whichis then deleted from the dataset at the next iteration. Thisprocedure continues until there are no more significant clustersin the remaining data. For the identification and extraction of acluster, the cluster center is first located by using a Pearson chi-squared-type statistic on the basis of HD vectors. The outputof the algorithm does not depend on the order of the inputdata points.
E. Single Objective GA-based Fuzzy Clustering Algorithms
Three single objective GA (SGA) based clustering algo-rithms with different objective functions have been consid-ered here. All the algorithms have the same chromosomerepresentation as that of the multiobjective one and similargenetic operators. The first SGA-based algorithm minimizesthe objective function π , and thus, we call it SGA(π ). Thesecond SGA-based clustering maximizes Sep, and hence, itis named SGA(Sep). The last one minimizes the objectivefunction π/Sep, and it is named SGA(π , Sep).
F. Multiobjective GA-based Crisp Clustering Algorithm
To establish the utility of incorporating fuzziness, a multiob-jective crisp clustering algorithm (MOGAcrisp) for categoricaldata has been utilized. This algorithm uses similar encodingtechnique and similar genetic operators as the proposed multi-objective fuzzy clustering method. The only difference is thatit optimizes the crisp versions of the objective functions de-scribed in (15) and (17), respectively. The objective functionsfor MOGAcrisp are as follows:
πcrisp =K∑
i=1
σi
ni=
K∑i=1
∑xk∈Ci
D(zi , xk)∑nk=1 R(zi , xk)
(22)
Sepcrisp =K∑
i=1
K∑j=1, j �=i
D(zi , z j ). (23)
Here R(zi , xk) is defined as follows:
R(zi , xk) ={
1, ifxk ∈ Ci
0, otherwise.(24)
Here Ci denotes the i th cluster and all other symbols havethe same meaning as before. The data points are assigned toparticular clusters as per nearest distance criterion. The finalsolution is selected from the generated non-dominated frontfollowing the procedure described in Section IV-E.
VI. RESULTS AND DISCUSSION
The performance of the proposed algorithm has been eval-uated on four synthetic datasets (Cat250_15_5, Cat100_10_4,Cat500_20_10, and Cat280_10_6) and four real-life datasets(Congressional Votes, Zoo, Soybean, and Breast cancer).
A. Dissimilarity Measures
As stated earlier, there is no inherent distance/dissimilaritymeasure, such as Euclidean distance, that can be directlyapplied to compute the dissimilarity between two categoricalobjects. This is because there is no natural order among thecategorical values of any particular attribute domain. Hence, itis difficult to measure the dissimilarity between two categoricalobjects.
In this paper following dissimilarity measure has been usedfor all the algorithms considered. Let xi = [xi1, xi2, . . . , xip],and x j = [x j1, x j2, . . . , xjp] be two categorical objects de-scribed by p categorical attributes. The dissimilarity measurebetween xi and x j , D(xi , x j ), can be defined by the total
Authorized licensed use limited to: INDIAN INSTITUTE OF INFORMATION TEHNOLOGY. Downloaded on November 28, 2009 at 23:17 from IEEE Xplore. Restrictions apply.
998 IEEE TRANSACTIONS ON EVOLUTIONARY COMPUTATION, VOL. 13, NO. 5, OCTOBER 2009
50 100 150 200 250
50
100
150
200
250
(a)
10 20 30 40 50 60 70 80 90 100
10
20
30
40
50
60
70
80
90
100
(b)
50 100 150 200 250 300 350 400 450 500
50
100
150
200
250
300
350
400
450
500
(c)
50 100 150 200 250
50
100
150
200
250
(d)
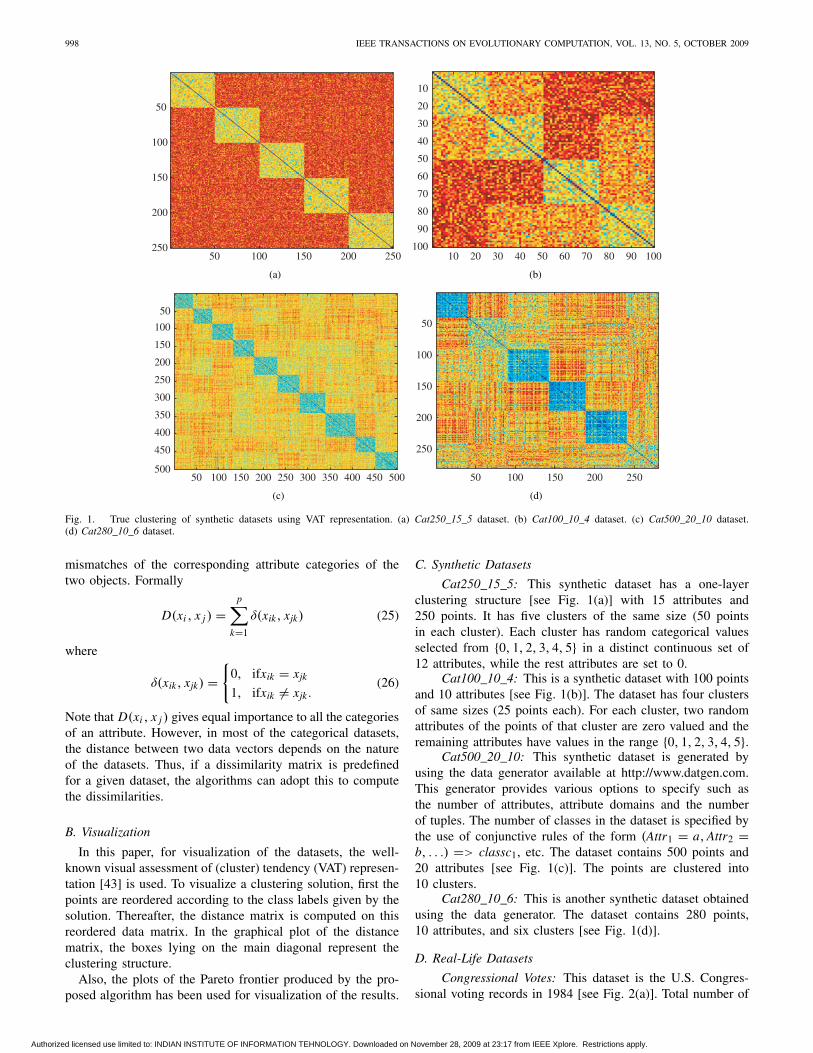
Fig. 1. True clustering of synthetic datasets using VAT representation. (a) Cat250_15_5 dataset. (b) Cat100_10_4 dataset. (c) Cat500_20_10 dataset.(d) Cat280_10_6 dataset.
mismatches of the corresponding attribute categories of thetwo objects. Formally
D(xi , x j ) =p∑
k=1
δ(xik, xjk) (25)
where
δ(xik, xjk) ={
0, ifxik = xjk
1, ifxik �= xjk .(26)
Note that D(xi , x j ) gives equal importance to all the categoriesof an attribute. However, in most of the categorical datasets,the distance between two data vectors depends on the natureof the datasets. Thus, if a dissimilarity matrix is predefinedfor a given dataset, the algorithms can adopt this to computethe dissimilarities.
B. Visualization
In this paper, for visualization of the datasets, the well-known visual assessment of (cluster) tendency (VAT) represen-tation [43] is used. To visualize a clustering solution, first thepoints are reordered according to the class labels given by thesolution. Thereafter, the distance matrix is computed on thisreordered data matrix. In the graphical plot of the distancematrix, the boxes lying on the main diagonal represent theclustering structure.
Also, the plots of the Pareto frontier produced by the pro-posed algorithm has been used for visualization of the results.
C. Synthetic Datasets
Cat250_15_5: This synthetic dataset has a one-layerclustering structure [see Fig. 1(a)] with 15 attributes and250 points. It has five clusters of the same size (50 pointsin each cluster). Each cluster has random categorical valuesselected from {0, 1, 2, 3, 4, 5} in a distinct continuous set of12 attributes, while the rest attributes are set to 0.
Cat100_10_4: This is a synthetic dataset with 100 pointsand 10 attributes [see Fig. 1(b)]. The dataset has four clustersof same sizes (25 points each). For each cluster, two randomattributes of the points of that cluster are zero valued and theremaining attributes have values in the range {0, 1, 2, 3, 4, 5}.
Cat500_20_10: This synthetic dataset is generated byusing the data generator available at http://www.datgen.com.This generator provides various options to specify such asthe number of attributes, attribute domains and the numberof tuples. The number of classes in the dataset is specified bythe use of conjunctive rules of the form (Attr1 = a, Attr2 =b, . . .) => classc1, etc. The dataset contains 500 points and20 attributes [see Fig. 1(c)]. The points are clustered into10 clusters.
Cat280_10_6: This is another synthetic dataset obtainedusing the data generator. The dataset contains 280 points,10 attributes, and six clusters [see Fig. 1(d)].
D. Real-Life Datasets
Congressional Votes: This dataset is the U.S. Congres-sional voting records in 1984 [see Fig. 2(a)]. Total number of
Authorized licensed use limited to: INDIAN INSTITUTE OF INFORMATION TEHNOLOGY. Downloaded on November 28, 2009 at 23:17 from IEEE Xplore. Restrictions apply.
MUKHOPADHYAY et al.: MULTIOBJECTIVE GENETIC ALGORITHM-BASED FUZZY CLUSTERING OF CATEGORICAL ATTRIBUTES 999
50 100 150 200 250 300 350 400
50
100
150
200
250
300
350
400
(a)
10 20 30 40 50 60 70 80 90 100
10
20
30
40
50
60
70
80
90
100
(b)
5 10 15 20 25 30 35 40 45
5
10
15
20
25
30
35
40
45
(c)
100 200 300 400 500 600
100
200
300
400
500
600
(d)
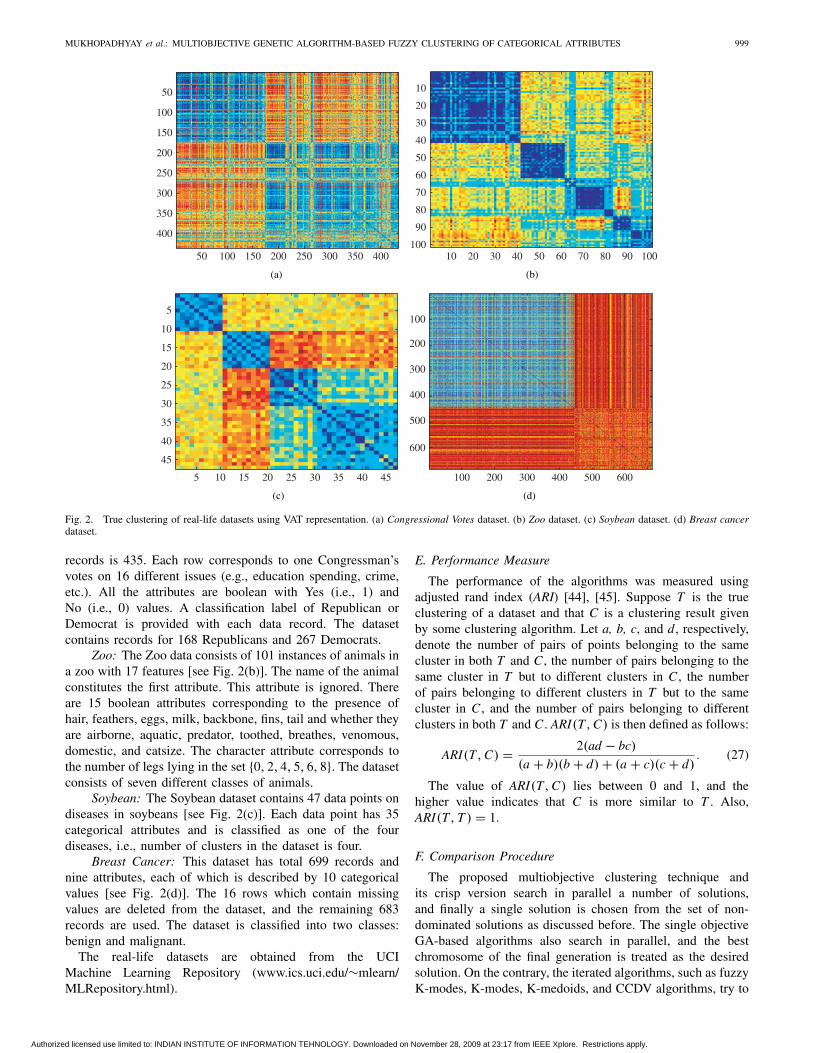
Fig. 2. True clustering of real-life datasets using VAT representation. (a) Congressional Votes dataset. (b) Zoo dataset. (c) Soybean dataset. (d) Breast cancerdataset.
records is 435. Each row corresponds to one Congressman’svotes on 16 different issues (e.g., education spending, crime,etc.). All the attributes are boolean with Yes (i.e., 1) andNo (i.e., 0) values. A classification label of Republican orDemocrat is provided with each data record. The datasetcontains records for 168 Republicans and 267 Democrats.
Zoo: The Zoo data consists of 101 instances of animals ina zoo with 17 features [see Fig. 2(b)]. The name of the animalconstitutes the first attribute. This attribute is ignored. Thereare 15 boolean attributes corresponding to the presence ofhair, feathers, eggs, milk, backbone, fins, tail and whether theyare airborne, aquatic, predator, toothed, breathes, venomous,domestic, and catsize. The character attribute corresponds tothe number of legs lying in the set {0, 2, 4, 5, 6, 8}. The datasetconsists of seven different classes of animals.
Soybean: The Soybean dataset contains 47 data points ondiseases in soybeans [see Fig. 2(c)]. Each data point has 35categorical attributes and is classified as one of the fourdiseases, i.e., number of clusters in the dataset is four.
Breast Cancer: This dataset has total 699 records andnine attributes, each of which is described by 10 categoricalvalues [see Fig. 2(d)]. The 16 rows which contain missingvalues are deleted from the dataset, and the remaining 683records are used. The dataset is classified into two classes:benign and malignant.
The real-life datasets are obtained from the UCIMachine Learning Repository (www.ics.uci.edu/∼mlearn/MLRepository.html).
E. Performance Measure
The performance of the algorithms was measured usingadjusted rand index (ARI) [44], [45]. Suppose T is the trueclustering of a dataset and that C is a clustering result givenby some clustering algorithm. Let a, b, c, and d, respectively,denote the number of pairs of points belonging to the samecluster in both T and C , the number of pairs belonging to thesame cluster in T but to different clusters in C , the numberof pairs belonging to different clusters in T but to the samecluster in C , and the number of pairs belonging to differentclusters in both T and C . ARI(T, C) is then defined as follows:
ARI(T, C) = 2(ad − bc)
(a + b)(b + d) + (a + c)(c + d). (27)
The value of ARI(T, C) lies between 0 and 1, and thehigher value indicates that C is more similar to T . Also,ARI(T, T ) = 1.
F. Comparison Procedure
The proposed multiobjective clustering technique andits crisp version search in parallel a number of solutions,and finally a single solution is chosen from the set of non-dominated solutions as discussed before. The single objectiveGA-based algorithms also search in parallel, and the bestchromosome of the final generation is treated as the desiredsolution. On the contrary, the iterated algorithms, such as fuzzyK-modes, K-modes, K-medoids, and CCDV algorithms, try to
Authorized licensed use limited to: INDIAN INSTITUTE OF INFORMATION TEHNOLOGY. Downloaded on November 28, 2009 at 23:17 from IEEE Xplore. Restrictions apply.

1000 IEEE TRANSACTIONS ON EVOLUTIONARY COMPUTATION, VOL. 13, NO. 5, OCTOBER 2009
TABLE I
AvgARIB SCORES FOR SYNTHETIC DATASETS OVER 50 RUNS OF
DIFFERENT ALGORITHMS
Algorithm Cat250 Cat100 Cat500 Cat280
Fuzzy K-modes 0.7883 0.5532 0.3883 0.5012K-modes 0.7122 0.4893 0.3122 0.4998K-medoids 0.7567 0.4977 0.3003 0.4901Average linkage 1.0000 0.5843 0.2194 0.0174CCDV 1.0000 0.5933 0.0211 0.5002SGA (π ) 0.8077 0.5331 0.4243 0.4894SGA (Sep) 0.7453 0.4855 0.2954 0.4537SGA(π, Sep) 1.0000 0.5884 0.4276 0.5264MOGAcrisp 1.0000 0.5983 0.4562 0.5442MOGA (π, Sep) 1.0000 0.6114 0.4842 0.5851
improve a single solution iteratively. They depend a lot on theinitial configuration and often get stuck at the local optima. Inorder to compare these algorithms with GA-based methods,the following procedure is adopted. Iterated algorithms are runN times where each run consists of I re-iterations as follows:
for i = 1 to Nfor j = 1 to I
ARI[ j] = ARI score obtained by running thealgorithm with new random seed.
end forARIB[i] = max {ARI[1], . . . , ARI[I]}.
end forAvgARIB = avg{ARIB[1], . . . , ARIB[N ]}.In Tables I and III, we have reported the average ARIB
scores (AvgARIB) for each algorithm.The GA-based algorithms have been run N times, with
number of generations as I. The average of the best ARIscores for the GA-based algorithms are computed from theARI scores of the N runs.
G. Input Parameters
The GA-based algorithms are run for 100 generations withpopulation size 50. The crossover and mutation probabilitiesare fixed at 0.8 and 1/chromosome length, respectively. Thesevalues are chosen after several experiments. The parametersN and I are taken as 50 and 100. Each re-iteration of thefuzzy K-modes, K-modes, and K-medoids algorithms havebeen executed 500 times, unless they converge earlier. Thismeans that each of these three iterative algorithms has beenexecuted for 50 × 100 times, and each such execution isallowed for a maximum of 500 iterations. This is done fora fair comparison of these algorithms with the GA-basedtechniques which explore a total of 50 × 100 combinations(since number of generations and population size of the GA-based techniques are 100 and 50, respectively). The fuzzyexponent m has been chosen to be 2.
H. Results for Synthetic Datasets
Clustering results in terms of the average values of theARIB scores over 50 runs (AvgARIB) on the four synthetic
TABLE II
OBJECTIVE FUNCTION VALUES AND THE BEST ARIB SCORES FOR
CAT250_15_5 DATASET
Algorithm π Sep ARI
Single objective GA minimizing π 11.29 13.44 0.8119Single objective GA maximizing Sep 11.57 16.39 0.7701Multiobjective GA optimizing π and Sep 11.34 15.38 1.0000
datasets using different algorithms are reported in Table I. Themaximum values of AvgARIB are shown in bold letters. Fromthe table, it can be observed that the proposed multiobjectivegenetic clustering algorithm gives the best AvgARIB scores forall the datasets. It is also evident from the table that for all thesynthetic datasets, the fuzzy version of a clustering methodperforms better than its crisp counterpart. For example,the AvgARIB scores for Fuzzy K-modes and K-modes algo-rithms are 0.5092 and 0.4998, respectively, for Cat280_10_6data. This is also the case for multiobjective clustering.MOGA(π, Sep) and MOGAcrisp provide AvgARIB scores0.5851 and 0.5442, respectively, for this dataset. For all otherdatasets also the fuzzy algorithms provide better results thanthe corresponding crisp versions. This establishes the utilityof incorporating fuzziness for clustering categorical datasets.
Table II reports another interesting observation. Here, thebest ARIB scores for single objective and multiobjective GA-based fuzzy algorithms have been shown for the Cat250_15_5dataset. The final objective function values are also reported.As expected, SGA(π ) produces the minimum π value (11.29),whereas SGA(Sep) gives the maximum Sep value (16.39). Theproposed MOGA(π , Sep) method provides a π value (11.34)greater than that provided by SGA(π ), whereas a Sep value(15.38) smaller than that provided by SGA(Sep). However, interms of the ARIB scores, the proposed technique providesthe best result (ARIB = 1). This signifies the importanceof optimizing both π and Sep simultaneously instead ofoptimizing them separately, and this finding is very similarto that in [25].
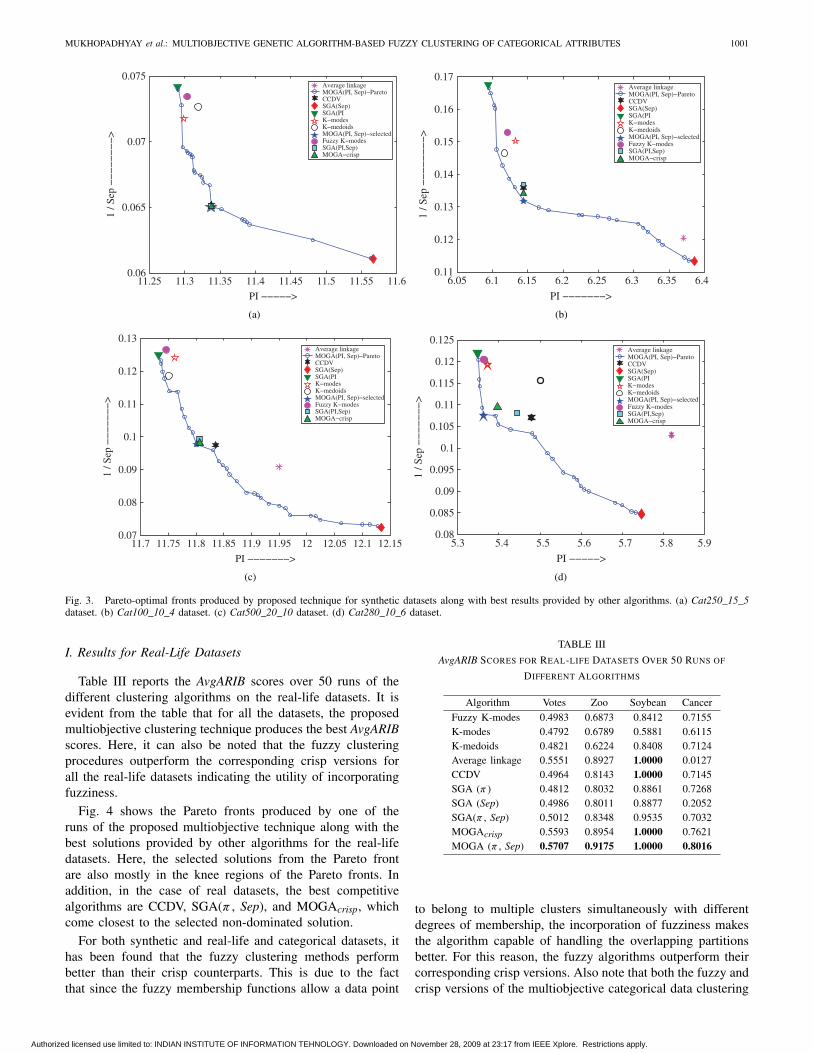
Fig. 3 plots the Pareto fronts produced by one of the runsof the proposed multiobjective algorithm along with the bestsolutions provided by the other algorithms for the syntheticdatasets. The figure also marks the selected solution fromthe non-dominated Pareto-optimal set. It appears that theseselected solutions tend to fall at the knee regions of the Paretofronts. Similar plots have been used for illustrations in [25]for showing the Pareto front generated by the multiobjectivealgorithm along with the solutions generated by other crispclustering methods for continuous data. Here we have plottedthe solutions for both fuzzy and crisp clustering methods usedfor clustering categorical data. As expected, each of the fuzzyK-modes, K-modes, K-medoids, and SGA(π ) algorithms tendsto minimize objective π and thus gives smaller values forSep (larger values for 1/Sep). On the other hand, SGA(Sep)maximizes the objective Sep and, hence, gives larger valuesof the objective π . The algorithms CCDV, SGA(π , Sep), andMOGAcrisp are found to come nearest to the selected solutionin the Pareto front.
Authorized licensed use limited to: INDIAN INSTITUTE OF INFORMATION TEHNOLOGY. Downloaded on November 28, 2009 at 23:17 from IEEE Xplore. Restrictions apply.
MUKHOPADHYAY et al.: MULTIOBJECTIVE GENETIC ALGORITHM-BASED FUZZY CLUSTERING OF CATEGORICAL ATTRIBUTES 1001
11.25 11.3 11.35 11.4 11.45 11.5 11.55 11.60.06
0.065
0.07
0.075
PI −−−−−>
1 / S
ep −
−−
−−
−−
−>
Average linkageMOGA(PI, Sep)−ParetoCCDVSGA(Sep)SGA(PIK−modesK−medoidsMOGA(PI, Sep)−selectedFuzzy K−modes SGA(PI,Sep)MOGA−crisp
(a)
6.05 6.1 6.15 6.2 6.25 6.3 6.35 6.40.11
0.12
0.13
0.14
0.15
0.16
0.17
PI −−−−−−−>
1 / S
ep −
−−
−−
−−
−>
Average linkageMOGA(PI, Sep)−ParetoCCDVSGA(Sep)SGA(PIK−modesK−medoidsMOGA(PI, Sep)−selectedFuzzy K−modes SGA(PI,Sep)MOGA−crisp
(b)
11.7 11.75 11.8 11.85 11.9 11.95 12 12.05 12.1 12.150.07
0.08
0.09
0.11
0.1
0.12
0.13
PI −−−−−−−>
1 / S
ep −
−−
−−
−−
>
Average linkageMOGA(PI, Sep)−ParetoCCDVSGA(Sep)SGA(PIK−modesK−medoidsMOGA(PI, Sep)−selectedFuzzy K−modes SGA(PI,Sep)MOGA−crisp
(c)
5.3 5.4 5.5 5.6 5.7 5.8 5.90.08
0.085
0.09
0.095
0.105
0.1
0.11
0.115
0.12
0.125
PI −−−−−>
1 / S
ep −
−−
−−
−−
>
Average linkageMOGA(PI, Sep)−ParetoCCDVSGA(Sep)SGA(PIK−modesK−medoidsMOGA(PI, Sep)−selectedFuzzy K−modes SGA(PI,Sep)MOGA−crisp
(d)
Fig. 3. Pareto-optimal fronts produced by proposed technique for synthetic datasets along with best results provided by other algorithms. (a) Cat250_15_5dataset. (b) Cat100_10_4 dataset. (c) Cat500_20_10 dataset. (d) Cat280_10_6 dataset.
I. Results for Real-Life Datasets
Table III reports the AvgARIB scores over 50 runs of thedifferent clustering algorithms on the real-life datasets. It isevident from the table that for all the datasets, the proposedmultiobjective clustering technique produces the best AvgARIBscores. Here, it can also be noted that the fuzzy clusteringprocedures outperform the corresponding crisp versions forall the real-life datasets indicating the utility of incorporatingfuzziness.
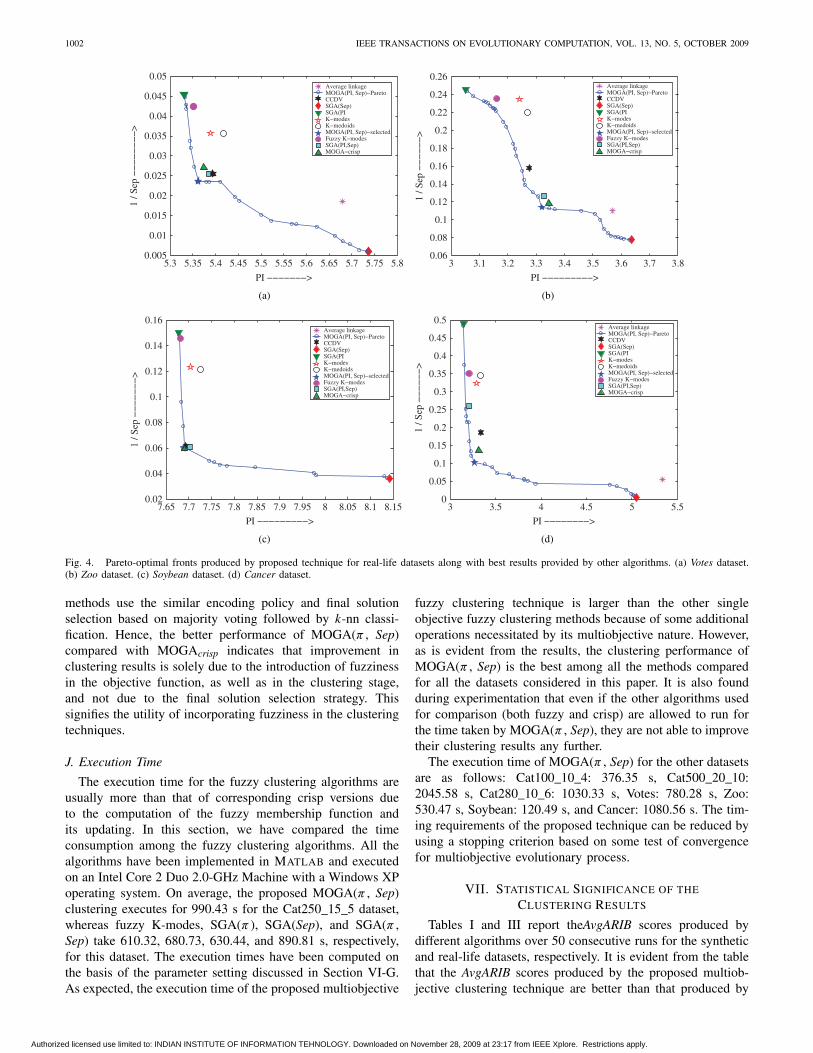
Fig. 4 shows the Pareto fronts produced by one of theruns of the proposed multiobjective technique along with thebest solutions provided by other algorithms for the real-lifedatasets. Here, the selected solutions from the Pareto frontare also mostly in the knee regions of the Pareto fronts. Inaddition, in the case of real datasets, the best competitivealgorithms are CCDV, SGA(π , Sep), and MOGAcrisp, whichcome closest to the selected non-dominated solution.
For both synthetic and real-life and categorical datasets, ithas been found that the fuzzy clustering methods performbetter than their crisp counterparts. This is due to the factthat since the fuzzy membership functions allow a data point
TABLE III
AvgARIB SCORES FOR REAL-LIFE DATASETS OVER 50 RUNS OF
DIFFERENT ALGORITHMS
Algorithm Votes Zoo Soybean Cancer
Fuzzy K-modes 0.4983 0.6873 0.8412 0.7155K-modes 0.4792 0.6789 0.5881 0.6115K-medoids 0.4821 0.6224 0.8408 0.7124Average linkage 0.5551 0.8927 1.0000 0.0127CCDV 0.4964 0.8143 1.0000 0.7145SGA (π ) 0.4812 0.8032 0.8861 0.7268SGA (Sep) 0.4986 0.8011 0.8877 0.2052SGA(π , Sep) 0.5012 0.8348 0.9535 0.7032MOGAcrisp 0.5593 0.8954 1.0000 0.7621MOGA (π , Sep) 0.5707 0.9175 1.0000 0.8016
to belong to multiple clusters simultaneously with differentdegrees of membership, the incorporation of fuzziness makesthe algorithm capable of handling the overlapping partitionsbetter. For this reason, the fuzzy algorithms outperform theircorresponding crisp versions. Also note that both the fuzzy andcrisp versions of the multiobjective categorical data clustering
Authorized licensed use limited to: INDIAN INSTITUTE OF INFORMATION TEHNOLOGY. Downloaded on November 28, 2009 at 23:17 from IEEE Xplore. Restrictions apply.
1002 IEEE TRANSACTIONS ON EVOLUTIONARY COMPUTATION, VOL. 13, NO. 5, OCTOBER 2009
5.3 5.35 5.4 5.45 5.5 5.55 5.6 5.65 5.7 5.75 5.80.005
0.01
0.015
0.02
0.025
0.03
0.035
0.04
0.045
0.05
PI −−−−−−−>
1 / S
ep −
−−
−−
−−
−>
Average linkageMOGA(PI, Sep)−ParetoCCDVSGA(Sep)SGA(PIK−modesK−medoidsMOGA(PI, Sep)−selectedFuzzy K−modes SGA(PI,Sep)MOGA−crisp
(a)
3 3.1 3.2 3.3 3.4 3.5 3.6 3.7 3.80.06
0.08
0.1
0.12
0.14
0.16
0.18
0.2
0.22
0.24
0.26
PI −−−−−−−−−>
1 / S
ep −
−−
−−
−>
Average linkageMOGA(PI, Sep)−ParetoCCDVSGA(Sep)SGA(PIK−modesK−medoidsMOGA(PI, Sep)−selectedFuzzy K−modes SGA(PI,Sep)MOGA−crisp
(b)
7.65 7.7 7.75 7.8 7.85 7.9 7.95 8 8.05 8.1 8.150.02
0.04
0.06
0.08
0.1
0.12
0.14
0.16
PI −−−−−−−−−>
1 / S
ep −
−−
−−
−−
>
Average linkageMOGA(PI, Sep)−ParetoCCDVSGA(Sep)SGA(PIK−modesK−medoidsMOGA(PI, Sep)−selectedFuzzy K−modes SGA(PI,Sep)MOGA−crisp
(c)
3 3.5 4 4.5 5 5.50
0.05
0.1
0.15
0.2
0.25
0.3
0.35
0.4
0.45
0.5
PI −−−−−−−−>
1 / S
ep −
−−
−−
−>
Average linkageMOGA(PI, Sep)−ParetoCCDVSGA(Sep)SGA(PIK−modesK−medoidsMOGA(PI, Sep)−selectedFuzzy K−modes SGA(PI,Sep)MOGA−crisp
(d)
Fig. 4. Pareto-optimal fronts produced by proposed technique for real-life datasets along with best results provided by other algorithms. (a) Votes dataset.(b) Zoo dataset. (c) Soybean dataset. (d) Cancer dataset.
methods use the similar encoding policy and final solutionselection based on majority voting followed by k-nn classi-fication. Hence, the better performance of MOGA(π , Sep)compared with MOGAcrisp indicates that improvement inclustering results is solely due to the introduction of fuzzinessin the objective function, as well as in the clustering stage,and not due to the final solution selection strategy. Thissignifies the utility of incorporating fuzziness in the clusteringtechniques.
J. Execution Time
The execution time for the fuzzy clustering algorithms areusually more than that of corresponding crisp versions dueto the computation of the fuzzy membership function andits updating. In this section, we have compared the timeconsumption among the fuzzy clustering algorithms. All thealgorithms have been implemented in MATLAB and executedon an Intel Core 2 Duo 2.0-GHz Machine with a Windows XPoperating system. On average, the proposed MOGA(π , Sep)clustering executes for 990.43 s for the Cat250_15_5 dataset,whereas fuzzy K-modes, SGA(π ), SGA(Sep), and SGA(π ,Sep) take 610.32, 680.73, 630.44, and 890.81 s, respectively,for this dataset. The execution times have been computed onthe basis of the parameter setting discussed in Section VI-G.As expected, the execution time of the proposed multiobjective
fuzzy clustering technique is larger than the other singleobjective fuzzy clustering methods because of some additionaloperations necessitated by its multiobjective nature. However,as is evident from the results, the clustering performance ofMOGA(π , Sep) is the best among all the methods comparedfor all the datasets considered in this paper. It is also foundduring experimentation that even if the other algorithms usedfor comparison (both fuzzy and crisp) are allowed to run forthe time taken by MOGA(π , Sep), they are not able to improvetheir clustering results any further.
The execution time of MOGA(π , Sep) for the other datasetsare as follows: Cat100_10_4: 376.35 s, Cat500_20_10:2045.58 s, Cat280_10_6: 1030.33 s, Votes: 780.28 s, Zoo:530.47 s, Soybean: 120.49 s, and Cancer: 1080.56 s. The tim-ing requirements of the proposed technique can be reduced byusing a stopping criterion based on some test of convergencefor multiobjective evolutionary process.
VII. STATISTICAL SIGNIFICANCE OF THE
CLUSTERING RESULTS
Tables I and III report theAvgARIB scores produced bydifferent algorithms over 50 consecutive runs for the syntheticand real-life datasets, respectively. It is evident from the tablethat the AvgARIB scores produced by the proposed multiob-jective clustering technique are better than that produced by
Authorized licensed use limited to: INDIAN INSTITUTE OF INFORMATION TEHNOLOGY. Downloaded on November 28, 2009 at 23:17 from IEEE Xplore. Restrictions apply.
MUKHOPADHYAY et al.: MULTIOBJECTIVE GENETIC ALGORITHM-BASED FUZZY CLUSTERING OF CATEGORICAL ATTRIBUTES 1003
TABLE IV
P -VALUES PRODUCED BY t -TEST COMPARING MOGA(π , Sep) WITH OTHER ALGORITHMS
Datasets P-valuesFuzzy K-modes K-modes K-medoids Avg link CCDV SGA(π ) SGA(Sep) SGA(π , Sep) MOGAcrisp
Cat250_15_5 2.13E−07 2.13E−10 7.44E−07 same same 5.45E−10 1.67E−20 same sameCat100_10_4 3.02E−10 4.07E−17 5.39E−11 1.46E−12 6.28E−07 5.11E−15 3.82E−12 4.88E−07 3.98E−06Cat500_20_10 2.73E−08 1.02E−10 7.88E−10 5.07E−13 1.22E−24 2.12E−11 1.43E−08 2.93E−11 6.92E−08Cat280_10_6 4.06E−10 9.32E−12 4.95E−12 2.69E−31 3.44E−09 4.63E−12 3.66E−14 1.82E−09 5.21E−09Votes 4.33E−08 3.85E−11 2.56E−09 7.23E−07 4.84E−08 2.33E−10 7.83E−08 4.72E−08 3.73E−08Zoo 4.57E−19 6.45E−19 7.48E−20 5.11E−09 3.54E−07 4.12E−13 8.44E−14 2.18E−07 4.66E−09Soybean 5.62E−06 2.04E−18 8.55E−06 same same 5.66E−05 3.18E−05 5.08E−05 sameCancer 1.83E−11 6.17E−12 2.48E−10 2.33E−40 7.55E−09 6.03E−08 5.22E−26 2.66E−08 8.56E−08
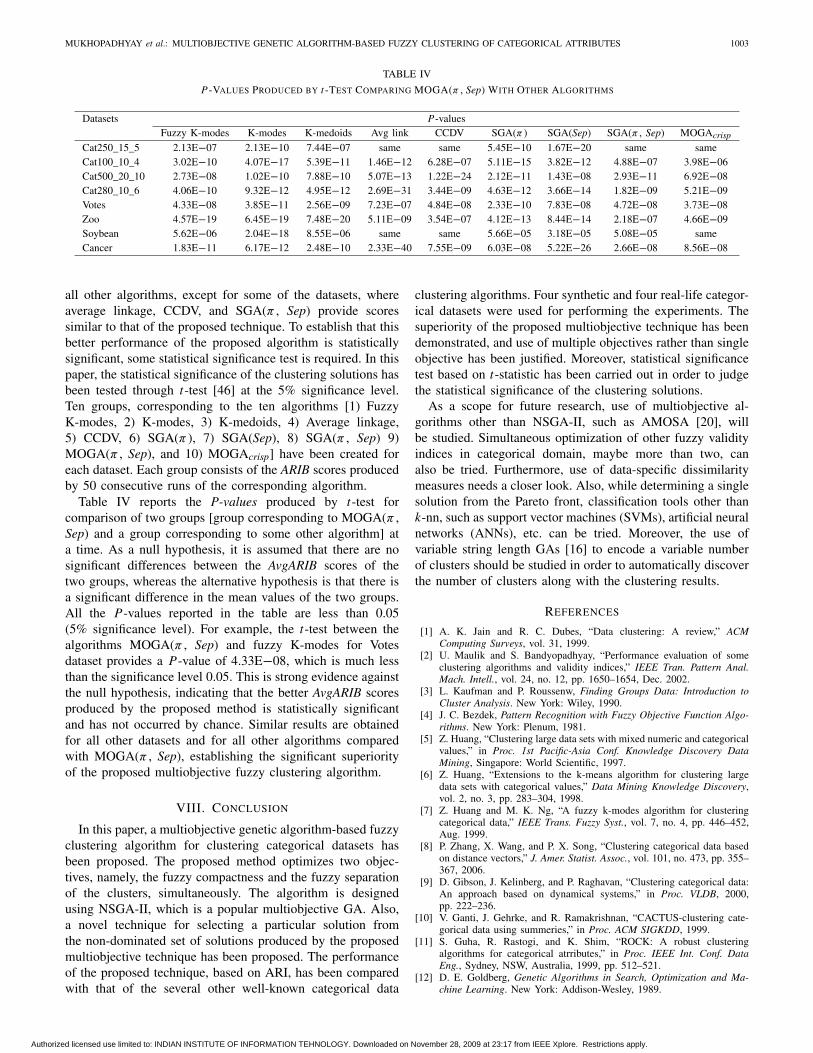
all other algorithms, except for some of the datasets, whereaverage linkage, CCDV, and SGA(π , Sep) provide scoressimilar to that of the proposed technique. To establish that thisbetter performance of the proposed algorithm is statisticallysignificant, some statistical significance test is required. In thispaper, the statistical significance of the clustering solutions hasbeen tested through t-test [46] at the 5% significance level.Ten groups, corresponding to the ten algorithms [1) FuzzyK-modes, 2) K-modes, 3) K-medoids, 4) Average linkage,5) CCDV, 6) SGA(π ), 7) SGA(Sep), 8) SGA(π , Sep) 9)MOGA(π , Sep), and 10) MOGAcrisp] have been created foreach dataset. Each group consists of the ARIB scores producedby 50 consecutive runs of the corresponding algorithm.
Table IV reports the P-values produced by t-test forcomparison of two groups [group corresponding to MOGA(π ,Sep) and a group corresponding to some other algorithm] ata time. As a null hypothesis, it is assumed that there are nosignificant differences between the AvgARIB scores of thetwo groups, whereas the alternative hypothesis is that there isa significant difference in the mean values of the two groups.All the P-values reported in the table are less than 0.05(5% significance level). For example, the t-test between thealgorithms MOGA(π , Sep) and fuzzy K-modes for Votesdataset provides a P-value of 4.33E−08, which is much lessthan the significance level 0.05. This is strong evidence againstthe null hypothesis, indicating that the better AvgARIB scoresproduced by the proposed method is statistically significantand has not occurred by chance. Similar results are obtainedfor all other datasets and for all other algorithms comparedwith MOGA(π , Sep), establishing the significant superiorityof the proposed multiobjective fuzzy clustering algorithm.
VIII. CONCLUSION
In this paper, a multiobjective genetic algorithm-based fuzzyclustering algorithm for clustering categorical datasets hasbeen proposed. The proposed method optimizes two objec-tives, namely, the fuzzy compactness and the fuzzy separationof the clusters, simultaneously. The algorithm is designedusing NSGA-II, which is a popular multiobjective GA. Also,a novel technique for selecting a particular solution fromthe non-dominated set of solutions produced by the proposedmultiobjective technique has been proposed. The performanceof the proposed technique, based on ARI, has been comparedwith that of the several other well-known categorical data
clustering algorithms. Four synthetic and four real-life categor-ical datasets were used for performing the experiments. Thesuperiority of the proposed multiobjective technique has beendemonstrated, and use of multiple objectives rather than singleobjective has been justified. Moreover, statistical significancetest based on t-statistic has been carried out in order to judgethe statistical significance of the clustering solutions.
As a scope for future research, use of multiobjective al-gorithms other than NSGA-II, such as AMOSA [20], willbe studied. Simultaneous optimization of other fuzzy validityindices in categorical domain, maybe more than two, canalso be tried. Furthermore, use of data-specific dissimilaritymeasures needs a closer look. Also, while determining a singlesolution from the Pareto front, classification tools other thank-nn, such as support vector machines (SVMs), artificial neuralnetworks (ANNs), etc. can be tried. Moreover, the use ofvariable string length GAs [16] to encode a variable numberof clusters should be studied in order to automatically discoverthe number of clusters along with the clustering results.
REFERENCES
[1] A. K. Jain and R. C. Dubes, “Data clustering: A review,” ACMComputing Surveys, vol. 31, 1999.
[2] U. Maulik and S. Bandyopadhyay, “Performance evaluation of someclustering algorithms and validity indices,” IEEE Tran. Pattern Anal.Mach. Intell., vol. 24, no. 12, pp. 1650–1654, Dec. 2002.
[3] L. Kaufman and P. Roussenw, Finding Groups Data: Introduction toCluster Analysis. New York: Wiley, 1990.
[4] J. C. Bezdek, Pattern Recognition with Fuzzy Objective Function Algo-rithms. New York: Plenum, 1981.
[5] Z. Huang, “Clustering large data sets with mixed numeric and categoricalvalues,” in Proc. 1st Pacific-Asia Conf. Knowledge Discovery DataMining, Singapore: World Scientific, 1997.
[6] Z. Huang, “Extensions to the k-means algorithm for clustering largedata sets with categorical values,” Data Mining Knowledge Discovery,vol. 2, no. 3, pp. 283–304, 1998.
[7] Z. Huang and M. K. Ng, “A fuzzy k-modes algorithm for clusteringcategorical data,” IEEE Trans. Fuzzy Syst., vol. 7, no. 4, pp. 446–452,Aug. 1999.
[8] P. Zhang, X. Wang, and P. X. Song, “Clustering categorical data basedon distance vectors,” J. Amer. Statist. Assoc., vol. 101, no. 473, pp. 355–367, 2006.
[9] D. Gibson, J. Kelinberg, and P. Raghavan, “Clustering categorical data:An approach based on dynamical systems,” in Proc. VLDB, 2000,pp. 222–236.
[10] V. Ganti, J. Gehrke, and R. Ramakrishnan, “CACTUS-clustering cate-gorical data using summeries,” in Proc. ACM SIGKDD, 1999.
[11] S. Guha, R. Rastogi, and K. Shim, “ROCK: A robust clusteringalgorithms for categorical atrributes,” in Proc. IEEE Int. Conf. DataEng., Sydney, NSW, Australia, 1999, pp. 512–521.
[12] D. E. Goldberg, Genetic Algorithms in Search, Optimization and Ma-chine Learning. New York: Addison-Wesley, 1989.
Authorized licensed use limited to: INDIAN INSTITUTE OF INFORMATION TEHNOLOGY. Downloaded on November 28, 2009 at 23:17 from IEEE Xplore. Restrictions apply.
1004 IEEE TRANSACTIONS ON EVOLUTIONARY COMPUTATION, VOL. 13, NO. 5, OCTOBER 2009
[13] K. Deb, Multiobjective Optimization Using Evolutionary Algorithms.Chichester, U.K.: Wiley, 2001.
[14] L. Davis, Handbook of Genetic Algorithms. New York: VanNostrand Reinhold, 1991.
[15] U. Maulik and S. Bandyopadhyay, “Genetic algorithm based clusteringtechnique,” Pattern Recognition, vol. 33, pp. 1455–1465, 2000.
[16] U. Maulik and S. Bandyopadhyay, “Fuzzy partitioning using a real-coded variable-length genetic algorithm for pixel classification,” IEEETrans. Geosci. Remote Sens., vol. 41, no. 5, pp. 1075–1081, May 2003.
[17] S. Bandyopadhyay and U. Maulik, “Non-parametric genetic clustering:Comparison of validity indices,” IEEE Trans. Syst., Man, Cybern. Part-C, vol. 31, no. 1, pp. 120–125, Feb. 2001.
[18] C. A. Coello Coello, “A comprehensive survey of evolutionary-basedmultiobjective optimization techniques,” Knowledge and Inform. Syst.,vol. 1, no. 3, pp. 129–156, 1999.
[19] S. Bandyopadhyay, U. Maulik, and A. Mukhopadhyay, “Multiobjectivegenetic clustering for pixel classification in remote sensing imagery,”IEEE Trans. Geosci. Remote Sens., vol. 45, no. 5, pp. 1506–1511, May2007.
[20] S. Bandyopadhyay, S. Saha, U. Maulik, and K. Deb, “A simulatedannealing-based multiobjective optimization algorithm: AMOSA,” IEEETrans. Evol. Comput., vol. 12, no. 3, pp. 269–283, Jun. 2008.
[21] K. Deb, A. Pratap, S. Agrawal, and T. Meyarivan, “A fast and elitistmultiobjective genetic algorithm: NSGA-II,” IEEE Trans. Evol. Comput.,vol. 6, no. 2, pp. 182–197, Apr. 2002.
[22] M. Delattre and P. Hansen, “Bicriterion cluster analysis,” IEEE Trans.Pattern Anal. Mach. Intell., vol. PAMI-2, no. 4, pp. 277–291, Apr. 1980.
[23] R. Caballero, M. Laguna, R. Marti, and J. Molina, (2006). Multiobjectiveclustering with metaheuristic optimization technology, Leeds SchoolBusiness, Univ. Colorado, Boulder, CO, Tech. Rep. [Online]. Available:http://leeds-faculty.colorado.edu/laguna/articles/mcmot.pdf
[24] J. Handl and J. Knowles, “Multiobjective clustering around medoids,”in Proc. IEEE Congr. Evol. Comput., vol. 1. Edinburgh, U.K., 2005,pp. 632–639.
[25] J. Handl and J. Knowles, “An evolutionary approach to multiobjectiveclustering,” IEEE Trans. Evol. Comput., vol. 11, no. 1, pp. 56–76, Feb.2006.
[26] J. Handl and J. Knowles, “Multiobjective clustering and cluster vali-dation,” in Proc. Comput. Intell., vol. 16, New York: Springer-Verlag,2006, pp. 21–47.
[27] S. Bandyopadhyay and U. Maulik, “An evolutionary technique based onk-means algorithm for optimal clustering in RN ,” Inform. Sci., vol. 146,pp. 221–237, 2002.
[28] W. Wanga and Y. Zhanga, “On fuzzy cluster validity indices,” FuzzySets Syst., vol. 158, no. 19, pp. 2095–2117, 2007.
[29] A. G. D. Nuovo, M. Palesi, and V. Catania, “Multiobjective evolutionaryfuzzy clustering for high-dimensional problems,” in Proc. IEEE Int.Conf. Fuzzy Syst., London, U.K., 2007, pp. 1–6.
[30] S. Bandyopadhyay, A. Mukhopadhyay, and U. Maulik, “An improvedalgorithm for clustering gene expression data,” Bioinform., vol. 23, no.21, pp. 2859–2865, 2007.
[31] X. L. Xie and G. Beni, “A validity measure for fuzzy clustering,” IEEETrans. Pattern Anal. Mach. Intell., vol. 13, no. 8, pp. 841–847, Aug.1991.
[32] P. Rousseeuw, “Silhouettes: A graphical aid to the interpretation andvalidation of cluster analysis,” J. Comp. App. Math., vol. 20, pp. 53–65,1987.
[33] E. Zitzler, M. Laumanns, and L. Thiele, “SPEA2: Improving thestrength Pareto evolutionary algorithm,” Swiss Fed. Inst. Technol.,Zurich, Switzerland, Tech. Rep. 103, 2001.
[34] E. Zitzler and L. Thiele, “An evolutionary algorithm for multiobjectiveoptimization: The strength Pareto approach,” Swiss Fed. Inst. Technol.,Zurich, Switzerland, Tech. Rep. 43, 1998.
[35] G. E. Tsekouras, D. Papageorgiou, S. Kotsiantis, C. Kalloniatis, andP. Pintelas, “Fuzzy clustering of categorical attributes and its use inanalyzing cultural data,” Int. J. Comput. Intell., vol. 1, no. 2, pp. 147–151, 2004.
[36] M. Halkidi, Y. Batistakis, and M. Vazirgiannis, “On clustering validationtechniques,” J. Intell. Inform. Syst., vol. 17, no. 2–3, pp. 107–145, 2001.
[37] K. Deb, “Multiobjective evolutionary algorithms: Introducing biasamong Pareto-optimal solutions,” in Proc. Adv. Evol. Computing: TheoryApplicat., London, U.K.: Springer-Verlag, 2003, pp. 263–292.
[38] C. A. Mattson, A. A. Mullur, and A. Messac, “Smart Pareto filter:Obtaining a minimal representation of multiobjective design space,” Eng.Optim., vol. 36, no. 6, pp. 721–740, 2004.
[39] I. Das, “On characterizing the ‘knee’ of the pareto curve based onnormal-boundary intersection,” Struct. Optim., vol. 18, no. 2–3, pp. 107–115, 1999.
[40] G. Stehr, H. Graeb, and K. Antreich, “Performance trade-off analysis ofanalog circuits by normal-boundary intersection,” in Proc. 40th DesignAutomation Conf., Anaheim, CA, 2003, pp. 958–963.
[41] J. Branke, K. Deb, H. Dierolf, and M. Osswald, “Finding knees inmultiobjective optimization,” in Proc. 8th Int. Conf. Parallel Probl.Solving From Naure, Berlin, Germany: Springer-Verlag, 2004, pp. 722–731.
[42] R. Tibshirani, G. Walther, and T. Hastie, “Estimating the number ofclusters in a dataset via the gap statistic,” J. Roy. Statist. Soc.: Ser. B,vol. 63, no. 2, pp. 411–423, 2001.
[43] J. C. Bezdek and R. J. Hathaway, “VAT: A tool for visual assessmentof (cluster) tendency,” in Proc. Int. Joint Conf. Neural Netw., vol. 3.Honolulu, HI, 2002, pp. 2225–2230.
[44] K. Y. Yip, D. W. Cheung, and M. K. Ng, “A highly usable projectedclustering algorithm for gene expression profiles,” in Proc. 3rd ACMSIGKDD Workshop Data Mining Bioinformatics, 2003, pp. 41–48.
[45] L. Hubert and P. Arabie, “Comparing partitions,” J. Classification, vol. 2,pp. 193–218, 1985.
[46] P. J. Bickel and K. A. Doksum, Mathematical Statistics: Basic Ideasand Selected Topics. San Francisco, CA: Holden-Day, 1977.
Anirban Mukhopadhyay received the B.E. degreefrom the National Institute of Technology, Durgapur,India, in 2002 and the M.E. degree from JadavpurUniversity, Kolkata, India, in 2004, respectively,both in computer science and engineering. He hassubmitted his Ph.D. dissertation in computer scienceat Jadavpur University in 2009.
He is a faculty member with the Department ofComputer Science and Engineering, University ofKalyani, Kalyani, India. His research interests in-clude soft and evolutionary computing, data mining,
bioinformatics, and optical networks. He has coauthored or presented about35 research papers in various international journals and conferences. Hisbiography has been included in the 2009 edition of Marquis Who is Whoin the World.
Mr. Mukhopadhyay received the University Gold Medal and the AmitavaDey Memorial Gold Medal from Jadavpur University in 2004.
Authorized licensed use limited to: INDIAN INSTITUTE OF INFORMATION TEHNOLOGY. Downloaded on November 28, 2009 at 23:17 from IEEE Xplore. Restrictions apply.
MUKHOPADHYAY et al.: MULTIOBJECTIVE GENETIC ALGORITHM-BASED FUZZY CLUSTERING OF CATEGORICAL ATTRIBUTES 1005
Ujjwal Maulik (M’99–SM’05) received the B.S.degrees in physics and computer science from Uni-versity of Calcutta, Kolkata, India, in 1986 and 1989,respectively, and the M.S. and Ph.D. degrees incomputer science from Jadavpur University, Kolkata,India, in 1991 and 1997, respectively.
He is currently a Professor with the Departmentof Computer Science and Engineering, JadavpurUniversity, Kolkata, India. He was the Head of theSchool of Computer Science and Technology withKalyani Government Engineering College, Kalyani,
India, during 1996–1999. He was with the Center for Adaptive SystemsApplication, Los Alamos, NM, in 1997; the University of New South Wales,Sydney, Australia, in 1999; the University of Texas at Arlington, in 2001; theUniversity of Maryland Baltimore County in 2004; the Fraunhofer InstituteAiS, St. Augustin, Germany, in 2005; Tsinghua University, Beijing, China, in2007; and the University of Rome, Rome, Italy, in 2008. He has also visitedmany Institutes/Universities around the world to deliver invited lectures andconduct collaborative research. He is a co-author of two books and about 130research publications. His research interests include artificial intelligence andcombinatorial optimization, soft computing, pattern recognition, data mining,bioinformatics, VLSI, and distributed System.
Dr. Maulik was the recipient of the Government of India BOYSCASTfellowship in 2001. He has been the Program Chair, Tutorial Chair, anda Member of Program Committees of many international conferences andworkshops. He is a Fellow of IETE, India.
Sanghamitra Bandyopadhyay (M’99–SM’05)received the B.S. degrees in physics and computerscience from University of Calcutta, Kolkata,India, in 1988 and 1991, respectively, the M.S.degree in computer science from Indian Instituteof Technology (IIT), Kharagpur, India, in 1993,and the Ph.D. degree in computer science from theIndian Statistical Institute, Kolkata, India, in 1998.
Currently, she is an Associate Professor withthe Machine Intelligence Unit, Indian StatisticalInstitute, Kolkatta, India. She was with the Los
Alamos National Laboratory, Los Alamos, NM, in 1997; the Universityof New South Wales, Sydney, Australia, in 1999; the University of Texasat Arlington in 2001; the University of Maryland at Baltimore in 2004;the Fraunhofer Institute, St. Augustin, Germany, in 2005; and TsinghuaUniversity, Beijing, China, in 2006 and 2007. She has co-authored morethan 150 technical articles in international journals, book chapters, andconference/workshop proceedings. She has delivered many invited talks andtutorials around the world. She has also edited special issues of journalsin the areas of soft computing, data mining, and bioinformatics. Herresearch interests include computational biology and bioinformatics, soft andevolutionary computation, pattern recognition, and data mining.
Dr. Bandyopadhyay is the first recipient of the Dr. Shanker Dayal SharmaGold Medal as well as the Institute Silver Medal for being adjudged the bestall-round postgraduate performer at IIT, in 1994. She also received the YoungScientist Awards from the Indian National Science Academy and the IndianScience Congress Association in 2000. In 2002, she received the YoungScientist Award from the Indian National Academy of Engineers. She alsoreceived the 2006–2007 Swarnajayanti Fellowship in Engineering Sciencesfrom the Government of India. She was the Program Co-Chair of the FirstInternational Conference on Pattern Recognition and Machine Intelligenceheld in Kolkata, India, during December 18–22, 2005. She authored a bookentitled Classification and Learning Using Genetic Algorithms: Applicationsin Bioinformatics and Web Intelligence (Springer) and two edited booksentitled Advanced Methods for Knowledge Discovery from Complex Data,(Springer, 2005), and Analysis of Biological Data: A Soft ComputingApproach (World Scientific, in 2007).
Authorized licensed use limited to: INDIAN INSTITUTE OF INFORMATION TEHNOLOGY. Downloaded on November 28, 2009 at 23:17 from IEEE Xplore. Restrictions apply.