Web Log Data Analysis by Enhanced Fuzzy C Means Clustering
15
International Journal on Computational Sciences & Applications (IJCSA) Vol.4, No.2, April 2014 DOI:10.5121/ijcsa.2014.4209 81 Web Log Data Analysis by Enhanced Fuzzy C Means Clustering V.Chitraa 1 , Antony Selvadoss Thanamani 2 1 Assistant Professor, CMS College of Science and Commerce, Coimbatore, Tamilnadu, India 2 Reader in Computer Science, NGM College (AUTONOMOUS), Pollachi, Coimbatore, Tamilnadu, India ABSTRACT World Wide Web is a huge repository of information and there is a tremendous increase in the volume of information daily. The number of users are also increasing day by day. To reduce users browsing time lot of research is taken place. Web Usage Mining is a type of web mining in which mining techniques are applied in log data to extract the behaviour of users. Clustering plays an important role in a broad range of applications like Web analysis, CRM, marketing, medical diagnostics, computational biology, and many others. Clustering is the grouping of similar instances or objects. The key factor for clustering is some sort of measure that can determine whether two objects are similar or dissimilar. In this paper a novel clustering method to partition user sessions into accurate clusters is discussed. The accuracy and various performance measures of the proposed algorithm shows that the proposed method is a better method for web log mining. KEYWORDS Cluster, FCM, Feature Reduction, Vector Machines, Web Log Data 1. INTRODUCTION Internet has become buzzword of today’s world. Ocean of information is available in internet and people use it for different purposes. Finding information in this voluminous data is a difficult task for the users. For a specific user only a small amount of web is useful and remaining are irrelevant. Systems are required in client and server side for finding out the desired information. Web mining is an active research area to extract useful information in the ocean of data. Data mining techniques are applied in web data for this purpose. There are three categories of web mining. Web Content Mining is the process of extracting useful information from the contents of Web documents. In web structure mining the site map which depicts the structure of a typical web graph consists of web pages as nodes, and hyperlinks as edges connecting between two related pages are analyzed. Web Usage Mining is the application of data mining techniques to discover interesting usage patterns from Web data, in order to understand and better serve the needs of Web based applications. Usage data reveals the intention, identity and origin of Web users along with their browsing behavior at a Web site.
-
Upload
khangminh22 -
Category
Documents
-
view
1 -
download
0
Transcript of Web Log Data Analysis by Enhanced Fuzzy C Means Clustering
International Journal on Computational Sciences & Applications (IJCSA) Vol.4, No.2, April 2014
DOI:10.5121/ijcsa.2014.4209 81
Web Log Data Analysis by Enhanced Fuzzy CMeans Clustering
V.Chitraa1, Antony Selvadoss Thanamani2
1Assistant Professor, CMS College of Science and Commerce, Coimbatore,Tamilnadu, India
2Reader in Computer Science, NGM College (AUTONOMOUS), Pollachi, Coimbatore,Tamilnadu, India
ABSTRACT
World Wide Web is a huge repository of information and there is a tremendous increase in the volume ofinformation daily. The number of users are also increasing day by day. To reduce users browsing time lotof research is taken place. Web Usage Mining is a type of web mining in which mining techniques areapplied in log data to extract the behaviour of users. Clustering plays an important role in a broad rangeof applications like Web analysis, CRM, marketing, medical diagnostics, computational biology, and manyothers. Clustering is the grouping of similar instances or objects. The key factor for clustering is some sortof measure that can determine whether two objects are similar or dissimilar. In this paper a novelclustering method to partition user sessions into accurate clusters is discussed. The accuracy and variousperformance measures of the proposed algorithm shows that the proposed method is a better method forweb log mining.
KEYWORDS
Cluster, FCM, Feature Reduction, Vector Machines, Web Log Data
1. INTRODUCTION
Internet has become buzzword of today’s world. Ocean of information is available in internet andpeople use it for different purposes. Finding information in this voluminous data is a difficulttask for the users. For a specific user only a small amount of web is useful and remaining areirrelevant. Systems are required in client and server side for finding out the desired information.Web mining is an active research area to extract useful information in the ocean of data. Datamining techniques are applied in web data for this purpose.
There are three categories of web mining. Web Content Mining is the process of extractinguseful information from the contents of Web documents. In web structure mining the site mapwhich depicts the structure of a typical web graph consists of web pages as nodes, and hyperlinksas edges connecting between two related pages are analyzed. Web Usage Mining is theapplication of data mining techniques to discover interesting usage patterns from Web data, inorder to understand and better serve the needs of Web based applications. Usage data reveals theintention, identity and origin of Web users along with their browsing behavior at a Web site.

International Journal on Computational Sciences & Applications (IJCSA) Vol.4, No.2, April 2014
82
This is considered as an implicit mining since without knowledge of the users of the website thelog file is analyzed. The purpose of Web usage mining is to gather useful information aboutnavigation patterns. There are three phases of Web Usage Mining such as preprocessing, patterndiscovery and analysis [13]. Preprocessing is an important phase and it is done in six steps. In thefirst step entries with failed status code, robot traversed entries are cleaned. The second step isuser identification step where users are identified. In third step different sessions of users aresegregated by using time oriented method or navigation oriented methods. Missing entries due toproxy server and cache in client systems are added in the next step. The sessions are transformedinto a matrix format for further analysis. In the second phase of pattern discovery the usernavigation patterns are clustered into groups. Web user clusters do not necessarily have crispboundaries. Hence researchers interested in using the using fuzzy sets for clustering of webresources. In the third phase patterns are analyzed and matched with the incoming pattern to findout the similar user and the navigation patterns. This paper focuses on feature selection,clustering and classification of users by using vector machines. A novel soft clustering method tocluster user sessions is proposed in this paper. The proposed technique clusters the user sessionsaccurately and efficiently. Clusters thus formed are classified with machine learning algorithms inthe pattern discovery phase. The remainder of this paper is organized as follows: Section 2presents literature of existing works. Section 3 deals with the methodology for feature reductionusing ICA, novel clustering technique, implementation of Support Vector Machines andRelevance Vector Machine to classify a new user. Experimental results are given in Section 4. Atlast a summary of the work is given in Section 5.
2. Related Work
The heterogeneous and unstructured information available in the web reduces the analysis to agreater extent. Therefore, the preprocessing phase is a prerequisite for discovering patterns and ittransforms the raw click stream data into a set of user profiles [4]. Data preprocessing is adifficult task with a number of challenges. Hence this work gives rise to variety of algorithms andheuristic techniques as merging and cleaning, user and session identification etc [14]. Variousresearch works are carried in different phases of preprocessing.
After cleaning and users are identified then sessions are created by dividing which is defined as aset of pages visited by the same user within the duration of one particular visit to a website. Auser may have a single or multiple sessions during a period. Once a user has been identified, theclick stream of each user is portioned into logical clusters. There are three methods in sessionreconstruction. There are two methods available to find sessions. One depends on time and oneon navigation. Time oriented method is based on specific time browsed by user and is called aspage viewing time. It varies from 25.5 minutes [1] to 24 hours [17] while 30 minutes is thedefault timeout by Cooley [14]. Features are the attributes of session matrix in the proposed worklike individual user IP address, time etc., Feature selection phase reduces the less importantattributes that are not useful for further web extraction or usage.
After sessions are discovered the similar user navigation patterns are grouped by clustering.Clusters are created by estimating the similarities and differences within a data set and groupsimilar data. The performance of a clustering method is measured by its inter-cluster similarityand the intra-cluster similarity where the former one should be low and latter should be high.Web user clustering involves grouping of web users. Clustering algorithms are classified into fourmain groups as partitioning algorithms, hierarchical algorithms, density-based algorithms, andgrid-based algorithms. Partitioning algorithms divides of N objects into a set of k clusters such

International Journal on Computational Sciences & Applications (IJCSA) Vol.4, No.2, April 2014
83
that the partition optimizes a given criterion. A hierarchical method creates hierarchicaldecomposition of objects and it is classified into agglomerative (bottom-up) approaches anddivisive (top-down) approaches based on how the hierarchy is formed. Density-based clusteringalgorithms locate clusters by constructing a density function that reflects the spatial distributionof the data points.
Depending on the ability of density connected points to reach the maximal density, the densitybased notion of a cluster is defined. Grid-based algorithms performs all the operations in a gridstructure which is formed by partitioning the space into a finite number of cells. The mainadvantage of the approach is its fast processing time..However, there exist some important differences between clustering in conventional applicationsand clustering in web mining. Due to non-numerical nature of web data Runkler and Beadek [16]proposed relational clustering method for clustering.. Web user clusters tend to have vague orimprecise boundaries [9]. Fuzzy clustering is observed to be a suitable method to handleambiguity in the data, since it enables the creation of overlapping clusters and introduces a degreeof membership of data object in each cluster. Fuzzy modeling is proposed by Shi [16] byconsidering the time duration that a user spends at a URL .
A wide variety of classification methods have become available during the last three decades.Among them, the most utilized general-purpose methods can be grouped into several categoriessuch as Inductive methods , Coverage methods , Bayesian methods, Linear methods, Non-linearmethods , Lazy methods . Vector machines are observed as a most appropriate method for webuser classification. Support Vector Machines are the most effective machine learning algorithmfor many complex binary classification problems[11]. The SVM is a supervised classificationmethod based on the existence of a linear separator on the data. The linear separator proposed bythis method can be computed in a high dimensional space induced by a kernel. There are severalalgorithms to perform the SVM method as incremental SVM[2], DirectSVM [15] andSimpleSVM [18].
Recently Tipping [5] introduced another machine learning technique Relevance Vector Machine(RVM) for classification which makes probabilistic predictions and yet which retains theexcellent predictive performance of the support vector machine. It also preserves the sparsenessproperty of the SVM. Indeed, for a wide variety of test problems it actually leads to models whichare dramatically sparser than the corresponding SVM, while sacrificing little if anything in theaccuracy of prediction. It consists of several different types of kernels. Even though two differentkernels can remain on the same location, due to the sparseness property the automatic selection ofproper kernel at each location by pruning all irrelevant kernels is possible.
3. METHODOLOGY
Web log file is collected from web server and after cleaning, users are identified. The sessions ofeach user are identified by navigation oriented method. Sessions are reconstructed in the form ofa matrix. Generally the presence of redundant and irrelevant attributes could mislead theanalysis. The storage and processing of data increases the complexity of the analysis anddegrades the accuracy of the result. Increase in attributes in the web log mining not onlyincreases the complexity of the analysis, but also degrades the performance. So feature selectionis an important step in preprocessing which enhances further analysis. To group similar usersclustering is essential. To identify a new user classification is an promising research area in weblog analysis.

International Journal on Computational Sciences & Applications (IJCSA) Vol.4, No.2, April 2014
84
Clustering is the process of grouping navigation patterns into groups with similar features. Itdivides the data into clusters in a way that similar data are placed in the same classes, whiledissimilar data are place in different classes. Classification, on the other hand, a data is assignedto a predefined labeled category, if it has more features similar to that group. Both thesetechniques are used in this research for identifying a new user to a particular class of users withsimilar interest.
Figure 1: Architecture of entire system
3.1 Feature Selection by Independent Component Analysis
The presence of redundant and irrelevant attributes could mislead the analysis. For miningprocess if all the attributes is considered it not only increases the complexity of the analysis, butalso degrades the accuracy of the result. So attributes are reduced by ICA and it is a morepowerful technique to find the patterns. New patterns are selected to reduce the dimensions ofmatrix to enhance better performance. In the proposed method the session matrix is reduced.
In the proposed method a session matrix which consists of navigation patterns is considered. Theclass ‘c’ in this method is the unique web pages of the website browsed over a period of time . Anew matrix is created after normalizing each pattern with mean and standard deviation. ICA isapplied to new patterns and the minimum weighted values are deleted[1]. The remaining patterns
Preprocessing
Input user web log dataWeb log data
Web Log Data Feature Selection
ICA
Pattern grouping
PPFPCMFCM, FPCM
Classification
SVM, RVM
Test data
Perform all steps
Performance evaluation
International Journal on Computational Sciences & Applications (IJCSA) Vol.4, No.2, April 2014
85
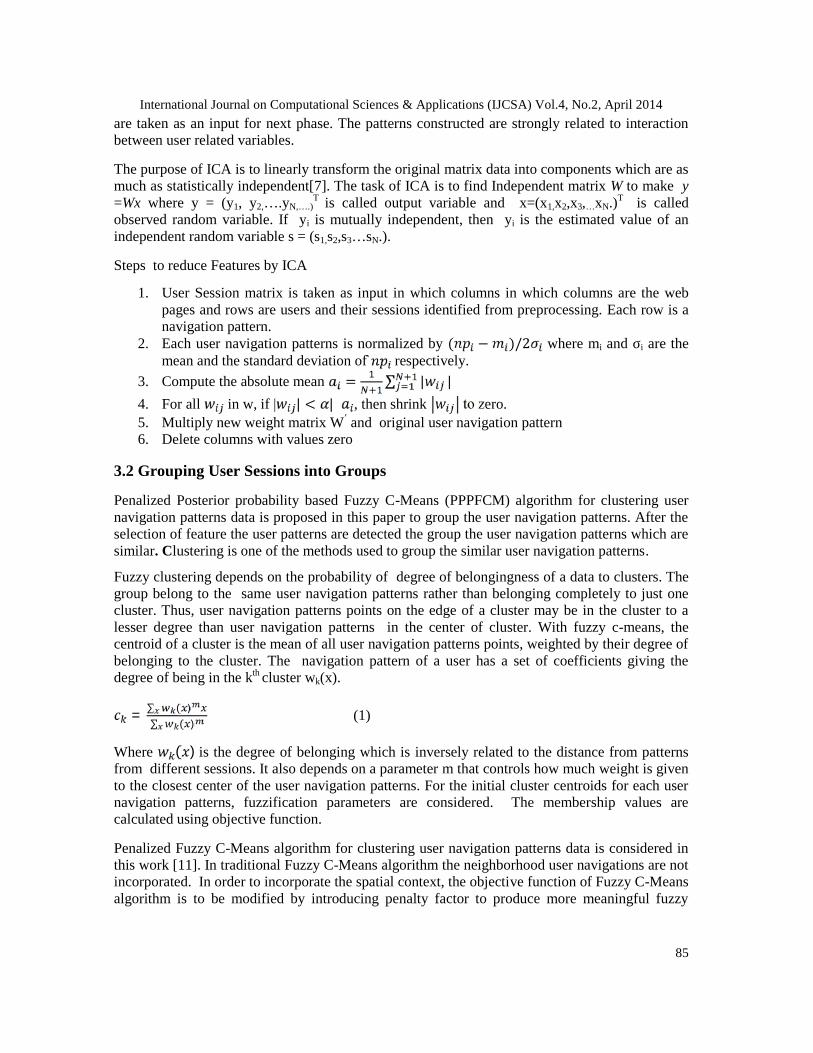
are taken as an input for next phase. The patterns constructed are strongly related to interactionbetween user related variables.
The purpose of ICA is to linearly transform the original matrix data into components which are asmuch as statistically independent[7]. The task of ICA is to find Independent matrix W to make y=Wx where y = (y1, y2,….yN,….)
T is called output variable and x=(x1,x2,x3,…xN.)T is calledobserved random variable. If yi is mutually independent, then yi is the estimated value of anindependent random variable s = (s1,s2,s3…sN.).
Steps to reduce Features by ICA
1. User Session matrix is taken as input in which columns in which columns are the webpages and rows are users and their sessions identified from preprocessing. Each row is anavigation pattern.
2. Each user navigation patterns is normalized by ( − )/2 where mi and σi are themean and the standard deviation of respectively.
3. Compute the absolute mean = ∑ | |4. For all in w, if | | < | , then shrink to zero.5. Multiply new weight matrix W’ and original user navigation pattern6. Delete columns with values zero
3.2 Grouping User Sessions into Groups
Penalized Posterior probability based Fuzzy C-Means (PPPFCM) algorithm for clustering usernavigation patterns data is proposed in this paper to group the user navigation patterns. After theselection of feature the user patterns are detected the group the user navigation patterns which aresimilar. Clustering is one of the methods used to group the similar user navigation patterns.
Fuzzy clustering depends on the probability of degree of belongingness of a data to clusters. Thegroup belong to the same user navigation patterns rather than belonging completely to just onecluster. Thus, user navigation patterns points on the edge of a cluster may be in the cluster to alesser degree than user navigation patterns in the center of cluster. With fuzzy c-means, thecentroid of a cluster is the mean of all user navigation patterns points, weighted by their degree ofbelonging to the cluster. The navigation pattern of a user has a set of coefficients giving thedegree of being in the kth cluster wk(x).= ∑ ( )∑ ( ) (1)
Where ( ) is the degree of belonging which is inversely related to the distance from patternsfrom different sessions. It also depends on a parameter m that controls how much weight is givento the closest center of the user navigation patterns. For the initial cluster centroids for each usernavigation patterns, fuzzification parameters are considered. The membership values arecalculated using objective function.
Penalized Fuzzy C-Means algorithm for clustering user navigation patterns data is considered inthis work [11]. In traditional Fuzzy C-Means algorithm the neighborhood user navigations are notincorporated. In order to incorporate the spatial context, the objective function of Fuzzy C-Meansalgorithm is to be modified by introducing penalty factor to produce more meaningful fuzzy

International Journal on Computational Sciences & Applications (IJCSA) Vol.4, No.2, April 2014
86
clusters. The cluster centroids for each user navigation patterns is to be computed andmembership values will be calculated.
In Penalized FCM clustering algorithm, each user session is not exactly analyzed to evaluatemembership value. By using Bayesian statistics the posterior probability is calculated by theprobability of the parameters which contrasts with the likelihood function when given with theevidence. They are considerably higher than equivalent nonparametric methods and erroneousconclusions will be made more often. The method will assign user navigation patterns to the classwith highest membership.
Steps for the Penalized Posterior probability based Fuzzy C-Means
Set the cluster centroids vi, fuzzification parameter q, the cluster index l and number of clusters c.Repeat until
1. Calculate membership values using Equation.∗ = ∑ , ∑ ( ), ∑ ( ) ( ) (2)
2. Evaluate the highest membership value result ∗ based on the probability function .Theposterior probability is the probability of the parameters ∗ given the evidence ( ∗ | ) .( ∗ | ) is the probability of the evidence given by the parameters and it is different from thelikelihood function in conventional FCM . The posterior probability is defined as( ∗ | ) = ∗ ( ∗ )( ) (3)
3. Compute the cluster centroids for user navigation patterns using Eq.
∗ = ∑ ( ∗ )∑ ( ∗ ) (4)
Until convergence criteria of the similar user navigation patterns are clustered.
After convergence a defuzzification process takes place, in order to convert the user navigationpatterns matrix to a crisp partition. Among many methods available for defuzzification themaximum membership procedure is the best method for user navigation patterns. The procedureassigns the user navigation patterns k to the class C with the highest membership= arg max ( ∗ | ) , = 1, … (5)
3.3 Classification
Classification is the process of classifying a data item into one of several predefined classes. Aftersimilar navigation patterns are clustered from above clustering methods then next step is toclassify user navigation patterns to a class and when new user navigation patterns entered intoweb page similar user navigation patterns are identified and classified using classificationmethods. In this work proposed vector methods such as SVM, RVM are used for classification.

International Journal on Computational Sciences & Applications (IJCSA) Vol.4, No.2, April 2014
87
3.3.1 Classification by Support Vector Machines
Support Vector Machines based on Structural Risk Minimization acts as one of the best approachfor classification. The principal behind this theory is to learn from finite data and controlsgeneralization ability of learning machines which reduces the error. The data is separated by ahyper plane in the n-dimensional space. The data which are closest to the hyperplane are calledsupport vectors which acts as representatives. The hyperplane that separates two groups of data isexpressed in the objective function
w.x + b = 0 (6)
where x is a set of training vectors, w represent vectors perpendicular to the separatinghyperplane and b represents the offset parameters which allows increase of the margin.For n-dimensional data n-1 hyperplanes are to be introduced. A positive slack variable ϵ isintroduced in the objective function in order to add some flexibility in separating the categories[ ].The improvised objective function is
yi(w.xi +b) >=1- ϵi (7)
where ϵ >=0. For non-linear classification kernel functions are used instead of every dot product.It maps the input space into a high dimensional space through a non-linear transformation. Thekernel mapping provides a common base for most of the commonly employed modelarchitectures, enabling comparisons to be performed [8]. There are several kernel functions likeGaussian, Laplace, Radial Basis Function are available in which Laplacian is observed as suitablefor the log data classification.( , ) = exp (− | | ) (9)
Given a training set of instance-label pairs (xi; yi); i = 1… l where xi ∈ Rn and y ∈{1,-1}l, thenthe support vector machines requires the solution for the objective function
yi(w. φ (xi) +b) >=1- ϵi (10)
The function φ maps training vectors xi into a higher dimensional space. A linear separatinghyperplane with the maximal margin in this higher dimensional space is found by SVM.
The steps to train using SVM Classifier is1. Prepare and normalize the cluster data2. Consider the Laplacian Kernel3. Use Cross-validation to find the best parameters and train the whole training data set.4. Test the data and find accuracy.
The advantages of SVM are
• Effective in high dimensional space• Memory efficient• Accuracy.

International Journal on Computational Sciences & Applications (IJCSA) Vol.4, No.2, April 2014
88
There are few drawbacks such as
• Non-probabilistic classification which is a need for user behavior classification• An increase in number of support vectors with the size of increasing training set.
Due to these reasons the computational complexity increases and experimentation is done withanother technique which overcomes these pitfalls.
3.3.2 Classification By Relevance Vector Machines
There are certain drawbacks observed in SVM like complexities increase with increase in classesand kernel functions are centered on training data points which must be positive definite. Soanother machine learning technique Relevance Vector Machines is considered for classification.RVM rely on Bayesian inference learning. RVM has the highest capacity to find exact userpatterns and probabilistic solutions.
Steps in RVM for Classification
Step 1 Initialize parameters and select Laplacian Kernel function to design matrix ΦStep 2. Establish a suitable convergence criteria for α and βStep 3. Fix a threshold value αTh which it is assumed an αi is tending to infinity upon reaching it.Step 4. Initialize α and βStep 5. Calculate m = β ∑ ΦTt where ∑=(A + β Φ T Φ)-1
Step 6. Update αi = / mi2 and β = (N - ∑i ) / || t- Φm||Step 7. Apply pruning to αi and basis functions αi > αTh
The steps 5 to 7 until convergence criteria is met. Whenever a new user arrives after doingpreprocessing, the resultant pattern is estimated with a target value ‘t’ for a new input x’ by usingthe objective function
t=mT Φ(x’) (8)
4. Experimental Results
The proposed web log preprocessing is evaluated in this section. The results of different stagesare given as follows. The method is implemented by using MATLAB.
4.1 Web log data
The weblog data considered for evaluation is collected from a furniture shop web server duringthe period of May to August, 2013. Initially the log file consists of 23141 raw log entries withnoisy entries like gif, jpeg etc which are not necessary for web log mining.
4.2 Data Cleaning
Data cleaning phase is performed and irrelevant entries are removed. Entries with graphics andvideos format such as gif, JPEG, etc., and entries with robots traversal are removed. The numberof records resulted after cleaning phase is 19687 and it is represented in figure 2.

International Journal on Computational Sciences & Applications (IJCSA) Vol.4, No.2, April 2014
89
Figure 2: No of log Entries before and after Data Cleaning
4.3 Session Matrix Construction
There are 358 unique users identified after applying the algorithm. Session identification processis carried out. Sessions are reconstructed in a matrix format which gives details about thefrequency and navigation pattern of different users. A part of the result obtained by using thesession identification process is represented in matrix format is represented in figure 3. U1, U2,etc., represents the user with particular IP address. S1, S2 etc., gives the session constructed asper proposed method. The columns 1,2,3….are the web pages browsed by users in the respectedsessions, As presented in the figure, it can be seen that for user 1 there are two sessions in whichfirst session has the URL traversal 1-2. For user 2, only one session is resulted i.e., 5-6-7---.
Users Sessions 1 2 3 4 5 6 7
U1 S1 1 2 10
0U1 S2 2 0 0 0 0 0 2
U2 S1 0 0 0 0 2 1 1
U3 S1 0 1 0 2 100
U3 S2 0 0 0 0 0 0 1
U4 S1 0 0 0 2 1 0 0
U5 S1 0 4 0 0 0 1
Figure 3.Sample User Session Matrix
4.4 Feature Reduction by ICA.
In the given input data the matrix constructed consists of 14 columns in which most of thecolumns are irrelevant and after applying there are only 5 columns which enhances furtheranalysis in terms of time and complexity.
4.5 Clustering By PPPFCM
The sessions are divided into 14 clusters. User-Sessions are distributed among these 14 clusters.A sample of 3 clusters is given in Figure 4.
1700018000190002000021000220002300024000
Before After
Num
ber o
f rec
ords
Data Cleaning Step

International Journal on Computational Sciences & Applications (IJCSA) Vol.4, No.2, April 2014
90
Figure 4.Sample Clusters
To measure the clustering accuracy of proposed system Penalized Posterior Probability FCM andexisting methods FCM(Fuzzy C means) clustering, Penalised FCM clustering, the parameterssuch as Rand Index, Sum of Squared Error (SSE) are used.
4.4.1 Rand Index
The Rand index is a measure used to compare induced clustering structure(C ) and a clusteringstructure (C ). Let ′a′ be the number of instances that are assigned to the cluster in C and C . ′b′be the number of instances that are in the same cluster C , but not in the cluster in C . ‘c’ be thenumber of instances that are in the same cluster in C , but not in the cluster in C , and ‘d’ be thenumber of instances that are assigned to different clusters in C and C . The quantities a and d canbe interpreted as agreements, and b and c as disagreements. The Rand index is defined as:= (9)
The Rand index lies between 0 and 1. When the two partitions agree perfectly, the Rand index is1.The clustering accuracy is high and the rand index value is nearly equal to one or else theaccuracy of clustering results is less. The clustering accuracy results of methods is shown inFigure 5. It shows proposed PPPFCM have higher rand index rate than FCM and PFCMmethods.The results of clustering methods for Rand Index is shown in table 1
.
Figure 5. Rand index of clustering methods
00.20.40.60.8
1
2 4 6 8 10
Rand
inde
x(%
)
Number of clusters
Rand indexFCM PFCM PPPFCM

International Journal on Computational Sciences & Applications (IJCSA) Vol.4, No.2, April 2014
91
Table 1. Rand index of clustering results
Number of
clusters
Rand index (RI) (%)
FCM PFCM PPPFCM
2 0.78 0.79 0.8654
4 0.7512 0.852 0.9123
6 0.7412 0.8562 0.9125
8 0.7652 0.8215 0.921
10 0.7923 0.8645 0.915
4.4.2 Sum of Squared Error (SSE)
SSE is the simplest and most widely used criterion measure for clustering. It measures thecompactness of the clusters. It is calculated as= ∑ ∑ || − ||∀ ∈ (10)
where is the set of instances in cluster , is the vector mean of cluster . The componentsof are calculated as:
, = ∑ .∀ ∈ (11)
where = | | is the number of instances belonging to cluster .The SSE error values is lessbelow to 0.01 ,error values of clustering results are less .The results of SSE among clusteringmethods for user session matrix is shown in Figure 6. It shows that proposed system have lesserror value when compare to FCM and PFCM methods, the results are also tabulated in table 3 .
Figure 6. Sum of Squared Error (SSE) of clustering methods
0
0.05
0.1
0.15
0.2
0.25
2 4 6 8 10Sum
of S
quar
ed E
rror
(SSE
) (%
)
Number of clusters
Sum of Squared Error (SSE)FCM PFCM PPPFCM

International Journal on Computational Sciences & Applications (IJCSA) Vol.4, No.2, April 2014
92
Table 3: Sum of Squared Error (SSE) of clustering methods
Number of clusters Sum squared Error (SSE)(%)
FCM PFCM PPPFCM
2 0.21 0.15 0.1
4 0.18 0.1358 0.09
6 0.16 0.1359 0.075
8 0.1248 0.1105 0.0612
10 0.1251 0.0912 0.02458
4.4.3. F-measure
All three algorithms are compared based on the effectiveness of the clustering results. The F-measure is calculated by combining precision and recall values of clusters. Let us consider ci
designate the number of session in class , and designate the number of session in cluster j.Moreover, let designate the number of items of class i present in cluster j. The ( , ) isthe precision of cluster j with respect to class i and ( , ) is the recall of a cluster withrespect to class as( , ) = (12)
( , ) = (13)
The f-measure, ( , ), of a class with respect to cluster is then defined as( , ) = ∗( ( , )∗ ( , ))( , ) ( , ) (14)
The values of F-Measure is high when formation of cluster results are correct. Proposed PPPFCMclustering algorithm have higher clustering accuracy than existing methods such as FCM andPFCM methods. Results are tabulated in table 4 and comparison of performance is is shown inFigure 6.
Table 4.F-measure of clustering methods
Number ofclusters
F-measure (%)
FCM PFCM PPPFCM
2 0.71 0.725 0.9125
4 0.723 0.741 0.9189
6 0.7324 0.7512 0.9215
8 0.7413 0.7648 0.9289
10 0.7498 0.7712 0.9315

International Journal on Computational Sciences & Applications (IJCSA) Vol.4, No.2, April 2014
93
Figure 6: F-measure of clustering methods
4.5 Classification By Support Vector Machines And Relevance Vector Machines
Classification is done by implementing both vector machine methods. The performance measuresof these methods are measured by various parameters. The true positive rate TPrate =TP/(TP+FN) represents the rate of recognition of the positive class. It is also known as sensitivity.The corresponding measurement for the negative class is the true negative rate (TNrate), alsocalled specificity, and is computed as the number of negative examples correctly identified, out ofall negative samples TNrate=TN/(TN+FP). The results for the measures calculated afterclassification by SVM and RVM are tabulated in table 5 and a graphic representation is shown infigure 7 below.
Table 5. Measures of SVM and RVM Classification
Measures SVM RVM
Sensitivity 0.4077 0.6035
Specificity 0.2397 0.2036
Figure 7. Comparison of SVM and RVM Classification
0
0.2
0.4
0.6
0.8
1
2
F-m
easu
re (%
)
FCM
Sensitivity
Specivicity
International Journal on Computational Sciences & Applications (IJCSA) Vol.4, No.2, April 2014
93
Figure 6: F-measure of clustering methods
4.5 Classification By Support Vector Machines And Relevance Vector Machines
Classification is done by implementing both vector machine methods. The performance measuresof these methods are measured by various parameters. The true positive rate TPrate =TP/(TP+FN) represents the rate of recognition of the positive class. It is also known as sensitivity.The corresponding measurement for the negative class is the true negative rate (TNrate), alsocalled specificity, and is computed as the number of negative examples correctly identified, out ofall negative samples TNrate=TN/(TN+FP). The results for the measures calculated afterclassification by SVM and RVM are tabulated in table 5 and a graphic representation is shown infigure 7 below.
Table 5. Measures of SVM and RVM Classification
Measures SVM RVM
Sensitivity 0.4077 0.6035
Specificity 0.2397 0.2036
Figure 7. Comparison of SVM and RVM Classification
2 4 6 8 10Number of clusters
F measureFCM PFCM PPPFCM
0 0.2 0.4 0.6 0.8
Sensitivity
SpecivicityRVM
SVM
International Journal on Computational Sciences & Applications (IJCSA) Vol.4, No.2, April 2014
93
Figure 6: F-measure of clustering methods
4.5 Classification By Support Vector Machines And Relevance Vector Machines
Classification is done by implementing both vector machine methods. The performance measuresof these methods are measured by various parameters. The true positive rate TPrate =TP/(TP+FN) represents the rate of recognition of the positive class. It is also known as sensitivity.The corresponding measurement for the negative class is the true negative rate (TNrate), alsocalled specificity, and is computed as the number of negative examples correctly identified, out ofall negative samples TNrate=TN/(TN+FP). The results for the measures calculated afterclassification by SVM and RVM are tabulated in table 5 and a graphic representation is shown infigure 7 below.
Table 5. Measures of SVM and RVM Classification
Measures SVM RVM
Sensitivity 0.4077 0.6035
Specificity 0.2397 0.2036
Figure 7. Comparison of SVM and RVM Classification

International Journal on Computational Sciences & Applications (IJCSA) Vol.4, No.2, April 2014
94
The most widely employed such metric is the accuracy (Acc) of the classifier, or its complement– the error rate (Err). Acc is defined as the ratio between the total number of correctly classifiedinstances and the total number of instances, Acc = (TP+TN)/(TP+TN+FP+FN), They are usuallyexpressed as percentages. A comparison of accuracy of both the methods are shown in Figure 8.
Figure 8.Accuray of SVM and RVM
5. CONCLUSION
In this paper, a novel approach based on Fuzzy C Means in fuzzy environments is proposed tocluster the web user transactions. This approach is groups the similar user navigation patterns.The algorithm enhances the FCM, and Penalized FCM clustering algorithm by adding PosteriorProbability to find highest membership for a member to add in a cluster. Classification is carriedout by SVM and RVM for classifying a new user to a particular group. The method isexperimented and evaluated and found it is better method for clustering than the existingmethods.
REFERENCES
[1] Catlegde L. and Pitkow J., “Characterising browsing behaviours in the world wide Web”,ComputerNetworks and ISDN systems, 1995
[2] Cauwenberghs, g. Et poggio, T. “ Incremental and decremental support vector machineLearning”. In Advances in neural information processing systems 13.proceedings of the 2000conference, pages 409–415.
[3] Chih-Wei, Chih-Chung Chang, and Chih-Jen Lin, Hsu, "A practical guide to support vectorclassification." (2003).
[4] Demin Dong, “Exploration on Web Usage Mining and its Application, “,IEEE,2009[5] Tzikas, Dimitris G., et al. "A tutorial on relevance vector machines for regression and classification
with applications." EURASIP News Letter, 17, 2, 4 23 (2006).[6] Houqun Yang, Jingsheng Lei, Fa Fu, “An approach of Multi-path Segmentation Clustering Based on
Web Usage Mining”, Fourth International Conference on Fuzzy Systems and Knowledgediscovery,IEEE,2007.
[7] Hyvärinen, Aapo, and Erkki Oja. "Independent component analysis: algorithms andapplications."Neural networks 13.4 (2000): 411-430.

International Journal on Computational Sciences & Applications (IJCSA) Vol.4, No.2, April 2014
95
[8] Lee, Lam Hong, et al. "A Review of Nearest Neighbor-Support Vector Machines HybridClassification Models." Journal of Applied Sciences 10.17 (2010).
[9] P. Lingras, C. West, Interval set clustering of web users with rough k-means, Journal of IntelligentInformation Systems 23(1)(2004) 5-16.
[10] Mehrdad Jalali, Norwati Mustapha, Ali Mamat, Md. Nasir B Sulaiman , 2009, A RecommenderSystem for Online Personalization in the WUM Applications. Proceedings of the World congresson Engineering and Computer Science 2009 Vol II, San Francisco, USA pp741- 746.
[11] Nello Cristianini and John Shawe-Taylor, “An Introduction to Support Vector Machines and OtherKernel-based Learning Methods”, Cambridge University Press, 2000.
[12]. P.K. Nizar Banu and H. Hannah Inbarani, “An Analysis Of Gene Expression Data Using PenalizedFuzzy C-Means Approach”, 2013.
[13] Raju G.T. and Sathyanarayana P. “Knowledge discovery from Web Usage Data : CompletePreprocessing Methodology, ”, IJCSNS 2008.
[14] Robert.Cooley,Bamshed Mobasher, and Jaideep Srinivastava, “ Web mining:Information and PatternDiscovery on the World Wide Web”, In International conference on Tools with ArtificialIntelligence, pages 558-567, Newport Beach, IEEE,1997.
[15] T. Runkler, J. Beadek, Web mining with relational clustering, International Journal of ApproximateReasoning, 32(2003) 217-236.
[16] Shi, P., “An Efficient Approach for Clustering Web Access Patterns from Web Logs”, InternationalJournal ofAdvanced Science and Technology, Vol. 5, April 2009
[17] Spilipoulou M.and Mobasher B, Berendt B.,”A framework for the Evaluation of SessionReconstruction Heuristics in Web Usage Analysis”, INFORMS Journal on Computing Spring ,2003.
[18] Vishwanathan, S. et Narasimha Murty, M. (2002). Ssvm: a simple svm algorithm. IJCNN’02.Proceedings of the 2002 International Joint Conference on Neural Networks, 3:2393 – 2398.
AUTHORS
Mrs. V. Chitraa is a doctoral student in Manonmaniam Sundaranar University,Tirunelveli, Tamilnadu. She is working as an Assistant Professor in CMS college ofScience and Commerce, Coimbatore and a member of IEEE. Her research interestlies in Web Mining, Database Concepts and knowledge mining. She has publishedmany papers in reputed international journals and conferences.
Dr. Antony Selvadoss Thanamani is working as a Reader in the department ofComputer Science in NGM college with a teaching experience of about 26 years.Hisresearch interests include Knowledge Management, Web Mining, Networks,MobileComputing, and Telecommunication. He has guided more than 41 M.Phil.Scholarsand many Ph.D., scholars. He has presented more than 50 papers. He has attendedmore than 15 workshops, seminars and published about 8 books and 16 papers