a fundamental evaluation of the atmospheric pre-leaching ...
412
A FUNDAMENTAL EVALUATION OF THE ATMOSPHERIC PRE-LEACHING SECTION OF THE NICKEL-COPPER MATTE TREATMENT PROCESS by RODRICK MULENGA LAMYA Dissertation presented for the Degree of DOCTOR OF PHILOSOPHY (Extractive Metallurgical Engineering) in the Department of Process Engineering at the University of Stellenbosch, South Africa Promoter Prof. L. Lorenzen STELLENBOSCH March 2007
-
Upload
khangminh22 -
Category
Documents
-
view
1 -
download
0
Transcript of a fundamental evaluation of the atmospheric pre-leaching ...

A FUNDAMENTAL EVALUATION OF THE
ATMOSPHERIC PRE-LEACHING SECTION OF THE
NICKEL-COPPER MATTE TREATMENT PROCESS
by
RODRICK MULENGA LAMYA
Dissertation presented for the Degree
of
DOCTOR OF PHILOSOPHY
(Extractive Metallurgical Engineering)
in the Department of Process Engineering at the University
of Stellenbosch, South Africa
Promoter
Prof. L. Lorenzen
STELLENBOSCH
March 2007

DECLARATION
I the undersigned, hereby declare that the work contained in this
dissertation is my own original work and that I have not previously in
its entirety or in part submitted it at any university for a degree.
Signature: ...............................................
Date: .......................................................
Copyright © 2007 Stellenbosch University
All rights reserved
i

SYNOPSIS
Nickel-Copper sulphide ores are the most important Platinum Group Metal bearing
ores. The South African deposits are exceptionally rich in the platinum group
metals (PGMs) and production of the PGMs is the primary purpose of treating these
ores. The methods used in the recovery of the PGMs from the nickel-copper ores
generally consists of ore concentration by physical techniques, pyrometallurgical
concentration and hydrometallurgical extraction of the base metals followed by the
PGMs. Pyrometallurgical concentration produces Ni-Cu matte, which is treated by
hydrometallurgical processes to recover the nickel, copper, cobalt and the precious
metals.
In this study, the leaching behaviour of a Ni–Cu matte in CuSO4–H2SO4 solution
during the repulping (pre-leach) stage at Impala Platinum Refineries was studied.
The repulping stage is basically a non–oxidative atmospheric leach stage, in which
nickel, iron and cobalt are partially dissolved, while the copper is precipitated. To
understand the nature of the leaching process during this stage of the base metal
refining operation, the effects of variations in the key process variables such as
temperature, stirring rate, particle size, pulp density, residence time, initial copper
and acid concentrations were investigated. The pre-leached matte was then
pressure leached to ascertain the effect of process conditions in the pre-leach stage
on the subsequent pressure leach stage.
It was found that the leaching mechanism entails dissolution of metal alloys out of
sulphide minerals with transformation of Ni3S2 to NiS. Aqueous copper precipitates
as metallic copper and as chalcocite. The matte is leached by both acid and the
cementation process, especially in the early stage when the Cu2+ ions are present.
Galvanic interaction of the sulphide minerals and/or the Ni alloy also enhances the
leaching process. The leaching kinetics of Ni was characterized with the shrinking
core model and was found to be controlled by diffusion through surface layer. An
activation energy of 31 kJ/mol was obtained, which also suggested a diffusion
controlled leaching reaction. Atmospheric leaching tests indicated that Ni
ii

extraction increased slightly in the temperature range 50 – 60 oC, however no
significant increase was observed from 60 to 80 oC, probably because the leaching
process was found to be diffusion controlled. The slight increase in nickel
dissolution at higher temperatures (>60 oC) may be attributed to the
transformation of Ni3S2 to NiS, which is easier to leach. Co extraction appeared to
be insensitive to temperature changes, while Fe extraction was low at 50 oC but
increased significantly at 60 – 80 oC. The Ni extraction increased gradually with
increase in the stirring rate from 145 to 400 rpm while Co and Fe extractions were
insensitive at 145 and 205 rpm, but increased substantially at 400 rpm. This was
probably due to increased mass transfer rate and transformation of Ni3S2 to NiS.
With pulp density, Ni and Co extractions appeared to be insensitive to changes in
the pulp density as only a slight increase in extractions was observed when the
density was reduced from 1.7 kg/L to 1.6 kg/L. Similar iron extractions were
achieved at 1.7 and 1.75 kg/L but increased significantly at 1.6 kg/L. It was found
that Ni and Co extractions were not significantly affected by changes in the particle
size, probably because metal alloys were liberated and hence exposed to the
leaching solution. Iron extraction could not be determined accurately because of
iron precipitation at pH above 3. Generally the leaching of metals did not depend
on the initial copper concentration in the investigated range of 25 - 48 g/L Cu. It
was also observed that initial acid concentration did not have an effect on Ni
extraction, probably due to the fact that most of the nickel was leached by the
process of cementation. However, Co and Fe extractions increased when the acid
increased from 90 g/L to 110 g/L, but no further increase was noted at 125 g/L. A
residence time of 5 hours was found to be adequate as there was no significant
increase in metal extractions when the residence time was increased beyond 5
hours. As much as 20% Ni, 40% Co and 80% Fe can be extracted from the Ni-Cu
matte during the repulping stage of the leaching process studied, provided the
investigated conditions prevail.
Generally the rate of Cu cementation increased with increasing temperature and
pulp density, but decreased with an increase in particle size, acid and copper
iii

concentrations. The rate of stirring did not affected Cu cementation. It was found
that aqueous copper precipitated from the solution within 90 minutes when the
temperature was raised to 80 oC. However, under the present pre-leach
temperature of about 60 oC complete Cu cementation can only be achieved after
about 5 hours. The cementation reaction was found to follow a mixed control
mechanism, with two distinct activation energies namely 18.2 kJ/mol at 70 – 80 oC and 74.6 kJ/mol at 50 – 70 oC. This suggested that the rate of cementation
reaction is probably controlled by a boundary layer diffusion mechanism at higher
temperatures. At low temperatures the rate is probably controlled by a surface
reaction mechanism.
The pressure leaching experiments, which were aimed at investigating the response
of pre-leached matte to the subsequent pressure leaching process, showed that Ni
extractions were similar for the investigated pre-leach temperature of 50 – 80 oC
and stirring rate of 145 – 400 rpm. For the pre-leach stage conditions of 60 – 80 oC
and 205 – 400 rpm Ni3S2 was transformed into NiS, which is easier to leach in the
pressure leaching stage. However, because of the aggressive conditions prevailing
in the pressure leaching stage, all the nickel minerals were leached at about the
same rate. In the case of pulp density, Ni extraction was comparable for all the
investigated pulp densities (1.6 – 1.75 kg/L). This was probably due to the fact that
Ni3S2 transformed to NiS in the pre-leach stage. It was found that Ni extraction
increased with increasing residence time for the investigated time of 1 hour to 9
hours, probably due to the changes in the mineral phases of the matte as indicated
above. The copper minerals (Cu2S and Cu1.96S) transformed into Cu2S and Cu1.8S
with aqueous copper being precipitated, and were not leached under the applied
conditions. All the cobalt and iron dissolved in the pressure leaching stage.
A semi-empirical kinetic model was developed for the pre-leaching stage. A
comparison of the model predictions and the experimental data for the dissolved
species during the batch leaching process showed that the model can satisfactorily
fit the trends in the leaching of the metals.
iv

OPSOMMING
Nikkel-koper-sulfiederts is die belangrikste platinum-groep metaaldraende erts.
Die Suid-Afrikaanse afsetting in die platinum-groep metale (PGM’s) is
buitengewoon ryk en die produksie van die PGM’s is die hoofdoel vir die
behandeling van hierdie erts. Die metodes wat gebruik word om die PGM’s van die
nikkel-koper-erts te herwin, bestaan hoofsaaklik uit ertskonsentrasie deur fisiese
tegnieke, pirometallurgiese konsentrasie en hidrometallurgiese ekstraksie van die
basismetale, gevolg deur die PGM’s. Pirometallurgiese konsentrasie produseer Ni-
Cu swaelmetaal, wat deur hidrometallurgiese prosesse behandel word om die
nikkel, koper, kobalt en edelmetale te herwin.
In hierdie studie is die uitlogingsgedrag van ’n Ni–Cu swaelmetaal in ’n CuSO4–
H2SO4-oplossing gedurende die herverpulping- (vooruitlogings-)fase by Impala
Platinum Refineries ondersoek. Die herverpulpingsfase is basies ’n nie-oksidatiewe
atmosferiese uitlogingsfase, waartydens nikkel, yster en kobalt gedeeltelik opgelos
word terwyl die koper gepresipiteer word. Ten einde die aard van die
uitlogingsproses gedurende hierdie fase van die basismetaal-affineringsproses te
verstaan, is die uitwerking van die variasies in die hoofprosesveranderlikes, soos
temperatuur, roertempo, partikelgrootte, pulpdensiteit, verblyftyd en aanvanklike
koper- en suurkonsentrasies ondersoek. Drukuitloging is daarna op die
vooruitgeloogde swaelmetaal toegepas om die uitwerking van die proses se
toestande in die vooruitlogingsfase op die daaropvolgende drukuitlogingsfase te
bepaal.
Daar is gevind dat die uitlogingsmeganisme oplossing van metaallegerings uit
sulfiedminerale met transformasie van Ni3S2 na NiS behels. Waterkoper presipiteer
as metaalkoper en as chalkosiet. Die swaelmetaal word deur sowel die suur as die
sementasieproses uitgeloog, veral in die vroeë fase wanneer die Cu2+-ione
teenwoordig is. Galvaniese interaksie van die sulfiedminerale en/of die Ni-legering
versterk ook die uitlogingsproses. Die uitlogingskinetika van Ni is deur die
krimpende kernmodel gekenmerk en daar is gevind dat dit deur diffusie deur die
v

bolaag beheer is. ’n Aktiveringsenergie van 31 kJ/mol is verkry, wat ook ’n
diffusiebeheerde uitlogingsreaksie aan die hand doen. Atmosferiese uitlogingstoetse
het aangedui dat Ni-ekstraksie effens in ’n temperatuur van 50 oC tot 60 oC
toegeneem het. Geen beduidende toename is egter tussen 60 oC en 80 oC
waargeneem nie, waarskynlik omdat daar gevind is dat die uitlogingsproses
diffusiebeheerd is. Die effense toename in nikkel-dissolusie teen hoër temperature
(>60 oC) kan aan die transformasie van Ni3S2 na NiS toegeskryf word, wat makliker
is om uit te loog. Co-ekstrasie blyk nie sensitief vir temperatuurveranderinge te
wees nie, terwyl Fe-ekstraksie laag was teen 50 oC maar aansienlik teen 60 oC tot
80 oC verhoog het. Die Ni-ekstraksie het geleidelik verhoog met toename in die
roertempo van 145 rpm tot 400 rpm, terwyl Co en Fe nie teen 145 rpm en 205 rpm
sensitief was nie, maar wesenlik teen 400 rpm verhoog het. Dít is heel moontlik
weens die verhoogde tempo van massa-oordrag en transformasie van Ni3S2 na NiS.
Wat pulpdensiteit betref, blyk Ni- en Co-ekstraksies nie sensitief vir veranderinge
in die pulpdensiteit te wees nie, aangesien slegs ’n effense verhoging van
ekstraksies waargeneem is toe die densiteit van 1.7 kg/L tot 1.6 kg/L verminder is.
Soortgelyke yster-ekstraksies is teen 1.7 kg/L en 1.75 kg/L bereik, maar het
beduidend teen 1.6 kg/L vermeerder. Daar is gevind dat Ni- en Co-ekstraksies nie
wesenlik deur veranderinge in die partikelgrootte beïnvloed is nie, heel moontlik
omdat metaallegerings vrygestel is en dus aan die uitlogingsoplossing blootgestel
is. Yster-ekstraksie kon weens yster-presipitering by pH bo 3 nie akkuraat bepaal
word nie. Oor die algemeen het die uitloging van metale nie afgehang van die
aanvanklike koper-konsentrasie in die reeks van 25 g/L tot 48 g/L Cu wat
ondersoek is nie. Daar is ook gemerk dat aanvanklike suurkonsentrasie geen
uitwerking op Ni-ekstraksie gehad het nie, heel moontlik weens die feit dat die
meeste van die nikkel deur die sementasieproses uitgeloog is. Co- en Fe-
ekstraksies het egter vermeerder toe die suur van 90 g/L tot 110 g/L toegeneem
het, maar geen verdere toename is teen 125 g/L waargeneem nie. ’n Verblyftyd van
vyf uur blyk genoegsaam te wees, aangesien daar geen beduidende toename van
metaalekstraksies was toe die verblyftyd langer as vyf uur was nie. Soveel as 20%
Ni, 40% Co en 80% Fe kan van die Ni-Cu-swaelmetaal tydens die
vi

herverpulpingsfase van die uitlogingsproses wat ondersoek is, uitgeloog word, mits
die toestande wat ondersoek is, teenwoordig is.
Oor die algemeen het die tempo van Cu-sementasie met ’n toename in temperatuur
en pulpdensiteit toegeneem, maar met ’n toename in partikelgrootte en koper- en
suurkonsentrasies afgeneem. Die roertempo het nie Cu-sementasie beïnvloed nie.
Daar is gevind dat waterkoper binne 90 minute uit die oplossing gepresipiteer het
toe die temperatuur tot 80 oC verhoog is. Onder die huidige
vooruitlogingstemperatuur van ongeveer 60 oC kan volledige Cu-sementasie egter
slegs ná ongeveer vyf uur verkry word. Daar is gevind dat die sementasiereaksie op
’n gemengde kontrolemeganisme volg, met twee duidelike aktiveringsenergieë,
naamlik 18.2 kJ/mol teen 70 oC tot 80 oC en 74.6 kJ/mol teen 50 oC tot 70 oC. Dit
suggereer dat die tempo van die sementasiereaksie heel moontlik deur ’n
grenslaag-diffusiemeganisme teen hoër temperature beheer word. Teen lae
temperature word die tempo moontlik deur ’n oppervlak-reaksiemeganisme beheer.
Die drukuitlogingseksperimente, wat daarop gemik was om die reaksie van
vooruitgeloogde swaelmetaal op die daaropvolgende drukuitlogingsproses te
ondersoek, het aangetoon dat Ni-ekstraksies soortgelyk was by die
vooruitlogingstemperatuur van 50 oC tot 80 oC wat ondersoek is en ’n roertempo
van 145 rpm tot 400 rpm. By die toestande in die vooruitlogingsfase van 60 oC tot
80 oC en 205 rpm tot 400 rpm is Ni3S2 na NiS getransformeer, wat makliker is om
in die drukuitlogingsfase uit te loog. Weens die aggressiewe toestande wat tydens
die drukuitlogingsfase heers, is al die nikkelminerale egter teen ongeveer dieselfde
tempo uitgeloog. Ni-ekstraksies was vergelykbaar vir al die pulpdensiteite wat
ondersoek is (1.6 kg/L tot 1.75 kg/L). Dit is heel moontlik toe te skryf aan die feit
dat Ni3S2 in die vooruitlogingsfase na NiS getransformeer het. Daar is gevind dat
Ni-ekstraksie met verhoogde verblyftyd in die ondersoektyd van een tot nege uur
vermeerder het, moontlik weens die veranderinge in die mineraalfases van die
swaelmetaal soos hier bo aangedui. Die koperminerale (Cu2S en Cu1.96S) het na
Cu2S en Cu1.8S getransformeer, met waterkoper wat gepresipiteer het, en is nie
vii

onder die toegepaste toestande uitgeloog nie. Al die kobalt en yster het in die
drukuitlogingsfase opgelos.
’n Semi-empiriese kinetiese model is vir die vooruitlogingsfase ontwikkel. ’n
Vergelyking van die model-voorspellings en die eksperimentele data vir die
opgeloste spesies tydens die lot-uitlogingsproses het aangetoon dat die model
bevredigend by die neigings in die uitloging van die metale kan inpas.
viii

DEDICATION
To my dear wife Kezia, my sons Mulenga, Mulasha and
Mwewa for your tolerance, patience and understanding.
ix

ACKNOWLEDGEMENTS
I wish to thank my supervisor Professor Leon Lorenzen for his invaluable support,
guidance and encouragement throughout the course of this study. The financial
support I received from him is also greatly appreciated. I would like to thank Dr
Johan Rademan of Crusader Systems (Pty) Ltd for the helpful discussion and
advice on the aim of this study.
In the Department of Process Engineering at the University of Stellenbosch, I wish
to thank all the staff for providing a friendly environment; and for their cooperation
and support while I was in Stellenbosch.
This work was also performed at Impala Base Metals Refinery (BMR). I would
therefore like to acknowledge and thank the personnel at the BMR for providing me
with the Laboratory, material and the equipment, in particular Mr T. Spandiel
(BMR Manager), Ms R. Ramkumar, Mr V. Nkomo, Mr D. Hall and Mr H.
Ramagwede. I am thankful to Mr Z. Mthethwa, Mr E. Mabunda, Mr P. Montso and
Mrs S. Phochana for the helpful advice on the Impala BMR process. The assistance
I received from the staff of the Base Metals Laboratory is also acknowledged, in
particular the help rendered by Mr G. Langenhoven and Mr N. Halwindi is
sincerely appreciated. Special thanks to the Laboratory Manager of School of
Chemical and Metallurgical Engineering at the University of Witwatersrand for
allowing me to use the pressure reactor.
I wish to gratefully thank Impala Platinum Refineries for providing the material and
financial support. The support and encouragement I got from Mr M. Fox (Technical
Manager) and Mr E. Orellana (R&D Manager) is sincerely acknowledged. Many
thanks to Mrs E. Lategan and Mrs W. Harvey of the Impala Technical Library for
their assistance in providing the information on time.
Finally, Thanks to my family and all my friends in Johannesburg and Cape Town
for their support and encouragement.
x

LIST OF ABBREVIATIONS
ASTM American Society for Testing Materials
BET Brunauer-Emmett-Teller
BMs Base Metals
BMR Base Metals Refinery
BML Base Metals Laboratories
D2EHPA Di (2-ethyl hexyl) phosphoric acid
EF Electric Furnace
EDX Energy-Dispersive X-ray
EPL Eastern Platinum Limited
FSF Flash Smelting Furnace
ICP Inductively Coupled Plasma
IRS Impala Refining Services
LG-1 Lower Group 1
LG-2 Lower Group 2
LG-3 Lower Group 3
LCD Liquid Crystal Display
MG-1 Middle Group 1
MG-2 Middle Group 2
MG-3 Middle Group 3
MEC Magnetic Concentrates
NCM Non-Magnetic Concentrates
PGE Platinum-Group Element
PGM Platinum Group Metals
PMR Precious Metals Refinery
PLC Programmable Logic Controller
RBMR Rustenburg Base Metals Refiners
SCM Shrinking Core Model
SEM Scanning Electron Microscope
UG-2 Upper Group 2
xi

WPL Western Platinum Limited
WPR Western Platinum Refinery
XRD X-ray diffraction
LIST OF SYMBOLS
A Surface area of matte particles (cm2)
A frequency factor
As the surface area factor that accounts for the effect of variation in the
effective surface area of the matte particles
CM Initial concentration of M in the initial volume of leaching solution (g/L)
CM,j the concentration of M in sample j (g/L)
cm the wt % of M in the solids added into the reactor
[Cu2+]t copper concentration at time t (g/L)
[Cu2+]0 initial copper concentration at t = 0 (g/L)
CA concentrations of reactant species A in solution
CB concentrations of reactant species B in solution
Ea activation energy of a reaction (kJ/mol)
fO2 oxygen fugacity
i the ith reaction
j the jth sample taken during leaching
J the total number of samples taken
K reaction rate constant
M the exact mass of the solids added into the reactor (g)
M molality of species used to draw Potential – pH diagrams
NA moles of species A (mol)
nA stoichiometric coefficient of species A in the reaction rate expression
xii
rA reaction rate of species A based on the unit volume of solution
(mol/L.min-1)
R gas constant
t reaction time (S, min or hr)
T temperature (o C)
V the volume of the solution (cm3 or L)
Vj the volume of the solution sample j (L)
Vr reaction volume (L)
XMi the percent extraction of M at the time ti
X is the fraction reacted during the leaching process
Z the term that accounts for the shrinking core leaching effect
Greek symbols kinetic constant used in the Shrinking Core Model
xiii

TABLE OF CONTENTS
Chapter Page
Declaration i
Synopsis ii
Opsomming v
Dedication ix
Acknowledgements x
List of Abbreviations xi
List of Symbols xii
Table of Contents xi v
1.0 INTRODUCTION 1
1.1 Motivation 3
1.2 Outline of the Dissertation 4
2.0 LITERATURE REVIEW 6
2.1 Geology and Mineralogy of the Bushveld Complex 6
2.1.1 The Merensky Reef 11
2.1.2 The Upper-Group-two (UG-2 ) Reef 16
2.1.3 The Platreef and Dunite pipes 17
2.1.4 The Great Dyke of Zimbabwe 18
2.2 Processing of PGM bearing minerals 18
2.2.1 Comminution (crushing and grinding) 19
2.2.2 Flotation / Gravity separation 21
2.2.3 Pyrometallurgical concentration: Smelting and Converting 23
( i ) Smelting 23
Smelting of Silicates 24
xiv

Smelting of Base Metal Sulphides 25
Smelting of Platinum-Group Minerals 26
(ii) Converting 27
The Direct Outokumpu Nickel Smelting Process
(DON process) 30
2.2.4 Hydrometallurgicalprocessing of Ni – Cu matte 32
The operations at Rustenburg Base Metals Refinery 32
Western Platinum’s Base Metals Refinery 34
Outokumpu nickel-copper matte leaching process 37
The FSF matte leaching circuit 38
The EF matte leaching circuit 40
2.3 Chemistry of Nickel-Copper Matte Leaching Processes 40
2.4 Kinetics of leaching processes 62
2.5 Summary 65
3.0 HYDROMETALLURGICAL OPERATIONS AT IMPALA PLATINUM
LIMITED 67
3.1 Impala Base Metals Refinery (BMR) 68
The Sherritt Gordon Technology 68
3.2 Impala Base Metals Refinery (BMR) process description 69
3.2.1 The pre-leach stage (Pulp density adjustment stage) 69
3.2.2 First stage leach 70
3.2.3 Second Stage Pressure leach 71
3.2.4 Third Stage Pressure leach 72
3.2.5 Fourth Stage Pressure leach 72
3.2.6 Fifth Stage Pressure leach 73
3.2.7 Nickel and cobalt recovery circuit 74
3.2.8 Copper recovery circuit 75
3.3 Summary 75
xv

4.0 EXPERIMENTAL 78
4.1 Matte Preparation 79
4.2 Chemical and Mineral composition of the matte 82
4.2.1 Chemical composition of the matte 82
4.2.2 Mineral composition of the matte 82
4.3 preparation of leaching solution 84
4.4 Atmospheric leaching (pre-leaching) experiments 85
4.4.1 Experimental equipment 85
4.4.2 Experimental conditions 87
4.4.3 Experimental procedure 88
4.5 Pressure leaching experiments 89
4.5.1 Experimental equipment 89
4.5.2 Experimental conditions 90
4.5.3 Experimental procedure 91
4.6 Chemical and mineralogical analysis 92
4.7 Summary 93
5.0 LEACHING CHARACTERISTIC OF Ni – Cu MATTE 95
5.1 Thermodynamics of the Ni-Cu matte -H2SO4 leaching
System 95
5.2 Mechanism of Atmospheric Leaching of Ni-Cu Matte 99
5.2.1 Leaching mechanism based on mineralogical investigations 99
5.2.2 Leaching mechanism based on process chemistry 103
(a) Leaching of metals with simultaneous precipitation of
aqueous copper via the cementation process 103
(b) Leaching of metals by direct acid attack in the absence
of the copper cementation process 105
5.3 Galvanic interaction between minerals phases during leaching
of the Ni-Cu matte 111
5.4 Mechanism of copper cementation during leaching of the
xvi

Ni-Cu matte 115
5.5 Nature of the cemented deposit 117
5.6 Summary 118
6.0 RESULTS AND DISCUSSION OF ATMOSPHERIC LEACHING
EXPERIMENTS 120
6.1 Effect of temperature on the leaching behaviour of the
Ni-Cu matte 124
6.1.1 Effect of temperature on the dissolution of nickel, cobalt
and iron 124
6.1.2 Effect of temperature on copper cementation 132
6.2 Effect of stirring rate on leaching behaviour of the Ni-Cu matte 135
6.2.1 Effect of stirring rate on nickel, cobalt and iron dissolution
135
6.2.2 Effect of stirring rate on copper cementation 139
6.3 Effect of pulp density on the leaching behaviour of the
Ni-Cu matte 142
6.3.1 Effect of pulp density on nickel, cobalt and iron dissolution 142
6.3.2 Effect of pulp density on copper cementation 145
6.4 Effect of particle size on leaching behaviour of the Ni-Cu matte 148
6.4.1 Effect of particle size on nickel, cobalt and iron dissolution
148
6.4.2 Effect of particle size on copper cementation 152
6.5 Effect of initial copper concentration on the leaching behaviour
Of the Ni-Cu matte 154
6.5.1 Effect of initial copper concentration on nickel, cobalt
and iron dissolution 154
6.5.2 Effect of initial copper concentration on copper
cementation 157
6.6 Effect of initial acid concentration on the leaching behaviour
xvii

of the Ni-Cu matte 160
6.6.1 Effect of initial acid concentration on nickel, cobalt
and iron dissolution 160
6.6.2 Effect of initial acid concentration on copper cementation 163
6.7 Effect of residence time on the leaching behaviour of the
Ni-Cu matte 165
6.7.1 Effect of residence time on nickel, cobalt and
iron dissolution 165
6.7.2 Effect of residence time on copper cementation 166
6.8 Summary 169
7.0 PRESSURE LEACHING OF PRE-LEACHED Ni-Cu MATTE 171
7.1 Thermodynamics of the Ni-Cu matte-H2SO4 pressure
leaching systems 171
7.2 Mechanism of pressure leaching of Ni-Cu matte 174
7.3 Results and discussion of Pressure Leaching Experiments 175
7.3.1 Effect of pre-leaching the matte at different temperatures 175
7.3.2 Effect of pre-leaching the matte at different stirring rates 179
7.3.3 Effect of pre-leaching the matte at different pulp densities
182
7.3.4 Effect of pre-leaching the matte at different residence times 185
7.4 Summary 188
8.0 KINETIC MODEL 188
8.1 Chemical reaction rates 189
8.2 Reaction rate expressions 190
8.3 Reaction rate constants 195
8.4 Combined reaction expressions 197
8.5 Evaluation of the model 198
8.6 Summary 199
xviii

9.0 CONCLUSIONS AND RECOMMENDATIONS 204
9.1 Conclusions 204 9.2 Recommendations 211
REFERENCES 213
APPENDICES
APPENDIX A TABLES OF ATMOSPHERIC LEACHING DATA
APPENDIX A1 EFFECT OF TEMPERATURE ON NICKEL, COBALT
AND IRON DISSOLUTION; AND COPPER CEMENTATION
APPENDIX A2 EFFECT OF STIRRING RATE ON NICKEL, COBALT
AND IRON DISSOLUTION; AND COPPER CEMENTATION
APPENDIX A3 EFFECT OF PULP DENSITY ON NICKEL, COBALT
AND IRON DISSOLUTION; AND COPPER CEMENTATION
APPENDIX A4 EFFECT OF MATTE PARTICLE SIZE ON NICKEL, COBALT
AND IRON DISSOLUTION; AND COPPER CEMENTATION
APPENDIX A5 EFFECT OF INITIAL COPPER CONCENTRATION OF
LEACHING SOLUTION ON NICKEL, COBALT AND
IRON DISSOLUTION; AND COPPER CEMENTATION
APPENDIX A6 EFFECT OF INITIAL SULPHURIC ACID CONCENTRATION
OF LEACHING SOLUTION ON NICKEL, COBALT AND
IRON DISSOLUTION; AND COPPER CEMENTATION
APPENDIX A7 EFFECT OF RESIDENCE TIME ON NICKEL, COBALT
AND IRON DISSOLUTION; AND COPPER CEMENTATION
APPENDIX A8 DATA FOR SOLID RESIDUE ANALYSES
APPENDIX A9 DATA FOR SHRINKING CORE MODEL
xix

APPENDIX B TABLES OF PRESSURE LEACHING DATA
APPENDIX B1 EFFECT OF PRE-LEACHING THE MATTE AT DIFFERENT
TEMPERATURE VALUES
APPENDIX B2 EFFECT OF PRE-LEACHING THE MATTE AT DIFFERENT
STIRRING RATE VALUES
APPENDIX B3 EFFECT OF PRE-LEACHING THE MATTE AT DIFFERENT
PULP DENSITY VALUES
APPENDIX B4 EFFECT OF PRE-LEACHING THE MATTE AT DIFFERENT
RESIDENCE TIME VALUES
APPENDIX C GRAPHS OF XRD ANALYSES
APPENDIX C1 GRAPHS OF XRD
APPENDIX D DETERMINATION OF MINERAL COMPOSITION OF
THE MATTE AND PREPARATION OF THE LEACHING
SOLUTION
APPENDIX D1 DETERMINATION OF APPROXIMATE MINERAL
COMPOSITION OF THE MATTE
APPENDIX D2 DETERMINATION OF QUANTITY OF MATTE,
SPENT ELECTROLYTE SOLUTION AND DEMINERALIZED
WATER TO BE MIXED FOR THE VARIATION IN THE
PULP DENSITY REACTION MIXTURE
APPENDIX E KINETIC MODEL DATA
APPENDIX F PAPERS BASED ON THIS DISSERTATION
xx

LIST OF FIGURES
FIGURE PAGE
Figure 2.1 Generalised geological bedrock map of the Bushveld
Complex with selected host rocks 7
Figure 2.2 Generalized stratigraphic column of the Rustenburg Layered
Suit, showing location and lithology of the Merensky Reef 10
Figure 2.3 Stratigraphy of the Critical Zone 10
Figure 2.4 Schematic diagram of the two main types of Merensky Reef
petrology occurring in the Impala Platinum 15
Figure 2.5 Simplified generic flow diagram of platinum-group mineral
refining process 20
Figure 2.6 Simplified flowsheet of the direct Outokumpu Nickel Smelting
Process (DON process) 31
Figure 2.7 Simplified block flow diagram of the Rustenburg Base Metals
Refining process 36
Figure 2.8 A simplified block flow diagram of the Western Platinum Base
Metals refining process 37
Figure 2.9 Block flow diagram of the Outokumpu nickel-copper smelter
and matte leaching process 39
Figure 3.1 Simplified block flow diagram of the pre-leach/first stage leach
Process 73
Figure 3.2 Simplified block flow diagram of the Impala Base Metals
Refinery (BMR) 77
Figure 4.1 Mineral composition of the matte 83
Figure 4.2 Cross section of the leaching vessel used for the atmospheric
leaching experiments 86
xxi

Figure 4.3 Schematic diagram of the atmospheric leaching experimental
set-up 86
Figure 4.4 2-litre Paar Series 4520 bench top pressure reactor 90
Figure 5.1 Eh-pH diagram for the Ni-S-H2O system at (a) 50 oC, (b) 80oC 98
Figure 5.2 Eh-pH diagrams for the Cu-S-H2O system at (a) 50 oC, (b) 80 oC 98
Figure 5.3 Eh-pH diagrams for the Fe-S-H2O system at (a) 50 oC, (b) 80 oC 99
Figure 5.4 SEM images of matte particle before leaching showing
a particle of Nickel alloy in the Ni/Cu sulphide matrix at
a magnification of 7000x 101
Figure 5.5 SEM images of matte particle after 5 hours of leaching,
showing holes formed in the particle after metal alloy was
leached out 101
Figure 5.6 SEM image of matte particle after 5 hours of leaching, showing
that the Ni-Cu alloy and Ni-Fe alloy were not completely
dissolved: spot 1: Ni-Fe alloy; spots 2, 3 and 4: Ni-Cu alloy;
Spot 5: Ni/Cu sulphides 102
Figure 5.7 Variation of metal concentrations and pH of leach solution as
a function of leaching time at 70 oC 107
Figure 5.8 Variation of metal concentrations and pH of leach solution as a
function of leaching time at 80 oC 107
Figure 5.9 Variation of metal concentrations and pH of leach solution as
a function of leaching time at a stirring rate of 400 rpm 108
Figure 5.10 Variation of metal concentrations in leach solution as
a function of leaching time at 60 oC 110
Figure 5.11 Variation of metal concentrations in leach solution as
a function of leaching time at 70 oC 110
xxii

Figure 5.12 Variation of metal concentrations in leach solution as
a function of leaching time at 80 oC 111
Figure 5.13 Schematic diagram of galvanic couple between nickel alloy
and nickel sulphide minerals 114
Figure 5.14 Eh-pH diagram for the Ni-Cu-S-H2O system at 50 oC 115
Figure 5.15 SEM images of matte particles: (a) before leaching,
(b) after 5 hours of leaching 117
Figure 6.1 Nickel extraction as a function of leaching time at different
temperatures 126
Figure 6.2 Cobalt extraction as a function of leaching time at different
temperatures 126
Figure 6.3 Iron extraction as a function of leaching time at different
temperatures 127
Figure 6.4 Metal extractions after atmospheric leaching of the
Ni-Cu matte at different temperatures 127
Figure 6.5 Comparison of metal extractions between two tests conducted
at a temperature of 80 oC 128
Figure 6.6a Plot of 1-3(1-X)2/3 + 2(1-X) vs time for the leaching of Ni
at different temperatures for the size fraction –300 + 150 μm 130
Figure 6.6b Plot of 1-(1-X)1/3 vs time for the leaching of Ni at different
temperatures for the chemically controlled reaction 131
Figure 6.6c Plot of [1-3(1-X)2/3 + 2(1-X)] + α[1 – (1-X)1/3] vs time for the
leaching of Ni at different temperatures for the mixed
controlled reaction 131
Figure 6.7 Arrhenius plot for the Ni leaching reaction at three
different temperatures 132
xxiii
Figure 6.8 Copper precipitation as a function of time during atmospheric
leaching of the matte at different temperatures 134
Figure 6.9a Variation of log[Cu2+]t /[Cu2+]0 ratio with time at different
temperatures 134
Figure 6.9b Variation of cementation rate constant (K) with temperature 135
Figure 6.10 Nickel extraction as a function of leaching time at different
stirring rate 137
Figure 6.11 Cobalt extraction as a function of leaching time at different
stirring rate 137
Figure 6.12 Iron extraction as a function of leaching time at different
stirring rate 138
Figure 6.13 Metal extractions after atmospheric leaching of the
matte at different stirring rates 138
Figure 6.14 Comparison of metal extractions between two tests conducted at a stirring rate of 400 rpm 139
Figure 6.15 Copper precipitation as a function of time during atmospheric
leaching of the matte at different stirring rates 140
Figure 6.16 Variation of log[Cu 2+]t /[Cu 2+]0 ratio with time at different
stirring rates 141
Figure 6.17 Variation of cementation rate constant (K) with stirring rate 141
Figure 6.18 Nickel extraction as a function of leaching time at different
pulp densities of matte 143
Figure 6.19 Cobalt extraction as a function of leaching time at different
pulp densities of matte 143
Figure 6.20 Iron extraction as a function of leaching time at different pulp
densities of the matte 144
Figure 6.21 Metal extractions after atmospheric leaching of the matte
xxiv

at different pulp densities 144
Figure 6.22 Comparison of metal extractions between two tests conducted
at a pulp density of 1.7 kg/L 145
Figure 6.23 Copper precipitation as a function of time during atmospheric
leaching of the matte at different pulp densities 146
Figure 6.24 Variation of log[Cu 2+]t /[Cu 2+]0 ratio with time at different pulp
density values 147
Figure 6.25 Variation of cementation rate constant (K) with pulp density
of reaction mixture 147
Figure 6.26 Nickel extraction as a function of leaching time at different
particle sizes 149
Figure 6.27 Cobalt extraction as a function of leaching time at different
particle sizes 150
Figure 6.28 Iron extraction as a function of leaching time at different
particle sizes 150
Figure 6.29 Metal extractions after atmospheric leaching of the matte
at different particle sizes 151
Figure 6.30 Comparison of metal extractions between two tests conducted
at a particle size of –45 microns 151
Figure 6.31 Copper precipitation as a function of time during atmospheric
leaching of the matte at different particle sizes 152
Figure 6.32 Variation of log[Cu 2+]t /[Cu 2+]0 ratio with time at different
matte particle sizes 153
Figure 6.33 Variation of cementation rate constant (K) with matte particle
size distribution 154
Figure 6.34 Nickel extraction as a function of leaching time at different
initial copper concentrations 155
xxv

Figure 6.35 Cobalt extraction as a function of leaching time at different
initial copper concentrations 156
Figure 6.36 Iron extraction as a function of leaching time at different
initial copper concentration 156
Figure 6.37 Metal extractions after atmospheric leaching of the matte at
different initial copper concentrations 157
Figure 6.38 Copper precipitation as a function of time during atmospheric
leaching of the matte at different initial copper concentrations 158
Figure 6.39 Variation of log[Cu 2+]t /[Cu 2+]0 ratio with time at different
initial Cu concentrations 159
Figure 6.40 Variation of cementation rate constant (K) with initial Cu
Concentration 159
Figure 6.41 Nickel extraction as a function of leaching time at different
initial H2SO4 concentrations 161
Figure 6.42 Cobalt extraction as a function of leaching time at different
initial H2SO4 concentrations 162
Figure 6.43 Iron extraction as a function of leaching time at different
initial H2SO4 concentration 162
Figure 6.44 Metal extractions after atmospheric leaching of the
matte at different initial H2SO4 concentrations 163
Figure 6.45 Copper precipitation as a function of time during atmospheric
leaching of the matte at different initial H2SO4 concentrations 163
Figure 6.46 Variation of log[Cu 2+]t /[Cu 2+]0 ratio with time at different
initial acid strength 164
Figure 6.47 Variation of cementation rate constant (K) with initial
acid strength 165
Figure 6.48 Nickel extraction as a function of leaching time at
xxvi

residence times of 7 and 9 hrs 167
Figure 6.49 Cobalt extraction as a function of leaching time at residence
times of 7 and 9 hours 167
Figure 6.50 Iron extraction as a function of leaching time at residence
times of 7 and 9 hours 168
Figure 6.51 Metal extractions after atmospheric leaching of the matte for
residence times of 7 and 9 hours 168
Figure 7.1 Eh-pH diagrams for the Ni-S-H2O system at 145 oC and
5 bar pressure 173
Figure 7.2 Eh-pH diagrams for the Ni-S-H2O system at 145 oC and 5 bars 173
Figure 7.3 Eh-pH diagrams for the Ni-S-H2O system at 145 oC and 5 bars 174
Figure 7.4 Nickel extraction from matte pre-leached at different
temperatures versus leaching time 177
Figure 7.5 Cobalt extraction from matte pre-leached at different
temperatures versus leaching time 178
Figure 7.6 Iron extraction from matte pre-leached at different
temperatures versus leaching time 178
Figure 7.7 Nickel extraction from matte pre-leached at different
stirring rates versus leaching time 180
Figure 7.8 Cobalt extraction from matte pre-leached at different
stirring rates versus leaching time 181
Figure 7.9 Iron extraction from matte pre-leached at different stirring
rates versus leaching time 181
Figure 7.10 Nickel extraction from matte pre-leached at different pulp
densities versus leaching time 183
Figure 7.11 Cobalt extraction from matte pre-leached at different
pulp densities versus leaching time 184
xxvii

Figure 7.12 Iron extraction from matte pre-leached at different pulp
densities versus leaching time 184
Figure 7.13 Nickel extraction from matte pre-leached at different
residence times versus leaching time 186
Figure 7.14 Cobalt extraction from matte pre-leached at different
residence times versus leaching time 187
Figure 7.15 Iron extraction from matte pre-leached at different
residence times versus leaching time 187
Figure 8.1 A comparison of the model predictions and experimental
data for species in solution for matte leached at 60 0C 200
Figure 8.2 A comparison of the model predictions and experimental
data for species in solution for matte leached at 80 0C 200
Figure 8.3 A comparison of the model predictions and experimenta
data for species in solution for matte leached at
– 45 µm particle size 201
Figure 8.4 A comparison of the model predictions and experimental data
for species in solution for Matte leached at – 106+45 µm size 201
Figure 8.5 A comparison of the model predictions and experimental
Data for species in solution for matte leached at initial
H2SO2 of 125g/L 202
Figure 8.6 A comparison of the model predictions and experimental data
for species in solution during the leaching of the matte at
initial copper of 48 g/L 202
Figure 8.7 A comparison of the model predictions and experimental data
for species in solution for matte leached at 400 rpm 203
xxviii

LIST OF TABLES
TABLE PAGE
Table 2.1 Platinum-Group Metals of the Merensky Reef at the Impala
Platinum Mines near Rustenburg 16
Table 4.1 Particle size distribution of the matte sample before and after
Milling 80
Table 4.2 Comparison of particle size analysis of matte sample used
in this study and matte used on the plant 80
Table 4.3 Particle size distribution and chemical composition of size
fractions used to investigate effects of particle size 81
Table 4.4 Surface area of the matte and particle size fractions used
in the evaluation of kinetics of the Cu cementation reactions 81
Table 4.5 Chemical composition of the matte 82
Table 4.6 Composition of copper spent electrolyte solution 85
Table 4.7 Atmospheric leaching parameter values that were
Investigated with plant parameter values 88
Table 4.8 Experimental pressure leaching conditions, and plant
leaching conditions 91
Table 5.1 Mineralogical composition of the matte before and after
leaching for 5 hours 102
Table 6.1 Ni, Co, and Fe extractions and final metal concentrations
of the solution after atmospheric leaching of the matte at
different temperatures 125
Table 6.2 Ni, Co, and Fe extractions and final metal concentrations
of the solution after atmospheric leaching of the matte at
different stirring rates 136
xxix

Table 6.3 Ni, Co, and Fe extractions and final metal concentrations
of the leach solution after atmospheric leaching of the
matte at different pulp densities 142
Table 6.4 Ni, Co, and Fe extractions and final metal concentrations
of the solution after atmospheric leaching of the matte at
different particle sizes 149
Table 6.5 Ni, Co and Fe extractions and final metal concentrations
of the solution after atmospheric leaching of the matte at
different initial copper concentrations 155
Table 6.6 Ni, Co, and Fe extractions and final metal concentrations of
the solution after atmospheric leaching of the matte
at different initial H2SO4 concentrations 161
Table 6.7 Ni, Co, and Fe extractions and final metal concentrations
of the leach solution after atmospheric leaching of the
matte for 5, 7 and 9 hours 166
Table 7.1 Metal extractions from matte pre-leached at temperatures of
50, 60 and 80 oC, and minerals present in the leach solids 176
Table 7.2 Metal extractions from matte pre-leached at 145, 205 and
400 rpm, and minerals present in the leach solids 179
Table 7.3 Metal extractions from matte pre-leached at 1.6, 1.7 and
1.75 kg/L, and minerals present in the leach solids 182
Table 7.4 Metal extractions from matte pre-leached at residence times
of 1, 3 and 9 hrs, and minerals present in the leach solids 185
Table 8.1 Reaction rate constants used in the kinetic model 197
xxx

CHAPTER 1 1.0 INTRODUCTION
The nickel-copper sulphide ores of South Africa are among the most important
Platinum Group Metal (PGM) bearing ores, and contain the world’s largest
reserves of platinum. The nickel-copper sulphide ores are also found in other
regions such as Canada, Russia, Austraria, Zimbabwe, Botswana and the Pacific
Ocean belt, to mention a few. The South African deposits are exceptionally rich
in the platinum group metals and production of the platinum group metals is the
primary purpose of treating the nickel-copper sulphide ores, which also have
some cobalt. The methods used in the recovery of the Platinum Group Metals
(PGMs) from the nickel-copper ores generally consist of three main unit
processes, namely ore concentration by physical techniques (e.g. flotation and
gravity), pyrometallurgical concentration and hydrometallurgical extraction of
base metals followed by the PGMs. Pyrometallurgical concentration entails
smelting of the nickel-copper concentrates obtained from the flotation/gravity
concentration step. This is a thermal treatment of the concentrates to melt them
and bring about physical and chemical changes that enable recovery of base
metals, PGMs and other valuable metals in crude form. It allows separation of
valuable metals from the bulk of unwanted constituents. In the smelting process,
the general practice is to eliminate the unwanted material (gangue) and
substantially all of the iron sulphide and to concentrate the metal values into a
high-grade converter matte. Matte refers to the intermediate product that is
produced from the smelting process. It is the product that contains metal values,
which is further processed to recover the contained metals. The matte is further
treated by hydrometallurgical processes to produce marketable metal values
such as nickel, copper, cobalt and precious metals, in the case of PGM bearing
nickel-copper mattes. The principal objective of hydrometallurgical extractive
1

processes is to leach the desired elements selectively into an aqueous phase so
as to separate them from the bulk of the unwanted material.
The first step in the hydrometallurgical processing of the Ni-Cu matte is the
leaching stage in which the metal values are first dissolved in a solution and
later recovered as final products in the subsequent stages. Conventionally, two
process routes are employed for leaching the Ni-Cu mattes, especially those
containing platinum group metals. The first process involves both atmospheric
and pressure leaching in acidic copper–nickel sulphate solution, with oxygen
being the oxidizing agent. In this process the matte is first leached under
atmospheric conditions followed by a pressure leach step, and in both steps
O2/air is sparged into the leaching vessels. During atmospheric leaching
substantial quantities of nickel and cobalt are dissolved while copper and iron
are precipitated from the solution, and any PGM present remains in the solids.
The precipitated copper and any unleached nickel and cobalt are dissolved in the
subsequent pressure leach step or, in some cases, fed to a smelter. The other
leaching process route employs a pre-leach step, which is essentially a matte
repulping step, prior to a pressure leach step. The repulping process may be
considered to be basically a non–oxidative atmospheric leach stage since leaching
of the matte starts immediately it comes into contact with the CuSO4 –H2SO4
repulping solution. During the pre-leach stage nickel, iron and cobalt are
partially dissolved, while the copper is precipitated. In both of these Ni-Cu matte
process route alternatives, nickel and cobalt can be recovered from the solution
as metal by electrowinning or hydrogen reduction, or they may be recovered as
sulphate crystals. Copper can be recovered as metal by electrowinning from the
sulphate solution or by electrorefining if the precipitated copper was treated by
the smelting process.
The pre-leach stage in the second process route alternative, described above, is
the subject of this study. The study investigates the leaching behaviour of a Ni–
Cu matte in H2SO4-CuSO4 solution during the pre-leaching (repulping) stage at
2

Impala Platinum Refinery. Impala Platinum Ltd is currently the second largest
producer of platinum in the world. It operates two separate refineries at Springs
east of Jonnesburg, South Africa: the Base Metals Refinery and the Precious
Metals Refinery. The pre-leaching stage is an important stage of the process as
some leaching of the matte takes place at this stage.
The Base Metal Refinery employs the Sherrit Gordon acid pressure leaching
technology, which involves successive stages of acid-oxidation leaching. The base
metals are first leached out while the Platinum Group Metals (PGMs) are leached
in subsequent series of leaching stages. In the base metal recovery process,
nickel and cobalt are first leached. The nickel and cobalt are then recovered as
metallic powder by hydrogen pressure reduction in autoclaves. The solids are
further leached in the next stage to solubilise copper which is recovered by
electrowinning. At this stage the leach residue is basically the PGM concentrate
that is fed to the Precious Metal Refinery, after impurity removal. A more detailed
description of the Sherritt Gordon process is given in chapter 3, and can be
found in literature (Burkin, 1987; Boldt and Queneau, 1967).
1.1 Motivation
At Impala Base Metals Refinery, the repulping (pre-leach) section is the first stage
in the leaching process of nickel-copper matte to produce a high grade Platinum
Group Metal (PGM) concentrate. Therefore, knowledge of all aspects of the
leaching process taking place at this stage will lead to a better understanding of
the entire nickel-copper matte leaching process, including the pressure leaching
process. Consequently, this will in turn lead to an efficient process and increased
production efficiency of a high grade PGM concentrate. It was thus the aim of
this work to study the leaching behaviour of the nickel-copper matte at the pre-
leaching stage. The study also investigated the response of the pre-leached matte
to the subsequent pressure leaching stage.
3
Objectives
The objectives of this study were to:
i. Study the chemical processes, leaching mechanism and kinetics of the
leaching process that occurs in the repulping stage during the refining of
the nickel-copper matte, with a view of improving efficiency of the leaching
process.
ii. Investigate the response of the pre-leached matte to the subsequent
pressure leaching operation and quantify the influence that pre-leached
matte has on the subsequent pressure leaching operation.
iii. Study mineralogical transformations that may occur during the matte
repulping stage.
iv. Develop a model that can simulate the leaching process taking place in the
repulping stage.
The application of the knowledge gained in this study and the implementation of recommendations to improve the efficiency of the process were not part of the scope of this study. 1.2 Outline of the Dissertation
The first part of this study (chapter 2) is essentially a review of the literature on
the geology/mineralogy of the Platinum Group Metal (PGM) bearing ores of South
Africa; and a review of the methods employed in the recovery of the platinum
group metals from the ores, starting from milling to smelting of the ore resulting
in the production of nickel-copper matte that contains the metal values. A few
examples of commercial operations that treat Ni-Cu mattes have been presented,
and the chemistry of the leaching processes of the matte has been described. The
chapter has also presents a short literature review of the kinetics of leaching
processes.
In chapter 3, a short description of the operations of the Impala Platinum
Refineries has been presented, in particular the operations of the Impala Base
4
Metals Refinery whose pre-leach section was studied. An overview of the base
metal hydrometallurgical refining process has been described, highlighting the
major unit processes.
Chapter 4 has described the nature of experiments conducted in this study. It
has presented the material used in the experiments, and the process parameters
investigated. Two sets of laboratory scale experiments were conducted, namely
atmospheric leaching experiments that were designed to investigate the effect of
variations in the operating conditions of the matte repulping stage; and pressure
leaching tests on the leach residue from the atmospheric leaching experiments.
These tests were aimed at investigating the response of the pre-leached matte to
the subsequent pressure leaching operations.
In chapter 5, results of the atmospheric leaching experiments have been
discussed on the basis of the thermodynamics and mechanisms of the leaching
system studied. The first section (section 5.1) discussed the thermodynamics of
the Ni-Cu matte – H2SO4 leaching system using the Potential-pH (Eh–pH)
equilibrium diagrams (Pourbaix diagrams). Section 5.2 discussed the leaching
mechanism of the matte, based on the mineralogical investigations of the matte
as well as on the chemistry of the leaching process, while section 5.3 discussed
the leaching of the matte due to galvanic interaction between the mineral phases.
Chapter 6 has presented and discussed in detail the results of the atmospheric
leaching experiments, outlining the effects of variations in the process
parameters. Chapter 7 has presented and discussed results of the pressure
leaching experiments that were conducted to investigate the response of pre-
leached matte to pressure leaching. The chapter has also presented the
thermodynamics of the Ni-Cu-H2SO4 pressure leaching system using the Eh-pH
diagrams.
A semi-empirical kinetic model has been developed on the basis of the leaching
mechanism and chemical reactions of the leaching system investigated. This is
presented in chapter 8.
5

CHAPTER 2
2.0 LITERATURE REVIEW
This chapter reviews the literature on the geology and mineralogy of the Platinum
Group Metal (PGM) bearing ores of the Bushveld Complex of South Africa. It
describes the geology and mineralogy of economically significant platiniferous
horizons of the Bushveld Complex, namely the Merensky reef, the UG-2
chromitite, the platreef and the Dunit pipes. The chapter also describes the
methods employed in the recovery of Platinum Group metals (PGMs) from the
ores, starting from milling to smelting of the ore resulting in the production of
nickel-copper matte that contains PGMs. Examples of commercial
hydrometallurgical processes for treating the Ni-Cu matte are also presented,
and the chemistry of the leaching processes of the matte has been described.
Finally, the chapter presents literature on the kinetics of leaching processes.
2.1 Geology and Mineralogy of the Bushveld Complex
In this section a short description of the geology and mineralogy of the Bushveld
Complex of South Africa is presented. The Bushveld Complex is found in the
Northwest, Limpopo, Gauteng and Mpumalanga provinces of South Africa and is
said to be the largest stratiform Platinum-Group Metals (PGM) ore body known,
measuring about 66 000 km2 (von Gruenewaldt,1977). Impala Platinum Mines,
from which the material used in this study originated, are located the Bushveld
Complex, except for some mines that are located in Zimbabwe. The Bushveld
Complex has been extensively studied; and reviews and investigations on the
geology and mineralogy have been presented by several researchers, for example
Wagner (1973) published a book that gives a comprehensive description of the
platinum deposits and Mines of South Africa. The Bushveld Complex can be
divided into four units (Figure 2.1): the Lebowa Granite Suite, the Rashoop
6

Granophyre Suite, the Rooiberg Group and the Rusternburg Layered Suite
(Lindsay, 1988 and Boerst, 2001). The Lebowa Granite Suite consists of a series
of different granite types, the Rashoop Granophyre Suite consists of
predominantly homogeneous granophyre as well as associated granophyric
granite, graphyre porphyry and pseudogranophyre. The Rusternburg Layered
Suite is a large, thick layered body of ultramafic to mafic intrusive rocks, which
make up the bulk of the bushveld complex (Hochreiter et al., 1985).
Figure 2.1: Generalised geological bedrock map of the Bushveld Complex with selected
host rocks (Boerst, 2001)
The Rusternburg Layered Suite is further subdivided into five zones from bottom
to top (Figure 2.2). These are the marginal zone, the lower zone, the critical zone,
the main zone and the upper zone. The marginal zone is a skin between the
older Transvaal sequence rocks and the layered rocks of the Bushveld Complex.
7

The lower zone is a thick sequence of alternating basic/ultrabasic rocks which
lies above the marginal zone, but below the critical zone. The critical zone
consists of a series of layered rocks. In terms of the Platinum-Group Element
(PGE) mineralization, it is the most important unit, which consists (in its lower
part) of a series of chromitite layers within pyroxenite, and in its upper part of a
series of cyclically repetitive triplets of chromitite, pyroxenite and norite
(Hochreiter et al., 1985). The critical zone is divided according to the chromitite
layer into the Lower Group, Middle Group and Upper Group (Figure 2.3). The
basal chromitite of each unit is identified by being numbered according to its
group from the bottom upwards, e.g. LG-1, LG-2, LG-3, etc for Lower Group
chromitite, MG-1, MG-2. MG-3, etc for Middle Group and so on. Of the
chromitites only the UG2 is said to carry significant PGE values throughout the
Bushveld complex (Hochreiter et al., 1985). Near the top of the critical zone is the
Merensky Reef, above of which occurs the final chromitite-pyroxenite called the
Bastard Reef.
In the upper critical zone of the Rusternburg Layered Suite, four economically
significant platiniferous horizons occur: the Merensky reef, the UG-2 chromitite,
the Platreef and the platiniferous ultramafic pipes. Of the above platiniferous
horizons, the Merensky reef is the most exploited horizon for platinum group
metals followed by the UG-2, despite higher grades and large reserves due to
difficulties encountered in recovering the PGMs from UG-2 (Bryson, 2004a and
Green et al., 2004). Naldrett (1981) also noted that the Platinum Group Element
(PGE) mineralization of economic importance on the Bushveld Complex occurs in
four distinct settings, namely the Merensky Reef, the UG-2 chromitite layer, the
Platreef of the Potgietersrus (Mokopane) area and the Discordant Dunite Pipes of
the Eastern limb. von Gruenewaldt (1977) studied the the geology and
mineralogy of the Bushveld Complex and published a paper on the mineral
resources of the Bushveld Complex. He studied the three types of deposits
namely the Merensky Reef, the UG-2 chromitite layer and the Platreef, and
8

identified the most important mineral deposits of the Bushveld Complex as the
sulphide ores.
Some of the work that has been published on the other horizons includes a study
by Sharpe (1982) who studied and presented data on the concentrations of noble
metals (Ir, Rh, Pt, Pd and Au) from representatives of the major units of the
marginal rocks of the Bushveld Complex. From these data, an estimate was
made of a possible liquid composition from which the UG-2 layer and the
Merensky Reef crystallized. This estimate was used to calculate values of the
silicate/sulphide melt distribution co-efficient for the mineralized layers. Hulbert
and von Gruenewaldt (1982) published a review of nickel, copper and platinum
mineralization of the Lower Zone of the Potgietersrus limb of the Bushveld
Complex. They noted that the Lower Zone of the Potgietersrus limb consists of a
succession of ultramafic rocks, and that two significant horizons of sulphide and
platinum group element mineralization were known within the Lower Zone of the
area.
Kinloch (1982) conducted a study on the regional trends in the platinum-group
mineralogy of the Critical zone and noted that the platinum-group minerals of
the UG-2 chromitite and overlying Merensky Reef show close similarities in the
mineral types in any one area. For example, if in one particular area the
Merensky Reef contains abundant Pt-Pd sulphides, the underlying UG-2 layer is
also enriched in Pt-Pd sulphides. This is also the case for Pt-Fe alloy. In contrast,
the distribution of Pt-Pd tellurides displays no pattern in the complex. Three
main categories of mode of occurrence of the platinum-group minerals (PGMs)
were identified:
1. PGMs associated with base metal sulphides.
2. PGMs associated with chromite or other oxides.
3. PGMs enclosed in silicates.
Categories 1 and 2 can be further subdivided into PGMs enclosed in base metal
sulphides/chromite, and PGMs attached to base metal sulphides/chromite
9

Figure 2.2: Generalized stratigraphic column of the Rustenburg Layered Suit, showing location and lithology of the Merensky Reef (Boerst, 2001).
Figure 2.3: Stratigraphy of the Critical Zone (Naldrett, 1981)
10

2.1.1 The Merensky Reef
The Merensky Reef was discovered in 1924 by Dr Hans Merensky (Wagner, 1973
and Hochreiter et al., 1985). In a review of the platinum-group element deposits
of the Bushveld Complex, Naldrett (1981) noted that the term “Reef” was
inherited from Witwatersrand gold mines, where it refers to the ore zone. In the
Merensky Reef the major base metal sulphides are (in order of decreasing
abundance) pyrrhotite, pentlandite, chalcopyrite and pyrite. These occur
interstitially between cumulus and intercumulus silicates (orthopyroxene and
plagioclase respectively) commonly as multimineralic aggregates. The PGMs are
normally found in association with the sulphides as inclusions or along
sulphide/silicate grain boundaries. They also occur, to some extent, as
inclusions in silicate and in close association with chromite. The dominant PGMs
are cooperite (PtS) and braggite (Pt,Pd,Ni)S with subordinate amounts of
sperrylite (PtAs2), Pt-Pd tellurides, laurite (RuS2) and Pt-Fe alloy (Lindsay, 1988).
Vermaak and Hendriks (1976) published a review of the mineralogy of the
Merensky Reef, and defined the Merensky Reef as the economically valuable
pegmatoidal layer bounded by thin chromite seams or stringers. According to
these authors the Merensky consists of a cumulate orhopyroxene-chromite
pegmatoid containing post cumulus feldspar and clinopyroxene, although local
olivine-rich or quartz-bearing facies occur. The orthopyroxene is bimodal, with
separate coarse and fine fractions present. The base metal sulphides occur as a
temporal sequence typical of magmatic assemblages with a host of rare minor
minerals. They noted the main base metal sulphides as pyrrhotite, pentlandite,
pyrite and chalcopyrite. The precious minerals are predominantly associated with
the base metal sulphides, with the major discrete platinoid minerals being
idiomorphic braggite, cooperite and laurite with minor sperrylite. Another main
platinoid constituent is Pt-Fe alloy, which most commonly occurs as complex
intergrowths with other minerals, principally base metal sulphides.
11

Schwellnus et al. (1976) conducted a study of the Merensky Reef at a mine called
Atok Platinum Mine, located in the north-eastern sector of the Bushveld
Complex. They observed that at this particular locality the Merensky Reef zone
mineralization composed platinoid and other metal values, which were almost
invariably associated with chromitite seams and porphyritic pyroxenite, though
portions of pegmatoid were also frequently mineralised. Sulphide minerals such
as chalcopyrite, pentlandite, pyrite and pyrrhotite were also noticed in the
porphyritic pyroxenite and pegmatoid. The sulphide minerals which were found
only in trace amounts included mackinawite, bravoite and galena. In the ores
that were slightly oxidised, violarite was observed as an alteration product of
pentlandite. In conclusion Schwellnus et al. (1976) pointed out that the platinum
group minerals are preferentially associated with the sulphides and tend to occur
at the boundaries of sulphides grains.
Brynard et al. (1976) carried out a mineralogical investigation of the Merensky
Reef at the Western Platinum Mine. They described the geology of the Merensky
Reef as generally consisting of pegmatitic pyroxenite and porphyritic pyroxenite,
situated between two thin chromitite bands (Figure 2.4). In the western portion of
the complex, the lower chromitite band is in contact with a band of anorthosite.
In the eastern portion the lower chromitite band is in contact with pegmatitic
pyroxenite, and the interval between the two chromitite bands usually consists of
porphyritic pyroxenite. The interval of the reef above the upper chromitite band
consists of porphyritic pyroxenite grading into anorthosite. The authors
compared the character of the reef within the western portion of the complex at
different localities and found that at Western Platinum Mine the reef consisted of
porphyritic melanorite, whereas at Rustenburg it consisted of pegmatitic
pyroxenite. The mineralisation of platinum-group elements occurs near the
upper chromitite band at Western Platinum, whereas it occurs between the two
bands at Rustenburg. The most abundant minerals phases at Western Platinum
Mines are sperrylite and Pt-Pd bismuthotellurides together with Pt-Pd sulphides,
whereas at Rustenburg the most abundant phases are braggite and cooperite.
12

They concluded that the platinum-group mineralogy of the Merensky Reef was
different for every locality that had been investigated.
Kingston and El-Dosuky (1982) studied platinum-group mineralogy of the
Merensky Reef at the Rustenburg Platinum Mine. Their study indicated that the
main platinum-group minerals (PGMs) at this particular location, in decreasing
order of abundance, are braggite (Pt,Pd,Ni)S, cooperite (PtS), moncheite
((Pt,Pd,Ni)(Te,Bi,Sb)2), laurite (RuS2), kotulskite (Pt,Pd,Ni)(Te,Bi,Sb), merenskyite
(Pd,Pt,Ni)(Te,Bi,Sb)2 , Pt-Fe alloy, palladian electrum (Au,Ag,Pd,Cu) and sperrylite
(Pt,Rh)As2. The remainder (< 1%) include atokite [(Pd,Pt)3Sn], paolovite
[(Pd,Pt)2Sn], rustenburgite [(Pt,Pd,Bi)3Sn] and a palladium arsenide. They noted
that cooperite and braggite were nearly always found at or near the pentlandite-
silicate contact of the base metal sulphide aggregates. Laurite also occurs in the
base metal sulphide aggregates, it appears as small crystals enclosed particularly
by pentlandite and chalcopyrite, and close to or in contact with the silicate
boundaries. Laurite was also found to occur on veins within the silicates and
within chromite. Sperrylite was very rare and occurred as crystals in chalcopyrite
and pyrrhotite. Platinum-group Tellurides, for example moncheit, kotulskite,
merenskyite etc, were found to occur in three main forms:
a) as large laths situated at the base metal sulphide-silicate contacts and
predominantly associated with pentlandite.
b) Both as small grains and crystals enclosed by chalcopyrite and rarely by
pentlandite.
c) As pockets of small grains closely associated and often intergrown with
chalcopyrite remote from the main base metal sulphide aggregates.
The platinum-iron alloy was found to occur as four main intergrowth types with
the base metal sulphides and other PGMs: Type 1 occurs predominantly with
13

pyrrhotite, occurrences in pentlandite and chalcopyrite are minor. Type 2
occurrences consist of aggregates of small crystals of Pt-Fe alloy that are
intergrown most commonly with pyrrhotite matrix, and rarely pentlandite and
chalcopyrite. Type 3 occurrences include fine spong to graphic intergrowths of
Pt-Fe alloy with cooperate; and type 4 occurrences of the Pt-Fe alloy are large
and often occur as homogenous grains with cooperite in the PGM concentrates.
The Pt-Pd-Sn compounds (paolovite, atokite, etc) occur as large laths enclosed by
chalcopyrite at its contact with the silicates, or may occur within the silicates
away from the base metal sulphide aggregates. No rhodium mineral occurrences
were located in the samples examined from the Rustenburg mine.
The platinum-group mineralogy of the Merensky Reef at the Impala Platinum
mines in Rustenburg was investigated by Mostert et al. (1982). They reported
that the Merensky Reef in the Impala area is typically a coarse-grained to
pegmatoidal pyroxene with either one or two thin chromite layer (Figure 2.4). The
platinum-group element – bearing zone is associated with the footwall chromitite
layer in the pyroxenitic reef and with the upper chromitite layer in the
pegmatoidal reef. The chromitite layers of the reef consist of chromite and
interstitial plagioclase with minor sulphides, biotite and rutile. Orthopyroxene,
sulphides, rare chromite and olivine, together with interstitial plagioclase and
clinopyroxene, as well as minor hornblende, talc and biotite, constitute the
silicate part of the reef in this area.
The main base metals sulphides, in decreasing order of abundance, were found
to be pyrrhotite (41%) pentlandite (37%), chalcopyrite (18%) and pyrite (4%). The
sulphides occur as blebs interstitial to silicate and chromite. Of the PGMs,
cooperite (PtS) is by far the most abundant mineral (44%) followed by laurite
(RuS2) at 21%, moncheite (17%) and braggite (12%). The rare minerals were
grouped together and constituted about 6% (Table 2.1). It was found that most of
the PGMs associated with the base metal sulphides and most of these minerals
were found to associate with chalcopyrite, although chalcopyrite is not the most
14

abundant base metal sulphide. However, this distribution pattern is not followed
by laurite, which tends to occur more frequently with pentlandite. It should be
noted that cooperite and laurite occur preferentially in the chromitite layers,
whereas moncheite was most commonly found in the silicate part of the
Merensky Reef. The investigation showed that cooperite, laurite, moncheite and
braggite are the most abundant platinum-group minerals in the Merensky Reef
in the Impala area of Rustenburg.
Figure 2.4: Schematic diagram of the two main types of Merensky Reef petrology (pyroxenite and pegmatoid reefs) occurring in the Impala Platinum Mines (Mostert et al., 1982).
15
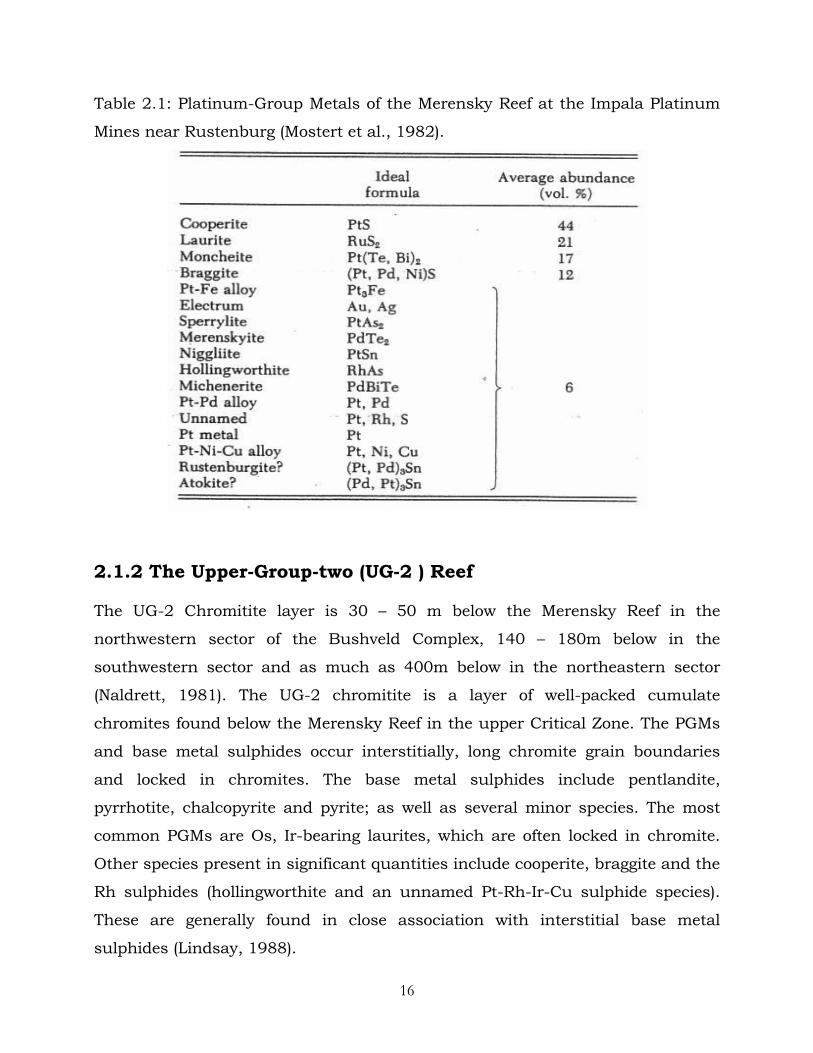
Table 2.1: Platinum-Group Metals of the Merensky Reef at the Impala Platinum
Mines near Rustenburg (Mostert et al., 1982).
2.1.2 The Upper-Group-two (UG-2 ) Reef
The UG-2 Chromitite layer is 30 – 50 m below the Merensky Reef in the
northwestern sector of the Bushveld Complex, 140 – 180m below in the
southwestern sector and as much as 400m below in the northeastern sector
(Naldrett, 1981). The UG-2 chromitite is a layer of well-packed cumulate
chromites found below the Merensky Reef in the upper Critical Zone. The PGMs
and base metal sulphides occur interstitially, long chromite grain boundaries
and locked in chromites. The base metal sulphides include pentlandite,
pyrrhotite, chalcopyrite and pyrite; as well as several minor species. The most
common PGMs are Os, Ir-bearing laurites, which are often locked in chromite.
Other species present in significant quantities include cooperite, braggite and the
Rh sulphides (hollingworthite and an unnamed Pt-Rh-Ir-Cu sulphide species).
These are generally found in close association with interstitial base metal
sulphides (Lindsay, 1988).
16

McLaren (1978) stated that PGE values in the UG-2 layer are mainly in the basal
and middle portion of the main chromitite over the northwestern, southwestern
and southeastern sectors. In the southwestern sector, the most common
minerals are laurite (RuS2), cooperite (PtS), braggite ((Pt,Pd,Ni)S) and unnamed
minerals which were simply given as Pt-Rh-Cu-S, Rh-S and Pt-Pd-Cu-S. In the
northwest braggite, laurite, cooperite, Pt-Fe alloy and an unnamed Pt-Rh-Ir-Cu-S
mineral are the main species. In the southeast, laurite, braggite, vysotskite,
cooperite and an unnamed mineral Pt-Rh-Ir-Cu-S mineral predominate; while in
the northeastern sector sulphides of the PGE were revealed to be predominant in
the UG-2 layer.
McLaren and De Villiers (1982) studied the chemistry and mineralogy of the
platinum-group metals of the UG-2 chromitite layer of the Bushveld complex.
They noted that the most abundant PGMs were laurite, cooperite, an unnamed
Pt-Ir-Rh-Cu sulphide, vysotskite (PdS), braggite, a Pt-Fe alloy, gold and electrum
(Au,Ag), as well as intermetalloids such as Pt-Fe, Pd-Cu, Pd-Pb and Pd-Hg. All
the PGMs were observed as discrete grains that are predominantly associated
with the base metal sulphides; they also occur along grain boundaries in silicates
or in chromite. The main base metal sulphides associated with the PGMs are
pentlandite, chalcopyrite, pyrrhotite and pyrite.
2.1.3 The Platreef and Dunite pipes
The platreef and Dunite pipes are other horizons containing economically
significant quantities of PGEs (Figure 2.1). The platreef occurs in the
Potgietersrus limb of the Bushveld Complex where the Critical Zone is not well
developed and the base metal sulphide and PGE mineralization are erratic. The
platinum-group mineral assemblage is made up mostly of Pt-Pd tellurides,
cooperite, braggite and Pt-Fe alloy, which tend to be associated with the base-
metal sulphides along grain boundaries and enclosed in silicate (Lindsay, 1988
17

and Kinloch, 1982). Dunite pipes (PGE-bearing ultramafic pipes) occur in both
the western and eastern sectors of the Bushveld Complex (Lindsay, 1988;
Kinloch, 1982 and Naldrett, 1981). The mineralogy of the pipes differ from that of
the Merensky reef or UG-2 ore zones in that there are no Bi tellurides, and
sulphides of the PGE are rare (Naldrett, 1981). The PGM mineralogy is dominated
by Pt-Fe alloy and various PGE sulpharsenides, arsenides and antimonides,
which mainly occur interstitially with the silicates (Lindsay, 1988).
2.1.4 The Great Dyke of Zimbabwe
Impala Platinum Holdings Limited obtains some of the PGE concentrates from its
mines in Zimbabwe. Platinum-group mineral occurrences in Zimbabwe are
confined to the Great Dyke of Zimbabwe. The PGEs are associated with base-
metal sulphides, namely pentlandite, pyrrhotite, chalcopyrite and pyrite. The
major PGMs are sperrylite, moncheite, merenskyite and hollingworthite (Lindsay,
1988). More information on the geology-mineralogy of the Great Dyke of
Zimbabwe, and problems associated with the processing of nickel ores can be
found in a paper published by Mashanyane and Storey (1986).
2.2 PROCESSING OF PGM BEARING MINERALS
The processing of Platinum Group-Minerals (PGMs) generally comprises several
steps, the major steps being the following:
1) Comminution (crushing and grinding).
2) Concentration of ore by physical techniques such as flotation and gravity
concentration.
3) Pyrometallurgical concentration, which involves smelting and converting to
produce a PGM-rich nickel-copper sulphide matte.
4) Hydrometallurgical extraction of base metals. This includes leaching and
recovery of individual base metals (BMs), and production of PGM
concentrate.
18

5) Refining of the PGM concentrate to produce individual platinum group
elements (PGE).
A simplified block flow diagram of the Platinum-Group Mineral (PGMs) refining
process is shown in Figure 2.5, and each of the steps is briefly described below.
However, the refining of the PGM concentrate to produce individual platinum-
group elements (step 5) has not been described, as it is not in the scope of this
study. The Pyrometallurgical operations have been described in general terms, as
the description fits most of the current commercial operations. However, one
operation that differs slightly from the general process description is the
Outokumpu Nickel Smelting Process (DON process), which does not use a
converter after the smelting furnace (Knuutila et al., 1997). Most of the other
nickel-copper smelting processes make use of a matte converter. A brief
description of the Outokumpu smelting process is given in section 2.2.3. The
hydrometallurgical processes of most platinum producers differ considerably,
hence only a few examples of the process routes that are employed commercially
have been presented. Reviews of the PGMs recovery routes include papers by
Edwards (1976, 1984), Newman (1973), Corrans et al. (1982), Mostert and
Roberts (1973) and Hochreiter et al. (1985).
2.2.1 Comminution (crushing and grinding)
Comminution serves to reduce the ore to manageable size fractions and liberate
the ore minerals. The run-of-mine ore is first crushed to reduce the size and fed
to the milling circuit where it is ground to further reduce the size and liberate the
ore minerals from the gangue. The milled ore is classified and the desired size
fraction is transferred to the flotation circuit to separate the gangue from ore
minerals. Because of their different metallurgical properties, ores mined from the
Merensky and UG-2 reefs are usually treated in separate milling and flotation
circuits up until the smelting stage.
19

Run-of-mine ore
Comminution
Classification
Flotation
Smelting
Converting
Leaching
Base metal recovery
Over size
Under size
Tailings Concentrate
Slag Furnace Matte
Converter Matte
PGM refining
PGM conc.
SO2
Converter slag
Solution
Cobalt Copper Nickel
Individual PGMs
Figure 2.5: Simplified generic flow diagram of platinum-group mineral refining process
20

2.2.2. Flotation / Gravity separation
The process of flotation separates gangue from ore minerals by making use of
surface properties of the individual minerals. The surface properties of the ore
and gangue minerals may be modified by the addition of reagents, for example
collectors that render the surfaces of selected particles hydrophobic, frothers
which stabilize and strengthen bubble walls, and modifiers may be added to
enhance or inhibit the floatability of specific mineral species. Base metal
sulphides are mainly recovered by the flotation process. Gravity separation is
used to remove PGMs by virtue of their characteristically high density, it reduces
losses of PGMs and reduces the flotation head grade which helps in lowering the
overall grade of the tailings (Corrans et al., 1982).
The distribution of PGEs in different mineral phases is an important factor in the
beneficiation process (Bryson, 2004b and Cabri, 1981). Kinloch (1982), Kingston
and El-Dosuky (1982), Mostert et al. (1982) and Peyerl (1983) have shown that
the PGEs occur in several forms, such as discrete PGMs, in base metal
sulphides and oxides and/or silicates. Platinum, Ruthinium, Osmium and
Iridium as well as some Palladium form discrete PGMs which are usually
amenable to concentration by gravity and flotation. Palladium and rhodium
mostly occur in base metal sulphides and are therefore, recoverable mainly by
flotation (Lindsay, 1988).
Textures of the minerals are also important, euhedral-subhedral PGMs such as
sperrylite, laurite, Pt-Pd sulphides (cooperite-Braggite –Vysotskite) and portion of
Pt-Fe alloy are usually readly liberated and recovered by flotation and/or gravity.
PGMs such as the Pt-Pd bismuthotellurides often occur as thin veinlets and
plates and are not readily recovered by gravity as they have relatively low
densisty and are flaky in habit. Thus, they show a tendency to follow the base
metal sulphides into the flotation circuit; this behaviour applies also to small,
reatively light laurite particles. PGMs that are intimately intergrown with gangue
21

and which are not easily liberated may be lost to the tailings. PGMs such as Pt-
Fe alloy, which are either intergrown with base metal sulphides or locked in them
end up in the flotation circuit and are recovered by the flotation of the host base-
metal sulphides. Thus, in general, the PGMs most commonly found in the
flotation concentrate are braggite, laurite and sperrylite with minor cooperite and
Pt-Pd tellurides (Kinloch, 1982). However, the most contributor of PGEs to the
flotation concentrate are the base metal sulphides, therefore, losses of base metal
sulphides constitutes a big loss of PGEs. Chalcopyrite and pentlandite float well,
however, pyrrhopytite is a notoriously slow floater that mostly reports to the
flotation tailings and constitutes the greatest source of PGE losses (Corrans et
al., 1982). The PGE bearing minerals that are most successfully recovered by
gravity techniques are cooperite and isoferroplatinum.
The alteration of minerals is another contributing factor to the losses of PGEs.
PGE losses are enhanced when a reef whose mineralogy has been altered is
processed. Altered minerals, both silicates and base metal sulphides, have been
found to report mostly to the tailings during flotation (Lindsay, 1988). Alteration
of base metal sulphides can cause changes to their surface chemistry resulting
in partial loss of hydrophobic properties, which inhibits their ability to flotation.
Common altered sulphides include mackinawite covellite, violarite and valleriite.
Oxidation of sulphide minerals also has adverse effects on flotation. For example
oxidation of sulphides may occur during milling, possibly enhanced by galvanic
reactions (Adam et al., 1984) to form Fe-oxide, hydroxide and/or sulphate
oxidation rims on the Fe – sulphides surfaces. The oxidation products may coat
other base-metal sulphides and interfer with their surface hydrophobic
properties, resulting in them reporting to the flotation tailings together with the
PGEs.
22

2.2.3 Pyrometallurgical concentration: Smelting and Converting
The next major step in the processing of PGE bearing minerals is the smelting-
converting stage. During this stage, the base metals and PGEs are concentrated
into sulphide matte to enhance grades to 400 –800 ppm PGE, 16 – 18% Ni and 8
– 11% Cu in the furnace matte, and in the subsequent converting stage the
metals are upgraded to 1500 – 2500 ppm PGE, 45 – 50% Ni and 25 – 35% Cu in
the converter matte (Impala reports, 2003-2005, Hochreiter et al., 1985, and
Mostert and Roberts, 1973).
( i ) Smelting
During the smelting process the sulphides form a molten matte in which
valuable metals are concentrated while the silicates and oxides form a slag
phase, which contains most of the gangue minerals. Losses of metals to the slag
may occur by matte entrainment, or dissolution of the metals in the slag as
oxides.
The furnace feed consists of dried and pelletised flotation concentrate blended
with flux (lime), low grade reverts and occasionally iron ore. Miscellaneous
additions may include recycled furnace matte/slag containing metal values,
especially those emanating from barrens/effluent treatment processes in the
Precious Metals Refineries. In addition, molten converter slag, which is mostly
fayalite with some magnetite, is recycled back to the furnace. The concentrate
consists of base metal sulphides with traces of PGMS, and gangue minerals. The
predominant minerals are chalcopyrite, pentlandite, pyrrhotite and pyrite. The
gangue component of the feed is normally predominantly bronzite (pyroxene)
with subordinate plagioclase (Ca- feldpar) and some amounts of biotite–
phlogopite (Fe, Mg–mica) serpentine, talc (hydrated Mg-Silicate) and chlorite
(hydrated Mg, Fe, Ca silicate) (Lindsay, 1988).
23

The smelting is carried out in electric arc furnaces. During smelting the furnace
electrodes make contact with the slag to form a circuit, this result in heat
generation by the electrical resistance of the slag. Temperature control can be
effected by varying the input voltage and electrode depth into the slag. During
smelting the average matte temperature can be as high as 1200 oC and that of
slag as high as 1400 oC. The difference in the temperature of the matte and slag
creates a temperature gradient which may induce thermal convection and slow
matte setting, as well as cause erosion of furnace refractories (Newman, 1973).
As melting proceeds, the charge gradually smelts and separates into immiscible
silicate and sulphides liquid phases. The silicate forms slag layer, which overlies
the denser matte layer. The slag is tapped continuously and cooled down or
granulated in water, after which it may be milled and subjected to flotation to
recover entrained sulphides before it is transferred to the slag dump. The
furnace matte is tapped periodically and transferred by laddle to converters.
Lindsay (1988) described the smelting of the furnace feed components, in
particular the silicates, sulphides and PGMs of the flotation concentrate as
follows:
Smelting of Silicates
During the smelting process the minor hydrated silicates such as serpentine,
talc, chlorite, biotine – phlogopite are first to react by a series of dehydration
reactions within the temperature range 600 – 900 oC. Most of these silicates
decompose to forsterite, enstatite and/or a silica-rich melt. The dominant
silicates, particularly bronzite and plagioclase decompose and melt at higher
temperatures (1000 – 1500 oC). However, the melting point can be lowered by
adding CaO to the system. Bronzite is a pyroxene which melts at about 1240 oC
and undergoes a number of solid –state transformations to form ferriferous
wollastonite (Deers et al., 1978). Plagioclase, feldspar in the Merensky reef
flotation concentrates start to smelt at 1400-1440 oc and finishes at 1480 – 1520 oC. However, the combination of diopside and plagioclase forms a ternary system
24

which lowers the melting point of the mixture. In a diopside – dominant mixture
which is the case with the flotation concentrate, the mixture would start melting
at 1250 – 1275oc and complete melting by 1391 oC.
Smelting of Base Metal Sulphides
The predominant base sulphides in the flotation concentrate are chalcopyrite,
pyrrhotite and pentlandite. The melting of these base metal sulphides involves a
series of solid – state reactions and transformations. Phase equilibria of the Cu-
Fe-S system at various temperatures have been presented by Barton (1973). A
more detailed discussion of the Cu-S, Ni-S, Cu2S-Ni3S2 systems and general
pyrometallurgy of sulphide ores of nickel can be found in the paper by Terry
(1987). The transformations of these minerals at temperatures below 650 oC
have been described by Lindsay (1988). At a temperature of 547 oC, chalcopyrite
(CuFeS2) breakdowns to form intermediate solid solution (CuFeS2-CuFe2S3-
Cu3Fe4S6), pyrite (FeS2) and sulphur. In the presence of pyrrhotite the
chalcopyrite breaks down at temperatures of 334 oC – 450 oC. The intermediate
solid solution is stable over a large composition and temperature range.
Pentlandite becomes unstable at 610 oC to form monosulphide solid solution
(Fe1–XS.Ni1-XS) and heazlewoodite solid solution (Ni,Fe)3±XS2. The heazlewoodite
solid solution melts at 806 – 862 oC to form (Ni,Fe)S2 and sulphide liquid, the
NiS2 phase melts at 991 oC. The monosulphide solid solution melts at 635 oC and
forms a Ni – S composition, and as the temperature increases to 912 oC the Fe –
S liquid appears. The last of the solid phases, Fe-rich monosulphide solid
solution melts at 1192 oC. Reviews and investigations on the smelting of base
metal sulphides have been published by many authors, including Robiette
(1973), Biswas and Davenport (1976), Boldt and Queneau (1967), Rosenqvist
(1974), Nagamori (1974) and Celmer et al. (1987).
Smelting of Platinum-Group Minerals
Lindsay (1988) has given the decomposition temperatures of the platinum-group
minerals as follows:
25
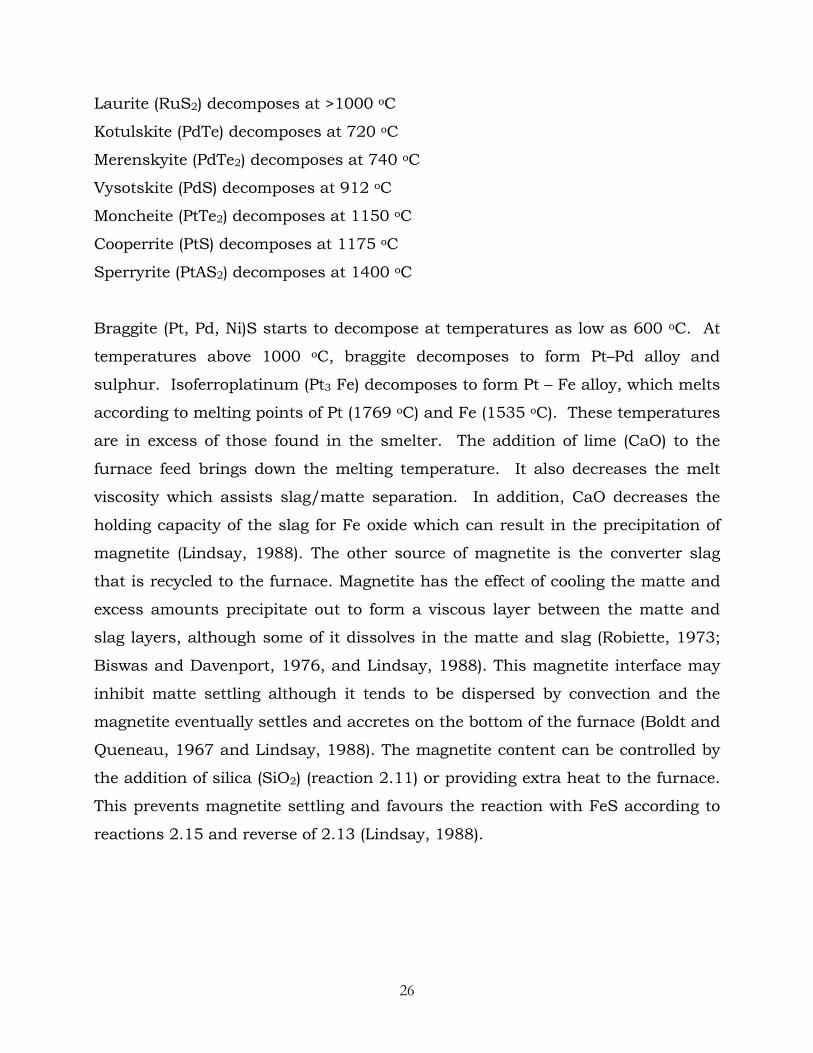
Laurite (RuS2) decomposes at >1000 oC
Kotulskite (PdTe) decomposes at 720 oC
Merenskyite (PdTe2) decomposes at 740 oC
Vysotskite (PdS) decomposes at 912 oC
Moncheite (PtTe2) decomposes at 1150 oC
Cooperrite (PtS) decomposes at 1175 oC
Sperryrite (PtAS2) decomposes at 1400 oC
Braggite (Pt, Pd, Ni)S starts to decompose at temperatures as low as 600 oC. At
temperatures above 1000 oC, braggite decomposes to form Pt–Pd alloy and
sulphur. Isoferroplatinum (Pt3 Fe) decomposes to form Pt – Fe alloy, which melts
according to melting points of Pt (1769 oC) and Fe (1535 oC). These temperatures
are in excess of those found in the smelter. The addition of lime (CaO) to the
furnace feed brings down the melting temperature. It also decreases the melt
viscosity which assists slag/matte separation. In addition, CaO decreases the
holding capacity of the slag for Fe oxide which can result in the precipitation of
magnetite (Lindsay, 1988). The other source of magnetite is the converter slag
that is recycled to the furnace. Magnetite has the effect of cooling the matte and
excess amounts precipitate out to form a viscous layer between the matte and
slag layers, although some of it dissolves in the matte and slag (Robiette, 1973;
Biswas and Davenport, 1976, and Lindsay, 1988). This magnetite interface may
inhibit matte settling although it tends to be dispersed by convection and the
magnetite eventually settles and accretes on the bottom of the furnace (Boldt and
Queneau, 1967 and Lindsay, 1988). The magnetite content can be controlled by
the addition of silica (SiO2) (reaction 2.11) or providing extra heat to the furnace.
This prevents magnetite settling and favours the reaction with FeS according to
reactions 2.15 and reverse of 2.13 (Lindsay, 1988).
26
(ii) Converting
The transformation that takes place and reactions involved in the conversion of
furnace matte to converter matte have been described by Kellogg (1986), Boldt
and Queneau (1967), Lindsay (1988), Terry (1987) and Alcock (1976). Conversion
of furnace matte is performed in Pierce Smith converters. During the operation
silica, high-grade reverts and oxygen (as air) are added. The converting process
serves to eliminate iron and sulphur from the matte by oxidation, and to create a
metal-rich matte that contains alloy phases into which the precious metals can
concentrate. This is achieved by blowing air through the molten matte. Oxygen
reacts with the sulphides to oxidise Fe and S to FeO and SO2, respectively. The
FeO then reacts with SiO2 to form fayalite slag which can be skimmed off.
The oxidation of Fe-Ni-S furnace matte is accompanied by desulphurisation
according to reaction 2.1. Thermodynamically, the iron oxidation reaction
(reaction 2.1) is the most favoured reaction at temperatures and oxygen
fugacities of the converter (T = 1300 oC, fO2 = 10–8 to 10–7). This fact was observed
by Robiette (1973) and Alcock (1976) who used Ellingham-type diagrams for the
oxidation and sulphurization of metals to show that, with respect to Cu and Ni,
Fe forms the most stable oxide and the least stable sulphide. Terry (1987)
illustrated the principles behind the conversion or oxidation of copper-nickel-iron
mattes by referring to the diagram of standard free energies of formation of the
oxides and sulphides of copper, nickel and iron as a function of temperature. He
concluded that in the temperature range 1250 – 1350 oC, typical of converting
temperatures:
• The sulphides of copper, nickel and iron have comparable thermodynamic
stabilities.
• In the presence of oxygen each of the oxides is considered more stable than
the sulphide.
• Iron forms the most stable oxides; sulphur and nickel oxides have
comparable stabilities and copper forms the least stable oxides.
27

FeS + 1½O2 = FeO + SO2 (2.1)
Other important converter reactions involve the formation of Cu and Ni
sulphides:
2(Fe, Ni)9S8 + 13O2 = 6Ni3S2 + 18FeO + 4SO2 (2.2)
2Cu5FeS4 + 4O2 = 5Cu2S + 2FeO + 3SO2 (2.3)
3NiS + O2 = Ni3S2 + SO2 (2.4)
2CuS + O2 = Cu2S + SO2 (2.5)
At higher oxygen fugacities and/or higher temperatures, the oxidation of nickel
and copper can occur, generally towards the end of the final blow:
Ni3S2 + 3½O2 = 3NiO + 2SO2 (2.6)
NiS + 1½O2 = NiO + SO2 (2.7)
2Cu2S + 3O2 = 2Cu2O + 2SO2 (2.8)
The NiO is thermodynamically more stable and forms more readily than Cu2O,
whereas Ni-sulphide is less stable than Cu-sulphide. The oxidation of Ni and Cu
is undesirable as their oxidic forms are soluble in slag.
It is believed that the Cu-Ni alloy found in the converter matte is initiated in the
furnace with the iron component being oxidized and replaced by Ni and Cu in the
converter. The Ni and Cu metallic components are generated during converting
by reactions such as the following:
Ni3S2 + 2O2 = 3Ni + 2SO2 (2.9)
28

Cu2S + O2 = 2Cu + SO2 (2.10)
These metals are completely miscible with each other and are stable in the matte
at converter temperatures.
The Converter slag is formed by reaction between ferrous oxide and silica
(reaction 2.11), and is removed periodically by slagging.
2FeO + SiO2 = Fe2SiO4 (2.11)
The other function of the slag forming reaction (2.11) is to control the generation
of magnetite, which is produced by reactions such as:
3FeO + ½O2 = Fe3O4 (2.12)
4FeO + ½S2 = FeS + Fe3O4 (2.13)
3FeS + 5O2 = Fe3O4 + 3SO2 (2.14)
Magnetite is stable and generally inert at smelting temperatures, with low
solubility in the molten slag. On cooling, solubility decreases and dissolved
magnetite is expelled from the iron silicate to form myrmekitic intergrowths. Its
presence in the liquid silicate is problematic as converter slag is returned to the
furnace where it contributes to magnetite problems such as inhibiting matte-slag
separation, reducing furnace volume (Robiette, 1973; Biswas and Davenport,
1976, and Lindsay, 1988). The formation of Cu oxides and Ni oxides (reactions
2.6 - 2.8) may be reversed in the presence of excess FeS by reactions such as the
following:
3Fe3O4 + FeS + 5SiO2 = 5Fe2SiO4 + SO2 (2.15)
NiO + FeS = NiS + FeO (2.16)
Cu2O + FeS = Cu2S + FeO (2.17)
29

In the newly formed slag, matte separates out as an immiscible liquid rich in
slag-incompatible components such as Ni2S3, Cu2S, Cu-Ni alloy, platinum group
elements and unreacted FeS. The slag is rich in matte-incompatible components
such as Fe-silicate with dissolved Cu and Ni oxides, and magnetite. This is
returned to the furnace to recover valuable components. The final converter
matte consists of molten Cu and Ni sulphides, and significant quantities of Cu-Ni
alloy. The matte is either poured out and allowed to cool slowly or granulated in
water. Slow cooled matte facilitates the crystallization of a metallic Ni-Cu-Fe alloy
containing most of the PGMs, and a PGM-free nickel-copper matte, which is non
magnetic (Hofirek and Halton, 1990; Hochreiter et al., 1985). However, slow
cooled matte results in the formation of undesirable trevorites (NiO.Fe2O3) and
magnetite (FeO.Fe2O3) which are insoluble in the subsequent base metal leaching
stages and report to the PGM concentrate; while granulation prevents this from
happening and is therefore preferred (Steenekamp and Dunn, 1999). Sulphur
dioxide produced during the smelting process is used to make sulphuric acid,
which is used in the hydrometallurgical processes.
The Direct Outokumpu Nickel Smelting Process (DON process)
The direct Outokumpu Nickel Smelting Process (DON process) differs slightly
from the smelting process described in the preceding section in that it does not
make use of a converter to clean the smelting furnace matte. The Don process
produces two types of matte: a low iron matte in the flash smelting furnace (FSF),
and a high iron matte produced by cleaning the flash furnace slag in an electric
furnace (EF) (Knuutila et al., 1997). Figure 2.6 is a simplified flow sheet of the
DON process.
The primary feed for the DON process is a blend of various concentrates, nickel
containing secondary materials and iron precipitate from the electric furnace
matte leaching circuit. The chemistry of the base metal sulphide smelting has
been described earlier in this section. Matte from the flash furnace is granulated
30

and fed to the flash smelting furnace matte leaching circuit, while the slag is
tapped into the electric furnace for cleaning. Hot gas from the flash furnace is
cooled down in a waste heat boiler and fed to an acid plant. In the electric
furnace coal is used as a reductant and dry nickel concentrate as a sulphidizing
agent to produce a desired quality of matte and slag. The matte is granulated
and fed to the EF matte leaching plant. The slag from the electric furnace is also
granulated and stored in slag dumps.
Flash furnace smelting
Electric furnace smelting
FSF matte granulation
EF matte granulation
Concentrate
Fe precipitate Secondary materials
O2 + air Flux
Matte To FSF matte leaching plant Slag
Matte To EF matte leaching plant
Waste slag
Figure 2.6: Simplified flowsheet of the direct Outokumpu Nickel Smelting Process (DON process).
31

2.2.4 Hydrometallurgical Processing of nickel-copper matte
The converter matte is hydrometallurgically treated to recover valuable base
metals, (e.g. Cu, Ni, Co), remove base metal impurities and produce PGM
concentrate. At this stage of the PGM recovery process, the process routes of the
various platinum producers start to differ. The following are examples of the
process routes employed by some operations in South Africa. Description of the
process at Impala Platinum Refineries is given in chapter 3.
The operations at Rustenburg Base Metals Refinery
Rustenburg Base Metals Refiners (RBMR) is part of a large integrated mining
and metallurgical complex, the Rustenburg Platinum Mines, situated near
Rustenburg town about 120 km northwest of Johannesburg. It is the world’s
largest producer of platinum. The operations of the RBMR have been described
by many authors, including Hofirek and Halton (1990); Hofirek and Nafal (1995);
Hofirek and Kerfoot (1992); Anonymous, (1981).
The Rustenburg Base Metals Refinery comprises a platinum-group element
(PGE) enrichment plant that produces PGE concentrate, and a base metal
refinery. It treats nickel-copper converter matte for the recovery of nickel metal,
copper metal, cobalt sulphate crystals and production of PGE concentrates. The
converter matte is first crushed and milled. The milled product undergoes
magnetic separation; the magnetic separation removes the alloy from the
sulphides to produce magnetic (MEC) and non-magnetic (NCM) concentrates,
respectively. The NCM is transferred to the Base Metal Refinery to recover nickel,
copper and cobalt. The PGE rich magnetic concentrate undergoes three leaching
steps to remove base metals. The primary leach is performed in an oxidising
medium of concentrated Sulphuric acid, which removes most of the Ni, Co and
some Cu into solution. The solution is filtered and transferred to the Base Metal
Refinery. The PGE-Cu-Fe residue undergoes a reducing secondary leach under
atmospheric conditions, in which ferric iron (Fe 3+) is reduced to ferrous iron (Fe
32

2+) to facilitate its removal. The third stage leach is similar to the primary leach
but is performed under more severe conditions to dissolve copper, which is
returned to the primary leach stage. The residue at the end of this stage
contains ± 60 % PGE + Au and is sent to Precious Metals Refinery (Hofirek and
Halton, 1990, and Lindsay, 1988).
The solutions from the primary leach of the magnetic concentrate and the non-
magnetic sulphide fraction (NCM) containing large quantities of nickel and
copper with cobalt, is fed to the Base Metals Refinery to recover the valuable
metals. A simplified block flow diagram of the Base Metals Refinery is shown in
Figure 2.7. In the base metals refinery, the NCM is initially fed to the copper
removal stage (atmospheric leach) where it is contacted with the primary
pressure leach discharge solution (Figure 2.7). All the dissolved copper and iron
is rejected into the residue producing virtually Cu, Fe and acid free solution,
while stoichiometrically equivalent amounts of nickel are dissolved (Hofirek and
Halton, 1990). After thickening the solids are fed to the primary pressure leach
whilst the nickel rich solution undergoes further purification. The copper
removal stage residue is subjected to a pressure leach in Sherritt Gordon
horizontal autoclaves, with copper spent electrolyte from copper tank house
being used as the leaching solution. Only the leading two compartments of the
autoclave are aerated at a controlled rate to ensure maximum nickel dissolution;
the last 2 compartments are operated without air in order to re-precipitate part
of the copper, which was either dissolved in the oxidizing phase or supplied with
the copper spent electrolyte. After thickening and filtration, the primary leach
residue then undergoes secondary copper leaching. In this stage all the
autoclave compartments are aerated to ensure almost complete dissolution of
copper and the residue nickel, whilst large proposition of iron is re-precipitated
in the form of jarosite or hematite. The slurry is then filtered and the residue is
treated in a small Pyrometallurgical section for the recovery of the residual
PGEs, which are recycled to the converters. The copper-rich filtrate is treated
with sodium sulphite solution to precipitate selenium. After filtration the
33

selenium-rich cake is combined with the secondary leach residue (Figure 2.7).
The purified copper solution goes to copper electrowinning. Copper spent
electrolyte is recycled to both pressure leach stages where it is used as lixiviant.
The solution from the atmospheric leach is subjected to further purification to
remove lead and cobalt prior to nickel electrowinning. The lead is precipitated
from the solution by barium hydroxide. The lead removal cake obtained is
recycled to the smelter. Cobalt is removed from the Ni-rich solution by
precipitation with nickelic hydroxide. The cobalt removal cake is initially leached
at a controlled pH in nickel spent electrolyte to dissolve the nickel hydroxides,
followed by a reducing leach in sulphuric acid to dissolve the remaining nickel
with the cobalt. After further impurity (Cu, Fe and Pb) removal the cobalt is
separated from the nickel by solvent extraction with D2EHPA. Pure cobalt
solution is crystallized to saleable CoSO4.7H2O whilst the nickel-rich raffinate is
transferred to the Sulphur removal stage (Hofirek and Halton, 1990).
The Ni-rich solution from the cobalt removal stage is transferred to nickel
tankhouse for electrowinning. Any sulphides, sulphur oxidized in the leaching
stages is removed at the end of the nickel circuit in the “sulphur removal” stage
(Figure 2.7). After this stage, part of the nickel spent electrolyte is neutralized
with sodium hydroxide, generating a sodium sulphate solution, which is used to
form crystals.
Western Platinum Base Metals Refinery
Western Platinum Base Metals Refinery (BMR) is situated about 70 km
northwest of Johannesburg and is owned by Lonrho Platinum, which comprises
Western Platinum Limited (WPL) and Eastern Platinum Limited (EPL). A
simplified block flow diagram of the Base Metals Refinery is shown in Figure 2.8.
The converter matte can either be crushed or water granulated. According to
Steenekamp and Dunn (1999), water granulation of the matte was preferred to
pouring it into moulds and allowing it to cool down before crushing. This is due
34

to the fact that during the mould cooling process some of the sulphides in the
matte are oxidised to form magnetite (FeO.Fe2O3) and trevorite (NiO.Fe2O3). These
ferrite species are insoluble in the BMR leaching stages and report to the PGM
concentrate. To reduce ferrite formation during the cooling period, and hence
prevent contamination of the PGM concentrate, water granulation of the matter
was implemented. The granulated matte was found to be more reactive than the
crushed matte with more copper and PGM precipitation from the solution.
The converter matte is ball milled in a closed circuit. After thickening the matte
slurry is pumped to the first stage leach, which is an atmospheric leach
consisting of a number of agitated tanks in series. Both sulphuric acid and
copper spent electrolyte are used as leaching solution, and oxygen is sparged
into the first two tanks. More than 50 % Ni extraction is achieved at this stage
while copper is precipitated from solution (Steenekamp and Dunn, 1999;
Brugman and Kerfoot, 1986). The slurry is then fed to a thickener to obtain a
nickel-rich overflow solution from which nickel sulphate hexahydrate is
crystallized. The underflow slurry is fed to the second stage pressure leach step
conducted in horizontal autoclaves. Oxygen and copper spent electrolyte and
sulphuric acid are added to the autoclave to extract most of the remaining nickel
and copper. The autoclave discharge slurry is filtered to obtain a PGE
concentrate. The concentrate is further upgraded by leaching, dried and
dispatched to Western Platinum Refinery (WPR) in Brakpan, Johannesburg,
about 150 km from the BMR. The filtrate is heated and mixed with aqueous
sulphur dioxide solution to precipitate selenium and tellurium as copper
selenide and telluride. Some of the PGEs that also dissolved into solution are co-
precipitated. The residue is then processed to recover some of the valuable
metals (Figure 2.8). Solution from the selenium removal stage is fed to copper
electrowinning circuit to recover copper as cathodes.
35

Magnetic (MEC)
Converter matte
Solution
Cobalt sulphate crystals
To smelter
Figure 2.7: Simplified block flow diagram of the Rustenburg Base Metals Refining process.
Non-magnetic ( NCM )
Solids
Solution
Solids
Solids
Solution
Solids
Solids to smelter
Solids
Copper cathodes
Solution
PGE concentrates to PMR
Solids
Solution
Sodium sulphate crystals
Solution
NaOH
Nickel cathodes
Magnetic Separation
Atmospheric leach
Lead removal
Cobalt SX
Primary leach
Primary Pres. leach
Co cake redissolution
Cobalt removal
Nickel electrowin
Sulphur removal
Crystalliser
Secondary Pres. leach
Selenium removal
Copper electrowin
Secondary Atm. leach
Crystalliser
Tertiary leach
36

Converter matte
Oxygen
H2SO4
First stage Atmo. leach
Second stage Pres. leach
Final leach
PGE concentrate
Solids
Nickel Crystalliser
Nickel sulphate crystals
Oxygen
H2SO4
Solution
Selenium removal
Copper electrowin
Selenium Roast & leach
Copper cathodes
SO2
Se / Te products
Figure 2.8: A simplified block flow diagram of the Western Platinum Base Metals refining process
Outokumpu nickel-copper matte leaching process
The Outokumpu nickel-copper matte leaching process has been described by
Knuutila et al. (1997), Fugleberg et al. (1995) and Nyman (1992). The process
consists of both atmospheric and pressure leach stages. Two types of matte are
produced, namely matte obtained from a flash smelting furnace (FSF) and matte
obtained after cleaning the flash furnace slag through an electric furnace (EF).
Detailed description of the smelting process is given in section 2.3. Prior to
leaching, the two types of matte are wet ground in ball mills to reduce the
37

granulated particle size followed by leaching in separate circuits (Figure 2.5). The
main leaching agents are sulphuric acid and oxygen.
The Flash Smelting Furnace (FSF) matte leaching circuit
The FSF matte leaching circuit consists of three stages connected counter-
currently. The first stage is the atmospheric copper removal stage whose
objective is to produce a nickel-cobalt sulphate solution with low concentrations
of iron, copper, arsenic and other impurities. The leaching is conducted in
mechanically agitated reactors with oxygen inlet below the stirrer. The leaching
solution is sulphuric acid and recycled streams (Figure 2.9). The product
solution from the copper removal stage is separated from solids by a thickener
and passed through a press filter before it goes to the cobalt and nickel recovery
circuits. The leach residue is fed to the next stage, the nickel atmospheric leach,
where more nickel and cobalt are leached while Cu, Fe, As, Sb and Bi are kept to
the minimum. After solid-liquid separation, using a thickener, the solution is
recycled to the copper removal stage while the thickener underflow is fed to the
nickel pressure leach stage.
The aim of the nickel pressure leach is to bring unleached or precipitated nickel
and iron into solution and produce an outlet for copper in the form of copper
sulphide. This stage consists of a selective nickel leaching part where no or little
oxygen is used and a total leaching part with efficient oxidation. Most of the
nickel is leached at this stage, while the copper is precipitated as sulphide. After
solid-liquid separation the solution is routed to the Electric Furnace (EF) matte
leach circuit. The leach residue, consisting mostly of copper sulphide, is split into
two portions: one portion goes to the copper smelter and the other portion is an
outlet for precious metals. This last portion is fed to the total pressure leach
where the residual base metal sulphides are leached almost completely to
produce precious metal concentrates.
38

Solids
Concentrate
O2
Flash furnace smelting
Electric furnace smelting
Copper removal stage
Atmospheric leach
Secondary materials and Fe precipitate
Co powderO2 + air
Solution to ammonium sulphate recovery
Flux
Waste slag
Slag
Matte
O2
Figure 2.9: Block flow diagram of the Outokumpu nickel-copper smelter and matte leaching process
Flue gas to acid plant
Oxygen
Cobalt recovery
Atmospheric leach
Nickel recovery
Ni cathodes or briquettes
Nickel pressure leach
Total pressure leach
Copper sulphide to smelter
Air
Pressure leach
Iron precipitation
PGE concentrate
Acid/electrolyte
O2Acid/ Electrolyte
Acid/ Electrolyte
Fe precipitate
39

The Electric Furnace (EF) matte leaching circuit
The objective of the electric furnace matte leaching circuit is to leach nickel,
copper and cobalt from the cleaned FSF slag (EF matte), and precipitate the iron
as goethite-hematite. The main component of the EF matte is metallic alloy (Ni-
Fe alloy), copper may also be present in the alloy. Pentlandite is the major
sulphide component of the matte. The EF matte is leached in two stages: firstly
an atmospheric leach followed by a pressure leach stage (Figure 2.9). High
recoveries of nickel, cobalt and copper are achieved and also iron precipitation is
optimised. The iron is precipitated as goethite in the atmospheric leach and as
hematite in the pressure leach stage. Solid-liquid separation is carried out in
thickeners. After thickening the solution from the pressure leach stage goes to an
iron removal autoclave where iron is precipitated and recycled to the flash
smelting furnace.
2.3 Chemistry of Nickel-Copper Matte Leaching Processes
Knuutila et al. (1997) described the processing of nickel-copper matte at
Outokumpu Harjavalta Metals Oy in Finland, and presented an overview of the
matte leaching chemistry. The process consisted of both atmospheric and
pressure leaching of matte in sulphuric acid/nickel sulphate solution, with
oxygen being the oxidizing agent (see section 2.2.4). Two types of matte were
produced namely matte obtained from a flash furnace and that obtained after
cleaning the flash furnace slag through an electric furnace. Both types of matte
were first atmospherically leached prior to pressure leach stage (Figure 2.9).
The main minerals in the blast furnace matte were heazlewoodite (Ni3S2), Copper
Sulphide (Cu2S) and a Ni-Cu alloy. Of these minerals the most reactive phase
was noted to be the metallic alloy followed by Ni3S2 and then by Cu2S. The main
component of the electric furnace matte was a metallic alloy (Ni-Fe) which may
40

be mixed with copper; while pentlandite (Ni,Fe)9S8 was the major sulphide
component of the matte.
The atmospheric leaching of the blast furnace matte was carried out in two
stages, with the important reactions in the first stage being the precipitation of
copper and the simultaneous leaching of nickel. The most important net
reactions were the following:
CuSO4 + Ni-Cu + 0.5O2 → Cu2O + NiSO4 (2.18)
2CuSO4 +2Ni3S2 +0.5O2 → Cu2O + 2NiSO4 + 4NiS (2.19)
3CuSO4 + 2Ni3S2 + O2 + 2H2O → Cu3SO4 (OH)4 + 2NiSO4 + 4NiS (2.20)
2CuSO4 + Ni-Cu + O2 + 2H2O → Cu3SO4 (OH)4 + NiSO4 (2.21)
Any iron in the leaching solution was virtually Fe2+, and was oxidized and
precipitated as FeOOH:
FeSO4 +Ni3S2 + 0.75O2 + 0.5H2O → FeOOH + NiSO4 + 2NiS (2.22)
However, some Fe(OH)3 was also formed. Other elements present in the matte
like arsenic, antimony and bismuth were mainly precipitated together with iron
in poorly soluble ferric compounds similar to ferric arsenate, FeASO4.
In the second stage of the atmospheric leaching of the flash furnace matte, the
objectives were to leach remaining Ni3S2 as completely as possible leaving NiS as
the secondary phase prior to pressure leach and to mimimise Cu, Fe, As, Sb, and
Bi levels in the solution.
The main reaction was the leaching of Ni3S2 according to reaction (2.23):
41

Ni3S2 + H2SO4 + 0.5O2 → NiSO4 + 2NiS + H2O (2.23)
Copper sulphide (Cu2S) also reacted, but more slowly than heazlewoodite (Ni3S2).
A small amount of copper was leached, but the bulk of it was converted into
more oxidized sulphide species; with the most common species being Cu1.8S and
CuS (reactions 2.24 and 2.25).
Cu2S + 0.2H2SO4 + 0.1O2 → Cu1.8S + 0.2CuSO4 + 0.2H2O (2.24)
Cu1.8S + 0.8H2SO4 + 0.4O2 → CuS + 0.8CuSO4 + 0.8H2O (2.25)
Iron was again precipitated as FeOOH (reaction 2.22).
The atmospheric leach residue was then fed to the nickel pressure leach section
to solubilise unleached or precipitated nickel and iron, and produce an outlet for
copper in the form of copper sulphide.
The pressure leaching section consisted of a two stage selective nickel leaching
process. In the first stage no or little oxygen was added; NiS and eventually
remaining Ni3S2 were converted into digenite (Cu1.8S) according to the following
reactions:
6NiS + 9CuSO4 + 4H2O → 5Cu1.8S + 6NiSO4 + 4H2SO4 (2.26)
8Ni3S2 + 27CuSO4 + 4H2O → 15Cu1.8S + 24NiSO4 + 4H2SO4 2.27)
NiS reacted very fast, whereas the leaching rate of Ni3S2 was much slower. CuS
and Cu2+ ions also reacted to form Cu1.8S and sulphuric acid according to
reaction (2.28):
6CuS + 3CuSO4 +4H2O → 5Cu1.8S + 4H2SO4 (2.28)
42

As the solution was acidic, Fe3+ in solution was reduced by the sulphide:
Fe2(SO4)3 + 1.25Cu1.8S → 2FeSO4 + 1.25CuS + CuSO4 (2.29)
When Fe3+ was removed from the solution, dissolution of FeOOH, FeASO4 as well
as Sb and Bi compounds proceeded as long as free acid and reducing sulphide
were available. On the contrary, Se was precipitated from the solution in this
step.
In the second stage of the pressure leaching process where oxygen was added
and efficient oxidisation occurred, any remaining Ni3S2 was leached according to
reaction (2.23) whereas NiS and CuS were leached according to reaction (2.30):
MeS + 2O2 → MeSO4, where Me = Ni, Cu (2.30)
Thus, the sulphides of the matte were leached almost completely, and the leach
residue from the pressure leach stage was composed mainly of precious metals.
The leaching circuit for the electric furnace matte also consisted of atmospheric
and pressure leach stages (Figure 2.9). The electric furnace matte can react
vigorously with sulphuric acid to form hydrogen and hydrogen sulphide if mixing
and supply of oxygen are not adequate, especially at high temperatures. The
formation of these unwanted products was prevented by providing excess oxygen
into the solution and by vigorous agitation. The metallic alloys were leached in
the atmospheric leach stage whereas the sulphides were leached under high
pressure. High recoveries of nickel, copper and cobalt were achieved with iron
precipitation. The leaching of this matte whose main minerals were a metallic
alloy (Ni-Fe) which may be mixed with copper and pentlandite (NiFe)9S can
roughly be described by the following overall reactions.
43
Me + H2SO4 + 0.5O2 → MeSO4 + H2O where Me = Ni, Cu, Fe (2.31)
The pentlandite reacts according to reaction (2.32)
(NiFe)9S8 + H2SO4 + 16.5O2 → 9(Ni,Fe)SO4 + H2O (2.32)
Hydrogen can be produced according to reaction (2.33), while hydrogen sulphide
may be formed by reaction (2.34):
Ni-Fe + 2H2SO4 → NiSO4 + FeSO4 + 2H2 (2.33)
(NiFe)9S8 + 4H2SO4 → 5NiS + 4FeSO4 + 3H2S + H2 (2.34)
Iron was mainly precipitated as goethite in the atmospheric leach (reaction 2.35),
but can also be precipitated as jarosite at pH values < 2. In the pressure leach it
was precipitated as hematite according to reaction (2.36):
2FeSO4 + 3H2O + 0.5O2 → 2FeOOH + 2H2SO4 (2.35)
2FeSO4 + 2H2O + 0.5O2 → Fe2O3 + 2H2SO4 (2.36)
Fugleberg et al. (1995) also presented an overview of the chemistry of matte
leaching at the Harjavalta operations in Finland. They also noted that in the
oxidative acid leaching of nickel-copper matte the metallic phase was the most
reactive, followed by heazlewoodite (Ni3S2). Chalcocite (Cu2S) was the most stable
phase. In the atmospheric leach, the metallic phase reacts first according to the
following reactions:
Nio + H2SO4 + 0.5O2 →NiSO4 + H2O (2.37)
2Cuo + 0.5O2 → Cu2O (2.38)
44

3Cuo + H2SO4 + H2O + 1.5O2 → CuSO4.2Cu(OH)2 (2.39)
The copper forms either cuprite (Cu2O) or basic copper sulphate antlerite
(CuSO4.2Cu(OH)2) depending on pH and availability of oxygen. When the metallic
phase has reacted, heazlewoodite will be leached followed by chalcocite according
to reactions (2.23) – (2.25).
Under certain conditions, with excessive oxidation, millerite (NiS) can be
converted to polydymite (Ni3S4):
4NiS + H2SO4 + 0.5O2 → Ni3S4 + NiSO4 + H2O (2.40)
Fugleberg et al. (1995) indicated that studies conducted at Outokumpu showed
that:
♦ Cu2+ will react with Ni3S2, NiS and Ni3S4, and the resulting copper
sulphides will be Cu1.96S, Cu1.8S and Cu1.8S respectively.
♦ The reaction rate for NiS is very fast, but the rate for both Ni3S2 and Ni3S4
are least one order of magnitude lower.
The overall leaching reactions for heazlewoodite and polydymite would be given
by reaction (2.41) and (2.42), respectively.
8Ni3S2 + 27CuSO4 + 4H2O → 15 Cu1.8S + 24NiSO4 + 4H2SO4 (2.41)
8Ni3S4 + 45CuSO4 + 28H2O → 25Cu1.8S + 24NiSO4 + 28H2SO4 (2.42)
It was found that the ideal feed to the pressure leach should contain only
millerite, the formation of polydymite should be avoided.
Llanos et al. (1974) carried out a study of the atmospheric leaching response of
Ni-Cu mattes with varied composition at the Port Nickel Refinery, Louisiana,
USA. The major phases in the matte were Ni3S2, Cu7S4 and Ni-Cu alloy, with
45

traces of cobalt and iron. It was observed that contact of the matte with the
lixiviant (H2SO4/Ni-Cu solution) caused a rapid rise in nickel concentration in
solution due to the cementation reaction:
Nio + Cu2+ → Ni2+ + Cuo (2.43)
However, with matte high in copper and sulphur, high concentration of copper
was observed in the early leaching stages probably due to the oxidation and
dissolution of metallic copper from the Ni-Cu alloy, according to reactions (2.44)
and (2.45):
2Cuo + ½O2 → Cu2O (2.44)
Cu2O + 4H+ + ½O2 → 2Cu2+ + 2H2O (2.45)
It was believed that during the first minutes of leaching, more copper was
generated by reaction (2.45) than was consumed by reaction (2.43). When the
solution pH rose to a value of 2, the rate of reaction (2.45) decreased sharply.
Copper oxide then accumulated on the unreacted matte particles and almost
completely prevented further oxidation.
In high-sulphur mattes, most of the nickel was present as Ni3S2 and the
solubilization of one atom of nickel from the sulphide takes place according to
reaction (2.46):
Ni3S2 + 2H+ + ½O2 → Ni2+ + 2NiS + H2O (2.46)
Reaction (2.46) was believed to be controlled by the rate of oxygen transfer from
the gas to the aqueous phase when leaching high sulphur mattes, but that it was
unimportant for low-sulphur mattes because of the much greater effect of
reaction (2.43). This is because the Ni3S2 to alloy weight ratio, depends on the
46

matte sulphur content, with the ratio becoming smaller as sulphur content
decreases. Aqueous copper also reacts with Ni3S2 in the absence of oxygen
according to the following reaction:
Ni3S2 + 2Cu2+ → Cu2S + NiS + 2Ni2+ (2.47)
In the presence of oxygen, the interaction between Ni3S2 and Cu2+ probably
occurs as in reaction (2.48):
Ni3S2 + 2Cu2+ + ½O2 → 2NiS + Ni2+ + Cu2O (2.48)
At high pH values, aqueous copper precipitates in the form of basic copper
sulphates:
3Cu2+ + SO42- + 4H2O → CuSO4.2Cu(OH)2 + 4H+ (2.49)
The degree and the rate of this hydrolysis reaction are said to be dependent on
temperature. Increasing the leaching temperature increases the extent of copper
hydrolysis and chemical reaction rates, as well as diffusion rates. It also lowers
the solubility of oxygen in the leach. The hydrolysis of Cu2+ becomes rate
controlling above pH 3.9, particularly during leaching of low-sulphur mattes. The
acid generated during hydrolysis further reacts with Ni3S2 and Cu2O as in
reactions (2.45) and (2.46). These reactions continue until all aqueous copper is
either precipitated as basic sulphate or consumed via either reaction (2.43) or
reaction (2.48).
The Cu1.75S initially present in the matte undergoes a transformation into
Cu1.95S, the transformation is thought to proceed as in reactions (2.50) and
(2.51:
10Cu1.75S + 3Cu2+ +4H2O → 9Cu1.95S + SO42- + 8H+ (2.50)
47
Cathodic conversion of Cu1.75S into Cu1.95S is also possible via reaction (2.51):
Cu1.75S + 0.2Cuo → Cu1.95S (2.51)
The mineral CuS was also observed in the leach residue, it was probably formed
by reaction of dissolved Cu2+ with the hydrogen sulphide gas produced as an
intermediate product (reaction 2.52)
Cu2+ + H2S → CuS + 2H+ (2.52)
In conclusion Llanos et al. (1974) noted that the time required to effectively reject
copper from solution and leach the matte in question is inversely proportional to
the sulphur content in the matte, but almost insensitive to the matte Ni/Cu
ratio. The rate of nickel dissolution is controlled by the rate of copper
cementation on nickel during the first few minutes of leaching until a pH value of
3.9 is attained; thereafter oxygen transfer between gas and liquid phase controls
the rate of dissolution. At higher pH values hydrolysis of Cu2+ and subsequent
precipitation of basic copper sulphate dictates the time required to attain a final
pH of 5.3. The Ni/Cu ratio of the matte at one sulphur level has little effect on
the relative ratio of Ni3S2 to Nio in the matte. They observed also that if the molar
amount of copper plus acid per mole of nickel in the matte remains constant,
variations in the Cu2+ / H2SO4 ratio of the leaching solution have little effect on
the total nickel dissolution from the matte. The higher the molar ratio of aqueous
copper plus free acid to nickel in the matte, the longer the leaching time and the
greater the nickel extraction. Generally, the leaching time was inversely
proportional to the pulp density, the higher the pulp density the faster the
leaching kinetics. Iron concentration in either the matte or the lixiviant has
adverse effect on the leaching kinetics, the higher the iron content the longer the
leaching time.
48

Other studies on the atmospheric leaching of Ni-Cu matte include investigations
by Filmer (1981) and Symens et al. (1979). Symens et al. (1979) studied the
atmospheric leaching of matte at the Port Nickel Refinery. Their work
investigated special measures necessary in operating the atmospheric leach
circuit to process mattes containing in excess of 2% iron. High iron
concentrations in leach systems have been reported to cause unfavourable leach
response, for example they increase total leaching time (Llanos et al. (1974), and
Dutrizac and Chen (1987). Two types of matte were studied, which were
categorized as high sulphur (19.6% S) and low sulphur (15.2% S). The mattes
composed of Ni3S2, Cu2S containing exsolved CuS, Ni–Fe alloy, entrapped slag
particles, some copper and minor cobalt. Like other studies done after Llanos et
al. (1974), this study also found that sulphur content in the matte has an effect
on the leaching characteristics of the matte in that the lower the sulfur, the
faster copper is rejected from solution regardless of the electrolyte ratio of H2SO4
to aqueous copper in the lixiviant. Conversely, the rate at which iron is rejected
from solution is faster the higher the sulphur content of the matte and the lower
the H2SO4/Cu ratio of the leaching solution. It was also found that fast oxidation
and precipitation of iron from the nickel leach liquor is favoured by low
temperatures. On the other hand, the lower the leach temperature the slower
copper is rejected from solution. Copper is removed from the leach system as
Cuo and Cu2O according to reactions (2.43), and reactions (2.44), (2.48), (2.18)
and (2.19), respectively. It can also be precipitated as CuO via reaction 2.53:
Cu2O + ½O2 → 2CuO (2.53)
The study showed that the precipitation of copper between pH 1.5 and 4.0 is
accelerated by operating under one or a combination of the following conditions:
♦ High H2SO4 /Cu2+ ratio in the leaching solution.
♦ Low sulphur matte feed (i.e. high amount of Ni-Fe alloy phase).
♦ High leaching temperature.
49

♦ Under the above conditions copper removal is mainly attributable to its
cementation by the alloy phase of the matte. Copper precipitation above
pH 4 is believed to be mainly due to hydrolysis according to reaction (2.49).
Dissolution of copper also occurs above pH 4 when either too much oxygen or
oxygen at too high a partial pressure is introduced into the system. Perhaps
excess oxygen accelerates conversion of Cuo to Cu2O by reaction (2.44) and
perhaps to CuO which is relatively soluble (reaction 2.53). This redissolution is
reduced or avoided by decreased agitation and /or oxygen partial pressure, or by
increasing the solution temperature.
Aqueous iron was removed via the following reactions:
2Fe2+ + 2H+ + ½O2 → 2Fe3+ + H2O (2.54)
Fe3+ + 3H2O → Fe(OH)3 + 3H+ (2.55)
Symens et al. (1979) noted that precipitation of iron started after the first hour of
leaching. In general the rate of iron oxidation is directly proportional to the
oxygen partial pressure; hence the rate of oxygen dissolution becomes the
controlling step such that an increase in agitation and decrease in solution
temperature accelerate iron rejection. However, when catalysts are available in
sufficient quantities, the reaction becomes independent of oxygen pressure.
Copper is an effective catalyst for oxidation of ferrous iron, thus if aqueous
copper is rapidly rejected from the leach solution during the early stage of
leaching, the rejection of iron will be inhibited.
Dutrizac and Chen (1987) carried out a mineralogical study of the phases formed
during the leaching of Nickel – Copper matte by the Sherrit Gordon process. The
study identified the changes occurring in the sulphide phases during the
leaching of the matte in CuSO4 – H2 SO4 – O2 solutions. In this process, milled
50

Ni-Cu matte is mixed with H2SO4 and recycled copper spent electrolyte in feed
tanks. Recycled copper cementation solids are added too. The pulp is then
subjected to a number of pressure leaching stages. In the first stage leach nickel
is selectively leached with CuSO4-H2SO4-O2 media while copper is precipitated as
copper sulphides. In the second stage leach the pulp is reacted with O2 and
H2SO4 to dissolve the copper sulphides and residual nickel sulphides. The copper
solution from the second stage leach is purified prior to copper recovery by
electrolysis, while the nickel-rich solution from the first stage leach undergoes
hydrogen reduction to recover nickel as powder and/or briquettes. The Sherrit
Gordon process is described in detail in chapter 3.
The feed to the leaching circuit consists of mostly of Ni3S2, Cu2S and Cu1.96S and
Ni alloy. In the feed tanks both the Ni alloy in the matte and the recycled copper
cementation product react rapidly according to the following reactions:
Nio + H2SO4 + ½ O2 → NiSO4 + H2O (2.56)
Nio + CuSO4 →Cuo + NiSO4 (2.57)
Cuo + H2SO4 + ½O2 → CuSO4 + H2O (2.58)
A small amount of the Ni3S2 may also react, but this was not observed by the
investigators (Dutrizac and Chen, 1987).
In the first stage leach circuit the Ni is completely leached according to reactions
(2.56), (2.57) and (2.58); the Cu2S or Cu1.96S originally present in the matte is
oxidized to digenite and is complete within this stage:
Cu2S + 0.1O2 + 0.2H2SO4 → Cu1.8S + 0.2CuSO4 + 0.2O2 (2.59)
51

The reaction between the Ni3S2 and CuSO4 – H2SO4 – O2 leaching system also
occurs in this stage:
2Ni3S2 + 3/2 O2 + 3H2SO4 → 3NiSO4 + Ni3S4 + 3 H2O (2.60)
3Ni3S2 + 2CuSO4 + 2O2 + 4H2SO4 → 6NiSO4 + Ni3S4 + 2CuS + 4H2O (2.61)
Reaction (2.60) is believed to be initially more predominant than reaction (2.61).
In the last section of the first stage leach circuit, Ni3S2 disappears and covellite
(CuS) is the major phase. This suggests that equation (2.61) becomes more
important and that digenite is attacked to some extent:
Cu1.8S + 0.4O2 + 0.8H2SO4 → CuS + 0.8CuSO4 + 0.8H2O (2.62)
However, work conducted by Plasket and Romanchuk (1978) on a similar
process indicated that the leaching of Ni3S2 proceeds through NiS intermediary
rather than Ni3S4, this was observed in this study too.
The discharge from the first stage leach, consisting of Cu1.8S, CuS and Ni3S2 with
various oxide and silicate phases, is further treated in the second stage leach
circuit where the sulphides are further attacked by H2SO4 – O2 (Dutrizac and
Chen, 1987):
Cu1.8S + 0.402 + 0.8 H2SO4 → CuS + 0.8CuSO4 + 0.8H2O (2.63)
CuS + 2O2 → CuSO4 (2.64)
Ni3S4 + H2O + 15/2 O2 → 3NiSO4 + H2SO4 (2.65)
At this point, the leach residues contain oxide, silicate, sulphate or hydroxy –
sulphate phases. Iron is present in the original matte both as oxide grains and as
trace constituent of the Ni3S2, Cu2S, or Ni alloy. Part of the iron is present as
52
magnetite and nickel ferrite. These were observed to report to the leach residue.
Part of the iron dissolves, and this is variously precipitated and redissolved. It
was suggested that iron precipitated mostly as ammonium jarosite (reaction
2.66), although some iron may also have precipitated as amorphous ferric
arsenate (reaction 2.67).
NH4+ + 3Fe3+ + 2SO42- + 6 H2O → NH4Fe3(SO4)2 (OH)6 + 6H+ (2.66)
Fe3+ + AsO43- + 2H2O → FeAsO4 + 2H2O (2.67)
Dissolution of the ammonium jarosite occurs with the concomitant release of
iron to the solution, especially when fresh acid is added to the circuit:
NH4Fe3(SO4)2(OH)6 + 6H+ → NH4+ + 3Fe3+ + 2SO42- + 6H2O (2.68)
Dutrizac and Chen (1987) concluded that during the pressure leaching of matte
consisting predominantly of heazlewoodite (Ni3S2), chalcocite (Cu2S) and a Ni
alloy phase in CuSO4-H2SO4-O2 media, the Ni alloy is rapidly dissolved. The Cu2S
is oxidized to digenite (Cu1.8S) and the Ni3S2 is dissolved and/or altered to
soluble NiSO4 and a mixture of polydymite (Ni3S4) and covellite (CuS). The
resulting residue (from the first stage leach) consisting of Cu1.8S, CuS and Ni3S4
is then re-leached in H2SO4-O2 media to dissolve copper and residual nickel. The
Cu1.8S is oxidized to CuS, and both the CuS and Ni3S4 are further oxidized to
soluble sulphates. The oxide minerals pass through the leach circuit largely
unaffected, although extensive dissolution of silicate particles occurs. Iron
present in the sulphides or in the Ni alloy is dissolved and is subsequently
precipitated as ammonium jarosite. The ammonium jarosite itself seems to
dissolve to a limited extent in various parts of the circuit.
The chemistry of matte leaching process at Rustenburg Base Metals Refiners
(RBMR) has been published by many workers (Hofirek and Halton, 1990; Hofirek
53

and Nafal, 1995; Hofirek and Kerfoot, 1992). The RBMR operations have been
described in section 2.2.4 in this thesis. The work published by Hofirek and
Kerfoot (1992) is of most interest and is reviewed below:
Chemistry of the nickel–copper matte leaching as well as its application to
process control and optimisation at RBMR was extensively studied at laboratory
and pilot-plant scales. The study evaluated chemical and mineralogical changes
occuring during the leaching of non-magnetic sulphide fraction of the converter
matte. The RBMR operations consist of a first stage atmospheric leach followed
by a two – stage pressure leach in Sherritt Gordon horizontal autoclaves at
temperatures in excess of 130 oC. Initially, the converter matte is separated
magnetically into a PGM – containing metalic fraction and a non magnetic
sulphide fraction (Figure 2.7). The non–magnetic material does not contain any
Ni–Fe alloy but has two major mineralogical species present, namely
heazlewoodite (Ni3S2) and djurleite (Cu1.96S). Minor species which were identified
included pentlandite (Ni,Fe)9S8, godlevskite (Ni7S6), bornite (Cu5FeS4) and idaite
(Cu5FeS6).
In the atmospheric leach the non-magnetic is leached in a mixture of copper-
nickel sulphate solution at a pH of about 2.5, temperature of 75-80 oC and an
overall residence time of 12 hours. A detailed analysis of the atmospheric leach
tests revealed three characteristic leaching steps defined by the pH of the leach
slurry:
Copper cementation (metathesis) up to a pH of 2.5 accompanied by the
formation of Cu1.96S and NiS (Ni7S6).
Iron hydrolysis in the pH range 2.5 – 4.5 accompanied by the formation of
ferric hydroxide Fe(OH)3.x H2O or basic ferric sulphate Fe(OH)SO4.
Copper hydrolysis in the pH range of 4.5 - 6 accompanied by the formation
of basic cupric sulphate Cu3(OH)4SO4 (antlerite).
54

The individual reaction steps may or may not be present, or may proceed
simultaneously, depending on the initial conditions. According to the initial
acidity three modes of atmospheric leach operation were characterised:
An atmospheric leach in moderate or high acid solution of >10g/L,
acid/matte ratio of >0.1w/w is distinguished by a rapid and complete
copper rejection from solution during cementation, followed by iron
hydrolysis. Copper hydrolysis is generally absent.
An atmospheric leach in low acid solutions of 1 – 10g/L, acid/matte ratio
of <0.1 w/w is characterised by a separate occurrence of all three reaction
steps in the order of: cementation, iron hydrolysis and copper hydrolysis.
An atmospheric leach in acid-free solutions of pH >2.5 is characterised by
an absence of cementation. Iron hydrolysis and copper hydrolysis proceed
simultaneously.
The chemical reactions proposed in this study were similar or identical to those
described by Llanos et al. (1974) and Symens et al. (1979). The overall reaction
of copper cementation (metathesis) is generally presented as
Ni3S2 + 2Cu2+ → Cu2S + NiS + 2Ni2+ (2.69)
This reaction is said to proceed only in the presence of hydrogen ions and
accelerates with increasing acid concentration. In excess acid, Heazlewoodite
decomposes according to reaction (2.23), which is believed to proceed stepwise
through the initial formation of godlevskite Ni7S6:
3Ni3S2 + 4H+ + O2 → Ni7S6 + 2Ni2+ +2H2O (2.70)
Ni7S6 + 2H+ + ½O2 → 6NiS + Ni2+ + H2O (2.71)
55

Any ferric ion present in the solution is reduced to ferrous state through reaction
(2.72). It is assumed that the dissolved iron acts as an electron carrier and
enhances the leaching rate:
Ni3S2 + 2Fe3+ → 2Fe2+ + 2NiS + Ni2+ (2.72)
At pH values above 2-2.5 iron dissolution and its reduction to ferrous state
ceases and the ferrous ion is oxidised to the ferric ion by the oxygen in air:
2Fe2+ + 2H + + 0.502 → 2Fe3+ + H2O (2.73)
At pH values above 3.5 ferric iron begins to hydrolyze to ferric hydroxide or basic
ferric sulphate (parabutlerite):
Fe3+ + 3H2O → Fe(OH)3 + 3H+ (2.74)
Fe3+ + HSO4- + H2O → Fe(OH)SO4 + 2H+ (2.75)
At this pH value copper cementation ceases. Under normal operating conditions
iron hydrolysis is almost complete in the pH range of 4.5 - 5. When a leach is
done at pH values above 2.5, where iron and copper hydrolyze simultaneously at
an Fe/Cu ratio above 1, the copper hydrolysis is completed prior to iron
hydrolysis and iron concentration in solution (up to 1g/L) persists to pH 6
(Hofirek and Kerfoot, 1992). This residual iron is present in a non-hydrolysable
ferrous state probably due to lack of cupric ions which is known to have a
catalytic effect on the rate of ferrous ion oxidation (Burkin, 1966). Yuhua and
Xianxuan (1990) also found that the rate of iron oxidation and hydrolysis was
affected by the concentration of copper ions in the iron removal stage of the
nickel purification circuit at Jinchuan Non-ferrous Metals Company in China.
They noted that when the nickel solution was very low in copper the rate of iron
removal was very slow. When the copper concentration was increased, the rate of
56

iron oxidation and hydrolysis increased significantly. They attributed the
increase in the rate of iron oxidation to the fact that Cu2+ ions can oxidize Fe2+
ions in solution, according to reaction (2.76):
Fe2+ + Cu2+ → Cu+ + Fe3+ (2.76)
Cu2+ ions are reduced to Cu+ ions which are then re-oxidised to Cu2+ by
air/oxygen.
The lack of cupric ions during iron hydrolysis was believed to be a probable
reason for long reaction times required for complete iron rejection in moderate or
high acid solutions (Hofirek and Kerfoot, 1992). At pH values above 4.5 the
cupric ion hydrolyses to form basic cupric sulphate Cu3(OH)4SO4 (antlerite):
3Cu2+ + HSO4- + 4H2O → Cu3(OH)4SO4 + 5H+ (2.77)
Reaction (2.77) releases acid, which is consumed by the unreacted Ni3S2 or Ni7S6
according to reactions (2.70) and (2.71) and shift the equilibrium of reaction
(2.77) in favour of basic cupric sulphate precipitation. If the pH rises above 6.5,
basic nickel sulphate may start to precipitate.
The residue from the atmospheric leach (Figure 2.3), composing of heazlwodite
(Ni3S2), godlevskite (Ni7S6), millerite (NiS), djurleite (Cu1.96S) and antlerite
(Cu3(OH)4SO4), is first repulped with copper spent electrolyte prior to pressure
leach. In the repulping tank reactions (2.69), (2.70) and (2.71) proceed to a
significant extent, as well as dissolution of antlerite (reaction 2.78) and
precipitated iron species.
Cu3(OH)4SO4 + 5H+ → 3Cu2+ + HSO4- + 4H2O (2.78)
After repulping and preheating of the slurry, the solids are essentially a mixture
of millerite (NiS) and djurleite (Cu1.96S) which are leached in the initial phase of
57

the oxidative pressure leach operation to produce polydymite (Ni3S4) and covellite
(CuS) by reactions (2.79) and (2.80), respectively:
4NiS + 2H+ + ½ O2 → Ni3S4 + Ni2+ + H2O (2.79)
*1Cu2S + 2H+ + ½ O2 → CuS + Cu2+ + H2O (2.80)
However, it was found that a substantial part of the nickel (about 30%) was
dissolved by direct oxidation of millerite to nickel sulphate:
NiS + 2O2 → Ni2+ + SO42 - (2.81)
The authors observed that the rate of copper precipitation in the form of
Cu3(OH)4SO4 (reaction (2.77), and dissolution from the sulphide phase (reaction
2.80) were in a dynamic equilibrium, resulting in no pH and solution copper
concentration changes. The iron redissolved in the feed preparation tank is
reprecipitated again, but now most probably as jarosite or haematite.
In the non–oxidizing phase of the first stage pressure leach, significant nickel
dissolution (up to 20%) and sulphur oxidation (up to 10%) occurred despite
absence of oxygen and acid. A large quantity of copper was also precipitated from
solution by metathesis:
NiS + Cu2+ → CuS + Ni2+ (2.82)
Copper is also precipitated as digenite (Cu9S5), with a minor amount of covellite
(CuS). According to Hofirek and Kerfoot (1992) the mechanism of the reaction
between polydymite (Ni3S4) and the cupric ion that forms digenite involves a
*1Djurleite (Cu1.96S) in equation 2.80 is susbtituted with Cu2S for the sake of simple stoichiometric co-efficients
58

range of non-stochiometric metal sulphides. The overall reaction can be
represented by the following equation:
4Ni3S4 + 9Cu2+ + 8H2O → Cu9S5 + 9NiS + 3Ni 2+ + 2SO4 2- + 16H+ (2.83)
It was also observed that polydymite remnants showed a high nickel deficiency,
Ni : S ratio of 0.45. This was probably due to nickel substitution by copper prior
to the formation of the discrete digenite phase (reaction 2.84):
Ni3S4 + xCu2+ → Ni3-xCuxS4 + xNi2+ (2.84)
The solid residue from the first stage of the pressure leach (primary leach) is fed
to the second stage of the pressure leach operation, the secondary leach (Figure
2.3). This stage is operated at 140-145 oC, pressure of 1050 kPa and 8 hours
residence time. Air is sparged into all compartments of the autoclave at
controlled rates (Hofirek and Kerfoot, 1992). The feed to the secondary pressure
leach stage is composed of polydymite (Ni3S4 with Cu), Millerite (NiS), Digenite
(Cu9S5), Covellite (CuS) and Antlerite (Cu3(OH)4SO4). Contact of the feed solids
with the spent electrolyte in the feed preparation tank results in redissolution of
basic copper, iron and nickel sulphates (if present). In the autoclave, the major
reaction in the initial phases of the leach is the decomposition of digenite:
Cu9S5 + 8H+ + 2O2 → 5CuS + 4 Cu2+ +4H2O (2.85)
The generated covellite (CuS) is either directly oxidized to copper sulphate
according to reaction (2.64), or can be decomposed to elemental sulphur by the
leaching of copper from the covellite lattice:
CuS + 2H+ + ½O2 → Cu2+ + So + H2O (2.86)
59

Reaction (2.85) and (2.64) proceed simultaneously, oxidized covellite being
substituted by covellite generated from digenite, so initially no change in covellite
content occurs until digenite is depleted. The reaction sequence for the
dissolution of the polydymite (Ni3S4) or copper – containing polydymite is
obsecure, but the overall stoichiometry can be described by equation (2.87):
Ni3S4 + 7½O2 + H2O → 3Ni2+ + 4SO42- + 2H+ (2.87)
The millerite (NiS) is partially converted to polydymite (equation 2.79) as well as
directly oxidized to nickel sulphate (equation 2.81).
At this high temperature (140 -145 oC) the ferric ion hydrolysis commences at a
moderate acid concentration of about 30 g/L. Depending on the conditions, iron
precipitates either as the sodium jarosite (reaction 2.88) or as haematite (reaction
2.89):
3Fe3+ + Na+ + 2SO42- + 6H2O → NaFe3(OH)6(SO4)2 + 6H+ (2.88)
2Fe3+ +3H2O → Fe2O3 + 6H+ (2.89)
Both reactions release a considerable quantity of acid which is either consumed
in the digenite decomposition (reaction 2.85) or results in acid concentration
increase in the terminal phases of the leach. The residue from this stage is
composed predominantly of iron precipitates.
The chemistry of Ni-Cu matte leaching at Lonrho Platinum’s Base Metals
Refinery was described by Steenekamp and Dunn (1999). Detailed description of
the leaching process is given in section 2.2.4. The leaching process basically
consisted of a two-stage operation (Figure 2.8). In the first stage the ground
matte was leached in tanks in series at atmospheric pressure, with oxygen
sparging into the first two tanks. Both concentrated H2SO4 and recycled
tankhouse copper spent electrolyte were used as leaching solutions. Nickel and
small quantities of cobalt were leached while copper and PGMs were precipitated
60

from solution. After thickening the copper free overflow solution was fed to the
nickel sulphate crystalliser, while the underflow slurry was routed to the
pressure leach stage. Oxygen and sulphuric acid were added to the autoclave to
extract the majority of the remaining nickel and copper.
The atmospheric leach chemistry of nickel-copper mattes has been published by
various workers, including Hofirek and Kerfoot (1992), Hofirek and Nofal (1995),
Hofirek and Halton (1990), Knuutila et al. (1997), Fugleberg et al. (1995),
Dutrizac and Chen (1987), Llanos et al. (1974). The reactions in the first
atmospheric stage leach essentially comprise of oxidising rections of the type
represented by equations (2.33), (2.46), (2.56) and metathesis reactions
represented by (2.47) and (2.90).
5NiS + 2CuSO4 → Cu2S + 2NiSO4 + Ni3S4 (2.90)
Steenekamp and Dunn (1999) presented a break-down of the principle reactions
occurring in the pressure leach stage into two categories. First the dissolution of
atmospheric leach hydrolysis products:
Cu(OH)2CuSO4 + H2SO4 →2CuSO4 + 2H2O (2.91)
2Fe(OH)SO4 + H2SO4 → Fe2(SO4)3 + 2H2O (2.92)
And secondly the oxidation of sulphide minerals according to reactions (2.23),
(2.64), (2.81) and (2.93).
Cu2S + H2SO4 + 2½O2 → 2CuSO4 + H2O (2.93)
These reactions are exothermic and the heat released is almost proportional to
the amount of sulphur being oxidised.
61

The hydrometallurgical operations at Impala Base Metals Refinery (BMR) have
been described in chapter 3 of this document. The chemistry of the Ni-Cu
leaching process of the BMR is similar to that of other Ni-Cu processing
operations described earlier, especially those processes utilizing the Sherritt
Gordon process. Detailed description of the chemistry of the Impala base metals
refinery has been published by Plasket and Romanchuk (1978), Rademan et al.
(1999), Forbes (1999), Plasket and Dunn (1986a) and Plasket and Dunn (1986b).
2.4 Kinetics of leaching process
Several models have been developed, and more are still being developed, that are
used to evaluate the dissolution kinetics of metals during the leaching process.
One of the commonly used model type is the shrinking core model (SCM, which
applies to monosized spherical particles. Depending on the chemical-physical
process controlling the leaching process, different equations can be applied.
These equations, which are presented below, have been extensively discussed in
the literature (Ahmed et al., 2000; Gbor et al., 2000; Herreros et al., 2002; Sato
and Lawson, 1983).
For a surface chemical reaction controlled process:
1 – (1 – X)1/3 = K1t (2.94)
For a product layer/ash diffusion controlled process:
1-3(1-X)2/3 + 2(1-X) = K2t (2.95)
For mixed (surface and product layer/ash) controlled process:
[1-3(1-X)2/3 + 2(1-X)] + [1-(1-X)1/3] = K3t (2.96)
62

Where X is the fraction reacted, K1 and K2 and K3 reaction rate constants and t is
the time. Detailed derivation of the equations for various controlling conditions
in the SCM can be found in Levenspiel (1972), Sohn and Wadsworth (1979) and
Szekely et al. (1976).
Gbor et al., 2000 carried out an investigation into the behaviour of Co and Ni
during aqueous sulphur dioxide leaching of a nickel smelter slag. They used the
shrinking core model to explain the behaviour of Co and Ni, and found that Co
extraction was limited by both ash layer diffusion and surface chemical reaction;
whereas Ni extraction was limited only by ash layer diffusion. In another
investigation, the same authors (Ahmed et al. 2000) studied the dissolution
behaviour of Co, Cu, Fe, Ni and Zn from smelter slag in aqueous sulphur dioxide.
It was found that dissolution kinetics of Co, Fe, Zn, and Ni, could be described
using the shrinking core model. The equation based on the assumption of ash
layer control gave the best fit to the data.
A study was conducted of the dissolution kinetics of enargite (Cu3AsS4) with
chlorine generated in solution by the reaction between sodium hypchlorite and
hydrochloric acid (Herreros et al., 2002). The kinetics of the dissolution were
characterized by two sequential stages: relatively fast reaction initially, while
later the reaction become very slow. In the first stage, the fraction of Cu
extracted () varied linearly with time according to = K1t, whereas in the second
stage, the dissolution was represented by the shrinking core model controlled by
diffusion through a porous product layer (equation 2.95). Colussi et al. (1983)
carried out a study to obtain kinetic models for the leaching of Zinc – containing
slags with sulphuric acid. They analyzed the data obtained according to the
shrinking core models represented by equations 2.94 and 2.95. The dissolution
kinetic mechanism was divided into two stages: The first was chemically
controlled and the second diffusion controlled. Dutrizac and Chen (1995)
investigated the leaching of galena (PbS) in the ferric sulphate media and found
that relatively slow kinetics were observed in most instances, with the shrinking
63

core model for a diffusion - controlled reaction (equation 2.94) being closely
obeyed. The diffusion controlled kinetics were attributed to the formation of a
tenacious layer of PbSO4 and So on the surface of the galena. Other authors who
have used the shrinking core model (SCM) to describe the dissolution kinetics of
materials/metals during the leaching process include Mulak (1985), Colek et al.
(1987), Yu et al. (1973), and Youzbashi and Dixit (1991).
Dry and Bryson (1987) investigated the kinetics of leaching of a low-grade Fe-Ni-
Cu-Co matte in ferric sulphate solution. They used the shrinking – particle
surface area model to represent the change during leaching of the mineral
surface area. This was combined with an electrochemical surface-reaction
mechanism to represent the dissolution reactions. It was found that the surface
reaction was rate-limiting and electrochemical in nature. Filippou and
Demopoulos (1992) developed a reaction kinetic model for the leaching of
industrial zinc ferrite particulates in sulphuric acid media. They found that the
grain model for surface reaction control (Szekely et al. 1976) exhibited the best fit
to the experimental data, as long as the rate equation was expressed as a
function of the activity of H+, instead of the concentration of H2SO4. Ma and Ek
(1991) used a modified grain model to explain test results and to predict the
relationship between conversion and leaching time (or other process variables) in
a study conducted to investigate the leaching of a manganese carbonate ore in
sulphuric acid. It was found that the rate controlling steps included diffusion in
the porous residue layers and reaction within the mineral grains. Provis et al.
(2003) developed a semi-empirical mathematical model for the acid-oxygen
pressure leaching of Ni-Cu matte from Impala Platinum Refineries, based on data
from batch leaching experiments conducted by Rademan (1995). The primary
controlling factor in the leaching process was found to be galvanic inhibition of
the more highly oxidized copper and nickel sulphide species by less oxidized
species, particularly Ni alloy and Ni3S2. The kinetic model was based on first-
order chemical reaction controlled rate expressions, as the reactions occurring
were electrochemical in nature.
64

Several other kinetic models have been developed to describe the leaching
process taking place in various leaching systems. Among these models are those
developed for the non-oxidative dissolution of sphalerite (Crundwell and
Verbaan, 1987) and for the pressure oxidation of pyrite in sulphuric acid media
(Long and Dixon, 2004). Others have been developed for the leaching of
pentlandite in acidic ferric sulphate solutions (Corrans and Scholtz, 1976) and
for leaching of calcined magnesite using ammonium chloride (Raschman, 2000).
2.5 Summary
This chapter has reviewed the literature on the geology and mineralogy of the
Platinum Group Metal (PGM) bearing ores of the Bushveld Complex of South
Africa. The Bushveld Complex can be divided into four units namely the Lebowa
Granite Suit, the Rashoop Granophyre Suite, the Rooiberg Group and the
Rustenburg Layered Suite. In terms of the Platinum Group Element (PGE)
mineralization, the Rustenburg Layered Suite is the most important unit. Within
this unit there are four PGE mineralization of economic importance, namely the
Merensky Reef, the Upper Group 2 (UG-2) chromitite layer, the Platreef and the
Discordant Dunite Pipes. The most important mineral deposits of the Bushveld
Complex are the sulphide ores (pyrrhotite, pentlandite, chalcopyrite and pyrite).
In the Merensky Reef the base metal sulphides are found in association with
Platinum Group Metals (PGMs). In the UG-2 chromitite the PGMs and base metal
sulphides occur interstitially along chromite grain boundaries and locked in
chromites.
The chapter has also describes the methods employed in the recovery of the
Platinum Group metals (PGMs) from the ores; starting from milling to smelting of
the ore, resulting in the production of nickel-copper matte that contains PGMs.
The general process route for the platinum group metal ores consists of three
65

main unit processes, namely ore concentration by physical techniques (flotation
and gravity), pyrometallurgical concentration and hydrometallurgical extraction
of base metals and Platinum Group Metals (PGMs). The pyrometallurgical
process employed by commercial PGM producers is generally the same. However,
different hydrometallurgical processes are used, although most of them employ
both atmospheric and pressure leaching of the Ni-Cu matte in the initial stages.
A few examples of commercial hydrometallurgical processes for treating the Ni-
Cu matte have been presented, and the chemistry of the leaching processes of
the matte has been described in detail. Literature on the leaching kinetics of
different materials has also been included.
66

CHAPTER 3
In this chapter a short description of the operations of the Impala Platinum Ltd is
presented, in particular the operations of the Impala Base Metals Refinery. The
Precious Metals Refinery was not in the scope of this study, and therefore has
not been discussed. An overview of the base metal hydrometallurgical refining
process has been presented, highlighting the major unit processes.
3.0 HYDROMETALLURGICAL OPERATIONS AT IMPALA
PLATINUM REFINERIES
Impala platinum Refineries commenced production operations in 1969, and is
currently the second largest producer of platinum in the world. It operates two
separate refineries at springs in Jonnesburg, South Africa: the Base Metals
Refinery (BMR) and the Precious Metals Refinery (PMR). The hydrometallurgical
process of the BMR has been described by many authors, including Plasket and
Dunn (1986a), Plasket and Romanchuk (1978), Plasket and Dunn (1986b),
Rademan et al. (1999) and Forbes (1999). Therefore only a brief
description/overview of the BMR operations will be presented in this study.
Moreover, emphasis has been placed on the pre-leach stage (matte repulping
stage) as this was the part of the Ni-Cu matte refining process that has been
investigated in this study. Information on the PMR operations is confidential and
is not available in the public domain; therefore it has not been discussed in this
study. Impala Platinum Ltd gets ore from the Merensky reef and the UG2 reef at
its mines situated near Rustenburg about 100 km Northwest of Johannesburg.
In addition it also gets ore from its mines located in the Limpompo province in
the Eastern limb of the Bushveld complex, and from its mines in Zimbabwe. The
other source of raw material is the Impala Refining Services (IRS), which is a
subsidiary company responsible for sourcing PGE-bearing materials for toll-
refining by the Impala operations. The ore is processed and concentrated at the
67

mineral processing plants on the mine sites to obtain a concentrate, which is
transported to the Impala Smelter in Rusternburg. The concentrate is smelted
and converted to produce a matte consisting mostly of nickel and copper
sulphides with small amounts of iron and cobalt sulphides, and a small percent
of PGMs. The matte is transported by trucks from Rustenburg, where the smelter
is located, to the Base Metals Refinery (BMR) in Springs, Johannesburg. At the
BMR the converter matte is treated to produce nickel, copper, cobalt and
ammonium sulphate as a by-product. The residue, which is the Precious metals
concentrate, is sent to the Precious Metals Refinery (PMR) where the PGEs and
small quantities of gold and silver are recovered.
3.1 Impala Base Metals Refinery (BMR)
The Sherritt Gordon Technology
The Impala Base Metals Refinery (BMR) employs the Sherritt Gordon acid
pressure leaching technology, which involves successive stages of acid-oxidation
leaching. Nickel is leached and removed in the first stage and the Ni solution is
reduced by hydrogen to recover nickel in a powder form. Copper is removed in
the second stage and recovered by electrowinning. The residue from the second
stage is further leached under acid conditions to produce a PGM rich final
residue that constitutes the feed to the Precious Metals Refinery.
In the Sherritt Gordon process, the objective of the first stage leach is to achieve
as high as possible nickel extraction, while at the same time precipitating copper
out of the solution. After thickening, the thickener overflow is treated with either
fresh matte (or NaHS) and NiSO4 to precipitate the rest of the copper from
solution. The copper free solution is further treated to remove iron and other
impurities, after which it is treated with ammonia and ammonium sulphate. The
adjusted nickel solution is then fed into an autoclave in which the nickel is
reduced with hydrogen under pressure and precipitated as nickel powder. The
remaining nickel barren solution is treated with ammonium sulphate and fed to
68

the cobalt circuit to recover cobalt in a powder form. The cobalt barren solution
goes to the ammonium sulphate plant to recover ammonium sulphate as
crystals.
The thickener underflow from the first stage leach goes to the second stage leach
after adjusting the pulp density. The second stage leach extracts almost all of the
copper and any residual nickel from the first stage leach solids. The solids from
the second stage leach are transferred to the third stage then to the fourth stage
and finally to the fifth stage. The last three stages serve as PGM concentrating
stages. The solution from the second stage is first treated to remove impurities
before going to the copper electrowinning circuit where copper is recovered as
cathode copper.
The last three leaching stages (third, fourth and fifth) extract the remaining small
amounts of nickel, copper and iron from the second stage leach solids, and
recycle the solution. Therefore, the solids from the fifth stage leach are very rich
in platinum group metals (1.6 – 2.1 kg/ton) and are transferred to the Platinum
Metals Refinery.
3.2. Impala Base Metals Refinery (BMR) process description
3.2.1 The pre-leach stage (Pulp density adjustment stage)
This section presents a short description of the leaching process as well as that
of the other stages of the base metal refining process. More information on the
BMR process can also be found in papers published by Plasket and Dunn
(1986a), Plasket and Romanchuk (1978), Plasket and Dunn (1986b), Rademan et
al. (1999) and Forbes (1999). The matte generally comprises primarily
heazlewoodite (N3S2), chalcocite (Cu2S) and/or djurleite (Cu1.96S) and a nickel-
rich alloy. Typically, the matte fed to the BMR circuit is composed of the
following: 25 – 32% Cu, 46 – 51% Ni, 0.2 – 0.5% Co, 0.2 - 1.5% Fe and 19 – 23%
S. The matte is repulped in demineralised water to a density of about 3.0 kg/L
and milled to ±50% minus 45μm particle size using a ball mill. The slurry from
the ball mill is then combined with solids from copper cementation and spent
69

electrolyte from the copper electrowinning circuit in the pre-leach tanks to obtain
a pulp density of 1.6 - 1.8kg/L prior to pressure leaching (Figure 3.1). The spent
electrolyte typically contains 24 - 26g/L Ni, 24 - 25g/L Cu, 0.4 - 0.8g/L Fe, 0.2 –
0.3g/L Co and 90 - 110g/L H2SO4, depending on the operation of the copper
electrowinning circuit. The temperature in the pre-leach stage (pulp density
adjustment stage) is in the range of 50 – 65 oC.
The matte feed rate to the ball mill is in the range of 7 – 8 ton/hr and is
controlled by a weightometer on the conveyor belt. The demineralised water
flowrate is controlled by a manual valve. The ball mill is operated in a batch
process, which is determined by the level in tank 2100, such that milling starts
when the level is below 50% and stops after it is full. The mill product is
controlled by measuring the pulp density at regular intervals while milling. The
pulp from the ball mill and solids from the copper cementation circuit are
transferred to tank 2100 where the pulp density is adjusted with copper spent
electrolyte solution to about 3.0 kg/L (Figure 3.1). From tank 2100 the pulp is
transferred through a splitter box to tank 2102 where the pulp density is further
adjusted with the copper spent electrolyte to a density of 1.6 - 1.8kg/L. The
splitter box controls the pulp flowrate to tank 2102 as well as the spent
electrolyte flowrate to both tanks 2100 and 2102, which are set according to the
pulp densities in these tanks. Both tanks 2100 and 2102 have level indicators,
which are connected to the programmable logic controller (PLC) system in the
control room. The copper spent electrolyte is stored in tank 2107 from where it
is pumped to tanks 2100 and 2102 and then directly to the first stage leach
autoclave.
3.2.2 First stage pressure leach
The first stage pressure leaching operation is performed in a four-compartment
autoclave. The pulp from tank 2102 is fed to the first compartment using a
special air pump. The air pump setting is usually kept constant at a
70

predetermined flowrate to maintain the matte throughput. Steam is used to heat
and maintain the temperature at 135 – 150 oC in the first compartment.
Temperatures in the second compartment are kept within the range 150 – 160 oC, while temperatures in the third and fourth compartments are 155 – 165 oC
and 130 – 150 oC, respectively. Air or oxygen (oxidant) pressure is maintained at
about 450 kPa through out the autoclave. The desired temperature and pressure
are maintained by adding steam directly into the autoclave and by bubbling
air/oxygen through the pulp, respectively. Both the temperature and pressure
are automatically controlled by the PLC. The autoclave is vented at constant
intervals to prevent build-up of gases and to ensure proper flow of oxygen
through the pulp. Spent electrolyte is used to maintain the pH in the range 1.8 -
2.5 in the autoclave. pH of the pulp is an important controlling parameter,
depending on the pH, the spent electrolyte flowrate into the autoclave is varied or
the pulp feed flowrate is adjusted. Samples are taken at specific intervals from
the first and fourth compartments of the autoclave to determine the pH and
analyse for Ni, Cu and Fe content. All the leach process inputs are added in the
first compartment. The discharge from the autoclave goes to a thickener where
the solids are separated from the solution; the solids are fed to the second stage
leach while the solution is transferred to the copper cementation and other
impurity removal stages prior to nickel recovery in the form of powder or
briquette (Figure 3.2).
3.2.3 Second stage pressure leach
In the second stage solids from the first stage leach are leached in sufficient
sulphuric acid to meet the requirements of the non-stoichiometric sulphides. The
objective here is to dissolve the remaining nickel and most of the copper from the
first stage leach solids, as well as complete oxidation of the sulphide sulphur to
sulphate with minimal dissolution of the PGMs. Typical leaching conditions are:
temperature in the range 130 – 140 oC, 550 - 600 kPa total pressure and about 4
hours residence time. At this stage almost all the nickel and copper (> 95%) are
71
extracted from the matte. Approximately 94% of the matte is leached in the
second stage. The leach residue is separated from solution by thickening, and
the copper-rich solution undergoes impurity removal prior to copper recovery by
electrowinning. Copper spent electrolyte from the electrowinning cells, containing
some nickel, copper and regenerated sulphuric acid is recycled to the first stage
leach circuit (Figure 3.2).
3.2.4 Third stage pressure leach
The second stage leach residue is repulped and mixed with sulphuric acid before
charging it into the third stage leaching autoclave. The third stage leach is
operated batchwise and is used to remove the remaining iron impurities from the
Platinum-Group Metals (PGM) concentrate. The leach solution is separated from
the leach solids by filtration. The leach solids, which are now rich in PGM, but
contains also some copper, selenium, tellurium, arsenic and sulphur impurities,
are routed to the fourth stage leach. The solution containing mostly iron and
copper is recycled to the first stage leach.
3.2.5 Fourth stage Pressure leach
The fourth stage leach is also operated as a batch process and is used to
remove residual copper from the PGM concentrate. The third stage leach
residue, rich in PGM, is repulped in sulphuric acid and fed to the fourth stage
autoclave. After leaching the slurry is filtered and the solution is routed to the
copper recovery circuit where it joins the spent electrolyte. The PGM-rich solids,
containing trace elements such selenium, arsenic, tellurium and sulphur
impurities are routed to the firth stage pressure leach for further impurity
removal.
72

Ball mill
Tank (2100)
Tank (2102)
Tank (2107
Autoclave
Oxygen/Air Steam
Cu spent electrolyte
Pulp to 2nd stage
Matte
Demin water
Solids from Cu cementation
Spent electrolyte form Cu electrowinning
Figure 3.1: Simplified block flow diagram of the pre-leach/first stage leach process
3.2.6 Fifth stage Pressure leach
The fifth stage leach serves to remove selenium, arsenic, tellurium and sulphur
from the PGM concentrate. The concentrate is repulped in water, then mixed
with sodium hydroxide and fed into the autoclave, which is also operated as a
batch process. The autoclave is operated at high temperatures (175 – 195 oC)
with addition of oxygen. The total pressure in the autoclave is in the range 1750
– 1850 kPa so as to dissolve Se, Te, As and S. After leaching the PGM
concentrate is separated from the solution by filtration. The solution containing
small quantities of dissolved PGMs is transported to the Precious Metals Refinery
(PMR) to recover the PGMs via the barren solution circuit. The PGM concentrate
73

is dried in a steam drier prior to dispatching it to the PMR for PGM recovery. At
this stage the PGM concentrate has been upgraded to about 25% PGM.
3.2.7 Nickel and cobalt recovery circuit
The nickel - cobalt solution from the first stage leach process is first fed to a
copper removal stage where copper is precipitated by cementation with matte or
nickel. The resulting solution is then fed to an autoclave where oxygen and
ammonia are added to oxidize and precipitate out iron, arsenic and lead. Ferrous
iron is oxidised to the ferric state and reacts with ammonium sulphate to form
ammonium jarosite. The arsenic precipitates as ferric arsenate, while lead is
precipitated as plumbojarosite.
The iron, arsenic and lead precipitates are filtered off using filter presses and the
purified nickel-rich solution is transferred to the next stage where ammonia and
ammonium sulphate are added to obtain desired concentrations of nickel and
cobalt diamine sulphates. The adjusted nickel solution is then pumped to nickel
reduction autoclaves where hydrogen is added to reduce nickel and precipitate it
as powder (Figure 3.2). The powder is discharged from the autoclaves, washed
and dried or it is briquetted. Steam is used to heat and maintain temperature at
about 200°C, while the pressure is kept at about 2800 kPa.
Solution from the nickel reduction autoclaves is taken to the next stage where it
is cooled and acidified with sulphuric acid, which results in the precipitation of a
mixed double salt containing nickel and cobalt ammonium sulphate. Small
quantities of iron, copper, manganese and arsenic are also precipitated along
with the mixed double salt. After filtration the pH of the filtrate is adjusted to
neutral and heated before a portion of it is recycled to the nickel solution
purification circuit, and the remainder is pumped to ammonium sulphate
fertilizer plant. The mixed double salt is repulped in solution/water to which
ammonia is added to precipitate iron and arsenic as goethite and ferric arsenate
74

respectively. After filtration, ammonia is added to the iron-arsenic-free solution to
provide the desired molar ratio of ammonia to total nickel plus cobalt. The
cobaltous ammines are then oxidized to the stable cobaltic aquapentammine.
After cobalt oxidation sulphuric acid is added to the solution and cooled to below
30 oC to precipitate nickel ammonium sulphate. The nickel salt is redissolved in
aqueous ammonia and recycled to recover the nickel. Any remaining copper and
manganese are then precipitated out of the cobalt-rich solution, after which the
cobaltic cobalt is converted back to the cobaltous state by reacting the solution
with cobalt powder. The purified cobaltous ammine sulphate solution is then
reduced with hydrogen at elevated temperature and pressure to cobalt powder in
an autoclave. The slurry is filtered and the filtrate is recycled to the mixed double
salt circuit.
3.2.8 Copper recovery circuit
The solution from the second stage leach, which is now rich in copper, goes
through a thickener and filter presses prior to selenium and tellurium removal
step, where sulphurous acid is added to precipitate selenium and tellurium. The
Se and Te precipitates are filtered off and the copper rich solution is directed to
an electrowinning plant where copper is recovered as cathodes. The spent
electrolyte containing some nickel, copper and regenerated sulphuric acid is
recycled to the first leaching stage (Figure 3.2).
3.3 Summary
In this chapter a short description of the operations of the Impala Platinum
Refineries has been presented, in particular the operations of the Base Metals
Refinery whose pre-leaching section was studied. An overview of the base metal
hydrometallurgical refining process has been described, highlighting the major
unit processes. Impala Platinum Ltd obtains Platinum Group Metal (PGM)
bearing ores from its mines situated in Rustenburg, in Limpopo Province and
75

Zimbabwe. The other raw material comes from different sources for toll-refining.
The run-of-mine ore is concentrated and smelted in Rustenburg, about 100 km
northwest of Johannesburg. The converter matte obtained from the smelter,
containing mostly nickel and copper with minor amounts of cobalt and PGMs, is
transported to Johannesburg where both the Base Metal Refinery and the
Precious Metals Refinery are situated. The Base Metal Refinery employs the
Sherrit Gordon acid pressure leaching technology, which involves successive
stages of acid-oxidation leaching. The base metals are first leached out while the
Platinum Group Metals (PGMs) are leached in subsequent series of leaching
stages. In the base metal recovery process, nickel and cobalt are first leached.
The nickel and cobalt are then recovered as metallic powder by hydrogen
pressure reduction in autoclaves. The solids are further leached in the next stage
to solubilise copper which is recovered by electrowinning. At this stage the leach
residue is basically the PGM concentrate that is fed to the Precious Metal
Refinery, after impurity removal.
76

Ball mill
Copper electrowin
Impurity removal
Jarosite precipitation
Repulping / Pre-leach
2nd stagleach
e 1st stage leach
Copper cementation
3rd stage leach
4th stage leach
5th stage leach
Ni solution adjustment
Nickel reduction
Co mixed double salt
(NH4)2SO4 Crystalliser
Cobalt purification
Cobalt reduction
Solution
Converter matte
Copper cathodes
PGM concentrate to PMR
Water
O2
Steam
H2SO4
O2
Steam
H2SO4
Solution
O2
Steam
H2SO4
Solids
Solution
Steam
NaOHO2
Solution
Caustic solution to PMR
SO2
Se / Te residue
Ni sulphate / Ni powder
Cu residue
H2SO4
NH3
H2SO4
O2
O2
Jarosite residue
NH3
Hydrogen Nickel powder/ Briquettes
NH3
Hydrogen
H2SO4Cobalt powder
Ammonium sulphate crystals
Figure 3.2: Simplified block flow diagram of the Impala Base Metals Refinery (BMR).
77

CHAPT ER 4
4.0 EXPERIMENTAL
The study was carried out to investigate the leaching behaviour of Ni – Cu matte
in copper spent electrolyte during the matte repulping (pre-leaching) stage at
Impala Base Metal Refinery (BMR). The study also investigated the response of
the pre-leached matte to the subsequent pressure leaching operation. Therefore,
two sets of laboratory scale experiments were conducted. The first set consisted
of experiments that were designed to simulate the operating conditions of the
matte repulping stage of the BMR plant. The second set of experiments consisted
of pressure leach tests simulating the first stage pressure leach of the BMR
process. The process parameters that influence the pre-leach process were
identified as temperature, particle size, pulp density, stirring rate, acid and
copper concentration; then effects of variations in these parameters on the pre-
leach process were investigated. The experiments simulating the pre-leach stage
of the Impala Base Metals Refinery (BMR) were conducted at the University of
Stellenbosch, while pressure leach experiments were performed at Impala Base
Metal Refinery. The materials used in the study were Ni–Cu converter matte and
copper spent electrolyte obtained from Impala Base Metal Refinery. The matte
sample (about 50kg) was taken before the milling section, and about 200 litres
of the copper spent electrolyte were taken from tank 2107 and stored in a 200-
litre plastic drum. Tank 2107 feeds into the pre-leach tank (tank 2102) via a
spliter box (Figure 3.1). All the atmospheric pre-leach experiments were
conducted using this batch of copper spent electrolyte, while the pressure leach
experiments were performed using a new batch of the electrolyte solution.
Experimental methodology
In the experimental design employed in this study, the approach was to change
the value of one variable at a time while keeping the other variables constant;
this allowed for determination of the effect of that particular variable on the
78

leaching behaviour of the matte. It must be noted that the main purpose and
objective of the study was to understand the chemical processes and reactions,
as well as to determine the possible controlling mechanisms occurring in the
matte repulping stage; and not the optimisation of the process. Modelling of the
process was a secondary objective. It is understood that in complex leaching
processes such as the one investigated in this study there are interactions
between variables; but to try and understand the chemistry involved and get a
general picture of the effects of the variables on the leaching process the
approach of changing one variable and keeping others constant was applied.
Thus, the interactions between the various variables during the leaching process
were not evaluated.
It should be noted that the pre-leach stage at Impala Base Metals Refinery was a
“black box” before this study, in that the leaching behaviour of the matte at this
stage of the process was unknown. Therefore, this study was undertaken to
investigate the leaching behaviour and gain some knowledge on how various
process variables affect the leaching process. Although the factorial design
approach could have been used, the method employed was considered to be
adequate for this study.
4.1 Matte Preparation
The as-received matte was dry milled in a rubber-lined pilot plant scale ball mill.
After milling the matte was thoroughly mixed using a pilot plant scale spiral
mixer. The matte was then wet screened using ASTM standard sieves to obtain
the desired particle size distribution, which was designed to simulate the BMR
plant conditions. The matte was screened into the following particle size
fractions: +300, -300+212, -212+150, -150+75, -75+45 and -45 microns (Table
4.1). Table 4.1 shows also the particle size distribution of the original matte
sample before milling. Table 4.1 shows that about half (50.4%) of the milled
matte had particle sizes less than 45 microns, which was the particle size
distribution employed on the plant. Table 4.2 compares particle size analysis of
79
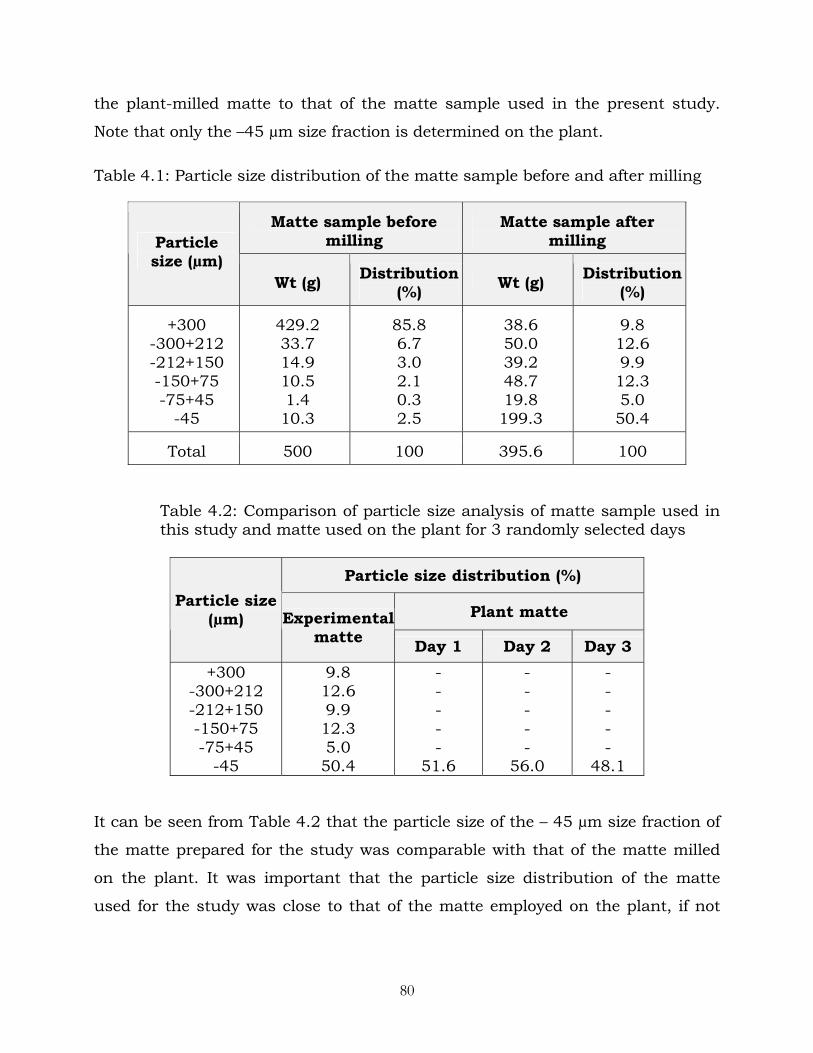
the plant-milled matte to that of the matte sample used in the present study.
Note that only the –45 µm size fraction is determined on the plant.
Table 4.1: Particle size distribution of the matte sample before and after milling
Matte sample before milling
Matte sample after milling Particle
size (µm) Wt (g) Distribution
(%) Wt (g) Distribution (%)
+300 -300+212 -212+150 -150+75 -75+45
-45
429.2 33.7 14.9 10.5 1.4 10.3
85.8 6.7 3.0 2.1 0.3 2.5
38.6 50.0 39.2 48.7 19.8 199.3
9.8 12.6 9.9 12.3 5.0 50.4
Total 500 100 395.6 100
Table 4.2: Comparison of particle size analysis of matte sample used in this study and matte used on the plant for 3 randomly selected days
Particle size distribution (%)
Plant matte Particle size (µm) Experimental
matte Day 1 Day 2 Day 3 +300
-300+212 -212+150 -150+75 -75+45
-45
9.8 12.6 9.9 12.3 5.0 50.4
- - - - -
51.6
- - - - -
56.0
- - - - -
48.1
It can be seen from Table 4.2 that the particle size of the – 45 µm size fraction of
the matte prepared for the study was comparable with that of the matte milled
on the plant. It was important that the particle size distribution of the matte
used for the study was close to that of the matte employed on the plant, if not
80

same, this was because the study had to simulate the plant operating conditions
in order to draw proper conclusions from the experimental results.
A portion of the milled matte sample was wet screened to get three different size
fractions, namely -300+150, -106+45 and –45 µm (Table 4.3). These size
fractions were used to investigate the effect of particle size on the leaching
characteristics of the matte. Chemical composition of the three size fractions was
determined and is also presented in Table 4.3. The specific surface area of the
matte powder was also determined using the BET method (Table 4.4). Details
about the BET theory and its application to measurement of surface area can be
found in the book by Webb and Orr (1997). The surface area of the matte was
used in the evaluation of kinetics of the copper cementation reactions (see
chapter 6.0).
Table 4.3: Particle size distribution and chemical composition of size fractions used to investigate effects of particle size on leaching characteristics of the matte
Chemical composition (%) Particle size
(µm)
Distribution
(%) Ni Cu Co Fe +300
-300+150
-106+45
-45
10.6
21.4
16.3
51.7
-
49.1
47.9
48.8
-
30.4
31.6
30.5
-
0.33
0.31
0.35
-
0.70
0.58
0.61
Table 4.4: Specific surface area of the original matte and particle size fractions that was used in the evaluation of kinetics of the copper cementation reactions
Particle size fractions Specific surface area
( Cm2/g )
Original matte 66982
-300+150 µm 36868
-106+45 µm 89247
-45 µm 82846
81

4.2 Chemical and Mineral composition of the matte
4.2.1 Chemical composition of the matte
Chemical analyses of the matte as provided by Impala Base Metals Refineries are
shown in Table 4.5, together with the analyses obtained in this study. The
analysis was performed by digesting the matte in aqua regia, and analyzing the
solution using inductively coupled plasma (ICP). Sulphur content of the matte
was analysed using a Leco sulphur analyzer. It can be seen that the discrepancy
between the values provided by Impala and those obtained in this study was
quite small. It was, however, decided to use the average values in all the work
presented in this study. It should be noted that only base metals (major
elements) of the matte were analysed and reported, the other elements, for
example PGEs were not analysed. At this stage the PGEs were present in very
small quantities (100 – 2000 ppm).
Table 4.5: Chemical composition of the matte
Matte chemical Composition (wt %) Element/chemical
Analysis from Impala
Analysis from this study
Average values
Nickel Copper Cobalt Iron
Sulphur
47.10 30.19 0.33 0.52 20.10
48.85 32.42 0.34 0.67 20.7
47.98 31.31 0.34 0.60 20.4
4.2.2 Mineral composition of the matte
Mineralogical analysis was performed on the matte sample to determine the
mineral phases present. The analysis was performed by means of X-ray
diffraction (XRD) and Scanning Electron Microscope (SEM) equipped with an
82

energy-dispersive X-ray (EDX) analyzer. The XRD analyses indicated presence of
heazlewoodite (Ni3S2), djurleite (Cu1.9S) and chalcocite (Cu2S), this can be seen
from the XRD graphs in Appendix C. Cobalt and iron phases could not be
detected by the XRD analysis probably due to the small amounts of these
elements in the matte (0.5 – 0.9% Fe and 0.3 – 0.4% Co). The SEM-EDX analysis
indicated the presence of Ni-Fe alloy and Ni-Cu alloy (Figure 5.3, and also in
appendix C), but did not detect any cobalt. However, information from Impala
Base Metals Refineries indicated that cobalt in the Impala matte is present as
Co3S2, and iron as Fe-Ni alloy phase, FeS in the Ni3S2 matrix and as FeAsS
(Spandiel, 1996).
On the basis of the mineral phases present in the matte and the chemical
analyses shown in Table 4.5, the major mineral phases in the matte were
estimated as 54% Ni3S2, 33% Cu2S-Cu1.9S, 11% Ni-rich alloy and 2% other
minerals (Figure 4.1). The method employed in determining the percent mineral
composition is illustrated in Appendix D.
Ni-rich alloy (11%)
Ni3S2 (54%)
other minerals
(2%)
Cu2S + Cu1.9S (33%)
Figure 4.1: Mineral composition of the matte
83

4.3 Preparation of Leaching Solution
The leaching solution was copper spent electrolyte obtained from the copper
electrowinning circuit at Impala Base Metals Refinery. The original copper spent
electrolyte that was used in the pre-leach/atmospheric leaching experiments had
the following chemical composition: 28 g/L Ni, 30 g/L Cu, 0.95 g/L Fe, 0.29 g/L
Co and 95 g/L H2SO4. The second batch of the copper spent electrolyte, which
was used for the pressure leaching experiments, had the following chemical
composition: 25 g/L Ni, 30 g/L Cu, 0.90 g/L Fe, 0.26 g/L Co and 100 g/L
H2SO4. To simulate the leaching conditions prevailing on the plant in both the
pre-leach and pressure leach stages, it was necessary to determine the various
ratios of matte, spent electrolyte solution and demineralized water which had to
be mixed together for the variations in the pulp density. The calculations
involved in the determination of the ratios are shown in Appendix D2. Therefore,
before each experiment was conducted the quantities of copper spent electrolyte
and demineralised water to be mixed together prior to heating up to the desired
temperature were calculated. The chemical compositions of the leaching
solutions used in the atmospheric pre-leach experiments and pressure leach
experiments are shown in Table 4.6, which also shows typical composition range
of the original copper spent electrolyte. The chemical compositions of the
leaching solutions shown in Table 4.6 were obtained after mixing the original
copper spent electrolyte with dematerialized water, according to predetermined
solution /water ratio.
For the experiments conducted to investigate the effect of copper and acid
concentrations of the leaching solution on nickel extraction and copper
cementation, the required leaching solutions were prepared as follows:
• For effect of acid concentration, the acid concentration of the leaching
solution was increased by adding concentrated sulphuric acid. The acid
concentrations investigated were 90 g/L, 110 g/L and 125 g/L (see also
Table 4.7).
84
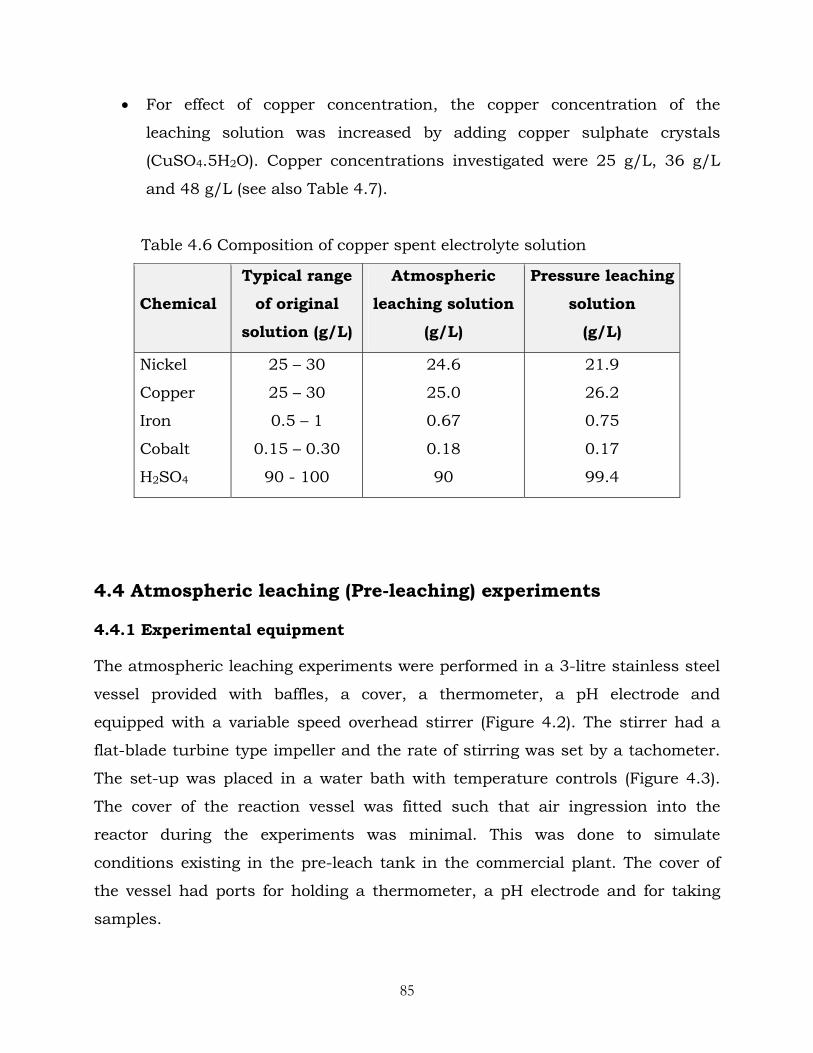
• For effect of copper concentration, the copper concentration of the
leaching solution was increased by adding copper sulphate crystals
(CuSO4.5H2O). Copper concentrations investigated were 25 g/L, 36 g/L
and 48 g/L (see also Table 4.7).
Table 4.6 Composition of copper spent electrolyte solution
Chemical
Typical range
of original
solution (g/L)
Atmospheric
leaching solution
(g/L)
Pressure leaching
solution
(g/L)
Nickel
Copper
Iron
Cobalt
H2SO4
25 – 30
25 – 30
0.5 – 1
0.15 – 0.30
90 - 100
24.6
25.0
0.67
0.18
90
21.9
26.2
0.75
0.17
99.4
4.4 Atmospheric leaching (Pre-leaching) experiments
4.4.1 Experimental equipment
The atmospheric leaching experiments were performed in a 3-litre stainless steel
vessel provided with baffles, a cover, a thermometer, a pH electrode and
equipped with a variable speed overhead stirrer (Figure 4.2). The stirrer had a
flat-blade turbine type impeller and the rate of stirring was set by a tachometer.
The set-up was placed in a water bath with temperature controls (Figure 4.3).
The cover of the reaction vessel was fitted such that air ingression into the
reactor during the experiments was minimal. This was done to simulate
conditions existing in the pre-leach tank in the commercial plant. The cover of
the vessel had ports for holding a thermometer, a pH electrode and for taking
samples.
85

1. pH meter 2. Impeller 3. Water bath 4. pH probe 5. Leach reactor 6. Thermometer 7. Heating element 8. Heat and stirrer
control panel
1 3
4
5
6
2
8
7
Figure 4.3: Schematic diagram of the atmospheric leaching experimental set-up
170 mm
90 mm
150 mm
Stirrer
Baffle
Leaching vessel
130 mm
170 mm
Figure 4.2: Cross section of the leaching vessel used for the atmospheric leaching experiments
86

4.4.2 Experimental conditions
As was noted at the beginning of this chapter, the study was carried out to
investigate the leaching behaviour of Impala nickel-copper matte in the copper
spent electrolyte during the pre-leaching (repulping) stage at the Base Metals
Refinery. To do this, effects of variations in the process parameters such as
temperature, pulp density, stirring rate, residence time, matte particle size,
solution acid and copper concentrations were studied. In order to obtain
meaningful results the leaching conditions employed were aimed at simulating
the actual conditions prevailing during the repulping (pre-leach) stage in tank
2102 in the plant, except for experiments conducted to investigate the effect of
variation in the plant parameters. It should be noted that the conditions in the
repulping tanks (tanks 2100 and 2102) are not strictly monitored and hence
optimum conditions were not known. However, before this study was
commenced the plant personnel were requested to carefully monitor the
temperature and the pulp density in the tank that feeds the autoclaves ( tank
2102 ), though the pulp density and pulp level in this tank were routinely
monitored and recorded in the log sheets by the operators. Thus, the following
values of the parameters were taken as optimum values, and most of the
experiments were conducted at these values: temperature of 60 oC and pulp
density of 1.7 kg/L. A stirring rate of 205 rpm was chosen on the basis that it
was high enough to keep the matte particles in suspension; while a residence
time of 5 hours was found long enough to cater for the time the matte takes to go
through the repulping stage, i.e. to move from the ball mill to the 1st stage of
pressure leaching. Table 4.6 shows the parameters that were investigated
together with values, and plant parameter values. Conditions prevailing in the
two tanks of the pre-leach stage, tanks 2100 and 2102 could not be simulated
separately. Since the pre-leaching of the matte is understood to take place mostly
in the autoclave feed tank (tank 2102), it was assumed that the conditions
prevailing in tank 2100 would be reached very quickly in tank 2102 where most
of the copper spent electrolyte is added (Figure 3.1).
87
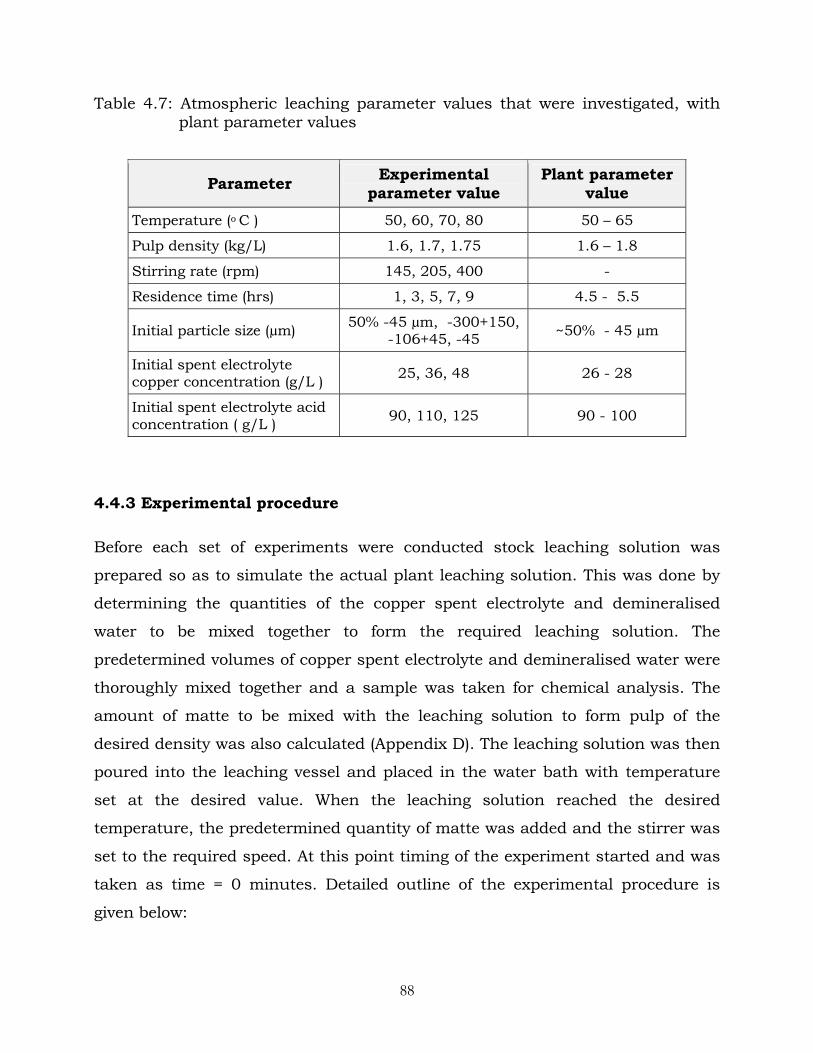
Table 4.7: Atmospheric leaching parameter values that were investigated, with plant parameter values
Parameter Experimental parameter value
Plant parameter value
Temperature (o C ) 50, 60, 70, 80 50 – 65
Pulp density (kg/L) 1.6, 1.7, 1.75 1.6 – 1.8
Stirring rate (rpm) 145, 205, 400 -
Residence time (hrs) 1, 3, 5, 7, 9 4.5 - 5.5
Initial particle size (µm) 50% -45 µm, -300+150, -106+45, -45 ~50% - 45 µm
Initial spent electrolyte copper concentration (g/L ) 25, 36, 48 26 - 28
Initial spent electrolyte acid concentration ( g/L ) 90, 110, 125 90 - 100
4.4.3 Experimental procedure
Before each set of experiments were conducted stock leaching solution was
prepared so as to simulate the actual plant leaching solution. This was done by
determining the quantities of the copper spent electrolyte and demineralised
water to be mixed together to form the required leaching solution. The
predetermined volumes of copper spent electrolyte and demineralised water were
thoroughly mixed together and a sample was taken for chemical analysis. The
amount of matte to be mixed with the leaching solution to form pulp of the
desired density was also calculated (Appendix D). The leaching solution was then
poured into the leaching vessel and placed in the water bath with temperature
set at the desired value. When the leaching solution reached the desired
temperature, the predetermined quantity of matte was added and the stirrer was
set to the required speed. At this point timing of the experiment started and was
taken as time = 0 minutes. Detailed outline of the experimental procedure is
given below:
88

1. 1537 mL of the leaching solution was added to the leaching vessel, which was
then placed in a water bath and heated to the desired temperature.
2. When the desired temperature was reached, 1276 g of the matte was added
and the stirrer was set to the desired stirring rate using a tachometer.
The first sample was taken 15 minutes after the experiment began and thereafter
at 15-minute time intervals. The pH of the reaction mixture was also monitored
at 15-minute time intervals. The samples, each of 25 mL, were taken using a
pipette and were immediately filtered. The filter cake was washed with
demineralised water and dried in an oven at about 100 oC overnight. The filtrate
and the dried cake were kept in sample bottles for chemical analysis, and for free
acid determination in some solution samples. At the end of each experiment the
pulp was allowed to cool down to room temperature, filtered, washed with
demineralised water and solids dried overnight. Both the solids and the filtrate
were also kept for chemical analysis.
4.5 Pressure leaching experiments
4.5.1 Experimental equipment
The pressure leaching experiments were conducted at Impala Base Metals
Refinery (BMR), and were aimed at investigating the response of pre-leached
matte to the subsequent pressure leaching operations. The experiments were
conducted in a 2-litre Paar Series 4520 bench top pressure reactor (autoclave)
made of 316 stainless steel (Figure 4.4a). Leaching of the material takes place
inside a reaction chamber called the bomb (Figure 4.4b), which is placed inside
the shell of the reactor. The reaction chamber can be removed from the reactor
when loading samples.
89

2 - litre bomb assembly
( a ) ( b )
Figure 4.4: 2-litre Paar Series 4520 bench top pressure reactor
The autoclave is equipped with an agitator, dip pipe for sparging gas, sample
port, vent valves and a pressure gauge; and is heated by an electric heater that is
connected to an automatic temperature controller. The temperature controller
regulates temperature in the autoclave by means of a thermocouple connected to
it. The autoclave temperature and the agitator speed are displayed on an LCD
monitor, which houses both the temperature and stirrer controllers. The speed of
the stirrer is set manually on the LCD monitor, and the pressure in the autoclave
is controlled manually by setting the pressure on the gas regulator of the gas
cylinder and then by monitoring the pressure on the autoclave itself. The oxygen
gas cylinder was connected to the autoclave by a flexible pressure hose.
4.5.2 Experimental conditions
As the objective of the pressure leaching experiments was to investigate the
response of the pre-leached/atmospheric leached matte to the subsequent
pressure leaching process, it was important to simulate the leaching conditions
employed in this process. Therefore all the experiments were performed under
90

the same conditions, using the pre-leached matte samples obtained from the
atmospheric leach experiments. The leaching conditions employed in the
pressure leaching experiments simulated the first stage pressure leach
conditions. Table 4.8 shows the experimental conditions as well as those of the
plant.
Table 4.8: Experimental pressure leaching conditions, and plant leaching conditions
Parameter Experimental parameter value Plant parameter value
Temperature (o C ) 145 ± 3 135 – 150
Pulp density ( kg/L) 1.4 1.35 – 1.5
Residence time (hrs) 3 -
Total pressure (kPa) 500 ± 2 450 – 600
4.5.3 Experimental procedure
The quantities of the leaching solution (copper spent electrolyte plus
demineralised water) and matte to be mixed to obtain the desired pulp density
(1.4 kg/L) were calculated prior to the experiments, as explained in section 4.4.3
(see Appendix D2). The calculated volume of the leaching solution (1167 mL) was
first poured into the autoclave reaction chamber (bomb) and the matte was
added. The autoclave bomb was then covered, placed into the autoclave shell and
heated slowly. When the temperature was about 130 oC, the pressure relief valve
was slightly opened for a few seconds to remove any air present inside the
autoclave. Upon attaining a temperature of about 135 oC, the vapour pressure of
the solution was noted, stirrer speed increased to about 900 rpm and oxygen
admitted into the autoclave. The leaching was started at a temperature of about
135 oC, instead of the required temperature of 145 oC to avoid overshooting of
temperature, as the reactions taking place during the leaching process were
exothermic. The total pressure in the autoclave was then set at about 500 kPa.
91

At this point timing of the experiment started and was taken as the beginning of
the pressure leaching process (time = 0 minutes), i.e. 25 minutes after starting
heating the slurry. Upon addition of oxygen the temperature rose from 135 to
145 oC very fast and sometimes reached 148 oC before it came down within 10 –
15 minutes and stabilized at 145 ± 1 oC. Consequently the total autoclave
pressure also rose to about 520 kPa before it stabilized at 500 ± 2 kPa. The first
sample was taken after 15 minutes from commencement of the leaching process
and thereafter every 15 minutes until the experiment was completed. After taking
the sample (20 mL) the pH was measured and the sample was immediately
filtered. The cake was washed with demineralised water and dried in an oven at
100 oC overnight. The dried cake and the filtrate were kept for chemical and total
acid analysis. The residence time of all the experiments was 3 hours. At the end
of each experiment the pulp was allowed to cool down to room temperature,
filtered, washed with demineralised water and solids dried overnight. Both the
solids and the filtrate were also kept for chemical analysis.
4.6 Chemical and mineralogical analysis
Chemical and mineralogical analysis of the samples from the atmospheric
leaching experiments were done at University of Stellenbosch, however some of
the samples were sent to independent Laboratories such as the Bemlab in Cape
Town, to double check and verify the chemical analyses done at the University
laboratories. The pressure leaching experiments were conducted at the Impala
Platinum’s Base Metals Refinery, therefore the chemical analysis was performed
at Impala Base Metals Laboratories (BML), while mineralogical analysis was
conducted at University of the Witwatersrand in Johannesburg. Some samples
were also sent to Setpoint Laboratories to double-check the analyses from
Impala’s Base Metals Laboratories.
Solution samples were analysed for Ni, Cu, Co and Fe using inductively coupled
plasma (ICP). Solid samples were analysed by XRF , although some sample were
analysed by dissolving the solid sample in perchloric acid and/or aqua regia and
92

analyzing for the same elements using the ICP. Total sulphur was determined
using a Leco furnace. Characterisation of the solid samples was done by means
of a TOPCON ABT60 scanning electron microscope (SEM) quipped with an energy
– dispersive X–ray (EDX) analyzer; and also by X-ray diffraction analysis using a
Philips X-ray Diffractometer.
The percent extraction (XM,i) of nickel, cobalt and iron at the time ti during the
leaching was evaluated using the following formula:
( ))100/(
1
1,,
1
1
,m
i
jMjMjjM
i
jj
iM cm
CVCVCVVX
∑∑−
=
=
=
−+⎟⎟⎠
⎞⎜⎜⎝
⎛−
= (4.1)
Where: XMi = the percent extraction of M at the time ti (M= nickel, cobalt or iron)
V = the initial volume of the leaching solution (L)
CM = Initial concentration of M in the initial volume of leaching solution (g/L)
Vj = the volume of the solution sample j (L)
CM,j = the concentration of M in sample j (g/L)
M = the exact mass of the solids added into the reactor (g)
cm = the wt % of M in the solids added into the reactor
j = the jth sample taken during leaching
J = the total number of samples taken
4.7 Summary
This chapter has described the nature of experiments conducted in this study. It
has presented the material used in the experiments, and the process parameters
investigated. Two sets of laboratory scale experiments were conducted, namely
93

atmospheric leaching experiments and pressure leaching experiments on the
leach residue from the atmospheric leaching experiments. The approach was to
change the value of one variable at a time while keeping the other variables
constant; this allowed for determination of the effect of that particular variable on
the leaching behaviour of the matte, in particular the chemistry of the leaching
process. The main purpose and objective of the study was to understand the
chemical processes and reactions, as well as to determine the possible
controlling mechanisms occurring in the matte repulping stage; and not the
optimisation of the process. Modelling of the process was a secondary objective.
The pressure leaching tests were aimed at investigating the response of the pre-
leached matte to the subsequent pressure leaching operations. The process
parameters that were investigated in the atmospheric leach experiments were
temperature, particle size, pulp density, stirring rate, acid and copper
concentrations. In the pressure leaching experiments, plant conditions of the 1st
stage leach were employed.
Chemical and mineralogical composition of the matte was determined. The
mineralogical analysis indicated presence of heazlewoodite, djurleite, chalcocite
and nickel alloy. Cobalt and iron mineral phases could not be identified due to
the small amounts of these elements in the matte (0.34% Co and 0.6% Fe). The
major mineral phases in the matte were estimated at 54% Ni3S2, 33% Cu2S-
Cu1.9S, 11% Ni-rich alloy and 2% other minerals. The specific surface area of the
matte powder was also determined and used in the evaluation of kinetics of the
copper cementation reactions. The leaching solution was copper spent electrolyte
obtained from the copper electrowinning circuit at Impala Base Metals Refinery.
94

CHAPTER 5
5.0 LEACHING CHARACTERISTIC OF Ni – Cu MATTE
5.1 Thermodynamics of the Ni-Cu matte-H2SO4 Leaching System
One of the most convenient techniques used to predict what species would be
formed under particular conditions of redox potential and pH in a leaching
system, such as the one investigated in this study, is to draw the potential – pH
equilibrium diagrams (Pourbaix, 1966). These diagrams, which are known as
Pourbaix diagrams, show predominance areas of species that may be
thermodynamically stable in the system under study. They provide information
on the tendency of a chemical reaction to occur in a particular direction, but do
not provide information on the rate of the reaction. Many researchers have used
Eh-pH diagrams to predict equilibrium stable species in leaching and solution
treatment operations. Osseo-Asare and Fuerstenau (1978) investigated the
application of activity-activity diagrams to ammonia hydrometallurgy, and
presented Eh-pH diagrams for the system Cu-NH3-H2O, Ni-NH3-H2O and Co-
NH3-H2O at a temperature of 25 oC. In a separate study, Osseo-Asare (1981) later
studied the same systems at elevated temperatures. Ferreira (1975) presented
high temperature Eh-pH diagrams for the systems S-H2O, Cu-S-H2O and Fe-S-
H2O; his study dealt with the oxides and sulphides of copper and iron, in
particular the behaviour of the sulphide minerals of copper and iron during
leaching or during geological formations.
In the present study predominance area diagrams have been used to predict the
thermodynamically stable species in the Ni-Cu matte-H2SO4-CuSO4 leaching
system, under the investigated conditions. For the sake of clarity the discussion
of the Eh-pH diagrams has been restricted to the regions applicable to this study,
which are in the pH range of -1 to 4.5. Species which are not relevant to this
study have been omitted. The diagrams were drawn using the HSC Chemistry
95

computer software program written by Roine (2002). The method and
calculations involved in the development of the Pourbaix diagrams have been
published by many authors, including Pourbaix (1966), Ferreira (1975), Osseo-
Asare (1981). The thermodynamically stable species as predicted by the Eh-pH
diagrams were in agreement with those expected from the chemistry of the
leaching process (section 5.2.2) and XRD and SEM-EDX analysis of the solids
obtained after leaching of the matte (Appendix C).
The Eh-pH diagrams for the atmospheric leaching of the Ni-Cu matte are
presented in Figures 5.1 – 5.3, which show the stability regions of the species in
the Ni-S-H2O, Cu-S-H2O and Fe-S-H2O systems at temperatures of 50 oC and 80 oC. Figure 5.1 shows that during the atmospheric leaching of the matte, in the
repulping stage of the leaching process under study, the possible stable species
are aqueous nickel ions (Ni2+), metallic nickel (Nio) and nickel sulphides such as
heazlewoodite (Ni3S2). Figure 5.1 (a) and (b) show that at both temperatures of 50
and 80 oC, pH values of less than 5 and under oxidizing conditions (redox
potential of about zero and above), nickel can be leached from the matte. It can
also be seen that under the investigated conditions, the potential range as well as
pH range in which dissolved nickel seem to be stable does not change with
temperature. This means that nickel can be leached in the same pH range at
both lower temperatures (50 oC) and higher temperatures (80 oC), although the
kinetics of the leaching process may not be the same. This was evident from the
results of the leaching tests performed at 50 and 80 oC (section 6.1). The nickel
species presented by the Eh-pH diagrams are comparable with the results
obtained from the XRD analysis of the leach solids (Appendix C). It should
however, be noted that the diagram for the temperature of 80 oC (Figure 5.1 (b))
does not show presence of millerite (NiS), although XRD analysis showed the
presence of NiS in the leach solids. (see section 7.3.1, Table 7.1).
The stability regions of copper species are presented in Figure 5.2. It can be seen
that the possible stable species of copper for pH values less than 4 are aqueous
96

copper ions (Cu2+), metallic copper (Cuo) and copper sulphides such as
chalcocite. Any increase in pH above 4 will result in hydrolysis of aqueous copper
to form basic copper sulphates (Cu3(OH)4SO4) or copper oxides depending on the
potential of the system. However, under the investigated leaching conditions (pH
< 4.5) all the aqueous copper precipitated before the pH of the system reached 4.
It should be noted that although the diagrams show only one type of copper
sulphide mineral (Cu2S), other minerals such as Cu1.9S and Cu1.8S may also be
present as the chemical composition of these minerals are very close. Infact XRD
analysis of the leach solids showed both Cu2S and Cu1.9S as being present at
both temperatures of 50 and 80 oC (see section 7.3.1, Table 7.1). The size of the
stability regions of all the copper species is not affected by change in temperature
under the investigated conditions.
Figures 5.3 (a) and 5.3 (b) show the stability regions of the iron species in the Fe-
S-H2O system at 50 oC and 80 oC, respectively. The possible stable iron species
under the investigated conditions are aqueous iron (Fe2+ and Fe3+), metallic iron (
Feo ) and iron hydroxide (Fe(OH)3). Under the investigated conditions of pH < 4.5
aqueous ferrous iron (Fe2+) is stable at redox potential of between 0.75V and –
0.5V, however it undergoes hydrolysis to form ferric hydroxide ( Fe(OH)3 ) if the
pH is raised from about 2 and the potential is decreased from about 0.75V to -
0.5V. The Fe2+ is oxidized to Fe3+ as the potential increases from about 0.75V as
long as the pH is less than 1. Figure 5.3 shows also that dissolved ferrous iron
will precipitate as metallic iron if the potential is decreased to less than -0.5V. It
should be noted that no iron compound was detected in the leach solids by the
XRD analysis. This was probably due to the small amount of iron present in the
matte (0.6 %) and leaching solution (0.67 g/L). However, precipitated solids from
the leach solutions were examined by SEM- EDX analysis and revealed presence
of Fe, which was most likely in the Fe(OH)3 form. It can also be seen that
increase in temperature from 50 to 80 oC does not significantly change the
stability regions of the iron species, except that the pH range over which Fe2+ is
stable decreases slightly from about 8 at 50 oC to about 7 at 80 oC.
97

14121086420-2
2.0
1.5
1.0
0.5
0.0
-0.5
-1.0
-1.5
-2.0
Ni - Cu - S - H2O - System at 50.00 C
C pH
Eh (Volts)
NiO
Ni3S2
Ni
Ni(+2a)
14121086420-2
2.0
1.5
1.0
0.5
0.0
-0.5
-1.0
-1.5
-2.0
Ni - Cu - S - H2O - System at 80.00 C
C pH
Eh (Volts)
NiO
Ni3S2
Ni
Ni(+2a)
(a) (b)
Figure 5.1: Eh-pH diagram for the Ni-S-H2O system at (a) 50 oC, (b) 80 oC; [Ni] = 2.00 M, [S] = 2.00 M at atmospheric pressure. ( M = molality)
14121086420-2
2.0
1.5
1.0
0.5
0.0
-0.5
-1.0
-1.5
-2.0
Cu - Ni - S - H2O - System at 50.00 C
C pH
Eh (Volts)
Cu
Cu
Cu2S
CuO
Cu2O
Cu3(OH)4SO4Cu(+2a)
14121086420-2
2.0
1.5
1.0
0.5
0.0
-0.5
-1.0
-1.5
-2.0
Cu - Ni - S - H2O - System at 80.00 C
C pH
Eh (Volts)
Cu
Cu
Cu2S
CuO
Cu2O
Cu3(OH)4SO4Cu(+2a)
(a) ( b)
Figure 5.2: Eh-pH diagrams for the Cu-S-H2O system at (a) 50 oC and (b) 80 oC; [Cu] = 1.50 M, [S] = 2.00 M at atmospheric pressure. ( M = molality ).
98
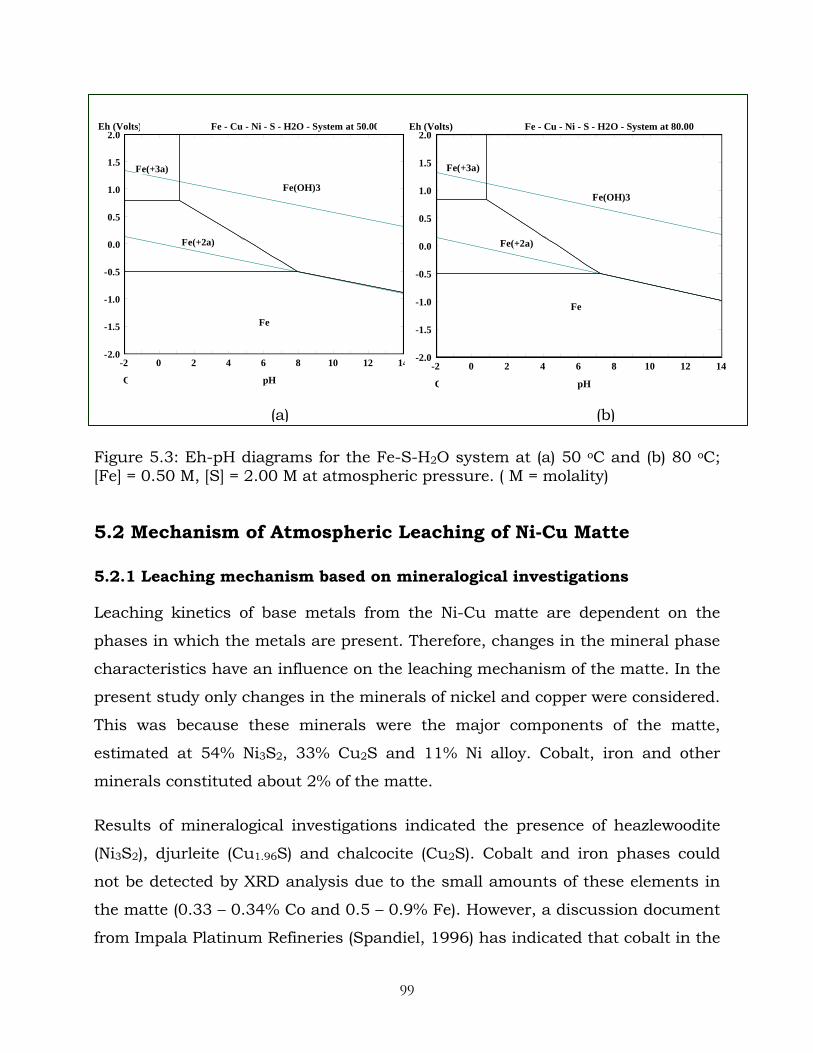
Figure 5.3: Eh-pH diagrams for the Fe-S-H2O system at (a) 50 oC and (b) 80 oC; [Fe] = 0.50 M, [S] = 2.00 M at atmospheric pressure. ( M = molality)
14121086420-2
2.0
1.5
1.0
0.5
0.0
-0.5
-1.0
-1.5
-2.0
Fe - Cu - Ni - S - H2O - System at 50.00
C pH
Eh (Volts)
Fe
Fe(OH)3
Fe(+2a)
Fe(+3a)
14121086420-2
2.0
1.5
1.0
0.5
0.0
-0.5
-1.0
-1.5
-2.0
Fe - Cu - Ni - S - H2O - System at 80.00
C pH
Eh (Volts)
Fe
Fe(OH)3
Fe(+2a)
Fe(+3a)
(a) (b)
5.2 Mechanism of Atmospheric Leaching of Ni-Cu Matte
5.2.1 Leaching mechanism based on mineralogical investigations
Leaching kinetics of base metals from the Ni-Cu matte are dependent on the
phases in which the metals are present. Therefore, changes in the mineral phase
characteristics have an influence on the leaching mechanism of the matte. In the
present study only changes in the minerals of nickel and copper were considered.
This was because these minerals were the major components of the matte,
estimated at 54% Ni3S2, 33% Cu2S and 11% Ni alloy. Cobalt, iron and other
minerals constituted about 2% of the matte.
Results of mineralogical investigations indicated the presence of heazlewoodite
(Ni3S2), djurleite (Cu1.96S) and chalcocite (Cu2S). Cobalt and iron phases could
not be detected by XRD analysis due to the small amounts of these elements in
the matte (0.33 – 0.34% Co and 0.5 – 0.9% Fe). However, a discussion document
from Impala Platinum Refineries (Spandiel, 1996) has indicated that cobalt in the
99

Impala converter matte is present as Co3S2 and iron as Fe in the nickel alloy
phase, FeS in the Ni3S2 matrix and as FeAsS. Berezowsky (2003) suggested that
some cobalt exists in metallic form; however, SEM-EDS analysis was not able to
detect any cobalt phase but showed the presence of Ni-Fe alloy and Ni-Cu alloy.
Figure 5.4 shows an SEM image of a particle of nickel alloy in the Ni-Cu sulphide
matrix prior to leaching. SEM-EDS analysis also showed that nickel and copper
mineral phases were intergrown, with copper minerals always present in nickel
minerals and vice versa. Figure 5.5 shows images of a matte particle taken after
5 hours of leaching. It can be seen that the nickel alloy was leached out of the
matte particle, leaving holes in the particle. This is evident from Figure 5.6,
which shows holes created by the dissolution of the Ni-Cu alloy (spots 2, 3 and 4)
and Ni-Fe alloy (spot 1). Figure 5.6 revealed also that the metal alloys were not
completely dissolved after 5 hours of leaching. The metals in the alloy phase were
leached out of the matte particles and no mineral matrix disintegration was
observed.
The presence of Ni-Cu and Ni-Fe-Cu alloys in converter matte has been reported
by other researchers, including Rademan et al. (1999), Llanos et al. (1974), and
Hofirek and Kerfoot (1992). Mackinnon et al. (1971) stated that the preparation
of mattes involves a slow cooling process during which a Ni-Cu alloy is formed.
However, the Impala matte is granulated and not slow cooled; therefore it seems
that both granulated and slow cooled matte may contain Ni-Cu-Fe alloy. Slow
cooled matte facilitates the crystallisation of a metallic Ni-Cu-Fe alloy containing
most of the PGMs, and a PGM-free nickel-copper matte (Hofirek and Halton,
1990 and Hochreiter et al., 1985). However, slow cooled matte results in the
formation of undesirable trevorites (NiO.Fe2O3) and magnetite (FeO.Fe2O3) which
are insoluble in the subsequent base metal leaching stages and report to the
PGM concentrate. Granulation prevents this from happening and is therefore
preferred (Steenekamp and Dunn, 1999). Rademan et al. (1999) carried out an
extensive study of the pressure leaching process at Impala base metals refinery
and noted the same mineral phases in the converter matte as those observed in
100

the present study. They reported that mineral structure of the nickel and copper
sulphides can be visualized as layers of sulphides anions with nickel and copper
cations filling some of the spaces in this layer, where the filling of the nickel and
copper cations in the sulphides lattice will determine the crystal structure of the
mineral and hence it’s properties. Nickel and copper are gradually leached out of
the sulphides lattice to form minerals with lower nickel and copper to sulphur
ratio. Table 5.1 shows the mineralogical composition of the matte prior to
leaching and that of the same matte after 5 hours of atmospheric leaching in the
CuSO4-H2SO4 solution.
Figure 5.4: SEM image of matte particle before leaching showing a particle of nickel alloy in the Ni/Cu sulphide matrix at a magnification of 7000x.
(a) (b)
Figure 5.5: SEM images of matte particle after 5 hours of leaching, showing holes formed in the particle after metal alloy was leached out: (a) 1600x magnification; (b) 14500x magnification,
101

Figure 5.6: SEM image of matte particle after 5 hours of leaching, showing that the Ni-Cu alloy and Ni-Fe alloy were not completely dissolved: spot 1: Ni-Fe alloy; spots 2, 3 and 4: Ni-Cu alloy; Spot 5: Ni/Cu sulphides
Table 5.1: Mineralogical composition of the matte before and after leaching for 5 hours
Mineral composition of matte ( % )
Before leaching After leaching
Heazlewoodite (Ni3S2)
Heazlewoodite (Ni3S2) Millerite (NiS)
Chalcocite (Cu2S) Djurleite (Cu1.96S)
Chalcocite (Cu2S) Djurleite (Cu1.96S Chalcocite-Q
Ni-Cu alloy Ni-Fe alloy
Ni-Cu alloy Ni-Fe alloy
Table 5.1 shows that some of the heazlewoodite was leached and transformed
into millerite, this is evident from the XRD analysis graphs given in Appendix C.
However, most of the nickel was expected to be leached from the alloy. In the
atmospheric leaching of Ni-Cu converter matte, with no air or/and oxygen
102

addition and under the conditions applied in this study, the copper sulphide
minerals were not leached. Instead aqueous copper from the solution was
precipitated and formed copper minerals, while nickel was leached from the
matte. The copper was precipitated as metallic copper and as chalcocite or
chalcocite-Q, although this could not be confirmed as there was already
chalcocite in the original matte. It should be noted that these two copper
minerals are difficult to distinguish as their XRD patterns and peaks overlap,
besides their chemical compositions are very close. Hence these copper minerals
are sometimes simply referred to as Cu2S.
5.2.2 Leaching mechanism based on process chemistry
The leaching mechanism presented in this section was based on mineral phase
changes discussed in the preceding section, chemical analysis and information
from the literature. Under the conditions employed in this study, where no
oxidant was added, the metals were not expected to be leached to any significant
degree especially from the sulphide minerals. The leaching mechanism of the
matte under the investigated conditions can be divided into two parts:
(a) Leaching of the matte with simultaneous precipitation of aqueous copper
via the cementation process.
(b) Leaching of the matte by direct acid attack.
(a) Leaching of the matte with simultaneous precipitation of aqueous
copper via the cementation process
The major mineral phases in the matte were Ni3S2, Cu2S (Cu2S plus Cu1.96S) and
Ni alloy. The nickel in the alloy was leached by the process of cementation
according to reaction 5.1:
Nio + CuSO4 → Cuo + NiSO4 (5.1)
103

This reaction is substantiated by the fact that metallic copper was clearly visible
on the sides of the leaching vessel and in the leach solids. The Ni alloy continued
to be leached throughout the five-hour leaching period and was not dissolved
completely, as is evident from Figure 5.6. The dissolution of metallic iron from
the Ni–Fe alloy was believed to proceed according to the well-known reaction of
cementation of copper by metallic iron:
Feo + CuSO4 → FeSO4 + Cuo (5.2)
The ability of Ni-Cu matte to precipitate Cu2+ from solution with simultaneous
leaching of Ni, is a well known fact (Llanos et al., 1974; Rademan et al., 1999;
Hofirek and Kerfoot, 1992; Plasket and Romanchuk, 1978). Therefore, some of
the aqueous copper may be precipitated by the heazlewoodite according to the
following reactions:
Ni3S2 + CuSO4 → Cuo + 2NiS + NiSO4 (5.3)
Ni3S2 + 2CuSO4 → Cu2S + NiS + 2NiSO4 (5.4)
Ni3S2 + Ni + 4CuSO4 → 2Cu2S + 4NiSO4 (5.5)
The formation of NiS was supported by the presence of this phase in the leach
solids examined by XRD (see Appendix C). However, the formation of Cu2S
through reactions (5.4) and (5.5) could not be substantiated by means of XRD
analysis as there was already Cu2S in the original matte. No copper precipitation
by hydrolysis (reaction 5.6) was expected to occur, since under normal operating
conditions copper hydrolysis takes place above pH 4 (Hofirek and Kerfoot, 1992;
and Symens et al., 1979). In all the experiments, it was observed that copper was
completely rejected from the solution by reactions (5.1) – (5.5) before pH 4 was
attained. This was why basic cupric sulphate Cu3(OH)4SO4 (antlerite) was not
detected in the leach solids.
104

3Cu2+ + SO42- + 4H2O → Cu3(OH)4SO4 + 4H+ (5.6)
(b) Leaching of the matte by direct acid attack
In the absence of an oxidant, such as air or oxygen, some of the nickel and iron
from the alloy can be leached by the sulphuric acid according to reaction (5.7):
Ni–Fe + 2H2SO4 → NiSO4 + FeSO4 + 2H2 (5.7)
The other possible reactions are the leaching of NiS and FeS by the sulphuric
acid (reactions 5.8 and 5.9). FeS is reported to be in the Ni3S2 matrix (Spandiel,
1996), while NiS is formed during the leaching process by reactions (5.3) and
(5.4).
NiS + H2SO4 → NiSO4 + H2S (5.8)
FeS + H2SO4 → FeSO4 + H2S (5.9)
Although the leaching vessel was covered during the experiments, some air may
have entered the leaching system. Thus, in the presence of air some of the nickel,
iron and a small portion of the heazlewoodite may have been leached by oxidative
dissolution in the sulphuric acid according to the following reactions:
Nio + H2SO4 + ½O2 → NiSO4 + H2O (5.10)
Feo + H2SO4 + ½O2 → FeSO4 + H2O (5.11)
Ni3S2 + H2SO4 + ½O2 → NiSO4 + 2NiS + H2O (5.12)
It was not possible to determine the form of cobalt in the matte, due to the small
amount of this element present in the matte (0.33 – 0.34%). If it is assumed that
some of it existed in metallic form, as reported by Berezowsky (2003), then it was
leached as shown in reaction (5.13):
105

Coo + H2SO4 + ½ O2 → CoSO4 + H2O (5.13)
As the leaching vessel was not air tight, some of the matte may have been
leached according to reactions (5.4a) and (5.5a), resulting in the production of
H2S as an intermediate product. According to Mulak (1987) Ni3S2 is unstable in
acid oxidizing solutions and evolution of H2S gas takes place spontaneously. The
aqueous Cu2+ ions accept electrons from evolved hydrogen sulphide to form
Cu2S. Rademan et al. (1999) indicated that the formation of H2S occurs through
the oxidative (anodic half-cell) reaction of the cementation of copper with Ni3S2
and Ni alloy.
Ni3S2 + 2H+ = NiS +2Ni2+ H2S + 2e- (5.4a)
Ni3S2 + Ni + 4H+ = 4Ni2+ + 2H2S + 4e- (5.5a)
2Cu2+ + H2S +2e- = Cu2S +2H+ (5.4b)
4 Cu2+ + 2H2S + 4e- = 2Cu2S + 4H+ (5.5b)
The overall equation for reactions (5.4a) and (5.4b) is equation (5.4), while
equation 5.5 represents the overall equation for reactions (5.5a) and (5.5b).
Ni3S2 + 2Cu2+ → Cu2S + NiS + 2Ni2+ (5.4)
Ni3S2 + Ni + 4Cu2+ → 4 Ni2+ + 2Cu2S (5.5)
However, no smell of H2S was detected during the leaching experiments,
probably due to the fact that reactions (5.4b) and (5.5b) were as fast as reactions
(5.4a) and (5.5a). Hence, H2S was probably consumed as fast as it was produced.
106

0
10
20
30
40
50
60
70
80
0 15 30 60 90 120 150 180 240 300
Leaching Time, min
Met
al e
xtra
ctio
n, %
0
1
2
3
4
5
Sol
utio
n pH
Co
FeNi
pH
Figure 5.7: Variation of metal concentrations and pH of leach solution as a
function of leaching time at 70 oC (Stirring rate: 205 rpm; Pulp density: 1.7kg/L)
0
10
20
30
40
50
60
70
80
0 15 30 60 90 120 150 180 240 300
Leaching Time, min
Met
al e
xtra
ctio
n, %
0
1
2
3
4
5S
olut
ion
pHCo
FeNi
pH
Figure 5.8: Variation of metal concentrations and pH of leach solution as a
function of leaching time at 80 oC (Stirring rate: 205 rpm; Pulp density: 1.7kg/L)
107

0
20
40
60
80
100
0 15 30 60 90 120 150 180 240 300
Leaching Time, min
Met
al e
xtra
ctio
n, %
0
1
2
3
4
5
6
Sol
utio
n pH
Co
Fe
Ni
pH
Figure 5.9: Variation of metal concentrations and pH of leach solution as a
function of leaching time at a stirring rate of 400 rpm (Temp.: 60 oC; Pulp
density: 1.7kg/L)
One interesting observation was that the pH of the solution increased sharply
immediately after Cu2+ ions were completely precipitated out of solution as can
be seen in Figures 5.10, 5.11 and 5.12, which also show metal concentrations of
the leach solution as a function of leaching time at temperatures of 60, 70 and
80 oC, respectively. The reason for this behaviour was attributed to the fact that
prior to complete copper cementation, part of the matte leaching process
occurred via the cementation process (reactions 5.1 – 5.5) and by direct attack
with H2SO4 (reactions 5.7 – 5.13). After complete copper rejection, the leaching
process was mainly by direct reaction of the matte with H2SO4, which consumed
most of the acid and hence raised the solution pH. The rise in the pH resulted in
the precipitation of iron at pH values above 3 (see Figures 5.7, 5.8 and 5.9). It
should be noted that the rise in pH to above 3 was only observed in the
experiments where the Cu2+ ions were completely precipitated within 3 hours of
leaching time. (Figures 5.11 and 5.12).
108
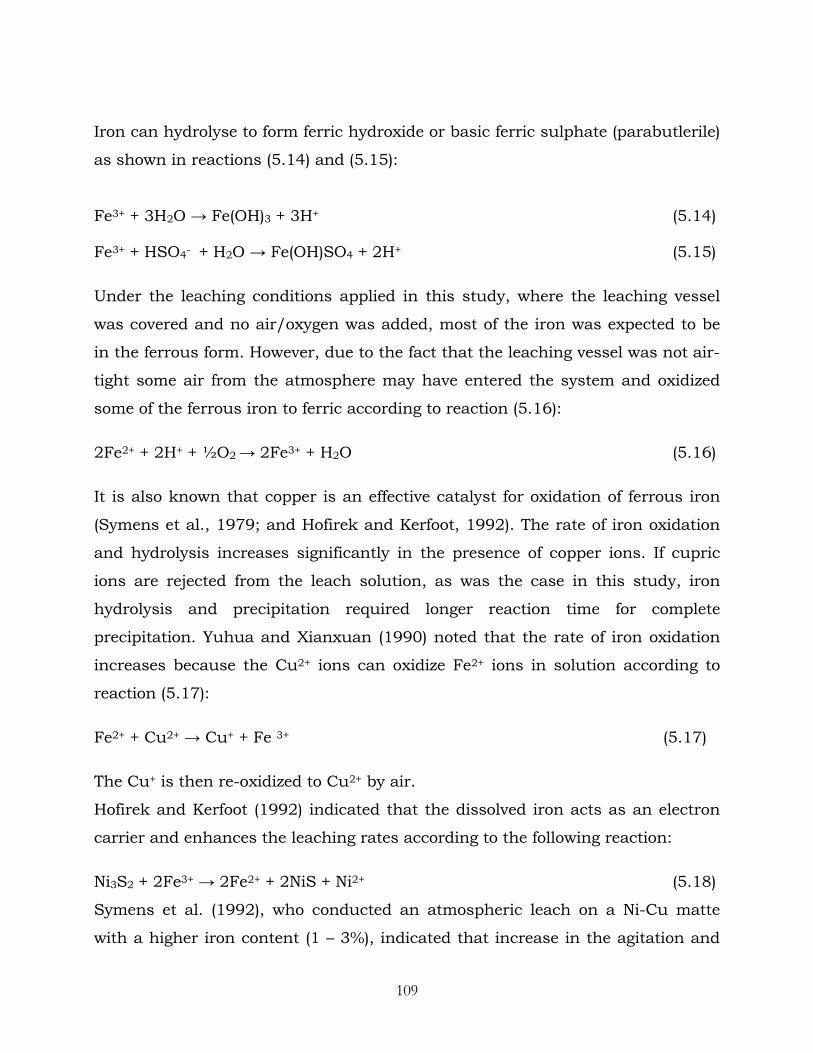
Iron can hydrolyse to form ferric hydroxide or basic ferric sulphate (parabutlerile)
as shown in reactions (5.14) and (5.15):
Fe3+ + 3H2O → Fe(OH)3 + 3H+ (5.14)
Fe3+ + HSO4- + H2O → Fe(OH)SO4 + 2H+ (5.15)
Under the leaching conditions applied in this study, where the leaching vessel
was covered and no air/oxygen was added, most of the iron was expected to be
in the ferrous form. However, due to the fact that the leaching vessel was not air-
tight some air from the atmosphere may have entered the system and oxidized
some of the ferrous iron to ferric according to reaction (5.16):
2Fe2+ + 2H+ + ½O2 → 2Fe3+ + H2O (5.16)
It is also known that copper is an effective catalyst for oxidation of ferrous iron
(Symens et al., 1979; and Hofirek and Kerfoot, 1992). The rate of iron oxidation
and hydrolysis increases significantly in the presence of copper ions. If cupric
ions are rejected from the leach solution, as was the case in this study, iron
hydrolysis and precipitation required longer reaction time for complete
precipitation. Yuhua and Xianxuan (1990) noted that the rate of iron oxidation
increases because the Cu2+ ions can oxidize Fe2+ ions in solution according to
reaction (5.17):
Fe2+ + Cu2+ → Cu+ + Fe 3+ (5.17)
The Cu+ is then re-oxidized to Cu2+ by air.
Hofirek and Kerfoot (1992) indicated that the dissolved iron acts as an electron
carrier and enhances the leaching rates according to the following reaction:
Ni3S2 + 2Fe3+ → 2Fe2+ + 2NiS + Ni2+ (5.18)
Symens et al. (1992), who conducted an atmospheric leach on a Ni-Cu matte
with a higher iron content (1 – 3%), indicated that increase in the agitation and
109

decrease in solution temperature accelerate iron precipitation. This fact was also
noted in the present study where more iron was precipitated at a higher stirring
rate of 400 rpm in comparison with that at 205 rpm (see Figure 6.13). However,
this phenomenon was not observed in the experiments where the effect of
temperature was investigated (Figure 6.4).
0102030405060708090
100
0 15 30 60 90 120 150 180 240 300
Leaching Time, min
Sol
utio
n C
onc.
, g/L
0
1
2
3
4
5
Sol
utio
n pH
Co Fe NiCu pH
pH rises sharply after Cu2+ precipitation
Figure 5.10: Variation of metal concentrations in leach solution as a function of leaching time at 60 oC (Stirring rate: 205 rpm; Pulp density: 1.7kg/L).
Figure 5.11: Variation of metal concentrations in leach solution as a function of leaching time at 70 oC (Stirring rate: 205 rpm; Pulp density: 1.7kg/L).
0
20
40
60
80
100
0 15 30 60 90 120 150 180 240 300
Leaching Time, min
Sol
utio
n C
onc.
, g/
0
1
2
3
4
5
Sol
utio
n p
Co Fe NiCu pH
l
HpH rises sharply after Cu2+ precipitation
110

0
20
40
60
80
100
0 15 30 60 90 120 150 180 240 300
Leaching Time, min
Sol
utio
n C
onc.
, g/L
0
1
2
3
4
5
Sol
utio
n pH
CoFe
NiCu
pH
pH rises sharply after Cu2+ precipitation
Figure 5.12: Variation of metal concentrations in leach solution as a function of leaching time at 80 oC (Stirring rate: 205 rpm; Pulp density: 1.7kg/L). 5.3 Galvanic interaction between mineral phases during leaching
of the Ni-Cu matte
It is a well known fact that when conducting or semi conducting minerals in
contact with each other are subjected to a leaching medium which facilitates
charge transfer, galvanic interactions may occur which can enhance the leaching
rate of one or more members of the electrochemically coupled minerals and
retard the dissolution of other mineral members. In general, a galvanic couple is
operative where two or more solid phases are in electrical contact, and each solid
assumes either anodic or cathodic behaviour and has its own separate surface
area for reaction. The galvanic interaction results in change of rates of anodic
and cathodic half reactions that occur at the surface of each solid phase. Several
investigators have published information on the electrochemical behaviour of
sulphide minerals. Hiskey and Wadsworth (1981) published an extensive review
of electrochemical processes that take place in the leaching of metal sulphides
and oxides, and noted that a fundamental property of semi-conducting minerals
is the characteristic “rest” potential. The rest potential, for interfacial electrode
111

processes, corresponds to the equilibrium (no net anodic or cathodic current)
electrode potential. Generally the phenomenon of galvanic interaction is
explained in terms of the rest potential of each mineral with respect to the
standard hydrogen electrode (SHE). Minerals with more positive rest potentials
(i.e. more noble minerals) act as cathodes, while minerals with less positive (or
more negative) rest potentials act as anodes. For example, if chalcocite (Cu2S)
with rest potential of 0.44 V vs SHE is in contact with covellite (CuS) whose rest
potential is 0.42 V vs SHE in the presence of a leaching medium the CuS will
dissolve anodically and the rate of dissolution will increase, while Cu2S will act
as the cathode which will retard its dissolution. Berry et al. (1978) studied
galvanic interaction between chalcopyrite (rest potential: 0.52 V vs SHE) and
pyrite (rest potential: 0.63 V vs SHE) during bacterial leaching of low-grade
chalcopyrite waste rock. They observed that during the leaching of these
minerals as separate, non-contacting phases, the pyrite corroded more rapidly
than the chalcopyrite. When the pyrite and chalcopyrite were in contact, the
resulting galvanic interaction caused the chalcopyrite to corrode more rapidly
than the pyrite; which was effectively passivated. Holmes and Crundwell (1995)
studied the copper-pyrite galvanic couple in acidified ferric sulphate solution and
the galena-pyrite galvanic couple in ferric nitrate solution. They developed a
quantitative description of galvanic interactions between sulphide minerals based
on thermodynamic and kinetic parameters; and used these parameters in a
mathematical model to obtain a prediction of the magnitude of the galvanic
interaction. Southwood (1985) carried out experiments on the acid leaching of
nickel and copper from sulphidic ore in the presence of pyrite under atmospheric
pressure and temperature (25 oC). The results obtained showed that the
dissolution rate of nickel and copper from a pyrrhotite-pentlandite-chalcopyrite
ore in a lixiviant of sulphuric acid was greatly enhanced in the presence of pyrite.
He attributed the observed result to a probable galvanic mechanism. Leaching
behaviour of gold in contact with associated minerals depends on the galvanic
interaction between gold and the minerals and partially on the formation of a
passivating film on the gold surface (Lorenzen and van Deventer, 1992). Gold in
112

contact with conducting minerals will passivate as a result of the enhanced
magnitude of the cathodic current, resulting in decreased gold dissolution rates.
The list of electrochemical studies of anodic dissolution of minerals is
inexhaustible and includes investigations by Paul et al. (1978), Nicol et al (1975,
Nicol, 1984), Jayasekera et al. (1995) and Reddy et al. (1987).
Although galvanic phenomenon could not be proved in the leaching system
investigated in the present study, the Ni-Cu sulphide minerals and the Ni alloys
were in intimate contact with one another in the matte, therefore it was possible
that a galvanic couple existed between the Ni alloy and the sulphide minerals in
which the Ni alloy had a lower rest potential and thus acted as an anode. This
may have also contributed to the leaching of the nickel from the alloy, as
depicted in Figure 5.13. The dissolution of nickel from the Ni alloy can occur
through the anodic half cell reaction represented by equation (5.5a). It should be
noted that equations 5.4a, 5.4b, 5.5a and 5.5b are given in section 5.2.2, but are
repeated here for the sake of clarity.
Ni + Ni3S2 + 4H+ = 2H2S +4Ni 2+ + 4e- (5.5a)
The cathodic reaction is the reduction of aqueous copper ions by the H2S onto
the Ni3S2 surface (equation (5.5b)):
4Cu2+ + 2H2S + 4e- = 2Cu2S + 4H+ (5.5b)
The other factor that may have contributed to the leaching of the nickel is the
galvanic couple between the copper sulphide and nickel sulphide minerals. In
this case, the anodic reaction is the leaching of the Ni3S2 according to reaction
(5.4a ):
Ni3S2 + 2H+ = H2S + NiS + 2Ni2+ + 2e- (5.4a)
The cathodic reaction is the reduction of copper ions by the H2S:
2Cu2+ + H2S + 2e- = Cu2S + 2H+ (5.4b)
113

The thermodynamic relationships of various solids in contact with aqueous
solutions of specific composition can be illustrated by potential-pH diagrams
(Pourbaix diagrams). These diagrams can be used to get a rough indication as to
which galvanic couples in a leaching system are thermodynamically favoured to
react anodically, and those that are thermodynamically likely to react
cathodically. For example Figure 5.14 indicates that the potential of the
Cu2+/Cu2S couple for the given conditions is more positive than that of the
Ni2+/Ni3S2 couple. This indicates that reactions involving the Ni2+/Ni3S2 couple
have lower half cell potentials than those of the Cu2+/Cu2S couple, and are
therefore thermodynamically favoured to react anodically in the presence of
copper ions. However, it should be noted that the sequence of reaction products
does not necessarily correspond to those having the greatest thermodynamic
drive, but relative reaction rates should also be taken into account (Hiskey and
Wadsworth, 1981).
H+
Ni2+ H2S
Ni3S2
Ni
Cu2+
H+
Cu2S
H2S
e-
Leaching solution
Figure 5.13: Schematic diagram of galvanic couple between nickel alloy and nickel sulphide minerals.
114

14121086420-2
2.0
1.5
1.0
0.5
0.0
-0.5
-1.0
-1.5
-2.0
Ni
Ni
Ni
Ni
Ni
Ni
NiNi
Ni
Ni
NiNi
NiNiNi
Ni
NiNi
Cu
Cu Cu
Cu
CuCu
Cu
CuCu
Cu
Cu
CuCu
Cu
Cu
Cu
Cu
Cu
Cu
Cu
CuCuCu
Cu
CuCu
Cu
Cu
Cu
Cu
Cu
CuCuCu
Ni - Cu - S - H2O - System at 50.00 C
C pH
Eh (Volts)
NiO
Ni3S2
Ni
Ni(+2a)
Cu
Cu
Cu2S
CuO
Cu2O
Cu3(OH)4SO4
Cu(+2a)
Figure 5.14: Eh-pH diagram for the Ni-Cu-S-H2O system at 50 oC,; [Ni] = 2.00 M, [S] = 2.00 M and atmospheric pressure. (M = molality)
5.4 Mechanism of copper cementation during leaching of the Ni-Cu matte
Cementation is defined as an electrochemical reaction involving the precipitation
of a more noble metal ion from solution by another more electropositive metal
according to the overall reaction:
mN n+ + nM = nM m+ + mN (5.19)
Where N is the noble metal and M is the precipitant. Cementation is an
important reaction in hydrometallurgical processes, for example it can be used to
recover copper from acid leach solutions and gold from cyanide leach solutions.
Many studies have been conducted on the process of cementation of copper,
using precipitants such as Fe, Al, and Ni, to understand the mechanisms and
kinetics involved. Nadkarni et al. (1967) carried out a study of copper
precipitation on iron using a rotating disc. They correlated the rate of
115

cementation with such parameters as copper and hydrogen ion concentration,
flowrate, geometric factors and temperature. Annamalai and Murr (1979)
conducted a similar study to investigate the influence of deposit morphology on
the kinetics of copper cementation on pure iron. Investigations on copper
cementation on pure aluminum disc include kinetic studies carried out by
Annamalai and Hiskey (1978), Mackinnon and Ingraham (1970), and Donmez et
al. (1999). Mackinnon et al. (1971) studied copper cementation on pure nickel
and nickel-copper alloy discs. According to their results, copper cementation on
the Ni-Cu alloy was unsuccessful, and this was attributed to a lower potential
difference between the copper solution and the surface of the nickel-copper alloy.
However, satisfactory results were obtained in the present study in which the
precipitant was also the nickel metal in the form of Ni-Cu alloy within the
sulphide matte. Other authors who have carried out investigations on the
cementation of various metals from different solutions include Anacleto and
Carvalho (1996), Hsu and Tran (1996), Puvvada and Tran (1995), Sahoo and
Srinivasa (1982), and Addy and Fletcher (1987).
Copper cementation reaction on a nickel precipitant can be represented by
equation 5.20:
Nio + Cu2+ = Ni 2+ + Cuo (5.20)
During the leaching of the Ni-Cu matte some of the aqueous copper precipitated
as Cu2S (equations (5.4b) and (5.5b) ) due to the presence of H2S, which was
generated during the leaching process, according to reactions (5.4a) and (5.5a).
However, as no oxidant was added to the system the reaction between the
sulphide minerals and acid was considered insignificant. It was therefore
assumed that reactions (5.4) and (5.5) did not have significant effect on the
overall cementation process, and was not accounted for in the discussion of the
kinetics of copper cementation presented in chapter 6.
The mechanism by which the over-all cementation reaction at the solid-liquid
interface can occur is generally considered to go through a number of steps. For
116

cementation of aqueous copper ions onto solid Ni-Cu matte particles, the steps
involved are:
1. Diffusion of Cu 2+ ions to the solid matte surface,
2. Adsorption of the Cu 2+ onto the surface,
3. Chemical reaction at the surface,
4. Desorption of Ni 2+ from the matte surface, and
5. Diffusion of Ni 2+ away from the surface.
Any one of the above steps may be rate controlling. Diffusion of the Cu2+ ions
through the bulk solution may be eliminated by sufficiently increasing the
stirring rate. However, diffusion through a boundary layer could still be the rate –
controlling step.
5.5 Nature of the cemented deposit
The nature of the deposit, with regard to size and shape of the particles, could
not be determined due to the small quantity of the deposit in comparison with
the leach solid residue. Examination of the initial matte and the leach residue
under a scanning electron microscope did not clearly show the difference in
particle size and shape between the initial matte sample and the final leach
residue, as the deposit was mixed with the residue (Figure 5.13).
(a) (b)Figure 5.13: SEM images of matte particles: (a) before leaching, (b) after 5 hours of leaching.
117

5.6 Summary
In this chapter results of the atmospheric leaching experiments have been
discussed on the basis of the thermodynamics and mechanism of the leaching
system studied. The first section (section 5.1) discussed the thermodynamics of
the Ni-Cu matte – H2SO4 leaching system using the Potential-pH (Eh – pH)
equilibrium diagrams (pourbaix diagrams). The pourbaix diagrams have
predicted the possible thermodynamically stable species in the Ni-Cu matte –
H2SO4 – CuSO4 leaching system, under the investigated conditions, as aqueous
nickel, metallic nickel, nickel sulphides (e.g. Ni3S2), aqueous copper, metallic
copper and copper sulphides (e.g. Cu2S). The species predicted by the Eh-pH
diagrams were in agreement with the results obtained from the analysis of the
leach solids and solutions.
Section 5.2 discussed the leaching mechanism of the matte, based on the
mineralogical investigations of the matte as well as on the chemistry of the
leaching process. It was noted that the leaching mechanism of base metals
depends on the phases in which the metals are present. The metals in the alloy
phase were leached out of the matte particles and no mineral matrix
disintegration occurred. The results showed some millerite (NiS) in the leach
solids indicating that heazlewoodite dissolved to some extent, and transformed
into NiS. The aqueous copper precipitated as metallic copper and probably as
chalcocite/chalcocite-Q, although this could not be confirmed by the XRD
analysis as there was already chalcocite in the original matte. The leaching
mechanism based on the process chemistry was supported by mineral phases
found in the leach solids, solution analyses and information from the literature.
In this mechanism the matte leaching occurred through the cementation process
and direct attack of the matte by acid, especially in the early stages when the
aqueous copper was still present. After copper was completely precipitated from
the solution, the leaching process was by direct reaction of the matte with acid.
The pH of the solution rose sharply after the Cu2+ ions were completely
118

precipitated, probably due to the rapid consumption of the acid by the leaching
reactions. The sharp rise in the pH was only noted in the experiments where the
copper ions were completely precipitated. The nickel sulphides may have been
leached by the metathesis reaction and by acid due to presence of air, as the
leaching vessel was not air tight. The nature of the copper deposit could not be
characterised due to the small quantity of deposit in comparison with the leach
solid residue.
In section 5.3 leaching of the matte due to galvanic interaction between the
mineral phases has been discussed. It was postulated that because the Ni-Cu
sulphide minerals and the Ni alloys were in intimate contact, they formed a
galvanic couple in which the Ni alloy had a lower rest potential and thus
dissolved anodically. The other factor that may have contributed to the leaching
of the matte is the galvanic couple between the copper sulphide and nickel
sulphide minerals. In this case, the nickel sulphide minerals dissolved
anodically.
119

CHAPTER 6
6.0 ATMOSPHERIC LEACHING EXPERIMENTS OF Ni-Cu
MATTE
Leaching behaviour of the nickel-copper matte in copper spent electrolyte during
the repulping stage at Impala Base Metals Refinery (BMR) was studied in order to
improve understanding of the process. Results of the dissolution of nickel, cobalt
and iron as well as cementation of copper during the leaching process are
presented and discussed in this chapter. As stated earlier (see chapter 3), the
base metal refining process consists of a matte repulping stage prior to a series of
pressure leaching stages. The repulping stage can be considered as a “non-
oxidative” atmospheric leach stage, since leaching of the matte starts
immediately it comes into contact with the CuSO4-H2SO4 repulping solution.
It should be noted that the results are an indication of the degree of leaching
that can be expected under the experimental conditions employed in this study.
To show the trend in the dissolution behaviour of nickel, cobalt and iron during
the leaching process the extractions were ploted against leaching time. Results
obtained from solid analysis have been compared with those from the solution
analysis. To show reproducibility of the results graphs of tests done in duplicate
are also presented. The results are also depicted in bar graphs; the error bars on
the graphs indicate a 5% error in the results.
Effect of variations in the process parameters such as temperatures, stirring
rate, pulp density, matte particle size, initial copper and acid concentrations
were studied. Leaching kinetics of the matte were characterized with the
shrinking core model, which was done by using the dissolution kinetics of nickel
in the experiments conducted at temperatures of 50, 60 and 70 oC using a
portion of matte that was screened to –300+150 μm particle size fraction. Nickel
dissolution kinetics was used because nickel was the most abundant element in
120

the matte (48%), and was one of the elements that dissolved. Iron and cobalt
content of the matte was very low at 0.6 %Fe and 0.34% Co. Copper which was
about 31% in the matte precipitated during the leaching process, and hence
could not be used in the model. Depending on the chemical-physical process
controlling nickel dissolution, different equations can be applied. The equations,
which are also given in section 2.4 but repeated here for clarity, may be
summarized as:
For a surface chemical reaction controlled process:
1-(1-X)1/3 = kt (6.1)
For a product layer/ash diffusion controlled process:
1-3(1-X)2/3 + 2(1-X) = kt (6.2)
For mixed (surface and product layer/ash) controlled process:
[1-3(1-X)2/3 + 2(1-X)] + [1 – (1-X)1/3] = kt (6.3)
Where X is the fraction reacted, t is the time of leaching, k is the rate constant
and is a kinetic constant.
The kinetics of copper cementation was evaluated by measuring the rate of
decrease of copper concentration in the solutions, as a result of precipitation
onto the suspended matte particles of known surface area. Cementation
reactions are first order processes with respect to the noble metal, which is
copper in this case. The reactions are found to obey the first order kinetic law, in
which data fit a first order rate equation. The rate of copper cementation onto Ni–
Cu matte can be represented by the following first order rate equation:
VCuKA
dtCud ][][ 22 ++
−= (6.4)
121
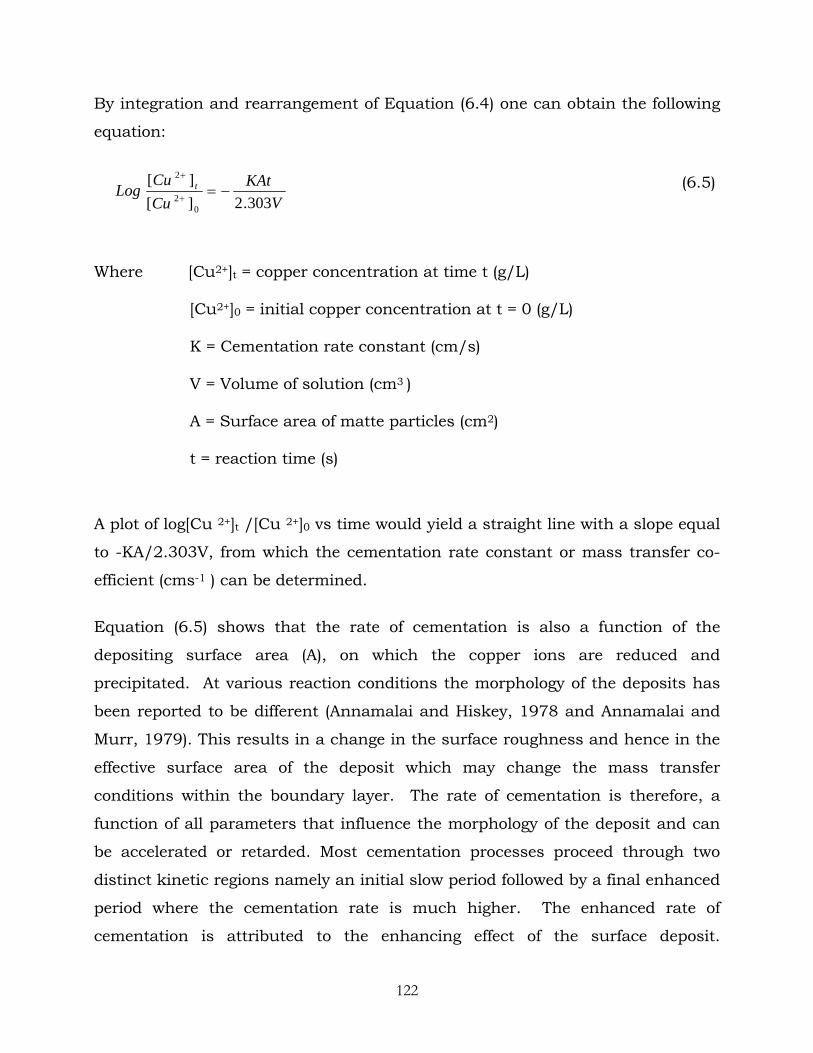
By integration and rearrangement of Equation (6.4) one can obtain the following
equation:
V
KAtCuCu
Log t
303.2][][
02
2
−=+
+ (6.5)
Where [Cu2+]t = copper concentration at time t (g/L)
[Cu2+]0 = initial copper concentration at t = 0 (g/L)
K = Cementation rate constant (cm/s)
V = Volume of solution (cm3 )
A = Surface area of matte particles (cm2)
t = reaction time (s)
A plot of log[Cu 2+]t /[Cu 2+]0 vs time would yield a straight line with a slope equal
to -KA/2.303V, from which the cementation rate constant or mass transfer co-
efficient (cms-1 ) can be determined.
Equation (6.5) shows that the rate of cementation is also a function of the
depositing surface area (A), on which the copper ions are reduced and
precipitated. At various reaction conditions the morphology of the deposits has
been reported to be different (Annamalai and Hiskey, 1978 and Annamalai and
Murr, 1979). This results in a change in the surface roughness and hence in the
effective surface area of the deposit which may change the mass transfer
conditions within the boundary layer. The rate of cementation is therefore, a
function of all parameters that influence the morphology of the deposit and can
be accelerated or retarded. Most cementation processes proceed through two
distinct kinetic regions namely an initial slow period followed by a final enhanced
period where the cementation rate is much higher. The enhanced rate of
cementation is attributed to the enhancing effect of the surface deposit.
122

Annamalai and Murr (1979) explained the enhancement in terms of attaining a
critical deposit mass which effectively increases the cathodic surface area, and
alters the diffusion boundary layer by increased surface roughness. While the
two-step mechanism was typical for most experiments in this study, it did not
appear in a few cases in which the entire rate was slow.
The kinetics of copper cementation onto the Ni-Cu matte was analysed using the
first-order rate law shown in Equation (6.5). The cementation reaction can be
seen as consisting of two stages: the initial period of reaction (stage 1), and the
subsequent period (stage 2). Stage 1 of the reaction is represented by the initial
straight line portion of the log[Cu 2+]t/[Cu 2+]0 vs time plot, and stage 2 is
represented by the subsequent straight line of the graph (see Figure 6.8). It
should be noted that each of the two stages on the graph has a different slope,
and hence different value of the rate constant (K). However, due to the fact that
no geometric correction was used for the change in the surface area of the matte
during the reaction period, only the rate constant for the first stage was
determined in all the tests. Thus, K refers to the first stage rate constant in the
present study. It should be noted that lower values of the rate constants (K) were
obtained in the present study (values ranged from 0.004 to 0.028 x 10⁻³ cm/s) in
comparison with those obtained by MacKinnon et al. (1971), Annamalai and
Hiskey (1978), MacKinnon and Ingraham (1970), and Nadkarni et al. (1967).
MacKinnon et al. (1971) obtained rate constant values of more than 0.2 x 10²
cm/sec in a study of copper cementation on nickel discs using rotating disc
method. The comparatively low rate of cementation obtained in the present study
was probably due to the fact that the total surface area of the matte, which was
used in the calculation of the K values, was much larger than the surface area of
nickel particles in the matte on which the cementation reaction takes place. In
addition, much higher pulp densities and solution concentrations were employed
in this study.
123

The activation energy (Ea) of both the leaching and cementation reactions were
determined from the Arrhenius equation (Equation 6.6).
K = Ae –Ea/RT (6.6)
Where K is the reaction rate constant, A is called the frequency factor, R is the
gas constant and Ea is the activation energy of the reaction.
6.1 Effect of temperature on the leaching behaviour of the Ni-
Cu matte
6.1.1 Effect of temperature on the dissolution of nickel, cobalt and iron
The effect of temperature on the leaching behaviour of the matte was investigated
by changing the value of the temperature while keeping the other variables
constant. The experiments were conducted for the temperature range 50 – 80 oC
at a pulp density of 1.7 kg/L and stirring rate of 205 rpm. The results obtained
are presented in Table 6.1, and graphically illustrated in Figures 6.1 – 6.4. Figure
6.5 illustrates the reproducibility of the results, and shows similar leaching
behaviour of the metals. Results obtained from solid analysis were also
comparable with those from the solution analysis (Appendix A). It should be
noted that the results obtained are an indication of the leaching that can be
expected under the experimental conditions employed in this study. To show the
trend in the dissolution behaviour of nickel, cobalt and iron during the leaching
process the extractions were ploted against leaching time as shown in Figures
6.1, 6.2 and 6.3, respectively. Detailed data on the metal extractions and
concentrations of the leach solutions during the atmospheric leaching process
are presented in Appendix A.
The results indicated that increasing the temperature from 50 oC to 60 oC slightly
increased both the rate and degree of nickel extraction; however no significant
increase in the degree of nickel extraction was observed for the temperature
124

range 60 – 80 oC (Figure 6.1). Mineralogical analysis also indicated that more
nickel was leached in the temperature range 60 – 80 oC as suggested by the fact
that Ni3S2 transformed into NiS at 60 – 80 oC, whereas at 50 oC no mineral
transformation occurred (see Table 7.1 in section 7.3.1)
In the case of cobalt, no clear trend was observed with regard to the effect of
temperature variation as both the rate and degree of leaching appeared to be
insensitive to temperature changes in the range 50 - 70 oC and only increased
slightly at 80 oC (Figure 6.2). Figure 6.3 shows that at the low temperature of 50 oC relatively low iron extraction was achieved, however when the temperature
was increased to 60 oC both the rate and degree of leaching increased. It also
illustrates that increasing the temperature from 60 to 80 oC did not have effect
on the iron dissolution as similar extractions were observed. However, it should
be noted that iron extractions could not be determined with certainty due to iron
hydrolysis and subsequent precipitation above pH 3.
Table 6.1: Ni, Co, and Fe extractions and final metal concentrations of the solution after atmospheric leaching of the matte at different temperatures
Metal extraction (%)
Final solution concentration (g/L) Temperature
(oC) Ni Co Fe * Ni Co Fe Cu
50
60
70
80
13.2
16.9
18.6
19.5
27.5
28.7
30.4
35.3
45.8
70.4
70.8
73.4
76.6
85.8
101.6
104.6
0.9
1.0
1.1
1.2
4.2
4.3
3.6
3.9
7.9
0.0
0.0
0.0
*The value shows maximum extraction attained prior to Fe precipitation. Leaching conditions: stirring rate: 205 rpm, pulp density: 1.7kg/L, residence time: 5 hours
125

0
5
10
15
20
25
0 30 60 90 120 150 180 210 240 270 300
Leaching time, min
Ni e
xtra
ctio
n, %
50 oC60 oC70 oC80 oC
Figure 6.1: Nickel extraction as a function of leaching time at different temperatures (stirring rate: 205 rpm, pulp density: 1.7kg/L ).
0
5
10
15
20
25
30
35
40
0 30 60 90 120 150 180 210 240 270 300
Leaching time, min
Co
extra
ctio
n, %
50 oc60 oC70 oC80 oC
Figure 6.2: Cobalt extraction as a function of leaching time at different temperatures (stirring rate: 205 rpm, pulp density: 1.7kg/L)
126

0
10
20
30
40
50
60
70
80
0 30 60 90 120 150 180 210 240 270 300
Leaching time, min
Fe e
xtra
ctio
n, %
50 oC60 oC70 oC80 oC
Figure 6.3: Iron extraction as a function of leaching time at different temperatures (stirring speed: 205 rpm, pulp density: 1.7kg/L )
0
10
20
30
40
50
60
70
80
90
100
Ni Co Fe
Metal
Met
al e
xtra
ctio
n, %
50 oC
60 oC
70 oC
80 oC
Figure 6.4: Metal extractions after atmospheric leaching of the Ni-Cu matte at different temperatures
127

0
10
20
30
40
50
60
70
80
0 15 30 60 90 120 150 180 240 300
Leaching Time, min
Met
al e
xtra
ctio
n, %
Test 2 - CoTest 2 - Fe
Test 2 - NiTest 1 - CoTest 1 - Fe
Test 1 - Ni
Figure 6.5: Comparison of metal extractions between two tests conducted at a temperature of 80 oC (stirring rate: 205 rpm, pulp density: 1.7kg/L ).
The initial dissolution rates of all the three metals were relatively high during the
first 15 minutes of leaching (Figures 6.1 – 6.3). The high rates of metal
dissolution were probably due to the fast chemical reaction kinetics of the matte
in the initial stages of leaching (0 – 15 min.) when fine particles were still
present. About 50% of the “leacheable nickel” was extracted within the first 15
minutes, while more than 50% of leacheable cobalt and iron were solubilized.
The term leacheable nickel (or leacheable metal) in this case refers to the
maximum nickel that can possibly be leached under the leaching conditions
employed in this study. The leacheable nickel is believed to leach mostly from the
Ni alloy, the remainder originated from the nickel sulphide.
The results show different degrees of extraction for the three metals, iron
extraction was the highest followed by that of cobalt; and nickel extraction was
the lowest. This suggests that most of the iron in the matte probably occurred in
an alloy form, probably as Ni-Fe alloy (Figure 5.6) which was leachable under the
conditions employed in this study. Cobalt extraction was the second highest and
128

it is believed that part of it existed as an alloy and the rest as sulphide, as
reported in a discussion document from Impala Platinum Refineries (Spandiel,
1996). However, it was difficult to detect it with the SEM-EDX and XRD analyses
because the matte had very low cobalt content (0.3%). It is possible that the
metallic cobalt was responsible for most of the cobalt dissolution observed in this
study. As expected, the degree of nickel extraction was the lowest since most of
the Ni in the Ni-Cu matte exists as heazlewoodite (54%) and little occurs as an
alloy (11%), which is more likely to leach under the conditions employed where
no oxygen was added.
As indicated earlier the dissolution kinetics of the metals were characterized
with the shrinking core model using nickel dissolution kinetics data obtained
from an experiment conducted on the -300+150µm size fraction of the matte. The
equation describing reaction controlled by diffusion through surface layer
(Equation 6.2), appeared to give the best fit (Figure 6.6a), in comparison with the
equations describing reaction controlled by a surface chemical reaction (Equation
6.1) as shown in Figure 6.6b or the equation describing a mixed (chemical
reaction and diffusion) controlled process (Equation 6.3) as shown in Figure 6.6c.
Although the mixed controlled equation also appeared to give a good fit, the
correlation coefficient values obtained were lower than those for the diffusion
controlled reaction. The correlation coefficient values for the diffusion controlled
reaction at the temperatures of 50, 60 and 70 oC were found to be 0.95, 0.91 and
0.96 respectively, while those of a mixed controlled reaction were 0.88, 0.84 and
0.91 at 50, 60 and 70 oC respectively. In view of the higher correlation coefficient
values obtained for the diffusion controlled reaction, it is reasonable to conclude
that the diffusion control equation gives the best representation of the leaching
process.
1-(1-X)1/3 = kt (6.1)
129

1-3(1-X)2/3 + 2(1-X) = kt (6.2)
[1-3(1-X)2/3 + 2(1-X)] + [1 – (1-X)1/3] = kt (6.3)
The variation of 1- 3(1-X)2/3 + 2(1-X) with time is shown in Figure 6.6a for three
temperatures (50, 60 and 70 oC). The reaction rate constants (K) were obtained
from the slopes of the 1-3(1-X)2/3 + 2(1-X) Vs time lines (Figure 6.6a), and these
rate constants were used in the Arrhenius equation (Equation 6.6) to determine
the activation energy (Ea) of the reaction using Figure 6.6. Activation energy (Ea)
of 31 kJ/mol was obtained from the Arrhenius plot of equation 6.6 (see Figure
6.7) and this value of the Ea suggested a diffusion-controlled leaching reaction.
Detailed experimental data and calculations are presented in Appendix A.
0.000
0.002
0.004
0.006
0.008
0.011
0 30 60 90 120 150
Leaching time, min
1-3(
1-x)
2/3 +
2(1
-x)
50 deg.
60 deg.
70 deg.
Figure 6.6a: Plot of 1-3(1-X)2/3 + 2(1-X) vs time for the leaching of Ni at different temperatures for the diffusion controlled reaction.
130

0.000
0.010
0.020
0.030
0.040
0.050
0.060
0.070
0.080
0 30 60 90 120 150
Leaching time, min
1-(1
-x)1/
3
50 deg.
60 deg.
70 deg.
Figure 6.6b: Plot of 1-(1-X)1/3 vs time for the leaching of Ni at different temperatures for the chemically controlled reaction.
0.000
0.002
0.004
0.006
0.008
0.011
0.013
0.015
0 30 60 90 120 150Leaching time, min
[1-3
(1-x
)2/3 +
2(1
-x)]+α[
1-(1
-X)1/
3 ]
50 deg.
60 deg.
70 deg.
Figure 6.6c: Plot of [1-3(1-X)2/3 + 2(1-X)] + α[1 – (1-X)1/3] vs time for the leaching of Ni at different temperatures for the mixed controlled reaction.
131

-4 .4 5
-4 .4 0
-4 .3 5
-4 .3 0
-4 .2 5
-4 .2 0
-4 .1 5
-4 .1 0
2 .9 0 2 .9 5 3 .0 0 3 .0 5 3 .1 0 3 .1 5
Tem pera tu re (1000 /T) , K
Log
K
Ea = 31 kJ/mol
Figure 6.7: Arrhenius plot for the Ni leaching reaction at three different temperatures.
6.1.2 Effect of temperature on copper cementation
Effect of temperature on the cementation rate of copper during the atmospheric
leaching of the matte in the temperature range 50 – 80 oC is illustrated in Figure
6.8, which shows the trend in the rate of copper precipitation. It can be seen that
the rate of copper cementation increased substantially with increasing
temperature in the range 50 – 70 oC, however when the temperature increased
from 70 oC to 80 oC only a slight increase in the cementation rate was observed.
At 80 oC all the aqueous copper was precipitated, whereas at 50 oC only 68% of
the copper precipitated. The observed behaviour of copper suggested that if
copper needs to be removed from the solution as fast as possible during the
repulping stage (pre-leach stage), the temperature should be increased.
The effect of temperature on the copper cementation reaction kinetics is shown
in Figures 6.9a and 6.9b. Figure 6.9a is a plot of log{[Cu 2+]t/[Cu 2+]0} against time
at various temperatures, as explained earlier in this chapter (see equation 6.5).
From the slopes of these plots, cementation rate constants (K) were determined
and plotted against 1/T ( Arrhenius plot) as presented in Figure 6.9b, which
132

shows the effect of temperature on the rate constant for the first period (stage 1)
of the reaction ( Figure 6.9a). It can be seen from Figure 6.9a that the
cementation rate constant increased with increase in temperature. From the
slopes of the plots in Figure 6.9b, the activation energy of the reaction (Ea) was
calculated using the Arrhenius relationship (Equation 6.6). The results indicated
that the reaction proceeded under two rate controlling mechanisms, as shown in
Figure 6.9b. MacKinnon et al. (1971) obtained similar results in their studies of
cementation of copper on nickel discs. Annamalai and Hiskey (1978) also
observed the two rate controlling mechanisms in their study of copper
cementation on pure aluminum.
Two distinct activation energies, namely 18.2 kJ/mol at high temperatures (70 –
80 oC) and 74.6 kJ/mol for lower temperatures (50 – 70 oC) were obtained. These
values of the activation energy indicated that the rate of the reaction was
probably controlled by a boundary layer ionic diffusion mechanism at higher
temperatures. At low temperatures, the activation energy was quite high
indicating that the rate was probably controlled by a surface reaction. This result
agrees with the observed insensitivity of the cementation rate constants to
variations in the stirring rates at a temperature of 60 oC (Figure 6.17), which
suggests a surface reaction controlled cementation process. MacKinnon et al.
(1971) observed similar cementation behaviour and obtained an activation
energy of 7 kcal/mol (29 kJ/mol) for a temperature range of 59 oC - 84 oC, and
44 kcal/mol (184.2 kJ/mol) for a temperature range of 49 oC – 59 oC, for copper
cementation on nickel discs. They attributed their results to the presence of an
oxide film on the surface of the disc, which retarded the cementation reaction.
High temperatures help breakdown the oxide layer and therefore the reaction
proceeds at a faster rate. The high value of the activation energy and low rate of
cementation observed at low temperatures in the present study may be
attributed to the small surface area of nickel particles that was exposed to the
aqueous copper ions, since most of the matte particles consisted of Ni-Cu
133
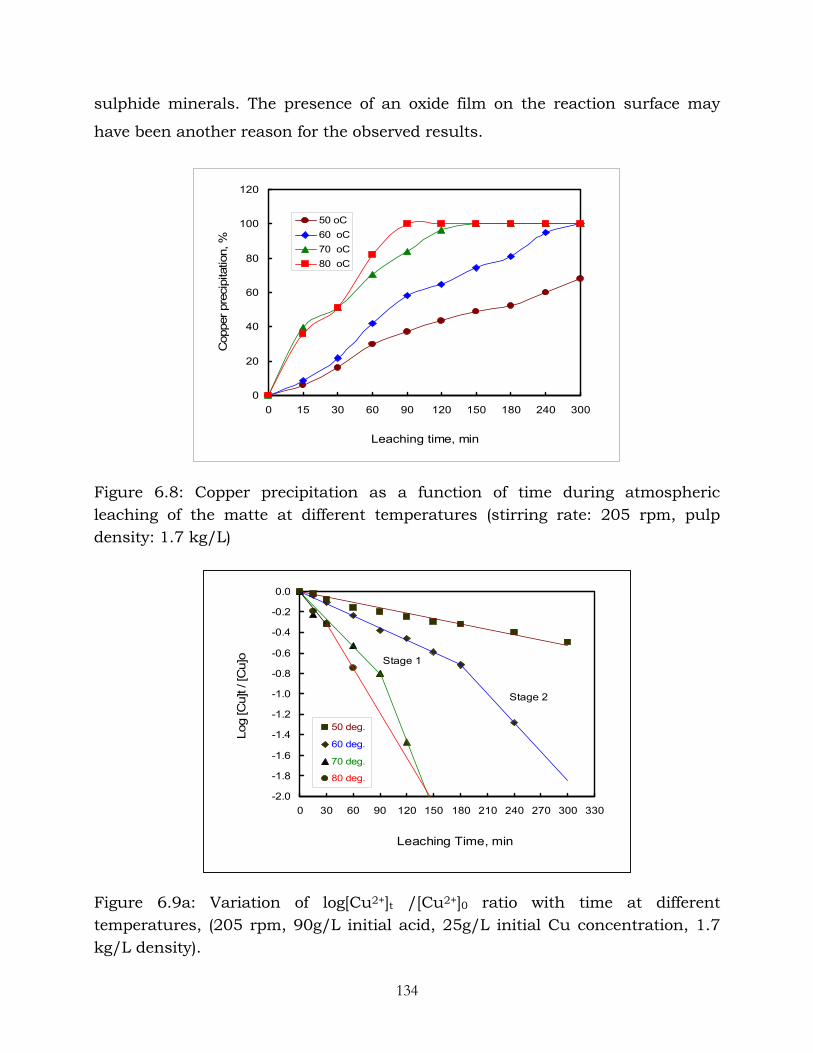
sulphide minerals. The presence of an oxide film on the reaction surface may
have been another reason for the observed results.
0
20
40
60
80
100
120
0 15 30 60 90 120 150 180 240 300
Leaching time, min
Cop
per p
reci
pita
tion,
%50 oC60 oC70 oC80 oC
Figure 6.8: Copper precipitation as a function of time during atmospheric leaching of the matte at different temperatures (stirring rate: 205 rpm, pulp density: 1.7 kg/L)
Figure 6.9a: Variation of log[Cu2+]t /[Cu2+]0 ratio with time at different temperatures, (205 rpm, 90g/L initial acid, 25g/L initial Cu concentration, 1.7 kg/L density).
-2.0
-1.8
-1.6
-1.4
-1.2
-1.0
-0.8
-0.6
-0.4
-0.2
0.0
0 30 60 90 120 150 180 210 240 270 300 330
Leaching Time, min
Log
[Cu]
t / [C
u]o
50 deg.
60 deg.
70 deg.
80 deg.
Stage 1
Stage 2
134

-5.40
-5.30
-5.20
-5.10
-5.00
-4.90
-4.80
-4.70
-4.60
-4.50
2.80 2.85 2.90 2.95 3.00 3.05 3.10 3.15
Temperature (1000/T), K
Log
K, c
m/s
Ea = 18.2 kJ/mol
Ea = 74.6 kJ/mol
25 g/L initial Cu90 g/L initial acid205 rpm1.7 kg/L P.D.
Figure 6.9b: Variation of cementation rate constant (K) with temperature
6.2 Effect of stirring rate on the leaching behaviour of the Ni-Cu
matte
6.2.1 Effect of stirring rate on nickel, cobalt and iron dissolution
To investigate the effect of stirring rate on the leaching behaviour of the matte
experiments were conducted at three different stirring rates, namely 145, 205
and 400 rpm; while keeping the temperature at 60 oC, pulp density at 1.7 kg/L
and residence time of 5 hours. As mentioned in section 6.1.1, the interactions
between the variables were not evaluated as the aim was not to optimise the
process. The results obtained are shown in Table 6.2 and in Figures 6.10 – 6.13.
Detailed information on the calculations of metal concentrations and extractions
are illustrated in Appendix A2. Figure 6.14 is a typical example of results
obtained in the tests that were done in duplicate to check reproducibility of the
results.
The results indicated that nickel dissolution was lower at the stirring rate of 145
rpm; however, it increased gradually when the stirring rate was increased from
135

145 to 205 rpm and then to 400 rpm. The observed increase in nickel dissolution
was accompanied by transformation in the mineral Ni3S2, which transformed to
NiS, implying that more nickel was dissolved at the stirring rates of 205 and 400
rpm than at 145 rpm (see Table 7.2 in section 7.3.2). In the case of cobalt and
iron the extractions were low at 145 rpm and 205rpm but increased when the
stirring rate increased to 400 rpm (Figures 6.11 and 6.12). As in the other
experiments, iron hydrolysed and subsequently precipitated when the pH was
above 3. The fact that nickel dissolution rates were affected by stirring rates
suggested that the leaching of this metal was probably influenced by transport
processes; this was also in agreement with the calculated activation energy of 31
kJ/mol (see section 6.1.1).
The results suggested that the leaching of the metals from the matte did not
entirely depend on the cementation process, but other mechanisms of leaching
such as direct leaching with H2SO4 also played an important role (see chapter 5).
Otherwise the rate of metal dissolution would not have increased when the
stirring rate was increased from 205 rpm to 400 rpm, as the rate of cementation
process was found to be independent of the stirring rate (see section 6.2.2).
Table 6.2: Ni, Co, and Fe extractions and final metal concentrations of the solution after atmospheric leaching of the matte at different stirring rates
Metal extraction (%)
Final solution concentration (g/L) Stirring rate
rpm)
Ni Co Fe * Ni Co Fe Cu
145
205
400
12.3
16.9
19.2
30.1
28.7
36.6
69.4
70.4
85.5
74.4
85.8
102.1
1.1
1.0
1.2
4.2
4.3
3.5
1.0
0.0
0.0
*The value shows maximum extraction attained prior to Fe precipitation. Leaching conditions: temperature: 60 oC, pulp density: 1.7kg/L, residence time: 5 hours
136

0
5
10
15
20
25
0 30 60 90 120 150 180 210 240 270 300 330
Leaching time, min
Ni e
xtra
ctio
n, %
145 rpm
205 rpm
400 rpm
Figure 6.10: Nickel extraction as a function of leaching time at different stirring rate (Temperature: 60 oC, pulp density: 1.7kg/L )
0
5
10
15
20
25
30
35
40
0 30 60 90 120 150 180 210 240 270 300 330
Leaching time, min
Co
extra
ctio
n, %
145 rpm
205 rpm
400 rpm
Figure 6.11: Cobalt extraction as a function of leaching time at different stirring rate (Temperature: 60 oC, pulp density: 1.7kg/L )
137

0
10
20
30
40
50
60
70
80
90
0 30 60 90 120 150 180 210 240 270 300
Leaching time, min
Fe e
xtra
ctio
n, %
145 rpm
205 rpm
400 rpm
Figure 6.12: Iron extraction as a function of leaching time at different stirring rate (Temperature: 60 oC, pulp density: 1.7kg/L )
0
10
20
30
40
50
60
70
80
90
100
Ni Co Fe
Metal
Met
al e
xtra
ctio
n, %
145 rpm
205 rpm
400 rpm
Figure 6.13: Metal extractions after atmospheric leaching of the matte at different stirring rates
138

0
20
40
60
80
100
0 15 30 60 90 120 150 180 240 300
Leaching Time, min
Met
al e
xtra
ctio
n, %
Test 2 - Co
Test 2 - Fe
Test 2 - Ni
Test 1 - Co
Test 1 - Fe
Test 1 - Ni
Figure 6.14: Comparison of metal extractions between two tests conducted at a stirring rate of 400 rpm (temperature: 60 oC, pulp density: 1.7kg/L ).
6.2.2 Effect of stirring rate on copper cementation
The effect of stirring rate on copper cementation is illustrated in Figures 6.15 –
6.17. It can be seen that the rate of cementation of the aqueous copper was not
affected by variations in the stirring rates. Figure 6.15 shows percent copper
precipitation as a function of time. It can be seen that at all three stirring rates
employed (145, 205 and 400 rpm) the rate of copper cementation was similar,
with complete copper precipitation achieved after 5 hours of leaching at 205 and
400 rpm. The fact that the rate of copper cementation did not vary with varying
stirring rates suggests that the copper cementation process is probably
chemically controlled as discussed later. This implies that two different process
controlling mechanisms are operative during the Ni-Cu matte pre-leaching
process; i.e. the metal leaching process is diffusion controlled while the copper
cementation process is chemically controlled.
139

The effect of stirring rate on copper cementation is presented in Figures 6.16 and
6.17. Figure 6.16 shows a graph of log[Cu2+]t /[Cu2+]0 versus time for the
investigated stirring rates, while Figure 6.17 is a plot of cementation rate
constants as a function of stirring rates. The rate constants were derived from
the slopes of plots in Figure 6.16. It can be seen that there was no increase in the
cementation rate constant with increase in stirring rate. This result, together
with the calculated activation energy of 74.6 kJ/mol (see Figure 6.9b), indicated
that the rate of cementation was probably chemical reaction controlled under the
employed leaching conditions. Nadkarni et al. (1967) reported similar results
from a kinetic study of copper precipitation on iron.
0
20
40
60
80
100
120
0 15 30 60 90 120 150 180 240 300
Leaching time, min
Cop
per p
reci
pita
tion,
%
145 rpm205 rpm400 rpm
Figure 6.15: Copper precipitation as a function of time during atmospheric leaching of the matte at different stirring rates (temperature: 60 oC, pulp density: 1.7 kg/L)
140

-2.0
-1.8
-1.6
-1.4
-1.2
-1.0
-0.8
-0.6
-0.4
-0.2
0.0
0 30 60 90 120 150 180 210 240 270 300 330
Leaching Time, min
Log
[Cu]
t / [C
u] o
145 rpm
205 rpm
400 rpm
Figure 6.16: Variation of log[Cu 2+]t /[Cu 2+]0 ratio with time at different stirring rates, (90g/L initial acid, 25g/L initial Cu concentration, 60 oC, 1.7 kg/L density).
0.000
0.002
0.004
0.006
0.008
0.010
0.012
0.014
50 100 150 200 250 300 350 400 450
Stirring rate, rpm
K X
10 -3
, cm
/s
25 g/L initial Cu60 oC90 g/L initial acid1.7 kg/L P.D.
Figure 6.17: Variation of cementation rate constant (K) with stirring rate.
141
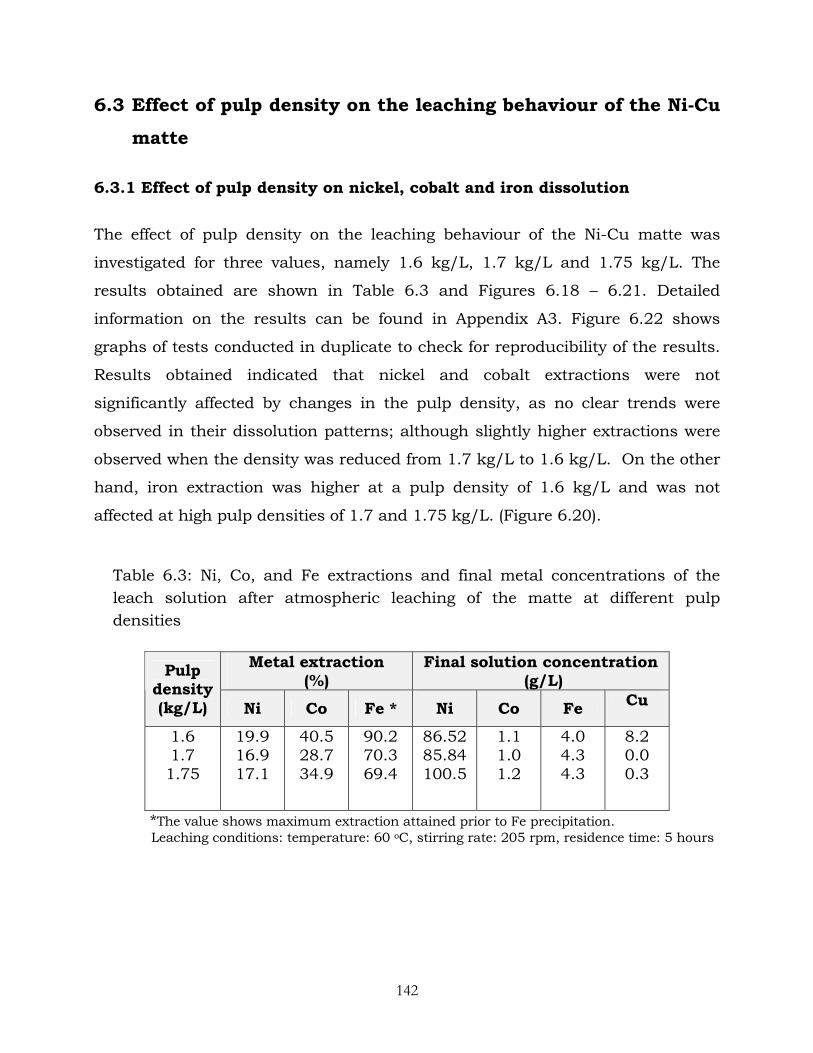
6.3 Effect of pulp density on the leaching behaviour of the Ni-Cu
matte
6.3.1 Effect of pulp density on nickel, cobalt and iron dissolution
The effect of pulp density on the leaching behaviour of the Ni-Cu matte was
investigated for three values, namely 1.6 kg/L, 1.7 kg/L and 1.75 kg/L. The
results obtained are shown in Table 6.3 and Figures 6.18 – 6.21. Detailed
information on the results can be found in Appendix A3. Figure 6.22 shows
graphs of tests conducted in duplicate to check for reproducibility of the results.
Results obtained indicated that nickel and cobalt extractions were not
significantly affected by changes in the pulp density, as no clear trends were
observed in their dissolution patterns; although slightly higher extractions were
observed when the density was reduced from 1.7 kg/L to 1.6 kg/L. On the other
hand, iron extraction was higher at a pulp density of 1.6 kg/L and was not
affected at high pulp densities of 1.7 and 1.75 kg/L. (Figure 6.20).
Table 6.3: Ni, Co, and Fe extractions and final metal concentrations of the leach solution after atmospheric leaching of the matte at different pulp densities
Metal extraction (%)
Final solution concentration (g/L) Pulp
density (kg/L) Ni Co Fe * Ni Co Fe Cu
1.6 1.7 1.75
19.9 16.9 17.1
40.5 28.7 34.9
90.2 70.3 69.4
86.52 85.84 100.5
1.1 1.0 1.2
4.0 4.3 4.3
8.2 0.0 0.3
*The value shows maximum extraction attained prior to Fe precipitation. Leaching conditions: temperature: 60 oC, stirring rate: 205 rpm, residence time: 5 hours
142

0
5
10
15
20
25
0 30 60 90 120 150 180 210 240 270 300
Leaching time, min
Ni e
xtra
ctio
n, %
1.6 kg/L
1.7 kg/L
1.75 kg/L
Figure 6.18: Nickel extraction as a function of leaching time at different pulp
densities of matte (stirring rate: 205 rpm, temp. 60 oC ).
0
5
10
15
20
25
30
35
40
45
0 30 60 90 120 150 180 210 240 270 300
Leaching time, min
Co
extra
ctio
n, %
1.6 kg/L
1.7 kg/L
1.75 kg/L
Figure 6.19: Cobalt extraction as a function of leaching time at different pulp
densities of matte (stirring rate: 205 rpm, temp. 60 o C ).
143

01020
3040506070
8090
100
0 30 60 90 120 150 180 210 240 270 300
Leaching time, min
Fe e
xtra
ctio
n, %
1.6 kg/L
1.70 kg/L
1.75 kg/L
Figure 6.20: Iron extraction as a function of leaching time at different pulp
densities of matte (stirring rate: 205 rpm, temp. 60 o C ).
0102030405060708090
100
Ni Co Fe
Metal
Met
al e
xtra
ctio
n, %
1.6 kg/L
1.7 kg/L
1.75 kg/L
Figure 6.21: metal extractions after atmospheric leaching of the matte at different pulp densities.
144

0
10
20
30
40
50
60
70
80
0 15 30 60 90 120 150 180 240 300
Leaching Time, min
Met
al e
xtra
ctio
n, %
Test 2 - Co
Test 2 - Fe
Test 2 - Ni
Test 1 - Co
Test 1 - Ni
Test 1 - Fe
Figure 6.22: Comparison of metal extractions between two tests conducted at a pulp density of 1.7 kg/L (stirring rate: 205 rpm, temperature: 60 oC )
6.3.2 Effect of pulp density on copper cementation
The effect of variation in pulp density of the reaction mixture on copper
cementation is illustrated in Figures 6.23 - 6.25. Figure 6.23 illustrates percent
copper precipitation versus leaching time. The results indicated that copper
precipitated faster at pulp densities above 1.6 kg/L, with complete copper
precipitation achieved after 5 hours of leaching for pulp densities of 1.7 and 1.75
kg/L.
Figure 6.24 is a plot of log[Cu2+]t /[Cu2+]0 versus leaching time. From the slopes
of the graphs copper cementation rate constants were obtained, as explained
earlier, and these were plotted as a function of pulp density (Figure 6.25). It can
be seen from Figure 6.25 that the cementation rate constant increased as the
pulp density increased from 1.6 to 1.7 kg/L and reached a maximum value at
145

about 1.7 kg/L. Above the pulp density of 1.7 kg/L copper cementation did not
appear to be influenced by further increase in the pulp density. The increase in
the rate of copper cementation when the pulp density was increased from 1.6 to
1.7 kg/L may be attributed to the increase in cathodic surface area of matte on
which copper cementation takes place. At high pulp density values greater than
1.7kg/L low mass-transfer rates of reactants and products caused by the
increase in the quantity of matte in the reaction mixture were probably
responsible for slowing down the cementation process. The result indicates that
pulp densities of above 1.6 kg/L are desirable in the pre-leach stage as the
subsequent pressure leaching stage requires less dissolved copper. In the
commercial plant the pulp density is kept at about 1.7 kg/L.
0
20
40
60
80
100
120
0 15 30 60 90 120 150 180 240 300
Leaching time, min
Cop
per p
reci
pita
tion,
%
1.6 kg/L
1.7 kg/L
1.75 kg/L
Figure 6.23: Copper precipitation as a function of time during atmospheric leaching of the matte at different pulp densities (stirring rate: 205 rpm, temperature: 60 oC )
146

-2.0
-1.8
-1.6
-1.4
-1.2
-1.0
-0.8
-0.6
-0.4
-0.2
0.0
0 30 60 90 120 150 180 210 240 270 300 330
Leaching Time, min
Log
[Cu]
t / [C
u]o
1.6 kg/l
1.7 kg/l
1.75 kg/l
Figure 6.24: Variation of log[Cu 2+]t /[Cu 2+]0 ratio with time at different pulp density values, (205 rpm, 90g/l initial acid, 60 oC, 25g/l initial Cu concentration).
0.000
0.002
0.004
0.006
0.008
0.010
0.012
0.014
1.55 1.6 1.65 1.7 1.75 1.8
Pulp density, kg/L
K X
10
-3, c
m/s
25 g/L initial Cu60 oC205 rpm90 g/L initial acid
Figure 6.25: Variation of cementation rate constant (K) with pulp density of reaction mixture.
147

6.4 Effect of particle size on the leaching behaviour of the Ni-Cu
matte
6.4.1 Effect of particle size on nickel, cobalt and iron dissolution
Results of leaching experiments conducted to investigate the influence of matte
particle size on the leaching characteristics of the matte are shown in Table 6.4
and Figures 6.26 – 6.29. Three particle size fractions were investigated (–
300+150 µm, -106+45µm, and -45 µm ) at the temperature of 60 oC, stirring rate
of 205 rpm and pulp density of 1.7 kg/L. Figure 6.30 serves to show
reproducibility of the results. The results indicated that nickel extraction was not
significantly affected by changes in the particle size, only a slight increase in the
leaching rate was observed for the –45 µm size fraction (Figure 6.26). This
indicates that in all the three particle sizes, the nickel alloy was liberated and
hence exposed to the leaching solution. The leaching behaviour of cobalt was
similar to that of nickel, although in this case the cobalt extractions for the –45
µm and -106+45µm size fractions were substantially higher than that of the
300+150 µm size fraction (Figure 6.27). The leaching behaviour of iron could not
be determined accurately because of iron precipitation when the solution pH
increased to above 3; this was especially so for smaller size fractions. It should be
noted that small size fractions tend to have faster reaction kinetics due to the
larger surface area of small particles that is exposed to the leaching solution.
148

Table 6.4: Ni, Co, and Fe extractions and final metal concentrations of the solution after atmospheric leaching of the matte at different particle sizes
Metal extraction (%)
Final solution concentration (g/L) Particle
Size (µm) Ni Co Fe * Ni Co Fe Cu
-300+150
-106+45
-45
16.4
17.0
18.7
31.8
39.3
41.0
87.1
76.7
75.8
91.6
94.7
101.8
1.1
1.31
1.35
5.1
4.5
4.5
10.4
0.0
0.0
*The value shows maximum extraction attained prior to Fe precipitation. Leaching conditions: temperature: 60 oC, stirring rate: 205 rpm, pulp density: 1.7kg/L, residence time: 5 hours.
0
2
4
6
8
10
12
14
16
18
20
0 30 60 90 120 150 180 210 240 270 300
Leaching time, min
Ni e
xtra
ctio
n, %
-45 microns
-106+45 microns
-300+150 microns
Figure 6.26: Nickel extraction as a function of leaching time at different particle sizes (temperature: 60 oC, stirring rate: 205 rpm, pulp density: 1.7 kg/L ).
149

0
5
10
15
20
25
30
35
40
45
0 30 60 90 120 150 180 210 240 270 300
Leaching time, min
Co
extra
ctio
n, %
-45 microns
-106+45 microns
-300+150 microns
Figure 6.27: Cobalt extraction as a function of leaching time at different particle
sizes (Temperature: 60 oC, stirring rate: 205 rpm, pulp density: 1.7 kg/L )
0
10
20
30
40
50
60
70
80
90
100
0 30 60 90 120 150 180 210 240 270 300
Leaching time, min
Fe e
xtra
ctio
n, %
-45 microns
-106+45 microns
-300+150 microns
Figure 6.28: Iron extraction as a function of leaching time at different particle
sizes (temperature: 60 oC, stirring rate: 205 rpm, pulp density: 1.7 kg/L ).
150

0102030405060708090
100
Ni Co Fe
Metal
Met
al e
xtra
ctio
n, %
-45 microns
-106+45 microns
-300+150 microns
Figure 6.29: Metal extractions after atmospheric leaching of the matte at different particle sizes.
0
10
20
30
40
50
60
70
80
90
0 15 30 60 90 120 150 180 240 300
Leaching Time, min
Met
al e
xtra
ctio
n, %
Test 2 - Co
Test 2 - Fe
Test 2 - Ni
Test 1 - Co
Test 1 - Fe
Test 1 - Ni
Figure 6.30: Comparison of metal extractions between two tests conducted at a particle size of –45 microns (stirring rate: 205 rpm, temp.: 60 oC, pulp density: 1.7 kg/L)
151

6.4.2 Effect of particle size on copper cementation
The effect of matte particle size on copper cementation is illustrated in Figures
6.31 - 6.33. Figure 6.31 shows percent copper precipitation versus time. It can
be seen that the rate of copper cementation increased with decreasing particle
size. At particle sizes of -45µm and -106+45 µm, all the aqueous copper was
precipitated, whereas with the –300+150 µm particle size about 42% Cu
precipitated after 5 hours of leaching. As noted with the metal dissolution rate,
the faster rate of copper cementation observed with the finer size fractions was
attributed to the increase in the surface area of fine particles.
Figure 6.31: Copper precipitation as a function of time during atmospheric leaching of the matte at different particle sizes (stirring rate: 205 rpm, temperature: 60 oC, pulp density:1.7 kg/L).
152

Figures 6.32 and 6.33 illustrate the influence of matte particle size on the
kinetics of copper cementation. The rate of copper cementation decreased with
increasing particle size as illustrated in Figure 6.33, which shows a graph of
cementation rate constants versus matte particle size. The copper cementation
rate constants were obtained from Figure 6.32 using the same method as
explained in the previous sections. It was found that the rate of cementation was
more sensitive to particle size in the last period of the cementation reaction for
the finer size fractions (-45 µm and –106+45 µm), as shown in Figure 6.32. This
was probably due to the changes in the matte particle morphology and lattice
structure, which opened up and exposed more Ni surface area to the solution.
The morphology and structure of the cemented particles may also have an effect
on the rate of cementation.
-2.0
-1.8
-1.6
-1.4
-1.2
-1.0
-0.8
-0.6
-0.4
-0.2
0.0
0 30 60 90 120 150 180 210 240 270 300 330
Leaching Time, min
Log
[Cu]
t / [C
u]o
-45 micron
-106+45 micron
-300+150 micron
Figure 6.32: Variation of log[Cu 2+]t /[Cu 2+]0 ratio with time at different matte particle sizes, (205 rpm, 90 g/L initial acid, 25 g/L initial Cu concentration, 60 oC, 1.7 kg/L density).
153

0.000
0.005
0.010
0.015
0.020
0.025
- 45 - 106 + 45 - 300 + 150
Particle size, microns
K X
10-3
, cm
/s
25 g/L initial Cu90 g/Ll initial acid60 oC205 rpm1.7 kg/l P.D.
Figure 6.33: Variation of cementation rate constant (K) with matte particle size
distribution.
6.5 Effect of initial copper concentration on the leaching
behaviour of the Ni-Cu matte
6.5.1 Effect of initial copper concentration on nickel, cobalt and iron
dissolution
Effect of initial copper concentration on the leaching behaviour of the Ni-Cu
matte was investigated at initial copper concentrations of 25, 36 and 48 g/L,
temperature of 60 oC, stirring rate of 205 rpm and pulp density of 1.7 kg/L.
Results of metal dissolution are shown in Table 6.5 and Figures 6.34 – 6.37.
Detailed data are presented in Appendix A5. Figures 6.34 – 6.36 indicate that
generally the leaching of the metals did not depend on initial copper
concentrations in the investigated copper concentration range of 25 - 48 g/L. The
rate of leaching as well as the degree of leaching was not significantly different for
the three copper concentrations, as can be seen from Figues 6.34 – 6.36. This
154

implies that copper concentration of the spent electrolyte does not have
significant influence on the leaching of metals that occurs in the pre-leaching
stage.
Table 6.5: Ni, Co and Fe extractions and final metal concentrations of the solution after atmospheric leaching of the matte at different initial copper concentrations.
Metal extraction (%)
Final solution concentration (g/L) Copper
(g/L) Ni Co Fe * Ni Co Fe Cu
25 36 48
16.9 17.5 16.3
28.7 35.0 33.6
70.4 76.3 69.4
85.8 97.7 93.0
1.0 1.2 1.2
4.3 4.5 4.2
0.0 12.1 20.1
*The value shows maximum extraction attained prior to Fe precipitation. Leaching conditions: temperature: 60 oC, stirring rate: 205 rpm, pulp density: 1.7kg/L, residence time: 5 hours.
02468
101214161820
0 30 60 90 120 150 180 210 240 270 300
Leaching time, min
Ni e
xtra
ctio
n, %
25 g/L Cu
36 g/L Cu
48 g/L Cu
Figure 6.34: Nickel extraction as a function of leaching time at different initial copper concentrations (temperature: 60 oC, stirring rate: 205 rpm, pulp density: 1.7 kg/L ).
155

0
5
10
15
20
25
30
35
40
0 30 60 90 120 150 180 210 240 270 300
Leaching time, min
Co
extra
ctio
n, %
25 g/L Cu
36 g/L Cu
48 g/L Cu
Figure 6.35: Cobalt extraction as a function of leaching time at different initial copper concentrations (Temperature: 60 oC, stirring rate: 205 rpm,pulp density: 1.7 kg/L )
0
10
20
30
40
50
60
70
80
90
0 30 60 90 120 150 180 210 240 270 300
Leaching time, min
Fe e
xtra
ctio
n, %
25 g/L Cu
36 g/L Cu
48 g/L Cu
Figure 6.36: Iron extraction as a function of leaching time at different initial copper concentration (temperature: 60 oC, stirring rate: 205 rpm, pulp density: 1.7 kg/L ).
156

0102030405060708090
100
Ni Co Fe
Metal
Met
al e
xtra
ctio
n, %
25 g/L Cu
36 g/L Cu
48 g/L Cu
Figure 6.37: Overall metal extractions after atmospheric leaching of the matte at different initial copper concentrations (temperature: 60 oC, stirring rate: 205 rpm, pulp density: 1.7 kg/L ).
6.5.2 Effect of initial copper concentration on copper cementation
The effect of varying the initial copper concentration of solution on the kinetics of
copper cementation onto suspended particles of the matte was investigated at
three different values, namely 25, 36 and 48 g/L Cu. The other variables were
kept constant. The results obtained are depicted in Figures 6.38 - 6.40. Figure
6.38 shows percent copper precipitation as a function of leaching time. The
results have shown that the rate as well as the degree of copper cementation was
higher for the experiment conducted with lower initial copper concentrations (25
g/L). However, both the rate and degree of copper cementation decreased when
the initial copper concentration increased to 36 g/L.
Figure 6.39 shows the first order kinetic plot of log ([Cu 2+]t/[Cu 2+]0) vs time, and
Figure 6.40 presents a plot of rate constants as a function of the initial copper
concentration. The values of the cementation rate constant (K) were determined
157

from the slopes of the plots in Figure 6.39. The cementation rate constant was
found to decrease with increasing copper ion concentration until a value of about
36 g/L was reached, and then the rate constant became almost independent of
the initial copper ion concentration (Figure 6.40). MacKinnon and Ingraham
(1970) observed similar results for cementation of copper on rotating aluminium
disc. The decrease in the cementation rate has been attributed to the following
factors:
changes of activity brought about by the increase in copper ion
concentration,
the rise in solution viscosity, and
the decrease in the diffusivity of copper ions as a result of the increase of
initial copper concentration in solution.
0
20
40
60
80
100
120
0 15 30 60 90 120 150 180 240 300
Leaching time, min
Cop
per p
reci
pita
tion,
%
25 g/L
36 g/L
48 g/L
Figure 6.38: Copper precipitation as a function of time during atmospheric leaching of the matte at different initial copper concentrations (stirring rate: 205 rpm, temperature: 60 oC ).
158

-2.0
-1.8
-1.6
-1.4
-1.2
-1.0
-0.8
-0.6
-0.4
-0.2
0.0
0 30 60 90 120 150 180 210 240 270 300 330
Leaching Time, min
Log
[Cu]
t / [C
u]o
25 g/l Cu
36 g/l Cu
48 g/l Cu
25a g/l
Figure 6.39: Variation of log[Cu 2+]t /[Cu 2+]0 ratio with time at different initial Cu
concentrations, (205 rpm, 90 g/L initial acid, 60 oC, 1.7 kg/L density).
0.000
0.002
0.004
0.006
0.008
0.010
0.012
0.014
20 25 30 35 40 45 50
Copper Concentration, g/L
K X
10 -3
, cm
/s
90 g/L initial acid205 rpm60 oC1.7 kg/L P.D.
Figure 6.40: Variation of cementation rate constant (K) with initial Cu
concentration.
159

6.6 Effect of initial acid concentration on the leaching behaviour
of the Ni-Cu matte
6.6.1 Effect of initial acid concentration on nickel, cobalt and iron
dissolution
Results of experiments conducted to investigate the effect of initial H2SO4
concentration on the dissolution behaviour of nickel cobalt and iron are
presented in Table 6.6 and Figures 6.41 – 6.44. More data on the experiments
and results are given in Appendix A6. The results indicate that variations in the
initial acid concentration did not have effect on nickel extraction as no changes
in the nickel extractions were observed (Figure 6.41). The observed leaching
behaviour of nickel can probably be attributed to the fact that most of the nickel
was leached by the process of cementation. Dissolution of the nickel by direct
attack by acid was probably most prominent when the aquoues copper
precipitated, as noted in section 5.2.2. On the other hand, cobalt and iron
extractions were affected by variations in the initial acid concentration as shown
in Figures 6.42 and 6.43, respectively. The rate of extraction of both metals
increased when the acid increased from 90 g/L to 110 g/L. However, further
increase in the initial acid concentration had no effect on both cobalt and iron
extraction.
The observed leaching behaviour of cobalt and iron may be attributed to the fact
that when the acid concentration was increased, the rate of leaching by acid
(reactions 5.7 - 5.13) increased due to increased strength of the acid. However,
when the acid strength was increased further metal dissolution did not increase
further probably because almost all the metal that could be leached under the
applied conditions had been dissolved.
160

Table 6.6: Ni, Co, and Fe extractions and final metal concentrations of the solution after atmospheric leaching of the matte at different initial H2SO4
concentrations.
Metal extraction (%)
Final solution concentration (g/L) H2SO4
(g/L) Ni Co Fe * Ni Co Fe Cu
90 110 125
16.9 17.17 17.55
28.7 34.8 36.2
70.4 86.5 89.9
85.84 96.39 98.05
1.01 1.18 1.22
4.34 5.04 5.22
0.0 2.57 1.93
*The value shows maximum extraction attained prior to Fe precipitation. Leaching conditions: temperature: 60 oC, stirring rate: 205 rpm, pulp density: 1.7kg/L, residence time: 5 hours.
02468
101214161820
0 30 60 90 120 150 180 210 240 270 300 330
Leaching time, min
Ni e
xtra
ctio
n, %
90 g/L H2SO4
110 g/L H2SO4
125 g/L H2SO4
Figure 6.41: Nickel extraction as a function of leaching time at different initial
H2SO4 concentrations (temperature: 60 oC, stirring rate: 205 rpm, pulp density:
1.7 kg/L ).
161

0
5
10
15
20
25
30
35
40
0 30 60 90 120 150 180 210 240 270 300 330
Leaching time, min
Co
extra
ctio
n, %
90 g/L H2SO4
110 g/L H2SO4
125 g/L H2SO4
Figure 6.42: Cobalt extraction as a function of leaching time at different initial H2SO4 concentrations (Temperature: 60 oC, pulp density: 1.7 kg/L )
0
10
20
30
40
5060
70
80
90
100
0 30 60 90 120 150 180 210 240 270 300
Leaching time, min
Fe e
xtra
ctio
n, %
90 g/L H2SO4
110 g/L H2SO4
125 g/L H2SO4
Figure 6.43: Iron extraction as a function of leaching time at different initial H2SO4 concentration (temperature: 60 oC, stirring rate: 205 rpm, pulp density: 1.7 kg/L ).
162

0
10
20
30
40
50
60
70
80
90
100
Ni Co Fe
Metal
Met
al e
xtra
ctio
n, %
90 g/L H2SO4
110 g/L H2SO4
125 g/L H2SO4
Figure 6.44: Metal extractions after atmospheric leaching of the matte at different initial H2SO4 concentrations 6.6.2 Effect of initial acid concentration on copper cementation
The effect of initial H2SO4 concentrations of the solution on the cementation of
copper during the leaching of the Ni-Cu matte is illustrated in Figures 6.45 –
6.47. Figure 6.45 shows percent copper precipitation versus time, while Figure
6.46 is a plot of log ([Cu 2+]t/[Cu 2+]0) versus time. From the slopes of these
graphs copper cementation rate constants were obtained and plotted as a
function of H2SO4 concentration (Figure 6.47). It can be seen that the rate of
copper cementation decreased slightly when acid was increased from 90 to 110
g/L, then the rate became insensitive to the initial acid concentration. At 90g/L
H2SO4 all the copper was precipitated from the solution. The decrease in the rate
of copper cementation when the acid concentration was increased to 110 g/L
may be attributed to redissolution of some of the precipitated copper due to
increase in the acidity of the solution. Figure 6.47 shows that beyond acid
concentration of about 110g/L the rate constants did not vary with acid
strength, probably because the rate of copper cementation was almost the same
as the rate of copper redissolution.
163

0
20
40
60
80
100
120
0 15 30 60 90 120 150 180 240 300
Leaching time, min
Cop
per p
reci
pita
tion,
%
90 g/L acid
110 g/L acid
125 g/L acid
Figure 6.45: Copper precipitation as a function of time during atmospheric leaching of the matte at different initial H2SO4 concentrations (stirring rate: 205 rpm, temperature: 60 oC )
-2.00
-1.80
-1.60
-1.40
-1.20
-1.00
-0.80
-0.60
-0.40
-0.20
0.00
0 30 60 90 120 150 180 210 240 270 300
Leaching Time, min
Log
[Cu]
t / [C
u]o
90 g/L acid
110 g/L acid
125 g/L acid
Figure 6.46 Variation of log[Cu 2+]t /[Cu 2+]0 ratio with time at different initial acid strength, (205 rpm, 25 g/L initial Cu concentration, 60 oC, 1.7 kg/L density).
164

0.000
0.002
0.004
0.006
0.008
0.010
0.012
0.014
80 90 100 110 120 130
H2SO4 Concentration, g/L
K x
10
-3 (
cm
/s)
25 g/Linitial Cu 2+
60 oC205 rpm1.7g/L P.D.
Figure 6.47: Variation of cementation rate constant (K) with initial acid strength.
6.7 Effect of residence time on the leaching behaviour of the Ni-
Cu matte
6.7.1 Effect of residence time on nickel, cobalt and iron dissolution
To investigate the effect of residence time on the dissolution of nickel, cobalt and
iron as well as copper cementation, the matte was leached for longer residence
times of 7 and 9 hours; as opposed to a leaching time of 5 hours that was
employed in the other experiments. The results obtained are presented in Table
6.7 and graphically illustrated in Figures 6.48 – 6.51 (see also Appendix A7). The
results show that nickel extraction did not increase with increasing residence
time for leaching times of more than 5 hrs, as no increase in the extractions was
observed when the residence time was increased from 5 to 9 hours. Figure 6.48
shows that the degree of nickel extraction was similar for the residence times of 7
and 9 hours, and Figure 6.49 shows that the degree of cobalt dissolution was
165

also similar at the investigated residence times of 7 and 9 hours. The same
leaching behaviour was observed for iron (Figure 6.50).
The observed leaching behaviour of the matte for different residence times
indicated that a leaching time of 5 hours was enough to dissolve almost all the
leachable metals under the applied conditions. It was also noted that for leaching
times of more than 3 hrs, the mineral Ni3S2 was transformed to NiS indicating
that the times were enough to dissolve most of the leacheable nickel.
6.7.2: Effect of residence time on copper cementation
Results obtained have shown that the aqueous copper was completely
precipitated after 5 hours of leaching. For residence times of less than 5 hours,
the copper did not precipitate completely, as can be seen from Tables A7.1 and
A7.3 in Appendix A7.
Table 6.7: Ni, Co, and Fe extractions and final metal concentrations of the leach solution after atmospheric leaching of the matte for 5, 7 and 9 hours.
Metal extraction (%)
Final solution concentration
(g/L) Time ( hrs )
Ni Co Fe * Ni Co Fe Cu
5 7 9
16. 9 20.5 20.5
28.7 29.1 29.7
70. 4 69.3 67.6
85.8 106.9 105.0
1.0 0.8 0.9
4.3 4.1 3.9
0.00 0.00 0.00
*The value shows maximum extraction attained prior to Fe precipitation. Leaching conditions: stirring rate: temperature: 60 oC, 205 rpm, pulp density: 1.7kg/L,
166

0
5
10
15
20
25
0 60 120 180 240 300 360 420 480 540
Leaching time, min
Ni e
xtra
ctio
n, %
7 hrs
9 hrs
Figure 6.48: Nickel extraction as a function of leaching time at residence times of 7 and 9 hrs (temperature: 60 oC, stirring rate: 205 rpm, pulp density: 1.7 kg/L ).
0
5
10
15
20
25
30
35
0 60 120 180 240 300 360 420 480 540
Leaching time, min
Co
extra
ctio
n, %
7 hrs
9 hrs
Figure 6.49: Cobalt extraction as a function of leaching time at residence times of 7 and 9 hours (Temperature: 60 oC, 205 rpm, pulp density: 1.7 kg/L )
167
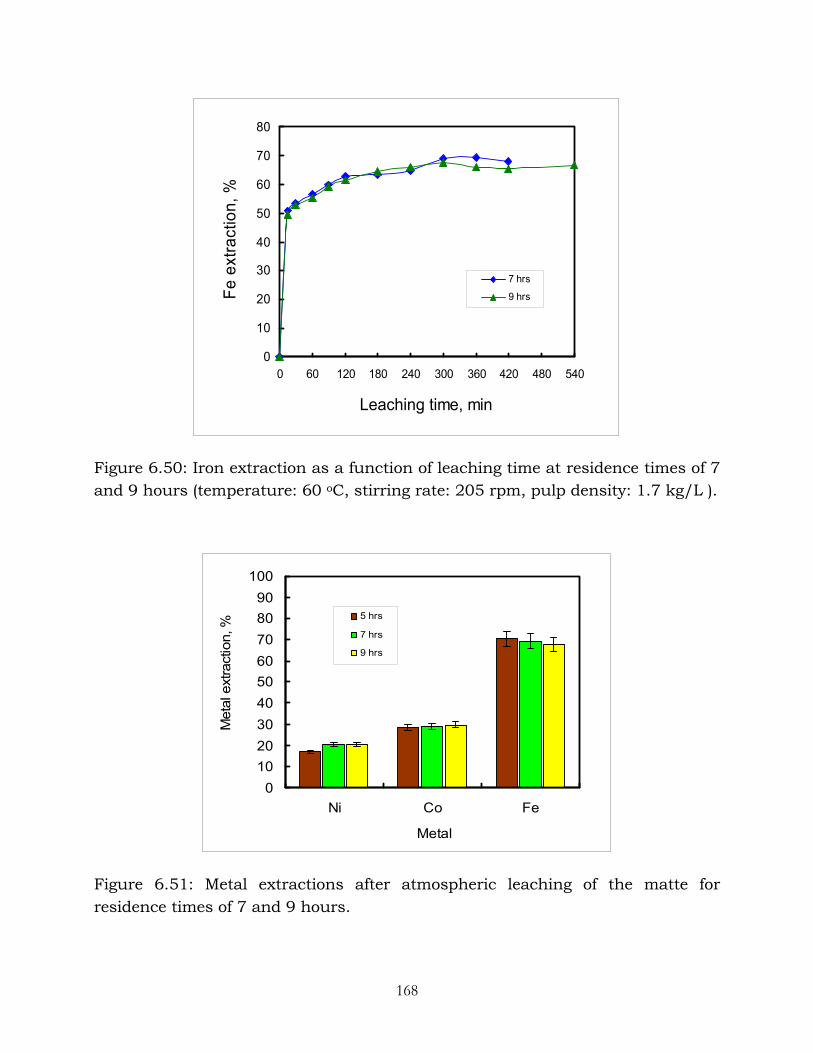
0
10
20
30
40
50
60
70
80
0 60 120 180 240 300 360 420 480 540
Leaching time, min
Fe e
xtra
ctio
n, %
7 hrs
9 hrs
Figure 6.50: Iron extraction as a function of leaching time at residence times of 7 and 9 hours (temperature: 60 oC, stirring rate: 205 rpm, pulp density: 1.7 kg/L ).
0102030405060708090
100
Ni Co Fe
Metal
Met
al e
xtra
ctio
n, %
5 hrs
7 hrs
9 hrs
Figure 6.51: Metal extractions after atmospheric leaching of the matte for residence times of 7 and 9 hours.
168
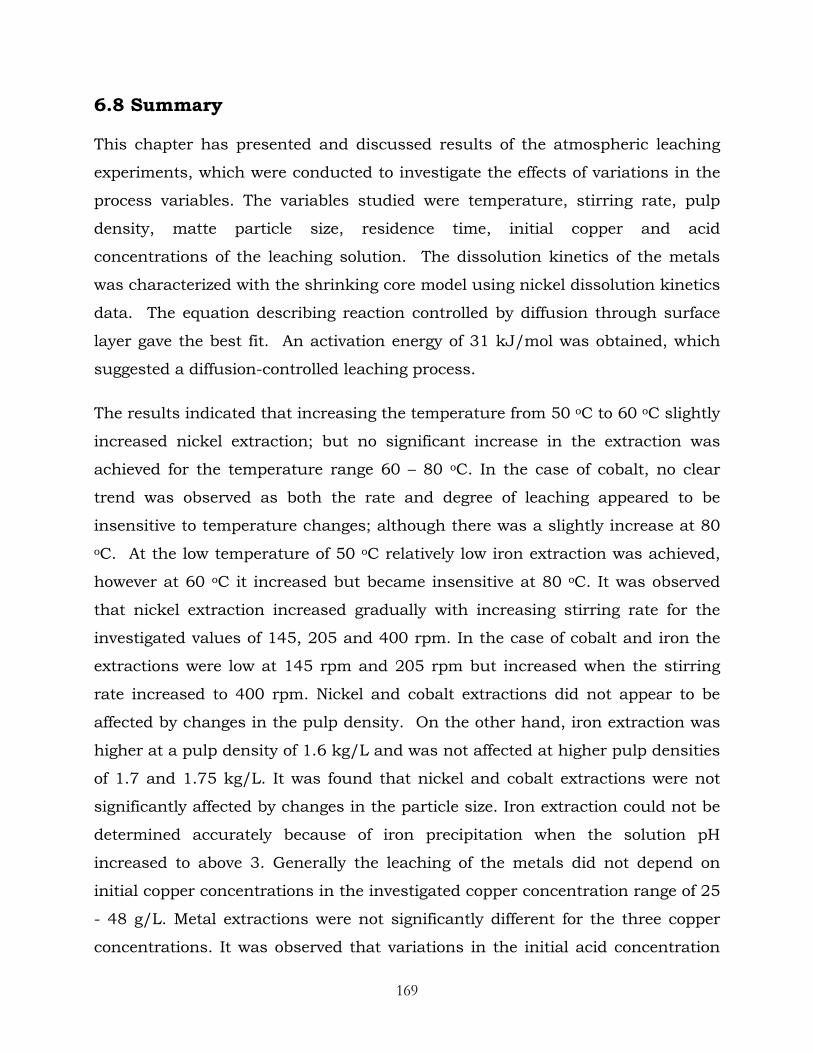
6.8 Summary
This chapter has presented and discussed results of the atmospheric leaching
experiments, which were conducted to investigate the effects of variations in the
process variables. The variables studied were temperature, stirring rate, pulp
density, matte particle size, residence time, initial copper and acid
concentrations of the leaching solution. The dissolution kinetics of the metals
was characterized with the shrinking core model using nickel dissolution kinetics
data. The equation describing reaction controlled by diffusion through surface
layer gave the best fit. An activation energy of 31 kJ/mol was obtained, which
suggested a diffusion-controlled leaching process.
The results indicated that increasing the temperature from 50 oC to 60 oC slightly
increased nickel extraction; but no significant increase in the extraction was
achieved for the temperature range 60 – 80 oC. In the case of cobalt, no clear
trend was observed as both the rate and degree of leaching appeared to be
insensitive to temperature changes; although there was a slightly increase at 80 oC. At the low temperature of 50 oC relatively low iron extraction was achieved,
however at 60 oC it increased but became insensitive at 80 oC. It was observed
that nickel extraction increased gradually with increasing stirring rate for the
investigated values of 145, 205 and 400 rpm. In the case of cobalt and iron the
extractions were low at 145 rpm and 205 rpm but increased when the stirring
rate increased to 400 rpm. Nickel and cobalt extractions did not appear to be
affected by changes in the pulp density. On the other hand, iron extraction was
higher at a pulp density of 1.6 kg/L and was not affected at higher pulp densities
of 1.7 and 1.75 kg/L. It was found that nickel and cobalt extractions were not
significantly affected by changes in the particle size. Iron extraction could not be
determined accurately because of iron precipitation when the solution pH
increased to above 3. Generally the leaching of the metals did not depend on
initial copper concentrations in the investigated copper concentration range of 25
- 48 g/L. Metal extractions were not significantly different for the three copper
concentrations. It was observed that variations in the initial acid concentration
169

did not have effect on nickel extraction, probably due to the fact that most of the
nickel was leached by the process of cementation. However, cobalt and iron
extractions increased when the acid increased from 90 g/L to 110 g/L, although
further increase in the initial acid concentration had no effect on both cobalt and
iron extraction. A residence time of 5 hours was found to be adequate as there
was no significant increase in metal extractions when the residence time was
increased beyond 5 hours.
The rate of copper cementation increased with increasing temperature. At 80 oC
all the aqueous copper precipitated, whereas about 68% precipitated at 50 oC.
The cementation reaction followed a mixed control mechanism, with two distinct
activation energies namely 18.2 kJ/mol at 70 – 80 oC and 74.6 kJ/mol at 50 –
70 oC. This suggested that the rate of cementation reaction was probably
controlled by a boundary layer diffusion mechanism at higher temperatures, and
a surface reaction mechanism at low temperatures. The rate of copper
cementation was not affected by variations in the stirring rate, suggesting a
chemical reaction controlled process as indicated by the activation energy (74.6
kJ/mol). It was noted that copper precipitated faster as the pulp density
increased from 1.6 to 1.7 kg/L and reached a maximum value at about 1.7
kg/L, probably due to the increase in cathodic surface area of matte. It was
observed also that copper cementation increased with decreasing particles size,
probably due to the increase in the surface area of fine particles. The effect of
initial copper concentration of the leaching solution was that the rate of copper
cementation decreased with increase in the initial copper concentration, until a
value of about 36 g/L was reached. Thereafter it became almost independent of
the initial copper concentration. It was found that copper cementation decreased
with increase in the initial acid concentration up to a value of 110 g/L H2SO4,
then it become almost insensitive to the acid concentration of the solution. The
results showed that all the aqueous copper precipitated within 5 hours of
leaching.
170
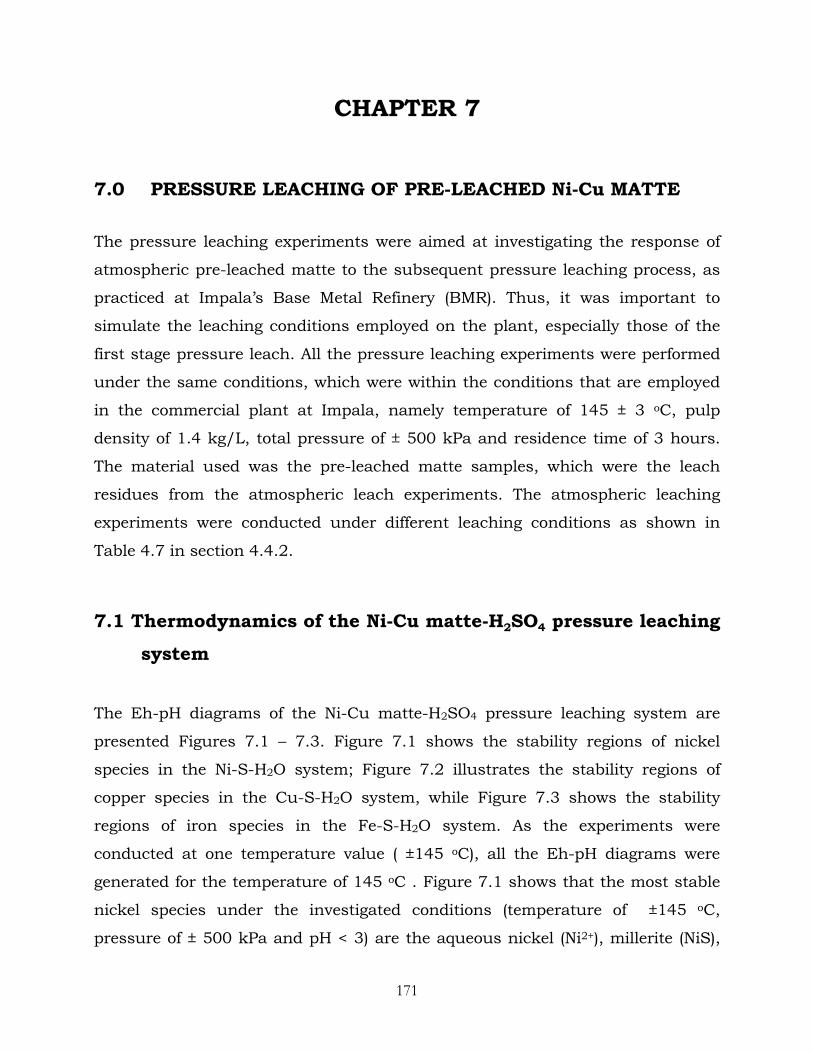
CHAPTER 7
7.0 PRESSURE LEACHING OF PRE-LEACHED Ni-Cu MATTE
The pressure leaching experiments were aimed at investigating the response of
atmospheric pre-leached matte to the subsequent pressure leaching process, as
practiced at Impala’s Base Metal Refinery (BMR). Thus, it was important to
simulate the leaching conditions employed on the plant, especially those of the
first stage pressure leach. All the pressure leaching experiments were performed
under the same conditions, which were within the conditions that are employed
in the commercial plant at Impala, namely temperature of 145 ± 3 oC, pulp
density of 1.4 kg/L, total pressure of ± 500 kPa and residence time of 3 hours.
The material used was the pre-leached matte samples, which were the leach
residues from the atmospheric leach experiments. The atmospheric leaching
experiments were conducted under different leaching conditions as shown in
Table 4.7 in section 4.4.2.
7.1 Thermodynamics of the Ni-Cu matte-H2SO4 pressure leaching
system
The Eh-pH diagrams of the Ni-Cu matte-H2SO4 pressure leaching system are
presented Figures 7.1 – 7.3. Figure 7.1 shows the stability regions of nickel
species in the Ni-S-H2O system; Figure 7.2 illustrates the stability regions of
copper species in the Cu-S-H2O system, while Figure 7.3 shows the stability
regions of iron species in the Fe-S-H2O system. As the experiments were
conducted at one temperature value ( ±145 oC), all the Eh-pH diagrams were
generated for the temperature of 145 oC . Figure 7.1 shows that the most stable
nickel species under the investigated conditions (temperature of ±145 oC,
pressure of ± 500 kPa and pH < 3) are the aqueous nickel (Ni2+), millerite (NiS),
171

heazlewoodite (Ni3S2) and metallic nickel (Nio), depending on the potential of the
system. Under oxidizing conditions (potential of more than zero) nickel can be
leached from the matte. Figure 7.1 shows also that at pH values of greater than 4
and a potential of above zero, aqueous nickel can form NiO. At higher potential
values (above 1.0 V) and pH of above 1.0 aqueous nickel can hydrolyse to form
Ni(OH)3. It should be noted that species such Ni2+, NiS and Ni3S2 were observed
in the leaching system under study, as predicted in Figure 7.1.
Figure 7.2 shows stability regions of the copper species in the system Cu-S-H2O.
The most stable species in the investigated pH values of less than 3 are aqueous
copper (Cu2+) Cu2S, CuS and metallic copper, depending on the potential of the
system. However, no CuS was observed in the leach solids, probably due to the
fact that very small amounts were formed and the pH of the system was never
less than zero as CuS is shown to form at pH of less than zero (Figure 7.2).
Figure 7.2 shows also that at pH >3 and potential greater than 0.5V, aqueous
copper can form basic copper sulphate (Cu3(OH)4SO4. However, no Cu3(OH)4SO4
was observed in the leaching system, probably due to the fact that all the
aqueous copper precipitated before a pH of 3 was attained (Appendix B). Figure 7.3 shows that the possible iron species in the system investigated are
aqueous ferric iron (Fe3+), ferrous iron (Fe2+), metallic iron (Fe), and iron oxides
(Fe2O3 and Fe3O4 ). In the system under study, no iron compounds were detected
in the leach solids by XRD and SEM-EDS, probably due to the small amount of
iron present in the matte (0.6 %) and in the leaching solution (0.67g/L).
172

Figure 7.1: Eh-pH diagrams for the Ni-S-H2O system at 145 oC and 5 bar pressure; [Ni] = 2.00 M, [S] = 2.00 M (M = molality)
Figure 7.2: Eh-pH diagrams for the Cu-S-H2O system at 145 oC and 5 bar pressure; [Cu] = 1.50 M, [S] = 2.00 M (M = molality)
173
Figure 7.3: Eh-pH diagrams for the Fe-S-H2O system at 145 oC and 5 bar pressure; [Fe] = 0.50 M, [S] = 2.00 M (M = molality)
14121086420-2-4-6
2.0
1.5
1.0
0.5
0.0
-0.5
-1.0
-1.5
-2.0
Fe - Cu - Ni - S - H2O - System at 145.00 C
C pH
Eh (Volts)
Fe
Fe3O4
Cu2O*Fe2O3
Fe2O3
Fe2O3
Fe(+2a)
Fe(+3a)
7.2 Mechanism of pressure leaching of Ni-Cu matte
Although some pressure leaching experiments were conducted to investigate the
response of pre-leached matte to the subsequent pressure leaching operations,
no detailed study of the pressure leaching process has been done in the present
study. This is because the main aim of the present study was to investigate the
atmospheric leaching process, and not the pressure leaching process. Hence, the
mechanism of Ni-Cu matte pressure leaching process was not investigated in
detail in the present study. Pressure leaching mechanism of the Ni-Cu matte has
been studied and published by many researchers, of which include the work of
Rademan et al. (1999), who carried out an extensive study of the pressure
leaching operation at Impala Base Metals Refinery (BMR). Plasket and
Romanchuk (1978) also published the Ni-Cu refining process at Impala’s BMR.
Among the other workers who have investigated pressure leaching of the Ni-Cu
174

matte are Dutrizac and Chen (1987), Hofirek and Kerfoot (1992), Hofirek and
Nofal (1995), and Steenekamp and Dunn (1999). According to Rademan (1995)
the leaching mechanism for the acid-oxygen pressure leaching of Ni-Cu matte
entails the following leaching sequences: the nickel sulphides leach from
heazlewoodite (Ni3S2) to millerite (NiS), with godlevskite (Ni7S6) forming as an
intermediate product. The millerite leaches further to form polydymite (Ni3S4)
before it is completely leached. The mechanism for leaching the copper sulphides
is slightly more complex with chalcocite (Cu2S) being leached and formed in the
beginning of the process. The chalcocite is then leached to form digenite (Cu1.8S),
with djurleite (Cu31S16) forming as an intermediate product. The digenite leaches
further to form covellite (CuS), which is subsequently dissolved. The nickel in the
alloy phase leaches out of the matte within the first 40 minutes and no mineral
changes were detected in the alloy phase.
7.3 Results and discussion of Pressure Leaching Experiments
7.3.1 Effect of pre-leaching the matte at different temperatures
Results of pressure leaching experiments that were conducted to investigate the
effect of pre-leaching the matte at different temperatures prior to the subsequent
pressure leach stage are presented in Table 7.1 and Figures 7.4 – 7.6. The
starting time, which is indicated as -25 minutes, on the horizontal axis of these
graphs and all other metal extraction graphs in this chapter represents the 25
minutes of slurry heating time. The pressure leaching process was considered to
have started at the point when the desired temperature was attained and O2
added to the reactor, i.e 25 minutes after commencement of the experiment. The
results are also presented in more detail in Appendix B. Table 7.1 shows results
of the atmospheric and the pressure leaching stages for the investigated
temperatures. It was found that the leaching behaviour was similar for the matte
pre-leached at 50, 60 and 80 oC as similar leaching rates were observed during
the pressure leaching stage.
175

Table 7.1: Metal extractions from matte pre-leached at temperatures of 50, 60 and 80 oC, and minerals present in the leach solids.
Extraction (%) and minerals in leach solids
Leaching stage
50 oC 60 oC 80 oC Pre-leach 13 17 20 Pres. Leach 64 67 66
Nickel
Overall 69 73 72 Pre-leach 28 29 35 Pres. Leach 100 100 100
Cobalt
Overall 100 100 100 Pre-leach 46 70 66 Pres. Leach 100 100 100
Iron
Overall 100 100 100
Pre-leach stage (Atm. Leach)
Ni3S2, Cu1.96S, Cu2S,
Ni alloy
Ni3S2, NiS, Cu1.96S, Cu2S,
Ni alloy
Ni3S2, NiS, Cu1.96S, Cu2S,
Ni alloy
Mineral in leach solids
Pressure leach stage
Ni3S2, NiS, Cu1.8S, Cu2S
Ni3S2, NiS, Cu1.8S, Cu2S
Ni3S2, NiS, Cu1.8S, Cu2S
• Pre-leach conditions: Pulp density 1.7 kg/L; stirring 205 rpm; residence time 5 hrs • Pressure leach conditions: temp 145 oC; pulp density 1.4 kg/L; stirring 900 rpm;
residence time 3 hrs; total pressure 500 kPa
It is understood that for matte pre-leached at 60 and 80 oC heazlewoodite (Ni3S2)
transformed into millerite (NiS), which was easier to leach in the subsequent
pressure leach stage, hence higher metal extractions would be expected.
However, because of the conditions prevailing in the pressure leaching stage, all
the nickel minerals appeared to be leached at the same rate regardless of the
temperature at which the matte was pre-leached. The advantage that would be
gained in pre-leaching the matte at a higher temperature would be that it would
take less time to pressure leach nickel as more Ni3S2 would have transformed
into NiS in the pre-leach stage.
The nickel alloy present in the pre-leached matte is leached within 90 minutes of
the pressure leach stage (Rademan et al., 1999), and was therefore not present in
176

the final leach residue. The copper minerals (Cu2S and Cu1.96S) transformed into
Cu2S and Cu1.8S, and were not leached under the applied conditions. The
aqueous copper present in the leaching solution precipitated too. It has been
found that, in the system under study, copper starts to leach after a leaching
time of about 3 hours (Rademan, 1995). The sequence of mineral transformation
occurring during the leaching of Ni-Cu matte has been described in sections 5.2
and 7.2. Rademan et al. (1999), Dutrizac and Chen (1987) and Hofirek and
Kerfoot (1992) have presented detailed studies of phases formed during the
leaching of Ni-Cu matte.
It was found that pre-leaching of the matte at different temperature values prior
to pressure leaching did not have any effect on cobalt and iron extractions as
both cobalt and iron were completely leached in the pressure leach stage. Figures
7.5 and 7.6 show the rates of cobalt and iron extractions, respectively. It can be
seen that the rate of metal extraction was also independent of temperature at
which the matte was pre-leached prior to pressure leaching.
0102030405060708090
100
-25 0 15 30 60 90 120 150 180
Leaching time, min
Ni e
xtra
ctio
n, %
Preleach temp: 50 oC
preleach temp: 60 oC
preleach temp: 80 oC
Figure 7.4: Ni extraction from matte pre-leached at different temperatures versus leaching time (Leaching conditions as in Table 7.1, starting time indicated as -25 minutes represents the 25 minutes of slurry heating time)
177

0
20
40
60
80
100
120
-25 0 15 30 60 90 120 150 180
Leaching time, min
Co
extra
ctio
n, %
50 oc
60 oC
80 oC
Figure 7.5: Cobalt extraction from matte pre-leached at different temperatures versus leaching time (Leaching conditions as in Table 7.1, starting time indicated as -25 minutes represents the 25 minutes of slurry heating time)
0
20
40
60
80
100
120
-25 0 15 30 60 90 120 150 180
Leaching time, min
Fe e
xtra
ctio
n, %
50 oC
60 oC
80 oC
Figure 7.6: Iron extraction from matte pre-leached at different temperatures versus leaching time (Leaching conditions as in Table 7.1, starting time indicated as -25 minutes represents the 25 minutes of slurry heating time)
178
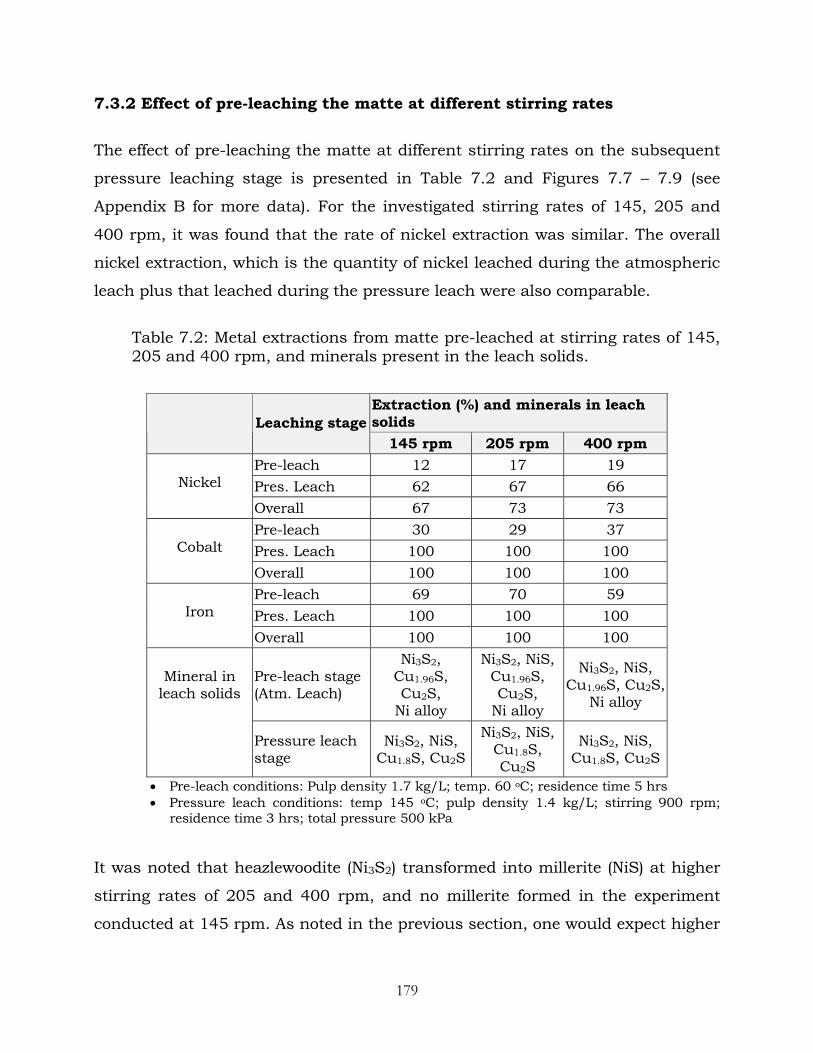
7.3.2 Effect of pre-leaching the matte at different stirring rates
The effect of pre-leaching the matte at different stirring rates on the subsequent
pressure leaching stage is presented in Table 7.2 and Figures 7.7 – 7.9 (see
Appendix B for more data). For the investigated stirring rates of 145, 205 and
400 rpm, it was found that the rate of nickel extraction was similar. The overall
nickel extraction, which is the quantity of nickel leached during the atmospheric
leach plus that leached during the pressure leach were also comparable.
Table 7.2: Metal extractions from matte pre-leached at stirring rates of 145, 205 and 400 rpm, and minerals present in the leach solids.
Extraction (%) and minerals in leach solids
Leaching stage
145 rpm 205 rpm 400 rpm Pre-leach 12 17 19 Pres. Leach 62 67 66
Nickel
Overall 67 73 73 Pre-leach 30 29 37 Pres. Leach 100 100 100
Cobalt
Overall 100 100 100 Pre-leach 69 70 59 Pres. Leach 100 100 100
Iron
Overall 100 100 100
Pre-leach stage (Atm. Leach)
Ni3S2, Cu1.96S, Cu2S,
Ni alloy
Ni3S2, NiS, Cu1.96S, Cu2S,
Ni alloy
Ni3S2, NiS, Cu1.96S, Cu2S,
Ni alloy
Mineral in
leach solids
Pressure leach stage
Ni3S2, NiS, Cu1.8S, Cu2S
Ni3S2, NiS, Cu1.8S, Cu2S
Ni3S2, NiS, Cu1.8S, Cu2S
• Pre-leach conditions: Pulp density 1.7 kg/L; temp. 60 oC; residence time 5 hrs • Pressure leach conditions: temp 145 oC; pulp density 1.4 kg/L; stirring 900 rpm;
residence time 3 hrs; total pressure 500 kPa
It was noted that heazlewoodite (Ni3S2) transformed into millerite (NiS) at higher
stirring rates of 205 and 400 rpm, and no millerite formed in the experiment
conducted at 145 rpm. As noted in the previous section, one would expect higher
179

metal extractions in cases where there was Ni3S2 transformation but because of
more aggressive conditions prevailing in the pressure leaching stage, all the
nickel minerals were leached at about the same rate. Again the advantage of
pre-leaching the matte at higher stirring rates would be that less time would be
needed to pressure leach nickel as more Ni3S2 would have transformed into NiS
in the pre-leach stage.
The nickel alloy and copper mineral leaching characteristics were the same as
noted in the previous section: the alloy leached within 90 minutes of the
pressure leach stage, and the copper minerals (Cu2S and Cu1.96S) transformed
into Cu2S and Cu1.8S with aqueous copper being precipitated. The degree and
rate of cobalt and iron extractions were not affected by the stirring rates of the
matte pre-leach stage, as 100% of cobalt and iron extraction was achieved (Table
7.2). The kinetics of cobalt and iron extractions were also independent of pre-
leach stage stirring rates as illustrated in Figures 7.8 and 7.9, respectively.
0
10
20
30
40
50
60
70
80
-25 0 15 30 60 90 120 150 180
Leaching time, min
Ni e
xtra
ctio
n, %
145 rpm
205 rpm
400 rpm
Figure 7.7: Nickel extraction from matte pre-leached at different stirring rates versus leaching time (Leaching conditions as in Table 7.2, starting time indicated as -25 minutes represents the 25 minutes of slurry heating time)
180

0
20
40
60
80
100
120
-25 0 15 30 60 90 120 150 180
Leaching time, min
Co
extra
ctio
n, %
145 rpm
205 rpm
400 rpm
Figure 7.8: Cobalt extraction from matte pre-leached at different stirring rates versus leaching time (Leaching conditions as in Table 7.2, starting time indicated as -25 minutes represents the 25 minutes of slurry heating time)
0
20
40
60
80
100
120
-25 0 15 30 60 90 120 150 180
Leaching time, min
Fe e
xtra
ctio
n, %
145 rpm
205 rpm
400 rpm
Figure 7.9: Iron extraction from matte pre-leached at different stirring rates versus leaching time (Leaching conditions as in Table 7.2, starting time indicated as -25 minutes represents the 25 minutes of slurry heating time)
181

7.3.3 Effect of pre-leaching the matte at different pulp density values
Results of experiments conducted to investigate the influence of pulp density of
the atmospheric leach on the subsequent pressure leaching of the pre-leached
matte are given in Table 7.3 and illustrated in Figures 7.10 – 7.12. More
information is given in Appendix B. It was found that there was no clear trend in
the leaching behaviour of the matte pre-leached at different pulp density values.
The overall nickel extraction, as well as the leaching rates did not seem to be
influenced by the fact that the matte was pre-leached at different pulp densities.
Cobalt and iron extractions were 100% for all the investigated pulp density
values.
Table 7.3: Metal extractions from matte pre-leached at Pulp density values of 1.6, 1.7 and 1.75 kg/L, and minerals present in the leach solids.
Extraction (%) and minerals in leach solids
Leaching stage
1.6 kg/L 1.7 kg/L 1.75 kg/L Pre-leach 20 17 17 Pres. Leach 63 67 65
Nickel
Overall 70 73 71 Pre-leach 41 29 35 Pres. Leach 100 100 100
Cobalt
Overall 100 100 100 Pre-leach 90 70 68 Pres. Leach 100 100 100
Iron
Overall 100 100 100
Pre-leach stage (Atm. Leach)
Ni3S2, NiS, Cu1.96S, Cu2S,
Ni alloy
Ni3S2, NiS, Cu1.96S, Cu2S,
Ni alloy
Ni3S2, NiS, Cu1.96S, Cu2S,
Ni alloy
Mineral in
leach solids
Pressure leach stage
Ni3S2, NiS, Cu1.8S, Cu2S
Ni3S2, NiS, Cu1.8S, Cu2S
Ni3S2, NiS, Cu1.8S, Cu2S
• Pre-leach conditions: Stirring rate: 205 rpm; temp.: 60 oC; residence time: 5 hrs • Pressure leach conditions : temp 145 oC; pulp density 1.4 kg/L; stirring 900 rpm;
residence time 3 hrs; total pressure 500 kPag
182

The observed leaching behaviour of nickel can be attributed to the fact that
nickel extractions as well as Ni3S2 transformation to NiS in the pre-leach stage
were similar. The other contributing factor was the conditions prevailing in the
pressure leaching stage, which allowed all the nickel minerals to be leached at
about the same rate regardless of the pulp density at which the matte was pre-
leached. Table 7.3 shows that at all three pulp density values millerite (NiS) was
formed in the pre-leach stage. This implies that at the investigated pulp densities
nickel leaching time is likely to be similar in the pressure leaching stage. The
leaching behaviour of copper minerals and nickel alloy was the same as noted in
section 7.3.1.
0
10
20
30
40
50
60
70
80
-25 0 15 30 60 90 120 150 180
Leaching time, min
Ni e
xtra
ctio
n, %
1.6 kg/L
1.7 kg/L
1.75 kg/L
Figure 7.10: Nickel extraction from matte pre-leached at different pulp densities versus leaching time (Leaching conditions as in Table 7.3, starting time indicated as -25 minutes represents the 25 minutes of slurry heating time)
183
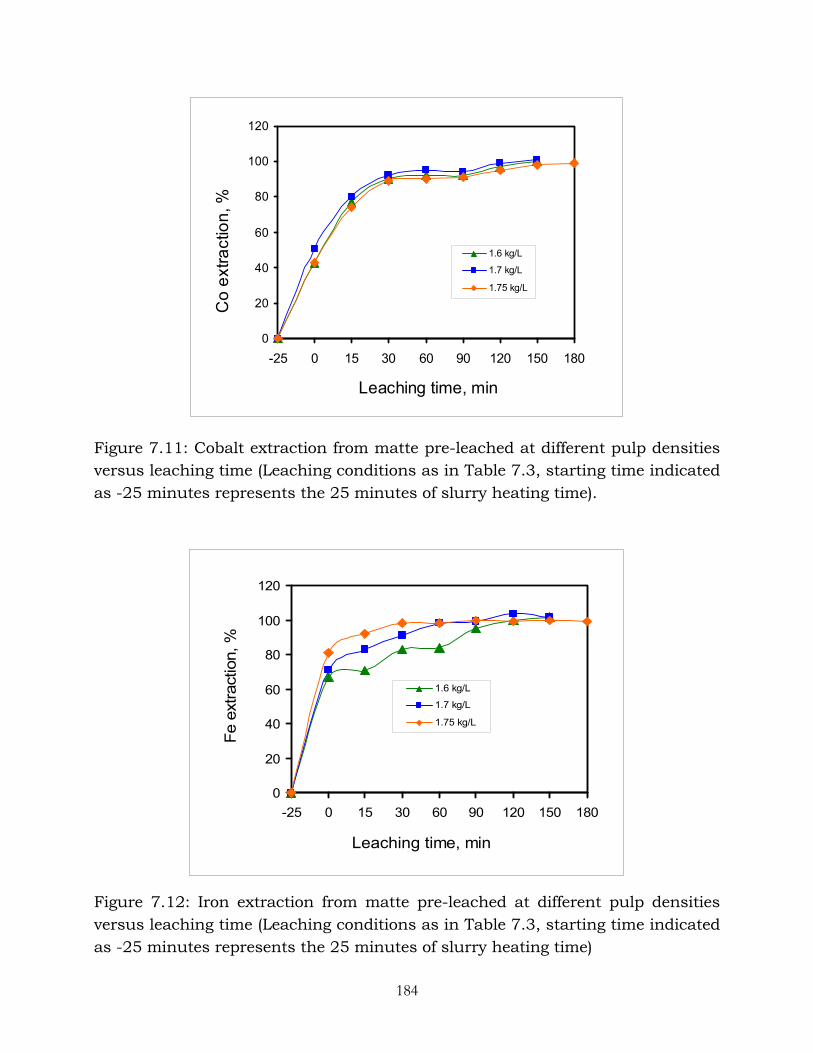
0
20
40
60
80
100
120
-25 0 15 30 60 90 120 150 180
Leaching time, min
Co
extra
ctio
n, %
1.6 kg/L
1.7 kg/L
1.75 kg/L
Figure 7.11: Cobalt extraction from matte pre-leached at different pulp densities versus leaching time (Leaching conditions as in Table 7.3, starting time indicated as -25 minutes represents the 25 minutes of slurry heating time).
0
20
40
60
80
100
120
-25 0 15 30 60 90 120 150 180
Leaching time, min
Fe e
xtra
ctio
n, %
1.6 kg/L
1.7 kg/L
1.75 kg/L
Figure 7.12: Iron extraction from matte pre-leached at different pulp densities versus leaching time (Leaching conditions as in Table 7.3, starting time indicated as -25 minutes represents the 25 minutes of slurry heating time)
184

7.3.4 Effect of pre-leaching the matte at different residence times
Results of experiments conducted to investigate the effect of varying residence
time of the pre-leach stage on the subsequent pressure leaching stage are shown
in Table 7.4 and Figures 7.13 – 7.15 (see Appendix B for more detail). The results
indicated that pre-leaching of the matte at different residence times appeared to
have effect on nickel extraction in the subsequent pressure leaching stage. Table
7.4 shows that the degree of nickel extraction increased with increasing
residence time of the pre-leach stage.
Table 7.4: Metal extractions from matte pre-leached at residence times of 1, 3 and 9 hrs, and minerals present in the leach solids.
Extraction (%) and minerals in leach solids
Leaching stage
1 hr 3 hrs 9 hrs Pre-leach 13 15 21 Pres. Leach 41 57 65
Nickel
Overall 49 64 72 Pre-leach 30 27 30 Pres. Leach 100 100 100
Cobalt
Overall 100 100 100 Pre-leach 67 62 67 Pres. Leach 100 100 100
Iron
Overall 100 100 100
Pre-leach stage (Atm. Leach)
Ni3S2, Cu1.96S, Cu2S,
Ni alloy
Ni3S2, NiS, Cu1.96S, Cu2S,
Ni alloy
Ni3S2, NiS, Cu1.96S, Cu2S,
Ni alloy
Mineral in
leach solids
Pressure leach stage
Ni3S2, NiS, Cu1.8S, Cu2S
Ni3S2, NiS, Cu1.8S, Cu2S
Ni3S2, NiS, Cu1.8S, Cu2S
• Pre-leach conditions: Pulp density 1.7 kg/L; stirring rate 205 rpm; temp. 60 oC; • Pressure leach conditions : temp: 145 oC; pulp density: 1.4 kg/L; stirring rate: 900
rpm; residence time 3 hrs; total pressure 500 kPa
185

The rate of nickel extraction also increased with increasing residence time of the
pre-leach stage, as illustrated in Figure 7.13. The reason for the observed nickel
extraction results could probably be attributed to changes in the mineral phases
of the matte as discussed in the preceding sections. The increase in nickel
extraction when the matte was pre-leached for longer times was probably due to
the presence of more NiS in the pre-leached solids, which is easily leached in the
pressure leach stage. Table 7.4 shows that for a residence time of 1 hour no NiS
was formed.
As discussed in the previous sections copper was never leached in the pressure
leach stage due to shorter leaching time (3 hours). Cobalt and iron leaching
behaviour was same as described in the previous sections. For all the three pre-
leach stage residence times of 1, 3 and 9 hrs, cobalt and iron were completely
leached (100 % extraction).
0
10
20
30
40
50
60
70
-25 0 15 30 60 90 120 150 180
Leaching time, min
Ni e
xtra
ctio
n, %
1 hrs3 hrs9 hrs
Figure 7.13: Nickel extraction from matte pre-leached at different residence times versus leaching time (Leaching conditions as in Table 7.4, starting time indicated as -25 minutes represents the 25 minutes of slurry heating time)
186

0
20
40
60
80
100
120
-25 0 15 30 60 90 120 150 180
Leaching time, min
Co
extra
ctio
n, %
1 hrs3 hrs9 hrs
Figure 7.14: Cobalt extraction from matte pre-leached at different residence times versus leaching time (Leaching conditions as in Table 7.4, starting time indicated as -25 minutes represents the 25 minutes of slurry heating time)
0
20
40
60
80
100
120
-25 0 15 30 60 90 120 150 180
Leaching time, min
Fe e
xtra
ctio
n, %
1 hrs3 hrs9 hrs
Figure 7.15: Iron extraction from matte pre-leached at different residence times versus leaching time (Leaching conditions as in Table 7.4, starting time indicated as -25 minutes represents the 25 minutes of slurry heating time)
187

7.4 Summary
In this chapter, results of the pressure leaching experiments are presented and
discussed. In section 7.1 the thermodynamics of the Ni-Cu-H2SO4 pressure
leaching system has been discussed using the Eh-pH diagrams. The diagrams
showed that the thermodynamically possible stable species in the leaching
system under investigation were Ni2+, Cu2+, NiS, Ni3S2, Cu2S and CuS. However,
Cu2+ easily precipitated, and CuS was not formed in the leaching conditions
employed. In general, the species predicted by the Eh-pH diagrams were in
agreement with what was observed in the leach samples. The results showed
that similar nickel leaching rates were observed for the temperatures of 50, 60
and 80 oC. For matte pre-leached at 60 and 80 oC, Ni3S2 transformed into NiS
which is easier to leach in the pressure leach stage, and no NiS was formed in
the test conducted at 50 oC. However, because of the conditions prevailing in the
pressure leaching stage, nickel was leached at the same rate regardless of the
temperature at which the matte was pre-leached. The rate of nickel extraction
was similar for the investigated stirring rates of 145, 205 and 400 rpm. At the
stirring rates of 205 and 400 rpm, Ni3S2 transformed into NiS. No NiS formed in
the experiment conducted at 145 rpm, though nickel minerals were leached at
about the same rate due to the leaching conditions. Residence time of the pre-
leaching stage had an effect on the nickel extraction in the pressure leaching
stage. The nickel extraction increased with increasing residence time, due to the
changes in the mineral phases of the matte as indicated above. In the case of
pulp density, nickel extraction was comparable for the pulp densitiy range of 1.6
– 1.75 kg/L. This was probably due to the fact that the degree of mineral
transformation in the pre-leach stage was similar. For all three pulp densities the
Ni3S2 transformed to NiS. The copper minerals (Cu2S and Cu1.96S) transformed
into Cu2S and Cu1.8S with aqueous copper being precipitated, and were not
leached under the applied conditions. All the cobalt and iron dissolved in the
pressure leaching stage.
188

CHAPTER 8
8.0 KINETIC MODEL
This chapter presents a semi-empirical kinetic model which was developed on
the basis of the leaching mechanism and chemical reactions presented in
chapter 5. The model makes allowance for variations in the values of the leaching
parameters such as initial copper concentration, temperature, particle size and
initial acid concentration. As stated in chapter 5, under the leaching conditions
employed in this study (where no oxidant was added) the sulphide minerals were
not expected to leach to any significant degree. Therefore, the chemical reactions
considered in the model are those that are most likely to occur to a significant
degree during the leaching process.
8.1 Chemical reaction rates
The chemical reaction rates are presented in terms of the rate of change of the
number of moles of the species in the reaction volume (Levenspiel, 1972 and
Fogler, 1986), according to equation 8.1:
formedAtimevolume
ofreactionmoles
dtdN
Vr A
A ))((1
== (8.1)
dtdN
Vr AA = (8.2)
The actual volume of the reaction mixture decreased slightly during the
experiments as samples were taken out for analysis. However, the volume taken
out was considered insignificant in comparison to that which remained. Thus the
189

reaction volume term in equation 8.2 was taken as a constant, and was absorbed
into the rate constants used in the model.
If we consider a single elementary homogeneous reaction with a stoichiometric
equation given by
A + B → D (8.3)
The rate of disappearance of A is given by:
-rA = KCACB (8.4)
Where K is the reaction rate constant and CA and CB are the concentrations of
species A and B respectively. The negative sign indicates the disappearance of
species A.
Combining equations 8.2 and 8.4, the reaction rate expression takes the form
shown in equation 8.5:
CC BAA K
dtdN
= (8.5)
8.2 Reaction rate expressions
The reactions used in the mathematical model, and any assumptions made in
developing the model are presented below. In chapter 5 it has been stated that
the leaching mechanism can be divided into two categories namely
• Leaching of the matte via the cementation process and
• Leaching of the matte by direct acid attack
The two means of matte leaching occur simultaneously during the early part of
the leaching process when aqueous copper is still present. Therefore, in
190
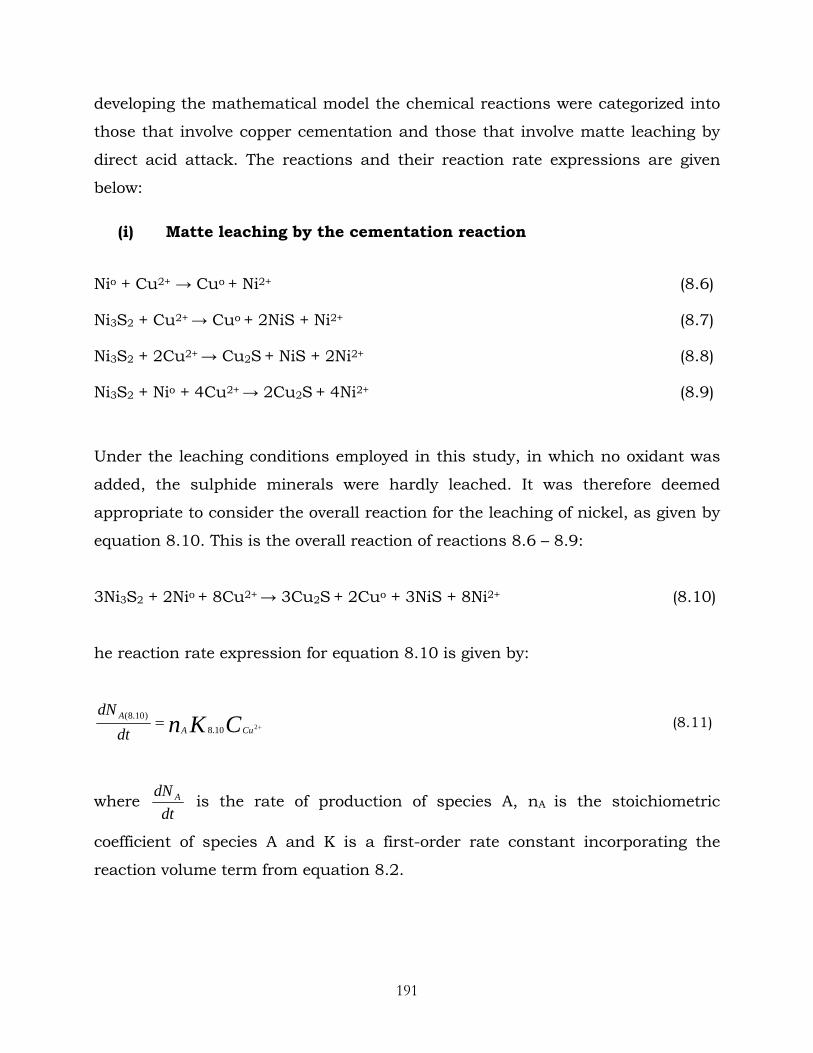
developing the mathematical model the chemical reactions were categorized into
those that involve copper cementation and those that involve matte leaching by
direct acid attack. The reactions and their reaction rate expressions are given
below:
(i) Matte leaching by the cementation reaction
Nio + Cu2+ → Cuo + Ni2+ (8.6)
Ni3S2 + Cu2+ → Cuo + 2NiS + Ni2+ (8.7)
Ni3S2 + 2Cu2+ → Cu2S + NiS + 2Ni2+ (8.8)
Ni3S2 + Nio + 4Cu2+ → 2Cu2S + 4Ni2+ (8.9)
Under the leaching conditions employed in this study, in which no oxidant was
added, the sulphide minerals were hardly leached. It was therefore deemed
appropriate to consider the overall reaction for the leaching of nickel, as given by
equation 8.10. This is the overall reaction of reactions 8.6 – 8.9:
3Ni3S2 + 2Nio + 8Cu2+ → 3Cu2S + 2Cuo + 3NiS + 8Ni2+ (8.10)
he reaction rate expression for equation 8.10 is given by:
CKn CuAA
dtdN
+= 210.8)10.8( (8.11)
where dt
dN A is the rate of production of species A, nA is the stoichiometric
coefficient of species A and K is a first-order rate constant incorporating the
reaction volume term from equation 8.2.
191

Equation 8.11 was used to develop the reaction rate expressions for the
dissolution and formation of various species during the leaching process, as a
result of the cementation process (equations 8.10A – 8.10G).
CkNiCudt
d+=
+
210.8
2
38 (8.10A)
CkCuCudt
d+−=
+
210.8
2
38 (8.10B)
CKNiCu
o
dtd
+−= 210.832 (8.10C)
CKSNiCudt
d+−= 210.8
23 (8.10D)
CKSCuCudt
d+= 210.8
2 (8.10E)
CKSNiCudt
d+= 210.8 (8.10F)
CKCuCu
o
dtd
+= 210.832 (8.10G)
The leaching of iron by the cementation process (equation 8.12) was assumed to
be insignificant due to the presence of the iron alloy as small inclusions
randomely distributed in the matte. The matte had to be attacked by the acid
and penetrated to leach the iron grains embedded in the matte, besides the
quantity of iron in the matte was very small (0.60%). It was therefore assumed
that the iron was leached mainly by the acid according to reaction 8.15.
Feo + Cu2+ = Fe2+ + Cuo (8.12)
192

(ii) Matte leaching by direct acid attack
The nickel alloy was leached by acid according to the following reaction:
Nio + 2H+ + 1/2O2 → Ni2+ + H2O (8.13)
The rate expression for reaction 8.13 is given by equation 8.14:
PCKn OHAA
dtdN
213.8)13.8(
+= (8.14)
where dt
dN A , nA, and K(8.13) are as explained earlier for equation 8.11, CH+ is the
acid concentration and PO2 is the partial pressure of oxygen. But no oxygen was
added to the system, so the O2 partial pressure was taken to be the same as the
atmospheric pressure and was assumed to be constant. Therefore, the oxygen
partial pressure term in all the rate expressions for the dissolution and formation
of species due to leaching by acid has been omitted. The rate expressions for
reaction 8.13 are given by equations 8.13A – 8.13C:
CkNiHdt
d+=
+
13.8
2
(8.13A)
CkHHdt
d+−=
+
13.82 (8.13B)
CkNiH
o
dtd
+−=13.8
(8.13C)
It should be noted that for modelling purposes, reactions of sulphide minerals
with acid have not been considered due to the fact that the acid will mainly
attack metal alloys, especially in this case where no oxidant was added.
The iron alloy present in the matte was leached according to reaction 8.15:
193

Feo + 2H+ + 1/2O2 → Fe2+ + H2O (8.15)
Fe3+ + 3H2O → Fe(OH)3 + 3H+ (8.16)
When the pH of the leaching system rose sufficiently, iron precipitated from the
solution (see Figures 5.7 – 5.9). For modelling purposes, it has been assumed
that the precipitation occurs via equation 8.16. The rate expressions for reaction
8.15 are represented by equations 8.15A – 8.15C, and again the O2 partial
pressure term has been assumed constant.
CkFeHdt
d+=
+
15.8
2
(8.15A)
CkHHdt
d+−=
+
15.82 (8.15B)
CkFeH
o
dtd
+−=15.8
(8.15C)
The rate expressions for equation 8.16 are:
CkFeFedt
d+−=
+
316.8
3
(8.16A)
CkHFedt
d+=
+
316.83 (8.16B)
CkOHFe
Fedt
d+= 316.8
3)( (8.16C)
It was noted that any iron present as FeS would not have leached to a significant
degree under the conditions employed in this study.
194

The cobalt alloy was leached according to reaction 8.17:
Co + 2H+ + 1/2O2 → Co2+ + H2O (8.17)
The reaction rate expressions for equation 8.17 are given below. As stated ealier,
the oxygen partial pressure was constant (atmospheric pressure) and hence it
was absorbed into the rate constant, K8.17.
CkCoHdt
d+=
+
17.8
2
(8.17A)
CkHHdt
d+−=
+
17.82 (8.17B)
CkCoH
o
dtd
+−=17.8
(8.17C)
8.3 Reaction rate constants
The empirical rate constants K8.10, K8.13, K8.15, K8.16 and K8.17 were estimated and
fine tuned to provide the best possible fit to the experimental data. A set of
constants that enabled the model to accurately simulate the experimental data is
presented in Table 8.1. The reaction rate constants incorporate expressions that
can predict effect of variations in temperature, particle size, initial acid and
copper concentrations. The leaching rate constants also incorporate a term for
the shrinking core leaching effect. This is because the Ni alloy occurs as small
inclusions randomly distributed in the matte particles. Hence, pores have to form
for the leaching solution to reach the Ni alloy particles. In general the reaction
rate constants are of the form:
Ki = AsKH+/Cu+ KT,j Z (8.18)
195

Where Ki is the reaction rate constant for reaction (i).
The terms in the reaction rate constant expression represent the following:
As is the surface area factor that accounts for the effect of variation in the
effective surface area of the matte particles (Rademan, 1995).
K H+/Cu+ is the reaction rate constant that accounts for the effect of initial acid or
copper concentration.
KT,i is the term that accounts for the effect of variations in the temperature. The
effect of temperature is represented by the Arrhenius law, and may be written as:
eAK RTE
iiT
ia ,
,
−
= (8.19)
where A is the frequency factor of reaction (i), R is the gas constant and Ea,i is the
activation energy of the reaction (i).
Z is the term that accounts for the shrinking core leaching effect, and in this
case applies to reactions where Ni alloy leaching takes place. This term is of the
form (Rademan, 1995):
32
)0(
)(
⎟⎟
⎠
⎞
⎜⎜
⎝
⎛=
=NNZ
tNialloy
tNialloy (8.20)
where NNi alloy(t) is the moles of the Ni alloy at time t, and NNi alloy(t=0) is the initial
moles of the alloy in the matte.
196

Table 8.1 Reaction rate constants used in the kinetic model
Reaction rate constant value Process parameter K8.10 K8.13 K8.15 K8.16 K8.17
60 0.298 0.679 0.0881 0.082 0.032 Temp. (oC) 80 1.728 0.979 o.0981 0.082 0.032
205 0.298 0.679 0.0881 0.082 0.032 Stirring rate
(rpm) 400 0.249 3.19 0.1109 2.02 0.032
- 45 1.161 1.409 0.171 0.261 0.035 Particle size (µm) -106+45 0.498 0.976 0.124 0.695 0.035
90 0.298 0.679 0.0881 0.082 0.032 Initial acid (g/L) 125 0.173 1.532 0.086 - 0.024
25 0.298 0.679 0.0881 0.082 0.032 Initial Cu (g/L) 48 0.0867 1.545 0.0881 0.082 0.032
8.4 Combined reaction expressions
The combined reaction rate expressions for the dissolution and formation of
various species during the leaching process are represented by equations 8.21 -
8.31. These rate expressions were solved numerically by the 4th order Rung-
Kutta method using the Excel spread sheet (see Appendix E), after values of the
rate constants K 8.10, K8.13, K8.15, K8.16 and K8.17 were determined.
It should be noted that in the case of iron it was not possible to distinguish
between Fe2+ and Fe3+, hence they have been represented as total Fe
concentration.
CKCkNiHCudt
d++ +=
+
13.810.8
2
238 (8.21)
CkCuCudt
d+−=
+
210.8
2
38 (8.22)
197

CKCkFeFeH
Total
dt
d++ −−= 316.815.8 (8.23)
CkCoHdt
d+=
+
17.8
2
(8.24)
CKCKCKCKHHFeHHdt
d++++ −+−−=
+
17.816.815.813.8 232 32 (8.25)
CKCKNiHCu
o
dtd
++ −−= 13.810.8 232 (8.26)
CKCuCu
o
dtd
+= 210.832 (8.27)
CKSCuCudt
d+= 210.8
2 (8.28)
CKSNiCudt
d+= 210.8 (8.29)
CkFeH
o
dtd
+−=15.8
(8.30)
CkCoH
o
dtd
+−=17.8
(8.31)
8.5 Evaluation of the kinetic model
The kinetic model was evaluated by comparing the model predictions to
experimental data. The model was found to satisfactorily fit the trends in the
leaching of the metals. Due to the fact that in most of the experiments only
198

solution samples were analysed for metal concentrations when determining the
effect of variations in the leaching parameters, the accuracy of the model is
mainly determined by how well its predictions fit the nickel, copper, cobalt, total
iron and acid concentrations in the solution. It was not possible to analyse all the
solid samples because of the difficult inherent in the analysis of large numbers of
solid samples. The accuracy of analysis of solid samples was also a concern as
the matte did not leach to a significant degree under the conditions employed in
this study. Therefore, the rate of decrease and formation of solid species during
the leaching of the matte were not evaluated. However, equations 8.26 – 8.31
could be used to predict the leaching and formation the solid species, since any
ransformation in the mineral phases are caused by the leaching process.
l trend in the leaching behaviour of the
etals, and can be improved upon later.
.6 Summary
e model was found to satisfactorily fit the trends in the leaching of the
metals.
t
A comparison of the model predictions and experimental data for the dissolved
species during the leaching process for different conditions is presented in
Figures 8.1 - 8.7. It can be seen that the kinetic model was able to predict the
leaching of the matte reasonably accurate. However, it should be mentioned that
some of the model graphs could not fit the experimental data well probably due
to the fact that a complex reaction mechanism takes place in the system where
some metals dissolve and others precipitate. It is also understood that the model
is basic and was indented to give a genera
m
8
A semi-empirical kinetic model was developed on the basis of the leaching
mechanism and chemical reactions of the leaching system investigated. The
kinetic model was evaluated by comparing the model predictions to experimental
data. Th
199

0
10
20
30
40
50
60
70
80
90
100
110
0 30 60 90 120 150 180 210 240 270 300 330
Time, min
Ni,
H2S
O4 c
once
ntra
tion,
g/L
0
5
10
15
20
25
30
Cu,
Fe,
Co
conc
entra
tion,
g/L
Ni ExperimentalNi ModelH2SO4 ModelH2SO4 ExperimentalCu ExperimentalCu ModelFe ModelFe ExperimentalCo ModelCo Experimental
Figure 8.1: A comparison of the model predictions and experimental data for species in solution during the leaching of the matte at 60 0C (stirring rate: 205 rpm, pulp density: initial acid: 90 g/L, initial Cu: 25 g/L, Pulp density: 1.7 kg/L, residence time: 5 hours).
0
10
20
30
40
50
60
70
80
90
100
110
0 30 60 90 120 150 180 210 240 270 300 330
Time, min
Ni c
once
ntra
tion,
g/L
0
5
10
15
20
25
30
Cu,
Fe,
Co
conc
entra
tion,
g/L
Ni ExperimentalNi ModelCu ExperimentalCu Model
Fe ModelFe ExperimentalCo ModelCo Experimental
Figure 8.2: A comparison of the model predictions and experimental data for species in solution during the leaching of the matte at 80 0C ( Stirring rate: 205 rpm, initial acid: 90 g/L, initial Cu: 25 g/L, pulp density: 1.7 kg/L, residence time: 5 hours).
200

0
10
20
30
40
50
60
70
80
90
100
110
0 30 60 90 120 150 180 210 240 270 300 330
Time, min
Ni c
once
ntra
tion,
g/L
0
5
10
15
20
25
30
Cu,
Fe,
Co
conc
entra
tion,
g/L
Ni Experimental
Ni ModelCu Experimental
Cu ModelFe ModelFe Experimental
Co ModelCo Experimental
Figure 8.3: A comparison of the model predictions and experimental data for species in solution during the leaching of the matte at – 45 µm particle size (Temp.: 60 oC, stirring rate: 205 rpm, initial acid: 90 g/L, initial Cu: 25 g/L, pulp density: 1.7 kg/L, residence time: 5 hours).
0
10
20
30
40
50
60
70
80
90
100
110
0 30 60 90 120 150 180 210 240 270 300 330
Time, min
Ni c
once
ntra
tion,
g/L
0
5
10
15
20
25
30
Cu,
Fe,
Co
conc
entra
tion,
g/L
Ni Experimental
Ni ModelCu Experimental
Cu ModelFe ModelFe Experimental
Co ModelCo Experimental
Figure 8.4: A comparison of the model predictions and experimental data for species in solution during the leaching of the matte at – 106+45 µm particle size (Temp.: 60 oC, stirring rate: 205 rpm, initial acid: 90 g/L, initial Cu: 25 g/L, pulp density: 1.7 kg/L, residence time: 5 hours).
201

0
10
20
30
40
50
60
70
80
90
100
110
0 30 60 90 120 150 180 210 240 270 300 330
Time, min
Ni c
once
ntra
tion,
g/L
0
5
10
15
20
25
30
Cu,
Fe,
Co
conc
entra
tion,
g/L
Ni ExperimentalNi ModelCu Experimental
Cu ModelFe ModelFe Experimental
Co ModelCo Experimental
Figure 8.5: A comparison of the model predictions and experimental data for species in solution during the leaching of the matte at initial H2SO2 of 125g/L (Temp.: 60 oC, stirring rate: 205 rpm, initial Cu: 25 g/L, pulp density: 1.7 kg/L, residence time: 5 hours).
0
10
20
30
40
50
60
70
80
90
100
110
0 30 60 90 120 150 180 210 240 270 300 330
Time, min
Ni c
once
ntra
tion,
g/L
0
10
20
30
40
50
60
Cu,
Fe,
Co
conc
entra
tion,
g/L
Ni Experimental
Ni ModelCu Experimental
Cu ModelFe ModelFe Experimental
Co ModelCo Experimental
Figure 8.6: A comparison of the model predictions and experimental data for species in solution during the leaching of the matte at initial copper of 48 g/L (Temp.: 60 oC, stirring rate: 205 rpm, initial acid: 90 g/L, initial Cu: 25 g/L, pulp density: 1.7 kg/L, residence time: 5 hours).
202

0
10
20
30
40
50
60
70
80
90
100
110
0 30 60 90 120 150 180 210 240 270 300 330
Time, min
Ni c
once
ntra
tion,
g/L
0
5
10
15
20
25
30
Cu,
Fe,
Co
conc
entra
tion,
g/L
Ni Experimental
Ni ModelCu ExperimentalCu Model
Fe ModelFe Experimental
Co ModelCo Experimental
Figure 8.7: A comparison of the model predictions and experimental data for species in solution during the leaching of the matte at a stirring rate of 400 rpm (Temp.: 60 oC, acid: 90 g/L, initial acid: 90 g/L, initial Cu: 25 g/L, pulp density: 1.7 kg/L, residence time: 5 hours).
203

CHAPTER 9
9.0 CONCLUSIONS AND RECOMMENDATIONS
9.1 Conclusions
1) Atmospheric leaching experiments
Leaching behaviour of nickel-copper matte in H2SO4-CuSO4 solution during
the pre-leaching stage at Impala Base Metals Refinery has been studied to
ascertain effects of variations in the key process variables such as
temperature, stirring speed, particle size, pulp density, residence time, copper
and acid concentrations. The leaching mechanism of the pre-leaching stage
has been determined based on the mineralogical characterization and
chemistry of the process. From the results obtained in the atmospheric
leaching experiments, the following conclusions can be drawn:
1.1) Metal dissolution
• Potential - pH diagrams can be used to predict the thermodynamically
stable species in the Ni-Cu matte-H2SO4 leaching system. The Eh-pH
equilibrium diagrams showed that the possible thermodynamically
stable species, under the investigated conditions (temperature 50 – 80 oC and pH <3) were Ni2+, Cu2+, Nio, Cuo, Ni3S2 and Cu2S. The species
predicted by the Eh-pH diagrams were in agreement with the results
obtained from the analysis of the leach solids and leach solutions.
• The leaching mechanism for the Ni-Cu matte entails dissolution of the
metal alloy out of the matte particles without sulphide mineral
disintegration. The nickel mineral sulphide (heazlewoodite) dissolves to
204
a lesser extent and transforms into millerite (NiS). Aqueous copper
precipitates as metallic copper and as chalcocite.
• It was found that matte leaching occurs by the cementation process as
well as direct attack by the acid. This is especially so in the early stages
when the aqueous copper is still present. After the copper is completely
precipitated, the leaching process occurs by direct reaction of the matte
with the acid. This was supported by the sharp rise in the pH of the
solution after the Cu2+ ions were precipitated.
• It has been postulated that because the Ni-Cu sulphide minerals and
the Ni alloy are in intimate contact in the matte, they form a galvanic
couple in which the Ni alloy has a lower rest potential and thus
dissolve anodically. It is also possible that a galvanic couple between
the copper and nickel sulphide minerals forms. In this case the nickel
sulphide minerals dissolve anodically.
• The leaching kinetics of the matte can be characterized with the
shrinking core model using Ni dissolution kinetics data. The Ni
dissolution kinetics was characterized using the equation describing
reaction controlled by diffusion through surface layer. An activation
energy of 31 kJ/mol was obtained, which also suggested a diffusion
controlled leaching reaction.
• It was found that increasing the temperature from 50 oC to 60 oC
slightly increased nickel extraction; however no significant increase in
nickel extraction was observed for temperatures above 60 oC, probably
because the leaching process is diffusion controlled. The slight increase
in nickel dissolution at higher temperatures (> 60 oC) may be attributed
to the transformation of Ni3S2 to NiS, which is easier to leach. In the
case of cobalt, no clear trend was observed as both the rate and degree
of leaching appeared to be insensitive to temperature changes, only a
slight increased at a higher temperature of 80 oC was noted. Relatively
205

low iron extraction was achieved (< 50 %) at 50 oC, but increased (> 65
%) when the temperature was raised to 60 - 80 oC.
• It was observed that nickel extraction was lower at the stirring rate of
145 rpm but increased gradually when the stirring rate was increased
from 145 to 205 rpm and then to 400 rpm, probably due to increased
mass transfer rate as the leaching process was found to be diffusion
controlled. The leaching process was accompanied by transformation of
Ni3S2 to NiS. In the case of cobalt and iron, the extractions increased
significantly when the stirring rate increased from 145 to 205 - 400
rpm. At high pH of above 3 iron hydrolysed and subsequently
precipitated.
• Nickel and cobalt extractions were not significantly affected by changes
in the pulp density as only a slight increase in the extractions was
observed when the density was reduced from 1.7 – 1.75 kg/L to 1.6
kg/L. On the other hand, iron extraction was higher at a pulp density
of 1.6 kg/L but similar extraction rate was achieved at high pulp
densities of 1.7 and 1.75 kg/L.
• It was found that nickel extraction was not significantly affected by
changes in the particle size, probably because in all the three particle
sizes the nickel alloy was liberated and hence exposed to the leaching
solution. Cobalt extraction was similar to that of nickel, although
cobalt extractions for the –45 µm and -106+45µm size fractions were
relatively higher than that of the 300+150 µm size fraction. Iron
extraction could not be determined accurately because of iron
precipitation when the solution pH increased to above 3.
• Generally the leaching of the metals did not depend on initial copper
concentrations in the investigated copper concentration range of 25 -
48 g/L. The rate of leaching as well as the degree of leaching was not
significantly different for the three copper concentrations.
206

• It was observed that variations in the initial acid concentration did not
have effect on nickel extraction. The observed leaching behaviour of
nickel can probably be attributed to the fact that most of the nickel was
leached by the process of cementation. Dissolution of the nickel by
direct attack by acid was probably most prominent when the aquoues
copper precipitated. However, cobalt and iron extractions increased
when the acid increased from 90 g/L to 110 g/L, although further
increase in the initial acid concentration had no effect on both cobalt
and iron extraction.
• A residence time of 5 hours was found to be adequate as there was no
significant increase in metal extractions when the residence time was
increased beyond 5 hours.
1.2) Copper cementation
The kinetics of copper cementation onto Ni-Cu matte during the pre-
leaching stage is influenced by process variables such as copper
concentration, free acid concentration, temperature, particle size, and
pulp density. Variations in the stirring rates appear to have little or no
effect on the cementation kinetics, under the applied experimental
conditions.
• It was found that the rate of copper cementation increased with
increasing temperature. At 80 oC all the aqueous copper precipitated,
whereas about 68% precipitated at a lower temperature of 50 oC. The
cementation reaction followed a mixed control mechanism, with two
distinct activation energies namely 18.2 kJ/mol at 70 – 80 oC and 74.6
kJ/mol at 50 – 70 oC. This suggested that the rate of cementation
reaction was probably controlled by a boundary layer diffusion
mechanism at higher temperatures. At low temperatures the rate was
probably controlled by a surface reaction mechanism.
207

• The rate of copper cementation is not affected by variations in the
stirring rate, under the investigated conditions, suggesting a chemical
reaction controlled process as indicated by the activation energy (74.6
kJ/mol).
• It was noted that copper cementation increased as the pulp density
increased from 1.6 to 1.7 kg/L and reached a maximum value at about
1.7 kg/L. Above the pulp density of 1.7 kg/L copper cementation did
not appear to be influenced by increase in the pulp density. The
increase in the rate of copper cementation when the pulp density was
increased from 1.6 to 1.7 kg/L may be attributed to the increase in
cathodic surface area of matte on which copper cementation takes
place. At high pulp density values greater than 1.7kg/L low mass-
transfer rates of reactants and products caused by the increase in the
quantity of matte in the reaction mixture were probably responsible for
slowing down the cementation process.
• Copper cementation increased with decreasing particles size, probably
due to the increase in the surface area of fine particles. It was found
that the rate of cementation was more sensitive to particle size in the
last period of the cementation process for the finer size fractions (-45
µm and –106+45 µm). This was probably due to the changes in the
matte particle morphology and lattice structure, which opened up and
exposed more Ni surface area to the solution. The morphology and
structure of the cemented particles may also have had an effect on the
rate of cementation.
• The effect of initial copper concentration of the leaching solution was
that the rate of copper cementation decreased with increase in the
initial copper concentration, until a value of about 36 g/L was reached.
Thereafter it became almost independent of the initial copper
concentration. This behaviour can be attributed to changes in activity
brought about by the increase in copper ion concentration, the rise in
208

solution viscosity and the decrease in the diffusivity of copper ions as a
result of the increase of copper concentration in solution.
• It was found that copper cementation decreased with increase in the
initial acid concentration up to a value of 110 g/L H2SO4, then copper
cementation become almost insensitive to the acid concentration of the
solution. The decrease in the rate of copper cementation with
increasing acidity may be attributed to redissolution of some of the
precipitated copper due to increase in the acidity of the solution.
• Aqueous copper can be precipitated from the leach solution within 90
minutes of the pre-leaching process, if the temperature is raised to 80 oC. However, under the present pre-leaching temperature of about 60 oC complete copper cementation can only be achieved after about 5
hours.
2) Pressure Leaching experiments
The pressure leaching experiments were aimed at investigating the response
of atmospheric pre-leached matte to the subsequent pressure leaching
process, as practiced at Impala’s Base Metal Refinery. Thus, it was important
to simulate the leaching conditions employed on the plant, especially those of
the first stage pressure leach.
• Eh-pH diagrams were used to predict the thermodynamically stable
species in the Ni-Cu matte – H2SO4 leaching system. The diagrams showed
that the possible thermodynamically stable species in the leaching system
under investigation were Ni2+, Cu2+, NiS, Ni3S2, Cu2S and CuS. However,
Cu2+ easily precipitated, and CuS was not formed in the leaching
conditions employed. In general, the species predicted by the Eh-pH
diagrams were in agreement with what was observed in the leach samples.
209

• It was found that nickel leaching behaviour was similar for the matte pre-
leached at 50, 60 and 80 oC as similar leaching rates were observed during
the pressure leaching stage. For matte pre-leached at 60 and 80 oC,
heazlewoodite (Ni3S2) transformed into millerite (NiS) which is easier to
leach in the subsequent pressure leach stage; no NiS was formed in the
test conducted at 50 oC. However, because of the conditions prevailing in
the pressure leaching stage, nickel was leached at the same rate regardless
of the temperature at which the matte was pre-leached.
• It was found that the rate of nickel extraction was similar for the
investigated stirring rates of 145, 205 and 400 rpm. At higher stirring rates
of 205 and 400 rpm heazlewoodite (Ni3S2) transformed into millerite (NiS)
which is earsier to leach, and no millerite formed in the experiment
conducted at 145 rpm. However, as indicated above, because of the
aggressive conditions prevailing in the pressure leaching stage, all the
nickel minerals were leached at about the same rate.
• In the case of pulp density, it was found that nickel extraction was
comparable for all the investigated pulp densities of the pre-leach stage.
This was probably due to the fact that the degree of mineral transformation
in the pre-leach stage was similar for the investigated pulp densities of 1.6,
1.7 and 1.75 kg/L. For all three pulp densities the heazlewoodite
transformed to millerite. The conditions prevailing in the pressure
leaching stage allowed all the nickel minerals to be leached at about the
same rate regardless of the pulp density at which the matte was pre-
leached.
• Residence time of the pre-leaching stage had an effect on the nickel
extraction in the pressure leaching stage. The nickel extraction increased
with increasing residence time, due to the changes in the mineral phases
of the matte as indicated above.
210

• The copper minerals (Cu2S and Cu1.96S) transformed into Cu2S and Cu1.8S
with aqueous copper being precipitated, and were not leached under the
applied conditions. All the cobalt and iron dissolved in the pressure
leaching stage.
3) Kinetic Model
A semi-empirical kinetic model was developed on the basis of the leaching
mechanism and chemical reactions of the leaching system investigated. The
model makes allowance for variations in the values of the leaching parameters
such as initial copper concentration, temperature, particle size and initial acid
concentration. Under the leaching conditions employed in this study (where
no oxidant was added) the sulphide minerals were not expected to leach to a
significant degree. Therefore, the chemical reactions considered in the model
are those that are most likely to occur to a significant degree during the
leaching process. The kinetic model was evaluated by comparing the model
predictions to experimental data. A comparison of the model predictions and
the experimental data for the dissolved species during the leaching process
showed that the model was able to satisfactorily fit the trends in the leaching
of the metals.
9.2 Recommendations
• The findings of this study can be utilized to understand better the impact
of conditions prevailing in the pre-leaching stage on the subsequent
pressure leaching stage. In particular the nickel sulphide mineral
transformations that take place in the pre-leaching stage, which may affect
the rate of nickel dissolution in the pressure leaching stage.
• The findings on the behaviour of the copper cementation process can be of
use in controlling copper levels in the copper cementantion section at
211

Impala Base Metals Refinery. In this plant the residual copper is removed
from the nickel rich solution by cementation with matte, NiSO4 powder or
NaHS.
• The galvanic interaction between the mineral species of the matte can be
investigated to quantify its influence on the degree and rate of base metal
leaching.
• The rate of decrease and formation of solid species during the pre-leaching
of the matte were not evaluated by the semi-empirical kinetic model, this
may be worth considering if more tests were to be done on the pre-leaching
process. Furthermore, the model can be improved upon so as to increase
the accuracy of the predictions.
• It may be worthwhile to conduct more tests to measure the redox potential
of the investigated leaching system in order to establish more accurate
potential-pH diagrams (Pourbaix diagrams) of the species that may be
thermodynamically stable in the leaching system investigated in this
study.
• Future work should consider conducting factorial design experiments. This
will help in determining the interrelationships between variables, which
can help in modelling studies.
212

REFERENCES
Adam, K., Natarajan, K.A. and Iwasaki, I., 1984. Grinding media wear and its effect on the flotation of sulphide minerals. International Journal of Mineral Processing, 12, pp. 39-54.
Addy, s and Fletcher, A.J., 1987. The deposition of cobalt on iron powder by means of the cementation reaction. Hydrometallurgy, 17, 1987, pp. 269 – 280.
Ahmed, I.B., Gbor P.K. and Jia, C.Q., 2000. Aqueous sulphur dioxide leaching of Cu, Ni, Co, Zn and Fe from smelter slag in absence of oxygen. The Canadian Journal of Chemical Engineering, vol. 78, pp. 694 – 703.
Alcock, C.B., 1976. Principles of pyrometallurgy. Academic Press, London, 348 pp.
Annamalai, V. and Murr, L.E., 1979. Influence of deposit morphology on the kinetics of copper cementation on pure iron. Hydrometallurgy, 4, pp. 57 – 82.
Annamalai, V. and Hiskey, J.B., 1978. A kinetic study of copper cementation on pure aluminum. Society of Mining Engineers, pp. 650 – 659.
Anacleto, A.L. and Carvalho, R.J., 1996. Mercury cementation from chloride solutions using iron, zinc and aluminium. Minerals Engineering, vol 9, No.4, pp. 385 – 397.
Anonymous, 1981. Matthey Rustenburg Refiners. Journal of SAIMM, October, pp 11-14.
Barton, P.B. Jr, 1973. Solid solutions in the system Cu-Fe-S. Part I: The Cu-S and CuFe-S joins. Economic Geology, Vol 68, pp 455 – 465.
Berezowsky, R., 2003. Impala Platinum Limited, Base Metals Refinery, Review of process chemistry and mineralogy. Dynatec Corporation, Metallurgical Technologies Division, Fort Saskatchewan, Alberta, Canada, unpublished.
213
Berry, V.K., Murr, L.E. and Hiskey, J.B., 1978. Galvanic interaction between chalcopyrite and pyrite during bacterial leaching of low-grade waste. Hydrometallurgy, 3, pp. 309 – 326.
Biswas, A.K. and Davenport, W.G., 1976. Extractive Metallurgy of Copper. Pergamon Press, Oxford, pp. 80 – 155.
Boerst, K.D., 2001. Geochemistry of the Merensky reef on Impala platinum mine, Western bushveld complex. MSc Thesis, University of the Witwatersrand, South Africa, pp 1-19.
Boldt, J.R. Jr. and Queneau, P., 1967a. The Winning of Nickel: Its Geology, Mining and Extractive Metallurgy. Methuen and Co. Ltd, London, pp. 299 - 314.
Boldt, J.R. Jr. and Queneau, P., 1967b. The winning of nickel: Its geology, mining and extractive metallurgy. Methuen and Co. Ltd, London, pp. 228 – 288.
Brynard, H.J., de Villiers, J.P.R. and Viljoen, E.A., 1976. A mineralogical investigation of the Merensky Reef at the Western Platinum Mine, near Marikana, South Africa. Economic Geology, Vol. 71, pp 1299 – 1307.
Bryson, M.A.W, 2004a. Mineralogical control of minerals processing circuit design. Journal of SAIMM, vol. 104, No.6, July, pp 307-310.
Bryson, M.A.W, 2004b. New technologies in the concentration of PGM values from UG-2 ores. Journal of SAIMM, vol. 104, No.6, July, pp 311-313.
Brugman, C.F., and Kerfoot, D.G., 1986. Traetment of nickel-copper matte at Western Platinum by the Sherritt Acid Leach Process. In: Proceedings of Nickel Metallurgy, Vol. I, Extraction and Refining of Nickel. Ed. Ozberk, E. and Marcuson, S.W. CIM, August, Toronto, pp. 512 - 531.
Burkin, A.R., 1987. Extractive Metallurgy of Nickel. John Wiley & Sons, Chichester, pp. 99 – 113.
Burkin, A.R., 1966. The Chemistry of Hydrometallurgical Processes. E. & F.N. Spon Ltd, London, 157 pp.
214

Cabri, L.J., 1981. Relationship of Mineralogy to the recovery of Platinum-group elements from ores. In: Platinum-Group Elements: Mineralogy, Geology, Recovery, CIM special volume 23,. Ed. Cabri, L.J. The Canadian Institute of Mining and Metallurgy, pp. 233 – 249.
Celmer, R.S., Kaiura, G.H. and Toguri, J.M., 1987. Chemical reactions during the electric smelting of nickel-copper calcines. Canadian Metallurgical Quarterly, vol. 26, No. 4, pp. 277 - 284
Corrans, L.J., Dunne, R.C. and Allison, S.A., 1982. The recovery of platinum-group metals from the chromite reefs of the Bushveld Complex. XIV International Mineral Processing Congress, Toronto. CIM, October, pp. II-10.1 – II-10.21.
Colussi, I, Meriani, S. and Monte, U., 1983. Kinetic models for the leaching with sulphuric acid of zinc-containing slag. Hydrometallurgy, 10, pp. 61 – 67.
Colak, S., Alkan, M. and Kocakerim, M.M., 1987. Dissolution kinetics of chalcopyrite containing pyrite in water saturated with chlorine. Hydrometallurgy, 18, pp. 183 – 193.
Corrans, L.J. and Scholtz, M.T., 1976. A kinetic study of the leaching of pentlandite in acidic ferric sulphate solutions. Journal of SAIMM, May, pp. 403 - 411.
Crundwell, F.K. and Verbaan, B., 1987. Kinetics and mechanism of the non-oxidative dissolution of sphalerite (zinc sulphide). Hydrometallurgy, 17, pp. 369 – 384.
Deers, W.A., Howie, R.A. and Zussman, J., 1978. Rock-forming minerals, vol. 2A, single-chain silicates. Longman, 668 pp.
Donmez, B., Sevim, F. and Sarac, H., 1999. A kinetic study of the cementation of copper from sulphate solutions onto a rotating aluminium disc. Hydrometallurgy, 53, pp. 145 – 154.
Dry, M.J. and Bryson, A.W., 1987. Kinetics of leaching of a low-grade Fe-Ni-Cu-Co matte I ferric sulphate solution. Hydrometallurgy, 18, pp. 155 – 181.
215

Dutrizac, J.E. and Chen, T.T., 1987. A mineralogical study of the phases formed during the CuSO4-H2SO4-O2 leaching of nickel-copper matte. Canadian Metallurgical Quarterly, Vol. 26 (4), pp.265-276.
Dutrizac, J.E. and Chen, T.T., 1995. The leaching of galena in ferric sulphate media. Metallurgical and Materials Transactions B, vol. 26B, April, pp. 219 – 227.
Edwards, R.I., 1976. Refining of the platinum-group metals. Journal of Metals, August, pp 4 – 9.
Edwards, R.I., 1984. Metallurgical flowsheet II. The treatment of Merensky Reef ore – a complex metallurgical flowsheet. In: Metallurgy for geologists. Mineralogical Association of South africa, Johannesburg, pp 365 – 379.
Ferreira, R.C.H., 1975. High-temperature E-pH diagrams for the systems S-H2O, Cu-S-H2O and Fe-S-H2O. In: Leaching and reduction in hydrometallurgy, Ed. Burkin, A.R. The Institute of Mining and Metallurgy, London, pp. 67- 83.
Filmer, A.O., 1981. The non-oxidative dissolution of nickel mattes in aqueous acidic solution. Journal of SAIMM, March, pp.74-84.
Filippou, D. and Demopoulos, G.P., 1992. A reaction kinetic model for the leaching of industrial zinc ferrite particulates in sulphuric acid media. Canadian Metallurgical Quarterly, vol 31, No. 1, pp. 41 – 54.
Forbes, P.B.C., 1999. The use of life cycle assessment in the evaluation of environmental performance in the base metal refining industry. MSc Dissertation, University of Cape Town, South Africa.
Fogler, H. S., 1986. Elements of Chemical Reaction engineering. Prentice-Hall, Inc., New Jersey, 769 pp.
Fugleberg, S., Hultholm, S.E., Rosenback, L. and Holohan, T., 1995. Development of the Hartley Platinum leaching process. Hydrometallurgy, 39, pp.1-10.
Gbor, P.K, Ahmed, I.B., and Jia, C.Q., 2000. Behaviour of Co and Ni during aqueous sulphur dioxide leaching of nickel smelter slag. Hydrometallurgy, 57, pp. 13 - 22.
216

Green, B.R., Smit, D.M.C., Maumela H. and Coetzer,G., 2004; Leaching and recovery of platinum group metals from UG-2 concentrates, Journal of SAIMM, vol. 104, No.6, July, pp 323-331.
Herreros, O. Quiroz, R. Hernandez, M.C. and Vinals, J., 2002. Dissolution kinetics of enargite in dilute Cl2/Cl- media. Hydrometallurgy, 64, pp. 153- 160.
Hiskey, J.B. and Wadsworth, M.E., 1981. Electrochemical processes in the leaching of metal sulphides and oxides. In: Process and fundamental considerations of selected hydrometallurgical systems. Ed. Kuhn, M.C. Society of Mining Engineers of American Institute of Mining, Metallurgical, and Petroleum Engineers, New York, pp. 359-369
Hochreiter, R.C., Kennedy, D.C., Muir, W. and Woods, A.I., 1985. Platinum in South Africa (Metal review series no. 3). Journal of SAIMM, vol. 85, No.6, June, pp 165-185.
Hofirek, Z. and Kerfoot, D.G.E., 1992. The chemistry of the nickel-copper matte leach and its application to process control and optimisation. Hydrometallurgy, 29, pp. 357-381.
Hofirek, Z. and Nofal, P.J, 1995. Pressure leach capacity expansion using oxygen-enriched air at RBMR (Pty) Ltd. Hydrometallurgy, 39, pp. 91-116.
Hofirek, Z. and Halton, P., 1990. Production of high quality electrowon nickel at Rustenburg Base Metals Refiners (Pty) Ltd. In: Electrometallurgical Plant Practice, Ed. Claessens, P.L and Harris G.B. New York, pp. 233 - 251.
Holmes, P.R. and Crundwell, F.K., 1995. Kinetic aspects of galvanic interactions between minerals during dissolution. Hydrometallurgy, 39, pp. 353- 375.
Hsu, Y.J. and Tran, T., 1996. Selective removal of gold from copper-gold cyanide liquors by cementation using zinc. Minerals Engineering, vol 9, No.1, pp. 1 – 13.
Hulbert, L.J. and von Gruenewaldt, G., 1982. Nickel, copper and platinum mineralization in the lower zone of the Bushveld Complex, south of Potgietersrus. Economic Geology, vol. 77, pp. 1296 – 1306.
217

Impala reports, 2003 – 2005, Weekly feedback reports on production, Impala platinum refineries, Johannesburg, unpublished.
Jayasekera, S., 1995. Pressure leaching of reduced ilmenite: electrochemical aspects. Hydrometallurgy, 39, pp. 183 -199.
Kellogg, H.H., 1986. Thermochemistry of nickel-matte converting. In: Proceedings of Nickel Metallurgy, Vol. I, Extraction and Refining of Nickel. Ed. Ozberk, E. and Marcuson, S.W. CIM, August, Toronto, pp. 95 - 128.
Kinloch, E.D., 1982. Regional trends in the platinum-group mineralogy of the critical Zone of the Bushveld Complex, South Africa. Economic Geology, vol. 77, pp. 1328 – 1347.
Kingston, G.A. and El-Dosuky, B.T., 1982. A contribution on the platinum-group mineralogy of the Merensky Reef at the Rustenburg Platinum Mine. Economic Geology, vol. 77, pp. 1367 – 1384.
Knuutila, K. Hultholm, S. Saxen, B. and Rosenback, L., 1997. New nickel process increasing production at Outokumpu harjavalta Metals Oy, Finland. ALTA Nickel/Cobalt Pressure Leaching & Hydrometallurgy Forum, Perth. W. Australia.
Levenspiel, O., 1972. Chemical Reaction Engineering. John Wiley & Sons, New York, 578 pp.
Lindsay, N.M., 1988. The processing and recovery of the Platinum-group elements. PhD Thesis, University of the Witwatersrand, Johannesburg, South Africa, pp. 9 – 59.
Long, H. and Dixon, D.G., 2004. Pressure oxidation of pyrite in sulphuric acid media: a kinetic study. Hydrometallurgy, 73, pp. 335 - 349.
Lorenzen, L. and van Deventer, J.S.J., 1992. Electrochemical interactions between gold and its associated minerals during cyanidation. Hydrometallurgy, 30, pp. 177 - 194.
Llanos, Z.R., Queneau, P.B. and Rickard, R.S., 1974. Atmospheric Leaching of
218

Matte at the Port Nickel Refinery. CIM Bulletin, 64, pp. 74-81.
Ma, Z. and Ek, C., 1991. Rate processes and mathematical modeling of the acid leaching of a manganese carbonate ore. Hydrometallurgy, 27, pp. 125 - 139.
MacKinnon, D.J., Ingraham, T.R. and Kerby, R., 1971. Copper cementation on nickel discs. Canadian Metallurgical Quarterly, Vol. 10, no. 3, pp 165 - 169.
Mashanyane. H.S. and Storey, M.J., 1986. Problems associated with the processing of nickel ores. In: Proceedings of Nickel Metallurgy, Vol. I, Extraction and Refining of Nickel. Ed. Ozberk, E. and Marcuson, S.W. CIM, August, Toronto pp. 13-35.
McLaren, C.H., 1978. A mineralogical investigation of the platinum-group minerals in the UG-2 layer of the Bushveld Complex with special reference to the recovery of the minerals from the ores. Metals and Minerals Processing, vol, pp. 19 – 27.
McLaren, C.H. and De Villiers, J.P.R., 1982. The platinum-group chemistry and mineralogy of the UG-2 chromitite layer of the Bushveld Complex. Economic Geology, vol. 77, pp. 1348 – 1366.
McKinnon, D.J. and Ingraham, T.R., 1970. Kinetics of Cu(II) cementation on a pure aluminum disc in acidic sulphate solution. Canadian Metallurgical Quarterly, Vol. 9, no. 3, pp. 443- 448.
Mostert, A.B., Hofmeyer, P.K. and Potgieter, G.A., 1982. The platinum-group mineralogy of the Merensky Reef at the Impala Platinum Mines, Bophuthatswana. Economic Geology, vol. 77, pp. 1385 – 1394.
Mostert, J.C. and Roberts, P.N., 1973. Electric smelting at Rustenburg Platinum Mines Limited of nickel-copper concentrates containing platinum-group metals. Journal of SAIMM, April, pp 290-299.
Mulak, W., 1987. The catalytic action of cupric and ferric ions in nitric acid leaching of Ni3S2. Hydrometallurgy, 17, pp. 201 - 214
Mulak, W., 1985. Kinetics of dissolution of synthetic heazlewoodite (Ni3S2) in nitric acid solutions. Hydrometallurgy, 14, pp. 67 - 81.
219

Nagamori, M., 1974. Metal loss to slag I.Sulfidic and oxidic dissolution of copper in Fayalite slag from low grade matte. Metallurgical Transactions, vol. 5, March, pp.531 – 538.
Nadkarni, R.M., Jelden, C.E., Bowles, K.C., Flanders, H.E. and Wadsworth, M.E. A , 1967. kinetic study of copper precipitation on iron – Part I. Transactions of the Metallurgical Society of AIME, Vol. 239, pp. 581-585.
Naldrett, A.J., 1981. Platinum-group elements deposits. In: Platinum-Group Elements: Mineralogy, Geology, Recovery, CIM special volume 23,. Ed. Cabri, L.J. The Canadian Institute of Mining and Metallurgy, pp. 197 – 231.
Newman, S.C., 1973. Platinum. Bulletin of Institute of Mining and Metallurgy (6B), vol 82, Sect. A, pp. 52 – 68.
Nicol, M.J., Needs, C.R.S. and Finkelstein, 1975. Electrochemical model for the leaching of uranium dioxide: 1 – acid media. In: Leaching and reduction in hydrometallurgy. Ed. Burkin, A.R. The Institute of Mining and Metallurgy, London, pp. 1 – 11.
Nicol, M.J., 1984. An electrochemical study of the interaction of copper (II) ions with sulphide minerals. Electrochemistry in mineral and metal processing (Proceedings of the international Symposium). Ed. Richardson, P.E., Srinivasan, S. and Woods, R. The Electrochemical Society, Inc., 152 – 168.
Nyman, B., Aaltonen, A., Hultholm, E.S. and Karpale, K., 1992. Application of new hydrometallurgical developments in the Outokumpu HIKO process. Hydrometallurgy, 29, pp. 461 - 478.
Osseo-Asare, K. and Fuerstenau, D.W., 1978. Application of activity-activity diagrams to ammonia hydrometallurgy: The systems Cu-NH3-H2O, Ni-NH3-H2O, Co-NH3-H2O at 25 oC. Fundamental Aspects of Hydrometallurgical processes. Ed. Chapman, T.W., et al . AIChE Symposium series, vol. 74, No. 173, pp. 1 – 13.
Osseo-Asare, K., (1981). Application of activity-activity diagrams to ammonia hydrometallurgy II. The copper-, nickel-, cobalt-ammonia-water systems at elevated temperatures. In: Process and fundamental considerations of selected hydrometallurgical systems. Ed. Kuhn, M.C. Society of Mining Engineers of
220
American Institute of Mining, Metallurgical, and Petroleum Engineers, New York, pp. 359-369
Paul, R.L., Nicol, M.J., Diggle, J.W. and Saunders, A.P., 1978. The electrochemical behaviour of galena (lead sulphide)- I. Anodic dissolution. Electrochimica Acta, vol. 23, pp. 625 – 633.
Peyerl, W., 1983. The metallurgical implications of the mode of occurrence of platinum-group metals in the Merensky Reef and UG-2 chromitite of the Bushveld Complex. Geological Society of South Africa, special publication, 7, pp. 295 – 300.
Plasket, R.P. and Dunn, G.M., 1986a. Iron rejection and impurity removal from nickel leach liquor at Impala Platinum Limited. In: Iron control in hydrometallurgy. Ed. Dutrizac, J.E. and Monhemiums, A.J. Ellis Horwood Limited, Chichester, pp. 695 - 718.
Plasket, R.P. and Dunn, G.M., 1986b. Commissioning experiences in the cobalt plant at Impala Platinum Ltd. Minerals and Metallurgical Processing, February, pp. 7 – 14.
Plasket, R.P. and Romanchuk, S., 1978. Recovery of nickel and copper from high-grade matte at Impala Platinum by the Sherritt process. Hydrometallurgy, 3, pp. 135-151.
Pourbaix, M., 1966. Atlas of Electrochemical Equilibria in Aqueous Solutions. Pergamon press, Oxford, 644 pp.
Puvvada, G. and Tran, T., 1995. The cementation of Ag (I) ions from sodium chloride solutions onto a rotating copper disc. Hydrometallurgy, 37, pp. 193- 205.
Provis, J.L., van Deventer, J.S.J., Rademan, J.A.M. and Lorenzen, L., 2003. A kinetic model for the acid-oxygen pressure leaching of Ni-Cu matte. Hydrometallurgy, 70, pp. 83 - 99.
221

Rademan, J.A.M., Lorenzen, L. and van Deventer, J.S.J., 1999. The leaching Characteristics of Ni-Cu matte in the acid-oxygen pressure leach process at Impala platinum. Hydrometallurgy, 52, pp. 231-252.
Raschman, p., 2000. Leaching of calcined magnesite using ammonium chloride at constant pH. Hydrometallurgy, 56, pp. 109 - 123
Rademan, J.A.M., (1995). The simulation of a transient leaching circuit, PhD Dissertation, University of stellenbosch, South Africa, 423 pp.
Reddy, P.L.N., Venkatachalam, S. and Mallikarjunan, R., 1987. Electrochemical dissolution of a chalcopyrite concentrate. In: Proceedings of the International Symposium on Electrochemistry in Mineral and Metal processing. Ed. Richardson, P.E., Srinivasan, S. and Woods, R. The Electrochemical Society, pp. 447-468.
Robiette, A.G.E, 1973. Electric smelting processes. Charles Griffin & Company Limited, London, pp. 203 - 233.
Roine, A., 2002. Outokump HSC Chemistry 5.11. Outokumpu Research Oy, Pori, Finland.
Rosenqvist, T., 1974. Principles of Extractive Metallurgy. McGraw-Hill, Tokyo, pp. 354 – 373.
Sato, T. and Lawson, F., 1983, Dfferential leaching of some lead smelter slags with sulfurous acid and oxygen. Hydrometallurgy, 11, pp. 371 - 388.
Sahoo, P.K. and Srinivasa, K., 1982. Cementation of copper from complex sulphide leach liquor. Hydrometallurgy, 8, pp. 223 - 229.
Schwellnus, J.S.I., Hiemstra, S.A. and Gasparrini, E., 1976. The Merensky Reef at the Atok Platinum Mine and its environs. Economic Geology, vol. 71, pp. 249 – 260.
Sharpe, M. R., 1982. Noble metals in the marginal rocks of the Bushveld Complex. Economic Geology, Vol 77, pp 1286 – 1295.
222

Southwood, M.J. 1985. The acid leaching of nickel and copper from sulphidic ore in the presence of pyrite. Journal of SAIMM, vol. 85, No.11, November, pp 395-401.
Spandiel, T., 1996. The chemistry of Impala base metal refining operations and its application to modelling and simulation, discussion document (confidential), unpublished.
Sohn, H. Y. and Wadsworth, M. E., 1979. Rate Processees of Extractive Metallurgy. Plenum Press, New York, pp. 1 – 51.
Steenekamp, N. and Dunn, M.G., 1999. Operations of and improvements to the Lonrho Platinum Base Metal refinery. EPD Congress, Ed. Mishra, B., pp. 365-378.
Symens, R.D., Queneau, P.B., Chou, E.C. and Clark, F.F., 1979. Leaching of iron-containing copper-nickel matte at atmospheric pressure. Canadian Metallurgical Quarterly, Vol. 18, pp.145-153.
Szekely, J., Evans, J.W. and Sohn, H.Y., 1976. Gas-Solid Reactions. Academic Press, New York, pp. 109 -125.
Terry, B., 1987. Pyrometallurgy of sulphide ores of nickel to finished metal or mattes. Extractive Metallurgy of Nickel. Ed. Burkin, A.R., Critical reports on applied chemistry, vol. 17, Society of Chemical Industry, John Wiley & Sons, Chichester, 150 pp.
Vermaak, C.F. and Hendriks, L.P., 1976. A review of the mineralogy of the Merensky Reef, with specific reference to new data on the precious metal mineralogy. Economic Geology, vol. 71, pp. 1244 – 1269.
Von Gruenewaldt, G., 1977. The mineral resources of the Bushveld complex. Minerals Science Engineering, vol. 9, no. 2, April, pp 83 - 95
Wagner, P.A., 1973. The Platinum Deposits and Mines of South Africa. C. Struik (Pty) Ltd, Cape Town, 338 pp.
Webb, P.A. and Orr, C., 1997. Analytical Methods in Fine Particle Technology. Micromeritics Instrument Corporation, Norcross,USA, PP. 53 – 153.
223

Youzbashi, A.A. and Dixit, S.G., 1991. Leaching of nickel from supported nickel waste catalyst using aqueous sulphur dioxide solution. Metallurgical Transactions B, vol. 22B, December, pp. 775 – 781.
Yu, P.H., Hansen, C.K. and Wadsworth, M.E., 1973. A kinetic study of the leaching of chalcopyrite at elevated temperatures. In: Proceedings of 2nd International Symposium on hydrometallurgy, Ed. Evans, D.J.I. AIME, New York, pp. 375 – 402.
Yuhua, Y., and Xianxuan, M., 1990. Operating practice and technical developments in nickel refining and cobalt recovery at Jinchuan non-ferrous metal company. In: Electrometallurgical plant practice, Ed. Claessens, P.L. and Harris, G.B, Pergamon, New York, pp. 253 – 268.
224

TABLE A1.7: METAL SOLUTION CONCENTRATIONS DURING ATMOSPHERIC LEACHING OF THE MATTE AT A TEMPERATURE OF 80 O C
Leaching conditions: Temperature: 80 oCAgitation: 205 rpmPulp density: 1.7 kg/L
Leaching Co Fe Ni Cu pHTime (g/l) (g/l) (g/l) (g/l)
( min )
0 0.18 0.67 24.61 24.95 0.05115 0.68 3.04 58.34 16.06 0.24130 0.76 3.32 65.58 12.16 0.3860 0.83 3.58 76.59 4.44 1.1790 0.94 4.03 87.97 0.00 1.35
120 1.00 4.25 91.86 0.00 1.82150 1.07 4.33 97.00 0.00 2.44180 1.09 4.39 97.73 0.00 3.24240 1.16 4.15 104.17 0.00 3.65300 1.21 3.96 104.59 0.00 4.79
Fig. A1.7: Metal concentration as a function of leaching time at 80 oC.
0
20
40
60
80
100
0 15 30 60 90 120 150 180 240 300
Leaching Time, min
Solu
tion
Con
c., g
/l
0
1
2
3
4
5So
lutio
n pH
CoFeNiCupH
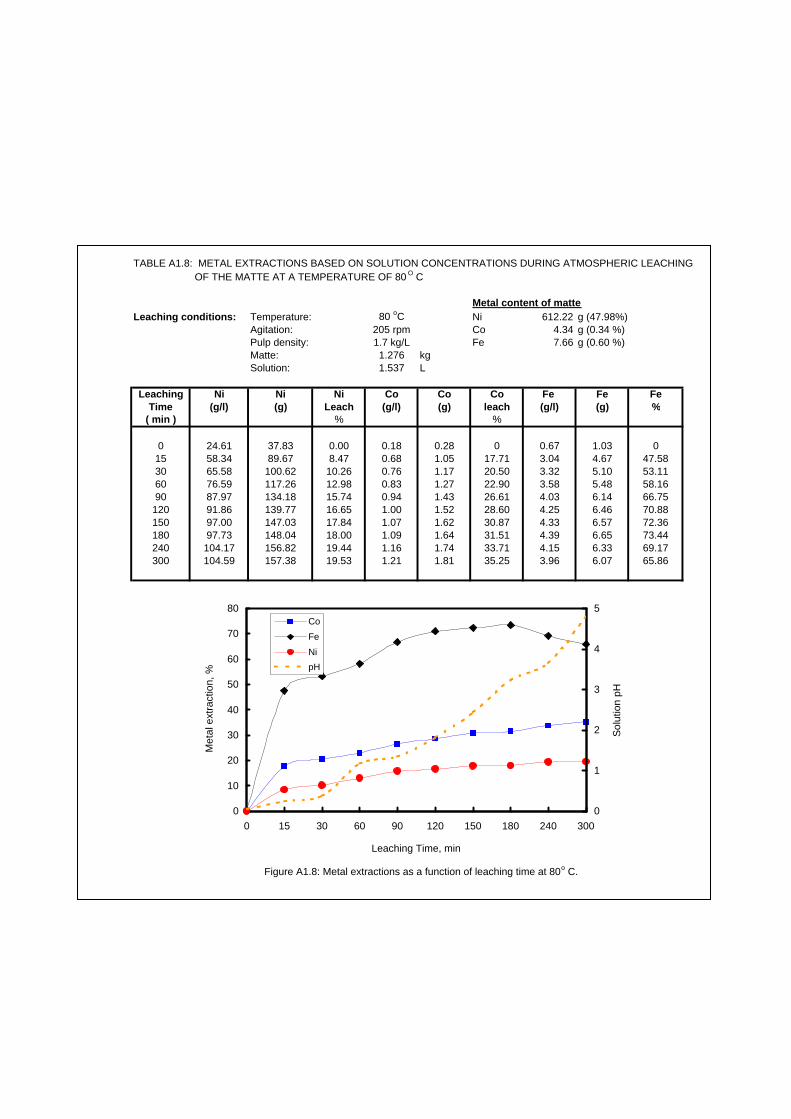
TABLE A1.8: METAL EXTRACTIONS BASED ON SOLUTION CONCENTRATIONS DURING ATMOSPHERIC LEACHING OF THE MATTE AT A TEMPERATURE OF 80 O C
Metal content of matteLeaching conditions: Temperature: 80 oC Ni 612.22 g (47.98%)
Agitation: 205 rpm Co 4.34 g (0.34 %)Pulp density: 1.7 kg/L Fe 7.66 g (0.60 %)Matte: 1.276 kgSolution: 1.537 L
Leaching Ni Ni Ni Co Co Co Fe Fe FeTime (g/l) (g) Leach (g/l) (g) leach (g/l) (g) %
( min ) % %
0 24.61 37.83 0.00 0.18 0.28 0 0.67 1.03 015 58.34 89.67 8.47 0.68 1.05 17.71 3.04 4.67 47.5830 65.58 100.62 10.26 0.76 1.17 20.50 3.32 5.10 53.1160 76.59 117.26 12.98 0.83 1.27 22.90 3.58 5.48 58.1690 87.97 134.18 15.74 0.94 1.43 26.61 4.03 6.14 66.75
120 91.86 139.77 16.65 1.00 1.52 28.60 4.25 6.46 70.88150 97.00 147.03 17.84 1.07 1.62 30.87 4.33 6.57 72.36180 97.73 148.04 18.00 1.09 1.64 31.51 4.39 6.65 73.44240 104.17 156.82 19.44 1.16 1.74 33.71 4.15 6.33 69.17300 104.59 157.38 19.53 1.21 1.81 35.25 3.96 6.07 65.86
Figure A1.8: Metal extractions as a function of leaching time at 80 o C.
0
10
20
30
40
50
60
70
80
0 15 30 60 90 120 150 180 240 300
Leaching Time, min
Met
al e
xtra
ctio
n, %
0
1
2
3
4
5So
lutio
n pH
CoFeNipH

TABLE A1.7B: METAL SOLUTION CONCENTRATIONS DURING ATMOSPHERIC LEACHING OF THE MATTE AT A TEMPERATURE OF 80 O C - SECOND TEST
Leaching conditions: Temperature: 80 oCAgitation: 205 rpmPulp density: 1.7 kg/L
Leaching Co Fe Ni CuTime (g/L) (g/L) (g/L) (g/L)
( min )
0 0.18 0.67 24.61 24.9515 0.74 3.14 61.03 15.1730 0.79 3.3 68.18 10.2660 0.86 4.01 79.43 3.9690 0.91 4.06 85.67 0.00
120 1.02 4.45 93.36 0.00150 1.08 4.31 96.89 0.00180 1.09 4.02 99.23 0.00240 1.19 4.05 102.67 0.00300 1.25 3.61 107.09 0.00
Fig. A1.7B: Metal concentration as a function of leaching time at 80 Oc - second test
0
20
40
60
80
100
0 15 30 60 90 120 150 180 240 300
Leaching Time, min
Solu
tion
Con
c., g
/L
CoFeNiCupH

TABLE A1.8B: METAL EXTRACTIONS BASED ON SOLUTION CONCENTRATIONS DURING ATMOSPHERIC LEACHING OF THE MATTE AT A TEMPERATURE OF 80 O C - SECOND TEST
Metal content of matteLeaching conditions: Temperature: 80 oC Ni 612.22 g (47.98%)
Agitation: 205 rpm Co 4.34 g (0.34 %)Pulp density: 1.7 kg/L Fe 7.66 g (0.60 %)Matte: 1.276 kgSolution: 1.537 L
Leaching Ni Ni Ni Co Co Co Fe Fe FeTime (g/L) (g) Leach (g/L) (g) leach (g/L) (g) %
( min ) % %
0 24.61 37.83 0.00 0.18 0.28 0 0.67 1.03 015 61.03 93.80 9.14 0.74 1.14 19.84 3.14 4.83 49.5930 68.18 104.61 10.91 0.79 1.21 21.58 3.3 5.07 52.7560 79.43 121.62 13.69 0.86 1.32 23.98 4.01 6.12 66.5490 85.67 130.90 15.20 0.91 1.39 25.67 4.06 6.20 67.49
120 93.36 141.95 17.01 1.02 1.55 29.31 4.45 6.76 74.81150 96.89 146.94 17.82 1.08 1.63 31.26 4.31 6.56 72.23180 99.23 150.18 18.35 1.09 1.65 31.58 4.02 6.16 66.98240 102.67 154.87 19.12 1.19 1.78 34.72 4.05 6.20 67.51300 107.09 160.78 20.08 1.25 1.86 36.57 3.61 5.61 59.83
Figure A1.8B: Metal extractions as a function of leaching time at 80 o C - Second test.
0
10
20
30
40
50
60
70
80
0 15 30 60 90 120 150 180 240 300
Leaching Time, min
Met
al e
xtra
ctio
n, %
CoFeNipH

TABLE A1.5: METAL SOLUTION CONCENTRATIONS DURING ATMOSPHERIC LEACHING OF THE MATTE AT A TEMPERATURE OF 70 O C
Leaching conditions Temperature: 70 oCAgitation: 205 rpmPulp density: 1.7 kg/L
Leaching Co Fe Ni Cu pHtime (g/l) (g/l) (g/l) (g/l)
( min )
0 0.18 0.67 24.61 24.95 1.1015 0.73 3.09 59.60 15.03 1.0330 0.77 3.3 65.88 12.23 1.0660 0.79 3.29 67.80 7.35 1.1090 0.88 3.61 77.59 3.97 1.14120 0.89 3.63 79.13 0.85 1.18150 0.96 3.95 86.36 0.00 1.29180 1.01 4.05 92.39 0.00 1.61240 1.08 4.28 97.99 0.00 2.12300 1.06 3.62 101.60 0.00 4.51
Fig. A1.5: Metal concentration as a function of leaching time at 70 oC
0
20
40
60
80
100
0 15 30 60 90 120 150 180 240 300
Leaching Time, min
Sol
utio
n C
onc.
, g/l
0
1
2
3
4
5
Sol
utio
n pH
Co Fe NiCu pH

TABLE A1.6: METAL EXTRACTIONS BASED ON SOLUTION CONCENTRATIONS DURING ATMOSPHERIC LEACHING OF THE MATTE AT A TEMPERATURE OF 70 O C
Leaching conditions: Temperature: 70 oC Metal content of matte:Agitation: 205 rpm Ni 612.22 g (47.98%)Pulp density: 1.7 kg/L Co 4.34 g (0.34 %)Matte: 1.276 kg Fe 7.66 g (0.60 %)Solution: 1.537 L
Leaching Ni Ni Ni Co Co Co Fe Fe FeTime (g/l) (g) Leach (g/l) (g) leach (g/l) (g) %
( min ) % %
0 24.61 37.83 0.00 0.18 0.28 0 0.67 1.03 015 59.60 91.61 8.78 0.73 1.12 19.49 3.09 4.75 48.5830 65.88 101.10 10.34 0.77 1.18 20.88 3.3 5.07 52.7360 67.80 103.96 10.80 0.79 1.21 21.56 3.29 5.05 52.5490 77.59 118.27 13.14 0.88 1.34 24.60 3.61 5.52 58.65120 79.13 120.48 13.50 0.89 1.36 24.93 3.63 5.55 59.02150 86.36 130.69 15.17 0.96 1.46 27.21 3.95 6.00 64.92180 92.39 139.05 16.53 1.01 1.53 28.81 4.05 6.14 66.74240 97.99 146.68 17.78 1.08 1.62 31.00 4.28 6.45 70.83300 101.60 151.51 18.57 1.06 1.59 30.39 3.62 5.57 59.30
Fig. A1.6: Metal extraction as a function of leaching time at 70 o C
0
10
20
30
40
50
60
70
80
0 15 30 60 90 120 150 180 240 300
Leaching Time, min
Met
al e
xtra
ctio
n, %
0
1
2
3
4
5S
olut
ion
pHCo
FeNi
pH

TABLE A1.3: METAL SOLUTION CONCENTRATIONS DURING ATMOSPHERIC LEACHING OF THE MATTE AT A TEMPERATURE OF 60 O C
Leaching conditions: Temperature: 60 oCAgitation: 205 rpmPulp density: 1.7 kg/L
Leaching Co Fe Ni Cu pHTime (g/l) (g/l) (g/l) (g/l)
( min )
0 0.18 0.67 24.61 24.95 0.9715 0.77 3.35 64.11 22.84 1.1030 0.79 3.44 66.16 19.49 1.1160 0.80 3.68 68.85 14.47 1.1890 0.79 3.80 71.18 10.45 1.28120 0.91 3.91 78.69 8.75 1.34150 0.88 3.96 80.00 6.39 1.43180 0.96 4.05 86.80 4.79 1.51240 0.91 4.08 88.33 1.30 1.61300 1.01 4.24 94.44 0.00 1.90
Fig. A1.3: Metal concentrations as a function of leaching time at 60 o C
0
10
20
30
40
50
60
70
80
90
100
0 15 30 60 90 120 150 180 240 300
Leaching Time, min
Solu
tion
Con
c., g
/l
0
1
2
3
4
5
Solu
tion
pH
Co FeNi CupH

TABLE A1.4: METAL EXTRACTIONS BASED ON SOLUTION CONCENTRATIONS DURING ATMOSPHERIC LEACHING OF THE MATTE AT A TEMPERATURE OF 60 O C
Leaching conditions: Temperature: 60 oC Metal content of matte:Agitation: 205 rpm Ni 612.22 g (47.98%)Pulp density: 1.7 kg/L Co 4.34 g (0.34 %)Matte: 1.28 kg Fe 7.66 g (0.60 %)Solution: 1.54 L
Leaching Ni Ni Ni Co Co Co Fe Fe FeTime (g/l) (g) Leach (g/l) (g) leach (g/l) (g) ( % )
( min ) % %
0 24.61 37.83 0.00 0.18 0.28 0 0.67 1.03 015 64.11 98.54 9.92 0.77 1.18 20.90 3.35 5.15 53.8030 66.16 101.64 10.42 0.79 1.21 21.60 3.44 5.29 55.5860 68.85 105.71 11.09 0.80 1.23 21.94 3.68 5.64 60.2490 71.18 109.17 11.65 0.79 1.21 21.61 3.80 5.82 62.61120 78.69 119.96 13.42 0.91 1.39 25.58 3.91 5.98 64.60150 80.00 121.81 13.72 0.88 1.34 24.60 3.96 6.05 65.52180 86.80 131.24 15.26 0.96 1.46 27.16 4.05 6.17 67.15240 88.33 133.33 15.60 0.91 1.39 25.59 4.08 6.21 67.69300 94.44 141.49 16.93 1.01 1.52 28.67 4.24 6.43 70.48300
Figure A1.4: Metal extractions as a function of leaching time at 60 o C
0
10
20
30
40
50
60
70
80
0 15 30 60 90 120 150 180 240 300
Leaching Time, min
Met
al e
xtra
ctio
n, %
0
1
2
3
4
Sol
utio
n pH
CoFeNipH

TABLE A1.3B: METAL SOLUTION CONCENTRATIONS DURING ATMOSPHERIC LEACHING OF THE MATTE AT A TEMPERATURE OF 60 O C - SECOND TEST
Leaching conditions: Temperature: 60 oCAgitation: 205 rpmPulp density: 1.7 kg/L
Leaching Co Fe Ni CuTime (g/L) (g/L) (g/L) (g/L)
( min )
0 0.17 0.67 24.61 24.9515 0.67 3.21 54.21 21.1430 0.76 3.54 69.75 19.5860 0.79 3.78 70.85 16.5790 0.76 3.89 74.16 12.25120 0.81 3.96 77.61 8.15150 0.79 3.96 82.16 5.87180 0.98 4.08 88.68 4.09240 0.97 4.18 89.32 0.92300 1.06 4.34 99.69 0.00
Fig. A1.3B: Metal concentrations as a function of leaching time at 60 o C - Second test
0
20
40
60
80
100
120
0 15 30 60 90 120 150 180 240 300
Leaching Time, min
Solu
tion
Con
c., g
/l
Co FeNi CupH

TABLE A1.4B: METAL EXTRACTIONS BASED ON SOLUTION CONCENTRATIONS DURING ATMOSPHERIC LEACHIN OF THE MATTE AT A TEMPERATURE OF 60 O C
Leaching conditions: Temperature: 60 oC Metal content of matte:Agitation: 205 rpm Ni 612.22 g (47.98%)Pulp density: 1.7 kg/L Co 4.34 g (0.34 %)Matte: 1.28 kg Fe 7.66 g (0.60 %)Solution: 1.54 L
Leaching Ni Ni Ni Co Co Co Fe Fe FeTime (g/L) (g) Leach (g/L) (g) leach (g/L) (g) ( % )
( min ) % %
0 24.61 37.83 0.00 0.17 0.26 0 0.67 1.03 015 54.21 83.32 7.43 0.67 1.03 17.78 3.21 4.93 50.9930 69.75 106.82 11.27 0.76 1.17 20.92 3.54 5.43 57.5160 70.85 108.48 11.54 0.79 1.21 21.95 3.78 5.79 62.1790 74.16 113.41 12.35 0.76 1.17 20.90 3.89 5.95 64.27120 77.61 118.36 13.15 0.81 1.24 22.59 3.96 6.05 65.59150 82.16 124.78 14.20 0.79 1.21 21.94 3.96 6.05 65.59180 88.68 133.83 15.68 0.98 1.47 28.02 4.08 6.22 67.76240 89.32 134.70 15.82 0.97 1.46 27.70 4.18 6.35 69.54300 99.69 148.56 18.09 1.06 1.58 30.48 4.34 6.57 72.33
Solidanalysis
Figure A1.4B: Metal extractions as a function of leaching time at 60 o C - second test
0
10
20
30
40
50
60
70
80
0 15 30 60 90 120 150 180 240 300
Leaching Time, min
Met
al e
xtra
ctio
n, % Co
FeNipH

TABLE A1.1: METAL SOLUTION CONCENTRATIONS DURING ATMOSPHERIC LEACHING OF THE MATTE AT A TEMPERATURE OF 50 O C
Leaching conditions: Temperature: 50 oCAgitation: 205 rpmPulp density: 1.7 kg/L
Leaching Co Fe Ni Cu pHTime (g/l) (g/l) (g/l) (g/l)
( min )
0 0.18 0.67 24.61 24.95 0.8415 0.65 2.76 51.79 23.51 1.3430 0.70 2.79 55.43 20.93 1.4860 0.79 2.89 59.65 17.47 1.5290 0.88 2.85 64.01 15.72 1.52
120 0.90 2.78 66.97 14.15 1.50150 0.94 2.88 68.04 12.72 1.61180 0.96 2.92 70.36 11.90 1.62240 0.97 2.95 74.85 9.96 1.74300 0.97 2.97 76.56 7.55 1.88
Fig. A.1.1: -Metal concentration as a function of leaching time at 50 oC
0
10
20
30
40
50
60
70
80
90
0 15 30 60 90 120 150 180 240 300
Leaching Time, min
Sol
utio
n C
onc.
, g/l
0
1
2
3
4
5
Sol
utio
n pH
Co FeNi CupH

TABLE A1.2: METAL EXTRACTIONS BASED ON SOLUTION CONCENTRATIONS DURING ATMOSPHERIC LEACHING OF THE MATTE AT A TEMPERATURE OF 50 O C
Leaching conditions: Temperature: 50 oC Metal content of matte:Agitation: 205 rpm Ni 612.22 g (47.98%)Pulp density: 1.7 kg/L Co 4.34 g (0.34 %)Matte: 1.28 kg Fe 7.66 g (0.60 %)Solution: 1.54 L
Leaching Ni Ni Ni Co Co Co Fe Fe FeTime (g/l) (g) Leach (g/l) (g) leach (g/l) (g) %
( min ) % %
0 24.61 37.83 0.00 0.18 0.28 0.00 0.67 1.03 015 51.79 79.60 6.82 0.65 1.00 16.65 2.76 4.24 41.9630 55.43 85.20 7.74 0.70 1.08 18.42 2.79 4.29 42.5660 59.65 91.68 8.80 0.79 1.21 21.61 2.89 4.44 44.5790 64.01 98.38 9.89 0.88 1.35 24.80 2.85 4.38 43.77
120 66.97 102.93 10.63 0.90 1.38 25.51 2.78 4.27 42.36150 68.04 104.58 10.90 0.94 1.44 26.93 2.88 4.43 44.37180 70.36 108.14 11.49 0.96 1.48 27.63 2.92 4.49 45.17240 74.85 115.04 12.61 0.97 1.49 27.99 2.95 4.53 45.77300 76.56 117.67 13.04 0.97 1.49 27.99 2.97 4.56 46.17
Fig. A1.2: Metal extraction as a function of leaching time at a temperature of 50 oC.
0
10
20
30
40
50
60
0 15 30 60 90 120 150 180 240 300
Leaching Time, min
Met
al e
xtra
ctio
n, %
0
1
2
3
4
Sol
utio
n pH
Co FeNi pH
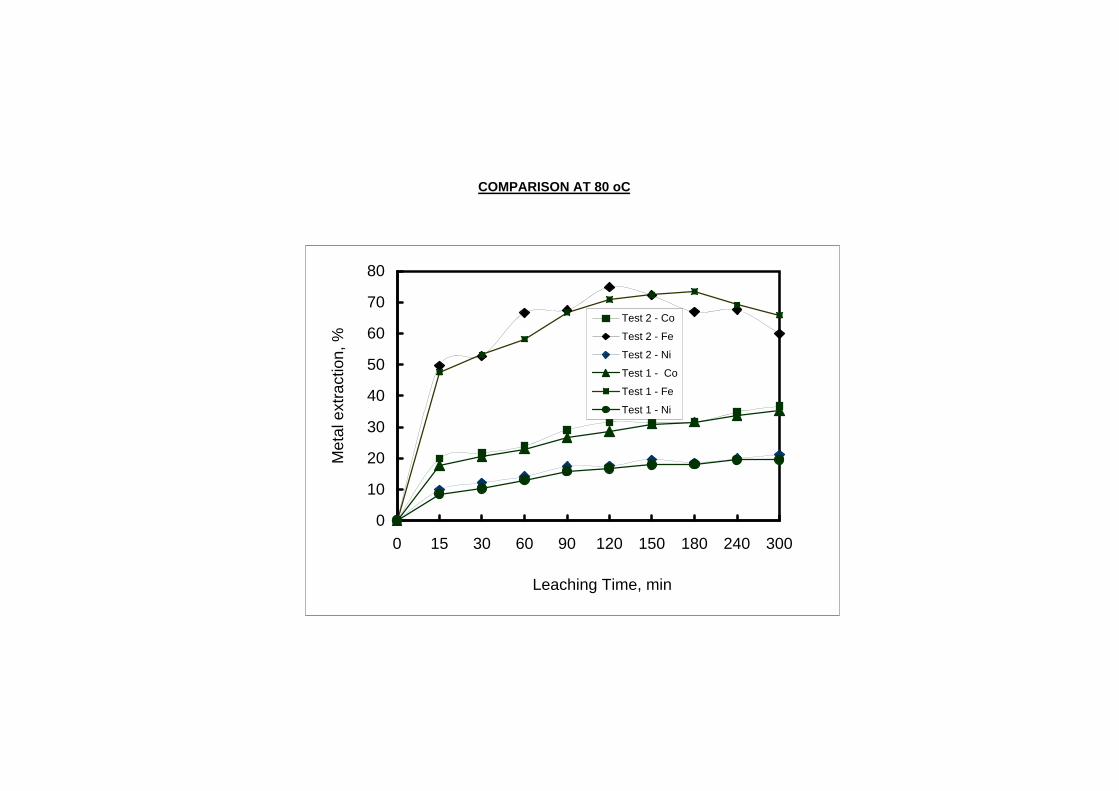
COMPARISON AT 80 oC
0
10
20
30
40
50
60
70
80
0 15 30 60 90 120 150 180 240 300
Leaching Time, min
Met
al e
xtra
ctio
n, %
Test 2 - Co
Test 2 - Fe
Test 2 - Ni
Test 1 - Co
Test 1 - Fe
Test 1 - Ni

TABLE A1.10 : COPPER PRECIPITATION DURING ATMOSPHERIC LEACHING TABLE A1.9: COPPER SOLUTION CONCENTRATION DURING ATMOSPHERIC LEACHING OF THE MATTE AT DIFFERENT TEMPERATURE VALUES OF THE MATTE AT DIFFERENT TEMPERATURE VALUES
Leaching conditions Feed matte Feed solution Leaching conditions Feed matte Feed solutionPulp density ( kg/L ) 1.7 Mass ( kg ) 1.28 Volume (mL)1.54 Pulp density ( kg/L ) 1.7 Mass ( kg ) 1.28 Volume ( mL 1.54Stirring rate (rpm ): 205 Ni ( % ) 47.98% Ni (g/L) 24.61 Stirring rate (rpm ): 205 Ni ( % ) 47.98% Ni 24.61Leaching time ( hr ): 5 hrs Cu ( % ) 31.31 Cu (g/L) 24.95 Leaching time ( hr ): 5 hrs Cu ( % ) 31.31 Cu 24.95Matte (kg): 1.28 Co ( % ) 0.34% Co (g/L) 0.18 Matte (kg): 1.28 Co ( % ) 0.34% Co ??
Fe ( % ) 0.6% Fe (g/L) 0.67 Fe ( % ) 0.6% Fe ??
Leaching Copper in leach solution, g Copper precipitation, % Leaching Copper Concentration, g/L Log [Cu 2+]t / [Cu2+]0
Time Time( min ) 50 oC 60 oC 70 oC 80 oC 50 oC 60 oC 70 oC 80 oC ( min ) 50 oC 60 oC 70 oC 80 oC 50 oC 60 oC 70 oC 80 oC
0 38.42 38.42 38.42 38.42 0.00 0.00 0.00 0.0015 36.21 35.17 23.15 24.73 5.77 8.46 39.76 35.63 0 24.95 24.95 24.95 24.95 0.00 0.00 0.00 0.0030 32.23 30.01 18.83 18.73 16.11 21.88 50.98 51.26 15 23.51 22.84 15.03 16.06 -0.03 -0.04 -0.22 -0.1960 26.90 22.28 11.32 6.84 29.98 42.00 70.54 82.20 30 20.93 19.49 12.23 12.16 -0.08 -0.11 -0.31 -0.3190 24.21 16.09 6.11 0.00 36.99 58.12 84.09 100.00 60 17.47 14.47 7.35 4.44 -0.15 -0.24 -0.53 -0.75
120 21.79 13.48 1.31 0.00 43.29 64.93 96.59 100.00 90 15.72 10.45 3.97 0.00 -0.20 -0.38 -0.80150 19.59 9.84 0.00 0.00 49.02 74.39 100.00 100.00 120 14.15 8.75 0.85 0.00 -0.25 -0.46 -1.47180 18.33 7.38 0.00 0.00 52.30 80.80 100.00 100.00 150 12.72 6.39 0.00 0.00 -0.29 -0.59240 15.34 2.00 0.00 0.00 60.08 94.79 100.00 100.00 180 11.9 4.79 0.00 0.00 -0.32 -0.72300 12.26 0.00 0.00 0.00 68.10 100.00 100.00 100.00 240 9.96 1.30 0.00 0.00 -0.40 -1.28
300 7.96 0.00 0.00 0.00 -0.50
Variation of the copper cementation rate constant ( K ) with temperature
-5.40
-5.30
-5.20
-5.10
-5.00
-4.90
-4.80
-4.70
-4.60
-4.50
2.80 2.85 2.90 2.95 3.00 3.05 3.10 3.15
Temperature (1000/T), KLo
g K
, cm
/s
Ea = 18.2 kJ/mol
Ea = 74.6 kJ/mol
25 g/L initial Cu90 g/L initial acid205 rpm1.7 kg/L P.D.
Copper precipitation as a function of leaching time at different temperaturevalues ( 205 rpm, 1.7 kg/L P.D. )
0
20
40
60
80
100
120
0 15 30 60 90 120 150 180 240 300
Leaching time, min
Cop
per p
reci
pita
tion,
%
50 oC60 oC70 oC80 oC


Figure A1.9: Copper concentration as a function of leaching time at different temperature values (205 rpm, 25g/L initial Cu, 90g/L initial acid, 1.7 kg/L pulp density)
0
4
8
12
16
20
24
28
0 15 30 60 90 120 150 180 240 300
Leaching Time, min
Cop
per c
once
ntra
tion,
g/L
50 oC
60 deg.
70 deg.
80 deg.


TABLE A1.11: DETERMINATION OF COPPER CEMENTATION RATE CONSTANTS FOR STAGE 1OF CEMENTATION REACTION AT DIFFERENT TEMPERATURE VALUES
Leaching conditions Specific surface area of matte ( cm2/g ) 66982Pulp densit 1.7 Mass of matte ( g ): 1276Stirring rate205 Volume of solution ( cm3 ) 1537Leaching tim5 hrsMatte (kg): 1.28
Temperature ( T ) Slope of graph rate constant TEMPERATURE ACTIVATION ENERGY( oC ) (oK ) 1000/T for reaction stage 1 K1 X 10 -3 ( cm / s ) K1/1000 Log K1 Range ( oC ) Ea ( kJ/mol )
( oK 0
80 353 2.83 0.0018 0.02709 0.000027 -4.57 80 - 70 18.270 343 2.92 0.0039 0.02261 0.000023 -4.65 70 - 50 74.660 333 3.00 0.0091 0.00969 0.000010 -5.0150 323 3.10 0.0109 0.00447 0.000004 -5.35
Variation of the copper cementation rate constant ( K ) with temperature
-2.0
-1.8
-1.6
-1.4
-1.2
-1.0
-0.8
-0.6
-0.4
-0.2
0.0
0 30 60 90 120 150 180 210 240 270 300 330
Leaching Time, min
Log
[Cu]
t / [C
u]o
50 deg.
60 deg.
70 deg.
80 deg.


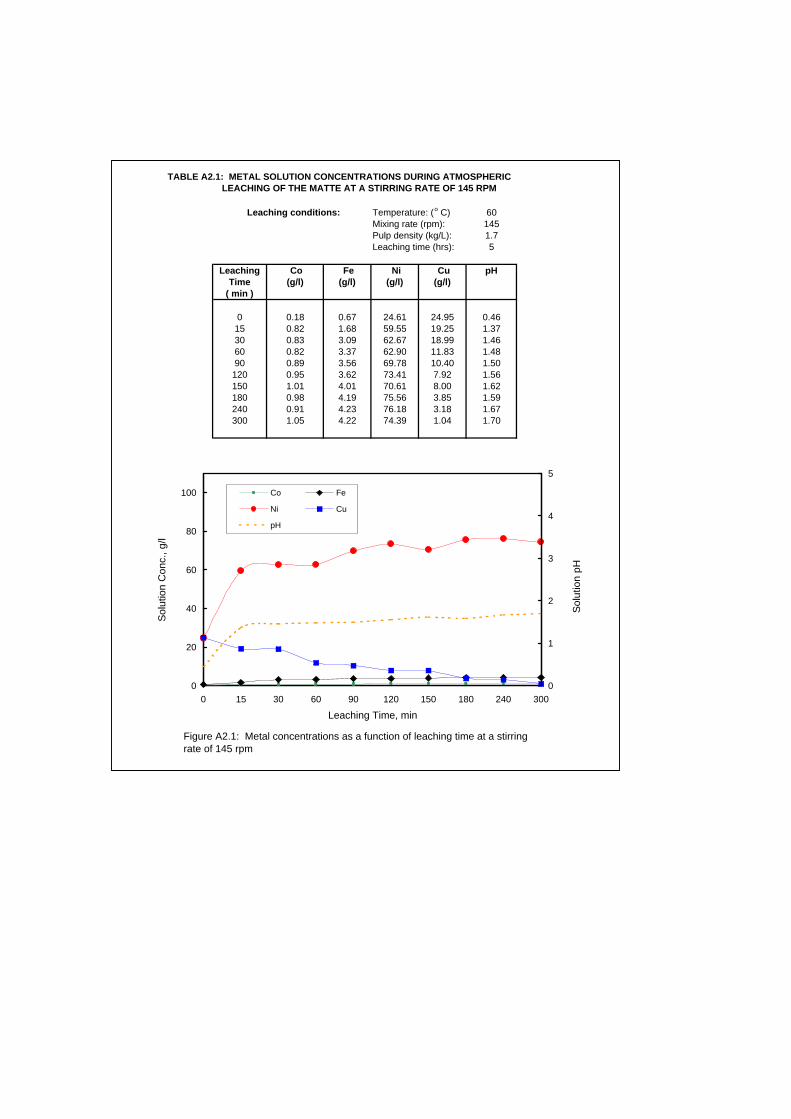
TABLE A2.1: METAL SOLUTION CONCENTRATIONS DURING ATMOSPHERIC LEACHING OF THE MATTE AT A STIRRING RATE OF 145 RPM
Leaching conditions: Temperature: (o C) 60Mixing rate (rpm): 145Pulp density (kg/L): 1.7Leaching time (hrs): 5
Leaching Co Fe Ni Cu pHTime (g/l) (g/l) (g/l) (g/l)
( min )
0 0.18 0.67 24.61 24.95 0.4615 0.82 1.68 59.55 19.25 1.3730 0.83 3.09 62.67 18.99 1.4660 0.82 3.37 62.90 11.83 1.4890 0.89 3.56 69.78 10.40 1.50120 0.95 3.62 73.41 7.92 1.56150 1.01 4.01 70.61 8.00 1.62180 0.98 4.19 75.56 3.85 1.59240 0.91 4.23 76.18 3.18 1.67300 1.05 4.22 74.39 1.04 1.70
Figure A2.1: Metal concentrations as a function of leaching time at a stirringrate of 145 rpm
0
20
40
60
80
100
0 15 30 60 90 120 150 180 240 300
Leaching Time, min
Solu
tion
Con
c., g
/l
0
1
2
3
4
5
Solu
tion
pH
Co Fe
Ni Cu
pH

TABLE A2.2: METAL EXTRACTIONS BASED ON SOLUTION CONCENTRATIONS DURING ATMOSPHERIC LEACHNG OF THE MATTE AT A STIRRING RATE OF 145 RPM
Leaching conditions: Temperature (o C): 60Mixing rate (rpm): 145Pulp density (kg/L): 1.7 Metal content of matteLeaching time (hrs): 5 Ni 614.14 g (47.98%)Matte (kg): 1.28 Co 4.35 g (0.34%)Solution (L): 1.54 Fe 7.68 g (0.6%)
Leaching Ni Ni Ni Co Co Co Fe Fe FeTime (g/l) (g) Leach (g/l) (g) leach (g/l) (g) %
( min ) % %
0 24.61 37.90 0.00 0.18 0.28 0 0.67 1.03 015 59.55 91.71 8.76 0.82 1.26 22.65 1.68 2.59 20.2530 62.67 96.43 9.53 0.83 1.28 23.13 3.09 4.72 48.0760 62.90 96.78 9.59 0.82 1.26 22.66 3.37 5.14 53.5090 69.78 107.03 11.26 0.89 1.37 25.01 3.56 5.42 57.12120 73.41 112.26 12.11 0.95 1.45 27.00 3.62 5.51 58.25150 70.61 108.30 11.46 1.01 1.54 28.95 4.01 6.06 65.43180 75.56 115.18 12.58 0.98 1.50 27.99 4.19 6.31 68.69240 76.18 116.03 12.72 0.91 1.40 25.79 4.23 6.36 69.40300 74.39 113.63 12.33 1.05 1.59 30.10 4.22 6.35 69.23
Fig.ure A2.2: Metal extraction as a function of leaching time at a stirringrate 145 rpm
0
10
20
30
40
50
60
70
80
0 15 30 60 90 120 150 180 240 300
Leaching Time, min
Met
al e
xtra
ctio
n, %
0
1
2
3
4
Solu
tion
pH
Co
Fe
Ni
pH

TABLE A 2.5: METAL SOLUTION CONCENTRATIONS DURING ATMOSPHERIC LEACHING OF THE MATTE AT A STIRRING RATE OF 400 RPM
Leaching conditions: Temperature: (o C) 60Mixing rate (rpm): 400Pulp density (kg/L): 1.7Leaching time (hrs): 5
Leaching Co Fe Ni Cu pHTime (g/l) (g/l) (g/l) (g/l)
( min )
0 0.18 0.67 24.61 24.95 0.4515 0.80 3.47 58.15 21.09 1.4130 1.13 4.66 84.95 23.55 1.4860 1.14 4.8 91.20 17.71 1.5890 1.20 4.9 97.93 13.98 1.74120 1.21 4.97 102.38 11.90 1.96150 1.02 4.26 101.18 8.02 2.34180 1.20 4.02 102.47 5.99 3.37240 1.09 4.18 101.00 1.58 3.85300 1.23 3.49 102.13 0.00 4.77
Figure A2.5: Metal concentrations as a function of leachingtime at a stirring rate of 400 rpm
0
20
40
60
80
100
0 15 30 60 90 120 150 180 240 300
Leaching Time, min
Sol
utio
n C
onc.
, g/L
0
1
2
3
4
5
6
Sol
utio
n pH
Co
Fe
Ni
Cu
pH

TABLE A2.6: METAL EXTRACTIONS BASED ON SOLUTION CONCENTRATIONS DURING ATMOSPHERIC LEACHNG OF THE MATTE AT A MIXING RATE OF 400 RPM
Leaching conditions: Temperature (o C): 60Mixing rate (rpm): 400 Metal content of mattePulp density (kg/L): 1.7 Ni 614.14 g (47.98%)Leaching time (hrs): 5 Co 4.35 g (0.34%)Matte (kg): 1.28 Fe 7.68 g (0.6%)Solution (L): 1.54
Leaching Ni Ni Ni Co Co Co Fe Fe FeTime (g/l) (g) Leach (g/l) (g) leach (g/l) (g) leach
( min ) % % %
0 24.61 37.90 0.00 0.18 0.28 0 0.67 1.03 015 58.15 89.55 8.41 0.80 1.23 21.94 3.47 5.34 56.1530 84.95 130.15 15.02 1.13 1.73 33.43 4.66 7.15 79.6260 91.20 139.62 16.56 1.14 1.75 33.77 4.8 7.36 82.3490 97.93 149.65 18.20 1.20 1.83 35.79 4.9 7.50 84.24120 102.38 156.06 19.24 1.21 1.85 36.12 4.97 7.60 85.56150 101.18 154.36 18.96 1.02 1.58 29.94 4.26 6.60 72.48180 102.47 156.15 19.25 1.20 1.83 35.69 4.02 6.26 68.13240 101.00 154.15 18.93 1.09 1.68 32.24 4.18 6.48 70.98300 102.13 155.66 19.17 1.23 1.87 36.55 3.49 5.56 58.94
Figure A2.6: Metal extractions as a function of leaching time at a stirringrate of 400 rpm
0
20
40
60
80
100
0 15 30 60 90 120 150 180 240 300
Leaching Time, min
Met
al e
xtra
ctio
n, %
0
1
2
3
4
5
6
Sol
utio
n pH
Co
Fe
Ni
pH

TABLE A 2.5B: METAL SOLUTION CONCENTRATIONS DURING ATMOSPHERIC LEACHING OF THE MATTE AT A STIRRING RATE OF 400 RPM - SECOND TEST
Leaching conditions: Temperature: (oC) 60Mixing rate (rpm): 400Pulp density (kg/L): 1.7Leaching time (hrs): 5
Leaching Co Fe Ni CuTime (g/L) (g/L) (g/L) (g/L)
( min )
0 0.18 0.67 24.61 24.9515 0.71 3.02 62.55 20.4830 0.98 4.18 76.65 18.5760 1.06 4.67 85.97 15.0590 1.14 4.86 91.03 12.03120 1.26 4.57 98.87 9.64150 1.12 4.12 102.23 5.78180 1.86 4.16 101.98 6.09240 1.21 3.07 102.55 3.18300 1.25 3.13 101.96 0.00
Figure A2.5B: Metal concentrations as a function of leachingtime at a stirring rate of 400 rpm - second test
0
20
40
60
80
100
0 15 30 60 90 120 150 180 240 300
Leaching Time, min
Sol
utio
n C
onc.
, g/L
Co
Fe
Ni
Cu
pH
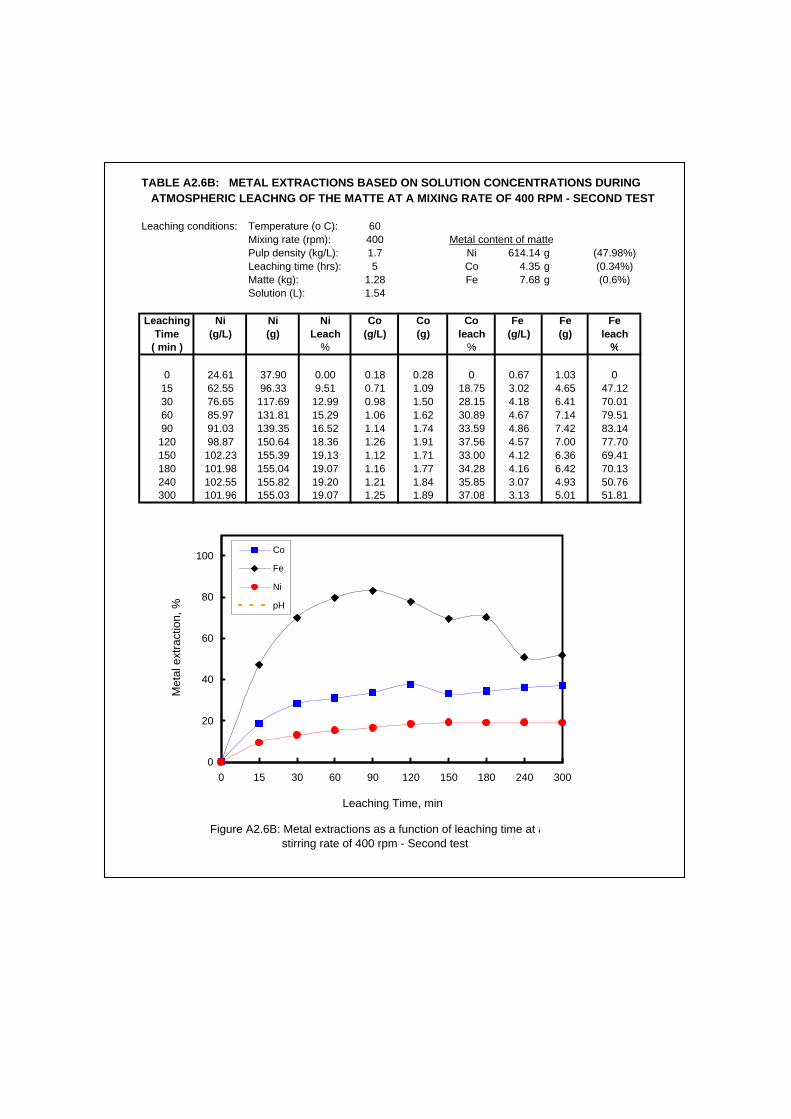
TABLE A2.6B: METAL EXTRACTIONS BASED ON SOLUTION CONCENTRATIONS DURING ATMOSPHERIC LEACHNG OF THE MATTE AT A MIXING RATE OF 400 RPM - SECOND TEST
Leaching conditions: Temperature (o C): 60Mixing rate (rpm): 400 Metal content of mattePulp density (kg/L): 1.7 Ni 614.14 g (47.98%)Leaching time (hrs): 5 Co 4.35 g (0.34%)Matte (kg): 1.28 Fe 7.68 g (0.6%)Solution (L): 1.54
Leaching Ni Ni Ni Co Co Co Fe Fe FeTime (g/L) (g) Leach (g/L) (g) leach (g/L) (g) leach
( min ) % % %
0 24.61 37.90 0.00 0.18 0.28 0 0.67 1.03 015 62.55 96.33 9.51 0.71 1.09 18.75 3.02 4.65 47.1230 76.65 117.69 12.99 0.98 1.50 28.15 4.18 6.41 70.0160 85.97 131.81 15.29 1.06 1.62 30.89 4.67 7.14 79.5190 91.03 139.35 16.52 1.14 1.74 33.59 4.86 7.42 83.14120 98.87 150.64 18.36 1.26 1.91 37.56 4.57 7.00 77.70150 102.23 155.39 19.13 1.12 1.71 33.00 4.12 6.36 69.41180 101.98 155.04 19.07 1.16 1.77 34.28 4.16 6.42 70.13240 102.55 155.82 19.20 1.21 1.84 35.85 3.07 4.93 50.76300 101.96 155.03 19.07 1.25 1.89 37.08 3.13 5.01 51.81
Figure A2.6B: Metal extractions as a function of leaching time at astirring rate of 400 rpm - Second test
0
20
40
60
80
100
0 15 30 60 90 120 150 180 240 300
Leaching Time, min
Met
al e
xtra
ctio
n, %
Co
Fe
Ni
pH

TABLE A2.3: METAL SOLUTION CONCENTRATIONS DURING ATMOSPHERIC LEACHING OF THE MATTE AT A STIRRING RATE OF 205 RPM
Leaching conditions: Temperature: 60 oCAgitation: 205 rpmPulp density: 1.7 kg/L
Leaching Co Fe Ni Cu pHTime (g/l) (g/l) (g/l) (g/l)
( min )
0 0.18 0.67 24.61 24.95 0.9715 0.77 3.35 64.11 22.84 1.1030 0.79 3.44 66.16 19.49 1.1160 0.80 3.68 68.85 14.47 1.1890 0.79 3.80 71.18 10.45 1.28120 0.91 3.91 78.69 8.75 1.34150 0.88 3.96 80.00 6.39 1.43180 0.96 4.05 86.80 4.79 1.51240 0.91 4.08 88.33 1.30 1.61300 1.01 4.24 94.44 0.00 1.90
Fig. A2.3: Metal concentrations as a function of leaching time at stirring rate of 205 rpm
0
10
20
30
40
50
60
70
80
90
100
0 15 30 60 90 120 150 180 240 300
Leaching Time, min
Solu
tion
Con
c., g
/l
0
1
2
3
4
5
Solu
tion
pH
Co FeNi CupH

TABLE A2.4: METAL EXTRACTIONS BASED ON SOLUTION CONCENTRATIONS DURING ATMOSPHERIC LEACHING OF THE MATTE AT A STIRRING RATE OF 205 RPM
Leaching conditions: Temperature: 60 oC Metal content of matte:Agitation: 205 rpm Ni 612.22 g (47.98%)Pulp density: 1.7 kg/L Co 4.34 g (0.34 %)Matte: 1.28 kg Fe 7.66 g (0.60 %)Solution: 1.54 L
Leaching Ni Ni Ni Co Co Co Fe Fe FeTime (g/l) (g) Leach (g/l) (g) leach (g/l) (g) ( % )
( min ) % %
0 24.61 37.83 0.00 0.18 0.28 0 0.67 1.03 015 64.11 98.54 9.92 0.77 1.18 20.90 3.35 5.15 53.8030 66.16 101.64 10.42 0.79 1.21 21.60 3.44 5.29 55.5860 68.85 105.71 11.09 0.80 1.23 21.94 3.68 5.64 60.2490 71.18 109.17 11.65 0.79 1.21 21.61 3.80 5.82 62.61120 78.69 119.96 13.42 0.91 1.39 25.58 3.91 5.98 64.60150 80.00 121.81 13.72 0.88 1.34 24.60 3.96 6.05 65.52180 86.80 131.24 15.26 0.96 1.46 27.16 4.05 6.17 67.15240 88.33 133.33 15.60 0.91 1.39 25.59 4.08 6.21 67.69300 94.44 141.49 16.93 1.01 1.52 28.67 4.24 6.43 70.48300
Figure A2.4: Metal extractions as a function of leaching time at stirring rate of 205 rpm
0
10
20
30
40
50
60
70
80
0 15 30 60 90 120 150 180 240 300
Leaching Time, min
Met
al e
xtra
ctio
n, %
0
1
2
3
4
Sol
utio
n pH
CoFeNipH

Comparison of leaching at 400 rpm
0
20
40
60
80
100
0 15 30 60 90 120 150 180 240 300
Leaching Time, min
Met
al e
xtra
ctio
n, %
Test 2 - Co
Test 2 - Fe
Test 2 - Ni
Test 1 - Co
Test 1 - Fe
Test 1 - Ni

TABLE A2.8: COPPER PRECIPITATION DURING ATMOSPHERIC LEACHING OF THE MATTE AT DIFFERENT STIRRING RATES
Leaching conditions Feed matte Feed solutionPulp density ( kg/L ) 1.7 Mass ( kg ) 1.28 Volume (mL) 1.54Stirring rate (rpm ): 205 Ni ( % ) 47.98% Ni (g/L) 24.61Leaching time ( hr ): 5 hrs Cu ( % ) 31.31 Cu (g/L) 24.95Matte (kg): 1.28 Co ( % ) 0.34% Co (g/L) 0.18
Fe ( % ) 0.6% Fe (g/L) 0.67
Leaching Copper in leach solution, g Copper precipitation, %Time
( min ) 145 rpm 205 rpm 400 rpm 145 rpm 205 rpm 400 rpm
0 38.42 38.42 38.42 0.00 0.00 0.0015 35.81 35.17 32.48 6.81 8.46 15.4730 29.24 30.01 31.65 23.89 21.88 17.6460 18.22 22.28 22.05 52.59 42.00 42.6190 16.02 16.09 17.06 58.32 58.12 55.59120 13.74 13.48 12.40 64.25 64.93 67.74150 12.32 9.78 12.35 67.94 74.55 67.86180 5.93 7.38 6.34 84.57 80.80 83.49240 4.90 2.00 2.43 87.25 94.79 93.67300 1.60 0.00 0.00 95.83 100.00 100.00
TABLE A2.9: DETERMINATION OF COPPER CEMENTATION RATE CONSTANTS FOR CEMENTATION REACTION AT DIFFERENT STIRRING RATE VALUES
Leaching conditions Pulp density ( kg/L ) 1.7 Specific surface area of matte, A ( cm2/g ) 66982Stirring rate (rpm ): 205 Mass of matte ( g ): 1276Leaching time ( hr ): 5 hrs Volume of solution ( cm3 ) 1537Matte (kg): 1.28 Slope of graph = (KxA) / (2.303V)
Stirring rate Slope rate constant( rpm ) (stage 1) K1 X 10 -3 ( cm / s )
145 0.0037 0.009205 0.0040 0.010400 0.0039 0.010
Note: Cementation rate constant obtained from slope of graph in Figure 6.15

TABLE A2.7: COPPER SOLUTION CONCENTRATION DURING ATMOSPHERIC LEACHING OF THE MATTE AT DIFFERENT STIRRING RATES
Leaching conditions Feed matte Feed solutionTemperature ( oC ): 60 Mass ( kg ) 1.28 Volume ( mL ) 1.54Stirring rate (rpm ): 205 Ni ( % ) 47.98% Ni 24.61Pulp density ( kg/L ): 1.7 Cu ( % ) 31.31 Cu 24.95Leaching time ( hr ): 5 hrs Co ( % ) 0.34% Co 0.18Matte (kg): 1.28 Fe ( % ) 0.6% Fe 0.67
Leaching Copper concentration, g/L Log [Cu 2+]t / [Cu2+]0
Time( min ) 145 rpm 205 rpm 400 rpm 145 rpm 205 rpm 400 rpm
0 24.95 24.95 24.95 0 0.00 0.0015 23.25 22.84 21.09 -0.03 -0.04 -0.0730 18.99 19.49 20.55 -0.12 -0.11 -0.0860 11.83 14.47 14.32 -0.32 -0.24 -0.2490 10.40 10.45 11.08 -0.38 -0.38 -0.35120 8.92 8.75 8.05 -0.45 -0.46 -0.49150 8.00 6.35 8.02 -0.49 -0.59 -0.49180 3.85 4.79 4.12 -0.81 -0.72 -0.78240 3.18 1.30 1.58 -0.89 -1.28 -1.20300 1.04 0.00 0.00 -1.38
Figure A2.7: Copper concentration as a function of leaching time for the different stirring rates
0
4
8
12
16
20
24
28
0 15 30 60 90 120 150 180 240 300Leaching time, min
Cop
per c
once
ntra
tion,
g/L
145 rpm205 rpm400 rpm

-2.0
-1.8
-1.6
-1.4
-1.2
-1.0
-0.8
-0.6
-0.4
-0.2
0.0
0 30 60 90 120 150 180 210 240 270 300 330
Leaching Time, min
Log
[Cu]
t / [C
u]o
145 rpm
205 rpm
400 rpm
0.000
0.002
0.004
0.006
0.008
0.010
0.012
0.014
50 100 150 200 250 300 350 400 450
Stirring rate, rpm
K X
10
-3, c
m/s
25 g/L initial Cu60 oC90 g/L initial acid1.7 kg/L P.D.
0
20
40
60
80
100
120
0 15 30 60 90 120 150 180 240 300
Leaching time, min
Cop
per p
reci
pita
tion,
%
145 rpm205 rpm400 rpm

TABLE A2.1: METAL SOLUTION CONCENTRATIONS DURING ATMOSPHERIC LEACHING OF THE MATTE AT A STIRRING RATE OF 145 RPM
Leaching conditions: Temperature: (o C) 60Mixing rate (rpm): 145Pulp density (kg/L): 1.7Leaching time (hrs): 5
Leaching Co Fe Ni Cu pHTime (g/l) (g/l) (g/l) (g/l)
( min )
0 0.18 0.67 24.61 24.95 0.4615 0.82 1.68 59.55 19.25 1.3730 0.83 3.09 62.67 18.99 1.4660 0.82 3.37 62.90 11.83 1.4890 0.89 3.56 69.78 10.40 1.50120 0.95 3.62 73.41 7.92 1.56150 1.01 4.01 70.61 8.00 1.62180 0.98 4.19 75.56 3.85 1.59240 0.91 4.23 76.18 3.18 1.67300 1.05 4.22 74.39 1.04 1.70
Figure A2.1: Metal concentrations as a function of leaching time at a stirringrate of 145 rpm
0
20
40
60
80
100
0 15 30 60 90 120 150 180 240 300
Leaching Time, min
Solu
tion
Con
c., g
/l
0
1
2
3
4
5
Solu
tion
pH
Co Fe
Ni Cu
pH
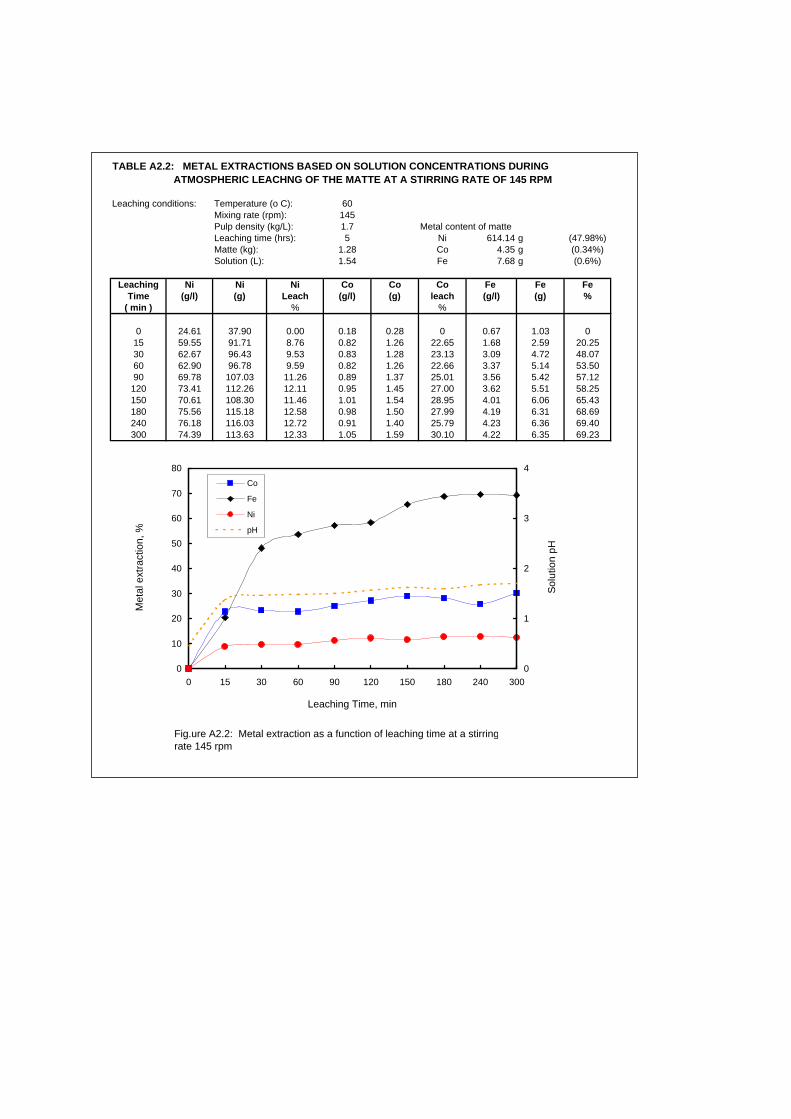
TABLE A2.2: METAL EXTRACTIONS BASED ON SOLUTION CONCENTRATIONS DURING ATMOSPHERIC LEACHNG OF THE MATTE AT A STIRRING RATE OF 145 RPM
Leaching conditions: Temperature (o C): 60Mixing rate (rpm): 145Pulp density (kg/L): 1.7 Metal content of matteLeaching time (hrs): 5 Ni 614.14 g (47.98%)Matte (kg): 1.28 Co 4.35 g (0.34%)Solution (L): 1.54 Fe 7.68 g (0.6%)
Leaching Ni Ni Ni Co Co Co Fe Fe FeTime (g/l) (g) Leach (g/l) (g) leach (g/l) (g) %
( min ) % %
0 24.61 37.90 0.00 0.18 0.28 0 0.67 1.03 015 59.55 91.71 8.76 0.82 1.26 22.65 1.68 2.59 20.2530 62.67 96.43 9.53 0.83 1.28 23.13 3.09 4.72 48.0760 62.90 96.78 9.59 0.82 1.26 22.66 3.37 5.14 53.5090 69.78 107.03 11.26 0.89 1.37 25.01 3.56 5.42 57.12120 73.41 112.26 12.11 0.95 1.45 27.00 3.62 5.51 58.25150 70.61 108.30 11.46 1.01 1.54 28.95 4.01 6.06 65.43180 75.56 115.18 12.58 0.98 1.50 27.99 4.19 6.31 68.69240 76.18 116.03 12.72 0.91 1.40 25.79 4.23 6.36 69.40300 74.39 113.63 12.33 1.05 1.59 30.10 4.22 6.35 69.23
Fig.ure A2.2: Metal extraction as a function of leaching time at a stirringrate 145 rpm
0
10
20
30
40
50
60
70
80
0 15 30 60 90 120 150 180 240 300
Leaching Time, min
Met
al e
xtra
ctio
n, %
0
1
2
3
4
Solu
tion
pH
Co
Fe
Ni
pH

TABLE A3.5: METAL SOLUTION CONCENTRATIONS DURING ATMOSPHERIC LEACHING OF THE MATTE AT A PULP DENSITY OF 1.75 kg/L
Leaching conditions: Temperature: (o C) 60Mixing rate (rpm): 205Pulp density (kg/L): 1.75Leaching time (hrs): 5
Leaching Co Fe Ni CuTime (g/l) (g/l) (g/l) (g/l) pH
( min )0 0.18 0.67 24.61 24.95 0.75
15 0.95 3.72 66.27 24.16 1.7530 1.00 3.90 72.58 20.31 1.7860 1.07 4.11 79.87 15.75 1.9090 1.15 4.35 86.34 11.90 2.26
120 1.14 4.26 87.00 8.94 2.34150 1.19 4.36 91.11 7.44 2.40180 1.19 4.35 93.53 5.12 2.74240 1.21 4.39 96.98 2.98 3.31300 1.25 4.33 100.51 0.25 5.09
Figure A3.5: Metal concentration as a function of leaching timat a pulp density of 1.75Kg/L
0
20
40
60
80
100
0 15 30 60 90 120 150 180 240 300
Leaching Time, min
Sol
utio
n C
onc.
, g/l
0
1
2
3
4
5
6
7
Sol
utio
n pH
FeNiCuCopH

TABLE A3.6: METAL EXTRACTION BASED ON SOLUTION CONCENTRATIONS DURING ATMOSPHERIC LEACHING OF THE MATTE AT AT A PULP DENSITY OF 1.75 kg/L
Leaching conditions: Temperature (o C): 60 Metal content of matte:Mixing rate (rpm): 205 Ni 719.70 g (47.98%)Pulp density (kg/L): 1.75 Co 5.10 g (0.34%)Leaching time (hrs): 5 Fe 9.00 g (0.6%)Matte (kg): 1.5Solution (L): 1.69
Leaching Ni Ni Ni Co Co Co Fe Fe FeTime (g/l) (g) Leach (g/l) (g) leach (g/l) (g) Leach
( min ) % % %
0 24.61 41.59 0.00 0.18 0.30 0 0.67 1.13 015 66.27 112.00 9.78 0.95 1.61 25.52 3.72 6.29 57.2730 72.58 121.46 11.10 1.00 1.69 27.15 3.90 6.59 60.6060 79.87 133.26 12.74 1.07 1.80 29.40 4.11 6.93 64.4390 86.34 143.53 14.16 1.15 1.93 31.93 4.35 7.32 68.74
120 87.00 144.41 14.29 1.14 1.92 31.62 4.26 7.18 67.15150 91.11 150.83 15.18 1.19 2.00 33.15 4.36 7.33 68.88180 93.53 154.45 15.68 1.19 2.00 33.15 4.35 7.32 68.71240 96.98 159.62 16.40 1.21 2.03 33.75 4.39 7.38 69.39300 100.51 164.79 17.12 1.25 2.09 34.92 4.33 7.29 68.39
Figure A3.6: Metal extraction as a function of leaching time at a pulp density o1.75 kg/L
0
10
20
30
40
50
60
70
80
0 15 30 60 90 120 150 180 240 300
Leaching Time, min
Met
al e
xtra
ctio
n, %
0
1
2
3
4
5
6
7
Sol
utio
n pH
Co Fe
Ni pH

TABLE A3.1: METAL SOLUTION CONCENTRATIONS DURING ATMOSPHERIC LEACHING OF THE MATTE AT A PULP DENSITY OF 1.6 kg/L
Leaching conditions: Temperature: (o C) 60Mixing rate (rpm): 205Pulp density (kg/L): 1.6Leaching time (hrs): 5
Leaching Co Fe Ni CuTime (g/l) (g/l) (g/l) (g/l) pH
( min )0 0.18 0.67 24.61 24.95 0.75
15 0.88 3.62 64.13 26.11 1.3230 0.96 3.79 66.22 22.33 1.3260 0.94 3.90 69.05 18.42 1.3690 0.96 4.02 72.90 16.12 1.40120 0.96 4.01 73.46 14.21 1.34150 0.96 4.01 74.46 12.87 1.37180 1.03 4.03 81.89 11.98 1.39240 1.00 4.05 84.17 9.97 1.40 `300 1.05 4.06 86.52 8.15 1.45
Figure A3.1: Metal concentration as a function of leaching time at a pulp density of 1.6Kg/L
0
20
40
60
80
100
0 15 30 60 90 120 150 180 240 300
Leaching Time, min
Solu
tion
Con
c., g
/L
0
1
2
3
4
Solu
tion
pH
Fe NiCu CopH

TABLE A3.2: METAL EXTRACTION BASED ON SOLUTION CONCENTRATIONS DURING ATMOSPHERIC LEACHING OF THE MATTE AT A PULP DENSITY OF 1.6 kg/L
Leaching conditions: Temperature (o C): 60 Metal content of matte:Mixing rate (rpm): 205 Ni 532.58 g (47.98%)Pulp density (kg/L): 1.6 Co 3.77 g (0.34%)Leaching time (hrs): 5 Fe 6.66 g (0.6%)Matte (kg): 1.11Solution (L): 1.78
Leaching Ni Ni Ni Co Co Co Fe Fe FeTime (g/l) (g) Leach (g/l) (g) leach (g/l) (g) Leach
( min ) % % %
0 24.61 43.81 0.00 0.18 0.32 0 0.67 1.19 015 64.13 114.15 13.21 0.88 1.57 33.02 3.62 6.44 78.8430 66.22 116.83 13.71 0.96 1.71 36.74 3.79 6.74 83.3260 69.05 121.68 14.62 0.94 1.67 35.82 3.90 6.93 86.1890 72.90 128.17 15.84 0.96 1.71 36.72 4.02 7.14 89.25
120 73.46 129.01 16.00 0.96 1.71 36.72 4.01 7.12 89.00150 74.46 130.65 16.31 0.96 1.71 36.72 4.01 7.12 89.00180 81.89 142.74 18.58 1.03 1.82 39.75 4.03 7.15 89.52240 84.17 146.21 19.23 1.00 1.77 38.47 4.05 7.19 90.01300 86.52 149.87 19.92 1.05 1.85 40.56 4.06 7.20 90.21
Figure A3.2: Metal extraction as a function of leaching time at a pulp density of 1.6 kg/L
0
10
20
30
40
50
60
70
80
90
100
0 15 30 60 90 120 150 180 240 300
Leaching Time, min
Met
al e
xtra
ctio
n, %
0
1
2
3
4
Solu
tion
pH
Co
Fe
Ni
pH

TABLE A3.3: METAL SOLUTION CONCENTRATIONS DURING ATMOSPHERIC LEACHING OF THE MATTE AT A PULP DENSITY OF 1.7 kg/L
Leaching conditions: Temperature: 60 oCAgitation: 205 rpmPulp density: 1.7 kg/L
Leaching Co Fe Ni Cu pHTime (g/l) (g/l) (g/l) (g/l)
( min )
0 0.18 0.67 24.61 0.67 0.9715 0.77 3.35 64.11 3.35 1.1030 0.79 3.44 66.16 3.44 1.1160 0.80 3.68 68.85 3.68 1.1890 0.79 3.80 71.18 3.80 1.28120 0.91 3.91 78.69 3.91 1.34150 0.88 3.96 80.00 3.96 1.43180 0.96 4.05 86.80 4.05 1.51240 0.91 4.08 88.33 4.08 1.61300 1.01 4.24 94.44 4.24 1.90
Fig. A3.3: Metal concentrations as a function of leaching time at pulp density of 1.7 kg/L
0
10
20
30
40
50
60
70
80
90
100
0 15 30 60 90 120 150 180 240 300
Leaching Time, min
Solu
tion
Con
c., g
/l
0
1
2
3
4
5
Solu
tion
pH
Co FeNi CupH

TABLE A3.4: METAL EXTRACTIONS BASED ON SOLUTION CONCENTRATIONS DURING ATMOSPHERIC LEACHING OF THE MATTE AT A PULP DENSITY OF 1.7 kg/L
Leaching conditions: Temperature: 60 oC Metal content of matte:Agitation: 205 rpm Ni 612.22 g (47.98%)Pulp density: 1.7 kg/L Co 4.34 g (0.34 %)Matte: 1.28 kg Fe 7.66 g (0.60 %)Solution: 1.54 L
Leaching Ni Ni Ni Co Co Co Fe Fe FeTime (g/l) (g) Leach (g/l) (g) leach (g/l) (g) ( % )
( min ) % %
0 24.61 37.83 0.00 0.18 0.28 0 0.67 1.03 015 64.11 98.54 9.92 0.77 1.18 20.90 3.35 5.15 53.8030 66.16 101.64 10.42 0.79 1.21 21.60 3.44 5.29 55.5860 68.85 105.71 11.09 0.80 1.23 21.94 3.68 5.64 60.2490 71.18 109.17 11.65 0.79 1.21 21.61 3.80 5.82 62.61120 78.69 119.96 13.42 0.91 1.39 25.58 3.91 5.98 64.60150 80.00 121.81 13.72 0.88 1.34 24.60 3.96 6.05 65.52180 86.80 131.24 15.26 0.96 1.46 27.16 4.05 6.17 67.15240 88.33 133.33 15.60 0.91 1.39 25.59 4.08 6.21 67.69300 94.44 141.49 16.93 1.01 1.52 28.67 4.24 6.43 70.48300
Figure A3.4: Metal extractions as a function of leaching time at pulp density of 1.7 kg/L
0
10
20
30
40
50
60
70
80
0 15 30 60 90 120 150 180 240 300
Leaching Time, min
Met
al e
xtra
ctio
n, %
0
1
2
3
4
Sol
utio
n pH
CoFeNipH

TABLE A1.3B: METAL SOLUTION CONCENTRATIONS DURING ATMOSPHERIC LEACHING OF THE MATTE AT A TEMPERATURE OF 60 O C - SECOND TEST
Leaching conditions: Temperature: 60 oCAgitation: 205 rpmPulp density: 1.7 kg/L
Leaching Co Fe Ni CuTime (g/L) (g/L) (g/L) (g/L)
( min )
0 0.17 0.67 24.61 24.9515 0.67 3.21 54.21 21.1430 0.76 3.54 69.75 19.5860 0.79 3.78 70.85 16.5790 0.76 3.89 74.16 12.25120 0.81 3.96 77.61 8.15150 0.79 3.96 82.16 5.87180 0.98 4.08 88.68 4.09240 0.97 4.18 89.32 0.92300 1.06 4.34 99.69 0.00
Fig. A1.3B: Metal concentrations as a function of leaching time at 60 o C - Second test
0
20
40
60
80
100
120
0 15 30 60 90 120 150 180 240 300
Leaching Time, min
Solu
tion
Con
c., g
/l
Co FeNi CupH

TABLE A1.4B: METAL EXTRACTIONS BASED ON SOLUTION CONCENTRATIONS DURING ATMOSPHERIC LEACHIN OF THE MATTE AT A TEMPERATURE OF 60 O C
Leaching conditions: Temperature: 60 oC Metal content of matte:Agitation: 205 rpm Ni 612.22 g (47.98%)Pulp density: 1.7 kg/L Co 4.34 g (0.34 %)Matte: 1.28 kg Fe 7.66 g (0.60 %)Solution: 1.54 L
Leaching Ni Ni Ni Co Co Co Fe Fe FeTime (g/L) (g) Leach (g/L) (g) leach (g/L) (g) ( % )
( min ) % %
0 24.61 37.83 0.00 0.17 0.26 0 0.67 1.03 015 54.21 83.32 7.43 0.67 1.03 17.78 3.21 4.93 50.9930 69.75 106.82 11.27 0.76 1.17 20.92 3.54 5.43 57.5160 70.85 108.48 11.54 0.79 1.21 21.95 3.78 5.79 62.1790 74.16 113.41 12.35 0.76 1.17 20.90 3.89 5.95 64.27120 77.61 118.36 13.15 0.81 1.24 22.59 3.96 6.05 65.59150 82.16 124.78 14.20 0.79 1.21 21.94 3.96 6.05 65.59180 88.68 133.83 15.68 0.98 1.47 28.02 4.08 6.22 67.76240 89.32 134.70 15.82 0.97 1.46 27.70 4.18 6.35 69.54300 99.69 148.56 18.09 1.06 1.58 30.48 4.34 6.57 72.33
Solidanalysis
Figure A1.4B: Metal extractions as a function of leaching time at 60 o C - second test
0
10
20
30
40
50
60
70
80
0 15 30 60 90 120 150 180 240 300
Leaching Time, min
Met
al e
xtra
ctio
n, % Co
FeNipH

Comparison of metal leaching at PD of 1.7 g/L
0
10
20
30
40
50
60
70
80
0 15 30 60 90 120 150 180 240 300
Leaching Time, min
Met
al e
xtra
ctio
n, %
Test 2 - Co
Test 2 - Fe
Test 2 - Ni
Test 1 - Co
Test 1 - Ni
Test 1 - Fe

TABLE A3.8: COPPER SOLUTION CONCENTRATION DURING ATMOSPHERIC LEACHING OF THE MATTE AT DIFFERENT PULP DENSITIES
Leaching conditions Feed matte Feed solutionTemperature ( oC ): 60 Mass ( kg ) 1.28 Volume (mL) 1.54Stirring rate (rpm ): 205 Ni ( % ) 47.98% Ni (g/L) 24.61Leaching time ( hr ): 5 Cu ( % ) 31.31 Cu (g/L) 24.95Matte (kg): 1.28 Co ( % ) 0.34% Co (g/L) 0.18
Fe ( % ) 0.6% Fe (g/L) 0.67
Leaching Copper in leach solution, g Copper precipitation, %Time
( min ) 1.6 kg/L 1.7 kg/L 1.75 kg/L 1.6 kg/L 1.7 kg/L 1.75 kg/LP.D. P.D. P.D. P.D. P.D. P.D.
0 38.42 38.42 38.42 0.00 0.00 0.0015 35.59 35.17 37.21 7.37 8.46 3.1730 34.39 30.01 31.28 10.50 21.88 18.6060 28.37 22.28 24.32 26.17 42.00 36.7190 24.82 16.09 18.33 35.39 58.12 52.30
120 21.88 13.48 13.77 43.05 64.93 64.17150 19.82 9.84 11.46 48.42 74.39 70.18180 18.45 7.38 10.96 51.98 80.80 71.46240 15.35 2.00 4.59 60.04 94.79 88.06300 12.55 0.00 0.00 67.33 100.00 100.00
TABLE A3.9: DETERMINATION OF COPPER CEMENTATION RATE CONSTANTS FOR CEMENTATION REACTION AT DIFFERENT PULP DENSITY VALUES
Leaching conditions Temperature ( oC ): 60 Specific surface area of matte, A ( cm2/g ) 66982Stirring rate (rpm ): 205 Mass of matte ( g ): 1276Leaching time ( hr ): 5 hrs Volume of solution ( cm3 ) 1537Matte (kg): 1.28 Slope of graph = (KxA) / (2.303V)
Pulp density Slope rate constant(kg/L ) (stage 1) K1 X 10 -3 ( cm / s )
1.6 0.0017 0.0041.7 0.0039 0.010
1.75 0.0033 0.008
Note: Cementation rate constant obtained from slope of graph in Figure 6.22
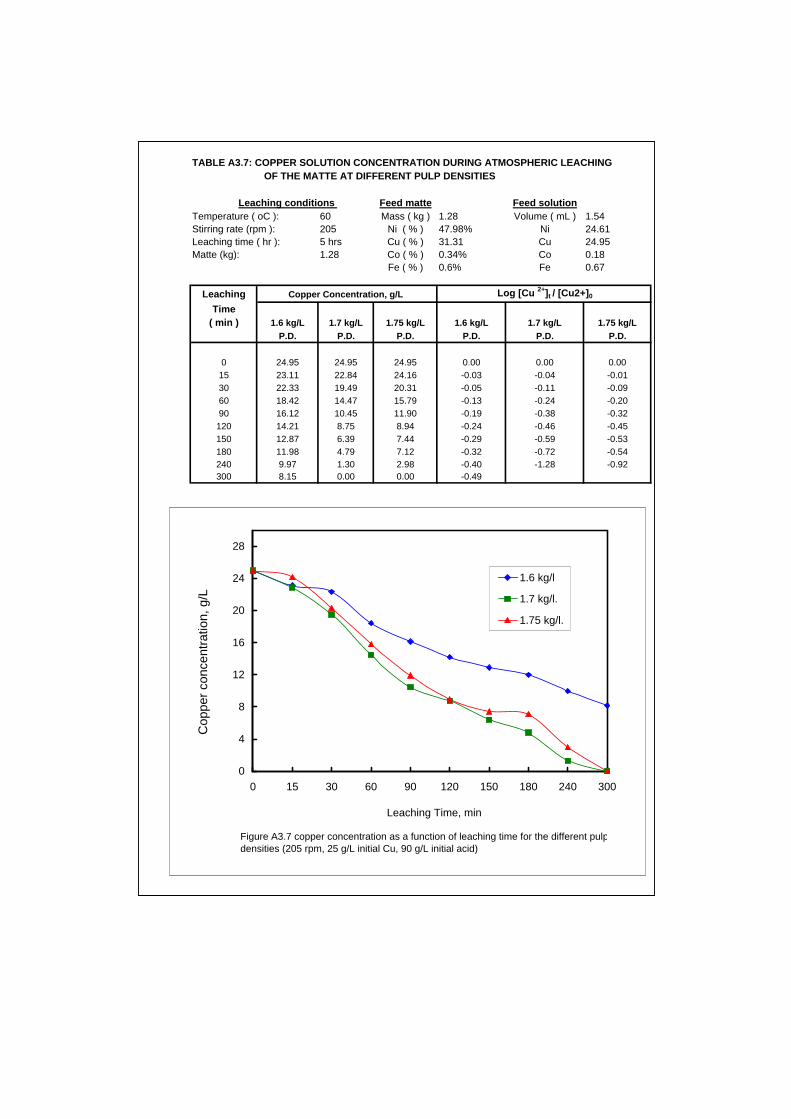
TABLE A3.7: COPPER SOLUTION CONCENTRATION DURING ATMOSPHERIC LEACHING OF THE MATTE AT DIFFERENT PULP DENSITIES
Leaching conditions Feed matte Feed solutionTemperature ( oC ): 60 Mass ( kg ) 1.28 Volume ( mL ) 1.54Stirring rate (rpm ): 205 Ni ( % ) 47.98% Ni 24.61Leaching time ( hr ): 5 hrs Cu ( % ) 31.31 Cu 24.95Matte (kg): 1.28 Co ( % ) 0.34% Co 0.18
Fe ( % ) 0.6% Fe 0.67
Leaching Copper Concentration, g/L Log [Cu 2+]t / [Cu2+]0
Time( min ) 1.6 kg/L 1.7 kg/L 1.75 kg/L 1.6 kg/L 1.7 kg/L 1.75 kg/L
P.D. P.D. P.D. P.D. P.D. P.D.
0 24.95 24.95 24.95 0.00 0.00 0.0015 23.11 22.84 24.16 -0.03 -0.04 -0.0130 22.33 19.49 20.31 -0.05 -0.11 -0.0960 18.42 14.47 15.79 -0.13 -0.24 -0.2090 16.12 10.45 11.90 -0.19 -0.38 -0.32
120 14.21 8.75 8.94 -0.24 -0.46 -0.45150 12.87 6.39 7.44 -0.29 -0.59 -0.53180 11.98 4.79 7.12 -0.32 -0.72 -0.54240 9.97 1.30 2.98 -0.40 -1.28 -0.92300 8.15 0.00 0.00 -0.49
Figure A3.7 copper concentration as a function of leaching time for the different pulpdensities (205 rpm, 25 g/L initial Cu, 90 g/L initial acid)
0
4
8
12
16
20
24
28
0 15 30 60 90 120 150 180 240 300
Leaching Time, min
Cop
per c
once
ntra
tion,
g/L
1.6 kg/l
1.7 kg/l.
1.75 kg/l.

-2.0
-1.8
-1.6
-1.4
-1.2
-1.0
-0.8
-0.6
-0.4
-0.2
0.0
0 30 60 90 120 150 180 210 240 270 300 330
Leaching Time, min
Log
[Cu]
t / [C
u]o
1.6 kg/l
1.7 kg/l
1.75 kg/l
0
20
40
60
80
100
120
0 15 30 60 90 120 150 180 240 300
Leaching time, min
Cop
per p
reci
pita
tion,
%1.6 kg/L
1.7 kg/L
1.75 kg/L
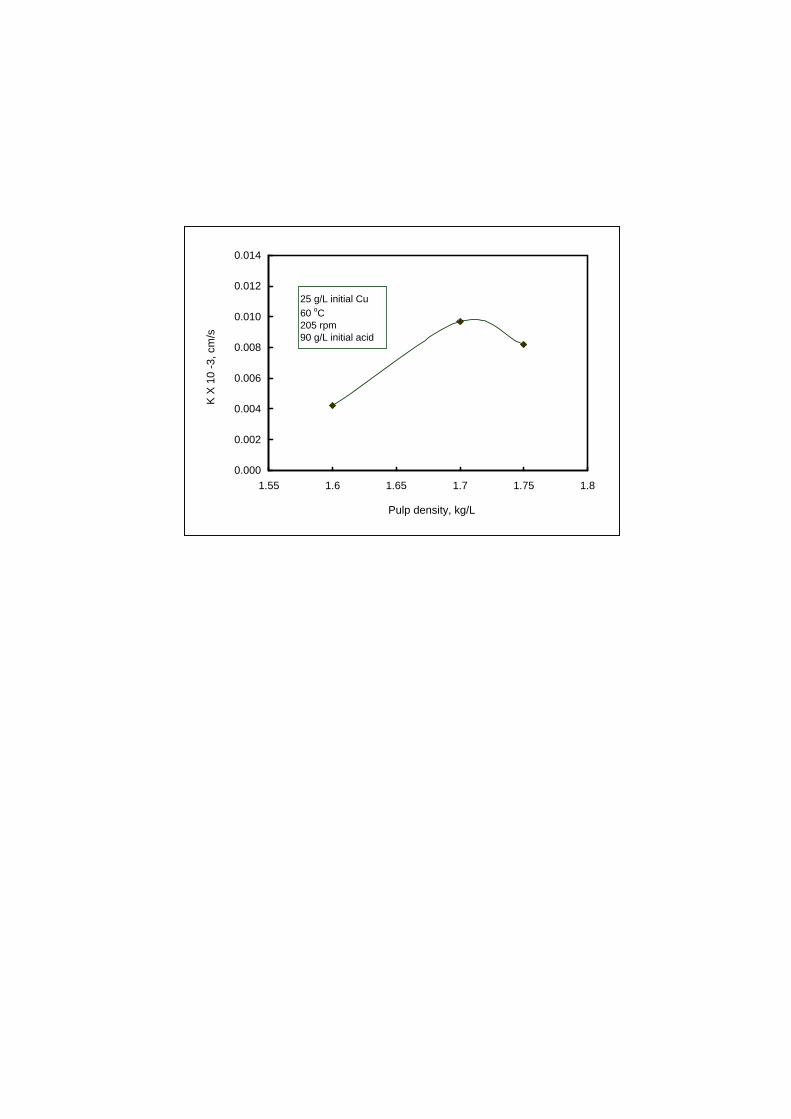
0.000
0.002
0.004
0.006
0.008
0.010
0.012
0.014
1.55 1.6 1.65 1.7 1.75 1.8
Pulp density, kg/L
K X
10
-3, c
m/s
25 g/L initial Cu60 oC205 rpm90 g/L initial acid

TABLE A 2.5B: METAL SOLUTION CONCENTRATIONS DURING ATMOSPHERIC LEACHING OF THE MATTE AT A STIRRING RATE OF 400 RPM - SECOND TEST
Leaching conditions: Temperature: (oC) 60Mixing rate (rpm): 400Pulp density (kg/L): 1.7Leaching time (hrs): 5
Leaching Co Fe Ni CuTime (g/L) (g/L) (g/L) (g/L)
( min )
0 0.18 0.67 24.61 24.9515 0.71 3.02 62.55 20.4830 0.98 4.18 76.65 18.5760 1.06 4.67 85.97 15.0590 1.14 4.86 91.03 12.03120 1.26 4.57 98.87 9.64150 1.12 4.12 102.23 5.78180 1.86 4.16 101.98 6.09240 1.21 3.07 102.55 3.18300 1.25 3.13 101.96 0.00
Figure A2.5B: Metal concentrations as a function of leachingtime at a stirring rate of 400 rpm - second test
0
20
40
60
80
100
0 15 30 60 90 120 150 180 240 300
Leaching Time, min
Sol
utio
n C
onc.
, g/L
Co
Fe
Ni
Cu
pH

TABLE A2.6B: METAL EXTRACTIONS BASED ON SOLUTION CONCENTRATIONS DURING ATMOSPHERIC LEACHNG OF THE MATTE AT A MIXING RATE OF 400 RPM - SECOND TEST
Leaching conditions: Temperature (o C): 60Mixing rate (rpm): 400 Metal content of mattePulp density (kg/L): 1.7 Ni 614.14 g (47.98%)Leaching time (hrs): 5 Co 4.35 g (0.34%)Matte (kg): 1.28 Fe 7.68 g (0.6%)Solution (L): 1.54
Leaching Ni Ni Ni Co Co Co Fe Fe FeTime (g/L) (g) Leach (g/L) (g) leach (g/L) (g) leach
( min ) % % %
0 24.61 37.90 0.00 0.18 0.28 0 0.67 1.03 015 62.55 96.33 9.51 0.71 1.09 18.75 3.02 4.65 47.1230 76.65 117.69 12.99 0.98 1.50 28.15 4.18 6.41 70.0160 85.97 131.81 15.29 1.06 1.62 30.89 4.67 7.14 79.5190 91.03 139.35 16.52 1.14 1.74 33.59 4.86 7.42 83.14120 98.87 150.64 18.36 1.26 1.91 37.56 4.57 7.00 77.70150 102.23 155.39 19.13 1.12 1.71 33.00 4.12 6.36 69.41180 101.98 155.04 19.07 1.16 1.77 34.28 4.16 6.42 70.13240 102.55 155.82 19.20 1.21 1.84 35.85 3.07 4.93 50.76300 101.96 155.03 19.07 1.25 1.89 37.08 3.13 5.01 51.81
Figure A2.6B: Metal extractions as a function of leaching time at astirring rate of 400 rpm - Second test
0
20
40
60
80
100
0 15 30 60 90 120 150 180 240 300
Leaching Time, min
Met
al e
xtra
ctio
n, %
Co
Fe
Ni
pH

TABLE A4.5: METAL SOLUTION CONCENTRATIONS DURING ATMOSPHERIC LEACHING OF THE -300 +150 MICRONS SIZE FRACTION OF THE MATTE
Leaching conditions: Temperature: (o C) 60Mixing rate (rpm): 205Pulp density (kg/L): 1.7Leaching time (hrs): 5
Leaching Co Fe Ni Cu pHTime (g/l) (g/l) (g/l) (g/l)
( min )0 0.18 0.67 24.61 24.95 0.2515 0.95 4.17 63.20 22.46 0.6030 0.99 4.66 67.73 19.15 0.6360 1.02 4.86 79.68 18.53 0.6490 0.99 4.88 80.18 17.65 0.66
120 1.00 4.89 81.35 16.42 0.68150 0.99 4.91 82.77 14.90 0.70180 1.00 4.95 84.69 13.70 0.71240 1.04 5.00 87.13 12.56 0.74300 1.09 5.05 91.57 10.38 0.75
Figure A4.5: Metal concentrations as a function of leaching time fothe -300 +150 microns size fraction of the matte
0
20
40
60
80
100
0 15 30 60 90 120 150 180 240 300
Leaching Time, min
Sol
utio
n C
onc.
, g/L
0
1
2
3
4
Sol
utio
n pH
Co FeNi CupH
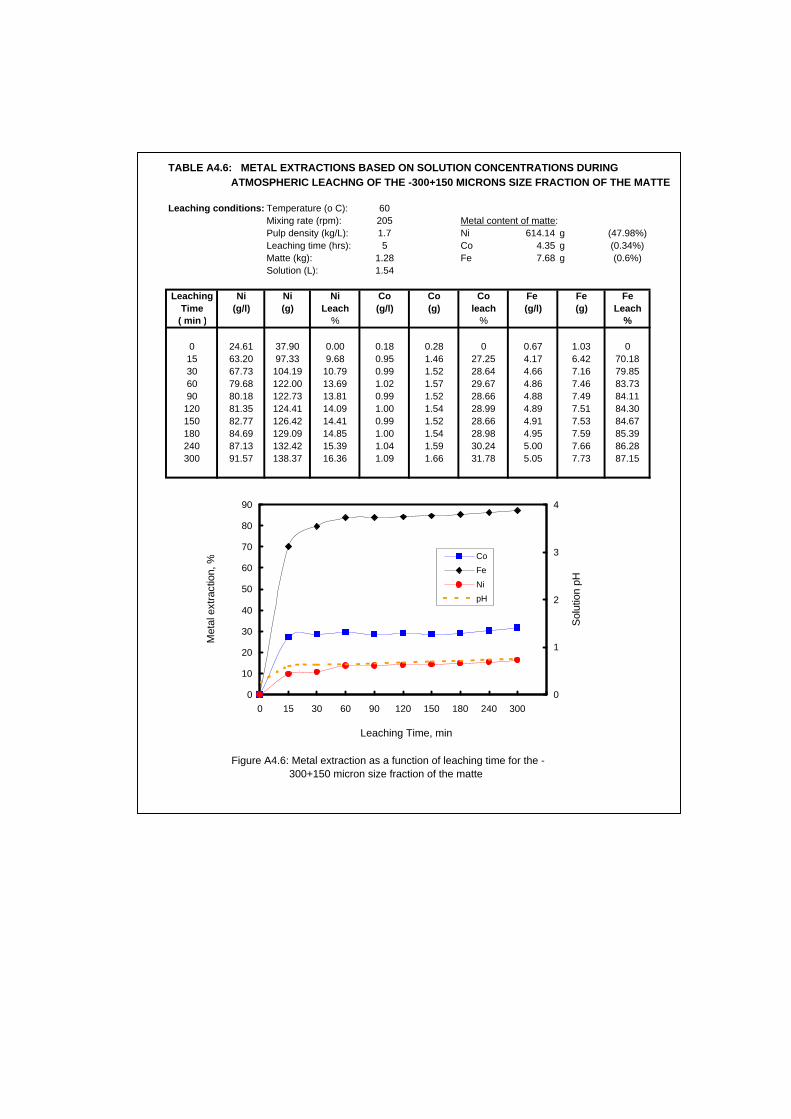
TABLE A4.6: METAL EXTRACTIONS BASED ON SOLUTION CONCENTRATIONS DURING ATMOSPHERIC LEACHNG OF THE -300+150 MICRONS SIZE FRACTION OF THE MATTE
Leaching conditions: Temperature (o C): 60Mixing rate (rpm): 205 Metal content of matte:Pulp density (kg/L): 1.7 Ni 614.14 g (47.98%)Leaching time (hrs): 5 Co 4.35 g (0.34%)Matte (kg): 1.28 Fe 7.68 g (0.6%)Solution (L): 1.54
Leaching Ni Ni Ni Co Co Co Fe Fe FeTime (g/l) (g) Leach (g/l) (g) leach (g/l) (g) Leach
( min ) % % %
0 24.61 37.90 0.00 0.18 0.28 0 0.67 1.03 015 63.20 97.33 9.68 0.95 1.46 27.25 4.17 6.42 70.1830 67.73 104.19 10.79 0.99 1.52 28.64 4.66 7.16 79.8560 79.68 122.00 13.69 1.02 1.57 29.67 4.86 7.46 83.7390 80.18 122.73 13.81 0.99 1.52 28.66 4.88 7.49 84.11
120 81.35 124.41 14.09 1.00 1.54 28.99 4.89 7.51 84.30150 82.77 126.42 14.41 0.99 1.52 28.66 4.91 7.53 84.67180 84.69 129.09 14.85 1.00 1.54 28.98 4.95 7.59 85.39240 87.13 132.42 15.39 1.04 1.59 30.24 5.00 7.66 86.28300 91.57 138.37 16.36 1.09 1.66 31.78 5.05 7.73 87.15
Figure A4.6: Metal extraction as a function of leaching time for the -300+150 micron size fraction of the matte
0
10
20
30
40
50
60
70
80
90
0 15 30 60 90 120 150 180 240 300
Leaching Time, min
Met
al e
xtra
ctio
n, %
0
1
2
3
4
Sol
utio
n pH
CoFe
NipH

TABLE A4.3: METAL SOLUTION CONCENTRATIONS DURING ATMOSPHERIC LEACHING OF THE -106+45 MICRONS SIZE FRACTION OF THE MATTE
Leaching conditions: Temperature: (o C) 60Mixing rate (rpm): 205Pulp density (kg/L): 1.7Leaching time (hrs): 5
Leaching Co Fe Ni CuTime (g/l) (g/l) (g/l) (g/l) pH
( min )0 0.18 0.67 24.61 0.00 0.4615 0.93 4.19 71.70 22.12 3.0430 1.01 4.46 78.22 17.64 3.0960 1.11 4.49 78.79 11.94 3.1890 1.23 4.47 84.73 6.23 3.39120 1.24 3.81 87.23 1.19 3.75150 1.22 3.76 88.09 0.00 4.64180 1.24 3.91 92.30 0.00 5.05240 1.22 3.89 91.20 0.00 5.20300 1.31 3.81 94.71 0.00 5.24
Figure A4.3: Metal concentrations as a function of leaching time for the -106+45 micron size fraction of the matte.
0
20
40
60
80
100
0 15 30 60 90 120 150 180 240 300
Leaching Time, min
Solu
tion
Con
c., g
/l
0
1
2
3
4
5
6
7
Solu
tion
pH
Co FeNi CupH

TABLE A4.4: METAL EXTRACTION BASED ON SOLUTION CONCENTRATIONS DURING ATMOSPHERIC LEACHING OF THE -106+45 MICRONS SIZE FRACTION OF THE MATTE
Leaching conditionsTemperature (o C): 60Mixing rate (rpm): 205Pulp density (kg/L): 1.7 Metal content of matte:Leaching time (hrs): 5 Ni 614.14 g (47.98%)Matte (kg): 1.28 Co 4.35 g (0.34%)Solution (L): 1.54 Fe 7.68 g (0.6%)
Leaching Ni Ni Ni Co Co Co Fe Fe FeTime (g/l) (g) Leach (g/l) (g) leach (g/l) (g) leach
( min ) % % %
0 24.61 37.90 0.00 0.18 0.28 0 0.67 1.03 015 71.70 110.42 11.81 0.93 1.43 26.54 4.19 6.45 70.5030 78.22 119.12 13.22 1.01 1.55 29.32 4.46 6.86 75.9160 78.79 119.80 13.34 1.11 1.70 32.75 4.49 6.91 76.4990 84.73 128.49 14.75 1.23 1.88 36.79 4.47 6.88 76.11120 87.23 131.94 15.31 1.24 1.89 37.12 3.81 5.93 63.73150 88.09 133.10 15.50 1.22 1.86 36.47 3.76 5.86 62.81180 92.30 138.93 16.45 1.24 1.89 37.11 3.91 6.06 65.53240 91.20 137.32 16.19 1.22 1.86 36.48 3.89 6.04 65.17300 94.71 142.05 16.96 1.31 1.99 39.25 3.81 5.93 63.78
Figure A4.4: Metal extraction as a function of leaching time for the -106+45 microns particle size of the matte
0
10
20
30
40
50
60
70
80
90
100
0 15 30 60 90 120 150 180 240 300
Leaching Time, min
Met
al e
xtra
ctio
n, %
0
1
2
3
4
5
6
Solu
tion
pH
Co Fe
Ni pH

TABLE A4.1: METAL SOLUTION CONCENTRATIONS DURING ATMOSPHERIC LEACHING OF THE - 45 MICRONS SIZE FRACTION OF THE MATTE
Leaching conditions: Temperature: (o C) 60Mixing rate (rpm): 205Pulp density (kg/L): 1.7Leaching time (hrs): 5
Leaching Co Fe Ni CuTime (g/l) (g/l) (g/l) (g/l) pH
( min )0 0.18 0.67 24.61 24.95 0.4615 1.20 4.11 78.26 17.59 3.3830 1.25 4.46 85.38 12.08 3.660 1.26 3.66 87.58 2.28 3.6590 1.27 2.58 89.29 0.00 4.37120 1.29 1.44 92.55 0.00 4.51150 1.30 1.34 93.10 0.00 4.71180 1.30 1.36 93.18 0.00 5.17240 1.32 1.42 99.45 0.00 5.42300 1.35 1.27 101.84 0.00 5.53
Figure A4 1: Metal concentrations as a function of leaching time for the - 45 micron size fraction of the matte
0
20
40
60
80
100
0 15 30 60 90 120 150 180 240 300
Leaching Time, min
Solu
tion
Con
c., g
/l
0
1
2
3
4
5
6
7
Solu
tion
pH
Co FeNi CupH

TABLE A4.2: METAL EXTRACTION BASED ON SOLUTION CONCENTRATIONS DURING ATMOSPHERIC LEACHING OF THE -45 MICRONS SIZE FRACTION OF THE MATTE
Leaching conditions: Temperature (o C): 60Mixing rate (rpm): 205Pulp density (kg/L): 1.7 Metal content of matte:Leaching time (hrs): 5 Ni 614.14 g (47.98%)Matte (kg): 1.28 Co 4.35 g (0.34%)Solution (L): 1.54 Fe 7.68 g (0.6%)
Leaching Ni Ni Ni Co Co Co Fe Fe FeTime (g/l) (g) Leach (g/l) (g) leach (g/l) (g) leach
( min ) % % %
0 24.61 37.90 0.00 0.18 0.28 0 0.67 1.03 015 78.26 120.52 13.45 1.20 1.85 36.09 4.11 6.33 68.9830 85.38 129.97 14.99 1.25 1.92 37.83 4.46 6.86 75.8860 87.58 133.07 15.50 1.26 1.94 38.18 3.66 5.67 60.3690 89.29 135.52 15.89 1.27 1.95 38.51 2.58 4.09 39.76120 92.55 140.17 16.65 1.29 1.98 39.18 1.44 2.44 18.39150 93.10 140.86 16.77 1.30 2.00 39.50 1.34 2.30 16.54180 93.18 140.96 16.78 1.30 2.00 39.50 1.36 2.33 16.91240 99.45 149.52 18.17 1.32 2.02 40.13 1.42 2.41 17.97300 101.84 152.56 18.67 1.35 2.06 41.05 1.27 2.21 15.35
Figure A4.2: Metal extraction as a function of leaching time for the - 45 micronssize fraction of the matte
0
10
20
30
40
50
60
70
80
0 15 30 60 90 120 150 180 240 300
Leaching Time, min
Met
al e
xtra
ctio
n, %
0
1
2
3
4
5
6
7
Solu
tion
pH
Co Fe
Ni pH
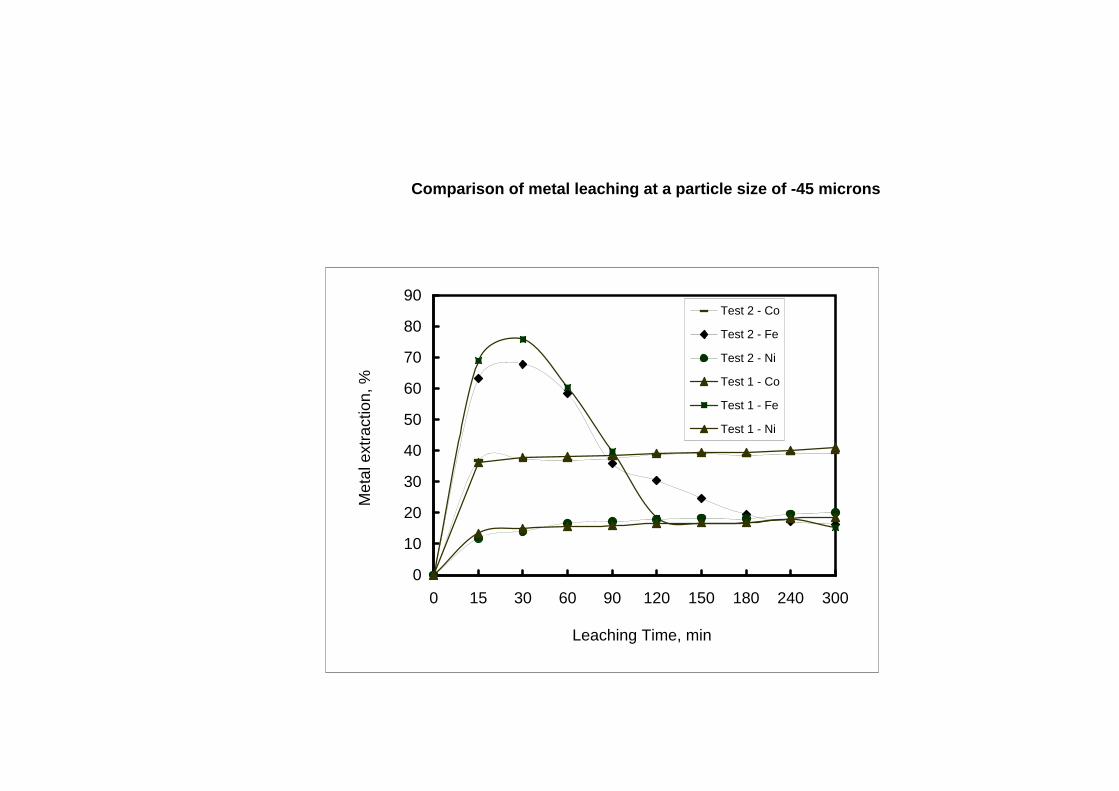
Comparison of metal leaching at a particle size of -45 microns
0
10
20
30
40
50
60
70
80
90
0 15 30 60 90 120 150 180 240 300
Leaching Time, min
Met
al e
xtra
ctio
n, %
Test 2 - Co
Test 2 - Fe
Test 2 - Ni
Test 1 - Co
Test 1 - Fe
Test 1 - Ni

TABLE A4.8: COPPER SOLUTION CONCENTRATION DURING ATMOSPHERIC LEACHING OF THE MATTE AT DIFFERENT PARTICLE SIZE FRACTIONS
Leaching conditions Feed matte Feed solutionTemperature ( oC ): 60 Mass ( kg ) 1.28 Volume (mL) 1.54Stirring rate (rpm ): 205 Ni ( % ) 47.98% Ni (g/L) 24.61Pulp density ( kg/L ): 1.7 Cu ( % ) 31.31 Cu (g/L) 24.95Leaching time ( hr ): 5 hrs Co ( % ) 0.34% Co (g/L) 0.18Matte (kg): 1.28 Fe ( % ) 0.6% Fe (g/L) 0.67
Leaching Copper in leach solution, g Copper precipitation, %Time - 300 + 150 - 106 + 45 - 45 - 300 + 150 - 106 + 45 - 45
( min ) (micron) (micron) (micron) (micron) (micron) (micron)
0 38.42 38.42 38.42 0.00 0.00 0.0015 34.59 34.06 27.09 9.98 11.34 29.5030 29.49 27.17 18.60 23.25 29.30 51.5860 28.54 18.39 3.51 25.73 52.14 90.8690 27.18 9.59 0.00 29.26 75.03 100.00
120 25.29 1.83 0.00 34.19 95.23 100.00150 22.95 0.00 0.00 40.28 100.00 100.00180 21.10 0.00 0.00 45.09 100.00 100.00240 19.34 0.00 0.00 49.66 100.00 100.00300 15.99 0.00 0.00 58.40 100.00 100.00
TABLE A4.9: DETERMINATION OF COPPER CEMENTATION RATE CONSTANTS FOR CEMENTATION REACTION AT DIFFERENT PARTICLE SIZE FRACTIONS
Leaching conditions Temperature ( oC ): 60 Specific surface area of original matte ( cm 2/g ) 66982Stirring rate (rpm ): 205 Mass of matte ( g ): 1276Leaching time ( hr ): 5 Volume of solution ( cm 3 ) 1537Matte (kg): 1.28 Slope of graph = (KxA) / (2.303V)
Particle size Surface area Slope rate constant( microns ) (cm2/g) (stage 1) K1 X 10 -3 ( cm / s )
- 45 82846 0.0104 0.021- 106 + 45 89247 0.0052 0.010
- 300 + 150 36868 0.0014 0.006
Note: Cementation rate constant obtained from slope of graph in Figure 6.29

TABLE A4.7: COPPER SOLUTION CONCENTRATION DURING ATMOSPHERIC LEACHING OF THE MATTE AT DIFFERENT PARTICLE SIZE FRACTIONS
Leaching conditions Feed matte Feed solutionTemperature ( oC ): 60 Mass ( kg ) 1.28 Volume (mL) 1.54Stirring rate (rpm ): 205 Ni ( % ) 47.98% Ni (g/L) 24.61Pulp density ( kg/L ): 1.7 Cu ( % ) 31.31 Cu (g/L) 24.95Leaching time ( hr ): 5 hrs Co ( % ) 0.34% Co (g/L) 0.18Matte (kg): 1.28 Fe ( % ) 0.6% Fe (g/L) 0.67
Leaching Copper concentration, g/L Log [Cu 2+]t / [Cu2+]0
Time - 300 + 150 - 106 + 45 - 45 ( min ) (micron) (micron) (micron) - 300 + 150' um - 106 + 45 um '- 45 ' um
0 24.95 24.95 24.95 0.00 0.00 0.0015 22.46 22.12 17.59 -0.05 -0.05 -0.1530 19.15 17.64 12.08 -0.11 -0.15 -0.3260 18.53 11.94 2.28 -0.13 -0.32 -1.0490 17.65 6.23 0.00 -0.15 -0.60
120 16.42 1.19 0.00 -0.18 -1.32150 14.90 0.00 0.00 -0.22180 13.70 0.00 0.00 -0.26240 12.56 0.00 0.00 -0.30300 10.38 0.00 0.00 -0.38
Figure A4.7: Copper concentration as a function of leaching time for the differentparticle size fractions (205 rpm, 25 g/L initial Cu, 90 g/L initial acid, 1.7 kg/L P.D.
0
4
8
12
16
20
24
28
0 15 30 60 90 120 150 180 240 300
Leaching Time, min
Cop
per c
once
ntra
tion,
g/l
- 45 um
- 106 + 45 um
- 300 + 150 um

0.000
0.005
0.010
0.015
0.020
0.025
- 45 - 106 + 45 - 300 + 150
Particle size, microns
K X
10-3
, cm
/s
25 g/L initial Cu90 g/Ll initial acid60 oC205 rpm1.7 kg/l P.D.
0
20
40
60
80
100
120
0 15 30 60 90 120 150 180 240 300
Leaching time, min
Cop
per p
reci
pita
tion,
%
- 45 microns
-106+45 microns
-300+150 microns

-2.0
-1.8
-1.6
-1.4
-1.2
-1.0
-0.8
-0.6
-0.4
-0.2
0.0
0 30 60 90 120 150 180 210 240 270 300 330
Leaching Time, min
Log
[Cu]
t / [C
u]o
-45 micron
-106+45 micron
-300+150 micron

TABLE A5.3: METAL SOLUTION CONCENTRATIONS DURING ATMOSPHERIC LEACHING OF THE MATTE AT INITIAL COPPER CONCENTRATION OF 36 g/L
Leaching conditions: Temperature: (o C) 60Mixing rate (rpm): 205Pulp density (kg/L): 1.7Leaching time (hrs): 5
Leaching Co Fe Ni CuTime (g/l) (g/l) (g/l) (g/l) pH
( min )0 0.18 0.67 24.61 36.03 0.7415 0.95 3.74 65.00 35.93 1.5630 0.99 3.88 70.10 32.63 1.6260 1.08 4.25 77.97 28.90 1.6490 1.11 4.33 81.59 25.26 1.75120 1.12 4.46 86.65 21.99 1.84150 1.15 4.48 89.02 19.91 1.94180 1.13 4.44 88.98 17.87 2.03240 1.17 4.51 93.42 14.84 2.25 `300 1.18 4.51 97.73 12.14 2.68
Figure A5.3: Metal concentration as a function of leaching time at initialcopper concentration of 36g/l
0
20
40
60
80
100
0 15 30 60 90 120 150 180 240 300
Leaching Time, min
Solu
tion
Con
c., g
/l
0
1
2
3
4
Solu
tion
pH
Co
Fe
Ni
Cu
pH

TABLE A5.4: METAL EXTRACTION BASED ON SOLUTION CONCENTRATIONS DURING ATMOSPHERIC LEACHING OF THE MATTE AT INITIAL COPPER CONCENTRATION OF 36 g/L
Leaching conditions: Temperature (o C): 60 Metal content of matte:Mixing rate (rpm): 205 Ni 614.14 g (47.98%)Pulp density (kg/L): 1.7 Co 4.35 g (0.34%)Leaching time (hrs): 5 Fe 7.68 g (0.6%)Matte (kg): 1.28Solution (L): 1.54
Leaching Ni Ni Ni Co Co Co Fe Fe FeTime (g/l) (g) Leach (g/l) (g) leach (g/l) (g) Leach
( min ) % % %
0 24.61 37.90 0.00 0.18 0.28 0 0.67 1.03 015 65.00 100.10 10.13 0.95 1.46 27.25 3.74 5.76 61.5630 70.10 106.82 11.22 0.99 1.52 28.64 3.88 5.97 64.3260 77.97 118.42 13.11 1.08 1.66 31.72 4.25 6.52 71.5090 81.59 123.52 13.94 1.11 1.70 32.73 4.33 6.64 73.03120 86.65 130.72 15.11 1.12 1.72 33.06 4.46 6.83 75.46150 89.02 133.95 15.64 1.15 1.76 34.04 4.48 6.86 75.83180 88.98 133.83 15.62 1.13 1.73 33.40 4.44 6.80 75.11240 93.42 139.89 16.61 1.17 1.79 34.65 4.51 6.90 76.35300 97.73 145.56 17.53 1.18 1.80 34.96 4.51 6.90 76.35
Figure A5.4: Metal extraction as a function of leaching time at an initial copperconcetration of 36 g/L
0
10
20
30
40
50
60
70
80
0 15 30 60 90 120 150 180 240 300
Leaching Time, min
Met
al e
xtra
ctio
n, %
0
1
2
3
4
Solu
tion
pH
Co
Fe
Ni
pH

TABLE A5.5: METAL SOLUTION CONCENTRATIONS DURING ATMOSPHERIC LEACHING OF THE MATTE AT INITIAL COPPER CONCENTRATION OF 48 g/L
Leaching conditions: Temperature: (o C) 60Mixing rate (rpm): 205Pulp density (kg/L): 1.7Leaching time (hrs): 5
Leaching Co Fe Ni CuTime (g/l) (g/l) (g/l) (g/l) pH
( min )0 0.18 0.67 24.61 48.43 0.78
15 0.94 3.67 65.45 48.43 1.5830 0.96 3.75 68.25 43.25 1.6360 0.94 3.66 69.17 36.43 1.6790 0.97 3.71 71.47 33.01 1.63
120 1.00 3.85 77.02 30.73 1.76150 1.04 3.94 79.99 29.37 1.85180 1.02 3.86 80.16 26.80 1.92240 1.07 4.04 86.15 24.06 2.07 `300 1.15 4.18 92.97 20.11 2.46
Figure A5.5: Metal concentration as a function of leaching time at initiacopper concentration of 48g/L
0
20
40
60
80
100
0 15 30 60 90 120 150 180 240 300
Leaching Time, min
Sol
utio
n C
onc.
, g/l
0
1
2
3
4
Sol
utio
n pH
Co FeNi CupH

TABLE A5.6: METAL EXTRACTION BASED ON SOLUTION CONCENTRATIONS DURING ATMOSPHERIC LEACHING OF THE MATTE AT INITIAL COPPER CONCENTRATION OF 48 g/L
Leaching conditions: Temperature (o C): 60 Metal content of matte:Mixing rate (rpm): 205 Ni 614.14 g (47.98%)Pulp density (kg/L): 1.7 Co 4.35 g (0.34%)Leaching time (hrs): 5 Fe 7.68 g (0.6%)Matte (kg): 1.28Solution (L): 1.54
Leaching Ni Ni Ni Co Co Co Fe Fe FeTime (g/l) (g) Leach (g/l) (g) leach (g/l) (g) Leach
( min ) % % %
0 24.61 37.90 0.00 0.18 0.28 0 0.67 1.03 015 65.45 100.79 10.24 0.94 1.45 26.89 3.67 5.65 60.1630 68.25 104.01 10.77 0.96 1.48 27.59 3.75 5.77 61.7360 69.17 105.31 10.98 0.94 1.45 26.90 3.66 5.64 59.9990 71.47 108.66 11.52 0.97 1.49 27.91 3.71 5.71 60.94
120 77.02 116.60 12.81 1.00 1.54 28.91 3.85 5.91 63.57150 79.99 120.66 13.48 1.04 1.59 30.21 3.94 6.04 65.23180 80.16 120.82 13.50 1.02 1.56 29.57 3.86 5.93 63.78240 86.15 128.99 14.83 1.07 1.63 31.14 4.04 6.18 66.98300 92.97 137.98 16.30 1.15 1.74 33.60 4.18 6.36 69.42
Figure A5.6: Metal extraction as a function of leaching time at an initial Coppeconcetration of 48 g/L
0
10
20
30
40
50
60
70
80
0 15 30 60 90 120 150 180 240 300
Leaching Time, min
Met
al e
xtra
ctio
n, %
0
1
2
3
4
Sol
utio
n pH
Co
Fe
Ni
pH

TABLE A5.1: METAL SOLUTION CONCENTRATIONS DURING ATMOSPHERIC LEACHING OF THE MATTE AT INITIAL Cu CONCENTRATION OF 25 g/L
Leaching conditions: Temperature: 60 oCAgitation: 205 rpmPulp density: 1.7 kg/L
Leaching Co Fe Ni Cu pHTime (g/l) (g/l) (g/l) (g/l)
( min )
0 0.18 0.67 24.61 24.95 0.9715 0.77 3.35 64.11 22.84 1.1030 0.79 3.44 66.16 19.49 1.1160 0.80 3.68 68.85 14.47 1.1890 0.79 3.80 71.18 10.45 1.28120 0.91 3.91 78.69 8.75 1.34150 0.88 3.96 80.00 6.39 1.43180 0.96 4.05 86.80 4.79 1.51240 0.91 4.08 88.33 1.30 1.61300 1.01 4.24 94.44 0.00 1.90
Fig. A5.1: Metal concentrations as a function of leaching time at initial Cu concentration of 25 g/L
0
10
20
30
40
50
60
70
80
90
100
0 15 30 60 90 120 150 180 240 300
Leaching Time, min
Solu
tion
Con
c., g
/l
0
1
2
3
4
5
Solu
tion
pH
Co FeNi CupH

TABLE A5.2: METAL EXTRACTIONS BASED ON SOLUTION CONCENTRATIONS DURING ATMOSPHERIC LEACHING OF THE MATTE AT INITIAL Cu CONCENTRATION OF 25 g/L
Leaching conditions: Temperature: 60 oC Metal content of matte:Agitation: 205 rpm Ni 612.22 g (47.98%)Pulp density: 1.7 kg/L Co 4.34 g (0.34 %)Matte: 1.28 kg Fe 7.66 g (0.60 %)Solution: 1.54 L
Leaching Ni Ni Ni Co Co Co Fe Fe FeTime (g/l) (g) Leach (g/l) (g) leach (g/l) (g) ( % )
( min ) % %
0 24.61 37.83 0.00 0.18 0.28 0 0.67 1.03 015 64.11 98.54 9.92 0.77 1.18 20.90 3.35 5.15 53.8030 66.16 101.64 10.42 0.79 1.21 21.60 3.44 5.29 55.5860 68.85 105.71 11.09 0.80 1.23 21.94 3.68 5.64 60.2490 71.18 109.17 11.65 0.79 1.21 21.61 3.80 5.82 62.61
120 78.69 119.96 13.42 0.91 1.39 25.58 3.91 5.98 64.60150 80.00 121.81 13.72 0.88 1.34 24.60 3.96 6.05 65.52180 86.80 131.24 15.26 0.96 1.46 27.16 4.05 6.17 67.15240 88.33 133.33 15.60 0.91 1.39 25.59 4.08 6.21 67.69300 94.44 141.49 16.93 1.01 1.52 28.67 4.24 6.43 70.48300
Figure A5.2: Metal extractions as a function of leaching time at initial Cu concentration of 25 g/L
0
10
20
30
40
50
60
70
80
0 15 30 60 90 120 150 180 240 300
Leaching Time, min
Met
al e
xtra
ctio
n, %
0
1
2
3
4
Solu
tion
pHCoFe
NipH

TABLE A6.3: METAL SOLUTION CONCENTRATIONS DURING ATMOSPHERIC LEACHING OF THE MATTE AT INITIAL H2SO4 CONCENTRATION OF 110 g/L
Leaching conditions: Temperature: (o C) 60Mixing rate (rpm): 205Pulp density (kg/L): 1.7Leaching time (hrs): 5
Leaching Co Fe Ni CuTime (g/l) (g/l) (g/l) (g/l) pH
( min )0 0.18 0.67 24.61 0.00 0.61
15 0.89 3.77 60.68 26.60 1.0430 0.96 4.15 67.35 22.12 0.9860 1.04 4.55 75.51 17.07 1.0990 1.08 4.69 79.96 13.65 1.14
120 1.13 4.86 84.58 11.23 1.18150 1.12 4.86 86.35 9.23 1.19180 1.13 4.85 87.40 7.72 1.25240 1.16 5.01 92.65 4.87 1.27300 1.18 5.04 96.39 2.57 1.32
Figure A6.3: Metal concentration as a function of leaching time at initiaH2SO4 concentration of 110g/L
0
20
40
60
80
100
0 15 30 60 90 120 150 180 240 300
Leaching Time, min
Sol
utio
n C
onc.
, g/L
0
1
2
3
4
Sol
utio
n pH
CoFeNiCupH

TABLE A6.4: METAL EXTRACTION BASED ON SOLUTION CONCENTRATIONS DURING ATMOSPHERIC LEACHING OF THE MATTE AT INITIAL H2SO4 CONCENTRATION OF 110 g/L
Leaching conditions: Temperature (o C): 60 Metal content of matte:Mixing rate (rpm): 205 Ni 614.14 g (47.98%)Pulp density (kg/L): 1.7 Co 4.35 g (0.34%)Leaching time (hrs): 5 Fe 7.68 g (0.6%)Matte (kg): 1.28Solution (L): 1.54
Leaching Ni Ni Ni Co Co Co Fe Fe FeTime (g/l) (g) Leach (g/l) (g) leach (g/l) (g) Leach
( min ) % % %
0 24.61 37.90 0.00 0.18 0.28 0 0.67 1.03 015 60.68 93.45 9.04 0.89 1.37 25.12 3.77 5.81 62.1630 67.35 102.65 10.54 0.96 1.48 27.56 4.15 6.38 69.6660 75.51 114.64 12.50 1.04 1.60 30.30 4.55 6.98 77.4290 79.96 120.96 13.52 1.08 1.65 31.65 4.69 7.18 80.09
120 84.58 127.50 14.59 1.13 1.73 33.30 4.86 7.43 83.28150 86.35 129.89 14.98 1.12 1.71 32.98 4.86 7.43 83.28180 87.40 131.30 15.21 1.13 1.73 33.30 4.85 7.41 83.10240 92.65 138.44 16.37 1.16 1.77 34.24 5.01 7.63 85.94300 96.39 143.32 17.17 1.18 1.79 34.85 5.04 7.67 86.46
Figure A6.4: Metal extraction as a function of leaching time at initial H2SO4concentration of 110 g/L
0
10
20
30
40
50
60
70
80
90
100
0 15 30 60 90 120 150 180 240 300
Leaching Time, min
Met
al e
xtra
ctio
n, %
0
1
2
3
4
Sol
utio
n pH
Co
Fe
Ni
pH

TABLE A6.5: METAL SOLUTION CONCENTRATIONS DURING ATMOSPHERIC LEACHING OF THE MATTE AT INITIAL H 2SO4 CONCENTRATION OF 125 g/L
Leaching conditions: Temperature: (o C) 60Mixing rate (rpm): 205Pulp density (kg/L): 1.7Leaching time (hrs): 5
Leaching Co Fe Ni Cu pHTime (g/l) (g/l) (g/l) (g/l)
( min )0 0.18 0.67 24.61 24.95 0.5715 0.94 4.11 64.66 25.99 0.9230 1.01 4.40 70.58 22.16 0.8760 1.08 4.63 76.40 17.46 0.9590 1.08 4.74 79.58 14.48 0.98120 1.11 4.85 83.22 11.95 1.01150 1.13 4.84 84.66 9.81 0.91180 1.14 4.93 87.63 8.12 1.01240 1.19 5.11 93.38 4.86 0.90 `300 1.22 5.22 98.05 1.93 1.17
Figure A6.5: Metal concentration as a function of leaching time at initial H2SO4 concentration of 125g/lL.
0
20
40
60
80
100
0 15 30 60 90 120 150 180 240 300
Leaching Time, min
Sol
utio
n C
onc.
, g/L
0
1
2
3
4
Sol
utio
n pH
Co
FeNi
CupH

TABLE A6.6: METAL EXTRACTION BASED ON SOLUTION CONCENTRATIONS DURING ATMOSPHERIC LEACHING OF THE MATTE AT INITIAL H2SO4 CONCENTRATION OF 125 g/L
Leaching conditions: Temperature (o C): 60 Metal content of matte:Mixing rate (rpm): 205 Ni 614.14 g (47.98%)Pulp density (kg/L): 1.7 Co 4.35 g (0.34%)Leaching time (hrs): 5 Fe 7.68 g (0.6%)Matte (kg): 1.28Solution (L): 1.54
Leaching Ni Ni Ni Co Co Co Fe Fe FeTime (g/l) (g) Leach (g/l) (g) leach (g/l) (g) Leach
( min ) % % %
0 24.61 37.90 0.00 0.18 0.28 0 0.67 1.03 015 64.66 99.58 10.04 0.94 1.45 26.89 4.11 6.33 68.9830 70.58 107.54 11.34 1.01 1.55 29.33 4.40 6.77 74.7060 76.40 116.07 12.73 1.08 1.66 31.73 4.63 7.11 79.1690 79.58 120.58 13.46 1.08 1.66 31.73 4.74 7.27 81.26120 83.22 125.74 14.30 1.11 1.70 32.72 4.85 7.43 83.32150 84.66 127.69 14.62 1.13 1.73 33.37 4.84 7.42 83.14180 87.63 131.78 15.29 1.14 1.74 33.69 4.93 7.54 84.77240 93.38 139.56 16.55 1.19 1.81 35.26 5.11 7.79 87.97300 98.05 145.67 17.55 1.22 1.85 36.18 5.22 7.94 89.89
Figure A6.6: Metal extraction as a function of leaching time at initial H2SO4
concentration of 125 g/L
0
10
20
30
40
50
60
70
80
90
100
0 15 30 60 90 120 150 180 240 300
Leaching Time, min
Met
al e
xtra
ctio
n, %
0
1
2
3
4
Sol
utio
n pH
Co
Fe
Ni
pH
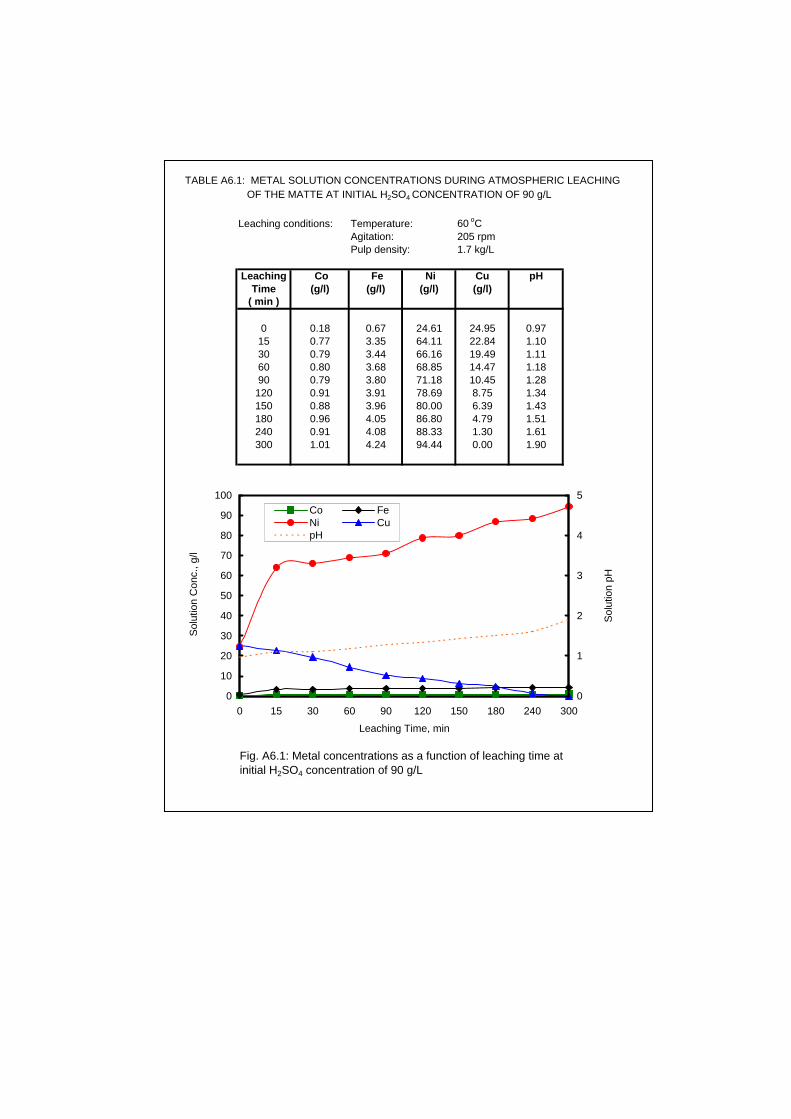
TABLE A6.1: METAL SOLUTION CONCENTRATIONS DURING ATMOSPHERIC LEACHING OF THE MATTE AT INITIAL H2SO4 CONCENTRATION OF 90 g/L
Leaching conditions: Temperature: 60 oCAgitation: 205 rpmPulp density: 1.7 kg/L
Leaching Co Fe Ni Cu pHTime (g/l) (g/l) (g/l) (g/l)
( min )
0 0.18 0.67 24.61 24.95 0.9715 0.77 3.35 64.11 22.84 1.1030 0.79 3.44 66.16 19.49 1.1160 0.80 3.68 68.85 14.47 1.1890 0.79 3.80 71.18 10.45 1.28120 0.91 3.91 78.69 8.75 1.34150 0.88 3.96 80.00 6.39 1.43180 0.96 4.05 86.80 4.79 1.51240 0.91 4.08 88.33 1.30 1.61300 1.01 4.24 94.44 0.00 1.90
Fig. A6.1: Metal concentrations as a function of leaching time at initial H2SO4 concentration of 90 g/L
0
10
20
30
40
50
60
70
80
90
100
0 15 30 60 90 120 150 180 240 300
Leaching Time, min
Solu
tion
Con
c., g
/l
0
1
2
3
4
5
Solu
tion
pH
Co FeNi CupH
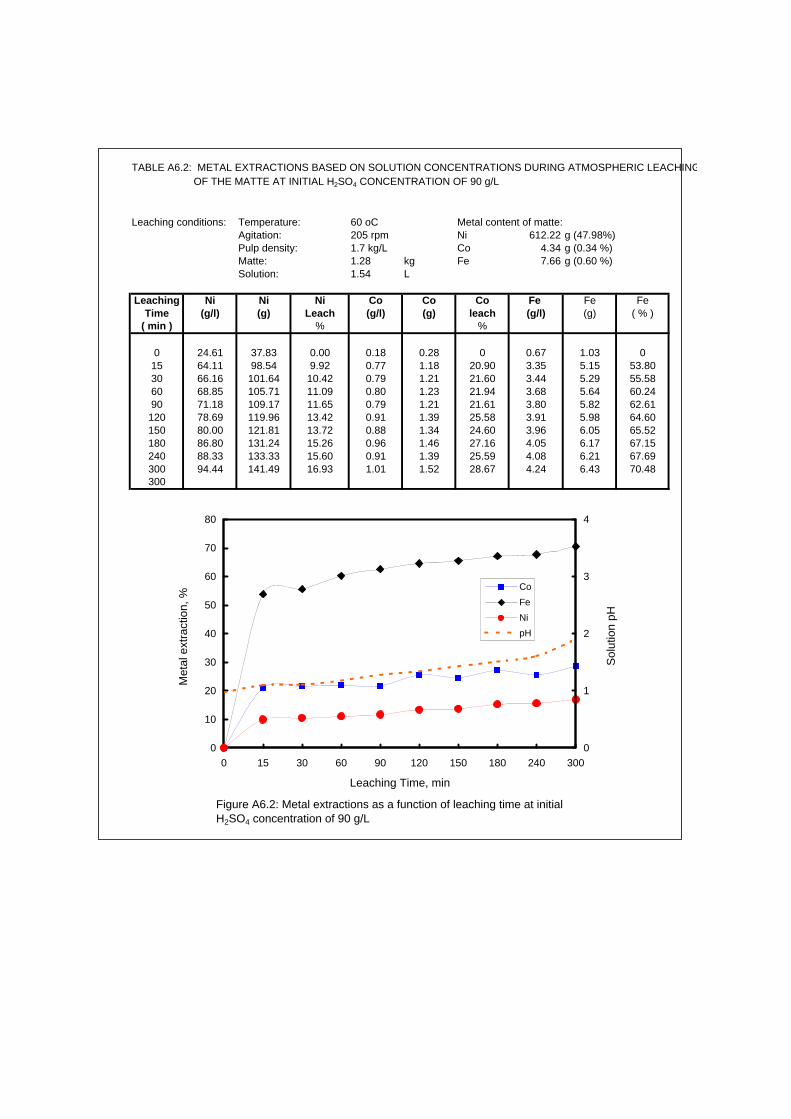
TABLE A6.2: METAL EXTRACTIONS BASED ON SOLUTION CONCENTRATIONS DURING ATMOSPHERIC LEACHING OF THE MATTE AT INITIAL H2SO4 CONCENTRATION OF 90 g/L
Leaching conditions: Temperature: 60 oC Metal content of matte:Agitation: 205 rpm Ni 612.22 g (47.98%)Pulp density: 1.7 kg/L Co 4.34 g (0.34 %)Matte: 1.28 kg Fe 7.66 g (0.60 %)Solution: 1.54 L
Leaching Ni Ni Ni Co Co Co Fe Fe FeTime (g/l) (g) Leach (g/l) (g) leach (g/l) (g) ( % )
( min ) % %
0 24.61 37.83 0.00 0.18 0.28 0 0.67 1.03 015 64.11 98.54 9.92 0.77 1.18 20.90 3.35 5.15 53.8030 66.16 101.64 10.42 0.79 1.21 21.60 3.44 5.29 55.5860 68.85 105.71 11.09 0.80 1.23 21.94 3.68 5.64 60.2490 71.18 109.17 11.65 0.79 1.21 21.61 3.80 5.82 62.61120 78.69 119.96 13.42 0.91 1.39 25.58 3.91 5.98 64.60150 80.00 121.81 13.72 0.88 1.34 24.60 3.96 6.05 65.52180 86.80 131.24 15.26 0.96 1.46 27.16 4.05 6.17 67.15240 88.33 133.33 15.60 0.91 1.39 25.59 4.08 6.21 67.69300 94.44 141.49 16.93 1.01 1.52 28.67 4.24 6.43 70.48300
Figure A6.2: Metal extractions as a function of leaching time at initial H2SO4 concentration of 90 g/L
0
10
20
30
40
50
60
70
80
0 15 30 60 90 120 150 180 240 300
Leaching Time, min
Met
al e
xtra
ctio
n, %
0
1
2
3
4
Sol
utio
n pH
CoFeNipH
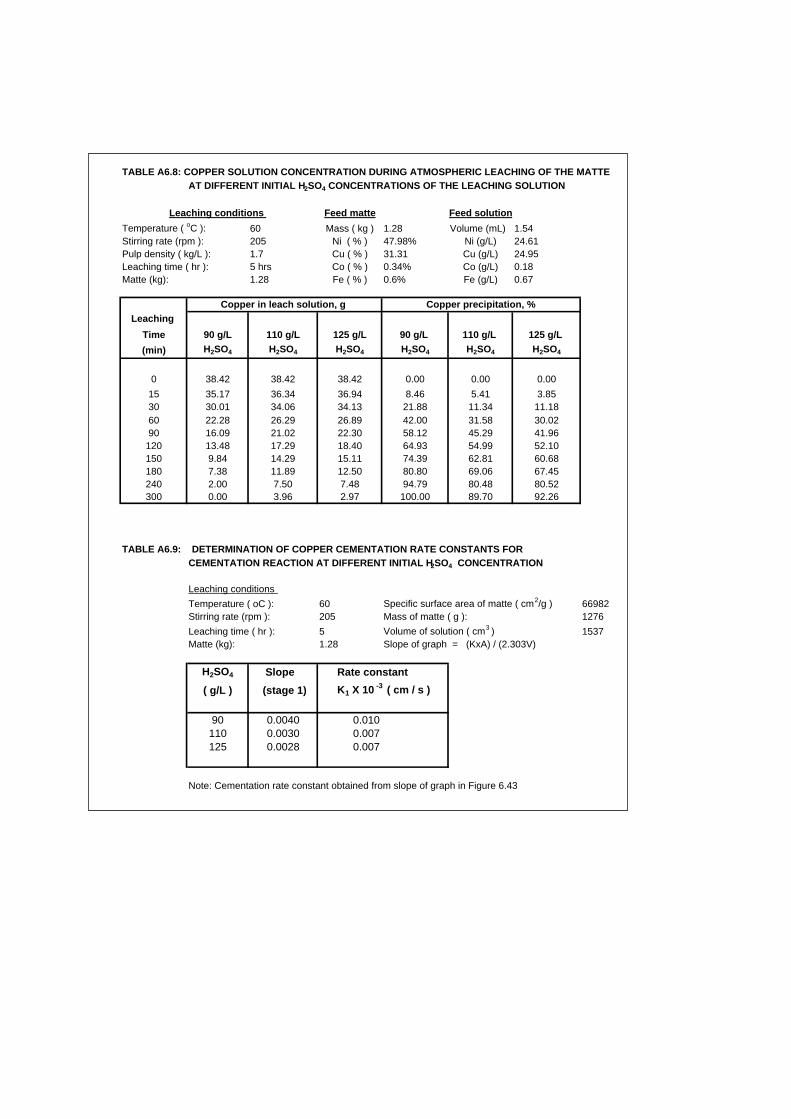
TABLE A6.8: COPPER SOLUTION CONCENTRATION DURING ATMOSPHERIC LEACHING OF THE MATTE AT DIFFERENT INITIAL H2SO4 CONCENTRATIONS OF THE LEACHING SOLUTION
Leaching conditions Feed matte Feed solutionTemperature ( oC ): 60 Mass ( kg ) 1.28 Volume (mL) 1.54Stirring rate (rpm ): 205 Ni ( % ) 47.98% Ni (g/L) 24.61Pulp density ( kg/L ): 1.7 Cu ( % ) 31.31 Cu (g/L) 24.95Leaching time ( hr ): 5 hrs Co ( % ) 0.34% Co (g/L) 0.18Matte (kg): 1.28 Fe ( % ) 0.6% Fe (g/L) 0.67
Copper in leach solution, g Copper precipitation, %Leaching
Time 90 g/L 110 g/L 125 g/L 90 g/L 110 g/L 125 g/L (min) H2SO4 H2SO4 H2SO4 H2SO4 H2SO4 H2SO4
0 38.42 38.42 38.42 0.00 0.00 0.0015 35.17 36.34 36.94 8.46 5.41 3.8530 30.01 34.06 34.13 21.88 11.34 11.1860 22.28 26.29 26.89 42.00 31.58 30.0290 16.09 21.02 22.30 58.12 45.29 41.96
120 13.48 17.29 18.40 64.93 54.99 52.10150 9.84 14.29 15.11 74.39 62.81 60.68180 7.38 11.89 12.50 80.80 69.06 67.45240 2.00 7.50 7.48 94.79 80.48 80.52300 0.00 3.96 2.97 100.00 89.70 92.26
TABLE A6.9: DETERMINATION OF COPPER CEMENTATION RATE CONSTANTS FOR CEMENTATION REACTION AT DIFFERENT INITIAL H2SO4 CONCENTRATION
Leaching conditions Temperature ( oC ): 60 Specific surface area of matte ( cm2/g ) 66982Stirring rate (rpm ): 205 Mass of matte ( g ): 1276Leaching time ( hr ): 5 Volume of solution ( cm3 ) 1537Matte (kg): 1.28 Slope of graph = (KxA) / (2.303V)
H2SO4 Slope Rate constant( g/L ) (stage 1) K1 X 10 -3 ( cm / s )
90 0.0040 0.010110 0.0030 0.007125 0.0028 0.007
Note: Cementation rate constant obtained from slope of graph in Figure 6.43

TABLE A6.7: COPPER SOLUTION CONCENTRATION DURING ATMOSPHERIC LEACHING OF THE MATTE AT DIFFERENT INITIAL H2SO4 CONCENTRATIONS OF THE LEACHING SOLUTION
Leaching conditions Feed matte Feed solutionTemperature ( oC ): 60 Mass ( kg ) 1.28 Volume (mL) 1.54Stirring rate (rpm ): 205 Ni ( % ) 47.98% Ni (g/L) 24.61Pulp density ( kg/L ): 1.7 Cu ( % ) 31.31 Cu (g/L) 24.95Leaching time ( hr ): 5 hrs Co ( % ) 0.34% Co (g/L) 0.18Matte (kg): 1.28 Fe ( % ) 0.6% Fe (g/L) 0.67
Copper concentration, g/L Log [Cu 2+]t / [Cu2+]0
Leaching Time 90 g/L 110 g/L 125 g/L 90 g/L 110 g/L 125 g/L (min) H2SO4 H2SO4 H2SO4 H2SO4 H2SO4 H2SO4
0 24.95 24.95 24.95 0.000 0.000 0.00015 22.84 23.60 23.99 -0.038 -0.024 -0.01730 19.49 22.12 22.16 -0.107 -0.052 -0.05260 14.47 17.07 17.46 -0.237 -0.165 -0.15590 10.45 13.65 14.48 -0.378 -0.262 -0.236
120 8.75 11.23 11.95 -0.455 -0.347 -0.320150 6.39 9.28 9.81 -0.592 -0.430 -0.405180 4.79 7.72 8.12 -0.717 -0.509 -0.488240 1.30 4.87 4.86 -1.283 -0.710 -0.710300 0.00 2.57 1.93 -0.987 -1.112
Figure A6.7: Acid concentration as a function of leaching time for different initial H2SO4 concentration of leaching solution (205 rpm, 25 g/L initial Cu, 1.7 gk/L P.D.)
0
4
8
12
16
20
24
28
0 15 30 60 90 120 150 180 240 300
Leaching Time, min
Cop
per c
once
ntra
tion,
g/L
125 g/L acid
110 g/L acid
90 g/L acid

-2.00
-1.80
-1.60
-1.40
-1.20
-1.00
-0.80
-0.60
-0.40
-0.20
0.00
0 30 60 90 120 150 180 210 240 270 300
Leaching Time, min
Log
[Cu]
t / [C
u]o
90 g/L acid
110 g/L acid
125 g/L acid
0
20
40
60
80
100
120
0 15 30 60 90 120 150 180 240 300
Leaching time, min
Cop
per p
reci
pita
tion,
%
90 g/L acid
110 g/L acid
125 g/L acid

0.000
0.002
0.004
0.006
0.008
0.010
0.012
0.014
80 90 100 110 120 130
H2SO4 Concentration, g/L
K x
10
-3 (
cm
/s)
25 g/Linitial Cu 2+
60 oC205 rpm1.7g/L P.D.

TABLE A7.1: METAL SOLUTION CONCENTRATIONS DURING ATMOSPHERIC LEACHING OF THE MATTE FOR A RESIDENCE TIME OF 5 HOURS
Leaching conditions: Temperature: 60 oCAgitation: 205 rpmPulp density: 1.7 kg/L
Leaching Co Fe Ni Cu pHTime (g/l) (g/l) (g/l) (g/l)
( min )
0 0.18 0.67 24.61 24.95 0.9715 0.77 3.35 60.14 22.84 1.1030 0.79 3.44 62.18 19.49 1.1160 0.80 3.68 64.86 14.47 1.1890 0.79 3.49 67.18 10.45 1.28120 0.91 3.91 74.94 8.75 1.34150 0.88 3.96 76.05 6.39 1.43180 0.96 4.05 82.83 4.79 1.51240 0.91 4.08 84.33 1.30 1.61300 1.01 4.24 85.84 0.00 1.90
Figure A7.1: Metal concentrations as a function of leaching time for a residence time of 5 hours
0
10
20
30
40
50
60
70
80
90
100
0 15 30 60 90 120 150 180 240 300
Leaching Time, min
Solu
tion
Con
c., g
/l
0
1
2
3
4
5
Solu
tion
pH
Co FeNi CupH

TABLE A7.2: METAL EXTRACTIONS BASED ON SOLUTION CONCENTRATIONS DURING ATMOSPHERIC LEACHING OF THE MATTE FOR A RESIDENCE TIME OF 5 HOURS
Leaching conditions: Temperature: 60 oC Metal content of matte:Agitation: 205 rpm Ni 612.22 g (47.98%)Pulp density: 1.7 kg/L Co 4.34 g (0.34 %)Matte: 1.28 kg Fe 7.66 g (0.60 %)Solution: 1.54 L
Leaching Ni Ni Ni Co Co Co Fe Fe FeTime (g/l) (g) Leach (g/l) (g) leach (g/l) (g) ( % )
( min ) % %
0 24.61 37.83 0.00 0.18 0.28 0 0.67 1.03 015 60.14 92.44 8.92 0.77 1.18 20.90 3.35 5.15 53.8030 62.18 95.52 9.42 0.79 1.21 21.60 3.44 5.29 55.5860 64.86 99.57 10.09 0.80 1.23 21.94 3.68 5.64 60.2490 67.18 103.02 10.65 0.79 1.21 21.61 3.49 5.36 56.61120 74.94 114.17 12.47 0.91 1.39 25.58 3.91 5.97 64.50150 76.05 115.74 12.73 0.88 1.34 24.60 3.96 6.04 65.42180 82.83 125.14 14.26 0.96 1.46 27.16 4.05 6.16 67.05240 84.33 127.19 14.60 0.91 1.39 25.59 4.08 6.20 67.58300 85.84 129.21 14.93 1.01 1.52 28.67 4.24 6.42 70.38300
Figure A7.2: Metal extractions as a function of leaching time for a residence time of 5 hours
0
10
20
30
40
50
60
70
80
0 15 30 60 90 120 150 180 240 300
Leaching Time, min
Met
al e
xtra
ctio
n, %
0
1
2
3
4
Sol
utio
n pH
CoFeNipH

TABLE A7.3: METAL SOLUTION CONCENTRATIONS DURING ATMOSPHERIC LEACHING OF THE MATTE FOR A RESIDENCE TIME OF 7 HOURS
Leaching conditions: Temperature: (o C) 60Mixing rate (rpm): 205Pulp density (kg/L): 1.7Leaching time (hrs): 7
Leaching Co Fe Ni Cu pHTime (g/l) (g/l) (g/l) (g/l)
( min )
0 0.18 0.67 24.61 24.95 0.5115 0.49 3.20 69.46 20.70 1.4330 0.52 3.34 73.15 18.00 1.4560 0.59 3.50 78.78 14.28 1.5090 0.60 3.67 83.71 10.70 1.55
120 0.65 3.83 88.78 8.59 1.60180 0.69 3.87 93.10 5.32 1.68240 0.74 3.94 97.41 2.02 1.80300 0.76 4.18 102.23 0.00 2.00360 0.79 4.19 104.73 0.00 2.76420 0.83 4.11 106.89 0.00 3.22
Figure A7.3: Metal concentrations as a function of leachingtime for a residence time of 7 hours
0
20
40
60
80
100
120
0 15 30 60 90 120 180 240 300 360 420
Leaching Time, min
Sol
utio
n C
onc.
, g/L
0
1
2
3
4
5
Sol
utio
n pH
CoFe
NiCu
pH

TABLE A7.4: METAL EXTRACTIONS BASED ON SOLUTION CONCENTRATIONS DURING ATMOSPHERIC LEACHNG OF THE MATTE FOR A RESIDENCE TIME OF 7 HOURS
Leaching conditions: Temperature (o C): 60Mixing rate (rpm): 205Pulp density (kg/L): 1.7 Metal content of matteLeaching time (hrs): 7 Ni 614.14 g (47.98%)Matte (kg): 1.28 Co 4.35 g (0.34%)Solution (L): 1.54 Fe 7.68 g (0.6%)
Leaching Ni Ni Ni Co Co Co Fe Fe FeTime (g/l) (g) Leach (g/l) (g) leach (g/l) (g) %
( min ) % %
0 24.61 37.90 0.00 0.18 0.28 0 0.67 1.03 015 69.46 106.97 11.25 0.49 0.75 10.97 3.20 4.93 50.7330 73.15 112.56 12.16 0.52 0.80 12.01 3.34 5.14 53.4960 78.78 121.09 13.55 0.59 0.90 14.41 3.50 5.38 56.6090 83.71 128.43 14.74 0.60 0.92 14.75 3.67 5.63 59.84
120 88.78 135.73 15.93 0.65 0.99 16.40 3.83 5.86 62.84180 93.10 141.85 16.93 0.69 1.05 17.70 3.87 5.91 63.58240 97.41 147.84 17.90 0.74 1.12 19.30 3.94 6.01 64.84300 102.23 154.42 18.97 0.76 1.14 19.93 4.18 6.34 69.11360 104.73 157.77 19.52 0.79 1.18 20.85 4.19 6.35 69.28420 106.89 160.61 19.98 0.83 1.24 22.06 4.11 6.25 67.91
Figure A7.4: Metal extractions as a function of leaching time for a residence time of 7 hours
0
10
20
30
40
50
60
70
80
0 15 30 60 90 120 180 240 300 360 420
Leaching time, min
Met
al e
xtra
ctio
n, %
0
1
2
3
4
Sol
utio
n pH
Ni
Co
Fe
pH

TABLE A7.5: METAL SOLUTION CONCENTRATIONS DURING ATMOSPHERIC LEACHING OF THE MATTE FOR A RESIDENCE TIME OF 9 HOURS
Leaching conditions: Temperature: (o C) 60Mixing rate (rpm): 205Pulp density (kg/L): 1.7Leaching time (hrs): 9
Leaching Co Fe Ni Cu pHTime (g/l) (g/l) (g/l) (g/l)
( min )
0 0.18 0.67 24.61 24.95 0.4415 0.48 3.14 64.03 24.79 1.3330 0.46 3.3 69.32 21.01 1.3660 0.52 3.44 75.68 15.80 1.4290 0.58 3.64 82.03 11.71 1.46
120 0.63 3.76 85.98 9.31 1.58180 0.67 3.93 91.91 5.26 1.69240 0.72 4.02 97.56 2.04 1.80300 0.76 4.1 101.12 0.00 1.93360 0.79 4.01 102.28 0.00 2.68420 0.81 3.98 104.87 0.00 3.28540 0.89 3.92 105.04 0.00 4.92
Figure A7.5: Metal concentrations as a function of leaching time for a residence time of 9 hrs
0
20
40
60
80
100
120
0 15 30 60 90 120 180 240 300 360 420 540
Leaching Time, min
Solu
tion
Con
c., g
/l
0
1
2
3
4
5
Solu
tion
pH
Co
Fe
Ni
Cu
pH

TABLE A7.6: METAL EXTRACTIONS BASED ON SOLUTION CONCENTRATIONS DURING ATMOSPHERIC LEACHNG OF THE MATTE FOR A RESIDENCE TIME OF 9 HOURS
Leaching conditions: Temperature (o C): 60Mixing rate (rpm): 205Pulp density (kg/L): 1.7 Metal content of matteLeaching time (hrs): 9 Ni 614.14 g (47.98%)Matte (kg): 1.28 Co 4.35 g (0.34%)Solution (L): 1.54 Fe 7.68 g (0.6%)
Leaching Ni Ni Ni Co Co Co Fe Fe FeTime (g/l) (g) Leach (g/l) (g) leach (g/l) (g) %
( min ) % %
0 24.61 37.90 0.00 0.18 0.28 0 0.67 1.03 015 64.03 98.61 9.88 0.48 0.74 10.62 3.14 4.84 49.5330 69.32 106.62 11.19 0.46 0.71 9.92 3.3 5.08 52.6860 75.68 116.26 12.76 0.52 0.80 11.97 3.44 5.29 55.4090 82.03 125.72 14.30 0.58 0.89 13.99 3.64 5.58 59.22
120 85.98 131.41 15.23 0.63 0.96 15.65 3.76 5.75 61.47180 91.91 139.80 16.59 0.67 1.01 16.95 3.93 5.99 64.60240 97.56 147.65 17.87 0.72 1.08 18.55 4.02 6.12 66.23300 101.12 152.51 18.66 0.76 1.14 19.80 4.1 6.23 67.65360 102.28 154.06 18.91 0.79 1.18 20.72 4.01 6.11 66.08420 104.87 157.47 19.47 0.81 1.21 21.33 3.98 6.07 65.57540 105.04 157.69 19.51 0.89 1.31 23.70 3.92 5.99 64.56
Fig.ure A7.6: Metal extractions as a function of leaching time for a residance time of 9 hrs
0
10
20
30
40
50
60
70
0 15 30 60 90 120 180 240 300 360 420 540
Leaching Time, min
Met
al e
xtra
ctio
n, %
0
1
2
3
4
5
6
Solu
tion
pH
Co
Fe
Ni
pH

TABLE A7.5B: METAL SOLUTION CONCENTRATIONS DURING ATMOSPHERIC LEACHING OF THE MATTE FOR A RESIDENCE TIME OF 9 HOURS - SECOND TEST
Leaching conditions: Temperature: (o C) 60Mixing rate (rpm): 205Pulp density (kg/L): 1.7Leaching time (hrs): 9
Leaching Co Fe Ni CuTime (g/L) (g/L) (g/L) (g/L)
( min )
0 0.18 0.67 24.61 24.9515 0.41 2.25 58.73 22.1530 0.51 2.84 67.51 18.0860 0.54 3.41 76.18 13.2690 0.59 3.57 80.42 11.01
120 0.65 3.84 88.36 7.91180 0.70 4.05 94.11 5.39240 0.74 4.01 100.12 1.54300 0.78 4.15 102.78 0.00360 0.79 4.11 102.89 0.00420 0.86 3.95 105.62 0.00540 0.87 3.79 104.16 0.00
Figure A7.5B: Metal concentrations as a function of leaching time for a residence time of 9 hrs - second test
0
20
40
60
80
100
120
0 15 30 60 90 120 180 240 300 360 420 540
Leaching Time, min
Solu
tion
Con
c., g
/L
Co
Fe
Ni
Cu
pH

TABLE A7.6: METAL EXTRACTIONS BASED ON SOLUTION CONCENTRATIONS DURING ATMOSPHERIC LEACHNG OF THE MATTE FOR A RESIDENCE TIME OF 9 HOURS - SECOND TEST
Leaching conditions: Temperature (o C): 60Mixing rate (rpm): 205Pulp density (kg/L): 1.7 Metal content of matteLeaching time (hrs): 9 Ni 614.14 g (47.98%)Matte (kg): 1.28 Co 4.35 g (0.34%)Solution (L): 1.54 Fe 7.68 g (0.6%)
Leaching Ni Ni Ni Co Co Co Fe Fe FeTime (g/L) (g) Leach (g/L) (g) leach (g/L) (g) %
( min ) % %
0 24.61 37.90 0.00 0.18 0.28 0.00 0.67 1.03 0.0015 58.73 90.44 8.56 0.41 0.63 8.14 2.25 3.47 31.6830 67.51 103.75 10.72 0.51 0.78 11.62 2.84 4.36 43.3260 76.18 116.88 12.86 0.54 0.83 12.65 3.41 5.21 54.3890 80.42 123.20 13.89 0.59 0.90 14.33 3.57 5.44 57.43
120 88.36 134.63 15.75 0.65 0.99 16.32 3.84 5.83 62.49180 94.11 142.77 17.08 0.70 1.06 17.94 4.05 6.13 66.36240 100.12 151.12 18.44 0.74 1.11 19.22 4.01 6.07 65.64300 102.78 154.75 19.03 0.78 1.17 20.47 4.15 6.26 68.13360 102.89 154.90 19.05 0.79 1.18 20.78 4.11 6.21 67.43420 105.62 158.49 19.64 0.86 1.27 22.90 3.95 6.00 64.69540 104.16 156.61 19.33 0.87 1.29 23.19 3.79 5.79 62.00
Fig.ure A7.6B: Metal extractions as a function of leaching time for a residance time of 9 hrs - Second test
0
10
20
30
40
50
60
70
0 15 30 60 90 120 180 240 300 360 420 540
Leaching Time, min
Met
al e
xtra
ctio
n, %
Co
Fe
Ni
pH

TABLE A7.1: METAL SOLUTION CONCENTRATIONS DURING ATMOSPHERIC LEACHING OF THE MATTE FOR A RESIDENCE TIME OF 5 HOURS
Leaching conditions: Temperature: 60 oCAgitation: 205 rpmPulp density: 1.7 kg/L
Leaching Co Fe Ni Cu pHTime (g/l) (g/l) (g/l) (g/l)
( min )
0 0.18 0.67 24.61 24.95 0.9715 0.77 3.35 60.14 22.84 1.1030 0.79 3.44 62.18 19.49 1.1160 0.80 3.68 64.86 14.47 1.1890 0.79 3.49 67.18 10.45 1.28120 0.91 3.91 74.94 8.75 1.34150 0.88 3.96 76.05 6.39 1.43180 0.96 4.05 82.83 4.79 1.51240 0.91 4.08 84.33 1.30 1.61300 1.01 4.24 85.84 0.00 1.90
Figure A7.1: Metal concentrations as a function of leaching time for a residence time of 5 hours
0
10
20
30
40
50
60
70
80
90
100
0 15 30 60 90 120 150 180 240 300
Leaching Time, min
Solu
tion
Con
c., g
/l
0
1
2
3
4
5
Solu
tion
pH
Co FeNi CupH

TABLE A7.2: METAL EXTRACTIONS BASED ON SOLUTION CONCENTRATIONS DURING ATMOSPHERIC LEACHING OF THE MATTE FOR A RESIDENCE TIME OF 5 HOURS
Leaching conditions: Temperature: 60 oC Metal content of matte:Agitation: 205 rpm Ni 612.22 g (47.98%)Pulp density: 1.7 kg/L Co 4.34 g (0.34 %)Matte: 1.28 kg Fe 7.66 g (0.60 %)Solution: 1.54 L
Leaching Ni Ni Ni Co Co Co Fe Fe FeTime (g/l) (g) Leach (g/l) (g) leach (g/l) (g) ( % )
( min ) % %
0 24.61 37.83 0.00 0.18 0.28 0 0.67 1.03 015 60.14 92.44 8.92 0.77 1.18 20.90 3.35 5.15 53.8030 62.18 95.52 9.42 0.79 1.21 21.60 3.44 5.29 55.5860 64.86 99.57 10.09 0.80 1.23 21.94 3.68 5.64 60.2490 67.18 103.02 10.65 0.79 1.21 21.61 3.49 5.36 56.61120 74.94 114.17 12.47 0.91 1.39 25.58 3.91 5.97 64.50150 76.05 115.74 12.73 0.88 1.34 24.60 3.96 6.04 65.42180 82.83 125.14 14.26 0.96 1.46 27.16 4.05 6.16 67.05240 84.33 127.19 14.60 0.91 1.39 25.59 4.08 6.20 67.58300 85.84 129.21 14.93 1.01 1.52 28.67 4.24 6.42 70.38300
Figure A7.2: Metal extractions as a function of leaching time for a residence time of 5 hours
0
10
20
30
40
50
60
70
80
0 15 30 60 90 120 150 180 240 300
Leaching Time, min
Met
al e
xtra
ctio
n, %
0
1
2
3
4
Sol
utio
n pH
CoFeNipH

TABLE A8: METAL EXTRACTIONS BASED ON XRF ANALYSIS OF SOLID RESIDUE FROM ATMOSPHERIC LEACHING EXPERIMENTS
Feed matte
Ni ( % ) 47.98 Co ( % ) 0.34
Cu ( % ) 31.31 Fe ( % ) 0.60
Fixed Variable Wt of Wt of Metal in leach residue ( % ) Metal extraction ( % )matte (g) residue (g) Ni Co Fe Cu Ni Co Fe
Temp: 80 oC 1276 1143 41.3 0.25 0.19 42.00 22.89 34.13 71.63Temp: 70oC 1276 1172 42.9 0.26 0.17 42.00 17.88 29.76 73.98Temp: 60oC 1276 1181 43.7 0.27 0.18 41.00 15.70 27.04 72.23Temp: 50oC 1276 1199 43.5 0.26 0.29 40.00 14.81 27.31 54.58Time: 5 hrs 1276 1181 43.7 0.27 0.18 41.00 15.70 27.04 72.23Time: 7 hrs 1276 1178 42.3 0.26 0.19 41.00 18.61 30.49 70.77Time: 9 hrs 1276 1174 41.9 0.26 0.19 41.00 19.65 29.91 70.86Stirring rate: 145 rpm 1276 1195 44.9 0.25 0.20 41.00 12.36 31.14 68.94Stirring rate: 205 rpm 1276 1181 43.7 0.27 0.18 41.00 15.70 27.04 72.23Stirring rate: 400 rpm 1276 1178 41.4 0.24 0.13 40.00 20.34 35.10 80.46Particle size: -300+150 µm 1276 1182 43.2 0.25 0.10 36.00 16.60 31.89 84.25Particle size: -106+45 µm 1276 1139 43.7 0.24 0.17 39.00 18.70 36.99 74.71Particle size: -45 um 1276 1136 43.2 0.24 0.16 38.00 19.84 38.47 76.26SCM: temp: 70oC 1276 1176 41.3 0.25 0.13 39.00 20.67 - -
SCM: temp: 60oC 1276 1181 42.9 0.25 0.12 36.00 17.24 - -
SCM: temp: 50oC 1276 1186 43.2 0.25 0.15 35.00 16.31 - -PD: 1.75 kg/L 1276 1179 43.3 0.23 0.112 40.00 16.61 38.85 82.75PD: 1.7 kg/L 1276 1181 43.7 0.27 0.18 41.00 15.70 27.04 72.23PD: 1.6 kg/L 1276 1174 41.8 0.24 0.19 41.00 19.84 34.51 70.86H2SO4: 90 kg/L 1276 1181 43.7 0.27 0.18 41.00 15.70 27.04 72.23H2SO4: 110 kg/L 1276 1176 42.5 0.25 0.08 41.00 18.36 33.59 87.71H2SO4: 125 kg/L 1276 1161 42.4 0.23 0.08 41.00 19.59 38.18 87.87Cu: 25 kg/L 1276 1181 43.7 0.27 0.18 41.00 15.70 27.04 72.23Cu: 36 kg/L 1276 1180 42.4 0.24 0.16 40.00 18.28 34.45 75.34Cu: 48 kg/L 1276 1185 43.8 0.25 0.19 40.00 15.22 32.26 70.59
SCM = Shrinking Core Model (data for shrinking core model tests)
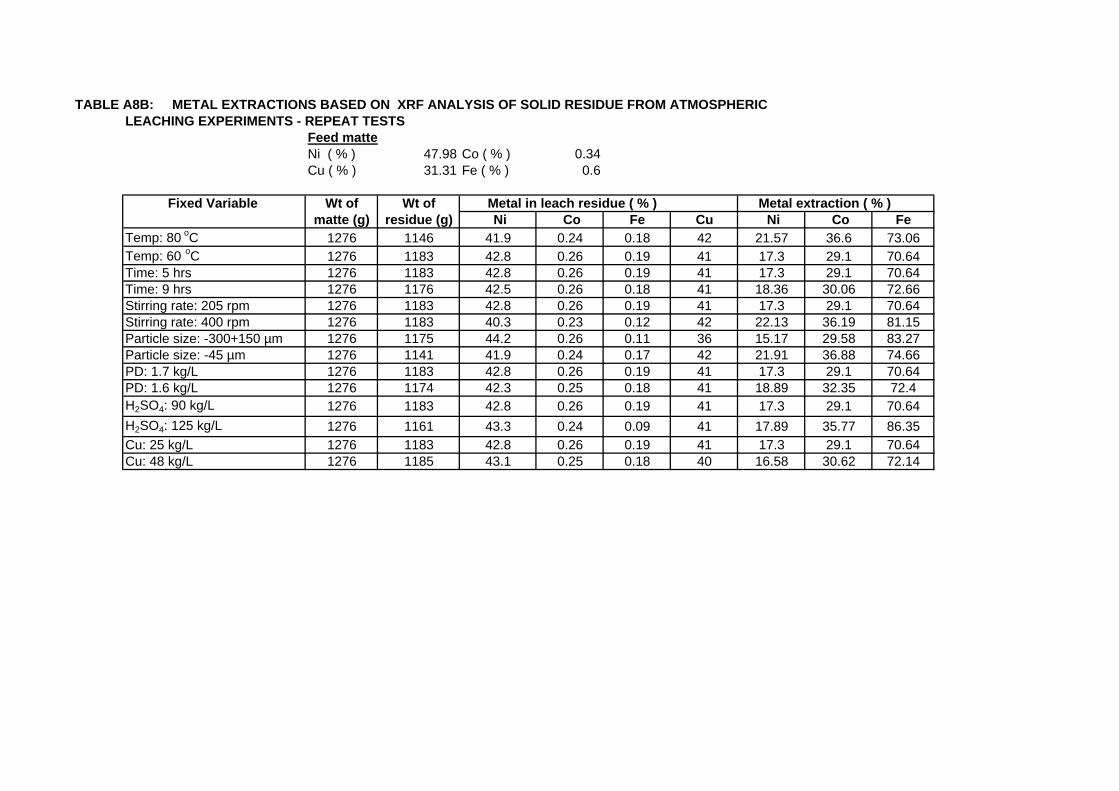
TABLE A8B: METAL EXTRACTIONS BASED ON XRF ANALYSIS OF SOLID RESIDUE FROM ATMOSPHERIC LEACHING EXPERIMENTS - REPEAT TESTS
Feed matteNi ( % ) 47.98 Co ( % ) 0.34Cu ( % ) 31.31 Fe ( % ) 0.6
Fixed Variable Wt of Wt of Metal in leach residue ( % ) Metal extraction ( % )matte (g) residue (g) Ni Co Fe Cu Ni Co Fe
Temp: 80 oC 1276 1146 41.9 0.24 0.18 42 21.57 36.6 73.06Temp: 60 oC 1276 1183 42.8 0.26 0.19 41 17.3 29.1 70.64Time: 5 hrs 1276 1183 42.8 0.26 0.19 41 17.3 29.1 70.64Time: 9 hrs 1276 1176 42.5 0.26 0.18 41 18.36 30.06 72.66Stirring rate: 205 rpm 1276 1183 42.8 0.26 0.19 41 17.3 29.1 70.64Stirring rate: 400 rpm 1276 1183 40.3 0.23 0.12 42 22.13 36.19 81.15Particle size: -300+150 µm 1276 1175 44.2 0.26 0.11 36 15.17 29.58 83.27Particle size: -45 µm 1276 1141 41.9 0.24 0.17 42 21.91 36.88 74.66PD: 1.7 kg/L 1276 1183 42.8 0.26 0.19 41 17.3 29.1 70.64PD: 1.6 kg/L 1276 1174 42.3 0.25 0.18 41 18.89 32.35 72.4H2SO4: 90 kg/L 1276 1183 42.8 0.26 0.19 41 17.3 29.1 70.64H2SO4: 125 kg/L 1276 1161 43.3 0.24 0.09 41 17.89 35.77 86.35Cu: 25 kg/L 1276 1183 42.8 0.26 0.19 41 17.3 29.1 70.64Cu: 48 kg/L 1276 1185 43.1 0.25 0.18 40 16.58 30.62 72.14

SHRINKING CORE MODELS
PARTICLE SIZE: -300 + 150 UM
Leaching Ni extraction Fraction Fraction Fraction Diffusion controlled Chemical reaction controlled Mixed controlled
Time % Leached (X) Leached (X) Leached (X) 1-3(1-X)2/3 + 2(1-X) 1-(1-X)1/3 [1-3(1-X)2/3 + 2(1-X)] + α[1-(1-X)1/3]
( hrs) 50 60 70 Ni (50 deg) Ni (60 deg) Ni (70 deg) (50 deg) (60 deg) (70 deg) (50 deg) (60 deg) (70 deg) (50 deg) (60 deg) (70 deg)
0 0.00 0 0 0.000 0.000 0.000 0.000 0.000 0.000 0.000 0.000 0.000 0.000 0.000 0.00015 5.91 6.24 7.71 0.059 0.062 0.077 0.001 0.001 0.002 0.020 0.021 0.026 0.002 0.002 0.00330 6.99 9.62 9.61 0.070 0.096 0.096 0.002 0.003 0.003 0.024 0.033 0.033 0.003 0.005 0.00560 9.72 10.8 12.26 0.097 0.108 0.123 0.003 0.004 0.005 0.034 0.037 0.043 0.005 0.006 0.00790 10.20 12.5 15.04 0.102 0.125 0.150 0.004 0.006 0.008 0.035 0.044 0.053 0.005 0.007 0.011
120 12.10 13.6 15.86 0.121 0.136 0.159 0.005 0.007 0.009 0.042 0.048 0.056 0.007 0.009 0.012180 13.01 16.45 18.22 0.130 0.165 0.182 0.006 0.010 0.012 0.045 0.058 0.065 0.008 0.012 0.015240 14.21 17.5 19.89 0.142 0.175 0.199 0.007 0.011 0.015 0.050 0.062 0.071 0.009 0.014 0.018
DIFFUSION CONTROL CHEMICAL CONTROL
0.000
0.002
0.004
0.006
0.008
0.011
0 30 60 90 120 150
Leaching time, min
1-3(
1-x)
2/3 +
2(1
-x)
50 deg.
60 deg.
70 deg.
0.000
0.010
0.020
0.030
0.040
0.050
0.060
0.070
0.080
0 30 60 90 120 150
Leaching time, min
1-(1
-x)1/
3
50 deg.
60 deg.
70 deg.

50 oC 60 oC 70 oC[1-3(1-X)2/3 + 2(1-X)]/t [1-(1-X)1/3]/t [1-3(1-X)2/3 + 2(1-X)]/t [1-(1-X)1/3]/t [1-3(1-X)2/3 + 2(1-X)]/t [1-(1-X)1/3]/t
#DIV/0! #DIV/0! #DIV/0! #DIV/0! #DIV/0! #DIV/0!0.0797 1.3401 0.0890 1.4166 0.1368 1.75940.0560 0.7955 0.1075 1.1051 0.1073 1.10390.0549 0.5585 0.0681 0.6230 0.0884 0.71100.0404 0.3914 0.0613 0.4837 0.0899 0.58760.0430 0.3507 0.0548 0.3963 0.0753 0.46610.0333 0.2522 0.0542 0.3231 0.0671 0.36030.0300 0.2075 0.0462 0.2588 0.0605 0.2969
MIXED CONTROL ESTIMATION OF KINETIC CONSTANT α Temp. (o C) α50 0.041760 0.044970 0.0497
0.000
0.002
0.004
0.006
0.008
0.011
0.013
0.015
0 30 60 90 120 150Leaching time, min
[1-3
(1-x
)2/3 +
2(1
-x)]+
α[1-
(1-X
)1/3 ]
50 deg.
60 deg.
70 deg.y = 0.0497x + 0.0518
R2 = 0.9679
y = 0.0417x + 0.025R2 = 0.9539
y = 0.0449x + 0.0392R2 = 0.8037
0.000
0.020
0.040
0.060
0.080
0.100
0.120
0.140
0.000 0.500 1.000 1.500 2.000
[1-(1-X)1/3] / t
[1-3
(1-x
)2/3 +
2(1
-x)]
/ t
50 deg.
60 deg.
70 deg.

TABLE B1.1: METAL CONCENTRATIONS DURING PRESSURE LEACHING OF MATTE PRE-LEACHED AT 80 oC
Leaching conditions: Temperature ( oC ): 145Total pressure (kPa ): 500Initial P.D. ( kg/L ): 1.4Leaching time (hrs ): 3Mixing rate ( rpm ): 900Oxidant : O2
Leaching Co Fe Ni CuTime (g/l) (g/l) (g/l) (g/l) pH
( min )) *
-25 0.17 0.75 21.90 26.20 0.410 0.32 1.00 44.20 14.80 0.4615 0.47 1.28 64.50 0.79 0.530 0.53 1.35 68.70 0.20 0.5260 0.54 1.37 81.10 0.19 0.7290 0.54 1.37 93.20 0.22 0.82120 0.55 1.39 96.50 0.12 0.89150 0.54 1.39 99.80 0.12 0.95180 0.55 1.43 103.00 0.06 1.01
* First 25 minutes was solution pre-heating time
Figure B1.1: Metal concentrations as a function of leaching time for the matte pre-leached at 80 oC
0
10
20
30
40
50
60
70
80
90
100
110
-25 0 15 30 60 90 120 150 180
Leaching Time, min
Ni,
Cu,
g/L
0
1
2
3
4
5
6
7
8
Fe, C
o, g
/LpH
Ni
Cu
Co
Fe
pH

TABLE B1.2: METAL EXTRACTIONS BASED ON SOLUTION CONCENTRATIONS DURING PRESSURE LEACHING OF MATTE PRE-LEACHED AT 80 oC
Feed matte: Feed solution: Leaching conditions:Wt 397 g Volume 1.167 L Temperature: 145 oCNi 34.30 % Ni 21.9 g/L Total pressure: 500 kPaCo 0.11 % Co 0.17 g/L Initial P.D. : 1.4 kg/LFe 0.19 % Fe 0.75 g/L Oxidant: O2
Leaching Ni Ni Ni Co Co Co Fe Fe Fe H2SO4Time (g/l) (g) Leach (g/l) (g) leach (g/l) (g) % (g/l)
( min ) % %
- 25 21.90 25.56 0 0.17 0.20 0 0.75 0.88 0 99.400 44.20 51.58 19 0.32 0.37 40 1.00 1.17 39 73.6015 64.50 74.76 36 0.47 0.54 79 1.28 1.48 80 68.2030 68.70 79.46 40 0.53 0.61 95 1.35 1.57 92 48.6060 81.10 93.00 50 0.54 0.62 96 1.37 1.59 94 28.5090 93.20 105.91 59 0.54 0.62 97 1.37 1.59 94 24.20120 96.50 109.35 62 0.55 0.63 99 1.39 1.60 97 21.10150 99.80 112.70 64 0.54 0.63 98 1.39 1.61 97 14.50180 103.00 115.88 66 0.55 0.63 100 1.43 1.65 102 13.40
* First 25 minutes was solution pre-heating time
Figure B1.2.: Metal extraction as a function of leaching time for matte pre-leached at 80 oC
0
10
20
30
40
50
60
70
80
90
100
110
0 15 30 60 90 120 150 180
Leaching Time, min
Met
al e
xtra
ctio
n, %
0
10
20
30
40
50
60
70
80
90
100
110
H2S
O4,
g/L
CoFeNiH2SO4

TABLE B1.3: METAL CONCENTRATIONS DURING PRESSURE LEACHING OF MATTE PRE-LEACHED AT 60 oC
Leaching conditions: Temperature ( oC ): 145Total pressure (kPa ): 500Initial P.D. ( kg/L ): 1.4Leaching time (hrs ): 3Mixing rate ( rpm ) 900Oxidant : O2
Leaching Co Fe Ni CuTime (g/l) (g/l) (g/l) (g/l) pH
( min )) *
-25 0.17 0.75 21.90 26.20 0.410 0.38 1.16 47.20 10.60 0.515 0.50 1.23 64.30 0.18 0.5330 0.55 1.28 71.00 0.30 0.6360 0.56 1.32 88.00 0.87 1.3490 0.56 1.33 91.20 0.13 3.19120 0.58 1.00 99.90 0.01 3.45180 0.59 0.99 104.00 0.00 4.28
*First 25 minutes were solution pre-heating time
Figure B1.3: Metal concentrations as a function of time for the matte pre-leached a60 oC
0
1020
30
40
5060
70
80
90100
110
120
-25 0 15 30 60 90 120 180
Leaching Time, min
Ni,
Cu,
g/l
0
1
2
3
4
5
6
7
8
Fe, C
o, g
/lpH
Ni
Cu
Co
Fe
pH

TABLE B1.4: METAL EXTRACTIONS BASED ON SOLUTION CONCENTRATIONS DURING PRESSURE LEACHING OF MATTE PRE-LEACHED AT 60 oC
Feed matte: Feed solution: Leaching conditions:Wt 397 g Volume 1.167 L Temperature: 145 oCNi 34.50 % Ni 21.9 g/L Total pressure: 500 kPaCo 0.12 % Co 0.17 g/L Initial P.D. : 1.4 kg/LFe 0.17 % Fe 0.75 g/L Oxidant: O2
Leaching Ni Ni Ni Co Co Co Fe Fe Fe H2SO4Time (g/l) (g) Leach (g/l) (g) leach (g/l) (g) % (g/l)
( min ) % %*
-25 21.90 25.56 0 0.17 0.20 0 0.75 0.88 0 99.400 47.20 55.08 22 0.38 0.44 51 1.16 1.35 71 57.2015 64.30 74.61 36 0.50 0.58 80 1.23 1.43 83 47.6030 71.00 82.09 41 0.55 0.64 92 1.28 1.49 91 32.1060 88.00 100.66 55 0.56 0.65 95 1.32 1.53 98 31.6090 91.20 104.07 57 0.56 0.65 94 1.33 1.54 99 30.10120 99.90 113.14 64 0.58 0.67 99 1.36 1.58 104 21.60180 104.00 117.31 67 0.59 0.68 101 1.35 1.56 102 12.10
* First 25 minutes was solution pre-heating time
Figure B1.4: Metal extraction as a function of leaching time for matte pre-leached at 60 oC )
0
10
20
30
40
50
60
70
80
90
100
110
-25 0 15 30 60 90 120 180
Leaching Time, min
Met
al e
xtra
ctio
n, %
0
10
20
30
40
50
60
70
80
90
100
110
H2S
O4,
g/L
Co
Fe
Ni
H2SO4

TABLE B1.5: METAL CONCENTRATIONS DURING PRESSURE LEACHING OF MATTE PRE-LEACHED AT 50 oC
Leaching conditions: Temperature ( oC ): 145Total pressure (kPa ) 500 Initial P.D. ( kg/L ): 1.4Leaching time (hrs ): 2.5Mixing rate ( rpm ) 900Oxidant : O2
Leaching Co Fe Ni CuTime (g/l) (g/l) (g/l) (g/l) pH
( min )*
-25 0.17 0.75 21.90 26.20 0.410 0.37 1.02 47.40 11.90 0.5215 0.51 1.27 66.10 0.84 0.5530 0.51 1.38 73.90 0.13 0.6460 0.52 1.39 83.90 0.13 0.9090 0.52 1.40 87.70 0.04 0.99120 0.55 1.40 96.10 0.03 1.03150 0.55 1.41 99.30 0.07 1.12180
* First 25 minutes were solution pre-heating time
Figure B1.5: Metal concentrations as a function of leaching time for the matte pre-leachedat 50 oC
0
10
20
30
40
50
60
70
80
90
100
110
-25 0 15 30 60 90 120 150 180
Leaching Time, min
Ni,
Cu,
g/l
0
1
2
3
4
5
6
7
8
Fe, C
o, g
/lpH
Ni
Cu
Co
Fe
pH

TABLE B1.6: METAL EXTRACTIONS BASED ON SOLUTION CONCENTRATIONS DURING PRESSURE LEACHING OF MATTE PRE-LEACHED AT 50 oC
Feed matte: Feed solution: Leaching conditions:Wt 397 g Volume 1.167 L Temperature: 145 oCNi 34.30 % Ni 21.9 g/L Total pressure: 500 kPaCo 0.11 % Co 0.17 g/L Initial P.D. : 1.4 kg/LFe 0.19 % Fe 0.75 g/L Oxidant: O2
Leaching Ni Ni Ni Co Co Co Fe Fe Fe H2SO4Time (g/l) (g) Leach (g/l) (g) leach (g/l) (g) % (g/l)
( min ) % %*
-25 21.90 25.56 0 0.17 0.20 0 0.75 0.88 0 99.400 47.40 55.32 22 0.37 0.43 53 1.02 1.19 42 64.3015 66.10 76.67 38 0.51 0.59 90 1.27 1.48 80 53.4030 73.90 85.38 44 0.51 0.59 91 1.38 1.60 96 32.3060 83.90 96.30 52 0.52 0.60 92 1.39 1.61 97 22.4090 87.70 100.36 55 0.52 0.61 93 1.40 1.61 98 21.40120 96.10 109.11 61 0.55 0.63 99 1.40 1.62 99 15.50150 99.30 112.37 64 0.55 0.63 100 1.41 1.63 100 13.10180
* First 25 minutes were solution pre-heating time
Figure B1.6: Metal extraction as a function of leaching time for matte pre-leached at 50 oC
0
10
20
30
40
50
60
70
80
90
100
110
-25 0 15 30 60 90 120 150
Leaching Time, min
Met
al e
xtra
ctio
n, %
0
10
20
30
40
50
60
70
80
90
100
110
H2S
O4,
g/L
CoFeNiH2SO4

TABLE B2.3: METAL CONCENTRATIONS DURING PRESSURE LEACHING OF MATTE PRE-LEACHED AT STIRRING RATE OF 205 RPM
Leaching conditions: Temperature ( oC ): 145Total pressure (kPag ): 500Initial P.D. ( kg/L ): 1.4Leaching time (hrs ): 3Mixing rate ( rpm ) 900Oxidant : O2
Leaching Co Fe Ni CuTime (g/l) (g/l) (g/l) (g/l) pH
( min )) *
-25 0.17 0.75 21.90 26.20 0.410 0.38 1.16 47.20 10.60 0.515 0.50 1.23 64.30 0.18 0.5330 0.55 1.28 71.00 0.30 0.6360 0.56 1.32 88.00 0.87 1.3490 0.56 1.33 91.20 0.13 3.19120 0.58 1.00 98.60 0.01 3.45180 0.59 0.99 104.00 0.00 4.28
*First 25 minutes were solution pre-heating time
Figure B2.3: Metal concentration as a function of time for the matte pre-leached astirring rate of 205 rpm
010
2030
4050
6070
8090
100110
120
-25 0 15 30 60 90 120 180
Leaching Time, min
Ni,
Cu,
g/l
0
1
2
3
4
5
6
7
8
Fe, C
o, g
/lpH
Ni
Cu
Co
Fe
pH

TABLE B2.4: METAL EXTRACTIONS BASED ON SOLUTION CONCENTRATIONS DURING PRESSURE LEACHING OF MATTE PRE-LEACHED AT STIRRING RATE OF 205 RPM
Feed matte: Feed solution: Leaching conditions:Wt 397 g Volume 1.167 L Temperature: 145 oCNi 34.50 % Ni 21.9 g/L Total pressure: 500 kPagCo 0.12 % Co 0.17 g/L Initial P.D. : 1.4 kg/LFe 0.17 % Fe 0.75 g/L Oxidant: O2
Leaching Ni Ni Ni Co Co Co Fe Fe Fe H2SO4Time (g/l) (g) Leach (g/l) (g) leach (g/l) (g) % (g/l)
( min ) % %*
-25 21.90 25.56 0 0.17 0.20 0 0.75 0.88 0 99.400 47.20 55.08 22 0.38 0.44 51 1.16 1.35 71 57.2015 64.30 74.61 36 0.50 0.58 80 1.23 1.43 83 47.6030 71.00 82.09 41 0.55 0.64 92 1.28 1.49 91 32.1060 88.00 100.66 55 0.56 0.65 95 1.32 1.53 98 31.6090 91.20 104.07 57 0.56 0.65 94 1.33 1.54 99 30.10120 98.60 111.78 63 0.58 0.67 99 1.36 1.58 104 21.60180 104.00 117.28 67 0.59 0.68 101 1.35 1.56 102 12.10
* First 25 minutes was solution pre-heating time
Figure B2.4: Metal extraction as a function of leaching time for matte pre-leached at stirring rateof 205 rpm
0
10
20
30
40
50
60
70
80
90
100
110
-25 0 15 30 60 90 120 180
Leaching Time, min
Met
al e
xtra
ctio
n, %
0
10
20
30
40
50
60
70
80
90
100
110
H2S
O4,
g/L
Co
Fe
Ni
H2SO4

TABLE B2.1: METAL CONCENTRATIONS DURING PRESSURE LEACHING OF MATTE PRE-LEACHED AT STIRRING RATE OF 145 RPM
Leaching conditionsTemperature ( oC ): 145Total pressure (kPag ) 500Initial P.D. ( kg/L ): 1.4Leaching time (hrs ): 3Mixing rate ( rpm ) 900Oxidant : O2
Leaching Co Fe Ni Cu H2SO4 pHTime (g/l) (g/l) (g/l) (g/l) (g/l)
( min )*
-25 0.17 0.75 21.90 26.20 994.00 0.410 0.27 1.19 34.70 0.00 711.00 0.4915 0.46 1.30 60.80 0.04 575.00 0.5930 0.51 1.32 64.60 0.02 415.00 0.6560 0.52 1.33 72.80 0.14 366.00 0.7290 0.53 1.35 86.80 0.04 290.00 0.77120 0.55 1.40 91.20 0.00 231.00 0.82150 0.56 1.42 98.50 0.01 211.00 0.84180
* First 25 minutes were solution pre-heating time
Figure B2.1: Metal concentration as a function of time for matte pre-leached astirring rate 145 rpm
01020304050
60708090
100110
-25 0 15 30 60 90 120 150 180
Leaching Time, min
Ni,
Cu,
g/l
0
1
2
3
4
5
6
7
8
Fe, C
o g/
lpH
Ni
Cu
Co
Fe
pH

TABLE B2.2: METAL EXTRACTIONS BASED ON SOLUTION CONCENTRATIONS DURING PRESSURE LEACHING OF MATTE PRE-LEACHED AT STIRRING RATE OF 145 RPM
Feed matte: Feed solution: Leaching conditions:Wt 397 g Volume 1.167 L Temperature: 145 oCNi 34.30 % Ni 21.9 g/L Total pressure: 500 kPaCo 0.11 % Co 0.17 g/L Initial P.D. : 1.4 kg/LFe 0.19 % Fe 0.75 g/L Oxidant: O2
Leaching Ni Ni Ni Co Co Co Fe Fe Fe H2SO4Time (g/l) (g) Leach (g/l) (g) leach (g/l) (g) % (g/l)
( min ) % %*
-25 21.90 25.56 0 0.17 0.20 0 0.75 0.88 0 99.400 34.70 40.49 11 0.27 0.32 27 1.19 1.39 68 71.1015 60.80 70.30 33 0.46 0.53 76 1.30 1.51 85 57.5030 64.60 74.55 36 0.51 0.59 89 1.32 1.54 88 41.5060 72.80 83.50 43 0.52 0.60 92 1.33 1.55 89 36.6090 86.80 98.44 54 0.53 0.61 95 1.35 1.57 92 29.00120 91.20 103.02 57 0.55 0.63 98 1.40 1.62 99 23.10150 98.50 110.45 62 0.56 0.64 100 1.42 1.64 101 21.10
180
*First 25 minutes were solution pre-heating time
Figure B2.2: Metal extraction as a function of leaching time for matte pre-leached at stirring rate o145 rpm
0
10
20
30
40
50
60
70
80
90
100
110
-25 0 15 30 60 90 120 150 180
Leaching Time, min
Met
al e
xtra
ctio
n, %
0
10
20
30
40
50
60
70
80
90
100
110
H2S
O4,
g/L
CoFeNiH2SO4

TABLE B2.5: METAL CONCENTRATIONS DURING PRESSURE LEACHING OF MATTE PRE-LEACHED AT STIRRING RATE OF 400 RPM
Leaching conditionTemperature ( oC ): 145Total pressure (kPag 500Initial P.D. ( kg/L ): 1.4Leaching time (hrs ): 3Mixing rate ( rpm ) 900Oxidant : O2
Leaching Co Fe Ni Cu H2SO4 pHTime (g/l) (g/l) (g/l) (g/l) (g/l)
( min )*
-25 0.17 0.75 21.90 26.20 994.00 0.410 0.37 1.21 46.40 0.00 662.00 0.515 0.48 1.28 66.80 0.05 563.00 0.5330 0.50 1.31 71.00 0.01 484.00 0.5760 0.51 1.36 78.40 0.03 432.00 0.6390 0.51 1.40 81.20 0.01 422.00 0.65
120 0.53 1.41 83.70 0.04 403.00 0.68150 0.55 1.41 95.30 0.17 421.00 0.70180 0.55 1.41 100.80 0.79 316.00 0.74
* First 25 minutes were solution pre-heating time
Figure B2.5: Metal concentration as a function of time for matte pre-leached at stirringrate of 400 rpm
0
10
20
30
40
50
60
70
80
90
100
110
-25 0 15 30 60 90 120 150 180
Leaching Time, min
Ni,
Cu,
g/l
0
1
2
3
4
5
6
7
8
Fe, C
o g/
lpH
Ni
Cu
Co
Fe
pH

TABLE B2.6: METAL EXTRACTIONS BASED ON SOLUTION CONCENTRATIONS DURING PRESSURE LEACHING OF MATTE PRE-LEACHED AT STIRRING RATE OF 400 RPM
Feed matte: Feed solution: Leaching conditions:Wt 397 g Volume 1.167 L Temperature: 145 oCNi 34.30 % Ni 21.9 g/L Total pressure: 500 kPaCo 0.11 % Co 0.17 g/L Initial P.D. : 1.4 kg/LFe 0.19 % Fe 0.75 g/L Oxidant: O2
Leaching Ni Ni Ni Co Co Co Fe Fe Fe H2SO4 Time (g/l) (g) Leach (g/l) (g) leach (g/l) (g) % (g/l)
( min ) % %*
-25 21.90 25.56 0 0.17 0.20 0 0.75 0.88 0 99.400 46.40 54.15 21 0.37 0.43 53 1.21 1.41 71 66.2015 66.80 77.45 38 0.48 0.56 82 1.28 1.49 82 56.3030 71.00 82.14 42 0.50 0.58 88 1.31 1.53 87 48.4060 78.40 90.22 47 0.51 0.59 90 1.36 1.57 93 43.2090 81.20 93.21 50 0.51 0.59 90 1.40 1.62 99 42.20
120 83.70 95.81 52 0.53 0.61 94 1.41 1.63 100 40.30150 95.30 107.61 60 0.55 0.63 100 1.41 1.63 100 42.10180 100.80 115.58 66 0.55 0.65 103 1.41 1.67 105 31.60
* First 25 minutes were solution pre-heating time
Fig.ure B2.6: Metal extraction as a function of leaching time for matte pre-leached atstirring rate of 400 rpm
0
10
20
30
40
50
60
70
80
90
100
110
-25 0 15 30 60 90 120 150 180
Leaching Time, min
Met
al e
xtra
ctio
n, %
0
10
20
30
40
50
60
70
80
90
100
110
H2S
O4,
g/L
CoFeNiH2SO4

TABLE B3.3: METAL CONCENTRATIONS DURING PRESSURE LEACHING OF MATTE PRE-LEACHED AT PULP DENSITY OF 1.7 kg/L
Leaching conditions: Temperature ( oC ): 145Total pressure (kPa ): 500Initial P.D. ( kg/L ): 1.4Leaching time (hrs ): 3Mixing rate ( rpm ) 900Oxidant : O2
Leaching Co Fe Ni CuTime (g/l) (g/l) (g/l) (g/l) pH
( min )) *
-25 0.17 0.75 21.90 26.20 0.410 0.38 1.16 47.20 10.60 0.515 0.50 1.23 64.30 0.18 0.5330 0.55 1.28 71.00 0.30 0.6360 0.56 1.32 88.00 0.87 1.3490 0.56 1.33 91.20 0.13 3.19120 0.58 1.00 98.60 0.01 3.45180 0.59 0.99 104.00 0.00 4.28
*First 25 minutes were solution pre-heating time
Figure B3.3: Metal concentrations as a function of time for the matte pre-leached apulp density of 1.7 kg/L
0
1020
30
40
5060
70
80
90100
110
120
-25 0 15 30 60 90 120 180
Leaching Time, min
Ni,
Cu,
g/l
0
1
2
3
4
5
6
7
8
Fe, C
o, g
/lpH
Ni
Cu
Co
Fe
pH

TABLE B3.4: METAL EXTRACTIONS BASED ON SOLUTION CONCENTRATIONS DURING PRESSURE LEACHING OF MATTE PRE-LEACHED AT PULP DENSITY OF 1.7 kg/L
Feed matte: Feed solution: Leaching conditions:Wt 397 g Volume 1.167 L Temperature: 145 oCNi 34.50 % Ni 21.9 g/L Total pressure: 500 kPaCo 0.12 % Co 0.17 g/L Initial P.D. : 1.4 kg/LFe 0.17 % Fe 0.75 g/L Oxidant: O2
Leaching Ni Ni Ni Co Co Co Fe Fe Fe H2SO4Time (g/l) (g) Leach (g/l) (g) leach (g/l) (g) % (g/l)
( min ) % %*
-25 21.90 25.56 0 0.17 0.20 0 0.75 0.88 0 99.400 47.20 55.08 22 0.38 0.44 51 1.16 1.35 71 57.2015 64.30 74.61 36 0.50 0.58 80 1.23 1.43 83 47.6030 71.00 82.09 41 0.55 0.64 92 1.28 1.49 91 32.1060 88.00 100.66 55 0.56 0.65 95 1.32 1.53 98 31.6090 91.20 104.07 57 0.56 0.65 94 1.33 1.54 99 30.10120 98.60 111.78 63 0.58 0.67 99 1.36 1.58 104 21.60180 104.00 117.28 67 0.59 0.68 101 1.35 1.56 102 12.10
* First 25 minutes was solution pre-heating time
Figure B3.4: Metal extraction as a function of leaching time for matte pre-leached at pulp density of 1.7 kg/L
0
10
20
30
40
50
60
70
80
90
100
110
-25 0 15 30 60 90 120 180
Leaching Time, min
Met
al e
xtra
ctio
n, %
0
10
20
30
40
50
60
70
80
90
100
110
H2S
O4,
g/L
Co
Fe
Ni
H2SO4

TABLE B3.1 METAL CONCENTRATIONS DURING PRESSURE LEACHING OF MATTE PRE-LEACHED AT PULP DENSITY OF 1.6 kg/L
Leaching conditionTemperature ( oC ): 145Total pressure (kPa ): 500Initial P.D. ( kg/L ): 1.4Leaching time (hrs ): 3Mixing rate ( rpm ) 900Oxidant : O2
Leaching Co Fe Ni Cu H2SO4 pH
Time (g/l) (g/l) (g/l) (g/l) (g/l)( min )
*-25 0.17 0.75 21.90 26.20 994.00 0.410 0.33 1.18 41.30 15.90 516.00 0.5815 0.46 1.21 65.20 0.04 369.00 0.6230 0.51 1.29 76.50 0.00 254.00 0.6860 0.52 1.30 80.20 0.00 223.00 0.8790 0.52 1.38 81.60 0.01 222.00 0.97120 0.54 1.42 96.70 0.02 269.00 1.02150 0.55 1.43 98.80 0.47 265.00 1.05180
* First 25 minutes were solution pre-heating time
Figure B3.1 Metal concentration as a function of time for matte pre-leached at apulp density of 1.6 kg/L
0
10
20
30
40
50
60
70
80
90
100
110
-25 0 15 30 60 90 120 150 180
Leaching Time, min
Ni,
Cu,
g/l
0
1
2
3
4
5
6
7
8
Fe, C
o g/
lpH
Ni
Cu
Co
Fe
pH

TABLE B3.2: METAL EXTRACTIONS BASED ON SOLUTION CONCENTRATIONS DURING PRESSURE LEACHING OF MATTE PRE-LEACHED AT PULP DENSITY OF 1.6 kg/L
Feed matte: Feed solution: Leaching conditions: Wt 397 g Volume 1.167 L Temperature: 145 oC
Ni 34.30 % Ni 21.9 g/L Total pressure: 500 kPaCo 0.11 % Co 0.17 g/L Initial P.D. : 1.4 kg/LFe 0.19 % Fe 0.75 g/L Oxidant: O2
Leaching Ni Ni Ni Co Co Co Fe Fe Fe H2SO4Time (g/l) (g) Leach (g/l) (g) leach (g/l) (g) % (g/l)
( min ) % %*
-25 21.90 25.56 0 0.17 0.20 0 0.75 0.88 0 99.400 41.30 48.20 17 0.33 0.39 43 1.18 1.38 67 51.6015 65.20 75.49 37 0.46 0.53 77 1.21 1.41 71 36.9030 76.50 88.11 46 0.51 0.59 90 1.29 1.50 83 25.4060 80.20 92.15 49 0.52 0.60 92 1.30 1.51 84 22.3090 81.60 93.65 50 0.52 0.60 92 1.38 1.60 96 22.20120 96.70 109.38 62 0.54 0.62 97 1.42 1.63 101 26.90150 98.80 111.52 63 0.55 0.63 100 1.43 1.65 103 26.50180
* First 25 minutes were solution pre-heating time
Figure B3.2: Metal extraction as a function of leaching time for the matte pre-leached at pulpdensity of 1.6 kg/L
0
10
20
30
40
50
60
70
80
90
100
110
-25 0 15 30 60 90 120 150 180
Leaching Time, min
Met
al e
xtra
ctio
n, %
0
10
20
30
40
50
60
70
80
90
100
110
H2S
O4,
g/L
Co
Fe
Ni

TABLE B3.5 METAL CONCENTRATIONS DURING PRESSURE LEACHING OF MATTE PRE-LEACHED AT PULP DENSITY OF 1.75 kg/L
Leaching conditions: Temperature ( oC ): 145Total pressure (kPa ): 500Initial P.D. ( kg/L ): 1.4Leaching time (hrs ): 3Mixing rate ( rpm ) 900Oxidant : O2
Leaching Co Fe Ni Cu H2SO4 pHTime (g/l) (g/l) (g/l) (g/l) (g/l)
( min )*
-25 0.17 0.75 21.90 26.20 994.00 0.410 0.33 1.00 43.20 17.20 582.00 0.4615 0.45 1.03 64.00 0.01 509.00 0.530 0.51 1.05 77.30 0.01 375.00 0.5260 0.51 1.05 79.60 0.01 262.00 0.7290 0.52 1.06 82.80 0.00 227.00 0.82
120 0.53 1.05 84.50 0.06 221.00 0.89150 0.55 1.06 95.40 0.03 211.00 0.95180 0.55 1.05 100.20 0.00 206.00 1.01
* First 25 minutes were solution pre-heating time
Figure B3.5: Metal concentration as a function of time for matte pre-leached atpulp density of 1.75 kg/L
0
10
20
30
40
50
60
70
80
90
100
110
-25 0 15 30 60 90 120 150 180
Leaching Time, min
Ni,
Cu,
g/l
0
1
2
3
4
5
6
7
8
Fe, C
o g/
lpH
Ni
Cu
Co
Fe
pH

TABLE B3.6: METAL EXTRACTIONS BASED ON SOLUTION CONCENTRATIONS DURING PRESSURE LEACHING OF MATTE PRE-LEACHED AT PULP DENSITY OF 1.75 kg/L
Feed matte: Feed solution: Leaching conditions: Wt 397 g Volume 1.167 L Temperature: 145 oC
Ni 34.80 % Ni 21.9 g/L Total pressure: 500 kPaCo 0.11 % Co 0.17 g/L Initial P.D. : 1.4 kg/LFe 0.09 % Fe 0.75 g/L Oxidant: O2
Leaching Ni Ni Ni Co Co Co Fe Fe Fe H2SO4Time (g/l) (g) Leach (g/l) (g) leach (g/l) (g) % (g/l)
( min ) % %
-25 21.90 25.56 0 0.17 0.20 0 0.75 0.88 0 99.400 43.20 50.41 18 0.33 0.39 43 1.00 1.16 81 58.2015 64.00 74.17 35 0.45 0.52 74 1.03 1.20 92 50.9030 77.30 89.02 46 0.51 0.59 89 1.05 1.22 97 37.5060 79.60 91.54 48 0.51 0.59 90 1.05 1.22 98 26.2090 82.80 94.95 50 0.52 0.60 91 1.06 1.23 99 22.70
120 84.50 96.72 52 0.53 0.61 95 1.05 1.23 99 22.10150 95.40 107.81 60 0.55 0.63 98 1.06 1.23 99 21.10180 100.20 115.07 65 0.55 0.63 99 1.05 1.23 98 20.60
* Fisrt 25 minutes were solution pre-heating time
Fig.ure B3.6: Metal extraction as a function of leaching time for matte pre-leached atpulp density of 1.75 kg/L
0
10
20
30
40
50
60
70
80
90
100
110
-25 0 15 30 60 90 120 150 180
Leaching Time, min
Met
al e
xtra
ctio
n, %
0
10
20
30
40
50
60
70
80
90
100
110
H2S
O4,
g/L
CoFeNiH2SO4

TABLE B4.3: METAL CONCENTRATIONS DURING PRESSURE LEACHING OF MATTE PRE-LEACHED FOR 3 HOURS
Leaching conditions Temperature ( oC ): 145Total pressure (kPa ): 500Initial P.D. ( kg/L ): 1.4Leaching time (hrs ): 3Mixing rate ( rpm ): 900Oxidant : O2
Leaching Co Fe Ni Cu H2SO4 pHTime (g/l) (g/l) (g/l) (g/l) (g/l)
( min )
-25 0.17 0.75 21.90 26.20 99.400 0.35 0.95 52.40 2.98 65.40 0.5115 0.49 1.20 59.10 0.25 51.80 0.5530 0.51 1.36 62.80 0.01 47.40 0.5860 0.52 1.39 76.20 0.01 41.40 0.7690 0.52 1.39 76.80 0.01 37.30 0.83
120 0.53 1.40 85.50 0.01 29.20 0.90150 0.55 1.41 88.30 0.01 31.20 0.91180 0.55 1.43 91.60 0.01 28.90 0.94
* First 25 minutes was solution pre-heating time
Figure B4.3: Metal concentration as a function of time for matte pre-leached for aresidence time of 3 hours
0102030405060708090
100110
-25 0 15 30 60 90 120 150 180
Leaching Time, min
Ni,
Cu,
g/l
0
1
2
3
4
5
6
7
8
Fe, C
o g/
lpHNi
Cu
Co
Fe
pH

TABLE B4.4: METAL EXTRACTIONS BASED ON SOLUTION CONCENTRATIONS DURING PRESSURE LEACHING OF MATTE PRE-LEACHED FOR A RESIDENCE TIME OF 3 HOURS
Feed matte: Feed solution: Leaching conditions:Wt 397 g Volume 1.167 L Temperature: 145 oCNi 34.30 % Ni 21.9 g/L Total pressure: 500 kPaCo 0.11 % Co 0.17 g/L Initial P.D. : 1.4 kg/LFe 0.19 % Fe 0.75 g/L Oxidant: O2
Leaching Ni Ni Ni Co Co Co Fe Fe Fe H2SO4Time (g/l) (g) Leach (g/l) (g) leach (g/l) (g) % (g/l)
( min ) % %
-25 21.90 25.56 0 0.17 0.20 0 0.75 0.88 0 99.400 52.40 61.15 26 0.35 0.41 48 0.95 1.11 31 65.4015 59.10 68.80 32 0.49 0.57 85 1.20 1.40 69 51.8030 62.80 72.94 35 0.51 0.59 90 1.36 1.57 92 47.4060 76.20 87.57 46 0.52 0.60 92 1.39 1.60 96 41.4090 76.80 88.21 46 0.52 0.60 93 1.39 1.61 97 37.30
120 85.50 97.27 53 0.53 0.61 94 1.40 1.61 98 29.20150 88.30 100.12 55 0.55 0.63 99 1.41 1.63 99 31.20
180 91.60 103.39 57 0.55 0.63 100 1.43 1.64 102 28.90
* First 25 minutes was solution pre-heating time
Figure B4.4: Metal extraction as a function of leaching time for matte pre-leached for aresidence time of 3 hours.
0
10
20
30
40
50
60
70
80
90
100
110
-25 0 15 30 60 90 120 150 180
Leaching Time, min
Met
al e
xtra
ctio
n, %
0
10
20
30
40
50
60
70
80
90
100
110
H2S
O4,
g/L
CoFeNiH2SO4

TABLE B4.3: METAL CONCENTRATIONS DURING PRESSURE LEACHING OF MATTE PRE-LEACHED FOR 9 HOURS
Leaching conditions: Temperature ( oC ): 145Total pressure (kPa ): 500Initial P.D. ( kg/L ): 1.4Leaching time (hrs ): 3Mixing rate ( rpm ): 900Oxidant : O2
Leaching Co Fe Ni Cu H2SO4 pHTime (g/l) (g/l) (g/l) (g/l) (g/l)
( min )*
-25 0.17 0.75 21.90 26.20 99.40 0.410 0.32 0.98 47.40 7.72 72.80 0.5215 0.44 1.30 70.20 0.00 53.30 0.5630 0.46 1.36 76.30 0.01 42.60 0.6760 0.49 1.39 82.80 0.10 26.10 1.0590 0.50 1.41 84.30 0.01 24.60 1.18
120 0.53 1.41 89.90 0.05 18.60 1.28150 0.55 1.41 98.60 0.06 15.60 1.34180 0.55 1.41 101.10 0.02 14.80 1.41
* First 25 minutes were solution pre-heating time
Figure B4.3: Metal concentration as a function of leaching time for matte pre-leachedfor 9 hours
0
10
20
30
40
50
60
70
80
90
100
110
-25 0 15 30 60 90 120 150 180
Leaching Time, min
Ni,
Cu,
g/l
0
1
2
3
4
5
6
7
8
Fe, C
o g/
lpH
Ni
Cu
Co
Fe
pH
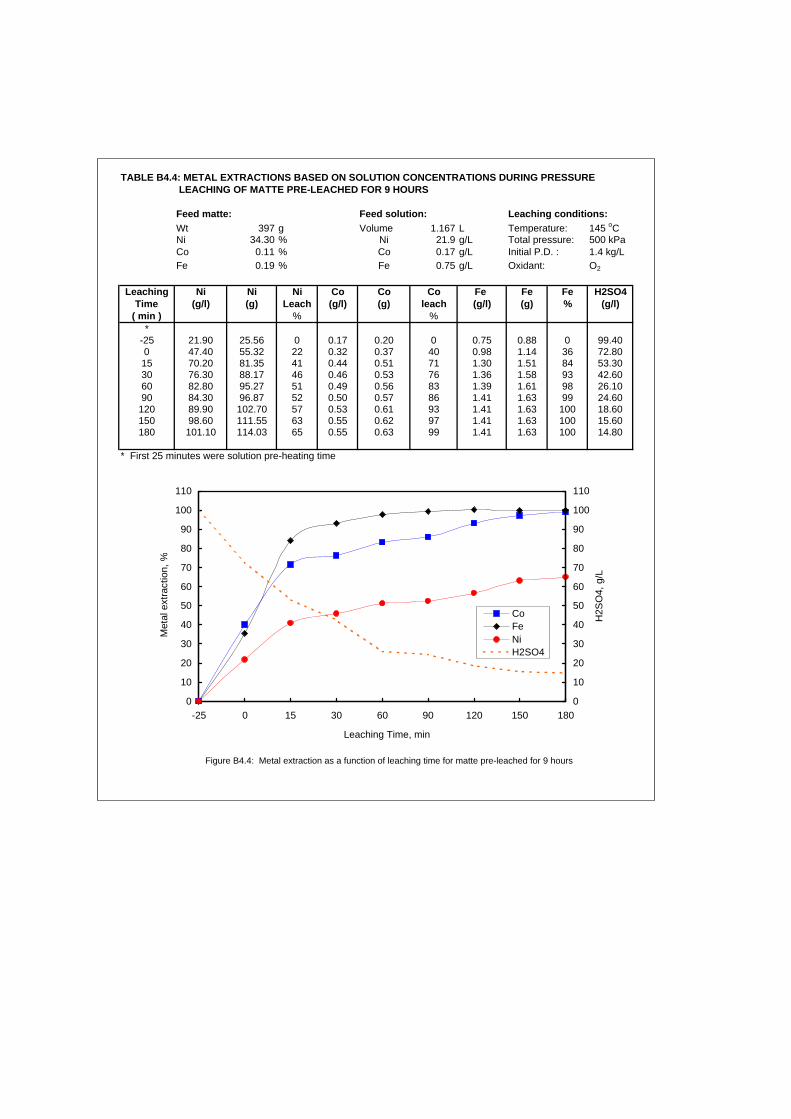
TABLE B4.4: METAL EXTRACTIONS BASED ON SOLUTION CONCENTRATIONS DURING PRESSURE LEACHING OF MATTE PRE-LEACHED FOR 9 HOURS
Feed matte: Feed solution: Leaching conditions:Wt 397 g Volume 1.167 L Temperature: 145 oCNi 34.30 % Ni 21.9 g/L Total pressure: 500 kPaCo 0.11 % Co 0.17 g/L Initial P.D. : 1.4 kg/LFe 0.19 % Fe 0.75 g/L Oxidant: O2
Leaching Ni Ni Ni Co Co Co Fe Fe Fe H2SO4Time (g/l) (g) Leach (g/l) (g) leach (g/l) (g) % (g/l)
( min ) % %*
-25 21.90 25.56 0 0.17 0.20 0 0.75 0.88 0 99.400 47.40 55.32 22 0.32 0.37 40 0.98 1.14 36 72.8015 70.20 81.35 41 0.44 0.51 71 1.30 1.51 84 53.3030 76.30 88.17 46 0.46 0.53 76 1.36 1.58 93 42.6060 82.80 95.27 51 0.49 0.56 83 1.39 1.61 98 26.1090 84.30 96.87 52 0.50 0.57 86 1.41 1.63 99 24.60
120 89.90 102.70 57 0.53 0.61 93 1.41 1.63 100 18.60150 98.60 111.55 63 0.55 0.62 97 1.41 1.63 100 15.60180 101.10 114.03 65 0.55 0.63 99 1.41 1.63 100 14.80
* First 25 minutes were solution pre-heating time
Figure B4.4: Metal extraction as a function of leaching time for matte pre-leached for 9 hours
0
10
20
30
40
50
60
70
80
90
100
110
-25 0 15 30 60 90 120 150 180
Leaching Time, min
Met
al e
xtra
ctio
n, %
0
10
20
30
40
50
60
70
80
90
100
110
H2S
O4,
g/L
CoFeNiH2SO4

TABLE B4.5: METAL CONCENTRATIONS DURING PRESSURE LEACHING OF MATTE PRE-LEACHED FOR 1 HOURS
Leaching conditions: Temperature ( oC ): 145Total pressure (kPa ): 500Initial P.D. ( kg/L ): 1.4Leaching time (hrs ): 3Mixing rate ( rpm ): 900Oxidant : O2
Leaching Co Fe Ni Cu H2SO4 pHTime (g/l) (g/l) (g/l) (g/l) (g/l)
( min )*
-25 0.17 0.75 21.90 26.20 99.40 0.410 0.40 1.03 47.20 9.14 62.40 0.4315 0.45 1.10 54.90 0.01 56.30 0.4430 0.51 1.12 56.40 0.01 53.60 0.4760 0.51 1.13 60.40 0.02 46.20 0.5290 0.52 1.14 64.80 0.01 45.70 0.54
120 0.53 1.15 66.60 0.02 42.60 0.55150 0.55 1.20 68.60 0.14 41.30 0.58180 0.55 1.22 70.90 0.00 32.70 0.59
* First 25 minutes were solution pre-heating time
Figure B4.5: Metal concentration as a function of leaching time for matte pre-leached for 1 hour
0
10
20
30
40
50
60
70
80
90
100
110
-25 0 15 30 60 90 120 150 180
Leaching Time, min
Ni,
Cu,
g/l
0
1
2
3
4
5
6
7
8
Fe, C
o g/
lpH
Ni
Cu
Co
Fe
pH

TABLE B4.6: METAL EXTRACTIONS BASED ON SOLUTION CONCENTRATIONS DURING PRESSURE LEACHING OF MATTE PRE-LEACHED FOR 1 HOURS
Feed matte: Feed solution: Leaching conditions:Wt 397 g Volume 1.167 L Temperature: 145 oCNi 34.30 % Ni 21.9 g/L Total pressure: 500 kPaCo 0.11 % Co 0.17 g/L Initial P.D. : 1.4 kg/LFe 0.13 % Fe 0.75 g/L Oxidant: O2
Leaching Ni Ni Ni Co Co Co Fe Fe Fe H2SO4Time (g/l) (g) Leach (g/l) (g) leach (g/l) (g) % (g/l)
( min ) % %*
-25 21.90 25.56 0 0.17 0.20 0 0.75 0.88 0 99.400 47.20 55.08 22 0.40 0.47 61 1.03 1.20 63 62.4015 54.90 63.88 28 0.45 0.52 75 1.10 1.28 78 56.3030 56.40 65.55 29 0.51 0.59 90 1.12 1.31 83 53.6060 60.40 69.92 33 0.51 0.59 90 1.13 1.32 86 46.2090 64.80 74.61 36 0.52 0.60 92 1.14 1.32 87 45.70
120 66.60 76.49 37 0.53 0.61 95 1.15 1.34 90 42.60150 68.60 78.52 39 0.55 0.63 99 1.20 1.39 99 41.30180 70.90 80.81 41 0.55 0.63 100 1.22 1.40 102 32.70
* First 25 minutes were solution pre-heating time
Fig.ure B4.6: Metal extraction as a function of leaching time for the matte pre-leached for 1 hour
0
10
20
30
40
50
60
70
80
90
100
110
-25 0 15 30 60 90 120 150 180Leaching Time, min
Met
al e
xtra
ctio
n, %
0
10
20
30
40
50
60
70
80
90
100
110
H2S
O4,
g/L
CoFeNiH2SO4


APPENDIX D
DETERMINATION OF MINERAL COMPOSITION OF THE
MATTE AND PREPARATION OF THE LEACHING SOLUTION

APPENDIX D1
DETERMINATION OF APPROXIMATE MINERAL
COMPOSITION OF THE MATTE
The matte consisted of 47% Ni, 30% Cu and 21% S with small amounts of Co and Fe.
The balance ( 2 % ) constituted cobalt, iron, PGMs and other chemical elements in the
matte. The major mineral phases in the matte were Ni3S2, Cu2S, Cu1.9S and a nickel-rich
alloy. The quantities of these mineral phases were not known; hence it was necessary to
determine the approximate mineral composition of the matte. In the calculations it was
assumed that all of the copper in the matte was present as Cu2S; and that the quantities of
cobalt and iron minerals / alloys were insignificant, and hence were not considered in the
calculations. The ratio of copper to nickel in the Ni alloy is assumed to be 1: 2, as
reported by Dynatec Corporation (2003)*.
The calculations involved are illustrated below; please note that the calculations are based
on 100 g of matte sample:
Total moles of nickel in matte
Amount of Ni in the matte = 47%, for 100g of matte there is 47g of Ni Moles of Ni in the matte = 47/58.69 = 0.801, where 58.69 is the molecular weight of Ni
Let moles of Ni3S2 = X (D1.1)
therefore, moles of Ni in Ni3S2 = 3X (D1.2)
let moles of Ni in the alloy = Z (D1.3)
therefore, mass of Ni in the alloy = 58.69Z (D1.4)
Total moles of Ni in the matte = 3X + Z = 0.801 (D1.5)

Total moles of copper in matte
Amount of copper in the matte = 30%, for 100g of matte there is 30g of Cu Moles of Cu in the matte = 30/63.55 = 0.472, where 63.55 is the molecular weight of Cu
Let moles of Cu2S = Y (D1.6)
therefore, moles of Cu in Cu2S = 2Y (D1.7)
moles of Cu in the alloy = (58.69Z/2) / 63.55 = 0.4618Z (D1.8)
where 58.69Z is mass of Ni in the alloy (equation D1.4 ), and ratio of mass of Ni to Cu
in the alloy is 2:1
Total moles of Cu in the matte = 2Y + 0.4618Z = 0.472 (D1.9)
Total moles of sulphur in matte
Amount of sulphur in the matte = 21%, for 100g of matte there is 21g of S
Moles of S in the matte = 21/32.06 = 0.655, where 32.o6 is the molecular weight of S
From equation (D1.1), moles of S in Ni3S2 = 2X (D1.10)
From equation (D1.6), moles of S in Cu2S = Y (D1.11)
Total moles of S in the matte = 2X + Y = 0.655 (D1.12)
Equations (D1.5), (D1.9) and (D1.12) can now be solved for X, Y and Z:
Solving for Z in equation (D1.5) gives:
Z = 0.801 – 3X (D1.13)
Substituting equation (D1.13) into (D1.9) gives:
2Y – 1.3854X = 0.1021 (D1.14)
solving equations (D1.12) and (D1.14) simultaneously by multiplying (D1.12) by 2 and
subtracting (D1.14) from (D1.12) gives:
X = 0.2243 (D1.15)
Substituting value of X into equation (D1.12):
2(0.2243) + Y = 0.655

Y = 0.2064 (D1.16)
Substituting values of X and Z into equation (D1.5) gives:
3(0.2243) + Z = 0.801
Z = 0.1281 (D1.17)
Compostion of the matte
Heazlewoodite (Ni3S2)
Moles of Ni3S2 in the matte = X = 0.2243
mass of Ni3S2 in the matte = 0.2243 x 240.19 = 53.87 g, where 240.19 is molecular wt of
Ni3S2.
Therefore Percent composition in matte = 53.87 % Ni3S2
Ni in Ni3S2
From equation (D1.2), moles of Ni in Ni3S2 = 3X = 3 x 0.2243 = 0.6729
mass of Ni in Ni3S2 = 0.6729 x 58.69 = 39.49 g = 39.49 %
S in Ni3S2
From equation (D1.10), moles of S in Ni3S2 = 2X = 2 x 0.2243 = 0.4486
mass of Ni in Ni3S2 = 0.4486 x 32.06 = 14.38 g = 14.38 %
Chalcocite ( Cu2S ) - other copper sulphides assumed to be in the form of Cu2S
Moles of Cu2S in the matte = Y = 0.2064
mass of Cu2S in the matte = 0.2064 x 159.2 = 32.86 g, where 159.2 is molecular wt of
Cu2S.
Therefore Percent composition in matte = 32.86 % Cu2S
Cu in Cu2S

From equation (D1.7), moles of Cu in Cu2S = 2Y = 2 x 0.2064 = 0.4128
mass of Cu in Cu2S = 0.4128 x 63.55 = 26.23 g = 26.23 %
S in Cu2S
From equation (D1.11), moles of S in Cu2S = Y = 0.2064
mass of S in Cu2S = 0.2064 x 32.06 = 6.62 g = 6.62 %
Alloy – any Fe and Co in the alloy assumed to be negligible
Ni in alloy
Moles of Ni in the alloy = Z = 0.1281
mass of Ni in the alloy = 0.1281 x 58.69 = 7.52 g
Percent composition of Ni in the alloy is = 7.52 % Ni
Cu in alloy
Moles of Cu in the alloy = (58.69Z/2) / 63.55 = 0.4618Z = 0.0592; (from equation
(D1.8))
mass of Cu in the alloy = 0.0592 x 63.55 = 3.76 g
Percent composition of Cu in the alloy = 3.76 % Cu
Therefore Percent composition of Ni-Cu alloy in the matte = 11.28 % alloy

Table D1: Summary of mineral composition of the matte
Mineral composition ( % )
Mineral phase Ni Cu S Total
Ni2S2 39.49 - 14.38 53.87
Cu2S - 26.24 6.62 32.86
Ni alloy 7.52 3.76 - 11.28
Total 47.0 30.0 21.0 98.0
N.B. Other minerals in the matte account for 2%
APPENDIX D2
DETERMINATION OF QUANTITY OF MATTE, SPENT
ELECTROLYTE SOLUTION AND DEMINERALIZED WATER TO
BE MIXED FOR THE VARIATION IN THE PULP DENSITY
REACTION MIXTURE
D2.1 ATMOSPHERIC LEACHING EXPERIMENTS
To simulate the pre-leach conditions it was necessary to determine the quantities of
matte, spent electrolyte solution and demineralised water to be mixed for the variation in
the pulp density of the reaction mixture. On the commercial plant the pulp density in the
atmospheric (pre-leach) stage is controlled by the addition of copper spent electrolyte to

the matte pulp. The matte pulp is a mixture of matte and water coming from the ball
milling section. The pre-leach experiments were performed at a pulp density of 1.7 kg/L,
so to determine how much matte, spent electrolyte and demineralised water were needed
to achieve this pulp density the following calculations were performed:
The variables considered were:
Volume of spent electrolyte, Vse (mL)
Volume of demineralised water, Vdw (mL)
Volume of matte, Vm (mL)
Volume of pulp from the milling section, Vms (mL)
Volume of pulp in the pre-leach stage, VpL (mL)
Density of spent electrolyte, Dse (g/mL)
Density of demineralised water, Ddw (g/mL)
Density of matte, Dm (g/mL)
Density of pulp from the milling section, Dms (g/mL)
Density of pulp in the pre-leach stage, DpL (g/mL)
Values of the densities were known, and were as follows:
Dse = 1.17, Ddw = 1, Dm = 5.8, Dms = 2.4, DpL = 1.7
From the relationship of density, volume and mass (density = mass/volume) the
following equations were derived, which were then solved for volumes of demineralised
water and spent electrolyte as well as mass of matte required for the atmospheric
experiments.
msedw
mmsesedwdwpL VVV
VDVDVDD ++++
= (D2.1)
mdw
mmdwdwms VV
VDVDD +
+= (D2.2)

Where
= mass of demineralised water V = m
tage, VpL (mL) (m
ubstituting the values of densities into equation D2.1
DdwVdw
Dse se ass of spent electrolyte solution DmVm = mass of matte
e pre-leach sVdw +Vse +Vm = volume of pulp in thVdw +Vm = volume of pulp from the milling section, Vms L)
S
msedw
msedw VVV ++=
8.517.11 (D2.3)
VVV ++7.1
Simplifying and rearranging equation D2.3 gives:
( )msedwmsedw VVVVVV ++=++ 7.18.517.1
sedwm VVV 53.07.01.4 =− (D2.4)
ubstituting the values of densities into equation D2.2 S
mdw
mdw VV +=
8.514.2 (D2.5)
VV +
Simplifying and rearranging equation D2.5 gives:
4118.0= (D2.6)
Substit .6 into equation D2.4
( )mdwmdw VVVV +=+ 4.28.5
dwm VV 4.14.3 =
V dwm V
uting equation D2
( ) sedwdw VVV 53.07.04118.01.4 =− (D2.7)

Simplifying equation D2.7 gives:
(D2.8)
The volumes of spent electrolyte and demineralised water were thus calculated using the
relationship given in equation D2.8. Volume of the matte was calculated from equation
D2.2 PRESSURE LEACHING EXPERIMENTS
o simulate the pressure leaching conditions the quantities of matte, spent electrolyte
solution and demineralised water to be mixed were again calculated, using the same
n D2.3 becomes:
dwse VV 864.1=
D2.6. Then the mass was found by using the relationship:
mass = Dm x Vm
T
approach as illustrated in D2.1 above. It was assumed that changes in the density of the
matte from the pre-leach stage were insignificant. On the commercial plant the pulp
density in the pressure leaching stage is controlled by the addition of copper spent
electrolyte to the matte pulp from the pre-leach stage. The pressure leaching experiments
were performed at a pulp density of 1.4 kg/L, so to determine how much matte, spent
electrolyte and demineralised water were needed to achieve this pulp density the
following calculations were performed:
For pressure leaching conditions, equatio
msedw
msedw VVV ++=
8.517.114.1 VVV ++
(D2.9)

Simplifying and rearranging equation D2.9 gives
( )msedwmsedw VVVVVV ++=++ 4.18.517.1
sedwm VVV 23.04.04.4 =− (D2.10)
Equation D2.6 is true for both th
ubstituting equation D2.6 into equation D2.10:
e atmospheric leach and pressure leach.
S
( ) sedwdw VVV 23.04.04118.04.4 =− (D2.11)
(D2.12)
Like
were calculated using the relationship given in equation D2.12. Volume of the matte was
Dynatec Corporation, 2003. Impala Platinum Ltd, Base Metals Refinery diagnosis of plant samples. Confidential report, Dynatec Corporation, Fort Saskatchewan, Alberta, Canada, unpublished.
Simplifying equation D2.11 gives
dwse VV 14.6=
explained in D2.1 above, the volumes of spent electrolyte and demineralised water
calculated from equation D2.6. Then the mass was found by using the relationship:
mass = Dm x Vm
*

INCREASE IN Ni CONCENTRATION DUE TO LEACHING BY CEMENTATION AND ACID AT 60 oC
RUNGE-KUTTA FOURTH-ORDER METHOD
Overall rate equation: dNi2+/dt = 8/3K8.10Cu2+ + K8.13CH+Temp. = 60 oC
dNi2+/dt = 8/3K8.10Cu2+ Initial Ni = 24.61 g/L 0.419 moles dNi2+/dt = K8.13CH+
K8.10 = 0.298 Initial Cu = 24.95 g/L 0.393 moles K8.10 = -0.795 Initial H2SO4 = 90 g/L 0.918 moles K8.13 = -0.679
EXPERIMENTAL VALUES MODEL VALUESTime [Ni2+ ] [Ni2+ ] [Ni2+ ] Copper contribution Acid contribution(min) (g/L) (g/L) (mol) (mol) K1 K2 K3 K4 (moles) K1 K2 K3 K4
0 24.61 24.61 0.419 0.393 0.91830 66.16 47.68 0.812 0.264 -0.16 -0.13 -0.13 -0.10 0.65 -0.31 -0.26 -0.27 -0.2260 68.85 63.80 1.087 0.177 -0.10 -0.08 -0.09 -0.07 0.47 -0.22 -0.18 -0.19 -0.1690 71.18 75.08 1.279 0.119 -0.07 -0.06 -0.06 -0.05 0.33 -0.16 -0.13 -0.14 -0.11
120 78.69 80.69 1.375 0.119 -0.05 -0.04 -0.04 -0.03 0.24 -0.11 -0.09 -0.10 -0.08150 80.00 86.97 1.482 0.080 -0.05 -0.04 -0.04 -0.03 0.17 -0.08 -0.07 -0.07 -0.06180 86.80 91.36 1.557 0.054 -0.03 -0.03 -0.03 -0.02 0.12 -0.06 -0.05 -0.05 -0.04210 94.42 1.609 0.036 -0.02 -0.02 -0.02 -0.01 0.09 -0.04 -0.03 -0.03 -0.03240 88.33 96.56 1.645 0.024 -0.01 -0.01 -0.01 -0.01 0.06 -0.03 -0.02 -0.02 -0.02270 98.05 1.671 0.016 -0.01 -0.01 -0.01 -0.01 0.04 -0.02 -0.02 -0.02 -0.01300 94.44 99.10 1.688 0.011 -0.01 -0.01 -0.01 0.00 0.03 -0.01 -0.01 -0.01 -0.01
INCREASE IN Fe CONCENTRATION DUE TO LEACHING BY ACID AT 60 oC
RUNGE-KUTTA FOURTH-ORDER METHOD
Overall rate equation: dFe(total)/dt = K8.15CH+ - K8.16CFe3+
Temp. = 60 oCInitial H2SO4 = 90 g/L 0.918367 molesInitial Fe = 0.67 g/L 0.012055 molesH2SO4 after 180 min = 20 g/L 0.204 moles
dFe2+/dt = K8.15CH+ Total Fe after 180 min = 4.39 g/L 0.079 moles dFe3+/dt = -K8.15CH+
K8.15 = 0.0881 K8.16 = -0.082
EXPERIMENTAL VALUES MODEL VALUESTime Fe Fe Fe Fe2+ contribution Fe3+ contribution(min) (g/L) (g/L) (mol) (mol) K1 K2 K3 K4 (mol) K1 K2 K3 K4
0 0.67 0.67 0.012 0.01230 3.44 3.01 0.05 0.05 0.040 0.041 0.041 0.04260 3.45 3.15 0.06 0.06 0.002 0.002 0.002 0.00290 3.8 3.29 0.06 0.06 0.002 0.003 0.003 0.003
120 3.91 3.44 0.06 0.06 0.003 0.003 0.003 0.003150 3.76 3.60 0.06 0.06 0.003 0.003 0.003 0.003180 4.05 3.76 0.07 0.07 0.003 0.003 0.003 0.003210 3.93 0.07 0.07 0.003 0.003 0.003 0.003240 3.86 4.11 0.07 0.07 0.003 0.003 0.003 0.003 0.07270 3.94 0.07 0.08 0.003 0.003 0.003 0.003 0.07 -0.0031 -0.0030 -0.0030 -0.0030300 4.34 4.13 0.07 0.08 0.003 0.003 0.003 0.004 0.07 -0.0030 -0.0029 -0.0029 -0.0028

INCREASE IN Co CONCENTRATION DUE TO LEACHING BY ACID AT 60 oC
RUNGE-KUTTA FOURTH-ORDER METHOD
dCo2+/dt = K8.16CH+ Temp. = 60 oCInitial H2SO4 = 90 g/L 0.918 moles
K8.17 = 0.0320 Initial Co = 0.18 g/L 0.003 moles
EXPERIMENTAL VALUES MODEL VALUESTime Co Co Co(min) (g/L) (g/L) (mol) K1 K2 K3 K4
0 0.18 0.18 0.00330 0.79 1.05 0.02 0.0147 0.0148 0.0148 0.014960 0.8 1.07 0.02 0.0003 0.0003 0.0003 0.000390 0.79 1.09 0.02 0.0003 0.0003 0.0003 0.0003120 0.91 1.10 0.02 0.0003 0.0003 0.0003 0.0003150 0.88 1.12 0.02 0.0003 0.0003 0.0003 0.0003180 0.96 1.14 0.02 0.0003 0.0003 0.0003 0.0003210 1.16 0.02 0.0003 0.0003 0.0003 0.0003240 0.91 1.18 0.02 0.0003 0.0003 0.0003 0.0003270 1.20 0.02 0.0003 0.0003 0.0003 0.0003300 1.01 1.22 0.02 0.0003 0.0003 0.0003 0.0003
DECREASE IN Cu CONCENTRATION DUE TO LEACHING BY ACID AT 60 oC
RUNGE-KUTTA FOURTH-ORDER METHOD
dCu2+/dt = -8/3K8.10Cu2+ Temp. = 60 oCK8.10 = 0.298 Initial Cu = 24.95 g/L 0.393 moles
-8/3K8.10 = -0.795 Initial H2SO4 = 90 g/L 0.918 moles
EXPERIMENTAL VALUES MODEL VALUESTime Cu Cu Cu(min) (g/L) (g/L) (mol) K1 K2 K3 K4
0 24.95 24.95 0.39330 19.49 16.77 0.26 -0.1560 -0.1250 -0.1312 -0.103960 14.47 11.27 0.18 -0.1049 -0.0840 -0.0882 -0.069890 10.45 7.58 0.12 -0.0705 -0.0565 -0.0593 -0.0469120 8.75 5.09 0.08 -0.0474 -0.0380 -0.0398 -0.0316150 6.39 3.42 0.05 -0.0318 -0.0255 -0.0268 -0.0212180 4.79 2.30 0.04 -0.0214 -0.0172 -0.0180 -0.0143210 1.55 0.02 -0.0144 -0.0115 -0.0121 -0.0096240 1.30 1.04 0.02 -0.0097 -0.0078 -0.0081 -0.0064270 0.70 0.01 -0.0065 -0.0052 -0.0055 -0.0043300 0.00 0.47 0.01 -0.0044 -0.0035 -0.0037 -0.0029

DECREASE IN ACID CONCENTRATION DUE TO LEACHING BY CEMENTATION AND ACID AT 60 oC (Eqns 8B1,8B2,8B3 &8B4)
RUNGE-KUTTA FOURTH-ORDER METHOD
Overall rate equation: dH+/dt = -2K8.13CH+ -2K8.14CH+ -2K8.16 + 3K8.15CFe3+Temp. = 60 oCInitial Ni = 24.61 g/L 0.419 moles dH+/dt = -2K8.13CH+ dH+/dt = -2K8.14CH+ dH+/dt = 2K8.16CH+ dH+/dt = 3K8.15CFe3+
Initial Cu = 24.95 g/L 0.393 moles K8.13 = 0.679 K8.15 = 0.0881 K8.17 = 0.032 K8.16 = 0.0820Initial H2SO4 = 90 g/L 0.918 moles 2K8.13 = -1.358 2K8.15 = -0.1762 2K8.17 = -0.064 3K8.16 = 0.246
EXPERIMENTAL VALUES MODEL VALUES MODEL VALUESTime [H2SO4 ] [H2SO4] [H2SO4] Acid contribution from equation 8.13 Acid contribution from equation 8.14 Acid contribution from equation 8.16 Acid contribution from equation 8.15(min) (g/L) (g/L) (mol) (mol) K1 K2 K3 K4 (moles) K1 K2 K3 K4 (mol) K1 K2 K3 K4 (moles) K1 K2 K3 K4
0 90.00 90.00 0.918 0.918 0.918 0.91830 62.87 54.69 0.558 0.467 -0.62 -0.41 -0.48 -0.30 0.84 -0.08 -0.08 -0.08 -0.07 0.889 -0.03 -0.03 -0.03 -0.0360 36.04 32.19 0.328 0.237 -0.32 -0.21 -0.25 -0.15 0.77 -0.07 -0.07 -0.07 -0.07 0.861 -0.03 -0.03 -0.03 -0.0390 19.23 20.45 0.209 0.121 -0.16 -0.11 -0.12 -0.08 0.71 -0.07 -0.06 -0.06 -0.06 0.834 -0.03 -0.03 -0.03 -0.03
120 10.68 14.21 0.145 0.061 -0.08 -0.05 -0.06 -0.04 0.65 -0.06 -0.06 -0.06 -0.06 0.808 -0.03 -0.03 -0.03 -0.03150 7.96 10.78 0.110 0.031 -0.04 -0.03 -0.03 -0.02 0.59 -0.06 -0.05 -0.05 -0.05 0.783 -0.03 -0.03 -0.03 -0.03180 8.03 8.80 0.090 0.016 -0.02 -0.01 -0.02 -0.01 0.54 -0.05 -0.05 -0.05 -0.05 0.758 -0.03 -0.02 -0.02 -0.02210 7.43 7.58 0.077 0.008 -0.01 -0.01 -0.01 -0.01 0.50 -0.05 -0.05 -0.05 -0.04 0.734 -0.02 -0.02 -0.02 -0.02240 8.29 6.75 0.069 0.004 -0.01 0.00 0.00 0.00 0.45 -0.04 -0.04 -0.04 -0.04 0.711 -0.02 -0.02 -0.02 -0.02 0.00270 8.97 6.14 0.063 0.002 0.00 0.00 0.00 0.00 0.42 -0.04 -0.04 -0.04 -0.04 0.689 -0.02 -0.02 -0.02 -0.02 0.00 0.11 0.12 0.12 0.13300 7.05 5.66 0.058 0.001 0.00 0.00 0.00 0.00 0.38 -0.04 -0.04 -0.04 -0.03 0.667 -0.02 -0.02 -0.02 -0.02 0.00 0.00 0.00 0.00 0.00

KINETIC MODEL OF METAL CONCENTRATIONS DURING ATMOSPHERIC LEACHING OF THE MATTE AT A TEMPERATURE OF 60 oC
ConditionsTemp. = 60 oCInitial copper = 25 g/LInitial nickel = 25 g/LInitial H2SO4 = 90 g/LStirring rate = 205 rpmPD = 1.7 kg/L
0
1020
3040
5060
7080
90100
110
0 30 60 90 120 150 180 210 240 270 300 330
Time, min
Ni,
H2S
O4 c
once
ntra
tion,
g/L
0
5
10
15
20
25
30
Cu,
Fe,
Co
conc
entra
tion,
g/L
Ni ExperimentalNi ModelH2SO4 ModelH2SO4 ExperimentalCu ExperimentalCu ModelFe ModelFe ExperimentalCo ModelCo Experimental


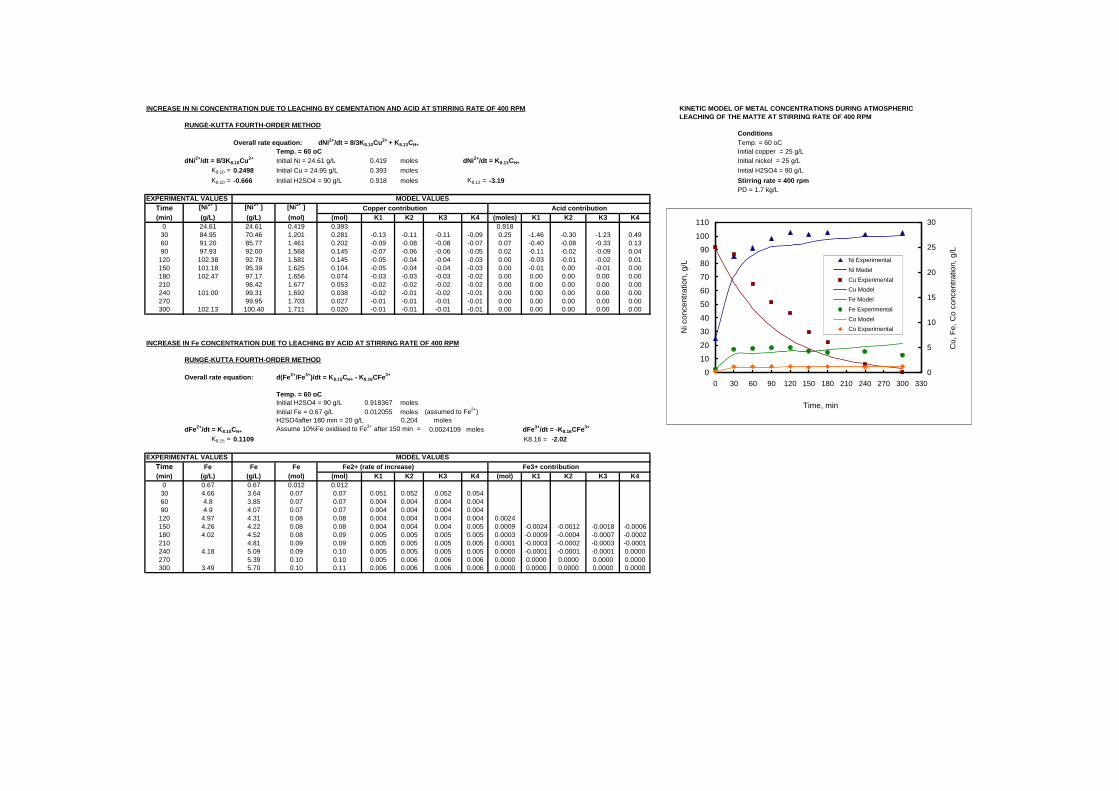
INCREASE IN Ni CONCENTRATION DUE TO LEACHING BY CEMENTATION AND ACID AT STIRRING RATE OF 400 RPM KINETIC MODEL OF METAL CONCENTRATIONS DURING ATMOSPHERIC LEACHING OF THE MATTE AT STIRRING RATE OF 400 RPM
RUNGE-KUTTA FOURTH-ORDER METHODConditions
Overall rate equation: dNi2+/dt = 8/3K8.10Cu2+ + K8.13CH+ Temp. = 60 oCTemp. = 60 oC Initial copper = 25 g/L
dNi2+/dt = 8/3K8.10Cu2+ Initial Ni = 24.61 g/L 0.419 moles dNi2+/dt = K8.13CH+ Initial nickel = 25 g/L K8.10 = 0.2498 Initial Cu = 24.95 g/L 0.393 moles Initial H2SO4 = 90 g/L K8.10 = -0.666 Initial H2SO4 = 90 g/L 0.918 moles K8.13 = -3.19 Stirring rate = 400 rpm
PD = 1.7 kg/LEXPERIMENTAL VALUES MODEL VALUES
Time [Ni2+ ] [Ni2+ ] [Ni2+ ] Copper contribution Acid contribution(min) (g/L) (g/L) (mol) (mol) K1 K2 K3 K4 (moles) K1 K2 K3 K4
0 24.61 24.61 0.419 0.393 0.91830 84.95 70.46 1.201 0.281 -0.13 -0.11 -0.11 -0.09 0.25 -1.46 -0.30 -1.23 0.4960 91.20 85.77 1.461 0.202 -0.09 -0.08 -0.08 -0.07 0.07 -0.40 -0.08 -0.33 0.1390 97.93 92.00 1.568 0.145 -0.07 -0.06 -0.06 -0.05 0.02 -0.11 -0.02 -0.09 0.04
120 102.38 92.78 1.581 0.145 -0.05 -0.04 -0.04 -0.03 0.00 -0.03 -0.01 -0.02 0.01150 101.18 95.39 1.625 0.104 -0.05 -0.04 -0.04 -0.03 0.00 -0.01 0.00 -0.01 0.00180 102.47 97.17 1.656 0.074 -0.03 -0.03 -0.03 -0.02 0.00 0.00 0.00 0.00 0.00210 98.42 1.677 0.053 -0.02 -0.02 -0.02 -0.02 0.00 0.00 0.00 0.00 0.00240 101.00 99.31 1.692 0.038 -0.02 -0.01 -0.02 -0.01 0.00 0.00 0.00 0.00 0.00270 99.95 1.703 0.027 -0.01 -0.01 -0.01 -0.01 0.00 0.00 0.00 0.00 0.00300 102.13 100.40 1.711 0.020 -0.01 -0.01 -0.01 -0.01 0.00 0.00 0.00 0.00 0.00
INCREASE IN Fe CONCENTRATION DUE TO LEACHING BY ACID AT STIRRING RATE OF 400 RPM
RUNGE-KUTTA FOURTH-ORDER METHOD
Overall rate equation: d(Fe2+/Fe3+)/dt = K8.15CH+ - K8.16CFe3+
Temp. = 60 oCInitial H2SO4 = 90 g/L 0.918367 molesInitial Fe = 0.67 g/L 0.012055 moles (assumed to Fe2+)H2SO4after 180 min = 20 g/L 0.204 moles
dFe2+/dt = K8.15CH+ Assume 10%Fe oxidised to Fe3+ after 150 min = 4 0.0024109 moles dFe3+/dt = -K8.16CFe3+
K8.15 = 0.1109 K8.16 = -2.02
EXPERIMENTAL VALUES MODEL VALUESTime Fe Fe Fe Fe2+ (rate of increase) Fe3+ contribution(min) (g/L) (g/L) (mol) (mol) K1 K2 K3 K4 (mol) K1 K2 K3 K4
0 0.67 0.67 0.012 0.01230 4.66 3.64 0.07 0.07 0.051 0.052 0.052 0.05460 4.8 3.85 0.07 0.07 0.004 0.004 0.004 0.00490 4.9 4.07 0.07 0.07 0.004 0.004 0.004 0.004
120 4.97 4.31 0.08 0.08 0.004 0.004 0.004 0.004 0.0024150 4.26 4.22 0.08 0.08 0.004 0.004 0.004 0.005 0.0009 -0.0024 -0.0012 -0.0018 -0.0006180 4.02 4.52 0.08 0.09 0.005 0.005 0.005 0.005 0.0003 -0.0009 -0.0004 -0.0007 -0.0002210 4.81 0.09 0.09 0.005 0.005 0.005 0.005 0.0001 -0.0003 -0.0002 -0.0003 -0.0001240 4.18 5.09 0.09 0.10 0.005 0.005 0.005 0.005 0.0000 -0.0001 -0.0001 -0.0001 0.0000270 5.39 0.10 0.10 0.005 0.006 0.006 0.006 0.0000 0.0000 0.0000 0.0000 0.0000300 3.49 5.70 0.10 0.11 0.006 0.006 0.006 0.006 0.0000 0.0000 0.0000 0.0000 0.0000
0
10
20
30
40
50
60
70
80
90
100
110
0 30 60 90 120 150 180 210 240 270 300 330
Time, min
Ni c
once
ntra
tion,
g/L
0
5
10
15
20
25
30
Cu,
Fe,
Co
conc
entra
tion,
g/L
Ni ExperimentalNi ModelCu ExperimentalCu ModelFe ModelFe ExperimentalCo ModelCo Experimental
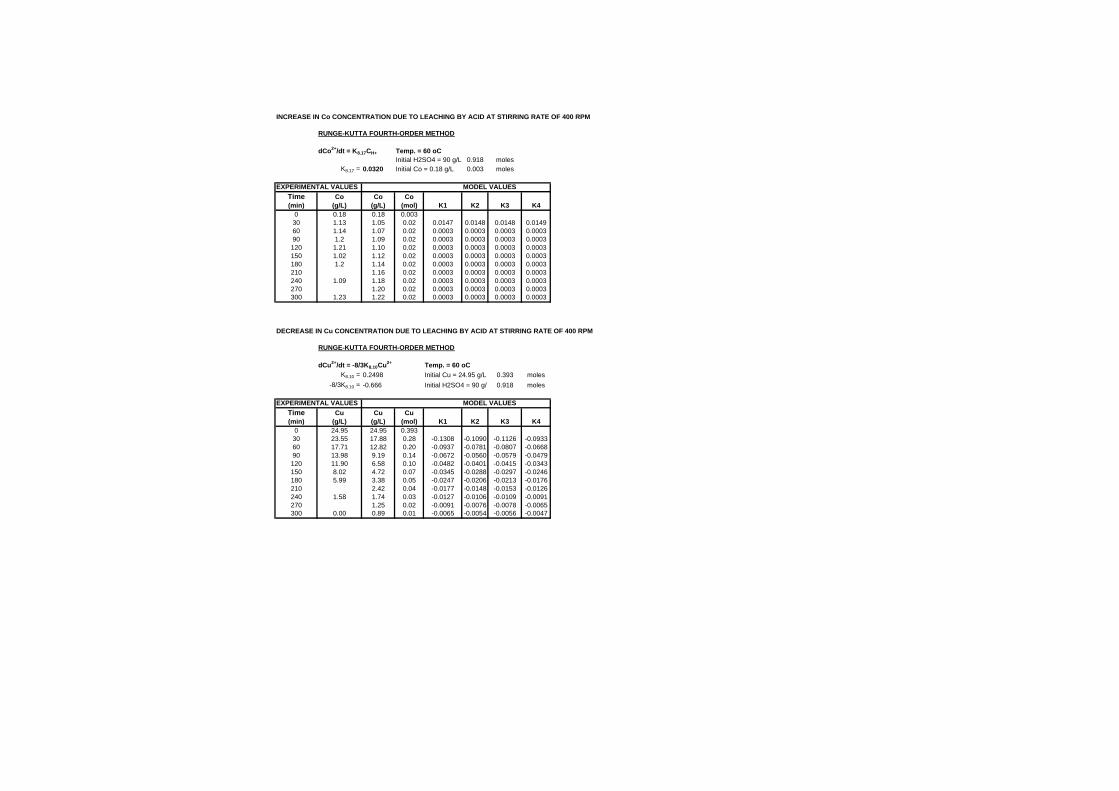
INCREASE IN Co CONCENTRATION DUE TO LEACHING BY ACID AT STIRRING RATE OF 400 RPM
RUNGE-KUTTA FOURTH-ORDER METHOD
dCo2+/dt = K8.17CH+ Temp. = 60 oCInitial H2SO4 = 90 g/L 0.918 moles
K8.17 = 0.0320 Initial Co = 0.18 g/L 0.003 moles
EXPERIMENTAL VALUES MODEL VALUESTime Co Co Co(min) (g/L) (g/L) (mol) K1 K2 K3 K4
0 0.18 0.18 0.00330 1.13 1.05 0.02 0.0147 0.0148 0.0148 0.014960 1.14 1.07 0.02 0.0003 0.0003 0.0003 0.000390 1.2 1.09 0.02 0.0003 0.0003 0.0003 0.0003120 1.21 1.10 0.02 0.0003 0.0003 0.0003 0.0003150 1.02 1.12 0.02 0.0003 0.0003 0.0003 0.0003180 1.2 1.14 0.02 0.0003 0.0003 0.0003 0.0003210 1.16 0.02 0.0003 0.0003 0.0003 0.0003240 1.09 1.18 0.02 0.0003 0.0003 0.0003 0.0003270 1.20 0.02 0.0003 0.0003 0.0003 0.0003300 1.23 1.22 0.02 0.0003 0.0003 0.0003 0.0003
DECREASE IN Cu CONCENTRATION DUE TO LEACHING BY ACID AT STIRRING RATE OF 400 RPM
RUNGE-KUTTA FOURTH-ORDER METHOD
dCu2+/dt = -8/3K8.10Cu2+ Temp. = 60 oCK8.10 = 0.2498 Initial Cu = 24.95 g/L 0.393 moles
-8/3K8.10 = -0.666 Initial H2SO4 = 90 g/L 0.918 moles
EXPERIMENTAL VALUES MODEL VALUESTime Cu Cu Cu(min) (g/L) (g/L) (mol) K1 K2 K3 K4
0 24.95 24.95 0.39330 23.55 17.88 0.28 -0.1308 -0.1090 -0.1126 -0.093360 17.71 12.82 0.20 -0.0937 -0.0781 -0.0807 -0.066890 13.98 9.19 0.14 -0.0672 -0.0560 -0.0579 -0.0479120 11.90 6.58 0.10 -0.0482 -0.0401 -0.0415 -0.0343150 8.02 4.72 0.07 -0.0345 -0.0288 -0.0297 -0.0246180 5.99 3.38 0.05 -0.0247 -0.0206 -0.0213 -0.0176210 2.42 0.04 -0.0177 -0.0148 -0.0153 -0.0126240 1.58 1.74 0.03 -0.0127 -0.0106 -0.0109 -0.0091270 1.25 0.02 -0.0091 -0.0076 -0.0078 -0.0065300 0.00 0.89 0.01 -0.0065 -0.0054 -0.0056 -0.0047

INCREASE IN Ni CONCENTRATION DUE TO LEACHING BY CEMENTATION AND ACID AT 48 g/L INITIAL COPPER
RUNGE-KUTTA FOURTH-ORDER METHOD
Overall rate equation: dNi2+/dt = 8/3K8.10Cu2+ + K8.13CH+Temp. = 60 oC
dNi2+/dt = 8/3K8.10Cu2+ Initial Ni = 24.61 g/L 0.419 moles dNi2+/dt = K8.13CH+
K8.10 = 0.0867 Initial Cu = 24.95 g/L 0.393 moles K8.13 = 1.545 K8.10 = -0.231 Initial H2SO4 = 90 g/L 0.918 moles K8.13 = -1.545
EXPERIMENTAL VALUES MODEL VALUESTime [Ni2+ ] [Ni2+ ] [Ni2+ ] Copper contribution Acid contribution(min) (g/L) (g/L) (mol) (mol) K1 K2 K3 K4 (moles) K1 K2 K3 K4
0 24.61 24.61 0.419 0.393 0.91830 68.25 56.02 0.955 0.350 -0.05 -0.04 -0.04 -0.04 0.43 -0.71 -0.44 -0.54 -0.2960 69.17 71.67 1.221 0.312 -0.04 -0.04 -0.04 -0.04 0.20 -0.33 -0.20 -0.25 -0.1490 71.47 79.88 1.361 0.278 -0.04 -0.03 -0.03 -0.03 0.09 -0.15 -0.09 -0.12 -0.06120 77.02 82.77 1.410 0.278 -0.03 -0.03 -0.03 -0.03 0.04 -0.07 -0.04 -0.05 -0.03150 79.99 85.88 1.463 0.247 -0.03 -0.03 -0.03 -0.03 0.02 -0.03 -0.02 -0.03 -0.01180 80.16 88.09 1.501 0.220 -0.03 -0.03 -0.03 -0.03 0.01 -0.02 -0.01 -0.01 -0.01210 89.79 1.530 0.196 -0.03 -0.02 -0.02 -0.02 0.00 -0.01 0.00 -0.01 0.00240 86.15 91.18 1.554 0.175 -0.02 -0.02 -0.02 -0.02 0.00 0.00 0.00 0.00 0.00270 92.36 1.574 0.156 -0.02 -0.02 -0.02 -0.02 0.00 0.00 0.00 0.00 0.00300 92.97 93.39 1.591 0.139 -0.02 -0.02 -0.02 -0.02 0.00 0.00 0.00 0.00 0.00
INCREASE IN Fe CONCENTRATION DUE TO LEACHING BY ACID AT 48 g/L COPPER
RUNGE-KUTTA FOURTH-ORDER METHOD
Overall rate equation: dFe(total)/dt = K8.15CH+ - K8.16CFe3+
Temp. = 60 oCInitial H2SO4 = 90 g/L 0.918367 molesInitial Fe = 0.67 g/L 0.012055 moles
dFe2+/dt = K8.15CH+ dFe3+/dt = -K8.16CFe3+
K8.15 = 0.0881 K8.16 = -0.082
EXPERIMENTAL VALUES MODEL VALUESTime Fe Fe Fe Fe2+ contribution Fe3+ contribution(min) (g/L) (g/L) (mol) (mol) K1 K2 K3 K4 (mol) K1 K2 K3 K4
0 0.67 0.67 0.012 0.01230 3.75 3.01 0.05 0.05 0.040 0.041 0.041 0.04260 3.66 3.15 0.06 0.06 0.002 0.002 0.002 0.00290 3.71 3.29 0.06 0.06 0.002 0.003 0.003 0.003120 3.85 3.44 0.06 0.06 0.003 0.003 0.003 0.003150 3.94 3.60 0.06 0.06 0.003 0.003 0.003 0.003180 3.86 3.76 0.07 0.07 0.003 0.003 0.003 0.003210 3.93 0.07 0.07 0.003 0.003 0.003 0.003240 4.04 4.11 0.07 0.07 0.003 0.003 0.003 0.003 0.00270 4.11 0.07 0.08 0.003 0.003 0.003 0.003 0.00 0.0000 0.0000 0.0000 0.0000300 4.18 4.30 0.08 0.08 0.003 0.003 0.003 0.004 0.00 0.0000 0.0000 0.0000 0.0000

INCREASE IN Co CONCENTRATION DUE TO LEACHING BY ACID AT 48 g/L COPPER
RUNGE-KUTTA FOURTH-ORDER METHOD
dCo2+/dt = K8.17CH+ Temp. = 60 oCInitial H2SO4 = 90 g 0.918 moles
K8.17 = 0.0320 Initial Co = 0.18 g/L 0.003 moles
EXPERIMENTAL VALUES MODEL VALUESTime Co Co Co(min) (g/L) (g/L) (mol) K1 K2 K3 K4
0 0.18 0.18 0.00330 0.96 1.05 0.02 0.0147 0.0148 0.0148 0.014960 0.94 1.07 0.02 0.0003 0.0003 0.0003 0.000390 0.97 1.09 0.02 0.0003 0.0003 0.0003 0.0003120 1.00 1.10 0.02 0.0003 0.0003 0.0003 0.0003150 1.04 1.12 0.02 0.0003 0.0003 0.0003 0.0003180 1.02 1.14 0.02 0.0003 0.0003 0.0003 0.0003210 1.16 0.02 0.0003 0.0003 0.0003 0.0003240 1.07 1.18 0.02 0.0003 0.0003 0.0003 0.0003270 1.20 0.02 0.0003 0.0003 0.0003 0.0003300 1.15 1.22 0.02 0.0003 0.0003 0.0003 0.0003
DECREASE IN Cu CONCENTRATION DUE TO LEACHING BY ACID AT 48 g/L COPPER
RUNGE-KUTTA FOURTH-ORDER METHOD
dCu2+/dt = -7/3K8ACu2+ Temp. = 60 oCK8.10 = 0.0867 Initial Cu = 48.00 g/L 0.755 moles
-8/3K8.10= -0.231 Initial H2SO4 = 90 g/L 0.918 moles
EXPERIMENTAL VALUES MODEL VALUESTime Cu Cu Cu(min) (g/L) (g/L) (mol) K1 K2 K3 K4
0 48.43 48.00 0.75530 43.25 42.76 0.67 -0.0873 -0.0823 -0.0826 -0.077860 36.43 38.09 0.60 -0.0778 -0.0733 -0.0735 -0.069390 33.01 33.93 0.53 -0.0693 -0.0653 -0.0655 -0.0617120 30.73 30.23 0.48 -0.0617 -0.0582 -0.0584 -0.0550150 29.37 26.93 0.42 -0.0550 -0.0518 -0.0520 -0.0490180 26.80 23.99 0.38 -0.0490 -0.0462 -0.0463 -0.0436210 21.37 0.34 -0.0436 -0.0411 -0.0413 -0.0389240 24.06 19.04 0.30 -0.0389 -0.0366 -0.0368 -0.0346270 16.96 0.27 -0.0346 -0.0326 -0.0327 -0.0308300 20.11 15.11 0.24 -0.0308 -0.0291 -0.0292 -0.0275
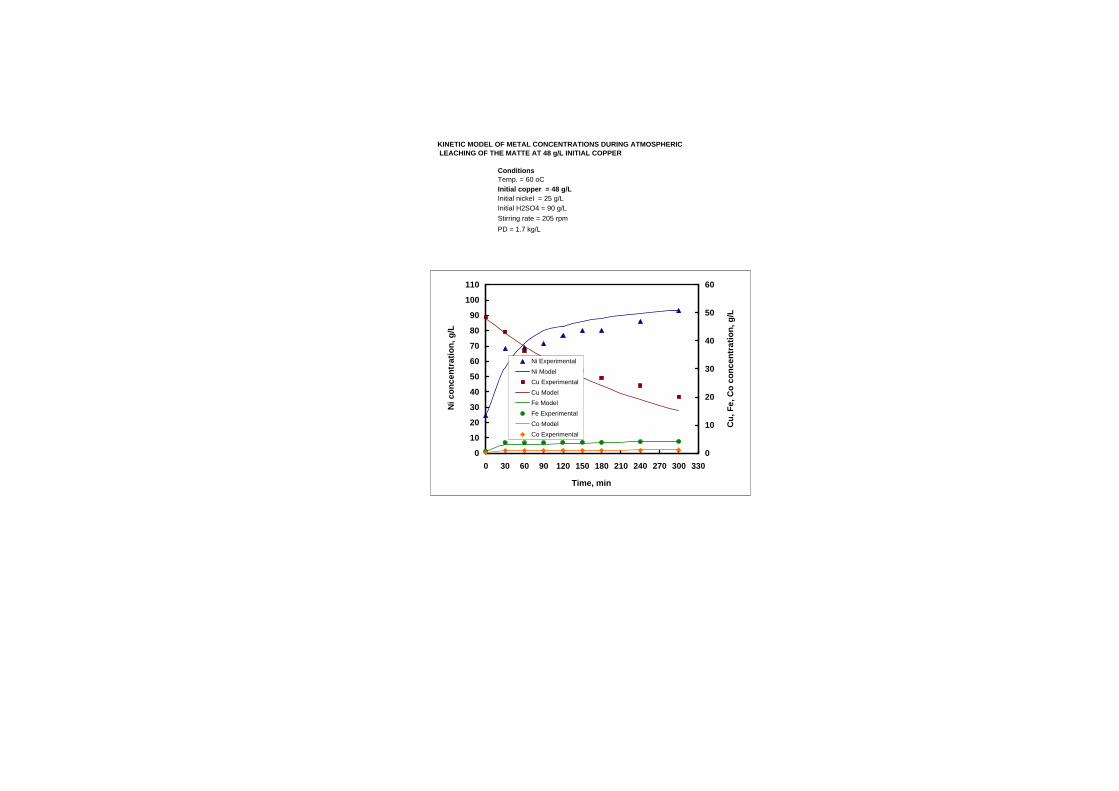
KINETIC MODEL OF METAL CONCENTRATIONS DURING ATMOSPHERIC LEACHING OF THE MATTE AT 48 g/L INITIAL COPPER
ConditionsTemp. = 60 oCInitial copper = 48 g/LInitial nickel = 25 g/LInitial H2SO4 = 90 g/LStirring rate = 205 rpmPD = 1.7 kg/L
0
10
20
30
40
50
60
70
80
90
100
110
0 30 60 90 120 150 180 210 240 270 300 330
Time, min
Ni c
once
ntra
tion,
g/L
0
10
20
30
40
50
60
Cu,
Fe,
Co
conc
entr
atio
n, g
/L
Ni ExperimentalNi ModelCu ExperimentalCu ModelFe ModelFe ExperimentalCo ModelCo Experimental


INCREASE IN Ni CONCENTRATION DUE TO LEACHING BY CEMENTATION AND ACID AT 80 oC KINETIC MODEL OF METAL CONCENTRATIONS DURING ATMOSPHERIC LEACHING OF THE MATTE AT A TEMPERATURE OF 80 oC
RUNGE-KUTTA FOURTH-ORDER METHODConditions
Overall rate equation: dNi2+/dt = 8/3K8.10Cu2+ + K8.13CH+ Temp. = 80 oCTemp. = 80 oC Initial copper = 25 g/L
dNi2+/dt =8/3 K8.10Cu2+ Initial Ni = 24.61 g/L 0.419 moles dNi2+/dt = K8.13CH+ Initial nickel = 25 g/L K8.10 = 1.728 Initial Cu = 24.95 g/L 0.393 moles Initial H2SO4 = 90 g/L
8/3K8.10 = -4.608 Initial H2SO4 = 90 g/L 0.918 moles K8.13 = -0.979 Stirring rate = 205 rpmPD = 1.7 kg/L
EXPERIMENTAL VALUES MODEL VALUESTime [Ni2+ ] [Ni2+ ] [Ni2+ ] Copper contribution Acid contribution(min) (g/L) (g/L) (mol) (mol) K1 K2 K3 K4 (moles) K1 K2 K3 K4
0 24.61 24.61 0.419 0.393 0.91830 65.58 57.31 0.976 0.191 -0.90 0.14 -1.06 1.54 0.56 -0.45 -0.34 -0.37 -0.2760 76.59 75.85 1.292 0.093 -0.44 0.07 -0.52 0.75 0.35 -0.28 -0.21 -0.22 -0.1790 87.97 86.48 1.474 0.045 -0.21 0.03 -0.25 0.36 0.21 -0.17 -0.13 -0.14 -0.10
120 91.86 92.65 1.579 0.022 -0.10 0.02 -0.12 0.18 0.13 -0.10 -0.08 -0.08 -0.06150 97.00 96.26 1.640 0.011 -0.05 0.01 -0.06 0.09 0.08 -0.06 -0.05 -0.05 -0.04180 97.73 98.38 1.676 0.005 -0.02 0.00 -0.03 0.04 0.05 -0.04 -0.03 -0.03 -0.02210 99.65 1.698 0.003 -0.01 0.00 -0.01 0.02 0.03 -0.02 -0.02 -0.02 -0.01240 104.17 99.645 1.711 0.001 -0.01 0.00 -0.01 0.01 0.02 -0.01 -0.01 -0.01 -0.01270 100.86 1.718 0.001 0.00 0.00 0.00 0.00 0.01 -0.01 -0.01 -0.01 -0.01300 104.59 101.13 1.723 0.000 0.00 0.00 0.00 0.00 0.01 -0.01 0.00 0.00 0.00
INCREASE IN Fe CONCENTRATION DUE TO LEACHING BY ACID AT 80 oC
RUNGE-KUTTA FOURTH-ORDER METHOD
Overall rate equation: dFe(total)/dt = K8.15CH+ - K8.16CFe3+
Temp. = 80 oCInitial H2SO4 = 90 g/L 0.918367 molesInitial Fe = 0.67 g/L 0.012055 molesH2SO4after 180 min = 20 g/L 0.204 moles
dFe2+/dt = K8.15CH+ Total Fe after 180 min = 4.39 g/L 0.079 moles dFe3+/dt = -K8.16CH+
K8.15 = 0.0981 K8.16 = -0.082
EXPERIMENTAL VALUES MODEL VALUESTime Fe Fe Fe Fe2+ contribution Fe3+ contribution(min) (g/L) (g/L) (mol) (mol) K1 K2 K3 K4 (mol) K1 K2 K3 K4
0 0.67 0.67 0.012 0.01230 3.32 3.28 0.06 0.059 0.045 0.046 0.046 0.04760 3.58 3.45 0.06 0.062 0.003 0.003 0.003 0.00390 4.03 3.63 0.06 0.065 0.003 0.003 0.003 0.003
120 4.25 3.81 0.07 0.068 0.003 0.003 0.003 0.003150 4.33 4.00 0.07 0.072 0.003 0.003 0.003 0.004180 4.39 4.21 0.08 0.075 0.004 0.004 0.004 0.004 0.00210 4.21 0.08 0.079 0.004 0.004 0.004 0.004 0.00 0.0000 0.0000 0.0000 0.0000240 4.15 4.42 0.08 0.083 0.004 0.004 0.004 0.004 0.00 0.0000 0.0000 0.0000 0.0000270 4.65 0.08 0.087 0.004 0.004 0.004 0.004 0.00 0.0000 0.0000 0.0000 0.0000300 3.96 4.88 0.09 0.092 0.004 0.004 0.004 0.005 0.00 0.0000 0.0000 0.0000 0.0000
0
10
20
30
40
50
60
70
80
90
100
110
0 30 60 90 120 150 180 210 240 270 300 330
Time, min
Ni c
once
ntra
tion,
g/L
0
5
10
15
20
25
30
Cu,
Fe,
Co
conc
entra
tion,
g/L
Ni ExperimentalNi ModelCu ExperimentalCu ModelFe ModelFe ExperimentalCo ModelCo Experimental

INCREASE IN Co CONCENTRATION DUE TO LEACHING BY ACID AT 80 oC
RUNGE-KUTTA FOURTH-ORDER METHOD
dCo2+/dt = K8.17CH+ Temp. = 80 oCInitial H2SO4 = 90 g/L 0.918 moles
K8.17 = 0.0320 Initial Co = 0.18 g/L 0.003 moles
EXPERIMENTAL VALUES MODEL VALUESTime Co Co Co(min) (g/L) (g/L) (mol) K1 K2 K3 K4
0 0.18 0.18 0.00330 0.76 1.05 0.02 0.0147 0.0148 0.0148 0.014960 0.83 1.07 0.02 0.0003 0.0003 0.0003 0.000390 0.94 1.09 0.02 0.0003 0.0003 0.0003 0.0003120 1.00 1.10 0.02 0.0003 0.0003 0.0003 0.0003150 1.07 1.12 0.02 0.0003 0.0003 0.0003 0.0003180 1.09 1.14 0.02 0.0003 0.0003 0.0003 0.0003210 1.16 0.02 0.0003 0.0003 0.0003 0.0003240 1.16 1.18 0.02 0.0003 0.0003 0.0003 0.0003270 1.20 0.02 0.0003 0.0003 0.0003 0.0003300 1.21 1.22 0.02 0.0003 0.0003 0.0003 0.0003
DECREASE IN Cu CONCENTRATION DUE TO LEACHING BY ACID AT 80 oC
RUNGE-KUTTA FOURTH-ORDER METHOD
dCu2+/dt = -8/3K8.10Cu2+ Temp. = 80 oCK8.10 = -1.728 Initial Cu = 24.95 g/L 0.393 moles
-8/3K8.10 = -4.608 Initial H2SO4 = 90 g/L 0.918 moles
EXPERIMENTAL VALUES MODEL VALUESTime Cu Cu Cu(min) (g/L) (g/L) (mol) K1 K2 K3 K4
0 24.95 24.95 0.39330 12.16 12.12 0.19 -0.9046 0.1375 -1.0630 1.544560 4.44 5.89 0.09 -0.4395 0.0668 -0.5165 0.750590 0.00 2.86 0.05 -0.2136 0.0325 -0.2510 0.3647120 0.00 1.39 0.02 -0.1038 0.0158 -0.1220 0.1772150 0.00 0.68 0.01 -0.0504 0.0077 -0.0593 0.0861180 0.00 0.33 0.01 -0.0245 0.0037 -0.0288 0.0418210 0.16 0.00 -0.0119 0.0018 -0.0140 0.0203240 0.00 0.08 0.00 -0.0058 0.0009 -0.0068 0.0099270 0.04 0.00 -0.0028 0.0004 -0.0033 0.0048300 0.00 0.02 0.00 -0.0014 0.0002 -0.0016 0.0023

INCREASE IN Ni CONCENTRATION DUE TO LEACHING BY CEMENTATION AND ACID AT 125 g/L ACIDKINETIC MODEL OF METAL CONCENTRATIONS DURING ATMOSPHERIC
RUNGE-KUTTA FOURTH-ORDER METHOD LEACHING OF THE MATTE AT 125 g/L INITIAL ACID TEMPERATURE OF 60 oC
Overall rate equation: dNi2+/dt = 8/3K8.10Cu2+ + K8.13CH+Temp. = 60 oC Conditions
dNi2+/dt = 8/3K8.10Cu2+ Initial Ni = 24.61 g/L 0.419 moles dNi2+/dt = K8.13CH+ Temp. = 60 oC K8.10 = 0.173 Initial Cu = 24.95 g/L 0.393 moles Initial copper = 24.95 g/L K8.10 = -0.461 Initial H2SO4 = 125 g/L 1.276 moles K8.13 = -1.532 Initial nickel = 25 g/L
Initial H2SO4 = 125 g/LEXPERIMENTAL VALUES MODEL VALUES Stirring rate = 205 rpm
Time [Ni2+ ] [Ni2+ ] [Ni2+ ] Copper contribution Acid contribution PD = 1.7 kg/L(min) (g/L) (g/L) (mol) (mol) K1 K2 K3 K4 (moles) K1 K2 K3 K4
0 24.61 24.61 0.419 0.393 0.91830 70.58 58.09 0.990 0.312 -0.09 -0.08 -0.08 -0.07 0.43 -0.70 -0.43 -0.54 -0.2960 76.40 75.28 1.283 0.248 -0.07 -0.06 -0.06 -0.06 0.20 -0.33 -0.20 -0.25 -0.1490 79.58 84.53 1.440 0.197 -0.06 -0.05 -0.05 -0.05 0.09 -0.15 -0.09 -0.12 -0.06120 83.22 87.46 1.490 0.197 -0.05 -0.04 -0.04 -0.04 0.04 -0.07 -0.04 -0.05 -0.03150 84.66 91.20 1.554 0.156 -0.05 -0.04 -0.04 -0.04 0.02 -0.03 -0.02 -0.03 -0.01180 87.63 93.72 1.597 0.124 -0.04 -0.03 -0.03 -0.03 0.01 -0.02 -0.01 -0.01 -0.01210 95.52 1.627 0.098 -0.03 -0.03 -0.03 -0.02 0.00 -0.01 0.00 -0.01 0.00240 93.38 96.84 1.650 0.078 -0.02 -0.02 -0.02 -0.02 0.00 0.00 0.00 0.00 0.00270 97.85 1.667 0.062 -0.02 -0.02 -0.02 -0.01 0.00 0.00 0.00 0.00 0.00300 98.05 98.63 1.681 0.049 -0.01 -0.01 -0.01 -0.01 0.00 0.00 0.00 0.00 0.00
INCREASE IN Fe CONCENTRATION DUE TO LEACHING BY ACID AT 125 g/L CID
RUNGE-KUTTA FOURTH-ORDER METHOD
Overall rate equation: dFe(total)/dt = K8.15CH+ - K8.16CFe3+
Temp. = 60 oCInitial H2SO4 = 125 g/L 1.27551 molesInitial Fe = 0.67 g/L 0.012055 moles
dFe2+/dt = K8.15CH+ dFe3+/dt = -K8.16CFe3+
K8.15 = 0.086 K8.16 = 0.00
EXPERIMENTAL VALUES MODEL VALUESTime Fe Fe Fe Fe2+ contribution Fe3+ contribution(min) (g/L) (g/L) (mol) (mol) K1 K2 K3 K4 (mol) K1 K2 K3 K4
0 0.67 0.67 0.012 0.01230 4.40 3.84 0.07 0.07 0.055 0.056 0.056 0.05760 4.63 4.01 0.07 0.07 0.003 0.003 0.003 0.00390 4.74 4.19 0.07 0.07 0.003 0.003 0.003 0.003120 4.85 4.37 0.08 0.08 0.003 0.003 0.003 0.003150 4.84 4.57 0.08 0.08 0.003 0.003 0.003 0.004180 4.93 4.77 0.09 0.09 0.004 0.004 0.004 0.004210 4.98 0.09 0.09 0.004 0.004 0.004 0.004240 5.11 5.20 0.09 0.09 0.004 0.004 0.004 0.004 0.00270 5.20 0.09 0.10 0.004 0.004 0.004 0.004 0.00 0.0000 0.0000 0.0000 0.0000300 5.22 5.43 0.10 0.10 0.004 0.004 0.004 0.004 0.00 0.0000 0.0000 0.0000 0.0000
0
10
20
30
40
50
60
70
80
90
100
110
0 30 60 90 120 150 180 210 240 270 300 330
Time, min
Ni c
once
ntra
tion,
g/L
0
5
10
15
20
25
30
Cu,
Fe,
Co
conc
entra
tion,
g/L
Ni ExperimentalNi Model
Cu ExperimentalCu ModelFe ModelFe Experimental
Co ModelCo Experimental

INCREASE IN Co CONCENTRATION DUE TO LEACHING BY ACID AT 125 g/L ACID
RUNGE-KUTTA FOURTH-ORDER METHOD
dCo2+/dt = K8.17CH+ Temp. = 60 oCInitial H2SO4 = 125 g/L 1.276 moles
K8.17 = 0.0240 Initial Co = 0.18 g/L 0.003 moles
EXPERIMENTAL VALUES MODEL VALUESTime Co Co Co(min) (g/L) (g/L) (mol) K1 K2 K3 K4
0 0.18 0.18 0.00330 1.01 1.09 0.02 0.0153 0.0154 0.0154 0.015560 1.08 1.10 0.02 0.0002 0.0002 0.0002 0.000290 1.08 1.11 0.02 0.0002 0.0002 0.0002 0.0002120 1.11 1.13 0.02 0.0002 0.0002 0.0002 0.0002150 1.13 1.14 0.02 0.0002 0.0002 0.0002 0.0002180 1.14 1.15 0.02 0.0002 0.0002 0.0002 0.0002210 1.17 0.02 0.0002 0.0002 0.0002 0.0002240 1.19 1.18 0.02 0.0002 0.0002 0.0002 0.0002270 1.20 0.02 0.0002 0.0002 0.0002 0.0002300 1.22 1.21 0.02 0.0002 0.0002 0.0002 0.0002
DECREASE IN Cu CONCENTRATION DUE TO LEACHING BY ACID AT 125 g/L ACID
RUNGE-KUTTA FOURTH-ORDER METHOD
dCu2+/dt = -8/3K8ACu2+ Temp. = 60 oCK8.10 = 0.173 Initial Cu = 24.95 g/L 0.393 moles
-8/3K8.10= -0.461 Initial H2SO4 = 125 g/L 1.276 moles
EXPERIMENTAL VALUES MODEL VALUESTime Cu Cu Cu(min) (g/L) (g/L) (mol) K1 K2 K3 K4
0 24.95 24.95 0.39330 22.16 19.81 0.31 -0.0906 -0.0801 -0.0813 -0.071860 17.46 15.73 0.25 -0.0719 -0.0636 -0.0646 -0.057090 14.48 12.49 0.20 -0.0571 -0.0505 -0.0513 -0.0453120 11.95 9.92 0.16 -0.0453 -0.0401 -0.0407 -0.0359150 9.81 7.87 0.12 -0.0360 -0.0318 -0.0323 -0.0285180 8.12 6.25 0.10 -0.0286 -0.0253 -0.0257 -0.0227210 4.96 0.08 -0.0227 -0.0201 -0.0204 -0.0180240 4.86 3.94 0.06 -0.0180 -0.0159 -0.0162 -0.0143270 3.13 0.05 -0.0143 -0.0127 -0.0128 -0.0113300 1.93 2.49 0.04 -0.0114 -0.0100 -0.0102 -0.0090

INCREASE IN Ni CONCENTRATION DUE TO LEACHING BY CEMENTATION AND ACID At -45um PARTICLE SIZ KINETIC MODEL OF METAL CONCENTRATIONS DURING ATMOSPHERICLEACHING OF THE MATTE AT -45 um PARTICLE SIZE
RUNGE-KUTTA FOURTH-ORDER METHODConditions
Overall rate equation: dNi2+/dt = 8/3K8.10Cu2+ + K8.13CH+ Particle size = - 45µmTemp. = 60 oC Temp. = 60 oC
dNi2+/dt = 8/3K8.10Cu2+ Initial Ni = 24.61 g/L 0.419 moles dNi2+/dt = K8.13CH+ Initial copper = 25 g/L K8.10 = 1.161 Initial Cu = 24.95 g/L 0.393 moles Initial nickel = 25 g/L K8.10 = -3.096 Initial H2SO4 = 90 g/L 0.918 moles K8.13 = -1.409 Initial H2SO4 = 90 g/L
Stirring rate = 205 rpmEXPERIMENTAL VALUES MODEL VALUES PD = 1.7 kg/L
Time [Ni2+ ] [Ni2+ ] [Ni2+ ] Copper contribution Acid contribution(min) (g/L) (g/L) (mol) (mol) K1 K2 K3 K4 (moles) K1 K2 K3 K4
0 24.61 24.61 0.419 0.393 0.91830 85.38 68.59 1.169 0.106 -0.61 -0.14 -0.50 0.17 0.46 -0.65 -0.42 -0.50 -0.3060 87.58 86.62 1.476 0.029 -0.16 -0.04 -0.14 0.05 0.23 -0.32 -0.21 -0.25 -0.1590 89.29 94.53 1.611 0.008 -0.04 -0.01 -0.04 0.01 0.11 -0.16 -0.10 -0.12 -0.07120 92.55 97.84 1.667 0.008 -0.01 0.00 -0.01 0.00 0.06 -0.08 -0.05 -0.06 -0.04150 93.10 99.81 1.701 0.002 -0.01 0.00 -0.01 0.00 0.03 -0.04 -0.03 -0.03 -0.02180 93.18 100.72 1.716 0.001 0.00 0.00 0.00 0.00 0.01 -0.02 -0.01 -0.01 -0.01210 101.15 1.723 0.000 0.00 0.00 0.00 0.00 0.01 -0.01 -0.01 -0.01 0.00240 99.45 101.35 1.727 0.000 0.00 0.00 0.00 0.00 0.00 0.00 0.00 0.00 0.00270 101.45 1.729 0.000 0.00 0.00 0.00 0.00 0.00 0.00 0.00 0.00 0.00300 101.84 101.50 1.729 0.000 0.00 0.00 0.00 0.00 0.00 0.00 0.00 0.00 0.00
INCREASE IN Fe CONCENTRATION DUE TO LEACHING BY ACID AT - 45 um PARTICLE SIZE
RUNGE-KUTTA FOURTH-ORDER METHOD
Overall rate equation: dFe(total)/dt = K8.15CH+ - K8.16CFe3+
Temp. = 60 oCInitial H2SO4 = 90 g/L 0.918367 molesInitial Fe = 0.67 g/L 0.012055 molesH2SO4after 180 min = 20 g/L 0.204 moles
dFe2+/dt = K8.15CH+ Total Fe after 180 min = 4.39 g/L 0.079 moles dFe3+/dt = -K8.16CFe3+
K8.15 = 0.171 K8.16 = 0.261
EXPERIMENTAL VALUES MODEL VALUESTime Fe Fe Fe Fe2+ contribution Fe3+ contribution(min) (g/L) (g/L) (mol) (mol) K1 K2 K3 K4 (mol) K1 K2 K3 K4
0 0.67 0.67 0.012 0.01230 4.46 5.35 0.10 0.10 0.079 0.082 0.082 0.08660 3.66 2.18 0.04 0.10 0.008 0.009 0.009 0.009 0.0790 2.58 2.20 0.04 0.11 0.009 0.009 0.009 0.010 0.07 0.0086 0.0091 0.0091 0.0097120 1.44 2.20 0.04 0.12 0.010 0.010 0.010 0.011 0.09 0.0097 0.0104 0.0104 0.0111150 1.34 2.17 0.04 0.14 0.011 0.011 0.011 0.012 0.10 0.0111 0.0118 0.0119 0.0127180 1.36 2.11 0.04 0.15 0.012 0.012 0.012 0.013 0.11 0.0127 0.0135 0.0135 0.0144210 2.00 0.04 0.16 0.013 0.013 0.013 0.014 0.13 0.0144 0.0154 0.0154 0.0164240 1.42 1.85 0.03 0.18 0.014 0.014 0.014 0.015 0.14 0.0164 0.0175 0.0176 0.0187270 1.63 0.03 0.19 0.015 0.016 0.016 0.016 0.16 0.0187 0.0199 0.0200 0.0213300 1.27 1.34 0.02 0.21 0.016 0.017 0.017 0.018 0.19 0.0213 0.0227 0.0228 0.0243
0
10
20
30
40
50
60
70
80
90
100
110
0 30 60 90 120 150 180 210 240 270 300 330
Time, min
Ni c
once
ntra
tion,
g/L
0
5
10
15
20
25
30
Cu,
Fe,
Co
conc
entra
tion,
g/L
Ni ExperimentalNi Model
Cu ExperimentalCu ModelFe ModelFe Experimental
Co ModelCo Experimental

INCREASE IN Co CONCENTRATION DUE TO LEACHING BY ACID AT -45um PARTICLE SIZE
RUNGE-KUTTA FOURTH-ORDER METHOD
dCo2+/dt = K8.17CH+ Temp. = 60 oCInitial H2SO4 = 90 g/L 0.918 moles
K8.17 = 0.0350 Initial Co = 0.18 g/L 0.003 moles
EXPERIMENTAL VALUES MODEL VALUESTime Co Co Co(min) (g/L) (g/L) (mol) K1 K2 K3 K4
0 0.18 0.18 0.00330 1.25 1.14 0.02 0.0161 0.0162 0.0162 0.016460 1.26 1.16 0.02 0.0003 0.0003 0.0003 0.000390 1.27 1.18 0.02 0.0003 0.0003 0.0003 0.0003120 1.29 1.20 0.02 0.0003 0.0004 0.0004 0.0004150 1.30 1.22 0.02 0.0004 0.0004 0.0004 0.0004180 1.30 1.24 0.02 0.0004 0.0004 0.0004 0.0004210 1.26 0.02 0.0004 0.0004 0.0004 0.0004240 1.32 1.28 0.02 0.0004 0.0004 0.0004 0.0004270 1.31 0.02 0.0004 0.0004 0.0004 0.0004300 1.35 1.33 0.02 0.0004 0.0004 0.0004 0.0004
DECREASE IN Cu CONCENTRATION DUE TO LEACHING BY ACID AT -45 um ARTICLE SIZE
RUNGE-KUTTA FOURTH-ORDER METHOD
dCu2+/dt = -8/3K8.10Cu2+ Temp. = 60 oCK8.10 = 1.161 Initial Cu = 24.95 g/L 0.393 moles
-8/3K810 = -3.096 Initial H2SO4 = 90 g/L 0.918 moles
EXPERIMENTAL VALUES MODEL VALUESTime Cu Cu Cu(min) (g/L) (g/L) (mol) K1 K2 K3 K4
0 24.95 24.95 0.39330 12.08 6.77 0.11 -0.6078 -0.1374 -0.5014 0.168560 2.28 1.83 0.03 -0.1648 -0.0372 -0.1360 0.045790 0 0.50 0.01 -0.0447 -0.0101 -0.0369 0.0124120 0 0.13 0.00 -0.0121 -0.0027 -0.0100 0.0034150 0 0.04 0.00 -0.0033 -0.0007 -0.0027 0.0009180 0 0.01 0.00 -0.0009 -0.0002 -0.0007 0.0002210 0 0.00 0.00 -0.0002 -0.0001 -0.0002 0.0001240 0 0.00 0.00 -0.0001 0.0000 -0.0001 0.0000270 0 0.00 0.00 0.0000 0.0000 0.0000 0.0000300 0 0.00 0.00 0.0000 0.0000 0.0000 0.0000

INCREASE IN Ni CONCENTRATION DUE TO LEACHING BY CEMENTATION AND ACID AT - 106+45 um PARTICLE SIZE KINETIC MODEL OF METAL CONCENTRATIONS DURING ATMOSPHERIC LEACHING OF THE MATTE AT - 106+45 um PARTICLE SIZE
RUNGE-KUTTA FOURTH-ORDER METHODConditions
Overall rate equation: dNi2+/dt = 8/3K8.10Cu2+ + K8.13CH+ Particle size: - 106+45Temp. = 60 oC Temp. = 60 oC
dNi2+/dt = 8/3K8.10Cu2+ Initial Ni = 24.61 g/L 0.419 moles dNi2+/dt = K8.13CH+ Initial copper = 25 g/L K8.10 = 0.498 Initial Cu = 24.95 g/L 0.393 moles Initial nickel = 25 g/L K8.10 = -1.328 Initial H2SO4 = 90 g/L 0.918 moles K8.13 = -0.976 Initial H2SO4 = 90 g/L
Stirring rate = 205 rpmEXPERIMENTAL VALUES MODEL VALUES PD = 1.7 kg/L
Time [Ni2+ ] [Ni2+ ] [Ni2+ ] Copper contribution Acid contribution(min) (g/L) (g/L) (mol) (mol) K1 K2 K3 K4 (moles) K1 K2 K3 K4
0 24.61 24.61 0.419 0.393 0.91830 78.22 56.57 0.964 0.202 -0.26 -0.17 -0.20 -0.13 0.56 -0.45 -0.34 -0.37 -0.2760 78.79 75.10 1.280 0.104 -0.13 -0.09 -0.10 -0.06 0.35 -0.28 -0.21 -0.22 -0.1790 84.73 85.91 1.464 0.054 -0.07 -0.05 -0.05 -0.03 0.21 -0.17 -0.13 -0.14 -0.10
120 87.23 90.73 1.546 0.054 -0.04 -0.02 -0.03 -0.02 0.13 -0.10 -0.08 -0.08 -0.06150 88.09 95.21 1.622 0.028 -0.04 -0.02 -0.03 -0.02 0.08 -0.06 -0.05 -0.05 -0.04180 92.30 97.82 1.667 0.014 -0.02 -0.01 -0.01 -0.01 0.05 -0.04 -0.03 -0.03 -0.02210 99.34 1.693 0.007 -0.01 -0.01 -0.01 0.00 0.03 -0.02 -0.02 -0.02 -0.01240 91.20 100.24 1.708 0.004 0.00 0.00 0.00 0.00 0.02 -0.01 -0.01 -0.01 -0.01270 100.77 1.717 0.002 0.00 0.00 0.00 0.00 0.01 -0.01 -0.01 -0.01 -0.01300 94.71 101.08 1.722 0.001 0.00 0.00 0.00 0.00 0.01 -0.01 0.00 0.00 0.00
INCREASE IN Fe CONCENTRATION DUE TO LEACHING BY ACID AT - 106+45 um PARTICLE SIZE
RUNGE-KUTTA FOURTH-ORDER METHOD
Overall rate equation: d(Fe2+/Fe3+)/dt = K8.15CH+ - K8.16CFe3+
Temp. = 60 oCInitial H2SO4 = 90 g/L 0.918 molesInitial Fe = 0.67 g/L 0.012 molesH2SO4after 180 min = 20 g/L 0.204 moles
dFe2+/dt = K8.15CH+ Total Fe after 180 min = 4.39 g/L 0.079 moles dFe3+/dt = -K8.16CFe3+
K8.15 = 0.124 K8.16 = 0.695
EXPERIMENTAL VALUES MODEL VALUESTime Fe Fe Fe Fe2+ contribution Fe3+ contribution(min) (g/L) (g/L) (mol) (mol) K1 K2 K3 K4 (mol) K1 K2 K3 K4
0 0.67 0.67 0.012 0.01230 4.46 4.01 0.07 0.07 0.057 0.059 0.059 0.06160 4.49 4.27 0.08 0.08 0.004 0.005 0.005 0.00590 4.47 4.54 0.08 0.08 0.005 0.005 0.005 0.005 0.012
120 3.81 3.90 0.07 0.09 0.005 0.005 0.005 0.005 0.017 0.0041 0.0048 0.0049 0.0058150 3.76 4.10 0.07 0.09 0.005 0.006 0.006 0.006 0.019 0.0058 0.0068 0.0070 0.0082180 3.91 4.12 0.07 0.10 0.006 0.006 0.006 0.006 0.025 0.0065 0.0077 0.0079 0.0093210 4.23 0.08 0.10 0.006 0.006 0.006 0.006 0.029 0.0085 0.0100 0.0103 0.0121240 3.89 4.18 0.07 0.11 0.006 0.007 0.007 0.007 0.037 0.0101 0.0118 0.0121 0.0143270 4.16 0.07 0.12 0.007 0.007 0.007 0.007 0.044 0.0127 0.0149 0.0153 0.0180300 3.81 3.99 0.07 0.13 0.007 0.008 0.008 0.008 0.05 0.0153 0.0180 0.0185 0.0218
0
10
20
30
40
50
60
70
80
90
100
110
0 30 60 90 120 150 180 210 240 270 300 330
Time, min
Ni c
once
ntra
tion,
g/L
0
5
10
15
20
25
30
Cu,
Fe,
Co
conc
entra
tion,
g/L
Ni ExperimentalNi ModelCu ExperimentalCu ModelFe ModelFe ExperimentalCo ModelCo Experimental

INCREASE IN Co CONCENTRATION DUE TO LEACHING BY ACID AT - 106+45 um PARTICLE SIZE
RUNGE-KUTTA FOURTH-ORDER METHOD
dCo2+/dt = K8.17CH+ Temp. = 60 oCInitial H2SO4 = 90 g 0.918 moles
K8.17 = 0.0350 Initial Co = 0.18 g/L 0.003 moles
EXPERIMENTAL VALUES MODEL VALUESTime Co Co Co(min) (g/L) (g/L) (mol) K1 K2 K3 K4
0 0.18 0.18 0.00330 1.01 1.14 0.02 0.0161 0.0162 0.0162 0.016460 1.11 1.16 0.02 0.0003 0.0003 0.0003 0.000390 1.23 1.18 0.02 0.0003 0.0003 0.0003 0.0003
120 1.24 1.20 0.02 0.0003 0.0004 0.0004 0.0004150 1.22 1.22 0.02 0.0004 0.0004 0.0004 0.0004180 1.24 1.24 0.02 0.0004 0.0004 0.0004 0.0004210 1.26 0.02 0.0004 0.0004 0.0004 0.0004240 1.22 1.28 0.02 0.0004 0.0004 0.0004 0.0004270 1.31 0.02 0.0004 0.0004 0.0004 0.0004300 1.31 1.33 0.02 0.0004 0.0004 0.0004 0.0004
DECREASE IN Cu CONCENTRATION DUE TO LEACHING BY ACID AT - 106+45 um PARTICLE SIZE
RUNGE-KUTTA FOURTH-ORDER METHOD
dCu2+/dt = -8/3K8.10Cu2+ Temp. = 60 oCK8.10 = 0.498 Initial Cu = 24.95 g/L 0.393 moles
-8/3K8.10 = -1.328 Initial H2SO4 = 90 g/L 0.918 moles
EXPERIMENTAL VALUES MODEL VALUESTime Cu Cu Cu(min) (g/L) (g/L) (mol) K1 K2 K3 K4
0 24.95 24.95 0.39330 17.64 12.87 0.20 -0.2607 -0.1741 -0.2029 -0.126060 11.94 6.64 0.10 -0.1345 -0.0898 -0.1046 -0.065090 6.23 3.42 0.05 -0.0693 -0.0463 -0.0540 -0.0335
120 1.19 1.77 0.03 -0.0358 -0.0239 -0.0278 -0.0173150 0.00 0.91 0.01 -0.0184 -0.0123 -0.0144 -0.0089180 0.00 0.47 0.01 -0.0095 -0.0064 -0.0074 -0.0046210 0.00 0.24 0.00 -0.0049 -0.0033 -0.0038 -0.0024240 0.00 0.12 0.00 -0.0025 -0.0017 -0.0020 -0.0012270 0.00 0.06 0.00 -0.0013 -0.0009 -0.0010 -0.0006300 0.00 0.03 0.00 -0.0007 -0.0004 -0.0005 -0.0003

APPENDIX F
PAPERS BASED ON THIS DISSERTATION
Lamya, R.M. and Lorenzen, L., 2005. A study of the factors influencing
the kinetics of copper cementation during atmospheric leaching of
converter matte. Journal of SAIMM, January, pp. 21 – 27.
Lamya, R.M., Orellana, E.A., Fox, M. and Lorenzen, L., 2004. A study
of factors influencing the kinetics of atmospheric leaching of nickel-
copper matte in copper spent electrolyte. SAIMM colloquium –
Innovations in leaching technology, 18 – 19 May.
Lamya, R.M. and Lorenzen, L., Atmospheric acid leaching of nickel-
copper matte from Impala Platinum Refineries. Journal of SAIMM,
(submitted for publication).