DAMD17-94-C-4069 TITLE - DTIC
424
* ,. -} AD Award Number: DAMD17-94-C-4069 TITLE: Services to Operate and Maintain the Microwave Research Facility at Brooks Air Force Base, San Antonio, Texas PRINCIPAL INVESTIGATOR: Yahya Akyel, Ph.D. CONTRACTING ORGANIZATION: McKesson Bioservices Rockville, Maryland 2 0850 REPORT DATE: May 2001 TYPE OF REPORT: Final (Supplement) PREPARED FOR: U.S. Army Medical Research and Materiel Command Fort Detrick, Maryland 21702-5012 DISTRIBUTION STATEMENT: Approved for Public Release; Distribution Unlimited The views, opinions and/or findings contained in this report are those of the author(s) and should not be construed as an official Department of the Army position, policy or decision unless so designated by other documentation. 20010718 087
-
Upload
khangminh22 -
Category
Documents
-
view
1 -
download
0
Transcript of DAMD17-94-C-4069 TITLE - DTIC

* ,. -}
AD
Award Number: DAMD17-94-C-4069
TITLE: Services to Operate and Maintain the Microwave Research Facility at Brooks Air Force Base, San Antonio, Texas
PRINCIPAL INVESTIGATOR: Yahya Akyel, Ph.D.
CONTRACTING ORGANIZATION: McKesson Bioservices Rockville, Maryland 2 0850
REPORT DATE: May 2001
TYPE OF REPORT: Final (Supplement)
PREPARED FOR: U.S. Army Medical Research and Materiel Command Fort Detrick, Maryland 21702-5012
DISTRIBUTION STATEMENT: Approved for Public Release; Distribution Unlimited
The views, opinions and/or findings contained in this report are those of the author(s) and should not be construed as an official Department of the Army position, policy or decision unless so designated by other documentation.
20010718 087

REPORT DOCUMENTATION PAGE Form Approved
OMB No. 074-0188 Public reporting burden for this collection of information is estimated to average 1 hour per response, including the time for reviewing instructions, searching existing data sources, gathering and maintaining the data needed, and completing and reviewing this collection of information. Send comments regarding this burden estimate or any other aspect of this collection of information, including suggestions for reducing this burden to Washington Headquarters Services, Directorate for Information Operations and Reports, 1215 Jefferson Davis Highway, Suite 1204, Arlington, VA 22202-4302, and to the Office of Management and Budget, Paperwork Reduction Project (0704-0188), Washington, DC 20503
1. AGENCY USE ONLY (Leave blank) 2. REPORT DATE May 2001
3. REPORT TYPE AND DATES COVERED Final (Supplement) (21 May 94 20 May 01)
4. TITLE AND SUBTITLE Services to Operate and Maintain the Microwave Research Facility at Brooks Air Force Base, San Antonio, Texas
6. AUTHOR(S) Yahya Akyel, Ph.D.
5. FUNDING NUMBERS DAMD17-94-C-4069
7. PERFORMING ORGANIZATION NAME(S) AND ADDRESS(ES) McKesson Bioservices Rockville, Maryland 20850
E-Mail: [email protected]
8. PERFORMING ORGANIZATION REPORT NUMBER
9. SPONSORING / MONITORING AGENCY NAME(S) AND ADDRESS(ES)
U.S. Army Medical Research and Materiel Command Fort Derrick, Maryland 21702-5012
10. SPONSORING / MONITORING AGENCY REPORT NUMBER
11. SUPPLEMENTARY NOTES This report contains colored photos
12a. DISTRIBUTION / AVAILABILITY STATEMENT Approved for Public Release; Distribution Unlimited
12b. DISTRIBUTION CODE
13. ABSTRACT (Maximum 200 Words)
Due to growing concerns for the health and safety of military personnel and civilians exposed to radio frequency radiation, a series of research investigating behavioral, neural, biological, cardiovascular and retinal effects of high peak power pulsed microwaves (Mw), ultra-wide-band (UWB) and mm waves were accomplished. Up to 20 W/kg, pulsed 1.25 GHz Mw did not cause retinal injuries. Extremely high peak power 9.2 GHz Mw had no specific effect on pacemaker of the frog heart or hippocampal slices but a specific inhibitory effect on the growth rate of yeast cells was suspected. Synaptic transmission of frog spinal cord was not a target of 41.1-42.4 GHz CW mm waves. Interaction between 1.25 GHz pulsed Mw and 3-nitropropionic acid on prepulse inhibition of acoustic startle was found. A SAR dependent effect on Y-maze performance was found in rats exposed to 2.45 GHz Mw, A SAR dependent hypotension was found in rats exposed to UWB pulses. UWB pulses could inhibit the hyperactivity caused by a nitric oxide synthase inhibitor. The UWB pulses were not genotoxic. A general mathematical model using FDTD techniques to estimate the electric field.in a large GTEM cell was developed and validaded. Six concept papers have been published. Details of accomplishments and a list of publications is included.
14. SUBJECT TERMS Hiqh peak power pulsed microwaves, ultra-wide-band puses, mm waves, Neural, retinal, cardiovascular, behavorial, neutoxin, growth, gene
15. NUMBER OF PAGES 422
16. PRICE CODE
17. SECURITY CLASSIFICATION OF REPORT
Unclassified
18. SECURITY CLASSIFICATION OF THIS PAGE
Unclassified
19. SECURITY CLASSIFICATION OF ABSTRACT
Unclassified
20. LIMITATION OF ABSTRACT
Unlimited NSN 7540-01-280-5500 Standard Form 298 (Rev. 2-89)
Prescribed by ANSI Std. Z39-18 298-102

FOREWORD
Opinions, interpretations, conclusions and recommendation are those of the author and are not necessarily endorsed by the U.S. Army.
Ojfo- Where copyrighted material is quoted, permission has been obtained to use such material.
JA Q Where material from documents designated for limited distribution is quoted, permission has been obtained to use the material.
H/>- Citations of commercial organizations and trade names in this report do not constitute an official Department of Army endorsement or approval of the products or services of these organizations.
Isy ft- In conducting research using animals, the investigator (s) adhered to the "Guide for the Care and Use of Laboratory Animals," prepared by the committee on Care and Use of Laboratory animals of the Institute of Laboratory Resources, National Research Council (NIH Publication No.86-23, Revised 1985).
°1 A" For the protection of human subjects, the investigator(s) adhered to policies of applicable Federal Law 45 CFR 46.
L\ f\ In conducting research utilizing recombinant DNA technology, the investigator(s) adhered to current guidelines promulgated by the National Institutes of Health.
fx\/P- In the conduct of research utilizing recombinant DNA, the investigator(s) adhered to the NIH Guidelines for Research Involving Recombinant DNA Molecules.
fr-]/^- In the conduct of research involving hazardous organisms, the investigator(s) adhered to the CDC-NIH Guide for Biosafety in Microbiological and Biomedical Laboratories.
PI - Signature Date

TABLE OF CONTENTS
Cover 1
SF298 2
Foreword 3
Introduction 6
Body of Report
Research on High Peak Power From Radio Frequency Radiation (RFR) and Neurotoxic Effects of RFR 8
Retinal Effects of the L-band Radiation 8
Neural Effects of Extremely High Peak Power Microwaves In Vitro 10
In Vitro Effect of Extremely High Peak Power Pulses on Cell Growth 13
Neurotoxic Effects of Radio Frequency Radiation 15
Biological Hazards of Ultra Wide Band (UWB) Radiation on Cardiovascular System and Other Cellular Systems 20
Cardiovascular Effects 20
Genotoxic Effects of UWB Pulses 26
Interaction Between Nitric Oxide Synthase Inhibitor and Exposure to UWB Pulses 26
Finite Difference Time Domain (FDTD) Techniques to Perform Dosimetry in Biological Tissue for High Peak Power RFR and UWB Exposures 28
Concept Paper to Identify Strategies to Capture the Epidemiology of Microwave Exposure to Army Personnel and the Implication to Military Perfornance 30
Conclusion 37
Personnel 39
Presentations / Publications List 40

Volume II
Copies of Publications (1-14)
Volume III
Copies of Publications (15-20)
Copies of Technical Reports (1-2)

INTRODUCTION
The following report summarizes the performance of McKessonHBOC Pharmaceutical Partners Group, Clinical and Biological Services (MCBS) staff at the Walter Reed Army Institute of Research (WRAIR), U.S. Army Medical Research Detachment, Microwave Bioeffects Branch at Brooks Air Force Base, Texas under the contracts DAMD17-94-C-4069 and DAMD17-94-E-0001. MCBS has nine years contract with the U.S. Army Medical Research and Acquisition Activity (USAMRAA) to operate and maintain Microwave Bioeffects Branch, a Government-owned Contractor-operated (GOCO) facility. Reports summarized the base three years (May 20, 1994 - May 2, 1997) and the first option years (May 21, 1997 - May 20, 1999) were previously filed with the U.S. Army Medical Research and Materiel Command, Fort Detrick, Maryland in June, 1997 and May, 1999. The present report reflects the efforts of MCBS staff during the second option years (May 21, 1999 - May 20, 2001) of the aforementioned contract.
Based on guidance provided in the contract and the guidance provided by the Contracting Officer's Representative (COR), Mr. Bruce Stuck, MCBS The research objectives are twofold:
• To operate, maintain and provide technical support for all the U.S. Army Electromagnetic Bioeffects Research Program (EMBRP) Laboratories. This includes operation, maintenance and repair of the high power transmitters and all related microwave and biomedical instrumentation used in the Army EMBRP facility, and
• To furnish biomedical scientists and research assistants to plan, direct, and carry out the relevant research necessary to support WRAIR's EMBRP. The protocols for research performed by the Contractor's scientists are subject to review/approval by the COR, the Commander, WRAIR, Laboratory and Animal Care and Use Committee (LACUC).
Specifically, the MCBS staff is to focus research in the following areas:
• Conduct research on high peak power effects from radio frequency radiation (RFR) inherent to U.S. Army systems to assess health and safety for military personnel. Conduct a series of at least three major studies exploring the potential of neurotoxic effects of radio frequency (RFR) exposure. These studies will test mechanisms of neurodegenerative disease, following up on current studies on retinal tissue bioeffects and epidemiological studies conducted by others which suggest a link between neurodegenerative diseases and RFR exposure.
• Conduct research on the biological hazards of ultra wide band (UWB) radiation on the cardiovascular system and other cellular systems. Produce a report which details the research results and discusses implications to the interim guidelines for safe

exposure to UWB radiation promulgated by the Tri Service Electromagnetic Radiation Protection Panel (TERP) and soldier performance. Collaborate with other scientists in the area of Finite Difference Time Domain (FDTD) techniques to perform dosimetry in biological tissues for high peak power RFR and UWB exposure.
Prepare an initial concept paper to identify strategies to capture the epidemiology of microwave exposure to Army personnel and the implication to military performance.

BODY OF REPORT
RESEARCH ON HIGH PEAK POWER EFFECTS FROM RADIO FREQUENCY RADIATION (RFR) AND
NEUROTOXIC EFFECTS OF RFR
Retinal Effects of the L-band Radiation
Radio frequency radiation induced alteration of biological endpoints generally requires specific absorption rates (SARs) greater than 4 W/kg threshold known to disrupt ongoing behavior. It has been question that this threshold can cause retinal injury in form of electroretinogram (ERG) depression, and histological and ultrastructural evidence of degeneration. Due to the potential importance of microwave ocular hazards in relation to health and safety of soldiers, sailors, airmen, and the general public, an ocular study using rhesus monkeys was requested by the TERP.
The objective of the research was to identify the presence or absence of high peak power (1.25 MW/kg peak retinal SAR, 5.59 us pulse width) RFR induced retinal injuries by studying changes in fundus picture, angiograph, and ERG and post-exposure histopathology of monkeys exposed to 1.25 GHz pulsed microwaves. The average retinal SARs were at 0, 4.3, 8.4, and 20.2 W/kg achieved by 0, 0.59, 1.18 and 2.79 Hz pulse repetition rates. The exposure was 4 hr per day and 3 days per week for 3 weeks, for a total of nine exposures. The following special considerations were incorporated in the experimental design:
Extensive desitometry and dosimetry were performed prior to experimentation, Transmitter output power was continuously monitored and recorded, Extensive pre-exposure screenings were used to assure the retinal normality prior to the acceptance of experimental subjects into the study, All diagnostic procedures were applied uniformly to all subjects regardless of treatment, Graded multiple retinal doses were used to maximize the probability of observing retinal changes caused by microwave exposures, Pre-exposure baseline were used for individual control, Data obtained in the exposed monkeys were further compared to those of sham-exposed monkeys which were run concurrently with the experimental monkeys, Ketamine restraint and general anesthesia were not used during exposure, A minimum of a 72 hour recovery period was mandatory between pre-screenings and beginning of the repeated exposures,

• Fluorophotometry was not used, • Exposures were randomized,
• All investigators except one (code keeper) were blind to the experimental treatments, • Long distance transportation was avoided, and • Experimental subjects were transported in a metal cage with opaque plastic cover and in
an enclosed air-conditioned van.
These considerations were incorporated to ensure data quality and to avoid introducing unidentified confounding factors and unintentional biases by investigators.
Results indicated that pre-exposure and post-exposure fundus pictures and angiograms were all within normal limits. The response of cone photoreceptors to light flash was enhanced in monkeys exposed at 8.4 or 20.2 W/kg, but not in monkeys exposed at 4.3 W/kg. Scotopic (rod) response, maximum (combined cone and rod) response, and Naka-Rushton Rmax and log K of the scotopic b-wave were all within normal range. Post-exposure retinal histopathology revealed the presence of enhanced glycogen (periodic acid Schiff) in photoreceptors among sham (2/5), 8.4 W/kg (3/3) and 20.2 W/kg (2/5) exposed monkeys, while enhanced glycogen storage was not observed in the 4.3 W/kg (0/4) exposed group. It was concluded as followed:
• Supra-normal cone photoreceptor b-wave was SAR dependent and may be an early indicator of mild injury,
• No evidence of degenerative changes and ERG depression was seen, • Retinal injury is very unlikely at 4 W/kg in adult rhesus monkeys, and • Functional changes that occur at higher SAR are probably reversible since we saw no
evidence of histopathologic correlation with ERG changes.
However, these results did not address the sensitivity of retina to microwave radiation in juvenile monkeys nor the sensitizing effect of glaucoma medication such as timolol or pilocarpine on the susceptibility of retina and corneal endothelial cells to microwave induced injuries. Results of this study is reported in a peer-reviewed journal article and a Tri-Service Technical Report which contains all the details including tabulated raw data of individual animals.
Relevant Publications
• Lu, S.-T.; Mathur, S.P.; Stuck, B.; Zwick, H.; D'Andrea, J.A; Ziriax, J.M.; Merritt, J.H.; Lutty, G.; McLeod, D. S.; and Johnson, M. [1999]: Retinal Effects of High Peak Power Microwaves in Rhesus Monkeys. Brooks Air Force Base, U.S. Army Medical Research Detachment, Naval Health Research Center Detachment, U.S. Air Force Research Laboratory, Technical Report, USAMRD WRAIR 9907 006 TX, NHRC-DET 99-01, AFRL- HE-BR-TR-1999-0231.

Lu, S.-T.; Mathur, S.P.; Stuck, B.; Zwick, H.; D'Andrea, J.A.; Ziriax, J.M.; Merritt, J.H.; Lutty, G.; McLeod, D. S.; and Johnson, M. [2000]: Effects of high peak power microwaves on the retina of the rhesus monkey. Bioelectromagnetics 21:439-454.
Neural Effects of the Extremely High Peak Power Microwaves In Vitro
Numerous experimental studies, as well as observations in human, have indicated that certain types of microwave exposure might be a risk factor or a cause of nervous system pathologies, including neuropsychiatric disorders, asthenia, neuropathy, and neurodegenerative diseases. However, mechanisms of neurotoxic effect of microwaves remain unclear, and little is known about the prevention and therapy of the microwave-induced pathological conditions.
Of particular interests are new types of microwave emissions, namely the extremely high power microwave pulses (EHPP), which are produced by directed energy weapons and modern radars. During operation of EHPP transmitters, military personnel and civilian population can be exposed to sub-microsecond pulses emitted at peak powers of hundreds of megawatts or even gigawatts. EHPP microwave pulses represent a new, unknown, and potentially hazardous environmental factor. This dictates the need for detailed research into biological effects of EHPP to identify exposure hazards and suggest treatment and rehabilitation procedure for EHPP- induced injuries.
Current opinion among researchers is that exposures at sufficient high pulse power will undoubtedly be very harmful to cell membranes, cytoplasm, and organism as a whole. However, very little is known about such hazards. Studying these EHPP bioeffects constitutes a new area of fundamental research with important implications for identifying and preventing exposure hazards in DoD operations. At present, due to lack of scientific data on EHPP bioeffects, safety guidelines are set arbitrarily, and exposure limits in different countries differ by orders of magnitude. Our efforts are to provide critical data on potential hazards to the nervous system from EHPP exposure and to form the basis for scientifically justified exposure safety guidelines.
An in vitro 9.3 GHz EHPP exposure system for small biological samples was designed, assembled and put into operation in this laboratory. The system can provide peak SAR as high as 350-400 kW/g and fixed pulse duration at 1 ps. Recently, the system was upgraded to provide EHPP pulses with 2.5 times higher in peak SAR and variable pulse duration between 0.5 and 2 ps. A high-resolution micro-dosimetry method based on microthermocouple technique has been developed in this laboratory. It was used to determine SAR of the exposed sample.
Specific biological effect associated with high peak power microwaves and their potential
10

health hazards are among the most debated but least explored problem in the area of biological effects of RFR. Initially, pacemaker function in isolated heart slices was studied. The study attempted to reveal the existence of specific effects of high peak power microwaves. Comparison was made between effects of EHPP train (1 us pulse duration, 250-350 kW/g, 9.2 GHz) and of relative low power pulse (LPP, 0.5-10 |is pulse duration, 3-30 W/g, 9.2 GHz) of equal average SAR. Results indicated that the inter-beat interval was decreased immediately by a single LPP or EHPP train in most cases. The effect was proportional to microwave heating, fully reversible, and easily reproducible. The magnitude and time course of EHPP and LPP- induced tachycardiac effects were always the same. Delayed and irreversible effects were not observed. The same tachycardiac effect could be repeated in a single preparation numerous times with no sign of adaptation, sensitization, long lasting functional alteration, or damage. A temporary arrest of pacemaker beating could be observed when microwave heating exceeded limits of physiological tolerance. This effect also did not depend on whether the critical temperature rise was produced by LPP or EHPP exposure. Therefore, it is concluded that no indications of EHPP specific effect on isolated frog heart slices was found within the study limits.
Extracellular population spikes of CA1 area of rat hippocampal slices were used to reveal possible modulation-specific effect of RFR on the neuron circuitry function. The brain slices were exposed to 9.2 GHz microwaves in a custom-made chamber filled with artificial cerebrospinal fluid at 35.5 °C. Stratum radiatum area of the slice was stimulated with a bipolar tungsten electrode at 30 s intervals, and population spikes (PS) were recorded with a glass electrode. Experiments began after 30- to 60-min stabilization. Each experiment included recording of the PS amplitude for 5 min before, 5 min during and 10 min after exposure. Each slice could be exposed up to three times; various regimens of RFR and sham exposures were alternated in random. The interval between sequential exposures was more than 15 min. Data for each exposure were analyzed as an independent experiment. In the first series of experiments, the modulation frequency was fixed at 16 Hz; the average SAR, peak SAR, and pulse duration were 0.06 - 7.2 W/g, 2.4 - 14.4 W/g and 1.55 to 31 ms, respectively. In the second series, pulsed or CW exposures were performed at the average SAR of 2.4 W/g. Repetition rates were 10, 100 and 1,000 Hz, while the peak SAR and duty cycle were kept constant, i.e., 12 W/g and 0.02. In the third series, CW and 10-Hz exposure regimens from the second series were repeated in order to validate a potential modulation-dependent RFR effect.
In all series, RFR-induced heating was directly proportional to the average SAR, up to 4 °C at 7.2 W/kg. These experiments established that various exposure regimens did not cause reproducible and statistically significant effect on the PS if the temperature during exposure did not exceed 36.5 °C. If the average SAR was high enough to exceed this temperature limit, irradiation caused decrease in PS amplitude. This effect was proportional to the average SAR and heating. Modulation frequency, peak power and duty cycle appeared to be of no
11

significance. Within the study limits, all proven effects could be adequately explained by microwave heating.
Relevant Publication / Presentation
• Pakhmov, A.G.; Mathur, S.P.; Belt, M.; and Murphy, M.R. [1999]: Dose dependencies in bioeffects of extremely high peak power microwave pulses. In: "Electromagnetic Fields: Biological Effects and Hygienic Standardization, (Proceedings of the International Meeting, may 18-22, 1998, Moscow, Russia)" Repacholi, M.H.; Rubtsova, N.B.; and Muc, A.M., eds., Geneva, Switzerland, World Health Orgnaization, pp. 325-334.
• Pakhomov, A.G.; and Murphy, M.R. [1999]: Low-intensity millimeter waves as a novel therapeutic modality. In: "Digest of Technical Papers, 12th IEEE International Pulsed Power Conference," pp. 23-28.
• Pakhomov, A.G.; Doyle, J.; Kiel, J.L.; and Murphy, M.R. [1999]: The role of peak and average power in microwave bioeffects in excitable tissue models. In: "Electromagnetic Fields and Human Health, Proceedings of the Second International Conference on Problems of Electromagnetic Safety and Human Health (Sept 20-24, 1999, Moscow, Russia), p. 330.
• Pakhomov, A.G.; and Murphy, M.R. [1999]: Low-intensity millimeter waves as a novel therapeutic modality. In: "Abstracts of the First International Symposium on Nonthermal Medical/Biological Treatments Using Electromagnetic Fields and Ionized Gases," p.21.
• Pakhomov, A.G.; Doyle, J.; Mathur, S.P.; Kiel, J.L.; and Murphy, M.R. [1999]: Search for specific physiological effects of extremely high power microwave pulses. In: "Abstracts of 21st Annual Meeting of the Bioelectromagnetics Society," pp. 200-201.
Pakhomov, A.G.; Mathur, S.P.; Akyel, Y.; Kiel, J.L.; and Murphy, M. R. [2000]: High- resolution microwave dosimetry in lossy media. In: "Radio Frequency Radiation Dosimetry," Klauenber, B.J., and Miklavcic, D. (ed.s.), Netherlands, Kluwer Academic Publishers, pp. 187-197.
Pakhomov, A.G.; Mathur, S.P.; Doyle, J.; Stuck, B.E.; Kiel, J.L.; and Murphy, M.R. [2000]: Comparative effects of extremely high power microwave pulses and a brief CW irradiation on pacemaker function in isolated frog heart slices. Bioelectromagnetics 21 (4): 245-254.
12

Pakhomov, A.; and Doyle, J. [2000]: Effect of pulsed microwaves on the population spike in rat hippocampal slices. In: "Millennium International Workshop on Biological Effects of Electromagnetic Fields Proceedings," Kostarakis, P.; and Starvroulakis, P. (ed.), pp. 480-485 (ISBN 960-86733-0-5).
Pakhomov, A.G.; Doyle, J.; and Mathur, S.P. [2000]: Combined effect of pulsed microwaves and glutamate superfusion on the population spike in rat hippocampal slices. In: "Abstracts of the 22nd Annual Meeting of the Bioelectromagnetics Society," pp.262-263.
Pakhomov, A.G., Doyle, J., Mathur, S., and Murphy, M.R. [2001]: Retaining of the long- term potentiation in hipocampal slices after high peak power microwave exposure and heating. In: "Abstracts of the Second International Symposium on Nonthermal Medical/Biological Treatments Using Electromagnetic Fields and Ionized Gases," May 21- 23, 2001.
Pakhomov, A.G., Doyle, J., Mathur, S., and Murphy, M.R. [2001]: Effects of extremely high power microwave pulses on the population spike and long-term potentiation in rat hippocampal slices. In: "Abstracts of the 23rd Annual Meeting of the Bioelectromagnetics Society," June 10-14,2001.
In Vitro Effect of Extremely High Peak Power Pulses on Cell growth
Exploring the dependence of a microwave bioeffect on SAR is a laborious process. Numerous experiments are needed to collect biological data after exposure at different SARs. P new technique has been designed to explore the SAR dependence of bioeffects in a single experiment. The technique utilizes the principle that SAR decreases exponentially with the distance from the surface. For example, SAR falls about 2 fold for every mm in agarose solidified cell culture medium and in 20 mm falls more than million folds (220). Agarose solidification prevents cell movements, mixing or settling during the exposure. Therefore, agarose gel-suspended cells can be exposed to a continuous spectrum of SARs in one exposure. After the exposure, dependence of microwave effect of SAR in exposed cells can be studied using available biological assays.
A system utilizes 9.3 GHz CW (1.3 W) and pulsed microwaves (0.5 p.s width, 250-270 kW peak 10 Hz repetition rate) was designed. The pulsed microwave was transmitted in a WR930 waveguide terminated via a sapphire matching plate into a custom-made exposure chamber. The chamber had a water jacket and was stabilized initially at 25 °C by circulating water from a water bath. One exposure and one control chamber were used. Agarose gels containing yeast (Saccharomyces cerevisiae BY4741) at 2 x 10⁶ cells/ml in YPD medium were
13

prepared in two plastic cuvettes (10x10x35 mm). The cuvettes were put in the exposure and control chambers and submerged into YPD broth. After 6 hour exposure, the exposed and control gels were sliced into 2-mm thick pieces in a plane perpendicular to the gel axis. The cell density in the slices was measured by nephelometry and expressed as the optical density (OD) at 600 nm. Changes in cell density was expressed as percentage changes in OD in relation to the average OD of slices from concurrent control
Local SAR values were calculated by analytical formula, by FDTD numerical simulation and also measured by microthermocouple technique. Along the gel long axis, the time-average SAR ranged from 2 W/g at 1 mm from the matching plate to 1 uW/g at 23 mm for both CW and pulsed exposure. The corresponding peak SAR was 390 kW/g at 1mm and 0.25 W/kg at 23 mm.
Both CW and pulsed irradiation for 6 hours induced significant temperature increases in the entire gel, with high at 40.7 °C and low at 27.5 °C. Eight CW and eight pulsed experiments were performed. Post-exposure OD ranged from 95 to 210 % of the control. The changes in OD correlated well with the temperature profile. The optimal temperature for yeast growth (34-35 °C) in the 4th slice correlated with highest OD (200-210 %). Slower growth at both higher (closer to the matching plate, 1 mm: 95-110 %) and lower temperature (away from the matching plate, decreased to 160 % in 4 slices) resulted in a lower OD or growth.
While pulsed and CW exposures produced exactly the same heating, an unusual OD variation in the 1st slice between CW (110.2 ±3.3 %) and pulsed (96.1 ± 7.6 %) exposures (mean ± S.E.) was noted. Due to large variability in OD, the difference was not statistically significant (p<0.1).
In summary, the use of gel-suspended cell culture proved to be a reliable and highly efficient technique. Current results are indicative of a specific effect of extremely high peak power pulses at peak power higher than 20-30 kW/g. To confirm the existence of this specific peak power effect, optimization of assay sensitivity or exposure configuration to increase spatial resolution along the long axis of gel will be needed.
Relevant Publication / presentation
• Pakhomov, A.G., Mathur, S., Gajsek, P., and Murphy, M.R. [2001]: Use of gel-suspended cell cultures for analysis of dose dependence of microwave bioeffects. Abstract submitted to the 5 International Congress of the European BioElectromagnetics Association (EBEA), September 6-8, 2001.
14

Pakhomov, A.G.; Gajsek, P.; Allen, L.; Stuck, B.E.; and Murphy, M.R. [2001]: Comparison of dose dependences for bioeffects of continuous-wave and high-peak power microwave emission using gel-suspended cell cultures. Bioelectromagnetics (pending).
Neurotoxic Effects of Radio Frequency Radiation
Evaluation of neurotoxic effects of radio frequency radiation can be approach in two
ways: RFR as a neurotoxin by itself and the permissible role of RFR in modifying (synergism)
toxic effects of other neurotoxins. A number of studies have demonstrated that low-intensity
millimeter waves (MMW) can affect the function of membrane and excitable tissues. These
effects include activation of Ca++ pump in sarcoplasmic reticulum of skeletal and heart muscles,
modified the activation characteristics of Ca++-activated K+ channel, suppression or facilitated
transmembrane chloride current, altered action potential conduction in isolated nerves and
cardiac pacemaker activity. A study was initiated to search for MMW effect on key processes of
inter-neuronal interaction on mono- and poly-synaptic transmission in the central nervous system
to further characterize the nature of RFR effect on neural transmission.
Isolated preparation of amphibian spinal cord was used as a model because this
preparation offers a unique combination of features that are essential for electrophysiological
studies in electromagnetic fields. It is particularly important that the afferent input and the
efferent out of the spinal cord are anatomically separated (dorsal and ventral roots, respectively).
For synaptic processes, recording and stimulating electrodes can be attached to distal ends of
roots, at distance from the cord itself. Hence, when the cord is exposed to RFR, the electrodes
can be shielded from the radiation, thus removing artifacts resulting from electrodes in the
electromagnetic fields. It has been established in this laboratory in isolated nerve preparation
that the RFR effect depended on frequency rather than on the intensity. Within the study limits
of MMW, 41.34 GHz was the most effective RFR. A 100 MHz deviation to either direction
decreased the effect twofold, and a 200 MHz deviation eliminated the effect. Therefore, in the
present study, a constant frequency of 41.34 GH, or various frequencies within 41.1-42.4 GHz
band.
Current results revealed that MMW irradiation at the incident power density of up to 3
mW/cm produced either a minor or no effect on synaptic transmission in the frog spinal cord.
When present, the MMW effect appears as mild modulation of synaptic transmission, not as
suppression or facilitation. MMW sensitivity appeared to vary between individual preparations
15

and/or depended on some uncontrolled and unidentified factors. Results of this study did not
support the hypothesis that synaptic transmission is a target for MMW bioeffects. There are still
additional synaptic processes (pre- and post-synaptic inhibition, gap junction transmission,
modifiability phenomena, etc.) that have never been studied in experiments with MMW
radiation. Further studies are needed to fully resolve the issues of MMW effects on synaptic
processes of central nervous system.
Military personnel can be subjected to a variety of environment factors in the
performance of duties. These environmental factors include toxic chemical compounds used as
pesticides, herbicides or nerve agents. Radio frequency radiation is an additional environmental
factor that is used extensively in military operations, such as communication, terrain navigation,
detection and tracking, fire control, jamming, interruption and killing of enemy electronic
devices. It can be said that modern battlefield maneuvers will not be effective without the use of
RFR. With sufficient intensities, RFR can cause physiological stress, psychological stress and
physical trauma. Chemical exposure, hypoxic condition, physical exertion and loss of blood can
result in tissue that increase the susceptibility or severity to RFR injury or vise versa. Warfighers
can encounter more than one of these environmental factors at the same time. Through
synergistic actions, these environmental factors can interact with each other concurrently to
aggravate neuronal injuries beyond the extent caused by each individual factor. The possibility
of interaction among these environmental factors cannot be ignored.
Common mechanism involved in various types of cell injury are production of reactive
oxygen species (oxidative stress), free radicals, and nitric oxide, increased intracellular calcium,
and membrane depolarization through NMDA glutamate receptors (excitotoxicity). RFR is also
known to cause oxidative stress, free radical production, and decreased cellular metabolism.
Neurotoxic injuries can also be enhanced indirectly by hypoxia caused by chemical exposure,
hypoxic conditions, physical exertion, and loss of blood. Under certain conditions, RFR can
compromise circulatory efficiency in cardiac output through decrease in heart rate and pulse
pressure and by a decrease in blood (tissue perfiision) pressure.
A neurodegenerative model in rats was achieved by 3-nitropropionic acid (3-NP)
administration (2 daily 10 mg/kg injections) to initial the processes of hypoxia, exitotoxicity and
oxidative stress. One hour after the last 3-NP injection, two pulsed microwave "doses" (1.25
GHz, 5.9 fxs, 10 Hz), 0.6 and 6 W/kg were used to evaluate the interaction between neurotoxin
and RFR. Endpoints are spontaneous activity, prepulse inhibition of acoustic startle), brain
histology and ultrastructure of the caudate putamen.
16

Interaction between RFR and 3-NP appears to be a complex function of time and RFR
specific absorption rate. Spontaneous activity was lower by 3-NP at 3.5 hours after the last
injection, but microwave exposure had no effect. Interaction between 3-NP and microwave on
the spontaneous activity was not significant. Spontaneous activity decreased at 1,2, and 3 weeks
after exposure independent of treatments, 3-NP and microwave or interaction between
treatments. Habituation appears to be the main cause. Histological examination of brain, liver,
heart, and lung at second day and 4-5 weeks after treatment showed no pathological evidence of
microwave or 3-NP induced injuries.
Alterations in prepulse inhibition of acoustic startle and ultrastructure of neurons at
caudate putamen were found. Shortly (3.5 hours) after administration, 3-NP appeared to offset
the effect of 6 W/kg microwave exposure on prepulse inhibition of acoustic startle. On the other
hand, a synergistic effect on prepulse inhibition of acoustic startle was noted between 3-NP and
0.6 W/kg microwave exposure. Increased intracisternal width of rough endoplasmic reticulum
and the thickening of nuclear envelope were the ultrastructural alterations of neurons at the
caudate putamen. Both alterations could be induced by 3-NP and 6 W/kg but not the 0.6 W/kg
microwave exposure. A possible synergistic effect between 3-NP and 6 W/kg microwave
exposure was noted. At 3 weeks after exposure, reduction in prepulse inhibition was prevented
in animals received 3-NP and 0.6 or 6 W/kg microwave exposure. Ultrastructure of neurons at
caudate putamen is presently in progress.
Additional RFR neuotroxicity testing was tested in rats. Y-maze was used to evaluate memory consolidation as an endpoint. The RFR exposure in a circularly polarized waveguide exposure system was 2.45 GHz continuous wave (CW) microwave at 0, 0.39, 3.85 and 6.37 W/kg for 30 minutes. Twenty-four hours after exposure, Y-maze performance was evaluated. The increased number of errors made by rats during Y-maze test was equivocal with possible increased number of errors in rats exposed at 3.85 W/kg but not at 0.39 and 6.37 W/kg. On the other hand, the average time per arm entry during Y-maze test decreased significantly in a "dose" related fashion. Decrease time per arm entry can be interpreted as a decrease in cautiousness or an increase in boldness of rats' behavior after exposure to RFR. These effects should be further explored.
Relevant Publication / Presentation
• Akyel, Y.; Lu, S-T.; Mathur, S.P.; and Doyle, J. [1999]: Dose-response Characteristics of Microwave-induced Disturbance on foraging patterns in rats. In: "Abstracts of the 21st
Annual Meeting of the Bioelectromagnetics Society," pp. 24-25.
17

•
•
•
Brewer, P.A., Mery, L.R., Phelix, C.F., and Seaman, R.L. [2001]: Monoamine oxidase inhibition enhances ultrastructural changes in rat striatal neurons after single systemic injection of 3-nitropropionic acid. Abstract submitted to the 31st Annual Meeting of the Society for Neuroscience, November 10-15, 2001. Mery, L.R.; Phelix, C.F.; Wayner, M.J.; and Seaman, R.L. [2000]: Ultrastructure changes in rat striatal neurons after single systemic injection of 3-nitropropionic acid. In: "Abstracts of 30th Annual Meeting of Society for Neuroscience Meeting," p. 1876.
Pakhomov, A.G.; Prol, H.K.I Mathur, S.P.; and Akyel, Y. [1999]: Search for the effect of millimeter waves on synaptic processes in the central nervous system. In: "Electricity and Magnetism in Biology and Medicine," Bersani, F. ed., Kluwer Academic/Plenum Publishers, pp. 971-974.
Seaman, R.L.; and Wohlfeld, B.J. [1999]: Activity and acoustic startle prepulse inhibition 3-4 hr after 3-nitropropionic acid injection. In: "Abstracts of the 1999 Annual Meeting of the Experimental Biology Society."
Seaman, R.L.; Phelix, C.F.; Bruno, J.G.; Kalns, J.E.; Dick, E.J.Jr.; Wohlfeld, B.J.; and Kiel, J.L. [1999]: Exploration of a neurodegeneration model for use in microwave studies. In: "Abstracts of the 21st Annual Meeting of the Bioelectromagnetics Society," pp. 209-210.
Seaman, R.L.; Belt, ML.; Doyle, J.M.; and Mathur, S.P [1999]: Hyperactivity caused by a nitric oxide synthase inhibitor is countered by ultra-wideband pulses. Bioelectromagnetics. 20:431-439.
Seaman, R. [2000]: Effects of acute systemic 3-nitropropionic acid administration on rat activity and acoustic startle. Neuroscience Letters 280:183-186.
Seaman, R.L.; Mathur, S.P.; Dick, E. J.Jr.; and Gonzalez, M.Y. [2000]: Effects of microwave exposure and 3-nitropropionic acid on rat activity, acoustic startle, and brian histology. In: "Abstracts of 22nd Annual Meeting of the Bioelectromagnetics Society," p. 285-286.
Seaman, R.L.; Mathur, S.P.; and Dick, E.J.Jr. [2001]: Effects of pulsed microwaves and toxin-induced hypoxia on rat motor activity, acoustic startle, and brain histology. Bioelectromagnetics (Pending).
Seaman, R.L., Mathur, S.P., Phinney, A.M., and Harris, N.R. [2001]: Interaction between a neurotoxin and pulsed microwaves. In: Abstracts of 23rd Annual Meeting of the Bioelectromagnetics Society, June 10-14, 2001.
18

Seaman, R.L., and Phelix, C.F. [2001]: Changes in ultrastructure of rat caudate-putamen neurons with a neurotoxin and exposure to pulsed microwaves. Abstract submitted to 5th
International Congress of the European BioElectromagnetics Association (EBEA), September 6-8, 2001.
Seaman, R.L., and Phelix, C.F. [2001]: Acute changes in rat caudate-putamen neuronal ultrastructure due to 3-nitropropionic acid and microwave exposure are not reflected in behavior. Abstract submitted to the 31st Annual Meeting of the Society for Neuroscience, November 10-15, 2001.
19

BIOLOGICAL HAZARDS OF ULTRA WIDE BAND (UWB) RADIATION ON CARDIOVASCULAR SYSTEM AND OTHER CELLULAR SYSTEMS
Cardiovascular Effects
The aim of this research is to evaluate the cardiovascular effects of Ultra-Wide-Band (UWB) pulses, a new modality in radar technology. Additional studies has been performed since the initial finding of an UWB-induced delayed hypotension (decrease in arterial blood pressure) [Lu et al 1999b, 1999c], Dose-response characteristics were clearly evident. Delayed hypotension could be induced by a 6 minutes exposure to 1 ns UWB pulses at 85 to 95 kV/m peak electric fields. Hypotension could be induced at 1,000 Hz (1.89 mW/cm2, 0.12 W/kg average) and 500 Hz (1.06 mW/cm2, 0.065 W/kg average) but not at 250 Hz (0.61 mW/cm2, 0.038 W/kg average) and 125 Hz (0.28 mW/cm2, 0.017 W/kg). Figure 1, 2, and 3 showed the delayed development of this UWB-induced hypotension and its dose response characteristics. Surprisingly, the heart rate did not change significantly due to its larger variations (Fig. 4).
Several important features of this UWB-induced hypotension deserve attention. They were:
• Delay and persistent nature of the effect indicated that it is not an immediate physiological adjustment to the exposure,
• Threshold (0.065-0.12 W/kg) is at or below the current personnel protection guidelines specified as peak electric filed (100 kV/m) or specific absorption rate (0.4 W/kg in a controlled environment and 0.08 W/kg in an uncontrolled environment),
• The effect is not thermal in nature since the estimated core body temperature was less than 0.012 °C, and
• The effect may have health implications such as headache, fainting, fatigue and decreased performance or a novel therapeutic modality for hypertension if associated symptoms with hypotension are absent or minimal.
Apparently, the hypotensive effect did not occur as a result of exposure to a narrow-band (2.45 GHz) continuous wave (CW) exposure at higher "doses", 30 minutes exposure to 0.21, 3.20, and 6.59 W/kg [Lu et al, 2000a, 2000b]. Twenty-four hours after treatment, these CW exposures did not cause a degradation in physical endurance under a high threat and highly motivated testing protocol [Lu et al. 2000a, 2000b]. Decreased performance due to hypotension cannot be resolved since endurance was not tested at 2 weeks after exposure and also due to an absence of induced hypotension. Further research is needed to resolve the role of UWB-induced hypotension on physical endurance.
20

^m SHAM (15) ^M 125 Hz (5) 250 Hz (5) 171.2
^ 166.2
X g 161.2
E, W 156.2 cc ID CO 151.2 CO UJ EC 146.2 D. _J < 141.2 or in £ 136.2
< O 131.2 _l o H 126.2 CO
W 121.2
116.2
500 Hz (10) 1,000 Hz (10)
0.14 1.48 1.97 2.08 5.07* 4.48* 3.74* 4.18*
* p< 0.05 by ANOVA, F(440)
* P< 0.05 by Dunnett's Test
PRE 0.75 H 24 H 72 H 1 WK 2 WK 3 WK 4 WK
Figure 1. Systolic Pressure
^M SHAM (15) ^m 125 Hz (5) 250 Hz (5) ^ffl500Hz(10) 1,000 Hz (10) 138.6
133.6
X E 128.6
UJ CÜ Z> 123.6 W CO UJ ^ 118.6
_l <
g] 113.6
< z 108.6 < UJ
103.6
98.6
0.21 1.90 1.95 3.57* 6.46* 4.30* 5.20* 4.34*
p< 0.05 by ANOVA, F(4 40)
1
P< 0.05 by Dunnett Test
. PRE 0.75 H 24 H 72 H 1 WK 2 WK 3 WK 4 WK
Figure 2. Mean Arterial Pressure
21

H SHAM (15) ^1 125 Hz (5) 250 Hz (5) 500 Hz (10) 1,000 Hz (10) 138.6
133.6 CO X E E. Lil
D (0 CO LU or a. _i < LU H
<
< iii
128.6
123.6
118.6
113.6
108.6
103.6
98.6
0.21 1.90 1.95 3.57* 6.46* 4.30* 5.20* 4.34*
p< 0.05 by ANOVA, F(4 40)
v P< 0.05 by Dunnett Test
PRF n 7R H OA H 7? H 1 \A/K 9 \A/K 3 \A/K 4 \A/K
Figure 3. Diastolic Pressure
3 C
368.7
358.7
348.7
WM SHAM (15) ^ 125 Hz (5) ^M 250 Hz (5) ^M 500 Hz (10) ^M 1,000 Hz (10)
Q. J2 338.7 CO <u .£_ Ill I- < a: I-
< LU x
328.7
318.7
308.7
298.7 PRE 0.75 H 24 H 72 H
Figure 4. Heart Rate 1 WK 2WK 3WK 4WK
22

A double blind, abbreviated replication study was subsequently performed. Data analysis is completed. The following plots (Fig. 5, 6, 7 and 8) include results from the original series (left panel) and from the replication study (right panel). Baseline drift prevented a complete success in replication. Holder acclimation in the replication study appeared to be inadequate. This was clearly shown in the baseline systolic pressures between two series. In the replication study, rats showed significant reduction in systolic pressure from those of sham-exposed rats in Faraday cage (controls) at 0.3 hr and 2 weeks after exposure. Reduction in mean arterial pressure was observed at 0.3 hr after exposure. Changes in diastolic pressure was inconclusive because a low baseline. Decreases in heart rate at 0.3 hr after UWB exposure appeared to be contributed by increased heart rate in rats exposed in Faraday cage (controls). Overall, rats exposed to UWB appeared to maintain a lower blood pressure. It was also apparent that the time points selected in the replication study were biased toward no effect, i.e., effect was expected at only one (2 weeks post exposure) of the four time points. A more balanced design and resolving baseline drift are essential in future studies.
190
^, 180
X
| 170
LU OH ■=> 160 to CO LU
£ 150 o _l O 140 h- C/3
W 130
120
SHAM (15), ORIGINAL STUDY
500 Hz (10), ORIGINAL STUDY
S FILED SHAM (14), REPLICATION STUDY
500 Hz (14), REPLICATION STUDY
▼ P< 0.05
TIME, Fpe4)= 5.27; P< 0.01
INTERACTION, F^p 3.43; P< 0.01
#^ol^ 7^ ^
Figure 5. Systolic Pressure of Rats in the Replicate Study
23

145
c» 140 I E E
135 "—•* ill a: 130 3
125 LU
a. 120 _J < 115 or UJ H 110 a: < 7 105 < III ^ 100
95
SHAM (15), ORIGINAL STUDY
500 Hz (10), ORIGINAL STUDY
S FILED SHAM (14), REPLICATION STUDY
500 Hz (14), REPLICATION STUDY
▼ P< 0.05
I
TIME, Fp£M|= 4.58; P< 0.01
INTERACTION, F^p 1.87; P< 0.05
#^0^ %^ ^ ^ ^ 0=3 %^ß> %^
Figure 6. Mean Arterial Pressure in the Replicate Study
125
_ 120 'S X E 115 E
g 110 V) [2 105
D. O 100
< a
95
90 -
85
SHAM (15), ORIGINAL STUDY
M 500 Hz (10), ORIGINAL STUDY
FILED SHAM (14), REPLICATION STUDY
500 Hz (14), REPLICATION STUDY
V P<0.05
TREATMENT, F(184|= 6.22; P< 0.05
INTERACTION, F&m)= 1.74; P< 0.05
#^o3^ ^^ ^ & >V^ .aY& nL>& o^> a^
Figure 7. Diastolic Pressure of Rats in the Replicate Study
24

380
370
360
I. 350
W 340 < a:
330
Lu 320 X
310
300
290
SHAM (15), ORIGINAL STUDY
500 Hz (10), ORIGINAL STUDY
FILED SHAM (14), REPLICATION STUDY
500 Hz (14), REPLICATION STUDY
TREATMENT, F(w= 7.82; P< 0.01
INTERACTION, Fp381|= 0.94; N.S.
P< 0.05
#^ ^ %^ n^
Figure 8. Heart Rate of Rats in the Replicate Study
Relevant Publication / presentation
• Lu, S.-T.; Akyel, Y.; and Mathur, S.P. [1999a]: A potential low dose 2.45 GHz CW-induced Hypotension in Rats. In: "Abstracts of the 21st Annual Meeting of the Bioelectromagnetic Society", pp. 122-123.
• Lu, S.-T.; Mathur, S.P.; Akyel, Y.; and Lee, J.C. [1999b]: Ultra-wideband electromagnetic pulses induced hypotension in rats. Physiol. Behav. 65(4/5): 753-761.
• Lu, S.-T.; Mathur, S.P.; Akyel, Y.; and Lee, J.C. [1999c]: Erratum: Ultra-wideband electromagnetic pulses induced hypotension in rats. Physiol. Behav. 67(3): 463.
• Lu, S.-T.; Mathur, S.P.; and Akyel, Y. [2000a]: Absence of effects of 2.45 GHz microwaves on physical endurance, motivational levels and cardiovascular functions. In: "Millennium International Workshop on Biological Effects of Electromagnetic Fields Proceedings", Kostarakis, P.; and Stavroulakis, P. (eds.), pp. 491-496 (ISBN 960-86733-0-5).
• Lu, S.-T.; Mathur, S.P.; and Akyel, Y. [2000b]: Effects of 2.45 GHz CW microwave on physical endurance and motivational levels in rats. In: "Abstracts of the 22nd Annual Meeting of the Bioelectromagnetics Society," p.281.
• Lu, S.-T. [2001]: Potential application of UWB pulses in lowering blood pressure. In: "Abstracts of the 2001 Asia-Pacific Radio Science Conference", August 1-4, 2001.
25

Genotoxic Effect of UWB Pulses
A widely accepted in vivo test system, rodent micronuclei assay, for detecting genotoxic agents was used to assess the genotoxic potential of the UWB pulses. CF-1 mice were exposed for 15 minutes to 600 Hz UWB pulses at 91-103 kV/m peak electric field intensity, 0.92-0.97 ns pulse duration and 147-166 ps rise time. The presence of micronuclei in polychromatic erythrocytes in bone marrow and peripheral blood was determined at 18 and 24 hours after exposure. In addition, positive controls were used. As a positive control, mice were injected intraperitoneally with mytomycin C (1 mg/kg body weight) 18 and 24 hours before sacrifice for determination of the presence of micronuclei in the bone marrow and peripheral blood. Decreased polychromatic erythrocyte and increased presence of micronuclei were noted in mytomycin positive control. However, there is no evidence for excess genotoxicity in peripheral blood or bone marrow cells of mice exposed to UWB pulses under the present experimental condition.
Relevant Publication / Presentation
• Vijayalaxmi, Seaman, R.L; Belt, Ml.; Doyle, J.M.; Mathur, S.P.; and Prihode, T.J. [1999]: Frequency of micronuclei in the blood and bone marrow cells of mice exposed to ultra- wideband electromagnetic Radiation. Int. J. Radiat. Biol. 75(1): 115-120.
• Vijayalaxmi; and Seaman. R.L. [1999]: Micronuclei in the peripheral blood and bone marrow cells of mice exposed to ultra-wideband electromagnetic radiation. In: "Abstracts of the 21st Annual Meeting of the Bioelectromagnetics Society," p. 214.
Interaction Between Nitric Oxide Synthase Inhibitor and Exposure to UWB Pulses
In a past study on the effects of UWB pulses (600 Hz, 105 kV/m peak electric field intensity, 165 ps rise time, 0.97 ns pulse duration) in CF-1 mice, it was found that 15, 30 and 45 min exposures tend to increase morphine-induced analgesia and hypoactivity. Nitric oxide is involved in normal nociception. Nitric oxide synthase inhibitor such as NG-nitro-L-arginine methyl ester (L-NAME) is known to enhanced opioid induced analgesia and hypoactivity. Thus, nitric oxide has been implied in modulation of the opioid-induced analgesia and locomotion. It was hypothesized that subtle effects of UWB pulses could change the effects of L-NAME on nociception and motor activity.
26

The hypothesis was tested in CF-1 mice injected with 50 mg/kg L-NMAE and subjected to 30 min UWB exposure. The pulse parameters were 102 kV/m peak electric field intensity, 160 ps rise time, 0.90 ns pulse width and 600 Hz pulse repetition rate. The estimated whole- body averaged specific absorption rate was 0.037 W/kg. Animals were tested for thermal nociception response on the surface maintained at 50 °C and for spontaneous locomotor activity for 5 min. As expected, L-NAME increased spontaneous locomotor activity and nociception threshold indicated by lengthening of the response latencies. The L-NAME induced hyperactivity was absent after UWB exposure. The UWB exposure had no effect on increased nociception threshold induced by L-NAME. Reduction and cancellation of effect of L-NAME on spontaneous locomotor activity suggests activation of counteracting mechanism by the UWB pulses. The possible mechanism includes increase of nitric oxide production by nitric oxide synthase.
Relevant Publication / Presentation
• Seaman, R.L.; Belt, M.L.; Doyle, J.M.; and Mathur, S.P. [1999]: Hyperactivity caused by a nitric oxide synthase inhibitor is countered by ultr-wideband pulses. Bioelectromagnetics 20: 431-439.
27

FINITE DIFFERENCE TIME DOMAIN (FDTD) TECHNIQUES TO PERFORM DOSIMETRY IN BIOLOGICAL TISSUES FOR HIGH PEAK POWER RFR AND UWB EXPOSURES
Due to its short pulse duration and short duty cycle, Ultra-Wide-Band (UWB) dosimetry in biological tissues creates a unique problem in the radio frequency radiation bioeffect research. In comparison to studies using narrow-band RFR, the averaged exposure intensity of the UWB is relatively low, frequently in the range of less than 2 mW/cm2. Conventional indirect dosimetry methods, such as thermometry and calorimetry lack the sensitivity to determine specific absorption rate. Lack of appropriate tissue electric field measuring device prevents investigators from measuring the internal E-field. A method of estimating SAR from UWB pulses has been devised from the integration of the entire power spectrum of the UWB pulse and the SAR spectrum of an appropriate spheroid. However, validity of the estimation procedure has not been verified. Mathematical modeling can be used to estimate the field experienced by an object. Knowing the electrical properties of the object being tested, one can then estimated the SAR experienced by the object. The finite difference time domain (FDTD) method is widely used in tissue dosimetry of RFR. However there is very little experimental data to validate FDTD modeling results.
The electromagnetic interaction produced inside a Gigahertz Transverse Electromagnetic Cell (GTEM), the UWB exposure system currently in use for biological effects of UWB pulses, can be analyzed using numerical modeling methods. Although the field characteristics can be measured in an empty GTEM cell, once an object is placed in the GTEM cell, the field is disturbed and it is no longer easy to know or even measure the field experienced by the object. Similar validation for application of the FDTD modeling is also required.
A general mathematical model that can be used to estimate the electrical field in a large class of TEM cells is developed. An excitation plane was used to simulate the input to the GTEM cell and FDTD method was then used to calculate the field anywhere and anytime inside the cell. This is first documented use of FDTD to model an UWB exposure system. The model was tested on the simple (square) NBC cell and on a flared GTEM cell. The results have been acceptable in all cases. The effort has laid the foundation for further research. Future improvements to the modeling of relative small objects placed in the cell. When accomplished, the method will have increased the scope and capability of electromagnetic compatibility and dosimetry research.
Empirical methods for characterizing absorption of RFR in biological specimen have limits and require considerable expertise and labor intensive. For this reason, dosimetry modeling has become an important tool in RFR bioeffects research. As indicated earlier, validation of the FDTD modeling of RFR absorption is required. Efforts have been made to
28

validate FDTD predictions using rhesus monkey carcasses. A thermometric method was used to determine SARs empirically in these carcasses. Four inline RFR transparent fluorooptic probes, a total of 16 sensors were used to track temperature changes in the base of brain, cerebral cortex, spinal cord and neck muscle at 800 and 500 MHz using two transmitter/horn antenna combinations. The rate of temperature change during the microwave exposure corrected by the rate of temperature changes before and after exposure was converted to SARs and compared to the results of a FDTD estimation of a monkey model constructed with various tissue types. Overall measured SARs agreed reasonably well with calculated values approximated by FDTD predictions. However, clear differences between two transmitters and among carcasses. Validation of FDTD by empirical measurements using simple model is currently underway.
Relevant Publication / Presentation
• Samn S.; and Mathur, S. [1999]: A mathematical model of gigahertz transverse electromagnetic cell, I. Brooks Air Force Base, U.S.A.F. Research Laboratory, Technical Report AFRL-HE-BR-TR-1999-0219.
• Ziriax, J.M.; Lu, S.-T.; Mathur, S.; Cox, D.; Henry, P.; Kosub, K.; Garay, R; Hurt, W.; and D' Andrea, J. [2000]: Verifying FD-TD Predictions with Thermometry Measurements. In: "Abstracts of the 22nd Annual Meeting of the Bioelectromagnetics Society," pp.202-203.
• Ziriax, J.M., D'Andrea, J.A., Lu, S.-T., Mathur, S., and Cox, D. [2001]: Verifying electromagnetic Dosimetry. In: "Abstracts of 2001 Asia-Pacific Radio Science Conference," August 1-4, 2001.
29

CONCEPT PAPER TO IDENTIFY STRATEGIES TO CAPTURE THE EPIDEMIOLOGY OF MICROWAVE EXPOSURE
TO ARMY PERSONNEL AND THE IMPLICATION TO MILITARY PERFORMANCE
The staff scientists in the Microwave Bioeffects Branch have made extraordinary accomplishment toward concept paper to identify strategies to capture the epidemiology of microwave exposure to army personnel and the implication to military performance. These achievements can best be viewed by the number concept paper published and listed in the Relevant Publication / Presentation at the end of this section. Briefly, concept paper on personnel protection standards, behavioral effect, controversies regarding "non-thermal" effects, on biological studies in Russia and the former Soviet Union, biological effects of high peak power radio frequency pulses, and the Army's contribution in RFR biological effects research. A synopsis of these publications with contemporary thinking of other scientists will be included. Readers are encouraged to consult relevant publication for appropriate topic of interest.
Personnel protection guidelines and standards have been reviewed by one of our staff member as a co-author [Gajsek el al. 2001]. It is well known that the RFR personnel protection guidelines (standards), now in effect in Eastern European countries, are much lower than those in the U.S. and other Western countries. The U.S. and Western RFR standards are based on established acute biological effects that could be considered as an adverse effect. The frequency dependent whole-body averaged specific absorption rate ("dose rate" in toxicology) could not account for frequency or modulation specific effects or effects caused by partial body RFR exposure. On the other hand, Eastern European standards are derived to protect personnel from potential non-thermal effects caused by chronic exposure to very low intensities, where a "power load", the product of field intensity and duration of exposure (i.e., "dose" in toxicology). Most Eastern European experts are aware that their standards are based on unconvincing research evidence that requires more precise specifications and improvements. The limiting values of any standard at each point in time reflect the level of contemporary knowledge of biological effects and methodologies. The historical evolution of U.S. volunteer guidelines represents the importance of research and knowledge in setting the RFR standards. RFR standards are based on theoretical estimates, extrapolations and judgement from experimental data to human implications. Part of controversies is undoubtedly evolved from for absolute assurance and proof of safety.
One of the major controversies is "thermal versus non-thermal" biological effects of RFR which was reviewed by one of our staff members [de Lorge 2000a]. The conventional definition of "non-thermal effect" is an effect caused by an amount of RFR energy failing to produce a detectable rise in an organism's temperature. This definition ignores the physiological process allowing an organism to be able to compensate for RFR energy deposition. Failure of detecting
30

a rise in an organism's core body temperature frequently is not a proof of temperature rise elsewhere in the organism's body. An example of this is the microwave evoked body movements in absence of changes in core body temperature due to localized microwave exposure. However, a minimum of 1.2 °C change in skin temperature was noted at the absolute threshold for the microwave evoked body movements. Non-thermal biological effects of RFR are difficult to investigate for several reasons including:
• Absorbed energy is hard to measure, • Biological endpoints are not well described, • Target organs have not been identified, • Definitions of non-thermal effects vary from on publication to another, • Consistent results are lacking, and • Lack of convincing theory to explain the mechanism of effect.
Radio Frequency in sufficient intensity is known to cause lethality, burn, and disturbances of normal functions or disruption of normal structure in virtually every organ system including central nervous system. In addressing the health and safety issues of the RFR and in an effort to coordinate worldwide research on biological effects of RFR, Rapacholi [Bioelectromagnetics 19: 1-19, 1998] of the World Health Organization summarized the needs of additional research in the following area:
• In vitro • Cell kinetics and proliferation effects; • Effects on genes; • Effects on signal transduction and alterations in membrane structure and functions; • Biophysical and biochemical mechanisms for effects of RFR;
• In Vivo • Cancer promotion, co-promotion, progression, and synergistic effects; • Genotoxic, immunological and carcinogenic effects of chronic low-level exposure to
RFR; • Effects on the central nervous system; • Melatonin synthesis; • Permeability of the blood-brain barrier • Reactions to neurotropic drugs. • Structure and functions of the eye;
• Epidemiological studies • Incidence of various cancer; • Headaches;
31

• Sleep disturbance; • Other subjective effects; • Adverse pregnancy outcome; and • Ocular pathologies.
Recent interest in biological effect RFR in the civilian sector is undoubtedly generated by popularity and proliferated use of cellular (mobile) telephones and sensation aroused by lawsuits. Just during the past year (August 2000), a Maryland neurologist is suing for 800 millions claiming that RFR from his cellular telephone is responsible for his malignant brain tumor. Two recent epidemiological studies [Muscat et al. JAMA 284: 3001-3007, 2000; Hardell et al. Med. Gen. Med. May 4: E2, 2000] did not find an overall increase in risk of brain tumor associated with cellular phone use. However, both of these studies indicated an increased risk of brain tumor with the side of brain that cases held their cell phones (so does the wire telephone use in one of the studies!). Because RFR is widely used by the general population, a large case-control study (3,000 cases and 3,000 controls) coordinated by the International Agency for Research on Cancer is in progress. Results of this study and other ongoing studies (at least four other epidemiological studies) will not be forthcoming in several years. Major difficulties in epidemiology are the uncertainties in exposure history and determination of which of the exposure metrics is responsible for the causation. Research in the laboratory setting can usually resolve these difficulties in dosimetry.
The extent of public concern on health and safety aspects of cellular telephone is evident by the number of studies completed and ongoing. Swicord compiled the statistics of current mobile telephone related studies 83 completed and 54 ongoing cancer relevant or related studies and 76 completed and 61 ongoing non-cancer studies (Swidord's presentation can be viewed at WEB site: http://www.sciencefags.com/database^oard/download/FMKSHD0038.pdf).
Additional difficulty in characterizing the biological effects of RFR is that in contrast to chemical toxin, RFR does not have a target organ or organs. Thus, a disease entity caused by RFR is virtually similar to disease occurred spontaneously. RFR may also interact with a known disease process. Best example of this permissible role of RFR in disease process can be viewed by the use of low-intensity millimeter waves (MMW) as a therapeutic modality. One of staff members has reviewed the therapeutic utilization of low-intensity millimeter waves [Pakahomov and Murphy 2000a].
The effects of MMW often have a sharp, resonance-like dependence on the radiation frequency, but relatively little on the radiation intensity. A brief, low intensity MMW exposure can change cell growth and proliferation rates, activity of enzymes, state of cell genetic apparatus, function of excitable membranes and peripheral receptors. It can alleviate stress reactions, stimulate tissue repair and regeneration. In other words, not all the biological effects
32

of RFR can be equate to health hazards. Careful examination and review are required to place an effect of RFR in its perspectives, injury or benefit.
Because of different modulation characteristics and frequencies, high average power of RFR devices, and high peak and low average power devices in military environments, the knowledge obtained in mobile telephone studies may not directly applicable to military operations. The only solution in relevancy is to perform independent and complementary research relevant to RFR used in the military environment. Biological effects of pulse modulation has been reviewed by our staff members on research performed in Russia and the former Soviet Union (FSU) [Pakhomov and Murphy 2000b], and in the U.S. and Western countries [Lu and de Lorge 2000].
Analysis of biological effects and health implications of high peak power RFR is a complicated endeavor by itself. The task is further compounded by the recent developments in methods of generating RF pulses by shifting from narrow-band pulses to carrierless pulses. Conventional radar is operated in a narrow band mode in which the fractional bandwidth is less 1 % of the center (carrier) frequency. In carrierless RF pulses, the frequency domain of the pulse can span from DC to GHz that creates new challenges in dosimetry and in the potential mode of interactions between carrierless pulses and biological materials. Recent developments in AMT antenna, SUOSUS and COMWIN systems exceed the coverage of current personnel protection guidelines by bringing antenna(s) close in contact with the body surface (body-born). Also these new communication systems intends to use multiple RFR frequencies. These developments bring out the least studied areas of biological effects of RFR, i.e., effects of partial body RFR exposure and multi-frequency exposure.
It can be concluded that Russian/FSU studies constitute an important source of information on biological effects of pulsed RFR. Emphasis in these studies was given to RF- induced changes in the nervous system function. Such issues as RF-induced carcinogenesis apparently have not been a concern and were not studied at all. Manny (perhaps, most) of the studies were flawed, a number of good-quality studies have convincingly demonstrated significant biological effects of pulsed RFR. Modulation often was the factor that determined the biological response to RF irradiation. Reactions to pulsed and CW emissions at equal time- averaged intensities in many cases were substantially different. These results showed that biological effects of pulsed RF may involve some specific mechanisms of interaction, which are not understood yet. Most reported biological effects of low-intensity pulsed microwaves were just subtle functional changes, which did not exceed the limits of normal physiological variation and could only be detected by sensitive physiological tests. However, some studies did report pathogenic effects. An independent confirmation of these findings would be of principle importance for understanding health hazards from RF exposure and development of safety standards.
33

A single RF pulse lasting from microseconds to seconds with adequate pulse energy is known to cause drastic acute biological effects. Examples in descending order of pulse energy are brain enzyme denaturation, stun and seizure, pain, decreased spontaneous activity and acetylcholine concentration, microwave induced whole-body movements, thermal sensation, startle modification and microwave hearing. The first four effects are associated with significant bulk heating indicated by 2 °C or more increase in body temperature. On the other hand, none of the last four effects requires a significant bulk heating. They can be caused by administration of a single pulse incapable of imparting adequate energy to cause an elevation in core temperature of animals. However, whole-body movements can be evoked by a single pulse that results in 0.2 to 2 °C increase in subcutaneous temperature. On the other hand, a thermal sensation is elicited by partial body exposure in which less than 0.1 °C increase in cutaneous temperature is noted. Startle modification and microwave hearing are produced by a pulse that is barely capable of transferring enough energy to cause less than a 10"3 or 10"4 °C increase in tissue temperature of animals. The mechanism of action is not clear in startle modification and microwave induced whole-body movements. However, the mechanism of action is well established in the microwave auditory effect in which the cranial pressure wave created by thermoelastic expansion associated with a RF pulse is sensed by hair cells of the cochlear. The activation of thermoreceptors is undoubtedly involved in thermosensation. Both startle modification and microwave induced whole-body movements appear to be reflex reactions that require receptor, reflex center and effectors. In other words, these last four effects are originated from activation of specialized nerve endings, mechanisms of which have not yet been adequately investigated.
The threshold of a single pulse effect appears to have a critical duration. For an exposure period shorter than the critical duration, the threshold must be dependent on specific absorption and the threshold depends on specific absorption rate if the exposure duration is longer than the critical duration. Examples can be found in microwave hearing and microwave induced whole body movements.
It has been proposed that high peak power pulses may have specific effects differing from those caused by a CW radiation. In addition, pulse modulation has been suspected to cause enhancement of a given biological effect than the same one by CW radiation of equivalent average SAR. Microwave hearing can be considered to be specific to pulse modulation since it would not occur without the RF modulated pulse or pulses. On the other hand, pulse enhancement is not established reliably since many studies have failed to demonstrate its importance. Later studies aimed at comparing effectiveness of an induced biological effect between pulsed and CW RFs (duty factor > 10"4 or ratio of peak to average power < 104) usually failed to confirm the earlier reports that indicated the existence of pulse enhancement. However, studies have not been done to confirm or deny the enhancement effect of pulse modulation on injury of corneal endothelium, brain cholinergic activity, and possibly on consolidation of working memory. A variety of behavioral effects have been observed in experiments employing
34

"TEMPO" pulses. On the other hand, well-trained behaviors are resistant to alteration by "TEMPO" pulses.
A concrete conclusion regarding biological effects of carrierless RF is, at most, tentative because of the limited number of studies. The carrierless RF includes electromagnetic pulse (EMP) and ultra-wide-band (UWB) pulses. Although unconfirmed, a single EMP pulse with a peak electric field several hundred kV/m might interfere with the ability of animals to run a maze. Other than that report, most studies indicate no observable effect with EMP pulses with peak electric field less than 100 kV/m. Studies of biological effects of UWB pulses have begun to reveal the existence of UWB bioactivity at peak electric field intensity around 100 kV/m. Because of health and medical implications, UWB-induced hypotension needs to be independently confirmed and the dose-response characteristics further explored.
It is fairly clear that biological effects of pulsed RFR involve nervous system, central and peripheral, and its end-organ functions. Behavior is a final common expression of virtually all the physiological processes with perhaps, the exception of disease, and even that endpoint is often initially expressed as a behavioral response. Results of behavioral experiments also form the decision bases of exposure standards in place of most countries [de Lorge 2000b]. If low level RF radiation produces adverse health effects, behavioral changes will continue to be the first to be observed. Since cognitive and innate behaviors appear to be more sensitive to disturbance caused by RFR, it is essential to incorporate these types of endpoints in the study neural effects of RFR.
Relevant Publication / Presentation
• de Lorge, J. [2000a]: Non-thermal bioeffects of radio frequency radiation: What are they? In: "Millennium International Workshop on Biological Effects of Electromagnetic Fields Proceedings", Kostarakis, P., and Stavroulakis, P. (eds.), pp. 342-346 (ISBN 960-86733-0-5).
• de Lorge, J. [2000b]: Contemporary research on the behavioral effects of radio frequency radiation. In: "Radio Frequency Radiation Dosimetry", Klauenberg, B.J., and Miklavcic, D. (eds.), Netherlands, Kluwer Academic Publishers, pp. 403-407.
• Gajsek, P., Pakhomov, A.G., and Klauenberg, B.J. [2001]: Electromagnetic field standards in central and eastern european countries: current state, and stipulations for international harmonization. Health Physics (in press)
35

Lu, S.-T.; and de Lorge, J. [2000]: Biological effects of high peak power radiofrequency pulses. In: "Advances in Electromagnetic Fields in Living Systems, Volume 3," Lin, J.C. (ed.), New York, Kluwer Academic/Plenum Publishers, pp. 207-264.
Lu, S.-T. [2001]: Research on biological effects of radio frequency radiation at Walter Reed Army Institute of Research. In: "Abstracts of the 2001 Asia-Pacific Radio Science Conference", August 1-4, 2001.
Pakhomov, A.G.; and Murphy, M.R. [2000a]: Low-intensity millimeter waves as a novel therapeutic modality. IEEE Trans. Plasma Sei. 21 (4): 34-40.
Pakhomov, A.G.; and Murphy, M.R. [2000b]: A Comprehensive review of the research on biological effects of pulsed radiofrequency radiation in Russia and the former Soviet Union. In: "Advances in Electromagnetic Fields in Living Systems, Volume 3," Lin, J.C. (ed.), New York, Kluwer Academic/Plenum Publishers, pp. 260-292.
36

CONCLUSION
The McKessonHBOC Clinical and Biological Services (MCBS) staffs understanding of technical issues and insight into scientific principles have been the keystone of success for the Microwave Bioeffects Branch's research program. Due to MCBS staffs efforts in planning and managing ongoing research programs, and the dedication and enthusiasm of the staff members, the scientific productivity of the program has been outstanding. During the past two years of the contract, MCBS employee proved that they were determined to provide high quality scientific products under the general guidance of the COR, appropriate WRAIR Program Managers, and Statement of Work specified in the contract. Members of the Microwave Bioeffects Branch (staffed entirely by McKessonHBOC employees) continued to enjoy respects from other members of the Tri-Service Directed Energy Bioeffects Program at Brooks AFB and the biological effects research community in general. Despite changing composition of the staff members and research emphases, the Microwave Bioeffects Branch stayed highly productive and continued to support the needs of U.S. Army admirably.
During the past two years, MCBS staff published 20 papers, 2 technical reports, and 26 meeting abstracts. Three additional manuscript are submitted and under peer review process. Work performed by MCBS staff met and often exceeded every requirement specified in the Statement of Work. All these accomplishments are excellent proof of the productivity and the dedication of MCBS staff. Our staff members do realize that the research efforts of the US army in high power, and high peak power RF fields have little precedence and are considered innovative and pioneering. The progress and accomplishments are summarized as followed:
• Retinal injuries were not observed in rhesus monkeys subjected repetitively to 1.25 GHz pulsed microwave at 1.25 MW/kg peak retinal SAR, 5.59 u.s pulse duration and 4.3, 8.4 and 20.2 W/kg average SAR.
• Extremely high peak power (250-350 MW/kg, 1 u,s, 9.2 GHz) or low peak power (3- 30 kW/kg, 05-10 u,s, 9.2 GHz) pulses had no specific effect on pacemaker activity of the isolated frog heart slices.
• Effects of pulsed 9.2 GHz microwaves on hippocampal slices were proportional to average SAR and heating independent of modulation frequency, peak SAR or duty cycle.
• A specific inhibitory effect of 9.3 GHz pulsed microwaves on growth rate of yeast cells was suspected at 20-30 MW/kg peak SAR. Optimization of assay sensitivity is needed to confirm the existence of this specific extremely high peak power effect.
• Synaptic transmission of the frog spinal cord was not a target of 41.1-42.4 GHz microwaves up to 3 mW/cm2.
37

• The interaction between 1.25 GHz pulsed microwaves and 3-nitropropionic acid was revealed in prepulse inhibition of acoustic startle and ultrastructure of neurons at caudate putamen, but not in the spontaneous activity of rats.
• A SAR dependent effect on Y-maze performance (decrease in cautiousness or increase in boldness) was noted in rats exposed to 2.45 GHz microwaves at 0.39, 3.85 and 6.37 W/kg.
• A SAR dependent hypotension was found in rats exposed to ultra-wide-band pulses. The threshold was lower than 100 kV/m peak electric field intensity and 0.08 W/kg average whole-body SAR. An abbreviated double-blind replication study was successful in identifying the ultra-wide-band induced systolic hypotension.
• Genotoxic effect was not found in polychromatic erythrocytes in bone marrow and peripheral blood of rats exposed to ultra-wide-band pulses (91-103 kV/m peak electric field intensity, 0.92-0.97 ns pulse duration, 15 min).
• Exposure to ultra-wide-band pulses (102 kV/m peak electric field intensity, 0.9 ns pulse duration, 600 Hz pulse repetition rate, 30 min) inhibited the hyperactivity but had no effect on the analgesic effect of the N°-nitro-L-arginine.
• A general mathematical model using finite difference time domain techniques that can be used to estimate the electrical field in a large Gigahertz Transverse Electromagnetic Cell was developed and validated with actual measurements.
• Six concept papers have been published on current knowledge of the biological effects of radio frequency radiation and pulsed radiation.
In the next two years, MCBS researchers will increase collaborative efforts with researchers from various universities. The main foci of research will be in six areas. They are:
• Neurotoxic effect of microwave radiation on the nigrostriatal dopaminergic system, • Effects of pulsed electromagnetic radiation on neurotoxin-induced degenerative
changes in brain function and structure, • Neurophsiological effects of extremely high power microwave pulses, • Ultra-wide-band and high peak power pulsed radiation and their potential for
inducing astrocyte transformation and injury, • Hypotensive effect of ultra-wide-band pulses, and • Non-thermal biological effects of radio frequency radiation from body-worn
antennas.
MCBS employees are dedicated to continue to promote the success of the Walter Reed Army Institute of Research and be the world leader in military relevant biomedical research. We aim to assist WRAIR to ensure that the soldiers will have the best possible knowledge and protection against environmental electromagnetic threats.
38

PERSONNEL
The following McKessonHBOC Clinical and Biological Services personnel served under the present contract:
Dr. Yahya Akyel
Dr. John O. de Lorge
Dr. Shin-Tsu Lu
Dr. Andrei Pakhomov
Dr. Ronald Seaman
Dr. Satnam Mathur
Dr. Xiaoyi Du
Ms. Lori Allen
Mr. John Ashmore
Mr. Norman Harris
Ms. Joanne Doyle
Ms. Monica Gonzalez
Ms. Amy Phinney
Principal Investigator / Behavioral Psychologist
Program Manager / Behavioral Psychologist (resigned on 11/30/2000) Program Manager / Radiation Biologist Veterinarian Electrophysiologist
Biomedical Engineer / Physiologist
Electrical Engineer / Antenna Design
Neurophysiologist
Office Manager / Safety Officer
Electronic Technician
Electronic Technician (resigned on 12/15/2000)
Biomedical Technician
Biomedical Technician (resigned on 01/31/2001)
Biomedical Technician
39

•
MICROWAVE BIOEFFECTS BRANCH PRESENTATIONS / PUBLICATIONS LIST
(May 1999-May 2001)
Akyel, Y.; Lu, S-T.; Mathur, S.P.; and Doyle, J. [1999]: Dose-response Characteristics of Microwave-induced Disturbance on foraging patterns in rats. In: "Abstracts of the 21st
Annual Meeting of the Bioelectromagnetics Society," pp. 24-25.
Brewer, P.A.; Mery, L.R.; Phelix, C.F.; and Seaman, R.L. [2001]: Monoamine oxidase inhibition enhances ultrastructural changes in rat striatal neurons after single systemic injection of 3-nitropropionic acid. Abstract submitted to the 31st Annual Meeting of the Society for Neuroscience, November 10-15, 2001.
de Lorge, J. [2000]: Non-thermal bioeffects of radio frequency radiation: What are they? In:"Millennium International Workshop on Biological Effects of Electromagnetic Fields Proceedings", Kostarakis, P., and Stavroulakis, P. (eds.), pp. 342-346 (ISBN 960-86733-0-5).
de Lorge, J. [2000]: Contemporary research on the behavioral effects of radio frequency radiation. In: "Radio Frequency Radiation Dosimetry," Klauenberg, B.J.; and Miklavcic, D. (eds.), Netherlands, Kluwer Academic Publishers, pp. 403-407.
Gajsek, P.; Pakhomov, A.G., and Klauenberg, B.J. [2001]: Electromagnetic field standards in central and eastern european countries: current state, and stipulations for international harmonization. Health Physics (in press)
Kiel, J.L.; Seaman, R.L.; Holwitt, E.A; Mathur, S.P.; Hurt, W.D.; Mason, P.A.; Alls, J.L.; and Morales, P.J. [1999]: Nitration enhances the pulsed-microwave absorption by a tyrosine polymer. In: "Abstracts of the 21st Annual Meeting of the Bioelectromagnetics Society," pp. 131-132.
Kiel, J.L.; Seaman, R.L.; Mathur, S.P.; Parker, JE.; Wright, J.R.; Alls, J.L.; and Morales, P.J. [1999]: Pulsed microwave induced light, sound, and electrical discharge enhanced by a biopolymer. Bioelectromagnetics 20: 216-223.
Kiel, J.L.; Parker, J.E.; Morales, P.J.; Alls, J.L.; Mason, P.A.; Seaman, R.L.; Mathur, S.P.; and Holwitt, E.A. [2000]: Pulsed microwave induced bioeffects. IEEE Trans. Plasma Sei. 28(1): 161-167.
Kiel, J.L., Rockwell, B.A., Thomas, R.J., Alls, J.L., Mathur, S.P., Sutter, R.E., and Morales, P.J. [2001]: Laser and microwave induced breakdown spectroscopy: basis for a new detection technique for chemical and biological agents. Submitted to JEEE International Conference of Plasma Science and IEEE International Pulsed Power Conference, June 17-22, 2001.
40

• Kiel, J.L.; Alls, J.L.; Sutter, R.E.; Mason, P.A.; Mathur, S.P.; and Morales, P.J. [2001]: Directed killing of anthrax spores by microwave induced cavitation via specific binding of organic semi-conductor. In: "Abstracts of the Second International Symposium on Nonthermal Medical/Biological Treatments Using Electromagnetic Fields and Ionized Gases", May 21-23, 2001.
• Lu, S.-T.; Akyel, Y.; and Mathur, S.P. [1999]: A potential low dose 2.45 GHz CW-induced Hypotension in Rats. In: "Abstracts of the 21st Annual Meeting of the Bioelectromagnetic Society", pp. 122-123.
• Lu, S.-T.; Mathur, S.P.; Akyel, Y.; and Lee, J.C. [1999]: Ultra-wideband electromagnetic pulses induced hypotension in rats. Physiol. Behav. 65(4/5): 753-761.
• Lu, S.-T.; Mathur, S.P.; Akyel, Y.; and Lee, J.C. [1999]: Erratum: Ultra-wideband electromagnetic pulses induced hypotension in rats. Physiol. Behav. 67(3): 463.
• Lu, S.-T.; Mathur, S.P.; Stuck, B.; Zwick, H; D'Andrea, J.A; Ziriax, J.M.; Merritt, J.H.; Lutty, G; McLeod, D. S.; and Johnson, M. [1999]: Retinal Effects of High Peak Power Microwaves in Rhesus Monkeys. Brooks Air Force Base, U.S. Army Medical Research Detachment, Naval Health Research Center Detachment, U.S. Air Force Research Laboratory, Technical Report, USAMRD WRAIR 9907 006 TX, NHRC-DET 99-01, AFRL- HE-BR-TR-1999-0231.
• Lu, S.-T.; Mathur, S.P.; and Akyel, Y. [2000]: Absence of effects of 2.45 GHz microwaves on physical endurance, motivational levels and cardiovascular functions. In: "Millennium International Workshop on Biological Effects of Electromagnetic Fields Proceedings", Kostarakis, P.; and Stavroulakis, P. (eds.), pp. 491-496 (ISBN 960-86733-0-5).
• Lu, S.-T.; Mathur, S.P.; Stuck, B.; Zwick, H; D'Andrea, J.A; Ziriax, J.M.; Merritt, J.H.; Lutty, G.; McLeod, D. S.; and Johnson, M. [2000]: Effects of high peak power microwaves on the retina of the rhesus monkey. Bioelectromagnetics 21:439-454.
• Lu, S.-T.; Mathur, S.P.; and Akyel, Y. [2000]: Effects of 2.45 GHz CW microwave on physical endurance and motivational levels in rats. In: "Abstracts of the 22nd Annual Meeting of the Bioelectromagnetics Society," p. 281.
• Lu, S.-T.; and de Lorge, J. [2000]: Biological effects of high peak power radiofrequency pulses. In: "Advances in Electromagnetic Fields in Living Systems, Volume 3," Lin, J.C. (ed.), New York, Kluwer Academic/Plenum Publishers, pp. 207-264.
• Lu, S.-T. [2001]: Potential application of UWB pulses in lowering blood pressure. In: "Abstracts of the 2001 Asia-Pacific Radio Science Conference", August 1-4, 2001.
41

Lu, S.-T. [2001]: Research on biological effects of radio frequency radiation at Walter Reed Army Institute of Research. In: "Abstracts of the 2001 Asia-Pacific Radio Science Conference", August 1-4, 2001.
Mery, L.R.; Phelix, C.F.; Wayner, M.J.; and Seaman, R.L. [2000]: Ultrastructure changes in rat striatal neurons after single systemic injection of 3-nitropropionic acid. In: "Abstracts of 30th Annual Meeting of Society for Neuroscience Meeting," p. 1876.
Pakhomov, A.G.; Prol, H.K.; Mathur, S.P.; and Akyel, Y. [1999]: Search for the effect of millimeter waves on synaptic processes in the central nervous system. In: "Electricity and Magnetism in Biology and Medicine," Bersani, F. ed., Kluwer Academic/Plenum Publishers, pp. 971-974.
Pakhmov, A.G.; Mathur, S.P.; Belt, M.; and Murphy, M.R. [1999]: Dose dependencies in bioeffects of extremely high peak power microwave pulses. In: "Electromagnetic Fields: Biological Effects and Hygienic Standardization, (Proceedings of the International Meeting, may 18-22, 1998, Moscow, Russia)" Repacholi, M.H.; Rubtsova, N.B.; and Muc, A.M., eds., Geneva, Switzerland, World Health Orgnaization, pp. 325-334.
Pakhomov, A.G.; and Murphy, M.R. [1999]: Low-intensity millimeter waves as a novel therapeutic modality. In: "Digest of Technical Papers, 12th IEEE International Pulsed Power Conference," pp. 23-28.
Pakhomov, A.G.; Doyle, I; Kiel, J.L.; and Murphy, M.R. [1999]: The role of peak and average power in microwave bioeffects in excitable tissue models. In: "Electromagnetic Fields and Human Health, Proceedings of the Second International Conference on Problems of Electromagnetic Safety and Human Health (Sept 20-24, 1999, Moscow, Russia), p. 330.
Pakhomov, A.G.; and Murphy, M.R. [1999]: Low-intensity millimeter waves as a novel therapeutic modality. In: "Abstracts of the First International Symposium on Nonthermal Medical/Biological Treatments Using Electromagnetic Fields and Ionized Gases," p.21.
Pakhomov, A.G.; Doyle, J.; Mathur, S.P.; Kiel, J.L.; and Murphy, M.R. [1999]: Search for specific physiological effects of extremely high power microwave pulses. In: "Abstracts of 21st Annual Meeting of the Bioelectromagnetics Society," pp. 200-201.
Pakhomov, A.G.; Mathur, S.P.; Akyel, Y.; Kiel, J.L.; and Murphy, M. R [2000]: High- resolution microwave dosimetry in lossy media. In: "Radio Frequency Radiation Dosimetry," Klauenber, B.J., and Miklavcic, D. (ed.s.), Netherlands, Kluwer Academic Publishers, pp. 187-197.
Pakhomov, A.G.; Mathur, S.P.; Doyle, J.; Stuck, B.E.; Kiel, J.L.; and Murphy, M.R. [2000]: Comparative effects of extremely high power microwave pulses and a brief CW irradiation on pacemaker function in isolated frog heart slices. Bioelectromagnetics 21 (4): 245-254.
42

Pakhomov, A.G.; and Murphy, M.R. [2000]: A Comprehensive review of the research on biological effects of pulsed radiofrequency radiation in Russia and the former Soviet Union. In: "Advances in Electromagnetic Fields in Living Systems, Volume 3," Lin, J.C. (ed.), New York, Kluwer Academic/Plenum Publishers, pp. 260-292.
Pakhomov, A.; and Doyle, J. [2000]: Effect of pulsed microwaves on the population spike in rat hippocampal slices. In: "Millennium International Workshop on Biological Effects of Electromagnetic Fields Proceedings", Kostarakis, P.; and Starvroulakis, P. (ed.), pp. 480-485 (ISBN 960-86733-0-5).
Pakhomov, A.G.; and Murphy, M.R. [2000]: Low-intensity millimeter waves as a novel therapeutic modality. IEEE Trans. Plasma Sei. 21 (4): 34-40.
Pakhomov, AC; Doyle, J.; and Mathur, S.P. [2000]: Combined effect of pulsed microwaves and glutamate superfusion on the population spike in rat hippocampal slices. In: "Abstracts of the 22nd Annual Meeting of the Bioelectromagnetics Society," pp.262-263.
Pakhomov, A.G.; Doyle, J., Mathur, S.; and Murphy, M.R. [2001]: Retaining of the long- term potentiation in hipocampal slices after high peak power microwave exposure and heating. In: "Abstracts of the Second International Symposium on Nonthermal Medical/Biological Treatments Using Electromagnetic Fields and Ionized Gases," May 21- 23,2001.
Pakhomov, A.G.; Doyle, J.; Mathur, S.; and Murphy, M.R. [2001]: Effects of extremely high power microwave pulses on the population spike and long-term potentiation in rat hippocampal slices. In: "Abstracts of the 23rd Annual Meeting of the Bioelectromagnetics Society," June 10-14,2001.
Pakhomov, A.G.; Gajsek, P.; Allen, L.; Stuck, B.E.; and Murphy, M.R. [2001]: Comparison of dose dependence for bioeffects of continuous-wave and high-peak power microwave emissions using gel-suspended cell cultures. Bioelectromagnetics (pending).
Pakhomov, A.G.; Mathur, S.; Gajsek, P.; and Murphy, M.R. [2001]: Use of gel-suspended cell cultures for analysis of dose dependence of microwave bioeffects. Abstract submitted to the 5 International Congress of the European BioElectromagnetics Association (EBEA), September 6-8, 2001.
Samn S.; and Mathur, S. [1999]: A mathematical model of gigahertz transverse electromagnetic cell, I. Brooks Air Force Base, U.S.AF. Research Laboratory, Technical Report AFRL-HE-BR-TR-1999-0219.
Seaman, R.L.; and Wohlfeld, B.J. [1999]: Activity and acoustic startle prepulse inhibition 3-4 hr after 3-nitropropionic acid injection. In: "Abstracts of the 1999 Annual Meeting of the Experimental Biology Society."
43

•
•
Seaman, R.L.; Phelix, C.F.; Bruno, JG.; Kalns, J.E.; Dick, E.J.Jr.; Wohlfeld, B.J.; and Kiel, J.L. [1999]: Exploration of a neurodegeneration model for use in microwave studies. In: "Abstracts of the 21st Annual Meeting of the Bioelectromagnetics Society," pp. 209-210.
Seaman, R.L.; Belt, M.L.; Doyle, J.M.; and Mathur, S.P [1999]: Hyperactivity caused by a nitric oxide synthase inhibitor is countered by ultra-wideband pulses. Bioelectromagnetics. 20:431-439.
Seaman, R.L.; Mathur, S.P.; Dick, E. J.Jr.; and Gonzalez, M.Y. [2000]: Effects of microwave exposure and 3-nitropropionic acid on rat activity, acoustic startle, and brian histology. In: "Abstracts of 22nd Annual Meeting of the Bioelectromagnetics Society," p. 285-286.
Seaman, R. [2000]: Effects of acute systemic 3-nitropropionic acid administration on rat activity and acoustic startle. Neuroscience Letters 280:183-186.
Seaman, R.L.; Mathur, S.P.; and Dick, E.J.Jr. [2001]: Effects of pulsed microwaves and toxin-induced hypoxia on rat motor activity, acoustic startle, and brain histology. Bioelectromagnetics (Pending).
Seaman, R.L.; Mathur, S.P.; Phinney, A.M.; and Harris, N.R. [2001]: Interaction between a neurotoxin and pulsed microwaves. In: Abstracts of 23rd Annual Meeting of the Bioelectromagnetics Society, June 10-14, 2001.
Seaman, R.L.; and Phelix, C.F. [2001]: Changes in ultrastructure of rat caudate-putamen neurons with a neurotoxin and exposure to pulsed microwaves. Abstract submitted to 5th
International Congress of the European BioElectromagnetics Association (EBEA), September 6-8, 2001.
Seaman, R.L.; and Phelix, C.F. [2001]: Acute changes in rat caudate-putamen neuronal ultrastructure due to 3-nitropropionic acid and microwave exposure are not reflected in behavior. Abstract submitted to the 31st Annual Meeting of the Society for Neuroscience, November 10-15,2001.
Vijayalaxmi; Seaman, RL; Belt, M.L.; Doyle, J.M.; Mathur, S.P.; and Prihode, T.J. [1999]: Frequency of micronuclei in the blood and bone marrow cells of mice exposed to ultra- wideband electromagnetic Radiation. Int. J. Radiat. Biol. 75(1): 115-120.
Vijayalaxmi; and Seaman. R.L. [1999]: Micronuclei in the peripheral blood and bone marrow cells of mice exposed to ultra-wideband electromagnetic radiation. In: "Abstracts of the 21st Annual Meeting of the Bioelectromagnetics Society," p. 214.
Ziriax, J.M.; Lu, S.-T.; Mathur, S.; Cox, D.; Henry, P.; Kosub, K.; Garay, R.; Hurt, W.; and D'Andrea, J. [2000]: Verifying FD-TD Predictions with Thermometry Measurements. In: "Abstracts of the 22nd Annual Meeting of the Bioelectromagnetics Society," pp.202-203.
44

Ziriax, J.M., D'Andrea, J.A., Lu, S.-T., Mathur, S., and Cox, D. [2001]: Verifying electromagnetic Dosimetry. In: "Abstracts of 2001 Asia-Pacific Radio Science Conference'' August 1-4, 2001.
45
VOLUME II
Award Number: DAMD17-94-C-4069 TITLE: Services to operate and Maintain a Microwave Research Laboratory PRINCIPAL INVESTIGATOR: Yahya Akyel, Ph.D.
Copies of Publications (1-14)
1. de Lorge, J. [2000]: Contemporary research on the behavioral effects of radio frequency radiation. In: "Radio Frequency Radiation Dosimetry," Klauenberg, B.J.; and Miklavcic, D. (eds.), Netherlands, Kluwer Academic Publishers, pp. 403-407.
2. de Lorge, J. [2000]: Non-thermal bioeffects of radio frequency radiation: What are they? In:"Millennium International Workshop on Biological Effects of Electromagnetic Fields Proceedings", Kostarakis, P., and Stavroulakis, P. (eds.), pp. 342-346 (ISBN 960-86733-0-5).
3. Kiel, J.L.; Seaman, R.L.; Mathur, S.P.; Parker, J.E.; Wright, J.R.; Alls, J.L.; and Morales, P.J. [1999]: Pulsed microwave induced light, sound, and electrical discharge enhanced by a biopolymer. Bioelectromagnetics 20: 216-223.
4. Kiel, J.L.; Parker, J.E.; Morales, P.J.; Alls, J.L.; Mason, P.A.; Seaman, R.L.; Mathur, S.P.; and Holwitt, E.A. [2000]: Pulsed microwave induced bioeffects. IEEE Trans. Plasma Sei. 28(1): 161-167.
5. Lu, S.-T.; Mathur, S.P.; Akyel, Y.; and Lee, J.C. [1999]: Ultra-wideband electromagnetic pulses induced hypotension in rats. Physiol. Behav. 65(4/5): 753-761.
6. Lu, S.-T.; Mathur, S.P.; Akyel, Y.; and Lee, J.C. [1999]: Erratum: Ultra-wideband electromagnetic pulses induced hypotension in rats. Physiol. Behav. 67(3): 463.
7. Lu, S.-T.; Mathur, S.P.; and Akyel, Y. [2000]: Absence of effects of 2.45 GHz microwaves on physical endurance, motivational levels and cardiovascular functions. In: "Millennium International Workshop on Biological Effects of Electromagnetic Fields Proceedings", Kostarakis, P.; and Stavroulakis, P. (eds.), pp. 491-496 (ISBN 960-86733-0-5).
8. Lu, S.-T.; Mathur, S.P.; Stuck, B.; Zwick, H; D'Andrea, J.A; Ziriax, J.M.; Merritt, J.H.; Lutty, G.; McLeod, D. S.; and Johnson, M. [2000]: Effects of high peak power microwaves on the retina of the rhesus monkey. Bioelectromagnetics 21:439-454.
9. Lu, S.-T.; and de Lorge, J. [2000]: Biological effects of high peak power radiofrequency pulses. In: "Advances in Electromagnetic Fields in Living Systems, Volume 3," Lin, J.C. (ed.), New York, Kluwer Academic/Plenum Publishers, pp. 207-264.

10. Pakhomov, A.G.; Prol, H.K.; Mathur, S.P.; and Akyel, Y. [1999]: Search for the effect of millimeter waves on synaptic processes in the central nervous system. In: "Electricity and Magnetism in Biology and Medicine," Bersani, F. ed., Kluwer Academic/Plenum Publishers, pp. 971-974.
11. Pakhmov, A.G.; Mathur, S.P.; Belt, M.; and Murphy, M.R. [1999]: Dose dependencies in bioeffects of extremely high peak power microwave pulses. In: "Electromagnetic Fields: Biological Effects and Hygienic Standardization, (Proceedings of the International Meeting, may 18-22, 1998, Moscow, Russia)" Repacholi, M.H.; Rubtsova, N.B.; and Muc, A.M., eds., Geneva, Switzerland, World Health Orgnaization, pp. 325-334.
12. Pakhomov, A.G.; and Murphy, M.R. [1999]: Low-intensity millimeter waves as a novel therapeutic modality. In: "Digest of Technical Papers, 12 ' IEEE International Pulsed Power Conference," pp. 23-28.
13. Pakhomov, A.G.; Mathur, S.P.; Akyel, Y.; Kiel, J.L.; and Murphy, M. R. [2000]: High- resolution microwave dosimetry in lossy media. In: "Radio Frequency Radiation Dosimetry," Klauenber, B.J., and Miklavcic, D. (ed.s.), Netherlands, Kluwer Academic Publishers, pp. 187-197.
14. Pakhomov, AG; Mathur, S.P.; Doyle, J.; Stuck, B.E.; Kiel, J.L.; and Murphy, M.R. [2000]: Comparative effects of extremely high power microwave pulses and a brief CW irradiation on pacemaker function in isolated frog heart slices. Bioelectromagnetics 21 (4): 245-254.

CONTEMPORARY RESEARCH ON THE BEHAVIORAL EFFECTS OF RADIO FREQUENCY RADIATION
J. O. DE LORGE McKessonHBOC BioServices 8308 Hawks Rd, Bldg. 1184 Brooks AFB, TX 78235
1. Introduction
The most recent and widely followed standards for safe levels of human exposure to radio frequency (RF) electromagnetic fields, the IEEE C95.1-1991 guide fl] relied on behavioral research as the most sensitive biological measure of potentially harmful effects. Research on the behavioral effects of RF exposure has continued to be important following the publication of that guide although there has been a substantial decrease in the number of facilities and published articles involved in RF biology.
The present chapter will examine much of the behavioral work published since 1990 and attempt to draw some conclusions as to its contribution to an understanding of the biological effects of exposure to electromagnetic fields in the RF range of the spectrum. Many of these recent studies can be categorized into two groups. The first group consists of research on the effects of pulses of high-powered energy. The second contains research with more conventional sources of radiation or at least of sources used in many studies conducted in the previous decade.
2. High Power Pulses
One of the first high-peak-power experiments of this decade is a study by Akyel et al. [2]. Pulses at a peak power of 1 MW and a transmitter frequency of 1.25 GHz were
used to illuminate constrained rats for 10 min. Specific absorption rates (SARs) of 0.84, 2.5, 7.6, and 23 W/kg were produced. The rats had been trained to lever press and following exposure they were placed back into a performance chamber for behavioral testing. Disruption of performance was found at the highest SAR (23 W/kg) but not at the lower levels. The authors concluded that the observed effects were based on a thermal effect.
A second study at a similar frequency, 1.3 GHz, by D'Andrea and his colleagues [3] was published the following year in a technical report. Rhesus monkeys were the subjects and performance was measured during irradiation at three SAR levels, 16, 26,
403
B.J. Klauenberg and D. Miklavcic (ids.). Radio Frequency Radiation Dosimetry, 403-407. (Ö 2000 Kluwer Academic Publishers. Printed in the Netherlands.

404
and 35 W/kg. Animals were illuminated for 25 minutes by an open-end waveguide focused on the rear of the monkey's head. Behavioral response rates on a vigilance task were reduced by the 26 and 35 W/kg SARs but not the 16 W/kg level. The authors concluded, amongst other things, that the current safety standard for localized maximum SAR of 8 W/kg in any one gram of tissue fails to provide for a safety factor of 10 and should be re-examined.
A series of studies with rhesus monkeys was conducted by John D'Andrea and colleagues [4, 5]. Two different frequencies, 5.62 GHz [4] and 2.37 GHz [5J were used. The animals were trained on operantly conditioned tasks and exposed to microwaves while performing the tasks. Even though the peak powers were quite high, the pulses were of short duration, e.g., 50 ns [4] and 93 ns [5]. The peak power densities ranged from 518 W/cm2 at 5.62 GHz to 11.3 kW/cm2 at 2.37 GHz. The exposures at the lower frequency resulted in relatively small SARs of 0.075 W/kg or less and no behavioral effects were observed. The exposures at 5.62 GHz at various energy levels produced SARs of 2, 4, and 6 W/kg. Only the 4 and 6 W/kg doses produced behavioral changes, a decrease in response rate and an increase in reaction time. These findings agreed with much of the behavioral work cited in the IEEE guide [1]. Two types of pulses, an enhanced pulse (9 times the level of the radar pulse) and the standard radar pulse, were examined in the higher frequency study [4]. No different behavioral effects occurred as a consequence of these two different pulse strengths.
A unique behavioral response of pulsed high power microwaves was observed by Brown et al. [6]. A mouse was confined to a plastic tube and its head and neck were exposed to single pulses of 1.25 GHz radiation at various power levels and number of pulses. It was observed that each animal would emit a twitch or movement of the body when it was exposed at levels ranging from 0.0072 to 200 kW. A dose dependency was found which leveled off at the higher doses (1 kW/kg). Again, a thermal mechanism seemed to be responsible with a threshold near an increment of 1.7. "C from baseline
Several behavioral investigations have been conducted with a TEMPO vircator located at the microwave facilities of the Walter Reed Army Institute of Research. The device generates an 80 ns, 3000 MHz pulse with 700 MW peak transmitted power. In one study treadmill performance of rats was studied [7]. The subjects were trained to steady rates of daily running and then exposed in 25 min sessions to 1 pulse every 8 seconds. Following an exposure session the animals were placed on a treadmill and their performance assessed. Exposures produced SARs of 0.072 W/kg; nevertheless, a reduction in running time occurred. Similarly, another experiment with rats using the TEMPO [8] reported that decision-making was disrupted after a 25 min exposure session (200 pulses). Both of these experiments observed behavioral effects at power levels substantially below those indicated as a safe level in the IEEE guide [1]. Such effects could be specific to unique properties of the TEMPO, thus they are difficult to replicate with other sources.
Another group of devices producing high-power pulses covering the R.F area involves ultra-wide band (UWB) and electromagnetic pulse (EMP) generators. UWB generators typically produce 60 Hz, 1-10 ns pulses at a bandwidth of 0.25-2.50 GHz, with a peak E field strength of 250 kV/m. The EMP generators contain most of their

405
energy in the 20-100 MHz region at E-field strengths of 100 kV/m. Exposures in both instances are generally of short duration, but the EMP pulse is typically much longer, e.g., 900 ns.
Results of behavioral experiments with EMP exposures vary. One study disclosed that exposure to 200 EMP pulses for about 30 minutes resulted in a group of rats that preferred the exposure and another group whose performance was actually enhanced [9]. However, the enhancement was not a statistically significant change .
Orientation behavior in birds 3 to 6 hours after undergoing EMP exposure was examined by Moore and Simons [10]. Some disruption in selection of migratory direction was found, but the investigators concluded that free-flying migratory birds should not be strongly influenced by EMP pulses.
Research dealing with animals exposed to UWB pulses has been conducted on rats [11] and monkeys [12]. A variety of both cognitive and motivational behaviors was explored in rats after exposure to UWB radiation between 0.25 and 2.50 GHz for 2 minutes. No statistically significant differences in behavior were found between sham and exposed animals [11]. The monkey experiments [12] were designed with a narrower bandwidth (100 MHz to 1.5 GHz) and continued the 2 min exposures prior to testing. Still, no differences were found in a very complicated cognitive task involving vestibular canal functions.
3. Conventional Pulses
In the current decade there has been a decrease in the number of experiments with animals exposed to energy from microwave sources. Furthermore, the results of these few experiments have not been consistent and seem to add little information for the documentation of potential health effects of RF exposure. Each study is unique in both the frequency explored and the behavior examined. For example, Lai et al. [13] exposed rats for 45 minutes to pulsed 2450 MHz microwaves at 1 mW/cm2 (SAR = 0.6 W/kg) in cylindrical waveguides. Following exposure the subjects were placed in a radial arm maze and tested for learning and memory. Several independent variables were employed, and in the main treatments of sham versus microwave exposure, a deficit in learning was found in the exposed rats.
In another study with a 2450 MHz source rats were also exposed at a power density of 1 mW/cm . When they were tested in a shuttle-box following exposure they were similarly found to have a performance decrement [14].
A recent report deals with the operantly conditioned behavior of the offspring of RF exposed rats [15]. Dams were exposed continuously from post-conception days 1-20 to 900 MHz radiation modulated at 217 Hz at 0.1 mW/cm2. When the offspring became adults they were trained on an operant task under various contingencies. No differences in the performance of the offspring of exposed versus the offspring of the sham- exposed mothers were observed.
A rather unique study is that of Gapeev et al. [16]. They examined the effects of a range of continuous wave radiation centered on 42.25 GHz on the movement of

406
protozoa. Cells of Paramecium caudatum were exposed in a 2 mm saline layer located in a cuvette. Cells were irradiated for 12 minutes at power densities from 0.1 to 20 mW/cm2. A motility index of the animal's activity was calculated. The carrier frequency of the radiation was modulated from 0.05 to 16 Hz. Locomotor activity increased and reached a maximum at 0.0956 Hz modulation and 0.1 mW/cm2. Different power densities produced the same effect. The effect decreased when the carrier frequency was either increased or decreased on either side of 42.25 GHz. This experiment illustrates a relatively simple preparation for investigating RF behavioral
effects and should be attempted by others even though isolating the effects on the organism as opposed to the effects on the organism in saline will present some problems.
4. Conclusions
Behavioral research on the effects of radiofrequency radiation has decreased substantially over the last ten years. This is a surprising phenomenon in light of the fact that exposure standards in place in most countries are based on the results of behavioral experiments. Perusal of the program for the recent annual meeting of the Bioelectromagnetics Society held in St. Petersburg, Florida, reveals that only three RF behavioral studies were presented. Only two of these concentrated on UWB effects. It may be that behavior is no longer perceived as a sensitive indicator of RF health effects. Certainly, most of the research concerning cellular telephones is on non-behavioral biological effects.
Behavior is a final common expression of virtually all physiological processes with, perhaps, the exception of disease, and even that endpoint is often initially expressed as a behavioral response. If low level RF radiation produces adverse health effects,
behavioral changes will continue to be the first to be observed.
5. References
1. IEEE C95.1-1991 (1992) Safety Levels With Respect To Human Exposure to Radio frequency Electromagnetic Fields, 3 kHz to 300 GHz, IEEE, Piscataway, NJ.
2. Akycl, Y., Hunt, E.L., Gambrill, C, and Vargas, C. Jr., (1991) Immediate post-exposure effects of high- peak-power microwave pulses on operant behavior of Wisiar rats, Bioelectromagnetics 12, 183-195.
3. D'Andrea J.A., Cobb B.L., and Knepton J. (1992) Behavioral effects of high peak power microwave pulses: Head exposure at 1.3 GHz. Report NAMRL-1372; Pensacola, FL: Naval Aerospace Medical Research Laboratory, NAMRL -1372.
4. D'Andrea, J.A., Thomas, A., and Hatcher, D.J. (1994) Rhesus monkey behavior during exposure to high-pcak-powcr 5.62-Gllz microwave pulses, Bioelectromagnetics 15, 163-176.
5. D'Andrea. J.A. (1995) Effects of microwave radiation exposure on behavioral performance: in nonhuman primates, in ß.J. Klauenberg, M. Grandolfo, and D.N. Erwin (eds.), Radiofrequency Radiation Standards. Biological Effects. Dosimelry, Epidemiology, and Public Health Policy, Plenum Press, New York, pp. 271- 277.

407
6. Brown, D.O., Lu, S-T., and Bison, E.C. (1994) Characteristics of microwave evoked body movements in mice, Bioelectromagnelics 15, 143-161.
7. Akyel, Y., Belt, M., Raslear, T.G., and Hammer, R.M. (1993) The effects of high-peak power pulsed microwaves on treadmill performance in the rat, in M. Blank (ed.), Electricity and Magnetism in Biology and Medicine, San Francisco Press, San Francisco, pp. 668-670.
8. Raslear, T.G., Akyel, Y., Bates, F., Belt, M., and Lu, S-T. (1993) Temporal bisection in rats: The effects of high-peak-power pulsed microwave radiation, Bioelectromagnelics 14, 459-478.
9. Akyel, Y. and RasleaT, T.G. (1993) The effects of acute EMP fields on the behavior of rats, in J. de Lorge and W. Mick (eds.), EMP Human Health Effects Science Review Panel Proceedings. 16-18 Mar. Theater Nuclear Warfare Program, Crystal Plaza 5, Rni. 866, Washington, DC 20362-5101, pp. 45-57.
10. Moore, F.R. and Simons, T. (1993) Orientation behavior of migratory birds in response to Empress II- simulated EMP, in J. de Lorge and W. Mick (eds.), EMP Human Health Effects Science Review Panel Proceedings, 16-18 Mar, Theater Nuclear Warfare Program, Crystal Plaza 5, Rm. 866, Washington, DC
20362-5101, pp. 97-112. 11. Walters, T.J., Mason, P.A., Sherry, C.J., Steffen, C, and Merritt, J.H. (1995) No detectable bioeffects
following acute exposure to high peak power ulira-wide band electromagnetic radiation in rats, Aviat. Space and Environ. Med. 65, 562-567.
12. Sherry, C.J., Blick, D.W., Wallers, T.J., Brown, G.G., and Murphy, M.R. (1995) Lack of behavioral effects in non-human primates after exposure to ultrawide electromagnetic radiation in the microwave frequency range, Radial. Res. 143, 93-97.
13. Lai, H., Horita, A., and Guy, A.W. (1994) Microwave irradiation affects radial-arm maze performance in the rat, Bioelectromagnelics 15, 95-104.
14. Varetski, V.V., Rudnev, M.I., Dcgtyar, V.N., and Rcdshod'ko, T.L. (1991) Combined influence of gamma- rays and superhigh-frequency radiation on conditioned reflex behavior in the rat, Radiohiologiia 31, 246-251.
15. Bornhausen, M., Kinkel, D., Wu, X.N., and Scheingraber, H. (1997) Operant behavior tests in rats after prenatal exposure to high frequency electromagnetic fields, presented at the Second World Congress for Electricity and Magnetism in Biology and Medicine, 8-13 June, Bologna, Italy, pp. 322-323.
16. Gapeev, A.B., Chemeris, N.K., Fescnko, E.E., and Khramov, R.N. (1994) Resonance effects of a low intensity modulated El IF field- Alteration of the locomotor activity of the protozoa paramecium caudatum, Biofizika, 39, 74-82.

n Biötoiteil Effects of Elsetroiiiaiiistlc Mil
A A A
mm» mmrsmamm
»rakli-i

NON-THERMAL BIOEFFECTS OF RADIO FREQUENCY RADIATION: WHAT ARE THEY?
JOHN DE LORGE
MCKESSON BIOSERVICES U.S. ARMY MEDICAL RESEARCH DETACHMENT
8308 HAWKS ROAD, BLDG 1184 BROOKS AIR FORCE BASE, TEXAS 78235
USA
ABSTRACT
Non-thermal biological effects of radiofrequency radiation (RFR) are difficult to investigate for several reasons including 1) absorbed energy is hard to measure, 2) biological endpoints are not well described a priori, 3) target organs have not been identified, 4) definitions of non-thermal vary from one publication to another, and 5) consistent research results are lacking. The genera) conventional definition of non-thermal is any amount of RFR energy failing to produce a detectable rise in an organism's temperature. However, this definition ignores an organism's ability to compensate for RFR energy deposition. The present paper will examine several definitions of non-thermal RFR levels of energy, provide examples, and discuss other experimental arrangements for demonstrating thermal versus non- thermal biological effects.
INTRODUCTION
Numerous recent articles in the popular press have commented on the biological effects of radiofrequency radiation (RFR) and the quantity of RFR emitters now present in our environment. In particular, awareness of the increasing number of mobile phones has elicited interest in the public health consequences of cell phone emissions. The standard reply to such interest has been that cell phone RFR emissions only result in low-level energy deposition in the user and therefore present no health hazard. In response to this has been a follow-up question, "What about non-thermal effects?"
What are non-thermal effects? These are the effects of RFR exposure presumed to be caused by something other than heat under the premise that thermal effects are the effects produced by an increase in the ceaseless random oscillation and vibration of molecules resulting in increased kinetic energy. There have been several conceptualizations of how low-intensity RFR energy is absorbed and manifested in non-thermal or athermal effects. Adey (1993) presents a number of ideas on the topic. Discussion of the mechanisms associated with such concepts will not be included in the present review. Instead, the subjeci matter of this paper will focus on examples in the scientific literature of non-thermal/athermal studies and how each classifies itself. Non-thermal and athermal will be treated as identical phenomenon. Such an approach may lead to a clarification of the variety of definitions in contemporary literature and provide an incentive for a universally acceptable technical definition of non-thermal RFR effects.
NON-THERMAL DEFINITIONS
A technical definition of a non-thermal effect produced by exposure to RFR should be based on information empirically obtained. However, defining characteristics are often ignored and only infrequently presented a priori. Most of these are seldom revealed in the literature dealing with the topic. Only after reading a specific research article does one become aware of what was meant by "non- thermal" in that instance. These "working definitions" are unique, varied, and consist of at least seven or more as illustrated in Table 1. The first definition in this table involves the situation where a thermometer is placed in a specimen and temperature is measured. If there is no measurable change in temperature the exposure is by definition non-thermal. For example Van Dorp et al. (1998) used a fiberoptic thermometer to measure the temperature of an in vitro preparation of mouse myeloma and hybridoma cells exposed to 2.45-GHz microwaves. No effects were seen as long as a physiologically normal temperature of 37 degrees C was maintained. On the other hand, D'Inzeo et al. (1988) did find
342

NON-THERMAL DEFINITIONS
differential effects when they exposed cultured myotubes from chick embryos to 10.75 GHz at a power density of 50 uW/cm2 and affected the ACh-activated single-channel openings and induced current in membrane patches. There were no temperature changes observed in the bath temperature. However, how their thermistor only had a resolution of 0.1-degree C for these in vitro preparations.
TABLfcI Indices and References of Non-Thermal Definitions
Index Mode Reference
AT = 0 CWorP
AT < Sham CWorP
AT< 0 EHPP
SAR < 0.4 W/kg CWorP
PD< l0mW/cmJ CWorP
RFR AT = Conventional AT CWorP
P AT = CW AT PvsCW
Van Dorp et al. (1998)
Cleary(l996)
Raslearetal. (1993)
Klug et al. (1997)
Akoevetal. (1995)
Zakharova et al. (1993)
Adey(1999)
One aspect of the D'lnzeo et al. (1988) article is that temperature increases could have occurred up to 0.1 degree C. If that had been the case then it may be possible that the positive effect was thermal, particularly if there were studies showing similar effects of such small temperature increases. The absence of studies on the effects of small temperature increases is not evidence that such effects will or will not occur. It should be clearly demonstrated that conventional temperature changes do not result in the measured effect, even when one ascertains that temperatures have not varied.
A slight modification of the first example is the situation wherein an RFR exposed preparation is compared with a sham and the temperature changes, if any, are identical before, during and after exposure. Any biological effects that occur in the exposed preparation are referred to as non-thermal. Cleary (1996) reviews a number of studies under this condition where extensive biological effects have been observed in vitro. Most of these effects were obtained under thermostatically regulated isothermal conditions (37' ± 0.1° C) with sample temperatures continuously monitored.
The non-thermal nature of these initial two definitions may apply only to in vitro experiments. On the other hand, when living animals are exposed to RFR under these conditions, AT = 0 and AT < Sham, it is possible that homeostatic processes will allow an animal to compensate for the additional energy and not display whole-body temperature differences. The compensation process itself may be responsible for any observed effects.
Another variation often erroneously reported as a non-thermal effect is that of "microwave hearing." Contemporary research shows this acoustic experience to be a result of a thermoelastic expansion and propagation of an acoustic wave induced by microwaves (Lin et al. 1988). However, these relatively high peak power pulses are very short and at a low average power density resulting in insignificant whole body temperature changes (< 0.01° C). Nevertheless, the microwave auditory response is probably the most sensitive bioeffect consistently found in the RFR research literature. This acoustic effect is more than likely responsible for the results of several experiments demonstrating differences between CW and pulsed RFR on animal behavior at low average powers. It may be possible to control for potential RFR produced acoustic effects by having a group of animals exposed with an acoustic masking noise or a group that experiences an audible sound at the same repetition rate as that of the RFR pulse.
An even greater high power pulse than that producing microwave hearing is that generated by unique military devices, e.g., TEMPO, with peak power in excess of 700 MW. These extremely high power pulses (EHPP) are very short, 80 ns, and are presented at low average powers resulting in SARs
343

DE LORGE
well below 0.1 W/kg (Raslear et al. 1993). It was found that cognitive function in rats could be affected by exposure to these pulses. Whole body temperatures associated with EHPPs are presumed to be insignificant and hence, thermal effects would not occur. However, when temperature measurements were made on rat cadavers exposed to these high power pulses it was observed that changes in the skin temperature in the area of the nose were as great as 0.4 degrees C.
Unless it has been empirically demonstrated that small temperature increases have no causal effect on the dependent variables of the latter two examples, it is inaccurate to say that an effect is non- thermal except, perhaps, in those cases where no temperature changes occur. In fact, even if no temperature increase is seen during exposure a transient increase might occur within a post exposure period of up to one hour following irradiation with pulsed RFR at low average power, SAR = 0.6 W/kg (Laietal. 1984).
Exposure of an organism to RFR will introduce energy throughout all areas illuminated by the radiation. An illuminated side of a subject may absorb substantial amounts of energy while the shadowed side may absorb none. Absorption of this energy is dependent upon characteristics of the RFR, the environment, and the organism. If the exposed subject is of the appropriate size in relation to the RFR wavelength it may absorb energy throughout. Whenever a measure of absorption is used such as the specific absorption rate, SAR, these aspects should be kept in mind.
Many studies define a non-thermal exposure in terms of how much energy is absorbed as measured or estimated by SAR. An example of this is seen in the work of Klug et al. (1997) who exposed rat embryos to SARs of 0.2, 1.0, and 5.0 W/kg at a frequency of 150 MHz. The embryos were grown in culture in containers specifically aligned in either the magnetic or electric field. SARs were estimated based on transmitter power levels. No temperature measurements were reported. All of these in vitro SAR values were treated as non-thermal and no significant effects on embryo growth or differentiation were found.
Even more frequently seen in the literature are the reports of non-thermal effects where the only criterion for non-thermal is the power density level. Abstracts of several Russian papers fall in this category; e.g., Koveshnikova and Antipenko (1988) reported effects at microwatt levels. Even higher levels up to 10 mW/cm7 have been referred to as being in the non-thermal range. Akoev et al. (1995) conducted studies on skates with power densities in the range of 1-5 mW/cm2 at frequencies between 37- 55 GHz. The ampullae of Lorenzini were shown to increase their firing rate at low intensities. Inhibitory responses were found when the highest power densities were used. Although no temperature measurements were taken the effects seen above 5 mW/cm2 were thought to be thermal while the lower levels were proposed to have their effect by generating D.C. potentials in the vicinity of electroreceptor duct openings.
Another approach compares the effects of heating with RFR to heating with conventional heating sources (Phelan et al. 1994). Different effects or differences in the effects of equivalent thermal loads are interpreted as attributable to non-thermal mechanisms. There are problems in this interpretation when living organisms are the experimental subject. Increased energy absorption will increase body temperature, which in turn will initiate thermoregulatory mechanisms to reduce body temperature. Among these mechanisms are sweating and increased peripheral blood flow which may increase reflection of the RFR at the skin surface. All of this, in addition to the possibility of energy hot spots and uneven energy distribution, should produce different effects of RFR heating and conventional heating. There is no need to resort to an interpretation of non-thermal mechanisms in such comparisons. In vitro experiments do not suffer from the same criticism although the differential microheating of tissues with RFR versus conventional sources could account for observed differences especially when one considers that the instant heating rate of a very high powered pulse is orders of magnitude faster than conventionally conducted heat (Zakharova et al. 1993; Czerka et al. 1997).
The final definition in the above table deals with studies where specific bioeffects were observed with amplitude modulated or pulsed RFR. Yet no such effects were found when CW or frequency modulation at the same SAR was used. Adey et al. (1999) examined the effects of standard, 836 MHz, digital phone RFR intensities similar to those experienced by hand-held mobile phone users on spontaneous or induced brain tumors in rats. North American Digital Cellular pulsed modulation (50 Hz) was used. A reduction in the incidence of tumors in the exposed animals was found. Later, Adey et al. (2000) exposed rats to the same frequency at similar power levels but this lime the carrier wave was frequency modulated. No effects on brain tumors were found. The observation that effects were obtained with pulsed RFR versus no effects with frequency modulation was attributed to alhermal or non-thermal mechanisms.
This brief overview of non-thermal literature reveals that many studies fail to actually measure tenipeiaiuie and only assume that lliemial effects wcic absent. Oilier studies use thermostatically
344

NON-THERMAL DEFINITIONS
regulated (in vitro) preparations while in vivo experiments depend upon the thermoregulatory system of an animal to dissipate heat from an RFR exposure. In both instances thermal causation of bioeffects may not have been prevented and it may be possible for phase transition thresholds of the cell membrane or thresholds for other biophysical triggers to be breached by very small temperature increments. Even where temperatures have been measured, different heating sources may have resulted in nonuniform microscopic heating of cells, tissues, etc. that could have been responsible for any observed differences.
Although there may be several others, one example of non-thermal bioeffects that escapes a thermal explanation is where different effects are found with pulsed or amplitude modulation when compared with CW or frequency modulation at similar low average power levels. Experiments with llicse comparisons should be replicated in several laboratories and hopefully testable explanations will be forthcoming.
ACKNOWLEDGMENTS
Contract grant sponsor: U.S. Army Medical Research and Materiel Command. Contract grant number: DAMD17-94-C-4069.
The views expressed in this article arc those of the author and should not be construed as reflecting the official policy or position of the Department of the Army, the United States Government, or McKesson BioServices.
The author is grateful for the valuable comments on this manuscript of D. Blick, M. Bornhausen, J. D'Andrea, S-T. Lu, S. Mathur, J. Merritt, A. Pakhomov, and R. Seaman along with the assistance of L. Allen.
REFERENCES
Adey, W.R., Biological effects of electromagnetic fields. I Cell BioChem , 51(4), 410-6,1993.
Adey, W.R., Byus, C.V., Cain, CD., Higgins, R.J., Jones, R.A., Kean, C.J., Küster, N., MacMurray, A., Stagg,
R.B., Zimmerman.G., Phillips, J.L., Haggren, W. Spontaneous and nitrosurea-induced primary tumors
of the central nervous system in Fischer 344 rats chronically exposed to 836 MHz modulated microwaves. Radiat Res, 152(3), 293-302,1999.
Adey, W.R., Byus, C.V., Cain, CD., Higgins, R. J., Jones, R.A., Kean, C. J., Küster, N. MacMurray, A., Stagg, R. B., Zimmerman, G., Spontaneous and nitrosourea-induced primary tumors of the central nervous system in Fischer 344 rats exposed to frequency-modulated microwave fields. Cancer Res, 60(7), 1857-63, 2000.
Akoev, G. N-, Avelev, V. D., Semenjkov, P. G., Reception of low-intensity millimeter-wave electromagnetic radiation by the electroreceptors in skates. Neuroscience, 66(1), 15-7,
1995.
Czerska, F.. M., Casamentn, J., Ning. I. T., Davis. C, Physical Characteristics and Possible. Biological Effects of Microwaves Applied in Wireless Communication. Workshop held in
Rockville, MD, 1997.
Cleary, S. F., In Vitro Studies of the Effects of Nonthermal Radiofrequency and Microwave Radiation. In: Bernhardt, J. H., Matthes, R. Repacholi, M. H. (eds). Non-thermal effects of RF electromagnetic fields. Proceedings of the International Seminar of the Biological effects of non-thermal pulse and amplitude modulated RF electromagnetic fields and related health hazards. Muenchen-
Neuherberg,. 119-130, 1996.
D'Inzeo, G., Bcrnardi, P., Eusebi, F., Grassi, F., Tamburello, C, Zani, B. M., Microwave Effects on Acetylcholine-Induced Channels in Cultured Chick Myotubes. Bioelectromagnetics, 9,
363-372, 1988.
345

DE LORGE
Klug, S., Hetscher, M, Giles, S., Kohlsmann, S., Kramer, K., The lack of effects of nonthermal RF electromagnetic fields on the development of rat embryos grown in culture. Life Sciences, 61,
1789- 1802,1997.
Koveshnikova, I.V., Antipenko, E.N., Changes in body weight of rats during irradiation with microwaves of
nonthermal intensity. Radiobiologiia, 28(4), 561-3, 1988.
Lai, H., Horita, A., Chou, C.K., Guy, A.W., Microwave-induced postexposure hyperthermia: involvement of
endogenous opioids and serotonin. IEEE Trans. Microwave Theory Tech, MTT-32, 822-887, 1984.
Lin, J.C., Su, J.-L., Wang, Y., Microwave induced thermoelastic pressure wave propagation in the cat brain. Bioelectromagnetics 9, 141,1988.
Phelan, A.M., Neubauer, C. F., Timm, R., Neirenberg,]., Lange, D. C, Atherma) alterations in the structure of the canalicular membrane and ATPase activity induced by thermal levels of microwave radiation. Radiat Res, 137(1), 52-8, 1994.
Raslear, T.G., Akyel, Y., Bates, F., Lu, S-T., Elson, E.C., Akyel, B., Mathur, S. P., The behavioral toxicology of
high-peak, low-average power, pulsed microwave irradiation. Technical Report #001-92, Department of Microwave Research, Walter Reed Army Institute of Research, Washington, D.C. 20307-5100,25 January 1993.
Van Dorp, R., Marani, E., Boon, M. E., Cell replication rates and processes concerning antibody production in vitro are not influenced by 2.45-GHz microwaves at physiologically normal temperatures. Methods, 15(2), 151-9, 1998.
Zakharova, N. M., Alekseev, S. I., Zhadin, M. N., Effect of SHF-radiation on spontaneous impulse activity of cerebral cortex slices in vitro. Biofizika, 38(3), 520-3, 1993.
346

Bioelectromagnetics 20:216-223 (1999)
Pulsed Microwave Induced Light, Sound, and Electrical Discharge Enhanced
by a Biopolymer
Johnathan L. Kiel,1* Ronald L. Seaman,2 Satnam P. Mathur,2
Jill E. Parker,1 John R. Wright,3 John L. Alls,1 and Pedro J. Morales1
'Directed Energy Bioeffects Division, Air Force Research Laboratory, Brooks AFB, Texas 2McKesson BioServices and U.S. Army Medical Research Detachment,
Brooks AFB, Texas department of Physical Sciences, Southeastern Oklahoma State University,
Durant, Oklahoma
Intense flashes of light were observed in sodium bicarbonate and hydrogen peroxide solutions when they were exposed to pulsed microwave radiation, and the response was greatly enhanced by a microwave- absorbing, biosynthesized polymer, diazoluminomelanin. A FPS-7B radar transmitter, operating at 1.25 GHz provided pulses of 5.73 ± 0.09 »is in duration at 10.00 ± 0.03 pulses/s with 2.07 ± 0.08 MW forward power (mean ± standard deviation), induced the effect but only when the appropriate chemical interaction was present. This phenomenon involves acoustic wave generation, bubble formation, pulsed luminescence, ionized gas ejection, and electrical discharge. The use of pulsed microwave radiation to generate highly focused energy deposition opens up the possibility of a variety of biomedical applications, including targeting killing of microbes or eukaryotic cells. The full range of microwave intensities and frequencies that induce these effects has yet to be explored and, therefore, the health and safety implications of generating the phenomena in living tissues remain an open question. Bioelectromagnetics 20:216-223, 1999. Published 1999 Wiley-Liss, Inc.*
Key words: radio frequency radiation; diazoluminomelanin; free radicals
INTRODUCTION
A peroxidizing mixture of diazoluminomelanin (DALM), a microwave absorbing polymer, can generate thermochemiluminescence (TCL), steady-state lumines- cence based on the temperature, when exposed to micro- wave radiation [Kiel et al., 1990; Kiel and O'Brien, 1991]. TCL will not proceed without the presence of hydrogen peroxide and a source of carbon dioxide (so- dium carbonate or bicarbonate can be used in place of the gas). The polymer, formed in bacteria, makes them sen- sitive to a profound microwave biological effect as well. A moderate rate of energy absorption (100 mW/g) of 2450-MHz radiation has previously shown a large mag- nitude of kill (5 logs) of Bacillus anthracis (Anthrax bacteria), when the bacteria were held at 37 °C during exposure under peroxidizing conditions, after cultivation on medium inducing DALM biosynthesis [Bruno and Kiel, 1993]. In 1989, we [Kiel and Seaman, unpublished data] observed flashes of light in peroxidizing solutions of the water-soluble TCL polymer DALM with applied microwave pulses. In those preliminary experiments, mi-
Published 1999 Wiley-Liss, Inc. ^This article was prepared by a group consisting of both United States government employees and non-United States government employees, and as such is subject to 17 U.S.C. Sec. 105.
crowave energy at 2450 MHz was delivered as 40-u.s pulses at 1-3 pulses/s. Application was made with 3.6-mm OD open-ended semirigid coaxial cable con- nected to an EPSCO PG5KB/5238H source, in contact either with sample fluid or with the outside of its cuvette; both approaches were successful in generating flashes of light. Here, we provide evidence for a pulsed-microwave
Grant sponsor: United States Air Force Office of Scientific Research and the U.S. Army Medical Research and Materiel; Grant number: DAMD17-94-C-4069.
The views, opinions, and/or findings contained in this report are those of the authors and should not be construed as an official Department of the Army or Department of the Air Force position, policy, or decision unless so designated by other documentation.
♦Correspondence to: J.L. Kiel, AFRL/HEDB, 2503 Gillingham Drive, Bldg. 175E, Brooks AFB, TX, 78235-5102. E-mail: johnathan. [email protected]
Received for review 14 August 1997; Final revision received 7 August 1998

Microwave Induced Light Production 217
mechanism for light production and focusing of energy deposition that is enhanced by DALM.
MATERIALS AND METHODS
Chemicals and Biosynthesis
Luminol (5-amino-2,3-dihydro-1,4-phthalazinedi- one), 3-amino-L-tyrosine dihydrochloride (3AT), sodium nitrite, and potassium nitrate were obtained from Sigma (St. Louis, MO). Diazoluminol was prepared by mixing 0.17 g of luminol and 0.65 g of NaN02 in 120 ml of distilled water and stirring for 35 min. The solution was filtered twice. In the case of luminol and bicarbonate solutions used, clear supernatants were collected off sat- urated aqueous solutions of luminol and NaHC03.
Biosynthetic DALM solutions were prepared from Escherichia coli JM109, pIC20RNR,, bacteria (Amer- ican Type Culture Collection # 69905) grown on medium containing 3-amino-L-tyrosine, luminol, and potassium nitrate in a tryptocase soy broth base (U.S. Patent 5,156,971) for 5 days. The unfrozen pigmented superna- tant was removed from above the ice of frozen cultures and was diluted as noted below. The 1:10 dilutions of DALM were made in sodium bicarbonateAuminol satu- rated solutions, except that when determining their opti- cal absorptions at 350 nm, deionized water was used instead. Optical absorption of 1:10 DALM solution at 350 nm wavelength was 0.15. Poly-diazotyrosine (pDAT) was synthesized like DALM, as previously re- ported [Kiel and O'Brien, 1991], but with the exclusion of luminol, and was dissolved in water until its optical absorption at 350 nm matched that of the respective DALM solutions. These proportions were preserved when solutions prepared with sodium bicarbonate/lumi- nol saturated solutions were substituted for water.
Reaction Mixtures
Premixed reaction mixtures for 1:10 DALM or pDAT contained 1.8 ml of saturated sodium bicarbonate/ luminol and 0.2 ml of DALM or pDAT neat solution, respectively, to which was added 1.2 ml of diazoluminol solution and additional 0.33 ml of saturated sodium bi- carbonate/luminol solution, with or without 0.495 ml of 3% hydrogen peroxide (added last). Solutions of 1:100 DALM or pDAT differed from the 1:10 solutions in containing 1.2 ml 1:10 dilution of diazoluminol solution and 0.2 ml 1:10 DALM or pDAT in sodium bicarbonate/ luminol saturated solutions, with additional 0.66 ml sat- urated sodium bicarbonate/luminol solution, with or without 0.66 ml of 3% hydrogen peroxide. Except for the 3% hydrogen peroxide, which was added to samples previously exposed to microwave radiation, when com- ponents of the reaction mixtures were deleted, saturated
sodium bicarbonate/luminol solution was substituted for the excluded components. This substitution was not made when sodium bicarbonate solution, deionized wa- ter, or hydrogen peroxide or any of these used in com- bination (Table 1) were exposed. All reactions were begun at room temperature (23 °C) but were bulk heated with forced hot air from 23.3 °C to 54.5 °C for DALM and pDAT samples without hydrogen peroxide and from 28.2 °C to 54.4 °C for those same samples with hydrogen peroxide. This scanning of temperature was required because we did not know what the optimal temperature or level of thermochemiluminescence was required to observe the pulse effects.
Microwave Exposure Samples were placed in 15-ml polystyrene tubes
without tops. As shown in Figure 1, a single tube was held by a polyvinyl support beam attached to a section of WR-650 microwave waveguide with a flangeless open- ing of 16.5 X 8.3 cm. The long dimension of the waveguide opening was horizontal, providing a vertical electrical field. When placed in a hole in the beam, a tube was vertical with its center 7.6 cm from the waveguide opening and was centered horizontally with respect to the opening. Microwave pulses were generated by a FPS-7B radar transmitter operating at 1.25 GHz. The transmitter provided pulses of 5.73 ± 0.09 |xs in duration at 10.00 ± 0.03 pulses/s with 2.07 ± 0.08 MW forward power (mean ± standard deviation). During exposures, temper- ature was monitored by means of nonperturbing Vitek 101 Electrothermia Monitor and Luxtron probes in and near the bottom of the sample. Specific absorption rates (SAR) determined in separate exposures of duplicate samples are listed in Table 1. These values were calcu- lated from the rate of rise of temperature (cC/s) in re- spective samples measured by nonperturbing fiberoptic Luxtron MPM probes: SAR = c(dT/dt). Specific heat c was taken to be that of water, 4180 J/kg/°C, for all samples. Equivalent peak SAR of the pulses was approx- imately 2 X 10⁴ times the time-averaged SARs reported in Table 1.
Sound and Light Recordings Sound was recorded on the audio track of videotape by using an RCA BK-6B M-l 1017A microphone outside of the anechoic chamber. Sound was directed to the micro- phone through a plastic tube (1.9-cm ID) connected to a plastic funnel positioned 15 cm above the sample tube. The acoustic path between the top of the sample tube and the microphone was 4.63 m long, with a calculated propagation delay of approximately 13.4 ms. The video images for analysis were recorded with an ITT model #F4577 low-light sensitive black/white camera at a nor- mal video frame redording rate. Images to spatially re-

08/14/01 07:03 FAX 301 619 2745 MRMC-RMI 'S 006
218 Kiel et at.
TABLE 1. Summary of Flash Responses Observable on Video Recordings*
Simple
Deionized water H202
NaHCOj w/H202
Luminol NaHC03
w/HA Luminol diaz/oluminol
NaHC03
w/HA DALM
(1:10) w/H20,
DALM (1:100) w/H2Oj
pDAT (L10) w/HA *
pDAT (1:100) W/HJOJ
SAR (W/kg)
50 + 40±
340± 370 ±
300 + 400 +
360 ± 370 +
0.0* 20 40 20
50 20
20 60
570 + 230 480+ 60
360 ± 50 610 ± 150
370 ± 440±
60 70
320 + 100 400+ 60
Onset delay (s)
N/A N/A N/A
94
301 12
N/A N/A
68 10
10 63
N/A 290
85 134
Flash burst type
None None None Sporadic
Sporadic Continuous
None None
Sporadic Sporadic
Sporadic Sporadic
None Sporadic
Sporadic Sporadic
Number of bursts
14
3 1
4 8
6 20
12 10
Maximum burst duration (s)
115
<1 242
9 38
47 20
<1
93 <1
Duration observed (s)
472 464 429 4:54
471 254
482 438
424 390
315 444
461 571
432 677
* SAR is the average (spatial and temporal) specific absorption rate of microwave energy. DALM (diazoluminomelamn) and diazotyrosine) solutions all contained luminol, diaznluminol, and sodium bicarbonate. * ± one standard deviation; n =» 2 to 6.
pDAT (poly-
solve the light source were recorded with an Optronics DEI-470 integrating color camera at various frame inte- gration times. The arrangement of this apparatus is
Bide View
Nonmetailc support
Tubirni to microphone
Inverted funnel
WR-650 waveguide
Fig. 1. Side view of sample positioned for exposure. The 15-ml polystyrene tube containing the sample was held by a nonme- tallic support beam made of Polyvinylchloride. The beam was securely fastened to the WR-650 waveguide by brackets made of the same material. The inverted plastic funnel directed sound produced in the sample through tubing connected to a micro- phone outside the anechoic chamber. Not shown in the sketch are secondary support braces and nonperturbing temperature probe.
shown in Figure 2. The exposure was performed in an anechoic chamber sealed off from external light sources. The cameras were placed in screen-wire Faraday cages with holes cut in the cages so as not to block the light path to the lenses.
For analysis, videotape was played on a Panasonic TV/Recorder AG-560 (27-cm diagonal screen) with con- trast set at maximum and brightness at minimum. The video image of an activated, luminescing solution was approximately 3.5 cm from the bottom of the sample tube to the fluid meniscus and 1.7 cm wide.
For sensing the light emissions, a sensing element of an EXTECH Light Adapter 4010201 was securely fastened to a vertical plate having a variable aperture. The plate was held in place in front of the monitor screen by stercotaxic manipulators, which allowed precise placement of the aperture-sensor combination. The signal fiom the light adapter was amplified by a Krohn-Hite 3322 Dual Filter (20 dB, low pass max flat, 51 kHz), and then by a Gould Model 20-4615-58 Universal Amplifier (ext. mV, 1 V F.S., DC-30 Hz) and displayed on a Tektronix 2430A Digital Oscilloscope and/or recorded on a Gould TA2000 Chart Recorder.
The audio output of the monitor was amplified by a Krohn-Hite filter (0 dB, high-pass RC, 900 Hz) and by a Rockland Model 1022F Dual Hi/Lo filter (20 dB, high-

Microwave Induced Light Production 219
Top View — Camera lines of sight Nonmetallic support ~F
Shielded box with color camera
WR-650 A waveguide
Shielded box with B&W camera
Port for cables and tubing To radar transmitter
Wall of shielded chamber
20 cm
Fig. 2. Top view of the experimental apparatus inside the ane- choic chamber. The shielded boxes containing cameras were supported from the floor and were approximately 76 cm from the sample tube. Lines of sight to the sample are shown as dotted lines. Not shown are cables from the cameras, tubing for sound transmission, and the nonperturbing temperature probe, which all passed through the cable port to instrumentation outside the chamber. Microwave absorbing material lining the interior wall of the chamber, secondary support braces, and funnel for sound pick up are also not shown.
pass RC, 11 Hz). The output of the latter was connected to the second Rockland amplifier (0 dB, low pass, 60 Hz) through a 1N914B signal diode to provide a rectified signal. The amplified signal or the amplified and rectified signal was displayed and/or recorded along with the light signal.
RESULTS
We first attempted to reproduce the original 1989 observation by formulating DALM solutions with max- imal TCL. One such solution contained sources of carbon dioxide and hydrogen peroxide, which are required for DALM, itself a complex mixture of a polymer of tyrosine and covalently and noncovalently linked luminol and diazoluminol, to luminesce. Another solution was made by adding a polymer formed from diazotyrosine (pDAT), that shows similar TCL to DALM. When exposed to pulsed (10/s) 1.25-GHz microwave radiation, these solu- tions generated flashes that were clearly distinguishable on video recordings by low-light intensity video cameras.
Figure 3 shows sequential video frames that dem- onstrate baseline TCL and flashes induced by microwave pulses. As in the original observations in 1989, the flashes appeared in bursts, i.e., not with every microwave pulse, and were accompanied by audible pops. The in- tensity of the pops correlated with the intensity of the flashes, as clearly shown by the examples of processed sound and light signals in Figure 4. In Figure 4D, the first
of each pair of peaks in the sound signal from a DALM solution was due to a signal induced on the audio channel by operation of the microwave transmitter. The earlier peak provided a convenient reference for timing. Note the low baseline luminescence (dashed lines in Fig. 4) and rapid increases in luminescence indicating flashes. Ripples on the light signal were due to the video frame rate. In Figure 4B, the luminescence was higher than in A (see inserted scale) because of the activation by hy- drogen peroxide. The 10 pulse/s variations in lumines- cence occurred in synchrony with the microwave pulses. In Figure 4C, by using only luminol, bicarbonate, and hydrogen peroxide, the luminescence was high and the flashing was persistent. However, not all the flashes were accompanied by a loud pop. In Figure 4D, where the tracing time scale for activated 1:100 DALM solution was expanded, the microwave artifact (brief, coincident with the flashes later in the record) and pops (longer, damped fall off recordings), due to the sound propaga- tion, there was a 13.5 to 14 ms delay. The small waves seen in the light signal were attributable to the video frame rate. Within the time resolutions of the recorded signals and analysis procedures, recorded flashes and pops seem to be occurring at the same time, coincident or nearly coincident with each microwave pulse. Figure 4 also illustrates that lower intensity pops occurred without flashes before and sometimes after bursts of flashes, that were, in turn, accompanied by higher intensity pops.
Integrated imaging (Fig. 3) clearly demonstrates that flashes originated from discrete areas in the menis- cus of the sample. Rashes were apparently independent of TCL in liquid below the meniscus. The images strongly suggest discharges in gas above the liquid. In all cases in which flashes were frequent and intense, bubbles were observed in liquid samples during and after micro- wave exposure. The high-intensity flash among the series of less intense flashes of ITT camera images in Figure 3 was attributable to inherent differences in flash intensity or the missing of the peak of the short-duration flash between video frames.
To further investigate the source of the flashes, we examined the components of DALM solutions separately and in combination using equal sample volumes and the same incident microwave pulses (Table 1). Deionized water, sodium bicarbonate, and hydrogen peroxide solu- tions all failed to demonstrate TCL and flashes, despite extended exposure to microwave pulses. Biosynthetic DALM solutions without hydrogen peroxide activation displayed bursts of flashes with greater regularity, but lower intensity, than the same solutions with hydrogen peroxide added. When DALM was excluded, solutions containing diazoluminol and luminol, as well as sodium bicarbonate with and without hydrogen peroxide, showed no flashes, although the peroxide-activated solutions

08/14/01 07:04 FAX 301 619 2745 MRMC RM1 "? n 0 f<
220 Kiel et al.
Fig 3. Two series of video frames showing repetitive flashes with microwave exposures in samples of sodium bicarbonate and H,0, solution with and without lumlnol added. A: (lumnol added) Images from an iTT model #F4577 low-light sensitive Wack/whlte camera, normal video frame rate recording; each
frame is a sequential frame representing 33 ms oli Ration time. B: (no lumiroi) Images from an Optronics DEI-470 inte- grating camera, recording at various frame Integration times (15,
8, 4, or 1 s).
showed strong background luminescence. When the di- azoluminol was excluded from the luminol and bicarbon- ate solutions, flashes occurred sporadically without hy- drogen peroxide, but more intensely in the peroxide- activated solutions. These flashes arose from discrete locations on the menisci, discharging into the air space above the tube but not outside the tube. Finally, when exposed to microwave pulses, sodium bicarbonate and hydrogen peroxide solution produced bright flashes that were sustained for several seconds.
In all cases in which flashes were observed, a delay was observed after initiation of microwave pulses until the firing of the first flash. The delay ranged from 10 and 12 s for hydrogen-peroxide-activated DALM and lumi- nol solutions, respectively, to 5 min for nonactivated luminol solutions. This observation and the presence ot gas bubbles in all cases in which flashes were noted suggest that formation of gas bubbles that collected in the menisci was necessary for the flash. DALM seemed to catalyze the formation of bubbles in nonactivated solu-

Microwave Induced Light Production 221
«V
1.BV i]ii,i.i,liii.,lli»iii]iiUllll,l.liiii.iiil,i.iiiiUlJlllllll^^
B.
6V
1.SV WJWWill MJuiiiwiiiiiJuiiS luiiiiiiiiiiiintUi
A A.
Fig. 4. Processed sound (top in each set) and light (bottom in each set) signals from videotape records from an ITT low-light sensitive camera. The scale insets are the chart recorder de- flections in volts (6 and 1.5 V for sound and light intensities, respectively, for A, B, and C and 0.5 V for D) and the time scale in seconds for A, B, and C and milliseconds for D. A: Sample rectified-sound and light signals from diazoluminomelanin (DALM) (1:10) solution. Aperture open full. B: Sample rectified- sound and light signals from DALM (1:10) solution with H202. Aperture approximately 1-cm diameter to reduce baseline lumi-
'!>■ I» p—f*—r*—r k-4 «—+*-+*•> »
nescence signal. C: Sample rectified-sound and light signals from an aqueous solution containing luminol, NaHC03, and H202. Aperture approximately 1 cm. D: Sample sound and light signals from DALM solution (1:100) with H202 on an expanded time scale at the onset of a flash burst. Aperture full open. The amplified or rectified-amplified audio signal was recorded at 1 V/cm for A-C and 0.25 V/cm for D. In D, output of a Rockland filter (0 dB) was connected directly to the chart recorder. The light signal was recorded at 0.25 V/cm for A-D.
tions because the flashes were more sustained than in luminol solutions alone.
DISCUSSION
An intermediate acoustic mechanism may play a role in the phenomenon observed here through ther- moelastic expansion caused by rapid temperature rise due to the microwave pulse [Foster and Finch, 1974; Borth and Cain, 1977; Lin, 1980; Chou et al., 1982]. It should be noted that the specific absorption per micro- wave pulse in our experiments, 20-50 J/kg, was at least three orders of magnitude larger than for microwave pulses known to elicit auditory sensations [Seaman and
Lebovitz, 1989]. However, we have recently generated the acoustic part of the effects enhanced by DALM with 6 kW peak power pulses (10 PPS; 1.5-ms pulse width) of 2.06 GHz radiation. This level is 3 X 10"3 times the level described in this paper (unpublished results).
The effects reported here could be explained by the following sequence: (1) the products of the chemical reactions produce enhanced absorption of the microwave energy; (2) the pulse form of the radiation and the spe- cific molecular absorption stimulates vibrations that be- come sound; (3) the container resonates at certain fre- quencies of the sound; (4) the resonance amplifies the sound; (5) the sound leads to cavitation, bubble forma- tion, and bubble collapse yielding luminescence; (6) fi-

08/14/01 07:05 FAX 301 619 2745 MRMC-RMI 7if"n
222 Kiel et a».
nally, the gas is ejected as a plasma <f* ^ **£!
S Ä ionized gas that then electrically discharge £cause of the microwave radiation's electric field. The secular "lightning in a bottle" effect imaged in F g- speaacuiai uguu. b -riwiart of discharge above the ure 3 is the consequence. The lack ot dW - tube opening and the absence of an electrical arc to the mLTave waveguide also support this conclusion and "t other sources of electrical ^charg-^so^ building of sound intensity with the burst of flashes «uLests a build up of hot ionized gas before the dis- chJgTne sporadic nature of the flashes, especially S ma or discharges were observed, suggests a pwt- We tepletion of the ionized gas that must again build up for Sequent flashes. The popping observed has also bin Sd in classic ultrasonic-induced sonlumines- bcS e ^and is believed to result from the; re— of the shock wave IWalton and Reynolds, 1984^ Glaru loofi- Barber et al 1997]. The popping reported here is
is not chaotic. It follows the pulse rate of ^ ™cruwave adion and the pops show evidence of a build up of the
sold pulses conSponding to the microwave radiation
^S SÄ-. - the lack of pulsed soimd generation in sodium bicarbonate and hydrogen peroxide Sons alone suggest that specific gases may be nee- Zra for the effect that occurs when these reactants are Sutl together. Also, the high nonphysiologic level of Sbonate used here was not sufficient to generate the e feTT^fore, it was not merely dependent on high 2? concenLon. The carbonate radical has been previ- ously^Sd as the major product of r**™£~ S Xbonate or sodium carbonate and hydrog n JeTxidc [Michelson and Maral, 1983]. Other^s ibili- Sare Superoxide, hydroxyl, and f^J**^ also suspect thai peroxycarbonate may be> omedJhese substances may be released in hot vapors or as gases. Ihe absencTof flashes when diazoluminol was present in S, bicarbonate, and hydrogen P""*^« suggests that this compound is quenching the reactive radical or ion that mediates the phenomenon, fhe
?o SL It has been recently reported to be a SL-enhancing
Tompound when ultrasound * "XT°^ [MaSdox et al., 1998]. When DALM or pDAT was oresent the quenching was reversed. This reversal sug P TL nAI M or oDAT can assist in the generation of
SSS^S^«^-«radiation aid tha; S ratals are likdy to be involved. The mteraction of
diazoluminol with the radicals was ,«^r«Pon«"='
not sufficient to explain the resultJ^™iwis w
the same kind of chemical «^J^f ^"Su„, of produce the effects obslerv^Al^froughti*^ ^ anthrax was done with continuous w*
microwave radiation.
CONCLUSIONS
nsc«s»ity m cen f ^ generalion by the phenomena;(2)tteneres^.1» « ws te
--Sis-
tion.
ACKNOWLEDGMENTS
TnsenSe Radiofrequency Radiation Facility for provid ing access to the FPS transmitter.
REFERENCES
143.

Microwave Induced Light Production 223
Borth DE, Cain CA. 1977. Theoretical analysis of acoustic signal gener- ation in materials irradiated with microwave energy. IEEE Trans Microwave Theory Tech 25:944-954.
Bruno JG, Kiel JL. 1993. Effect of radio-frequency radiation (RFR) and diazoluminomelanin (DALM) on the growth potential of bacilli. In: Blank M, editor. Electricity and magnetism in biology and medi- cine. San Francisco: San Francisco Press, p 231-233.
Chou CK, Guy AW, Galambos R. 1982. Auditory perception of radio- frequency electromagnetic fields. J Acoust Soc Am 71:1321-1334.
Foster KR, Finch ED. 1974. Microwave hearing: evidence for ther- moacoustic auditory stimulation by pulsed microwaves. Science 185:258-258.
Glanz J. 1996. The spell of sonoluminescence. Science 274:718-719. Kiel JL, O'Brien GJ. 1991. Diazoluminomelanin and a method for prepar-
ing same. U.S. Patent 5,003,050. Kiel JL, Gabriel C, Simmons DM, Erwin DN, Grant EH. 1990. Diazolu-
minomelanin: a conductive luminescent polymer with microwave
and radiowave absorptive properties. In: Pedersen PC, Onaral B, editors. Proceedings of the twelfth annual international conference of the IEEE Engineering in Medicine and Biology Society, Vol.12, No. 4, Philadelphia: IEEE, p 1689-1690.
Lin JC. 1980. The microwave auditory phenomenon. Proc IEEE 68:67-73. Maddox L, Reeves M, Wood K, Roberts K, Studer J, Wetzel J, Smith T,
Holwitt E, Alls J, Kiel J, Wright JR. 1998. Acoustic wave dosim- etry based on diazotized luminol solutions. Microchem J 58:209- 217.
Michelson AM, Maral J. 1983. Carbonate anions: effects on the oxidation of luminol, oxidative hemolysis, -y-irradiation and the reaction of activated oxygen species with enzymes containing various active centres. Biochimie 65:95-104.
Seaman RL, Lebovitz RL. 1989. Thresholds of cat cochlear nucleus neu- rons to microwave pulses. Bioelectromagnetics 10:147-160.
Walton AJ, Reynolds GT. 1984. Sonoluminescence. Adv Phys 33:595- 660.

IEEE TRANSACTIONS ON PLASMA SCIENCE, VOL. 28, NO. I, FEBRUARY 2000 161
Pulsed Microwave Induced Bioeffects Johnathan L. Kiel, Jill E. Parker, Pedro J. Morales, John L. Alls, Patrick A. Mason,
Ronald L. Seaman, Senior Member, IEEE, Satnam P. Mathur, Member, IEEE, and Eric A. Holwitt
Invited Paper
Abstract—High-power pulsed microwave radiation, when applied to solutions containing dissolved carbon dioxide (or bicarbonate), hydrogen peroxide, and the soluble organic semi-conductor diazoluminomelanin, generates sound, pulsed luminescence, and electrical discharge. Microbes exposed to these phenomena experienced damage comparable to short-time, high-temperature insults, even though the average and measur- able localized temperatures were insufficient to cause the observed effects.
Index Terms—Anthrax, bacillus, high-power, microwaves, pulse.
I. INTRODUCTION
PREVIOUSLY, we have reported the sensitization of anthrax bacteria (Bacillus anthracis) to killing (a 5-log
reduction in viable cells) by continuous-wave 2450-MHz radiation [1]. This effect was accomplished by growing the bacteria on culture medium that induces the synthesis of the organic semi-conductor diazoluminomelanin (DALM) and treating them with sodium bicarbonate and hydrogen peroxide [1]. The temperature of the exposure was maintained at 37 °C, well below the thermal kill temperature of anthrax, either its vegetative or spore forms [see Fig. 1(a) and (b)]. Furthermore, we have shown that HL-60, a human leukemia cell line, can be induced to produce DALM and show enhanced absorption of continuous microwave radiation [2]. Last, we have conferred this property on several cell lines—bacterial, mouse, and human—by introduction of a plant nitrate reductase gene fragment into their genomes [3]-[5]. The nitrate reductase gene is responsible for the biosynthesis of DALM [6]. This polymer demonstrates thermochemiluminescence, continuous and pulsed, when peroxidizing solutions containing bicarbonate, or other sources of carbon dioxide, are exposed to microwave radiation, continuous or pulsed, respectively [7]. Here we examine damage to anthrax spores with high-power pulsed mi-
Manuscript received May 7, 1999; revised October 28, 1999. This work was supported in part by the U.S. Air Force Office of Scientific Research, the Air Force Research Laboratory Munitions Directorate, the Joint Services Technical Base Program in Chemical and Biological Defense, and the U.S. Army Medical Research and Material Command under Contract DAMD17-94-C-4069.
J. L. Kiel, J. E. Parker, and P. J. Morales are with the Human Effectiveness Directorate, Air Force Research Laboratory, Brooks AFB, TX 78235 USA.
J. L. Alls and P. A. Mason are with Veridian, Inc., San Antonio, TX 78216 USA.
R. L. Seaman and S. P. Mathur are with McKesson BioServices and United States Army Medical Research Command Detachment, Brooks AFB, TX 78235 USA.
E. A. Holwitt is with Conceptual MindWorks, Inc., San Antonio, TX 78228-1316 USA.
Publisher Item Identifier S 0093-3813(00)01487-9.
Time (hrs)
25 - B
20 - \
? 15- \
£ h 10- \\
5- v^ 0-
I I I I I I
100 150 200 250 300 350
Temperature (°C)
400 450
Fig. 1. Thermal sensitivity of killing and growth inhibition of Bacillus anthracis (anthrax bacteria) dry spores assayed on blood agar and 4X3AT agar. (A) Colony-forming units surviving on blood agar after exposure to 60 °C (squares) or to 100 °C (circles) for the respective times. (B) Colony-forming units surviving on blood (circles) or 4X3AT (squares) agar for the respective time and temperature.
0093-3813/00$10.00 © 2000 IEEE

162 IEEE TRANSACTIONS ON PLASMA SCIENCE. VOL. 28. NO. I, FEBRUARY 2000
Fig. 2. Single captured frames from integrating charged couple device (left) and nonintegrating black and white (inset flash) video cameras of discharges from DALM solution absorbing 1.25-GHz radiation (6-/is pulsewidth, 10 pulses/s. 2-MW peak forward power).
crowave radiation in peroxidizing solutions of biosynthesized DALM and the mechanism thereof. The absorption is very small for microwave frequencies but is predicted to rise rapidly in the infrared and visible wavelengths. However, by increasing the number of redox activated molecules that are susceptible to microwave absorption, the probability of enhanced mi- crowave absorption is increased. This enhancement can be accomplished by simultaneous exposure to microwave and shorter wavelength radiation (into the visible and ultraviolet). The thermally activated delayed fluorescence demonstrated by DALM, when coated onto epoxy polymer, is supportive of this mechanism [9]. It is induced by simultaneous exposure to 366-nm wavelength (UVA) light and microwave radiation. The delayed fluorescence is observed by a reexposing of the DALM film to pulsed UVA and observing the afterglow. The intensity of the delayed fluorescence is proportional to the period of exposure or energy of radio-frequency exposure. Heating the film and exposing it to UVA simultaneously can also generate the effect, but a higher level of conventional than microwave heating is necessary [9].
II. EXPERIMENTS
A. Optimizing Focal Absorption of Pulsed Microwave Radiation
We previously reported the generation of light, sound, and electrical discharges in DALM solutions by exposure to pulsed microwave radiation [7]. A variety of mixtures were used, but the process was not optimized. The chemical structure of DALM and its relationship to its microwave radiation absorptive prop- erties is an object of intense research and remains unresolved at this time [10]. In order to determine the basis for variable sus- ceptibility of DALM preparations to the generation of these re- sponses, organically synthesized DALM was prepared and was
nitrated. Because nitrate reduction, under aerobic conditions, is necessary to the biosynthesis of DALM, nitration was consid- ered an essential process for optimizing the pulse response.
Nitration was achieved by mixing a solution containing 1.38 g of sodium nitrite in 20-ml water with 2.27 g of 30% hydrogen peroxide plus 0.33 ml of concentrated sulfuric acid in 20 ml of water at ice bath temperatures. As soon as the solution turned yellow, 1.12 g of sodium hydroxide in 20 ml of water was added to the previous mixture. Lyophilized synthetic DALM (2.5 g) was dissolved in 10 ml of the peroxynitrite solution (99 mM) formed as described above. The mixture was allowed to react overnight at room temperature. It was then dialyzed against cold deionized water with several changes and freeze-dried. Five mil- liliters of the nitro-DALM solution was placed in a 15-ml poly- styrene conical tube and was activated by addition of saturated sodium carbonate and luminol solution with 3% hydrogen per- oxide added.
As previously described for other DALM solutions, the nitro-DALM peroxidizing solution was exposed to 10 pulses/s (6-jiS pulse duration at 1/2 pulse height) of 1.25-GHz radiation with a peak incident power of 2-MW forward power [7]. The sound and light produced were recorded with a RCA BK-6B M-11017A microphone and low-light cameras (ITT model #F4577 black-and-white camera and an Optronics DEI-470 integrating color camera), respectively. The nitro-DALM began pulsing with sound and light almost immediately and with greater intensity than that of the original DALM (1:100 dilution of crude biosynthetic extract). Fig. 2 displays captured frames of the video from the Optronics and ITT cameras showing single-pulse results. The spark discharge extended from a point in the meniscus (the point is not at the same location for each discharge) into the gas head space of the tube but did not extend above the open mouth of the tube. Fig. 3 shows a typical temperature profile (measured with Vitek)

KIEL et at.: PULSED MICROWAVE INDUCED BIOEFFECTS 163
6.4 9.6
TIME [MINUTES]
16.0
Fig. 3. Time/temperature profile of a pulsed microwave (1.25 GHz, 6-/'S pulsewidth, 10 pulses/s, 2-MW peak power) exposed 5-ml sample of DALM. The top curve is the air temperature above the meniscus, the middle curve is the temperature of the meniscus, and the bottom curve is the temperature of the liquid at the bottom of the tube being exposed.
nonperturbing high-resistance thermal probes) of such an exposed tube. The solution in the bottom of the tube reached a thermal steady state, but the temperature of the meniscus appeared to linearly increase over the time of the exposure. The air immediately above the meniscus rapidly became about 40 °C-50 °C hotter than steady-state temperature of the solution and then fluctuated wildly with the discharges. None of these temperatures was sufficient to kill anthrax spores in the time frame of the exposure [Fig. 1(a) and (b)].
B. Determining Thermal Sensitivity of Anthrax Spores
The Bacillus anthracis (BA; Sterne strain) spore vaccine1 was centrifuged, the supernatant decanted, and the button washed with chilled deionized water. Dilute powdered milk solution was made with chilled deionized water to a concentration of 26 mg of milk solids in 1 ml of solution and filtered through a 0.2-^m filter. The BA button was resuspended in 1 ml of the sterile milk solution. Then, 50 ß\ of this suspension were diluted in 450 ß\ of physiological phosphate buffered saline (PBS) and used as the source for colony forming unit (CFU) assays. The solutions were transferred with a \-ß\ calibrated loop to blood or 4X3AT agar plates for incubation at 37 °C for 18-24 h. They were then counted up to 300 colonies per plate. For thermal exposures, sil- icone-coated [BDH Silicone Products, Repelcote (VS) solution, coated according to manufacturer directions] 5.75 in Pasteur pipettes were used. These pipettes were washed with deionized water, autoclaved, and oven dried. Each pipette was charged at the tip with 3 p\ of well-mixed skim milk/BA suspension. They were then frozen. The frozen samples were lyophilized for four to five days. They were stored under vacuum at room temper- ature when not in use. The lyophilized spore samples were ex- posed to various temperatures for various times by placing them
1 Thraxol, Mobay Corp., Animal Health Division, Shawnee, KS.
in the heating block of an electrothermal2 melting-point appa- ratus. Each set of exposures included a control, which was not heated. The tubes were assayed for CFU's by recovering the ex- posed material in 450 (A of sterile PBS and plating to the blood or 4X3 AT agar, using the l-/zl loop or 50 ßl of the suspension. The plates were incubated as described above.-1 The 4X3AT agar was custom made by the same manufacturer using 55 g of tryp- ticase soy agar base, 6 g of potassium nitrate, 50 mg of luminol, and 160 mg of three-amino-L-tyrosine HC1 per liter of sterile deionized water.
Fig. 4 shows that the 4X3AT medium displays no CFU's at about 225 °C near 1 s of exposure to heat, and the growth on blood agar drops to zero in 1-2 s at about 250 CC. This slight phase shift in the kill curve for BA on the two media allows for pinpointing the apparent temperature to which the BA was exposed during the pulsed microwave exposure. Figs. 5 and 6, for comparison, show the surviving CFU's for Bacillus thuringiensis var. kurstaki4 and Bacillus globigii var. niger,* re- spectively, exposed under the same conditions in the melting- point apparatus and cultured as the BA was.
In order to generate a preparation of single spores rather than conglomerated spores for BT and BG, special procedures were developed. One-half gram of the commercial preparation of BT Javelin was placed into a 15-ml centrifuge tube, 6 ml of chilled deionized water was added, and the suspension was thoroughly vortexed. It was then sonicated for 3-5 s. Next, 6 ml of chilled ethyl acetate was added to the suspension and the tube was shaken vigorously for 1 min. The suspension was then cen- trifuged in a clinical centrifuge for 15 min. The suspended plug
2 Model 9300; Electrothermal Engineering Limited, Southend-on-Sea, Essex, U.K.
3 The blood agar was commercially obtained from Remel. Lenexa, KS. 4 BT, a close relative of anthrax bacteria that kills insects; Javelin, Sandoz
Agro, Inc., Des Piaines, 1L. 5BG; provided by Dr. R. Liebert, U.S. Army Dugway Proving Ground, UT.

164 IEEE TRANSACTIONS ON PLASMA SCIENCE. VOL. 28, NO. I, FEBRUARY 2000
50 100 -I T - T 1 1 1 1
150 200 250 300 350 400 450
TEMPERATURE (°C)
Fig. 4. Anthrax bacterial growth on 4X3AT (square) and blood (circle) agars following 1-s exposures of dry spores to various temperatures. The single triangles indicate high-power, pulsed microwave data fitted to the thermal response data for growth on blood (triangle pointing up) and 4X3AT (triangle pointing down) agars, respectively.
150 200 250 300 350
Temperature (°C)
400 450
Fig. 5. Bacillus thuringiensis var. kurstaki growth on 4X3AT (squares) and blood (circles) agars following 1-s exposures of dry spores to various temperatures.
was loosened with a sterile stick and poured off the spore button with the supernatant. The button was washed three times with chilled deionized water and centrifuged each time. After de- canting the final wash, one calibrated loop (1 ß\) of the spore button was placed in 1 ml of the sterile skim milk solution. The procedure for BG was modified from that of BT. One gram of BG powder was placed in a 15-ml centrifuge tube, and the tube was filled with deionized water. The suspension was vortexed and then sonicated for 5 s. The suspension was then filtered with
100 150 200 250 300 350
Temperature (°C)
400 450
Fig. 6. Bacillus globigii var. niger growth on 4X3AT (circles) and blood (squares) agars following 1-s exposures of dry spores to various temperatures.
a sterile paper filter and funnel pulled through by vacuum. The filtrate was placed in another sterile 15-ml centrifuge tube and centrifuged for 15 min at maximum speed in a 45° fixed head in a clinical centrifuge. A vertical streak of spores formed along the length of the tube, and a button of debris was deposited in the bottom. The supernatant was poured off and the button was removed with a pipette. The streak was washed and centrifuged three times with chilled deionized water. After the final wash, the supernatant was removed and a 1-1 loopful of the streak was removed and resuspended in 1 ml of sterile deionized water. The samples were stored at 2 °C-8 °C until used. The media did not show differential growth for BT and BG like that seen with BA but did display about the same thermal kill profile as for BA.
C. Pulsed Microwave Effects on Anthrax Spore Viability
For pulsed microwave exposure, 0.5 ml of BA spore suspen- sion was placed into 0.2-^m-filter6 centrifuge tubes. The spores were then centrifuged onto the filter (16000 g for 15 min). The tubes were refilled with 1.5 ml of a reaction mixture consisting of 0.9 ml of saturated sodium bicarbonate/luminol solution, 0.1 ml of 1:10 biosynthetic DALM, 0.6 ml of 1:10 diazoluminol, 0.33 ml of saturated sodium bicarbonate/luminol solution, and 0.33 ml of 3% hydrogen peroxide. All the dilutions were made in the saturated sodium bicarbonatefluminol solution. The final dilution of the DALM was 1:1000. A detailed description of the reaction mixture has been previously published [6], [7]. The filter, with the BA spores, was inserted into the tube to the level just below the meniscus of the fluid. The exposures were as de- scribed above for the nitro-DALM. They were started at 3 min and 22 s after placing the reaction mixture in front of the mi- crowave wave guide. The microwave exposure was for 13 min and 28 s. Therefore, the total radiation exposure was for 48 ms (a duty factor of 0.000 06). The temperature of the sample was
6 Microfilterfuge, Rainin Instrument Co., Inc., Woburn, MA.
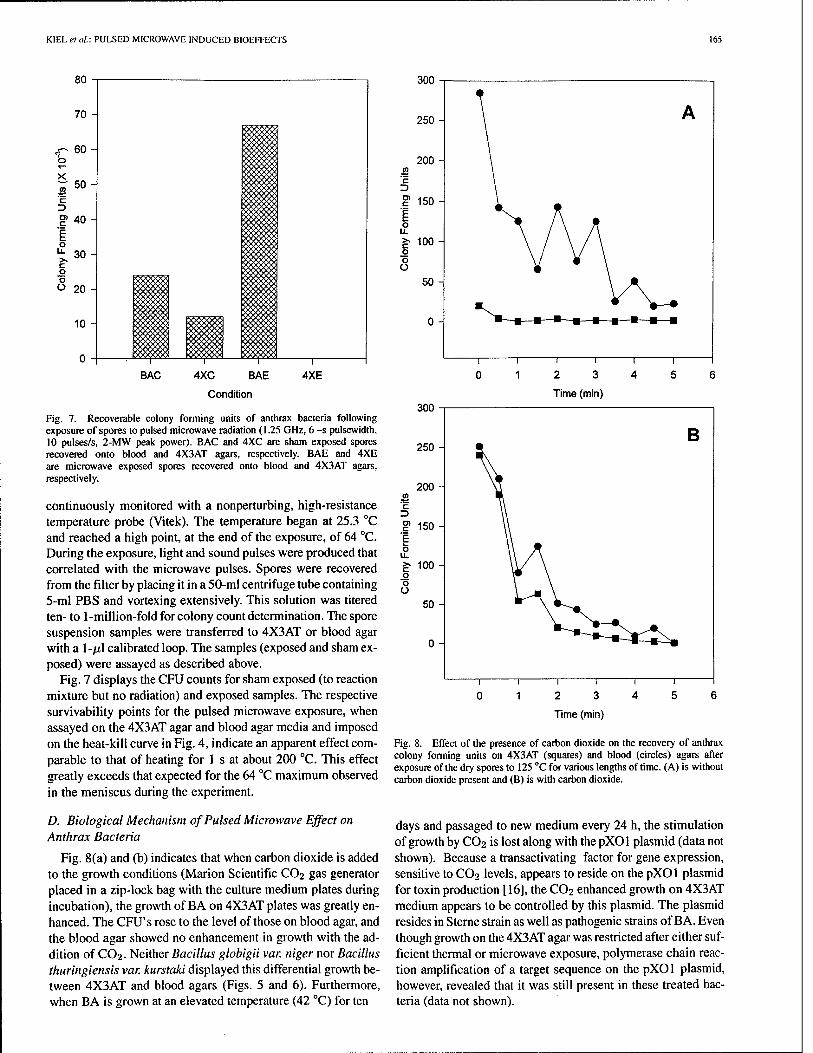
KIEL et al.: PULSED MICROWAVE INDUCED BIOEFFECTS 165
300
BAC 4XC BAE 4XE
Condition
Fig. 7. Recoverable colony forming units of anthrax bacteria following exposure of spores to pulsed microwave radiation (1.25 GHz, 6 -s pulsewidth, 10 pulses/s, 2-MW peak power). BAC and 4XC are sham exposed spores recovered onto blood and 4X3AT agars, respectively. BAE and 4XE are microwave exposed spores recovered onto blood and 4X3AT agars, respectively.
continuously monitored with a nonperturbing, high-resistance temperature probe (Vitek). The temperature began at 25.3 °C and reached a high point, at the end of the exposure, of 64 °C. During the exposure, light and sound pulses were produced that correlated with the microwave pulses. Spores were recovered from the filter by placing it in a 50-ml centrifuge tube containing 5-ml PBS and vortexing extensively. This solution was titered ten- to 1-million-fold for colony count determination. The spore suspension samples were transferred to 4X3AT or blood agar with a l-ß\ calibrated loop. The samples (exposed and sham ex- posed) were assayed as described above.
Fig. 7 displays the CFU counts for sham exposed (to reaction mixture but no radiation) and exposed samples. The respective survivability points for the pulsed microwave exposure, when assayed on the 4X3AT agar and blood agar media and imposed on the heat-kill curve in Fig. 4, indicate an apparent effect com- parable to that of heating for 1 s at about 200 °C. This effect greatly exceeds that expected for the 64 °C maximum observed in the meniscus during the experiment.
D. Biological Mechanism of Pulsed Microwave Effect on Anthrax Bacteria
Fig. 8(a) and (b) indicates that when carbon dioxide is added to the growth conditions (Marion Scientific CO2 gas generator placed in a zip-lock bag with the culture medium plates during incubation), the growth of BA on 4X3AT plates was greatly en- hanced. The CFU's rose to the level of those on blood agar, and the blood agar showed no enhancement in growth with the ad- dition of CO2. Neither Bacillus globigii var. niger nor Bacillus thuringiensis var. kurstaki displayed this differential growth be- tween 4X3AT and blood agars (Figs. 5 and 6). Furthermore, when BA is grown at an elevated temperature (42 °C) for ten
Time (min)
B 250-
200 - <n c 3 g 150 - E 0 u. >> 100 - 0 0 Ü
50-
0 -
i i i i i i
Time (min)
Fig. 8. Effect of the presence of carbon dioxide on the recovery of anthrax colony forming units on 4X3AT (squares) and blood (circles) agars after exposure of the dry spores to 125 °C for various lengths of time. (A) is without carbon dioxide present and (B) is with carbon dioxide.
days and passaged to new medium every 24 h, the stimulation of growth by CO2 is lost along with the pXOl plasmid (data not shown). Because a transactivating factor for gene expression, sensitive to CO2 levels, appears to reside on the pXOl plasmid for toxin production [16], the CO2 enhanced growth on 4X3AT medium appears to be controlled by this plasmid. The plasmid resides in Sterne strain as well as pathogenic strains of BA. Even though growth on the 4X3AT agar was restricted after either suf- ficient thermal or microwave exposure, polymerase chain reac- tion amplification of a target sequence on the pXOl plasmid, however, revealed that it was still present in these treated bac- teria (data not shown).
166 IEEE TRANSACTIONS ON PLASMA SCIENCE, VOL. 28. NO. I, FEBRUARY 2000
III. CONCLUSION
The comparison of the pulsed microwave effects on the viability of anthrax spores compared to standard thermal insult indicate that the spores perceive much higher temperatures than were measured during the exposures. The results indicate thermal damage to the plasmid, but not its thermal destruction, which occurred with the short-time, high-temperature (200 °C-225 °C) exposures and the pulsed microwave exposures. These results strongly suggest that the plasmid expression was affected and that the same thermal mechanism was operational in both types of insult.
The physical evidence, other than direct temperature measure- ments, also supports the ultrashort-time, very high-temperature mechanism for pulsed microwave effects. The electrical dis- charges above the liquid surface, and the pulsed light and sound that correlated with the microwave pulses support this mecha- nism. Even though the measured temperatures never reached 200 °C, the fact that the gas temperature above the meniscus was at least 30 °C hotter than the meniscus and 50 °C hotter than the bulk of the fluid in the tubes suggests that a hot gas was produced and ejected from the fluid. This gas was obviously not in thermodynamic equilibrium with the surrounding fluid. Also, if the temperature of the bacterial spores did approach 200 °C, as indicated by the assay responses, then the bacteria must have been in contact with a hot gas, not the aqueous solution that could not have exceeded 100 °C and remained a liquid. Therefore, gas must have been trapped or generated at the surface of the bacterial spores and transferred some of its energy to the bacterial spores. The physical and biological evidence presented here suggests that a sonoluminescent-like mechanism could be at work. The hot plasma involved could be generated by the intense thermal gradient, pulsed microwave induced sound (shock) wave, cavitation, and collapse of gas. The chemical reaction on or in the DALM molecules facilitated this process. A very high, very localized temperature effect on the spores is compatible with such a mechanism.
At this time it is not known how the redox chemistry of DALM brings about the process. What is known is that DALM is a ni- tration product of luminol and three-amino-L-tyrosine and that the latter is an analog of a natural amino acid tyrosine. Tyrosine and other biomolecules are nitrated in animal and human tissues [12]—[17]. Therefore, nitrated proteins, lipids, catecholamines, and nucleic acids could possibly participate in an energy focusing reaction comparable to the one involving DALM.
ACKNOWLEDGMENT
The views opinions, and/or findings contained in this report are those of the authors and should not be construed as an official De- partment of the Army or Department of the Air Force position, policy, or decision unless so designated by other documentation.
REFERENCES
[1] J. G. Bruno and J. L. Kiel, "Effects of radio frequency radiation (RFR) and diazoluminomelanin (DALM) on the growth potential of bacilli," in Electricity and Magnetism in Biology and Medicine, M. Blank, Ed. San Francisco, CA: San Francisco Press, 1993, pp. 231-233.
[2] , "Synthesis of diazoluminomelanin (DALM) in HL-60 cells for possible use as a cellular-level microwave dosimeter," Bioelectromag- netics, vol. 15, pp. 315-328, 1994.
[3] J. G. Bruno, J. E. Parker, and J. L. Kiel. "Plant nitrate reductase gene fragments enhance nitrite production in activated murine macro phage cell lines," Biochem. Biophys. Res. Comnutn., vol. 201, pp. 284-289, 1994.
[4] J. L Kiel, J. L. Alls, E. A. Holwitt, L. J. V. Stribling, and J. E. Parker, "Thermochemiluminescence as a technique for radio frequency radia- tion dosimetry," Bioelectrochem. Bbenerg., vol. 47, pp. 253-257, 1998.
[5] J. L. Kiel, J. E. Parker, E. A. Holwitt, and H. A. Schwertner, "Biosyn- thesis of Diazomelanin and Diazoluminomelanin and methods thereof," US Patent 5856 108, Jan 5, 1999.
[6] J. L. Kiel, J. L. Alls, P. A. Mason, and D. N. Erwin, "Luminescent radio frequency radiation dosimetry," Bioelectromagnetics, vol. 20, pp. 46-51. 1999.
[7] J. L. Kiel, R. L. Seaman, S. P. Mathur, J. E. Parker, J. R. Wright. J. L. Alls, and P. J. Morales, "Pulsed microwave induced light, sound, and electrical discharge enhanced by a biopolymer," Bioelectromagnetics. vol. 20, pp. 216-223, 1999.
[8] E. A. Holwitt. J. L. Kiel, and D. N. Erwin, "Microwave sensitive article," U.S. Patent 5658673, Aug. 19, 1997.
[9] K. B. Wagner-Brown, K. F. Ferris, J. L. Kiel, and R. A. Albanese, "Mor- phology dependence of the optical properties of DALM related mate- rials," in Proc. Mat, Res. Soc. Symp., vol. 488, 1998, pp. 909-914.
[10] J. M. Bartkus and S. H. Leppla, "Transcriptional regulation of the pro- tective antigen gene of Bacillus anthracis," Infect. Immun., vol. 57, pp. 2295-2300, 1989.
[11] S. V. Lymar, Q. Jiang, and J. K. Hurst, "Mechanism of carbon dioxide- catalyzed oxidation of tyrosine by peroxynitrite." Biochem., vol. 35, pp. 7855-7861, 1996.
[12] J. Khan, D. M, Brennan, N. Bradley, B. Gao, R. Bruckdorfer. and M. Jacobs, "3-Nitrotyrosine in the proteins of human plasma determined by an EL1SA method," J. Biochem., vol. 330, pp. 795-801, 1998.
[13] L. A. MacMillan-Crow, J. P. Crow, and J. A. Thompson, "Peroxyni- trite-mediated inactivation of manganese Superoxide dismutase involves nitration and oxidation of critical tyrosine residues," Biochem., vol. 37, pp. 1613-1622, 1998.
[14] J. P. Eiserich, M. Hristova, C. E. Cross, A. D. Jones, B. A. Freeman, B. Halliwell, and Van Der Vliet, "Formation of nitric oxide-derived inflam- matory oxidants by myeloperoxidase in neutrophils," Nature, vol. 391, pp. 393-397, Jan. 22, 1998.
[15] J. Byun, J. P. Henderson, D. M. Mueller, and J. W. Heinecke, "8-Nitro-2'-deoxyguanosine. a specific marker of oxidation by reactive nitrogen species, is generated by the myeloperoxidase-hydrogen peroxide-nitrite system of activated human phagocytes," Biochem., vol. 38, pp. 2590-2600, 1999.
[16] C. Daveu, C. Servy, M. Dendane, P. Marin, and C. Ducrocq, "Oxidation and nitration of catecholamines by nitrogen oxides derived from nitric oxide," Nitric Oxide Biol. Chem., vol. 1, pp. 234-243, 1997.
[17] J. Kalns, J. Parker, J. Bruno, E. Holwitt, E. Piepmeier, and J. Kiel, "Ni- trate reductase alters 3-nitrotyrosine accumulation and cell cycle pro- gression in LPS + IFN(-stimulated RAW 264.7 cells)," Nitric Oxide: Biol. Chem., vol. 2, pp. 366-374, 1998.
Johnathan L. Kiel was born in Houston. TX, on September 4, 1949. He received the D.V.M. degree (summa cum laude) from the School of Veterinary Medicine, Texas A&M University, College Station, in 1974 and the interdisciplinary Ph.D. degree in biochemistry and microbiology from the Health Sciences Center School of Medicine, Texas Tech University, Lubbock, in 1981.
He is Chief of the Biomechanisms and Modeling Branch of the Directed Energy Bioeffects Division of the Human Effectiveness Directorate of the Air Force
Research Laboratory, where he works in the areas of detection of biological agents and directed energy threats. His doctoral dissertation is titled "The Cy- totoxic Activity of Peroxidases." He is an author of 69 scientific publications, including Type-B Cytochrome: Sensors and Switches (Boca Raton, FL: CRC Press, 1995), and 95 scientific presentations. He holds 16 patents, and has three pending, many of which are licensed or in the process of being licensed.
Dr. Kiel was elected to the American College of Veterinary Microbiologists in 1984. He became a Fellow of the American Association for the Advance- ment of Science in 1995 and of the Air Force Research Laboratory in 1998. He received the U.S.A.F. Basic Research Award in 1994 for his work in radio-fre- quency radiation bioeffect mechanisms. His inventions won him the 1991 R&D 100 Award and the 1992 Federal Laboratory Consortium Award for Excellence in Technology Transfer. His scientific team was named a Star Team by the Air Force Office of Scientific Research in 1993. He was named an Air Force Asso- ciation Scientist of the Year in 1994.

KIEL et at.: PULSED MICROWAVE INDUCED BIOEFFECTS 167
Jill E. Parker was born in Sussex, U.K., and received the B.Sc. (Hons.) in Biochemistry from the University of Sheffield in 1963 and the Ph.D. degree in "Human Biochemical Genetics" from King's College, University of London, in 1966.
She held Postdoctoral positions at the Gallon Laboratory, University College, London University and at the University of Texas at Austin in the Department of Zoology and Department of Microbi-
! ology. Her research focused on obtaining the protein sequence of human Transferrin and a Flavodoxin
from Desulphovibrio gigas. In the Microbiology Department, she ran a centralized tissue culture facility to produce hybridomas for many departments. In 1982, she joined Dr. Barbara Bowman's group in the Department of Cellular and Structural Biology at the University of Texas health Science Center, San Antonio, and determined, by nucleic acid sequencing, the sequence of human Haptoglobin. In 1985, she transferred to the Microbiology Department working with Dr. Wendell Winters, and became a Fellow under a United States Air Force training program. Her research focused on the bioeffects of exposure to low level electromagnetic fields (ELF) and radiofrequency radiation (RFR). In 1987, she was recruited to Civil Service at Brooks AFB in what is now the Human Effectiveness Directorate. Sheworks with Dr. Jonathan Kiel in the Biomechanisms and Modeling Branch as a molecular biologist. Her current research focuses on characterization and sequence of key metabolic genes from Bacillus anthracis (B. a.) and the utilization of these genes in the rapid identification of B. a. from its near relatives.
Ronald L. Seaman (S'68-M'75-SM'83) was born in Seaman, Ohio. He received the B.S. degree in elec- trical engineering from the University of Cincinnati, Cincinnati, OH, the Ph.D. in biomedical engineering from Duke University, Durham, NC, and the M.S. degree in management from the Georgia Institute of Technology, Atlanta.
He was an Instructor at the University of Texas Health Science Center at Dallas before joining the Georgia Tech Research Institute in 1979. From 1986 to 1994, he was an Associate Professor of Biomedical
Engineering at Louisiana Tech University, Ruston, and served as Coordinator of Research in the Center for Rehabilitation Science and Biomedical Engineering there. Joining McKesson BioServices, Brooks AFB, TX, in 1994, He is cur- rently a Senior Biomedical Research Scientist in the Microwave Medical Bio- effects Branch of the U.S. Army Medical Research Detachment. He is also an Associate Investigator in the Center for Environmental Radiation Toxicology, consisting of organizations in the San Antonio, TX, area. His research interests are currently focused on the effects of electromagnetic fields on biological sys- tems at organism, system, and cell levels.
Dr. Seaman is a member of Eta Kappa Nu, Tau Beta Pi, the American As- sociation for the Advancement of Science, the Society for Neuroscience, the Bioelectromagnetics Society, the International Society for Bioelectricity, and the New York Academy of Sciences.
Pedro J. Morales was born in Toa Baja, Puerto Rico, in 1964. He enlisted in the U.S. Air Force in 1981, and completed his training as a Medical Laboratory Technician in the USAF School of Health Care Sci- ences in 1983.
From 1983 to 1995, he has worked in various clinical laboratories. From 1995 to present, he has been involved in basic research in the area of molecular biology with regards to electromag- netic bioeffects and in bioweapons detection and counter-proliferation in support of the Air Force
Research Lab at Brooks AFB, TX.
John L. Alls was born at Gary AFB, Texas, in 1954. He attended Southwest Texas State University, San Marcos. He received the associate degree in Medical Technology in 1985. He has been registered by the Board of the American Society of Clinical Patholo- gists since 1985.
He entered the U.S. Air Force in 1979. He special- ized in clinical microbiology at Carswell AFB and Wilford Hall Medical Center at Lackland AFB for eight years. In 1988, he was assigned to Brooks AFB Radiation Sciences Division to do basic research in
radio frequency radiation bioeffects.
Satnam P. Mathur (M'88) was born in Dholpur, India, on October 17, 1943. He received the diploma in electronics and radio engineering (with honors) from BTE, Bombay, India, in 1966, the M.A.Sc degree in electrical engineering from the University of Windsor, ON., Canada, in 1969, and the Ph.D. degree in electrical engineering from Michigan State University, East Lansing, in 1974.
From 1966 to 1967, he was a Scientific Assistant in the Microwave Division at the Tata Institute of Fun- damental Research, Bombay. From 1974 to 1975, he
was with the School of Radar Studies, Indian Institute of Technology, New Delhi, India. From 1982 to 1987, he was an Assistant Professor and from 1982 to 1987 a Professor of electrical engineering at the Delhi College of Engineering, Delhi University, Delhi, India. From 1988 to 1989, he was a Research Associate at the University of Utah, Salt Lake City, where he worked on FDTD methods applied to microwave energy deposition in biological systems. Since 1989, he has been with McKesson BioServices, Brooks AFB, TX, where he is engaged in microwave bioeffect research. His current research interests are microwave dosimetry and FDTD modeling of UWB exposure systems. He is an author of Electronic Devices, Applications, and Integrated Circuits (Delhi, India: Umesh, 1980).
Patrick A. Mason was born in San Diego, CA, in 1957. He received the B.A. degree in biology and in psychology from the University of California at San Diego in 1980 and the Ph.D. degree in physiological psychology from McGill University, Montreal, P.Q., Canada, in 1985.
From 1984 to 1990, he conducted research in the Department of Clinical Pharmacology, University of Colorado Health Science Center, Denver. He has been at Brooks AFB since 1990, where he has con- ducted research on the bioeffects of electromagnetic
field exposure. He is on the Program Management Committee and Editorial Board for the International EMF Dosimetry Project.
Dr. Mason is a member of the Bioelectromagnetics Society and the Society for Neuroscience.
Eric A. Holwitt taught chemistry at the U.S. Air Force Academy from 1980 to 1984. While at the Armed Forces Radiobiology Research Institute, he developed methods for synthesizing radiation products of DNA. He has also studied the interaction of radioproductive compounds with DNA. Other projects he has participated in are developing a biosynthetic polymer to destroy hydrazine and demonstrating the radiosensitivity of an Air Force patented material. During this time, he served as a UN weapons inspector with UNSCOM in Iraq and,
for the last three years, has been working on chemical and biological defense issues for the Air Force. He has co-authored 15 publications and has two patents. Besides research, he popularizes science throughout San Antonio, TX, performing chemistry magic shows for schools and civic groups.

Physiology & Behavior, Vol. 65, Nos. 4/5, pp. 753-761,1999 © 1999 Elsevier Science Inc.
Printed in the USA. All rights reserved 0031-9384/99 $-see front matter
ELSEVIER PII S0031-9384(98)00214-5
Ultrawide-Band Electromagnetic Pulses Induced Hypotension in Rats
SHIN-TSU LU,1 SATNAM P. MATHUR, YAHYA AKYEL AND JONATHAN C. LEE
McKesson BioServices, U.S. Army Medical Research Detachment, Microwave Bioeffects Branch, 8308 Hawks Road, Building 1168, Brooks Air Force Base, TX 78235
Received 17 December 1997; Accepted 17 July 1998
LU, S.-T., S. P. MATHUR, Y. AKYEL AND J. C. LEE. Ultrawide-band electromagnetic pulses induced hypotension in rats. PHYSIOL BEHAV 65(4/5) 753-761,1999.—The ultrawide-band (UWB) electromagnetic pulses are used as a new modality in radar technology. Biological effects of extremely high peak E-field, fast rise time, ultrashort pulse width, and ul- trawide band have not been investigated heretofore due to the lack of animal exposure facilities. A new biological effects data- base is needed to establish personnel protection guidelines for these new type of radiofrequency radiation. Functional indices of the cardiovascular system (heart rate, systolic, mean, and diastolic pressures) were selected to represent biological end points that may be susceptible to the UWB radiation. A noninvasive tail-cuff photoelectric sensor sphygmomanometer was used. Male Wistar-Kyoto rats were subjected to sham exposure, 0.5-kHz (93 kV/m, 180 ps rise time, 1.00 ns pulse width, whole-body averaged specific absorption rate, SAR = 70 mW/kg) or a 1-kHz (85 kV/m, 200 ps rise time, 1.03 ns pulse width, SAR = 121 mW/kg) UWB fields in a tapered parallel plate GTEM cell for 6 min. Cardiovascular functions were evaluated from 45 min to 4 weeks after exposures. Significant decrease in arterial blood pressures (hypotension) was found. In contrast, heart rate was not altered by these exposures. The UWB radiation-induced hypotension was a robust, consistent, and persis- tent effect. © 1999 Elsevier Science Inc.
Arterial pressure Heart rate Pulsed radiofrequency radiation Ultrawide-band radiation Delayed effects
THE ultrawide-band (UWB) radiofrequency (RF) radiation is a new modality in radar technology. The potential usages of UWB radar are not limited to military application only. At much lower power, an example of civilian UWB radar appli- cation is in automobile safety. Devices designed as warning systems for backing up and parking are planned, and expected to be available in the next few years. A commonly used defini- tion accepted by the Defense Advanced Research Project Agency is "Ultrawide band radar is any radar whose frac- tional bandwidth is greater than 0.25, regardless of the center frequency or the signal time-bandwidth product" (45). The UWB is a radiofrequency signal with an ultrashort pulse width (a few ns) and a very fast rise time (<200 ps). Because of the ultrashort pulse width, the peak electric field of a UWB pulse can be operated in excess of the breakdown voltage without arcing. In fact, systems with peak electric field in ex- cess of hundreds of kV/m are known to exist. Another charac- teristic is a very low duty cycle of these UWB devices result- ing from an ultrashort pulse width.
Radiofrequency personnel protection guidelines usually are promulgated on a time-averaged specific absorption rate
or power density. From operational characteristics of the UWB devices with an extremely high peak electric field and very low duty cycle, the energy absorption rate per pulse in humans can be extremely high (temporal peak SAR), but the average specific absorption rate (average SAR) can be very low if a time-average procedure is applied. The ratio of peak to average SARs will be much greater than those of narrow- band RF radiation used in the past for evaluation of the bio- logical effects of pulsed RF radiation. Concerns on UWB ra- diation safety issues have been voiced (1). However, the experimental database on UWB safety issues is very limited (41,48). Therefore, there is a need for additional toxicologi- cal testing to address the safety of UWB radiation.
Interests in the cardiovascular effects of RF radiation can be traced back to as early as the 1940s (37), and it has contin- ued until today. Specifically, cardiovascular effects of RF ra- diation include human studies with emphasis on changes in regional blood flow for diathermy, epidemiology, and case report, studies in experimental animals such as cardiac inju- ries caused by intense RF exposure, cardiovascular adjust- ments to localized "low-level" RF exposure, changes in arte-
To whom requests for reprints should be addressed. E-mail: [email protected]
753

754 LU ET AL.
rial pressure, and heart rate by moderate RF exposure. The effect of RF radiation on heart rate can be further divided into tachycardia, bradycardia, cardiac pacing, effects on iso- lated cardiac tissue in vitro and the RF interference of the im- planted cardiac pacemaker. This database forms a foundation for a comparative analysis between narrow-band RF and UWB radiations. However, the majority of these studies are acute experiments employing a short-term (acute) exposure and studying cardiovascular end points in a short period of time, for example, during or immediately after RF exposure, and usually under anesthesia. Three studies used a long-term (chronic) RF exposure, but cardiovascular functions were not their main emphasis; instead, they were embedded in a bat- tery of end points (8,10,46).
Two types of chronic cardiovascular effects have been ob- served. They are the cardiovascular effect of a chronic expo- sure and the delayed effect of an acute exposure. The chronic effect is represented by a biphasic (hypertension-»normoten- sion—»hypotension) or a monophasic (hypotension) arterial response in rats chronically exposed to RF radiation (37). The delayed effects are from case reports (13,49) indicating the presence of delayed hypertension in conjunction with anxiety attacks, which was termed "atypical post-traumatic syndrome," months after an accidental exposure to RF fields. This de- layed vascular response has never been confirmed experimen- tally. In the present experiment, heart rate and blood pressure in awake rats were evaluated periodically with a tail-cuff pho- toelectric sphygmomanometer from 45 min to 4 weeks after acute UWB exposures.
MATERIALS AND METHODS
General Description of the Experimental Procedure
Fifteen male Wistar-Kyoto (WKY) rats aged between 71 and 89 days were used at the beginning of the experiment. They were obtained at 56 days of age from a commercial source (Charles River, Portage, MI). They were maintained in the vivarium at 21-23°C ambient temperature, 100% condi- tioned fresh air for more than 10 exchanges per hour, and a 12 L-12 D (lights on 0600-1800 h) light cycle. Tap water and feed (Purina Rodent Diet 5008, Ralston Purina Co., St. Louis, MO) were available ad lib. After a 10-day quarantine period, they were acclimated to a test holder (IITC Life Science, Woodland Hills, CA, model 81) 1 h daily for 3 days. Preexpo- sure baseline of the heart rate and arterial pressures (systolic, mean, and diastolic) were determined 1-2 days after the holder acclimation. Three to 4 days later, they were individu- ally subjected to sham exposure, low UWB, or high UWB ex- posure for 6 min between 0900 and 1000 h in an exposure holder maintained at 23-25°C. On the exposure day, average body weight was 250 ± 4 g (n = 15, SE). Immediately after ex- posure, the rat was transferred to the test holder for heart rate and blood pressure measurements. Postexposure heart rate and blood pressures were determined at 45 min, 24 h, 72 h, 1, 2, 3, and 4 weeks after exposure. Four to six determinations were obtained at each time point, and the average value was used to represent the cardiovascular endpoints at that time point. Fifteen animals were divided randomly into three groups of five rats each for sham exposure, "low" UWB and "high" UWB exposures. Each rat was assigned randomly to receive one of the three treatments in five experimental cy- cles. The UWB-exposed rats were always accompanied by at least one sham-exposed animal such that the time-related ex- perimental error caused by different experimental cycles or animal shipments could be minimized.
Photoelectric Sphygmomanometer
An indirect tail-cuff arterial pressure measurement system without external preheating in awake rats was first introduced by Yen et al. (51). Validation of pressure markers (systolic and mean arterial pressures), and theoretical analysis of this indirect method based on a photoelectric sensor have been performed by various investigators (4,36,50). For the present experiment, a commercial system (IITC Life Sei., Woodland Hills, CA) was used. The system was composed of a pulse am- plifier (IITC model 29), tail-cuff photoelectric sensor assem- bly (IITC model B-60,5/8" cuff), smaller bore tubing (Tygon, 1.6 mm i.d., 0.8-mm wall thickness for connecting tail-cuff, pressure amplifier, pressurizing bulb, and pressure gauge) and animal holder (IITC model 81). Outputs of the pressure trans- ducer and pulse sensor from the pulse amplifier were split evenly. One set of outputs was monitored continuously with a digital oscilloscope (Tektronix 2430 A, Tektronix, Inc., Wilson- ville, OR). The other set of outputs was converted to a digital signal and recorded using a strip chart program (AYSTANT+, Asyst Software Technology, Rochester, NY) by a computer (Hewlett-Packard Vectra, Hewlett Packard, Greenley, CO) at 50 Hz data acquisition rate. The recorded data was im- ported into a graphics program (SigmaPlot 4.1, Jandel Scien- tific Softwares, San Rafael, CA) and viewed graphically and digitally. A custom-made microenvironment chamber was fab- ricated from acrylic tubes (28 cm long, 12 and 14 cm i.d., 3.2-mm wall thickness). Plastic tubing (Tygon, 6.4 mm i.d., 1.6-mm wall thickness, from Cole Palmer, Vernon Hills, IL) was wrapped around the smaller acrylic tube with tubing wall touching each other to form a coil 18 cm in length. The larger acrylic tube was used as an outer wall. Both ends of the Tygon tubing were connected to the pump inlet and outlet port of a precision cir- culator water bath (Neslab RTE-110, Neslab Instruments, Portsmouth, NH) providing an microenvironment within the inner acrylic tube between 26.5 and 27.5°C to prevent sudden temperature surges. The microenvironment chamber was mon- itored continuously with a thermistor temperature probe (Yel- low Springs 405 air temperature probe, Yellow Springs Instru- ment, Yellow Springs, OH) and a digital thermistor bridge (Cole Palmer 08502-12, Cole Palmer, Vernon Hills, IL). The pressure amplifier output was set at 1.00 volt per Torr (mmHg). Light intensity and photosensor output amplifier were ad- justed to provide a tail-pulse signal at no more than 5 volts at the maximum oscillation. Pressure amplifier output was cali- brated daily against a certified sphygomomanometer before use. The same tail-cuff-photoelectric sensor assembly was used throughout the entire experiment.
Cardiovascular Parameter Measurement
Rats were transported from the vivarium to the laboratory in the morning. They were allowed to sit quietly in their own cage for at least 30 min before being transferred to the test holder. The rat and test holder were then inserted into the mi- croenvironment chamber. Heating in the microenvironment chamber caused by animal body heat was offset by adjusting the waterbath temperature. After 20 min in the microenviron- ment chamber, the rat tail was passed through the tail cuff. The tail-cuff/photoelectric sensor was then attached to the test holder, by this time, characteristic tail pulses could be de- tected if the tail cuff was inflated to 40-60 Torr (mmHg). When the presence of tail pulses was ascertained, tail cuff was quickly inflated to 200-220 Torr until tail pulses disappeared. The cuff was then deflated immediately afterwards at approx- imately 2 Torr per heart beat for 25.6 s. Systolic pressure (Ps)

UWB-INDUCED HYPOTENSION 755
-
HR= 315.33 bpm P = 136.48 mm Hg P„= 116.48 mm Hg P„= 106.47 mm Hg
""^^^ CUFF PRESSURE •
AMPLITUDE
UlLi ^J~'K/^1^1j^\^u^^w^
sA-K^W***"*»«*
"j PHOTOELECTRIC PULSE
TIME (SECONDS)
FIG. 1. An example of the indirect arterial pressure measurement in the rat.
was determined during the deflation cycle as the corresponding cuff pressure at the reappearance of the tail pulse while mean pressure (Pm) was the cuff pressure when amplitude of the tail pulse reached a maximum. Diastolic pressure (Pd) was calculated by Pd = (Pm X 3 - PS)I2 (42). Heart rate was determined from the average of pulse-to-pulse intervals for at least 60 beats. An example of this deflation cycle is shown in Fig. 1. The arte- rial pressure/heart rate measurement was repeated for four to six times separated by a 5-min interval between determinations to avoid the collapse of the tail artery during measurement.
UWB Exposure
The UWB exposure system was originally designed and built at the Sandia National Laboratories (Albuquerque, NM).
The UWB pulses were generated by a spark gap pulse genera- tor and transmitted into a GTEM cell (Gigahertz Transverse Electromagnetic cell, a flared rectangular coaxial transmission line) (Fig. 2). The rise time and pulse width were 180 ps and 1.00 ns, respectively, when the system was operated at 500 Hz, and they were 200 ps and 1.03 ns when operated at 1,000 Hz. The pulsed electric field was measured with a EG&G (Welles- ley, MA) D-dot sensor (model ACD-IR) (33). Outputs of the D-dot sensors were measured with a 4.5-GHz bandwidth Tektronix SCD5000 transient sampling scope. A transfer function was used for data compensation of the pulsed electric field. The transfer function was based on deconvolution tech- nique of a standard pulse generated by a Picosecond Pulse Laboratories 4050 B picosecond step generator with 5100 pulse forming network. The corrected D-dot values were con- verted into E field intensity (2). For UWB exposures, the rat was placed in an exposure holder fabricated from an acrylic tube (6.5-cm i.d., 3.2-mm wall thickness, 28 cm long, 6.4 X 50-mm slots separated by 19 mm for ventilation) and polyethylene endcaps. No metallic parts was used, and this holder was used to align the animal position to UWB fields. The long axis of the tube, i.e., the major axis of the animal was placed in paral- lel with magnetic vector on the ground plane at 72.7 cm from the source end of GTEM cell. The animal was isolated from the ground plane by placing the exposure holder 4.2 cm from the ground plane on an acrylic stand. After transferring the ani- mal into the GTEM cell, a 5-min equilibration period was given before exposure. Three exposure protocols were used: sham exposure, low-UWB and high-UWB exposures for 6 min. During the sham exposure, all UWB exposure conditions were maintained except trigger pulses were never generated to cause discharge across the spark gap. Table 1 lists pertinent pulse parameters used. Figure 3 shows the pulse characteris- tics operated at 500 Hz (low-UWB) and 1,000 Hz (high- UWB) repetition rate.
GTEM Cell
Cross Section View from the absorber
FIG. 2. The UWB exosure system for rats.

756 LU ET AL.
TABLE 1 CHARACTERISTICS OF THE UWB PULSES
Pulse Parameters Sham Low UWB* High UWB* .
Risetime — 180±7ps 200 ± 5 ps Pulse width — 1.00 ± 0.004 ns 1.03 ± 0.02 ns Peak E field intensity OkV/m 93.0 ± 5.0 kV/ra 84.6 ± 4.0 kV/m Pulse repetition rate 0Hz 500 Hz 1,000 Hz Average power density 0 mW/cm2 1.15mW/cm2 1.96mW/cm2
Total radiant exposure 0J/cm2 0.41 J/cm2 0.70 J/cm2
Highest frequencyt — 2.78 GHz 2.50 GHz Medium frequencyt — 0.50 GHz 0.49 GHz Lowest frequencyt — 0.09 GHz 0.10 GHz Fractional bandwidtht — 187% 185%
*Mean ± SD, obtained in five exposures. tEstimated according to Foster (14). Ultrawide band radar is a radar whose
fractional bandwidth is greater than 25%, regardless of the center frequency or the signal time-bandwidth product (45). The fractional bandwidth of these pulses was wider than the minimum required to qualify as UWB radar.
Data Analysis
The present experiment utilized a factorial design with re- peated observations. The time after exposure was designated as "blocks" (r = 7), UWB treatments (t = 3) as treatments and five observations (s = 5) were included. Therefore, the present experiment was a 7 X 3 X 5 experiment which con- tained 105 experimental units. For each experimental unit, the average of four to six measurements was used. To limit the in- dividual variation, the use of individual control was incorpo- rated prior to the commencement of the experiment. There- fore, the end points were changes from the preexposure baseline in each individual rat. Postexposure heart rate and blood pressure data were the magnitude of change from the preexposure baseline of the same rat under study. An analytic method based on an analysis of variance with multiway classi- fication and multiple observations was used. The sources of variation were identified, and the variance and degree of free- dom (df) were computed. These various variances associated with the present experiment were total (experimental units, df = rst - 1 = 104), time after exposure (df = r - 1 = 6), UWB treatments (df = t - 1 = 2), interaction [df = (r - 1) (t - 1) = 12] and error [df = rt (s - 1) = 84]. Dunnett's test
100
80
60
40
20
0
-20
.... " 1" "| " "!■"'[
Vs A '•
• • •! j j ! " " ! p
'"M&}Hz,"9iö"kV?»Ä;"W'ps;'"l1wns'!' l.OqO Hz. (34.6 kY/m. 2(30 ps. jl.03 riß.
.... -4 ]-- I 1 u • fc 1 ! \ ! III!!!: a UJ c UJ i (i
i \\i | i i i ! i:
/H%A\\ JVl: .,!....!.. ..!....! 4t
.. i....
i
4 5 6
TIME (ns)
B 9 10
FIG. 3. The UWB pules operated at 500 and 1,000 Hz repetition rate.
was used for post hoc analysis when a significant UWB treat- ment effect was found. Null hypothesis was rejected at the 0.05 level.
RESULTS
Body Weight
Body weight of animals is shown in Fig. 4. Data are body weight before exposure, 24 h, 72 h, 1 week, 2,3, and 4 weeks after exposure. Other than an initial insignificant weight loss in sham and 500 Hz exposed rats, weight gains were similar among these three groups of animals.
Preexposure Baseline
Figure 5 shows the preexposure baseline. Average heart rate ranged between 332 and 351 beats per minutes (bpm). The ranges in systolic, mean, and diastolic pressures were 146.1 to 147.7,120.1 to 123.6, and 107.2 to 112.1 Torr, respec- tively. Difference among groups in any of the preexposure baseline was not found.
Heart Rate
Figure 6 shows the changes in heart rate from the preexpo- sure baseline. Heart rate usually decreased from the preexpo- sure baseline irrespective of UWB treatments. The UWB treatments, time after exposure and interaction between UWB treatments and time after exposure were not signifi- cantly different in this study.
Systolic Pressure
Systolic pressure of the sham-exposed rats had a tendency to increase (Fig. 7). In contrast, the systolic pressure was con- sistently lower than the preexposure baseline in rats exposed to 500 or 1,000 Hz UWB fields. UWB treatments were the only significant factor noted, F(2,84) = 16.62, p < 0.001. Time after exposure, F(6, 84) = 1.00, NS, and interaction between UWB treatments and time after exposure, F(12,84) = 0.75, NS, were not statistically significant. The largest changes from the respective preexposure baseline were +13.65 Torr at 4 weeks after sham exposure, -23.0 Torr at 2 weeks after expo- sure to 500 Hz and -22.8 Torr at 2 weeks after exposure to 1,000 Hz UWB. Post hoc analysis revealed that decreased sys-

UWB-INDUCED HYPOTENSION 757
320
I o Id
& o m
300 -
280
260
240
o ' ■ ■ ■ 1 ■ ■ ■ ■ 1 ■ ■ ■ r" "I ■ "■■!■■
Sham A 500 Hz
- o 1,000 Hz
> ;
- J^ „ TOvl ' rfr1
, , ...,
UWB TREATMENT: F„ 1.19: N.S. TIME: F, .- 0.95: N.S. INTERACTION: F,„ .,,= 1.03; N.S.
70 80 90
AGE (DAYS)
100 110
FIG. 4. Body weight of WKY rats exposed to UWB. Data shown are preexposure, 24 h, 72 h, 1 week, 2 weeks, 3 weeks, and 4 weeks after exposure.
tolic pressure occurred at 45 min, 24 h, 1,2, and 4 weeks after exposure but not at 72 h, and 3 weeks after exposure in the 500 Hz exposed rats. In the 1,000 Hz exposed rats, significant decreases in systolic pressure occurred at 45 min, 1,2, and 4 weeks after exposure but not at 24 h, 72 h, and 3 weeks after exposure. In comparison to the systolic pressure in sham- exposed rats, the most intense systolic hypotension occurred at 2 weeks after exposure. The magnitude of systolic pressure decrease from the sham-exposed group was 34.9 Torr in the 500 Hz group, and 34.7 Torr in the 1,000 Hz group.
Mean Arterial Pressure
Changes in mean arterial pressure were similar to changes in systolic pressure (Fig. 8). Mean arterial pressure had a ten- dency to increase from the preexposure baseline in sham- exposed rats while decreased mean arterial pressure was noted in rats exposed to 500 and 1,000 Hz UWB. Results of the factorial analysis of variance revealed that UWB treat- ments, F(2,84) = 18.55, p < 0.001, was statistically significant, but the times after exposure, F(6,84) = 0.57, NS was not. In- teraction between UWB treatments and time after exposure was statistically insignificant, F(12,84) = 0.37, NS. The largest
SHAM 0.5 K 1.0 K SHAM 0.5 K 1.0 K
i -
B53 SHAM Y77X 500 Hz. 93.0 kV/m. 1.00 ns ESS 1,000 HZ. 84.6 kV/m, 1.03 ns
72 H 1 WK 2 WK TIME AFTER EXPOSURE
FIG. 6. Heart rates in UWB-exposed rats.
changes from their respective baseline were +8.5 Torr at 72 h after sham exposure, -15.9 Torr at 24 h after 500 Hz, and -16.9 Torr at 2 weeks after 1,000 Hz UWB exposure. In com- parison to sham-exposed rats, significant lower mean arterial pressure was noted in 500 Hz-exposed rats at all times after exposure except at 3 weeks after exposure, and in 1,000 Hz- exposed rats at all time except at 24 h and 3 weeks after expo- sure. The largest magnitude of hypotension was 20.6 Torr in 500 Hz and 21.89 Torr in 1,000 Hz-exposed groups. Both of these occurred at 2 weeks after exposure.
Diastolic Pressure
Although systolic and mean arterial pressures can be de- termined with a photoelectric sphygmomanometer in rats, the diastolic pressure can only be estimated because a characteris- tic pulse marker is not available for identifying the diastolic pressure reliably during the deflection cycle. It is known that the mean arterial pressure is equal to the sum of diastolic pressure and 1/3 of the pulse pressure (difference between systolic and diastolic pressures) (42). Therefore, the diastolic pressure can be estimated from the systolic and mean arterial pressures. Changes in diastolic pressure were similar to systolic and mean arterial pressure (Fig. 9). In comparison to the pre-
UWB TREATMENT: Fgj,,,- 16.62; t< 0.01 TIME: F(6Jl0- 1.00: N.S. INTERACTION: F(,jW)-075: N.S.
30
Z 10 _J Ul (/I S 0
o
O z < X o
ggg SHAM V7A 500 Hz. 95.1 kV/m. 1.02 ns Egg 1.000 HZ, 82.0 kV/m, 1.05 ns
P< 0.05 FROM SHAM
FIG. 5. Preexposure cardiovascular baseline.
0.75H 24 H 72 H 1 WK 2 WK 3 WK 4 WK TIME AFTER EXPOSURE
FIG. 7. UWB-induced systolic hypotension in WKY rats.

758 LU ET AL.
JWB TREATMENT: F^^i 18.55; p< 0.001 . TIME: F(M<)= 0.57; N.S. INTERACTION: F(|2Jt)«0.37; N.S
fSggl SHAM 77A 500 Hz. 93.0 kV/m. 1.00 ns ES) 1.000 HZ, 84.6 kV/m, 1.03 ns
?f f T P< 0.05 FROM SHAM
0.75 H 24 H 72 H 1 WK 2 WK 3 WK 4 WK TIME AFTER EXPOSURE
FIG. 8. UWB-induced decreases in mean arterial pressure in WKY rats.
exposure baseline, change in sham-exposed rats was primar- ily an increase in diastolic pressure, while decreases were noted in rats exposed to 500 or 1,000 Hz UWB. The largest change from baseline was +9.6 Torr at 72 h after sham expo- sure, -16.6 Torr at 45 min after exposure to 500 Hz, and -14.0 Torr at 3 weeks after exposure to 1,000 Hz UWB. Again, the UWB treatments were statistically significant, ^(2,84) = 16.30, p < 0.001, but the time after exposure, ^(6,84) = 0.46, NS, and the interaction between UWB treat- ments and time after exposure, F(12,84) = 0.37, NS were not. Diastolic hypotension was found in four of the six sampling points, i.e., at 45 min, 24 h, 72 h, 1, and 3 weeks but not at two and four weeks after exposure, in rats exposed to 500 Hz UWB. Rats exposed to 1,000 Hz UWB had a lower diastolic pressure than sham-exposed rats in five of the six postexpo- sure sampling points. Diastolic hypotension was not noted in rats at 24 h after exposure to 1,000 Hz UWB. In comparison to sham exposure, the largest magnitude of changes in dias- tolic pressure was -22.5 Torr at 1 week after 500 Hz and -16.7 Torr at 4 weeks after 1,000 Hz.
DISCUSSION
The observation of a delayed, robust, and persistent de- crease in arterial pressures (delayed hypotension) without
UWB TREATMENT: F„„.- 16.30; |>< 0.01 TIME: F,„..- 0.4S; N.S. INTERACTION: F, , .-0.37; N.S.
30 <*w) f(i2.Mr
T- 15581 SHAM V77X 500 Hz. 95.1 kV/m. 1.02 ns ESS 1.000 HZ, 82.0 kV/m, 1.05 ns
Ki in m m im
0.75H 24 H 72 H 1 WK 2 WK 3 WK 4 WK TIME AFTER EXPOSURE
FIG. 9. UWB-induced diastolic hypotension in WKY rats.
changes in the heart rate in rats subjected to an acute UWB exposure is uncommon, no matter what the cause is. The heart rate is known to covary with blood pressure, or to be more susceptible than the blood pressure to RF perturbation (37). As indicated in the introduction, the anticipated UWB- induced change in the cardiovascular function, if any, was hy- pothesized to be hypertension (increased arterial pressure) as part of "atypical post-traumatic syndrome," which included emotional lability, irritability, headaches, insomnia, and de- layed hypertension. In addition, the cardiovascular effect of UWB radiation appears to be different from the effect in- duced by conventional RF radiation. Results of a recent series of experiments (15-18,23-30) on thermogenic effects of RF radiation on cardiovascular functions also supported the con- cept that susceptibilities of the heart rate and arterial pressure to thermogenic RF radiations were different.
Jauchem and Frei (15-18,23-30) evaluated the cardiovas- cular responses of rats exposed to discrete narrow-band mi- crowave radiation at 1.2 (30), 1.2-1.8/1.2-1.4 (26), 2.45 (17,23, 27), 2.8 (16,24,28), 5.6 (17,29), 9.3 (15), and 25 GHz (18). Ex- cept in one experiment (26), these investigators utilized ket- amine-anesthetized rats as the experimental model. Their ex- perimental design involved a comparison of cardiovascular end points, mean arterial pressure, and heart rate, in micro- wave exposed rats when their rectal temperature reached 38.5 and 39.5°C during the course of microwave exposure. Occa- sionally, the cardiovascular end points were the time sequen- tial data in a lethal exposure. The whole-body average SAR used in these experiments ranged between 6 and 16.8 W/kg. Because ketamine-anesthetized rats could not maintain a rec- tal temperature at 38.5 and 39.5°C, sham-exposure data was not presented in these experiments. Thermal tachycardia and thermal hypertension were usually concluded. In contrast, the specific aims of the present experiment were to study the late cardiovascular sequelae of UWB exposure in unanesthetized rats without confounding factors such as postsurgical compli- cations and anesthesia. In addition, the magnitude of response of each individual rat was adjusted with its own preexposure baseline in the present experiment. Furthermore, the cardio- vascular responses studied in the present experiment were compared to the end points obtained from sham-exposed rats. Because of these differences in experimental approaches, it is difficult to compare the results obtained in these two labora- tories. Lacking a comparable experiment on RF-induced de- layed cardiovascular effects, the uniqueness of the UWB- induced delayed hypotension cannot be ascertained at the present time.
Arterial pressure is determined by the cardiac output and total peripheral resistance. Based on hemodynamics princi- ples, the cause of a decrease in arterial pressure in the absence of heart rate alteration (therefore, no change in cardiac out- put) is a decrease in total peripheral resistance. Rats are known to possess a baroreceptor reflex mechanism, which serves to maintain a constant arterial pressure by increasing heart rate (therefore, cardiac output) if arterial pressure decreases or by decreasing the heart rate if arterial pressure increases (31). The absence of compensation by baroreceptor reflexes can re- sult from baroreceptor reset, alterations in autonomic out- flows or alterations in adrenergic receptors. The exact mecha- nism of the UWB-delayed hypotension is not known.
The Committee on Care and Use of Spontaneous Hyper- tensive Rats has recommended the use of an indirect blood (arterial) pressure measurement method for determining the arterial pressure in rats (22). Indirect arterial pressure mea- surement requires restraint. Restraint is a known psychogenic/

UWB-INDUCED HYPOTENSION 759
emotional stress. It is known to cause tachycardia and hyper- tension through sympathetic arousal in animals (3,5,38,40). The WKY rats used in the present experiment were accli- mated to the holder to prevent novelty stress. Successful accli- mation to novelty stress was indicated by the absence of reluc- tance to be placed in holder, absence of defecation and urination, and the reduction in number of restless episodes during the 1-h period in the holder. A recent study (5) has shown that the peak tachycardia response to restraint was not affected after 10 acclimation sessions. Acclimation, however, did accelerate the return of the tachycardia to baseline. Interpretation of re- sults in the present study should include the possibility that the method of indirect blood pressure measurement is a "stress test" rather than a test procedure for the basal/resting cardio- vascular functions. It is possible that demonstration of the UWB- induced hypotension requires additional "stimuli" associated with the indirect blood pressure measurement procedure.
Genetic predisposition appears to be an important factor in animal's response to stress. Sudakov (44) used a 30-h con- tinuous restraint to differentiate three types of cardiovascular changes to restraint: resistant, adaptive, and sensitive. More than 50% of Wistar rats that did not exhibit heart rate and ar- terial pressure responses to the prolonged restraint were clas- sified as resistant. Forty to 65% of Wistar, Vegh, August, and mixed strains that exhibited initial hypertension or hypoten- sion followed by a return almost to the initial level at the end of 30-h restraint, were classified as adaptive. Approximately 30% of August and Vegh rats were classified as sensitive; they perished during the 30-h restraint bearing ECG T-wave changes and myocardial infarction. Genetic predisposition was also considered to be an important factor in the basal/ resting cardiovascular functions, and the magnitude of cardio- vascular responses to various emotional stresses (3,6,32,35, 44). The WKY rats appeared to be adaptive because the car- diovascular indices were different from those of Wistar rats, their parent strain, which is classified as resistant.
It has been reported that responses of heart rate and arte- rial pressures reached a plateau and remained reasonably constant after 10 min in the restrainer (3). In addition, studies in several animal species including rats demonstrated that ar- terial pressure and heart rate were characterized by a large spontaneous variability in an unanesthetized state (12). To limit the spontaneous variation and genetic predisposition, we have instituted strenuous measurement controls such as sources of animals, strain of rats, ambient temperature (26.5- 27.5°C), time of day (0900-1200 h), duration in the test holder (between 20 and 60 min), and interval between testing (5 min). These controls were used to maintain a consistent level of stimulus during indirect arterial pressure measurement procedure. In addition, the average value of multiple mea- surements was used to represent the cardiovascular functions at each datum point for each animal to minimize sampling errors.
The heart rate and arterial pressure data obtained in rats bearing chronic arterial cannula (direct blood pressure mea- surement) in their home cages were accepted as stress-free measurements. Representative data for heart rate ranged be- tween 279 ± 10 (mean ± SE, n = 5) and 345 ± 9 (n = 6) bpm and mean arterial pressure between 115 ± 3 (n = 7) and 122 ± 4 (n = 6) Torr in male adult cannulated WKY rats by various investigators (6,35,40). The ranges of the preexposure cardio- vascular baseline of the present experiment were 332 ± 9 (n = 5) to 351 ± 8 (n = 5) bpm for heart rate and 120 ± 5 (n = 5) to 124 ± 5 (n = 5) Torr for mean arterial pressure. Therefore, these baseline values in the present study compared well to other reported ranges in the literature.
A decrease in blood pressure may not be a hypotension if the blood pressure is within the normal ranges of the species under study. The mean arterial pressures of the UWB-induced hypotension at the lowest point were 108 ± 7 (n = 5,500 Hz) and 107 ± 8 (n = 5,1,000 Hz) which qualify these values in the range of true hypotension instead of a decrease in arterial pressure in WKY rats. On the other hand, the range of stress- free mean arterial pressure of Wistar rats, the parent strain of WKY rats, was between 97 ± 2 (n = 6) and 112 ± 3 (n = 10) Torr (36,47). The stress-free mean arterial pressure of the Sprague-Dawley rats was also lower than that of WKY rats. The range reported were 85 ± 5 (n = 4) to 115 ± 3 (n = 12) Torr (3,12,20,43). The UWB-induced changes in arterial pressure in the present experiment was a mild form of hy- potension in the WKY rats and should be asymptomatic if the mean arterial pressures of various strains of rats are con- sidered.
In comparison to studies using narrow-band RF, the aver- aged exposure intensity of the present UWB exposure is rela- tively low—1.15 and 1.96 mW/cm2. Conventional dosimetry methods, such as thermometry and calorimetry, lack of sensi- tivity to determine the specific absorption rate (SAR) from exposure to these low intensities. Equipment, instrumentation and techniques for measuring the internal electric field are not available. To estimate the whole-body average SAR, the relative power spectrum was computed from the padded data file, from 10 ns to 100 ns for a 10 MHz resolution of the UWB pulse by Mathcad's Maximum Entropy Method in the Numer- ical Recipes Function Pack. It appeared that ti pewu was below 200 MHz (Fig. 10, power spectrum, dashed' line). The relative power (RP) spectrum was then convolved with the SAR vs. Frequency curve (11) in a spheroidal model of a medium rat for H polarization (Fig. 10, SAR, dotted line), also at 10 MHz intervals from 10 MHz to 10 GHz. The convo- luted curve (Fig. 10, SAR X RP, solid line) represented the absorption spectrum of a rat exposed to the UWB pulse used in the present experiment. {Ninety % of the spectrum power )
Cwäs between 10 MHz andl.08 GHzfThe maximum value of QJOQ the absorption for a single discrete'frequency was at *6TMHz, ° which indicated that SAR was less than ^mW/kg/mW/cm2 ifV according to the value presented in the SAR curve. Integra- tion of the convolved curve (SAR X RP) and normalized by the area under the RP curve yielded a whole-body SAR at 61.7 mW/kg/mW/cm2 for the high UWB pulse. Analysis of the low UWB pulse (500 Hz) yielded a similar result in relative power spectrum, absorption spectrum, and whole-body SAR (60.9 mW/kg/mW/cm2). For the 1,000 Hz group, total absorp- tion in 6 min was, therefore, in the order of 43.5 J/kg or less, which is incapable of inducing any significant temperature in- crease in the animal. The mechanism of the UWB-induced hypotension is not known.
A widely known effect specific to pulsed microwave radia- tion with high peak power in the induced auditory sensation elicited by microwave pulses. This effect has been the subject of several reviews (7,34,39). It is generally accepted that the pulsed microwave-induced audible sound is generated from a thermoelastic expansion of cranial tissue and launches an acoustic wave that is detected by hair cells in the cochlea. For pulsed microwave with pulse width shorter than 30 \ts, the mi- crowave-induced auditory threshold was independent of tem- poral peak power density (or temporal peak specific absorp- tion) and it is entirely dependent on the energy density of the microwave pulse or specific absorption (SA) per pulse. The auditory threshold SA per pulse has been determined in hu- man volunteers, cat (19) and rats (9), 16,10, to 12 and 0.9 to

760 LU ET AL.
E o
< C/)
10"
10- r
Cd 10
° 10"3
a Q- 10
* 4)
x £ a: o 10"4
< 0)
10"
10
i i r i i i i i | 1 1 1—r-r-m-f i , , , . 1111 :
-
SAR
■; ?~\~ //^\
: SAR •—^___^ /'^/ \ V_ Y/ RP :
; >^ ^^ SAR X RP^^ \ \ ■
r
./^ SAR, H polarization 1
■ Relative Power Spectrum • I SAR x RP
- SAR= 61.7 mW/kg/mW/cm2 -
: 1 1 1 1 1 1 1 1 1 1 1 L J. A. 1. Ill ■ i ■ ■ < i ■ ■I :
10 1 102 103 10"
Frequency (MHz)
FIG. 10. Power spectrum and absorption spectrum of the UWB pulse.
1.8 mJ/kg, respectively. The temporal peak SAR of the high UWB pulse used in the present experiment was>99icW/kg (duty cycle =10-6). Due to an extremely short pulse (pulse width = 1.03 ns), the SA per pulse from the high UWB pulses
Vas around Mli pj/kg, which was three ordeip of magnitude Jower märrthe known auditory threshold in rats. Therefore, 'the UWB-induced delayed hypotension was not a sequela of an audiogenic effect. Q. / 2.1
The estimated threshold SAR (£962 W/kg, high UWB pulse) for UWB-induced hypotension in rats was ^Sß times less than 0.4 W/kg, the basis for the IEEE C95.1-1991 safety standard in a controlled environment (21). The threshold peak electric field of the UWB pulses was less than the allow- able peak electric field (100 kV/m) used in this standard. Hy- potension is known to possess adverse health implications. The UWB-induced hypotension is a recent finding that has not been addressed during the promulgation of personnel
[if protection guidelines. Further research on effect replication and dose-response characteristics are highly recommended.
0&L ACKNOWLEDGEMENTS
This work was supported by the U.S. Army Medical Research and Materiel Command under the contract No. DAMD17-94-C-4069 with McKesson BioServices. The authors acknowledge the contributions of Jian-Zhong Bao for providing a transfer function for field measure- ment, Pamela J. Henry for technical assistance, D. Duane Cox for fab- rication of the microenvironment chambers, and Bruce E. Stuck for valuable suggestions during the preparation of the manuscript. In con- ducting this research, the investigators adhered to the "Guide for the Care and Use of Laboratory Animals" and policies of the Walter Reed Army Institute of Research and U.S. Air Force Armstrong Labora- tory. Disclaimer: The views, opinions and/or findings contained in this report are those of the authors and should not be construed as an official Department of the Army position, policy, and decision.
REFERENCES
1. Albanese, R.; Blaschak, J.; Median, R.; Penn, J.: Ultrashort elec- tromagnetic signals: Biophysical questions, safety issues, and medical opportunities. Aviat. Space Environ. Med. 65:A116- A120;1994.
2. Bao, J.-Z; Lee, J. C; Lu, S.-T.; Seaman, R. L.; Akyel, Y.: Analy- sis of ultra-wide-band pulses in a GTEM cell. In: Brandt, H. E., ed. Intense microwave pulses III, Proc. Spie 2557. Danvers: Inter- national Society for Optical Engineering; 1995:237-248.
3. Barron, B. A.; Van Loon, G. R.: Role of sympathoadrenomedul- lary system in cardiovascular response to stress in rats. J. Autonomi. Ner. Syst. 28:179-188; 1989.
4. Bunag, R. D.; Butterfield, J. B.: Tail-cuff blood pressure mea- surement without external preheating in awake rats. Hyperten- sion 4:898-903; 1982.
5. Chen, X.; Herbert, J.: Regional changes in c-fos expression in the basal forebrain and brainstem during adaptation to repeated stress: Correlations with cardiovascular, hypothermic and endo- crine responses. Neuroscience 64:675-685; 1995.
6. Chiueh, C. C; Kopin, I. J.: Hyperresponsivity of spontaneously hypertensive rat to indirect measurement of blood pressure. Am. J. Physiol. H690-H695; 1978.
7. Chou, C. K.; Guy, A W.; Galambos, R.: Auditory perception of radio-frequency electromagnetic fields. J. Acoust. Soc. Am. 71:1321- 1334; 1982.
8. Chou, C.-K.; Guy, A. W.; Kunz, L. L.; Johnson, R. B.; Crowley, J. J.; Krupp, J. H.: Long-term, low-level microwave irradiation of rats. Bioelectromagnetics 13:469-496; 1992.
9. Chou, C.-K, Yee, K.-C; Guy, A. W.: Auditory response in rats exposed to 2,450 MHz electromagnetic fields. Bioelectromagnet- ics 6:323-326; 1985.
10. D'Andrea, J. A.; Gandhi, O. P.; Lords, J. L.; Durney, C. H.; Astle, L.; Stensaas, L. J.; Schoenberg, A. A.: Physiological and behavioral effects of prolonged exposure to 915-MHz micro- waves. J. Microwave Power 15:123-135; 1980.
11. Durney, C. H; Massoudi, H.; Iskander, M. F.: Radiofrequency radiation dosimetry handbook, 4th ed. Brooks AFB: USAF

UWB-INDUCED HYPOTENSION 761
School of Aerospace Medicine Aerospace Medical Division (USAFSAM-TR-85-73) 1985:617.
12. Ferrari, A. U.; Dafffonchio, A.; Albergati, F.; Mancia, G.: Inverse relationship between heart rate and blood pressure variabilities in rats. Hypertension 10:533-537; 1987.
13. Foreman, S.; Holmes, C; McManamon, V.; Wedding, W.: Psy- chological symptoms and intermittent hypertension following acute microwave exposure. J. Occupat. Med. 24:932-934; 1982.
14. Foster, P. R.: Antennas and UWB signals. In: Taylor, J. D., ed. Introduction to ultra-wideband radar systems. Boca Raton, FL: CRC Press; 1995:237-248.
15. Frei, M. R.; Jauchem, J. R.: Thermoregulatory response of rats exposed to 9.3-GHz microwave: A comparison of E and H orien- tation. Physiol Chem. Phys. Med. NMR 24:1-10; 1992.
16. Frei, M.; Jauchem, J.; Heinmets, F.: Physiological effects of 2.8 GHz radiofrequency radiation: A comparison of pulsed and con- tinuous-wave radiation. J. Microwave Power 23:85-93; 1988.
17. Frei, M. R; Jauchem, J. R.; Price, D. R; Padilla, J. M.: Field ori- entation effects during 5.6-GHz radiofrequency irradiation of rats. Aviat. Space Environ. Med. 61:1125-1129; 1990.
18. Frei, M. R; Ryan, K. L.; Berger, R. E.; Jauchem, J. R: Sustained 35-GHz radiofrequency irradiation induces circulatory failume. Shock 4:289-293; 1995.
19. Guy, A. W.; Chou C. K.; Lin, J. C: Microwave-induced acoustic effects in mammalian auditory systems and physical materials. Ann. NY Acad. Sei. 247:194-218; 1975.
20. Houdi, A. A.; Dowell, R. T; Diana, J. N.: Cardiovascular responses to cigarette smoke exposure in restrained conscious rats. J. Pharmacol. Exp. Ther. 275:646-653; 1995.
21. Institute of Electrical and Electronics Engineers: IEEE C95.1 Standard for safety levels with respect to human exposure to radio frequency electromagnetic fields, 3 kHz to 300 GHz. New York: Institute of Electrical and Electronics Engineers; 1992.
22. Institute of Laboratory Resources: Committee on care and use of spontaneously hypertensive (SHR) rats. Spontaneously hyper- tensive (SHR) rats: Guidelines for breeding care and use, vol 19. Washington, DC: ILAR News; Natl. Acad. Sci.-Natl. Res. Coun- cil, 1976:G1-G20.
23. Jauchem, J. R.; Chang, K. S.; Frei, M. R.: Tolazoline decreases survival time during microwave-induced lethal heat stress in anesthetized rats. Proc. Soc. Exp. Biol. Med. 211:236-243; 1996.
24. Jauchem, J. R.; Frei, M. R.: Cardiovascular changes in unanesthe- tized and ketamine-anesthetized Sprague-Dawley rats exposed to 2.8-GHz radiofrequency radiation. Lab. Anim. Sei. 41:70-75; 1991.
25. Jauchem, J. R.; Frie, M. R.: Cardiorespiratory changes during microwave-induced lethal heat stress and ß-adrenergic blockage. J. Appl. Physiol. 77:434-440; 1994.
26. Jauchem, J. R.; Frei, M. R: High-peak power microwave pulses: Effects on heart rate and blood pressure in unanesthetized rats. Aviat. Space Environ. Med. 66:992-997; 1995.
27. Jauchem, J. R.; Frei, M. R; Chang, K. H; Berger, R. E.: Micro- wave-induced lethal heat stress: Effect of phentolamine, prazosin and metoprodol. Methods Find. Exp. Clin. Pharmacol. 17:241- 248; 1995.
28. Jauchem, J. R.; Frei, M. R.; Heinmets, F.: Thermal bradycardia during radiofrequency irradiation. Physiol. Chem. Phys. Med. NMR 15:429-434; 1983.
29. Jauchem, J. R; Frei, M. R.; Heinmets, F.: Heart rate changes due to 5.6 GHz radiofrequency radiation: Relation to average power density. Proc. Soc. Exp. Biol. Med. 177:383-387; 1984.
30. Jauchem, J. R.; Frei, M. R.; Padilla, J. M.: Thermal and physio- logic responses in 1200-MHz radiofrequency radiation: Differ- ence between exposure in E and H orientation. Proc. Soc. Exp. Biol. Med. 194:358-363; 1990.
31. Kirchheim, A. R.: Systemic arterial baroreceptor reflexes. Phys- iol. Rev. 56:100-176; 1976.
32. Lawer, J. E.; Barker, G. F.; Hubbard, J. W.; Schaub, R. G.: Effect of stress on blood pressure and cardiac pathology in rats with bor- derline hypertension. Hypertension 3:496-505; 1981.
33. Lee, J.; Bao, J.-Z.; Lu, S.-T; Seaman, R L: An ultra-wide-band exposure system for studying biological effects. In: Abstract book of the seventeenth annual meeting of the bioelectromagnetics society. Fredrick: Bioelectromagnetics Society, Fredrick; 1995:160.
34. Lin, J. C: Microwave auditory effects and applications. Spring- field, IL: Charles C. Thomas; 1978.
35. Ludin, S.; Ricksten, S.-E.; Thoren, P.: Interaction between "men- tal stress" and baroreceptor reflexes concerning effects on heart rate, mean arterial pressure and renal sympathetic activity in con- scious spontaneously hypertensive rats. Acta. Physiol. Scand. 120:273-281; 1984.
36. Mauck, G. W.; Smith, C. R.; Geddes, L. A; Bourland, J. D.: The meaning of the point of maximum oscillations in cuff pressure in the indirect measurement of blood pressure—Part II. J. Biomech. Eng. 102:28-33; 1980.
37. Michaelson, S. M.; Lin, J. C: Cardiovascular effects. In: Michael- son, S. M.; Lin, J. C, eds. Biological effects and health implica- tions of radiofrequency radiation. New York: Plenum Press; 1987: 451-488.
38. Nagasaka, T; Hirata, K.; Shibata, H.; Sugano, Y.: Metabolic and cardiovascular changes during physical restraint in rats. Jpn. J. Physiol. 30:799-803; 1980.
39. NCRP Report 86: Perception of RFEM fields. In: Biological effects and exposure criteria for radiofrequency fields. Bethesda, MD: National Research Council on Radiation Protection and Measurements; 1986:175-180.
40. Sakaguchi, A.; LeDoux, J. E.; Reis, D. J.: Sympathetic nerves and adrenal medulla: Contributions to cardiovascular-conditioned emotional responses in spontaneous hypertensive rats. Hyperten- sion 5:728-738; 1983.
41. Sherry, C. J.; Blick, D. W.; Walters, T. W.; Brown, G. C; Murph, M. R.: Lack of behavioral effects in non-human primates after exposure to ultrawideband electromagnetic radiation on the microwave frequency range. Radiat. Res. 143:93-97; 1995.
42. Sodeman, W. A., Jr.; Sodeman, W. A.: Systemic arterial pressure. In: Pathological physiology. Philadelphia, PA: W. B. Saunders Co.; 1974:177-205.
43. Sparrow, M. G.; Roggendorf, H.; Vogel, W. H: Effect of ethanol on heart rate and blood pressure in nonstressed and stressed rats. Life Sei. 40:2551-2559; 1987.
44. Sudakov, K. V.: Organization of cardiovascular functions under experimental emotional stress. J. Autonom. Nerv. Syst. 4:165- 180; 1981.
45. Taylor, J. D.: Ultra-wideband radar overview. In: Taylor, J. D., ed. Introduction to ultra-wideband radar systems. Boca Raton, FL: CRC Press; 1995:1-10.
46. Toler, J.; Popovic, V.; Bonasera, S.; Popovic, P.; Honeycutt, C; Sgoutas, D.: Long-term study of 435 MHz radio-frequency radia- tion on blood-borne end points in cannulated rats, Part II: Meth- ods, results and summary. J. Microwave Power 23:105-136; 1988.
47. Van Den Berg, D. T W. M.; De Jong, W.; De Kloet, E. R: Min- eralocorticoid antagonist inhibits stress-induced blood pressure response after repeated daily warming. Am. J. Physiol. 267:E921- E9926; 1994.
48. Walters, T. J.; Mason, P. A.; Sherry, C. J.; Steffen, C; Merritt, J. H.: No detectable bioeffects following acute exposure to high peak power ultra-wide band electromagnetic radiation in rats. Aviat. Space Environ. Med. 66:562-567; 1995.
49. Williams, R.; Webb, T.: Exposure to radiofrequency radiation from an aircraft radar unit. Aviat. Space Environ. Med. 51:1243- 1244; 1980.
50. Yamakoshi, K.-L; Kamiya, A.: Noninvasive measurement of arte- rial blood pressure and elastic properties using photoelectric plethysmography technique. Med. Prog. Technol. 12:123-143; 1987.
51. Yen, T T; Powell, C. E.; Pearson, D. V.: An indirect method of measuring the blood pressure of rats without heating. In: Sponta- neous hypertension: Its pathogenesis and complications. Bethesda, MD: U.S. Public Health Service (DHEW Publication No. 77-1179); 1977:486-490.

ELSEVIER
ERRATUM
Ultrawide-Band Electromagnetic Pulses Induced Hypotension in Rats
SHIN-TSU LU, SATNAM P. MATHUR, YAHYA AKYEL AND JONATHAN C LEE
Published in Physiology & Behavior 65 (1999) pages 753-761
The Publisher regrets that the publication of the above paper was printed without author's corrections. The article as it should have been published is shown on the following pages.
Physiology & Behavior, Volume 67, Issue No. 3, September, 1999
463

Physiology & Behavior, Vol. 65, Nos. 4/5, pp. 753-761,1999 © 1999 Elsevier Science Inc.
Printed in the USA. All rights reserved 0031-9384/99 $-see front matter
ELSEVIER PII S0031-9384(98)00214-5
Ultrawide-Band Electromagnetic Pulses Induced Hypotension in Rats
SHIN-TSU LU,1 SATNAM P. MATHUR, YAHYA AKYEL AND JONATHAN C LEE
McKesson BioServices, U.S. Army Medical Research Detachment, Microwave Bioeffects Branch, 8308 Hawks Road, Building 1168, Brooks Air Force Base, TX 78235
Received 17 December 1997; Accepted 17 July 1998
LU, S.-T.. S. P. MATHUR, Y. AKYEL AND J. C. LEE. Ultrawicle-band electromagnetic pulses induced hypotension in rats. PHYSIOL BEHAV 65(4/5) 753-761,1999.—The ultrawide-band (UWB) electromagnetic pulses are used as a new modality in radar technology. Biological effects of extremely high peak E-field, fast rise time, ultrashort pulse width, and ul- trawide band have not been investigated heretofore due to the lack of animal exposure facilities. A new biological effects data- base is needed to establish personnel protection guidelines for these new type of radiofrequency radiation. Functional indices of the cardiovascular system (heart rate, systolic, mean, and diastolic pressures) were selected to represent biological end points that may be susceptible to the UWB radiation. A noninvasive tail-cuff photoelectric sensor sphygmomanometer was used. Male Wistar-Kyoto rats were subjected to sham exposure. 0.5-kHz (93 kV/m, 180 ps rise time. 1.00 ns puke width, whole-body averaged specific absorption rate. SAR = 70 mW/kg) or a 1 -kHz (85 kV/m, 200 ps rise time, 1.03 ns puke width. SAR = 121 mW/kg) UWB fields in a tapered parallel plate GTEM cell for 6 min. Cardiovascular functions were evaluated from 45 min to 4 weeks after exposures. Significant decrease in arterial blood pressures (hypotension) was found. In contrast, heart rate was not altered by these exposures. The UWB radiation-induced hypotension was a robust, consistent, and persis- tent effect. © 1999 Elsevier Science Inc.
Arterial pressure Heart rate Pulsed radiofrequency radiation Ultrawide-band radiation Delayed effects
THE ultrawide-band (UWB) radiofrequency (RF) radiation is a new modality in radar technology. The potential usages of UWB radar are not limited to military application only. At much lower power, an example of civilian UWB radar appli- cation is in automobile safety. Devices designed as warning systems for backing up and parking are planned, and expected to be available in the next few years. A commonly used defini- tion accepted by the Defense Advanced Research Project Agency is "Ultrawide band radar is any radar whose frac- tional bandwidth is greater than 0.25, regardless of the center frequency or the signal time-bandwidth product" (45). The UWB is a radiofrequency signal with an ultrashort pulse width (a few ns) and a very fast rise time (<200 ps). Because of the ultrashort pulse width, the peak electric field of a UWB pulse can be operated in excess of the breakdown voltage without arcing. In fact, systems with peak electric field in ex- cess of hundreds of kV/m are known to exist. Another charac- teristic is a very low duty cycle of these UWB devices result- ing from an ultrashort pulse width.
Radiofrequency personnel protection guidelines usually are promulgated on a time-averaged specific absorption rate
or power density. From operational characteristics of the UWB devices with an extremely high peak electric field and very low duty cycle, the energy absorption rate per pulse in humans can be extremely high (temporal peak SAR), but the average specific absorption rate (average SAR) can be very low if a time-average procedure is applied. The ratio of peak to average SARs will be much greater than those of narrow- band RF radiation used in the past for evaluation of the bio- logical effects of pulsed RF radiation. Concerns on UWB ra- diation safety issues have been voiced (1). However, the experimental database on UWB safety issues is very limited (41.48). Therefore, there is a need for additional'toxicologi- cal testing to address the safety of UWB radiation.
Interests in the cardiovascular effects of RF radiation can be traced back to as early as the 1940s (37), and it has contin- ued until today. Specifically, cardiovascular effects of RF ra- diation include human studies with emphasis on changes in regional blood flow for diathermy, epidemiology, and case report, studies in experimental animals such as cardiac inju- ries caused by intense RF exposure, cardiovascular adjust- ments to localized "low-level" RF exposure, changes in arte-
'To whom requests for reprints should be addressed. E-mail: [email protected]
753

754 LU ET AL.
rial pressure, and heart rate by moderate RF exposure. The effect of RF radiation on heart rate can be further divided into tachycardia, bradycardia. cardiac pacing, effects on iso- lated cardiac tissue in vitro and the RF interference of the im- planted cardiac pacemaker. This database forms a foundation for a comparative analysis between narrow-band RF and UWB radiations. However, the majority of these studies are acute experiments employing a short-term (acute) exposure and studying cardiovascular end points in a short period of time, for example, during or immediately after RF exposure, and usually under anesthesia. Three studies used a long-term (chronic) RF exposure, but cardiovascular functions were not their main emphasis: instead, they were embedded in a bat- tery of end points (8.10.46).
Two types of chronic cardiovascular effects have been ob- served. They are the cardiovascular effect of a chronic expo- sure and the delayed effect of an acute exposure. The chronic effect is represented by a biphasic (hypertension-»normoten- sion-»hypotension) or a monophasic (hypotension) arterial response in rats chronically exposed to RF radiation (37). The delayed effects are from case reports (13,49) indicating the presence of delayed hypertension in conjunction with anxiety attacks, which was termed "atypical post-traumatic syndrome," months after an accidental exposure to RF fields. This de- layed vascular response has never been confirmed experimen- tally. In the present experiment, heart rate and blood pressure in awake rats were evaluated periodically with a tail-cuff pho- toelectric sphygmomanometer from 45 min to 4 weeks after acute UWB exposures.
MATERIALS AND METHODS
General Description of the Experimental Procedure
Fifteen male Wistar-Kyoto (WKY) rats aged between 71 and 89 days were used at the beginning of the experiment. They were obtained at 56 days of age from a commercial source (Charles River, Portage, MI). They were maintained in the vivarium at 21-23°C ambient temperature, 100% condi- tioned fresh air for more than 10 exchanges per hour, and a 12 L-12 D (lights on 0600-1800 h) light cycle. Tap water and feed (Purina Rodent Diet 5008, Ralston Purina Co., St. Louis, MO) were available ad lib. After a 10-day quarantine period, they were acclimated to a test holder (IITC Life Science, Woodland Hills. CA. model 81) 1 h daily for 3 days. Preexpo- sure baseline of the heart rate and arterial pressures (systolic, mean, and diastolic) were determined 1-2 days after the holder acclimation. Three to 4 days later, they were individu- ally subjected to sham exposure, low UWB, or high UWB ex- posure for 6 min between 0900 and 1000 h in an exposure holder maintained at 23-25°C. On the exposure day, average body weight was 250 + 4 g (n = 15, SE). Immediately after ex- posure, the rat was transferred to the test holder for heart rate and blood pressure measurements. Postexposure heart rate and blood pressures were determined at 45 min, 24 h, 72 h, 1, 2, 3, and 4 weeks after exposure. Four to six determinations were obtained at each time point, and the average value was used to represent the cardiovascular endpoints at that time point Fifteen animals were divided randomly into three groups of five rats each for sham exposure, "low" UWB and "high" UWB exposures. Each rat was assigned randomly to receive one of the three treatments in five experimental cy- cles. The UWB-exposed rats were always accompanied by at least one sham-exposed animal such that the time-related ex- perimental error caused by different experimental cycles or animal shipments could be minimized.
Photoelectric Sphygmomanometer
An indirect tail-cuff arterial pressure measurement system without external preheating in awake rats was first introduced by Yen et al. (51). Validation of pressure markers (systolic and mean arterial pressures), and theoretical analysis of this indirect method based on a photoelectric sensor have been performed by various investigators (4.36.50). For the present experiment, a commercial system (IITC Life Sei.. Woodland Hills, CA) was used. The system was composed of a pulse am- plifier (IITC model 29). tail-cuff photoelectric sensor assem- bly (IITC model B-60,5/8" cuff), smaller bore tubing (Tygon, 1.6 mm i.d., 0.8-mm wall thickness for connecting tail-cuff, pressure amplifier, pressurizing bulb, and pressure gauge) and animal holder (IITC model 81). Outputs of the pressure trans- ducer and pulse sensor from the pulse amplifier were split evenly. One set of outputs was monitored continuously with a digital oscilloscope (Tektronix 2430 A. Tektronix. Inc., Wilson- ville. OR). The other set of outputs was converted to a digital signal and recorded using a strip chart program (AYSTANT+, Asyst Software Technology, Rochester, NY) by a computer (Hewlett-Packard Vectra, Hewlett Packard. Greenley, CO) at 50 Hz data acquisition rate. The recorded data was im- ported into a graphics program (SigmaPlot 4.1. Jandel Scien- tific Softwares. San Rafael, CA) and viewed graphically and digitally. A custom-made microenvironment chamber was fab- ricated from acrylic tubes (28 cm long, 12 and 14 cm i.d.. 3.2-mm wall thickness). Plastic tubing (Tygon. 6.4 mm i.d.. 1.6-mm wall thickness, from Cole Palmer, Vernon Hills. IL) was wrapped around the smaller acrylic tube with tubing wall touching each other to form a coil 18 cm in length. The larger acrylic tube was used as an outer wall. Both ends of the Tygon tubing were connected to the pump inlet and outlet port of a precision cir- culator water bath (Neslab RTE-110, Neslab Instruments, Portsmouth, NH) providing an microenvironment within the inner acrylic tube between 26.5 and 27.5°C to prevent sudden temperature surges. The microenvironment chamber was mon- itored continuously with a thermistor temperature probe (Yel- low Springs 405 air temperature probe. Yellow Springs Instru- ment, Yellow Springs. OH) and a digital thermistor bridge (Cole Palmer 08502-12, Cole Palmer, Vernon Hills. IL). The pressure amplifier output was set at 1.00 volt per Torr (mmHg). Light intensity and photosensor output amplifier were ad- justed to provide a tail-pulse signal at no more than 5 volts at the maximum oscillation. Pressure amplifier output was cali- brated daily against a certified sphygomomanometer before use. The same tail-cuff-photoelectric sensor assembly was used throughout the entire experiment.
Cardiovascular Parameter Measurement
Rats were transported from the vivarium to the laboratory in the morning. They were allowed to sit quietly in their own cage for at least 30 min before being transferred to the test holder. The rat and test holder were then inserted into the mi- croenvironment chamber. Heating in the microenvironment chamber caused by animal body heat was offset by adjusting the waterbath temperature. After 20 min in the microenviron- ment chamber, the rat tail was passed through the tail cuff. The tail-cuff/photoelectric sensor was then attached to the test holder, by this time, characteristic tail pulses could be de- tected if the tail cuff was inflated to 40-^0 Torr (mmHg). When the presence of tail pulses was ascertained, tail cuff was quickly inflated to 200-220 Torr until tail pulses disappeared. The cuff was then deflated immediately afterwards at approx- imately 2 Torr per heart beat for 25.6 s. Systolic pressure (P,)

UWB-INDUCED HYPOTENSION 755
TIME (SECONDS)
FIG. 1. An example of the indirect arterial pressure measurement in the rat.
was determined during the deflation cycle as the corresponding cuff pressure at the reappearance of the tail pulse while mean pressure (Pm) was the cuff pressure when amplitude of the tail pulse reached a maximum. Diastolic pressure (Pd) was calculated by Pd = (P,„ X 3 - PS)I2 (42). Heart rate was determined from the average of pulse-to-pulse intervals for at least 60 beats. An example of this deflation cycle is shown in Fig. 1. The arte- rial pressure/heart rate measurement was repeated for four to six times separated by a 5-min interval between determinations to avoid the collapse of the tail artery during measurement.
UWB Exposure
The UWB exposure system was originally designed and built at the Sandia National Laboratories (Albuquerque, NM).
The UWB pulses were generated by a spark gap pulse genera- tor and transmitted into a GTEM cell (Gigahertz Transverse Electromagnetic cell, a flared rectangular coaxial transmission line) (Fig. 2). The rise time and pulse width were 180 ps and 1.00 ns. respectively, when the system was operated at 500 Hz, and they were 200 ps and 1.03 ns when operated at 1,000 Hz. The pulsed electric field was measured with a EG&G (Welles- ley. MA) D-dot sensor (model ACD-1R) (33). Outputs of the D-dot sensors were measured with a 4.5-GHz bandwidth Tektronix SCD5000 transient sampling scope. A transfer function was used for data compensation of the pulsed electric field. The transfer function was based on deconvolution tech- nique of a standard pulse generated by a Picosecond Pulse Laboratories 4050 B picosecond step generator with 5100 pulse forming network. The corrected D-dot values were con- verted into E field intensity (2). For UWB exposures, the rat was placed in an exposure holder fabricated from an acrylic tube (6.5-cm i.d., 3.2-mm wall thickness, 28 cm long, 6.4 X 50-mm slots separated by 19 mm for ventilation) and polyethylene endcaps. No metallic parts was used, and this holder was used to align the animal position to UWB fields. The long axis of the tube, i.e., the major axis of the animal was placed in paral- lel with magnetic vector on the ground plane at 72.7 cm from the source end of GTEM cell. The animal was isolated from the ground plane by placing the exposure holder 4.2 cm from the ground plane on an acrylic stand. After transferring the ani- mal into the GTEM cell, a 5-min equilibration period was given before exposure. Three exposure protocols were used: sham exposure, low-UWB and high-UWB exposures for 6 min. During the sham exposure, all UWB exposure conditions were maintained except trigger pulses were never generated to cause discharge across the spark gap. Table 1 lists pertinent pulse parameters used. Figure 3 shows the pulse characteris- tics operated at 500 Hz (low-UWB) and 1,000 Hz (high- UWB) repetition rate.
GTEM Cell
"A/
Cross Section View from the absorber
//////////////;////;///////////
FIG. 2. The UWB exosure svstem for rats.

756 LU ET AL.
TABLE 1
CHARACTERISTICS OF THE UWB PILSES
Pulse Parameters Sham Low UWB* High UWB*
Riselime I80±7ps 2(X) ± 5 ps Pulse width — l.(X)±().(X)4ns 1.03 ± 0.02 ns Peak E field intensity OkV/m 93.0 i 5.0 kV/m 84.6 ± 4.0 kV/m Pulse repetition rate 0 Hz 500 Hz 1.000 Hz Average power density 0mW/cm2 1.15mW/cm: l.96mW/cmJ
Total radiant exposure 0J/cm2 0.41 Jlcm2 0.70 J/cm2
Highest frcquencyt — 2.78 GHz 2.50 GHz Medium frequency! — 0.50 GHz 0.49 GHz Lowest frequency! — 0.09 GHz 0.10 GHz Fractional bandwidtht — 187% 185%
♦Mean ± SD. obtained in five exposures. tEstimatcd according to Foster (14). Ultrawide band radar is a radar whose
fractional bandwidth is greater than 25%. regardless of the center frequency or the signal time-bandwidth product (45). The fractional bandwidth of these pulses was wider than the minimum required to qualify as UWB radar.
Data Analysis
The present experiment utilized a factorial design with re- peated observations. The time after exposure was designated as "blocks" (r = 7), UWB treatments (t = 3) as treatments and five observations (s = 5) were included. Therefore, the present experiment was a 7 X 3 X 5 experiment which con- tained 105 experimental units. For each experimental unit, the average of four to six measurements was used. To limit the in- dividual variation, the use of individual control was incorpo- rated prior to the commencement of the experiment. There- fore, the end points were changes from the preexposure baseline in each individual rat. Postexposure heart rate and blood pressure data were the magnitude of change from the preexposure baseline of the same rat under study. An analytic method based on an analysis of variance with multiway classi- fication and multiple observations was used. The sources of variation were identified, and the variance and degree of free- dom (df) were computed. These various variances associated with the present experiment were total (experimental units, df = rst - 1 = 104), time after exposure (df = r - 1 = 6), UWB treatments (df = t - 1 = 2), interaction [df = (r - 1) (/ - 1) = 12] and error [df = rt (s - 1) = 84]. Dunnett's test
too ,■■■•[■ ■■■[ ! i , ■ ■ ■. j .... j. . . . j
•j: 1.000 Hz. S4.6 kV/m. 2JX> ps. jt-03 r*
80 f
^ <sn .... „..j. ;,.,. H N • > a 40 .... —y ;■---
iij c iii 20 .... . J. ' I
; | [ 0
-20
j i /
j |
MJ.IX. i , , . 1 i i i i I i ... I ... . i I. ■ ■ ■ i . ■
4M
. . ■ I ■■ 0'23456789 10
TIME (ns)
FIG. 3. The UWB pules operated at 500 and 1,000 Hz repetition rate.
was used for post hoc analysis when a significant UWB treat- ment effect was found. Null hypothesis was rejected at the 0.05 level.
RESULTS
Body Weight
Body weight of animals is shown in Fig. 4. Data are body weight before exposure. 24 h, 72 h, 1 week. 2.3. and 4 weeks after exposure. Other than an initial insignificant weight loss in sham and 500 Hz exposed rats, weight gains were similar among these three groups of animals.
Preexposure Baseline
Figure 5 shows the preexposure baseline. Average heart rate ranged between 332 and 351 beats per minutes (bpm). The ranges in systolic, mean, and diastolic pressures were 146.1 to 147.7.120.1 to 123.6, and 107.2 to 112.1 Torr, respec- tively. Significant difference among groups in any of the pre- exposure baseline was not found.
Heart Rate
Figure 6 shows the changes in heart rate from the preexpo- sure baseline. Heart rate usually decreased from the preexpo- sure baseline irrespective of UWB treatments. The UWB treatments, time after exposure and interaction between UWB treatments and time after exposure were not signifi- cantly different in this study.
Systolic Pressure
Systolic pressure of the sham-exposed rats had a tendency to increase (Fig. 7). In contrast, the systolic pressure was con- sistently lower than the preexposure baseline in rats exposed to 500 or 1,000 Hz UWB fields. UWB treatments were the only significant factor noted, F(2,84) = 16.62,/? < 0.001. Time after exposure. F(6, 84) = 1.00, NS, and interaction between UWB treatments and time after exposure, F(12.84) = 0.75, NS, were not statistically significant. The largest changes from the respective preexposure baseline were +13.65 Torr at 4 weeks after sham exposure, -23.0 Torr at 2 weeks after expo- sure to 500 Hz and -22.8 Torr at 2 weeks after exposure to 1,000 Hz UWB. Post hoc analysis revealed that decreased sys-

UWB-INDUCED HYPOTENSION 757
340
320
X o S >- o o m
300
280
260
240
O Sham A 500 Hz 0 1.000 Hz
) TREATMENT: rßM)- 1.19: N.S. TIME: F(M<)= 0.95: N.S. INTERACTION: F„M„=103: N.S.
70 60 90
AGE (DAYS)
100 110
FIG. 4. Body weight of WKY rats exposed to UWB. Data shown are preexposure, 24 h, 72 h, 1 week, 2 weeks. 3 weeks, and 4 weeks after exposure.
tolic pressure occurred at 45 min. 24 h. 1.2, and 4 weeks after exposure but not at 72 h, and 3 weeks after exposure in the 500 Hz exposed rats. In the 1,000 Hz exposed rats, significant decreases in systolic pressure occurred at 45 min. 1, 2, and 4 weeks after exposure but not at 24 h. 72 h. and 3 weeks after exposure. In comparison to the systolic pressure in sham- exposed rats, the most intense systolic hypotension occurred at 2 weeks after exposure. The magnitude of systolic pressure decrease from the sham-exposed group was 34.9 Torr in the 500 Hz group, and 34.7 Torr in the 1,000 Hz group.
Mean Arterial Pressure
Changes in mean arterial pressure were similar to changes in systolic pressure (Fig. 8). Mean arterial pressure had a ten- dency to increase from the preexposure baseline in sham- exposed rats while decreased mean arterial pressure was noted in rats exposed to 500 and 1,000 Hz UWB. Results of the factorial analysis of variance revealed that UWB treat- ments. /7(2,84) = 18.55, p < 0.001. was statistically significant, but the times after exposure, F(6M) = 0.57, NS was not. In- teraction between UWB treatments and time after exposure was statistically insignificant, F( 12.84) = 0.37, NS. The largest
Egg SHAM 77A 500 Hz. 93.0 kV/m. 1.00 ns Eg] 1,000 HZ. 84.6 kV/m, 1.03 ns
0.75 H 24 H 72 H 1 WK 2 WK 3 WK 4 \
TIME AFTER EXPOSURE
FIG. 6. Heart rates in UWB-exposed rats.
changes from their respective baseline were +8.5 Torr at 72 h after sham exposure, -15.9 Torr at 24 h after 500 Hz, and -16.9 Torr at 2 weeks after 1,000 Hz UWB exposure. In com- parison to sham-exposed rats, significant lower mean arterial pressure was noted in 500 Hz-exposed rats at all times after exposure except at 3 weeks after exposure, and in 1,000 Hz- exposed rats at all time except at 24 h and 3 weeks after expo- sure. The largest magnitude of hypotension was 20.6 Torr in 500 Hz and 21.89 Torr in 1,000 Hz-exposed groups. Both of these occurred at 2 weeks after exposure.
Diastolic Pressure
Although systolic and mean arterial pressures can be de- termined with a photoelectric sphygmomanometer in rats, the diastolic pressure can only be estimated because a characteris- tic pulse marker is not available for identifying the diastolic pressure reliably during the deflection cycle. It is known that the mean arterial pressure is equal to the sum of diastolic pressure and 1/3 of the pulse pressure (difference between systolic and diastolic pressures) (42). Therefore, the diastolic pressure Cchrbe estimated from the systolic and mean arterial pressures. Changes in diastolic pressure were similar to systolic and mean arterial pressure (Fig. 9). In comparison to the pre-
UWS TREATMENT: F(li))- I6.«£ p< 0.01 TWC: r((J4)- 1.00: N.S. INTERACTION: F(1U,,-0.7S: NS.
30
20
5 io Id (/> < CO
2 o Li.
CO Id Ü z < I o
E83 SHAM EZ3 500 Hi. 95.1 W/m. 1.02 ns ESI '.000 HZ. 82.0 kV/m. 1.05 ns
T P< 0.05 FROM SHAM
_l l l i_
SHAM 0.5 K 1.0 K SHAM 0.5 K 1.0 K
0.75H 24 H 72 H 1 WK 2 WK 3 WK 4 WK
TIME AFTER EXPOSURE
FIG. 5. Preexposure cardiovascular baseline. FIG. 7. UWB-induced systolic hypotension in WKY rats.

758 LU ET AL.
JWB TREA7UEN- F(w," IS.Si: p< 0.001 HUE: F,,,,,» 0.57: MS INTERACTION: F(„„,-0.37: N.S
• E3 SHAM ! 7?Zb 500 Hj. 93.0 kV/m. 1.00 fis
£53 1.000 H2. 84.6 kV/m. 1 03 ns
-30
I riTi i ff i?
T P< 0.05 FROM SHAM
0 75 H 24 H 72 H 1 WK 2 WK 3 WK 4 WK
TIME AFTER EXPOSURE
FICi. X. UWB-induced decreases in mean arterial pressure in WKY rats.
exposure baseline, change in sham-exposed rats was primar- ily an increase in diastolic pressure, while decreases were noted in rats exposed to 5(X) or 1 ,(XX) Hz UWB. The largest change from baseline was +9.6 Torr at 72 h after sham expo- sure. -16.6 Torr at 45 min after exposure to 500 Hz. and -14.0 Torr at 3 weeks after exposure to 1.000 Hz UWB. Again, the UWB treatments were statistically significant. F(2.84) = 16.30, p < 0.001. but the time after exposure, F(6.84) = 0.46. NS. and the interaction between UWB treat- ments and time after exposure, F( 12.84) = 037, NS were not. Diastolic hypotension was found in four of the six sampling points, i.e.. at 45 min. 24 h. 72 h. 1, and 3 weeks but not at two and four weeks after exposure, in rats exposed to 500 Hz UWB. Rats exposed to 1.000 Hz UWB had a lower diastolic pressure than sham-exposed rats in five of the six postexpo- sure sampling points. Diastolic hypotension was not noted in rats at 24 h after exposure to 1,000 Hz UWB. In comparison to sham exposure, the largest magnitude of changes in dias- tolic pressure was -22.5 Torr at 1 week after 500 Hz and -16.7 Torr at 4 weeks after 1.000 Hz.
DISCUSSION
The observation of a delayed, robust, and persistent de- crease in arterial pressures (delayed hypotension) without
UWB TREATMCNT: F(2J4). 16.30; p< 0.01 TO*. F(M,(- 0.46: HS INTERACTION: F(|U))-0.37; N.S.
30
20
E33 SHAM E222 500 Hz. 95.1 kV/m. 1.02 ns
" SS3 1.000 HZ. 82.0 kV/m. 1.05 ns
(A < CD
o or
LJ o z < I o
w 1
m 1 1
*T Tf IT T P< 0.05
0.75H 24 H 72 H 1 WK 2 WK 3 WK 4 WK TIME AFTER EXPOSURE
FIG. 9. UWB-induced diastolic hypotension in WKY rats.
changes in the heart rate in rats subjected to an acute UWB exposure is uncommon, no matter what the cause is. The heart rate is known to covary with blood pressure, or to be more susceptible than the blood pressure to RF perturbation (37). As indicated in the introduction, the anticipated UWB- induced change in the cardiovascular function, if any. was hy- pothesized to be hypertension (increased arterial pressure) as part of "atypical post-traumatic syndrome." which included emotional lability, irritability, headaches, insomnia, and de- layed hypertension. In addition, the cardiovascular effect of UWB radiation appears to be different from the effect in- duced by conventional RF radiation. Results of a recent series of experiments (15-18.23-30) on thermogenic effects of RF radiation on cardiovascular functions also supported the con- cept that susceptibilities of the heart rate and arterial pressure to thermogenic RF radiations were different.
Jauchem and Frei (15-18.23-30) evaluated the cardiovas- cular responses of rats exposed to discrete narrow-band mi- crowave radiation at 1.2 (30). 1.2-1.8/1.2-1.4 (26). 2.45 (17,23, 27). 2.8 (16.24.28). 5.6 (17.29). 9.3 (15). and 25 GHz (18). Ex- cept in one experiment (26). these investigators utilized ket- amine-anesthetized rats as the experimental model. Their ex- perimental design involved a comparison of cardiovascular end points, mean arterial pressure, and heart rate, in micro- wave exposed rats when their rectal temperature reached 38.5 and 39.5°C during the course of microwave exposure. Occa- sionally, the cardiovascular end points were the time sequen- tial data in a lethal exposure. The whole-body average SAR used in these experiments ranged between 6 and 16.8 W/kg. Because ketamine-anesthetized rats could not maintain a rec- tal temperature at 38.5 and 39.5°C. sham-exposure data was not presented in these experiments. Thermal tachycardia and thermal hypertension were usually concluded. In contrast, the specific aims of the present experiment were to study the late cardiovascular sequelae of UWB exposure in unanesthetized rats without confounding factors such as postsurgical compli- cations and anesthesia. In addition, the magnitude of response of each individual rat was adjusted with its own preexposure baseline in the present experiment. Furthermore, the cardio- vascular responses studied in the present experiment were compared to the end points obtained from sham-exposed rats. Because of these differences in experimental approaches, it is difficult to compare the results obtained in these two labora- tories. Lacking a comparable experiment on RF-induced de- layed cardiovascular effects, the uniqueness of the UWB- induced delayed hypotension cannot be ascertained at the present time.
Arterial pressure is determined by the cardiac output and total peripheral resistance. Based on hemodynamics princi- ples, the cause of a decrease in arterial pressure in the absence of heart rate alteration (therefore, no change in cardiac out- put) is a decrease in total peripheral resistance. Rats are known to possess a baroreceptor reflex mechanism, which serves to maintain a constant arterial pressure by increasing heart rate (therefore, cardiac output) if arterial pressure decreases or by decreasing the heart rate if arterial pressure increases (31). The absence of compensation by baroreceptor reflexes can re- sult from baroreceptor reset, alterations in autonomic out- flows or alterations in adrenergic receptors. The exact mecha- nism of the UWB-delayed hypotension is not known.
The Committee on Care and Use of Spontaneous Hyper- tensive Rats has recommended the use of an indirect blood (arterial) pressure measurement method for determining the arterial pressure in rats (22). Indirect arterial pressure mea- surement requires restraint. Restraint is a known psychogenic/

UWB-INDUCED HYPOTENSION 759
emotional stress. It is known to cause tachycardia and hyper- tension through sympathetic arousal in animals (3,53,40). The WKY rats used in the present experiment were accli- mated to the holder to prevent novelty stress. Successful accli- mation to novelty stress was indicated by the absence of reluc- tance to be placed in holder, absence of defecation and urination, and the reduction in number of restless episodes during the 1-h period in the holder. A recent study (5) has shown that the peak tachycardia response to restraint was not affected after 10 acclimation sessions. Acclimation, however, did accelerate the return of the tachycardia to baseline. Interpretation of re- sults in the present study should include the possibility that the method of indirect blood pressure measurement is a "stress test" rather than a test procedure for the basal/resting cardio- vascular functions. It is possible that demonstration of the UWB- induced hypotension requires additional "stimuli" associated with the indirect blood pressure measurement procedure.
Genetic predisposition appears to be an important factor in animal's response to stress. Sudakov (44) used a 30-h con- tinuous restraint to differentiate three types of cardiovascular changes to restraint: resistant, adaptive, and sensitive. More than 50% of Wistar rats that did not exhibit heart rate and ar- terial pressure responses to the prolonged restraint were clas- sified as resistant. Forty to 65% of Wistar. Vegh. August, and mixed strains that exhibited initial hypertension or hypoten- sion followed by a return almost to the initial level at the end of 30-h restraint, were classified as adaptive. Approximately 30% of August and Vegh rats were classified as sensitive; they perished during the 30-h restraint bearing ECG T-wave changes and myocardial infarction. Genetic predisposition was also considered to be an important factor in the basal/ resting cardiovascular functions, and the magnitude of cardio- vascular responses to various emotional stresses (3.632,35, 44). The WKY rats appeared to be adaptive because the car- diovascular indices were different from those of Wistar rats, their parent strain, which is classified as resistant.
It has been reported that responses of heart rate and arte- rial pressures reached a plateau and remained reasonably constant after 10 min in the restrainer (3). In addition, studies in several animal species including rats demonstrated that ar- terial pressure and heart rate were characterized by a large spontaneous variability in an unanesthetized state (12). To limit the spontaneous variation and genetic predisposition, we have instituted strenuous measurement controls such as sources of animals, strain of rats, ambient temperature (265- 27.5°C), time of day (0900-1200 h). duration in the test holder (between 20 and 60 min), and interval between testing (5 min). These controls were used to maintain a consistent level of stimulus during indirect arterial pressure measurement procedure. In addition, the average value of multiple mea- surements was used to represent the cardiovascular functions at each datum point for each animal to minimize sampling errors.
The heart rate and arterial pressure data obtained in rats bearing chronic arterial cannula (direct blood pressure mea- surement) in their home cages were accepted as stress-free measurements. Representative data for heart rate ranged be- tween 279 ±. 10 (mean ± SE, n = 5) and 345 ± 9 (n = 6) bpm and mean arterial pressure between 115 ± 3 (// = 7) and 122 ± 4 (n = 6) Torr in male adult cannulated WKY rats by various investigators (6,35.40). The ranges of the preexposure cardio- vascular baseline of the present experiment were 332 ± 9 (n = 5) to 351 ± 8 (n = 5) bpm for heart rate and 120 ± 5 (n = 5) to 124 ± 5 (« = 5) Torr for mean arterial pressure. Therefore, these baseline values in the present study compared well to other reported ranges in the literature.
A decrease in blood pressure may not be a hypotension if the blood pressure is within the normal ranges of the species under study. The mean arterial pressures of the UWB-induced hypotension at the lowest point were 108 ± 7 (« = 5,500 Hz) and 107 ± 8 (n = 5,1,000 Hz) which qualify these values in the range of true hypotension instead of a decrease in arterial pressure in WKY rats. On the other hand, the range of stress- free mean arterial pressure of Wistar rats, the parent strain of WKY rats, was between 97 ± 2 (n = 6) and 112 ± 3 (w = 10) Torr (36,47). The stress-free mean arterial pressure of the Sprague-Dawley rats was also lower than that of WKY rats. The range reported were 85 ± 5 (n = 4) to 115 ± 3 (n = 12) Torr (3,12.20,43). The UWB-induced changes in arterial pressure in the present experiment was a mild form of hy- potension in the WKY rats and should be asymptomatic if the mean arterial pressures of various strains of rats are con- sidered.
In comparison to studies using narrow-band RF. the aver- aged exposure intensity of the present UWB exposure is rela- tively low—1.15 and 1.96 mW/cm2. Conventional dosimetry methods, such as thermometry and calorimetry. lack of sensi- tivity to determine the specific absorption rate (SAR) from exposure to these low intensities. Equipment, instrumentation and techniques for measuring the internal electric field are not available. To estimate the whole-body average SAR. the relative power spectrum was computed from the padded data file, from 10 ns to 100 ns for a 10 MHz resolution of the UWB pulse by Mathcad's Maximum Entropy Method in the Numer- ical Recipes Function Pack. It appeared that ninety % of the spectrum power was between 10 MHz and 1.08 GHz (Fig. 10. power spectrum, dashed line). The relative power (RP) spec- trum was then convolved with the SAR vs. Frequency curve (11) in a spheroidal model of a medium rat for H polarization (Fig. 10. SAR. dotted line), also at 10 MHz intervals from 10 MHz to 10 GHz. The convoluted curve (Fig. 10. SAR X RP, solid line) represented the absorption spectrum of a rat ex- posed to the UWB pulse used in the present experiment. The maximum value of the absorption for a single discrete fre- quency was at 800 MHz. which indicated that SAR was less than 170 mW/kg/mW/cm2 according to the value presented in the SAR curve. Integration of the convolved curve (SAR X RP) and normalized by the area under the RP curve vielded a whole-body SAR at 61.7 mW/kg/mW/cm2 for the high UWB pulse. Analysis of the low UWB pulse (500 Hz) yielded a sim- ilar result in relative power spectrum, absorption spectrum, and whole-body SAR (60.9 mW/kg/mW/cm2). For the 1.000 Hz group, total absorption in 6 min was, therefore, in the or- der of 43.5 J/kg or less, which is incapable of inducing any sig- nificant temperature increase in the animal. The mechanism of the UWB-induced hypotension is not known.
A widely known effect specific to pulsed microwave radia- tion with high peak power is the induced auditory sensation elicited by microwave pulses. This effect has been the subject of several reviews (7,34,39). It is generally accepted that the pulsed microwave-induced audible sound is generated from a thermoelastic expansion of cranial tissue and launches an acoustic wave that is detected by hair cells in the cochlea. For pulsed microwave with pulse width shorter than 30 \LS. the mi- crowave-induced auditory threshold was independent of tem- poral peak power density (or temporal peak specific absorp- tion) and it is entirely dependent on the energy density of the microwave pulse or specific absorption (SA) per pulse. The auditory threshold SA per pulse has been determined in hu- man volunteers, cat (19) and rats (9). 16. 10. to 12 and 0.9 to 1.8 mJ/kg. respectively. The temporal peak SAR of the high

760 LU ET AL.
M
10°
1—i i i i |" 1 1 1 1 ■ 1 111 , ' IT" 1 -T -i—i—r
SAR
"l
E u in"' RP ;.>-•- _ \ / : 5 s
/ z' \ \ \ er 10"2 / / \ v> _ cn v^ SAR -____^ /^/ \ V_ \ «i ~~* ''y^^ \ *• . RP 5 s ^^s \ \ jS^ w o
V >
io-3
v' ^^ SAR X RP'^ ■
10"4 M\ ,
>^ SAR, H polarization \\ ^
o
< io-s Relative Power Spectrum
SAR x RP 2
i
\ i IQ"6
Ulli
SAR= 61.7 mW/kg/mW/cm
i i i ■ ■ ■ i ■ 1 i ■ • • i • ■ i 1 i i .1 _i i Uli
io' i<r ioJ
Frequency (MHz)
FIG. 10. Power spectrum and absorption spectrum of the UWB pulse.
10"
UWB pulse used in the present experiment was 117 kW/kg (duty cycle =10~6). Due to an extremely short pulse (pulse width = 1.03 ns), the SA per pulse from the high UWB pulses was around 0.12 mJ/kg. which was one order of magnitude lower than the known auditory threshold in rats. Therefore, the UWB-induced delayed hypotension was not a sequela of an audiogenic effect.
The estimated threshold SAR (0.121 W/kg, high UWB pulse) for UWB-induced hypotension in rats was 3 times less than 0.4 W/kg, the basis for the IEEE C95.1-1991 safety stan- dard in a controlled environment (21). The threshold peak electric field of the UWB pulses was less than the allowable peak electric field (100 kV/m) used in this standard. Hypoten- sion is known to possess adverse health implications. The UWB-induced hypotension is a recent finding that has not been addressed during the promulgation of personnel protec-
tion guidelines. Further research on effect replication and dose-response characteristics are highly recommended.
ACKNOWLEDGEMENTS
This work was supported bv the U.S. Army Medical Research and Materiel Command under the contract No. D AMD 17-94-C-4069 with McKesson BioServices. The authors acknowledge the contributions of Jian-Zhong Bao for providing a transfer function for field measure- ment. Pamela J. Henry for technical assistance, D. Duane Cox for fab- rication of the microenvironment chambers, and Bruce E. Stuck for valuable suggestions during the preparation of the manuscript. In con- ducting this research, the investigators adhered to the "Guide for the Care and Use of Laboratory Animals" and policies of the Walter Reed Army Institute of Research and U.S. Air Force Armstrong Labora- tory. Disclaimer: The views, opinions and/or findings contained in this report are those of the authors and should not be construed as an official Department of the Army position, policy, and decision.
REFERENCES
1. Albanese. R.; Blaschak, J.: Median, R.; Penn, J.: Ultrashort elec- tromagnetic signals: Biophysical questions, safety issues, and medical opportunities. Aviat. Space Environ. Med. 65:A116- A120-. 1994.
2. Bao, J.-Z.: Lee, J. C; Lu. S.-T.; Seaman, R. L.; Akyel, Y.: Analy- sis of ultra-wide-band pulses in a GTEM cell. In: Brandt, H. E., ed. Intense microwave pulses III, Proc. Spie 2557. Danvers: Inter- national Society for Optical Engineering; 1995:237-248.
3. Barron, B. A.; Van Loon, G. R.: Role of sympathoadrenomedul- lary system in cardiovascular response to stress in rats. J. Autonomi. Ner. Syst. 28:179-188; 1989.
4. Bunag, R. D.; Butterfield, J. B.: Tail-cuff blood pressure mea- surement without external preheating in awake rats. Hyperten- sion 4:898-903; 1982.
5. Chen, X.; Herbert, J.: Regional changes in c-fos expression in the basal forebrain and brainstem during adaptation to repeated stress: Correlations with cardiovascular, hypothermic and endo- crine responses. Neuroscience 64:675-685; 1995.
6. Chiueh, C. C; Kopin. I. J.: Hyperresponsivity of spontaneously hypertensive rat to indirect measurement of blood pressure. Am. J. Physiol. H690-H695:1978.
7. Chou, C. K.; Guy. A. W.: Galambos, R.: Auditory perception of radio-frequency electromagnetic fields. J. Acoust. Soc. Am. 71:1321— 1334; 1982.
8. Chou, C.-K.; Guy. A. W.; Kunz, L. L.; Johnson, R. B.; Crowley. J. J.; Krupp, J. H.: Long-term, low-level microwave irradiation of rats. Bioelectromagnetics 13:469-496; 1992.
9. Chou, C.-K., Yee. K.-C; Guy, A. W.: Auditory response in rats exposed to 2,450 MHz electromagnetic fields. Bioelectromagnet- ics 6323-326; 1985.
10. D'Andrea, J. A.: Gandhi, O. P.; Lords^ J. L.; Durney, C. H.; Astle, L.; Stensaas. L. J.; Schoenberg, A. A.: Physiological and behavioral effects of prolonged exposure to 915-MHz micro- waves. J. Microwave Power 15:123-135; 1980.
11. Dumey, C. H.; Massoudi, H.; Iskander, M. F.: Radiofrequency radiation dosimetry handbook, 4th ed. Brooks AFB: USAF

UWB-INDUCED HYPOTENSION 761
School of Aerospace Medicine Aerospace Medical Division (USAFSAM-TR-85-73) 1985:617.
12. Ferrari, A. U.; Dafffonchio, A; Albergati, F.; Mancia. G.: Inverse relationship between heart rate and blood pressure variabilities in rats. Hypertension 10:533-537; 1987.
13. Foreman, S.; Holmes. C; McManamon, V.; Wedding, W.: Psy- chological symptoms and intermittent hypertension following acute microwave exposure. J. Occupat. Med. 24:932-934:1982.
14. Foster, P. R.: Antennas and UWB signals. In: Taylor. J. D., ed. Introduction to ultra-wideband radar systems. Boca Raton. FL: CRC Press; 1995:237-248.
15. Frei, M. R.; Jauchem. J. R.: Thermoregulatory response of rats exposed to 9.3'-GHz microwave: A comparison of E and H orien- tation. Physiol Chem. Phys. Med. NMR 24:1-10:1992.
16. Frei, M.; Jauchem. J.: Heinmets, F.: Physiological effects of 2.8 GHz radiofrequency radiation: A comparison of pulsed and con- tinuous-wave radiation. J. Microwave Power 23:85-93; 1988.
17. Frei, M. R.; Jauchem. J. R.; Price, D. R.: Padilla. J. M.: Field ori- entation effects during 5.6-GHz radiofrequency irradiation of rats. Aviat. Space Environ. Med. 61:1125-1129:1990.
18. Frei, M. R.; Ryan. K. L.: Berger, R. E.: Jauchem. J. R.: Sustained 35-GHz radiofrequency irradiation induces circulatory failume. Shock 4:289-293:1995.'
19. Guy, A. W.; Chou C. K.; Lin, J. C: Microwave-induced acoustic effects in mammalian auditory systems and physical materials. Ann. NY Acad. Sei. 247:194-218; 1975.
20. Houdi, A. A.; Dowel!, R. T; Diana. J. N.: Cardiovascular responses to cigarette smoke exposure in restrained conscious rats. J. Pharmacol. Exp. Ther. 275:646-653:1995.
21. Institute of Electrical and Electronics Engineers: IEEE C95.1 Standard for safety levels with respect to human exposure to radio frequency electromagnetic fields. 3 kHz to 300 GHz. New York: Institute of Electrical and Electronics Engineers: 1992.
22. Institute of Laboratory Resources: Committee on care and use of spontaneously hypertensive (SHR) rats. Spontaneously hyper- tensive (SHR) rats: Guidelines for breeding care and use. vol 19. Washington. DC: ILAR News; Natl. Acad. Sci.-Natl. Res. Coun- cil. 1976:G1-G20.
23. Jauchem, J. R.: Chang. K. S.; Frei. M. R.: Tolazoline decreases survival time during microwave-induced lethal heat stress in anesthetized rats. Proc. Soc. Exp. Biol. Med. 211:236-243:1996.
24. Jauchem, J. R.: Frei. M. R.: Cardiovascular changes in unanesthe- tized and ketamine-anesthetized Sprague-Dawley rats exposed to 2.8-GHz radiofrequency radiation. Lab. Anim. Sei. 41:70-75; 1991.
25. Jauchem, J. R.: Frie. M. R.: Cardiorespiratory changes during microwave-induced lethal heat stress and ß-adrenergic blockage. J. Appl. Physiol. 77:434-140; 1994.
26. Jauchem, J. R.: Frei. M. R.: High-peak power microwave pulses: Effects on heart rate and blood pressure in unanesthclizcd rats. Aviat. Space Environ. Med. 66:992-997:1995.
27. Jauchem, J. R.: Frei. M. R.: Chang, K. H.: Berger. R. E.: Micro- wave-induced lethal heat stress: Effect of phentolamine. prazosin and metoprodol. Methods Find. Exp. Clin. Pharmacol. 17:241— 248:1995.
28. Jauchem, J. R.: Frei. M. R.; Heinmets. F.: Thermal bradycardia during radiofrequency irradiation. Physiol. Chem. Phys. Med. NMR 15:429-434:1983.
29. Jauchem. J. R.; Frei. M. R.: Heinmets. F.: Heart rate changes due to 5.6 GHz radiofrequency radiation: Relation to average power density. Proc. Soc. Exp. Biol. Med. 177:383-387; 1984.
30. Jauchem. J. R.: Frei. M. R.: Padilla. J. M.: Thermal and physio- logic responses in 1200-MHz radiofrequency radiation: Differ- ence between exposure in E and H orientation. Proc. Soc. Exp. Biol. Med. 194:358-363:1990.
31. Kirchheim, A. R.: Svstemic arterial baroreccptor reflexes. Phvs- iol. Rev. 56:100-176:'1976.
32. Lawer, J. E.: Barker. G. F.: Hubbard. J. W.; Schaub. R. G: Effect of stress on blood pressure and cardiac pathology in rats with bor- derline hypertension. Hypertension 3:496-505:1981.
33. Lee, J.; Bao, J.-Z.; Lu, S.-T.; Seaman, R. L: An ultra-wide-band exposure system for studying biological effects. In: Abstract book of the seventeenth annual meeting of the bioelectromagnetics society. Fredrick: Bioelectromagnetics Society, Fredrick; 1995:160.
34. Lin, J. C: Microwave auditory effects and applications. Spring- field, IL: Charles C. Thomas; 1978.
35. Ludin, S.; Ricksten, S.-E.; Thoren, P.: Interaction between "men- tal stress" and baroreceptor reflexes concerning effects on heart rate, mean arterial pressure and renal sympathetic activity in con- scious spontaneously hypertensive rats. Acta. Physiol. Scand. 120:273-281; 1984.
36. Mauck, G. W.; Smith, C. R.; Geddes, L. A.; Bourland, J. D.: The meaning of the point of maximum oscillations in cuff pressure in the indirect measurement of blood pressure—Part II. J. Biomech. Eng. 102:28-33; 1980.
37. Michaelson, S. M.; Lin, J. C: Cardiovascular effects. In: Michael- son, S. M.; Lin, J. C, eds. Biological effects and health implica- tions of radiofrequency radiation. New York: Plenum Press; 1987: 45W88.
38. Nagasaka, T.; Hirata, K.; Shibata, H.; Sugano. Y.: Metabolic and cardiovascular changes during physical restraint in rats. Jpn. J. Physiol. 30:799-803; 1980.
39. NCRP Report 86: Perception of RFEM fields. In: Biological effects and exposure criteria for radiofrequency fields. Bethesda, MD: National Research Council on Radiation Protection and Measurements; 1986:175-180.
40. Sakaguchi, A.; LeDoux. J. E.; Reis, D. J.: Sympathetic nerves and adrenal medulla: Contributions to cardiovascular-conditioned emotional responses in spontaneous hypertensive rats. Hyperten- sion 5:728-738; 1983.
41. Sherry, C. J.; Blick, D. W.; Walters, T. W.: Brown. G. C: Murph, M. R.: Lack of behavioral effects in non-human primates after exposure to ultrawideband electromagnetic radiation on the microwave frequency range. Radiat. Res. 143:93-97:1995.
42. Sodeman, W. A., Jr.; Sodeman. W. A.: Systemic arterial pressure. In: Pathological physiology. Philadelphia. PA: W. B. Saunders Co.: 1974:177-205.
43. Sparrow, M. G.; Roggendorf, H.; Vogel. W. H.: Effect of ethanol on heart rate and blood pressure in nonstrcssed and stressed rats. Life Sei. 40:2551-2559; 1987.
44. Sudakov, K. V.: Organization of cardiovascular functions under experimental emotional stress. J. Autonom. Nerv. Syst. 4:165- 180; 1981.
45. Taylor, J. D.: Ultra-wideband radar overview. In: Taylor. J. D., ed. Introduction to ultra-wideband radar systems. Boca Raton. FL: CRC Press: 1995:1-10.
46. Toler, /.; 'Popovic, V.: Bonascra. S.: Popovic. P.: Honeycutt. C; Sgoutas, D.: Long-term study of 435 MHz radio-frequency radia- tion on blood-borne end points in cannulated rats. Part II: Meth- ods, results and summary. J. Microwave Power 23:105-136:1988.
47. Van Den Berg, D. T. W. M.: De Jong. W.: De Kloet. E. R.: Min- eralocorticoid antagonist inhibits stress-induced blood pressure response after repeated daily warming. Am. J. Phvsiol. 267:E921- E9926; 1994.
48. Walters, T. J.; Mason. P. A.; Sherry. C. J.: Steffen. C: Merritt, J. H.: No detectable bioeffects following acute exposure to high peak power ultra-wide band electromagnetic radiation in rats. Aviat. Space Environ. Med. 66:562-567; 1995.
49. Williams. R.: Webb. T: Exposure to radiofrequency radiation from an aircraft radar unit. Aviat. Space Environ. Med. 51:1243- 1244; 1980.
50. Yamakoshi. K.-I.: Kamiya. A.: Noninvasive measurement of arte- rial blood pressure and elastic properties using photoelectric plethysmography technique. Med. Prog. Technol. 12:123-143: 1987.
51. Yen. T. T; Powell, C. E.; Pearson. D. V.: An indirect method of measuring the blood pressure of rats without heating. In: Sponta- neous hypertension: Its pathogenesis and complications. Bethesda. MD: U.S. Public Health Service (DHEW Publication No. 77-1179); 1977:486-490.

0&romasnetf€ rm
n ft A
U'"V Mi

ABSENCE OF EFFECTS OF 2.45 GHz MICROWAVES ON PHYSICAL ENDURANCE, MOTIVATIONAL LEVELS
AND CARDIOVASCULAR FUNCTIONS
SHIN-TSU LU SATNAM P. MATHUR
YAHYA AKYEL
MCKESSON BIOSERVICES U.S. ARMY MEDICAL RESEARCH DETACHMENT
8308 HAWKS ROAD, BUILDING 1168 BROOKS AIR FORCE BASE, TEXAS 78235
U.S.A.
ABSTRACT
A highly motivated and physically demanding task was used to evaluate the effect of 2.45 GHz CW microwave radiation on the characteristics of physical performance. Male Wistar-Kyoto rats were trained to run on a rodent treadmill. They were subjected to microwave radiation for 30 minutes in a circularly polarized exposure system at 0,0.31,3.20 and 6.59 W/kg whole-body average specific absorption rate. The physical performance was evaluated one week before exposure as baseline and 24 hours after exposure. In addition, cardiovascular functions were evaluated at two weeks after exposure. Under current experimental conditions, alterations in these biological endpoints were not found.
INTRODUCTION
Radio frequency (RF) radiation can have highly predictable effects on behavior at modest and even low levels of exposure [Justesen 1979). In addition, introduction of weak RF fields into sensitive tissues may promote bow fide physiological reactions that lead to changes in behavior. Operant behaviors have been studied extensively in animals exposed to RF radiation. Results of operant behavioral studies form the basis of contemporary western RF personnel protection guidelines and standards. That absorption of significant RF radiation can cause work-stoppage and work-decrement is beyond dispute. However, work-stoppage and work-decrement experiments were all based on tasks, such as pressing of a lever or levers, that do not require sustained, strenuous effort. When forced expenditure of effort at a task is required over a long period of time, one can assess ENDURANCE if an agent is introduced that interferes with performance of the task. In contrast to operant behavioral studies, few investigators [Hunt et al. 1975, Galvin et al. 1986, Akyel et al. 1993] have utilized endurance as an endpoint in studying biological effects of RF radiation.
Treadmill running is a standard laboratory procedure for the study of exercise physiology. Apart from its more strictly physiological uses in the measurement of oxygen consumption, muscle blood flow, fat metabolism, hepatic function etc., the treadmill also provides a convenient way of assessing an animals's physical endurance following various drug and environmental manipulations including ionizing radiation. Previous research [Gerald 1978] has shown that an orderly relationship exits among endurance, speed at which the animal is required to run and the strength of motivational stimuli which the animal is willing to tolerate. Although endurance performance was susceptible to degradation immediately after microwave exposure, recovery appears to be rapid [Hunt et al. 1975]. In order to assess the persistence of microwave effects, both endurance and motivational stimuli were evaluated at 24 hours after microwaves exposures in rats exposed to graded doses of microwaves.
491

Lu et al. [1999] has identified a delayed hypertensive effect in rats after exposure to Ultra-Wide-Band pulses. The effect appears to reach a maximum two weeks after exposure. In order to assess the induction of this delayed hypotension in other modalities of RF radiation, blood pressure and heart rate were also included in the present report.
MATERIAL AND METHODS
ANIMALS: Male normotensive Wistar-Kyoto rats were used at 5 to 8 months of age. At the time of exposure, their average body weight and standard deviations were 363 ± 33 (sham, n= 7), 365 ± 23 (0.31 W/kg, n= 7), 352 ± 38 (3.20 W/kg, n= 6) and 363 ± 36 g (6.59 W/kg, n= 7). They were maintained in the vivarium at 21-23 °C ambient temperature, lOOfo conditioned fresh air for more than 10 exchanges per hour, and a 12L-12D (light on 0600-1800 hours). Tap water and feed (Purina Rodent Diet 5008, Ralston Purina Co., St. Louis, MO, U.S.A.). They were quarantined and acclimated to the vivarium environment for at least 1 month before introduction into the experiment.
EXPOSURES: A circularly polarized waveguide exposure system [Guy and Chou 1976] was used throughout these experiments. Animals were individually exposed one at a time. A five power meter method, measuring forward, left-hand reflected, right-hand reflected, left-hand transmitted and right-hand transmitted powers, was used to determine the whole-body average specific absorption rate (SAR). The SAR was determined by the net power loss between loaded and empty waveguide divided by the body weight of the animal. Ten readings, approximately 3 minutes apart, were recorded during every exposure. The accuracy of this dosimetric method was confirmed in this laboratory by using calorimetric measurement of absorbed doses in a water phantom. The microwave was 2.45 GHz CW radiation. Four exposure conditions were used. The whole-body average S ARs at each condition were 0 (sham, n= 7), 0.31 ± 0.02 (S.D.. n= 7), 3.20 ± 0.34 (S.D., n= 6), and 6.59 ± 0.56 W/kg (S.D., n= 7). Colonic temperature was measured immediately after exposure by inserting a lubricated thermistor probe through the rectal orifice 5 cm into the colon. For comparison, 38 animals used in a Y- maze study were also included. These Y-maze animals received similar exposures except water was removed from home cage 24 hours before exposure.
TREADMILL: A commercially available rodent treadmill was used (Fig. 1, Columbus Instruments, Columbus, OH, U.S.A.). The speed of moving belt, inclination, and intensity of the electrical pulse trains (provided by a stainless steel grid at right side of the figure) can all be programmed. The animal had a choice between running on a treadmill belt surface or receiving motivational stimuli in form of electrical pulses if it chose to stay on the stationary grid. The electrical pulses were generated by rectifying a 120 V, 60 Hz power. The pulse train characteristics were 0.2 s pulse train duration, and 1 Hz pulse train repetition rate. An infrared photosensor was used to activate these pulse trains when the sensor detected the presence of the animal in the grid area. Each time, the animal left the grid area, the pulse train was deactivated and the clock was reset. To prevent injury, the total duration of a pulse train was set at 20 s even if the animal stayed in the grid area continuously for a longer period of time. In the present experiment, 8° inclination was used. Two treadmill speeds were used, i.e., 10 m/min for task familiarization and 25 m/min for endurance testing. The workload at 25 m/min and 8 ° inclination was approximately 29 W/kg or 78-80 % of the maximum aerobic power of an endurance trained rat [Shepherd and Gollnick 1976, SIentz et al. 1990].
TASK FAMILIARI2ATION: Rats require training to learn the running task. In order to familiarize animals with the treadmill apparatus, and to train them to perform the running task with minimal increase in physical endurance, a slow and easy treadmill speed (10 m/min 8° inclination) was used during the. task familiarization. The training or familiarization schedule was 10 minutes daily for 5 consecutive days. The effectiveness of this training procedure was clearly evident by a gradual and significant reduction of the total amount of time that animals spent at the grid and the number of visits to the grid (Fig. 2).
492

ü £ a z o m 3
s f2 öS 5
-L [ 10 mftnln, 8* tndJnallon, 10 min, n= 27 |
I
I I .1.
r~*~l NuMbM-ofVUM« EZ23 TbwonGrtd
JÜ I
1 I
I ^
TRAINING SESSION
ENDURANCE AND CARDIOVASCULAR EFFECTS
ENDURANCE: Physical endurance was defined as the duration of time spent running till exhaustion. However, the criteria for exhaustion has varied among investigators [Jones etal. 1967, King and Gollnick 1970, Gerald 1978, Beicastro et al. 1984, Heyes et al. 1988, Ji and Fu 1992, Seward et al. 1995]. The exhaustion was usually defined operationally as the animal failed to keep in pace with the treadmill's moving surface and received motivational stimuli continuously. In a trained animal, the animal did not stay on the stationary grid for more than Is if the animal was capable of and willing to run. In the present experiment, exhaustion was defined as the animal receiving motivational stimuli continuously for 20 s. For the endurance test, the animal was required to run at 25 m/min till exhaustion. Number of visits to the grid, duration of time spent on the grid and duration of time spent running were recorded. This endurance test is a strenuous task. The colonic temperature of animals could reach as high as 42 °C depending on duration of treadmill running. The final colonic temperature attained by animals appeared to be dependent on the total run time, e.g., 40.6 °C at 866 s, 41.1 °C at 848 s, 41.7 °C at 1556 s, 42.0 °C at 1565 s, and 42.2 °C at 1978 s. Each animal received two endurance tests,' baseline determination at 1 week before exposure, and post-exposure endurance at 24 hours after exposure. The time separation between endurance tests was to prevent interaction and training effect between tests.
CARDIOVASCULAR FUNCTIONS: The method used for heart rate, systolic (Ps), mean (PM) and diaslolic (PD) arterial blood pressures has been published previously [Lu et al. 1999]. A commercially available non-invasive rodent blood pressure measurement system was used (ITTC Life Sei., Woodland Hills, CA, U.S.A.). The system includes a tail cuff for tail artery occlusion, photoelectric sensor for detection of artery pulsations, pressure sensor for monitoring the cuff pressure, and associated amplifiers for photoelectric and pressure sensors. The tail cuff was first inflated to 20-30 mm Hg higher than the pressure needed to occlude the tail artery. The cuff pressure was then gradually decreased approximately at 2 mm Hg per heart beat. Systolic pressure was the cuff pressure when tail pulsation reappeared during the deflection cycle. The mean arterial pressure was the cuff pressure when the amplitude of tail pulsation reached a maximum. Diaslolic arterial pressure was calculated according to PD = (PM x 3 - Ps) / 2. Heart rate was determined from pulse duration between arterial pulses. Average of 40 to 60 pulse durations were routinely collected. Six determinations were performed every 4 to 5 minutes to prevent arterial collapse. These cardiovascular functions were determined in each exposed animal at two weeks after exposure. Due to the known variation of cardiovascular functions, 39 additional animals from a Y-maze study in which animals received similar treatments were also included in this report. Cardiovascular functions of these Y-maze animals were also determined at 2 weeks after 2.45 GHz CW microwave exposures.
STATISTICS: Analysis of variance, Student's t-test and paired t-test were used when appropriate. The null hypothesis was rejected at the 0.05 level.
RESULTS
Error bars shown in the results section are standard errors of mean. The colonic temperature of animals after 30 minute exposure at various SAR is shown (Fig. 3). Two different pre-treatments, normal hydration and water withheld for 24 hrs were included. Apparently, water deprivation for 24 hrs
U a
Ba ttKKfl WM«S M H. f^j. I«J» A *■«.,■ raw «MM 9 r*».MWi>wneAnieMT MAIMS »OraMIMl
SHAM 0.31 W»o 3.20 VU*o
SPECIFIC ABSRCCT10N RATE 0.51 Wtg
had a significant impact on colonic temperature response of animals to microwave exposure. Different post- exposure temperature was noted in rats exposed at 0, 3.20 and 6.59 W/kg but not at 0.31 W/kg. All the microwave doses caused significant increases in colonic temperature in rats with normal hydration. The
493
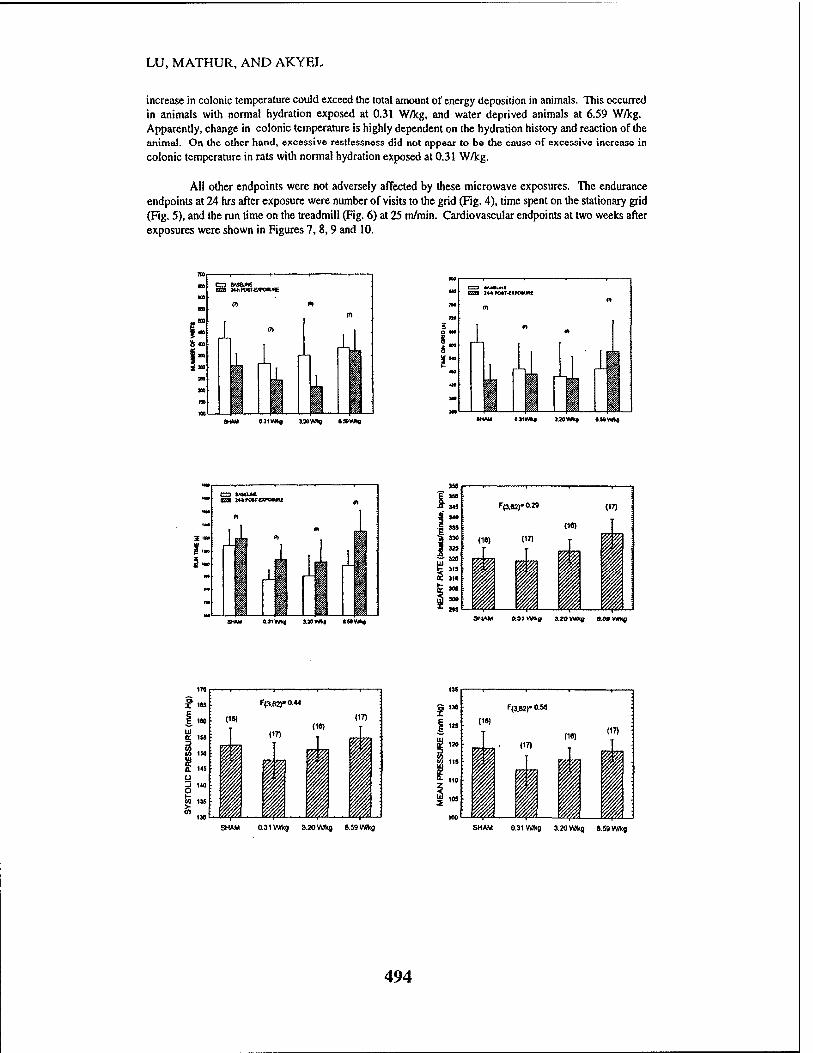
LU, MATHUR, AND AKYEL
increase in colonic temperature could exceed the total amount of energy deposition in animals. This occurred in animals with normal hydration exposed at 0.31 W/kg, and water deprived animals at 6.59 W/kg. Apparently, change in colonic temperature is highly dependent on the hydration history and reaction of the animal. On the other hand, excessive restlessness did not appear to be the cause of excessive increase in
colonic temperature in rats with normal hydration exposed at 0.31 W/kg.
All other endpoints were not adversely affected by these microwave exposures. The endurance endpoints at 24 hrs after exposure were number of visits to the grid (Fig. 4), time spent on the stationary grid (Fig. 5), and the run time on the treadmill (Fig. 6) at 25 m/min. Cardiovascular endpoints at two weeks after exposures were shown in Figures 7,8,9 and 10.
mm 0.31 wv» laws! «sewn
aHAW <L31VMC0 3.39VS*! AUWA4 OMAM 0.91 Whf 3.20VW<g a89V»K0
SHAM 0.31 Wkg 3.20 Wkg e.59Wkfl SHAM 0.31 Wfkg 3.20 W/kg «59 W/kg
494

ENDURANCE AND CARDIOVASCULAR EFFECTS
CONCLUSION
Exposure to 2.45 GHz CW at 6 W/kg whole-body average specific absorption rate for 30 minutes in fats did not adversely affect endurance performance at 24 hrs after exposure noi the cardiovascular functions at 2 weeks after exposure. Rats were visibly exhausted when water deprived for 24 hrs and exposed to a high microwave dose. Therefore, these results only confirmed that endurance deficit did not occur 24 hours after exposure in rats [Hunt et al. 1975]. Absence of delayed cardiovascular effects did not exclude the occurrence of cardiovascular reactions during the microwave exposure. The magnitude of increase in core body temperature is known to cause increase in heart rate [Lu et al. 1999), especially in 3 and 6 W/kg exposures in water deprived rats. Therefore, it was concluded that a single episode of significant CW microwave exposure did not cause persistent effects on physical endurance and cardiovascular functions.
ACKNOWLEDGMENTS: This work was supported by the U.S. Army Medical Research and Materiel Command under the contract No. SHA" 03W*a 3w/kg ew*0
DAMD17-94-C-4069 with McKesson BioServices. The authors wishes to acknowledge the technical assistance provided by Norman Harris and Monica Gonzalez. In conducting this research, the investigators adhered to the "Guide for the Care and Use of Laboratory Animals."
DISCLAIMER: The view, opinions and/or findings contained in this report are those of the authors and should not be construed as an official United States Department of the Army position, policy, and decision.
REFERENCES
Akyel, Y; Belt, M; Raslear, TG; Hammer, RM [1993]: The effect of high-peak power pulsed microwaves on treadmill performance in the rat. In: "Electricity and Magnetism in Biology and Medicine", Bland, M (ed.), San Francisco: San Francisco Press, pp. 668-670.
Beicastro, AN; Turcotte, R; Rossiter, M; SecorrJ, D [1984]: Myofibril ATPase activity of cardiac and skeletal muscle of exhaustively exercised rats. Int. J. Biochem. 16:297-303.
Galvin, MJ; Tilson, HA; Michell, CL; Peterson, J; McRee, DI [1986]: Influence of pre- and post-natal exposure of rats to 2.45 GHz microwave radiation on neurobehavioral function. Bioelectromagnetics 7:57- 71.
Gerald, MC [1978]: Effect of (+)-amphetamine on the treadmill endurance performance of rats. Neuropharmaco.l. 17:703-704.
Guy, AW; Chou, CK [1976]: System for quantitative chronic exposure of a population of rodents to UHF fields. In: "Biological Effects of Electromagnetic Waves, Vol 11," Johnson, CC; Shore, ML (eds.), HEW Publ. (FDA)-77-8011. pp. 381 -411.
Heyes, MP; Garnett, ES; Coates, G [1988]: Nigrostriatal dopaminergic activity is increased during exhaustive exercise stress in rats. .Life Sei. 42: 1537-1542.
Hunt, EL; King, NW; Phillips, RD [1975]: Behavioral effects of pulsed microwave irradiation. Ann. N.Y. Acad. Sei. 247:440-453.
Ji, LL; Fu, R [1992]: Response of glutathione system and antioxidant enzymes to exhaustive exercise and hydroperoxide. J. Appl. Physiol. 72: 549-554.
495

LU, MATHUR, AND AKYEL
Jones, DC; Osborn, GK; Kimeidorf, DJ 11967]: Treadmill exercise performance by the aging irradiated rat. Rad. Res. 30:714-724.
Justesen, DR [1979]: Behavioral and psychological effects of microwave radiation. Bull. N.Y. Acad. Mcd. 55: 1058-1078.
King, DW; Gollnick, PD [1970]: Infrastructure of rat heart and liver after exhaustive exercise. Am. J. Physiol. 218: 1150-1155.
Lu, S-T; Mathur, SP; Akyel, Y; Lee, JC [1999]: Ultrawide-Band electromagnetic pulses induced hypotension in rats. Physiol. Beh. 67: 463 and 65:753-761.
Seward, SW; Seiler KS; Starnes, JW [1995]: Intrinsic myocardial function and oxidative stress after exhaustive exercise. J. Appl. Physiol. 79: 251-255.
Shepherd, RE; Gollnick, PD [1976]: Oxygen uptake of rats at different work intensities. Pflugers Arch. 362: 219-222.
Slentz, CA; Davis, M; Settles, DL; Pate, RR; Settles, SJ [1990]: Glucose feeding and exercise in rats: glycogen use, hormone response, and performance. J. Appl. Physiol. 69:989-994.
496

Bioelectromagnetics 21:439-454 (2000)
Effects of High Peak Power Microwaves on the Retina of the Rhesus Monkey
Shin-Tsu Lu,1* Satnam P. Mathur,1 Bruce Stuck,2 Harry Zwick,2
John A. D'Andrea,3 John M. Ziriax,3 James H. Merritt,4 Gerard Lutty,5
D. Scott McLeod,5 and Mary Johnson6
1McKessonHBOC BioServices, Brooks AFB, Texas 2U.S. Army Medical Research Detachment, Walter Reed Army Institute of Research,
Brooks AFB, Texas 3U.S. Naval Health Research Center Detachment, Brooks AFB, Texas
4U.S. Air Force Research Laboratory, Brooks AFB, Texas 5Wilmer Eye Institute, Johns Hopkins University, Baltimore, Maryland
6Maryland Center for Eye Care, University of Maryland, Baltimore, Maryland
We studied the retinal effects of 1.25 GHz high peak power microwaves in Rhesus monkeys. Pre- exposure fundus photographs, retinal angiograms, and electroretinograms (ERG) were obtained to screen for normal ocular structure and function and, after exposure, as endpoints of the study. Histopathology of the retina was an additional endpoint. Seventeen monkeys were randomly assigned to receive sham exposure or pulsed microwave exposures. Microwaves were delivered anteriorly to the face at 0, 4.3, 8.4, or 20.2 W/kg spatially and temporally averaged retinal specific absorption rates (R-SAR). The pulse characteristics were 1.04MW (« 1.30MW/kg temporal peak R-SAR), 5.59 ps pulse length at 0, 0.59, 1.18, and 2.79Hz pulse repetition rates. Exposure was 4h per day and 3 days per week for 3 weeks, for a total of nine exposures. The preexposure and postexposure fundus pictures and angiograms were all within normal limits. The response of cone photoreceptors to light flash was enhanced in monkeys exposed at 8.4 or 20.2 W/kg R-SAR, but not in monkeys exposed at 4.3 W/kg R-SAR. Scotopic (rod) response, maximum (combined cone and rod) response, and Naka-Rushton Rmax and log K of scotopic b-waves were all within normal range. Retinal histopathology revealed the presence of enhanced glycogen storage in photoreceptors among sham (2/5), 8.4 W/kg (3/3), and 20.2 W/kg (2/5) exposed monkeys, while enhanced glycogen storage was not observed in the 4.3 W/kg (0/4) exposed group. Supranormal cone photoreceptor b-wave was R-SAR dependent and may be an early indicator of mild injury. However no evidence of degenerative changes and ERG depression was seen. We concluded that retinal injury is very unlikely at 4 W/kg. Functional changes that occur at higher R-SAR are probably reversible since we saw no evidence of histopathologic correlation with ERG changes. Bioelectromagnetics 21:439- 454, 2000. Published 2000 Wiley-Liss, Inc.*
Key words: electroretinogram; retinal angiogram; fundus photograph; retinal histopathology
INTRODUCTION ~ ; t TT _ . „,,.,„ u A Contract grant sponsor: U.S. Army Medical Research and The eye is a critical organ that can be injured by Material Command; Contract grant number: DAMD-17-94-C-
radiofrequency (RF) radiation including microwaves. ^069; Contract grant sponsor: Naval Medical Research and T . , n r\ i-i j- ^1 Development Command, Work Unit #63706.M00096; Contract It IS also one of the most Studied organs regarding the grant number. DN241243; Contract grant sponsor: Air Force injurious action of microwave radiation [Paulsson Research Laboratory Work Unit 7757B330; Contract grant et al., 1979]. Ocular injuries have been investigated in sponsor: U.S. Air Force; Contract grant number: 41624-96-C- monkeys and rabbits exposed to microwaves of various 9009. The views, opinions and/or findings contained in this report frequencies, modulations, intensities, duration, and ^e mose of the authors and should not be construed as an official
1, ' „. . ^ . , , Department of the Army, Navy, Air Force, and Defense position, number of exposures. This report includes a summary policy or decision unless so designated by other documentation. table of representative in vivo Studies of microwave Approved for public release, distribution is unlimited, effects on lens, cornea, retina, and electroretinogram (Table 1) Correspondence to: Shin-Tsu Lu, McKessonHBOC BioServices,
To date, most microwave eye research has USA-MCMR 8308 Hawks Road Bldg^ 1168, Brooks Air Force ' , i <• , • .i Base, Texas 78235. E-mail: [email protected]
concentrated on damage to the lens of the eye in the
form of lenticular Opacity (cataract genesis). The lens Received for review 15 June 1999; Final revision received 11 is assumed to be more susceptible to microwave November 1999
Published 2000 Wiley-Liss, Inc. tThis article is a US Government work and, as such, is in the public domain in the United States of America.

440 Lu et al.
4) u 3
s.
u .a' S3
e
e
73 C O
O ft X
ON ON ON r— t— t— ON ON ON
„ „ „ ,~ "0 ir> CN CN _f „r _r [5 00 00 ON ON cs cs cs §; ON o\ ON ON
cj cj <u r r •• ~ Ö u u "3 "^ "«3 13 "« e e e ■*-• CJ CJ CJ cj CJ CJ CJ CJ . „
frfr & >N U CJ a a a 3 3 D to cj 3
«5 cj 3
u u u o w w W W
rj cs E E E o o
E e o o E (N —' r-<
A A A
CS
CS CS
O O s c X XI cs cs
3 'cd "eS
•3 "u "33 0 'S S EC <)- S o o
cj cj ra o ^g 'rt S S es S <u u 2 3 u 2 E E 03 « o c3 o o U U £ U U U
o CN
X
X
NO —c
X s< C
<~. S?| l-C =~ ^~
==-. t- — [fell 1 ": co i/o
C 60 ° £
■8 ^
.2 (N' "Ö3(N
o 5 •o c CJ
o oo
| s* <U CD cü ~ CO (N
E o U
ES o U
S-y E 2 S: -
E
00 I
-o o ' O _**
C cs
ft co "_ xr
E X!
o o E
c£ i/o
Ö X
''% -a
toit _, «~> c^ m
^, in o\ "i
* 22 o o 00 CN
x - — &
-w E o N E .u o .P S: »> -
c E o o Co"- O u-l I
u u u & u u N N N N N N K X O O ■n m ■<*■ ■*
I I I I OOÜÜ m u-i u~i in
CN <N (N CN
. . . Oi
^f o _; o . O wO
'oo"-<N- "" r ' ON
en I u to o
_; 3 i "3 v.' cx>n a, u ^r u ^r
»OSO ^ u-i ^ tn
i^j 3.
- E -
u o.
CO
X X!
'to
ON
H
5 g
1 «5 3 u •C 3
v) cj t^ u c u 60_ O 3 2 M"C Ö
•a > u « 35 CO^ 3
3 8 O O
cs CS 3 c
^O 3
^O t t CJ CJ
cs
t cs cs X
O X o
ON CJ CÄ
CJ CJ -a T3
—" ON
1— ON
X) o •a CO
X O
T3
X o -a
CJ X
CJ X
3 — CJ CJ CJ X X X ON X X 3 3 c« ON tw cfl OH OH
•o 13 3 <_, cs cj
X ^-1 ^3 'X 8 8
X X X 3 3 3 CN 3 3 C_ ON D. &, CS cs"
■5 C 3 ON B c CJ CJ o o 3 3 3 -a •a C 3 CJ CS
«f c/T c/T c/T 3 e U 3
0) 3
CJ 3
CJ 3
< < H a. ^ ^ « W a Q
x E S «3 -50-0- •S > u .-3^3 O. 8 — CJ C -o
1—< ^ CD _
sSgs I A ■ " U
OH OH
a o O cs
S P 8 u o 00
3 CJ 60
c 8 -X O 8 T3
60 £ o *2
o. E CS
w -a •a E._ 8 <D E
•o = s
§ °1 CJ v> H
8 X> C
_ O 8
•s f?s 8 cs .3 O M 5
OS OS
O co CM
I E
^ ^
NO
2 „ ^ tS it
ft ft r-'
I 00 o ö
<*> II!
E
o
o ZI
CJ A 8 o
ft ft O o CO
c/T 3. ^*
ftN
ft/ 8 :
ft ft
00 O
I 00
M NO
I ^ CO T3 CJ
CN
CJ <43
S3 «
> « X
8 CO
•* cj ON » CO 3 ^-- ft
es K uO 0 CN
cN —;
O ft CO ft
51 3. o
o —
X cj <"! J£
3 ft
60 ^S=^
CO ^ 3
CJ ft hi
ej > BC n
cs t~~
K» CJ
cil
J30 « 00
CN
^< 3. Mco I" f* -a
'> <S) *-• 4-t
CJ
O
E
a cj ft
I ft ft
vo
CN
" c> 00 2
3 E
CJ 'B o'O
3 8 O O
•f*. « ■3 O 3 c 3
T! X) 0> cj
OS as
E r- ö
■a CJ ft
E
E CN (N
E o
CN
■i CJ ft
E o CN
X X >n CN ö
"So
ftON > 1 _? x r . X ! I'M '
3.
X O
X xj"
cj ft 60 . r CS N
IS
X IT) X
^ - " uo ^ E - ' 00 o
> T3- ^ 42 vq ^ Tl- CJ ^J- 3 cO . ^ 42 ^ °-"—' > cj 3 cj - cj p; 60 ft O0.Ü 60U CS CS PH CS
53 N 53 ü J3 N >. X > vr, >X a O a csi « O
— CO -H
en W W V HJ U (1
X X X X -^ -^ •S -S -S -S 0 0 OS OS OS OS S S
(1) ft
CJ it 8 O
s
CJ M 8 O
X X
OS
8 H-. es -g 3 o 3 cs
SC OS
8 O
s 8 O
8 O
s C O
CJ
8 O
s
CJ X X c
o
NO
3 X

Microwave Retinal Effects 441
induced damage than other parts of the eye due to its lack of vascularization. This lack of vascularization is believed to prevent thermal homeostasis and lead to an exaggerated temperature rise [Michaelson and Lin, 1987]. Conclusions drawn from data by Carpenter [1979] and Guy et al. [1975] indicated that the threshold for lenticular opacity was an exposure which induced a 41.5 °C intralenticular temperature. Depend- ing on the wavelength of the RF radiation, threshold power density for damage of the rabbit lens was 150mW/cm2 or higher (estimated lenticular specific absorption rates, SARs > 100W/kg) for 100 min. This threshold exposure intensity is two orders of magni- tude higher than the current personnel protection guidelines [IEEE C95.1, 1999]. Michaelson and Lin [1987] concluded that similar lenticular effects were induced by continuous wave (CW) and pulsed microwaves of the same average intensity. A series of experiments [Stewart-DeHaan et al., 1983; 1985], using isolated rat lenses exposed in vitro to 918 MHz 24 kW pulses at various pulse repetition rates, appeared to support a high threshold for microwave induced lenticular injuries and by Creighton et al. [1987] who found an absolute threshold for inducing holes in lens fibers at 231 W/kg for 6 min.
Corneal endothelial abnormalities were induced by microwave exposure in cynomolgus monkeys by Kues et al. [1985]. They concluded that pulsed microwave radiation (2.45 GHz, 10 us pulse width, 100 pulses per second) was twice as effective as CW microwaves of the same average power density. Kues et al. [1992] reported increased sensitivity of the nonhuman primate to microwave radiation following pretreatment with ophthalmic drugs, such as 0.5% Timolol maleate and 2% pilocarpine. In these pre- treated eyes, the absolute threshold for microwave induced ocular injuries, which included increased iris vascular leakage and corneal endothelial injury, dec- reased tenfold from 2.6 W/kg (10 mW/cm2) to 0.26 W/kg (lmW/cm2). Trevithick et al. [1987] determined in rabbits that the threshold SAR for destruction of a single corneal epithelial cell was 33 W/kg from a 35 GHz pulsed microwave source. However, keratitis was not found by Rosenthal et al. [1976] in rabbits exposed to 35 GHz (40mW/cm2, 175 W/kg) or 107 GHz (40mW/cm2, 238 W/kg) microwaves for 1 h.
Tengroth and Aurell [1974] reported an increased incidence of chorioretinal scar in microwave workers with unspecific exposure intensities. Microwave- induced retinal injury was noted by Paulsson et al. [1979] as neuronal degeneration in the rabbit and by Kues [1992; 1993] and Kues and Monahan [1992] as submacula detachment, degenerative changes in photoreceptor outer segments, vacuolization of the
outer retinal layers, focal retinal detachments, karyo- lysis of photoreceptors, and pyknotic changes of the pigmented epithelium in the monkey. These investi- gators observed retinal degeneration in experimental animals subjected to repetitive exposure to pulsed microwaves. In a series of meeting abstracts [Kues, unpublished observations] and in Kues and Monahan [1992], it was noted that the threshold SAR for primate retinal degeneration was 3.9 W/kg for 2.45 GHz pulsed microwave (10 us pulse width, 100 pulses per second, 15 mW/cm2 average power density, or 15 kW/cm2 peak power density) and 3.6 W/kg for the 1.25 GHz (10 us pulse width, 0.225 pulses per second, 12.5mW/cm2
average power density, 5.56kW/cm2 peak power density) microwaves. Timolol maleate pretreatment was observed to enhance the severity of the retinal injuries in monkeys in a series of 27 four-hour 2.45 GHz pulsed microwave (10 us, 100 pulses per second, 5 or 10mW/cm2, SARs «1 or 2 W/kg) exposures, wherein Kues and McLeod [unpublished observation] found a 2-4 fold decrease in injury threshold. These threshold SARs for retinal injuries from repetitive exposures are lower than the permis- sible local SAR for exposures in controlled environ- ments (8 W/kg spatial average over one gram of tissue defined in the IEEE C95.1 [1999]) and the threshold SAR for acute lenticular injuries.
Because of criticisms concerning the use of halothane anesthesia during microwave exposures, Kues' group subsequently exposed unanesthetized monkeys [Kues, 1992; 1993]. Degenerated cones were observed in monkeys exposed to 7 four-hour 1.25 GHz pulsed microwave exposures (0.5 us, 16 pulses per second, average ocular SAR 3.5-4.0W/kg) [Kues, unpublished observation], 9 four-hour 1.25 GHz exposures (0.5 us, 16 pulses per second, ocular SAR 4.0 W/kg) [Kues and Monahan, 1992; Kues, 1992; 1993], and 30 exposures (duration of each exposure was not specified) at 2.7 GHz (1 us, 20 pulses per second, ocular SAR 2.6 W/kg) [Kues, unpublished observation]. However, retinal injuries were not ob- served in monkeys exposed to 2.85 GHz pulsed micro- waves (1 us, 20 pulses per second, ocular SAR 3.5 W/kg, three times per week for 10 weeks) [Kues, unpublished observation]. Differences in specific pulse/frequency parameters and in the SAR resulting from frequency dependent absorption by the photopigments were sug- gested by Kues as the causes of the difference in the effectiveness of various pulsed microwave exposures.
Contrast sensitivity functions are used widely as a measure of basic visual spatial resolution. Hence the physical changes observed by various investigators might be reflected in a measure of contrast sensitivity. However, visual contrast sensitivity was not altered

442 Lu et al.
during repeated exposures to 5.6 GHz microwaves (2.3 jas pulse width, 100 pulses per second, 18- 108mW/cm2 averaged, 6kW/cm2 peak, 1-6 W/kg whole-body average SAR, 4 exposures lasting 30 min each) [D'Andrea, unpublished observation]. In a follow up study, visual contrast sensitivity again remained unaltered during repeated exposures to 1.3 GHz pulsed microwaves (4 W/kg at the eye, lW/kg whole-body average SAR, 0.5 us pulse width, 16 pulses per second, 1MW peak power output, 36 h total, 4 h per session, nine sessions total) [D'Andrea, unpublished observation].
Yee [1983] reported a reduction of b-wave amplitude and increased c-wave amplitude of the sco- topic adapted single flash electroretinogram (ERG) in rabbits after a 3-4 h exposure to 3 GHz pulsed micro- waves (6 us pulse width and 1875 pulses per second, 0.7mW/cm2, 622mW/cm2 peak, « 1.53 kV/m peak). Recovery occurred in half an hour after the exposure. Kues [1992; 1993] and Kues and Monahan [1992] ex- amined ERG changes in adult Rhesus monkeys before and after 7-9 four-hour exposures to 1.25 GHz pulsed microwaves (0.5us, 16pps, 3.5-4.0W/kg ocular SAR). They noted a 50-60% reduction in the scotopic single (rod) flash response, a 90% reduction in the 30 Hz flicker (cone) response, and a complete extinc- tion of photopic single flash (cone) response following these repetitive exposures. The ERG returned to normal one week after microwave exposures. Lim et al. [1993] reported a case of abnormal flicker electroretinogram in a man with facial erythema after two 15 min accidental exposures (30 W, 6 GHz, continuous wave radiation) while inspecting a 3.2 meter satellite communication transmitting antenna.
The reports by Kues and his colleagues on microwave-induced retinal injuries in the monkey have appeared primarily in meeting abstracts. As such, detailed descriptions of experiments are mostly lacking. In addition, the incidence of the retinal injuries indicated either by histopathological changes or ERG changes are never clearly indicated. Due to the potential health and safety implications of microwave- induced retinal hazards in humans, a retinal study by using rhesus monkeys was performed.
The objective of the project was to determine if high peak power microwave radiation could induce retinal injuries. The study endpoints were changes in fundus photographs, angiography, electroretinograms, and histopathology of monkeys exposed to 1.25 GHz pulsed microwaves at 0,4.3, 8.4, and 20.2 W/kg retinal SAR. The following special considerations were incorporated into the experimental design:
1. Extensive densitometry and dosimetry were per- formed prior to experimentation.
2. Transmitter output power was continuously mon- itored and recorded.
3. Extensive preexposure screenings were used to ensure retinal normality prior to the acceptance of experimental subjects into the study.
4. All diagnostic procedures were applied uniformly to all subjects regardless of treatment.
5. Graded multiple retinal doses were used to maximize the probability of observing retinal changes caused by microwave exposures.
6. Preexposure baselines were used as individual controls.
7. Data obtained from the exposed monkeys were compared with those of sham-exposed monkeys which were run concurrently with the experimen- tal monkeys.
8. Ketamine restraint and general anesthesia were not used during exposure.
9. A minimum of 72 h recovery period was manda- tory between pre-screenings and beginning of exposures.
10. Fluorophotometry was not used. 11. Exposures were randomized. 12. All except one (code keeper) investigator were
blind to the experimental treatments. 13. Long distance transportation was avoided. 14. Experimental subjects were transported in a metal
cage with opaque plastic cover and in an enclosed air conditioned van. These considerations were incorporated to ensure data quality and to avoid introducing unidentified confounding factors and unintentional biases by investigators.
MATERIALS AND METHODS
Animal Model
Seventeen adult (six male, 11 female) Rhesus monkeys (Macaca mulatta, 4.0-9.5 y old, 4.3-8.8 kg), clinically healthy, physical defect free, and negative for tuberculosis and B virus (Herpesvirus simiae, Cer- copithecine herpesvirus 1) were used. They were housed individually in standard stainless steel primate cages in air conditioned rooms. Standard feed (Monkey Diet #5038, PMI Feeds, Inc.) and water were available ad libitum. The ambient environment was maintained at 22 ± 1 °C and 50-55% relative humidity with more than 10 fresh air exchanges per hour. The photoperiod was 12L:12D (light was kept on between 0600 and 1800 hours). Additionally, monkeys were screened against ocular abnormalities by fundus photography, fluorescein and indocyanine green angiographies, and electroretinography (ERG). An additional five mon- keys were screened but not accepted due to abnormal

Microwave Retinal Effects 443
angiograms (2), abnormal electroretinograms (2), or hypersensitivity to ketamine/xylazine anesthesia (1).
General Procedures
Each monkey was subjected sequentially to procedures grouped into preexposure ocular screening, chair acclimation, microwave/sham exposure, post- exposure evaluation, and euthanization/histopathology evaluation. The preexposure screening, under keta- mine/xylazine or sodium pentobarbital anesthesia, included ERG evaluation and on a separate day, funduscopy, followed immediately by angiography performed by using a scanning laser ophthalmoscope (SLO). Chair acclimation and microwave/sham expo- sures were performed without anesthesia in an anechoic chamber. Chair acclimation included place- ment of the monkeys in a restraining chair fabricated entirely from polyvinyl chloride (PVC) with head restraints to limit head movements. Acclimation was gradually increased to four hours daily for a minimum of five days. A monkey was successfully acclimated when it could sit quietly in the chair for 4h. Three to 4 days after the chair acclimation, monkeys were exposed individually, 4 h daily, 3 days per week for 3 weeks, for a total of nine exposures. Two monkeys were exposed separately, one in the morning (0800- 1200 hours) and one in the afternoon (1230-1630 hours). The morning and afternoon exposures were selected randomly and mutually exclusively from one of the four microwave doses.
Twenty-four hours after the last of nine expo- sures, the monkey was subjected to postexposure evaluations which in sequence included ERG, fundus photography, and SLO/angiograms. Immediately after the last procedure, the animal was euthanized with 3 ml (300 mg) of sodium pentobarbital. Enucleation was performed immediately after the euthanization. Eyeballs were slit at the limbus, immersion fixed in 25% Karnovsky's fixative (1% paraformaldehyde and 1.25% glutaraldehyde in 0.1 M cacodylate buffer, pH 7.2), processed, sectioned at 2.5 urn in glycol metha- crylate block through the disk and macula, and stained with periodic acid Schiff's (PAS) and Harris' hema- toxylin. The endpoints of this study included fundus photographs, retinal angiograms, ERGs (rod b-wave amplitude and implicit time, cone a- and b-wave amplitudes and implicit time, mixed cone and rod a- and b-wave intensity response function, 30 Hz flicker amplitude, and summed scotopic oscillatory potential amplitudes) and retinal histopathology.
Microwave Exposure
The pulsed microwave radiation was generated from an FPS-7 transmitter operated at 1.25 GHz,
1.04 MW peak power, 5.59 (as pulse width at 0, 0.59, 1.18, and 2.79 Hz pulse repetition rates. The retinal specific absorption rates (R-SAR) were 0, 4.3 ±0.1 (SD, n = 4), 8.4 ±0.3 (SD, n = 3), and 20.2 ±0.4 (SD, n = 5) W/kg. The distance between the frontal supra-orbital ridge and the geometric center of the open-end waveguide was 7.6 cm. Initial testing indicated intolerance (restlessness and rapid eye blinking) could occur within 5 min at 26 W/kg. However, exposures up to 20 W/kg for 4h were tolerated by all monkeys. The warmest surface temperature (cornea) never exceeded 35 °C. In fact, all the exposures could only be described as uneventful and subjects spent the majority of time in the exposure chamber sleeping.
Exposure Facility
The microwave pulses were generated by the FPS-7 radar system. These microwave pulses were transmitted through a WR650 waveguide system into an anechoic chamber (Fig. 1). An open-end WR650 waveguide was used as an antenna to provide vertical E and horizontal H polarizations. An E-H tuner was used to minimize the mismatch (13-15 dB or more down from the forward power). The ambient tempera- ture of the anechoic chamber was monitored con- tinuously with a telethermometry system (YSI 405 probe and Cole-Parmer Thermistor Thermometer E-08502-14). An independent air conditioner unit was used. For quality assurance, redundant power measurements were made and recorded every 15 min. All the power measurement components, such as directional couplers, attenuators, connectors, and cables were individually and periodically calibrated and recorded with a sealer network analyzer (HP 8757C) with matching detectors (HP 85025A) and cables. A sweep oscillator (HP 8350B) with an RF plug-in (HP 83525B), calibrated bridge (HP 85027), and connector kits were used during calibration. All the power measurement instruments were factory- calibrated annually. All temperature measurement devices were calibrated in a water bath against an NIST traceable ASTM mercury-in-glass thermometer.
The FPS-7 transmitter produced trapezoidal pulses with rise- and fall-time of approximately 0.9 (is and 50% width of 6 us. The square wave equivalent pulse width calculated from pulse energy and peak power was 5.59 p.s. The width of the entire sideband was less than 20 MHz. Power densities at the E-H plane and bore-sight power densities at various distances from the antenna were measured with a Narda 8721 probe and 8716 meter positioned by a triaxial scanner. A continuous wave microwave signal was used for field mapping. The configuration allowed

444 Lu et al.
TK MM» O'too».
ex.», OCH. ;
OCULM/COIOW/C TtumuTum UESUKEUENTt /
itAu-06 moaes UflfTSO* »00
IUN ACQUISITION BYMTEU
DIRECTIONAL COUPLE* tun)
4+OKT WAVEOUIDE »WITCH
70 PEAK POHEft METER
^3--0 O OmeCTIOHAl COUPLER *■«
<w«J ES--0 MAY POW» METE*
vs/ 4« Tx
TO THE SUBJECT
ITENNA
AUSIENT TEUPERATURE MEASUREMENT
VA JT1~
McKaaaon BloSarvlcaa
L-Band Block Diagram
Salnam Uathur 9-12-9S
Fig. 1. Block diagram of the exposure system.
localized exposure limited to head and neck of the monkey (Fig. 2). The spatial peak-power density was 2.8mW/cm2 per W of transmitted power. Care in positioning the monkey, chair training, and head immobilization were extremely important to obtain a consistent exposure at 7.6 cm from the antenna.
Ocular Thermometric Dosimetry
A thermometric dosimetry procedure [Gambrill et al., 1993; Lu et al., 1993] with RF transparent temperature probes (Luxtron 3000 Fluoroptic Thermo- meter and 2 Luxtron MAM-05 probes, four sensors each at 5 mm spacing) was used. The rate of tem- perature change during dosimetric exposure (d77dfeXp, 40 s) was adjusted by the average of the rates of temperature change during preexposure period (d77d?pre, 40 s) and postexposure period (d77d?post, 40 s) as dT/dt = dT/dtexp-[(dT/dtprc + d77drpost)/2]. The local SAR was calculated by the following formula using average specific heat of tissue (C = 3474J/kg) and SAR (W/kg) = C • dT/dt. Four replications were performed for each local SAR determination. The SAR data were normalized to
W/kg per W of transmitted power. For ocular dosi- metry, the FPS-7 transmitter was operated nominally at 1 MW peak power, 6 us pulse width, 17.5 Hz pulse re- petition rate, and 80-100 W average transmitter output.
Two 6 year old female monkey carcasses (4.5 and 4.9 kg) were used. A fistula was created surgically in each of four quadrants of ocular globe—superior, oral, nasal, and temporal—through the eyelids (Fig. 3). Fiber optic temperature probes were inserted along the outer contour of the ocular globe, so as not to penetrate the eye wall, until the last sensor of the probe was resting near and slightly deeper than the limbus. The current procedure represents a retinal SAR rather than an intraocular SAR since only a thin layer of conjunctiva and sclera separated the probe and the retina. Sixteen retinal SARs per globe and 32 retinal SARs per carcass were determined.
Electroretinogram
Electroretinograms (ERG) were used as preex- posure screening criteria (3-4 weeks before exposure) for ocular health and as a postexposure endpoint (24 h after the last exposure). An Electrophysiologic Perso-

Microwave Retinal Effects
Contour I ln9 un It In dB
445
>• .5 4"
-5 -0 5 10
X oxls (cm)
Fig. 2. Power density contour of the exposure system at 7.6 cm.The image in the center of this graph shows the position of the monkey and relative size between the field and the monkey.
Right Nasal (4) Left Nasa| (3)
Right Superior (1)
Right Temporal (3)
Right Oral (2)
Left Superior (1)
Left Temporal (4)
Left Oral (2)
Location and Sequence of Peri-ocular (Retinal) SAR Determinations
Fig. 3. Locations and sequence of peri-ocular SAR determina- tions.
nal Interfaced Computer System (LKC Technologies, Inc., EPIC-2000) was used. The monkey was anesthe- tized with ketamine (20mg/kg, i.m.) and xylazine (2mg/kg, i.m.)- Two to three drops of 0.5% propar- acain hydrochloride ophthalmic solution, 1% tropica- mide ophthalmic solution, and 2.5% phenylephrine hydrochloride ophthalmic solution were instilled into the conjunctiva pouch for corneal analgesia and dilation of the iris. Ground (attached to inner surface of the leg), indifferent (attached to forehead skin surface), and active (ERG-Jet contact lens, Life-Tech, Inc. attached to corneal surface) electrodes were used. The Jet electrode was filled with 2.5% hydroxypropyl methylcellulose ophthalmic demulcent solution (Goni- sol) and then attached to the corneal surface. The eyes were dark-adapted (scotopic adaptation) in a shielded

446 Lu et al.
dark room for 30 min. The ERG was recorded after scotopic adaptation.
In sequence, the scotopic intensity response curve, scotopic 30 Hz flicker responses, and photopic responses were obtained. The intensity (luminance) of the light flashes was expressed in dB to the base of 2.23 cd-s/m2 (candela-seconds per meter squared). The light intensities used in determining scotopic intensity response curves were between —40.46 and 24.28 dB in 2-4 dB steps. The 30 Hz flicker stimulus consisted of photic pulses at 2.23 cd-s/m2 (OdB). Background illumination for the photopic response was 28.8 cd/m2 and a 2.23 cd-s/m2 (OdB) photic pulse was used. The above tests were in accordance with the ISCEV recommendations [International Standardization Committee, 1989; Marmor and Zren- ner, 1995] for "rod response", "maximum response", and "cone response." The relationship between the ERG b-wave amplitude, R (in uV), and stimulus intensity, I (in cd-s/m2), was given by Naka and Rushton [1966] as follows:
■«MTinx
/"
I" + K"
where Rmax is the asymptotic amplitude of the b-wave (in uV), A"is the intensity at which b-wave amplitude is half of its asymptotic value (in cd-s/m2), and n determines the slope of the function at I = K. Rmax
and log K can provide additional insights into the pathophysiologic mechanisms underlying retinal dis- ease [Massof et al., 1984; Peachey et al., 1992]. The b-wave intensity response data were used to derive Naka-Rushton constants according to the method developed by Severns and Johnson [1993]. Gonisol was washed out with 0.9% normal saline after the completion of ERG test procedures.
Fundus Photography, Fluorescein Angiography (FA) and Indocyanine Green Angiography (ICG)
These procedures were used both as preexposure screening for ocular health and as postexposure endpoints. Preexposure screening was performed independently of the ERG evaluation, and usually performed at least 4 days before the commencement of the microwave exposures. The postexposure endpoint studies were performed 24 h after the last sham/ microwave exposures and after the ERG procedures. Monkeys were anesthetized with ketamine (20 mg/kg, i.m.) and xylazine (2 mg/kg, i.m.) initially and then anesthetized with sodium pentobarbital (10-20 mg/kg,
i.v.) through the cannula and supplemented when needed. Two to 3 drops of 0.5% Proparacain hydro- chloride ophthalmic solution, 1% Tropicamide ophthalmic solution, and 2.5% Phenylephrine hydro- chloride ophthalmic solution were instilled into the conjunctival pouch for inducing cycloplegia and mydriasis. To reduce the incidence of postinjection emesis, acepromazine maleate (0.5-1.0 mg/kg, i.v.) was administered approximately 15 min before dye injections (Fluorescein and Indocyanine Green). The eyelids were held open by an ophthalmic speculum, and the cornea was irrigated frequently with 0.9% normal saline to prevent drying. A fundus camera and scanning laser ophthalmoscope (Rodenstock) were used. Fundus photographs were taken as Polaroid prints and slides for permanent records. FA was accomplished with intravenous injection of a 0.2 ml bolus of 10% sodium fluorescein (Alcon Labs., Inc.) and repeated up to 1 ml. ICG was accomplished by intravenous injection of a 0.1 ml bolus of indocyanine green (Becton Dickinson and Company). Each bolus of dye injection was followed by 1 ml of 0.9% normal saline flush. The FA and ICG images were recorded by a video recorder so that permanent records could be maintained and reviewed.
Euthanization and Retinal Histopathology
Immediately after the completion of postexpo- sure FA/ICG angiograms, the monkeys were eutha- nized with intravenous sodium pentobarbital (3 ml, 300 mg) until the heart beats stopped. Bilateral enucleation was performed immediately. The extir- pated eyes were slit at the limbus and immersed in the 1/4 strength Karnovsky's fixative (1% paraformalde- hyde and 1.25% glutaraldehyde) in 0.1 M cacodylate buffer, pH 7.2 at room temperature for 15 min. After the initial fixation, the anterior segments were removed and the tissue was returned to fixative. The ocular tissue in 1/4 strength Karnovsky's fixative was sent to the ocular histology laboratory at Wilmer Eye Institute, Johns Hopkins University, and stored refri- gerated at 4 °C until processing.
Following several washes in 0.1 M cacodylate buffer, pH 7.4, at 4°C, the posterior eyecups were dehydrated in graded alcohols (30, 50, 70, 80, 90, 95, and 95% v/v) for 30 min each on a rotator at room temperature. Tissues were trimmed during the 70% alcohol step to approximately 6x8 mm, which included the disk and macular region of the posterior pole. The 6 mm dimension was along the inferior to superior plane, while the 8 mm dimension was along the temporal plane extending from the nasal aspect of the nerve head. Trimmed tissues were imaged by using a calibrated macroscopic setup which included goose-

Microwave Retinal Effects 447
neck fiber optic lighting, and a Hamamatsu CCD camera with a 50 mm lens and 20 mm extension tube. Dehydration was then allowed to continue. The remaining peripheral tissue not embedded for histo- pathological evaluation was stored in 70% alcohol at 4°C.
Following the second 95% alcohol dehydration step, the tissue was infiltrated overnight at room temperature in catalyzed glycol methacrylate polymer (catalyzed JB-4 solution A, Polysciences, Inc.). The infiltrate was replaced with freshly prepared catalyzed JB-4 solution A in the following morning and infiltration was resumed for three additional hours.
Tissues were then embedded in 24 mm Wheaton snap cap vial lids which had prepoured bottoms from the previous day, and the blocks were polymerized under vacuum. The blocks were trimmed so that the macular and disk regions were approached from the inferior region of each eye and would be included in the same plane. Blocks were faced until complete sections of full thickness eyewall were obtained. At that time, four slides containing three sections each (2.5 pm in thickness) were collected and dried on a slide warmer. The process (collecting four slides con- taining three sections each) was repeated at 250 pm steps until the foveal slope was reached by which time eight slides (24 serial sections) were collected. The blocks were then sealed with clear nail polish and desiccated at room temperature for archival storage.
Slides were stained by using PAS and Harris' hematoxylin several days after complete drying. One slide from the first collection step of each eye was used
to verify proper timing of the staining procedure prior to staining the remaining slides. Two hours in 1% periodic acid followed by several distilled water rinses and 2h in Schiffs reagent yielded satisfactory results. The sections were counter-stained for 30 min in freshly filtered Harris' hematoxylin. The hematoxylin was blued in tap water for 2 h. After the staining, the slides were allowed to dry overnight before mounting. Two slides each from 250 pm step up to the fovea and four slides each within the fovea were stained and evaluated histologically.
RESULTS
Dosimetry
Microwave energy deposition was not uniform at various locations surrounding the eyes of the monkeys. The R-SAR, expressed in W/kg per W of transmitted power, is shown in Figures 4 and 5 for two animals. Retinal absorption was clearly altered by the anato- mical structures surrounding the eyes. In monkey A35Z, the supraorbital ridge shadowed the retinal tissue and resulted in a lower superficial R-SAR in both eyes in the superior quadrants at 0 and 0.5 cm (Fig. 4). At the same time, maximum absorption oc- curred at the surface of the nasal quadrants. The nasal absorption "hot spot" was confirmed by comparing thermographic images taken before and after a 2 min exposure (data not included). The shadowing effect of the supraorbital ridge was not as readily apparent in monkey A47Z (Fig. 5). The ratio of the warmest spot to
< If)
3.5
3.0
2.5
2.0
1.5
A35Z, Female, 6 years, 4.45 kg
t 1.0
0.5
0.0
"i p
Right Globe O Superior
• Oral V Nosol T Temporol
1.3035 +/- 0.6407 (S.O., N=16)
i l I i
0.0 0.5 1.0 1.5
Depth (rom Surloce (cm)
3.5
3.0
2.5
2.0
1.5
1.0 -
0.5
A35Z-SUU.SPG
0.0
1 I i i
Left Globe 0 Superior • Oral V Nasal V Temporol
1.1087 +/- 0.4265 (S.D., N=16)
0.0 0.5 1.0 1.5
Depth from Surface (cm)
Fig. 4. Retinal SAR of A35Z.

448 Lu et al.
3.5
3.0
A47Z, female, 6 years, 4.90 kg
^2.5
?.0
15 1 5
z
0.5
0.0
Right Globe 0 Superior
• Oral
V Nosal
T Temporal
1.3374 +/-0.3472 (S.D., N= 16)
-J i i i
3.5 A47Z-SUM.SPG
i
led Globe
A O Superior
• Oral 3.0
/ V Nosal
?■) * ▼ Temporol
2.0
1.5 7
"\ k^ 1.0 \ /\ ^^*
0.5
nn
1.2558 +/- 0.6954 (S.D.,
i i i
0.0 0.5 1.0 1.5
Deplh from Surface (cm)
0.0 0.5 1.0 1.5
Depth from Surface (cm)
Fig. 5. Retinal SAR of A47Z.
TABLE 2. Summary of the Retinal Dosimetry in the Monkeys
Monkey number Right globe Left globe
A35Z A47Z Mean
1.3±0.6(16)a 1.1 ±0.4 (16) 1.3 ±0.4 (16) 1.3 ±0.7 (16)
1.25 ±0.10 (4)
"Values are mean SAR ± SD (n) in W/kg per W net power.
the coldest spot was 2.3-5.1 in four eyes of two animals. While the R-SAR spatial distribution did not vary uniformly between eyes or between monkeys, the mean R-SAR over the entire ocular globe was relatively constant between the two eyes or between animals (Table 2). In fact, the largest ratio between the mean R-SAR of four eyes was 1.2. Therefore, the averaged R-SAR but not local R-SAR could be predicted accurately in the present exposure system.
Funduscopy
Regardless of the exposure group, pre- and postexposure fundus pictures were all within normal limits. Scarring, tearing, edema, hemorrhage, vascular occlusion, vascular torturous, abnormal pigmentation, discolored patch, streaks, or holes were not noted. Representative fundus pictures of the four experimen- tal groups are shown in Figure 6.
Angiography
The pre- and post angiographies were all within normal limits regardless of the treatment.
Electroretinogram
An example of the scotopic response-luminance relationship is shown in Figure 7. The figure illustrates the luminance dependent appearance and amplitude of
a-wave (negative deflection) and b-wave (positive inflection). Wavelets (oscillatory potentials) were also noted in the majority of traces at the ascending portion of the b-wave. The a-wave amplitude increased monotonically with luminance above the threshold (Fig. 8), while the b-wave amplitude-luminance relationship was composed of at least two limbs with plateaus or dips at the intermediate and intense flash intensity. The first limb of the amplitude-luminance curve was fitted with a sigmoid Naka-Rushton function for evaluation of Rmax and log K as indicated in the Materials and Methods section.
Other endpoints examined were "rod" response (3.47 x l(T3cd-s/m2 light flash), "maximum" re- sponse (combined rod and cone response, 2.23 cd-s/m2
light flash), 30 Hz flicker response (2.23 cd-s/m2 light flashes at 30 Hz), and "cone" response (response to 2.23 cd-s/m2 light flash in the 28.8 cd/m2 light-adapted eye). Specifically, the following endpoints were evaluated: b-wave amplitude and implicit time of the rod response, a-wave amplitude and implicit time of the maximum response, b-wave amplitude and implicit time of the maximum response, oscillatory potential of the maximum response, amplitude of the 30 Hz flicker response, a-wave amplitude and implicit time of the cone response, and b-wave amplitude and implicit time of the cone response. Of these 16 endpoints examined, only isolated changes were noted. These changes were: accelerated combined b-wave implicit time at 8.4 W/ kg but not at 4.3 and 20.2 W/kg (Fig. 9), and increased cone b-wave amplitudes in the 8.4 and 20.2 W/kg groups (Fig. 10).
Histopathology
Other than an increase of the PAS staining (Fig. 11), all retinal histopathology was within normal limits. The occurrence rate of PAS-positive retinas is indicated in Table 3.
DISCUSSION
Rather than retinal degeneration, enhanced ERG amplitude and a possible alteration in photoreceptor's glycogen store were noted in the present study. Enhanced ERG amplitudes can be caused by low-dose retinal toxins or metabolic inhibitors [Noell, 1958]. The ERG enhancement can occur prior to the appearance of retinal degeneration observed later as ophthalmoscopic and histological changes, depressed ERG amplitudes, and delayed appearances of a- and b-waves. Agents known to cause transient enhance- ment of ERG amplitude are sodium azide, trichlor- oethylene, sodium pentobarbital [Noell, 1958], hyperbaric oxygen [Ray and Hawgood, 1977], ische-

Microwave Retinal Effects 449
Representative Fundus Images
1.892ZOD30Jul97.tif SHAM PRE
2.892ZOD21Aug97.tif SHAM POST
3. B14ZOD6May97.tif 4.42 W/kg PRE
4. B14ZOD30May97.tif 4.42 W/kg POST
929ZOD1Jul97.tif 8.14 W/kg PRE
6. 929ZOD24Jul97.tif 8.14 W/kg POST
7. A72ZOD30Jul97.tif 20.0 W/kg PRE
8. A72ZOD21Aig97.tif 20.0 W/kg POST
Fig. 6. Representative fundus images. Images from left to right on the top row are sham preexpo- sure, sham postexposure, 4.4 W/kg preexposure and 4.4 W/kg postexposure. Images on the bottom row are 8.1 W/kg preexposure, 8.1 W/kg postexposure, 20.0 W/kg preexposure, 20.0 W/kg postexpo- sure.The monkey numbers are thefirst four letters of the file name.
mia [Brunette et al, 1986], sodium iodate [Adachi- Usame et al., 1992; Hosoda et al., 1993; Sugimoto et al., 1996], and in siderosis caused by intraocular metal particles [Knave, 1969]. Because of the correla- tion between enhanced ERG amplitude and the presence of reduced or extinct visual evoked poten- tials, ERG amplitude enhancement was hypothesized to result from abolition of a physiologic rivalry between photoreceptor's increasing sensitivity in the dark and inhibitory cerebral influence upon retinal activity exerted via efferent fibers in the optic nerve [Feinsod et al., 1971a; 1971b]. Enhanced ERG amplitudes in isolated retina in vitro could be achieved pharmacologically by dopaminergic antagonists (halo- peridol and chlorpromazine), anticholinergic drug (atropine), and monoamine uptake inhibitor (amitrip- tyline) [Nakagawa et al., 1988] or in vivo in rabbits after dopamine depletion by intravitreal injection of 6- hydroxydopamine [Olivier et al., 1987].
Dopamine has been shown in rabbits to be synthesized and degraded in a subset of amacrine
(interamacrine) cells located at the junction of the inner plexiform and inner nuclear layers [Dowling and Ehinger, 1978]. Therefore, enhanced ERG amplitude is a physiological event most likely originating in inner retina or optic nerve. Thus, it is not surprising to find enhanced ERG amplitudes in the absence of identifi- able histopathological change in photoreceptors. Our data indicate that microwave exposure can alter retinal physiology, however, under the conditions of our experiment, it appears that the functional changes had not progressed to degeneration, injury, or inflammation.
The PAS stain is used histologically for identify- ing the presence of glycogen, mucin, and basement membrane. In human and monkey retina, glycogen is found in the inner layers of the retina from the nerve fiber to the outer plexiform layer, in Muller's cells, and in cone but not rod photoreceptors [Mizuno and Sato, 1975]. In reaction to anoxic or ischemic condition, the retina manifests injury first by a reduction or depletion of glycogen storage, followed by impaired function

450 Lu et al.
B57Z. DARK ADAPTED, O.D.. 10/04/96
Flash onset
COMSINED RESPONSE. b-WAVE
100 ms: 100 ßV
Fig. 7. An example of electroretinographic response-luminance relationship of a dark-adapted right eye (O.D.) of a monkey. Data shown are preexposure baselines. The flash intensity is indicated in log unit in numerals. Each trace is offset vertically to avoid over- lapping, and horizontally to the beginning of the light flash. Abscissa is time while ordinate is the recorded voltage.
B57Z I0/0V96
600
700
eoo 500
400
JOO
J00
ICO
• OS. • ■
• • • • • • • " • ♦ ■
• — ■**-
- ""■ ■ •
■ ■ B * ■ * .
• •/ ■
^^ li . X m m fc m m a ■
i . . . . i . . . , . ' ■ .
LOG LUMINANCE (cd-s/m )
Fig. 8. The ERG amplitudes and flash luminance curve. Data are from the preexposure baseline from the same monkey in Figure 7. The solid line ofthe first segment within O.D. (right eye) or O.S. (left eye) is a sigmoid curve fitted with Naka-Rushton function. For details, see Materials and Methods.
(reduction in ERG amplitudes), and finally by tissue damage (e.g., mitochondrial swelling or vacuolization observed by light microscope) [Ames and Gurian, 1963; Ames, 1965; Wassilewa et al., 1976; Johnson, 1977].
Retinol SAR (W/kg)
Fig. 9. EffectofMicrowaveexposureoncombinedrodandconeb- wave implicit time. Data shown is the ratio of postexposure implicit to preexposure implicit time. Error bars are S.E. Arrow head indi- cates the direction of change in relation to endpoints of sham- exposed animals.
CONE RESPONSE. b-WAVE
Retinol SAR (W/kg)
Fig. 10. Effectofmicrowaveexposureoncone-b-waveresponses. For description, see Fig. 9.
It is known that the retinas of alloxan-diabetic rats showed increased glycogen synthesis in vitro [Kurimoto et al., 1965]. Compensatory glycogen accumulation in retina was noted in various species of animals in response to hypoxia [Kuwabara, 1965; Antal, 1979; Schuschereba et al., 1983]. However, compensatory glycogen accumulation occurs primar- ily in Müller cells, not in cone photoreceptors. In contrast to glycogen depletion, increased glycogen content in cone photoreceptors has not been reported as a marker for subsequent events leading to photo- receptor degeneration. In absence of ERG depression, histopathological changes, and a correlation between an increase in PAS staining and enhanced ERG amplitude, the alteration in PAS reactivity we observed could only point to a physiological condition instead of a pathological state.

Microwave Retinal Effects 451
B87Z, OD, sham, PAS (-) Mild distortion in outer segments
B71Z, OD, sham, PAS (+) Mild distortion in outer segments
B61Z, OD, 8 W/kg, PAS (+) Normal outer segments
B59Z, OD, 4 W/kg, PAS (-) Mild distortion in outer segments
B20Z, OD, 20 W/kg, PAS (-) Mild distortion in outer segments
B63Z, OD, 20 W/kg, PAS (+) Normal outer segments
Fig. 11. PAS enhancement. These are representative photomicrographs from monkeys. Both PAS negative (left column) and positive (right column) are included. Microwave treatments and com- ments on morphology of outer segments are also included.

452 Lu et al.
TABLE 3. Occurrence Rate of the PAS Positive Retinas
SAR Number of eyes with Number of eyes (W/kg) enhanced PAS examined
0 4.3 8.4 20.2
Based on the results of clinical morphology, histopathology, and electroretinogram, retinal degen- eration was not found in the present study. These findings are in contrast to the findings of Kues and colleagues as reviewed in the Introduction. Two of the procedures used by Kues were avoided in the present experiment. They are fluorophotometry and the use of ketamine as a chemical restraint for taking monkeys in and out of the restraint chair. One of the major issues in Kues' report concerned the incidence of retinal degeneration in microwave-exposed monkeys. Two final reports authored by Kues [1992; 1993] provided enough details to allow us to examine the incidence of retinal degeneration in 15 monkeys used in his experiments to identify retinal injuries caused by the 1.25 GHz pulsed microwave exposures.
Of these 15 monkeys, one was not sacrificed for morphological study. Of the remaining 14 monkeys, nine were subjected to fluorophotometry (seven exposed, two shams) and five were not (four exposed, one sham). Retinal injuries were identified in five monkeys (four exposed, one eye of a sham-exposed) and fluorophotometry was performed in all five. Regardless of microwave treatments, retinal histo- pathologies were within normal limits in monkeys not subjected to fluorophotometry.
In fluorophotometry, halothane anesthesia (2.5%, 97.5% oxygen), and 0.3 ml of 10% sodium fluorescein were used. Halothane as an inhalation anesthetic is known to inhibit respiration at any concentration and to reduce systemic arterial pressure, cardiac contractile force, cardiac output, and total peripheral resistance. It is known that anoxia and ischemia can induce irreversible retinal damages in 20-30 min [Noell, 1958; Anderson and Davis, 1975; Johnson, 1977]. With an increased oxygen concentration in the inhaled gas mixture, hypoxia could be relieved. However, the retina is also prone to injury by increased oxygen tension under hyperbaric condition or by increased oxygen concentration under normobaric condition. Visual cell death can occur during prolonged exposure to increased oxygen concentration [Noell, 1958; Beehler, 1964; Penn and Thum, 1989; Nichols and Lambertsen, 1969]. Hochheimer et al. [1987] demon-
strated that intravenous administration of 1 ml of 25% sodium fluorescein (a higher dose than that used by Kues) in rabbits could reduce the amount of blue light needed to induce a phototoxic retinal lesion by almost a log unit (1.6-0.2W/cm2). In other words, a host of retinotoxic agents can be present during fluorophoto- metry if adequate care is not exercised.
Upon repetitive administration, animals are known to quickly build up resistance to ketamine [Cumming, 1976; Livingston and Waterman, 1978]. It is likely that the ketamine dose would have been increased to achieve the same restraint effect in monkeys in Kues' experiments. High doses of ketamine are known to cause retinal ultrastructural changes within one hour after 30mg/kg [Antal, 1979], or a transient loss of vision for 25-30 min in humans after regaining full consciousness from i.m. or i.v. ketamine monoanesthesia at 1.5-2.6 mg/kg.
In summary, the original observation by Kues and colleagues on the retina's susceptibility to microwave injury (four out of 11 monkeys exposed at 4 W/kg) was not confirmed by the results obtained in the present study (0 out of 12 monkeys at 4-20 W/kg). The fluorophotometric procedure and repetitive use of ketamine may have predisposed the monkeys to retinal injuries.
ACKNOWLEDGMENTS
Technical assistance was provided by Michael Belt, Don Hatcher, David D. Cox (U.S. Navy), Frank Weathersby, Kevin Kosub (Veridian), Cary Richardson (Geocenter), Steve T. Schuschereba, Andre Akers, SSgt. Sally Ruiz, SSgt. Janis Loveday (U.S. Army), TSgt. Leland Johnson, TSgt. Maurice Täte, SSgt. Vincent Zavala, SSgt. David Hernandez, SrA. Jason Cochetti and SrA. Mike Lilly (U.S. Air Force). The investigators adhered to the "Guide for the Care and Use of Laboratory Animals" for the use of laboratory animals.
REFERENCES
Adachi-Usami E, Mizota A, Ikeda H, Hanawa T, Kimura T. 1992. Transient increase of b-wave in the mouse retina after sodium iodate injection. Invest Ophthalmol Visual Sei 33:3109-3113.
Ames A III. 1965. Studies of morphology, chemistry and function in isolated retina. In: Graymore CN, editor. Biochemistry of the Retina. New York: Academic Press, p 22-30.
Ames A III, Gurian BS. 1963. Effects of glucose and oxygen deprivation on function of isolated mammalian retina. J Neurophysiol 26:617-634.
Anderson DR, Davis EB. 1975. Sensitivities of ocular tissues to acute pressure-induced ischemia. Arch Ophthalmol 93: 267-274.

Microwave Retinal Effects 453
Antal M. 1979. Ketamine-induced ultrastructural changes in the retina. Albrecht v. Graefes Arch Klin Exp Ophthal 210: 43-53.
Beehler CC, Newton NL, Culver JF, Tredici T. 1964. Retinal detachment in adult dogs resulting from oxygen toxicity. Arch Ophthalmol 71:665-670.
Brunette JR, Olivier P, Zaharia M, Blondeau P, Lafond G. 1986. Rod-cone differences in response to retinal ischemia in rabbit. Doc Ophthal 63:359-365.
Carpenter R. 1979. Ocular effects of microwave radiation. Bull NY Acad Sei 55:1048-1057.
Creighton MO, Larsen LE, Stewart-DeHaan PJ, Jacobi JH, Sanwal M, Baskerville JC, Bässen HE, Brown DO, Trevithick JR. 1987. In vitro studies of microwave-induced cataract. II. Comparison of damage observed for continuous wave and pulsed microwaves. Exp Eye Res 45:233-246.
Cumming JF. 1976. The development of an acute tolerance to ketamine. Anesth Analg 55:788-791.
Dowling JE, Ehinger B. 1978. Synaptic organization of the dopaminergic neurons in the rabbit retina. J Comp Neurol 180:203-220.
Feinsod M, Rowe H, Auerbach E. 1971a. Changes in the electroretinogram in patients with optic nerve lesions. Doc Ophthal 29:169-200.
Feinsod M, Rowe H, Auerbach E. 1971b. Enhanced retinal responses without signs of optic nerve involvement. Doc Ophthal 29:201-211.
Gambrill CS, DeAngelis ML, Lu S-T. 1993. Error analysis of a thermometric microwave-dosimetry procedure. In: Blank M, editor. Electricity and magnetism in biology and medicine. San Francisco: San Francisco Press, p 593-595.
Guy AW, Lin JC, Kramar PO, Emery AF. 1975. Effect of 2450 MHz radiation on the rabbit eye. IEEE Trans Microwave Theory Tech 23:492-498.
Hochheimer BF, Lutty GA, D'Anna SA. 1987. Ocular fluorescein phototoxicity. Appl Optics 26:1473-1479.
Hosoda L, Adachi-Usami E, Mizota A, Hanawa T, Kimura T. 1993. Early effects of sodium iodate injection on ERG in mice. Acta Ophthalmol 71:616-622.
IEEE (Institute of Electrical and Electronics Engineers, Inc.). 1999. IEEE standard for safety levels with respect to human exposure to radio frequency electromagnetic fields, 3 kHz to 300 GHz. New York: The Institute of Electrical and Electronic Engineers, Inc.
International Standardization Committee. 1989. Standard for clinical electroretinography. Arch Ophthalmol 107: 816-819.
Johnson NF. 1977. Retinal glycogen content during ischaemia. Albrecht v. Graefes Arch Klin Exp Ophthal 203: 271-282.
Knave B. 1969. Electroretinography in eyes with retained intra- ocular metallic foreign bodies. Acta Ophthalmol Supple- ment 100:1-63.
Kues H. 1992. Effects of microwave radiation on human. Monkeys exposed to 1.25 GHz pulsed microwaves. Defense Technical Information Center, ADA249997.
Kues HA. 1993. High peak power microwaves: a health hazard. Defense Technical Information Center, ADA277168.
Kues HA, Hirst LW, Lutty GA, D'Anna SA, Dunkelberger GR. 1985. Effects of 2.45-GHz microwaves on primate corneal endothelium. Bioelectromagnetics 6:177—188.
Kues HA, Monahan JC. 1992. Microwave-induced changes to the primate eye. Johns Hopkins APL Tech Dig 13: 244-255.
Kues HA, Monhan JC, D'Anna SA, McLeod DS, Lutty GA, Koslow S. 1992. Increased sensitivity of the non-human primate eye to microwave radiation following ophthalmic drug pretreatment. Bioelectromagnetics 13:379-394.
Kurimoto S, Newell FW, Farkas TG. 1965. Glycogen synthesis by the rat retina. In: Graymore CN, editor. Biochemistry of the retina. New York: Academic Press, p 31-35.
Kuwabara T. 1965. Some aspects of retinal metabolism revealed by histochemistry: Müller cells in the pathological condition. In: Graymore CN, editor. Biochemistry of the retina. New York: Academic Press, p 93-98.
Lim JI, Fine SL, Kues HA, Johnson MA. 1993. Visual abnor- malities associated with high-energy microwave exposure. Retina 13:230-233.
Livingston A, Waterman AE. 1978. The development of tolerance to ketamine in rats and the significance of hepatic metabolism. Br J Pharmacol 64:63-69.
Lu S-T, DeAngelis ML, Gambrill CS. 1993. Ocular microwave thermometric dosimetry and thermometry in the rabbit. In: Blank M, editor. Electricity and magnetism in biology and medicine. San Francisco: San Francisco Press, Inc. p 675-678.
Marmor MF, Zrenner E. 1995. Standard for clinical electroretino- graphy (1994 update). Doc Ophthalmol 89:199-210.
Massof R, Wu L, Finkelstein D, Perry C, Starr SJ, Johnson MA. 1984. Properties of electroretinographic intensity-response functions in retinitis pigmentosa. Doc Ophthalmol 57: 279-296.
Michaelson SM, Lin JC. 1987. Cataract and other ocular effects. In: Biological effects and health implications of radio- frequency radiation. New York: Plenum Press, p 183-197.
Mizuno K, Sato K. 1975. Reassessment of histochemistry of retinal glycogen. Exp Eye Res 21:489-497.
Naka KI, Rushton WAH. 1966. S-potentials from colour units in the retina offish (Cyprindae). J Physiol 185:536-555.
Nakagawa T, Kurasaki S, Masuda T, Ukai K, Kubo S, Kadono H. 1988. Effects of some psychotropic drags on the b-wave of the electroretinogram in isolated rabbit retina. Japan J Pharmacol 46:97-100.
Nichols CW, Lambertsen CJ. 1969. Effects of high oxygen pressures on the eye. N Engl J Med 281:25-30.
Noell WK. 1958. Differentiation, metabolic organization, and viability of the visual cell. AMA Arch Ophthalmol 60: 702-733.
Olivier P, Jolicoeur FB, Lafond G, Dramheller A, Brunette JR. 1987. Effects of retinal dopamine depletion on the rabbit electroretinogram. Doc Ophthalmol 66:359-371.
Paulsson LE, Hamneius Y, Hasson HA, Sjostrand J. 1979. Retinal damage experimentally induced by microwave radiation at 55mW/cm2. Acta Ophthalmol 57:183-197.
Peachey NS, Alexander KR, Derlacki DJ, Fishman GA. 1992. Light adaptation and the luminance-response function of the cone electroretinogram. Doc Ophthalmol 79:363-369.
Penn JS, Thum LA. 1989. The rat as an animal model for retino- pathy of prematurity. Prog Clin Biol Res 314:623-642.
Ray DE, Hawgood J. 1977. Influence of systemic factors on hyperbaric oxygen toxicity in the rat visual system. Aviat Space Environ Med 48:1046-1050.
Rosenthal SW, Birenbaum L, Kaplan IT, Metlay W, Snyder WZ, Zaret MM. 1976. Effects of 35 and 107 GHz microwaves on the rabbit eye. In: Johnson CC, and Shore ML, editors. Biological effects of electromagnetic waves. Vol. 1, Rock- ville, MD: Food and Drug Administration, HEW Publ. (FDA)-77-8010.p 110-128.

454 Lu et al.
Schuschereba ST, Friedman HI, DeVenuto F, Beatrice ES. 1983. Tengroth B, Aurell E. 1974. Retinal changes in microwave Morphologic effects on the retina of massive exchange workers. In: Czerski P, Silverman C, Ostrowski K, Suess transfusion with stroma-free hemoglobin solution. Lab ML, Waldeskog B, editors. Biologic effects and health Investigation 48:339-352. hazards of microwave radiation. Warsaw, Poland: Polish
Severns ML, Johnson MA. 1993. The variability of the b-wave of Medical Publishers, p 302-305. the electroretinogram with stimulus luminance. Doc Trevithick JR, Creighton MP, Sanwal M, Brown DO, Bässen Ophthalmol 84:291-299. HI. 1987. Histopathological studies of rabbit cornea
Stewart-DeHaan PJ, Creighton MO, Jacobi JH, Ross WM, Sanwal exposed to millimeter waves. Proc IEEE EMBS Conf 9: M, Guo TC, Guo WW, Trevithick JR. 1983. In vitro studies 695-697. of microwave-induced cataract: separation of field and Wassilewa P, Hockwin O, Korte I. 1976. Glycogen concentration heating effects. Exp Eye Res 36:75-90. changes in retina, vitreous body and other eye tissues caused
Stewart-DeHaan PJ, Creighton MO, Larsen LE, Jacobi JH, Sanwal by disturbances of blood circulation. Albrecht v Graefes M, Baskerville JC, Trevithick JR. 1985. In vitro studies of Arch Klin Exp Ophthal 199:115-120. microwave-induced cataract: reciprocity between exposure Yee KC. 1983. Interaction of RF and MW with the living duration and dose rate for pulsed microwaves. Exp Eye Res systems: research and experience in China. In: Grandolfo 40:1-13. M, Michaelson SM, Rindi A, editors. Biological effects
Sugimoto S, Imawaka M, Kurata K, Kanamaru K, Ito T, Sasaki S, and dosimetry of non-ionizing radiation, radiofrequency Ando T, Saijo T, Sato S. 1996. A procedure for recording and microwave energies. New York: Plenum Press, electroretinogram (ERG) and effect of sodium iodate on p 501-530. ERG in mice. Japan J Toxicol Sei 21(suppl.):15-32.

BIOLOGICAL EFFECTS OF HIGH PEAK POWER RADIO FREQUENCY PULSES
Shin-Tsu Lu and John O. de Lorge
McKessonHBOC BioServices U.S. Army Medical Research Detachment Microwave Bioeflects Branch Brooks Air Force Base, TX 78235
INTRODUCTION
During the early years of research on the potential hazards of Radio Frequency (RF) radiation, scientists have considered the possibility that a pulsed RF field could produce effects other than those produced by continuous-wave (CW) radiation at the same average power. Recent developments in high peak power pulsed microwave systems have rekindled interest in exploring potential biological effects of high peak power radiofrequency pulses. Systems capable
of delivering 100 gigawatt (GW) pulses to a transmitting antenna and establishing hundreds of kV/m peak E-field intensity in the beam path are known to exist [Agee et al. 1995]. Safety aspects of high peak power, ultra-short electromagnetic signals have been questioned [Albanese et al 1994] and debated [Merritt et al 1995, Adair 1995]. Postow and Swicord [1996] concluded that pulsed microwaves produced by radar transmitters could not cause biological
effects other than those caused by exposure to continuous wave (CW) radiation at the same average power density of the pulsed microwaves. Apparently, their conclusion should not be generalized to include the specific and replicable auditory effects of microwave pulses. Lin [1989] found that few protection guidelines and exposure standards published by various organizations have established limits to guard against potential hazards of pulsed RF radiation. Studies on comparisons of biological effects between high peak power but low average pulsed RF radiation and CW radiation of equal average intensity (absorption) are sparse. As a result, existing personnel protection guidelines for high peak power pulsed radiofrequency radiation have often been based on guess work with many uncertainties. This lack of an adequate or appropriate biological database for pulsed KF has recently been recognized by at least one standards' setting group, ICNIRP PCNIRP 1998].
The majority of contemporary personal protection guidelines utilize frequency dependent time-averaged permissible exposure intensities derived from a time-averaged specific absorption rate (SAR). For RF pulses, time averaging involves integration of individual pulses (peak power
Advances in Electromagnetic Fields in Living Systems, Vol. 3 Edited by J.C. Lin, Kluwer Academic/Plenum Publishers, 2000 207

density, pulse width, rise time, fall time, waveform, power spectrum) and modulation characteristics (repetition rate of pulse train or bursts of pulse train). For simplicity, a time- average intensity of square wave modulated RF pulses is the product of peak power density and duty factor, the ratio of pulse duration to the pulse period of a periodic pulse train (equal to the product of pulse width and pulse repetition rate). Therefore, peak power density can increase inversely with duty cycle or pulse duration and pulse repetition rate. To prevent unintentionally high exposure and to preclude high specific absorption (SA) for decreasingly shorter pulse durations of RF pulses, peak power limits are needed. Due to uncertainties, various organizations approach the issue of peak power limits for RF guidelines differently. For example, the Czechoslovakian government lowers the time averaged power density of pulsed microwaves by a factor of 2.5 from that of the CW microwave [reviewed by Michaelson and Lin 1987]. More recently. IEEE [IEEE 1999] recommended the reduction of the time averaged maximum permissible exposure (MPE) by a factor of 5 under pulsed conditions when pulse duration is less than 100 ms. In addition, IEEE also recommended a 100 kV/m peak electric field intensity limit (-26.5 MW/m2 or 2.65 MW/cm'). ICNIRP [ICNIRP 1998] recommended lowering the MPE by a factor of 2 for pulsed microwaves. Additionally, ICNIRP further recommended SA limits of 10 and 2 mJ kg'1 for occupational and general public to prevent the occurrence of a microwave-induced auditory effect. Pulsed RF may cause a specific biological effect, or it may cause enhancement, attenuation, or no modification at all of the biological effect caused by CW KF at an equal average SAR. Knowledge of specific and syncrgistie effects (positive, negative, or none) of pulse modulation are needed for a valid evaluation of the MPE modifier used m RF pulses.
Analysis of biological effects and health implications of high peak power RF pulses is further complicated by the method of generating RF pulses. Conventional radar is operated in a narrow band mode in which fractional bandwidth is less than 1% of the center (carrier) frequency. Recent development of Ultra-Wide-Band (UWB) radar has increased the fractional bandwidth to more than 25% [Taylor 1995]. The UWB radar has also been described as carrierless radar. As the name implies, a center frequency is not found. In this type of radar, risetime and duration of the puke determine the highest and median frequency [Foster 1995]. The lowest frequency of a UWB pulse is determined by the cutoff frequency of the transmitting antenna. With risetime in 100-300 picoseconds (ps) range and pulse duration in one to several nanoseconds (ns) range, the frequency spectrum (90 or 99% of the pulse energy) of the Fourier transform of a radiating UWB pulse can span continuously from megahertz (MHz) to gigahertz (GHz) (Fig. 1). This type of RF pulse contains a broad spectrum of frequencies such that the interaction with tissue would be expected to be similar to that of both high- and low-frequency narrow band RF. In essence, analyses of biological effects involves the process of synthesizing these combined effects due to multiple frequency exposure and assigning a weighing factor to each individual frequency component. The electromagnetic pulse (EMP) produced by nuclear detonation possesses a similar problem as a carrierless pulse with a risetime of 10 to 100 ns and pulse width of 400 ns to a few microseconds (us) range [Lin 1975]. The EMP produced by a lightening discharge typically has a duration of peak current from 10 to 100 n&. The synthesizing procedure for evaluation can be rather tedious, time consuming and full of uncertainties. In addition, biological effects of multi-frequency exposure are virtually unexplored. Another approach to the subject of biological effects of carrierless RF pulses is to extrapolate from the results of animal experimentation with these pulses. The latter evaluation procedure will be the
208

focus of the present review in dealing with the topic of biological effects of high peak power carricrless pulses.
100
90
"g OO ">■ 70
60
50
G3 40
£ so —i 20 UJ u. io
-IO
:' .... 1.... 1 i
; -A.— — 1 ; \ I — J
: \ """ 1 \ j
\ \ j : \ :
: -I
\ A 1 : : * 1 *AJ *\ i „. .— A t a* I I V \ / ^-1 : I _y,
Ol 23456780 10
TIME <ns)
,„• _!
«n— * IO r- DC UJ
S io r-
^ io- ]
!
L UJ tO r- ^ 1 ^
to > !
IO + T ■
io' IO* IO*
FREQUENCY (MHz)
Figure 1. Typical unipolar UWD pulse and its relative power cpectrum by a spark gap generator.
BIOLOGICAL EFFECTS CAUSED BY A SINGLE PULSE
One misconception in studies of the biological effects caused by high peak-power RF pulses is to equate high peak power to high average power because the same power unit (W) and the resultant SAR unit (W/kg) are used in both cases. As indicated previously, high peak-power RF pulses can have a low average SAR if the duty factor is low. Another fundamental issue to address is to decide which of the following independent parameters, SAR or SA, is the most appropriate predictor of biological effects.
Drastic Biological Effects Caused by a Single Pulse of High Energy Deposition
The biological effects of a single pulse of high energy deposition can be very drastic. An example was the use of high power microwaves for brain enzyme denaturation in the analysis of neurotransmitters. The energy depositions used were as high as 57,000 J/kg in 2.8 s for rats (-20,500 W/kg for 2.8 s) [Lenox etal. 1977] or 200,000 J/kg in 0.35 to 1.4 s for mice (between 140,000 to 575,000 W/kg) [Schneider et at. 1982]. The brain temperatures reached as high as
209

80 °C. These research procedures were designed to achieve enzyme denaturation in as short a period of time as possible.
The susceptibility of rodents to pulsed microwave induced stun and seizure has been reported. Guy and Chou [1982] noted the threshold for "stun and seizure" (convulsions) in rats by a single 915 MHz pulse. They demonstrated an absorption threshold at 680 J in the brain in less than 0.38 s or equivalent to an energy absorption of 28,000 J/kg. The threshold absorption rate was equal to 73,700 W/kg for 0.38 s. It should be noted that a very high brain temperature (46 °C) was recorded at the threshold for "stun and seizure." The animal began moving again when brain temperature returned to within 1 °C of normal. Histological examination revealed demyelination of neurons one day after exposure and microfocal glial nodules in the brain one month after exposure. Time averaging of this high SAR but short duration threshold is inappropriate because an artificially low SAR can be obtained, i.e., 7.6 W/kg (680 J / 360 S / 0.25
kg). Modak et al. [1981] studied the effect of a 2.45 GHz microwave pulse of 15 or 25 ms
which increased mouse brain temperature by 2 or 4 "C, respectively. They used a tuned waveguide exposure system which delivered 90% of the 7.5 kW transmitted power into the head and 10% into the brain of the mouse. Immediately after exposure, the spontaneous activity of the exposed mouse decreased but began recovering within 5 minutes. The 25 ms pulse also caused a significant decrease in acetylcholine content of the whole brain. These authors suggested that increased membrane permeability could be die mechanism of the observed change in acetylcholine content.
Microwave Evoked Body Movements
Microwave evoked body movements in mice were demonstrated initially by Wachtel et al [1988,1989]. They [Wachtel et cd. 1988] noted similarities between microwave evoked body movements and classical startle reflexes. Startle is a protective response of mammals to an unexpected, sudden and intense visual, auditory, or tactile stimulus [Fleshier 1965]. Brown et al.
Table 1. Evoked body movements in mice by a single microwave pulse
Peak Brain SAR Pulse Duration Brain SA Incidence
(kW/kg) (ms) CM«) (%)
15.36 50 768 30
15.36 100 1,536 68
15.36 200 3,072 78
9.47 200 1,893 76
2.75 800 2,197 78
0.69 3,200 2,211 29 Data from Brown etal [1994],
210

[1994] studied this effect in detail in mice exposed locally (head and neck) to 1.25 GHz microwave pulses ranging from 50 ms to 3.2 s. Results of this study arc shown in Table 1. The effect appeared to be a complex interaction between peak SAR and SA. For pulse durations less than 1 s, the incidence of microwave evoked body movements was dependent on SA instead of peak SAR. Exposure to a single long pulse (3,200 ms) was much less effective in evoking body movements than those caused by shorter pulses. Figure 2 makes it clearly evident that a pulse train (R0 pulses per second, 10 /J& pulse duration, peak brain SAR 1,474 kW/kg, brain SA at 590,
1,180, and 2,360 kJ/kg; and administered between 50 to 200 ms) induced a similar incidence of evoked body movements as those induced by a single pulse. However, the incidence of evoked body movements decreased if the pulse duration was longer than Is (see open symbols in Fig. 2). Thus, the SA dependency of microwave evoked body movements should be modified as: the incidence of microwave evoked body movements was dependent on average SA if exposure
duration was less than Is. In other words, microwave evoked body movements were susceptible to the influence of temporal summation but possessed a very poor temporal resolutioa Part of this complex interaction between SA and SAR appeared to be related to changes in subcutaneous temperature because the incidence of the evoked body movements was a linear function of the temperature increment. A minimum temperature increment (1.2 °C) for evoking body movements in mice for exposures shorter than 1 s was noted by extrapolation The subcutaneous temperature increment which could evoke body movements also appeared to be very narrow. The incidence reached a maximum at a measured temperature increment of 1.66 *C; a total range of less than 0.5 °C.
3 m 3 o cc a.
99
90 > 1 2 3 < in
3 » o
10
LJ o 2 UJ o o 2
shorn pulse train, OO pps. 10 fts. 1.474 kW/kg peak brain SAR single pulse, 153.6, 9.47 or 2.75 kW/kg peak
• ■ □
G 3.2 s long pulse, 0.69 kW/kg peak O 2 s pulse train, 80 pps. 10 as.
147 kW/kg peak ^
0.0 0.5 1.0 1.5 2.0 2.5 3.0
BRAIN SPECIFIC ABSORPTION (kJ/kg) 3.5 4.0
Figure 2. less 1 s.
Comparison between short and long pulses. Solid symbols are data from exposures Open symbols are data from exposures longer than 1 s [Brown et al. 1994].
Raslear et al. [1992] studied the microwave evoked whole-body movements in Long- Evans rats exposed to a single 1 s, 1.25 GHz pulse localized to the head and neck region of the
211

rat in a WR 650 waveguide at graded forward power (40, 80,120, 160 and 200 W). Dosimetry data was not presented but estimated from Seaman et al [1992]. Peak brain SARs were 800, 1,600, 2,400, 3,200, and 4,000 W/kg and brain SAs were 800,1,600, 2,400, 3,200, and 4,000 J/kg. They noted that the incidence of evoked body movements increased with power applied to the waveguide exposure system. In addition, a significant increase in the incidence of evoked body movements (15 %) was observed at a subcutaneous temperature increase as low as 0.2 °C and grew with higher temperature increases (40 % at 0.33 °C, and 80 % at 0.65 °C), It appeared
that evoked body movements required a lower subcutaneous temperature increment in rats than in mice (1.2 to 1.7 °C from 0 to 100 % incidence). Physically, rats have a much larger head and neck surface area than that of mice. Spatial summation of subcutaneous temperature increment may be the key to the species difference in sensitivity to microwave evoked body movements. No reliable difference in deafened rats and normal rats exposed to similar power levels was observed. Therefore, the findings indicated that an associated microwave acoustic effect was probably not the underlying mechanism for microwave evoked body movements.
A pharmacological characterization of the microwave-evoked whole-body movements in rats was performed by Akyel et al [1993a]. A 1.25 GHz, 120 W pulse for 1 s was delivered to the head and neck region of the rat as in the previous experiment [Raslear et al. 1992]. This pulse was to evoke a 50 % movement incidence in the vehicle injected animals. Eleven drugs were used: pilocarpine, atropin, clonidine, desipramine, /7-choloramphetamine, buspirone, morphine, naloxone, d-amphetamine, pimoxine and diazepam. The movement incidence rates (50%) occurred as expected, and only atropin and clonidine injected rats failed to display microwave- evoked whole-body movement. It was concluded that a microwave-evoked whole-body movement was quite different from the neuropharmacology of a classical startle response since atropin should produce a slight increase in the startle response while clonidine depresses it [Davis 1980].
Startle Modification
Startle can be modified by a pre-pulse, a preceding brief sensory but not startle-evoking stimulus, that is acoustic, tactile or photic in nature. The ability of a microwave pulse to serve as a startle modifier was studied by Seaman et al. [1992,1993,1994]. The identical 1.25 GHz pulsed exposure system used by Raslear et al. [1992] provided the pulse. Two different microwave pre-pulses, approximately of 1 us pulse duration, 15.0-30.0 kW/kg (16.0-44.2 mJ/kg) and 35.0-86.0 kW/kg (66.6-141.8 mJ/kg) were delivered 201,101, 51,3 and 1 ms before and 1 ms after the startle eliciting acoustic stimulus (94 dB SPL, sound power level), or a 7.82 us microwave pre-pulse at 55.9-113.3 kW/kg (525.0-1,055.7 mJ/kg) at 157, 107, 57, and 7 ms before and 43 ms after the eliciting startle air burst (tactile stimulus). The lower intensity microwave pre-pulse (16.0 to 44.2 mJ/kg) could not modify the acoustic startle amplitude or latency. However, acoustic startle amplitude was reduced by the higher microwave pre-pulses (66.6-141.8 mJ/kg) at 51,101 and 201 ms, and enhanced by higher microwave pre-pulse at 1 ms lead time. Acoustic startle latency was also delayed by the higher intensity microwave pre-pulses at 51 and 201 ms lead times. The effect of the highest microwave pre-pulse (525.0-1,055.7 mJ/kg) was not as clear cut in modification of the tactile startle amplitude because the amplitude reduction was observed at a 57 ms lead time only. On the other hand, the latency of the tactile response was delayed when microwave pre-pulses were administered at 7, 57, 107, and 157 ms lead times. It is apparent that the heating potential of these microwave pre-pulses was negligible
212

(<]0~3 °C). Nevertheless, they were adequate to elicit modification of ongoing reflexes with a threshold SA higher than the threshold SA that can induce microwave hearing.
Thermal Sensation
Thermal sensation and thermal pain are other biological responses which can be used to elucidate the nature of biological effects of high power RF. Excellent reviews were made by Stevens [1983] on comparative warmth sensation elicited by infrared and microwave radiation and by Michaelson and Lin [1987a] on thermal sensation and pain elicited by microwave exposure. In contrast to infrared illumination which has a short onset and offset latency (abrupt onset and extinction of the sensation), microwave illumination induced a warm sensation that appeared to have a relative long onset latency (3.5 to 6 s) and long offset time (15 s or more), described as a kind of "afterglow" [Justesen etal. 1982]. The former reviews report that above the threshold, intensity of warmth sensation increases with power density of either radiations. The three most important variables governing the threshold power density are skin location, size of exposure area and duration of exposure. Each variable contributes differently to the threshold power density depending on the level of warmth perception. At a barely perceptible level, threshold power density is inversely proportional to the area of exposure (spatial summation). The area size of the spatial summation may be as large as 60 cm3 or more. It also depends on the location of skin exposure. The forehead is the most sensitive of the areas tested, followed by locations on the torso and extremities. The difference in skin location sensitivity becomes less with increasing levels of warmth sensation. Sensitivity (threshold power density) of warmth sensation is also inversely proportional to the duration of exposure (temporal summation), i.e., the longer the exposure duration, the lower the threshold. At a barely perceptible level, the threshold power density becomes asymptotic when the exposure duration is longer than a critical value. The critical period for an asymptotic threshold appears to be 1 s for infrared radiation [Stevens 1983] and 3 s for 3 GHz microwave radiation [Eijkman and Vendrik 1961]. A summary of microwave-induced warmth sensation thresholds is included in Table 2. In addition to location, area, duration, frequency, and power density, the penetration depth is also an important variable in determining the Üireshold [Blick et cd. 1997]. The threshold can vary more than an order of magnitude (14 fold difference) as shown in Table 2.
The salient feature of human warmth sensation is that the cutaneous temperature increase at the threshold is less than 0.1 * C. On the other hand thermal pain is elicited by a high cutaneous temperature (45-46 °C) [Michaelson and Lin 1987a]. Irrespective of type of radiation, either infrared or microwave, human warmth sensation has a relatively low threshold for the rate of temperature change (0.0005 to 0.002 °C/s) across the cutaneous thermoreceptor located approximately 150 to 200 //m below the skin surface. The rate of temperature change in human warmth sensation (0.0005 to 0.002 °C/s, 4 fold difference) for I to 10 s exposure time corresponds to 1.7 and 7.0 W/kg average SAR if a specific heat, 0.83 kcal per kg per °C, is assumed for the skin.
Auditory Effect (Microwave Hearing)
Frey [1961] was the first to study systematically the human auditory response to pulsed microwaves. Guy et al [1975] concluded that one of the most widely observed and accepted biological effects of low average power electromagnetic energy is the auditory sensation evoked
213

in man by pulsed microwaves. The effect appears as an audible clicking, buzzing or chirping sensation originating from within and near the back of the head and corresponding in frequency to the recurrence rate of the microwave pulses. This effect has been the subject of several reviews
Table 2. Thresholds for microwave-elicited human cutaneous warmth sensation
Frequency Exposure Skin Location Threshold Increase in Skin (GHz) Duration (s) and Size (cm2) (mW/cm2) Temperature ("Q
2.45 10 Forearm, 107.2 26.7 + 7.3 (6) —
2.45 10 Back, 377 63.1 ± 6.7(15) 0.054*
3.0 1 Forehead, 37 58.6 0.025
3.0 2 Forehead, 37 46.0 0.040
3.0 4 Forehead, 37 33.5 0.060
7.5 10 Back, 377 19.5 + 2.9(15) 0.049*
10.0 1 Forehead, 37 21 0.025
10.0 2 Forehead, 37 16.7 0.040
10.0 4 Forehead, 37 12.6 0.060
10.0 10 Back, 377 19.6 ±2.9 (15) 0.073*
35.0 10 Back, 377 8.8 ± 1.3 (15) 0.078*
94.0 10 Back, 377 4.5 ± 0.6 (15) 0.071* Data shown ate mean ± S£. (no. of subjects) from Hendler [1968], Hendler et al. [1963], Justesen etal. [1982], and Blickefat[1997]."*" indicates data calculated by Riu et al [1997].
[Chou et cd. 1982a, Lin 1978, 1980,1990, NCKP 1986]. Foster and Finch [1974] showed both theoretically and experimentally in a physiological solution that microwave pulses could produce significant acoustic energy by thermal expansion from 5 * 10"6 °C temperature rise in the solution from absorption of microwave pulses. It is generally accepted that the pulsed microwave- induced audible sound is generated by a thermoelastic expansion of cranial tissue [Lin 1976, 1976a, 1976b, 1976c, 1977, Lin etal. 1975] that launches an acoustic wave which is detected by hair cells in the cochlea. Essentially identical electrical activities elicited by microwave and acoustic pulses were recorded in the auditory pathway of cats and guinea pigs at the primary auditory cortex [Taylor and Ashleman 1974, Chou et al. 1976], the medial geniculate nucleus [Taylor and Ashleman 1974, Guy el al. 1975, Lin et al. 1979, 1982], the inferior colliculus nucleus [Cain and Rissman 1978, Lin et al. 1979], the lateral lemniscus nucleus [Lin et al. 1979, 1982], the superior olivary nucleus [Lin et al. 1979,1982] and the eighth cranial nerve [Taylor and Ashleman 1974]. In addition, brainstem potential and cochlear microphonics evoked by microwave pulses were comparable to those evoked by acoustic pulses [Lin et al. 1979,1982, Chou et al. 1975, 1976].
Taylor and Ashleman [1974] demonstrated the dependency of the microwave-induced
214

auditory effect on cochlea in cats by measuring the electrical responses in the eighth cranial nerve, the medial geniculate nucleus, and the primary auditory cortex to both acoustic and 2.45 GHz microwave pulses. They concluded that evoked electrical responses were similar between acoustic and microwave pulses. Furthermore, cochlear destruction, i.e., perforation of round window and aspiration of perilymph, resulted in abolishment of evoked electrical potential from acoustic and microwave pulses. Chou etal. [1975] recorded the sonic oscillations at 50 kHz from the round window of guinea pigs during pulsed 918 MHz irradiation. The oscillations promptly followed the onset of pulsed radiation, preceded the nerve response and disappeared after death. It is therefore reasonable to conclude that the pulsed microwave induced auditory effect is a cochlear response to acoustic signals that are generated in the head by pulsed microwaves.
For pulsed microwaves with durations shorter than 30 us, the microwave-induced auditory threshold was independent of temporal peak power density (or temporal peak specific absorption rate) and was entirely dependent on the energy density of the microwave pulse or specific absorption (SA) per pulse [Chou et al. 1982a, Lin 1978,1980,1990, NCRP 1986]. The auditory threshold SA per pulse has been determined in human volunteers (16 mJ/kg), cat (10 to 12 mJ/kg) [Guy et al. 1975], cat (4 mJ/kg) [Lebovitz and Seaman 1977] and rats (0.9 to 1.8 mJ/kg whole-body averaged SA) [Chou et al. 1982a]. The hearing potential of these pulses at these auditory thresholds was on the order of 10"* °C. It is the most sensitive biological effect induced by microwave radiation. For microwaves with pulse durations longer than 50 us, the auditory threshold is dependent on peak SAR. Microwave-induced pressure waves, their fundamental frequency, and propagation have been characterized in mammalian brain and models with a hydrophone [Olsen and Lin 1981, 1983, Lin etal. 1988]. A near identical result between prediction by the thermoelastic theory and hydrophone data further strengthens this explanation of the basic mechanism of microwave-induced auditory sensation. These studies also pointed out that a pressure wave could be created by a single microwave pulse within the cranial structure.
One of the consequences of the microwave acoustic effect could be annoyance. Annoyance caused by pulsed microwaves was not explicitly demonstrated in humans or animals. Indirect evidence of avoidance has been presented by some investigators [Frey et al. 1975, Frey and Field 1975, Johnson et al. 1976, Hjeresen et al. 1978]. However, the avoidance resulted from exposure to multiple pulses. Critical pulse repetition rate and duration of exposure needed to elicit an avoidance behavior have not been explored.
Lin [1989] proposed that this thermoelastic induced pressure wave could be one of the important mechanisms responsible for pulse modulated RF interactions with biological systems. He has calculated the peak pressure and displacement in various spherical head models irradiated with 10 us rectangular microwave pulses (Table 3). The isolated rat lens was found to displace by 10 nm when irradiated with a 10 us, 300 J/m2 microwave pulse [Brown and Wyeth 1983]. Substantial displacement and pressure (10 nm, 170 N/m2) could develop within the cranial structure if the peak power density reaches 5 MW/m2. Considerable damage to cell membrane and cytoplasm could occur by mechanical stress. Some supporting evidence (in vitro lenticular damage by multiple pulses) has been provided by a group of investigators [Stewart-DeHaan er al. 1983; 1985; Creightonetal. 1987].
Miscellaneous Effects Caused by a Single Electromagnetic Pulse
Hirsh et al. [1968] exposed trained rats to an electromagnetic pulse (EMP) and studied their ability to run a maze during and after EMP exposure. The EMP pulse used was 600 kV/m,
215

3 ns duration. "Startle" was noted to be associated with the EMP pulse and the ability of animals to run the maze was compromised. Recovery began 10 minutes after exposure and was nearly complete in 30 minutes after exposure. It was concluded that the animal's decision maldng strategy had been disturbed in some way, because there frequently was a hesitation at each point in the maze structure where a decision was required as to whether a left or right turn should be taken. The observation was interpreted as evidence of a slowing of mental processes and psychomotor reactions Although Hirsh e.t al. [1968] indicated that the EMP pulses were not accompanied by any auditory or visual phenomena which could act as stimuli, one cannot dismiss that the animals may have been disturbed by the auditory stimulus associated with the EMP pulse. Akyel and Kaslear [1993] observed characteristic ear "twitches" in rats associated with a 70 kV/m EMP pulse. Because ear "twitches" developed regardless of the animal's position in the EMP field, it was suggested that this ear response was caused by the very brief, high pitch sound generated by the discharge of capacitors in the power supply. Sounds produced by capacitor discharge could be heard by investigators in the shielded room which housed the EMP simulator.
Table 3. Peak pressure and displacement in spherical head model irradiated with 10 us rectangular microwave pulses at a peak absorption rate of 1 kW/kg
Sphere Microwave Incident Radius Frequency Pressure Displacement Power (mm) (MIIZ) Species (N/m2) (lO^nm) (WAn*)
20 2450 guinea pig 0.408 2.16 4,450
30 2450 cat, monkey 0.369 1.51 5,890
50 918 human-infant 0.961 9.34 12,820
70 918 human-adult 0.682 3.97 21,830 Data adapted from Lin [1989].
COMPARISON OF BIOLOGICAL EFFECTS CAUSED BY MULTIPLE HIGH PEAK POWER RF PULSES AND CWBFOF EQUIVALENT AVERAGE ABSORPTION
Because of the availability of dedicated and specifically designed RF exposure facilities for studying biological effects of RF radiation, a majority of studies utilized either CW or pulse modulated RF. Few exposure facilities provide the flexibility to change pulse characteristics such as peak power, pulse duration and pulse repetition rate and quantitatively examine associated
biological changes. In contrast to several proposed physical mechanisms in explaining biological effects of sinusoidal modulated [Postow and Swicord 1996] or of carrierless RF, a general lack of physical mechanisms was proposed to explain the difference in biological effects caused by CW and pulsed RF. The exception to the above statement is a proposed thermoelastic or thermomechanical effect associated with pulse modulation. Neshev and Kirilova [1996] described a theoretical model which indicated pulse-modulated microwaves could potentially influence the conformational oscillations of enzymes in living organisms and produce effects at extremely low power levels. This hypothesis is still to be proven. Considering equipment and theoretical
216

difficulties, this section evaluates only studies designed to compare the biological effects caused by CW and pulsed KF of equal averaged SAR. However, some studies of historical importance will also be included even if a CW counterpart was not studied.
Behavioral Effects
A hehavior study [deLorge 1984] involving rhesus monkeys exposed at near resonant (225 MHz, CW) and supra-resonant frequencies (1.3 GHz and 5.8 GHz) showed that the performance of monkeys trained to press levers in an observing-response paradigm for food was impaired at different threshold intensities for different frequencies. The time averaged threshold intensities were81 W/m2(whole-body averageSAR= 3.24 W/kg)for 225 MHz, 570 W/m2 (7.41 W/kg)for 1.3 GHz and 1400 W/m2 (4.3 W/kg) for 5.8 GHz. These threshold intensities were associated with reliable increases in colonic temperature in the range of 1 °C above the sham exposure level. The peak intensities were 81 W/m2 (CW) for the 225 MHz, 518 kW/nf for the 1.3 GHz (370 pps, 3 us), and 1.06 MW/m1 for the 5.8 GHz (662 pps, 2 us).
Thomas etal. [1975] compared 30 minute exposure of 50 to 200 W/m2 CW and pulsed 2.86 GHz microwaves on post-exposure performance of rats trained under a multiple fixed-ratio (FR), differential reinforcement of low rate (DRL) operant schedule. The pulses used were 1 /« pulse duration, 500 pps and a duty factor of 2.5 * 10"4. Instead of absolute response rate, change in behavioral performance was expressed as percentage relative to the performance rate during the preceding sham exposure within each individual rat. They found that the dose-response relationships of behavior endpoints were biphasic or multiphasic in nature. They noted that 200 W/m2 pulsed microwave (800 kW/m2 peak) significantly increased response rate, approximately by 40% during the DRL portion of the behavior. In addition, a marked increase in the proportion of shorter inter-response times was noted during the DRL portion of behavior when rats were exposed to 100 and 200 W/m2 (400 and 800 kW/n? peak). In conjunction with the DRL changes, FR response rates were lower than those observed after sham exposure irrespective of types of exposures. The largest effect (10% of the control) was found for the 200 W/m2 pulsed exposure. Differences between CW and pulsed microwaves on FR performance were not apparent at other doses. Thomas et al [1975] consider the most robust effect was the increased number of time-out responses after exposures. While the number of time-out responses of 50 W/m2 pulsed microwave was within control range, increased time-out responding was increased after the 50 W/m2 CW exposure sessions. Increased time-out responding was found after 100 and 150 W/m2 CW and pulsed exposures and the effects of pulsed exposures was larger in both cases. On the other hand, time-out responding was lower than control in pulsed 200 W/m2. However, time-out responding during CW 200 W/m2 exposure was not evaluated. Because of biphasic and multi-phasic response curves, competing events with different dose-response characteristics could be assumed. However, the value of this report was somewhat diminished because the variation of each data point was not included in this report.
Thomas et al. [1982] trained rats under a differential-reinforcement of low rate paradigm
and compared the efficacy of the CW and pulsed 2.8 GHz microwaves on the number of appropriate responses between 8-12 s of inter-response time (HIT) during each behavior session. A fixed pulse duration (2 fzs), pulse repetition rate (500 pps) and duty factor (10"s) were used for pulsed microwaves. Thirty minute exposures of sham, CW and pulsed microwaves at 10, 50, 100, and 150 W/m2 were used. For pulsed microwaves, the corresponding peak power densities were 10, 50, 100, and 150 kW/m2 Rats were exposed at weekly intervals, 2 to 3 times to a mixed
217

schedule of sham, CW and pulsed conditions. Within individual comparisons were made. They found the rate of emission of appropriately timed responses declined after exposure to pulsed microwaves at 100 and 150 W/m2, whereas similar exposure to the CW microwaves did not produce consistent effects. They further noted that the overall responses, regardless of correct or incorrect responses, were not reduced as a result of microwave exposure. It was concluded that the rat's ability to respond was not impaired, but rather that its ability to discriminate the appropriate IRT interval was disrupted.
Lebovitz [1983] compared the effects of CW and pulsed 1.3 GHz microwaves at two different levels (5.9 W/kg for CW, 6.7 W/kg for pulsed, and 3.6 W/kg for both CW and pulsed) on the performance of rats trained on a multi-component (fixed-ratio, timeout, FK25 TO10) operant task during exposure. The pulse characteristics were 1 /is pulse duration, 600 pps and 6 x 10** duty cycle. A circularly polarized waveguide exposure system was used. Duration of exposure was 3 hours. The results indicated that CW (5.9 W/kg) and pulsed (6.7 W/kg) microwaves were equally effective in reducing response rates during both the fixed-ratio and the timeout component of the operant task. At 3.6 W/kg the mean rates of fixed-ratio responding were unchanged, whereas the rates of responding during timeout were reduced significantly. Again, CW and pulsed microwaves yielded essentially equivalent results. The conclusion from this report was derived from the actual behavioral data from 14 to 15 animals in each treatment group. The author further commented that sensitivity of the operant behavior to microwave suppression was inversely related to the robustness of the operant behavior. Behavior on the FR schedule was relatively unaffected while behavior during the TO portion seemed to be more susceptable to microwave exposure.
D'Andrea et al. [1994] compared the effects of two microwave pulses on the behavioral performance of monkeys. The behavioral task was a complex schedule composed of a variable interval schedule (VI 25 s) on one lover and a color discrimination task on the other lever for food. The pulsed microwaves were 5.62-GHz operated at 100 pps generated by a radar unit (2.8 ßs pulse duration, 2.8 x if/4 duty factor) and by the radar unit whose output was amplified by a Stanford Linear Energy Doubler (SLED) (50 ns pulse duration, 5 x 10"7 duty factor) which enhanced peak power by a factor of nine by adding a high power pulse to the radar pulse. Sham exposure and three whole-body average SARs (2, A and 6 W/kg) were used. To achieve these doses, peak power densities were 0.56,1.28 and 2.77 kW/m2 for radar pulses and 5.18,12.70 and 25.2 kW/mi2 for the SLED pulses. The duration of exposure was 20 minutes. Compared to sham exposures, significant alterations of lever responding, reaction time, and earned food pellets occurred during microwave exposure at 4 and 6 W/kg but not at 2 W/kg. There were no differences between radar or SLED. These results complimented the earlier finding in de Lorge's [1984] study of the behavioral threshold in monkeys exposed to 5.8 GHz pulsed microwaves. Furthermore, it was concluded that high peak power microwaves did not possess a unique hazard at peak field intensity near the 100 kV/m (-26.5 MW/m2). The incident pulse energy of these pulses (1.56 to 7.76 mJ/m2) was higher than the threshold for microwave hearing (20-400 jzJ/m2) [Lin 1980, 1990, Chou etal. 1982a], hence, an acoustic effect could be expected. Because of equal pulse energies between radar and SLED pulses, differences in microwave acoustic effects do not seem to have occurred.
That microwave pulses can serve as a discrimination cue in behavioral situations is supported by works of several investigators [Frey et al. 1975, Frey and Field 1975, Johnson et al. 1976, Hjeresen et al. 1978]. Johnson et al. [1976] trained rats to nose poke for food pellets on an FR5 schedule in the presence of an 7.5 kHz acoustic cue (10 pps, 3 us). When a 918 MHz
218

microwave signal (150 W/m2 average, 10 pps, 10 ps, 1.5 MW/m2 peak power density) was used to substitute for the acoustic cue or administered during an extinction period (no acoustic cue was given), the response rate of the animals was similar to that during the period when the acoustic cue was present. Frey et al. [1975] used a shuttle box with shielded and unshielded sides and studied the amount of time that rats spent in each side of the shuttle box. A 1.2 GHz microwave was presented as CW (24 W/m2, 2.2 W/kg whole-body averaged SAR) or pulsed (10 W/m2
average, 1 W/kg whole-body averaged SAR, 21 W/m2 peak, 1,000 pps, 0.5 ms pulse duration). During.the last 2 of 4 successive daily 30 min exposures, rats exposed to pulse modulated microwaves spent less time (30 %) in an unshielded side of the shuttle box than the CW exposed rats (64 %) spent in the unshielded side. Frey and Feld [1975] also noted similar preferences (29% in the unshielded side of the shutde box) in rats exposed to 1.2 GHz pulsed (100 pps, 3 ps) microwaves at two levels (4 W/m2 average, 1.33 kW/m2 peak; 9 W/m2 average, 3 kW/m2 peak). Sham exposed rats spent 57 % of their time in the unshielded side of the shuttle box. Hjeresen etal. [1978] used a more sophisticated paradigm to eliminate the original side preference. The microwave pulses used were 2.88 GHz pulsed microwaves (95 W/m2 average, 330 W/m2 peak, 100 pps, 2.3 ps). They found a similarity between microwave pulses and conventional auditory cues in motivating side preference. These results and the absence of side preference when broadband noise was administered along with microwave pulses, led to the conclusion that an auditory stimulus perceived during pulsed microwave exposure was capable of mediating the preference response.
Ocular Effects A series of experiments was performed using isolated rat lenses exposed in vitro to 918
MHz pulsed microwaves (peak absorption rate= 480,000 W/kg, 10 ^s pulse width, and various repetition rates) for 5 to 6 minutes [Stewart-DeHaan etal. 1983; 1985; Creighton et al. 1987]. A very high perfusion rate (1,600 ml/min) was used to prevent excessive heating (<0.65 °C). An absolute threshold for inducing holes in lens übers at 231 W/kg average SAR for a 6 min exposure was estimated in these studies. It was suggested that the lenticular damage could be due to thermoelastic expansion and the result of pressures based on the observation that large globules formed in the exposed lens were not normally seen except at elevated temperatures of 47 and 50 °C in lens in vitro. CW was less effective in inducing lenticular injury than pulsed microwaves.
Birenbaume/a/. [1969] compared the effectiveness of the CW and pulsed (0.5 ßs pulse duration, and 0.001 duty factor, i.e., 2,000 pps) 5.8 GHz microwaves on the production of lenticular opacity (cataract) in anesthetized rabbits. One eye was exposed while the other served as control. A dielectric loaded waveguide with 1.27 cm diameter aperture was used as a contact applicator. Supra-threshold power densities for cataract formation were selected. Averaged aperture power density was 4.34 to 7.89 kW/m2 (4.34 to 7.89 MW/m2 peak aperture power density) for pulsed microwave and 4.73 to 7.89 kW/m2 for CW microwave. Duration of exposure range from 1.5 to 90 minutes. One hundred rabbits were used for each of the two exposure protocols. The endpoint was cataract formation one month after exposure. The incidence of cataract formation was found to be an inverse relation between aperture power density and duration of exposure. ED50 (50% effective dose) of the aperture power density and duration of exposure from each exposure protocol was constructed and compared. It was concluded that a
difference in effectiveness of CW and pulsed microwaves in inducing cataract was not found. Acute inflammatory reactions of the cornea, conjunctiva, iris, and/or ciliary body were observed in many eyes and probably produced in every exposed rabbit eye. No comparison for these acute
219

ocular inflammatory reactions was made between pulsed and CW exposures. An assessment of injury to rabbit corneas in vivo induced by high peak-power 35 GHz
microwaves (156 kW/m2 peak power density, 21.8 kW/kg peak SAR, 10 to 20/*s pulse width, variable repetition rate, 15 min exposure) was performed by Trevithick et al. [1987]. Light microscope and scanning electron microscope were used to evaluate the cornea morphology. They found that cornea damage was dependent on average SAR. The threshold for a single cell destruction was approximately at 33 W/kg. Furthermore, the area of involvement enlarged as the average SAR increased until large areas of many cells were completely destroyed at 550 W/kg. However, a CW counterpart was not performed. Kues et cd. [1985] observed comeal endothelial abnormalities in anesthetized cynomolgus monkeys exposed to CW and pulsed 2.45 GHz microwaves. They concluded that pulsed microwaves (100 W/m2 or 2.6 W/kg average, 1 kW/m2
peak, 100 pps, 10 us) were 2 to 3 times more effective than CW (200 to 300 W/m2) in inducing corneal endothelial abnormalities. This conclusion was derived after a variable number of 4 hour exposures, a variable number of examinations, and repetitive use of ketamine and halothane. There were no attempts by other investigators to verify this pulse enhancement effect.
Cardiovascular Effects
Pressman and Levitina [1963] compared the effects of 2.4 GHz CW (70-120 W/m2) and pulsed 3 GHz; microwaves (30-50 W/m2 average, 43-71 kW/m2, 1 jus pulse duration, 700 pps, 7 x 10"4 duty factor) on the heart rate of rabbits. They administered the incident fields from dorsal and ventral surfaces onto 6 different configurations: entire dorsal surface, dorsal back surface, dorsal head surface, entire ventral surface, ventral stomach surface and ventral head surface. A coefficient of chronotropic effect (K) was defined by % of cases showing acceleration (A) and slowing (S) by K - (100 + A) / (100 + S). Positive chronotropic effect (accelerated heart rate) was defined as K > 1, negative chronotropic effect (slowing of the heart rate) as K < 1, and no effect as K = 1. They concluded that dorsal exposure led to a positive chronotropic effect while ventral exposure led to a negative chronotropic effect. For dorsal exposure, the magnitude of K was higher in pulsed exposed animals than that of CW exposed animals despite a lower averaged incident power density. The magnitude of negative chronotropic K was found to be proportionately greater with larger irradiated surface in the CW ventrally exposed rabbits. An inverse relation between K and irradiated surface was noted in pulsed ventrally exposed rabbits. They interpreted that the negative chronotropic effect was caused by activation of skin receptors and the positive chronotropic effect by brain activation. However, the maximum changes in heart rates were +5 and -8 beats per minutes which are well within the range of spontaneous variation.
Frey and Seifert [1968] showed in the isolated frog heart that a pulsed 1.425 GHz microwave (6 uW/m2 average, 600 W/m2 peak, 1,000 pps, 10 us) administered at a synchronous period with the R wave in the EGG (220 ms after the F wave) resulted in tachycardia (increased heart rate) or arrhythmia in the isolated frog heart. However, other reports [Liu et al. 1976, Clapman and Cain 1975, Chou etal 1980] failed to find this pulse synchronizing (cardiac pacing) effect. The pulse characteristics used by Liu etal. [1976] were 1.42 GHz, 320 uW/m average, 3.2 kW/m2 peak, 1 pps, 100 us). Clapman and Cain [1975] attempted to replicate Frey and Seiferts pulse and method of study but did not observe cardiac pacing. In addition, the heart rate did not change in studies with a different peak power (55 W/m2), a different carrier frequency (3 GHz) or different pulse durations (2 and 150 us). Chou et al. [1980] could not find the pulse synchronizing effect on heart rate in rabbits exposed in vivo to pulsed 2.45 GHz microwaves (10
220

ps pulse, 137 W/m2 peak, pulse duration not specified) triggered by the ECG R wave at various delays (0, 100 and 200 ms) corresponding to R, T and P waves of ECG. Pakhomov et al. [1995] studied frog auricle contraction rate in an in vitro preparation. The frog auricle was exposed to pulsed microwaves at 915 or 885 MHz for 2 min with a peak specific absorption rate range between 100 and 3,000 W/kg, a pulse duration from 10"* to 10'2 s and a fixed duty factor (7 x 10'5). Tachycardia did not occur unless the perfusate temperature increased by more than 0.1 °C. Apparently, low intensity pulsed microwaves synclironized with the ECG were ineffective in inducing detectable changes in the heart rate.
Hamrick and McRee [1980] assessed the effects of body temperature and pulsed and CW microwaves on the heart rate of embryonic quail. They exposed the embryos to 2.45 GHz CW microwaves for 5-10 min (SARs= 3, 6,15, and 30 W/kg) at incubation temperatures from 35 to 38 °C, and to pulsed microwaves (6 kW/kg peak SAR, 10 /xs pulse duration, 10-50 pps, 0.5 *
10'3 duty factor, and 0.3,1.5 and 3 W/kg average SAR) at incubation temperatures of 35 to 39 °C. There were no significant differences between heart rates of the exposed and control embryos in any of the groups at any of the temperatures used. They did observe that embryonic heart rate increased approximately 23 beats/min for each 1 °C rise in incubation temperature between 36 and 39 °C.
Birenbaum et al. [1975] evaluated the effects of 2.8 GHz CW and pulsed microwaves on heart rates, respiration rate and subcutaneous temperature in rabbits. Four power densities (200, 400,600 and 800 W/m2) were used for CW exposures but only 200 W/m2 was used in the pulsed microwave exposure. The pulse characteristics were 1.3 ßs pulse duration, 1,000 pps, 1.3 x 10'3
duty factor, and 154 kW/m2 peak power density. Dose dependent increases in heart rate, respiration rate and subcutaneous temperature were noted in rabbits exposed to CW. Between 200 W/m2 CW and pulsed microwaves, no differences in any of three endpoints were found.
Frei et al. [1988] compared the cardiovascular effects of 2.8 GHz pulsed and CW microwave in ketamine anesthetized rats. Power densities in CW exposures were 300, 450, and 600 W/m2 (8.4, 12.6, and 16.8 W/kg whole-body average SAR). Microwave pulses were 2 fxs
pulse duration, 500 pps, and 10'3 duty factor at average power densities similar to those used in CW exposures and an additional average power density at 750 W/m2 (21 W/kg). Significant increases in heart rate were observed under the pulsed conditions except at 300 W/m2 (8.4 W/kg). The results of this initial study and a follow-up study [Frei etal. 1989a] are compared in Fig. 3. Frei et al. [1989a] re-examined cardiovascular effects with far-field whole-body exposure at 2.8 GHz and whole body average SAR at 14 W/kg for CW and pulsed microwave exposures. Both E- and H-orientations were used, 510 W/m2 was used for both CW and pulsed microwaves (1 MW/ra2 peak, 1,000 pps, 0.5 /zs pulse duration, 0.5 x 10'3 duty factor, SA= 14 mJ/kg) in E-orientation, and 730 W/m2 for both CW and pulsed microwaves in H-orientation (1.46 MW/m2, 1,000 pps, 0.5 JJS pulse duration, 0.5 x 10"3 duty factor, SA= 14 mJ/kg). The
cardiovascular endpoints of this study were heart rate and mean arterial blood pressure in the exposed animals when their colonic temperature reached 38.5, 39.0 and 39.5 °C and when colonic temperature returned to 39.0 °C after exposure. Sham exposure or hyperthermia induced by other modalities was not investigated. Although the time needed to increase colonic temperature from 38.5 to 39.5 °C differed between E- or H-orientation, being shorter in H-
orientation, both heart rate and blood pressure increased significantly from 38.5 to 39.5 °C (Fig. 3) [Frei et al. 1989a]. The magnitude of changes in heart rate (30 to 41 beats per minute) and blood pressure (9 to 14 mm Hg) were statistically significant and robust. Differences between
221
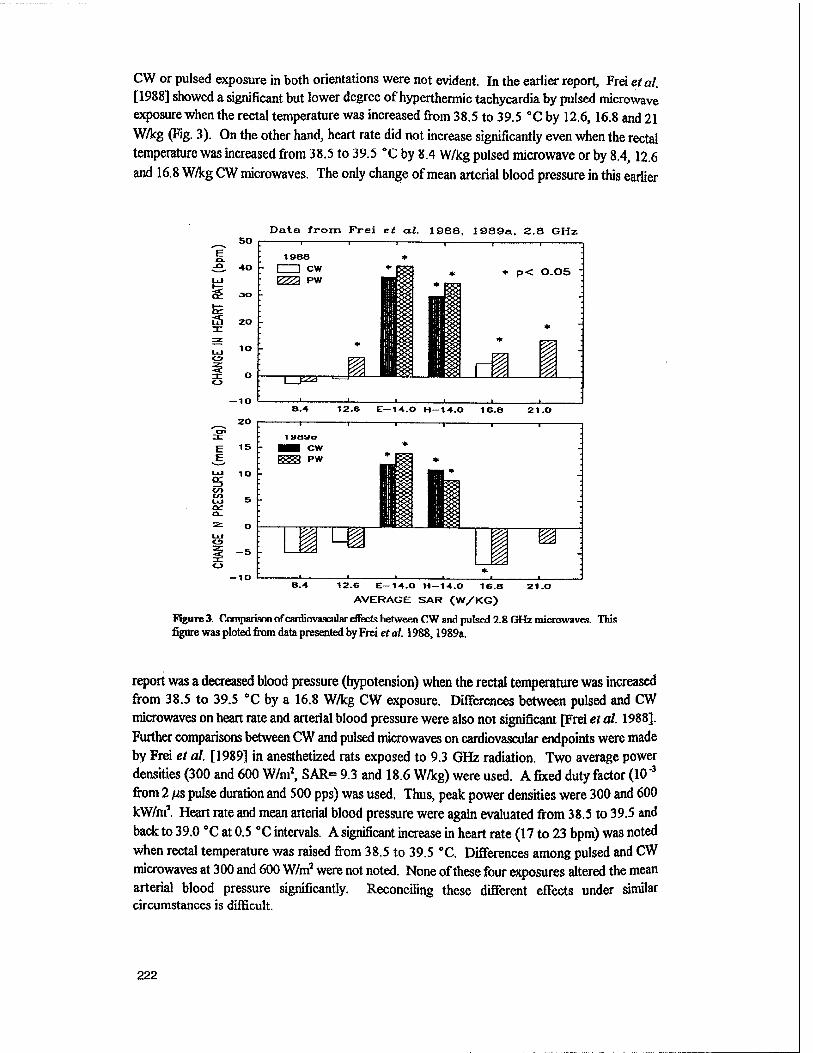
CW or pulsed exposure in both orientations were not evident. In the earlier report, Frei etal. [1988] showed a significant but lower degree of hyperthermic tachycardia by pulsed microwave exposure when the rectal temperature was increased from 38.5 to 39.5 °C by 12.6,16.8 and 21 W/kg (Fig. 3). On the other hand, heart rate did not increase significantly even when the rectal temperature was increased from 38.5 to 39.5 °C by 8.4 W/kg pulsed microwave or by 8.4,12.6 and 16.8 W/kg CW microwaves. The only change of mean arterial blood pressure in this earlier
E Ck.
§
50
40
Data from Frei et al. 1988. 1989a. 2.8 GHz
or L5 20
IO
-io
20
E 15
£J ID
V* «1
O
1988 I I CW 1777% PW
I fc^ g
* p< 0.05
rl i 12.6 E—14.0 H-14.0 16.8
1 Höy a
■H cw (8881 PW
1 ü ^ I B.4 12.6 E—14.Q H—14.£> 16.8 21.0
AVERAGE SAR (W/KG)
Figure 3. Comparison of cardiovascular efFecls hetween CWsnd pulsed 2.8 GHz microwaves. This figure was ploted from data presented by Frei et al. 1988,1989a.
report was a decreased blood pressure (hypotension) when the rectal temperature was increased from 38.5 to 39.5 °C by a 16.8 W/kg CW exposure. Differences between pulsed and CW microwaves on heart rate and arterial blood pressure were also not significant [Frei et al. 1988]. Further comparisons between CW and pulsed microwaves on cardiovascular endpoints were made by Frei et al. [1989] in anesthetized rats exposed to 9.3 GHz radiation. Two average power densities (300 and 600 W/m2, SAR= 9.3 and 18.6 W/kg) were used. A fixed duty factor (10'3
from 2 //s pulse duration and 500 pps) was used. Thus, peak power densities were 300 and 600 kW/m5. Heart rate and mean arterial blood pressure were again evaluated from 38.5 to 39.5 and back to 39.0 °C at 0.5 X intervals. A significant increase in heart rate (17 to 23 bpm) was noted when rectal temperature was raised from 38.5 to 39.5 °C. Differences among pulsed and CW microwaves at 300 and 600 W/m2 were not noted. None of these four exposures altered the mean arterial blood pressure significantly. Reconciling these different effects under similar circumstances is difficult.
222

The difference in cardiovascular responses to microwave exposure at different frequencies was interpreted as a result of difference in depth of penetration causing a different degree of skin heating [Frei et cd. J989J. On the other hand, the inconsistencies of the cardiovascular response among microwaves operated at various carrier frequencies could be caused by the instability of the preparation and the central depressant effect of the anesthetic agent used. Depressed responses of the cardiovascular system to microwave induced hyperthermia were clearly shown by the same group of investigators [Frei and Jauchem 1989] in unanesthetized and anesthetized rats exposed to 2.8 GHz CW microwaves. Significant increases in heart rate (-50 bpm) and blood pressure (~ 16 mm Hg) were observed in the unanesthetized rats while no changes (~ 1 to 2 bpm and -1 mm Hg) were noted in the anesthetized rats when their rectal temperatures were increased from 38.5 to 39.5 "C by a similar microwave exposure. In fact, significant increases in heart rate and blood pressure were noted in unanesthetized rats but not in the anesthetized rats when their rectal temperatures were increased from 38.5 to 39.0 °C, a mere 0.5 °C increase by CW microwave exposure.
Lu et aJ. [1992] used dorsal head-and-neck exposure (1.25 GHz CW and pulsed) in a waveguide exposure system. Three different whole body average SARs (0,3.0, and 9.7 W/kg) were used for CW and pulsed exposures. T,ocal brain SARs were 0, 9.5, 30.4 W/kg, and local neck SARs were 0,34.3 and 110 W/kg. Peak power of the microwave pulses were capable of producing a peak absorption rate at 0.60 MW/kg whole-body average, 1.9 MW/kg brain, and 6.9 MW/kg neck. Two pulse repetition rates and two pulse durations were used to match the low and high CW exposures. They were 0.5 pps, 10 ps (duty factor5 5 * 10s, SA= 6.0 J/kg whole- body average, 19 J/kg brain and 69 J/kg neck), and 16 pps, 1 ß$ (duty factor= 1.6 x 10"5, SA= 0.6 J/kg whole-body average, 1.9 J/kg brain and 6.9 J/kg neck). Endpoints of the study were heart rate, systolic, diastolic and mean arterial blood pressures. Pulse pressure (difference between systolic and diastolic pressures) was also included. Pre-exposure baseline and sham- exposure were used for individual and treatment controls. They noted an abnormal decrease in heart rate (bradycardia) while body temperature was increasing during 1.5 to 6 rninutes of exposure, and an incomplete recovery in 6 min after exposure. This bradycardia effect was dependent on SAR in terms of number of animals afflicted with the change and the magnitude of change. The pulse pressure also decreased in high SAR groups. At the appearance of bradycardia (2 min into exposure), the increase in colonic temperature could be as little as 0.14 "C while neck temperature increased by 0.59 °C. The difference between potencies of CW and pulsed microwaves in inducing these cardiovascular effects was inconclusive due to the large variability in individual animals.
Using an open-end coaxial exposure system, Seaman and DeHaan [1993] compared the effects of 190 s exposures to 2.45 GHz CW, pulsed, and square-wave-modulated microwaves on inter-beat intervals of aggregated cardiac cells from a chicken embryo. The four SARs used in CW microwave exposures were 1.2-2.1, 8.4-12.2, 42.6-48.3 and 72.0-89.9 W/kg. The pulsed microwaves (10.9 /« pulse duration, 10,000 pps, 0.109 duty factor) were administered at two SARs only, 1.2-2.1 (peakSAR= 11-19 W/kg) and S.4-12.2 W/kg (peak SAR= 77-112 W/kg). The gated CW microwaves were modulated at 16 and 0.8-1.7 Hz with a 0.50 duty factor at two higher SARs, 12.0-12.2 and 42.0-43.5 W/kg (24.0-24.4 and 84.0-87 W/kg peak SAR). Results of the study indicated that the inter-beat intervals decreased (i.e., increased heart rate) during CW or gated CW exposures at 42.0 W/kg or higher. The tachycardia effect was consistent with an effect of elevated temperature on heart rate. Alteration in sensitivity to a tachycardiac effect by
223

pulse modulation could not be evaluated because comparable SARs (> 12.2 W/kg) were not evaluated. However, the authors noted a transient decrease in the inter-beat intervals at 8.4-12.2 W/kg during the 95 s post pulsed exposure period, not the subsequent 95 s sampling period. Increase in the inter-beat intervals (slowing of the heart rate) was noted during CW exposure at 1.2-2.1 W/kg between sampling time points during the beginning and end of exposure periods, but the change was not significantly different from the pre-exposure baseline. The observations of "low SARs" (< 8.4-12 2 W/kg) on the beating rates were considered by the authors to be inconsistent with a thermal effect. Because of an unusual large standard error assocated with the transient post-exposure tachycardia of the 8.4-12.2 W/kg pulsed exposed aggregate and a slower beating rate during the pre-exposure period, this isolated case of post-exposure transient tachycardia could be a chance error.
Wolke et cd. [1996] measured the intracellular calcium concentration of isolated cardiac myocytes of the guinea pig exposed to CW and pulsed microwaves used in cellular phones (GSM standard). A host of exposure conditions was studied. In comparison to sham exposed myocytes, decreased intracellular calcium concentration was noted in myocytes exposed to 900 MHz, 50 pps pulses at 30 mW/kg (peak SAR= 59 mW/kg, duty factor= 0.5). The authors concluded that this small difference (decrease from 0.011 ± 0.014 to 0.001 ± 0.009, mean ± S.D.) was not regarded as a relevant effect of the exposure. In comparison to other studies, the duty factors used in this study were very high (0.14-0.80).
Effects on Blood-Brain Barrier Integrity
Frey et al. [1975] evaluated the integrity of the blood-brain barrier by comparing the fluorescein dye concentrations in brain slices in rats after 30 minute exposures to 1.2 GHz microwaves as CW (24 W/m2, 2.2 W/kg whole-body averaged SAR) or pulsed (10 W/m2
average, 1 W/kg whole-body averaged SAR, 21 W/m2 peak, 1,000 pps, 0.5 ms pulse duration). The fluorescein dye was found mostly in the lateral and third ventricles of the brain. The dye concentration in the brain slice was higher in bath CW or pulse exposed animals than in control animals. Pulsed microwaves induced a similar but more pronounced increase in dye concentration than CW microwaves. Oscar and Hawkins [1977] also compared the efficacies of 20 minute exposures between CW and pulsed 1.3 GHz microwaves on the disruption of the blood-brain barrier. They concluded that brain permeability increased, depending on molecular weight (mol wt) of the tracer, for manrdtol (mol wt= 182.2) and inulin (mol wt= 5,000) but not dextran (mol wt= 60,000 to 75,000) in rats exposed to CW and pulsed microwaves at average power densities lower than 30 W/m2. Increased permeability was observed immediately and 4 hours after exposure, but not 24 hours after exposure. Dose response curves were presented for CW, and two different pulses on brain uptake of manrdtol at average power densities lower than 30 W/m . Biphasic response curves were noted for CW and one of the pulsed microwaves (1,000 pps, 0.5 ß$ pulse duration, 0.0005 duty factor) and the pulsed microwave was less effective in increasing the brain uptake of mannitol than the CW. On the other hand, wider pulses with a lower repetition rate (5 pps, 10 ßs pulse duration, 5 * 10'5 duty factor) were much more effective on increasing the brain mannitol uptake than CW of equivalent average power densities. The sensitivity and time-course of blood-brain barrier interruption caused by microwaves was also noted by Albert [1979]. Albert [1979] used Chinese hamster and 2 hour exposures to 100 W/m2, 2.8 GHz CW microwave. Gross and ultrastructure observations of horseradish peroxide in the brain were used to evaluate the blood-brain barrier integrity. Immediately after exposure, leaky
224

or disruption of the blood-brain barrier was indicated by the dark-brown stain in brain slices and the electron dense horseradish peroxidase product surrounding the affected capillaries in the brain. A different time-course was noted, i.e., impermeability of blood-brain barrier to horseradish peroxide was re-established in two hours after exposure. In addition, the brain temperature increase was less than 0.4 °C when blood-brain barrier disruption occurred.
The blood-brain barrier effect of microwave exposure was not confirmed by Preston et al. \ 1979] who used the same Oldendorf procedure [Oldendorf 1970] as Oscar and Hawkins [1977] and did not find changes in brain uptake index of mannitol in medulla, cerebellum, diencephalon, and cortex in rats exposed to 2.45 GHz CW microwaves at 1 to 300 W/m2 for 30 minutes. Menitt etal. [1978] duplicated some of the pulsed parameters (1,000 pps, 0.5 ms pulse duration and 30 minute exposure) but extended the peak powers from 20 to 150,250, and 750 W/m2 which resulted in average power densities of 10,75,125, and 375 W/m2. They noted that fluorescein concentration in various areas of the brain increased with power density. However, none of pulsed exposures increased brain fluorescein concentration statistically. For positive control, hypcrtonic urea and ambient heating (43 °C for 30 min. resulted in more than a 4 °C
increase in brain temperature) were found to be effective in disrupting the blood-brain barrier integrity. An Oldendorf [1970] double isotope procedure for studying blood-brain barrier was also used by Merritt et al. [1978]. Four different 1.3 GHz microwave pulses were used. Their average power densities were 20 W/m2 (2 kW/m2,1,000 pps, 10 ßs pulse duration), 200 W/m2
(20 kW/m2, 1,000 pps, 10 fis pulse duration), 3 W/m2 (6 kW/m2 peak, 50 pps, 10 pts pulse duration) and 15 W/m2 (30 kW/m2, 50 pps, 10 ps pulse width). The comparable CW counterparts were not used. Neverthless, CW exposures were 1, 10, 100 and 500 W/m2. Sham exposed animals and 30 minute ambient heated (45 °C) animals injected with serotonin (50 mg/kg, i.p.) and animals injected with hypertonic urea were used for control and positive control. Brain uptake index of mannitol was used as a measurement of the blood-brain leakage. Again, no effect on blood-brain integrity was noted in rats after 30 minute exposures to pulsed microwaves. The exception was the increased manitol uptake index in ambient heated serotonin injected and urea injected animals. Fluorescein leakage into the brain parachyma was also used by Merritt et al. [1978] for evaluation of the blood-brain barrier integrity in rats exposed to 1.2 GHz pulsed microwaves at 0, 20, 150, 250 and 750 W/m2 average power densities at fixed duty factor (0.5) from 1,000 pps and 0.5 ms pulse duration. Thus, the peak power densities were 0,40, 300, 500 and 1,500 W/m2. The CW counterparts were not included. A positive control was a 30 minute ambient heating at 45 °C. With the exception of positive controls, none of exposed groups showed increased fluorescence in brain slices. Gruenau et al. [1982] also reported no significant change on the penetration of "C-sucrose into the brain of rats after a 30 minute exposure to 2.8 GHz microwaves either as pulsed radiation (2 {is pulse duration, 500 pps, 10"3 duty factor) of various intensities (10 to 150 W/m2) or as CW radiation of various intensities (100 to 400 W/m2).
In contrast to these negative results on the disruption of the blood brain barrier, several studies report significant increases in brain temperature as a result of appropriate microwave exposure with consistent blood-brain barrier disruption and graded severity of the disruption. Lin and Lin [1980, 1982], Goldman et al. [1984] and Williams etal. [1984a] all have demonstrated that increased dye or tracer leakage into the brain tissue would not occur unless microwave exposure caused at least a 4 to 5 "C increase in brain temperature. At this brain temperature (42 CC), the colonic temperature of the whole-body exposed rat was usually maintained at 41.5 °C which could result in reduced renal excretion of tracers [Kanter 1960], therefore, blood
225

concentration of the tracer could rise which increased brain uptake of the tracer. Oscar et al. [1981] noted increased blood flow in all 17 brain regions by 39% to more than 100% in rats after 60 minute exposures to a 2.8 GHz pulsed microwaves (2 jis pulse duration, 100 pps, 150 W/m2
average). Therefore, brain uptake of tracers could be enhanced by the increased brain perfiision rate. The tracer concentration in the brain parachyma caused by increased brain blood flow can mimic changes in endpoints similar to those caused by a low level increase in blood-brain barrier permeability.
On the other hand, localized brain exposure was used in experiments performed by Lin and Lin [1980,1982] and Goldman et al. [1984] and less than a 1 °C change in rectal temperature was noted. Although an indirect renal effect on blood tracer concentration was less important in the experiments using localized brain exposure, the hyperthermic enhancement of brain perfiision could not be entirely dismissed. The dependency of blood-brain barrier disruption on brain hypothermia was further demonstrated by Neilly and Lin [1986]. Graded doses of ethanol (0, 0.1, 0.3, 0.5, and 0.7 g/kg body weight) were administered to reduce the magnitude of brain temperature increase in rats caused by a constant local brain exposure (3.15 GHz, CW, 30 kW/m1,15 minutes). The graded reduction in severity of blood-brain barrier disruption was found to be correlated with a reduction in hrain hyperthermia by graded doses of ethanol. Sutton and Carroll [1979] demonstrated that the mortality and severity of blood-brain barrier disruption was less if the lower body of the animal was precooled to 30 °C while the brain temperature was maintained at a threshold hyperthermic level of 40 to 45 °C by microwave exposure.
Additional studies on effects of microwaves on the permeability of horseradish peroxidase, and sucrose through the blood-brain barrier were also performed by Williams et al. [Williams et al. 1984b, 1984c, 1984d]. Microwave radiation and blood-brain barrier function has been studied extensively in the past. An additional review on the topic can be found in an article by Lai [1994]. It was concluded that later studies were not supportive of the earlier findings, the disruption of blood-brain barrier by low SAR microwaves, by Frey et al. [1975] and Oscar and Hawkins [1977]. In fact, it was concluded that suppression of blood-brain barrier permeability occurs as a result of microwave exposure, and that this effect is mediated by temperature-dependent changes in endotheHal cell function, and not by quantities unique to microwave energy [Williams etctl. 1984c].
Effects on Nervous System
Baranski [1972a] compared the effectiveness of 3 GHz CW and pulsed microwaves (400 pps) on brain histology and histochemistry in guinea pigs. Six different microwave treatments were used. They were 35 W/m2 in CW and pulsed for 3 hours daily for 3 months, one 35 W/mJ
in CW and pulsed for 3 hours and one 250 W/m2 in CW and pulsed for 3 hours. No other pulse characteristics were included. He concluded that chronic repeated microwave exposure led to a morphologic lesion indicative of metabolic disturbances in myelin sheaths and glial cells as expressed by the appearance of peculiar metachromatic spherical bodies. Glial cell proliferation, decreased acetylcholinesterase activity and decreased acid dehydrogenase activity were also noted. These effects were more profound after exposure to pulsed microwaves than after exposure to CW microwaves. Due to lack of information, the dependence of pulse enhancement on peak SAR or SA could not be evaluated.
Seaman and Wachtel [1978] compared the effectiveness of 1.5 and 2.45 GHz pulsed and CW microwaves on the firing rate of the Aplysia pacemakers. They found that a few W/kg
226

exposure for 2 to 3 minutes could change the firing rate of Aplysia pacemakers. While a difference between pulsed and CW microwaves on the slow response was not apparent, pulsed microwaves could induce a rapid response more readily than did CW radiation at the same SAR. An earlier report [Watchel et al. 1975] by the same group of investigators indicated that they were unable to detwl any significant differences in the effects of pulsed (10 ßs pulse duration, at
1,000 and 5,000 pps) versus CW microwaves on Aplysia pacemakers exposed at 10 W/kg. Details of pulse characteristics in both reports were not provided by these authors other than that a 0.5 to 10 ßs pulse duration and 1,000 to 5,000 pps were used.
Chou and Guy [1978] compared the effect of pulsed and CW 2.45 GHz microwaves on compound action potentials of isolated frog sciatic nerves, cat saphenous nerves, rabbit vagus nerves and superior cervical ganglia, as well as contractility of rat diaphragm muscles in a waveguide exposure system with circulating Ringer's solution to maintain a constant bath temperature during exposure. Graded peak SARs (0.3, 3, 30 and 220 kW/kg) were used. A constant duty factor (If/5) was used by combining two pulse repetition rates (1,000 pps and 100 pps) and two pulse durations (1 ßs and 10 ßS) to obtain average SARs at 0.3, 3, 30, and 220 W/kg. They concluded that there were no significant changes in characteristics of nerves (compound action potentials, CAP) and muscles exposed to CW at SARs of 0.3-1500 W/kg and pulsed peak SARs of 0.3-220 kW/kg (average SAR of 0.3-220 W/kg). No direct stimulation of nerves by either CW or pulsed microwaves was observed. At the higher specific absorption rates, the CAP showed a slight increase in conduction velocity but no change in amplitude. This result was consistent with a 1 CC increase in battling solution temperature wherein the results were replicated by increasing the bathing solution temperature of an unexposed preparation.
In a series of two reports, McRee and Wachtel [1980,1982] compared the effectiveness of pulsed and CW 2.45 GHz microwaves on altering the "vitality" of isolated frog sciatic nerves stimulated with twin electric pulses separated by a 5 ms interval at 50 pulse pairs per second. "Vitality" was defined as the half-decay time ratio of the CAPs between exposed and control nerves. Both CAPs were examined. Microwave pulses used were 10 W/kg average SAR, 20 kW/kg peak SAR, 10 ßs pulse duration, 50 pps and 0.5 * 10"3 duty factor. The microwave pulses were delivered in three different phases of nerve firing: (1) asynchronous, wherein the microwave pulse was delivered at varying times in the nerve firing cycle; (2) synchronous, with the peak of the action potential; (3) synchronous, with the quiescent period between nerve firings. A 20 to 30 minute exposure was used. In all pulsed microwave exposures, the "vitality" decreased in comparison to the unexposed mate (control). However, the magnitude of this effect was essentially the same in all three cases and was also comparable with the effect seen using CW microwaves of equivalent SAR.
Arber and Lin [1985a] noted that snail neurons exposed to CW microwaves (12.9 W/kg) at constant temperatures (8 and 21 °C) resulted in inhibited spontaneous activity and reduced input resistance. On the other hand, modulated (amplitude modulated at a radom-noise frequency, 2-20 kHz) microwaves at 6.8 and 14.4 W/kg predominately caused excitory responses and increased membrane resistance. Tt was concluded that the microwave effect on snail neurons was related to the release of intracellular calcium ions (Ca4*) [Arber and Lin 1985a]. The conclusion was based on the observation that intracellular injection of EDTA, a chelating agent, completely "eliminated the microwave responses in snail neurons LArber 1981J and the manipulation of extracellular Ca" concentration had not influenced the fall of membrane resistance induced by microwaves [Arber and Lin 1985b]. Ginsburg et al. [1992] re-evaluated the principle that weak microwave fields could perturb a nonequilibrium physiochemical process
227

in an excitable tissue at a constant system temperature. They could not replicate the original findings of Arber and Lin [1985a] and concluded that microwave irradiation might enhance metabolic rundown and/or loss of ion channel function which occurred over time. In addition, a specific target for microwave interaction with neurons was not suggested by them [Ginsburg etal. 1992],
Chou et ah [1982b] compared the effects CW and pulsed microwaves on the electroencephalogram and visual and auditory evoked potentials. The microwaves were 2.45 GHz at 15 W/m2 average, 2 hours per day for 3 months. The pulse characteristics were 10 \J&
pulse duration, 100 pps and 10*3 duty factor. Six rabbits (3 males and 3 females) were used in sham-, CW- and pulsed-exposure groups. Frequency spectrum and amplitude of sensory-motor cortex and occipital cortex were evaluated over the 3 month exposure period. Due to considerable variations from animal to animal and from recording session to recording session, comparison was difficult. Other than a general trend of decreased amplitude during the later part of the experiment, no difference was found in the EEG endpoints. Similar variations also existed in visual and auditory evoked potential. Again, no consistent change in amplitude or latency of either evoked potentials was noted.
Lai et al. [1988] measured the cholinergic activity in the brain tissue by determining the sodium-dependent high-affinity choline uptake (HACU) of brain tissue of rats after 45 minutes exposure to 2.45 GHz at 0.6 W/kg whole-body average SAR in either pulsed radiation (500 pps, 2 ßS pulse duration, 10"' duty factor) or CW radiation in a circularly polarized waveguide exposure system or in the far-field in a miniature anechoic chamber. They found a decreased HACU in frontal cortex regardless of pulsed or CW radiations or exposure system used. Decreased hippocampal HACU occurred only after exposure to pulsed, but not CW radiation in both exposure systems. Decreased striatal HACU occurred in rats after exposure to either pulsed or CW radiation in the miniature anechoic chamber, but not after exposure in the circularly polarized waveguide. None of four exposure conditions altered the hypothalamic HACU. No significant pattern was found between brain local SAR and decreased HACU. This led the authors to conclude that the effect of microwaves on the brain HACU originated from other sites in the brain or body. Decreased frontal and hippocampal choline uptake, an indication of decreased cholinergic activity, was considered to be the mechanism for decreased working memory in pulsed exposed rats who committed more errors than sham exposed animals when tested in a radial arm maze [Lai et al. 1987,1994]. The experiment on the pulsed effect has not be been repeated independently by other investigators.
Effects on Dlood, Hemopoictic (Hcmatopoictic) System and Serum Chemistry
Czerski <tf a/. [1974] and Baranski and Czerski [1976] reported a study aimed to compare the effects of 2.95 GHz CW (n= 5) and pulsed (n= 9) microwaves on the hemopoiesis of rabbits at 30 W/m2 averaged power density, 2 hours daily for 74 hours. Characteristics of these microwave pulses were 1 fis pulse duration, 1,200 pps and 1.2 v 10"3 duty factor. In comparison to the control group (n=19), erythrocyte concentration, hemoglobin concentration and hematocnt did not alter significantly in rabbits exposed to CW or pulsed microwaves [Baranski and Czerski 1976]. On the other hand, alterations in iron kinetics were noted. These changes included increased half life, decreased iron transport rate, decreased iron turnover rate, decreased iron incorporation into erythrocytes and decreased percent of erythrocyte production [Czerski etal. 1974]. Czerski et al. [1974] concluded that perhaps the most interesting finding is that 74 h of
228

exposure to pulsed microwaves induced much more pronounced effects than to CW of the same duration, the difference between these groups being highly significant. The overalf picture of the alteration in iron kinetics appears to be consistent with a slower turnover of circulating erythrocyte, perhaps erythrocytes lived longer in exposed than in control rabbits. However, overlapping of error bars was noted. Due to the absence of details in inferential statistics and the nature of the error bars, it is difficult to reconcile the validity of a pulsed effect.
Chou et al. [1982b] in the previously referred study also compared the effects CW and pulsed microwave had on blood cellular elements. Hematological endpoints were red blood cell concentration, white blood cell concentration, hemoglobin concentration, hematocrit, mean corpuscle volume, mean corpuscle hemoglobin concentration, % of reticutocyte and differential leukocyte (neutrophil, lymphocyte, eosinophil, basophile and monocyte) concentrations. These endpoints were evaluated either at monthly intervals or at the end of the three month exposure.
Tabulated data (mean and standard deviation) were presented along with the "normal range" reported in the literature for this species of animal. It was concluded that minor morphological alterations of red blood cells (poikilocytosis - irregular shape, polychromasia - stained with basic and acid dyes, anisocytosis - considerable variation in size) occurred in all three groups of animals. No statistical differences were found among them. Exactly the same conclusion was presented by Baranski and CzersJd [1974]. Because of large biological variations and subtle differences between the effects of CW and pulsed microwaves, the authors [Chou et al. 1982b] concluded that a larger number of animals should be used in future experiments.
Baranski [1971] compared the effects of CW and pulsed 3 GHz (10 cm) microwaves at 35 W/m2,3 hours daily exposure«, except Sundays, for 3 months on the hemopoietic system. The pulse characteristics were not specified. A relatively large number of animals (n= 50), including rabbits and guinea pigs, were used in each sham, CW and pulsed exposure. At the end of 3 month exposures, red blood cell concentration did not change significantly from those of sham exposed animals in both species of animals exposed to CW and pulsed microwaves. On the other hand, the author reported alterations of erythroblast maturation process in bone marrow of guinea pigs exposed to microwaves. Immediately after 3 months of pulsed exposure, a marked depression in the percentage of proerythroblasts and basophilic erythroblasts was noted. This depression was accompanied by increases in percentage of polychromatic and orthochromatic erythroblasts indicating an accelerated maturation process. Similar changes in the erythroblast maturation process was noted but to a lesser degree in guinea pigs exposed to CW than to those exposed to pulsed microwaves. However, changes in erythroblast maturation did not result in a change of the total erythroblast percentage in bone marrow cells. In addition, the mitotic index of the erythroblasts in bone marrow decreased after exposure for 3 months, even more after 4 months. One month after termination of exposure to CW the mitotic index returned to normal, but overcompensation was noted one month after pulsed microwave exposure. The mitotic index reached nearly twice the control value in pulsed exposed guinea pigs. Since circulating red blood cell concentration was not evaluated 1 month after exposure, the possibility of resultant erythropenia and erythrocytosis is not known. Results of cytological examination indicated profound changes in the nuclei of erythroblasts. These changes included karyolysis, fragmentation of nuclei, pyenosis, clumping of chromosomes, chromosomal bridges and splitting off of chromosomes. However, quantitative or semiquantitative data was not presented.
Baranski [1971, 1972b] also noted increased white blood cell concentrations Qeukocytosis) hy approximately 50% to more than 100% in both species exposed to either CW or pulsed microwaves. This leukocytosis was contributed primarily by lymphocytosis (increased
229

lymphocytes). Lymphocytes increased further during the first 2 weeks and showed a tendency to normalization from the third week after termination of the 3 month exposures in guinea pigs. Difference between CW and pulsed microwaves on leukocyte concentration was not significant. In fact, leukocyte concentration in rabbits exposed to pulsed microwaves was consistently lower than those exposed to CW microwaves in both species of animals. The leukocytosis (lymphocytosis) was not accompanied by significant changes in percent composition of bone marrow cells. The stamped smear preparation of lymph nodes and spleen showed a marked increase in lymphoblasts and reticulum cells in exposed guinea pigs in comparison with controls. Abnormality of nuclear structure and mitosis were analogous to those seen in erythroblasts [Baranski 1971]. Mitotic rates of lymphopoiesis were further studied by the percentage of cells labeled with tritiated thymidine. Several fold increases in S-phase labeling were noted in lymph node and spleen of microwave exposed rats. Again, CW appeared to be more potent than pulsed microwaves in inducing increases in mitotic rate of lymphoblasts. The overall response of lymphocytosis appears to be an immuno-stimulation of unknown nature. In these experiments, multiple post exposure data was compared to a single control datum [Baranski 1971, 1972b]. Apparently, the control data were either pooled or historical in nature. If concurrent controls were not used, one has to question the validity of these results.
Wangemann and Cleary [1976] compared the effects of 2 hour exposures to 2.45 GHz CW and pulsed microwaves on blood chemistry of Dutch rabbits. Two power densities, 100 and 250 W/m2 average were used. For pulsed microwaves, a 10 (is pulse duration and a fixed peak power density of 4.85 kW/m2 were used. Thus, two duty factors (0.0206 and 0.0485) and two pulse repetition rates (2.06 * 10* and 5.15 x 10? pps) were used. Additional groups of rabbits were exposed to 50 W/m2 and sham-exposed controls (n= 12). Five to six rabbits were used in all other groups. Blood chemistry endpoints were serum concentration of calcium, inorganic phosphate, glucose, blood urea nitrogen (BUN), uric acid, cholesterol, total protein, alkaline phosphatase (AP), lactic dehydrogenase (LDH) and serum glutamic oxalic transaminase (SGOT). These endpoints were obtained as pre-exposure baselines and post-exposure levels immediately, 1, 3, and 7 days after exposure. A significant rise in mean serum glucose concentrations was found in all microwave-irradiated animals immediately after exposure; and returned to baseline levels 1 day later. The magnitude of changes in scrum glucose concentration was dose-dependent in CW exposed rabbits, 18% in 50 W/m2 CW, 29% in 100 W/m2 CW and 44% in 250 W/m 2 CW exposed rabbits. Similar changes at a lesser degree were noted in pulsed exposed rabbits. The increase in serum glucose concentration was considered to be a consequence of "thermal stress" because significant increases in rectal temperature were noted in rabbits exposed to 250 W/m CW and pulsed microwaves. In addition, significant increases in BUN (50%) and uric acid (150%) concentrations were noted in 250 W/m2 CW but not pulsed exposed rabbits. Focal hemorrhagic lesion and mild to moderate tubular nephrosis were noted in representative rabbits 24 hours after "2-3" hour exposure to 250 W/m2 CW microwave. Thus, gross and histopathological findings confirmed the observation of renal injury indicated by BUN and uric acid. Other focal lesions were observed in the psoas muscle, liver, kidneys, pulmonary tissue. However, no pathology was observed in animals examined 1-2 weeks after exposure. All other serum chemistry endpoints did not change significantly. The renal injury in the 250 W/m CW exposed rabbits appeared to be caused by a significant degree of hyperthermia since the rectal temperature of these animals increased by an average of 2.7 °C reaching 40.7 °C at the end of a 2 hour exposure. The absence of renal effect in the 250 W/m2 pulsed exposed rabbits could also be explained by a lower degree of hyperthermia (1.7 "C increase and 40.1°C) at the end of a 2
230

hour exposure. Because of a large difference in degree of hyperthermia between CW and pulsed exposed rabbits, it is doubtful that the investigators administered an equivalent SAR during the CW and pulsed exposures.
Chou etal. [1982b] also compared the effects of CW and pulsed microwaves on blood chemistry but at a lower intensity. As stated previously, the microwave was 2.45 GHz at 15 W/m2 average, 2 hours per day for 3 months. The blood chemistry endpoints were sodium ion concentration, potassium ion concentration, chloride ion concentration, carbon dioxide concentration, ion gap, total protein concentration, blood urea nitrogen concentration, glucose concentration, total complement concentration, triiodothyronine resin uptake, thyroxine concentration, percentage of albumin, and cortisol concentration. No change in any of these blood chemistry endpoints was noted. These results seem to support the thermal/hyperthermic nature of the changes in blood chemistry of the Wangemann and Cleary [1976] study.
Lymphoblastoid Transformation
A study by Stodolnik-Baranska [1967] has raised the possibility that the immunocompetent cells of humans are particularly susceptible to microwave radiation. In fact, it was claimed that microwaves were the only physical agent known to cause stimulation of spontaneous lymphoblastoid transformation. These studies were admitted by some authors to be poorly reproducible and nonquanthative (Roberts et cd. 1983]. Nonetheless, the study is frequently cited, and has provided the limited data available on exposure of human leukocytes, for use by individuals and agencies that develop environmental health standards [Roberts et al. 1983].
Stodolnik-Baranska [1974] summarized the stimulatory effect of pulsed 2.95 GHz microwaves on spontaneous lymphoblastoid transformation of human lymphocytes in culture. The mitotic index of human lymphocytes in culture was used for identifying the presence of spontaneous Lymphoblastoid transformation. Pulse characteristics were 1 jus pulse duration, 1,200 pps and 0.83 x 10~J duty factor at 70 and 200 W/m1 average power densities. Mitotic index of cultured human lymphocytes was found to increase to approximately 2 times that of controls after 20 and 40 minutes of exposure but not after 5, 10 and 15 minutes of exposure at 200 W/m1. Similar results were obtained in human lymphocyte cultures after 3 or 4 hours exposure at 70 W/m2, but data were not presented. When cultured human lymphocytes were exposed at 200 W/m2 for 10 minutes, the increased mitotic index became noticeable after 59 hours, became pronounced (approximately 40 % increase) after 64 hours, and subsided to a normal rate after 70 hours in culture. A 0.5 °C increase in culture temperature was noted after a 15 minute exposure at 200 W/m2, and 1.0 °C after 20 minutes at the same intensity. The medium temperature remained constant during a 4 hour exposure at 70 W/m2. Increased medium temperature is known to cause enhancement of the spontaneous lymphoblastoid transformation [Czerska et al. 1992] as shown in Fig. 4. Other changes noted by Stodolnik-Baranska [1974] were increased chromosome abnormalities (2 to 17 times that of controls) in human lymphocyte culture exposed at 200 W/m2 for 5 to 20 minutes. These chromosome abnormalities included stickiness and chromosome aberrations (dicentrics, hypoploidy, hyperploidy and breaks).
Using a waveguide exposure system [Lu etal. 1983], Roberts et al. [1984] studied human lymphocytes exposed to 2.45 GHz microwave pulses modulated at 16 and 60 pps at 0.39 and 4 W/kg for two hours. A relative high duty factor, 0.5 was used. Unstimulated and phytohemagglutinin suboptimally and optimally stimulated tritiated thymidine and tritiated leucine
231

incorporations for DNA and total protein syntheses were used to identify spontaneous lymphoblastoid transformation, and activated lymphoblastoid transformation. Viability of lymphocyte was also evaluated. Lymphocytes from individual donors were split into two parts for sham- and microwave exposures to limit the influence of individual variation on the outcome of the experiment. Two identical waveguides, one energized and one not, were mounted on a platform connected to a reciprocating shaker to provide agitation and to prevent sedimentation during exposures. Therefore, the temperature distribution within the exposure vials was much more uniform than in those exposure systems without agitation. The same exposure system, procedure and endpoints were also used to study the CW effect on lymphoblastoid transformation [Roberts et al. 1983] at 0.5,1.0 and 4.0 W/kg for 2 hours with the exception of an additional endpoint, tritiated uridine incorporation for RNA synthesis. Roberts et al. [1987] also compared the effectiveness of CW and pulsed (0.5 duty factor) 2.45 GHz microwaves at 4 W/kg on the unstimulated and mitogen-stimulated responsiveness of lymphoblastoid transformation in influenza virus infected human lymphocytes. None of these studies showed any evidence of a difference in any of the endpoints either unstimulated or stimulated between control and exposed split samples. The lack of a demonstrable difference was not originated from a lack of responsiveness of human lymphocytes used because these lymphocytes responded to mitogen stimulation in a dose dependent fashion regardless of their exposure history. Using the same procedure, Roberts et at. [1985] demonstrated a sensitivity to microwave induced effects in lymphocytes exposed to 2.45 GHz CW at 22.5 W/kg for 2 hours (culture temperature3 42.7 °C). This exposure resulted in decreased unstimulated RNA and total protein syntheses, as well as delayed synthesis of DNA, RNA and total protein in response to stimulation with the optimal concentration of mitogen and decreased synthesis in response to suboptimal concentrations of mitogen.
On the other hand, Czerska et al. [1992] provided convincing evidence of a profound stimulatory effect of pulsed 2.45 GHz on the sponntaneous lymphoblastoid transformation of cultured human lymphocytes (Fig. 4). A shorted rectangular waveguide exposure system in an incubator at 37 °C was used for this experiment. The CW exposures were a "non-heating" level (<0.2 6C) at 0.8-1.3 W/kg, and several "heating" levels (0.5,1.0,1.5 and 2.0 °C increase) at 1.8- 2.3, 3.5-4.5, 6.8-8.3 and 9.8-12.3 W/kg. The pulsed microwaves were operated at 1 fis pulsed duration, 100 to 1,000 pps, and variable duty factors, 10"4 to 10"3. It appears the peak SAR were fixed at 9.8-12.3 kW/kg. The exposure duration was 5 days continuously. Because the lymphoblastoid tranformation process involves gradual enlargement of the cell and of the nucleus, the size (>200 /«n2 vs <100 /an2) of the cell was used to identify lymphoblasts, lymphocytes and intermediate cells at the end of 5 day experiment period. In addition, conventional heating controls were used at 0.5 °C intervals between 37 and 39 °C for 5 days. Figure 4 shows clearly the optimal temperature for lymphoblastoid transformation was 38.0 °C irrespective of the exposure. The number of blastoids formed was not different between lymphocytes exposed to conventional (ambient) heating or CW microwave. However, the lymphoblasts formed from PW exposure were several times greater. Due to the known sensitivity of lymphocytes to increased temperature, inhomogeneous distribution of culture temperatue may have caused the cell destruction in microwave exposed human lymphocytes at temperatures as low as 38.5-39.0 CC. The temperature inhomogeneity could not fully explain the difference in lymphoblastoid transformation rates between CW and pulsed microwaves. Additional experiments are needed to confirm this pulse enhancement effect.
232

Z5
& 15 in i— in 5 o 10 o.
| 1 AMBIENT CW, 1, 2. 4. 7.5 & 11 W/kg PW. 1 ps. 10O-1.000 PPS, 10 D.F.
RANGE= S.D.
z g
& a:
7- o 6
lil o w
< O _x_a. z
37.0 37.5 39.0 38.5
INCUBATION TEMPERATURE
39.0
Figure 4. Effect afCWairiptd^aiicrovravts on spontan of human lymphocytes in vitro. The graph is ploted from data presented by Czerska et a!. [1992]. The lymphoblasts were cells whose size is larger than 200 jan* at the end of 5 day experiment. The incubator temperature was maintained at 37 °C during S days of CW and pulsed microwave exposures. The "0" at 38.5 °C indicates that no lymphoblast was found.
Other Studies
Sanders et cd. [1985] compared the efficacy of 5 minute exposures of two 591 MHz microwaves (250 and 500 pps, 5 //s pulse durations) on the brain concentration of nicotinamide adenine dinucleotide reduced form (NADH) in rats. They found a factor of 4 increase in thresholds, from about 4.5 to 18.5 W/m2, when pulse modulation frequency decreased from 500 to 250 pps. The effect of CW exposure on brain NADU concentration was not included. Thus, the specificity or modifying effect of pulse modulation on the studied endpoint could not be evaluated. In addition, they compared the efficacy among CW, 16-Hz sinusoidal-amplitude- modulated and 500 pps pulse-modulated (5 /is pulse duration) 591 MHz microwaves on brain adenosine triphosphate (ATP) and creatine phosphate (CP) concentrations at 138 W/m2 rms average (2.48 W/kg) for 0.5, 1 and 5 minutes. Both ATP and CP concentrations were significantly reduced from those of sham-exposed rats, but the efficacy of modulation was not evaluated due to large variations of the ATP and CP concentrations. Based on the absence of a brain temperature increase, the authors suggested a direct interaction of microwave energy with the mitochondria! electron transport chain function of ATP production.
Rafferty and Knutson [1987J compared the phase transition temperature of a liposome (dipalmitylphophstidylcholine and diapalmitylphosphtidylglycerol in 4:1 ratio) while exposed to 0.93 GHz CW (300 W/kg average SAR) and pulsed (4,000 kW/kg peak SAR, 300 W/kg average SAR, 10 /zs pulse duration, 7.5 pps, 75 x 10"* duty factor). The phase transition temperature of sham exposed liposomes was 40.1 ± 0.12 °C (S.D.). Neither CW nor pulsed microwave exposure altered this phase transition temperature.
233

Roberti et al. [1975] compared the effect of 3 GHz CW and pulsed microwaves on the spontaneous activity of rats. The pulse characteristics were 1.3 jtts pulse duration, 769.23 pps and a duty factor of 10°. Sham-exposures for 185 hours, CW at 5-10 W/m2 for 185 hours, pulses at 15-20 W/m2 average (15-20 kW/m2 peak) for 185 hours, and pulses at 240-260 W/m2 average (240-260 kW/m2 peak) for 408 hours were used. Spontaneous activity was not different between the sham exposed group and any of the microwave groups. This report indicates that spontaneous activity is not a sensitive measure for comparing effects between CW and pulsed microwaves.
McLees et al. [1972] compared the effect of 13.12 MHz CW and pulsed microwaves on regenerating hepatic tissue of the rat. The pulses were 200 ps pulse duration, 500 pps, and 0.01 duty factor. A thermometric method was used to determine the whole-body averaged SAR. The averaged SARs were 1.2 to 1.3 W/kg for both CW and pulsed (120 to 130 W/kg peak SAR) microwaves. Power density or electric field intensity was not specified. Rats were hepatomized under ether anesthesia with removal of 60-70% of the original hepatic mass. Exposure was initiated immediately following hepatectomy for 28-44 hours. Concurrent sham-exposed rats were used in conjunction with each of two microwave exposure protocols. Endpoints of the study were weight loss, mitotic index of the regenerating liver, and chromosome aberrations of the regenerating liver. Statistical differences between endpoints from either of the microwave exposed groups and their respective concurrent shams were not found. Obviously, regenerating liver seems not to be susceptible to microwaves either.
TEMPO EXPERIMENTS
The Transformer Energized Megavolt Pulsed Output (TEMPO) system at the Walter Reed Army Institute of Research (WRAIR) is a 3 GHz transmitter capable of delivering pulses (Fig. 5) at 500-700 MW peak output power, 120 ns wide, 20 ns rise time, and 0.125 pps. The transmitted power varies, a characteristic inherent in virtual cathode oscillators, yet can be represented as a rectangular pulse of 200 MW for 80 ns. With a 0.125 Hz pulse repetition rate, the duty factor is 10"* and the average output power is 2 W. The TEMPO antenna is a longitudinally slotted circular waveguide which radiates a fan-shaped (narrow horizontal, wide vertical) horizontally polarized beam. Subjects are typically exposed in a dual corner reflector assembly, 2.25 m from the antenna. The corner reflectors provide a 10 dB enhancement and achieve 10 W/m2 from a 1 W/m2 free-field power density per watt transmitted power. Thus, at maximum transmitted power (700 MW), peak power density is 7 GW/m2 and the peak electric field intensity is approximately at 1,600 kV/m. Wire screens of varying mesh densities can be placed over the antenna aperture to attenuate output of the system. These screens produce power outputs of-20, -30, -40, and -50 dB. Calorimetry results indicated that the whole-body average SAR of an average rat was 0.036 W/kg per watt transmitted power or 0.072 W/kg at full power. Extensive local SAR of interest has also been evaluated by a thermometric procedure [Raslear et al 1993b]. In addition to microwaves, TEMPO produces the noise and soft x-rays. For 200 pulses, the ionizing radiation dose was less than 0.31 rem, and noise level was lower than 89 dB SPL (57 dB during sham exposure). The TEMPO system has been used for studying the behavioral toxicology of high peak power but low average power microwaves. A typical exposure consisted of 200 pulses in approximately 25 minutes. Several studies have been performed at WRAIR with this device.
234

6GCM
AGO
20Q- -
aoo
FigureS. Oscilloscope tracing of a typical "TEMPO pulse. Spikes and ringing are noted.
Raslear et al. [1993b] trained rats under a bisection paradigm in which the rats were trained to discriminate between two durations of light (0.5 and 5 s, training stimuli) to obtain food reinforcement with a response on the appropriate lever designated as short and long. Five new durations (0.74, l.l, 1.62, 2.4, and 3.54 s, lest stimuli) equally spaced on a logarithmic scale between training stimuli were added for testing. All seven stimuli were presented in random order throughout the test session (320 trials per session). Responses to the test stimuli were never reinforced, but responses to the training stimuli continued to be reinforced. Psychometric functions, bisection point, response bias, discriminability, general task performance and null response (failure to respond on a trial) were examined after exposure to 200 TEMPO pulses at 5 graded doses in a 50 dB range. Both ascending and descending series of exposures were used. In addition, a cage control and a sham exposure were used. Measures of time perception, response bias, total trials and discriminability (ability to distinguish between durations) were not affected by TEMPO exposure. Significant dose-dependent changes were noted in increased session time, increased number of null responses and increased cumulative null responses with dose. It was interpreted that TEMPO exposures at less than 0.072 W/kg whole-body average SAR were affecting cognitive function in the rats, particularly the decision-making process. However, post hoc analysis was not performed to identify a threshold for each behavioral
endpoint. Using a Y-maze, Raslear et al. [1991a] tested 24 hour memory consolidation in rats
exposed to 200 TEMPO pulses at full power (0.072 W/kg whole-body average SAR), at 30 dB attenuated power, and in rats that served as cage controls. The difference between the two exposed groups was not significant, However, both exposed groups reliably made more errors than the cage control group. They concluded that the memory deficit caused by TEMPO pulses was consistent with the results of the bisection study [Raslear et al. 1993b} in which an increase in null responses, reflected a lack of confidence in making a decision.
Akyel et al. [1993b] studied the treadmill performance in rats immediately after sham or M-power TEMPO exposure (0.072 W/kg whole-body average SAR, 200 pulses). Cage controls
235

were also used. The running time of TEMPO exposed rats was reduced (56.44 ± 10.69 s, mean ± S.E.) from those of cage control (150.13 ± 25.65 s) or sham-exposed rats (152.89 ± 35.18 s). The mechanism of this decreased endurance was not investigated.
Raslear et al. [1991b] also studied the effect of TEMPO pulses on motivation for food and the circadian rhythmicity of food acquisition. Rats were exposed to one of three conditions, foil power TEMPO pulses (0.072 W/kg whole-body average SAR, 400 pulses, 50 minutes), pulses at -30 dB (400 pulses, 50 minute») and sham-cxposurc for 50 minutes. Following exposure, each rat was placed In one of six similar home cages which was equipped with a response levee and food pellet dispenser. On the first day in the test apparatus a lever pressing response produced a single 45-mg food pellet. On the second day the response requirement remained at 1 response/food pellet (FR 1, Fixed Ratio 1). On subsequent days the response requirement was increased to 15,45, 90, 180 and 360 responses per pellet. The animals were free to respond at all times of day. A 12:12 light:dark cycle (light on at 0600, off at 1800 hours) was used. The only food was what the rats earned in the experiment. The number of food pellets consumed as a function of the price of the food (response requirement) followed the typical pattern of decreasing consumption as price increased. There were no apparent differences among groups. Circadian function was assessed by the number of food pellets obtained during the day and the night. Typically, rats consumed 90-100 % of their food during the night. With the exception of 1 pellet per response (PR 1), TEMPO exposures did not affect the circadian rhythmicity. Instead of consuming 90-100 % of their food during the night, both TEMPO exposed groups consumed only about 50% of their food during the night under the FR 1 schedule.
The Porsolt swim test [Porsolt et al. 1978] in rats was used to identify the existence of despair and depression after an exposure to full power TEMPO pulses (0.072 W/kg whole-body average, SAR, 200 pulses) [Raslear et al. 1993a] There was no difference in immobility time between TEMPO exposed and sham-exposed rats. It appeared that exposure to TEMPO pulses did not cause despair and depression in rats irrespective of other behavioral alterations caused by the same exposure.
D'Andrea et al. [1993] used the TEMPO exposure system for an operant behavior study in rhesus monkeys. The corner reflector was not used, therefore, the peak power density was 456 kW/m2 which resulted in a peak whole-body SAR of 2.21 MW/kg and 1.3 J/kg SA per pulse. Performance under a color discrimination task for food was used as the endpoint. The task required monkeys to pull one plastic lever on a variable interval schedule (VI-25 s) and then respond to color signals and pull a second lever to obtain food. Behavioral performance on either component of the task was not altered significantly by the TEMPO pulses.
D'Andrea etal. [1989] also exposed monkeys to high peak power 2.37 GHz pulses from a different TEMPO system. The pulse characteristics were 70-113 kW/m2 peak power density and 93 ns pulse duration. The estimated temporal-peak spatial-average whole-body SAR was 583-938 kW/kg or 54-87 mJ/kg per pulse. The number of pulses delivered was between 28 and 51 in 20 minutes. Therefore, the whole-body average SAR was estimated to be less than 0.1 W/kg. The endpoint of the study was performance of the monkey under a vigilance task. The task involved two components, responding on a variable interval schedule (VI20 s, 1-84 s range) on one lever and responding on a second lever to tones. Compared to sham irradiation, significant changes in performance were not observed. In a subsequent technical report, D'Andrea etal. [1990] also found no effect of different TEMPO pulses (365-827 kW/kg peak SAR, whole- body average SAR < 0.1 W/kg) on the behavior of monkeys under the same vigilance task.
Klauenberg et al. [1988] exposed rats to TEMPO vircator pulses at 1.26 GHz with a 85
236

ns pulse duration and a peak power density of 5 kW/m2. Startle, following single and multiple pulses (1 pps, for 10 s), general activity, and rotarod performance after multiple pulses were used to assess the effects of exposure to TEMPO pulses. Reliably more animals in the exposed group startled relative to the sham-exposed group when single pulses were used, but no differences between groups occurred during multiple pulse exposures. More exposed animals failed to complete the rotarod task than sham-exposed animals.
Cordts et al. [1988] exposed rats to a Cober peak power simulator operating at 2.066 GHz, 250 ms pulse duration, and 300 W/m2 peak power density and a Gypsy Vircator pulse operating at 1.64 GHz, 140 ns pulse duration and 80 kW/m2 peak power density. Three behavioral tasks, one-trial avoidance, drinking, and rotarod performance, were used to evaluate the effects of the Cober and Gypsy pulses. Only the drinking test (time spent drinking) was reliably reduced by either source, and similar effects were seen for both pulses despite the large difference in incident power densities. It was estimated that a 0.7 °C increase in body temperature was caused by exposure to Cober pulses while only 0.0084 °C was caused by Gypsy pulses. Hence a conventional concept of heating (differential increase of body temperature of either 0.1 or 1 °C depending on endpoints) fails to explain the reduced drinking effect.
It appears that some cognitive behaviors are susceptible to the high peak but low average power microwave pulses. On the other hand, well trained behaviors appeared to be resistant to alteration by this type of microwave pulse. Unfortunately, none of these studies has attempted to include experiments using a CW microwave of the same carrier frequency and equivalent low average SAR exposure thereby limiting an evaluation of a pulse modification factor.
BIOLOGICAL EFFECTS OF CARRIERLESS PULSES
The current IEEE standard [IEEE 1999] recommends a 100 kV/m peak electric field intensity limit for pulsed fields of low frequencies and short pulses. This recommendation for a peak E-field limit of 100 kV/m is based on the necessity to cap the allowable field below levels at which air breakdown or spark discharges occur. The IEEE Standards Coordinating Committee 28 [TREE 1999] also recognizes the sparseness of studies for very short high-intensity exposure. This section is intended to update current knowledge in evaluating the biological effects caused by exposure to carrierless pulses in which a center frequency is not apparent. This type of RF is usually produced by impulses instead of modulation of a narrow-band KF.
Absorption of Carrierless Pulses
Guy [1990] used a Numerical Electromagnetic Code Method of Moments to calculate the maximum induced currents, SAR and absorbed energy density in human and non-human primates exposed to EMP. His results are shown in Table 4. The induced current could vary with size, as high as 281 amperes per leg for a human male, to as low as 4.89 amperes per leg for a squirrel monkey exposed to a 100 kV/m, 10 ns rise time EMP. However, the variation of maximum current density and SAR for the exposed subjects was small, ranging from a low of 148 kA/m2 and 26.2 MW/kg for an adult human, to a liigh or 180 kA/m7 and 38.0 MW/kg for a 1- year-old human child. Absorbed energy per pulse and peak E-field in tissue were also relatively independent of size. The tissue peak E-field was approximately twice the peak E-field intensity of the ambient (100 kV/m) EMP pulse.
237

Table 4. Comparison of maximum induced current, current density, SAR, absorbed energy and E-Field in human and non-human primates exposed to 100 kV/m, 10 ns Rise time electromagnetic
pulses
Subject Height
(cm)
Current per leg
(A)
Current density (kA/m*)
SAR
(MW/kg)
Energy per pulse
CJ/kg)
E-field in tissue (kV/m)
Man 178 281 148 26.2 0.186 177
10-year-old-child 138 185 162 31.2 0.182 193
S-year-old-child 112 129 171 34.6 0.177 202
1-year-old-child 74 59.0 180 38.0 0.164 211
Rhesus monkey 40 16.3 173 34.4 0.149 200
Squirrel monkey 23 4.89 155 28.4 0.142 183 * Data adapted from Guy [1990].
Additionally, Lin [1975, 1976, Lin and Lam 1976, Lin et ai, 1975] using frequency analytic techniques for various electromagnetic pulse interactions with different biological models explored the dependency of transmitted EMP on models, on pulse duration and on wave shape. Lin and Lam [1976] indicated that the coupling efficiency for a one fxs Gaussion pulse is three times as big as that for a ten //s Gaussion pulse in a model composed of a layer of soft tissue over a semi-infinite medium of bony structure. The maximum transmitted pulse strength was calculated to be about 2.2 kV/m from one ßs pulse at 100 kV/m. A similar dependency of transmitted EMP on pulse duration was noted between 1 j/s (221 V/m) and 50 jus (188 V/m) 50 kV/m Gaussian EMP incident normally at the air-tissue interface of a semi-infinite model [Lin 1975]. Lb [1976] concluded that the transmitted field strength in homogeneous spherical models of human and animal heads (10, 5, 3.5 and 1.75 cm radius) from 100 kV/m Gaussian EMP varying from 1 to 10 ps pulse duration was quite small, less than 20 V/m was coupled into a 3.5 or 10 cm radius spherical head. On the other hand, a triple exponential 50 kV/m EMP could produce 735 V/m in a 10 cm radius spherical head and 472 V/m in a 3.5 cm radius spherical head.
Using the same technique, Guy [1989] concluded that a peak current level of 5 A per kV/m occured for exposures to EMPs with a 10 ns rise time. Hagmann [1993] measured the peak current induced in human volunteers. Measured peak current levels per leg were 1.7 A per kV/m at the "ALECS" EMP facility and 0.9 A per kV/m at the "EMPRESS F EMP facility. If both arme and opposite leg of volunteers were raised, the peak current was enhanced (2.95 A per kV/m) at the "ALECS" facility but less so (1.1 A per kV/m) at the "EMPRESS I" facility. Clearly, the magnitude of current induced through the human body by EMPs can be greatly modified by changing posture and limbs making ground contact.
Chen and Gandhi [1991], using the finite-difference time-domain (FDTD) technique, calculated currents induced in an anatomically based model of a human with rubber soles for exposure to vertically polarized electromagnetic pulses at a peak electric field of 55.4 kV/m. They noted an excellent agreement of the calculated results by FDTD technique with data measured for a human subject. The peak current induced in both ankles, both knees and both
238

thighs (220 to 284 Aby a 55.4 kV/m peak EMP) were in agreement with Guy's results (Table 4). On the other hand, the whole body average SA of two representative EMP pulses (0.43 rrJ/kg from a 53.5 kV/m peak EMP pulse, and 0.22 mJ/kg from a 41.5 kV/m peak EMP pulse) differed from Guy's results (Table 4) by 3 orders of magnitude.
For extrapolation from results of animal experimentation to human health, it is important to know which absorption metric is responsible for the biological effect. The size dependence of peak induced current by EMP pulses was also evident in rats, a smaller laboratory animal. Mathur et cd. [1990] measured the induced current in a 200 g rat (body length ~ 15 cm) exposed to an EMP pulse (67 kV/m peak, 8 ns rise time). The measured peak current was 1.5 A (22.4 mA per kV/m) which is 2 orders of magnitude lower than the peak induced currents in humans (Table 4). The low peak induced currents by EMP pulses were confirmed by Gao et cd. [1992] using FDTD methods and a 2/3 -muscle-equivalent model of a rat.
Potential Mechanisms for Tissue Damage from Carrierless Pulses
Albanese er a/. [1994] proposed four potential tissue damage mechanisms for ultrashort electromagnetic signals. They were molecular conformation changes, alteration in chemical reaction rates, membrane effects (electroporation) and thermal damage. These proposed potential tissue damage mechanisms apparently required relatively high peak electric field and pulse duration. Some of these effects can be induced by pulses with a peak electric field intensity of several hundred kV/m.
The work of Neuman and Katchalsky [1972] was cited to support the existence of conformation changes (partial unwinding) in which artificial poly A/poly U triplets, destabilized in acid buffer were exposed to 2,000 kV/m, 10 ßs electromagnetic pulses. The peak electric field intensity in this study was higher and the pulse duration was longer than those pulses typically produced by impulse radars or EMP simulators. In addition, Merritt et cd. [1995] countered that several hems including that DNA in situ is inherently stabilized by histone, represser and activator proteins, and secondary chromosomal structures, and that topisomerase enzyme activity is required to release the stabilized structure and allow normal DNA synthesis to occur. Such dynamics may not be relevant as potential damage mechanisms.
Albanese et cd. [1994] estimated the change of chemical equilibrium in the presence of an electromagnetic field as 1% per 1 kV/m of electric field intensity. Based on the rate constant of chemical reactions (lOVs/M, relaxation time 10 ns or longer), Merritt et cd. [1995] concluded that ultrashort electromagnetic pulses with ps rise time and ns pulse duration could not alter the chemical reaction by individual pulses. In addition, Merritt et al. [ 1995] considered that chemical reactions are associated with the average energy deposition instead of a transient electromagnetic field.
Another damage mechanism considered by Albanese et al. [1994] was the permeation of cell membranes by electromagnetic pulses of hundreds of kV/m and pulse durations of MS to ms. The consideration was based on Tsong*s review [Tsong 1991] of declrupoialion, a process which describes collectively the effect of electromagnetic pulses on cell membranes resulting in leakage of ions and metabolites, fusion of cell membranes, and opening of pores. Reversible openings of protein channels occur with [is pulses, while irreversible channel openings are seen as the results of ms pulses. The process of extrapolation from a dilute in vitro cell suspension to a complex in vivo system is questionable at the present lime. Tsong [1991] also concluded that the breakdown
239

potential of bilayer lipid membrane is in the 150 to 500 mV range when the field duration is in microseconds to milliseconds. This value translates into a field strength of 30 to 100 MV/ra if the tissue thickness is 5 nm. Electroinsertion of foreign materials into a cell is known to require a lower critical field than electroporation [Mouneimne et al. 1993]. Furthermore, the critical field intensity routinely used in electroinsertion depends on cell size. Neumann et al. [1993] found that in situ pulsed electric fields in the range of 200 to 400 kV/m and 1 ßs to 50 ms could be used in the membrane electroporation method for transferring genes, nucleic acids and proteins into a cell interior as well as electro-release of cellular components into the medium. Similar to electroinsertion, the threshold for membrane breakdown decreases with increasing cell size. The irreversible breakdown of cell membrane is about 200 kV/m for blood cells [Zimmermann 1982, Hansson-Mild et al. 1982, Paile et al. 1995}, 100 kV/m for fibroblasts, and 5 kV/m for muscle cells [Lee et al. 1988]. With the exception of muscle cells, these threshold peak electric field intensities are higher than the current IEEE standards on peak electric field intensity [IEEE 1999].
The last tissue damage mechanism proposed by Albanese et al. [1994] was thermal damage by bulk heating. If a threshold bulk heating or temperature increase is allowed to continue for a sufficient time, tissue damage will indeed occur and it is not unique to ultrashort electromagnetic pulses. On a molecular basis, Albanese et al. [1994] suggested that if the rate of energy removal from a target molecule is slower than its absorption from the electromagnetic field, significant heating of the individual molecule could occur during exposure, with little gross temperature change in the overall medium, causing highly localized damage. The plausibility of the proposed mechanism is not known. Additionally, it was not clear to what extent molecule damage becomes critical to body homeostasis and is manifested in disease. Based on the results of highly sensitive single pulse endpoints (microwave hearing, microwave induced whole-body movements, and microwave induced thermal sensation), the presence of a critical duration is clearly evident. Although die critical duration appears to vary with the endpoint or effect studied, the effect threshold is dependent on the pulse energy (SA per pulse) when the pulse duration is shorter than the critical duration. When the exposure duration is longer than the critical duration, effect threshold appears to depend on the dose rate (SAR). Adair [1991] analyzed the electric and magnetic fields in the human body generated upon exposure to external pulsed electric fields. He concluded that for peak external field strengths as high as 100 kV/m, the effects of the consequent internal electric fields on sensitive cell elements, such as the membrane, organelles, and the macromolecules that carry genetic information, are shown to be small compared with the normal thermal agitation of the elements. He further concluded such pulses cannot be expected to produce any biological effects at the cellular level.
On the other hand, Gailey and Easterly [1903] reviewed the internal current densities and electric fields induced in the human body during exposure to EMP fields to predict the resulting membrane potentials. Using several different approaches, membrane potentials of about 100 mV were predicted. These values are comparable to the static membrane potentials maintained by cells. However, the EMP induced potential persisted for only about 10 ns, a time constant far shorter than the latency of most biological reactions in response to stimuli. Based on a theoretical model of EMP coupling on cables, Agouridis and Easterly [1989] had concluded earlier that electromagnetic fields produced by EMPs and EMP simulators, in certain circumstances could be hazardous and/or exceed the present guidelines.
Gailey and Easterly [1993] also pointed out that the spherical cell model used in most studies is far from accurate Muscle and nerve cells, for example, are elongated and the expression for limiting membrane potential must be modified by an enhancement factor. Other
240

considerations are electrical length of the structure, gap junctions electrically connecting groups of cells, altered capacitance of cell membrane, and thickness of membrane at tight junctions.
Using theHodgkin and Huxley nonlinear membrane model, Bernardi and Dlnzeo [1984] studied the current density induced in the biological tissue on the resting potential of an excitable cellular membrane. Various characteristics of the incident field, such as wave-shape, pulse duration and amplitude were analyzed. For induced voltage lower than 1 mV, the membrane's behavior could be considered as linear In this case, the membrane response showed a maximum response in the range of 1-30 MHz, where incident fields of about 20 kV/m are necessary to produce 1 mV on the membrane. Above 1 mV, the membrane showed a nonlinear behavior, and a CW incident field could produce a dc voltage on the membrane. Further increase in the amplitude of the incident field could produce depolarization or action potentials of the membrane. For pulsed fields, the membrane was particularly sensitive to pulses with a pulse duration of about 1 ms, the pulse duration comparable with the proper times of the membrane ionic channels. The threshold of action potential excitation varied inversely with pulse duration, i.e., the required incident electric field strength would be 400 kV/m at 1 ms and 2,000 kV/m at 10 us pulse duration. They further commented that transmembrane voltages greater than 1 mV were produced by pulsed fields with 100 W/m2 average power density. But such pulses could not produce adequate transmembrane voltage to cause action potential excitation. On the other hand, specialized neuroreceptors and pacemakers might be more susceptible to such a transmembrane voltage. The validity of this potential mechanism has not been resolved.
Blair [1932] formalized the law of nerve excitation by deriving a mathematical equation based on the known resistive and capacitive properties of cell membranes. The Blair expression for the strength-duration curve is:
I^b/p-e*'*)
Where I is the peak current (or peak external or tissue E-field intensity) for a rectangular pulse of duration d; b is the rheobase and t is membrane strength-duration time constant for the particular tissue. The "rheobase" con be described as minimum excitation threshold for long- duration stimuli. For pulses shorter than the strength-duration time constant, the peak current/field intensity increases according to the duty factor, i.e., ratio of pulse duration to strength-duration time constant, for nerve excitatioa The time constant could be identified as the break point between the minimum plateau and rising phases of the nerve excitation threshold curve in relation to pulse duration. The time constants for various excitable membranes (22 to 214 us) have been complied by Gedders and Baker [1989]. Reilly [1998] proposed a strength- duration time constant and "rheobase" for nerve excitation at 120 jus and 6.2 V/m (in situ E-field). The Blair relationship appears to hold true for pulse durations down in the 1 us range. If the Blah- expression holds true for EMP and UWB pulses, the nerve excitation threshold intensity is 75 kV/m tissue peak E-field intensity for a 10 ns EMP pulse, and 750 kV/m for 1 ns UWB pulse. Apparently, the nerve excitation threshold by EMP pulses estimated from the Blair expression is about 37 to 42 % of the calculated tissue E field from a 100 kV/m EMP pulse (Table 4). In addition, the Blair expression predicts that the shorter the membrane time constant, the lower the nerve excitation threshold. Thus, because of the shortest time constant, a myelinated A fiber would be the most sensitive neural fiber to the influence of ultrashort pulses. Jokela [1997], using a SENN (Spatially Extended Non-linear Node) model with folded axon with 2 mm separation for
241

Ranvier nodes, calculated the nerve stimulation threshold for rectangular pulses. The asymptotic threshold level for electric field inlensity was 10 V/m for pulse durations longer than 100 ^s, and a time-integrated electric field intensity of 1 x 10"3 V/m s for pulses with a pulse duration less than 100 fxs.
For nerve stimulation by sinusoidal currents, thresholds of excitation rise approximately in proportion to frequency beyond a critical frequency, a few kHz for neurosensory or neuromuscular stimulation, provided tliat the stimulus consists of multiple sinusoidal cycles [Reilly 1991]. Above this critical frequency, threshold current density for nerve excitation becomes so great that it will exceed the threshold for perception due to heating. For sinusoidal currents that are at least a significant fraction of 1 s in duration, the crossover between electrical and thermal perception thresholds occurs at about 100 kHz [Dalziel and Mansfield 1950, Chatterjee et al. 1986]. An experiment with anesthetized rats which allowed significant tissue heating, demonstrated neuromuscular stimulation with approximate frequency-proportional thresholds to 1 MHz [Lacourse et al. 1985]. Above this frequency, due to membrane short-circuiting, the heating of tissues by induced electric fields becomes increasingly important and tissue heating becomes predominant at frequencies above 100 MHz. In the frequency domain, pulsed fields are equivalent to a train of sinusoidal fields consisting of harmonic frequencies. Due to a very short pulse duration and even shorter rise times, the frequency spectrums of carrierless EMP and UWB span both non-thermal and thermal domains in their interactions with biological tissues. Therefore, entirely different modes of reaction may be encountered between pulses of similar peak electric field intensity and pulse energy.
Studies on the Biological Effects of Electromagnetic Pulses
There has been widespread public concern over the perceived risk of EMP. During the latter part of the 1980s, lawsuits by several employees of EMP test programs who had leukemia have caused the prohibition of many outdoor EMP simulator operations and increased public and political awareness of the EMP safety issue. The safety issue of EMP needs to be addressed in a scientific manner since public concern about the potential biological effects of EMP has been based on anecdotal evidence from studies without quantitative dosimetric data. Studies of biological effects of electromagnetic simulator pulses were performed as early as the 1970s, although defense contractors have been testing methods to protect electronic devices against effects of EMPs since the mid-1960s. However, only a limited number of studies has been performed.
The operation of EMP simulators is primarily in the area of testing the vulnerability of electronic equipment to electromagnetic pulses generated by nuclear detonation. Concern for cardiac pacemakers in EMP fields falls under the same category of electronic vulnerability to EMPs. Patrick [1993] reviewed scientific literature in this area and concluded that there was little evidence of permanent damage from a single electromagnetic pulse up to 50 kV/m peak electric field intensity on cardiac pacemakers. A single failure was reported at a peak E-field intensity at 500 kV/m, however the failure could not be repeated after the damaged component was replaced. Cardiac pacemaker upset, induction of an additional beat or skipping of a beat, was observed in one unit at 1.25 kV/m for 2 % of the time. Two recent analytical and experimental studies were conducted at Harry Diamond Laboratories [Bock 1988, Ellis 1991] on three to ten modern cardiac pacemakers to "VEMPS II" and "AESOP" electromagnetic pulses. Results of these studies indicated that a modern cardiac pacemaker would not experience damage or upset when
242
exposed to EMP simulator pulses up to a 16.5 kV/m peak electric field intensity, the typical field intensity in the accessible areas of these simulators. Apparently, the upper limit of cardiac pacemaker vulnerability to EMP pulses cannot be adequately tested prior to implantation in patients. Therefore, Patrick [1993] recommended, as a caution, restriction of cardiac pacemaker wearers from EMP simulator areas and posted warnings of the presence of electromagnetic energy.
In 1985, the diagnosis of chronic mydogenic leukemia in one employee of an EMP testing program during a mandatory health surveillance examination prompted Muhm [1992] to perform an epidemiologic study. Candidates for the study were identified from records indicating eligibility for undergoing mandatory health surveillance examinations because of employment in the EMP program between the inception of the surveillance examinations in September 1970 and an arbitrarily selected cutoff date, December 31, 1986. The surveillance examination was typically required for anyone who was expected to be exposed to EMP for at least 30 days, not necessarily continuously, during a 6-month period. A total of 352 candidates from 15 separate company documents was identified, and 304 men were followed for a total of 3362 person-years. Standardized mortality ratios (SMR) were ascertained by two methods: the World Health Organization's underlying cause of death algorithm; and the National Center for Health Statistics' algorithm to identify multiple listed causes of death. There was one underlying cause of death due to leukemia compared with 0.2 expected (SMR= 437, 95% confidence interval, CI= 11-2433), and two multiple listed causes of death due to leukemia compared with 0.3 expected (SMR= 775, CI= 94-2801). It was concluded that the study seem to suggest an association between death due to leukemia and employment in the EMP test program, but this suggestion was at most, tentative because of the absence of exposure data, the small number of deaths due to leukemia, and lack of statistical power and significance.
Sandler et al. [1975] studied the effect of EMP on the morphology of freshly excised frog spinal cord and medulla in vitro. The EMP exposure duration was 25 ms (6 pulses) of 130 kV/m (44.8 MW/m2) peak electric field intensity pulses operated at 250 pps, The half width of the pulse was 30 ns. No difference in histology of large motor neurons between exposed and control tissue was noted. It was concluded that this EMP did not cause a non-thermal injury at a calculated temperature rise (0.001 °C) from each pulse. However, the tissue fixation occurred within 5
minutes including dissection of tissue and exposure. The time-frame of the experiment was too short for an appearance of morphological alterations in cells after such an insult.
Mattson and Oliva [1976] exposed a monkey for one hour (a total of 18,700 pulses) to EMPs at 266 kV/m (188 MW/m2) peak E-field intensity, 11 ns (10-90 %) rise time, 550 ns (1/e) fall time and 5 pps. Sidman avoidance behavior and post-exposure electroencephalogram were evaluated. No difference in the endpoints between control and exposed sessions was noted.
A series of chronic EMP experiments using rats, mice and dogs was performed at the Armed Forces Radiobiology Research Institute. Characteristics of the EMP were 447 kV/m peak electric field intensity (530 MW/m2), 5 ns rise time and 550 ns (1/e) fall time, and 5 pps. Initially, the exposure was 22 hr per day and 5 days per week for 38 weeks to a total of 10* pulses (note: 7.52 xio7 pulses by calculation) [Skidmore and Baum 1974]. Various endpoints were compared between exposed and non-exposed animals. It was observed that the reticulocyte count in EMP exposed rats was nearly always greater than those in the non-exposed rats. However, there were no concomitant differences in peripheral erythrocyte count and in the radioactive iron incorporation between groups Platelet counts in the exposed rats were about 10 % below those
in the non-exposed group most of the time. Increased and decreased lymphocyte and total
243

leukocyte counts in EMP exposed rats were also found but less frequently than changes in platelet or erythrocyte count. When the EMP exposure was continued to 94 weeks to a total of 2.5 x 10' pulses (note: 1.86 x io« pulses by calculation), hematological changes were no longer evident [Baum et al. 1976]. In addition, bone marrow ceUularity was not different between groups [Skidmore and Baum 1974]. Because of these inconsistencies among hematological and hemopoietic endpoints and the absence of effect at the end of the 94 week exposure, it was concluded that EMP effect was not hazardous to rodents [Skidmore and Baum 1974, Baum et al. 1976}. In a later publication, Baum (1979] did not find any effects on hematotogfol and hemapoiesis endpoints in four male and five female beagle dogs exposed to the 447 kV/m EMP pulses for 8 hr/day, for a total 45 days and 5.8 x 10s pulses (note: 6.48 x if/ pu]ses by
calculation). These endpoints were examined periodically during the 45 day exposure and 1 year after the conclusion of all exposures.
Other endpoints studied were chromosomal aberrations of bone marrow cells blood chemistry, histology, teratogenesis, incidence of mammary tumors of rats, and leukemia incidence in leukemia prone AKR/J male mice. Differences between groups were not noted in any of these endpoints after a 38 week exposure [Skidmore and Baum 1974] and after a 94 week exposure [Baum etaJ. 1976). In addition, fertility and reproductive capability were not affected by EMP exposure [Baum etal. 1976]. Teratogenesis and disturbance of reproductive capabilities of EMP exposed male dogs were not found [Baum 1979].
Cleary et al. [1980] studied various biological endpoints in rabbits exposed to EMPs The characteristics of EMP were 100 to 200 kV/m peak electric field intensity, 0.1 m rise time and an exponentially cosine decay pulse with 50 % pnl.«e duration at 04/«. Because the spark gap generator was free running, pulse repetition rates varied. They studied the sodium pentobarbital induced sleeping time in rabbits exposed to 140 kV/m at 10 pps 190 kV/m at 24 pps, 90 kV/m at 10 pps. in the study of EMP effect on serum components (i.e serum chemistry), 150 kV/m at 38 pps for 2 hours was used. Serum components were concentrations of alkaline phosphatase, lactic dehydrogenase, serum glutamic oxafoacetic transaminase, calcium ions, inorganic phosphate, glucose, blood urea nitrogen, uric acid, cholesterol, total protein, albumin, and total bilirubin, immediately and 24 hours after EMP exposure. For serum concentrations of triglyceiide and ueaUne phosphokinase isoenzymes, rabbits were exposed to 200 kV/m at 50 pps and sampled immediately after the EMP exposure. In all of these biological endpoints, consistent statistical differences between EMP- and sham-exposed rabbits were not found.
Moore [1993] studied the orientation behavior of captured migratory birds in response to ««EMPRESS Ü" EMP pulses. The orientation of migrating birds ww studied for 2.5 hours after exposure to a single 50 or 100 kV/m "EMPRESS" pulse. Rise time, fall time and pulse duration were not specified. The distribution of heading was found to be different between exposed and sham-exposed birds in one of three observation periods during the spring of'92 but not during the spring or fall of '91. The author noted that some individual birds may experience difficulty selecting a seasonally appropriate direction following exposure to a single EMP pulse at peak electric field intensity higher than 50 kV/m.
Moore [1993] also studied the natural remanent magnetization and isothermal remanent magnetization of heads of three bird species exposed to an ascending series of "EMPRESS IT' pulses at 2, 5, 10, 19, 41, 72 and 102 kV/m. Magnetic field intensities and other pulse characters were again not specified for the «'EMPRESS IT pulses. No effect of EMP pulses was noted. Therefore, it was concluded that a discernable effect on magnetic orientation of bird
244

species due to EMP pulses was not expected to occur. Akyel et al. [1990, 1992] utilized a spectrum of behavioral paradigms (memory
consolidation, general motor activity, behavioral despair and preference of electromagnetic pulses) in rats in a study of the behavioral effects of EMPs. The EMP exposures were performed in a parallel plate EMP simulator which produced electromagnetic pulses at 100 kV/m peak electric field intensity, 7 ns rise time, 20 ns pulse duration and 6 pps. The exposure duration was 20 or 30 minutes. Sham-exposed animals were used as controls
In contrast to significantly more errors made by the TEMPO (1,600 kV/m, 20 ns, 3 GHz pulses) exposed rats [Raslear et cd. 1991a], the EMP exposed rats were not different from sham- exposed rats when evaluated under a 24-hour memory consolidation test [Akyel et al. 1990J. However, visual observation and video recordings of the animals in the EMP simulator revealed that the EMP-exposed animals were more active than sham-exposed animals. In addition, exposed animals also displayed an ear "twitch" to most EMPs. During the Porsolt's swim test, the immobility time of exposed animals after a 20 minute EMP exposure were not different from those of sham-exposed animals [Akyel et al. 1992]. It was concluded that this EMP exposure did not affect the mood of animals immediately after exposure.
Preference of rats for exposed versus non-exposed areas was also studied by Akyel et al. [1992]. An 80 cm long Plexiglas tube was placed with a 40 cm section inside the EMP simulator and subjected to the EMP exposure and the other joining 40 cm section outside the EMP simulator out of the EMP field. For sham-exposure, the Plexiglas tube was placed in the saure environment without the EMP field. A video camera was used to record the movement of subjects within the tube. Total elapsed time that the animal spent on either side of the tube was recorded for EMP- and sham-exposed animals [Akyel et al. 1992]. They observed that animals preferred the simulator side of tube when the simulator was active. The ear "twitch" was observed in exposed animals regardless of the position in and out of the EMP field and the "twitch" was not found in the absence of the field in sham-exposed animals. It was concluded that the "ear twitch" was not a field specific effect, rather, it was an effect caused by the noise associated with the generation of EMP pulses
From these studies, it appears that EMP is not biologically active at peak electric field intensities below 100 kV/m. However, evidence of a transient hematological disturbance, startle, and slowing of memory process due to EMPs at 400-600 kV/m peak electric field intensity have also been observed. These experiments with positive findings need to be independently verified. In addition, extrapolation from rodents to humans is hindered by uncertainties in mechanisms of action, and in determining an appropriate dosimetric index.
Studies on the Biological Effects of Ultra-Wide-Band Pulses
The Ultra-Wide-Band (UWB) radiofrequency (RF) radiation is a new modality in radar technology and electronic warfare. Some of these sources can produce repetitive ns pulses with sub-nanosecond rise time and peak electric field intensity in several hundred kV/m [Agee et al. 1995]. At much lower power, an example of forthcoming civilian UWB radar application is in the automobile device for obstacle avoidance. Because the primary military purpose of high peak power UWB transmitters is to damage or destroy electronic equipment [Fuerer 1991], the laymen's concern of health effects is multiplied by the apparent higher field intensity that may be encountered in their operation Due to a lack of dedicated exposure apparatus for biological experimentation, studies on biological effects of UWB pulses are primarily limited to research
245

institutes affiliated with military organizations. Only a handful of research papers has been published due to the novelty of the technology.
Pakhomova et al [1997] studied the mutagenic effects of UWB pulses in yeast, Saccharomyces cerevisiae, strain D7. This strain of yeast carries specific gene markers a/a, trp5- 12/trp5-27, ade2-40/ade2-119, and ilvl-92/ilvl-92 which make it feasible to detect certain mutagenic and recombinagenic events from appearance of the colony, reverse mutation of the isoleucine requirement, and mitotic gene conversion to tryptophane. The UWB exposure wa3 performed in a "Sandia" device, where UWB pulses generated by a triggered spark gap generator were transmitted into a giga-transverse electromagnetic (GTEM) cell designed for small animal and in vitro exposures. Three 1 ml yeast suspensions at 107 cells per ml in a polystyrene tube (120 mm height x 17 mm outer diameter, 1 mm wall thickness) were exposed simultaneously. Three different exposures for 30 minutes were used, i.e., sham-exposure, low repetition rate (16 pps, 104 kV/m peak electric field intensity, 165 ps rise time, and 1 ns pulse duration), and high repetition rate (600 pps, 102 kV/m peak electric field intensity, 165 ps rise time, and 1 ns pulse duration). Colony forming ability, normal and aberrant colonies, including mitotic crossovers, segregant, revertant and convertants, were scored. None of endpoints was found to be altered by UWB exposures Therefore, it. was concluded that T JWB exposure used in this experiment did not change the colony forming ability of yeast cells nor did it cause mutations or gene recombination.
Pakhomova etal. [1998], in a follow-up study, used the same D7 strain yeast, but pre- treated them with 254 nm ultraviolet light (UV) at 100 J/m2 in 2.5 ml of 5 * 106 cells/ml in a 36 mm diameter Petri dish. The UV-pre-treated yeast was then exposed to UWB pulses in the GTEM cell for 30 minutes at doses and techniques as in the previous experiment. There were three exposure conditions: sham-UWB, 16 Hz, and 600 Hz exposures. The experiment was performed in parallel according to UWB treatments, i.e., sham-UWB exposure vs control, low repetition rate UWB exposure vs sham-UWB exposure, and high repetition rate UWB exposure vs sham UWB exposure. Sham UV exposure was not included in the experiment. TheUVpre- treatment was found to be effective in reducing cell survival to 60-70 % and the survival rate was not altered by UWB exposures. The frequencies of segregation, mutations to the isoleucine independence, and gene recombination events, such as mitotic cross-over and conversion to tryptophan independence were remarkably similar between samples in the parallel experiments, as well as among sham, 16 Hz and 600 Hz exposed samples. It was therefore concluded that these UWB exposure did not cause changes in UV-induced mutagenesis and gene recombination.
Erwin and Hurt [1993] presented probably the first summary of various studies on biological effects of UWB pulses performed under a collaborative program between Phillips Laboratory (Kirtland AFB, NM) and Armstrong Laboratory (Brooks AFB, TX). Endpoints of studies were cardiovascular response in rats, equilibrium task performance of monkeys, performance scores of the Functional Observation Battery (29 physiological and behavioral measures) in rats, serum enzymes, plasma electrolyte concentration, hemoglobin concentration in rats, brain C-fos protein activation in rats, and metrazole seizure activity in rats. The exposure
was with a "ffindenburg-2" (H-2) device, which was developed in mid-1992 [Agee et al 1995] and produced bipolar pulses at 250 kV/m (166 MW/m1) peak electric field intensity, 318-377 ps rise time and 5-10 ns pulse duration. Typical exposure was 2 min at 60 pps except the operant behavioral study in which rats were tested immediately after an exposure to 12,000 pulses in a "sweep" pulse repetition, starting at 1 pps and increased continuously to 400 pps in 1 min. They
concluded that none of the endpoints was affected by UWB pulses. Some of these studies were
246

subsequently published in 1995 [Sherry et cd. 1995, Walters et cd. 1995]. Sherry et at. [1995] exposed six. adult male rhesus monkeys (Ma.ca.ca. mulatto) to UWB
pulses produced by the "H-2" device under similar parameters as used previously. The performance of monkeys on the "Primate Equilibrium Platform" (PEP) was used as an endpoint. The estimated whole-body average SAR was 0.5 W/kg, A 0.3 W/kg whole-body average SAR was estimated by Hurt [1999]. Each monkey was exposed to these UWB pulses twice, separated by 6 days between exposures. Performance on the PEP was tested before exposure, at 1 hr after exposure and at 24-h intervals thereafter for the next 5 days. Sham-exposed monkeys were not included. The only significant effects were individual differences among subjects and time. Therefore, it was concluded that UWB exposure had no effect on PEP performance of monkeys. In addition to an absence of sham exposure or sham-exposed animals, these monkeys had served in experiments on the effects of low doses of carbamatcs and/or organophosphates on PEP performance. The authors assured that such experiments had no detectable carryover effects. It is understandable that the non-human primate is a precious research commodity and the training for PEP performance is difficult and time consuming. Nevertheless, the lack of sham-exposed controls and re-use of animals from other experiments raise questions as to the repeatability of these observations.
Walters et cd. [1995] reported the results of rodents exposed to UWB pulses produced by the "H-2" device. The same pulse parameters were used at a 250 kV/m peak electric field intensity (reported as 17 CfW/m2, should be 0.17 GW/nf). The estimated whole-body average SAR was 20 mW/kg [Hurt 1999]. Various endpoints were evaluated bcluding performance in a swirnming test 3 h after exposure, scores in a Functional Observational Battery one day before and 2 h after exposure, serum enzyme concentrations (aspartate transaminase, alanine transaminase, creatine kinase and amylase) at 2 or 48 h after exposure, plasma electrolyte concentration and osmolarity at 2 or 48 h after exposure, and brain C-fos protein 2 h after exposure. No differences between any of the endpoints from sham-exposed and UWB exposed rats were noted.
Miller et at. [1999] injected rats intraperitoneally with a convulsant, pentylenetetrazol (PT) at 99 % effective dose (EDW, 89.17 mg/kg) to re-evaluate the effect of UWB pulses on drug-induced convulsions. Four different treatment groups were used: UWB exposed-PT injected, UWB exposed-saline injected, sham-exposed - PT injected, and sham-exposed - saline injected. The UWB and sham-exposure were performed 20 s after the PT or saline injection. UWB pulses were produced by a "Kentech PBG3" device into a parallel plate transmission line. The UWB pulses were 40 kV/m (4.24 MW/m2) peak electric field intensity, 176 ps rise time, 1.92 ns pulse duration and 1,000 pps for 2 minutes. The whole-body SAR was estimated as 16 mW/kg. As expected, there was a significant drug effect (PT vs saline) on mortality, however, exposure effects (UWB or sham) and interaction between drug and exposure effects were not found. Since saline injected rats did not convulse, latency to first convulsion response, latency to full tonic-clonic seizure and duration of seizure were evaluated in PT-treated rats only. No differences were noted in any of these three latencies.
Seaman etal [1998] tested the influence of a "Sandia" UWB (100-105 kV/m, 165-168 ps rise time, 0.97 ns pulse duration) exposure on nociception and spontaneous activity and interaction of UWB exposure on morphine induced analgesia and hyperactivity of the mouse. A complex experimental design with eight different experimental groups was used. These investigators used cage control, sham exposure, low repetition rate UWB (60 pps, 105 kV/m peak, 165 ps rise time, 0.97 ns pulse duration, and 3.7 mW/kg estimated whole-body average
247

SAR), and high repetition rate UWB exposure (600 pps, 100 kV/m peak, 168 ps rise time, 0.97 ns pulse duration and 37 mW/kg estimated whole-body average SAR) for 30 minutes. Saline- and morphine-injected male CF-1 (7.5 mg/kg) and male C57BL/6 (10 mg/kg) mice served as subjects. Nociception was evaluated by latency of front and back paw licking and "first response" of the mouse after being placed on a 49.5-50.5 °C metallic surface. Other than the effect of morphine,
none of the nociceptive endpoints was found to be influenced by the UWB exposures. Interaction between UWB and morphine was not significant in all of the three nociceptive endpoints. Lack of UWB effects on nociception and morphine-induced analgesia was supported by additional experiments with CF-1 mice with 15,30, and 45 minute exposures to the high repetition UWB pulses. Spontaneous activity was measured in C57BL/6 by the number of beam crossings in a 38.5 cm square arena. Other than a morphine induced hyperactivity, UWB effect and interaction between UWB and morphine were not observed. Due to limits of the exposure system, higher doses were not tested.
Inhibition of nitric oxide synthase (NOS) has a morphine-like analgesic effect and can cause alteration in locomotor activities. In an extension of their original study on morphine and UWB, Seaman et al. [1999] studied the effects of a NOS inhibitor, N°-nitro-L-arginine methyl ester (L-NAME) on manifestation of UWB effects in CF-lTPlus. mice. Nociception and spontaneous locomotor activity were measured as before. The sham and UWB exposures (600 pps, 102 kV/m peak, 0.90 ns pulse duration, 160 ps rise time, and 37 mW/kg estimated whole- body SAR) were administered to saline-injected and L-NAME-injected (50 mg/kg) rats. Effects of L-NAME on the "first response", hind paw licking latency and spontaneous activity were clearly demonstrated but no additional effects were found. While L-NAME was capable of inducing increased spontaneous activity in sham exposed mice, its effect was blocked entirely by the UWB exposure. In supporting the evidence that UWB pulses could affect nitric oxide production, Seaman et al. [1999] referred to an enhanced nitric oxide production by 41 % in stimulated murine macrophages incubated with potassium nitrate (GLN treatment) after UWB exposure [Seaman et al. 1996]. The nitric oxide produced was 9.14 mM in sham-exposed and 12.89 mM in UWB-exposed GLN treated macrophages. The exposure of these murine macrophages, RAW 264.7, was performed in a T75 flask covered with 235 ml of phosphate buffered saline in the "Sandia" system to UWB pulses operated at 72-95 kV/m peak, 198-216 ps rise time, and 1.01-1.07 ns rise time for 30 minutes. A dose estimate was not included.
The study of cardiovascular effects of UWB pukes has been performed in several studies. However, two different approaches have been used [Jauchem et al. 1998,1999, Lu et al. 1999]. Jauchem's group used ketamine-anesthetized (150 mg/kg, a rather high dose) and cannulated rats as a model to evaluate the X TWR effects on heart Täte and blood pressure during exposure and immediately after exposure. The UWB exposure was usually less than 2 minutes. An earlier report was presented by Erwin and Hurt [1993] and details of the experiment were not given. However, the exposure was probably a 2 minute exposure by the "H-2" device which produced bipolar pulses at 250 kV/m (166 MW/m2) peak electric field intensity, 318-377 ps rise time, 5-10 ns pulse duration, and 60 pps. Estimated whole-body average SAR was 20 mW/kg [Hurt 1999]. Jauchem et al. [1999] exposed rats to UWB pulses produced by a "Bournlea" pulse generator with pulses at a 19-21 kV/m peak electric field intensity, 327 ps rise time and 6 ns pulse duration. The exposure protocols were 2,000 pps for 0.5 s, 2,000 pps for 5 s, and 1,000 pps pulse train on for 2 s and off for 2 s for a total of 2 minutes. The estimated whole-body average SAR was 2& mW/kg [Hurt 1999]. None of these experiments included a sham-exposed group. Jauchem et al. [1998] also utilized the "Sandia" exposure system for rats. The experimental conditions were
248

sham, 50 pps (104 kV/m peak, 0.97 ns pulse duration, 177 ps rise time and 7.4 mW/kg estimated whole-body average SAR), 500 pps (102 kV/m peak, 0.97 ns pulse duration, 174 ps rise time and 71 mW/kg estimated whole-body average SAR) and 1,000 pps (87 kV/m peak, 0.99 ns pulse duration, 218 ps rise time and 114 mW/kg estimated whole-body average SAR). Results of these experiments revealed a stable heart rate and mean arterial pressure before, during and after UWB or sham exposures. However, the average heart rates (less than 265 beats per minute) of the Sprague-Dawley rats in these experiments were remarkably low for this species even if the cardiovascular stimulatory effect of the ketarnine [Lippmann et al. 1983] is ignored. In conscious, free-roaming and cannulated rats, the average heart rate of Sprague-Dawley rats is between 332 and 364 beats per minute [Baron and Van Loon 1989, Ferrari et al. 1987, Houdi et al. 1995, Sparrow et tu. 1987]. In addition, the delay time for manifestation of cardiovascular effects should be considered. Lu et al. [1992] demonstrated that it took 2 to 3 minutes for a heart rate change to appear in rats exposed to high peak power (7 MW/kg at the neck, 1 fxs pulse duration) and high average pulsed microwaves (110 W/kg at the neck) or high average CW microwaves (110 W/kg at the neck). In addition, the acute alteration in heart rate began to recover
immediately after exposure. In a non-invasive approach to evaluating the cardiovascular effects of UWB exposure, Lu
et al. [1999] measured the heart rate and arterial blood pressures (systolic, mean and diastolic) in conscious rats. Restraint adapted rats were exposed to sham, 500 Hz (93 kV/m, 180 ps rise time, 1 ns pulse duration, and 70 mW/kg estimated whole-body average SAR) and 1,000 Hz (85 kV/m, 200 ps rise time, 1.03 ns pulse width, and 121 mW/kg estimated whole-body average SAR) UWB pulses for 6 minutes. Cardiovascular endpoints were determined 3-4 days before exposure and 0.75 h, 24 h, 72 h, 1,2,3 and 4 weeks after exposure. Significant changes in heart rate were not found. On the other hand, significant decreases in systolic, mean, and diastolic pressures were observed in UWB exposed animals and the effect peaked at 2 weeks after UWB exposure. Recovery was still not complete by 4 weeks after exposure. In two subsequent, yet unpublished, experiments (Fig. 6), UWB exposures were sham, 125 Hz (91.3 kV/m peak, 156 ps rise time, 1.02 ns pulse duration, and 17 mW/kg estimated SAR), 250 Hz (94.0 kV/m peak, 168 ps rise time, 1.02 ns pulse duration, 38 mW/kg estimated SAR), 500 Hz (89.3 kV/m peak, 160 ps rise time, 0.91 ns pulse duration, and 59 mW/kg estimated SAR) and 1,000 Hz (85.4 kV/m, 167 ps rise time, 0.94 ns pulse duration and 112 mW/kg estimated SAR). The UWB-induced hypotension was robust (20 mm Hg), consistent, and persistent. The threshold appeared to be around 60 mW/kg estimated whole-body SAR.
In short, a response-SAR-exposure-duration relationship began to emerge from this limited number of studies on biological effects caused by UWB pulses. None of these average SARs can induce significant temperature increases. Additional characterization will be required to confirm and to elucidate response-SAR-exposure-duration relationships in other biological models. Dosimetry and mechanisms of action, either physical or biological, are still unresolved.
CONCLUSION
Analysis of biological effects and health implications of high peak power radio frequency pulses is a complicated endeavor by itself. The task is fiirther complicated by the recent developments in methods of generating RF pulses by shifting from narrow-band pulses to carrierless pulses. Conventional radar is operated in a narrow band mode in which the fractional
249

171.2
166.2
I ISHAM (15) ^125 Hz (5) ES3250 Hz (5) (^500 Hz (10) ■■ 1.000 Hz (10)
CO W 126.2
121.2
116.3
0.14 2.08 4.48« 4.18»
* P< 0.05 by DunntW» fvA
» p< 0.05 by ANOVA. F(4.40)
PRE 0.75 H 24 H 72 H 1 WK 2WK 3 WK ♦ WK
Figure 6. Development of hypotension in rats exposed to UWB pulses. Results ofANOVA at each sampling time point «re shown at upper abscissa. Significant Fs ore indicated by an asterisk. Significant differences between sham and exposed are shown by solid triangles.
bandwidth is less than 1% of the center (carrier) frequency. In carrierless RF pulses, the frequency domain of the pulse can span from DC to GHz which creates new challenges in dosimctry and in the potential mode of interactions between carrierless pulses and biological materials. The present review attempts to evaluate the progress in theoretical and experimental results of carrier and carrierless pulses.
A single RF pulse lasting from microseconds to seconds with adequate pulse energy is known to cause drastic acute biological effects. Examples in descending order of pulse energy are brain enzyme denaturation, stun and seizure, pain, decreased spontaneous activity and brain
acetylcholine concentration, microwave induced whole-body movements, thermal sensation, startle modification and microwave hearing. The first four effects are associated with significant bulk heating indicated by 2 °C or more increase in body temperature. On the other hand, none of the last four effects requires a significant bulk heating. They can be caused by a single pulse which is incapable of imparting adequate energy to cause an elevation in core temperature of animals. However, microwave induced whole-body movements are caused by a single pulse which results in 0.2 to 2 "C increase in subcutaneous temperature. On the other hand, a thermal sensation is elicited by partial body exposure in which less than 0.1 °C increase in cutaneous temperature is noted. Startle modification and microwave hearing are produced by a pulse that is barely capable of transferring enough energy to cause less than a 10"s or 10"4 °C increase in tissue temperature of animals. The mechanism of action is not clear in startle modification and microwave induced whole-body movements. However, the mechanism of action is well established in the microwave auditory effect in which the cranial pressure wave created by thermoelastic expansion associated with an RF pulse is sensed by hair cells of the cochlear. The activation of thermoreceptors is undoubtedly involved in thermosensation Roth startle
250

modification and microwave induced whole body movements appears to be reflexive reactions which require receptor, reflex center and effectors. In other words, these last four effects are originated from activation of specialized nerve endings, mechanisms of which have not yet been adequately investigated.
The threshold of a single pulse effect appears to have a critical duration. For an exposure period shorter than the critical duration, the threshold must be dependent on specific absorption and the threshold depends on specific, absorption rate if the exposure duration is longer than the critical duration. Examples can be found in microwave hearing and microwave induced whole body movements. However, the critical duration can vary with endpoint. This critical pulse duration appears to be around 30 ^s for microwave hearing and 1 s for microwave induced whole-body movements. The critical duration for a single pulse effect is not clear for other endpoints.
It has been proposed that high peak power RF pulses may have specific effects differing from those caused by a CW radiation. In addition, pulse modulation has been suspected to cause more enhancement of a given biological effect than the same one caused by CW radiation of equivalent average SAR. Microwave hearing can be considered to be specific to pulse modulation since it would not occur without the RF modulated pulse or pulses. On the other hand, pulse enhancement is not established reliably since many studies have failed to demonstrate its importance. Later studies aimed at comparing effectiveness of an induced biological effect between pulsed and CW RFs (duty factors > 10"4 or peak to average power ratio < 10*) usually failed to confirm the earlier reports that indicated the existence of pulse enhancement. However, studies have not been done to confirm or deny the enhancement effect of pulse modulation on injury of corneal endothelium, on brain cholinergic activity, and possibly on consolidation of working memory. A variety of behavioral effects have been observed in experiments employing "TEMPO" pulses. On the other hand, well-trained behaviors arc resistant to alteration by "TEMPO" pulses. Due to the uniqueness of the "TEMPO" pulses (Iff' duty factor, 0.072 W/kg whole-body average SAR, noise, and x-ray) and the cost of maintaining such a system, it is highly recommended, by using the process of elimination, to experiment with 3.0 GHz CW at equivalent SARs to eliminate the existence of unsuspected low dose effects from CW microwaves.
A concrete conclusion regarding biological effects of carrierless RF is, at most, tentative because of the limited number of studies. The carrierless RF includes electromagnetic pulse (EMP) and ultra-wide-band (UWB) pulses. Although unconfirmed, a single EMP pulse with a peak electric field of several hundred kV/m might interfere with the ability of animals to run a maze. Other than that report jHirsh et al. 1968], most studies indicate no observable effect with EMP pulses with peak electric fields less than 100 kV/m. Studies of biological effects of UWB
pulses have begun to reveal the existence of UWB bioactivity at a peak electric field intensity around 100 kV/m. Because of health and medical implications, UWB-induced hypotension needs to be independently confirmed and the dose-response characteristics further explored.
Acknowledgment: The authors are in part supported by the U.S. Army Medical Research and
Materiel Command under contract No. DAMD-17-94-C-4069 with McKessonHBOC BioServices. The views, opinions and/or findings contained in this report are those of the authors and should not be construed as an official Department of the Army position, policy or decision unless so designated by other documentation. Approved for public release, distribution is unlimited
251

REFERENCES
Adair, R.K., 1991, Biological effects on the cellular level of electric field pulses, Health Phys. 61: 395-399.
Adair, R.K., 1995, Ultrashort microwave signals: a didactic discussion, Aviat. Space Environ. Med. 66:792-794.
Agee, F.J., Schlfield, D.W., Prather W., and Burger, J.W., 1995, Powerful ultra-wide band RF emitters: status and challenges, In: Intense Microwave Pulses III, H.E. Brandt, ed., Proceeding of the Int. Soc. Optical Eng. vol 2557, pp 98-109.
Agouridis, D.C., and Easterly, C.E., 1989, EMP simulators and public safety: an analysis, Bioelctromagnetics 10: 355-360.
Akyel, Y., Raslear, T.G., and Serfini, R., 1990, Exposure of rodents in a parallel plate EMP simulator, Part II: behavioral effects, Proc. Ann. Conf. D3EEEMBS 12:1551-1152.
Akyel, Y., Raslear, T.G., Bates, F., and DeAngelis, M., 1992, Behavioral responses of rats to acute EMP fields, Proc. Ann. Conf. IEEE EMBS 14:287-288.
Akyel, Y., and Raslear, T.G., 1993, The effects of acute EMP fields on the behavior of rats, In: EMP Human Health Effects Science Review Panel Proceedings, J. de Lorge and W. Mick, eds., U.S. Navy Theater Nuclear Warfare Program and Operational Medicine and Fleet Support, Washington, D.C., pp 45-57.
Akyel, Y., Akyel, B., and Raslear, T.G., 1993a, Further characterization of microwave- evoked whole-body movement. Proc. Ann. Conf. WEE EMBS15:1451-1452.
Akyel, Y, Belt, M., Raslear, T.G., and Hammer, R.M., 1993b, The effects of high-peak power pulsed microwaves on treadmill performance in the rat, In: Electricity and Magnetism in Biology and Medicine, M. Blank, ed., San Francisco Press, San Francisco, CA, pp 668-670.
Albanese, R., Blaschak, J., Medina, R., and Penn J., 1994, Ultrashort electromagnetic signals: biophysical questions, safety issues, and medical opportunities, Aviat. Space Environ. Med. 65/Supplement: A116-A120.
Albert, E.N., 1979, Reversibility of microwave-induced blood-brain-barrier permeability, Radio Sei. 14/6 Supplement: 323-327.
Arber, S.L., 1981, The effect of microwave radiation on passive membrane properties of snail neurons, J. Microwave Power 16:15-20.
Arber, S.L., and Lin, J.C., 1985a, Microwave-induced changes in nerve cells: effects of modulation and temperature, Bioelectromagnetics 6:257-270.
Arber, S.L., and Lin, J.C., 1985b, Extracellular calcium and microwave enhancement of membrane conductance in snail neurons, Radiat. Environ. Biophys. 24:149-156.
Baranski, S., 1971, Effect of chronic microwave irradiation on the blood forming system of guinea pigs and rabbits, Aerospace Med. 42:1196-1199.
Baranski, S., 1972a, Histological and histochemical effect of microwave irradiation on the central nervous system of rabbits and guinea pig, Am. J. Phys. Med. 51: 182-191.
Baranski, S., 1972b, Effect of microwaves on the reactions of white blood cells system, ActaPhysiol. Pol. 23: 687-695.
Baranski, S., and Czerski, P., 1976, Microwave effects on blood and the blood-forming system, In: Biological Effects of Microwaves, Dowden, Hutchinson & Ross, Inc., Stroudsburg, PA Pp 137-146.
252

Barron, B.A., and Van Loon, G.R., 1989, Role of sympathoadrenomedullary system in cardiovascular response to stress in rats, J. Autonomie Nervous System 28: 179-188.
Baum, S.J., 1979, Tests of biological integrity in dogs exposed to an electromagnetic pulse environment, Health Phys. 36: 159-165.
Baum, S.J., Ekstrom, M.E., Skidmore, W.D., Wyant, D.E., and Atkinson, J.L., 1976, Biological measurements in rodents exposed continuously throughout their adult life to pulsed electromagnetic radiation, Health Phys. 30:161-166.
Bernardi, P., and D'Inzeo, G., 1984, A nonlinear analysis of the effects of transient electromagnetic fields on excitable membrane, IEEE Trans. Microwave Theory Tech. 32: 670-679.
Birenbaum, L., Grosof, G.M., Rosenthal, S.W., and Zaret, MM., 1969, Effect of microwaves on the eye, IEEE Trans. Biomed. Eng. 16: 7-14.
Birenbaum, L., Kaplan, I.T., Metlay, W., Rosenthal, S.W., and Zaret, M.M., 1975, Microwave and Infra-red effects on heart rate, respiration rate and subcutaneous temperature of the rabbit, J. Microwave Power 10: 3-18.
Blair, H.A., 1932, On the intensity-time relations for stimulation by electric current, J. Gen. Physiol. 15:177-185, 709-729, 731-755.
Blick, D.W., Adair, E.R., Hurt, W.D., Sherry, C.J., Walters, T.J., and Merritt, J.H., 1997, Thresholds of microwave-evoked warmth sensations in human skin, Bioclcctromagnctics 18: 403-409.
Bock, T.J., 1988, EMP test of implantable cardiac pacemakers, U.S. Army Laboratory Command, Harry Diamond Laboratories, Adelphi, MD, Report HDL-TR-2197.
Brown, D.O., Lu, S.-T., and Elson, E.C., 1994, Characteristics of microwave evoked body movements in mice, Bioelectromagnetics 15:143-161.
Brown, P.V.K., end Wyeth, N.C., 1983, Laser interferometer for measuring microwave- induced motion in eye lens in vitro, Rev. Sei. Instrum. 54: 85-89.
Cain, CA., and Rissman, W.J., 1978, Mammalian auditory responses to 3.0 GHz microwave pulses, IEEE Trans. Biomed. Eng. 25: 288-293.
Chatterjee, I.D., Wu, D., and Gandhi, O.P., 1986, Human body impedance and threshold currents for perception and pain for contact hazard analysis in the VLF-MF band, IEEE Trans. Biomed. Eng. 33: 486-494.
Chen, J.-Y., and Gandhi, O.P., 1991, Currents induced in an anatomically based model of human for exposure to vertically polarized electromagnetic pulses, IEEE Trans. Microwave Theory Tech. 30: 31-39.
Chnu, C.-K., and Guy, A.W., 1978, Effects of electromagnetic fields on isolated nerve and muscle preparations, IEEE Trans. Microwave Theory Tech. 26: 141-147.
Chou, C.K., Guy, A.W., Galambos, R., and Lovely, R.H., 1975, Cochlea microphonics generated by microwave pulses, J. Microwave Power 10: 361-367.
Chou, C.K., Guy, AW., and Galambos, R, 1976, Microwave-induced auditory response: cochlear microphonics, In: Biological Effects of Electromagnetic Waves, Vol. I, C.C. Johnson and MX. Shore, eds., FDA/BRH, Rockville, MD., HEW Publication (FDA) 77-8010, pp 291-296.
Chou, C.K., Guy, A.W., and Galambos, R., 1982a, Auditory perception of radio-frequency electromagnetic fields. J. Acoust. Soc. Am. 71:1321-1334.
Chou, C.-K., Guy, A.W., McDougall, J.A. and Han, L.-F., 1982b, Effects of continuous and pulsed chronic microwave exposure on rabbits, Radio Sei. 17/5 Supplement: 185-193.
253

Chou, C.K., Han, L.F., and Guy, AW., 1980, Microwave radiation and heart-beat rate of rabbits, J. Microwave Power 15: 87-93.
Clapman, R.M., and Cain, CA, 1975, Absence of heart rate effects in isolated frog heart irradiated with pulse modulated microwave energy, J. Microwave Power 10: 411-419.
Cleary, S.F., Nicldess, F., Liu, L.M., and Hoffman, R., 1980, Studies of exposure of rabbits to electromagnetic pulsed fields, Bioelectromagnetics 1: 345-352..
Cordts, R.E., Merritt, J.H., Erwin, D.N., Hardy, K.A., and Yochmowitz, M.G., 1988, Behavioral Response of Rats Exposed to High-Power Microwave Radiation, USAF School of Aerospace Medicine, Brooks Air Force Base, TX, USAF SAM-TR-87-30 (DTICADA192199).
Creighton, M.O., Larsen, L.E., Stewart-DeHaan, P.J., Jacobi, J.H., Sanwal, M., Baskerville, J.C., Bässen, HE, Brown, DO, and Trevithick, JR., 1987, In vitro studies of microwave-induced cataract, JQ. comparison of damage observed for continuous wave and pulsed microwaves. Exp. Eye Res. 45: 233-246.
Czerska, Ü.M., Elson, E.C., Davis, C.C., Swicord, M.L., and Czerski, P., 1992, Effects of continuous and pulsed 2450-MHz radiation on spontaneous lymphoblastoid transformation of human lymphocytes in vitro, Bioelectromagnetics 13:247-259.
Czerski, P., Paprocka-Stonka, E., Siekierzynski, M., and Stolarska, A., 1974, Influence of microwave radiation on the hematopoietic system, In: Biological Effects and Health Hazards ofMivrvwuve Radiation, P. Czerski, Ch. Silverman, K. Ostrowski, MJ. Suess, M.L. Shore, and B. Waldeskog, eds., Polish Medical Publishers, Warsaw, Poland, pp 67-74.
Dalziel, C.F., and Mansfield, T.H., 1950, Effects of frequency on perception currents, AIEE Trans. 69:1162-1168.
Davis, M-, 1980, Neurochemical modulation of sensory-motor reactivity: acoustic and tactil startle reflexes, Neurosci. Beh. Rev. 4: 241-263.
D'Andrea, J.A., Knepton, J., Cobb, B.L., Klauenberg, B., and Merritt, J.H., 1989, High Peak PowerMicrowave Pulses at 2.37 GH: no effects on vigilance performance in monkeys, Naval Aerospace Medical Research Laboratory, Pensacola, PL, and USAF School of Aerospace Medicine, Brooks AFB, TX, NAMRL-1348, and USAFSAM TR-89-21 (DTIC ADA219570).
D'Andrea, J.A., Cobb, Bl., Knepton, J., Shull, R.N., and Klauenberg, B.J., 1990, No Effects of High-Peak-Power Microwave Pulses at 2.36 GHz on Behavioral Performance in Monkeys, Naval Aerospce Medical Research Laboratory, Pensacola, FL, and USAF School of Aerospace Medicne, Brooks AFB, TX, NMRL-1358 and USAF SAMTR-90-14 (DTIC ADA283667).
D'Andrea, J.A., Cobb, B.L., Knepton, J., and Bates, F., 1993, Behavioral Performance in Monkeys Exposed to TEMPO High-Peak-Power Microwave Pulses at 3 GHz, Naval Medical Research Laboratory, Pensacola, FL, NAMRL-1389, (DTIC ADA280551).
D'Andrea, J.A, Thomas, A, and Hatcher, D.J., 1994, Rhesus monkey behavior during exposure to high-peak-power 5.62-GHz microwave pulses, Bioelectromagnetics 15: 163-176.
deLorge, J.O., 1984, Operant behavior and colonic temperature of Macaca mulatta exposed to radiofrequency fields at and above resonant frequency, Bioelectromagnetics 5: 233- 246.
254

Eijkman, R, and Vendrik, A.J.H., 1961, Dynamic behavior of the warm sense organ, J. Exp. Psychol. 62: 403-408.
Ellis, V.J., 1991, The effects of electromagnetic pulse (EMP) on cardiac pacemakers, U.S. Army Laboratory Command, Harry Diamond Laboratories, Adelphi, MD, Report HDL-TR-2197 (DTIC ADA242990).
Erwin, D.N., and Hurt, W., Biological effects of ultrawideband emmissions, In: EMP Human Health Effects Science Review Panel Proceedings, I de Lorge and W. Miclc, eds., U.S. Navy Theater Nuclear Warfare Program and Operational Medicine and Fleet Support, Washington, DC, pp 91-95.
Ferrari, AU., DafTonchio, A, Albergati, F., and Mancia, G., 1987, Inverse relationship between heart rate and blood pressure variability in rats, Hypertension 10: 533-537.
Fleshier, M., 1965, Adequate acoustic stimulus for startle reaction in the rat, J. Com. Physiol. Psychol. 60: 200-207.
Foster, K.R., and Finch, E.D., 1974, Microwave hearing: evidence for thermoacoustical auditory stimulation by pulsed microwave. Science 185: 246-248.
Foster, P.R., 1995, Special antenna requirements for UWB Radar Systems, Introduction, In: Introduction to Ultra-Wideband Radar System, J.D. Taylor, ed., CRC Press, Boca Raton, FL, pp 107-149.
Frei, M.R., and Jauchem, J.R, 1989, Effects of 2.8-GHz Microwaves on restrained and ketamine-anesthetized rats. Radial. Environ. Biophys. 28; 155-164.
Frei, M., Jauchem, J., and Heinmets, F., 1988, Physiological effects of 2.8 GHz radio- frequency radiation: a comparison of pulsed and continuous-wave radiation, J. Microwave Power 23: 85-93.
Frei, M., Jauchem, J., and Heinmets, F., 1989, Thermoregulatory responses of rats exposed to 9.3-GHz radiofrequency radiation, Radiat. Environ. Biophys. 28: 67-77.
Frei, M.R., Jauchem, J.R., and Padilla, J.M., 1989a, Thermal and physiological changes in rats exposed to CW and pulsed 2.8 GHz radiofrequency radiation in E and H orientation, Int. J. Radiat. Biol. 56: 1033-1044.
Frey, AH., 1961, Auditory system response to radio frequency energy, Aerospace Med. 32: 1140-1142.
Frey, A.H., and Feld, S.R., 1975, Avoidance by rats of illumination with low power nonionizing electromagnetic energy, J. Comp. Physiol. Psychol. 89: 183-188.
Frey, AH., Feld, S.R., and Frey, B., 1975, Neural function and behavior: defining the relationship. Ann. N.Y. Acad. Sei. 247:433-439.
Frey AH., and Seifert, E., 1968, Pulse modulated UHF energy illumination of the heart associated with change in heart rate. Life Sei. 7: 505-512.
Fuerer, D., 1991, Electronic countermeasures in wideband spectrum systems, In: Propagation Limitations for Systems Using Band Spreading, Advisory Group for Aerospace Research and Development, AGARD-LS-172, pp 1-11.
Gailey, P.C., and Easterly, C.E., 1993, Cell membrane potentials induced during exposure to EMP fields, In: EMP Human Health Effects Science Review Panel Proceedings, J. de Lorge and W. Mick, eds., U.S. Navy Theater Nuclear Warfare Program and Operational Medicine and Fleet Support, Washington, D.C., pp 133-139.
Gao, B.-Q., Gandhi, O.P., Mathur, S., Bates, F., and Bässen, H., 1992, Currents induced in a model of a rat exposed to EMP in a paralleUplate line: calculations and experimental results, Bioelectromagnetics 13: 439-443.
255

Geddes, L.A., and Baker, L.E., 1989, Principles ofAppliedBiomedical Instrumentation, 3rd edition, John Wiley, New York, NY, p. 961.
Ginsburg, K.S., Lin, J.C., and O'Neill, W.D., 1992, Microwave effects on input resistance and action potential firing of snail neuron, IEEE Trans. Biomed. Eng. 39: 1011-1021.
Goldman, H, Lin, J.C., Murphy, S., and Lin, M.F., 1984, Cerebrovascular permeability to ^Rb in the rat after exposure to pulsed microwaves, Bioelectromagnetics 5:323-330.
Gruenau, S.P., Oscar, K.J., Folker, M.T., and Rapoport, S.I., 1982, Absence of microwave effect on blood-brain barrier permeability to "C-sucrose in the conscious rat, Exp.
Neurobiol. 75:299-307. Guy, AW., 1989, Analysis of EMP induced currents in human body by NEC method of
moments, Proc. Ann. Int. Conf. IEEEEMBS 11: 1132-1133. Guy, A.W., 1990, Maximum induced currents, SAR and absorbed energy density in human
and non-human primates exposed to EMP, Proc. Ann. Int. Conf IEEE EMBS 12: 1547-1548.
Guy, A.W., and Chou, C.-K., 1982, Effects of high-intensity microwave pulse exposure of rat brain, Radio Sei. 17/5 Supplement: 169-178.
Guy, W., Chou, C.K., Lin, J.C., and Christense, D., 1975, Microwave-induced acoustic effects in mammalian auditory systems and physical materials, N.Y. Acad. Sei. 247: 194-218.
Hagmann, M.J., 1993, Human dosimetry in EMP exposures with minimally-perturbing current probes, In: EMP Human Health Effects Science Review Panel Proceedings, J. de Lorge and W. Mick, eds., U.S. Navy Theater Nuclear Warfare Program and Operational Medicine and Fleet Support, Washington, D.C., pp 59-78.
Hamrick, P., and McRee, D.I., 1980, The effect of 2450 MHz microwave irradiaiton on the heart rate of embryonic quail, Health Phys. 38: 261-268.
Hanson-Mild, K., Lovdahl, L., Lovstrand, K.-G, and Lovtrup, S., 1982, Effect of high- voltage pulses on the viability of human leukocytes in vitro, Bioelectromagnetics 3: 213-218.
Hendler, E., 1968, Cutaneous receptor response to microwave irradiation, In: Thermal Problems in Aerospace Medicine, J.D. Hardy, ed., UnwinLtd., Surry, pp 149-161.
Hendler, E., Hardy, J.D., and Murgatroyd, D., 1963, Skin heating and temperature sensation produced by microwave irradiaiton, In: Temperature: Its Measurement and Control in Science and Industry, CM. Herzfeld, ed., Reinhold, New York, NY, pp 211-230.
Hirsh, F.G., McGiboncy, D.R., and Harnish, T.D., 1968, The psychologic consequences of
exposure to high density pulsed electromagnetic energy, Int. J. Biometeror. 12: 263- 270.
Hjeresen, D.L., Doctor, S.R., and Sheldon, R.L., 1978, Shuttle side preference as mediated by pulsed microwave and conventional auditory cues, In: Electromagnetic Fields in Biological Systems, S.S. Stuchly, ed., IMPI, Edmonton, Canada, pp 194-214.
Houdi, A.A., Dowell, R.T., and Diana, IN., 1995, Cardiovascular responses to cigarette smoke exposure in restrained conscious rats, J. Pharmacol. Exp. Therap. 275:646- 653.
Hurt, W.D., 1999, Dosimetry in animals exposed to ultra-wide-band pulses produced by various Air Force devices, personal communication.
256

ICNIRP 1998, Guidelines for limiting exposure to time-varying electric, magnetic, and electromagnetic fields (up to 300 GHz), Health Phys. 74: 494-522.
IEEE, 1999, IEEE Standard for Safety Levels with Respect to Human Exposure to Radio Frequency Electromagnetic Fields, 3 kHz to 300 GHz, Institute of Electrical and Electronics Engineers, New York, NY.
Jauchem, J.R., Seaman, R.L., Lehnert, H.M., Mathur, S.P., Ryan, K.L., Frei, M.R., and Hurt, W.D., 1998, Ultra-wideband electromagnetic pulses: lack of effects on heart rate and blood pressure during two-minute exposures of rats, Bioelectromagnetics 19:330- 333.
Jauchem, J.R, Frei, MR., Ryan, K.L., Merritt, J.H., and Murphy, M.R., 1999, Lack of effects on heart rate and blood pressure in ketamine-anesthetized rats briefly exposed to ultra-wideband electromagnetic pulses, IEEE Trans. Biomed. Eng. 46:117-120.
Johnson, RB., Meyers, D.E., Guy, A.W., Lovely, R.H., and Galambos, R, 1976, Discrinrininative control of appetitive behavior by pulsed microwave radiation in rats, In: Biological Effects of Electromagnetic Waves, C.C. Johnson, andM.L. Shore, eds., FDA, Rockville, MD, HEW Publication (FDA) 77-8010, pp 238-247.
Jokela, K., 1997, Electro-physiological considerations relevant to the limiting of pulsed electric and magnetic fields, Health Phys. 72:408-417.
Justesen D.R, Adair, E.R., Stevens, J.C., Bruce-Wolfe, V., 1982, A comparative study of human sensory thresholds: 2450-MHz microwaves vs far-infrared radiation, Bioelectromagnetics 3: 117-125.
Kanter, G.S., 1960, Gtomerular filtration and renal plasma flow during hyperthermia, Am. J. Physiol. 198: 1044-1048.
Klauenberg, B.J., Merritt, J.H., and Erwin, D.N., 1988, Behavioral Effects of Exposure to the TEMPO High-Power Microwave System, USAF School of Aerospace Medicine Brooks Air Force Base, TX, USAFSAM-TR-87-35 (DTIC ADA193305).
Kues, H.A. Hirst, L.W., Lutty, G.A., D'Anna, S.A., and Dunkelberger, G.R., 1985, Effects of 2.45 GHz microwaves on primate cornea! endothelium, Bioelectromagnetics 6: 177- 188.
Lacourse, J.R., Vogt, M.C., Miller, M.T., and Selikowitz, S.M., 1985, Effect of high- frequency current on nerve and muscle tissue, IEEE Trans. Biomed. Eng. 32: 82-86.
Lai, H., 1994, Neurological effects of radiofrequency electromagnetic radiation, In: Advances in Electromagnetic Fields in Living Systems, J.C. Lin ed., Plenum Press, New York, NY, pp. 27-80.
Lai, H., Horita, A., Chou, C.K., and Guy, A.W., 1987, Low-level microwave iiiadiaiton
affects central cholinergic activity in the rat, J. Biochem. 48:40-45. Lai, H., Horita, A., and Guy, A.W., 1988, Acute low-level microwave exposure and central
cholinergic activity: studies on irradiation parameters, Bioelectromagnetics 9:355-362. Lai, H,, Horita, A., and Guy, A.W., 1994, Microwave irradiation affects radial-arm maze
performance in the rat, Bioelectromagnetics 15: 95-104. Lebovitz, R.M., 1983, Pulse modulated and continuous wave microwave radiation yield
equivalent changes in operant behavior of rodents, Physiol. Beh. 30: 891-898. Lebovitz, R.M., and Seaman, R.L., 1977, Microwave hearing: the response of single
auditory neurons in cat to pulsed microwave radiation, Radio Sei. 12/6 Supplement: 229-236.
257

Lee, R.C., Gaylor, DC, Bhatt, D., Israel, D.A., 1988, Role of cell membrane rupture in the pathogcnesis of electrical trauma, J. Surg. Res. 44: 709-719.
Lenox, R.H., Meyerhoff, J.L., Gandhi, O.P., and Wray, H.L., 1977, Regional levels of cyclic AMP in rat brain; pitfalls of microwave interaction. J. Clyclic Nucleotide Res. 3: 367-379.
Lin, J.C., 1975, Interaction of electromagnetic transient radiation with biological materials, IEEE Trans. Electromagnetic Compatibility 17: 93-97.
Lin, J.C., 1976, Electromagnetic pulse interaction with mammalian cranial structures, IEEE Trans. Biomed. Eng. 23:61-65.
Lin, J.C., 1976a, Microwave auditory effect - a comparison of some possible transduction mechanisms, J. Microwave Power 11: 77-81.
Lin, J.C., 1976b, Microwave induced hearing sensation: some preliminary theoretical observations, J. Microwave Power 11: 295-298.
Lin, l.C, 1976c, Theoretical znalysis of microwave-generated auditory effects in animals and man, In: Biological Effects of Electromagnetic Waves, C.C. Johnson andM.L. Shore, eds., FDA/BRH, Roclcville, MD, HEW Publication (FDA) 77-8010, pp 36-48.
Lin, J.C., 1977, On microwave-induced hearing sensation. IEEE Trans. Microwave Theory Tech,, 25: 605-613.
Lin, J.C., 1978, Microwave Auditory Effects and Applications, Charles C. Thomas, Springfield, EL.
Lin, J.C., 1980, Microwave auditory phenomenon, Proc. IEEE 68: 67-73. Lin, J.C., 1989, Pulsed radiofrequency field effects in biological systems, In:
Electromagnetic Interaction with Biological Systems" l.C. Lin ed., Plenum Press, New York, NY, pp 165-177.
Lin, J.C., 1990, Auditory perception of pulsed microwave radiation, In: Biological Effects and Medical Applications of Electromagnetic Energy, O.P. Gandhi, ed., Prentice Hall, Englewood Cliffs, NJ, pp 277-318.
Lin, J.C., and Lam, C.K., 1976, Coupling of Gaussian electromagnetic pulse into a muscle- bone model of biological structure, J. Microwave Power 11: 67-75.
Lin, J.C., and T.in, M.F., 1980, Studies on microwave and blood-brain barrier interaction, Bioelectromagnetics 1: 313-323.
Lin, J.C., and Lü\ M.F., 1982, Microwave hyperthermia-induced blood-brain barrier alteration, Kadiat. Res. 89: 77-87
Lin, J.C., Meltzer, R.J., and Redding, F.K., 1979, Microwave-evoked brainstem potentials in cats, J. Microwave Power 14: 291-296.
Lin, J.C., Meltzer, R.J., and Redding, F.K., 1982, Microwave-evoked brainstem auditory responses, Proc. San Diego Biomed. Symp. 17: 461-465.
Lin, J.C., Su, I.-L., and Wang, Y., 1988, Microwave-induced thermoelastic pressure propagation in the cat brain, Bioelectromagnetics 9:141-147.
Lin, J.C., Wu, C.-L., and Lam, C.K., 1975, Transmission of electromagnetic pulse into the head, Proc. IEEE 63: 1726-1727.
Lippmann, M., Appel, P.L., Mok, M.S., and Shoemaker, W.C., 1983, Sequential cardiorespiratory patterns of anesthetic induction with ketamine in critically ill patients, Critical CareMed. 11: 730-733.
Liu, L.M., Rosenbaum, F.J., and Pickard, W.F., 1976, The insensitivity of frog heart rate to pulse modulated microwave energy, J. Microwave Power 11: 225-232.
258
Lu, S.-T., Brown, D.O., Johnson, C.E., Mathur, S.P., and Elson, E.C., 1992, Abnormal cardiovascular responses induced by localized high power microwave exposure, IEEE Trans. Biom. Eng. 39: 484-492.
Lu, S.-T., Mathur, S.P., Akyel, Y, and Lee,/., 1999, Ultrawide-band electromagnetic pulses induced hypotension in rats, Physiol. Beh. 65: 753-761,
Lu, S.-T., Roberts, N.J., Jr., and Michaelson, S.M., 1983, A dual vial waveguide exposure facility for examining microwave effect in vitro, J. Microwave Power 18: 121-131.
Mathur, S., Bates, F., and Bässen, H., 1990, Exposure of rodents in a parallel plate EMP simulator, Part I: Engineering and dosimetry, Proc. Ann. Int. Conf. IEEE EMBS 12: 1549-1550.
Mattsson, J.L., and Oliva, S. A, 1976, Effect of electromagnetic pulse on avoidance behavior and electroencephalogram of a rhesus monkey, Aviat. Space Environ. Med. 47: 644-648.
McRee, D.I., and Wachtel, H., 1980, The effects of microwave radiation on the vitality of isolated frog sciatic nerves, Radiat. Res. 82: 536-546.
McRee, D.I., and Wachtel, H., 1982, Pulse microwave effects on nerve vitality, Radiat. Res. 91:212-218.
McLees, B.D., Finch, E.D., and Albright, M.L., 1972, An examination of regenerating hepatic tissue subjected to radio-frequency irradiation, J. Appl. Physiol. 32:78-85.
Merritt, J.H., Charmless, A.F., and Allen, S.J., 1978, Studies on blood-brain barrier permeability after microwave-radiation, Radiat. Environ. Biophy. 15:367-377.
Merritt, J.H., Kiel, J.L., and Hurt, W.D., 1995, Considerations for human exposure standards for fast-rise-time high-peak-power electromagnetic pulses, Aviat. Space Environ. Med. 66: 586-589.
Michaelson, S.M., and Lin, J.C., 1987, Personnel protection, protection guides, and standards, In: Biological Effects and Health Implications ofRadiofrequency Radiation, ch. 20, Plenum Press, New York, NY, pp 637-658.
Michaelson, S.M., and Lin, J.C., 1987a, The common integument (skin), In: Biological Effects and Health Implications ofRadiofrequency Radiation, ch. 17, Plenum Press, New York, NY, pp S39-S58.
Miller, S.A., Bronson, M.E., and Murphy, M.R., 1999, Ultrawideband radiation and pentylenetetrazol-induced convulsions in rats, Bioelectromagnetics 20: 327-329.
Modak, A.T., Stavinoha, W.B., and Deam, A.P., 1981, Effect of short electromagnetic pulses on brain acetylcholine content and spontaneous motor activity of mice, Bioelectromagnetics 2: 89-92.
Moore, F.R., and Simons, T., 1993, Orientation behavior of migratory birds in response to EMPRESS II-simulated EMP, In: EMP Human Health Effects Science Review Panel Proceedings, J. de Lorge and W. Mick, eds., U.S. Navy Theater Nuclear Warfare Program and Operational Medicine and Fleet Support, Washington, D.C., pp 97-112.
Mouneimne, Y., Tosü P.-F., and Nicolau, C, 1993, Electroinsertion of proteins into membranes: a novel approach to the study of membrane receptors, In: Electricity and Magnetism in Biology and Medicine, M. Blank, ed., San Francisco Press, San Francisco, CA pp 112-114.
Muhm, J.M., 1992, Mortality investigation of workers in an electromagnetic pulse test program, J. Occup. Med. 34: 287-292.
259

Neilly, J.P., and Lin, J.C., 1986, Interaction of ethanol and microwaves on the blood-brain barrier of rats. Bioclcctromagnctics 7: 405-414.
Neshev, N.N., and Kirilova, E.I., 1996, Environmental-health aspects of pulse-modulated microwaves, Rev. Environ. Health 11: 85-88.
Neumann, E., Werner, E., Spraflce, A., and Kroger, K., 1993, Membrane electroporation: two are a molecular mechanism, In: Electricity and Magnetism in Biology and Medicine, M. Blank, ed., San Francisco Press, San Francisco, CA, pp 109-111.
Newman, E., and Katchalsky, A., 1972, Long-lived conformation changes induced by electric impulses in biopolymers, Proc. Nat. Acad. Sei. 69: 993-997.
NCRP Report 86,1986, Perception of PFEM fields, In: Biological Effects and Exposure Criteria for Radiofrequency Fields, National Research Council on Radiation Protection and Measurements, Bethesda, MD, pp 175-180.
Oldendorf, W.H., 1970, Measurement of brain uptake of radiolabelcd substances using tritiated water internal standard, Brain Res. 24: 372-376.
Olsen, K.G., and Lin, J.C., 1981, Microwave pulse-induced acoustic resonances in spherical head models, DSEE Trans. Microwave Theory Tech. 29:1114-1117.
Olsen, R.G., and Lin, J.C., 1983, Microwave-induced pressure waves in mammalian brains, IEEE Trans. Biomed. Eng. 30: 289-294.
Oscar, K.J., Gruenau, S.P., Folker, M.T., and Rapoport, S.I., 1981, Local cerebral blood flow after microwave exposure, Brain Res. 204; 220-225.
Oscar, K.J., and Hawkins, T.D., 1977, Microwave alteration of the blood-brain barrier system of rats, Brain Res. 126: 281-293.
Paile, W., Jokela, K., Koivistoinen, S., and Salomaa, S., 1995, Effect of 50 Hz magnetic fields and spark discharges on human lymphocytes in vitro, Bioelectrochem. Bioenergy 36: 15-22.
Pakhomov, A.G., Dubovick, B.V., Degtyariov, I.G., and Pronkevick, A.N., 1995, Microwave influence on the isolated heart function: I. effect of modulation, Bioelectromagnetics 16: 241-249.
Pakhomova, O.N., Belt, ML, Mathur, S.P., Lee, J.C., and Akyel, Y, 1997, Lack of genetic effects of ultrawide-band electromagnetic radiation in yeast, Electro-Magnetobiol. 16: 195-201.
Pakhomova, O.N., Belt, MX., Mathur, S.P., Lee, J.C., and Akyel, Y, 1998, Ultra-wide band electromagnetic radiation does not affect UV-induced recombination and mutagenesis in yeast, Bioelectromagnetics 19:128-130.
Patrick, EX., [1993], Human health issues of woodbridge research facility's electromagnetic pulse simulators, In: EMP Human Health Effects Science Review Panel Proceedings, J. de Lorge and W. Mick, eds., U.S. Navy Theater Nuclear Warfare Program and Operational Medicine and Fleet Support, Washington, D.C., pp 23-37.
Porsolt, R.D., Anton, G., Blavet, N, and Jalfre, M., 1978, Behavioral despair in rats: a new model sensitive to antidepressant treatments, Eur. J. Pharmacol. 47: 379-391.
Postow, E., and Swicord, MX., 1996, Modulated fields and "window" effects, In: CRC Handbook of Biological Effects of Electromagnetic Fields, C. Polk and E. Postow, eds., CRC Press, Boca Raton, FL, pp 535-580.
Presman, A.S., and Levitina, N. A., 1963, Nonthermal action of microwaves on the rhythm of cardiac contractions in animals, Bull. Exp. Biol. Med. 53: 154-157.
260

Preston, E., Vavasour, E.J., and Assenheim, H.M., 1979, Permeability of the blood-brain barrier to mamiitol in the rat following 2450 MHz microwave irradiation, Brain Res. 174: 109-117.
Rafferty, C.N., and Knutson, J.R., 1987, EflGects of pulsed microwave fields on soluble proteins and liposomes, Proc. Ann. Int. Corf. IEEE EMBS 9:701-702.
Raslear, T.G., Akyel, Y., Bates, F., Lu, S.-T., andElson, E.C., 1993a, The Behavioral Toxicology of High-Peak, Low Average Power, Pulsed'Micrwm>e Irradiation, USAMRDC, Washington, DC. (DTIC ADA268392).
Raslear, T.G., Akyel, Y., Bates, F., Belt, M., and Lu, S.-T., 1993b, Temporal bisection in rats: The effects of high-peak-power pulsed microwave irradiation, Bioelectromagnetics 14:459-478.
Raslear, T.G., Akyel, Y., Lu, S.-T., Swearengen, J.R., Varle, D., DeAngelis, M.L., and Seaman, R.L., 1992, CW microwave fields evoke body movements in bilaterally cochleotomized rats, Proc. Ann. Int. Conf. IEEE EMBS 14:295-296.
Raslear, T.G., Akyel, Y, Serafini, R., Bates, F., and Belt, M, 1991a, Memory consolidation in the rat following high-peak power pulsed microwave irradiation. Proc. Ann. Int. Conf TREE EMBS 13: 958-959.
Raslear, T.G., Akyel, Y., Serafini, R., Bates, F., and Belt, M., 1991b, Food demand and circadian rhythmicity following high-peak power pulsed microwave irradiation. Proc. Ann. Int. Conf. IEEE EMBS 13: 962-963.
Reilly, J.P., 1991, Magnetic field excitaton of peripheral nerves and the heart: a comparison of thresholds, Med. Biol. Eng. Comput. 29: 571-579.
Reilly, J.P., 1998, Maximum pulsed electromagnetic field limits based on peripheral nerve stimulation: Application to B3EE/ANSI C95.1 electromagnitic field standards, IEEE Trans. Biomcd. Eng. 45: 137-141.
Riu, P.J., Foster, K.R., Bück, D.W., and Adair, E.R.1997, A thermal model for human threshold of microwave-evoked warmth sensations, Bioelectromagnetics 18: 578-583.
Roberti, B., Heebels, G.H., Hendricx, J.C.M., de Greef, A.H.AM., and Wolthuis, O.L., 1975, Preliminary investigations of the effects of low-level microwave radiation on spontaneous motor activity in rats. Ann. N.Y. Acad. Sei., 247: 416-424.
Roberts, N.J., Jr., Lu, S.-T., and Michaelson, S.M., 1983, Human leukocyte functions and the U.S. Safety standard for exposure to radio-frequency radiation, Science 220: 318- 320.
Roberts, N.J., Jr., Lu, S.-T., and Michaelson, S.M., 1985, Hyperthermia and human leukocyte functions: DNA RNA and total protein synthesis after exposure to <41 ° or >42.5° hyperthennia, Cancer Res. 45:3076-3082.
Roberts, N.J., Jr., Michaelson, S.M., and Lu, S.-T., 1984, Exposure of human mononuclear leukocytes to microwave energy pulse modulated at 16 and 60 Hz, IEEE Trans. Microwave Theory Tech. 32: 803-807.
Roberts, N.J., Jr., Michaelson, S.M., and Lu, S.-T., 1987, Mitogen responsiveness after exposure of influenza virus-infected human mononuclear leukocytes to continuous or pulse-modulated radiofrequency radiation, Radiat. Res. 110:353-361.
Sanders, AP., Joines, W.T., and Allis, J.W., 1985, Effects of continuous-wave, pulsed, and sinusoidal-amplitude-modulated microwaves on brain energy metabolism, Bioelectromagnetics 6: 89-97.
261

Sandler, S.S., Smith, G.S., and Albert, E.N., 1975, Electromagnetic field effects in nerve tissue, Aviat. Space Environ. Med. 46: 1414-1417.
Schwartz, D.C., and Koval, M., 1989, Conformational dynamics of individual DNA molecules during gel electrophoresis, Nature 338: 520-522.
Schneider, D.R., Fell, B.T., and Goldman, H., 1982, On the use of microwave radiation energy for brain tissue fixation, J. Neurochem. 38:749-752.
Seaman, R.L., 1993, Modification of acoustic startle amplitude by microwave pulses, In: Electricity and Magnetism in Biology andMedicine, M. Blank, ed., San Francisco Press, San Francisco, CA, pp 662-664.
Seaman, R.L., and Beblo, D.A., 1992, Modification of acoustic startle by microwave pulses in the rat: a preliminary report, Bioelectromagnetics 13:323-328.
Seaman, R.L., Beblo, D.A., andRastear, T.G., 1994, Modification of acoustic and tactile startle by single microwave pulses, Physiol. Behav. 55:587-595.
Seaman, R.L., and DeHaan, R.L., 1993, Inter-beat intervals of cardiac-cell aggregates during exposure to 2.45 GHz CW, pulsed, and square-wave-modulated microwaves, Bioelectromagnetics 14: 41-55.
Seaman, R.L., and Wachtel, H., 1978, Slow and rapid responses to CW and pulsed microwave radiation by individual Aplysia pacemakers, J. Microwave Power 13: 77- 86.
Seaman R.L., Belt, M.L., Doyle, J.M., and Mathur, S.P., 1998, Ultra-wideband Electromagnetic pulses and morphine-induced changes in nociception and activity in mice, Physiol. Beh. 65: 263-270.
Seaman, R.L., Kiel, R.L., Parker, J.E., Grubbs, T.R., andProl, H.K., 1996, Effects of ultra- wide-band pulses on nitric oxide production in murine macrophages, In: Abstracts of the Bioelectromagnetics Society 18th Annual Meeting, Bioelectromagnetics Society, Frederick, MD, p 213.
Seaman, R.L., Belt, M.L., Doyle, J.M., and Mathur, S.P., Hyperactivity caused by a nitric oxide synthase inhibitor is countered by ultra-wideband pulses. Bioelectromagnetics 20: 431-439.
Sherry, C. J., Blick, D.W., Walters, T.J., Brown, G.C., and Murphy, MR., 1995, Lack of behavioral effects in non-human primates after exposure to ultrawideband electromagnetic radiation in the microwave frequency range, Radiat. Res. 143:93-97.
Skidmore, W.D., and Baum, S.J., 1974, Biological effects in rodents exposed to 10* pulses of electromagnetic radiation, Health Phys. 26: 391-398.
Sparrow, M.G., Roggendorf, H., and Vogel. WJJ., 1987. Effect of etfianol on heart rate and blood pressure in nonstressed and stressed rats, Life Sei. 40: 2551-2559.
Stevens, J.C., 1983, Thermal sensation: infrared and microwaves, In: Microwaves and Thermoregitlaiion, E.R. Adair, ed., Academic Press, New York, NY, pp 191-201.
Stewart-DeHaan, P.J., Creighton, M.O., Jacobi, J.H., Ross, W.M., SanwalM., Guo, T.C., Guo, W.W., and Trevithick, J.R., 1983, In vitro studies of microwave-induced cataract: separation of field and heating effects, Exp. Eye Res. 36: 75-90.
Stewart-DeHaan, P.J., Creighton, M.O., Larsen, L.E., Jacobi, J.H., Sanwal, M., Baskerville, J.C., and Trevithick, J.R., 1985, In vitro studies of microwave-induced cataract: reciprocity between exposure duration and dose rate for pulsed microwaves, Exp. Eye Res. 40:1-13.
262

Stodolnik-Baranska, W., 1974, The effect of microwaves on human lymphocyte cultures, In: Biological Effects and Health Hazards of Microwave Radiation, P. Czerski, Ch. Silverman, K. Ostrowski, M.J. Suess, M.L. Shore, and B. Waldeskog, eds., Polish Medical Publishers, Warsaw, Poland, pp 189-195.
Sutton, CM., and Carroll, F.B., Effects of microwave-induced hyperthermia on the blood- brain barrier of the rat, Radio Sri. 14/6 Supplement: 329-334.
Taylor, E.M., and Ashleman, B.T., 1974, Analysis of central nervous system involvement in the microwave auditory effect, Brain Res. 74: 201-208.
Tayior, J.D., 1995, Ultra-wideband radar overview, In: Introduction to Ultra-wideband Radar System, J.C. Taylor, ed., CRC Press, Boca Raton, FL, pp 1-10.
Thomas, J.R., Finch, E.D., Fülle, D.W., and Burch, L.S., 1975, Effects of low-level microwave radiation on behavioral baselines, Ann. N.Y. Acad. Sei. 247: 424-432.
Thomas, J.R., Schrot, J., and Banvard, R.A., 1982, Comparative effects of pulsed and continuous-wave 2.8-GHz microwaves on temporally defined behavior, Biaelectromagnetics 3: 227-235.
Tsong, T.Y., 1991, Electroporation of cell membranes, Biophys. J. 60:297-306. Trevithick, J.R., Creighton, M.O., Sanwal, M., Brown, D.O., and Bässen, H.I., 1987,
Histo-pathological studies of rabbit cornea exposed to millimeter waves, Proc. Ann. Conf. IEEE EMBS 9: 695-697.
Wachtel, H., Beblo, D.t Vargas, C, Bässen, H., and Brown, D., 1988, Single microwave pulses can suppress startle reflexes in mice, Proc. Ann. Int. Conf. IEEE EMBS 10: 911-912.
Wachtel, H., Beblo, D., Vargas, C, Bässen, H., and Brown, D., 1989, Comparison of the efficiency of pulsed versus CW microwave fields in evoking body movements, Proc. Ann. Int. Conf. IEEE EMBS 11: 1136-1137.
Wachtel, H., Seaman, R., and Joines, W., 1975, Effects of low-intensity microwaves on isolated neurons, Ann. N.Y. Acad. Sei. 245: 47-62.
Walters, T.J., Mason, P.A., Sherry, C.J., Steffen, C, and Merritt, J.H., 1995, No detectable bioeffects following acute exposure to high peak power ultra-wide band electromagnetic radiation in rats, Aviat. Space Environ. Med. 66: 562-567.
Wangemann, R.T., and Cleary, S.F., 1976, The in vivo effects of 2.45 GHz Microwave radiation on rabbit serum components and sleeping times, Rad. Environ. Biophys. 13: 89-103.
Williams, W.M., Hoss, W., Formaniak, M., and Michaelson, S.M., 1984a, Effect of 2450 MHz microwave energy on the blood-brain barrier to hydrophilic molecules. A. Effect on the permeability to sodium fluorescein, Brain Res. Rev. 7:165-170.
Williams, W.M., del Cerro, M., and Michaelson, S.M., 1984b, Effect of 2450 MHz microwave energy on the blood-brain barrier to hydrophilic molecules. B. Effect on the permeability to HRP, Brain Res. Rev. 7. 171-181.
Williams, W.M, Plattier, I, and Michaelson, S.M., 1984c, Effect of 2450 MHz microwave energy on the blood-brain barrier to hydrophilic molecules. C. Effect on the permeability to [14C]sucrose, Brain Res. Rev. 7:183-190.
Williams, W.M., Lu, S.-T., del Cerro, M., and Michaelson, S.M., 1984d, Effect of 2450 MHz energy on the blood-brain barrier to hydrophilic molecules. D. Brain temperature and blood-brain barrier permeability to hydrophilic tracers, Brain Res. Rev. 7: 191-212.
263

Williams, W.M., Lu, S.-T., del Cerro, M., Hoss, W., and Michaelson, S.M., 1984e, Effects of 2450 MHz microwave energy on the blood-brain barrier: an overview and critique of past and present research, IEEE Trans. Microwave Theory Tech. 32: 808-818.
Wolke, S., Neibig, U., Eisner, R., Gollnick, F., and Meyer, R, 1996, Calcium homeostasis of isolated heart muscle cells exposed to pulsed high-frequency electromagnetic fields, Bioelectromagnetics 17: 144-153.
Zimmermann, U., 1982, Electric field-mediated fusion and related electrical phenomena, Biophys. Acta 694:227-277.
264

SEARCH FOR THE EFFECT OF MILLIMETER WAVES ON SYNAPTIC PROCESSES IN THE CENTRAL NERVOUS SYSTEM
Andrei G. Pakhomov1. Kenneth H. Prol\ Satnam P. Mathur2, and Yahya Akycl2
'US Army Medical Research Detachment and "McKesson BioServices Brooks Air Force Base, San Antonio, TX 78235-5324 USA
INTRODUCTION
A number of studies have demonstrated that low-intensity millimeter waves (MMW) can affect the function of membranes and excitable tissues. A short-lerui MMW exposure activated Ca*+ pump in the sarcoplasmic reliculum of skeletal and heart muscles', modified the activation characteristics of Ca**-aclivatcd K+ channels2, suppressed or facilitated transmembranc chloride current'1, altered action potential conduction in isolated nerves'11 and cardiac pacemaker activity . The present work is the first attempt to study MMW effect on key processes of interneuronal interaction, namely on mono- and polysynaptic transmission in the central nervous system.
For this, we employed an isolated preparation of amphibian spinal cord. This preparation offers a unique combination of features which are essential for clcctrophysiologica! studies with electromagnetic fields. It is particularly important that the afferent input and the efferent output of the spinal cord are anatomically separated (dorsal and ventral roots, respectively). For analysis of synaptic processes, recording and stimulating electrodes can be attached to distal ends of the roots, at a distance from the cord Itself. Hence, when the cord Is exposed to MMW, the electrodes can be shielded from the radiation, thus removing questions about possible artifacts resulting from the electrode operation in the electromagnetic field. Most morphological and biochemical correlates of the spinal cord electrical activity are known in great detail", thus providing opportunities for understanding physiological mechanisms of MMW effects, if any arc observed.
As established in our previous studies with isolated nerve preparation', the MMW effect depended on the frequency rather than on the intensity of the radiation. Within studied limits, the frequency of 41.34 GHz. was the most effective. A 100-MHz deviation from this frequency (to cither direction) decreased the effect twofold, and a 200-MHz deviation eliminated the effect. Therefore, in the present study we used either a constant frequency of 41.34 GHz, or different frequencies within 41.1-42.4 GHz band.
MATERIALS AND METHODS
Spinal Cord Preparation and Data Acquisition
All experiments were performed on isolated and hemisected spinal cord of the bullfrog (Rana cale.thiana). Prior lu expeiiniciil, animal* wcic chilled fui 15-20 min on itc and miiiiubiH/.cd by mechanical dcatiuUiun uf tile biain. The spinal cord was approached by dorsal laminectomy and transected at the level of the upper thoracic segments. Dorsal and ventral roots (DR and VR) of the segments IX and/or X needed for electrophysiological recording were transected as far from the cord as possible, all other roots were cut close to the cord. The cord was gently removed from the vertebral column and placed in a chilled Ringer's solution (NaCI 114; KCI 2.0; NaHCOj 2.0; CaOj 1.8; glucose 5.5 (mmol/L); pH 7.4-7.6) supplemented with hydrogen peroxide (0.004%) to improve tissue oxygenation and the
Electricity atui h'1(iy.n«tism in Biology ami Miulicint' F.dited by Fiersani, Kluwcr Academic/Plenum Publishers. 1999 971

preparation viability. After a saggital hemiscction, one part of the cord was transferred into (he exposure bath and laid lateral side downwards. The roots were extended upward along the walls of the bath and put in contact with bipolar stimulating and recording electrodes. The electrodes were made of thin gold wire and permanently mounted on the walls. In some experiments, stimulation was applied to Ihc lateral column (LC), a descending monosynaptie pathway to motoneurons from the brain. LC was stimulated by a coaxial electrode at the level of cord segments HI-VI.
In the exposure bath, the spinal cord was continuously superfused with Ringer's solution chilled to 9-10 "C at a rate of 2.7 ml/min. The solution layer above the cord was 1.5-2 mm. Distal parts of the roots extending upward from the solution to the electrodes were covered with a mixture of petroleum jelly and mineral oil to prevent them from drying.
MMW irradiation of the cord was performed from underneath, through the bottom of the bath made of 0.5 nun thick Plexiglas The area of cord segments IX and X was carefully pressed down to the hottom of the bath with a help of a micromanipulalor-driven plastic holder, to prevent formation of any saline gap between the cord and the bottom of the bath. The electrodes were shielded from the radiation by the cord itself and the saline layer above it.
The electrodes were connected to a Grass Instruments Stimulator S880O and BIOPAC MP100 clcctrophysiological data acquisition system. We used paired or single rectangular pulses of supramaximal amplitude (0.4-0.9 ms width, 10-30 V for DR, and up to 70 V for LC). Evoked potentials were recorded from a ventral root with or without averaging and stored for further processing. The endpoints measured were the latency, peak latency, amplitude and subtended area of the conditioning and li-sl responses The ratio of the amplitudes or areas of the lest and conditioning responses was a measure of facilitation or inhibition. The data were analyzed by x2 and Student's Mests.
MMW Irradiation and Dosimelry
The MMW exposure equipment, methods of dosimelry and field mapping were described in detail in our previous publications'''7. The microwave power generator (model G4-141, Russia) was operated in a CW regimen. The output waveguide line terminated in a tapered dielectric rod antenna positioned vertically under the exposure bath; the bottom of the bath was 25 mm above the lip of the rod. At this distance, the field was virtually uniform, with the maximum on the axis of the antenna. The field intensity decrease within 5 mm radius from the axis of the antenna did not exceed 2 dB, while the exposed segment of the spinal cord was less than 2 mm wide and 4-6 mm long. The K-field was aligned with the long axis of the cord. Exact radiation frequency and nel input power to the irradiating antenna were monitored via a bi-directional coupler using an EIP model 548A frequency counter and M3-2I wattmeter (Russia). During sham exposure, all equipment was turned on, but the output MMW attenuators were tuned to maximum attenuation (about 80 dB). A transition from sham to MMW exposure was not accompanied by any side effects such as vibrations or changes in low-frequency fields.
The temperature of the Ringer's solution at the outflow port of the exposure bath was monitored by a Luxtron Instruments model 850 multichannel fluoroptic thermometer. Within the accuracy of about 0.2 °C, these measurements demonstrated no temperature changes during MMW exposures.
RESULTS AND DISCUSSION
Effect of MMW on synaptic conduction was studied in three separate series of experiments, using different approaches and experimental protocols.
Series 1
This scries was focused on monosynaptie conduction from LC to VR. LC was stimulated every 2 min by a train of 10 paired pulses (50 ms intcrpulsc interval, 1 pair/2 s). VR responses (DR-VRR) were averaged for each train and stored for analysis. The experiment continued for 40 min, yielding a total of 21 dalapoints: 7 datapoints before MMW exposure (0-12 min), 7 during MMW exposure (14-26 min), and 7 after it (28-40 min). Exposures were performed at 41.34 GHz, at the incident power density of 1.7 mW/cm2, 2.5 inW/cm2, or 0 (sham exposure). As a rule, each successful spinal cord preparation was employed in three experiments, using different treatments in a random sequence. The duration of time interval between the experiments was also random, but no less than 20 min. A total of 34 experiments were performed.
LC-VRR usually represented a smooth peak, with a latency of 6-10 ms, 0.5-3 mV amplitude, and 10-20 ms duration. The test response (to the 2nd stimulus in a pair) was facilitated, although the degree of facilitation varied a lot from one preparation to another. Spontaneous (unforced) variations of latency, peak latency, amplitude and subtended area of LC-VRR during an experiment were within 10-30%, and in best preparations they did not exceed a few per cent. In isolated experiments, MMW irradiation seemed to increase the amplitude and decrease the peak latency of LC-VRR. However, these trends were not consistent and not statistically significant for entire groups. It was concluded that
972

monosynaptic conduction, synchronicity of moloneuron discharge, and facilitation processes were not affected by MMW, or their changes were beyond the resolution ability of the methods employed.
Series 2
In general, polysynaptic transmission is more sensitive than monosynaptic to various conditions, such as ionic composition of the medium, drugs, etc. This series was focused on the conduction of excitation from DR to VR, which is predominantly polysynaptic. DR was stimulated by single pulses every 30 s, and VR responses (DR-VRR) were recorded without averaging. The preparation stabilized for 0.5-3 hours before the onset of the experiment, without any alterations of the stimulation or other conditions. The experiment lasted for 65 min and included two 5-min exposures
(at 25 and 50 min, 41,340 ± 2 MHz, 2.6 ±0.2 mW/cm2). The rest of the time the preparation was sham exposed. Hence, 130 DR-VRR records were analyzed for each experiment. Each preparation was used in only one experiment.
A total of 13 experiments (26 exposures) were performed. In most preparations, DR-VRR was a complex and variable polyphasic wave, with a latency of about 10 ms and up to 80-120 ms duration. Initial analysis included plotting of DR-VRR parameters (latency, subtended area, etc.) against the time from the onset of the experiment. This analysis was intended to reveal possible "visible" responses to irradiation, particularly on- and off-reactions. However, no such reactions were observed, or they were masked by "spontaneous" fluctuations.
As a next step, the DR-VRR parameters were averaged for consequent 5-min intervals (10 records per interval). It was found that in about 50% of the preparations, the 1st MMW irradiation decreased the area and standard deviation of the DR-VRR amplitude (in this context, the standard deviation is a measure of the variation of the signal amplitude during a course of a single DR-VRR, and should not be confused with a statistical variable). The effect, although small (5-15%) was highly significant compared with previous 5-min intervals before irradiation. One should note that the time delay between isolation, the onset of DR stimulation and exposure was different for each preparation, so this effect was not just a "spontaneous" change that would have happened at a certain time. The 2nd MMW irradiation did not cause these changes.
These observations could not be used as a reliable proof of the MMW effect, because the statistically significant changes occurred in only a half of the preparations. Nonetheless, the data suggested that it might be more adequate to consider somehow any changes in the DR-VRR waveform, not just those which arc reflected by its latency, amplitude, or other parameters.
To quantify these "gross" changes in (he DR-VRR waveform, the biopotential records (not measured DR-VRR parameters, but the waveforms themselves) were summed for 5-min intervals, thus yielding 13 "accumulated" waveforms for 65 min of the experiment (W,, W2, ..., W13). The VRR changes from one 5-min interval to another were quantified by the integral or the difference (ID) of sequential waveforms (i.e., W„-W„.|). The mean ID was virtually stable for the first 5 intervals (sham) and sharply increased for the 6th interval (MMW exposure); then it returned to the initial value and was stable again. In fact, this ID increase due to the 1st exposure occurred in 9 out of the 13 tested preparations. The 2nd MMW exposure caused no ID changes in the 9 preparations which reacted to the 1st exposure. Most unexpectedly, the other 4 preparations which did not react to the I si exposure, demonstrated a significant ID increase in response to the 2nd irradiation.
It should be emphasized that conditions of the 1st and the 2nd exposures for each individual preparation were exactly the same. Even the pattern of "hot spots" (if any formed) remained unchanged. If the MMW effect were thermal, it would have been practically identical under the 1st and the 2nd exposures. However, it was not the case, and this indicates involvement of MMW-specific interaction mechanisms which arc different from mere healing. Most important, the effect of MMW exposure proved to be not limited to changes that take place just during the irradiation: The aftereffect of the 1st MMW exposure was not detectable from DR-VRR appearance, but manifested itself as a change of the sensitivity to the 2nd exposure. Moreover, this aftereffect could be either a decrease or an increase of the MMW sensitivity, depending on whether the preparation had responded to the 1st exposure or not. From the physiological point of view, the observed MMW effect could be regarded as a mild modulation of the polysynaptic conduction rather than its inhibition or facilitation. More detail about this effect and data analysis procedures can be found in a separate paper which is scheduled for publication in "Electro- and Magnclobiology".
Series 3
This series was aimed to reveal possible frequency-specific effects of MMW in 41.1-42.4 GHz band. DR-VRR were evoked by single pulses every 24 s. Each preparation was used in one 100-min experiment, which began after a 30- to 90-min stabilization. For convenience of data processing, the experiment was divided into 25 intervals, 4-inin each. Ten stimuli were applied during each interval, and 10 DR-VRR waveforms were averaged and stored for the same analysis of waveform changes as described above. MMW irradiation lasted from 24 to 80 min of the experiment (from the 7th till the 20lh interval), otherwise the preparation was sham exposed. During exposure, the frequency was changed
973
by 0.1 GHz steps every 4 min, either from 41.1 to 42.4 GHz, or in the opposite direction. The incident power density ranged from approximately 2 to 3 mW/cm2 for different frequencies. Control preparations were sham exposed during the entire experiment.
Analysis of changes in the DR-VRR waveform from 29 experiments performed did not establish any MMW effect, cither associated with a certain frequency, or with the exposure as a whole.
CONCLUSIONS
MMW irradiation at the incident power density of up to 3 mW/cm2 produces either a minor or no effect on synaplic transmission in the frog spinal cord. When present, the MMW effect appears as a mild modulation of synaptic transmission, not as its suppression or facilitation. MMW sensitivity seems to vary between individual preparations anuVor depend on some uncontrolled and unidentified factors. As or the present data, synaptic transmission cannot be regarded as a target for MMW bioeffects. However, there are still many synaptic processes which have never been studied in experiments with MMW radiation (pre- and poslsynaptic inhibition, gap junction transmission, modifiability phenomena, me,.).
ACKNOWLEDGMENTS
The work was supported by the US Army Medical Research and Materiel Command under contract DAMDI7-94- C-4069 awarded to McKesson DioServices. The views, opinions and findings contained in this report are those of the authors and should not be construed as an official Department of the Army position, policy or decision.
REFERENCES
1. V.M Brovkovich, N.B. Kurilo. and V.L. Barishpol'ls, Action of millimeter-range electromagnetic radiation on the Ca pump of sarcoplasmic rcticulum. Radiobiologiw 31:268 (1991).
2. Gelctyuk, V.N. Kazachenko, N.K. Chcmcris, and E.E. Fesenko. Dual effects of microwaves on single Ca2v-activated K' channels in cultured kidney cells Vero. FEBS Istr. 359:85 (1995).
3. Katacv. A.A. Alexandrov, L.L. Tikhonuva, and G.N. Berestovsky, Frequency-dependent effects of the electromagnetic millimeter waves on (lie ion currents in the cell membrane of Nitellopsis nonthermat action. Hiofivka 38:446 (1993).
4. Burachns and R. Muscoliunna, Suppression of nerve action potential under the cffccl wf inilliiiiclci waves, in. Millimeter Waves in Medicine and Biology, N.D. Dcvyatkov. ed.. Radioclcctronica. Moscow (1989).
5. Chemyakov, V.L, Koroclikin, A.P Bahenko. and E.V. Bigdai, Reactions of biological systems of various complexity to the action of low-level F.HF radiation. Ibid. (1989).
6. Pakhomov, UK Prol. S.P. Mathur, Y. Akyel, and C.B.Cj. Campbell. Search for frequency-specific effects of millimeter-wave radiation on isolated nerve function, Bioclectromagnelics 18:324(1997).
7. Pakhomov, II.K Prol, S.P. Mathur, Y. Akyel, and C.B.G. Campbell, Frequency-specific effects of millimeter wavelength electromagnetic radiation in isolated nerve. Electro-Magnetobiol. 16:43 (1997).
8. Kudo, The pharmacology of the amphibian spinal cord. Progress Neurabiol. 11:1 (1978).
974

ELECTROMAGNETIC FIELDS: BIOLOGICAL EFFECTS and
HYGIENIC STANDARDIZATION vsT'*
Proceedings of the International Meeting «EtECTROM^eiNrETlQ FIEtpS: BIOLOGIGAL EFFECTS
;ANp HYGIENIC S^ V Jtöoscow,18-22May 1998
* Editors: IVKH. Repacholi N.B. Rubtsova
A.M. Muc

DOSE DEPENDENCIES IN BIOEFFECTS OF EXTREMELY HIGH PEAK POWER MICROWAVE PULSES
A.G. Pakhomovw, S. P. Mathur1, M. Belt1, and M. R, Murphy2
McKesson BioServices, US Army Medical Research Detachment, and 2Directed Energy Bioeffects Division, Human Effectiveness Directorate, Air Force Research
Laboratory, Brooks Air Force Base, San Antonio, Texas, 78235-5324, USA.
Introduction
Tissue heating by moderate and high microwave intensities is the established mechanism of most known biological effects of this radiation. "Thermal" bioeffects can usually be predicted from the rates of energy absorption and heat dissipation in exposed specimens. However, it is not clear if this dose- based approach is valid for irradiation with brief, extremely high power pulses (EHPP). At peak specific absorption rates (SAR) as high as kilowatts per gram, high instant values of the electric field, thermoelastic stress, or other, mechanisms could produce tissue damage, even if the time-average SAR is low and general heating is negligible. Safety guidelines based upon the average absorbed or incident powers do not necessarily address the potentially harmful effects of EHPP, making it imperative that the possibility of such effects be investigated.
The present knowledge of EHPP bioeffects is limited and contradictory. In some studies, EHPP disrupted cognitive function and significantly decreased physical endurance in rats without increasing the body temperature (Akyel et aL, 1992; Raslear et al., 1993). In other studies, which employed somewhat different EHPP parameters, all behavioral and physiological changes observed in exposed rats and monkeys could be attributed to heating (D'Andrea et aL, 1989; Klauenberg et aL, 1990; Akyel et aL, 1991; Jauchem and Frei, 1995).
The present work tested the applicability of the dose-based approach in exposure to brief EHPP trains. Using an isolated heart preparation model, we compared bioeffects of EHPP trains with (1) a constant number of pulses per train, but different interpulse intervals, and (2) different numbers of pulses per train, but a constant interpulse interval. Microwave heating was linearly proportional to the number of EHPP per train, but did not depend on the interval between them
Methods
We employed an in-waveguide exposure setup capable of creating peak SAR of up to 400 kW/g in small samples (100-200 nl). Square microwave pulses
325

(9.5 GHz, 1 us width, 100-115 kW) were produced by an EPSCO Model MH300 system with an MF-IM65-01 RF plug-in into a WR90 waveguide (22.86 x 10.16 mm). Incident and reflected powers in the waveguide were measured via directional couplers by HP 438A and HP 435B power meters with HP 8481A power sensors. Microwave pulse trains were triggered externally from a Grass Instruments S8800 stimulator. The shape of microwave pulses was monitored via an HP 432 detector on a TEK 2430A digital oscilloscope.
The exposure cell at the end of the waveguide was separated by a quarter- wave matching plate and filled with 6 ml of Ringer's solution containing (mmol/1): NaCl, 103; KC1,1.0; NaHCCfe, 0.6; Cad2,0.9; pH 7.2-7.4. The waveguide walls in the exposure cell were covered with a lacquer to prevent its electrical contact with the solution.
With this setup, SAR in the solution decreased exponentially with increasing the distance above the matching plate. SAR as a function of this distance was calculated according to Chou and Guy (1978) and verified by direct measurements. At 25°C, calculated SAR equaled 610,304,145, and 69 kW/g per 100 kW of transmitted power at 0, 1, 2, and 3 mm above the matching plate, respectively. Within the depth of the solution in the exposure cell (about 25 mm), the radiation was absorbed almost completely, thus requiring no additional protection of the personnel or laboratory equipment
Direct SAR measurements were performed with a microthermocouple (MTC) made of 25-nm copper and constantan wires (Omega Engineering, Inc.) The MTC was covered with lacquer for insulation and fixed in a custom-made holder in a micromanipulator, above the exposure cell Temperature readings by the MTC were recorded on a PC using a universal amplifier (Gould 5900 frame) and a BIOPAC MP100 data acquisition system.
Virtually instant response of the MTC to temperature changes made it possible to record a temperature plateau for a period of 200-600 ms after a single EHPP or a brief EHPP train. Within the duration of this plateau, heat dissipation could be disregarded Therefore, the peak SAR could be calculated from the level of this plateau and known duration of the microwave pulses, despite EHPP-induced recording artifacts during the train itself. More detail on this method and its validation can be found in a separate publication (Pakhomov et al, 1998). Calculated and MTC-measured SAR matched well for various MTC positions in the exposure cell, output powers, numbers of pulses, etc. In all cases, measured SAR was 1.1-1.8 dB below the theoretical one; this small difference was likely to
326

result from imperfection of power meters and/or of the theory, rather than from inaccuracy of the temperature measurements.
An important detail established by the MTC thermometry was that the maximum microwave heating (i.e., the level of the plateau on the heating curve) was linearly proportional to the number of EHPPs in a train, but, within certain limits, it did not depend on the interpulse interval (Fig. 1).
B
*»1EESm*"**>—■ oo
A*V^*V
•«VwWvVvv-
j' |0.5CC
50 ms
Fig. L Heating dynamics under exposure to EHPP trains (1 \xs pulse width, 9.5 GHz, 400 kW/g peak SAR). Spikes during the ascending portion of the curves (artifacts) correspond to EHPP pulses. A: 10-pulse trains with different interpulse intervals (1,3,5, and 13 ms). Regardless of the interpulse interval, maximum microwave heating (the plateau level) is 0.93 °C. B: Trains including different number of pulses, but with a constant interpulse interval of 5 ms. Maximum microwave heating is linearly proportional to the number of pulses in the train. Heating by a single pulse is about 0.09 °C (not shown); each increase of the train by 4 pulses increases heating by about 0.38 °C. For these temperature measurements, we used 20- or 50-ms averages of the amplified voltage from MTC.
Dose dependencies of EHPP effects were studied in isolated, spontaneously beating sections of the cardiac sinoatrial area of the frog Rana catesbiana. The sections were of irregular shape, a few millimeters wide and long, and less than 1 mm thick. Peak SAR measured in saline at the position of the geometrical center of the preparation (i.e., about 0.5 mm above the matching plate) ranged from 270 to 310 kW/g. Maximum heating of the preparation was 0.08-0.09 °C per one EHPP; for trains consisting of« pulses, the maximum heating was n times greater.
327

The endpoint in these experiments was the immediate change in the duration of individual inter-beat intervals (IBIs) after delivery of a single EHPP train. Local currents, induced in the surrounding solution by beats of the preparation, were recorded by a BIOPAC MP100 data acquisition system using artifact-free electrodes (glass capillaries filled with the same solution). After positioning of the preparation at the bottom of the exposure cell, it was allowed to stabilize for 30-60 min. While recording a stable beating rhythm, we applied a train ofmicrowave pulses (it always fell within a single IBI). The exact time when the EHPP tram was applied was recorded on a separate marker trace, concurrently with the preparation beats.
Ten Bis immediately preceding the exposure were assigned numbers from -10 to -1; the BI coinciding the exposure was No. 0, and the next ten intervals were numbered from 1 to 10. The exact duration of each of these 21 Bis was measured automatically. A record of 21 Bis which included one exposure or sham exposure was considered as a single experiment Experiments with initially unstable rhythm (more than ± 2% variation of individual Bis before the EHPP train) were noticed for analysis and discarded
Though being very stable in each particular experiment, the BI duration ranged considerably (from 1 to 3.5 s) from one preparation to another. Hence, the raw data from different experiments had to be normalized before averaging, so the duration of the first (-10th) BI in each experiment was taken as 100%.
The same preparation was usually used in several different experiments, allowing at least a 15-min interval between them for function recovery and stabilisatioa Different regimens of microwave exposure were randomized with sham exposures. For a sham exposure, a waveguide switch was used to block microwave propagation to the exposure cell, otherwise all conditions were kept the same as with actual exposures. All experiments were performed at a room temperature of 24-27 °C.
Results
Series 1. In 87 experiments on 20 preparations, we studied the effect of 5- pulse EHPP trains. The interpulse intervals were 1, 5, or 25 ms, yielding the entire train durations of 4, 20, and 100 ms, respectively. Microwave heating did not depend on the interpulse interval and was the same for all these regimens (0.4-0.45 C maximum). There was no special synchronization of the train onset with the
preparation beats, but experiments with the EHPP train coining during the first and the second halves of an BI were processed separately.
328

100
I I
80
*4-t-*HMHt-*-*
meants.e.
p- -10
"T" -5
i t -I 10
Inter-beat interval number
Kg. 2. Changes in the inter-beat interval (IBI) after exposure to a 5-pulse EHPP train (9.5 GHz, Ins pulse width, 270 to 310 kW/g peak SAR). The train is applied during the first (A) or the second (B) half of the interbeat interval No. 0. Sham- exposed group is the same for A and B; n is number of experiments in each group. IBI decrease immediately after exposure is significant in all the groups (at p<0.05 or pO.01). Differences between the exposed groups are not statistically significant
In 100% of the experiments, EHPP irradiation immediately decreased the interval between beats, followed by a gradual recovery to the initial level. The averaged data are presented in Fig. 3, A and B. Though maximum effect was only 1.5-2.5%, it was significant at p<0.05 or p<0.01 (Student's /-test) compared with either the pre-exposure level or sham controls. As one could expect, the EHPP- induced changes in the beating rate developed slightly later in preparations that were exposed later within the IBI (namely, during the second half of the IBI, Fig 3, B). However, this was the only noticeable difference between the exposed groups, and the effect showed no dependence on the interval between pulses in the EHPP train.
Some authors (Tigranyan, 1986) reported that excitable tissues (e.g., isolated nerve and heart of the frog) are particularly sensitive to microwave pulses
329

within a certain period during or after exeitatioa In our experiments, the EHPP trainfell within various intervals after excitation (i.e., a beat), but no "critical penods" were observed. Furthermore, in six experiments when the EHPP train coincided with a beat (too few cases for statistical analysis, so they were not considered above), the exposure effect was practically the same as in other experiments.
20 30 40 Number of microwave pulses
Fig. 3. Dependence of the inter-beat interval change on the number of pulses in the EHPP^train. Hie data for exposure to 5-pulse trains are imported from Series Lall other data are from Series 2. The interval between EHPP in the train is 1 ms- see Fig. 2 for more exposure detail. Differences between all the group are significant at p<0.01 (for datapoints immediately after exposure).
Series 2. In this independent series of 65 experiments (18 preparations) the mteryal between pulses in EHPP train was fixed at 1 ms, and the trains consisted of 10,30, or 60 pulses. The trains were always applied within the first half of the IBI In most cases, the exposure immediately decreased the IBI proportionally to the number of pulses in the train, followed by a gradual recovery (Fig 3) The maximum decrease (by 15-20%, p<0.01) was caused by 60-pulse trains The maximum heating was linearly proportional to the number of pulses in the train, and so was the response of the preparation (Fig. 4). However, in the remaining experiments (about 15%), irradiation produced the opposite effect: it halted the preparation contractions, delaying the next expected beat for a period from 0.5 s to more than 100 s (Fig. 5). This paradoxical response occurred in 2 out of 17 exposures to 10 pulses, 3 out of 16 exposures to 30 pulses, and in 6 out of 17 exposures to 60 pulses; it was never caused by sham exposures or 5-pulse trains in me preceding set of experiments.
330

Fig. 4. Duration of the inter-beat interval coinciding the EHPP train versus the number of pulses in this train. (The same data as in Fig. 3). See Figs. 2 and 3 for more detail.
Discussion
A common way to judge whether exposure effects are or are not caused by heating is the comparison of reactions to microwave and equivalent conventional heating. However, this comparison would only be accurate if the dynamics of microwave and conventional heating are the same. In EHPP experiments, the instant heating rate (during a microwave pulse) reaches almost 100,000 °C/s, which cannot be matched by a conventional heating. In this situation, dose-response curves can be used for qualitative analysis of the role of heating in biological effects of EHPPs.
It is well known that a subtle or moderate heating increases the pacemaker rhythm (shortens IBI) in isolated frog heart preparations (Yee et al., 1986; Chernyakov et at, 1989; Pakhomov et al., 1995). Consistently, in most of the experiments described above, EHPP exposure produced an immediate decrease in the IBI duration. When the EHPP train was varied in a way that kept the absorbed dose and microwave heating constant, the biological effect remained constant as well (Series 1). At the same time, the IBI decrease was linearly proportional to the number of EHPPs per train, which was the parameter that determined the absorbed dose and heating (Series 2). This pattern of reacting to EHPPs is in agreement with the thermal mechanism of EHPP bioeffects.
One should note that beats in our preparation could only be induced by stimuli coming from pacemaker structures. Therefore, any IBI decrease reflected
331

an increase in the pacemaker rhythm. However, a temporary cessation of beats or B3I increase did not necessarily arise from a change in the pacemaker rhythm. Most likely, it was caused by a temporary uncoupling of contractile structures from the pacemaker, and some experimental records prove that it was the case indeed For example, in the experiment shown in Fig. 6, we concurrently recorded large and small beats, which were produced by two groups of contractile fibers. Before exposure, small and large beats were nicety synchronized, indicating that they were driven by the same pacemaker, but the large beats were elicited by every other stimulus from the pacemaker. This omission of pacemaker stimuli is not uncommon, and. indicates somewhat imperfect coupling of the respective contractile structures with the pacemaker. EHPP exposure halted the large beats, but the small beats continued uninterruptedly and increased their rate. Hence, the cessation of the large beats was caused by uncoupling and not by deceleration of the pacemaker. Though such analysis was not possible for every experiment with BBI increase after exposure, one can reasonably suppose that the impairment of coupling was responsible for this effect in other cases as well.
A 111III Ml HI—I UIH I Ml II' B tt
10s
I I I I I I I I I I I I I.
D i n 11111111 i 1111111111 Fig. 5. Cessation of beats caused by exposure to an EHPP train. A - D - different preparations of the sinoatrial area of the frog heart Upper traces, spontaneous beats of the preparation. Lower traces, marker of microwave exposure (9.5 GHz, 1 \xs pulse width, 1 ms interpulse interval, 270 to 310 kW/g peak SAR); a single train of 10 pulses (A), 30 pulses (B and Q, or 60 pulses (D).
Though uncoupling could be caused by a thermal effect of exposure, possible specific EHPP effects could not be discarded either. The temporary cessation of beats occurred only in a small percent of experiments, and the total number of observations was insufficient to make a prudent judgement As concerning the dose dependencies of EHPP effects on the pacemaker rhythm, they
332

n
were fully consistent with the thermal mechanism of microwave action. On th whole, the present experimental data are not suggestive of any mechanisms c EHPPbioeffects other than ordinary heating.
r<ig.6. An example of a "dual" response to EHPP irradiation. Marker (the lower trace) indicates the moment of exposure to a 60-pulse train. This exposure increased the interval between large beats and shortened the interval between snu beats. See Fig. 5 and text for more explanation.
Acknowledgements
The work was supported in part by the US Army Medical Research a Materiel Command and the US Air Force Directed Energy Bioeffect Divisi under US Army contract DAMD17-94-C-4069 awarded to McKesson BioSerwc The views expressed are those of the authors and should not be construed reflecting the official policy or position of the US Government or the Departme of the Army and the Air Force.
References:
1. Akyel, Y.; Hunt, E. L.; Gambrill, C; Vargas, C, Jr. Immediate p< exposure effects of high-peak-power microwave pulses on operant beha\ of Wistarrats. Bioelectromagnetics 12(3): 183-195,1991.
2. Akyel, Y.; Raslear, T. G.; Hammer, R. M; Belt, M The effects of hi peak power pulsed microwaves on treadmill performance in the rat. F World Congress for Electricity and Magnetism in Biology and Medici 14-19 June, Lake Buena Vista, FL, p. 60,1992.
333

3. Chernyakov, G. M; Korochkin, V. L.; Babenko, A. P.; Bigdai, E. V. Reactions of biological systems of various complexity to the action of low- level EHF radiation. Millimeter Waves in Medicine and Biology. N. D. Deyatkov, ed., Moscow: Radioelectronica, p. 141-167,1989.
4. Chou, C-K.; Guy, A. W. Effects of electromagnetic fields on isolated nerve and muscle preparations. IEEE Trans Microwave Theory Tech 26(3): 141- 147,1978.
5. D'Andrea, J. A.; Cobb, B. L.; Knepton, J.; Bates, F. Behavior in rhesus monkeys exposed to very high peak power 3.0-GHz microwave pulses. Bioelectromagnetics Society, 11th Annual Meeting, 18-22 June, Tucson, AZ, p. 38-39,1989.
6. Jauchem, J. R.; Frei, M R. High-peak-power microwave pulses: effects on heart rate and blood pressure in unanesthetized rats. Aviat Space Environ Med66(10):992-997,1995.
7. Klauenberg, B. J.; Cobb, B. L.; Merritt, J. H. Effects of exposure to tempo pulsed high-peak power microwave radiation. Bioelectromagnetics Society, 12th Annual Meeting, 10-14 June, San Antonio, TX, p. 91,1990.
8. Pakhomov, A. G.; Dubovick, B. V.; Degtyariov, I. G.; Pronkevich, A. N. Microwave influence on the isolated heart function: I. Effect of modulation. Bioelectromagnetics 16(4):241-249,1995.
9. Pakhomov, A. G.; Mathur, S. P.; Akyel, Y.; J. L. Kiel, J. L. Direct microdosimetry in media exposed to extremely high peak power microwaves. Bioelectromagnetics Society, 20th Annual Meeting, 7-11 June, St Petersburg Beach, FL, 1998 (in press).
10. Raslear, T. G.; Akyel, Y.; Bates, F.; Belt, M; Lu, S-T. Temporal bisection in rats: the effects of high-peak-power pulsed microwave irradiation. Bioelectromagnetics 14(5):459-478,1993.
11. Tigranyan, R. E. On the mechanism of pulsed microwaves effects on excitable structures. Vopr Kurortol Fizioter Lech Fiz Kult (6): 11-14,1986.
12. Yee, K-C.; Chou, C-K.; Guy, A. W. Effects of pulsed microwave radiation on the contractile rate of isolated frog hearts. J Microw Power Electromagn Energy 21(3):159-165,1986.
334

fcs*Ts.-vt*«r5 12th IEEE International Pulsed
Power Conference
C. Staiiings and
rtMhiei
ms
11111111
Monterey, California 1999
IEEE Catalog Number 99CH36358

LOW-INTENSITY MILLIMETER WAVES AS A NOVEL THERAPEUTIC MODALITY*
A. Pakhomovl'2 and M. Murphy2
^cKessonHBOC BioServices, US Army Medical Research Detachment, and Air Force Research Laboratory, Human Effectiveness Directorate, Directed Energy Bioeffects Division Radio Frequency
Radiation Branch, 8308 Hawks Rd., Bldg. 1168, Brooks AFB, TX 78235-5324, USA.
Abstract
One of the most significant events in contemporary electromagnetic biology is a surge in interest to specific effects of low-intensity millimeter-band radiation (30-300 GHz). Bioeffects of millimeter waves (MMW) can often occur without any considerable heating of the exposed subject, and biological responses are principally different from those caused by heating. The effects of MMW often have a sharp, resonance-like dependence on the radiation frequency, but they depend relatively little on the radiation intensity. A brief, low-intensity MMW exposure can change cell growth and proliferation rates, activity of enzymes, state of cell genetic apparatus, function of excitable membranes and peripheral receptors, it can alleviate stress reactions, stimulate tissue repair and regeneration, etc. In Eastern Europe, low-intensity MMW are widely employed for therapeutic purposes. The method has gained official recognition, and millions of people received MMW therapy for various conditions. While the mechanisms of MMW efficacy remain unclear and their medical usage is mostly empirical, the knowledge accumulated over more than 20 years of MMW therapy merits careful analysis and consideration.
I. INTRODUCTION
MMW are characterized by rather shallow penetration into biological tissues (<1 mm), and one may anticipate that MMW bioeffects arise mostly from surface heating. Indeed, this thermal mechanism is well known and is essentially the same as with other methods of local heating (e.g., with infrared).
At the same time, a large number of studies have reported principally different MMW effects, which do not fit into the thermal paradigm. These effects may occur at the radiation intensities orders of magnitude below the thermal effect threshold, and often demonstrate a highly nonlinear, resonance-type dependence on the radiation frequency. Specific MMW effects seem to be of fairly universal nature,
appearing at various levels of biological organization (from cells and subcellular structures to animal and human organisms) and affecting rather diverse biological functions (from DNA conformation and cell membrane permeability to immune reactions and behavior). While reasons for the unusual MMW sensitivity of living subjects and underlying biophysical mechanisms have yet to be identified, the possibility of manipulating biological functions by MMW has already been employed widely in biotechnology and medicine.
The purpose of the present paper is to introduce professionals with mostly physical and engineering backgrounds to the exciting and potentially important area of MMW bioeffects and medical applications. Interested readers are advised to see other reviews for more detailed information [1-8].
H. SPECIFIC BIOEFFECTS OF MILLIMETER WAVES
Resonance effects of MMW on cell growth rate have been studied for over 20 years [9-12]. Exposure of the yeast cells to certain frequencies within a 41.842.0 GHz band (8 kHz modulation) either increased the cell growth rate by up to 15%, or decreased it by up to 29%. The effect was shown by different methods, both in suspended cells and in monolayer, and at radiation intensities as low as 5 pW/cm2. The position of the "resonance frequency" (at which the growth rate increased) did not depend on the incident power density, while the "resonance width" (taken as a distance between two frequencies which decreased the growth rate) gradually increased from about 5 MHz at 5 pW/cm2 to 12-15 MHz at 1 mW/cm2. One should note, however, that independent attempts to replicate these observations were not successful [13, 14], suggesting that some other unknown and unidentified factors could be essential for this MMW effect.
Belyaev and co-authors [15-18] used an anomalous viscosity time dependence (AVTD) technique to study fine changes in DNA conformation and DNA-protein bonds caused by MMW exposure. Multiple frequency resonances were established (Fig 1, A), and, at a resonance frequency,
* The work was supported in part by the US Army Medical Research and Materiel Command and the US Air Force ^^tZ^To^)Z^m Army contract DAMD17-94-C-4069 awarded to McKesson BioServices. The vTerexpressedTa^e those of die authors and should not be construed as reflecting the official pohcy or position of the IZ^^JA^IW* of the Air Fore«, or the United States Government The authors greatly appreciate SesUn the topic and Support of organizers of the 12th IEEE International Pulsed Power Conference.
0-7803-5498-2/99/$10.00©1999 IEEE. 23

biological changes could be produced by field intensities as low as 10"19 W/cm2. The magnitude of changes gradually increased with the field intensity, reaching a plateau between 10"17 and 10"8 W/cm2. The resonance frequencies shifted when the haploid genome length of exposed cells was increased, thus suggesting that the chromosomal DNA may be a target for resonance interaction between living cells and MMW. The width of the frequency resonances increased from units to tens of MHz by increasing the incident power density (Fig. 1, B), which is in remarkable agreement with the above-mentioned independent findings [12].
51.65 51.70 51.75 51.80 51.85
GHz >M5
51.65 51.70 51.75 51.80 51.85
GHz
Figure 2. A, frequency dependence of MMW effect on genome conformational state at 10"10 W/cm2. B, gradual widening of a "resonance peak" at 51.756 GHz with increasing of the radiation intensity. Genome conformational state was determined in lysates of bacterial cells (Escherichia colt) by an anomalous viscosity time dependence technique. Reproduced with changes from [18], by permission of Wiley-Liss, Inc.
Due to the nature of the biological experiment, it becomes increasingly laborious to produce detailed frequency and intensity dependences of the bioeffects when working with more complex biological subjects (i.e., when moving from cells to isolated organs and whole organisms). Most of such studies analyzed a limited number of isolated MMW frequencies and/or intensities, or even employed a single frequency at a fixed intensity. These studies were focused
not as much on the development of the biological response spectra, but rather on identifying specific MMW effects and examining physiological mechanisms involved.
Kataev and co-authors [19] studied MMW effects on transmembrane currents in giant alga cells (Nitellopsis obtusa, Characea). Exposure for 30-60 min at 41 GHz, 5 mW/cm2
suppressed the chloride current to zero with no recovery for 10-14 hours. Marked inhibitory effects were also found at 50 and 71 GHz, while most of other tested frequencies enhanced the chloride current up to 200400% (49, 70, 76 GHz). This activation was reversible, and recovery to the initial value took 3040 min. MMW heating did not exceed 1 °C, and neither activating nor inhibitory effects were related to, or could be explained by this temperature change.
Pakhomov and co-authors [20-22] have repeatedly demonstrated that MMW exposure of isolated frog sciatic nerve increases its ability to sustain a high rate of electrical stimulation. The effect reached the maximum of 20-25% at 41.34 GHz (Figure 3, A), which was one of the "resonance frequencies" for genome conformation changes [15]. A 100- MHz deviation from 41.34 GHz (to 41.24 or 41.44 GHz) reduced the effect about twofold, and a 200-MHz deviation eliminated the effect At the "resonance" frequency of 41.34 GHz, the magnitude of MMW-induced changes was the same at the radiation intensities of 0.02,0.1, and 2.6 mW/cm2.
120-, At
%
110-
100-
GHz
41.14 41.34 41.54
Figure 3. MMW effect on isolated frog sciatic nerve tolerance to a high-rate stimulation, as a function of the radiation frequency at a fixed intensity (0.26 mW/cm2). Control data ("sham" exposure) are shown by the empty circle. The ability to tolerate the high-rate stimulation (20 paired stimuli/sec) was measured from changes in the peak amplitude of the test compound action potential (At). Reproduced with changes from [21], by permission of Marcel Dekker, Inc.
24

Modulation can be another important parameter that affects MMW biological effectiveness. An unusual "double- resonance" effect was described in a Protozoan Paramecium caudatum [23]. Spontaneous locomotor activity of individual protozoan cells was not affected by irradiation unless both the radiation frequency and modulation were tuned to "resonance" values. These values were 42.25 GHz and 0.0956 Hz, at 0.5 duty ratio. Under the "double resonance" conditions, the threshold field intensity was about 0.02 mW/cm2. The effect reached maximum of about 20% at 0.1 mW/cm2, and remained at this plateau level at intensities up to 50 mW/cm2, despite increasing heat production (0.1-0.2 °C at 5 mW/cm2). A continuous-wave (CW) irradiation, or modulation rates of 16, 8,1,0.5,0.25, or 0.05 Hz produced no effect, regardless of the field intensity or heating. At the resonance modulation frequency, a shift of the carrying frequency to 42.0 or 42.5 GHz eliminated the response. Infrared light modulated at 0.0956 Hz produced no biological effects either. The authors were unable to give any reasonable explanation to the sharp resonant dependence of the MMW effect upon both modulation rate and radiation frequency.
Most animal and human studies with MMW exposure explored potential applicability and benefits of this factor for disease treatment. Beneficial effects of MMW irradiation include, primarily, (1) anti-infiammatory effect and stimulation of tissue repair and regeneration, (2) stimulation of the immune function, and (3) sedative and analgesic effects [7].
Zemskov and co-authors [24] assessed MMW effects on healing of skin wounds in rabbits. The animals were randomly assigned to four groups; wounds in groups 1 and 2 were kept aseptic, and in groups 3 and 4 were infected with a pathogenic Staphylococcus. Wound in groups 1 and 3 were irradiated with 1 mW/cm2,37 or 46 GHz CW MMW for 30 min twice a day, for 5 days. Two remaining groups served as untreated controls! MMW decreased swelling of wound edges, hyperemia, and infiltration, and rapidly reduced the wound area in the first 24 hours. Complete healing of aseptic wounds in the exposed group took 2.9 days less than in the control group. Infected wound cleaning and granulation took 14-16 days in the exposed group, and 21-23 days in the respective control.
A similar protocol was used in a double-blind replicative study by Korpan et al. [25]. Rabbits with septic or aseptic cutaneous wounds were exposed for 30 min a day (37 GHz CW, 1 mW/cm2). The treatment continued for 5 days in the aseptic group, and for 7 days in the septic one; control animals underwent same courses of sham exposures from a non- operational MMW transmitter. The condition and size of the wounds were monitored for 32 days. Wound edge swelling and hyperemia subsided fester in MMW-irradiated animals, and granulation tissue filled the wound earlier than in the controls. The mean daily decrease in wound surface area was significantly greater in the MMW-treated animals, namely 7.9% and 6.3% in the aseptic and septic exposed groups versus 3.2% and 2.7% in the respective controls (p<0.05). The authors concluded that MMW irradiation enhanced both septic and aseptic wound healing and stimulated immune function.
Rather unexpectedly, MMW promoted regeneration of deep tissues, which are not reachable by the radiation Kolosova and
co-authors [26] reported that MMW treatment facilitated regeneration and functional recovery of a damaged peripheral nerve. The sciatic nerve in 40 rats was transected in the thigh region and sutured. MMW exposures of the injury area were performed^every third day for 7 or 20 days (10 min at a time, 4-mW/cm, 54-GHz); control rats were sham irradiated! Exposures did not increase the skin temperature (0.1 °C accuracy). The 7-day course of exposures had little effect on regeneration, but after the 20-day course the regeneration distance was significantly greater in MMW-exposed animals (18.410.4 mm) than in sham-exposed controls (14.0±1.4 mm, pO.01). In an independent subsequent study [27], the same irradiations were performed for two weeks after the injury, and the nerve was isolated for examination in 5 months. Indices of regeneration were the compound action potential amplitude and conduction velocity at different distances distal from the nerve suture. Both parameters were higher in the exposed animals: For example, 19 mm from the suture, the amplitude was 313134 nV versus 156115 uV in controls QK0.001), and the velocity was 20.410.9 m/s versus 15.510.9 m/s (p<0.05). The authors concluded that exposures facilitated both the growth and functional maturation of nerves. Since MMW did not penetrate to the impaired nerve, regeneration was affected via some indirect mechanism, such as stimulation of cellular and humoral immunity and activation of neurotrophic factors.
Sedative and analgesic effects of MMW were explored in a series of studies by Rojavin and co-authors [28, 29]. In mice anesthetized by either ketamine or chloral hydrate, MMW irradiation of the nasal area (61.22 GHz, 15 min at 15 mW/cm2) prolonged the drug-induced sleep by up to 50%. This MMW effect could be blocked by naloxone, an opioid system antagonist. Similar irradiation of mice injected with a pruritogenic agent (compound 48/80) significantly and consistently decreased the number of scratches of the injected site during 90 min after injection. The scratching activity was inhibited by more than twofold compared with sham-exposed controls. Again, pretreatment of animals with naloxone suppressed the anti-pniritic effect of MMW in a dose-dependent manner.
A logical extension of these findings was a double-blind study of MMW effect on acute pain tolerance in human volunteers [30]. The lower third of the sternum was exposed to 42.25 GHz MMW at 2515 mW/cm2 for 30 min, or it was sham-exposed from a non-operational MMW transmitter (neither volunteer nor experimenter knew whether an operational or non-operational transmitter was used). The volunteer's hand was then placed in a bath with cold water and melting ice mixture (110.5 °C). Pain sensitivity range and tolerance were evaluated from subjective sensations of the volunteer, and from the time until the pain became intolerable and the hand was withdrawn. Overall, MMW exposure increased the pain tolerance by 37.7% (p<0.05). In seven volunteers (out of twelve), the individual gain in pain tolerance ranged from 120 to 315%. The. authors stated that MMW therapy can potentially be used as a supplementary or alternative treatment for pain.
25

HI. CLINICAL TRIALS OF THE MILLIMETER WAVE THERAPY
The first clinical trials of MMW therapy began in the USSR in 1977. Nowadays, the method has been officially recognized by the Russian Ministry of Health and is used widely. It was claimed that by 1995 over 3 million people received MMW therapy at more than a thousand specialized centers as well as at regular hospitals [31].
The term "MMW therapy" implies repetitive local exposures of certain body areas to low-intensity MMW, which can be used as a monotherapy or combined with other therapeutic procedures and drags. The body area to be exposed, exposure schedule, regimen, and radiation frequency are determined by the physician based on the disease and the condition of the particular patient. The radiation intensity is usually considered as a less important variable. For most diseases, the daily exposure varies from 15 to 60 min, and the therapy lasts for 8- 15 days.
Publications on the clinical use of MMW are counted by hundreds. While many of these reports were flawed in one way or another, still others were not and involved all necessary attributes, such as placebo control and double- blind protocol, and a lot of matching results have been provided by independent groups of investigators. Many authors have claimed that MMW monotherapy was more effective than conventional drug therapy. At the same time, MMW seldom caused any adverse effects or allergies. MMW in combination with drug therapy facilitated favorable effects and/or reduced adverse side effects of drugs.
The most common applications of MMW are for gastric and duodenal ulcers, cardiovascular diseases, (angina pectoris, hypertension, ischemic heart disease, infarction) respiratory sicknesses (tuberculosis, sarcoidosis, bronchitis, asthma), and skin diseases (wounds, trophic ulcers, burns, atopic dermatitis). Isolated studies claimed successful MMW treatment for asthenia, neuralgia, diabetes, osteochondrosis, acute viral hepatitis, glomerulonephritis, alcoholism, etc. MMW were also used for alleviation of toxic effects of chemotherapy in cancer patients, and in preventive medicine and health resort therapy.
In most cases, physicians use specialized MMW generators, which are produced commercially by the medical equipment industry. Because of the high demand, there are now more than 100 models of medical MMW generators on the market in the former USSR and some other European countries [7]. The most commonly used frequencies are 42.19 and 53.53 GHz, and 59-63 GHz band (7.1-, 5.6-, and 4.9-mm wavelengths). Alternatively, the practitioner may select an effective frequency for each patient based on this patient's individual sensitivity (so-called "microwave resonance therapy" [32]). The radiation intensity usually is about 10 mW/cm , but can be as low as several nW/cm2. MMW radiation can be applied to biologically-active or acupuncture points, sternum and xiphoid process, skin projection of a diseased organ, large joints and tender zones.
With all the variety of exposure techniques and protocols currently in use by medical practitioners, there is little rationale or guidance why would particular techniques and protocols be preferred over the others. Mechanisms of the MMW therapy
are not understood, and its use remains predominantly empirical.
The format of this paper allows us to exemplify only several clinical studies with MMW therapy. More information on the subject can be found in other reviews [7,8].
Poslavsky et al. [33] used MMW as a monotherapy in 317 patients with gastric and duodenal ulcers. The disease duration was from several months to more than 10 years, and the ulcer defect diameter ranged from 0.3 to 3.5 cm The epigastric area was exposed at 10 mW/cm2, 53.53 GHz, for 30 min daily excluding weekends, until complete ulcer healing. A comparable control group of 50 patients received conventional drug therapy. The ulcers cicatrized in 95.3% of MMW-treated patients, with mean healing duration of 19.8 ± 0.45 days. Results in the control group were substantially worse, namely 78% and 33.6 ± 1.12 days, respectively. The ulcer relapse rate was also significantly lower after the MMW therapy.
Korpan and Saradeth [34] used MMW therapy to assist healing of postoperative septic wounds. This double-blind controlled trial included 141 patients, 31- to 83-year old, with purulent wounds after an abdominal surgery. MMW therapy with 1-mW/cm2, 37-GHz radiation was performed in 71 patients. Wound surface and adjacent tissues were exposed for 30 nun/day for 7 days. The remaining 70 patients received placebo therapy from a similar but defective MMW generator (neither patients nor physicians knew it was defective). Radical surgical cleaning of the wounds was performed regularly in both groups. The MMW-treated patients showed 1.8 times more rapid wound clearance (5.6 ± 0.6 versus 10.2 ± 0.5 days in controls), wound granulation and epithelization also began substantially earlier. The mean daily decrease of wound surface area in the treated patients was twice that of the controls (7.1% versus 3.2%), and, on the average, the MMW- treated patients were discharged from the hospital 8.9 days earlier.
Novikova et al. [35] included MMW in a complex therapy for pulmonary tuberculosis. Fifty patients received drug therapy only, and 86 patients were additionally treated with MMW. Exposures of the thymus projection area at 6.4- or 7.1- mm wavelength lasted for 40 or 60 min/day for 10 days. MMW facilitated recovery, particularly in patients with newly developed disease. Resolution of infiltrations and closure of caverns in 70% of these patients occurred within one month of treatment In the control group, infiltrations resolved in about two months and caverns closed in 3-4 months. The clearance of tuberculosis bacteria was achieved in two months in 50% of the exposed group, but in only 29% of the controls.
In a similar study [36] with 54 pulmonary tuberculosis patients, the caverns closed in 50% of the exposed group during the 2nd and the 3rd months of treatment, while in controls it always took more than 3 months. Resolution of infiltrations occurred within 2 weeks in 70% of the exposed group, but always took more than one month in controls. However, clearance of tuberculosis bacteria was apparently unaffected by the MMW course.
Babov et al. [37] studied the efficacy of MMW (59-63 GHz, 7 mW/cm2) in the rehabilitation of patients after myocardial infarction. The course of MMW therapy started 15-20 days after the infarction and consisted of 15 exposures of the cardiac
26

area for 15 min/day. Eighty six patients were treated with MMW and 80 patients received placebo. MMW significantly facilitated tissue repair in the group with the eukinetic type of circulation. Cardiac muscle repolarization improved in 100% of the MMW-treated patients and in 48.8% of placebo controls; physical endurance increased by 25.8 ± 2.2 W and 18.7 ± 1.8 W, respectively. MMW, but not placebo, improved miCTOcirculation and ventricular contraction, and stimulated cicatrization and collagen formation. The MMW effect was weaker in patients with hyperkinetic circulation and negligible in those with the hypokinetic circulation. Results of the study suggested that, in the case of eukinetic circulation, MMW can be employed even as a monotherapy.
The efficacy of the MMW therapy is often illustrated by individual clinical cases, and some of them are quite impressive. Naumcheva [38] described the disease history of a 54-year old male, who had two myocardial infarctions within a 2-year interval. He suffered severe attacks of angina both on exertion and at rest and took up to 80 nitroglycerin tablets a day (0.4 mg). Repeated courses of in- and outpatient therapy with modern drugs, physical therapy, etc. had little effect. Finally, the patient was taken to a hospital in a grave condition with a third infarction. Conventional therapy methods have proved to be ineffective, so it was decided to try MMW therapy. MMW exposures began on day 10 after admission (7.1-mm wavelength, for 30 min/day to the left border of sternum). Chest pains decreased after two exposures and nighttime pain attacks ceased after seven procedures. The nitroglycerin intake was decreased to 1-2 tablets/day after 12 exposures. After the entire MMW course, the patient did not have angina attacks for 34 days, was able to walk up to 5 km a day, and was discharged in a satisfactory condition. Another man, age 62, was hospitalized with a severe macrofocal infarction, collapse, extrasystolia, and acute insufficiency and aneurysm of the left ventricle. Three days of intensive treatment still left the patient in this critical condition. Even the first MMW irradiation of sternum (53.53 GHz, three 10-min exposures with 5-min intervals) arrested pains and normalized sleep; hemodynamics stabilized within the next 5 days. The patient was discharged in a satisfactory condition and later took two additional MMW courses as a preventive measure.
IV. SUMMARY
At present time, development of MMW technologies is driven predominantly by various industrial and military applications. However, mere is another lesser known, but rapidly developing and promising area of MMW biomedical applications. Numerous studies point to the specific ability of MMW to affect and modify various biological functions, many of those being of great importance for human organism function. More than 20- year experience with MMW therapy in countries of the former Soviet Union has yielded encouraging results in a broad spectrum of diseases. Today, MMW therapy gains recognition in Europe (Bulgaria, Germany), and its first clinical trials are in progress in the United States (Temple University, PA). A cooperative effort of biological,
physical, and engineering communities in understanding physical and physiological mechanisms of MMW bioeffects could greatly promote wider recognition and use of the MMW therapy.
V. REFERENCES [I] H. Fröhlich, "The biological effects of microwaves
and related questions," Adv. Electronics Electron. Phys., vol. 53, pp. 85-152, 1980.
[2] H. Fröhlich (ed), Biological coherence and response to external stimuli. Berlin: Springer-Verlag, 1988.
[3] O. P. Gandhi, "Some basic properties of biological tissues for potential biomedical applications of millimeter-waves," J. Microwave Power, vol. 18, pp. 295-304, 1983.
[4] W. Grundler, "Biological effects of RF and MW energy at molecular and cellular level," in Biological Effects and Dosimetry of Nonionizing Radiation. Radiofrequency and Microwave Energies, A. Rindi, M. Grandolfo, and S. M. Michaelson, Eds. New York: Plenum Press, 1983, pp 299-318.
[5] E. Postow and M. L Swicord, "Modulated fields and "window" effects," in Handbook of Biological Effects of Electromagnetic Fields, C. Polk, and E. Postow, Eds. Boca Raton, FL: CRC Press, Inc., 1986, pp. 425- 460.
[6] I. Ya. Belyaev, "Some biophysical aspects of the genetic effect of low-intensity millimeter waves," Bioelectrochem. Bioenerg., vol. 27, pp. 11-18,1992.
[7] M. A. Rojavin and M C. Ziskin, "Medical application of millimetre waves," Q. J. Med., vol. 91, pp. 57-66, 1998.
[8] A. G. Pakhomov, Y. Akyel, O. N. Pakhomova, B. E. Stuck, and M. R Murphy, "Current state and implications of research on biological effects of millimeter waves: a review of literature," Bioelectromagnetics, vol. 19, pp. 393413,1998.
[9] W. Grundler, F. Keilman, and H. Froehlich, "Resonant growth rate response of yeast cells irradiated by weak microwaves," Phys. Letters, vol. 62A, pp. 463-466, 1977.
[10] W. Grundler, F. Keilman, V. Putterlik, and D Strube, "Resonant-like dependence of yeast growth rate on microwave frequencies," Br. J. Cancer, vol. 45, pp. 206-208, 1982.
[II] W. Grundler, U. Jentzsch, F. Keilmann, and V. Putterlik, "Resonant cellular effects of low intensity microwave," in Biological Coherence and Response to External Stimuli, H. Fröhlich, Ed. Berlin: Springer- Verlagn, 1988, pp 65-85.
[12] W. Grundler and F. Kaiser, "Experimental evidence for coherent excitations correlated with growth," Nanobiology, vol. 1, pp. 163-176,1992.
[13] L. Furia, D. W. Hill, and O. P. Gandhi, "Effect of millimeter-wave irradiation on growth of Saccharomyces cerevisiae," IEEE Trans. Biomed. Eng., vol. 33, pp. 993-999,1986.
27

[14] P. Gos, B. Eicher, J. Kohli, and W.-D. Heyer, "Extremely high frequency electromagnetic fields at low power density do not affect the division of exponential phase Saccharomyces cerevisiae cells," Bioelectromagnetics, vol. 18, pp. 142-155,1997.
[15] I. Ya. Belyaev, Y. D. Alipov, V. A. Polunin, and V. S. Shcheglov, "Evidence for dependence of resonant frequency of millimeter wave interaction with Escherichia coli K12 cells on haploid genome length," Electro- andMagnetobiol., vol. 12, pp. 39-49,1993.
[16] I. Ya. Belyaev, Y .D. Shcheglov, V. A., Alipov, and S. P. Radko, "Regularities of separate and combined effects of circularly polarized millimeter waves on E. coli cells at different phases of culture growth," Bioelectrochem. Bioenerg., vol 31, pp. 49-63,1993.
[17] I. Ya. Belyaev, Y .D. Shcheglov, V. A, Alipov, V. S. Polunin and O. A. Aizenberg, "Cooperative response of Escherichia coli to the resonance effect of millimeter waves at super low intensity," Electro- and Magnetobiol., vol. 13, pp. 53-66,1994.
[18] I. Ya. Belyaev, Y .D. Shcheglov, V. A, Alipov, and V. S. Polunin, "Resonance effect of millimeter waves in the power range from 10"19 to 3 x 10"3 W/cm2 on Escherichia coli cells at different concentrations," Bioelectromagnetics, vol. 17, pp. 312-321,1996.
[19] A. A Kataev, A. A Alexandrov, L. L. Tikhonova, and G. N. Berestovsky, "Frequency-dependent effects of the electromagnetic millimeter waves on the ion currents in the cell membrane of Nitellopsis: nonthermal action," Biofizika, vol. 38, pp. 446-462, 1993.
[20] A. G. Pakhomov, H. K. Prol, S. P. Mathur, Y. Akyel, and C. B. G. Campbell, "Search for frequency-specific effects of millimeter-wave radiation on isolated nerve function," Bioelectromagnetics, vol. 18, pp. 324-334, 1997.
[21] A. G. Pakhomov, H. K. Prol, S. P. Mathur, Y. Akyel, and C. B. G. Campbell, "Frequency-specific effects of millimeter wavelength electromagnetic radiation in isolated nerve," Electro- and Magnetobiol., vol. 16, pp. 43-57, 1997.
[22] A. G. Pakhomov, H. K. Prol, S. P. Mathur, Y. Akyel, and C. B. G. Campbell, "Role of field intensity in the biological effectiveness of millimeter waves at a resonance frequency," Bioelectrochem Bioenerg., vol. 43, pp. 27-33,1997.
[23] A. B. Gapeev, N. K. Chemeris, E. E. Fesenko, and R. N. Khramov, "Resonance effects of a low-intensity modulated EHF field. Alteration of the locomotor activity of the protozoa Paramecium caudatum," Biofizika, vol. 39, pp. 74-82,1994.
[24] V. S. Zemskov, N. N. Korpan, la. I. Khokhlich, V. A. Pavlenko, L. S. Nazarenko, A. I. Koval'chuk, and la. I. Stefanishin, "Effect of millimeter-band low intensity electromagnetic radiation on the course of wound healing," Klin. Khir., vol. 1, pp. 31-33,1988.
[25] N. N. Korpan, K-L. Resch, and P. Kokoschinegg, "Continuous microwave enhances the healing process of septic and aseptic wounds in rabbits," J. Surg. Res.,
vol. 57, pp. 667-671, 1994. [26] L. I. Kolosova, G. N. Akoev, V. D. Avelev, O. V.
Riabchikova, and K S. Babu, "Effect of low-intensity millimeter wave electromagnetic radiation on regeneration of the sciatic nerve in rats," Bioelectromagnetics, vol. 17, pp. 44-47,1996.
[27] L. I. Kolosova, G. N. Akoev,. O. V. Riabchikova, and V. D. Avelev, "The effect of low-intensity milümeter- range electromagnetic radiation on the functional recovery of the damaged sciatic nerve in rat," Fiziol. Zh. Im. I. M. Sechenova, vol. 82, pp. 85-90,1996.
[28] M. A Rojavin and M. C. Ziskin, "Anaesthesia caused by ketamine and chloral hydrate in mice," Int. J. Radiat Biol., vol. 72, pp. 475-480,1997.
[29] M. A. Rojavin, A Cowan, A. A. Radzievsky, and M C. Ziskin, "Antipruritic effect of millimeter waves in mice," Pharmacol. Letters, vol. 63, pp. PL 251-257, 1998.
[30] A. A Radzievsky, M. A Rojavin, A Cowan,, and M. C. Ziskin, "Suppression of pain sensation caused by millimeter waves: a double blind, crossover, prospective human volunteer study," Anesthesia and Analgesia, 1999 (in press).
[31] N. N. Lebedeva and O. V. Betskii, "Application of low intensity millimeter waves in medicine," in Abstracts of the 17th Annual Meeting of the Bioelectromagnetics Society, Boston, MA: June, 1995, p. 141.
[32] S. R Danilenko, "Efficacy of the use of extremely- high-frequency electromagnetic field in the complex therapy of chrome bronchitis patients," Vopr. Kurortol. Fizioter. Lech. Fiz. Kult, vol. 6, pp. 16-18, 1997.
[33] M. V. Poslavsky, I. M. Korochkin, O. F. Zdanovich, "Experience with application of millimeter-range radiation for treatment and prophylactics of stomach and duodenal ulcer," Vopr. Kurortol. Fizioter. Lech. Fiz. Kult, vol. 4, pp. 31-36,1989.
[34] N. N. Korpan and T. Saradeth, "Clinical effects of continuous microwave for postoperative septic wound treatment: a double-blind controlled trial," Am. J. Surg., vol. 170, pp. 271-276,1995.
[35] L. N. Novikova, G. O. Kaminskaia, and L. N. Efimova, "Significance of the functional state of blood phagocytes in the choice of optimal regime of EHF therapy of patients with pulmonary tuberculosis," Probl. Tuberk., vol. 6, pp. 17-20,1995.
[36] A. G. Khomenko, V. I. Chukanov, and L. N. Novikova, "Effectiveness of chemotherapy combined with ultrahigh-frequency electromagnetic radiation for the treatment of patients with pulmonary tuberculosis," Probl. Tuberk., vol. 4, pp. 24,1994.
[37] K .D. Babov, S. A. Novikov, and L. E. Mikhno, "Effect of electromagnetic waves with 59-63 GHz frequency on myocardial infarct patients in the subacute stage," Vopr. Kurortol. Fizioter. Lech. Fiz. Kult, vol. 6, pp. 10-13, 1993.
[38] N. N. Naumcheva, "Effect of millimeter waves on ischemic heart disease patients," Millimetrovie Volni v Biologii i Meditcine, vol. 3, pp. 62-67, 1994.
28

HIGH-RESOLUTION MICROWAVE DOSIMETRY IN LOSSY MEDIA
A. G. PAKHOMOV1'2, S. P. MATHUR1, Y. AKYEL1, J. L. KIEL2 and M. R. MURPHY2
'McKesson BioServices, US Army Medical Research Detachment and 2Directed Energy Bioeffects Division, Human Effectiveness Directorate, Air Force Research Laboratory, Brooks Air Force Base, San Antonio, Texas, 78235-5324, USA
1. Introduction
Measurement of the local specific absorption rate (SAR) in microwave-exposed specimens is a necessary task in a variety of bioelectromagnetic studies. Numerical techniques, such as finite-difference time-domain (FDTD) modeling, are widely used to evaluate local SAR and its distribution [1]. This modeling is laborious and expensive, and involves certain approximations of the spatial organization of exposed subjects and their dielectric properties. Since these approximations introduce an error into SAR predictions, the accuracy of the method may be difficult to assess. A precise instrumental technique of local SAR measurement in absorptive media could be an alternative to numerical modeling and could also be employed to verify FDTD predictions. While measurement of local heating dynamics under microwave exposure is a standard approach to establish SAR, common thermometry techniques have substantial limitations [2]. The accuracy of thermometry relies on several conditions, including possible field distortion by a probe, the probe's size, heat capacity, and response time.
A few non-field-perturbing devices available on the market (devices with non- metallic probes, such as fluoroptic thermometers) tend to be slow and noisy. In a Luxtron 850 fluoroptic thermometer, for example, the measurement rate is limited to 30 samples/sec, and, at this rate, sequential measurements of a constant temperature may vary by as much as 0.5-1 °C. Averaging of sequential measurements reduces the "noise", but also reduces the temporal resolution, so a fast heating cannot be recorded correctly. Besides, these thermometers cannot be used to detect temperature fluctuations over small distances of 1-2 mm, which are comparable with the size of the measuring probe itself.
The possibility of using thermometers with metal-containing probes (e.g., thermistors and thermocouples) for microwave dosimetry remains in question. Such probes may cause field distortion, and electric currents induced in the probe and wires may result in erroneous temperature readings and excessive heating of the probe itself. However, these artifacts should decrease with decreasing the dimensions of the probe and wires;
187
B.J. Klauenberg and D. Miklavcic (eds.), Radio Frequency Radiation Dosimetry, 187-197. © 2000 Kluwer Academic Publishers. Printed in the Netherlands.

188
at some point, the artifacts may become negligible. Other advantages of miniaturization are decreasing of the probe's heat capacity and improvement of its spatial and temporal resolution.
In this study, we have analyzed the performance of a microthermocouple (MTC) under most "unfavorable" exposure conditions (very steep field gradients produced by extremely-high peak power microwave pulses). It was shown that the dynamics of microwave heating recorded by the MTC is qualitatively different from the dynamics recorded by larger probes. Due to its exceptionally fast response and high sensitivity, MTC was capable of recording a temperature plateau after a microwave pulse or a brief train of pulses. The level of this plateau was linearly proportional to the local specific absorbed dose (SAD). Calculation of SAR from the initial slope of the heating curve was not possible because of its contamination with recording artifacts; at the same time, SAR could be precisely calculated from SAD and known duration of microwave pulse(s). The recording artifacts and possible field distortion by the MTC were shown to have no effect on SAD or SAR measurements.
2. Exposure Setup
Square microwave pulses (9.5 GHz, 1 us width, 75-115 kW) were produced by an EPSCO Model MH300 system with an MF-IM65-01 RF plug-in into a WR90 waveguide (22.86 x 10.16 mm). Incident and reflected powers in the waveguide were measured via directional couplers by a dual-channel HP 43 8A power meter with HP 8481A power sensors. Microwave pulses or pulse trains were triggered externally from a Grass Instruments S8800 stimulator. The shape of microwave pulses was monitored via an HP 432 detector on a TEK 2430A digital oscilloscope.
The design of the exposure cell was similar to the one proposed by Chou and Guy [3]. A vertical section at the end of the waveguide was separated by a quarter-wave matching plate and filled with 6 ml of a physiological solution. The waveguide walls in the cell were covered with a lacquer to prevent its electrical contact with the solution. Complex dielectric constant of this solution at 9.5 GHz and at various temperatures was calculated by equations given by Stogryn [4]. With the solution normality of 0.12-0.14, its relative permittivity (er) and conductivity (a) at 25 °C were calculated as 63.4 and 15.9 S/m, respectively. To verify the calculations, the dielectric properties of the solution were also obtained experimentally using an HP 8510 measurement system (see [5] for detailed procedures). Measured values (er = 63, a = 16 S/m) were virtually the same as the calculated ones. The respective linear loss coefficient of the solution was 3.71 Np/cm.
SAR in the solution along the axis of the waveguide decreased exponentially with increasing the distance above the matching plate, and could be calculated according to [3] as:
SAR = (1/p)2(RIpr> 2ae-2az (W/g) (i)

189
where p is the saline density (g/cm3). P/ and Pr are the incident and reflected power values (W; their difference will be regarded below as a "transmitted power"), S is the cross-section of the waveguide (2.32 cm2), a is the linear loss coefficient in the saline (Np/cm), and z is the distance above the matching plate (cm). Based on this equation, a power of 100 kW transmitted to the exposure cell would produce SAR values of 610, 304, 145, and 69 kW/g at the distances of at 0, 1, 2, and 3 mm above the plate, respectively (at 9.5 GHz and 25 °C). In other words, SAR in the saline would decrease by approximately twofold per millimeter. Obviously, measurement of local SAR from heating dynamics in such a steep gradient makes it imperative to use temperature probes much smaller than 1 mm.
In some experiments, we also used relatively low power, longer microwave pulses (10-100 ms, 5-10 W, 9.5 GHz). These pulses were produced by an HP 8690A Sweep Oscillator connected via a Hughes 8020H Traveling Wave Tube Amplifier to the same waveguide exposure system.
3. Microthermocouple and Temperature Recording
MTCs made of 25-(4.m diameter bare copper and constantan wires was purchased from Omega Engineering, Inc. For convenient handling, MTC was fixed in a custom-made holder. Bare wires ending with the thermocouple junction extended from the holder by about 3 mm; they were covered with a lacquer for electrical insulation from saline. The lacquer coating was made as thin as technically achievable, under a visual control using a microscope.
The MTC was precisely positioned in the exposure cell by means of a micromanipulator. The accuracy of the micromanipulator movement was 0.05 mm in any orthogonal direction.
MTC signal was recorded by a BIOPAC MP100 data acquisition system via a universal DC amplifier (Gould 5900 frame). The higher cutoff frequency of the amplifier in most experiments was set at 1 or 10 kHz. The entire system (MTC + amplifier + MP100) was calibrated against a precision mercury thermometer. Within studied range of temperatures and achievable accuracy, the system response was linearly proportional to the temperature.
In most experiments, acquisition of the signal from MTC began shortly (10-50 ms) before the microwave pulse train, and ended some period after the train was over. Records of temperature changes produced by repeated pulses or pulse trains could be averaged, that substantially decreased the noise. The accuracy of temperature readings was about 0.05 °C without signal averaging and better than 0.01 °C after averaging. This accuracy could be further increased by measuring mean temperature over 5-50 ms periods (when the temperature of the medium was constant).
One should note that the above numbers apply only to "relative" temperatures, or temperature changes within relatively short periods of time (10"2-103 s). The absolute

190
temperature of the medium could only be measured using two thermocouples, one of them rendered as a reference and kept at a known constant temperature [6]. For the purpose of SAR measurement, knowing the exact absolute temperature was not essential, so the reference thermocouple was not used in our experiments.
In some experiments, temperature in the exposure cell was simultaneously recorded by the MTC and a Luxtron 850 Multichannel Fluoroptic Thermometer.
4. Results and Discussion
In the first series of experiments, we obtained simultaneous records of microwave heating by MTC and by a "recognized" artifact-free thermometer, Luxtron 850. MTC junction was put either in contact with the fluoroptic probe, or 0.2-0.4 mm apart. A sample record is shown in the Figure 1: At any transmitted power (which, in the shown case, was proportional to the pulse repetition rate), both the probes recorded the same heating dynamics. These data established the general possibility of using MTC under microwave irradiation, and also confirmed MTC calibration.
1/1 5 AT, Luxtron
A- AT, MTC
H
w AV. Power (1-us pulses, 75 kW peak)
A p.p.s.: 2.5 10 20 40
10 20 30 minutes 40
Figure 1. Parallel recording of microwave heating by a fluoroptic probe (Luxtron 850 thermometer, upper trace) and by a microthermocouple (MTC, middle trace). The probes are in contact with each other at the bottom of the exposure cell. The lower trace is the average transmitted power, which is proportional to the pulse repetition rate (p.p.s.).
Such similarity of MTC and Luxtron recordings as shown in Figure 1 was only possible at slow recording rates and long exposures (minutes) at a relatively low average transmitted power. Slow recording conceals much faster response time of the

191
MTC, and, at a low average power, allows enough time for temperature equilibration between neighboring spots with different local SAR. Additional peaks on the heating curves (particularly noticeable at 20 and 40 p.p.s.) resulted from liquid convection in the exposure cell. Such peaks disappeared entirely when the saline was solidified with a 1% agar-agar, and heating curves attained a "classic" appearance.
If the presence of the MTC in the exposed medium caused field distortion and altered microwave heating, then the Luxtron thermometer readings would depend on the presence of the MTC next to the fluoroptic probe. Experiments showed that this was not the case: Luxtron-recorded heating curves in response to identical exposures were the same with MTC positioned next to the fluoroptic probe, MTC removed from the solution, and also after returning MTC back into the original position.
However, the fluoroptic probe might be too slow and bulky to detect fine alterations of the field and heating pattern introduced by the MTC. Therefore, we performed more accurate experiments, in which the MTC-recorded heating curves served as "self- control" (Figure 2). The micromanipulator that we used for MTC positioning had an option to lift the MTC and then slide it momentarily down to the exact original position. The upper heating curve in Figure 2 was recorded when the MTC was permanently kept at the bottom of the exposure cell (Position 1). The lower curve (the same exposure parameters) started when the MTC was elevated into Position 2. After the exposure was over, the MTC was quickly slid into the Position 1.
a train of 20 high-power pulses (94 kW. 1- us width. 5-ms interval)
Figure 2. Microwave heating recorded by microthermocouple (MTC). Upper trace: MTC was at the bottom of the exposure cell (Position 1) during and after exposure (20 high-power pulses). Lower trace: MTC was at the top of the (Position 2) during the exposure, and was slid into the Position 1 after the exposure was over. See text for further explanation.
Solution in the cell was exposed to repeated trains of microwave pulses (1 train/10 sec), which resulted in a temperature difference between two MTC positions (Position 2 was farther away from the matching plate and therefore was cooler). Microwave pulses

192
produced large artifacts and pronounced heating in the Position 1, and smaller artifacts and only subtle heating in the Position 2. Due to the high field attenuation by the saline (about 40 times per 5 mm), the presence of the MTC in the Position 2 could have no effect on microwave heating at the bottom of the cell.
Hence, the temperature recorded on the lower curve after sliding the MTC down is the real temperature of the medium in the Position 1, not affected by the presence of the MTC there during exposure. This temperature was exactly the same as the one recorded with the MTC being in the Position 1 throughout the exposure (the upper curve). This experiment was repeated numerous times, with various MTC positions and exposure parameters, and with the same result as illustrated. Thus, the presence of MTC in the medium during exposure produced no measurable field distortion and did not affect heating of the medium.
Figure 3. The shape of a heating curve recorded by MTC. Heating is produced by trains of 10 high-power pulses (110 kW peak transmitted power, 1 us width, 1 ms interpulse interval, 1 train/12 s). Note recording artifacts (they also mark the time when the train was applied) and a long-lasting temperature plateau after the train.
This finding would be a sufficient grounds for local SAR measurement with the MTC unless the initial slope of the heating curve was contaminated by recording artifacts. These artifacts can be seen even better in Figure 3, which shows a heating curve recorded at three different time scales. The presence of microwave pulse artifacts makes it difficult or impossible to measure the initial slope of the heating curve. Hence, the "standard" approach to SAR measurement (Figure 4) may not be used in this case.
At the same time, there is an important difference between heating curves recorded by MTC and by larger conventional probes. This difference is the extended temperature plateau after a short microwave pulse or a brief train of pulses (Figure 3). It should be

193
emphasized that this is an actual plateau, and not a part of the declining slope that was artificially expanded to make it appear flat.
The existence of this plateau can be explained as follows. In our set-up, brief and intensive microwave exposure creates a significant SAR and temperature gradient in the exposed medium. After the exposure is over, the heat dissipates from warmer to cooler areas of the exposed medium and further into the environment. Thus, the MTC submerged into the medium is simultaneously warmed up by the heat flow from the warmer areas and cooled down by the heat flow to the cooler areas. The heat flow to cooler areas will obviously prevail, and the entire exposed medium will eventually cool down to the ambient temperature. However, for a very brief time interval after exposure and within an adequately small medium volume (like the volume in the immediate vicinity of the MTC), the warming and cooling heat flows will be virtually equal. As a result, the MTC will record a temperature plateau, as if no heat dissipation takes place.
Standard method:
SAR= C
Alternative method: AT
SAR = C At
■■ /
/
V, ■ „ /
AT 1
At —1
Figure 4. "Standard" and "alternative" methods of specific absorption rate (SAR) measurement from heating dynamics. Shown are the microwave pulse duration (lower traces) and sample heating curves (upper traces), The standard method uses the initial slope of the heating curve (C is the specific heat capacity of medium). The alternative method calculates SAR from the level of the after-pulse plateau and the duration of the pulse. Both methods can be used with the same result when the plateau is present and no artifacts are recorded.
If this is true, the plateau level (i.e., the difference between the temperature before the exposure and the plateau) will be linearly proportional to the delivered energy (e.g., the number of pulses in a train) and, within certain limits, will not depend on the pattern of the energy delivery (e.g., interpulse interval). Figure 5 shows that this was the case indeed. Hence, the locally absorbed dose (SAD) can be found as a product of the plateau level and specific heat capacity of the medium.
Once we know the SAD, we do not need the initial slope of the heating curve to calculate SAR. Instead, SAR can be calculated as a ratio of SAD and known duration of microwave pulse(s), as shown in Figure 4 as an "alternative method".

194
B 00 en Ö
oo en Ö
*0
©
0.5 °C
50 ms
Figure 5. Heating dynamics under exposure to trains of high-power pulses (l-|is pulse width, 400 kW/g peak SAR). Spikes during the ascending portion of the curves (artifacts) correspond to microwave pulses. Temperature is measured as mean values for 40-ms periods before and after exposure. A: 10-pulse trains with interpulse intervals of 1, 3, 5, and 13 ms. The plateau level (0.93 °C) does not depend on of the interpulse interval. B: Trains with a constant interpulse interval (5 ms) and different number of pulses. Heating is linearly proportional to the number of pulses per train. Heating by a single pulse is about 0.09 "C.
The final step to justify this alternative method was to compare measured SAR values with those predicted by the equation (1). This comparison is illustrated in Figures 6 and 7.
In Figure 6, A, heating of 0.1 °C was produced by a single high-power pulse. Calculated and measured SARs were 585 and 420 kW/g, respectively. As stated by Bässen and Babij [2], "an absolute accuracy of ±3 dB is the best case measurement uncertainty that can be achieved when attempting to determine the maximum and minimum SARs within an irradiated biological body." In our setup and with the use of MTC, the difference between calculated and measured SARs was only 1.4 dB.
The match was even better for exposure to low-power, longer microwave pulses (Figure 6, B). Measured values were only 0.4-0.5 dB apart from the calculated ones. This small error could easily be attributed to a combined inaccuracy of power meters, field probes and other devices, or even to some imperfection of the analytical equation itself (the equation is developed for TEio wave propagation mode, while various other modes also arise in the waveguide after the matching plate). Figure 6 also demonstrates that the presence of a temperature plateau after a microwave pulse is not a specific attribute of exposure to extremely high-power pulses. The plateau is as well pronounced with reasonably low amplitude pulses, and the proposed method of SAR measurement with MTC can be used as long as the plateau can be detected.

195
V^.,. „ .,,. ....»—■—-~v——-—-—*-—~—«. -. 0.2 C Jo.io °c
100 ms
Calculated SAR (25 °C) = 585 kW/g
Measured SAR = 4.2 x 0.1 /10"6 = 420 kW/g (-1.4 dB)
0.5 °C
B S*—~~~— . y019 'c 50 ms
J L 7.4 W 20 ms
Calculated SAR (27 °C) = 43.9 W/g Measured SAR = 4.2 x 0.19 / 0.02 = 39.9 W/g (-0.41 dB)
Figure 6. Comparison of calculated and microthermocouple-measured local SAR values. A, a high-power pulse (96 kW transmitted power, 1 us width); the moment of exposure coincides with the artifact on the heating curve. B, a moderate power pulse (7.4 W, 20 ms width, indicated on the lower trace). The temperature before the pulse and during the plateau was measured as a mean of a 25-ms period. Calculated SAR values were obtained using the equation (1), see text. The difference of the measured and calculated SAR was -1.4 dB (A) and -0.41 dB (B).
Figure 7 gives an example of the field mapping with MTC and illustrates its spatial resolution. Heating curves recorded in spots as close as 0.5 mm to each other were substantially different, and measured SAR values were always close to the calculated ones.
MTC was also used for horizontal field mapping in a cross-section of the waveguide. Horizontal field distribution was calculated according to standard waveguide equations [7] for TEio mode. Again, measured and calculated values were within ±1.5 dB apart.
5. Conclusions
The experiments established that MTC is an appropriate tool to measure local SAR in an absorptive medium. Small size, negligible heat capacity, fast response time, and high sensitivity make MTC particularly useful in high-gradient fields with complicated patterns of SAR distribution and also at high SARs, when larger probes may be too slow.
However, the presence of recording artifacts when the radiation is on prompts that, in general, the temperature of the medium can be measured accurately only when the

196
exposure is off. That is why the standard method of determining SAR from the initial slope of the heating curve may be essentially inaccurate, and a different procedure should be employed instead. This procedure is based on the ability of MTC to record a temperature plateau after a short microwave pulse or a brief train of pulses. The level of this plateau is proportional to SAD, and local SAR can be calculated from the SAD and known duration of microwave pulse(s). This method produced highly reproducible SAR measurements, which matched closely with theoretical predictions. We can conjecture that the proposed method of local SAR measurement with MTC will produce valid results in any situation when a temperature plateau after a pulsed exposure can be reliably detected (regardless of the wavelength, incident power, absorptive media properties or configuration).
The proposed method of local SAR measurement can be recommended for practical dosimetry, and can also be employed to verify FDTD predictions of SAR distribution in animal and human models.
a train of 10 high-power pulses (110 kW. 1- us width. 2-ms interval)
AT, °c peak SAR. kW/g
measured expected diff. (dB)
1.4
1.2
1.1 •1.5
a: as 0 1.0 2.0 3.0 4.0
Distance above the matching plate, mm
Figure 7. Vertical field mapping along the axis of the waveguide: A comparison of microthermocouple- measured and expected local SAR values. Heating curves (left) produced by a train of 10 high-power pulses were recorded at the heights from 0 to 3 mm above the matching plate (only four curves are shown). The "expected" local SAR was calculated by the equation (1). The table and the graph compare measured and expected local SAR values.

197
6. Acknowledgments
The work was supported in part by the U.S. Army Medical Research and Materiel Command and the U.S. Force Research Laboratory under US Army contract DAMD17- 94-C-4069 awarded to McKesson BioServices. The views expressed are those of the authors and should not be construed as reflecting the official policy or position of the Department of the Army, Department of the Air Force, or the United States Government.
7. References
1. Gandhi, O.P. (1990) Numerical methods for specific absorption rate calculations, in O.P. Gandhi (ed.), Biological Effects and Medical Applications of Electromagnetic Energy, Prentice Hall, Englewood Cliffs, New Jersey, pp. 113-140.
2. Bässen, H.I. and Babij, T. M. (1990) Experimental techniques and instrumentation, Ibid., pp. 141-173. 3. Chou, C-K. and Guy, A. W. (1978) Effects of electromagnetic fields on isolated nerve and muscle
preparations, IEEE Trans. Microwave Theory Tech. 26,141-147. 4. Stogryn, A. (1971) Equations for calculating the dielectric constant of saline water, IEEE Trans.
Microwave Theory Tech. 19,733-736. 5. Bao, J. Z., Swicord, M., and Davis, C. Microwave dielectric characterization of binary mixtures of
water, methanol, and ethanol. J. Chem. Phys. 104, pp. 4441-4450. 6. Benedict R. P., ed. (1983) Manual on the Use of Thermocouples in Temperature Measurement, ASTM
Special Technical Publication 470B, ASTM, Baltimore, MD, p. 258. 7. Paris, D.T. and Hurd, F.K. (1969) Basic Electromagnetic Theory, McGraw Hill Book Company, NY,
pp. 398-451.

Bioelectromagnetics 21:245-254 (2000)
Comparative Effects of Extremely High Power Microwave Pulses and a Brief CW
Irradiation on Pacemaker Function in Isolated Frog Heart Slices
Andrei G. Pakhomov,1,3* Satnam P. Mathur,1 Joanne Doyle,1 Bruce E. Stuck,2
Jonathan L. Kiel,3 and Michael R. Murphy3
1McKesson BioServices, Brooks Air Force Base, San Antonio, Texas ZU.S. Army Medical Research Detachment oftheWalter ReedArmy Institute ofResearch,
Brooks Air Force Base, San Antonio, Texas 3Directed Energy Bioeffects Division, Human Effectiveness Directorate,
Air Force Research Laboratory, Brooks Air Force Base, San Antonio, Texas
The existence of specific bioeffects due to high peak power microwaves and their potential health hazards are among the most debated but least explored problems in microwave biology. The present study attempted to reveal such effects by comparing the bioeffects of short trains of extremely high power microwave pulses (EHPP, 1 us width, 250-350 kW/g, 9.2 GHz) with those of relatively low power pulses (LPP, 0.5-10s width, 3-30W7g, 9.2GHz). EHPP train duration and average power were made equal to those of an LPP; therefore both exposure modalities produced the same temperature rise. Bioeffects were studied in isolated, spontaneously beating slices of the frog heart. In most cases, a single EHPP train or LPP immediately decreased the inter-beat interval (IBI). The effect was proportional to microwave heating, fully reversible, and easily reproducible. The magnitude and time course of EHPP- and LPP-induced changes always were the same. No delayed or irreversible effects of irradiation were observed. The same effect could be repeated in a single preparation numerous times with no signs of adaptation, sensitization, lasting functional alteration, or damage. A qualitatively different effect, namely, a temporary arrest of preparation beats, could be observed when microwave heating exceeded physiologically tolerable limits. This effect also did not depend on whether the critical temperature rise was produced by LPP or EHPP exposure. Within the studied limits, we found no indications of EHPP-specific bioeffects. EHPP- and LPP- induced changes in the pacemaker rhythm of isolated frog heart preparation were identical and could be entirely attributed to microwave heating. Bioelectromagnetics 21:245-254,2000. © 2000 Wiley-Liss, Inc.
Key words: high power microwave pulses; specific effects; frog heart rhythm; beating rate
INTRODUCTION
It is well known that bioeffects of high peak Contract grant sponsor: US Army Medical Research and , ,.x „. , ,.„ 6 *. Materiel Command and the U.S. An- Force Research Laboratory
power microwaves can be qualitatively different from (HEDR and AFOSR); Contract grant number: DAMD17-94-C- those of continuous-wave (CW) fields of the same 4069 average power. The best studied example is a micro- wave auditory effect, which is caused by a thermo- The views exPressed in this article are those of the authors and elastic stress in absorbing tissue and perception of the *?£*%* r^onstraed as reflecting the official policy or position
,.. I. • i . , . of the Department of the Army, Department of the Air Force, or resulting pressure wave by animal or human hearing the United States Government apparatus [Guy et al., 1975; Lin, 1978, 1989]. The threshold of microwave-induced sound perception in 'Correspondence to: Dr. A. Pakhomov, McKesson BioServices, humans at 2450 MHz was found to be about 400 mJ/m2 8308 Hawks Road> Building 1168, Brooks Air Force Base, San per pulse for various pulse widths shorter than 30 US ££jji ™ 78235-5324. E-mail: andrei.pakhomov@afrlars. [Guy et al., 1975]. Other phenomena, such as mem- brane damage by high instant values of the electric Received 20 April 1999; Final revision received 2 August 1999
©2000 Wiley-Liss, Inc.

246 Pakhomov et al.
field, could theoretically contribute to pulsed field bioeffects and cause damage without significant heating of tissues [Albanese et al., 1994]. Lin [1989] stated, "While there is very little likelihood that the microwave auditory effect at threshold incident power can constitute a hazard, exposures at levels that are significantly higher than threshold will undoubtedly be very harmful to cell membranes, cytoplasm, and whole organisms."
However, there are few experimental data avail- able to support this conjecture. Experimentation with animals at peak specific absorption rates (SAR) of the order of kilowatts per gram requires unique exposure facilities and is rather laborious and expensive. Only a few such studies have been reported in the literature. Akyel et al. [1992] and Raslear et al. [1993] found that extremely-high power pulses (EHPP) significantly decrease physical endurance and disrupted cognitive function in rats. These effects developed after exposure to 200 pulses at a rate of 1 pulse/8 s (80 ns pulse width, 3 GHz). Though the peak specific absorption rate (SAR) reached approximately 8.7kW/g (body aver- age) and 21 kW/g in the midbrain, the time-average values were 108 times lower, thus making it possible to rule out the ordinary thermal origin of the observed effects. However, at different exposure regimes and somewhat lower peak SAR levels (0.2-6.9 kW/g), no behavioral or physiological changes could be detected in EHPP-exposed monkeys and rats unless the time- average SAR was high enough to produce a thermal response [D'Andrea et al., 1989; Klauenberg et al., 1990; Akyel et al., 1991; Jauchem and Frei, 1995]. Though very limited, these findings seem to be consistent with the idea that mechanisms other than ordinary microwave heating could be involved in the bioeffects when EHPP intensity exceeds a certain threshold.
As an alternative to animal experiments, many aspects of EHPP biological action can be studied in vitro in cell and tissue models. The volume of in vitro samples usually does not have to be greater than 0.1- lml, and producing peak SAR of tens and even hundreds of kilowatts per gram in this small volume does not require custom-built, megawatt-output trans- mitters or anechoic chambers. Instead, the radiation can be confined in a waveguide, maximizing the portion of the output power that is effectively absorbed by the sample and minimizing undesired exposure of service personnel and laboratory equipment. Further advantages of in vitro experimentation are the possi- bilities for precise control of temperature and SAR in the exposed sample and greater flexibility of modula- tion regimes in the lower-power microwave trans- mitters.
Stewart-DeHaan et al. [1983, 1985] and Creighton et al. [1987] have used an in vitro set-up to compare CW and EHPP exposure damage in isolated ocular lenses. Irradiation at 915 or 918 MHz lasted for up to 60 min at the time-average SAR of 5.75-750 mW/g (0.5-60 W average transmitted power, respectively). For EHPP exposures (10 us wide, 24 kW peak power pulses, or 20 us wide, 48 kW peak power pulses), pulse repetition rates were adjusted to match the average power from CW exposure. Lenses were fixed immediately after irradiation and analyzed by scanning electron microscopy. In most cases, EHPP caused significantly greater damage than CW radiation at the same average power. The thermoelastic expan- sion following each microwave pulse and the resulting pressure waves induced in the aqueous medium and lens tissue, was the most likely mechanism to explain the greater effects of EHPP exposures. The possibility of tissue damage by mechanisms other than average heating under EHPP exposure may have major impli- cations for safety guidelines.
Using an in-waveguide exposure setup allowed us to study EHPP effects at peak SAR as high as 270-310 kW/g at 9.5 GHz and 1 us pulse width [Pakhomov et al., 1998, 1999b]. Spontaneous beating rate of isolated sections of the frog heart sinoatrial area was a robust and sensitive index of EHPP effect on pacemaker function, and various exposure regimes were compared in an attempt to reveal possible specific EHPP effects. The experiments established that brief (4-100ms) EHPP trains of 5-60 pulses immediately decreased the inter-beat interval (IBI). This change was fully reversible and proportional to the maximum microwave heating, which, in our conditions, was entirely determined by the number of pulses in the EHPP train. With the number of pulses per train kept constant, the maximum heating remained the same; trains of different durations, but with the same number of pulses, produced the same biological effect. This pattern of reacting to the exposure suggested a merely thermal mechanism of EHPP action.
In a few cases, the exposure caused a qualita- tively different effect, namely a more or less prolonged cessation of the preparation beats. It was possible to demonstrate that, at least in some of these cases, the cessation of beats was caused by uncoupling of contractile elements from the pacemaker, and not by deceleration or stoppage of the pacemaker itself. While stoppage of the pacemaker could have been an indication of a specific EHPP effect, the uncoupling could reasonably be explained by general heating.
The above experiments, although being indica- tive of a thermal EHPP effect only, did not answer the principal question: whether the biological effective-

Effects of EHPP Microwave Pulses 247
ness of EHPP trains is different from CW exposure at the same power. This comparison is made in the present study.
MATERIALS AND METHODS
Except for a few modifications, we employed the same techniques and procedures as described pre- viously [Pakhomov et al., 1998, 1999b]. These modi- fications included somewhat different design of the exposure cell, switching from 9.5 to 9.2 GHz, and using an extracellular glass microelectrode to record the preparation beats.
Exposure System, Dosimetry and Thermometry
Square microwave pulses (9.2 GHz, 1 |is width, 65-110kW) were produced by an EPSCO Model MH300 system with an MF-IM65-01 RF plug-in into a WR90 waveguide (22.86 x 10.16 mm). Incident and reflected powers in the waveguide were measured via directional couplers by Hewlett-Packard (HP) 438A and HP 435B power meters with HP 8481A power sensors. The EHPP transmitter was set to external triggering from a Grass Instruments S8800 Stimulator. The EHPP train onset, duration, and the repetition rate of pulses in the train were controlled by the stimulator, while the pulse width, output power, and frequency were determined by settings of the transmitter itself. The shape of microwave pulses was monitored via an HP 432 detector on a TEK 2430A digital oscilloscope.
With the help of a waveguide switch, the same waveguide system could be connected to a relatively low power CW transmitter tuned to 9.2 GHz (HP 8690A Sweep Oscillator with Hughes 8020H Travel- ing Wave Tube Amplifier, up to 8W output). A custom-made electronic trigger was used to keep the output power of the transmitter shut off except for the duration of control pulses from the stimulator ("gated CW")- Thus, the CW transmitter produced microwave pulses coincident in time and equal in duration to the control pulses from the stimulator. Hereafter, these pulses from the CW source will be referred to as "low- power pulses" (LPP).
In most cases, the LPP duration was set equal to the duration of the EHPP train, and the LPP power was adjusted to match the average power emitted during the EHPP train. For example, when the EHPP transmitter was set to produce als train of 50 pulses (100 kW peak power, 1 us pulse width, 5 W average power), the LPP width and power were set at 1 s and 5W, respectively. Reflection from the exposure cell situated at the termination of the waveguide was negligible for both EHPP and LPP (always less than
5%). Therefore, medium and sample in the exposure cell absorbed the same total amount of energy during an EHPP train and during a single LPP.
The exposure cell was set atop a vertical end section of the waveguide. The waveguide flanges (covered with a varnish) and a sapphire matching plate impressed into the waveguide formed at the bottom of the cell. Plexiglas walls divided the cell into two compartments. The central compartment above the center of the matching plate was filled with Ringer's salt solution, and samples to be exposed were placed directly on the matching plate. The central compart- ment was open from the top, to allow the access of recording electrodes and a temperature probe to the sample at the bottom. The other (outer) compartment was essentially a jacket filled with constant tempera- ture water circulating through a water bath. It should be emphasized that this thermostabilization system could not (and was not intended to) compensate for fast microwave heating in the middle compartment. Instead, its purpose was to set the initial temperature in the central compartment at a level different from the room temperature (e.g., 36 °C).
A method of high-resolution microwave dosime- try was described in detail and justified in a previous publication [Pakhomov et al., 2000]. In short, local SAR was measured with the help of a microthermo- couple (MTC) made of 25 um copper and constantan wires (Omega Engineering, Inc.). Virtually instant response of the MTC to temperature changes made it possible to record a temperature plateau for a period of 200-600 ms after a short (e.g., 10-100 ms) LPP or after a brief EHPP train. Within the duration of this plateau, heat flows to and from the MTC are virtually equal, so heat dissipation could be disregarded. Several independent tests proved that the level of the plateau is precisely proportional to the dose absorbed locally in the medium. Moreover, the plateau level was not affected by microwave-induced recording artifacts or the presence of the MTC itself in the medium during exposure. MTC measurements of SAR as a function of the distance above the matching plate in a solution- filled waveguide section produced practically the same values (within 1.1-1.8 dB) as a theoretical calculation according to Chou and Guy [1978]. The method proved to be capable of measuring accurate local SAR with a spatial resolution of better than 0.25 mm.
MTC measurements were used to analyze verti- cal and horizontal field distribution in our exposure setup (Fig. 1). Along the axis of the waveguide, SAR fell sharply with increasing distance above the matching plate (approximately twofold per milli- meter). It is worth mentioning that both the SAR gradient and the measured SAR values in this exposure

248 Pakhomov et al.
B
5 4
v. B 2
* i CO
0.5
tüj
E S
0 12 3
mm above the matching plate
-4-2 0 2
mm (H)
Fig. 1. Vertical (A) and horizontal (B) field distribution in the exposure cell filled with Ringer's solu- tion. Measurements were performed with a microthermocouple at 9.2 GHz. A. Specific absorption rate (SAR,W/g) per Watt of transmitted power as a function of the distance above the matching plate along the axis of the waveguide. Solid line is an exponential approximation of measured SAR values. Dashed line is a theoretical curve calculated for the Ringer's solution-filled waveguide section according to Chou and Guy [1978]. B. Measured field attenuation as a function of the distance from the waveguide axis in a horizontal plane 0.5 mm above the matching plateThe values are expressed as a percentage of the SAR maximum measured along the waveguideaxis (3.3 W/g/W). Coordinates are the distances (mm) from the waveguide axis in E- and H-vectordirections.
cell were very close to the values measured [Pakhomov et al., 2000] and calculated theoretically in a solution- filled waveguide (a theoretical curve for the solution- filled waveguide is shown by a dashed line in Figure 1 A). Indeed, the SAR gradient is determined by the solution properties rather than by the exposure cell design, and with very high losses in the solution, the presence or absence of waveguide walls has little effect on SAR along the waveguide axis.
It is known that a pulsed radiation may penetrate deeper into biological tissues than a CW radiation of the same frequency [Lin, 1989]. This difference arises because lower frequency harmonics present in a pulsed signal are attenuated to a lesser degree than the main frequency. However, in most situations the power of lower frequency harmonics is negligible (orders of magnitude less) compared with power at the main frequency. At any tested location in our exposure cell, MTC measurements produced exactly the same average SAR values for EHPP trains and LPPs of equivalent average power. Although the fine dynamics of microwave heating were different (gradual tem- perature rise during an LPP and a stepwise rise during an EHPP train), the temperature increase by the end of the exposure was the same.
Field distribution in the horizontal plane (parallel to the matching plate) was substantially more uniform
(Fig. 1 B). At 0.5 mm above the plate, i.e., at the ap- proximate position of the geometrical center of heart slices, SAR decreased by less than 20% within a 2 mm radius from the waveguide axis. For the slice pre- paration, which had width and length of about 2-3 mm or less, irradiation in the horizontal plane could be considered practically uniform. SAR values reported below in this paper are those along the waveguide axis, 0.5 mm above the matching plate; they were calculated using an MTC-measured transition coefficient of 3.3 W/g per W transmitted power.
While MTC was an indispensable tool for local heating and SAR measurements, a Luxtron Instru- ments model 850 multichannel fluoroptic thermometer was more convenient for routine monitoring of the solution temperature during biological experiments. A fluoroptic probe was positioned on the matching plate 1-1.5 mm away from the slice preparation. While the Luxtron probe temperature readings could be some- what different from the actual temperature in the slice, this offset was always the same for EHPP and LPP exposure.
Physiological Methods The experiments were performed in isolated,
spontaneously beating sections of the cardiac sinoatrial area of the bullfrog, Rana catesbiana. Active adult

Effects of EHPP Microwave Pulses 249
frogs (males) were kept in vivarium conditions (22- 25 °C, 30-70% relative humidity, 12 h light/12 h dark diurnal light cycle) for at least one month prior to experiments, which were carried out in December 1998. After animal immobilization by pithing the brain and the spinal cord, heart was isolated in a conven- tional manner and submerged into chilled Ringer's solution containing (mmol/1): NaCl, 102.6; KC1, 1.0; NaHC03,0.7; CaCl2,0.9; pH 7.4-7.6. We were able to prepare 3-6 usable slices from one heart, and they were used in experiments one at a time during the same day.
The slice to be exposed was transferred into the exposure cell filled with Ringer's solution. Preparation beats were recorded extracellularly with a blunt glass microelectrode (approximately 100 kilo Ohm resis- tance) filled with the same solution. The electrode also kept the preparation attached to the center of the sapphire plate at the bottom of the exposure cell.
The signal from the microelectrode was recorded by an MP100 data acquisition system (BIOPAC) via a DAM50 amplifier (WPI). The preparation beats appeared as sharp regular spikes, and the IBI duration was automatically calculated and plotted in real time on a separate channel. (One should realize that the duration of an ongoing IBI cannot be known until the IBI is over. That is why, the duration of an ongoing IBI will always be plotted with a "one-IBI" delay, i.e., during the next IBI. This delay is most noticeable in Figure 3 C). One more channel was used for an auto- matic marker of exposures, and the fourth channel served for synchronous monitoring of temperature changes.
After being placed into the exposure cell, the preparation was allowed to stabilize for 30-60 min. Preparations with unstable beating rhythm were dis- carded. Each preparation could be exposed several times, allowing enough time between exposures for complete IBI recovery and stabilization. EHPP and LPP exposures and sham exposures alternated in a random manner. For a sham exposure, microwave pulses were triggered, but radiation in the waveguide was re-routed to a matching load instead of the exposure cell. One should note, however, that with all the recording and exposure equipment being turned on throughout (and just awaiting the external trigger), preparations in the exposure cell were essentially undergoing sham exposure all the time except for periods of the actual exposure. Experimental data were analyzed by Student's t test (see "Results" section for details).
RESULTS
In an unchanged environment, the pacemaker rhythm in isolated frog auricle sections can remain
very stable for many minutes and even hours. At the same time, the rhythm is highly sensitive to the ambient temperature, and this dependence is gradual and uniform in a wide interval of temperatures (Fig. 2). Decrease in IBI with an increase in temperature is a well-known physiological response; it is fully rever- sible and readily reproducible.
Sample records of the preparation response to repetitive LPP and EHPP exposures are shown in Figure 3. The experiments shown were performed at different initial temperatures and with different exposure regimes, but in all cases the average power and duration of EHPP trains were equal to the power and duration of LPP. Indeed, within the accuracy of measurements, the magnitude and dynamics of heating produced by LPP and EHPP were the same (bottom traces).
Either modality of irradiation caused a small, but well reproducible IBI decrease (Figs. 3 A and B). The changes in IBI perfectly followed the temperature curve, and beating rate returned to the exact initial level as soon as the solution cooled down after each exposure. The effect appeared the same for EHPP and LPP exposures and could be consistently repeated numerous times, with no signs of adaptation, sensitiza- tion, lasting functional alteration, or preparation damage by microwaves. No delayed or irreversible effects of irradiation were observed.
o
10- 9 8 7
6
5
4-
1 3
<3 2-
J 10 15
—1 1 1 1 1 1 1 20 25
Temperature, °C
Fig. 2. A typical dependence of the inter-beat interval in an isolated slice of frog heart sinoatrial area upon the ambient tem- perature. Each dot represents a single measurement, without averaging. The measurements were done randomly during heat- ing and subsequent cooling of the preparation to the initial tem- peratureThe solid line is an approximation of measured values by an exponential function.

250 Pakhomov et al.
1 min 0.2 mV
m-mm LPP: 10-sec pulse, 3.16 W/g
EHPP: 10-sec train, 10 pulses/sec 316kW/gpeakSAR
_n_ L
JL L
v~Arv~^~ n n TL L L E
B 1 min I 1 mV
1111111111
LPP: l-sec pulse, 15.2 W/g
EHPP: l-sec train, 50 pulses/sec, 304 kW/g peak SAR
11
J L
18.0
15.0
SOsec 10.2 mV
LPP: 2-sec pulse, 26.4 W/g
EHPP: 2-sec train, 100 pulses/sec, 264 kW/g peak SAR
■'-'[■'■■■■^r1: ■ -
l
°c
J^"»! a.ij*- IM .J"**1 J^*«-
Fig. 3. Sample recordsof the isolated heart slice responseto repetitive EHPPand LPP exposures. A, B, and C represent different preparations and different exposure regimes. All exposures were per- formedat9.2 GHz, EHPP width wasl us; otherirradiationparametersareindicatedatthetopofeach fragment. Upper trace, spontaneous beats of the preparation; second trace, inter-beat interval, s; third trace, exposure marker (E, EHPP exposure; L, LPP exposure; or S, sham exposure); bottom trace, solution temperature in °C. The experiments were performed at the initial temperature of 22 °C (A and C) or 15.5 °C (B). Moderate microwave heating (A and B) decreased the inter-beat interval, while an excessive heating (C) ceased the preparation beating activity.

Effects of EHPP Microwave Pulses 251
D sham
T LPP: 1-sec pulse 15.2 W/g (+2.5 "C max.) 16 °C
• EHPP: 1-sectrain 15.2 W/g (+2.5 °C max.) IBI = 2.8+ 3.4 sec
50 pulses/sec 304 kW/g peak SAR
o
I
§
T 0 5
Inter-beat interval number
B
D sham
▼ LPP: 0.5-sec pulse 13 W/g (+1.2 °C max.)
• EHPP: 0.5-sec train 13 W/g (+1.2 °C max.)
50 pulses/sec 260 kW/g peak SAR
22 °C
IBI = 1.6+ 1.9 sec
100-1
I" •= 98
£ 96'
J5 94-
92 ->
r4f<*H**^M^*frA%-» - o - 5 - <D ' * - o ' $ " m ' ffi - o - °
ti* ,*••
1 /
-; ^f
-10 -I—I—I—I—I—I—I—I—I—I—I—I—I—I—I—I
-5 0 5 10 Inter-beat interval number
Fig. 4. Comparative effects of EHPP and LPP exposure on the inter-beat interval in isolated frog heart slices. A, B, and C represent three different series of experiments in different preparations and at different temperatures. Indicated at the top of each fragment are the exposure parameters and maximum heating recorded under the exposure, temperature at the onset of the experiments (°C), and typical inter-beat interval duration at this temperature (IB!, s). All exposures were per- formed at 9.2 GHz, EHPP width was 1 us. Horizontal axis: sequential IBI number with respect to time of microwave exposure (arrow). Vertical axis: IBI duration, in % to the initial (100% is the duration of the -10th interval in each experiment). Each datapoint is mean ±s.e. for a group of 5-11 experi- ments. For better viewing, datapoints for EHPP and LPP experiments are slightly shifted to the left and right, respectively. Effects of LPP and EHPP exposures were in all cases different from the sham (P < .01), but not from each other (P > .2).

252 Pakhomov et al.
D sham >»
▼ LPP: 1-sec pulse 15.2 W/g (+2.5 °C max.) 28 °C
• EHPP: 1-sec train 15.2 W/g (+2.S °Cmax.) IBI = 1.2+ 1.4 sec 50 pulses/sec 304 kW/g peak SAR
100-j
■2
& 90-
I i 80-
70-
^weA-fyfeffS i-S-a^m-ü'K^K^m
-10 1 i i i i |—i—i—i—i—[—i—i—i—i—|
5 0 5 10 Inter-beat interval number
Fig. 4. {continued)
Sometimes (e.g., Fig. 3A), irradiation also changed the amplitude of beats. These changes were coincident with the temperature rise, fully reversible, and had about the same magnitude under LPP and EHPP irradiation. However, isolated frog auricle slices are not a proper model to study the beat amplitude, so changes in this index were generally disregarded.
While a temporary IBI decrease was a standard response to various exposure regimes, a qualitatively different reaction could be produced by a more intensive irradiation, which pushed the temperature above the physiologically tolerable limits (Fig. 3 C). In this case, heating to 28-30 °C temporarily arrested the beats; however, upon recovery the beats continued at a higher rate until the temperature returned to the initial. The likely reason for beat cessation at high tempera- tures was uncoupling of contractile elements from the pacemaker, rather than deceleration or stoppage of the pacemaker itself [Pakhomov et al., 2000]. Indeed, periods of arrest often included low-amplitude spikes (upper trace), which were omitted by the IBI detector (the second trace). These spikes reflect the activity of contractile elements still coupled with the pacemaker, or electrical discharges of pacemaker cells themselves. Consistently with the expected response of the pace- maker to heating, the interval between these spikes is shorter than IBI before or after exposure. As in the experiments illustrated previously, EHPP and LPP exposures produced virtually equal effect.
While the experimental records were not indica- tive of any specific EHPP effect, this observation had
to be tested by a statistical analysis. For this purpose, we plotted the IBI duration against the IBI sequential number (Fig. 4). Ten BBIs immediately preceding the exposure were assigned numbers from —10 to —1; the IBI coinciding the exposure was No. 0, and the next ten intervals were numbered from 1 to 10. A record of 21 EBIs, which included either one exposure or one sham exposure was considered as a single experiment. The baseline IBI duration (i.e., without irradiation) could vary substantially from one preparation to another, so the raw data had to be normalized before averaging. The duration of the initial (—10th) IBI in each experiment was taken as 100%.
These experiments were performed at three different baseline temperatures (16, 22, and 28 °C) and with two different combinations of EHPP and LPP regimes. The effects of EHPP, LPP, and sham exposure at each of the baseline temperatures and in every time- point of the experiment were compared by Student's paired t test. Regardless of the treatment conditions, EHPP and LPP produced a fast and highly significant (P<.01 compared with sham) IBI decrease immedi- ately after the exposure, followed by a gradual re- covery. However, for any timepoint and at any of the tested baseline temperatures, EHPP- and LPP-induced changes in the IBI duration were almost identical (P > .2). While the graphs may seem to indicate that the exposure effect was stronger and recovery took longer at 28 °C than at 16 °C, actually this was not the case. With the average IBI duration of about 1.3 s at 28 °C, recovery to 95% of the initial IBI took about 13 s

Effects of EHPP Microwave Pulses 253
(Fig. 4C). This time interval corresponds to the 4th or the 5th IBI in Figure 4A (IBI duration at 16 °C is about 3 s), when the recovery reached the same 94-96%. In general, all the experimental data were consistent with a merely thermal mechanism of EHPP and LPP action.
DISCUSSION
We are not aware of any other publication that investigated bioeffects of pulsed microwaves at SAR in excess of 100kW/g. Upon entering this "uncharted territory", we reasonably anticipated that SAR as high as 300kW/g could be damaging to biological tissues and adversely affect physiological function, by one mechanism or another. However, current experiments provided no support to this hypothesis. EHPP trains always produced the same effects as LPP of the equal duration and average power. These effects followed the dynamics of microwave heating and post-exposure cooling, they were fully reversible and well-reprodu- cible. Within limits of the study, EHPP and LPP effects were not indicative of any interaction mechanisms other than general heating. This conclusion is consis- tent with our earlier studies in frog heart slices, despite differences in exposure and beat recording techniques, radiation frequencies, powers, and pulsing regimes [Pakhomov et al., 1995, 1999a, 1999b].
At 300kW/g and 0.5 mm above the matching plate (and even higher SAR at the surface of the plate), each 1 us EHPP increases the solution and preparation temperature by about 0.07 °C. A combination of the high SAR gradient (about twofold per mm along the waveguide axis) and of the high pulsed heating rate (70,000 °C/s) will inevitably produce thermoelastic stress and pressure waves in the exposure cell. However, measurements or calculation of the EHPP- produced thermoelastic effect were beyond the scope of this study. At this point, we can only state that the thermoelastic effect produced by 1 ps, 300kW/g microwave pulses in our exposure cell had no impact on the frog heart pacemaker function. One may speculate that longer pulses, pulses delivered at certain "resonance" repetition rates, or otherwise optimized for the maximum thermoelastic effect could be more biologically effective. Evaluation of bioeffects as a function of the thermoelastic effect magnitude could be a reasonable approach to assess potential hazards from thermoelastic phenomena, and may constitute a subject for future studies. As concerning other inter- action mechanisms that could potentially contribute to microwave bioeffect at high peak powers (e.g., micro- wave poration of cell membrane), the reality of such mechanisms has yet to be demonstrated.
Most of the currently effective safety standards appreciate the possibility of specific adverse effects of high power pulsed microwaves and set certain restric- tions on peak field intensities. However, with very limited knowledge of EHPP bioeffects, it is no wonder that different standards arbitrarily establish very different limits of the maximum permissible exposure. Currently effective US standard [ANSI/IEEE C95.1- 1991, 1992] limits the peak E-field of short pulses to 100kV/m. Reference limits recommended by the International Council on Nonionizing Radiation Pro- tection [ICNIRP Guidelines, 1998] for peak E-field in 2-300 GHz frequency range are 4.4kV/m for occupa- tional exposure and 1.95 kV/m for general public. The highest microwave radiation level permitted by a recent Russian standard [SanPin 2.2.4/2.1.8.055-96, 1996] is only 5mW/cm2, or 137 V/m (brief occupa- tional exposure of hands); limits for occupational or general public whole-body exposure are set as low as 0.01-1 mW/cm2 (6-61 V/m), regardless of the pulse width or duty ratio. In our study, which employed peak incident powers of the order of lOOkW, the E-field in the waveguide could reach 950kV/m. Even at this level, which exceeded all the safety standards by one or more orders of magnitude, the experiments est- ablished no EHPP effects different from CW radiation effects, thus giving no support for special considera- tion of peak E-field safety limits for short, high power microwave pulses. More studies in various biological subjects and with a wider range of exposure regimes are needed to scientifically establish safe levels of pulsed radiations.
REFERENCES
Akyel Y, Hunt EL, Gambrill C, Vargas C Jr. 1991. Immediate post- exposure effects of high-peak power microwave pulses on operant behavior of Wistar rats. Bioelectromagnetics 12:183-195.
Akyel Y, Raslear TG, Hammer RM, Belt M. 1992. The effects of high-peak power pulsed microwaves on treadmil perfor- mance in the rat. Lake Buena Vista, FL: First World Cong- ress for Electricity and Magnetism in Biology a Medicine, June 1992, p 60 (abstract).
Albanese R, Blaschak J, Medina R, Penn J. 1994. Ultrashort elec- tromagnetic signals: biophysical questions, safety issues, and medical opportunities. Aviat Space Environ Med 65: A116-A120.
ANSI/EEEE C95.1-1991. 1992. IEEE standard for safety levels with respect to human exposure to radio frequency electro- magnetic fields, 3 kHz to 300 GHz. New York: Inst. of Electrical and Electronics Engineers, Inc., 76 p.
Chou CK, Guy AW. 1978. Effects of electromagnetic fields on isolated nerve and muscle preparations. IEEE Trans Microwave Theory Tech 26:141-147.
Creighton MO, Larsen LE, Stewart-DeHaan PJ, Jacobi JH, Sanwal M, Baskerville JC, Bässen HE, Brown DO, Trevithick JR.

254 Pakhomov et al.
1987. In vitro studies of microwave-induced cataract. II. Comparison of damage observed for continuous wave and pulsed microwaves. Exp Eye Res 45:357-373.
D'Andrea JA, Cobb BL, Knepton J, Bates F. 1989. Behavior in rhesus monkeys exposed to very high peak power 3.0-GHz microwave pulses. Tucson, AZ: Bioelectromagnetics Society, 11th Annual Meeting, June 1989, p 38-39 (abstract).
Guy AW, Chou CK, Lin JC. 1975. Microwave-induced acoustic effects in mammalian auditory systems and physical materials. Ann NY Acad Sei 247:194-218.
ICNIRP Guidelines. 1998. Guidelines for limiting exposure to time-varying electric, magnetic, and electromagnetic fields (up to 300 GHz). Health Physics 74:494-522.
Jauchem, JR, Frei, MR. 1995. High-peak power microwave pulses: effects on heart rate and blood pressure in unanesthetized rats. Aviat Space Environ Med 66(10):992-997.
Klauenberg BJ, Cobb BL, Merritt JH. 1990. Effects of exposure to TEMPO pulsed high-peak power microwave radiation. San Antonio, TX: 12th Annual Meeting of the Bioelectromag- netics Society, June 1990, p 91 (abstract).
Lin JC. 1978. Microwave auditory effects and applications. Springfield, Illinois: Charles C. Thomas.
Lin JC. 1989. Pulsed radiofrequency field effects in biological systems. In: Lin JC, editor. Electromagnetic interaction with biological systems, New York: Plenum Press, p 165-177.
Pakhomov AG, Dubovick BV, Degtyariov IG, Pronkevich AN. 1995. Microwave influence on the isolated heart function: I. Effect of modulation. Bioelectromagnetics 16(4):241-249.
Pakhomov AG, Belt M, Cox DD, Mathur SP, Akyel Y, Murphy MR. 1998. Immediate effects of extremely high power microwave pulses on the beating rhythm in isolated frog heart auricle. St. Pete Beach, FL: 20th Annual Meeting of the Bioelectromagnetis Society, June 1998, p 113-114.
Pakhomov AG, Doyle J, Mathur SP, Kiel JL, Murphy MR. 1999a. Search for specific physiological effects of extremely high power microwave pulses. Long Beach, CA: 21st Annual Meeting of the Bioelectromagnetics Society, June 1999, p 200-201.
Pakhomov AG, Mathur SP, Belt M, Murphy MR. 1999b. Dose dependencies in bioeffects of extremely high-peak power microwave pulses. In: Repacholi MH, Rubtsova NB, Muc AM, editors. Electromagnetic fields: biological effects and hygienic standardization. Proceedings of the International Meeting, May 1998, Moscow, Russia. Geneva, Switzerland: World Health Organization, p 325-334.
Pakhomov AG, Mathur SP, Akyel Y, Kiel JL, Murphy MR. 1999b. High-resolution microwave dosimetry in lossy media. In: NATO Advanced Research Workshop on Radio Frequency Radiation Dosimetry and its Relationship to the Biological Effects of Electromagnetic Fields, October 1998, Gozd Martuljek, Slovenia (in press).
Raslear TG, Akyel Y, Bates F, Belt M, Lu ST. 1993. Temporal bisection in rats: the effects of high-peak power pulsed microwave irradiation. Bioelectromagnetics 14:459-478.
SanPin 2.2.4/2.1.8.055-96. 1996. Sanitary Rules and Norms Radiofrequency electromagnetic radiations (2.2.4. Physical factors of industrial surroundings. 2.1.8. Physical factors of the environment). Goskomsanepidanadzor of Russia, 28 p.
Stewart-DeHaan PJ, Creighton MO, Larsen LE, Jacobi JH, Ross WM, Sanwal M, Guo TC, Guo WW, Trevithick JR. 1983. In vitro studies of microwave-induced cataract: separation of field and heating effects. Exp Eye Res 36:75-90.
Stewart-DeHaan PJ, Creighton MO, Larsen LE, Jacobi JH, Sanwal M, Baskerville JC, Trevithick JR. 1985. In vitro studies of microwave-induced cataract: reciprocity between exposure duration and dose rate for pulsed microwaves. Exp Eye Res 40(1):1-13.

VOLUME III
Award Number: DAMD17-94-C-4069 TITLE: Services to operate and Maintain a Microwave Research Laboratory PRINCIPAL INVESTIGATOR: Yahya Akyel, Ph.D.
Copies of Publications (15 - 20)
15. Pakhomov, A.G.; and Murphy, M.R. [2000]: A Comprehensive review of the research on biological effects of pulsed radiofrequency radiation in Russia and the former Soviet Union. In: "Advances in Electromagnetic Fields in Living Systems, Volume 3," Lin, J.C. (ed.), New York, Kluwer Academic/Plenum Publishers, pp. 260-292.
16. Pakhomov, A.; and Doyle, J. [2000]: Effect of pulsed microwaves on the population spike in rat hippocampal slices. In: "Millennium International Workshop on Biological Effects of Electromagnetic Fields Proceedings", Kostarakis, P.; and Starvroulakis, P. (ed.), pp. 480-485 (ISBN 960-86733-0-5).
17. Pakhomov, A.G.; and Murphy, M.R. [2000]: Low-intensity millimeter waves as a novel therapeutic modality. IEEE Trans. Plasma Sei. 21 (4): 34-40.
18. Seaman, R.L.; Belt, M.L.; Doyle, J.M.; and Mathur, S.P [1999]: Hyperactivity caused by a nitric oxide synthase inhibitor is countered by ultra-wideband pulses. Bioelectromagnetics. 20:431-439.
19. Seaman, R. [2000]: Effects of acute systemic 3-nitropropionic acid administration on rat activity and acoustic startle. Neuroscience Letters 280:183-186.
20. Vijayalaxmi; Seaman, R.L; Belt, M.L.; Doyle, J.M.; Mathur, S.P.; and Prihode, T.J. [1999]: Frequency of micronuclei in the blood and bone marrow cells of mice exposed to ultra- wideband electromagnetic Radiation. Int. J. Radiat. Biol. 75(1): 115-120.
Copies of Technical Reports (1-2)
1. Lu, S.-T.; Mathur, S.P.; Stuck, B.; Zwick, H.; D'Andrea, J.A; Ziriax, J.M.; Merritt, J.H.; Lutty, G.; McLeod, D. S.; and Johnson, M. [1999]: Retinal Effects of High Peak Power Microwaves in Rhesus Monkeys. Brooks Air Force Base, U.S. Army Medical Research Detachment, Naval Health Research Center Detachment, U.S. Air Force Research Laboratory, Technical Report, USAMRD WRAIR 9907 006 TX, NHRC-DET 99-01, AFRL- HE-BR-TR-1999-0231.
2. Samn S.; and Mathur, S. [1999]: A mathematical model of gigahertz transverse electromagnetic cell, I. Brooks Air Force Base, U.S.A.F. Research Laboratory, Technical Report AFRL-HE-BR-TR-1999-0219.

A COMPREHENSIVE REVIEW OF THE RESEARCH ON BIOLOGICAL EFFECTS OF PULSED RADIOFREQÜENCY RADIATION IN RUSSIA AND THE FORMER SOVIET UNION
Andrei G. Pakhoraov1,2 and Michael R. Murphy2
'McKessonHBOC BioServices, U.S. Army Medical Research Detachment of the Walter Reed Army Institute of Research 2Directed Energy Bioeffects Division, Human Effectiveness Directorate, Air Force Research Laboratory Brooks Air Force Base, San Antonio, Texas, USA
INTRODUCTION
Pulsed radiofrequency (RF) radiation nowadays is among the most ubiquitous of environmental factors. Biological effects and health hazards of pulsed RF have been studied for decades, but there is still little consensus on whether the safety of pulsed RF should be given any special consideration compared to continuous wave (CW) emissions. While it is well known that pulsed fields can produce effects principally different from those of CW (e.g., an auditory effect, see Lin, 1990), potential implications of such effects for human safety and wellbeing continue to be debated.
A significant contribution to the field of bioelectromagnetics has been made by the research performed in the former Soviet Union (FSU). Unfortunately, most of this research was published in Russian; these publications are scarcely available in the West and have not ever been reviewed in English. Even some key findings, which may affect the conceptual understanding of interaction mechanisms and approaches to RF safety, seem to be not known in the West, and their replication in Western laboratories has never been attempted.
The goal of the present paper is to fill in this void and deliver a comprehensive review of the FSU research on biological effects and potential health hazards of pulsed RF radiations.
SOURCES OF INFORMATION
The principal source of information is a personal collection of scientific publications in Russian, which was accumulated as a part of a 7-year effort ofone of the authors (A.G.P.) to
Advances in Electromagnetic Fields in Living Systems, Vol. 3 Edited by J.C. Lin, Kluwer Academic/Plenum Publishers. 2000 265

monitor and review the Russian/FSU research in the area of electromagnetic biology. Currently, this collection includes over 1200 titles and is one of the largest of its kind.
Over 1000 of the collected studies were abstracted in English, and the abstracts are included in the electronic EMF Database (produced and distributed by Information Ventures, Inc., PA, USA). This Database (v. 3.2.4, 1999), which is the second major source of information for the current review, contains about 26000 unique citations of studies on bioeffects of electromagnetic fields (from DC to mm-waves). Out of them, there are about 3600 citations of studies performed in the FSU (and published in either Russian or English); we estimate that this bibliography includes at least 80% of related studies performed in the FSU and published in the open (unclassified) literature since 1975 (earlier papers are only scarcely included in the Database). The EMF Database proved to be extremely convenient as a fast reference and information search engine, while the scientific quality of studies usually had to be judged from the original publications.
STATISTICS AND GENERAL NOTES
For the purpose of this review, the term "pulsed RF" applies to any pulsed, intermittent, or amplitude-modulated electromagnetic emissions with carrier frequencies from units of megahertz up to 300 GHz. A detailed search of the EMF Database revealed a total of 206 citations of pulsed RF" studies performed in the FSU. For convenience, they will be referred to below as "Russian" studies, disregarding the exact place of origin (e.g., Russia or Ukraine) or the language of publication. A similar search for "non-Russian" publications on the subject revealed 1342 citations. The percentage of pulsed RF publications out of the total number in the Russian and non-Russian bibliographies was remarkably the same (6%).
These 206 citations were individually sorted to remove all meeting abstracts, review papers, and papers on dosimetry, modeling, standards setting and enforcement; then we added appropriate Russian papers not cited in the Database. The final outcome was 114 original experimental Russian studies on pulsed RF bioeffects.
Of these studies, over 70% were performed in laboratory animals. Only a few studies (<4%) employed pro- or eukaryotic cell cultures, whereas a lot of research was done in various isolated organ preparations (about 20%). A relatively large number of studies (>35%) explored effects of chronic irradiation.
It is generally accepted in Russian science that the nervous system is the most sensitive to electromagnetic radiation. Indeed, studies of pulsed RF effects on nervous system function and structure are by far the most numerous (>65%); electrophysiological and behavioral techniques are the most widely used. In a striking contrast with the Western research, not a single study has explored possible carcinogenic effects of pulsed RF; apparently, this possibility has never been a concern in Russian science.
Presumably nonthermal (or "RF-specific") bioeffects were found in 88 studies, which is more than 90% of all studies that searched for such effects. Among them, 34 studies compared bioeffects of various modulation regimens and/or those of CW versus pulsed RF. In most cases (>80%), it was found that pulsed RF effects indeed depend on modulation and/or are different from effects of CW irradiation at the equivalent time-average intensity. These data indicated that pulsing may be an important (or even the most important) factor that determines the biological effects of low-intensity RF emissions.
The most common question about Russian research in the bioelectromagnetic area is its scientific quality. Indeed, noticed flaws include unclear or invalid experiment protocols (e.g.,
266

lack of a sham-exposed control group); absence of good thermometry and dosimetry (in most animal studies, the specific absorption rate (SAR) was neither measured nor calculated); inadequate statistical analysis; failure to take into account specifics of biological experimentation with RF radiation (e.g., the use of metal recording electrodes in electrophysiological studies with RF could cause serious artifacts); and failure to report if all potential sources of the artifact were considered (e.g., the noise from a working RF transmitter can cause behavioral responses that may be misinterpreted as an RF bioeffect). While many studies were flawed in one way or another, or were poorly presented in publications, still many other Russian studies demonstrated a high-quality research.
For any study on RF bioeffects, whether flawless or not, the most critical issue is independent replication of findings. Until (or unless) proven wrong in replicative studies, the results of any reasonable-quality research deserve attention and careful consideration. That is why we attempted to address in this review all available Russian studies on pulsed RF bioeffects that meet at least the minimum scientific quality criteria. The other studies, which failed to meet these criteria (as far as it could be judged from the published material), were generally regarded as unacceptable. For example, all of the available Russian epidemiological studies with pulsed RF reported adverse health effects of exposure (such as "asthenic syndrome" or "radiofrequency disease"), but none of them showed reasonable evidence that these disorders were in fact caused by the RF exposure; besides, these studies reported too little or even no data about the exposure parameters. Because of the poor quality, none of the Russian epidemiological studies are included in the present review.
Among the "acceptable" studies, more credit was given to those that (1) reported interesting and potentially important findings, (2) presented data that were consistently reproduced over the years and were reported in more than a single publication, and (3) focused on research topics that were independently explored in different laboratories. The reviewed papers are arranged under the following categories: "In Vitro and In Situ Studies", "Animal Studies: Acute Exposure", "Animal Studies: Chronic Exposure", and "Bioeffects of Extremely High Power Pulses".
IN VITRO AND IN SITU STUDIES
Kim and co-authors (1986) used fluorescent probes to reveal possible effect of pulsed microwaves (800 MHz, 2 W/cm2, 50-us pulses at 25-100 Hz) on the state of the cell membrane in erythrocyte ghosts. The temperature of exposed samples was kept stable at 18- 19 °C during 20-25 min of exposure. The experiments established that fluorescence of probes that bind to the lipid-water boundary of the membrane (2-toluidinonaphthalene-6-sulfonate, or 2,6-TNS, and l-anilinonaphthalene-8-sulfonate, or 1,8-ANS) depended on the modulation frequency. Fluorescence of 2,6-TNS was not different from control at 25-35 Hz, but exceeded it by 12-16% at 55-65 Hz, and by 6-9% at 80-100 Hz. With 1,8-ANS, the increase in fluorescence intensity at 55 Hz was 16.9 ± 5.1%. (Hereinafter, shown average values represent the mean ± standard error, unless stated otherwise.) Fluorescence increased to the maximum after 10-20 min of exposure and then remained stable; the increase was more pronounced at higher concentrations of NaCl in the medium (up to 300 mmol). In contrast, the fluorescence parameters of piren, a hydrophobic probe, were not affected by irradiation. The authors supposed that the changes registered with fluorescent probes were induced by mechanical oscillations generated by microwave pulses.
267

Pashovskina and Akoev (1996) studied the effect of pulsed 2375 MHz radiation on the ATPase activity of rat actomyosin in vitro. Exposures for 1 min at either 40 or 200 mW/cm2
(50- to 310-Hz modulation) heated the samples by less than 0.3 °C. ATPase activity was measured from accumulation of the inorganic phosphate (IP). Two parallel control samples, prepared together with the exposed one and from the same tissue homogenates, were used to establish the background IP contents at the time before and after the exposure. With 40 mW/cm2 radiation, 130- and 300-Hz modulation suppressed the ATPase activity to 50 ± 3% and 9.4 ± 2.7% of the control level, respectively (p<.05). In contrast, 270-Hz modulation increased the ATPase activity almost 3-fold (p<05). Most of other tested frequencies produced weak or moderate (< 50%) activity changes. The dependence of the effects upon the modulation frequency did not show any pattern or shape. Increasing the field intensity to 200 mW/cm2 entirely changed the effectiveness of the same modulation frequencies. Exposure at 130 and 300 Hz then caused ATPase activation (by 170.3 ± 3.3% and 61 ± 3.9%, respectively). The activation reached a maximum at 110-130 Hz modulation and decreased at higher and lower frequencies, forming a bell-shaped dependence. The authors concluded that ATPase activity of actomyosin showed a complex dependence upon both the field intensity and modulation, but were unable to explain this result.
Semin et al. (1995) studied the effect of weak RF on the stability of DNA secondary structure in vitro. DNA was exposed in the presence of glycine and formaldehyde. Aminomethynol compounds, which form in this medium, react with DNA bases at single- Strand sites, which prevents recovery from damage to the DNA secondary structure. The damage accumulates during the incubation, and its amount can be estimated from the dynamics of thermal DNA denaturalization after RF or sham exposure. Samples were exposed for 30 min in an anechoic chamber at 18 °C by 10 different microwave frequencies simultaneously (4-to 8-GHz range, 25-ms pulses, 1- to 6-Hz repetition rate, 0.4 to 0.7 mW/cm1 peak power, no heating). Parallel control samples were sham exposed in a shielded area in the same chamber. The experiments established that irradiation at 3 or 4 Hz and 0.6 mW/cm2 peak power clearly increased the accumulated damage to the DNA secondary structure (P<0.00001). However, changing the pulse repetition rate to 1, 5, or 6 Hz, as well as changing the peak power to 0.4 or 0.7 mW/cm1, eliminated the effect entirely. Thus, the effect occurred only within narrow "windows" of the peak intensities and modulation frequencies.
One more example of a "double window" wax described hy Gapeev et al. (1994). In this case, the effect required a certain combination of the carrier and modulation frequencies, but did not show a window dependence on the field intensity. The authors explored if the spontaneous locomotor activity of a unicellular organism Paramecium caudatum could be affected by irradiation with CW and modulated millimeter waves. Paramecia were placed in a thin layer of saline in a small round cuvette (7-mm diameter). Hyperpolarization of cells by a 5-fold reduction of potassium content in the saline (to 0.2 mM) made them constantly circle around in the cuvette for hours. A "motility index" (MI) was evaluated automatically by an optic probe as the amount of light reflected from cells appearing in the field of vision of a microscope during any 2-min interval. The MI increased with increasing average locomotion velocity, and decreased when cells made more turns or when the number of active cells decreased. Radiation was applied for 12 min after a 10-min stabilization period. Control samples were monitored for the same time interval, but without irradiation.
268
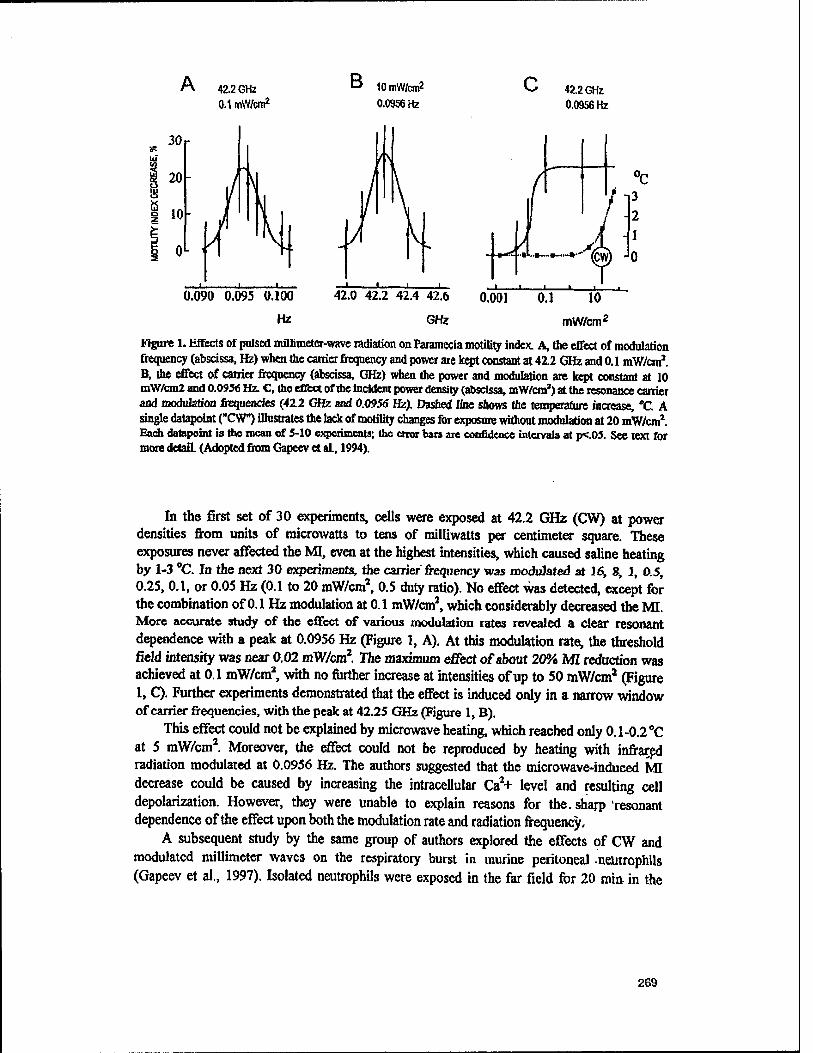
A 42.2 GHz 0.1 mW/cm2
B lOmW/cm2
0.0956 Hz 42.26Hz 0.0956 Hz
0.090 0.095 0.100
Hz
42.0 42.2 42.4 42.6
GHz
0.001 0.1 10
mW/cm2
Figure 1. Effects of pulsed millimeter-wave radiation on Faramecia motility index. A, the effect of modulation frequency (abscissa, Hz) when the carrier frequency and power are kept constant at 42.2 GHz and 0.1 mW/cm2. B, the effect of carrier frequency (abscissa, GHz) when the power and modulation are kept constant at 10 mW/cm2 and 0.095« Hz. C, the cfifect of the Incident power density (abscissa, mW/cm2) at the resonance carrier and modulation frequencies (422 GHz and 0.0956 Hz). Dashed line shows the temperature increase, "C. A single datapoint ("CW") illustrates the lack of motility changes for exposure without modulation at 20 mW/cm2. Each datapoint is the mean of 5-10 experiments; the ewor ban are confidence intervals at p<.05. See text for more detail (Adopted from Gapeev et al, 1994).
In the first set of 30 experiments, cells were exposed at 42.2 GHz (CW) at power densities from units of microwatts to tens of milliwatts per centimeter square. These exposures never affected the MI, even at the highest intensities, which caused saline heating by 1-3 °C. In the next 30 experiments, the carrier frequency was modulated at 16, 8, J, 0.5, 0.25, 0.1, or 0.05 Hz (0.1 to 20 mW/cm2, 0.5 duty ratio). No effect was detected, except for the combination of 0.1 Hz modulation at 0.1 mW/cm2, which considerably decreased the MI. More accurate study of the effect of various modulation rates revealed a clear resonant dependence with a peak at 0.0956 Hz (Figure 1, A). At this modulation rate, the threshold field intensity was near 0.02 mW/cm2. The maximum effect of about 20% MI redaction was achieved at 0.1 mW/cm3, with no further increase at intensities of up to 50 mW/cmJ (Figure 1, C). Further experiments demonstrated that the effect is induced only in a narrow window of carrier frequencies, with the peak at 42.25 GHz (Figure 1, B).
This effect could not be explained by microwave heating, which reached only 0.1-0.2 °C at 5 mW/cm2, Moreover, the effect could not be reproduced by heating with infrared radiation modulated at 0.0956 Hz. The authors suggested that the microwave-induced MI decrease could be caused by increasing the intracellular Ca2+ level and resulting cell depolarization. However, they were unable to explain reasons for the. sharp resonant dependence of the effect upon both the modulation rate and radiation frequency,
A subsequent study by the same group of authors explored the effects of CW and modulated millimeter waves on the respiratory burst in murine peritonea) -neUtrophils (Gapeev et al., 1997). Isolated neutrophils were exposed in the far field for 20 min in the
269

presence of a high concentration (7.5-10 nM) of calcium ionophore A23187. After the exposure, a respiratory burst was activated by adding phorhoUl2-wyristate-13-acetate (1 uM), and the production of reactive oxygen species (ROS) by neutrophils was measured from Iuminol-dependent chemoluminescence. Experiments with CW irradiation at 50 HW/cm7 at various fixed frequencies in the range 41.75-42.15 GHz revealed a 25% inhibition of ROS production at a "resonance" frequency of 41.95 GHz; the half width of the resonance was about 100 MHz. At 41.95 GHz, a 50% effect (half-maximum) was produced by intensities under 1 |iW/cm2. The effect reached maximum (about 24% inhibition) at 20 nW/cm2 and remained at this plateau level at higher intensities. Modulation of 41.95-GHz radiation at 1 Hz enhanced ROS production by about 10%, modulation rates of 0.1, 16, and 50 Hz inhibited ROS production by 16-20%, and the rates of 0.5, 2, 4 and 8 Hz had no effect. In the next experiments, the modulation rate was kept constant at 1 Hz and the radiation frequency was varied. This irradiation activated ROS production in the carrier frequency band of 41.95-42,05 GHz, and suppressed it in the band of 41.8-41.9 GHz. The authors concluded that the microwave effect on ROS production is nonthermal in nature, and is determined by specific combinations of the carrier frequency and modulation rate.
Tygranyan (1986) reported severe disturbances in isolated frog nerve and heart function if intense enough microwave pulses coincided with the "active" state of the excitable membrane (e.g., were applied during propagation of the compound action potential, CAP). In isolated frog sciatic nerve, these effects included decrease of the CAP amplitude (by 90-95%) and velocity (by 35-40%) after some 30 min of exposure. The same RF pulses delivered before, after, or asynchronously with CAP propagation produced only a subtle thermal effect. The author supposed that microwave pulse energy is converted into a mechanical pulse, which travels in a spiral between Schwann cell membranes of the nerve sheath. Due to a phase synchronism effect, the traveling pulse triggers another mechanical pulse perpendicular to the nerve surface, and the latter may be strong enough to damage the "active" nerve membrane. The author's calculations based on dielectric and mechanical properties of nerve seemed to support this hypothesis.
The findings of Tygranyan motivated Pakhomov et al. (1991) to search for similar effects in giant nerve fibers of the isolated ventral nerve cord of the earthworm Lumbricus terrestris. A length of about 2.5 mm of the cord was exposed in a small drop of Ringer's solution to 6.45-GHz CW or pulsed radiation, or was sham exposed. Exposure duration was from 10 to 50 min at the peak SAR from 30 to 230 mW/g. Action potentials, which were evoked by repetitive electrical stimulation and propagated along the nerve, were recorded by two pairs of electrodes, positioned immediately before and after the exposure zone. Therefore, comparison of these records provided an accurate measure indicating whether the nerve conduction in the exposure zone was affected. Microwave pulses were synchronized with the action potential crossing the exposure zone, or were delivered independently from the nerve stimulation (0.2- to 32-ms pulse width, 6- to 2000-Hz repetition rate). This study failed to produce any specific microwave effect, regardless of RF pulse parameters or then- phasing with the nerve firing. However, giant nerve fibers of the earthworm ventral cord do not have a myelin sheath that was theoretically supposed to be essential for Tygranyan's effect described above. The design of the exposure cell and the carrier frequency were also different (6.45 GHz versus 800-915 MHz).
For the next study (Pakhomov et al., 1993), a microwave transmitter and irradiator were borrowed from Tygranyan's laboratory, to replicate his exposure conditions with maximum care. The experiments were performed in isolated frog sciatic nerve, which was continually
270

stimulated at a rate of 50 twin pulses/sec for 90 min. This high-rate stimulation caused gradual decline of the nerve function, i.e., increased the CAP latency and decreased its amplitude and tracing integral. Exposures or sham exposures began 1 min after the onset of the high-rate stimulation and continued till the end of the experiment. Microwave pulses (915 MHz, 5 to 70 W/g peak SAR, 0.5- or 3-ms width) were phased with CAP in various ways, or were delivered asynchronously at a rate of 50 Hz. At the highest SAR, microwave heating could reach 2.7 °C. Regardless of phasing, SAR, or pulse width, none of the exposure regimens caused severe CAP suppression, therefore the results of Tygranyan (1986) failed to be independently confirmed.
At the same time, these experiments revealed a different microwave effect: The exposed nerves displayed a faster decrease of the CAP amplitude and tracing integral during the course of the high-rate stimulation. This effect was regarded as nonthermal or microwave- specific, since conventional heating of the superfusing solution by 3 °C during sham irradiation caused the opposite changes. Within studied limits, the magnitude of the effect showed no significant correlation with exposure parameters. In general, this microwave- induced facilitation of the nerve vitality loss was similar to the effect reported earlier by McRee and Wachtel (1980,1982), but substantially weaker.
Two subsequent studies explored the dependence of this effect upon modulation (Pakhomov et al., 1992; Pakhomov, 1993). The course of the high-rate stimulation and exposure was reduced to 20 min. Microwave pulses of 1- to 1000-jis duration (915 MHz, 43- 48 or 20-33 Wg peak SAR) were delivered at duty cycles from 1/20 to 1/4000, and were not synchronized with nerve firing. These studies identified effective and ineffective pulsing regimens. For instance, at 1/40 duty cycle and 43-48 W/g, 1- and 100-ns pulses caused a statistically significant effect, while 10- or 1000-p.s pulses did not, despite the fact that the gross microwave heating by all these exposures was essentially the same.
Presumably a nonthermal effect of pulsed RF was observed in in situ frog heart by Grechko (1994). This wide-scale study used 1680 male frogs to compare the effects of five different types of electromagnetic fields on cardiotoxic effectiveness of a drug strophantine K. Injection of this drug caused a characteristic heart arrest in systole in about 60 min. Irradiation by 3085 MHz, 1-u.s pulses at 400 Hz, 0.3-0.5 mW/cm2 for 30 mitt significantly increased the latency of the heart arrest (by 17-44%). In some cases, the heart was even able to restore the activity, which never happened under sham exposure conditions. In contrast, the same irradiation for 10 min at 2-3 mW/cm2 decreased the heart arrest latency by 10-25%. Pakhomov et al. (1995b) attempted to replicate findings of Tinney and co-authors (1976) that microwaves can cause beating rate changes in isolated heart by stimulation of ncurotransmittcr release from autonomous nervous system introcardiac fiber terminals. CW exposure at 2-10 mW/g (960 MHz) was reported to cause bradycardia in isolated turtle hearts. This effect could be blocked by a parasympathetic blocker atropine, or enhanced by a sympathetic blocker propranolol. The replication experiments were performed in isolated frog heart slices, using 915 MHz radiation; exposures continued for up to 40 min at SAR levels from 0.1 to 52 mW/g (10- to 100-u.s pulses at 16- to 2000-Hz repetition rates). Neither irradiation alone nor in combination with atropine or propranolol caused bradycardia in the frog heart slices. The only effect detected was a reversible beating rate increase when microwave heating exceeded 0.1 "C (when SAR exceeded 10mW/g). One needs to note, however, that the studied drugs alone (i.e., without irradiation) caused marked beating rate changes in isolated turtle hearts (Tinney et al., 1976), but not in the frog heart slices, even at much higher concentrations. This finding may reflect a principal difference in physiological
271

organization of these two heart preparations, which could be a reason for their different sensitivity to microwave radiation.
It was also reported that a caffeine antagonist, tetracaine, eliminated a nonthermal microwave effect in isolated snail neurons (Arber and Lin, 1984). Therefore, Pakhomov et al. (1995b) inferred that caffeine itself could enhance the microwave effect and tested this hypothesis in isolated frog heart slices. In contrast to atropine and propranolol, superfusion of slices with 1 mM of caffeine strongly increased the average heart power, which was calculated as a product of the beating rate and beats' amplitude. Exposure at 8-10 mW/g average SAR (1.5-ms pulses, 2.5-ms interpulse interval, 8 pulses/burst, 16 bursts/s, 915.MHz for 33 min) augmented the caffeine effect by about 15% (p<.02). Microwave heating was under 0.1 °C and could not account for this exposure effect. Moreover, the same exposure without caffeine superfusion caused no beating rate or amplitude changes.
Afrikanova and Grigoriev (1996) reported that pulsed, but not CW exposure increased the probability of heart rate changes and heart arrest in isolated and in situ frog heart. The effect was observed at intensities from 16 to 340 nW/cm2 at 9.3 GHz and modulation frequencies under 100 Hz (30% modulation depth, 50% duty cycle). The maximum effect was produced by a 5-min exposure with modulation frequency changing by 1-Hz steps from 6 to 10 Hz (1 min at each step). A longer exposure -with this modulation (10 or 19 min), as well as 5-min exposure using various other modulation patterns, produced weaker or different effects.
Pulsed RF effects on individual neurons in isolated brain slices were explored in studies of Zakharova and co-authors (1993,1995,1996). Spontaneous firing of cortical neurons was recorded by an extracellular microelectrode before, during, and after a brief (4-5 min) 900- MHz exposure at 1.4 mW/g. The reactions observed with 7-, 16-, 30-, and 60-Hz modulation (1/5 duty ratio) were a decrease of the firing rate and desynchronization of firing of individual neurons. The probability of the firing rate inhibition and its magnitude were the highest with 7- and I6-Hz modulation and the lowest with the 60-Hz modulation. For instance, 16-Hz pulses inhibited the activity in 15 out of 17 tested neurons; the firing rate could fall by 24% on the 1st minute of irradiation, and by as much as 65% on the 4th min. The rate did not recover but sometimes even decreased further after exposure. A far more intense conventional heating (by 0.33 "CVmin, as opposed to 0.02 °C/min under exposure) also inhibited the activity, but just in 7 out of 13 neurons, and the firing rate did recover when the heating was over. The greater effectiveness of microwave treatment, its dependence on modulation, as well as lack of the recovery after exposure, suggested a specific microwave effect mechanism.
Philippova et al. (1988) reported an interesting effect of 900-MHz exposure on 3H- camphor binding in isolated membrane fraction of rat olfactory epithelium. Under constant- temperature conditions, irradiation markedly decreased specific 3H-camphor binding (down to 60-40% of the control), but did not affect its nonspecific binding. The effect depended on SAR and duration of exposure, but not on modulation in the studied range from 1 to 100 Hz. At 1 mW/g, the effect gradually increased and reached saturation after some 10-20 mtn of exposure. For a 15-min exposure at various SARs, the effect gradually increased with SAR and reached saturation at about 4 mW/g. The authors supposed that the observed decrease of ligand binding resulted from microwave-induced release of specific camphor-binding protein from cell membranes into solution.
The microwave effect on olfactory epithelium and neighboring respiratory epithelium was further investigated in a histological study by-Popov et al. (1996). Tissue samples were
272

obtained from Wistar rats; one sample from each animal served as a control, and the other one was exposed for 15 min at 15 W/kgto 0.9 GHz microwaves (16 Hz pulsed modulation, 50% duty ratio). Subsequent electron microscopy revealed increased vacuolization of olfactory neurons in exposed samples, which indicated dying of these cells. The most severe degenerative changes (swelling, appearance of vesicles and multilamellar structures) developed in non-myelinated axons of olfactory neurons, Concurrently, support cells displayed pronounced cytoplasmic vacuolization in apical parts of the cell body, which indicated that microwaves enhanced mucus secretion. In the respiratory epithelium, the most remarkable effect was fusion of cilia into so-called "giant cilia," which contained numerous basal bodies. These bodies formed axonemes with a typical arrangement of microtubules. Giant cilia included 5-10 or more axonemes with basal bodies and numerous vesicles (remains of fused membranes). As a rule, the cytoplasm of respiratory cells was strongly vacuolated. Overall, the authors regarded these and other observed changes as a "direct and pronounced degenerative effect of microwaves on neurons and other epithelial cells."
To complete this section on in vitro bioefFects, we will mention the Studies that attempted to demonstrate specific bioefFects of pulsed RF, but could find either no effects, or only the effects caused by heating. Alexeev et al. (1987) could not find any but thermal effects on Ca3+ transmembrane current in mollusk neurons (900 MHz, <10 min at 0.2-20 mW/g, 0.5- to 1,000-Hz modulation). Khitrov and Kakushldna (1990) observed solely thermal effects of CW or pulsed exposure on K+ transport and oxygen consumption in isolated rat liver tissue (2450 MHz, 0.1-5 W/g, 13-, 17-, 21-, or 25-Hz pulses at 1/1000 duty ratio). Khramov et al. (1991) could detect only thermal effects of microwaves on the electric activity of a crayfish stretch receptor (37- to 78-GHz, 10 to 250 mW/cm2, from 20 sec to several hours, 0.01-1000 Hz modulation). In a study by Bolshakov and Alexeev (1992), pulsed but not CW radiation produced bursting responses of snail neurons (900 MHz, 0.5 to 15 mW/g, 0.5 to 110 Hz); however, the authors regarded this effect as possibly being an artifact from mechanical vibrations of the exposure chamber. In experiments with isolated frog heart slices. Pakhomov et al. (1995a) tested over 400 modulation regimens and concluded that changes in the beating rate and amplitude are entirely determined by the time- average SAR and microwave heating (885 or 915 MHz, 1-us to 10-ms pulses, 1/7 to 1/100,000 duty cycle, 100 to 3000 mW/g peak SAR for 2 min).
ANIMAL STUDIES: ACUTE EXPOSURE
The possible impact of low-intensity pulsed microwaves on natural ecosystems was studied in a laboratory model using a tick Hyalomma asiaticum (Korotkov et al., 1996). Exposure regimens tested in this study differed in the microwave frequency, peak power, and modulation (see Table 1). Ticks were kept at a room temperature of 21-23 °C in humidified chambers. Exposures were performed at different stages of tick development (eggs, larvae, nymphs, imago); the number of specimens in each exposed group varied from 20 (experiments with larvae) to as many as 3000 (experiments with eggs). Irradiation of eggs 5- 6 days after they were laid did not affect the percent of appearing larvae (95-100% in any group). At the same time,-exposures significantly delayed larvae hatching. In the control group (SI), 50% of larvae appeared in 11.9±1.0 days, while in the exposed groups this interval increased to 15.3±0.1 days (R2), 25.3+0.] days (R3), and 32.2i0.7 days (R4); R5 and R6 were not tested in these experiments. Activation of the larvae of SI- and R2-exposed
273

groups occun-ed on the day of hatching, while R3 and R4 exposures delayed it by 17.0±0.4 days and 23.9±0.5 days, respectively. Exposures R4 and R5 decreased the life span of unfed larvae and nymphs by 20-30%, but this effect was not statistically significant.
Effects of R3-R6 exposure regimens were studied in replete larvae in winter and fall tick generations. The larvae were exposed on the 10th day after feeding. The fust nymphs appeared in 16-18 days after the feeding in all the groups, but their survival, molting, and life span were adversely affected by exposures. On the whole, irradiation by pulse bursts at 3 GHz (R3 and R4) was the most effective, and the effects were more profound at the higher peak power (R4). On the contrary, the wide-band exposures (R2 and R5) were the least effective, even at 750 fiVY/cm2 peak SAR. Active and fed ticks were less sensitive to microwaves than hungry specimens or those in the diapause period. The authors concluded that low intensity pulsed microwaves were a negative environmental factor for the tick B. asiaticum.
Table. 1. Microwave exposure regimens* employed in the study by Korotkov et al., 1996
Regimen Frequency, GHz
Peak power, uW/cm2
Modulation
Pulse width, Pulserepetition Burst duration, Burst repetition ms rate, Hz ms rate, Hz
SI Sham - - - - R2 1-4 150 20 7 - R3 3 75 ♦* 1000 20 7 R4 3 150 . ♦* 1000 20 7 R5 1-4 750 20 2 - Rfi 1 750 20 2 -
* Exposure duration in all cases was 15 min (Grigoriev, 1999). ** Pulse width for regimens R3 and R4 is not specified in the paper.
All other in vivo studies of acute bioeffects of pulsed RF were performed in warm- blooded laboratory animals. The vast majority of these studies focused on changes in the nervous system and behavior; the other ones dealt with general physiological changes (e.g., hormone production, blood composition, heart rate), and just one study explored possible genetic damage from RF irradiation (Belokhvostov et al., 1995).
In this work, male albino rats (150-200 g) were exposed in an anechoic chamber to 1- M.sec, 400-Hz microwave pulses (3.085 GHz) at 5, 10, 20, or 46 mW/cm2. The exposure lasted for 24 min or 2 hours, and the authors claimed that it caused no rise in the rectal temperature. The animals were decapitated 5 hours after the exposure, and blood taken from 6-7 rats was pooled together and considered as one sample. Blood cells were removed, and the samples were analyzed by DNA electrophoresis in polyacrylamide gel and by polymerase chain reaction (PCR). Low-molecular-weight DNA fraction (175-185 nucleotide pairs) was revealed in blood plasma in 38% of the samples from sham-exposed animals (6 samples out of 16). In exposed groups, regardless of exposure duration and intensity, this fraction was found in 80 to 100% of samples (e.g., 7 out of 8 samples after 24 min at 5 mW/cm2, see also Figure 2, A). The DNA fraction was analyzed further by PCR to reveal complete and incomplete copies of so-called LINE elements (which are a known marker of genetic
274

transposition in various pathologic conditions). Complete copies of the LINE element were not found in any control samples, but were present in 1 out of 7, 5 out of 7, and 1 out 7 samples after a 2-hour exposure at 5,10, and 20 mW/cm1, respectively (i.e., 10 mW/cm2 was the most effective). The amount of DNA was, on the average, 2.24 times higher after 10 mW/cma exposure than after 20 mW/cra2 (n=3). Since the transposition of füll copies of the LINE element is known to cause DNA rearrangements within the genome, their release into blood plasma may indicate a possible adverse effect of microwaves on genome stability.
In contrast to complete LINE elements, partial copies of the LINE sequence (with 3'-etid fragment and the middle portion of the sequence) were present in all samples taken from the exposed animals For some sequence clones, the amount of DNA was proportional to the intensity of irradiation. For example, for the clone 43 (the sequence is given in the original article), the amount of DNA increased as 1.0/1.85/1.92/2.98 in the series sham/5/10/20 mW/cm2 (Fig. 2, B). The increased presence of the partial LINE copies does not indicate any pathological processes, but may be a useful index for biological dosimetry of microwave exposure.
B
i M 3 3
Figure 2. A, Presence of a low-weight (175-185 nucleoade pairs) DNA fraction in blood plasma of rats after pulsed RF exposure. 1: sham exposure, 2:20 mW/cm2 for 2 hours, M: molecular weight marker. Values to the right show the number of nucleotide pairs in marker DNA B, Revealing of the 3'-end fragment of the LINE DNA element (clone 43) by 25 cycles of PCR amplification. 1: sham exposure, 2: 5 mW/cm', 3: 10 mW/cm2, and 4:20 mWVcm2. See text for more detail. (Adopted fromBeloikhvostov et al, 1995).
Microwave exposure of the head of rabbits for 1 min at 0 2 mW/cm1 (6 GHz, 50-Hz pulses at 1/2 duty cycle) changed the spontaneous firing rate of individual neurons in the sensomotor cortex (Lukianova et al., 1995). The firing rate was recorded extracellularly with glass microelectrodes (5- to 20- Mohm resistance). The microelectrode holder and
275

micromanipulator were affixed to the animal's skull. These devices were custom made of plastic, to prevent any artifacts arising from metal objects introduced into the microwave
field. For the same reason, plastic tubes filled with saline were used instead of metal wires to connect the microelectrode holder with an amplifier. The activity of 53 neurons was analyzed in 67 3-min experiments; each experiment was a continual activity recording for 1 min before, 1 min during, and 1 min after irradiation. The data were compared to those recorded from 54 neurons in control experiments with sham irradiation. During the exposure or sham exposure, the firing rate of an individual neuron could either increase or decrease, or showed no statistically significant changes. In the control experiments, the firing rate decreased in 8.2% of neurons and increased in 13.07%. In the experiments whh irradiation, these numbers changed to 49.5% and 6.4%, respectively (p<.05). Thus, the most characteristic effect of exposure was suppression of the neuron firing. This suppression developed with an average latency of 12 sec after the onset of exposure. Other parameters studied, such as spike amplitude or firing pattern, were not affected by microwaves.
Table 2. Changes in "spontaneous" firing rate of neurons in rabbit cerebral cortex caused by a l-min sham or microwave exposure. (Adopted from Moiseeva, 1996, and Lukianova and Moiseeva, 1998)
Area of the cortex
Exposure regimen
Number of neurons
Type of response, % of the total number of neurons
Significant changes in the firing rate Lack of changes Rate increase Rate decrease
Sense-motor Sham
Pulses' Bursts2
72
105 63
2.7 U.l 86.2 27.6* 32.4* 40.0* 24.2+ 31.0* 44.8*
Occipito- parietal
Sham
Pulses' Bursts2
73 84 63
5.5 11.0 83.5
25.0* 29.8* 45.2* 23.2* 30.5* 46.3*
1 1.5 GHz, 0.3 mW/cm2 peak power, 0.4-ms pulses, 1000 pulses/sec. 2 1.5 GHz, 0.3 m W/cm2 peak power, 0.4-ms pulses, 1000 pulses/sec within 16-ms bursts, 0.12 bursts/sec * The percentage of neurons is significantly different from sham control (p<.01, xz test)
Similar experimental techniques and protocol were employed by Moiseeva (1996) and by Lukianova and Moiseeva (1998) to study the effect of 1.5 GHz microwaves. These two papers described effects of two different pulsing regimens in an experiment with 22 rabbits. For both the regimens, the pulse width was 0.4 ms and the peak power was 0.3 raW/cm2. These pulses were either continually delivered at a 1000-Hz repetition rate, or were arranged in 16-ms bursts (0.12 bursts/sec, 1000 pulses/sec within bursts). The data were collected from a total of 240 neurons in the sensomotor cortex and 220 neurons in the occipito-parietal cortex. Lack of statistically significant firing rate changes was the predominant response to sham exposure, while microwave irradiation markedly increased the percentage of neurons that either decreased or increased their firing rate (Table 2). Overall, about 60% of neurons reacted to microwaves. Both tested irradiation regimens caused a practically identical response. As a rule, exposure suppressed the activity in neurons with initially high firing rate, and facilitated the activity in neurons with initially low firing rate. The magnitude of changes
276

also was higher under microwave exposure. For exposure with repetitive microwave pulses, for example, the pre-exposure firing rate in the sensomotor cortex was 6.1 ± 0.89 pulses/sec; it increased to 11.2 ± 0.64 pulses/sec under irradiation (p<.05), and returned to 9.2 ± 0.58 pulses/sec after the irradiation. The respective numbers for sham exposure were 5.2 ± 1.32, 6.94 ± 1.5, and 7.8 ± 1.09 pulses/sec (the changes are not statistically significant). The average latency of the response was 10 ± 3 sec for firing activation, and 9 ± 2 sec for firing suppression.
Pulsed RF effects on brain receptors have been continually studied for more than 10 years (Akoev et al., 1985, Kuznetsov et al., 1991, Kolomytkin et al., 1994, Iurinskaia et al., 1996). A brief exposure of rats to 800, 880, or 915 MHz microwaves increased radiolabelled agonist binding to glutamate receptors, decreased binding to gamma-aminobutyric acid (GABA) receptors, and decreased acetylcholinesterase activity in brain. These effects required 16-Hz modulation, at either 85% or 32% duty ratio; CW irradiation or other modulation frequencies (3 to 30 Hz) caused no statistically significant changes. Interestingly, brief (1- and 5-min) exposures often produced greater effects than prolonged exposures (15- 60 min). For a 5-min exposure with 16-Hz modulation, the threshold field intensity was between 10 and 50 uW/cm2. The magnitude of the effects gradually increased or remained almost unchanged for the field intensities from 0.1 to 1 mW/cm1.
These findings can be illustrated in more detail by the paper of Iurinskaia et al. (1996). Four separate series of experiments were performed in male Wistar rats (150-200-g body weight). Animals were kept in normal vivarium conditions, and were made accustomed to experimental manipulations, environment, and handling for 7-10 days prior to experiments. All experiments were performed at the same time of day. The animals were exposed in groups of 3 in a plastic cage, from an open end of a waveguide. Control animals were treated in exactly the same manner and were subjected to a sham exposure. Rats were decapitated immediately after irradiation, and the brain was extracted and processed to evaluate the specific binding of radiolabelled agonists (3H-glutamate and 3H-muscimol) to glutamate and GABA receptors. In the first eet of experiments, the authors studied the dependence of binding on the incident power density (from 0.01 to 1 mW/cm2), when other exposure parameters were kept constant (915 MHz, 16 Hz modulation for 5 min). Microwaves increased binding of 3H-glutamate and decreased binding of 5H-muscimol. At 10 jiW/cm2, these indices changed to 120 ± 12% and 88 ± 12%, respectively (sham control was taken as 100%). At higher power densities, both effects gradually became more substantial (over 200% and 70-80%, respectively) and statistically significant (Figure 3, A).
The next series of experiments was focused on determining the role of modulation in the induction of these effects. Animals were exposed for 5 min at 1 mW/cm1 (800 MHz for experiments with 3H-muscimol and 915 MHz for experiments with 3H-glutamate), modulated at 0, 2.5, 3, 5, 7, 16, or 30 Hz (32% duty ratio). Neither CW nor modulated regimens produced a statistically significant change in 3H-muscimol binding, except for 16-Hz modulation which decreased binding to 70 ± 5%. Maximum increase in the 3H-glutamate binding (to 200-220%) also occurred at 16-Hz modulation (Figure 3, B).
In the third set of experiments, the exposure duration was varied from 1 to 60 min, keeping the other parameters constant (800 or 915 MHz, 16 Hz modulation, 1 mW/cm2). Maximum decrease in the 3H-muscimol binding (to 45-50%) occurred after a I-min exposure, and the effect gradually weakened for longer exposures. For 3H-ghitamate binding, the maximum effect of 200-220% was observed after a 5-min exposure; after 1-min
277

exposure, it was 130 ± 6%. The ability to produce the effects with very low intensities of radiation, as well as dependencies on modulation and exposure duration indicated a nonthermal mechanism of the effects.
16 Hz, 5 min
200
%
100 ■
Oi-
B 1mW/cm2,5min
hi
I £ M CO
u> io «o
I CM
1 1 1 10 100
uW/cm* 1000
Figure 3. Changes in the binding activity of ghrtamate and GABA receptors is the rat brain after exposure to modulated 915-MHz microwaves. A, the effect of a 5-min exposure with 16-Hz modulation on binding of radiolabelled muscimol (Mu) and ghitamate (Glu) at different incident power densities (abscissa, jiW/cm2). B, the effect of a 5-min, 1 mW/cm2 exposure on glutamate binding at different modulation frequencies (Hz). The data shown are the mean ± s.e., in % to sham-exposed controls. See text for more detail. (Adopted from Iurinskaiaetal., 1996).
In the forth set of experiments, the authors studied microwave effects on the concentration dependences of the change in binding characteristics. Irradiation only slightly affected the dissociation constant of muscimol, but decreased the number of binding sites from 17.4 ± 0.8 to 10 ± 2 pmol per mg of protein. In contrast, irradiation did not change the number of binding sites for glutamate, but decreased its dissociation constant from 277 ±15 nM (control) to 103 ± 10 nM.
Summarizing their experimental results, the authors noted that the dynamics of the changes they observed in the state of brain receptor systems is similar to the effects produced by an electric shock, pain, or immobilization stress. They hypothesized that electromagnetic radiation works as a stressing factor, with adaptation developing under a prolonged exposure.
A series of studies performed under the leadership of K. V. Sudakov explored neurophysiological and behavioral effects of the lower RF frequencies (30 to 40 MHz, 30 to 300 V/m, 2- to 50-Hz sinusoidal modulation). The experiments were performed in rats and rabbits, and exposures lasted from 2-5 min to 45-90 min. These exposures inhibited the autonomous nervous system response to stimulation of the hypothalamus (Kashtanov and Sudakov, 1981); alleviated stress response to immobilization and electrical stimulation of the skin (Gorbunova et al., 1981); induced spreading epileptiform activity in the brain, followed by EEG suppression; induced the appearance of slow waves and even catalepsy in some
278

animals (Sudakov and Antimonii, 1977); suppressed defensive behavior and motor activity, and inhibited extinction of the conditioned response (Sudakov, 1976, 1998). Depending on the modulation frequency, the exposure had a biphasic effect on the self-stimulatory behavior in rats (activation followed by suppression at 2-Hz modulation, or no effect followed by suppression at 7-Hz modulation), or even suppressed the self-stimulation practically from the onset of exposure at 50-Hz modulation (Antimonii et al., 1976).
However, these interesting findings should be taken with cautioa One reason is that, in many cases, the authors used regular metal electrodes for brain stimulation and recording of the electric activity. The use of such electrodes during the electromagnetic field exposure could cause field distortion and various artifacts (e.g., demodulation of the field and direct stimulation of biological structures by electric current at the modulation frequency). Without independent replication in artifact-free conditions, it is not possible to judge if these findings were in fact the effect of the field, or were just a result of the flawed experiment protocol.
Konovalov and Andreeva (1989) studied microwave effects on apomorphine-induced motor stcrcotypy in rabbits and rats. In rabbits, a 30-min exposure of the head (880 MHz, 8 mW/cm2, 16- or 30-Hz pulses or CW) decreased the number of "simultaneous hits" by hind limbs by 15-25%, but this difference was not statistically significant. The authors noted, however, that in 3 animals (out of 34) 16-Hz pulses decreased the number of "simultaneous hits" 3-4 times, while the other exposure regimens had only a subtle effect. In rats, a 1 mg/kg dose of apomorphine caused them to circle around the cage in the left or right direction. A single 60-min whole-body exposure with 16-Hz pulses suppressed this behavior by 21% (p< 05 compared with sham exposed controls); a series of 5 exposures for 60 min/day suppressed it by 40% (p<.01).
Grigoriev and Stepanov (1998) studied delayed effects of pulsed RF exposure on imprinting behavior in chicks. Eggs were exposed on the 16th day of incubation, for 5 min at 40 uW/cm2 (10 GHz, 1-, 2-, 3-, 7-, 9-, or 10-Hz modulation). Two days after hatching, chicks were given a choice of two flashing light stimuli. The flashing rate of one light was the same as the modulation rate in the previous RF exposure of the egg; the flashing rate of the other light was offset by 8 Hz. It was found that chicks exposed in eggs to 9- or 10-Hz RF pulses showed preferences to the light flashes of the same frequency. Sham-exposed chicks and those exposed at other RF pulsing rates did not show a preference to either light stimulus.
A single 50-min microwave exposure at very low average intensity (15 uW/cm2, 6 GHz, 2-Hz pulses) produced no statistically significant changes in the physiological condition of adult rabbits (Rynskov et al., 1995). The condition of microwave- and sham-exposed animals was evaluated immediately after the exposure and also on the next day. The tests employed in this study were electrocardiogram, electroencephalogram, compound myogram of musculvs gastrocnemius, pneumogram, and blood contents of cortisol, testosterone, insulin, and thyroxin.
Lukianova and co-authors (1995) compared formation of conditioned avoidance reflexes to light, sound, pulsed microwaves (6 GHz, 50-Hz pulses, 200 jiW/cm2 average and 400 uW/cm2 peak power), and 1000-Oe constant magnetic field. Rabbits were taught to respond to only one type of the conditioning stimuli (3 animals per group), and 4 other animals were subjected to "sham stimuli". Exposures and sham exposures were performed 6 times every other day, up to the total of 400 treatments for each animal. In 20 sec after the onset of the conditioning stimulation, the rear left extremity was stimulated with electric current, causing a flexor reaction. Withdrawal of the leg within this 20-sec interval prevented the electric stimulation and was regarded as a conditioned reflex response. Consolidation of the
279

conditioned reflex was observed in all but one exposed animal and in none of the sham- treated controls. Consolidation took noticeably more time in the case of magnetic field exposures (243-245 combinations of stimuli) than with exposures to microwaves, sound, or light (139-154, 98-134, and 114-184 combinations, respectively). The maximum reflex percentage per 50 combinations established for the above groups was 40-60%, 30-60%, 60- 78%, and 70-80%, respectively. The average latency of the reflex to the magnetic field (8.5 ± 0.12 sec) and to microwaves (7.76 ± 0.35 sec) significantly exceeded the corresponding numbers for sound (4.9 ± 0.09 sec) and light (4.47 ± 1.17 sec).
Navakatikian (1992) has described a behavioral technique sensitive enough to detect the effect of acute pulsed RF exposure at 10 uW/cm2 (or 2.7 nW/g). The author employed a well-known shuttle-box method of studying the conditioned reflex of active avoidance, but scrupulously refined the shuttle box design and optimized the schedules of animal training and testing. Particular attention was given to selection of uniform experimental and control groups and to statistical analysis of the animals' performance data. An experiment with microwave exposure illustrated all the detail of how to use this behavioral method and how to process the raw data.
Adult male rats (280- to 360-g body weight) were trained to respond to a sound stimulus by relocating from one compartment of the shuttle box into another, in order to avoid punishment by electrical stimulation. The optimum training schedule consisted of three training series, each with 75 combinations of stimuli. One additional, so-called "testing" series (identical to the previous training series) was performed immediately after a 30-min sham or microwave exposure (3000-MHz, 10 uW/cm2, 400-Hz pulse repetition rate, 2-usec pulse width, 4 pulses per burst, one burst every 3.75 sec). The difference in each animal's performance in the testing series and in the last training series was taken as an individual change (IC) index. The IC values were averaged over groups of 11 exposed and 11 control rats. For the latency of the reflex response, the average IC was -0.11 ± 0.06 sec for the sham- treated group, and +0.17 ± 0.09 sec in the exposed group (p<.05). The author noted that, for an acute exposure, the minimum microwave intensity that was reported in literature to change conditioned reflexes is 1000 uW/cm2. The method described in this paper has therefore been proven to be sensitive enough to establish an effect of acute microwave exposure at an intensity two orders of magnitude less than previously reported.
However, the significance of this demonstration should not be overestimated. The reason is, that with the employed pulsing regimen, the incident energy density per pulse reached 9 uJ/cm2, which clearly exceeds the established threshold of 1.5-3 pj/cm2 for auditory perception of RF pulses by rats (Chou et al., 1985). Therefore, it is not surprising that a sensitive behavioral technique could reveal some effect of a 30-min RF auditory stimulation. On the other hand, the author has reported elsewhere (Navakatikian, 1993) that the described method reliably detects the effect of 2450 MHz CW exposure at 0.1 mW/cm1
(27 uW/g); this finding suggests that the microwave effect does not necessarily involve just auditory or thermal stimulation.
ANIMAL STUDIES: CHRONIC EXPOSURE
A substantial number of studies have explored behavioral and physiological effects of exposure conditions that imitated actual occupational or residential exposures from various military and civilian radar systems. The employed modulation schemes could be rather
280

complex, such as regular bursts of pulses from rotating antennas or field modulation by Morse code.
Potential health effects of a coastal radar were explored by Tomashevskaia and Solenyi (1986). Field measurements established that population within 0.1-1-km distance from the coastal radar can be exposed to intermittent bursts of 400- or 800-Hz microwave pulses (3- or 10-cm wavelength) at levels from 10 to 80 uW/cm2; the intermittence was produced by antenna rotation at 16 rpm. White mongrel rats (130 -140 g body weight) were exposed to intermittent 10-cm (2750 MHz) pulsed microwaves for 16 hours a day at 100, 500, or 2500 uW/cm2 over a 4-month period; control animals were sham exposed. This microwave treatment significantly decreased the animals' motor activity (100 and 500 uW/cma), increased electrodermal sensitivity (500 and 2500 uW/cm2), decreased the glycogen content in liver and brain (all intensities), decreased cytochrome oxidase activity in brain mitochondria (2500 uW/cm2), and changed some immune indices (500 and 2500 uW/cm2). Mathematical analysis of the collected data has predicted the "no-effect field intensity" to be at 10 nW/cm2, which was therefore recommended as a maximum permissible irradiation level for residential areas.
The authors continued with studying the effects of a civil aviation radar system (Tomashevskaia and Dumanskii, 1988). Adult white rats were exposed to 400-Hz microwave pulses for 16 hours/day for 4 months using various carrier frequencies, intermittence regimens, and field intensities; (1) 2750 MHz, SO, 100, or 500 fiW/cm\ 40-psec bursts, 1 burst per 20 sec, (2) 1310 MHz, 20 or 100 uW/cm2, 28-usec bursts, 1 burst per 10 sec, and (3) 850 MHz, 20, 100, or 500 uW/cm2, 67-usec bursts, 1 burst per 6 sec. The experiments established that exposures at 20 and 50 uW/cm2 produced no statistically significant effects compared to sham-exposed controls. Exposures at 100 and 500 jiW/cm2 could cause statistically significant changes in the activity of several marker enzymes (cholinesterase, cytochrome oxidase, succmate dehydrogenase, and ceruloplasmin); the magnitude of changes in different tissues varied depending on the particular irradiation regimen.
Navakatikian and co-authors (1991) exposed rats to 3000-MHz pulsed radiation for 2 months, 12 hours/day during the nighttime. Bursts of 20, 4, or 2 pulses (2-|Asec pulse width, 400-Hz repetition rate) were emitted every 20, 3.75, or 2.07 sec, respectively, simulating antenna rotation speeds of 3, 16, and 29 rpm. The average energy output was virtually the same for all the pulsbg regimens (60, 64, and 58 pulses/min). The incident power density levels studied were 0.1, 0.5, and 2.5 mW/cm5. Exposure effects evaluated were the animals' exploratory activity (measured as an amount of movement in a special maze) and conditioned avoidance reflex in a shuttle box test. Most of the exposure regimens slightly stimulated the locomotor activity (except 20-pulse bursts at 0.5 and 2.5 mW/cm3). Performance in the shuttle-box after exposures was characterized by decreased latency of responses and increased number of correct responses. Overall, the changes were interpreted as a prolonged and moderately expressed activation of the central nervous system.
Bioeffects of the above-mentioned exposure regimens were explored further and compared to the effects of 2450 MHz, 0.01-1 mW/cm2 CW irradiation (Navakatikian and Tomashevskaya, 1994). In particular, it was found that 2-month CW exposure caused suppression of the central nervous system, in contrast to weak activation under pulsed irradiation. Histological examination of the thyroid gland revealed functional activation of the zona fasciculata after pulsed microwave exposure. Pulsed microwaves consistently and reproducibly decreased blood levels of insulin and testosterone, while CW exposure had no
281

effect. The authors have speculated that inhibition of behavior was a direct effect of irradiation on the nervous system, whereas activation might be mediated by hormonal changes.
Another study has replicated the exposure conditions of meteorological radar personnel (Navakatikian et al., 1991). Adult female rats were subjected to simultaneous irradiation from 9375- and 1765-MHz sources for 12 hours daily, 30 min each hour. The average incident power levels for 9375 MHz were 0.12, 0.24, and 0.36 mW/cm2; for 1765 MHz, the power output was set 24 times less, so the integral intensities used were 0.125, 0.25, and 0.375 mW/cm2. Modulation pulse width and repetition rate were 1.1 ^is, 475 Hz for 1765 MHz, and 2 us, 300 Hz for 9375 MHz. For 9375-MHz microwaves only, the pulses were assembled into 20-msec bursts and delivered at a rate of 1 burst every 10 sec. Behavioral endpoints after 1, 2, 3, and 4 months of everyday exposure were compared with those in a sham-exposed group. The exploratory activity in animals was slightly but statistically significantly suppressed after 1-month exposure at 0.375 mW/cm2 and after 2-months exposure at 0.125 mW/cm5 Conditioned reflex performance In a shuttle box was suppressed after 2 months of exposure at 0.25 mW/cm2. After 3 and 4 months of exposure, all behavioral parameters were the same as in the control group. Overall, behavioral effects observed in this study were regarded as "weak and unstable".
In a study by Grigoriev et al. (1995), adult rabbits were exposed to 1.5-GHz pulsed microwaves for 30 min a day for 1 month, excluding weekends and holidays (16-ms pulse width, 0.3 mW/cm2 peak power, 0.12-Hz pulse repetition rate). Exposures were performed in an anechoic chamber, one animal at a time. During the exposure, animals were placed into a special Perspex cage (40 x 40 x 40 cm) with a built-in piezoelectric probe for recording motor activity. The authors performed two identical series of experiments. In each series, 5 animals were exposed and 5 were sham-exposed. Sham exposures were done in the same chamber in a random sequence with microwave exposures. In both series, the motor activity of the sham-exposed animals was maximum in the first 2 days, reflecting an orientation- exploratory reaction. The later period (until the 15th day) was characterized by extensive fluctuations of motor activity, which was interpreted as development of adaptation. After 2 weeks of treatment, motor activity stabilized at a significantly lower level, showing that adaptation is completed. In exposed animals, this decrease of motor activity was not significant, and this effect was observed in both series of experiments. For example, in the control group of the second series, the number of movements recorded during 30 min of sham exposure decreased from 117113 (the first 2 weeks' average) to 64 + 7,8 (the second 2 weeks' average, p<.05). The respective numbers for microwave-exposed animals were 120 ± 11 and 105 ± 13 (p>.05). This irradiation effect was regarded as inhibition of the adaptive reaction, or disadaptation. The 30-min dynamics of motor activity did not show any difference between exposed and control animals, but one type of movements (rapid moving of paws up and down) significantly increased in the exposed animals in the second 2 weeks of the experiment. This type of activity pointed to an enhancement of excitatory processes in the central nervous system, increased anxiety and distress.
Physiological effects of fields generated by ship radio transmitters (13 MHz, 250 or 500 V/m, modulated by Morse code) were reported in a series of studies by Minkina et al. (1985) and Nikitina et al. (1989a,b). Male albino rats (160-180 g body weight) were exposed to the field for 2 hours a day, 5 times a week, over a 2- or 6-week period. The authors did not supply information as to whether or not these exposures affected the body temperature of the
282

animals. After the course of exposures, animals were decapitated and various tissues were taken for morphological and histological examination.
In the first of these studies, 2 weeks of exposure at 500 V/tn slightly activated the neurosecretory function of supraoptic and paraventricular nuclei in hypothalamus. These alterations disappeared after 6 weeks of exposure, but, by this time, the mass of the adrenals was considerably decreased. Irradiation at 250 V/m for 30 days reduced the blood plasma level of corticosterone, with no other effect on adrenals or hypothalamus. Changes observed in the thyroid gland morphology indicated activation of its function by 500 V/m exposure and suppression by 250 V/m exposure. Out of studied tissues and organs, spermaries proved to be the most sensitive to irradiation. Disorders of spennatugenesis, hemorrhagia, degenerative and dystrophic changes increased with longer course and higher intensity of exposures.
The second study (Nikitina et al., 1989a) was primarily focused on cytogenetic effects of exposure (500 V/m for 10 days). Chromosome aberration frequency significantly increased in bone marrow cells (to 10-11% versus 5-6% in sham exposed controls, p<.05), but not in corneal cells. At the same time, the mitotic index in corneal cells fell from 1.01% to 0.66% (p<05). The ascorbic acid concentration in the hypophysis and adrenal cortex increased from 264 ± 17 mg% and 403 ± 15 mg% in control animals to 361 + 27 mg% and 478 ± 24 mg%, respectively. The size of the adrenal cortex cells decreased. In thyroid gland, the growth of colloid accumulation in follicular cavities was observed. The follicular area fdled with colloid increased from 10.8 ± 2.8% to 29.7 ± 6.1% after irradiation. Irradiation disrupted spermatogenesis and reduced the mitotic activity of spermatic epithelium. The observed morphological changes indicated suppression of adrenocorticotropic hormone secretion and of the adrenal cortex and thyroid gland function. The production of hiteotropic and follicle-stimulating hormones apparently was not affected.
In the third study (Nikitina et al., 1989b), the authors suggested that individual features of the animals, namely, "the type of organization of their nervous function", might play a role in their sensitivity to radiofrequency exposure. As in the previous studies, the experiments were performed in male albino rats. Based on the animals' characteristic behavior in an open- field test, they were assigned to groups with "low-entropy" (LE) and "high-entropy" (HE) organization of the nervous function. After 60 days of exposure at 500 V/m, the authors evaluated the condition of the animals by 30 various indices (morphology of thyroid, adrenals, hypophysis; blood level of testosterone, luteinizing and follicle-stimulating hormones, etc.) and the condition of their progeny on the 20th day of embryo development by 13 other indices (body mass and length, organ pathology, ossification rate, etc.). Examination of the sham-exposed group revealed 7 indices that were significantly different in the LE and HE animals; in the exposed group, there were 17 such indices. The authors provided three examples that were characteristic for these differences. The morphological changes in the thyroid gland evidenced for its activation in both LE and HE exposed animals; however, in the LE specimens this actually was manifested as an increment in the epithelial cells height, and in the HE specimens it was an increment in the cell nucleus area. Exposure significantly diminished body mass in the exposed LE animals (by about 10% compared with LE controls), but did not change it in HE animals. There was no difference in the rate of ossification in the progeny of the control HE and LE animals, while the EMF treatment decreased this index in the offsprings of the LE specimens and increased it in the offsprings of the HE specimens. Thus, the experimental results revealed considerable differences in the EMF sensitivity between the LE and HE animals. It was recommended to consider such individual differences in future behavioral studies and in the development of safety standards.
283

Perhaps the most pronounced and unambiguously adverse effects of low-intensity microwave radiation were reported by Lokhmatova (1994). Effects of a 4-month exposure for 2 hours/day (3-GHz, 0.25 mW/cm2) on reproductive organs were studied in 22 adult male rats. While the transmitter operated in a CW mode, an intermittent irradiation regimen was achieved by rotating the transmitter horn antenna at 22 rpm. A similar group of 22 animals underwent the same course of sham exposures. Morphological and histochemical analyses of the testes and epididymides were performed right after the end of the exposures and also 4 months later. The experiments revealed explicit morphofunctional disorders in RF-exposed animals. The number of normal seminiferous tubules decreased to 28.2 ± 5.3% (compared with 47.1 ± 5.3% in the controls), while the number of the tubules with dying cells increased to 27.2 ± 4.4% (14.7 ± 3.3% in the controls, p<.05). The number of Leydig cells markedly decreased, and some of them showed pyknotic and destructive alterations. RF exposures increased alkaline phosphatase activity in the vicinity of basal membranes and in the spermatic channel walls, and increased levels of NADH and succinate dehydrogenases. Most of these disorders showed only a subtle or no trend to recovery in 4 months after the end of exposures. The author concluded that the changes evoked by the prolonged microwave exposure are likely to result in stable impairments of production and balance of steroid hormones and premature loss of reproductive function.
BIOEFFECTS OF EXTREMELY HIGH POWER PULSES (EHPP)
Nowadays, EHPP technologies and applications are among the fastest growing areas, but very little is known about EHPP bioeffects and health hazards. The overall number of biological studies with RF pulses of 1-100 kW/g does not exceed 2-3 dozen (including meeting abstracts), and only a few isolated studies have explored still higher peak field intensities. Russian EHPP studies employed the most advanced pulsed power sources (which are still not available for biologists in the West), but the quality of reported biological research often is questionable.
Tambiev et al. (1989) studied the effect of 10-ns wide, 200 kW/cm2 RF pulses (3-cm wavelength, 1 pulse per 6 min) on the growth rate and photosynthetic oxygen evolution in blue-green alga Spirulim platensis and unicellular green algae Platymonas viridis. It was found that exposure to 10-15 pulses stimulated cell culture growth and oxygen evolution. For example, by the 30th day after a single exposure, the biomass of S. platensis cultures increased by 52% in comparison with sham-exposed controls, and that of P. vMcus increased by 17%. Maximum stimulatory effect (by up to 115%) was achieved when a treatment by 10- 15 EHPP was performed Immediately after a 30-min exposure to 2.2 mW/cm1, 7.1-mm wavelength CW radiation (this mm-wave irradiation alone enhanced the growth by about 50%). The same combined treatment caused the most pronounced enhancement of the photosynthetic oxygen evolution (about 1.5 times). Further experiments demonstrated that a greater number of EHPP (20-25) had the opposite effect, i.e., suppressed the alga growth.
Deviatkov et al. (1994, 1998) studied the effects of 10-ns EHPP (3-cm wavelength, 100- MW peak output power) on malignant neoplasm development in vivo and in vitro. Exposure of Wistar rats for 9 days, 43 pulses/day, prior to inoculation with Walker carcinoma, decelerated the neoplasm growth rate 1.5 times and increased the life expectancy by 25-30%. In vitro exposure of Walker carcinoma cell suspensions (80 kV/cm, 6 pulses/min for 5 to 30 min) increased the number of degenerating ceils and those in a stage of lysis. Further
284

experiments studied combined effects of EHPP and an anti-tumor drug endoksan on alveolar hepatic cancer RS-1 in rats. The drug treatment and exposures (6 pulses/min» 30 min/day for 7 days) began when the tumor volume reached 3-4 cm3. By the 55th day after tumor inoculation, the tumor volume was 84.7 cm3 in controls, 14 cm3 in the endoksan-treated group, and 8.9 cm3 in the group treated by endoksan and EHPP. A similar experiment with Lewis lung "carcinoma found that EHPP treatment (6 pulses/min, 30 min/day for 4 days and then for 5 days more, after a 1-day interval) suppressed metastases, from 3.0 points (untreated controls) to 2.3 ± 0.4 (EHPP only) or 0.6 ± 0.2 (EHPP + endoksan); endoksan only decreased this index to 1.4 ± 0.4. For a health risk assessment, 58 animals were exposed to EHPP (from 130 to 720 pulses in 5 sessions) and compared with 64 control animals. Periodic examinations (3-4 times a month) over a period of 1-1.5 years have not revealed any modifications in behavioral responses or in the general state of health of the animals. Autopsy of animals in one year after the exposure did not reveal any pathological modifications in the liver, kidneys, adrenals, thymus, spleen, or other organs. We have to note, however, that lack of sufficient detail on the experimental data, protocols, dosimetry, and statistics in this study makes it difficult to evaluate the validity of reported findings.
An interesting EHPP study has been recently reported from the Institute of High Current Electronics in Tomsk, Russia (Bolshakov et al., 1999). The study was designed to check out several likely mechanisms of EHPP biological action, namely (1) membrane electroporation by high instant voltages of the electric field, (2) direct influence of the intense electric filed on macromolecular charged complexes, such as unfolded DNA sites and cytoskeleton fibers, and (3) changes in the rate of biochemical reactions, diffusion of substances and cell migration due to temperature gradients caused by EHPP absorption. These mechanisms were tested in experiments with (1) growth rate of Escherichia coli culture, (2) proliferation and growth of simple eukaryotic organisms (fungus Fusariwn), and (3) ontogenetic development of Drosophila flies. All exposures employed a relativistic microwave generator with 200- MW output, 10-ns pulse duration, and 3-cm wavelength. The incident E-field in the exposure zone (about 25-cm diameter) was 1.5 MV/m, which corresponds to the incident power density of 300 kW/cm2.
The growth of K coli culture was measured from changes in its optical density. Two identical thcrmostabilizcd (± 1 °C) vials with the bacterial culture were simultaneously placed in an anechoic chamber, but one of the vials (control) was shielded from microwave radiation. Exposures for 5 or 15 min at various EHPP repetition rates (up to 100 Hz) caused no significant changes in the cell growth rate. This result was interpreted as lack of cell electroporation by the EHPP pulses.
Proliferation rate of the Fusctrium fungus was measured by micrometry, from the diameter of cell colonies and the length of hyphae. Exposure regimens were the same as in experiments with K coli; in addition, some samples were exposed in cycles (5 min exposure, 5 min pause) for a total of 1 hour at the EHPP repetition rale of 6 Hz. All tested exposure regimens substantially decelerated the growth of hyphae, on the average from 0.338 ± 0.055 mm/hour (control) to 0.242 ± 0.033 mm/hour. This deceleration was equivalent to the effect of conventional heating by 20-25 °C; however, heating of samples during microwave exposure was less than 1 eC.
For experiments with Drosophila eggs, larvae, and pupa, each group included at least 300 specimens. Each group was exposed or sham exposed just a single time, at different stages of ontogenesis. The exposure duration was 5 min or 60 min (12 cycles of 5-min exposure with 5-min intervals); the EHPP repetition rate was 6,10,16, or 22 Hz. All tested
285

exposure parameters typically caused a 2- to 10-fold increase of cases of interrupted specimen development. Exposures of 1-hour-old embryos could cause developmental abnormalities (morphoses) in 6 to 9% of specimens (versus zero cases in parallel controls), increased imago lethality, and caused infertility in survivors. Additional experiments with imago flies established that 5 to 12% of flies died during a 1-min exposure at EHPP repetition rates of 16, 50, and 100 Hz. At the rates of 6 and 10 Hz, no flies died, but their first generation progeny became almost entirely nonviable (34% had morphoses, 38% died on the first day, and 100% were unable to lay eggs). Since the average heating by microwave exposures was negligible, the observed effects point to certain specific mechanisms of EHPP biological action.
SUMMARY
We conclude that Russian/FSU studies constitute an important source of information on pulsed RF bioeffects. Particular emphasis in these studies was given lo RF-induced changes in the nervous system function, while such issues as RF-induced carcinogenesis apparently have not been a concern and were not studied at all.
While many (perhaps, most) of the studies were flawed, a number of good-quality studies have convincingly demonstrated significant bioeffects of pulsed microwaves. Modulation often was the factor that determined the biological response to irradiation, and reactions to pulsed and CW emissions at equal time-averaged intensities in many cases were substantially different. These results showed that bioeffects of pulsed RF may involve some specific mechanisms of interaction, which are not understood yet.
Most reported bioeffects of low-intensity pulsed microwaves were just subtle functional changes, which did not exceed the limits of normal physiological variation and could only be detected by sensitive physiological tests. However, some studies did report clearly pathogenic effects, and an independent confirmation of these findings would be of principle importance for understanding of the health hazards from RF exposure and development of safety standards. These studies deserve careful consideration and their replication in the West and/or with participation of Western scientists should be given a high priority.
ACKNOWLEDGEMENTS
The work was supported in part by the U.S. Army Medical Research and Materiel Command and the U.S. Air Force Research Laboratory (HEDR and AFOSR) under U.S. Army contract DAMD17-94-C-4069 awarded to McKessonHBOC BioServices. The views expressed are those of the authors and should not be construed as reflecting the official policy or position of the Department of the Army, Department of the Air Force, or the United States Government.
REFERENCES
Afrikanova, L. A. and Grigoriev, Iu. G., 1996, Effects of various regimens of electromagnetic irradiation on cardiac activity (an experimental study), Radiats Biol Radioccol, 36/5: 691-699.
286

Akoev, I. G., Karanova, M. V., Kuznetsov, V. I., and Kotomytkin, O. V., 1985, Action of a uhf field on GABA-ergic and acetylcholinergic systems in synaptic transmission, Radiobiologiia, 25/3: 426-428.
Antimonii, G. D., Badikov, V. I., Kel, A. A., Krasnov, E. A., and Sudakov, S. K, 1976, Changes in the self-stimulation reaction in rats under the action of a modulated electromagnetic field, BiuII Eksp Biol Med, 82/10:1163-1165.
Arber, S. L. and Lin, J. C, 1984, Microwave enhancement of membrane conductance: effects of EDTA, caffeine and tetracaine, Physiol Chem Phys Med NMR, 16/6: 469- 475.
Belokhvostov, A. S., Osipovich, V. K., Veselova, O. M., and Kolodiazhnaia, V. A., 1995, Analysis of DNA of retrotransposon-like genetic line-elements in blood plasma of rats exposed to radiofrequency electromagnetic waves, Radiats Biol Radioecol, 35/3: 356- 363.
Bolshakov, M. A. and Alexeev, S. I., 1992, Bursting responses of Lymnea neurons to microwave radiation, Bioelectromagnetics, 13/2:119-129.
Bolshakov, M, A., Bugaev, S. P., Goncharik, A. 0., Gunin, A. V., Evdokimov, E. V., Klimov, A. I, Korovin, S. D., Pegel', I. V., and Rostov, V. V., 2000, Effects of intense microwave radiation of nanosecond duration on some biological objects, Dokladi Akademii Nauk (in press, referenced by permission of the authors).
Chou, C-K., Yee, K-C, and Guy, A. W., 1985, Auditory response in rats exposed to 2,450 MHz electromagnetic fields in a circularly polarized waveguide, Bioelectromagnerics, 6/3: 323-326.
Deviatkov, N. D., Betskii, O. V., Kabisov, R_ K., Morozova, N. B., Pletnev, S. D., Faikin, V. V., and Chernov, Z. S., 1998, Effect of low-energy pulsed ehf and microwave radiation with nanosecond pulse duration and high peak power on biological structures (malignant neoplasms), Biomedicinskaya Radioelectronica, 1: 56-62.
Deviatkov, N. D., Pletnev, S. D., Chernov, Z. S., Faikin, V. V., Bernashevskii, G. A., and Shchitkov, K. G., 1994, Effect of low-energy pulses of EHF and SHF-radiation of nanosecond duration with a high peak intensity on biological structures (malignant neoplasms), Dokl Akad Nauk, 336/6: 826-828.
Gapeev, A. B., Yakushina, V. S., Chemeris, N. K., and Feeenko, E. E., 1997, Modulated extremely high frequency electromagnetic radiation of low intensity activates or inhibits respiratory burst in neutrophils depending on modulation frequency, Biofizika, 42/5: 1125-1134.
Gorbunova, A. V., Petrova, N. V., Portugalov, V. V. and Sudakov, S. K, 1981, Acute experimental emotional stress in rabbits exposed to modulated electromagnetic fields, Izv Akad Nauk SSSR [Biol], 5: 774-780.
Grigoriev Yu. G., 1999, personal communication. Grigoriev, Iu. G. and Stepanov, V. S., 1998, Forming of memory (imprinting) in chicks
after prior low-level exposure to electromagnetic fields, Radiats Biol Radioecol, 38/2: 223-231.
Grigoriev, Iu. G., Lukianova, S. N, Makarov, V. P., Rynskov, V. V., and Moiseeva, N. V., 1995, Motor activity of rabbits in conditions of chronic low-intensity pulse microwave irradiation, Radiats Biol Radioecol, 35/1:29-35.
Iurinskaia, M. M., Kuznetsov, V. I., Galeev, A L., and Kolomytkin, O. V., 1996, Reaction of the brain receptor system to the effect of low intensity microwaves, Biofizika, 41/4: 859-865.
287

Kashtanov, S. I. and Sudakov, S. K., 1981, The predominant role of reticular formation of the midbrain in mediating the preventive effects of ultra-high frequency electromagnetic fields on excitation of emotiogenic hypothalamic centers, Biull Eksp BiolMed, 91/11: 523-526.
Khitrov, Iu. A. and Kakushkina, M. L., 1990, The action of microwave radiation on potassium ion transport and oxygen consumption in the perfused rat liver, Radiobiologiia, 30/2: 247-251.
Khramov, R N., Sosunov, E. A., Koltun, S. V., Ilyaova, E. N., and Lednev, V. V.» 1991, Millimeter-wave effects on electric activity of crayfish stretch receptors, Bioclcctromagnctics, 12/4: 203-214.
Kim, Iu. A., Kasimbekov, I. K, Fomenko, B. S., Tigranian, R E., 1986, Effect of pulse electromagnetic radiation on erythrocyte ghosts, Biol Nauki, 11:37-41.
Kolomytkin, O., Kuznetsov, V., Yurinska, M„ Zharikov, S., and Zharikova, A, 1994, Response of brain receptor systems to microwave energy exposure, In: On the Nature of Electromagnetic Field Interactions with Biological Systems, A. H. Frey, ed., R. G. Landes Co., Austin, TX, pp 194-206.
Konovalov, V. F. and Andreeva, L. A, 1989, Behavioral effects of VHF exposure, In: Influence of Electromagnetic Radiation on Biological Objects and Laser Medicine, V. I. Hichev, ed., Far East Branch, Acad. of Sciences of the USSR, Vladivostok, Russia, pp 122-136.
Korotkov Iu. S., Burenkov, M. S., Burenkova, L. A, Pichugin V. Iu,, Chunikhin, S. P., and Engovatov, V. V., 1996, The reaction of the tick Hyalomma asiaticum (Acarina, Ixodidae) to 1- to 4-GIIz microwaves, Mcd Parazitol (Mosk), 4: 28-31.
Kuznetsov, V. I, Iurinskaia, M. M., Kolomytkin, O. V., and Akoev, I. G, 1991, Action of microwaves with different modulation frequencies and exposure times on GABA receptor concentration in the cerebral cortex of rats, Radiobiologiia, 31/2:257-260.
Lin, J. C, 1990, Auditory perception of pulsed microwave radiation, In: Biological Effects and Medical Applications of Electromagnetic Energy, O. P. Gandhi, ed., Prentice Hall, Englewood Cliffs, NJ, pp 277-318.
Lokhmatova, S. A, 1994, The effect of low-intensity prolonged impulse electromagnetic irradiation in the uhf range on the testes and the appendages of the testis in rats, Radiats Biol Radioecol, 34/2:279-285.
Lukianova, S. N. and Moiseeva, N. V., 1998, Analysis of pulsed bioelectric activity of rabbit cerebral cortex in response to low-intensity microwave radiation, Radiats Biol Radioecol, 38/5:763-768.
Lukianova, S. N., Rymkov, V. V., and Makarov, V. P., 1995, A comparison of conditioned avoidance reflex in rabbits formed under the influence of permanent magnetic fields, ultra-high-frequency irradiation, light and sound, Radiats Biol Radioecol, 35/1:69-73.
Lukianova, S. N., Rynskov, V. V., and Makarov, V. P., 1995, Response of neurons of the sensomotor region of the cerebral cortex to low-intensity pulsed ultra-high frequency irradiation, Radiats Biol Radioecol, 35/1: 53-56.
McRee, D. I. and Wachtel, H., 1982, Pulse microwave effects on nerve vitality, Radiat Res 91/1:212-218.
McRee, D. 1., and Wachtel, H., 1980, The effects of microwave radiation on the vitality of isolated frog sciatic nerves, Radiat Res, 82/3: 536-546.
288

Minkina, N. A., Kuzminskaya, G. N., Nikitina, V. N., and Garina, I. A,, 1985, Influence of the intermittent short-wave electromagnetic field on endocrine glands, Radiobiologiia, 25/6: 756-762.
Moiseeva, N. V., 1996, Experimental data on the reaction of brain neurons to low-intensity pulse-burst microwave irradiation, Radials Biol Radioecol, 36/5: 710-713.
Navakatikian, M. A. and Tomashevskaya, L. A, 1994, Phasic behavioral and endocrine effects of microwaves of nonthermal intensity, In: Biological Effects of Electric and Magnetic Fields, vol. I: Sources and Mechanisms, D. O. Carpenter and S. Ayrapetyan, eds., Academic Press, San Diego, pp 333-342.
Navakatikian, M. A., 1992, A method of studying of a defensive conditioned reflex of active avoidance, Zh Vyssh Nerv Deiat Im IP Pavlova, 42/4: 812-818.
Navakatikian, M. A, Nikitina, N. G., and Zotov, S. V., 1991, Behavioral effects of the chronic combined exposure to 9375 and 1765 MHz microwaves, Gig Sanit 8: 52-53.
Navakatikian, M. A., Soldatchenkov, V. N., Bhkin, S. V., and Zotov, S. V., 1991, The status of the higher nervous activity in animals exposed to microwaves in conditions simulating the intermittent work of radiolocators, Gig Sanit 7: 57-61.
Navakattkyan, M. A, 1993, A problem of standardizing methods for biological evaluation of an electromagnetic field effect in hygienic regulation, In: Hygiene of Physical Factors of Environmental and Industrial Surroundings, First International Congress (16-18 November 1993, Kiev, Ukraine), pp 68-69.
Nicitina V. N., Matskevich 0. A, Dubrovina V. V., Minkina N. A, and Kuzminskaya G. N., 1989a, Cytogenetic and endocrinologic changes in experimental animals exposed to high-frequency electromagnetic fields, Gig Sanit, 5: 85-86.
Nikhina, Y. N., Suvorov, N. B., Minkina, N. A, and Shaposhnikov, E. S., 1989b, Peculiarities of the response of animals of various typological groups to electromagnetic radiation of high and very high frequency, Radiobiolugiia, 29/5: 676- 679.
Pakhomov, A G., 1993, Non-thermal microwave effect on nerve fiber function, Biofizdka, 8/2: 367-371.
Pakhomov, A. G., Dubovick, B. V., Degtyariov, I. G, and Pronkevich, A. N., 1995a, Microwave influence on the isolated heart function: I. Effect of modulation, Bioelectromagnetics, 16/4: 241-249.
Pakhomov, A G., Dubovick, B. V., Degtyariov, I. G., and Pronkevich, A N., 1995b, Microwave influence on the isolated heart function: n. Combined effect of radiation and some drugs, Bioelectromagnetics, 16/4:250-254.
Pakhomov, A. G., Dubovick, B. V., Kolupayev, V. E., and Pronkevich, A N., 1993a, Effect of high-peak-power microwave pulses on isolated nerve function, Electro Magnetobiol, 12/1:1-15.
Pakhomov, A G., Dubovick, B. V., Kolupayev, V. E., and Pronkevich, A. N., 1992, Microwave-induced changes in nerve conduction: effect of modulation, In: Proceedings of the 14th Int. Conf. of the IEEE Engineering in Medicine and Biology Society (Paris, France Oct. 29-Nov. 1.1992), part 1, pp. 293-294.
Pakhomov, A. G., Dubovick, B. V., Kolupayev, V. E., and Pronkevich, A. N., 1991, Absence of non-thermal microwave effects on the function of giant nerve fibers, J Bioelectr, 10/1&2:185-203.
289

Pashovskina, M. S. and Akoev, I. G., 1996, Effects of 2375 MHz pulse-modulated microwave radiation on ATPase activity of the rat muscle actomyosin, Radiats Biol Radioecol, 36/5: 700-705.
Philippova, T. M., Novoselov, V. I., Bystrova, M. F., and Alexeev, S. I, 1988, Microwave effect on camphor binding to rat olfactory epithelium, Bioelectromagnctics, 9/4: 347- 354.
Popov, V. I., Novoselov, V. I., Filippova, T. M., Khutsian, S. S., and Fesenko, E. E., 1996, Electron microscopy analysis of the effect of a modulated microwave radiation on isolated rat olfactory mucosa, Biofizika, 41/4: 851-858.
Rynskov, V. V., Polyntsev, Iu. V., Lukianova, S. N., Makarov, V. P., and Afanas'eva, E. A., 1995, Evaluation of changes in electrophysiological and hormonal parameters in rabbits resulting from short-term low-intensity ultra-high-frequency irradiation, Radiats Biol Radipecol, 35/1:66-68.
Semin, Iu. A., Shvartsburg, L. K., and Dubovik, B. V., 1995, Changes in the secondary structure of DNA under the influence of an external low-intensity electromagnetic field, Radiats Biol Radioecol, 35/1:36-41.
Sudakov, K. V. and Antimonii, G. D., 1977, The hypnotic effect of modulated electromagnetic field, Biull Eksp Biol Med, 34/8:146-149.
Sudakov, K. V., 1976, Modulated electromagnetic field as a factor of selective effect on the mechanisms of purposeful behavior in animals, Zh VysshNervDeiat, 26/5: 899-908.
Sudakov, K. V., 1998, Action of modulated electromagnetic fields on the emotional component of the systems organization of behavioral acts in rats, Neurosci Behav Physiol, 28/6: 686-693.
Tambiev, A. Kh., Kirikova, N. N., Lapshin, 0. M., Betzkii, O. V., Novskova, T. A, Nechaev, V. M., and Petrov, I. Yu., 1989, The combined effect of exposure to EMF of millimeter and centimeter wavelength ranges on productivity of microalgae, In: Millimeter Waves in Medicine and Biology, N. D. Devyatkov, ed., Radioelectronica, Moscow, pp 183-188.
Tinney, C. E., Lords, J. L., and Durney, C. H., 1976, Rate effects in isolated turtle hearts induced by microwave irradiation, IEEE Trans Microwave Theory Tech, 24/1: 18-24.
Tomashevskaia, L. A. and Dumanskii, Iu. D., 1988, Hygienic evaluation of the biological effect of pulsed electromagnetic fields of 850-2750 MHz, Gig Sanit, 9: 22-24.
Tomashevskaia, L. A. and Solenyi, E. A, 1986, Biological action and hygienic significance of the electromagnetic field created by coastal radar facilities, Gig Sanit, 7: 34-36.
Tygranyan, R E., 1986, On the mechanism of pulsed microwaves effects on excitable structures, Vopr Kurortol Fizioter Lech Fiz Kult, 6:11-14.
Zakharova, N. M., 1995, Enhancement of rhythmic processes in slices of the cerebral cortex under the action of pulse-modulated microwave radiation, Biofizika, 40/3: 695- 696.
Zakharova, N. M., Alexeev, S. I., and Zhadin, M. N., 1993, Microwave effect on spontaneous electrical activity in slices of the cerebral cortex in vitro, Biofizika, 38/3: 520-523.
Zakharova, N. M., Karpuk, N. N., and Zhadin, M. N., 1996, Cross-correlation analysis of interconnections in neuron firing in neocortex slices under the effect of microwave irradiation. Biofizika, 41/4: 913-915.
290

3.8* jjawF»«««*« «»&I >S.ft>Ö:8S;

EFFECT OF PULSED MICROWAVES ON THE POPULATION SPIKE IN RAT HIPPOCAMPAL SLICES
ANDREI PAKHOMOV1'2 and JOANNE DOYLE1
'McKessonHBOC BioServices, US Army Medical Research Detachment 2Directed Energy Bioeffects Division, Human Effectiveness Directorate,
Air Force Research Laboratory Brooks Air Force Base, San Antonio, Texas, 78235-5324, USA.
E-mail: [email protected]
ABSTRACT
The purpose of this study was to reveal possible modulation-specific effect of microwaves on the neuron circuitry function in the isolated brain slice model. Hippocampal slices (350-u.m thick) were obtained from 4- to 6-week old male Sprague-Dawley rats. The slices were exposed to 9.2 GHz microwaves in a custom-made chamber filled with artificial cerebrospinal fluid (ACSF) at 35.5 °C and connected to a waveguide via a sapphire window. Stratum radiatum area of the slice was stimulated with a bipolar tungsten electrode at 30-sec intervals, and extracellular population spikes (PS) in the CA1 area were recorded by a glass microelectrode. Experiments began after a 30- to 60-min stabilization. Each experiment included recording of the PS amplitude for 5 min before exposure, 5 min during it, and 10 min after it. Each slice preparation could be exposed up to three times; various regimens of exposure and sham exposures alternated in a random manner. The interval between sequential exposures was no less than 15 min, and the data for each exposure were analyzed as an independent experiment. In the 1st series of experiments, the modulation rate was fixed at 16 Hz; the average SAR, peak SAR, and pulse width were varied, respectively, from 0.06 to 7.2 W/g, from 2.4 to 14.4 W/g, and from 1.55 to 31 ms. In the 2nd series, pulsed or CW exposures were performed at the average SAR of 2.4 W/g. Tested pulse repetition rates were 10, 100, and 1000 Hz, while the peak SAR and duly cycle were kept constant (12 W/g and 1/5). In the 3rd series. CW and 10-Hz exposure regimens from the Series 2 were tested again, in order to validate a potential modulation-dependent microwave effect. In all the series, microwave-induced heating was directly proportional to the average SAR (up to 4 °C at 7.2 W/g). The experiments established that exposure regimens caused no reproducible and statistically significant effect on the PS if the temperature during the exposure did not exceed 36.5 °C. If the average 5AR was high enough to exceed this temperature, irradiation decreased the PS amplitude. This effect was proportional to the average SAR and heating, while other particulars of the exposure regimen appeared to be of no impprtance. Within the studied limits, all proven effects of exposure could be adequately explained by microwave heating.
INTRODUCTION
Biological effects of continuous-wave (CW) and pulsed microwaves (PW) have been compared in numerous studies. However, the current knowledge in this area is insufficient to draw a definite conclusion about the importance of modulation. In general, findings of these studies fall into one or more of the following categories: 1. Neither CW nor PW produced any bioeffect at low ("nonthermal") intensities. At higher ("thermal")
intensities, CW and PW effects were essentially the same. (1-4). 2. Microwave hearing effects, which can only be caused by PW and within a limited range of pulsing
parameters (5). The effect is mediated by thermoelaslic expansion that creates acoustic waves in tissue. It is unclear whether these acoustic waves can cause any bioeffects other than perception as an auditory stimulus. However, secondary effects could occur (e.g., behavioral response to the auditory stimulation).
3. Both CW and PW produced presumably nonthermal bioeffects, and these effects were essentially the same (6).
480

MICROWAVE EFFECT IN HIPPOCAMPUS
4. Only PW but nok>GW caused presumably nonthermal bioeffects, or nonthermal effects of PW were essentially different from those of CW. In many cases, PW were effective only within a limited range of pulsing parameters (e.g., pulse repetition frequency, PRF), creating so-called "windows of effectiveness" (7-10).
The latter phenomenon of "windows" is particularly intriguing, but perhaps the least established. A significant number of studies have reported specific microwave bioeffects at the PRF of 16 Hz (7-9), though these findings still require independent confirmation. Making the situation even more complicated, some authors have reported that a particular PRF will be biologically effective only within a certain range of the average field intensity (11), peak field intensity (12), or radiation wavelength (10).
The objective of the present study was a wide-scale screening of various pulsing regimens, in order to reveal those which could potentially produce specific (nonthermal) biological effects. The experiments employed a well-defined in vitro model of hippocampal brain slices exposed in fully controlled conditions (including temperature, PRF, peak and average field intensity, and pulse width).
METHODS
1. Exposure setup, thermometry and dosimeiry. The source of 9.2 GHz microwave radiation was an HP 8690A Sweep Oscillator connected to Hughes 8O20H Traveling Wave Tube Amplifier. The amplifier output signal (up to 8W) was transmitted to a biological sample via WR90 waveguide (22.86 x 10.16 mm). The oscillator operated in a CW mode, or was triggered externally by a Grass Instruments S8800 Stimulator to produce square microwave pulses. The pulse width and the PRF were determined by the stimulator settings. Incident and reflected powers in the waveguide were measured via directional couplers by HP 438A and HP 435B power meters with HP 8481A power sensors.
The exposure cell was made atop a vertical end section of the waveguide. The waveguide flanges (covered with a varnish) and a sapphire matching plate impressed into the waveguide formed the bottom of the cell. Plexiglas walls divided the cell into two compartments. The middle compartment above the center of the matching plate was filled with the ACSF, and samples to be exposed were placed directly on the matching plate. The middle compartment was open from the top, to allow the access of recording electrodes and a temperature probe to the sample at the bottom. The other (outer) compartment was essentially a jacket filled with constant-temperature water circulating through a water bath. It should be emphasized that this thermostabilization system could not (and was not intended to) compensate for fast microwave heating in the middle compartment. Instead, its purpose was to set the initial temperature in the middle compartment at a physiological level (about 35 °C).
A method of higli-resululiuii microwave dosiinctry was described in detail and justified in our previous publications (13, 14). Instrumental measurements of local specific absorption rate (SAR) in ACSF solution matched well with analytically calculated values. Along the axis of the waveguide, SAR fell sharply with increasing the distance above the matching plate (approximately twofold per millimeter). Field distribution in the horizontal plane (parallel to the matching plate) was substantially more uniform. For example, at 0.5 mm above the plate, SAR decreased by less than 20% within a 2-mm radius from the waveguide axis.
Brain slices (0.35-mm thick and less than 5-mm wide and long) were placed directly on the sapphire matching plate window and centered over the waveguide axis. However, dielectric properties of brain slice tissues are somewhat different from those of the ACSF, so SAR values measured for the solution had to be adjusted. Necessary calculations were done by Dr. S. Alekseev (1.5) using analytical approaches described by Alekseev and Ziskin (16). Local SAR in the slice on the axis of the waveguide was calculated to be 2.4 W/g per 1 W of transmitted power. Considering slice linear dimensions, SAR gradient within the thickness of the slice was negligible; in the plane parallel to the matching plate, SAR could decrease by 20-30% from the waveguide axis to the periphery of the slice.
Temperature was continually monitored in all experiments with a Luxtron Instruments model 850 multichannel fluoroptic thermometer. A fluoroptic probe sensor was positioned on the matching plate in the immediate vicinity (1-1.5 mm) of the brain slice preparation.
2. Brain slice isolation and recording of bioelectric potentials. Male Sprague-Dawley rats (4 to 6 weeks old) were anesthetized with sodium pentobarbital (50 mg/kg ip) and decapitated. Brain was removed and sliced with a Vibrotome machine (WPI) in a modified ACSF. Saggital slices of the hippocampus were transferred into a holding chamber filled with the ACSF that was continually gassed with a 95% 02 / 5% C02 mixture. The ACSF was composed of: (in mM) glucose, II; NaCI, 125; KC1, 3; MgCI2> 1; NaH2P04, 1.25; NaHC03, 26, CaCl2, 2; pH 7.2-7.4. In the modified ACSF that was used to reduce trauma during brain slicing, NaCI was substituted with an equimolar amount of sucrose.
481

Pakhomov and Doyle
The slice Co be exposed was transferred into the exposure cell filled with the ACSF at 35.3-35 5 C. The ACSF was continually oxygenated and circulated at a rate of 1 ml/min.. Stratum radiatum area of
the hippocampus was stimulated with a bipolar tungsten electrode at 30-sec intervals. An extracellular glass micropipette filled with 2-M NaCl (1- to tO-Mohm resistance) was used to record field potentials of neurons in the CA1 area (so called population spikes, PS). The signal from the micropipette was recorded by an MP100 data acquisition system (BIOPAC) via a DAM50 amplifier (WPI). PS peak-to-peak amplitude was the sole physiological index analyzed in this study.
Experiments began after a 30- to 120-min stabilization of the preparation in the exposure cell. Each experiment lasted for 20 min and included records of PS before exposure (5 min), during exposure (5 mm), and after exposure (10 min). Up to three experiments could be performed with each successful brain slice preparation; various exposure regimens and sham exposures alternated in a random manner, and the interval between sequential exposures was no less than 15 min.
RESULTS
In the 1st series of experiments, PRE was fixed at 16 Hz, while the time-average SAR was varied from 0 (sham) to 7.2 W/g. This formed 6 major groups (5 for sham exposure and A through E for actual exposure, sec Table 1). Within each group, the specified time-average SAR could be produced by different combination of peak SAR and pulse width, thus forming additional subgroups (e.g., Bl, B2, BO, etc.). This resulted in as many as 15 different exposure regimens; obviously, it would be too laborious to collect the data for a full statistical analysis of each treatment regimen. Therefore, the statistical analysis was only performed for the 6 major groups. Concurrently, each single experiment was analyzed separately, in order to reveal a possible "unusual" PS change during or after exposure. In case such a change was observed, the respective exposure regimen was given special attention and tested enough times to establish whether the unusual PS change was a coincidence or a real effect of exposure.
Table 1. Parameters of exposure regimens studied in Scries 1 of experiments. Shown in Italics are 1 - or 2- symbol codes for the regimens. For all the regimens, PRF was 16 Hz, and exposure duration was 5 min.
Time-Qverqge SAR, W/g
peok SAk, W/Q
2.4
3.6
14.4
0(5) 0.06 (A) 0.3(5) 1.2(C) 4.8 (0) 7.2 (E)
Pulse width, ms
1.55 (/4V) 7.8 {Bl) 31 (C/) -
0.52 (A2) 7.6 (B2) 10.4 (C2) 41.7 (D2> -
2.0 (B0) 8.0(50) 31 (DO) -
1.3.(55) 5.2 (CJ) 20.7 (D3) 31 (£5)
The experiments established that, typically, exposure regimens A, 5, and C, as well as sham exposure (S) caused no changes in the PS amplitude. Unusual PS fluctuations were observed only on a few occasions (e.g., with Al and B3 regimens), and failed to be confirmed as irradiation effects Exposures at higher intensities (D and E) caused pronounced heating and gradual PS decrease This decrease was fully or partially reversible after the exposure (Figures 1 and 2) The. effect of exposure on the PS amplitude was apparently determined by the time-average SAR and heating, and not by the peak SAR or pulse width. The data were not indicative of any specific effects of I6-Hz microwave pulses.
To analyze bioeffects of radiations at PRF other than 16 Hz, a Series 2 of experiments was performed. The experiment protocol was the same as for the Series I. A total of 4 exposure regimens were tested (1 CW and 3 PW). For all the regimens, the time-average SAR was fixed at 2.4 W/g, and the exposure duration was 5 min. For all pulsed exposures, the peak SAR was set at 12 W/g and'the duty cycle was 1/5. Tested PRFs were 1000, 100, and 10 Hz; the pulse width was 0.2 2 and 20 ms respectively. Exposure regimens alternated randomly, and each group included from 6 to 8 experiments
The results of Series 2 are summarized in Figure 3. As expected, all the regimens produced practically the same heating (about 1.2 °C). PS amplitude decreased under <hR exposure approximately to the same extent for all tested regimens. Statistical comparison of the graphs using paired /-test revealed no
482

MICROWAVE EFFECT EN HIPPOCAMPUS
significant differences at p<0.05 level. At the same time, the data showed an interesting trend: The rate and the extent of PS recovery after the exposure appeared to be dependent on the modulation. Post- exposure PS recovery was the steepest after the CW exposure, somewhat slower after the 1000-Hz PW exposure, still slower after the 100-Hz exposure, and after the 10-Hz exposure there appeared to be no PS recovery at all.
0 AMw^Vv^^*vi^^ PS mV
Al B3
My**^*A*i «WM*
i • r~ o 10 20 30 40 50 60 70 mm
Figure 1. Sample records of PS amplitude variations during experiments in two different preparations (A and B). Abscissa, time from the onset of the 1st experiment, min. Ordinates, PS amplitude (mV) and temperature (°C). Periods of microwave exposure are shown by horizontal bars. Designations of exposure regimens correspond to those in Table 1.
Thus, the results were indicative of a possibility that PW, at least at 10-Hz PRF, could have a different bioeffect than CW radiation at the same intensity. To validate this possibility, an additional series of experiments was performed.
In Series 3. we tested two exposure regimens that seemed to produce the most different effects at the same SAR level (CW and 10-Hz PW, same as in the previous series). To ensure greater reliability of the data, the experiment protocol was slightly modified: (1) pre-exposure PS recording period was increased from 5 min to 10 min, and (2) each brain slice preparation was exposed only once and then discarded. Otherwise, all experimental conditions remained the same as in Series 2. A total of 9 successful experiments were performed with each exposure regimen. Unfortunately, analysis of the data from these experiments has failed to confirm the trend observed in Series 2, nor did it reveal any other differences in the bioeffects of CW and PW exposures.
SUMMARY
Effects of 9.2 GHz CW and PW microwaves on the field population spike in hippocampal brain slices have been studied in three independent series of experiments. Generally, a 5-min irradiation had no effect on the PS amplitude when the temperature during exposure remained under 36.5 °C. With a more intensive irradiation and more intensive heating, PS amplitude gradually decreased. This PS decrease was proportional to the temperature rise and fully or partially reversible after the exposure. On some occasions, experimental data showed other (atypical) PS changes which could be indicative of a specific bioeffect of some modulation regimens. However, these atypical changes could not be confirmed in replication experiments. Within the limits of this study, all proven effects of exposure were apparently caused by microwave heating and did not depend on the PRF, pulse width, or peak SAR.
483

Pakhomov and Doyle
110
90
0W/g(S) ~| «MM
36-i oC J -* 34 J (
M%aiMM**MM*MM*
10 I
20
0.06 W/g (A)
«M»><M^MK
10 20
0.3 W/g (B)
10 20
%
°C
110-
90-
70- 39-i
37-
35
1.2 W/g (C) 4.8 W/g (D)
r o 10 20
I—r
0 10 "•—I
20
7.2 W/g (E)
0 10 mjn 20
Figure 2. Effect of time-average SAR on PS amplitude. Abscissa, time from the onset of the each experiment, min. Ordinates, PS amplitude (% of the average pre-exposure value) and temperature f°C). Each datapoint is the mean +/- s.o. for a group of 5 to 11 experiments. Indicated arc the periods of exposure (horizontal bars), time-average SAR, and a code letter for exposure regimens included in each group (see Table 1).
CW 2.4 W/g
1000-Hzrate Oi-ms width 12 W/g peak 2.4 W/g average
10041z rate 2-ms width 12 W/g peak 2.4 W/g average
10-HzHb 20-ms width 12 W/g peak 2.4 W/g average
100
%
90-
80J
37
°C 36
35 J
^I^Uyi. V rl \
A
10 20 0 10 20 0 10 ~i r 20 0
n • i 10 min20
Figure 3. Effect of modulation on the PS amplitude. Each datapoint is the mean +/- s.e. for 6 to 8 experiments. Exposure parameters are indicated above the graphs. See Figure 2 and text for more explanation.
484

MICROWAVE EFFECT IN HIPPOCAMPUS
ACKNOWLEDGEMENTS
The authors are thankful to Dr. S. Alekseev (Temple Univ., Philadelphia, PA) for calculation of SAR within brain slices. The work was supported in part by the U.S. Army Medical Research and Materiel Command and the U.S. Air Force Research Laboratory under U.S. Army contract DAMD17-94- C-4069 awarded to McKessonHBOC BioServices. The views expressed are those of the authors and should not be construed as reflecting the official policy or position of the Department of the Army, Department of the Air Force, or the United States Government.
REFERENCES
1. Chou C-K. and Guy A. W. Effects of electromagnetic fields on isolated nerve and muscle preparations. IEEE Trans Microwave Theory Tech 26(3):141-147, 1978.
2. Courtney K. R., Lin J. C, Guy A. W., Chou C. K. Microwave effect on rabbit superior cervical ganglion. IEEE Trans Microwave Theory Tech 23(10):809-813,1975.
3. Pakhomov A.G., Dubovick B. V„ Kolupayev V. E., Pronkevich A. N.. Absence of non-thermal microwave effects on the function of giant nerve fibers. J. Bioelectricity 10(2): 185-203, 1991.
4. Pakhomov A.G., Dubovick B. V., Degtyariov I. G., Pronkevich A. N. Microwave influence on the isolated heart function: I. Effect of modulation. Bioelectromagnetics 16(4):241-249,1995.
5. Lin J. C. Auditory perception of pulsed microwave radiation. In: Biological Effects and Medical Applications of Electromagnetic Energy. O. P. Gandhi, ed., Prentice Hall, Englewood Cliffs, NJ, pp 277-318, 1990.
6. McKee L). 1. and Wachtet H. Pulse microwave effects on nerve vitality. Radiat Res 9I(1):212-2I8, 1982.
7. Iurinskaia M. M., Kuznetsov V. I., Galeev A. L., and Kolomytkin 0. V. Reaction of the brain receptor system to the effect of low intensity microwaves. Biofizilca, 41(4): 859-865, 1996.
8. Blackman C. F., Elder J. A., Weil C. M., Benane S. G., Eichinger D. C, and House D. E. Induction of calcium-ion efflux from brain tissue by radiofrequency radiation: effects of modulation frequency and field strength. Radio Sei 14(6S):93-98, 1979.
9. Adey W. R. Biological effects of low energy electromagnetic fields on the central nervous system. In: Biological Effects and Dosimetry of Nonionizing Radiation. Radiofrequency and Microwave Energies. M. Grandolfo, S. M. Michaelson, A. Rindi, eds., New York: Plenum Press, pp. 359-391, 1983.
10. Gapeev A. B., Chemeris N. K., Fesenko E. E., Khramov R. N. Resonance effects of a low-intensity modulated ehf field. Alteration of the locomotor activity of the protozoa Parameciunv caudatum. Biofizika39(l):74-82.1994
11. Pashovskina M. S. and Akoev I. G., Effects of 2375 MHz pulse-modulated microwave radiation on ATPase activity of the rat muscle actomyosin. Radiats Biol Radioecol, 36(5):700-705, 1996.
12. Semin, Iu. A., Shvartsburg L. K., and Dubovik B. V. Changes in the secondary structure of DNA under the influence of an external low-intensity electromagnetic field. Radiats Biol Radioecol, 35(l):36-41,1995.
13. Pakhomov A.G., Mathur S. P., Akyel Y., Kiel J. L., and Murphy M. R. High-resolution microwave dosimetry in lossy media. In: Radio Frequency Radiation Dosimetry. B. J. Klauenberg and D. Miklavcic, eds., Kluwer Academic Publishers, Netherlands, pp. 187-197, 2000.
14. Pakhomov A.G., Mathur S. P., Doyle J., Stuck B. E., Kiel J. L., and Murphy M. R. Comparative effects of extremely high power microwave pulses and a brief CW irradiation on pacemaker function in isolated frog heart slices. Bioelectromagnetics 2I(4):245-254, 2000.
15. Alekseev S. I., personal communication, 1999. 16. Alekseev S. I. and Ziskin M. C. Reflection and absorption of millimeter waves by thin absorbing
films. Bioelectromagnetics, 21(4): 264-271, 2000.
485

34 IEEE TRANSACTIONS ON PLASMA SCIENCE, VOL. 28, NO. I, FEBRUARY 2000
Low-Intensity Millimeter Waves as a Novel Therapeutic Modality
Andrei G. Pakhomov and Michael R. Murphy, Associate Member, IEEE
Invited Paper
Abstract—One of the most significant events in contemporary electromagnetic biology is a surge in interest to specific effects of low-intensity millimeter-band radiation (30-300 GHz). Bioeffects of millimeter waves (MMW's) can often occur without any consid- erable heating of the exposed subject, and biological responses are principally different from those caused by heating. The effects of MMW's often have a sharp, resonance-like dependence on the ra- diation frequency, but they depend relatively little on the radiation intensity. A brief, low-intensity MMW exposure can change cell growth and proliferation rates, activity of enzymes, state of cell ge- netic apparatus, function of excitable membranes and peripheral receptors; it can alleviate stress reactions, stimulate tissue repair and regeneration, etc. In Eastern Europe, low-intensity MMW's are widely employed for therapeutic purposes. The method has gained official recognition, and millions of people received MMW therapy for various conditions. While the mechanisms of MMW efficacy remain unclear and their medical usage is mostly empir- ical, the knowledge accumulated over more than 20 years of MMW therapy merits careful analysis and consideration.
Index Terms—Millimeter waves, specific bioeffects, therapy.
I. INTRODUCTION
MILLIMETER WAVES (MMW's) are characterized by rather shallow penetration into biological tissues
(<1 mm), and one may anticipate that MMW bioeffects arise mostly from surface heating. Indeed, this thermal mechanism is well known and is essentially the same as with other methods of local heating (e.g., with infrared).
At the same time, a large number of studies have reported principally different MMW effects, which do not fit into the thermal paradigm. These effects may occur at the radiation in- tensities orders of magnitude below the thermal effect threshold, and often demonstrate a highly nonlinear, resonance-type de- pendence on the radiation frequency. Specific MMW effects seem to be of fairly universal nature, appearing at various levels
Manuscript received June 1, 1999; revised September 24, 1999. This work was supported in part by the U.S. Army Medical Research and Materiel Com- mand and the U.S. Air Force Research Laboratory (AFOSR) under U.S. Army Contract DAMD17-94-C-4069 awarded to McKesson BioServices.
A. G. Pakhomov is with McKesson BioServices, U.S. Army Medical Re- search Detachment, and Air Force Research Laboratory, Human Effectivenss Directorate, Directed Energy Bioeffects Division, Radio Frequency Radiation Branch, Brooks AFB, TX 78235-5324 USA (e-mail: andrei.pakhomov@afr- lars.brooks.af.mil).
M. R. Murphy is with Air Force Research Laboratory. Human Effectiveness Directorate, Directed Energy Bioeffects Division, Radio Frequency Radiation Branch, Brooks AFB, TX 78235-5324 USA.
Publisher Item Identifier S 0093-3813(00)00735-9.
of biological organization (from cells and subcellular structures to animal and human organisms) and affecting rather diverse bi- ological functions (from DNA conformation and cell membrane permeability to immune reactions and behavior). While reasons for the unusual MMW sensitivity of living subjects and under- lying biophysical mechanisms have yet to be identified, the pos- sibility of manipulating biological functions by MMW has al- ready been employed widely in biotechnology and medicine.
The purpose of this paper is to introduce professionals with mostly physical and engineering backgrounds to the exciting and potentially important area of MMW bioeffects and medical applications. Interested readers are advised to see other reviews for more detailed information [l]-[8].
II. SPECIFIC BIOEFFECTS OF MILLIMETER WAVES
Resonance effects of MMW's on cell growth rate have been studied for over 20 years [9]-[l 1]. Exposure of the yeast Sac- charomyces cerevisiae to certain frequencies within a 41.8-42.0 GHz band can either increase the cell growth rate by up to 15%, or decrease it by up to 29% [Fig. 1(a)]. The authors employed MMW's modulated at 8 kHz, and established the effect by dif- ferent methods, both in suspended cells and in monolayer. The effect could be detected at the radiation intensity as low as 5 pW/cm2, and remained essentially unchanged with the intensi- ties of up to 1 mW/cm2 [12]. The position of the "resonance frequency" (at which the growth rate increased) did not de- pend on the incident power density, while the "resonance width" (taken as a distance between two frequencies which decreased the growth rate) gradually increased from about 5 MHz at 5 pW/cm2 to 12-15 MHz at 1 mW/cm2 [Fig. 1(b)]. One should note, however, that independent attempts to replicate these ob- servations were not successful [13], [14], suggesting that some other unknown and unidentified factors could be essential for this MMW effect.
Belyaev et al. [15]—[18] used an anomalous viscosity time de- pendence (AVTD) technique to study fine changes in DNA con- formation and DNA-protein bonds caused by MMW exposure. Multiple frequency resonances were established [Fig. 2(a)], and, at a resonance frequency, biological changes could be produced by field intensities as low as 10-19 W/cm2. The magnitude of changes gradually increased with the field intensity, reaching a plateau between 10-17 and 10-8 W/cm2. The resonance fre- quencies shifted when the length of the chromosomal DNA of
0093-3813/00$ 10.00 © 2000 IEEE

PAKHOMOV AND MURPHY: LOW-INTENSITY MMW'S AS A NOVEL THERAPEUTIC MODALITY 35
A
5 pW/cm2
_L J
B
10-
10"
10"
104
41.690
Ml
41.700
GHz
R M2
§ 10-7
NT
c 10-9
Ö .S 10 10
10 -11
/ mW/cni1
Ä—S. / • lfiW/cm2
M2
Ml * *, 7"*M2 • 1 nW/cm2 •
I R f 1 nW/cm
'''] R 1/ Ml*-*-* M2 SpW/ari1
41.690 41.700 GHz
Fig. 1. (a) Effect of different MMW frequencies around 41.696 GHz on yeast cell growth rate. Exposure at 5 pW/cm2,8-kHz square-wave modulation. Labels indicate the frequencies that most efficiently decreased the growth rate (A/t and M2) and increased it (R). (b) Dependence of the "resonance width" (defined as a distance between frequencies A/i and M2) and of the "resonance peak" (R) position on the field intensity. Reproduced with changes from [12], by permission of Gordon and Breach Publishers.
exposed cells was increased, thus suggesting that the chromo- somal DNA may be a target for resonance interaction between living cells and MMW's. The width of the frequency resonances increased from units to tens of megahertz by increasing the in- cident power density [Fig. 2(b)], which is in remarkable agree- ment with the above-mentioned independent findings [12].
Due to the nature of the biological experiment, it becomes in- creasingly laborious to produce detailed frequency and intensity dependences of the bioeffects when working with more complex biological subjects (i.e., when moving from cells to isolated or- gans and whole organisms). Most of such studies analyzed a limited number of isolated MMW frequencies and/or intensi
A 1.40-
1.30-
1 20-
CO o o » "> >
£ lion E zs
•| 1.00- «0
0.90.
JO'10 W/cm2
Frequency, GHz
B u
$ 1.4- A 10"4 W/cm2
(A O O o 10"7 W/cm2
en > > TO <U
1.3-
1.2-
■10"17W/cm2
E E 'x «3
1.1-
1.0-
51.65 51.70 51.75 51.80 51.85
Frequency, GHz
Fig. 2. (a) Frequency dependence of MMW effect on genome conformational state at 10~10 W/cnv2. (b) Gradual widening of a "resonance peak" at 51.756 GHz with increasing of the radiation intensity. Genome conformational state was determined in lysates of bacterial cells (Escherichia coli) by an anomalous viscosity time dependence technique. Reproduced with changes from [18], by permission of Wiley-Liss, Inc.. a subdivision of John Wiley & Sons, Inc.
ties, or even employed a single frequency at a fixed intensity. These studies were focused not as much on the development of the biological response spectra, but rather on identifying spe- cific MMW effects and examining physiological mechanisms involved.
Kataev et al. [19] studied MMW effects on transmembrane currents in giant alga cells {Nitellopsis obtusa, Characea). Ex- posure for 30-60 min at 41 GHz, 5 mW/cm2 suppressed the chloride current to zero with no recovery for 10-14 h. Marked inhibitory effects were also found at 50 and 71 GHz, while most of other tested frequencies enhanced the chloride current up to 200%^100% (49, 70, 76 GHz). This activation was re- versible, and recovery to the initial value took 30-40 min. In- terestingly, "activating" frequencies could restore the chloride current after its complete and normally irreversible suppression by "inhibitory" frequencies. MMW heating did not exceed 1 °C, and neither activating nor inhibitory effects were related to, or could be explained by this temperature change.
Pakhomov et al. [20]-[22] have repeatedly demonstrated that MMW exposure of isolated frog sciatic nerve increases its ability to sustain a high rate of electrical stimulation. The effect reached the maximum of 20%-25% at41.34 GHz [Fig. 3(a)], which was

36 IEEE TRANSACTIONS ON PLASMA SCIENCE, VOL. 28, NO. I, FEBRUARY 2000
A O control
■ 0.26mW/cm2
At %
120 -i
110
100J i 1 1 1 1
41.14 41.34 41.54
B GHz A. control
A 41.34 GHz
At
%
100-
80
Tn—i i i HIHI—i i i HIHI—r—i
0.01 0.1 1
mW/cm
Fig. 3. MMW effect on isolated frog sciatic nerve tolerance to a high-rate electrical stimulation, (a) Dependence of the effect on the radiation frequency at a fixed intensity of 0.26 mW/cra2. (b) Dependence of the effect on the radiation intensity at a fixed frequency of 41.34 GHz. The ability to tolerate the high-rate stimulation (20 paired stimuli/s) was measured from changes in the peak amplitude of the test compound action potential (.4t). Asterisks indicate statistically significant difference from sham-exposed controls (p < 0.05). Experiments illustrated in fragments .4 and B employed somewhat different protocols of nerve stimulation, thus resulting in different baselines (different ,4( values in controls). Reproduced with changes from [21], by permission of Marcel Dekker, Inc. (fragment .4), and from [22], by permission of Elsevier Science S. A. (fragment B).
one of the "resonance frequencies" for genome conformation changes [15]. A 100-MHz deviation from 41.34 GHz (to 41.24 or 41.44 GHz) reduced the effect about twofold, and a 200-MHz deviation eliminated the effect. The distribution of the incident power density over the preparation at these frequencies was practically the same, so different MMW absorption or heating patterns could not account for the frequency-specificity of the effect. Moreover, at 41.34 GHz, the magnitude of MMW-induced changes was the same at the radiation intensities of 0.02, 0.1, and 2.6 mW/cm2 [Fig. 3(b)].
Modulation can be another important parameter that affects MMW biological effectiveness. An unusual "double-res- onance" effect was described in a Protozoan Paramecium caudatum [23]. Spontaneous locomotor activity of individual
protozoan cells was not affected by irradiation unless both the radiation frequency and modulation were tuned to "resonance" values. These values were 42.25 GHz and 0.0956 Hz, at 0.5 duty ratio. Under the "double resonance" conditions, the threshold field intensity was about 0.02 mW/cm2. The effect reached maximum of about 20% at 0.1 mW/cm2, and remained at this plateau level at intensities up to 50 mW/cm2, despite increasing heat production (0.1 °C-0.2 °C at 5 mW/cm2). A continuous-wave (CW) irradiation, or modulation rates of 16, 8, 1, 0.5, 0.25, or 0.05 Hz produced no effect, regardless of the field intensity or heating. At the resonance modulation frequency, a shift of the carrier frequency to 42.0 or 42.5 GHz eliminated the response. Infrared light at intensities producing similar heating of cell suspension, and modulated at 0.0956 Hz, produced no biological effects either. The authors were unable to give any reasonable explanation to the sharp resonant dependence of the MMW effect upon both modulation rate and radiation frequency.
Most animal and human studies with MMW exposure ex- plored potential applicability and benefits of this factor for dis- ease treatment. Beneficial effects of MMW irradiation include, primarily, 1) anti-inflammatory effect and stimulation of tissue repair and regeneration, 2) stimulation of the immune function, and 3) sedative and analgesic effects [7].
Zemskov et al. [24] assessed MMW effects on healing of skin wounds in rabbits. The animals were randomly assigned to four groups: wounds in groups 1 and 2 were kept aseptic, and in groups 3 and 4 were infected with a pathogenic Staphylo- coccus. In groups 1 and 3, the wound surface was irradiated with 1 mW/cm2,37- or 46-GHz CW MMW's for 30 min twice a day, for 5 days. Two remaining groups served as untreated controls. MMW decreased swelling of wound edges, hyperemia, and in- filtration, and rapidly reduced the wound area in the first 24 hours. Complete healing of aseptic wounds in the exposed group took 2.9 days less than in the control group. Wound cleaning and granulation took 14-16 days in the exposed group, and 21-23 days in the respective control.
A similar protocol was used in a double-blind replicative study by Korpan et al. [25]. Rabbits with septic or aseptic cutaneous wounds were exposed for 30 min a day (37 GHz CW, 1 mW/cm2). The treatment continued for 5 days in the aseptic group, and for seven days in the septic one; control animals underwent same courses of sham exposures from a nonoperational MMW transmitter. The condition and size of the wounds were monitored for 32 days. Wound edge swelling and hyperemia subsided faster in MMW-irradiated animals, and granulation tissue filled the wound earlier than in the controls. The mean daily decrease in wound surface area was significantly greater in the MMW-treated animals, namely 7.9% and 6.3% in the aseptic and septic exposed groups versus 3.2% and 2.7% in the respective controls (p < 0.05). The authors concluded that MMW irradiation enhanced both septic and aseptic wound healing and stimulated immune function.
Rather unexpectedly, MMW's promoted regeneration of deep tissues, which are not reachable by the radiation. Kolosova et al. [26] reported that MMW treatment facilitated regeneration and functional recovery of a damaged peripheral nerve. The sciatic nerve in 40 rats was transected in the thigh region and sutured. MMW exposures of the injury area were

PAKHOMOV AND MURPHY: LOW-INTENSITY MMW'S AS A NOVEL THERAPEUTIC MODALITY 37
performed every third day for seven or 20 days (10 min at a time, 4 mW/cm2, 54 GHz); control rats were sham irradiated. Exposures did not increase the skin temperature (0.1 °C accuracy). The seven-day course of exposures had little effect on regeneration, but after the 20-day course the regeneration distance was significantly greater in MMW-exposed animals (18.4 ± 0.4 mm) than in sham-exposed controls (14.0 ± 1.4 mm, p < 0.01). In an independent subsequent study [27], the same irradiations were performed for two weeks after the injury, and the nerve was isolated for examination in five months. Indexes of regeneration were the compound action potential amplitude and conduction velocity at different distances distal from the nerve suture. Both parameters were higher in the exposed animals: For example, 19 mm from the suture, the amplitude was 313 ± 34 ßV versus 156 ± 15 ßV in controls (p < 0.001), and the velocity was 20.4 ± 0.9 m/s versus 15.5 ± 0.9 m/s (p < 0.05). Hence, the authors concluded that exposures facilitated both the growth of nerve fibers and their functional maturation. Since MMW penetration to the impaired nerve was negligible (the depth of penetration for 54 GHz in skin and muscle tissues is roughly 0.5 mm), the authors concluded that regeneration was affected via some indirect mechanism, such as stimulation of cellular and humoral immunity and activation of neurotrophic factors.
Sedative and analgesic effects of MMW's were explored in a series of studies by Rojavin et al. [28], [29]. In mice anes- thetized by either ketamine or chloral hydrate, MMW irradia- tion of the nasal area (61.22 GHz, 15 min at 15 mW/cm2) pro- longed the drug-induced sleep by up to 50%. This MMW ef- fect could be blocked by naloxone, an opioid system antagonist. Similar irradiation of mice injected with a pruritogenic agent (compound 48/80) significantly and consistently decreased the number of scratches of the injected site during 90 min after injection. The scratching activity was inhibited by more than twofold compared with sham-exposed controls. Again, pretreat- ment of animals with naloxone suppressed the anti-pruritic ef- fect of MMW's in a dose-dependent manner.
A logical extension of these findings was a double-blind study of the MMW effect on acute pain tolerance in human volunteers [30]. Chest skin in the lower third of the sternum was exposed to 42.25 GHz MMW's at 25 ± 5 mW/cm2 for 30 min, or it was sham-exposed from a nonoperational MMW transmitter (nei- ther volunteer nor experimenter knew whether an operational or nonoperational transmitter was used). The volunteer's hand was then placed in a bath with cold water and melting ice mixture (1 ± 0.5 °C). Pain sensitivity range and tolerance were evaluated from subjective sensations of the volunteer, and from the time until the pain became intolerable and the hand was withdrawn. Overall, MMW exposure increased the pain tolerance by 37.7% (p < 0.05). In seven volunteers (out of twelve), the individual gain in pain tolerance ranged from 120% to 315%, in compar- ison to their own pre-exposure levels. The authors stated that MMW therapy can potentially be used as a supplementary or alternative treatment for pain.
III. CLINICAL TRIALS OF THE MMW THERAPY
The first clinical trials of MMW therapy began in the U.S.S.R. in 1977. Nowadays, the method has been officially recognized
by the Russian Ministry of Health and is used widely. It was claimed that by 1995 over 3 million people received MMW therapy at more than a thousand specialized centers as well as at regular hospitals [31].
The term "MMW therapy" implies repetitive local exposures of certain body areas to low-intensity MMW's, which can be used as a monotherapy or combined with other therapeutic procedures and drugs. The body area to be exposed, exposure schedule, regimen, and radiation frequency are determined by the physician based on the disease and the condition of the par- ticular patient. The radiation intensity is usually considered as a less important variable. For most diseases, the daily exposure varies from 15 to 60 min, and the therapy lasts for 8-15 days.
Publications on the clinical use of MMW's are counted by hundreds. While many of these reports were flawed in one way or another, still others were not and involved all necessary at- tributes, such as placebo control and double-blind protocol, and a lot of matching results have been provided by independent groups of investigators. Many authors have claimed that MMW monotherapy was more effective (sometimes, far more effec- tive) than conventional methods, such as drug therapy. In some cases, MMW has helped patients who had already tried all other known therapies without success, and were considered incur- able. At the same time, MMW seldom caused any adverse ef- fects or allergies. MMW in combination with drug therapy fa- cilitated favorable effects and/or reduced adverse side effects of drugs.
The most common applications of MMW's are for gastric and duodenal ulcers (about 25% of studies); cardiovascular diseases, including angina pectoris, hypertension, ischemic heart disease, infarction (about 25%); respiratory sicknesses, including tuberculosis, sarcoidosis, bronchitis, asthma (about 15%); and skin diseases, including wounds, trophic ulcers, burns, atopic dermatitis (about 10%). Isolated studies claimed successful MMW treatment for asthenia, neuralgia, diabetes mellitus, osteochondrosis, acute viral hepatitis, glomeru- lonephritis, alcoholism, etc. MMW's were also used for alleviation of toxic effects of chemotherapy in cancer patients, and in preventive medicine and health resort therapy.
In most cases, physicians use specialized MMW generators, which are produced commercially by the medical equipment in- dustry. Because of the high demand, there are now more than 100 models of medical MMW generators on the market in the former U.S.S.R. and some other European countries [7]. The most commonly used frequencies are 42.19 and 53.53 GHz, and 59-63 GHz band (7.1-, 5.6-, and 4.9-mm wavelengths). Alter- natively, the practitioner may select an effective frequency for each patient based on this patient's individual sensitivity (this method is called "microwave resonance therapy" [32], [33]). The radiation intensity usually is about 10 mW/cm2, but can be as low as several /xW/cm2. MMW radiation can be applied to biologically-active or acupuncture points, sternum and xiphoid process, skin projection of a diseased organ, large joints and tender zones.
With all the variety of exposure techniques and protocols cur- rently in use by medical practitioners, there is little rationale or guidance why particular techniques and protocols would be pre- ferred over the others. Mechanisms of the MMW therapy are not understood, and its use remains predominantly empirical.
38 IEEE TRANSACTIONS ON PLASMA SCIENCE, VOL. 28. NO. I, FEBRUARY 2000
The format of this paper allows us to exemplify only several clinical studies with MMW therapy. More information on the subject can be found in other reviews [7], [8].
Poslavsky et al. [34] used MMW's as a monotherapy in 317 patients with gastric and duodenal ulcers. The disease duration was from several months to more than ten years, and the ulcer defect diameter ranged from 0.3 to 3.5 cm. The epigastric area was exposed at 10 mW/cm2, 53.53 GHz, for 30 min daily ex- cluding weekends, until complete ulcer healing. A comparable control group of 50 patients received conventional drug therapy. The ulcers cicatrized in 95.3% of MMW-treated patients, with mean healing duration of 19.8 ± 0.45 days. Results in the con- trol group were substantially worse, namely 78% and 33.6 ± 1.12 days, respectively. The ulcer relapse rate was also signifi- cantly lower after the MMW therapy.
Korpan and Saradeth [35] used MMW therapy to assist healing of postoperative septic wounds. This double-blind controlled trial included 141 patients, 31- to 83-years old, with purulent wounds after an abdominal surgery. MMW therapy with 1 mW/cm2, 37-GHz radiation was performed in 71 patients. Wound surface and adjacent tissues were exposed for 30 min/day for seven days. The remaining 70 patients received placebo therapy from a similar but defective MMW generator (neither patients nor physicians knew it was defective). Radical surgical cleaning of the wounds was performed regularly in both groups. The MMW-treated patients showed 1.8 times more rapid wound clearance (5.6 ± 0.6 versus 10.2 ± 0.5 days in controls), wound granulation and epithelization also began substantially earlier. The mean daily decrease of wound surface area in the treated patients was twice that of the controls (7.1% versus 3.2%), and, on the average, the MMW-treated patients were discharged from the hospital 8.9 days earlier. The authors concluded that low intensity MMW radiation is a promising means to assist purulent wound treatment.
Novikova et al. [36] included MMW's in a complex therapy for pulmonary tuberculosis. Fifty patients received drug therapy only, and 86 patients were additionally treated with MMW's. Before the MMW course, blood samples were taken from each patient, and the phagocytic activity of white cells was analyzed in an assay with a nitric blue tetrazolium dye. This activity usu- ally was increased, up to threefold over the norm. The samples were exposed to 7.1 -, 6.4-, and 5.6-mm radiations, and the wave- length that normalized phagocytosis was chosen for the therapy. In fact, 5.6-mm radiation increased the deviation from the norm, and therefore was never chosen. The wavelength of 6.4 mm was effective mostly in younger patients with mild disease course; 7.1 mm was more appropriate for older patients with more pro- nounced disorders. Intermittent exposure at 7.1 mm was used for the most severe cases. Exposures of the thymus projection area lasted for 10 days, at 40 or 60 min/day. MMW's significantly facilitated recovery, particularly in patients with newly devel- oped disease. Resolution of infiltrations and closure of caverns in 70% of these patients occurred within one month of treatment. In the control group, infiltrations resolved in about two months and caverns closed in three to four months. The clearance of tu- berculosis bacteria was achieved in two months in 50% of the exposed group, but in only 29% of the controls.
In a similar study [37] with 54 pulmonary tuberculosis pa- tients, the caverns closed in 50% of the exposed group during
the second and the third months of treatment, while in controls it always took more than three months. Resolution of infiltrations occurred within two weeks in 70% of the exposed group, but always took more than one month in controls. However, clear- ance of tuberculosis bacteria was apparently unaffected by the MMW course.
Babov etal [38] studied the efficacy of MMW's (59-63 GHz, 7 mW/cm2) in the rehabilitation of patients after myocardial in- farction. The course of MMW therapy started 15-20 days after the infarction and consisted of 15 exposures of the cardiac area for 15 min/day. Eighty six patients were treated with MMW's and 80 patients received placebo. The results were analyzed sep- arately for patients with eukinetic, hyperkinetic, and hypoki- netic types of blood circulation. MMW's significantly facili- tated tissue repair in the group with the eukinetic type of circu- lation. Cardiac muscle repolarization improved in 100% of the MMW-treated patients and in 48.8% of placebo controls; phys- ical endurance increased by 25.8 ± 2.2 W and 18.7 ± 1.8 W, respectively. MMW's, but not placebo, improved microcircu- lation and ventricular contraction, and stimulated cicatrization and collagen formation. The MMW effect was weaker in pa- tients with hyperkinetic circulation and negligible in those with the hypokinetic circulation. Results of the study suggested that, in the case of eukinetic circulation, MMW's can be employed as a monotherapy, otherwise it should be combined with other rehabilitation means.
IV. CONCLUSION
At present time, development of MMW technologies is driven predominantly by various industrial and military appli- cations. However, there is another lesser known, but rapidly developing and promising area of MMW biomedical applica- tions. Numerous studies point to the specific ability of MMW's to affect and modify various biological functions, many of those being of great importance for human organism function. More than 20-year experience with MMW therapy in countries of the former Soviet Union has yielded encouraging results in a broad spectrum of diseases. Today, MMW therapy gains recognition in Europe (Bulgaria, Germany), and its first clinical trials are in progress in the United States (headed by Dr. M. Ziskin, Center for Biomedical Physics, Temple University, Philadelphia, PA). A cooperative effort of biological, physical, and engineering communities is necessary to achieve an understanding the physical and physiological mechanisms of MMW bioeffects.
ACKNOWLEDGMENT
The authors greatly appreciate interest in the topic and sup- port from the organizers of the ElectroMed99 First International Symposium (Prof. K. Schoenbach). The views expressed are those of the authors and should not be construed as reflecting the official policy or position of the Department of the Army, Department of the Air Force, or the U.S. Government.
REFERENCES
[1] H. Fröhlich, "The biological effects of microwaves and related ques- tions," Adv. Electronics Electron. Phys., vol. 53, pp. 85-152, 1980.
[2] H. Fröhlich, Ed., Biological Coherence and Response to External Stimuli. New York: Springer-Verlag, 1988.

PAKHOMOV AND MURPHY: LOW-INTENSITY MMW'S AS A NOVEL THERAPEUTIC MODALITY 39
[3] O. P. Gandhi, "Some basic properties of biological tissues for potential biomedical applications of millimeter-waves," J. Microwave Power, vol. 18, pp. 295-304, 1983.
[4] W. Grundier, "Biological effects of RF and MW energy at molecular and cellular level," in Biological Effects and Dosimetry of Nonionizing Radiation. Radiofrequency and Microwave Energies, A. Rindi, M. Grandolfo, and S. M. Michaelson, Eds. New York, NY: Plenum, 1983, pp. 299-318.
[5] Modulated fields and "window" effects. Handbook of Biological Ef- fects of Electromagnetic Fields, C. Polk and E. Postow, Eds., CRC, Boca Raton, FL, 1986, pp. 425^60.
[6] I. Ya. Belyaev, "Some biophysical aspects of the genetic effect of low-intensity millimeter waves," Bioelectrochem. Bioenerg., vol. 27, pp. 11-18, 1992.
[7] M. A. Rojavin and M. C. Ziskin, "Medical application of millimeter waves," Q. J. Med., vol. 91, pp. 57-66, 1998.
[8] A. G. Pakhomov, Y. Akyel, O. N. Pakhomova, B. E. Stuck, and M. R. Murphy, "Current state and implications of research on biological effects of millimeter waves: A review of literature," Bioelectromagnetics, vol. 19, pp. 393-413, 1998.
[9] W. Grundler, F. Keilman, and H. Froehlich, "Resonant growth rate re- sponse of yeast cells irradiated by weak microwaves," Phys. Lett., vol. 62A, pp. 463-466, 1977.
[10] W. Grundler, F. Keilman, V. Putterlik, and D. Strube, "Resonant-like de- pendence of yeast growth rate on microwave frequencies," Br. J. Cancer, vol. 45, pp. 206-208, 1982.
[11] W. Grundler, U. Jentzsch, F. Keilmann, and V. Putterlik, "Resonant cel- lular effects of low intensity microwave," in Biological Coherence and Response to External Stimuli, H. Fröhlich, Ed. New York: Springer- Verlag, 1988, pp. 65-85.
[12] W. Grundler and F. Kaiser, "Experimental evidence for coherent excita- tions correlated with growth," Nanobiology, vol. 1, pp. 163-176, 1992.
[13] L. Furia, D. W. Hill, and O. P. Gandhi, "Effect of millimeter-wave irra- diation on growth of Saccharomyces cerevisiae," IEEE Trans. Biomed. Eng., vol. BME-33, pp. 993-999, 1986.
[14] P. Gos. B. Eicher, J. Kohli, and W.-D. Heyer, "Extremely high frequency electromagnetic fields at low power density do not affect the division of exponential phase Saccharomyces cerevisiae cells," Bioelectromag- netics, vol. 18, pp. 142-155. 1997.
[15] I. Ya. Belyaev, Y. D. Alipov, V. A. Polunin, and V. S. Shcheglov, "Evi- dence for dependence of resonant frequency of millimeter wave interac- tion with Escherichia coli K12 cells on haploid genome length," Electro- and Magnetobiol, vol. 12, pp. 19-V), 1993.
[16] 1. Ya. Belyaev, Y. D. Shcheglov, V. A. Alipov, and S. P. Radko, "Regular- ities of separate and combined effects of circularly polarized millimeter waves on E. coli cells at different phases of culture growth," Bioelec- trochem. Bioenerg., vol. 31, pp. 49-63, 1993.
[17] I. Ya. Belyaev, Y. D. Shcheglov, V. A. Alipov, V. S. Polunin, and O. A. Aizenberg, "Cooperative response of Escherichia coli to the resonance effect of millimeter waves at super low intensity," Electro- and Magne- tobiol., vol. 13, pp. 53-66, 1994.
[18] I. Ya. Belyaev, Y. D. Shcheglov, V. A. Alipov, and V. S. Polunin, "Reso- nance effect of millimeter waves in the power range from !0~19 to 3 x 10⁻³ W/cnv2 on Escherichia coli cells at different concentrations," Bio- electromagnetics, vol. 17, pp. 312-321, 1996.
[19] A. A. Kataev, A. A. Alexandrov, L. L. Tikhonova, and G. N. Berestovsky, "Frequency-dependent effects of the electromagnetic millimeter waves on the ion currents in the cell membrane of Nitellopsis: Nonthermal ac- tion," Biofizika, vol. 38, pp. 446-462, 1993.
[20] A. G. Pakhomov, H. K. Prol, S. P. Mathur, Y. Akyel, and C. B. G. Camp- bell, "Search for frequency-specific effects of millimeter-wave radiation on isolated nerve function," Bioelectromagnetics, vol. 18, pp. 324-334, 1997.
[21 ] , "Frequency-specific effects of millimeter wavelength electromag- netic radiation in isolated nerve," Electro- and Magnetobiol., vol. 16, pp. 43-57, 1997.
[22] , "Role of field intensity in the biological effectiveness of millimeter waves at a resonance frequency," Bioelectrochem. Bioenerg., vol. 43, pp. 27-33, 1997.
[23] A. B. Gapeev, N. K. Chemeris, E. E. Fesenko, and R. N. Khramov, "Res- onance effects of a low-intensity modulated EHF field. Alteration of the locomotor activity of the protozoa Paramecium caudatum," Biofizika, vol. 39, pp. 74-82, 1994.
[24] V. S. Zemskov, N. N. Korpan, la. 1. Khokhlich, V. A. Pavlenko, L. S. Nazarenko, A. I. Koval'chuk, and la. 1. Stefanishin, "Effect of millimeter-band low intensity electromagnetic radiation on the course of wound healing," Klin. Kliir., vol. 1, pp. 31-33, 1988.
[25] N. N. Korpan, K.-L. Resch, and P. Kokoschinegg, "Continuous mi- crowave enhances the healing process of septic and aseptic wounds in rabbits," J. Surg. Res., vol. 57, pp. 667-671, 1994.
[26] L. I. Kolosova, G. N. Akoev, V. D. Avelev, O. V. Riabchikova, and K. S. Babu, "Effect of low-intensity millimeter wave electromagnetic radi- ation on regeneration of the sciatic nerve in rats," Bioelectromagnetics, vol. 17, pp. 44-47, 1996.
[27] L. I. Kolosova, G. N. Akoev, O. V. Riabchikova, and V. D. Avelev, "The effect of low-intensity millimeter-range electromagnetic radiation on the functional recovery of the damaged sciatic nerve in rat," Fiziol. Zh. Im. I. M. Sechenova, vol. 82, pp. 85-90, 1996.
[28] M. A. Rojavin and M. C. Ziskin, "Anaesthesia caused by ketamine and chloral hydrate in mice," Int. J. Radiat. Biol., vol. 72, pp. 475-480,1997.
[29] M. A. Rojavin, A. Cowan, A. A. Radzievsky, and M. C. Ziskin, "An- tipruritic effect of millimeter waves in mice," Pharmacol. Lett., vol. 63, pp. PL 251-257, 1998.
[30] A. A. Radzievsky, M. A. Rojavin, A. Cowan, and M. C. Ziskin, "Sup- pression of pain sensation caused by millimeter waves: A double blind, crossover, prospective human volunteer study," in Anesthesia and Anal- gesia, 1999. in press.
[31] N. N. Lebedeva and O. V. Betskii. "Application of low intensity mil- limeter waves in medicine," in Abstr. 17th Annu. Meet. Bioelectromag- netics Sot:, Boston, MA, June 1995, p. 141.
[32] S. R. Danilenko, "Efficacy of the use of extremely-high-frequency elec- tromagnetic field in the complex therapy of chronic bronchitis patients," Vopr. Kurortol. Fizioter. Lech. Fiz. Kult., vol. 6, pp. 16-18, 1997.
[33] E. B. Kan and T. D. Nikula, "The effect of microwave resonance therapy and hypnotherapy on some factors of ulcerative disease pathogenesis," Vrach. Delo, vol. 6, pp. 79-83, 1992.
[34] M. V. Poslavsky, I. M. Korochkin, and O. F. Zdanovich, "Experience with application of millimeter-range radiation for treatment and prophy- lactics of stomach and duodenal ulcer," Vopr. Kurortol. Fizioter. Lech. Fiz. Kult., vol. 4, pp. 31-36, 1989.
[35] N. N. Korpan and T. Saradeth, "Clinical effects of continuous mi- crowave for postoperative septic wound treatment: A double-blind controlled trial," Amer. J. Surg., vol. 170, pp. 271-276, 1995.
[36] L. N. Novikova, G. O. Kaminskaia, and L. N. Efimova, "Significance of the functional state of blood phagocytes in the choice of optimal regime of EHF therapy of patients with pulmonary tuberculosis," Probl. Tu- berk., vol. 6, pp. 17-20, 1995.
[37] A. G. Khomenko, V. I. Chukanov, and L. N. Novikova, "Effectiveness of chemotherapy combined with ultrahigh-frequency electromagnetic radi- ation for the treatment of patients with pulmonary tuberculosis," Probl. Tuberk., vol. 4, pp. 2-4, 1994.
[38] K. D. Babov, S. A. Novikov, and L. E. Mikhno, "Effect of electromag- netic waves with 59-63 GHz frequency on myocardial infarct patients in the subacute stage," Vopr. Kurortol. Fizioter. Lech. Fiz. Kult., vol. 6, pp. 10-13, 1993.
Andrei G. Pakhomov was born in Sverdlovsk, Russia, in 1960. He received the M.S. degree in animal and human physiology from the Moscow State University in 1982, and the Ph.D. degree in radiation biology from the Medical Radiology Research Center, Obninsk, Russia, in 1989.
He was a leading Research Scientist at the Medical Radiology Research Center until receiving a Resident Research Associateship Award from the National Research Council in 1994. The next three years he spent at Brooks AFB, San Antonio,
TX, as an NRC Research Associate with the U.S. Army Medical Research Detachment (USAMRD) of the Walter Reed Army Institute of Research. He is currently a Senior Research Physiologist with McKessonHBOC BioServices (Brooks AFB, TX), which is a USAMRD contractor for studying biological and health effects of electromagnetic fields. His primary research interests are in the area of microwave bioeffects in excitable tissues (nerve, muscle, heart), mechanisms of action, health hazards and beneficial (e.g., therapeutic) effects of the radiation. He also collaborates with Information Ventures, Inc., Philadelphia, PA, in reviewing and abstracting research papers for the Electromagnetic Field (EMF) Database, and has processed over 1000 papers.
Dr. Pakhomov is a member of the Bioelectromagnetics Society (BEMS) and of the IEEE Standards Coordinating Committee (IEEE SCC28).

40 IEEE TRANSACTIONS ON PLASMA SCIENCE, VOL. 28, NO. I. FEBRUARY 2000
Michael R. Murphy (A'93) received the Ph.D. degree in psychology and brain science from the Massachusetts Institute of Technology (MIT), Cambridge, in 1972.
Currently, he is the Chief of the Radio Frequency Radiation Branch, Directed Energy Bioeffects Divi- sion, Human Effectiveness Directorate, AirForce Re- search Laboratory, Brooks AFB, TX. The organiza- tion he leads is responsible for assessing human ex- posure standards and conducting biological research to support the maximal safe exploitation of radio fre-
quency radiation for the national defense. He has authored over 120 research publications, book chapters, abstracts, and technical reports.
Dr. Murphy is a member of EMBS and is actively involved with IEEE Standard Coordinating Committee 28 on Non-Ionizing Radiation, for which he serves on the Executive Committee and as Chair of the Subcommittee on International Liaisons. He is the Chair of the Tri-Service Electromagnetic Ra- diation Panel and the Defense Reliance Technology Panel on Directed Energy Weapons High Power Microwave Technology Working Group on Bioeffects. He is a member of the International Advisory Committee for the World Health Organization project on the hazards of electromagnetic fields and his Branch is a Collaborating Center of the World Health Organization and the Pan American Health Organization on the Biological Effects of Electromagnetic Radiation. He is also an active member of the Bioelectromagnetics Society.

Bioelectromagnetics 20:431 -439 (1999)
Hyperactivity Caused by a Nitric Oxide Synthase Inhibitor is Countered by Ultra-Wideband Pulses
Ronald L Seaman,* Michelle L. Belt, Joanne M. Doyle, andSatnam P. Mathur
McKesson BioServices and Microwave Bioeffects Branch, U.S. Army Medical Research Detachment, Brooks AFBJexas
Potential action of ultra-wideband (UWB) electromagnetic field pulses on effects of N°-nitro- L-arginine methyl ester (L-NAME), an inhibitor of nitric oxide synthase (NOS), on nociception and locomotor activity was investigated in CF-1 mice. Animals were injected IP with saline or 50 mg/kg L-NAME and exposed for 30 min to no pulses (sham exposure) or UWB pulses with electric field parameters of 102 ± 1 kV/m peak amplitude, 0.90 ± 0.05 ns duration, and 160 ± 5 ps rise time (mean ± S.D.) at 600/s. Animals were tested for thermal nociceptive responses on a 50 °C surface and for spontaneous locomotor activity for 5 min. L-NAME by itself increased mean first- response (paw lift, shake, or Uck; jump) and back-paw-lick response latencies and mean locomotor activity. Exposure to UWB pulses reduced the L-NAME-induced increase in back-paw-lick latency by 22%, but this change was not statistically significant. The L-NAME-induced hyperactivity was not present after UWB exposure. Reduction and cancellation of effects of L-NAME suggest activation of opposing mechanism(s) by the UWB pulses, possibly including increase of nitric oxide production by NOS. The action, or actions, of UWB pulses appears to be more effective on locomotor activity than on thermal nociception in CF-1 mice. Bioelectromagnetics 20:431-439, 1999. © 1999 Wiley-Liss, Inc.
Key words: L-NAME; hyperactivity; locomotor activity; CF-1 mice; nociception; UWB electromagnetic pulses
INTRODUCTION
Ultra-wideband (UWB) electromagnetic field pulses are increasingly being used in various military and civilian applications [Agee et al., 1998]. The extremely short electromagnetic pulses have durations of a few nanoseconds and rise times of 100-500 ps. Their propagation is by means of electric and magnetic fields with frequency spectra extending from near 0 Hz into the GHz range dependent on pulse shape.
Studies have been conducted on possible biolo- gical effects of UWB pulses because of possible health and safety issues. An exposure of 2 min or less causes no effect on blood pressure and heart rate or on certain behaviors [Sherry et al., 1995; Walters et al., 1995; Jauchem et al., 1998, 1999]. An exposure of 6 min causes hypotension in rats that persists for at least 4 weeks [Lu et al., 1998]. Longer exposures weakly influence morphine-induced antinociception and changes in locomotor activity in mice [Seaman et al., 1998]. Additional information on UWB biological effects is needed for different types of pulses, exposure durations, and biological endpoints for a more complete basis for developing guidelines for human exposure.
Because of the broad frequency spectra of UWB pulses, biological endpoints that have been shown to change with exposure to weak electric or magnetic fields of low frequencies may also be affected by UWB pulses. Examples of such effects are changes in nociception, stress- and morphine-induced antinoci- ception (analgesia), and morphine-altered locomotor activity due to low-intensity magnetic fields [Kavaliers et al., 1994; Lai, 1994]. A 0.5 Hz rotating magnetic field reduces morphine- and stress-induced analgesia in CF-1 mice, and morphine- and stress-induced
Contract grant sponsor: U.S. Army Medical Research and Materiel Command; Contract grant number: DAMD17-94-C- 4069 awarded to McKesson BioServices.
The views, opinions, and/or findings contained in this report are those of the authors) and should not be construed as an official Department of the Army position, policy, or decision unless so designated by other documentation.
♦Correspondence to: Dr. Ronald L. Seaman, McKesson BioSer- vices, P.O. Box 35460, Brooks AFB, TX 78235-5460. E-mail: ronald.seaman @ aloer.brooks.af.mil
Received for review 13 October 1998; Final revision received 4 January 1999
) 1999 Wiley-Liss, Inc.

432 Seaman et al.
hyperactivity in C57BL/J mice [Kavaliers and Ossen- kopp, 1985, 1986]. Morphine-induced analgesia in CF-1 mice is also reduced by 60 Hz magnetic fields and electromagnetic fields used in magnetic resonance imaging (MRI) [Ossenkopp and Kavaliers, 1987; Prato et al., 1992]. A static magnetic field reduces stress- induced analgesia in CD-I mice [Betancur et al., 1994]. In a land snail model of nociception, a 0.5 Hz rotating magnetic field, 60 Hz magnetic fields, and MRI fields also reduce analgesic behavior induced by opiate agonists [Kavaliers and Ossenkopp, 1988; Tysdale et al., 1991; Prato et al., 1992]. On the other hand, exposure to certain pulsed magnetic fields can induce an analgesia-like antinociception in the snail [Thomas et al., 1997b], increase opioid-induced analgesia in the snail [Thomas et al., 1997a], and increase the response threshold to electrical shock in rats [Fleming et al., 1994]. Antinociception is also seen in the snail after exposure to 60 Hz fields [Kavaliers and Ossenkopp, 1993].
In addition to these effects in rodents and snails, magnetic fields with multiple frequency components of less than 0.1 Hz reduce stress-induced analgesia in pigeons [Del Seppia et al., 1995] and humans [Papi et al., 1995; Sartucci et al., 1997]. In a study with UWB pulses, we have found that exposures of 15, 30, and 45 min consistently tend to increase morphine-induced analgesia in CF-1 mice, although changes are not statistically significant [Seaman et al., 1998]. Mor- phine-induced hypoactivity in the same animals tends to be reduced with UWB exposure.
Recently, nitric oxide has been implicated in opioid-induced analgesia and in its reduction by 60 Hz magnetic fields in the snail model [Kavaliers et al., 1998]. The enhanced analgesia observed is consistent with the role of nitric oxide in morphine-induced analgesia seen when using thermal or mechanical stimuli in mice [Brignola et al., 1994; Dambisya and Lee, 1995; Güney et al., 1998] treated systemically. Similar results have been obtained for morphine- induced analgesia [Yamaguchi and Naito, 1996] and stress-induced analgesia [Spinella and Bodnar, 1994] in rats. In these studies on rodents, inhibitors of nitric oxide synthase (NOS) increase the level of analgesia. Because NOS inhibitor NG-nitro-L-arginine methyl ester (L-NAME) increases opioid-induced analgesia in the snail [Kavaliers et al., 1998], similar effects on vertebrate and invertebrate nociception are indicated. L-NAME also blocks reduction of analgesia due to magnetic field exposure in the snail, suggesting that increased nitric oxide levels participate in the action of the field [Kavaliers et al., 1998].
Nitric oxide is also involved in normal nocicep- tion as well as in locomotor activity. Antinociception is
caused in mice by L-NAME [Moore et al., 1991, Mustafa, 1992; Babbedge et al., 1993; Brignola et al., 1994; Sakurada et al., 1996] and other NOS inhibitors [Moore et al, 1993; Handy et al., 1996]. NOS inhibitors reduce locomotor activity in mice [Calignano et al., 1993; Dzoljic et al, 1997; Volke et al., 1997] and rats [Connop et al, 1994; Sandi et al., 1995; Volke et al., 1997]. In addition, an inhibitor can overcome morphine-induced increases in activity [Calignano et al., 1993]. This last result suggests that altered levels of nitric oxide might also be involved in the reduction of morphine- and stress-induced hyper- activity seen with magnetic fields [Kavaliers and Ossenkopp, 1985, 1986].
Given the above roles of nitric oxide in nocicep- tion and locomotion, investigating its role in mediating the effects of electromagnetic fields on these behaviors becomes of interest. We examined whether the electromagnetic fields of UWB pulses would change the effects of L-NAME on nociception and activity. Action of the fields on NOS might contribute to the weak UWB effects seen on morphine-induced analge- sia and hypoactivity in CF-1 mice [Seaman et al., 1998].
MATERIALSAND METHODS
Animals
Male CF-1/Plus white mice (Charles River Labs, Portage, MI) weighing 30-49 g and 9-13 weeks of age were used. After a 10-day quarantine, the mice were housed in polycarbonate shoe box cages in a room having 22 ± 1 °C temperature, 50 ± 5% relative humidity, and 10-15 hourly air exchanges. Animals were housed three to a cage and were provided Purina rodent chow and tap water ad libitum. All exposures and tests were done 7-10 h after lights were put on in a 12/12 light/dark cycle.
Animals were injected D? with 0.9% saline or 50 mg/kg ^-nitro-L-afginine methyl ester HC1 (L- NAME; Sigma-Aldrich, St. Louis, MO) in saline (5 mg/ml, 10 ml/kg). The L-NAME dose was based on results of preliminary experiments showing changes in nociception, morphine-induced antinociception, and activity in CF-1 mice having many of the same characteristics seen in other mouse strains. The results indicated that use of NOS inhibitor L-NAME at 50 mg/kg in CF-1 mice was a valid approach.
In conducting this research, the investigator(s) adhered to the "Guide for the Care and Use of Laboratory Animals," prepared by the Committee on Care and Use of Laboratory Animals of the Institute of Laboratory Animal Resources, National Research

UWB and L-NAME 433
Council (NIH Publication No. 86-23, Revised 1985). The U.S. Air Force Research Laboratory (AFRL) at Brooks Air Force Base is fully accredited by the Association for Assessment and Accreditation of Laboratory Animal Care, International (AAALAC). All animal procedures had been approved by the AFRL-Brooks Institutional Animal Care and Use Committee.
Nociception and ActivityTests
Nociception was tested by placing the animal on a metallic surface heated by circulating water to 50 ±0.1 °C. The animal was within an upright, open 14.5-cm diameter cylinder made of clear plastic. Latency to a first response to the heated surface and latency to licking a back paw were measured by an observer by using a stopwatch. First responses were lifting, shaking, or licking a paw or jumping. If a first response did not occur before back-paw licking, the back-paw latency was also assigned to the earlier response. The animal was removed from the heated surface after ricking a back paw. Standard laboratory procedure was to remove an animal after 160 s if a back paw was not yet licked and to assign this value to the latency. However, this condition did not occur in the experiment with L-NAME and UWB pulses.
Spontaneous locomotor activity was tested by placing the animal in a 38.5 cm x 38.5 cm arena with 24-cm walls for 5 min with room lights off. Animal movement interrupted 10 light beams, 5 in each horizontal direction. The number of beam interrup- tions was counted under computer control for each minute of the test and used to indicate level of activity.
UWB Exposure
Animals were exposed to UWB pulses in a custom-built giga-transverse electromagnetic (GTEM) cell originally constructed by Sandia National Labora- tories (Albuquerque, NM). The cell, a tapered two- conductor transmission line with a square cross- section, was positioned so that one ground plane wall was horizontal. A modified RG-220 coaxial cable connected the center conductor of the GTEM cell to a source of high voltage. Ionization of nitrogen in a center-conductor gap in the cable generated UWB pulses in the GTEM cell with electric field vector directed from center conductor to ground conductor. Two four-inch speakers outside the GTEM cell provided broadband noise for auditory masking of UWB system operation.
An EG&G ACD(A) D-dot probe mounted in the wall of the GTEM cell was used to detect UWB pulses during animal exposures. The signal from the probe was sampled with 0.01-ns resolution by a Tektronix
SCD 5000 Transient Digitizer. Each digitized wave- form, representing the average of 200 individual pulses, was stored and later processed by using a correction algorithm [Bao, 1997] to give pulse electric field vs. time. The pulses were triggered by an external pulse generator at 600/s. The UWB pulses used in this experiment had 102±lkV/m peak amplitude, 0.90 ± 0.05 ns duration, and 160 ±5 ps rise time (mean ± S.D.). Specific absorption rate (SAR) of these pulses at 600/s was estimated to be 37 mW/kg.1 For sham exposure, no pulses were triggered (0/s).
Animals were exposed in a holder made from clear plastic placed in the GTEM cell on the horizontal ground plane. The holder consisted of an upright cylinder with 0.32-cm walls and 12.1-cm internal diameter, a floor of four concentric loops of 0.63-cm plastic rod, and a plastic cover. The top portion of the holder containing the animal measured 4.6 cm between the raised floor and the cover. The animal was 3.8 cm above the ground plane, a distance sufficient to prevent contact between the animal's tail and the ground plane. Animals exhibited normal spontaneous behavior while in the well-ventilated holder.
Procedure
Animals were assigned in sequence to one of the four UWB/L-NAME conditions, with all conditions delivered randomly in a block before their next delivery. Twenty animals were tested for each of the following conditions: sham/saline, sham/NAME, UWB/saline, UWB/NAME. An animal was first injected IP with 0.9% saline or 50 mg/kg L-NAME in saline. The animal was then placed in a holder and positioned in the GTEM cell for sham exposure (0/s) or exposure to UWB pulses at 600/s, both types of exposure lasting 30 min. At the end of exposure, the animal was taken from the GTEM cell and the holder and was tested for nociception. At the end of nociception testing, the animal was placed without delay into the arena for measuring spontaneous locomotor activity.
'Estimates of whole-body SAR were made by W.D. Hurt (Radiofrequency Radiation Division, Air Force Research Labora- tory, Brooks AFB) by using the power spectrum of the corrected UWB pulse electric field and the frequency-dependent normalized SAR (in W/kg per mW/cm2) for a prolate spheroidal model of a medium-sized mouse [Durney et al., 1986]. The integral of the product of these two functions in the frequency domain was multiplied by the ratio of pulse duration to repetition period (duty cycle) to obtain an SAR value. The average of results for k- and H-polarizations of the animal was used to account for movement of the animal.

434 Seaman et al.
The sound level in the GTEM cell at the location of the animal holder was checked daily with a Realistic 33-2055 sound level meter, and the broadband noise was adjusted, if necessary, to 74-75 dBA. Low- frequency magnetic fields were also measured daily with a Dexsil Magnum 310 three-axis digital gauss- meter at three locations: the home cage in the laboratory, near the GTEM cell, and immediately above the heated surface device. The measured magnetic fields were 0.004-0.088, 0.004-0.048, and 0.004-0.060 uT at the respective locations, with similar results when using the 60 Hz and 40-310 Hz settings of the meter. Background low-frequency fields in the laboratory were thus less than 0.1 uT (1 mG).
Data Analysis
Two-way analysis of variance (ANOVA) was performed separately on first-response latency, back- paw latency, and total activity, each with factors (levels) of exposure (sham and UWB) and L-NAME (saline and NAME). Three-way ANOVA was per- formed on the time profile of activity with exposure, L- NAME, and minute of test as factors with repeated measures on minute of test. Significant effects in ANOVAs were further investigated by using pair-wise comparisons in Newman-Keuls testing. Statistical tests were performed by using GB-STAT software (Dynamic Microsystems, Silver Spring, MD) with a significance level of P<.05 in all tests.
RESULTS
Nociception
Response latencies on the heated surface are shown in Figure 1. Mean first-response latency, measured in all animals, increased with L-NAME by similar amounts for both sham and UWB exposures. Mean back-paw-lick latency also increased with L- NAME for both exposure conditions, with the increase for UWB being smaller than that for sham. Back paw latency was obtained from only 17 animals in sham/ NAME and UWB/NAME due to persistent jumping of three animals in each of these groups. For each latency, means for saline-injected animals were nearly the same for sham and UWB exposures. The larger means for L-NAME-injected animals were slightly smaller for UWB.
ANOVA indicated no significant interaction of exposure and L-NAME for first-response latency nor back-paw-lick latency (F(l,76) < 1 and F(l,70) = 1.48, P=.227, respectively) as well as no significant main effect of UWB (F(l,76) = 1.19, P=.279 and F(l,70) = 3.34, P=.072, respectively). The main
80
70
60
ST 50
40
3 30
20
10
0
o c
c=i Saline ^^a NAME
First Response
20 20
20 i 20 20
H Li!
Back Paw Lick
17
17
20
1 Ul Sham UWB Sham UWB
Exposure Condition
Fig. 1. Response latency (mean ± SEM) on the heated surface of first response and back paw lick. Numbers above bars are respec- tive sample sizes.
effect of L-NAME was significant for both laten- cies (F(l,76) = 20.16, P<.0001; F(l,70) = 28.73, P<.0001). For each latency, Newman-Keuls testing showed significant differences in mean latency between saline and NAME for each type of exposure (F<.01 for sham and P<.05 for UWB). For back- paw-lick latency, means for sham/NAME and UWB/ NAME were also significantly different (F<.05).
Activity
Total activity and activity during each minute of the test, measured in all animals, are shown in Figure 2. For sham exposure, an increase of about 20% appeared in total activity and in activity for individual minutes with L-NAME. For UWB expo- sure, the total activity and activity for the minutes of test changed in the opposite direction, i.e., they were smaller with L-NAME. For all four conditions, activity generally declined during the test except for minutes 1-3 of UWB/NAME.
ANOVA indicated a significant UWB-L-NAME interaction (F(l,76) = 12.20, P=.0008) and a signifi- cant main effect of UWB (F(l,76) = 5.67, F = 0.02), whereas the main effect of L-NAME was not significant (F(l,76) = 1.29, F=.260). ANOVA indi- cated a significant main effect of minute of test (F(4,304) = 12.51, P< .0001), reflecting the decline in activity over time during the test. Interaction between L-NAME and minute of test and between UWB and minute of test were not significant (F(4,304)<1) as was the UWB-L-NAME-minute of test interaction (F(4,304) = 1.52, P = 0.195). Newman-Keuls testing of mean total activity showed that the UWB effect was due to a significant difference between means for

UWB and L-NAME 435
Total Activity 1000
m c o "S. Z2
& C
E CO a>
CD
Sham
Activity by Minute of Test
UWB
200
£ 150 ,o Q. E j§ 100
E TO a>
CD 50
Shann/Saline, N=20 UWB/Saline, N=20 Sham/NAME, N=20 UWB/NAME, N=20
12 3 4 5
Minute
Fig. 2. Total activity (above) and activity by minute of test (below) as number of light-beam interruptions (mean ± SEM). Numbers above bars are respective sample sizes.
sham/NAME and UWB/NAME. The mean for UWB/ NAME was not significantly different from means for sham/saline and UWB/saline. Newman-Keuls testing also showed that means were different for minutes 1-3 (P< .01) and minute 5 (P< .05) between sham/NAME and UWB/NAME, whereas no difference was found between means for respective minutes for sham/saline and UWB/saline.
DISCUSSION
The NOS inhibitor L-NAME was antinociceptive (analgesic) in the CF-1 mice for both measures of thermal nociception tested. Latencies to both first response and back paw lick were increased signifi- cantly for both exposure conditions (Fig. 1). This finding is consistent with findings in studies that used
other mouse strains and measures of nociception with L-NAME [Moore et al., 1991; Mustafa, 1992; Babbedge et al., 1993; Sakurada et al., 1996] and with other NOS inhibitors [Moore et al., 1993; Babbedge et al., 1993; Handy et al., 1996].
Exposure for 30 min to 0.9-ns, 102-kV/m UWB pulses at 600/s in this study did not significantly affect normal nociception nor the L-NAME-induced changes in nociception. A lack of UWB effect on normal nociception had previously been seen for CF-1 mice as well as C57BL/6 mice [Seaman et al., 1998]. The smaller mean back-paw-lick latency with L- NAME in UWB-exposed animals (UWB/NAME) is 22% smaller than the mean latency with L-NAME and sham exposure (sham/NAME). This reduction is in the direction indicating decreased analgesia with UWB pulses, but the probability of .072 for a main effect of UWB did not meet the significance criterion. However, the means for sham/NAME and UWB/NAME laten- cies were different in the Newman-Keuls test (P< .05). The reduction in response latency after UWB exposure is opposite to the additional increase in morphine- increased latency after similar exposure [Seaman et al., 1998].
The dose of 50 mg/kg L-NAME increased mean spontaneous locomotor activity by 22% in sham- exposed CF-1 mice (Fig. 2). Increases in activity were also seen for 25 and 50 mg/kg L-NAME doses in a preliminary experiment. This finding is opposite from the decreased activity reported for other mouse strains and rats with L-NAME and other NOS inhibitors summarized in the Introduction section. However, we note that CF-1 mice exhibit a decrease in activity 30 min after 7.5 mg/kg morphine sulfate [Seaman et al., 1998] instead of the hyperactivity seen in other mouse strains [Cowan, 1993]. The difference in activity responses are likely attributable to strain differences, effective-dose differences, or both. Mor- phine and L-NAME at these doses, thus, seem to have opposite effects on activity, possibly indicating some kind of opposing CNS action(s), rather than the same respective effect across strains and species. We also note that L-NAME is reported not to change activity or not to change all measures of activity for rats at 10 and 30 mg/kg [Sandi et al., 1995; Johansson et al., 1997]; Swiss mice at 1, 10, and 30 mg/kg [Calignano et al., 1993; Brignola et al., 1994]; and LACA mice at 50 and 75 mg/kg [Moore et al., 1991; Babbedge et al., 1993]. In addition, other NOS inhibitors exhibit a dose- dependent effect on activity [Connop et al., 1994; Volke et al., 1997]. Thus, the increase in CF-1 mice activity might have also been partly a result of the dose used. Indeed, in a preliminary experiment, 75 mg/kg L-NAME decreased CF-1 locomotor activity, which is

436 Seaman et al.
more consistent with the change reported for rats and other strains of mice.
Spontaneous locomotor activity was not changed by L-NAME when animals were exposed to UWB pulses for 30 min in this study (Fig. 2). The mean total activity for this combined condition was not different from totals for animals without both UWB exposure and L-NAME and for animals with only UWB exposure. The reduction in activity level is opposite to the increase in morphine-decreased activity with UWB pulses [Seaman et al., 1998]. The reduction represents an effective cancellation of L-NAME- induced hyperactivity by the UWB exposure and is similar in general pattern to back-paw-lick latency in Figure 1. Information on the type and site of opposing action can be drawn from studies on nitric oxide.
Nitric oxide is produced by NOS in many types of cells, including neurons in the CNS and endothelial cells in the peripheral circulation [Bredt and Snyder, 1994]. L-NAME inhibits both neuronal NOS and endothelial NOS. Smaller amounts of nitric oxide, an endogenous vasodilator, resulting from inhibition of endothelial NOS causes smaller vessel diameter that leads to decreased local blood flow and increased blood pressure [Moore et al., 1991; Wang et al., 1995; Handy et al., 1996; Hu et al., 1997; Yamamoto et al., 1998]. However, the effects of L-NAME on nocicep- tion and locomotor activity seen here are most likely due to actions in the central nervous system (CNS).
A number of arguments can be made that increased blood pressure was not a direct or indirect mediator of the antinociception and hyperactivity observed with L-NAME. First, reduced blood flow could conceivably compromise heat removal from the feet, so that a given thermal stimulus would cause a greater increase in local temperature that would be reflected as an increased thermal sensitivity to the stimulus. However, the analgesia observed with L- NAME represents decreased sensitivity, thus indicat- ing only minor, if any, influence of reduced blood flow. Second, application of L-NAME directly to CNS sites causes antinociception [Moore et al., 1991; Babbedge et al., 1993; Yamaguchi and Naito, 1996]. Third, systemic delivery of inhibitors specific for neuronal NOS cause antinociception without changing blood pressure [Moore et al., 1993; Handy et al., 1996] as well as reduce activity [Connop et al., 1994; Dzoljic et al., 1997; Volke et al., 1997; Maren, 1998] in a way similar to L-NAME [Calignano et al., 1993; Sandi et al., 1995], indicating that L-NAME action on neuronal NOS is sufficient. Fourth, dissociation of nociceptive and locomotive effects of L-NAME from its pressor effects is further indicated in studies in
which L-NAME has been reported not to change nociception [Dambisya and Lee, 1995; Pavone et al., 1997; Güney et al., 1998; Handy and Moore, 1998] or activity [Moore et al., 1991; Babbedge et al, 1993; Calignano et al., 1993; Brignola et al., 1994] at all doses tested. An argument that inhibitors of NOS affect central mechanisms for cardiovascular control that are linked to nociception systems [Ghione, 1996; Guasti et al., 1998] can be made, but this also constitutes a CNS action. Actions of L-NAME to change nociception and activity in the present study, thus, were not on endothelial cells, but were on CNS neurons, where UWB pulses might have their greatest effect in opposing L-NAME action. This can be further pursued by using an inhibitor specific for neuronal NOS, such as 7-nitroindazole, in experiments similar to the one presented here.
The increases in back-paw-lick latency and locomotor activity with L-NAME were reduced by UWB exposure, significantly so for activity. Reduction in L-NAME effect is consistent with an increase in nitric oxide resulting from UWB exposure that compensates for a reduction due to NOS inhibition. This action would likely be the most effective if located at the CNS site of inhibition by L-NAME. For nociception, this is possibly within the spinal cord [Sakurada et al., 1996], which has been proposed to be the site of a tonic "pronociceptive" action of nitric oxide [Machelska et al., 1997]. Evidence for increased production of nitric oxide has been found in murine macrophages exposed to similar UWB pulses [Seaman et al., 1996]. Evidence for increased nitric oxide levels in neural tissue has been reported for homogenate of rat cerebellum exposed to modulated 10 MHz fields [Miura et al., 1993] and rat hippocampal slices exposed to magnetic fields at 1 and 60 Hz [Bawin et al., 1996]. Nitric oxide in the spinal cord is also involved in morphine-induced analgesia [Yamaguchi and Naito, 1996; Machelska et al., 1997] such that inhibition of NOS enhances the analgesia. Thus, one might expect that increased production of nitric oxide would lead to the opposite effect: a reduction in analgesia. As summarized in the Introduction section, this is the direction of change seen across species in a large majority of experiments with low-frequency magnetic fields. This proposed action of electromag- netic fields to increase nitric oxide levels is consistent with the finding that increased nitric oxide is associated with reduction of opioid-induced analgesia by 60 Hz magnetic fields in the land snail [Kavaliers et al., 1998]. Of course, other sites of action and other compensating mechanisms are also possible.
For CF-1 mice exposed to UWB pulses in the present study, effects seem to be greater for CNS

UWBandL-NAME 437
components involved in locomotion than in nocicep- tion. Trends of UWB pulses to reduce response latency in thermal nociception and lecomotor activity in animals treated with L-NAME were opposite in direction to previously observed trends of UWB pulses to increase the same measures in animals treated with morphine [Seaman et al., 1998]. Assuming increased levels of nitric oxide after UWB exposure, this is consistent with the existence of a nitric oxide- mediated inhibition or offset of morphine-induced changes in respective neural pathways in the CF-1 mouse. This is, of course, compatible with previous work described in the Introduction section showing (1) an increase in nitric oxide and reduction in analgesia after exposure to low-frequency fields, and (2) the effect of NOS inhibitors to enhance morphine-induced analgesia.
With assumptions of pulse propagation in a transverse electromagnetic mode and wave impedance of 377 ohms, the peak magnetic field of an UWB pulse in the GTEM cell was estimated to be about 0.33 mT. This was 2 to 3 orders of magnitude larger than the background low-frequency fields in the laboratory. The time-averaged value was much smaller, about 0.2 nT, based on the small on-off ratio of about 6 • 10-7. The peak UWB magnetic field amplitude is within the range of 0.05-9.0 mT that was effective in changing nociception, analgesia, and activity in studies with static and low-frequency magnetic fields in mice and snails, as summarized in the Introduction section. It is also similar to the 0.1 mT (100 uT) peak values for effective pulsed magnetic fields. The peak amplitude is larger than the 0.02-0.07 mT (0.2-0.7 G) multiple- frequency fields that affect nociception in pigeons and humans [Del Seppia et al., 1995; Papi et al., 1995; Sartucci et al., 1997]. One possible explanation for the weakness of UWB effect on analgesia and activity seen here is the small amplitude of the time-averaged electromagnetic fields and the resulting small ampli- tudes of low-frequency spectral components known to be effective.
ACKNOWLEDGMENT
We are grateful to Duane Cox for design and construction of animal holders and heated surface device.
REFERENCES
Agee FJ, Baum CE, Prather WD, Lehr JM, O'Loughlin JP, Burger JW, Schoenberg JSH, Scholfield DW, Torres RJ, Hull JP, Gaudet JA. 1998. Ultra-wideband transmitter research. IEEE Trans Plasma Sei 26:860-873.
Babbedge RC, Hart SL, Moore PK. 1993. Anti-nociceptive activity of nitric oxide synthase inhibitors in the mouse: dissociation between the effect of L-NAME and L-NMMA. J Pharm Pharmacol 45:77-79.
Bao JZ. 1997. Picosecond domain electromagnetic pulse measure- ments in an exposure facility: an error compensation routine using deconvolution techniques. Rev Sei Instrum 68:2221- 2227.
Bawin SM, Satmary WM, Jones RA, Adey WR, Zimmerman G. 1996. Extremely-low-frequency magnetic fields disrupt rhythmic slow activity in rat hippocampal slices. Bioelec- tromagnetics 17:388-395.
Betancur C, Dell'Omo G, Alleva E. 1994. Magnetic field effects on stress-induced analgesia in mice: modulation by light. Neurosci Lett 182:147-150.
Bredt DS, Snyder SH. 1994. Nitric oxide: a physiologic messenger molecule. Annu Rev Biochem 63:175-195.
Brignola G, Calignano A, Di Rosa M. 1994. Modulation of morphine antinociception in the mouse by endogenous nitric oxide. Br J Pharmacol 113:1372-1376.
Calignano A, Persico P, Mancuso F, Sorrentino L. 1993. Endogenous nitric oxide modulates morphine-induced changes in locomotion and food intake in mice. Eur J Pharmacol 231:415-419.
Connop BP, Rolfe NG, Boegman RJ, Jhamandas K, Beninger RJ. 1994. Potentiation of NMDA-mediated toxicity on nigros- triatal neurons by a low dose of 7-nitro indazole. Neuropharmacology 33:1439-1445.
Cowan A. 1993. Effects of opioids on the spontaneous behavior of animals. In: Herz A, editor. Handbook of experimental pharmacology, 104/U: opioids II. Berlin: Springer-Verlag, pp 393-428.
Dambisya YM, Lee TL. 1995. Effects of L-N°-nitro arginine methyl ester (L-NAME), and L-N^monomethyl arginine (L-NMMA) and I^arginine on the antinociceptive effects of morphine in mice. Methods Find Exp Clin Pharmacol 17:577-582.
Del Seppia C, Ghione S, Luschi P, Papi F. 1995. Exposure to oscillating magnetic fields influences sensitivity to electrical stimuli. I. Experiments on pigeons. Bioelectromagnetics 16:290-294.
Durney CH, Massoudi H, Iskander MF. 1986. Radiofrequency radiation dosimetry handbook. Technical Report USAF- SAM-TR-85-73. Brooks Air Force Base, Texas: USAF School of Aerospace Medicine.
Dzoljic E, De Vries R, Dzoljic MR. 1997. New and potent inhibitors of nitric oxide synthase reduce motor activity in mice. Behav Brain Res 87:209-212.
Fleming JL, Persinger MA, Koren SA. 1994. Magnetic pulses elevate nociceptive thresholds: comparisons with opiate receptor compounds in normal and seizure-induced brain- damaged rats. Electromagnetobiol 13:67-75.
Ghione S. 1996. Hypertension-associated hypalgesia: evidence in experimental animals and humans, pathophysiological mechanisms, and potential clinical consequences. Hyper- tension 28:494-504.
Guasti L, Grimoldi P, Diolisi A, Petrozzino MR, Gaudio G, Grandi AM, Rossi MG, Venco A. 1998. Treatment with enalapril modifies the pain perception pattern in hypertensive patients. Hypertension 31:1146-1150.
Güney HZ, Görgün CZ, Tunctan B, Uludag O, Hodoglugil U, Abacioglu N, Zengil H. 1998. Circadian-rhythm-dependent effects of L-^-nitroarginine methyl ester (L-NAME) on morphine-induced analgesia. Chronobiol Int 15:283-289.

438 Seaman et al.
Handy RL, Moore PK. 1998. Effects of selective inhibitors of neuronal nitric oxide synthase carrageenan-induced mechanical and thermal hyperalgesia. Neuropharmacology 37:37-43.
Handy RL, Harb HL, Wallace P, Gaffen Z, Whitehead KJ, Moore PK. 1996. Inhibition of nitric oxide synthase by l-(2- trifluoromethylphenyl) imidazole (TRIM) in vitro: antino- ciceptive and cardiovascular effects. Br J Pharmacol 119: 423-431.
Hu CT, Chang KC, Wu CY, Chen HI. 1997. Acute effects of nitric oxide blockade with L-NAME on arterial haemodynamics in the rat. Br J Pharmacol 122:1237-1243.
Jauchem JR, Seaman RL, Lehnen HM, Mathur SP, Ryan KL, Frei MR, Hurt WD. 1998. Ultra-wideband electromagnetic pulses: lack of effects on heart rate and blood pressure during two-minute exposures of rats. Bioelectromagnetics 19:330-333.
Jauchem JR, Frei MR, Ryan KL, Merritt JH, Murphy MR. 1999. Lack of effects on heart rate and blood pressure in ketamine- anesthetized rats briefly exposed to ultra-wideband electro- magnetic pulses. IEEE Trans Biomed Eng 46:117-120.
Johansson C, Jackson DM, Svensson L. 1997. Nitric oxide synthase inhibition blocks phencyclidine-induced beha- vioural effects on prepulse inhibition and locomotor activity in the rat. Psychopharmacology 131:167-173.
Kavaliers M, Ossenkopp KP. 1985. Exposure to rotating magnetic fields alters morphine-induced behavioral responses in two strains of mice. Neuropharmacology 24:337-340.
Kavaliers M, Ossenkopp KP. 1986. Stress-induced opioid analgesia and activity in mice: inhibitory influences of exposure to magnetic fields. Psychopharmacology 89: 440-443.
Kavaliers M, Ossenkopp KP. 1988. Magnetic fields inhibit opioid- mediated "analgesic" behaviours of the terrestrial snail, Cepaea nemoralis. J Comp Physiol A 162:551-558.
Kavaliers M, Ossenkopp KP. 1993. Repeated naloxone treatments and exposures to weak 60-Hz magnetic fields have "analgesic" effects in snails. Brain Res 620:159-162.
Kavaliers M, Ossenkopp KP, Prato FS, Carson JJL. 1994. Opioid systems and the biological effects of magnetic fields. In: Frey AH, editor. On the nature of electromagnetic field interactions with biological systems. Austin, Texas: Landes, pp 181-194.
Kavaliers M, Choleris E, Prato FS, Ossenkopp KP. 1998. Evidence for the involvement of nitric oxide and nitric oxide synthase in the modulation of opioid-induced antinociception and the inhibitory effects of exposure to 60-Hz magnetic fields in the land snail. Brain Res 809: 50-57.
Lai H. 1994. Neurological effects of radiofrequency electromag- netic radiation. In: Lin JC, editor. Advances in electro- magnetic fields in living systems. Vol 1. New York: Plenum, pp. 27-80.
Lu ST, Mathur SP, Akyel Y, Lee JC. 1999. Ultra-wideband electromagnetic pulses induced hypotension in rats. Physiol Behav 65:753-761.
Machelska H, Labuz D, Przewlocki R, Przewlocka B. 1997. Inhibition of nitric oxide synthase enhances antinociception mediated by mu, delta and kappa opioid receptors in acute and prolonged pain in the rat spinal cord. J Pharmacol Exp Ther 282:977-984.
Maren S. 1998. Effects of 7-nitroindazole, a neuronal nitric oxide synthase (nNOS) inhibitor, on locomotor activity and con- textual fear conditioning in rats. Brain Res 804:155-158.
Miura M, Takayama K, Okada J. 1993. Increase in nitric oxide and cyclic GMP of rat cerebellum by radio frequency burst- type electromagnetic field radiation. J Physiol 461: 513-524.
Moore PK, Oluyomi AO, Babbedge RC, Wallace P, Hart SL. 1991. L-NG-nitro arginine methyl ester exhibits antinociceptive activity in the mouse. Br J Pharmacol 102:198-202.
Moore PK, Babbedge RC, Wallace P, Gaffen ZA, Hart SL. 1993. 7-nitro indazole, an inhibitor of nitric oxide synthase, exhibits anti-nociceptive activity in the mouse without increasing blood pressure. Br J Pharmacol 108: 296-297.
Mustafa AA. 1992. Mechanisms of L-NG-nitro arginine methyl ester induced antinociception in mice: A role for serotoner- gic and adrenergic neurons. Gen Pharmacol 23:1177-1182.
Ossenkopp KP, Kavaliers M. 1987. Morphine-induced analgesia and exposure to low-intensity 60-Hz magnetic fields: inhibition of nocturnal analgesia in mice is a function of magnetic field intensity. Brain Res 418:356-360.
Papi F, Ghione S, Rosa C, Del Seppia C, Luschi P. 1995. Exposure to oscillating magnetic fields influences sensitivity to electrical stimuli. I. Experiments on humans. Bioelectro- magnetics 16:294-300.
Pavone F, Capone F, Populin R, Przewlocka B. 1997. Nitric oxide synthase inhibitors enhance the antinociceptive effects of oxotremorine in mice. Pol J Pharmacol 49:31-36.
Prato FS, Kavaliers M, Ossenkopp KP, Carson JJL, Drost DJ, Frappier JRH. 1992. Extremely low frequency magnetic field exposure from MRI/MRS procedures. Ann NY Acad Sei 649:44-58.
Sakurada T, Sugiyama A, Sakurada C, Tan-No K, Yonezawa A, Sakurada S, Kensuke K. 1996. Effect of spinal nitric oxide inhibition on capsaicin-induced nociceptive response. Life Sei 59:921-930.
Sandi C, Venero C, Guaza C. 1995. Decreased spontaneous motor activity and startle response in nitric oxide synthase inhibitor-treated rats. Eur J Pharmacol 277:89-97.
Sartucci F, Bonfiglio L, Del Seppia C, Luschi P, Ghione S, Murri L, Papi F. 1997. Changes in pain perception and pain-related somatosensory evoked potentials in humans produced by exposure to oscillating magnetic fields. Brain Res 769: 362-366.
Seaman RL, Belt ML, Doyle JM, Mathur SP. 1998. Ultra- wideband electromagnetic pulses and morphine-induced changes in nociception and activity in mice. Physiol Behav 65:263-270.
Seaman RL, Kiel JL, Parker JE, Grubbs TR, Prol HK. 1996. Effects of ultra-wide-band pulses on nitric oxide production in murine macrophages. Abstracts of the Bioelectromagnetics Society Eighteenth Annual Meeting: 213.
Sherry CJ, Blick DW, Walters TJ, Brown GC, Murphy MR. 1995. Lack of behavioral effects in non-human primates after exposure to ultrawideband electromagnetic radiation in the microwave frequency range. Radiat Res 143:93-97.
Spinella M, Bodnar RJ. 1994. Nitric oxide synthase inhibition selectively potentiates swim stress antinociception in rats. Pharmacol Biochem Behav 47:727-733.
Thomas AW, Kavaliers M, Prato FS, Ossenkopp KP. 1997a. Antinociceptive effects of a pulsed magnetic field in the land snail, Cepaea nemoralis. Neurosci Lett 222:107-110.
Thomas AW, Kavaliers M, Prato FS, Ossenkopp KP. 1997b. Pulsed magnetic field induced "analgesia" in the land snail, Cepaea nemoralis, and the effects of u, 8, and K opioid receptor agonists/antagonists. Peptides 18:703-709.

UWB and L-NAME 439
Tysdale DM, Lipa SM, Ossenkopp KP, Kavaliers M. 1991. Inhibitory effects of 60-Hz magnetic fields on opiate- induced "analgesia" in the land snail, Cepaea nemoralis, under natural conditions. Physiol Behav 49:53-56.
Volke V, Soosaar A, Kööks S, Bourin M, Männistüo PT, Vasar E. 1997.7-Nitroindazole, a nitric oxide synthase inhibitor, has anxiolytic-like properties in exploratory models of anxiety. Psychopharmacology 131:399-405.
Walters TJ, Mason PA, Sherry CJ, Steffen C, Merritt JH. 1995. No detectable bioeffects following acute exposure to high peak power ultra-wide band electromagnetic radiation in rats. Aviat Space Environ Med 66:562-567.
Wang YX, Lim SL, Pang CCY. 1995. Increase by N°-nitro-L- arginine methyl ester (L-NAME) of resistance to venous return in rats. Br J Pharmacol 114:1454-1458.
Yamaguchi H, Naito H. 1996. Antinociceptive synergistic interac- tion between morphine and n^-nitro 1-arginine methyl ester on thermal nociceptive tests in the rat. Can J Anaesth 43:975-981.
Yamamoto T, Terada N, Seiyama A, Nishizawa Y, Akedo H, Kosaka H. 1998. Increase in experimental pulmonary metastasis in mice by L-arginine under inhibition of nitric oxide production by NG-nitro-L-arginine methyl ester. Int J Cancer 75:140-144.

ELSEVIER Neuroscience Letters 280 (2000) 183-186
Neuroscience Letters
www.elsevier.com/locate/neulet
Effects of acute systemic 3-nitropropionic acid administration on rat activity and acoustic startle
Ronald L Seaman* McKessonHBOC BioServices and Microwave Bioeffects Branch, US Army Medical Research Detachment, P.O. Box 35460,
Brooks AFB, TX 78235-5460, USA
Received 15 September 1999; accepted 20 December 1999
Abstract
Spontaneous activity, acoustic startle, and prepulse inhibition (PPI) of acoustic startle were measured in male Spra- gue-Dawley rats 3-6 h after 0,10,15, or 20 mg/kg i.p. 3-nitropropionic acid (3-NP), a mitochondrial toxin. Mean activity was significantly influenced by the 3-NP dose due to decreased activity for 20 mg/kg. Mean startle amplitude was not significantly affected by the 3-NP dose. Means of PPI for prepulses 6 and 12 dBA above background were smaller than means for respective 0 mg/kg doses, but the main effect of 3-NP dose did not reach statistical significance in ANOVA. The changes in measured exploratory-type activity and, possibly, in startle PPI parallel the occurrence of clinical signs exhibited at 3-5 h after 3-NP injection. Neural processing involved in these quantitative behavioral endpoints seems to be affected as energy stores are depleted and degenerative processes are beginning. © 2000 Elsevier Science Ireland Ltd. All rights reserved.
Keywords: 3-Nitropropionic acid; Locomotor activity; Acoustic startle; Behavior; Prepulse inhibition; Neurodegeneration
The succinate dehydrogenase (SDH) inhibitor 3-nitropro- pionic acid (3-NP) interferes with mitochondrial ATP synth- esis and can cause neurodegeneration involving oxidative- stress and excitotoxicity processes [2,19]. Multiple systemic administrations of 3-NP to rats over 3-30 days cause brain lesions (primarily in the caudate-putamen), increase gait variability and decrease locomotor activity [1,5,11,12,16].
Changes have also been noted to occur in the rat brain after a single 3-NP injection. These include decreased SDH 1-5 h after 25-30 mg/kg doses that lasts for 3-7 days [1,7,17]. Within 3 h after 20-30 mg/kg 3-NP, endogenous antioxidant activity changes in a number of brain regions [4] along with increases in free fatty acid content [3], peroxy- nitrite content [16] and /V-Methyl-D-aspartate (NMDA) receptor activity [19] in the striatum. Morphological changes in various sites have been reported at 3-6 h and at 1-7 d after 30 mg/kg [6,12,18]. Lesion formation in the striatum has been observed with MRI methods to begin 3- 4.5 h after 30 mg/kg i.v. [8].
Due to the biochemical and histological changes observed after single doses of 3-NP, one might expect
»Tel.: +1-210-536-5595; fax: +1-210-536-5382. E-mail address: [email protected]
(R.L. Seaman)
changes in behavior to occur within a short time after administration. Indeed, depending on dose level clinical signs are observed a few hours after a single dose [1,6,10,12]. However, few quantitative behavioral measures have been reported after only one or two doses of 3-NP. Rat locomotor activity is increased at 7 h after one and two injections of 10 mg/kg [5]. After two 20 mg/kg daily doses, rat acoustic startle amplitude is increased and the prepulse inhibition (PPI) of the startle is diminished at 7 days after the second dose, and amphetamine-induced stereotypy is reduced at 21 days [15].
As part of a project to study the influence of electromag- netic fields on neurodegeneration, we wished to establish an animal model, such as a single administration of 3-NP to the rat, which allows a single exposure to the fields to be made during ongoing degeneration processes. Since the striatum plays a major role in movement initiation and acoustic star- tle PPI [13,14], locomotor activity and the PPI were selected as behavioral endpoints that might be modified as a result of 3-NP action on the rat caudate-putamen. Due to the clinical signs as well as the altered brain chemistry and structure occurring within a few hours of injection, we decided to use a nominal interval of 3.5 h between injection and behavioral measurements.
A total of 52 male Sprague-Dawley rats (Charles River,
0304-3940/00/$ - see front matter © 2000 Elsevier Science Ireland Ltd. All rights reserved. Pll: S0304-3940(00)00790-4

184 R.L Seaman / Neuroscience Letters 280 {2000) 183-186
Portage) weighing 555 ± 58 g (mean ± SD) and 16-24 weeks of age (3.8-5.4 months, average 4.6 months) were tested. Single doses of 10, 15 and 20 mg/kg 3-NP (Sigma) were tested (1 ml/kg). Injection solutions were prepared in sterile distilled water with pH adjusted to 7.4 with 1 N NaOH. Sterile saline (1 ml/kg) was given for the 0 mg/kg control dose. Injections were administered i.p. 3-6 h after lights on in a 12/12 light/dark cycle.
Activity was tested by placing the animal in a clean 38.5 X 38.5 cm acrylic arena with 24 cm walls and ten light beams in the horizontal plane. The number of beam interruptions caused by animal movement was used as the measure of activity. Activity was measured the day before injection for 10 min to insure that pre-injection activity was not signifi- cantly different among the four dose groups. Three animals of an original 55 were excluded from use because of unaccep- tably low pre-injection activity levels. Post-injection activity was measured for 5 min starting 2.9-4.8 h (3.6 h average) after injection.
The whole-body startle response of an animal was measured after activity testing. An animal was placed in a clean cylindrical holder in a sound-attenuating chamber with light and fan on (San Diego Instruments, CA). A 23- min startle testing session began with a 5-min acclimation period with 70-dBA background noise. Three 40-ms star- tling noise bursts of 120 dBA were then presented and the results discarded. Subsequent startle trials were presented in seven iterations of five types of trials: no prepulse (0 dBA) and prepulses 1, 3, 6, or 12 dBA above background noise level. Each prepulse was a 20-ms noise burst deliv- ered 100 ms (onset to onset) before a 40-ms startling stimu- lus. Trial type was randomized within each iteration. Inter- trial intervals were randomized over all 38 trials and had a mean of 29 s. PPI was calculated for each animal for each prepulse intensity from respective averaged peak response amplitudes.
Data are plotted as means and standard errors of the means. Analysis of variance (ANOVA) and Newman- Keuls pair-wise comparisons were performed with GB- STAT software (v5.4, Dynamic Microsystems). A value of P < 0.05 was set as the criterion for statistical signifi- cance.
Animals that received 3-NP exhibited clinical signs of intoxication starting approximately 1.5 h after injection. Signs common to all doses included vacuous chewing, tremor, somnolence, and fixed gaze; these corresponded roughly to Stage I of the system used by Hamilton and Gould [10,12]. At the two higher doses these signs were followed by periods of staggering locomotion (Stage II) and then, in some cases, recumbency, postural rigidity, and rapid respiration (Stage III). Signs occurred earlier and more intensely for 20 mg/kg 3-NP, with animals that exhibited Stage III signs often not surviving. Survival rates of 100, 92,71, and 64% at 3.5 h for 0,10,15 and 20 mg/kg, respectively, resulted in fewer animals being available for testing at the higher doses.
700
600 -
CO § 500-1
§" 400 H aj
■S 300 H E | 200-1
100
0 0 10 15 20
3-NP Dose (mg/kg)
Fig. 1. Animal activity after 3-NP administration measured as number of light beam interruptions (mean and SEM). n = 12, 11.10, and 9 for 0,10,15, and 20 mg/kg 3-NP, respectively. *, P < 0.05 re 0 mg/kg and P < 0.01 re 10 mg/kg.
Fig. 1 shows number of beam interruptions recorded in the post-injection activity test with n = 12,11,10, and 9 for 0, 10, 15, and 20 mg/kg 3-NP, respectively. Mean activity for 10 mg/kg was larger than that for 0 mg/kg; mean activ- ities for 15 and 20 mg/kg were smaller. ANOVA showed a significant effect of 3-NP dose (F(3,38) = 3.85, P < 0.0168). Newman-Keuls tests showed that this was due to the mean number of interruptions for the 20 mg/kg dose being significantly smaller than the means for 0 and 10 mg/kg doses. However, the 20 mg/kg mean was not different from the 15 mg/kg mean. Means for 0, 10, and 15 mg/kg were not significantly different from one another.
Mean amplitude of the whole-body response to startling stimuli with no prepulse decreased with increased 3-NP dose but was not significantly different among dose groups (data not shown). Fig. 2 shows PPI for the four prepulse intensities and the 3-NP doses with n = 12, 11, 9, and 7 for 0, 10,15, and 20 mg/kg 3-NP, respectively. The inhibi- tion increased with prepulse intensity as expected, with all means for 1 and 3 dBA not being different from zero (t- tests). For 6 dBA mean PPI for the three non-zero 3-NP doses were 28-42%; for 12 dBA, 57-59%. These means were smaller than the two means for 0 mg/kg, 67 and 83%, respectively. Repeated measures ANOVA showed that interaction between prepulse intensity and 3-NP dose was not significant (F(9,105) = 1.09, P = 0.37). The ANOVA also indicated that the main effect of prepulse intensity was significant (F(3,105) = 54.9, P < 0.0001) but that the main effect of 3-NP dose (F(3,35) = 1.46, P = 0.24) was not Newman-Keuls tests showed that mean PPIs at 6 and 12 dBA were significantly larger than for 1 and 3 dBA for each dose except for the PPIs for 15 and 20 mg/kg at 6 dBA. However, the PPIs for 6 and 12 dBA were not significantly different across the four doses.
Given that clinical signs occurred to some degree after all three 3-NP doses, changes in the measured endpoints were not unexpected. All endpoints were more variable after 3-

R.L. Seaman /Neuroscience Letters 280 (2000) 183-186 185
3 6
Prepulse Intensity (ÖBA ^Qve background)
Fig. 2. Prepulse inhibition (in percent) of acoustic startle after 3- NP administration (mean and SEM) for four prepulse intensities. n = 12,11,9, and 7 for 0,10,15, and 20 mg/kg 3-NP, respectively.
NP, consistent with previously reported differences in animal susceptibility to this toxin [1,11,12,15]. An indica- tion of overall lowered energy during the testing is a previously reported decrease in body temperature of 1- 3°C 1-6 h after 30 mg/kg 3-NP s.c. [17]. The reduced mean spontaneous activity after 20 mg/kg 3-NP likely reflected a combination of lowered energy (SDH) levels and consequent short-term changes in neural processing. The lack of significant change in activity after 10 and 15 mg/kg 3-NP might indicate unaltered energy levels at the time of testing or effects of lowered energy and altered neural processing that offset each other.
The PPI of acoustic startle is more sensitive to sensori- neural changes than to neuromuscular effects of other toxins [9]. Hence, the tendency toward smaller, but statistically non-significant change in, PPI at 6 and 12 dBA was more likely due to alteration of the neural circuit subserving the PPI [14] than to muscle weakness. At 7 days after a second 20 mg/kg 3-NP dose, PPI of about 58% for prepulses of 4 and 5 dBA above background was found to be significantly smaller than control values (about 75%) for animals with gross striatal lesions [15]. Also, a similar difference was seen after two 15 mg/kg doses, which did not produce gross lesions. The tendency for reduced PPI here for 6 and 12 dBA prepulses is qualitatively similar to these previous results.
The results here for activity and startle are consistent with the primary site of 3-NP neurotoxicity being in the caudate- putamen, which is involved in movement initiation and star- tle PPI. Based on these results, the functioning of neural circuits underlying rat exploratory-type locomotor activity, and possibly acoustic startle PPI, appears to start changing
at or before 3.5 h after systemic administration of 3-NP, concurrent with reported early changes in brain chemistry and morphology.
B. Wohlfeld, M. Gonzalez, and E. Wood provided invalu- able technical support. J. DeLorge and G. Mastroianni provided helpful comments on the manuscript. N. Swerdlow gave advice on developing the acoustic startle test. This work is supported by the US Army Medical Research and Material Command under contract DAMD17-94-C-4069 awarded to McKessonHBOC BioServices. The views, opinions and/or findings contained in this report are those of the author(s) and should not be construed as an official Department of the Army position, policy or decision unless so designated by other documentation. In conducting research using animals, the investigator(s) adhered to the 'Guide for the Care and Use of Laboratory Animals' prepared by the Institute of Laboratory Animal Resources, National Research Council (Washington, DC: National Academy Press, 1996).
[1] Alexi, T., Hughes, P.E., Knusel, B. and Tobin, A.T., Meta- bolic compromise with systemic 3-nitropropionic acid produces striatal apoptosis in Sprague-Dawley rats but not in BALB/c ByJ mice. Exp. Neural., 153 (1998) 74-93.
[2] Alexi, T„ Hughes, P.E., Fault, R.L.M. and Williams, C.E., 3- Nitropropionic acid's lethal triplet: Cooperative pathways of neurodegeneration. NeuroReport, 9 (1998) R57-R64.
[3] Binienda, Z. and Kim, C.S., Increase in levels of total free fatty acids in rat brain regions following 3-nitropropionic administration. Neurosci. Lett., 230 (1997) 199-201.
14] Binienda, Z., Simons, C, Hussain, S., Slikker Jr, W. and Ali, S.F., Effect of acute exposure to 3-nitropropionic acid on activities of endogenous antioxidants in the rat brain. Neurosci. Lett., 251 (1998) 173-176.
[5] Borlongan, C.V., Koutouzis, T.K., Freeman, T.B., Cahill, D.W. and Sanberg, P.R., Behavioral pathology induced by repeated systemic injections of 3-nitropropionic acid mimics the motoric symptoms of Huntington's disease. Brain Res., 697 (1995) 254-257.
[6] Bossi, S.R., Simpson, J.R. and Isacson, 0„ Age dependence of striatal neuronal death caused by mitochondrial dysfunc- tion. NeuroReport, 4 (1993) 73-76.
[7] Brouillet, E., Guyot, M.C., Mittoux, V., Altairac, S., Conde, F., Palfi, S. and Hantraye, P., Partial inhibition of brain succi- nate dehydrogenase by 3-nitropropionic acid is sufficient to initiate striatal degeneration in rat. J. Neurochem., 70 (1998)794-805.
[8] Chyi, T. and Chang, C, Temporal evolution of 3-nitropro- pionic acid-induced neurodegeneration in the rat brain by T2-weighted, diffusion-weighted, and perfusion magnetic resonance imaging. Neuroscience, 92 (1999) 1035-1041.
[9] Crofton, K.M., Reflex modification and the detection of toxi- cant-induced auditory dysfunction. Neurotoxicol. Teratol., 12(1990)461-468.
[10] Gould, D.H., Wilson, M.P. and Hamar, D.W., Brain enzyme and clinical alterations induced in rats and mice by nitroa- liphatic toxicants. Toxicol. Lett., 27 (1985) 83-89.
111] Guyot, M.C., Hantraye, P., Dolan, R., Palfi, S., Maziere, M. and Brouillet, E., Quantifiable bradykinesia, gait abnormal- ities and Huntington's disease-like striatal lesions in rats chronically treated with 3-nitropropionic acid. Neuroscience, 79 (1997) 45-56.

186 R.L. Seaman / Neuroscience Letters 280 (2000) 183-186
[12] Hamilton, B.F. and Gould, D.H., Nature and distribution of brain lesions in rats intoxicated with 3-nitropropionic acid: A type of hypoxic (energy deficient) brain damage. Acta Neuropathol., 72 {1987) 286-297.
[13] Hauber, W., Involvement of basal ganglia transmitter systems in movement initiation. Prog. Neurobiol., 56 (1998) 507-540.
[14] Kodsi, M.H. and Swerdlow, N.R., Prepulse inhibition in the rat is regulated by ventral and caudodorsal striato-pallidal circuitry. Behav. Neurosci., 109 (1995) 912-928.
[15] Kodsi, M.H. and Swerdlow, N.R., Mitochondrial toxin 3- nitropropionic acid produces startle reflex abnormalities and striatal damage in rats that model some features of Huntington^ disease. Neurosci. Lett., 231 (1997) 103- 107.
[16] Matthews, R.T., Yang, L, Jenkins, B.G., Ferrante, R.J.,
Rosen, B.R., Kaddurah-Daouk, R. and Beal, M.F., Neuropro- tective effects of creatine and cyclocreatine in animal models of Huntington's disease. J. Neurosci., 18 (1998) 156-163.
[17] Nony, P.A., Scallet, A.C., Rountree, R.L., Ye, X. and Binienda, Z., 3-nitropropionic acid (3-NPA) produces hypothermia and inhibits histochemical labeling of succi- nate dehydrogenase (SDH) in rat brain. Metab. Brain Dis., 14 (1999) 83-94.
[18] Schmued, L.C. and Slikker Jr, W., Black-Gold: a simple, high-resolution histochemical label for normal and patho- logical myelin in brain tissue sections. Brain Res., 837 (1999) 289-297.
[19] WOller, U., Young, A.B., Penney, J.B. and Beal, M.F., 3- Nitropropionic acid toxicity in the striatum. J. Neurochem., 63 (1994) 1772-1781.

INT. J. RADIAT. BIOL 1999, VOL. 75, NO. 1, 115-120
Frequency of micronuclei in the blood and bone marrow cells of mice exposed to ultra-wideband electromagnetic radiation
VIJAYALAXMIt*, R. L. SEAMAN+, M. L. BELT+, J. M. DOYLE+, S. P. MATHUR+ and T.J. PRIHODA§
(Received 15 May 1998; accepted 18 August 1998)
Abstract. Purpose: To investigate the extent of genetic damage in the peripheral blood and bone marrow cells of mice exposed to ultra-wideband electromagnetic radiation (UWBR). Materials and methods: CF-1 male mice were exposed to UWBR for 15 min at an estimated whole-body average specific absorption rate of 37mWkg-1. Groups of untreated control and positive control mice injected with mitomycin C were also included in the study. After various treatments, half of the mice were killed at 18h, and the other half at 24 h. Peripheral blood and bone marrow smears were examined to determine the extent of genotoxicity, as assessed by the presence of micronuclei (MN) in polychromatic erythrocytes (PCE). Results: The percentages of PCE and the incidence of MN per 2000 PCE in both tissues in mice killed at 18 h were similar to the frequencies observed in mice terminated at 24 h. There were no significant differences in the percentage of PCE between control and the mice with or without UWBR exposure; the group mean values ( + standard deviation) were in the range of 3.1 ±0.14 to 3.2±0.23 in peripheral blood, and 49.0 + 3.56 to 52.3 + 4.02 in bone marrow. The mean incidence of MN per 2000 PCE in control and in mice with or without UWBR exposure ranged from 7.7 + 2.00 to 9.7+ 2.54 in peripheral blood and 7.4 + 2.32 to 10.0 + 3.27 in bone marrow. Pairwise compar- ison of the data did not reveal statistically significant differences between the control and mice with or without UWBR exposure groups (excluding positive controls). Conclusion: Under the experimental conditions tested, there was no evidence for excess genotoxicity in peripheral blood or bone marrow cells of mice exposed to UWBR.
1. Introduction
Electromagnetic devices capable of producing signals with pulse widths of a few nanoseconds and electric field amplitudes exceeding 100 OOOVm-1
♦Author for correspondence. | Department of Radiology, Division of Radiation Oncology,
and Center for Environmental Radiation Toxicology, The University of Texas Health Science Center at San Antonio, 7703 Floyd Curl Drive, San Antonio, TX 78284, USA. e-mail: [email protected]
J McKesson BioServices and Microwave Bioeffects Branch, US Army Medical Research Detachment, Brooks Air Force Base, San Antonio, TX 78235, USA.
§ Department of Pathology, The University of Texas Health Science Center at San Antonio, 7703 Floyd Curl Drive, San Antonio, TX 78284, USA.
are being considered in the USA and elsewhere for use in warfare settings, for example electronic coun- termeasures to identify and track incoming armour- piercing rounds that threaten ground vehicles (Fuerer 1991, Taylor 1991, Toevs etal. 1992). Ultra-wideband electromagnetic radiation (UWBR) in the radiofre- quency range is in this category of signal, and can be characterized as having a large band spread of up to 2 GHz, a rapid rise time of less than 0.2 ns, and a pulse duration of a few ns. It is conceivable that personnel could be exposed to such signals while operating and/or working in the vicinity of radar or communications-jamming equipment, and/or by similar friendly or enemy equipment (Sherry et al. 1995). Such potential exposure to UWBR raises issues related to possible bioeffects and/or possible human health hazards.
Recently, Albanese et al. (1994) described possible useful applications of ultra-short electromagnetic pulses in medical settings. These included electropor- ation, which would allow chemotherapeutic drugs to enter more readily and kill cancer cells, and the development of new techniques for imaging tissue structures. The authors also associated their theoret- ical considerations with undesirable health effects resulting from potential tissue damage mechanisms, including macromolecular conformation changes, alterations in chemical reaction rates, membrane effects and temperature-mediated adverse responses. Merritt et al. (1995) subsequently challenged most of these associations, and indicated the limited availabil- ity of experimental (biological) data. The small number of published scientific reports has not indi- cated any discernible physiological or behavioural change in rats and monkeys exposed to UWBR (Sherry et al. 1995, Walters et al. 1995).
The potential of UWBR exposure to induce gen- etic damage, if any, is important for risk assessment related to mutation and cancer induction. Recently, Pakhomova et al. (1997, 1998) reported an absence of mutagenic effects of UWBR exposure on the D7 strain of the yeast Saccharomyces cerevisiae. As far as is known, an examination of the genetic effects of
International Journal of Radiation Biology ISSN 0955-3002 print/ISSN 1362-3095 online © 1999 Taylor & Francis Ltd http://www.tandf.co.uk/JNLS/rab.htm
http://www.taylorandfrancis.com/JNLS/rab.htm
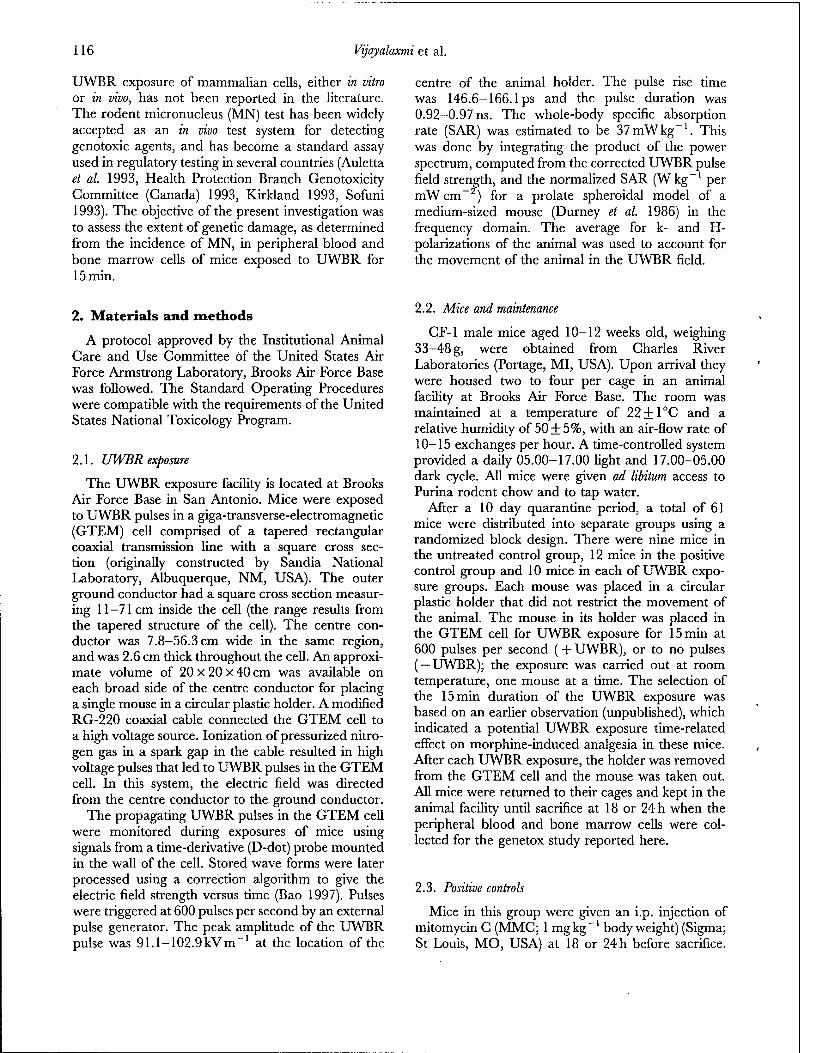
116 Vijayalaxmi et al.
UWBR exposure of mammalian cells, either in vitro or in vivo, has not been reported in the literature. The rodent micronucleus (MN) test has been widely accepted as an in vivo test system for detecting genotoxic agents, and has become a standard assay used in regulatory testing in several countries (Auletta et al. 1993, Health Protection Branch Genotoxicity Committee (Canada) 1993, Kirkland 1993, Sofuni 1993). The objective of the present investigation was to assess the extent of genetic damage, as determined from the incidence of MN, in peripheral blood and bone marrow cells of mice exposed to UWBR for 15 min.
centre of the animal holder. The pulse rise time was 146.6-166.1 ps and the pulse duration was 0.92-0.97 ns. The whole-body specific absorption rate (SAR) was estimated to be 37mWkg~'. This was done by integrating the product of the power spectrum, computed from the corrected UWBR pulse field strength, and the normalized SAR (W kg-1 per mWcm-2) for a prolate spheroidal model of a medium-sized mouse (Durney et al. 1986) in the frequency domain. The average for k- and H- polarizations of the animal was used to account for the movement of the animal in the UWBR field.
2. Materials and methods
A protocol approved by the Institutional Animal Care and Use Committee of the United States Air Force Armstrong Laboratory, Brooks Air Force Base was followed. The Standard Operating Procedures were compatible with the requirements of the United States National Toxicology Program.
2.1. UWBR exposure
The UWBR exposure facility is located at Brooks Air Force Base in San Antonio. Mice were exposed to UWBR pulses in a giga-transverse-electromagnetic (GTEM) cell comprised of a tapered rectangular coaxial transmission line with a square cross sec- tion (originally constructed by Sandia National Laboratory, Albuquerque, NM, USA). The outer ground conductor had a square cross section measur- ing 11-71 cm inside the cell (the range results from the tapered structure of the cell). The centre con- ductor was 7.8-56.3 cm wide in the same region, and was 2.6 cm thick throughout the cell. An approxi- mate volume of 20 x 20 x 40 cm was available on each broad side of the centre conductor for placing a single mouse in a circular plastic holder. A modified RG-220 coaxial cable connected the GTEM cell to a high voltage source. Ionization of pressurized nitro- gen gas in a spark gap in the cable resulted in high voltage pulses that led to UWBR pulses in the GTEM cell. In this system, the electric field was directed from the centre conductor to the ground conductor.
The propagating UWBR pulses in the GTEM cell were monitored during exposures of mice using signals from a time-derivative (D-dot) probe mounted in the wall of the cell. Stored wave forms were later processed using a correction algorithm to give the electric field strength versus time (Bao 1997). Pulses were triggered at 600 pulses per second by an external pulse generator. The peak amplitude of the UWBR pulse was 91.1-102.9kVm-1 at the location of the
2.2. Mice and maintenance
CF-1 male mice aged 10-12 weeks old, weighing 33-48 g, were obtained from Charles River Laboratories (Portage, MI, USA). Upon arrival they were housed two to four per cage in an animal facility at Brooks Air Force Base. The room was maintained at a temperature of 22 + 1 °C and a relative humidity of 50 + 5%, with an air-flow rate of 10-15 exchanges per hour. A time-controlled system provided a daily 05.00-17.00 light and 17.00-05.00 dark cycle. All mice were given ad libitum access to Purina rodent chow and to tap water.
After a 10 day quarantine period, a total of 61 mice were distributed into separate groups using a randomized block design. There were nine mice in the untreated control group, 12 mice in the positive control group and 10 mice in each of UWBR expo- sure groups. Each mouse was placed in a circular plastic holder that did not restrict the movement of the animal. The mouse in its holder was placed in the GTEM cell for UWBR exposure for 15 min at 600 pulses per second (+ UWBR), or to no pulses ( — UWBR); the exposure was carried out at room temperature, one mouse at a time. The selection of the 15 min duration of the UWBR exposure was based on an earlier observation (unpublished), which indicated a potential UWBR exposure time-related effect on morphine-induced analgesia in these mice. After each UWBR exposure, the holder was removed from the GTEM cell and the mouse was taken out. All mice were returned to their cages and kept in the animal facility until sacrifice at 18 or 24 h when the peripheral blood and bone marrow cells were col- lected for the genetox study reported here.
2.3. Positive controls
Mice in this group were given an i.p. injection of mitomycin C (MMC; 1 mgkg-1 body weight) (Sigma; St Louis, MO, USA) at 18 or 24 h before sacrifice.

Micronuclei in mice exposed to ultra-wideband electromagnetic radiation 117
MMC is a known clastogen that has been shown to induce MN (Heddle et al. 1984).
2.4. Peripheral blood and bone marrow smears
From each group, half of the mice were killed at 18 h, and the remaining half at 24 h. From each mouse, before sacrifice, a small drop of peripheral blood was collected on a clean microscope slide by snipping the end of the tail. A thin smear was made over an area of 2-3 cm by pulling the blood behind a coverglass held at a 45° angle. Following sacrifice, bone marrow from both femurs was flushed with 0.5 ml of foetal calf serum into a microfuge tube using a 1 ml syringe fitted with a 22 G needle. The cells were concentrated by gentle centrifugation at 600g for 1-3 min and a small drop of resuspended cells was placed on a clean microscope slide to make a smear as described above. All smears were air- dried, fixed in absolute methanol and stained using acridine orange.
Coded slides were examined under x 1000 magni- fication using a fluorescence microscope equipped with appropriate filters. Immature erythrocytes (PCE) were identified by their orange-red colour, mature erythrocytes by their green colour and the MN by their yellowish colour. For each mouse, 1000 erythro- cytes in peripheral blood and 200 erythrocytes in bone marrow were examined to obtain the percent- age of PCE. In addition, for each mouse, 2000 consecutive PCE were examined in peripheral blood and in bone marrow to determine the incidence of MN. Decoding of the slides was done after completing the microscopic analysis.
2.5. Statistical analysis
The statistical methods used were descriptive stat- istics of mean, standard deviation and analysis of variance of the groups used in the experiment. Pairwise multiple comparisons of individual means of different groups were done to compare the con- trols, + UWBR and -UWBR exposures, and MMC group for sacrifice times at 18 and 24 h. Residuals were analysed to determine whether the best skewness and kurtosis were with the raw data or the usual transformations for small percentages and for small frequency counts (Zar 1974). In addition, deleted residuals versus raw residuals were plotted to verify that no one observation had undue influence on the results. A final plot of residuals versus predicted values was used to verify normality of distribution, homogeneity of variance and lack of outliers, yielding a valid analysis.
3. Results
The mean percentages of PCE and the average incidence of MN per 2000 PCE for the mice in the control, + UWBR/ —UWBR-exposed and positive control groups (killed at 18 and 24 h) are shown in table 1.
3.1. Peripheral blood
The percentages of PCE in the control, + UWBR and -UWBR mice killed at 18 and 24h were all within the range of 3.1+0.14 to 3.2±0.23 {p = 0.1326 for the overall effect of UWBR). The positive control mice injected with MMC exhibited decreased percentages of PCE when killed at 18h (2.9 + 0.14) and at 24 h (2.6 + 0.17).
The frequencies of MN per 2000 PCE in control mice killed at 18 and 24h were 8.3 + 3.30 and 9.2 + 2.68, respectively. The indices for MN per 2000 PCE in + UWBR and -UWBR-exposed mice killed at 18 and 24 h were similar, ranging from 7.7 + 2.00
Table 1. The percentages of polychromatic erythrocytes (PCE) and the incidence of micronuclei (MN) in the peripheral blood and bone marrow cells of mice exposed to ultra- wideband electromagnetic radiation (UWBR) for 15 min.
Group
Group mean* Group mean % PCE MN per 2000 PCE (±SD) (±SD)
Peripheral blood
Mice sacrificed at Controls UWBR- UWBR + Mitomycin C
18 h after UWBR exposure 3.1 (0.17) 3.2 (0.23) 3.1 (0.17) 2.9(0.14)
8.3 (3.30) 7.7 (2.00) 9.7 (2.54)
99.2 (3.31)
Mice sacrificed at Controls UWBR- UWBR + Mitomycin C
24 h after UWBR exposure 3.1 (0.14) 3.2 (0.23) 3.1 (0.20) 2.6(0.17)
9.2 (2.68) 8.8 (2.20) 9.4 (2.88)
107.3 (8.07)
Bone marrow
Mice sacrificed at Controls UWBR- UWBR + Mitomycin C
18 h after UWBR exposure 49.0 (3.56) 51.4 (3.04) 51.2(2.61) 44.6 (3.07)
8.8 (2.06) 7.4 (2.32) 8.7 (2.00)
102.7 (9.09)
Mice sacrificed at Controls UWBR- UWBR + Mitomycin C
24 h after UWBR exposure 52.3 (4.02) 50.5 (3.55) 50.0(1.42) 42.3(2.14)
9.8 (2.86) 8.1 (2.28)
10.0 (3.27) 114.8(14.88)
* For each mouse, 1000 consecutive erythrocytes in the peri- pheral blood and 200 consecutive erythrocytes in the bone marrow were examined.

118 Vyayalaxmi et al.
to 9.7 + 2.54 (/> = 0.0975 for the overall effect of UWBR). The positive control mice treated with MMC exhibited a significantly increased incidence of MN per 2000 PCE when killed at both 18 h (99.2 + 3.31) and 24h (107.3 + 8.07) (/> = 0.0001).
3.2. Bone marrow
The percentages of PCE in control mice killed at 18 and 24 h were 49.0 + 3.56 and 52.3 + 4.02, respect- ively. In +UWBR and — UWBR-exposed mice, the percentage of PCE (at both times of sacrifice) ranged between 50.0+1.42 and 51.4 + 3.04 (/> = 0.705 for the overall effect of UWBR). The positive control mice exhibited a decrease in the percentage of PCE when killed at 18h (44.6 + 3.07) and at 24h (42.3 + 2.14).
The frequencies of MN per 2000 PCE in control mice killed at 18 and 24 h were 8.8 + 2.06 and 9.8 + 2.86, respectively. The indices for MN per 2000 PCE in +UWBR and -UWBR-exposed mice ter- minated at 18 and 24h ranged between 7.4 + 2.32 and 10.0 + 3.27 (/> = 0.072 for the overall effect of UWBR). The positive control mice treated with MMC exhibited significantly increased frequencies of MN per 2000 PCE when killed at both 18 h (102.7 + 9.09) and at 24h (114.8+14.88) (p = 0.0001).
4. Discussion
In mammals, during erythroblastosis, for a still unknown reason, the main nucleus is expelled and lagging chromosomal fragments and/or whole chro- mosomes that are not incorporated into daughter nuclei during cell division persist as easily recogniz- able micronuclei in immature erythrocytes (PCE). The first appearance of MN in PCE occurs 10-12 h after a clastogenic exposure. This lag period results from the time required for the erythroblast to divide, to expel its main nucleus to become the polychro- matic erythrocyte, and any mitotic delay induced by the genotoxic agent (Heddle et al. 1984). Once induced, the MN persists in the PCE for about 30 h (Jenssen and Ramel 1978). Hence, the clastogenic and/or aneugenic effect of a given treatment can be detected at any point during this time interval (Heddle et al. 1984). The main requirement of the treatment and/or sampling schedule is to obtain at least one sample at or near to the time of the maximum incidence of micronucleated PCE (MacGregor et al. 1987). In the present study, peri- pheral blood and bone marrow cells were examined at 18 and 24 h following UWBR exposure.
There were no significant differences in the
percentage of PCE between the controls and the + UWBR and —UWBR-exposed mice, and this indicates that the time required for nucleated erythro- poietic cells to become PCE is not altered by in vivo exposure of mice to +UWBR and —UWBR used in this study; a marked reduction in the frequency of PCE would have indicated that the division and maturation of the nucleated erythropoietic cells had been inhibited (MacGregor et al. 1987).
The incidence of MN observed in the bone marrow cells of control mice was comparable with values reported earlier for adult CF-1 mice (average of 4MN per 1000 PCE) (Okine et al. 1983). The influence of UWBR exposure on the incidence of MN per 2000 PCE in both the peripheral blood and bone marrow cells determined by pairwise analysis did not indicate significant differences between con- trol and +UWBR and -UWBR-exposed mice. In recendy published genetoxicity investigations, Pakhomova et al. (1997) observed no significant difference in the occurrence of chromosome recomb- inations, mutations and abnormal colonies (i.e. mitotic crossovers, segregations, revertants and con- vertants) between the UWBR-exposed and sham- exposed D7 strain of yeast Saccharomyces cerevisiae; in that study, the UWBR exposure was for 30 min, with a pulse repetition rate of 16-600 Hz, a pulse duration of 1.01-1.02 ns and a pulse rise time of 164—166 ps. This gives a bandwidth of 190% (Foster et al. 1995) and a peak electric field strength of 101 -104 kV m ~'. In a subsequent paper, the same authors reported no significant effect of similar UWBR exposure on the incidence of ultraviolet light- (UV; 2.25Jm-2
s_l and a total exposure of lOOJm-2) induced reciprocal and non-reciprocal recombination or mutagenesis, or on UV-induced cytotoxicity (Pakhomova et al. 1998).
Earlier investigations in rats, mice and monkeys exposed to UWBR did not demonstrate any altered physiological responses. Walters et al. (1995) reported no significant differences in a swimming performance test, in blood chemistry, or in the expression of c-fos protein in brain cells, between control rats and those exposed to UWBR for 2 min (pulse repetition rate 60 Hz, pulse duration 7-8 ns, bandwidth 0.25-2.5 GHz, peak E-field strength 250kVm~\ and far field equivalent peak power density of 1.7 x 10⁹ W cm-2). In a recent report, Jauchem et al. (1997) indicated no significant differences in heart rate and arterial blood pressure between UWBR- exposed (pulse repetition rate 1 kHz, pulse rise time 300 ps and E-field strength 21 kV m ~') and control rats. Sherry et al. (1995) exposed six monkeys to UWBR for 2 min (pulse frequency 60 Hz, pulse duration 5-10 ns, a total of 7200 pulses, bandwidth

Micronuclei in mice exposed to ultra-wideband electromagnetic radiation 119
100 MHz to 1.5 GHz, peak E-field strength of 250kVm"', and a whole-body SAR calculated to be 0.5mWkg_1). Each monkey was exposed to UWBR twice, with an interval of 6 days between exposures. The mean primate equilibrium platform performance for all monkeys after UWBR exposure was not different from that observed before each UWBR exposure. Seaman et al. (1998) reported that exposure of mice to UWBR for 30 min (60-600 pulses per second, pulse duration 1.0 ns, rise time 200 ps, pulse amplitude 100 kV m ~' and a calculated bandwidth of 184.3% (Foster et al. 1995)) did not result in significant changes in normal or morphine- induced nociception and locomotor activity. In con- trast, an in vitro exposure of murine macrophages to UWBR (with similar exposure conditions), under certain conditions of macrophage stimulation, resulted in an increase in the production of nitric oxide (Seaman et al. 1996).
The results from this investigation did not indicate excess genotoxicity in both peripheral blood and bone marrow cells of mice exposed to UWBR for 15 min.
Acknowledgements
This work was supported by the United States Army Medical Research and Material Command under contract DAMD17-94-C-4069 awarded to McKesson BioServices, and by the United States Air Force Office of Scientific Research grant No. F49620-95-1-0337. The authors thank T.-S. Lu for discussions on the estimate of SAR and and W. D. Hurt for SAR calculation.
The views, opinions and/or findings contained in this report are those of the authors and should not be construed as an official Department of the Army position, policy or decision unless so designated by other documentation.
In conducting the research using animals, the investigator(s) have adhered to the 'Guide for the Care and Use of Laboratory Animals' prepared by the Committee on Care and Use of Laboratory Animals of the Institute of Laboratory Animal Resources, National Research Council (NIH Publication # 86-23, Rev. 1985).
References
ALBANESE, R., BLASCHAK, J., MEDINA, R. and PENN, J., 1994, Ultrashort elecromagnetic signals: biophysical questions, safety issues, and medical opportunities. Aviation Space and Environmental Medicine, 65, A116-A120.
AULETTA, A. E., DEARFIELD, K. L. and CIMINO, M. C, 1993, Mutagenicity test schemes and guidelines: US EPA Office
of Pollution Prevention and Office of Pesticide Programs. Environmental and Molecular Mutagenesis, 21, 38-45.
BAO, J.-H., 1997, Picosecond domain electromagnetic pulse measurements in an exposure facility: an error compensa- tion routine using deconvolution techniques. Review of Scientific Instruments, 68, 2221-2227.
DURNEY, C. H., MASSOUDI, H. and ISKANDER, M. F., 1986, Radiofrequency Radiation Handbook, 4th edition, Report TR-85-73 (San Antonio, TX: USAF School of Aerospace Medicine, Brooks Air Force Base).
FOSTER, P. R., HALSEY, J. D. and HUSSAIN, G. M., 1995, Ultra-wideband antenna technology. In Introduction to Ultra-Wideband Radar Systems, edited by J. D. Taylor (Boca Raton, FL: CRC Press), pp. 145-286.
FUERER, D., 1991, Electronic countermeasures in wideband spectrum systems. In Propagation limitations for Systems Using Band Spreading, (Neuilly Sur Seine: AGARD) LS-172, pp. 1-11.
HEALTH PROTECTION BRANCH GENOTOXICITY COMMITTEE
(Canada), 1993, The assessment of mutagenicity: Health Protection Branch Mutagenicity Guidelines. Environmental and Molecular Mutagenesis, 21, 15-37.
HEDDLE, J. A., STUART, E. and SALAMONE, M. F., 1984, The bone marrow micronucleus test. In Handbook of Mutagenicity Test Procedures, edited by B. J. Kilbey, M. Legator, W. Nichols and C. Ramel (Amsterdam: Elsevier), pp. 441-457.
JAUCHEM, J. R., FREI, M. R., RYAN, K. L., MERRITT, J. H. and MURPHY, M. R., 1997, Lack of effects on heart rate and blood pressure in ketamine-anesthetized rats briefly exposed to ultrawideband electromagentic pulses. IEEE Transactions on Biomedical Engineering (in press).
JENSSEN, D. and RAMEL, C, 1978, Factors affecting the induction of micronuclei at low doses of X-rays, MMS and dimethyl- nitrosamine in mouse erythroblasts. Mutation Research, 58, 51-65.
KIRKLAND, D. J., 1993, Genetic toxicology testing requirements: official and unofficial views from Europe. Environmental and Molecular Mutagenesis, 21, 8-14.
MACGREGOR, J. T., HEDDLE, J. A., HITE, M., MARGOLIN, B. H., RAMEL, C, SALAMONE, M. F., TICE, R. R. and WILD, D., 1987, Guidelines for the conduct of micronucleus assays in mammalian bone marrow erythrocytes. Mutation Research, 189, 103-112.
MERRITT, J. H., KIEL, J. L. and HURT, W. D., 1995, Considerations for human exposure standards for fast- rise-time high-peak-power electromagnetic pulses. Aviation Space and Environmental Medicine, 66, 586-589.
OKINE, L. K. N., IOANNIDES, C. and PARKE, D. V., 1983, Studies on the possible mutagenicity of b-adrenergic blocker drugs. Toxicology Letters, 16, 167-174.
PAKHOMOVA, O. N., BELT, M. L., MATHUR, S. P., LEE, J. C. and AKYEL, Y., 1997, Lack of genetic effects of ultrawide- band electromagnetic radiation in yeast. Electro- and Magnetobiology, 16, 195-201.
PAKHOMOVA, O. N., BELT, M. L., MATHUR, S. P., LEE, J. C. and AKYEL, Y., 1998, Ultra-wide band electromagnetic radiation does not affect UV-induced recombination and mutagenesis in yeast. Bioelectromagnetics, 19, 128-131.
SEAMAN, R. L., BELT, M. L., DOYLE, J. M. and MATHUR, S. P., 1998, Ultra-wideband electromagnetic pulses and mor- phine-induced changes in nociception and activity in mice. Physiology and Behavior (in press).
SEAMAN, R. L., KIEL, J. L., PARKER, J. E., GRUBBS, T. R. and PROL, H. K., 1996, Effects of ultra-wide-band pulses on nitric oxide production in murine macrophages. Eighteenth

120 Micronuclei in mice exposed to ultra-wideband electromagnetic radiation
Annual Meeting of The Bioelectromagnetics Society (Frederick, MD, The Bioelectromagnetic Society), p. 213.
SHERRY, C. J., BLICK, D. W., WALTERS, T. J., BROWN, G. C. and MURPHY, M. R., 1995, Lack of behavioral effects in non-human primates after exposure to ultrawideband electromagnetic radiation in the microwave frequency range. Radiation Research, 143, 93-97.
SOFUNI, T., 1993, Japanese guidelines for mutagenicity testing. Environmental and Molecular Mutagenesis, 21, 2-7.
TAYLOR, J. D., 1991, Ultrawideband radar. IEEE International Microwaves Symposium Digest, MTT-S-1, 367-370.
TOEVS, J. W., SMITH, D. R, BYRNE, D. P. and Ross, G. F., 1992, UWB radar for ground vehicle self protection. IEEE International Microwaves Symposium Digest, MTT-S-3, 1492-1494.
WALTERS, T. J., MASON, P. A., SHERRY, C. J., STEFFEN, C. and MERRITT, J. H., 1995, No detectable bioeffects following acute exposure to high peak power ultra-wide band electromagnetic radiation in rats. Aviation Space and Environmental Medicine, 66, 562-567.
ZAR, J. H., 1974, Biostatistical Analysis (Englewood Cliffs, NJ: Prentice Hall).

^°% RETINAL EFFECTS OF HIGH PEAK POWER
MICROWAVES IN RHESUS MONKEYS
U.S. ARMY MEDICAL RESEARCH DETACHMENT NAVAL HEALTH RESEARCH CENTER DETACHMENT U.S. AIR FORCE RESEARCH LABORATORY
USAMRD WRAIR 9907 006 TX NHRC-DET 99-01 AFRL-HE-BR-TR-1999-0231
£jjfl K* TRI-SERVICE DIRECTED ENERGY BIOEFFECTS COMPLEX «r_ —Jv BROOKS AIR FORCE BASE
Approved for public release; distribution unlimited.

Technical Report Microwave Induced Retinal Effects
NOTICES
This research was in part supported by the U.S. Army Medical Research and Materiel Command under contract No. DAMD17-94-C-4069 with the McKesson BioServices, by funding from the Naval Medical Research and Development Command, Work Unit #63706.M00096, DN241243, by funding from the Air Force Research Laboratory Work Unit 7757B330, and by U.S. Air Force Contract #41624-96-C-9009 with Veridian.
When U.S. Government drawings, specifications, or other data are used for any purpose other than in connection with a definitely Government-related procurement, the United States Government incurs no responsibility or any obligation whatsoever. The fact that the government may have formulated or in any way supplied the said drawings, specifications, or other data, is not to be regarded by implication, or otherwise in any manner construed, as licensing the holder or any other person or corporation; or as conveying any rights or permission to manufacture, use, or sell any patented invention that may in any way to related thereto.
The views, opinions and/or finding contained in this report are those of the authors and should not be construed as an official Department of the Army, Navy, Air Force and Defense position, policy or decision unless so designated by other documentation.
The animals involved in this study were procured, maintained, and used in accordance with Federal Animal Welfare Act and the "Guide for the Care and Use of Laboratory Animals," prepared by the Institute of Laboratory Animal Resources ~ National Research Council.
Trade names of materials and/or products of commercial or nongovernmental organizations are cited as needed for precision. These citations do not constitute official endorsement or approval of the use of such commercial materials and/or products
Reproduction in whole or in part is permitted for any purpose of the United States Government.

Technical Report Microwave Induced Retinal Effects
CONTENTS
Notices i
Contents iii
Summary 1
1. Background 2
2. Material and Methods 9
2.1 Animal Model 9
2.2 General Procedures 9
2.3 Microwave Exposures 11
2.4 Exposure Facility 11
2.5 Ocular Thermometric Dosimetry 16
2.6 Electroretinogram 17
2.7 Fundus Photography, Fluorescein Angiography (FA) and Indocyanine Green Angiography (ICG) 19
2.8 Euthanization and Retinal Histopathology 20
2.9 Microdensitometry of the Optical Density of PAS Reaction 21
2.10 Body Temperature Measurements and Exposure Tolerance 21
3. Results 23
3.1 Dosimetry 23
3.2 Behavioral Responses and Signs of Intolerance During Microwave Exposure 25
3.3 Thermal Responses 26
3.4 Funduscopy 27
3.5 Angiography 28
m

Technical Report Microwave Induced Retinal Effects
3.6 Electroretinogram 30
3.6.1 Rod Response 34
3.6.2 Combined Rod and Cone Response 36
3.6.3 Oscillatory Potentials 36
3.6.4 30 Hz Flicker Response 39
3.6.5 Cone Response 39
3.6.6 Naka-Rushton Constants 44
3.7 Histopathology and Optical Density of PAS reactions 44
3.8 Special Cases, B06Z and 748Z 49
3.8.1 MonkeyB06Z 49
3.8.2 Monkey 748Z 51
4. Discussion 54
4.1 The Present Study 54
4.2 Effects in Current Experiment 54
4.2.1 Enhanced ERG Amplitudes 54
4.2.2 Enhanced PAS Reactivity 55
4.3 Kues'Results 57
4.4 SAR versus Peak-Power to Pulse-Length Ratio 57
4.5 Present Methods and Kues'Methods 59
4.5.1 Dosimetry 60
4.5.2 Ketamine 60
4.5.3 Fluorophotometry 61
4.5.4 Transportation 63
IV

Technical Report Microwave Induced Retinal Effects
4.6 Conclusion 63
5. References 64
6. Acknowledgement and Appendices 71
Acknowledgement 71
Appendix 1. Results of Ocular Dosimetry in A35Z 72
Appendix 2. Results of Ocular Dosimetry in A47Z 73
Appendix 3. ERG-Rod Response, b-wave Amplitude 74
Appendix 4. ERG-Rod Response, b-wave Implicit Time 76
Appendix 5. ERG-Combined Rod and Cone Response, b-wave Amplitude 78
Appendix 6. ERG-Combined Rod and Cone Response, b-wave Implicit Time 80
Appendix 7. ERG-Combined Rod and Cone Response, a-wave Amplitude 82
Appendix 8. ERG-Combined Rod and Cone Response, a-wave Implicit Time 84
Appendix 9. ERG-Oscillatory Pontentials 86
Appendix 10. ERG-30 Hz Flicker Amplitude 88
Appendix 11. ERG-Cone Response, b-wave Amplitude 90
Appendix 12. ERG-Cone Response, b-wave Implicit Time 92
Appendix 13. ERG-Cone Response, a-wave Amplitude 94
Appendix 14. ERG-Cone Response, a-wave Implicit Time 96
Appendix 15. Naka-Rushton Function Parameters of the ERG Scotopic b-waves 98
Appendix 16. Summary of Histopathologic Changes 102
Appendix 16A Histopathology (Sham) 104
Appendix 16B. Histopathology (4 W/kg) 105
Appendix 16C. Histopathology (8 W/kg) 106

Technical Report Microwave Induced Retinal Effects
Appendix 16D. Histopathology (20 W/kg) 107
Appendix 17. PAS Microdensitometry and Post-exposure ERG Photopic White b-wave Amplitude 108
Appendix 18. Normal Ranges for Standard Flash Electroretinogram in Rhesus Monkeys 109
Appendix 19. Necropsy Report (B06Z) 110
Appendix 20. Summary of Kues' Final Report 114
Appendix 21. Assessment of ERG Amplitude Reduction in Relation to Histopathologic Findings 116
VI

Technical Report Microwave Induced Retinal Effects
SUMMARY
This report summarizes the Tri-Services research efforts on the retinal effects of 1.25 GHz high peak power microwave exposure in Rhesus monkeys. Fundus photographs, retinal angiograms, and electroretinograms (ERG) were used prior to exposures to screen for normal ocular structure and function, and after exposures as endpoints of the experiment. Histopathology of the retina was used as an additional endpoint. Nineteen monkeys were randomized to receive sham exposure or pulsed microwave exposures. Microwaves were delivered anteriorly to the primate face at 4, 8, or 20 W/kg spatially averaged retinal specific absorption rates (R-SAR). The pulse characteristics was 1.04 MW (« 1.30 MW/kg temporal peak R-SAR), 5.59 (is pulse length at pulse repetition rates of 0, 0.59, 1.18 and 2.79 Hz. The exposure was 4 hours per day, 3 days per week for 3 weeks for a total of 9 exposures. The following results and conclusions are a synopsis of data from 17 monkeys; the remaining 2 monkeys due to illness or high ketamine dose used will be treated as special cases for separate evaluation and discussion. The pre-exposure and post-exposure fündus pictures and angiograms were all within normal limits regardless of treatment. The response of cone photoreceptors to light flash was enhanced in monkeys exposed at 8 or 20 W/kg R-SAR, but not in monkeys exposed at 4 W/kg R-SAR. In addition, increased Naka-Rushton Rmax of scotopic b-waves and decreased log k were noted in monkeys exposed at 20 W/kg R-SAR indicating increases in number of rod ERG generators and a decrease in rod photoreceptor sensitivity to light flashes. Retinal histopathology revealed the presence of an enhanced glycogen storage in photoreceptors which was distributed evenly among sham (2/5), 8 W/kg (3/3) and 20 W/kg (2/5) exposed monkeys with the exception of 4 W/kg (0/4) exposed monkeys. Supranormal cone photoreceptor b-wave was R-SAR dependent, and may be an early indicator of mild injury. However, no evidence of degenerative changes and ERG depression was seen in these animals. Thus, we concluded that retinal injury is very unlikely at 4 W/kg, and function changes that occurred at higher R-SAR were probably reversible since we saw no histopathologic correlation with ERG changes.

Technical Report Microwave Induced Retinal Effects
1. BACKGROUND
Personnel in both civilian and military occupational settings operate a vast array of radio frequency (RF, frequency = 300 kHz to 300 GHz) and microwave (frequency = 300 MHz to 300 GHz) emitting devices. Considering the number and kind of RF emitting devices in the Army, Navy, Air Force, and civilian sector, the possibilities for accidental exposure to RF radiation can be substantial. Technological advances have increased the output power of RF emitters several fold during the past 30 years enhancing concerns over the inadvertent human exposure. Promulgating safe exposure levels for personnel working with high power RF emitters requires an extensive scientific database. At the present time, safe exposure standards [IEEE 1999] are based on in vivo effects of the RF radiation on rodents and non-human primates. Specifically, thresholds to disrupt simple operant behaviors during acute whole-body RF exposure were determined [D Andrea et al. 1977; deLorge 1976; deLorge 1979; deLorge and Ezell 1980]. Modifiers (factor of 10 and 50) are then applied to the behavior disruption threshold to derive the current two tier personnel protection guidelines.
Previous research has shown that exposure to microwave/RF radiation can cause behavioral changes in man as well as in laboratory animals. The changes can range from perceptions of warmth and sound to high body temperature resulting in grand mal seizures and eventually death. Between these two extremes, trained behavior in the laboratory can be either perturbed or stopped outright. Under certain conditions, animals will escape and subsequently avoid microwave/RF exposure, but they will also work to obtain a brief burst of microwave/RF exposure in a cold environment. During the past two decades, much research has been devoted toward gaining an understanding of biological effects of microwave/RF radiation and mechanisms that produce biological effects.
Generally, microwave/RF-induced alteration of biological endpoints other than behavioral disruption requires specific absorption rates (SARs) greater than the 4 W/kg threshold known to disrupt ongoing behaviors. The eye is one of the critical organs which can potentially be injured by microwave and RF radiation exposure, and has been an extensively studied organ [Paulsson et al. 1979]. The eye is composed of three major components: the cornea, lens and retina. Cornea damage is a painful injury while lenticular and retinal damage can lead to blindness. The primary mechanism of lenticular injuries caused by microwave radiation is heating of the lens.
To date, most microwave eye research has concentrated on damage to the lens in the form of lenticular opacities (cataracts). Most investigators assumed that the lens is more susceptible to microwave induced damage than other parts of the eye due to its lack of a vascular system. It was believed that the lack of a vascular system prevented adequate heat loss thus exaggerating the temperature rise in the lens [Michaelson and Lin 1987]. Conclusions drawn from quantitative data collected by Carpenter et al. [1979] and Guy et al. [1975] indicated that the threshold for lenticular opacity was an intra-lenticular temperature of 43 °C. Depending on the wavelength of the RF radiation, the threshold power density was 150 mW/cm2 or higher (estimated lenticular

Technical Report Microwave Induced Retinal Effects
SARs = 33 to >100 W/kg) for 100 minutes. This threshold exposure intensity is two orders of magnitude higher than the current personnel protection guidelines [ANSI 1982; IEEE 1999]. Michaelson and Lin [1987] concluded in a review that similar lenticular effects were induced by continuous wave (CW) and pulsed microwaves of the same average intensity, i.e., no difference between pulsed and CW exposures.
A series of experiments was performed using isolated rat lenses exposed in vitro to 24 kW 918 MHz pulses at various pulse repetition rates [Stewart-DeHaan et al. 1983; 1985; Creighton et al. 1987]. They found an absolute threshold for inducing holes in lens fibers at 231 W/kg for 6 minutes. It has been suggested that the mechanism for this lenticular damage by high power pulsed microwaves was due to a thermal elastic expansion and the resultant pressure waves in the lens [Creighton et al. 1987]. However, the threshold of this lenticular cavitation (which resulted in lenticular opacity, or cataract) was approximately 29 times higher than the ANSI allowable local SAR or the IEEE allowable local SAR in a controlled environment (8 W/kg) [ANSI 1982; IEEE 1999].
Corneal endothelial abnormalities were observed by Kues et al. [1985], in cynomolgus monkeys. They concluded that pulsed microwave radiation (2.45 GHz, 10 us pulse width, 100 pulses per second) was twice as effective in inducing abnormalities as CW microwaves of the same average power density. This conclusion was based on a dose-response curve from one animal for each microwave treatment lasting 4 hours, a variable number of microwave treatments, variable intervals between exposures and repetitive use of chemical restraints (ketamine) and inhalation anesthetics (halothane). It was also apparent from the description of materials and methods of this publication that the control animals did not receive an adequate sham treatment, which should simulate the microwave exposure procedure in the absence of a microwave field. Because of these deficits, the latency and threshold corneal endothelial degeneration could not be derived reliably.
Kues et al. [1992] reported increased sensitivity of the non-human primate to microwave radiation following ophthalmic drug pretreatment, such as 0.5% Timolol maleate and 2% pilocarpine. Intactness of iris vascularity (assessed by fluorescein angiography) and of corneal endothelium (assessed by specular microscopy) were studied in monkeys exposed to 2.45 GHz pulsed microwaves (10 u.s pulse width, 100 pulses per second and variable peak powers, duty cycle = 0.001) between 0 and 3.9 W/kg and 4 hours daily for 3 days. The absolute threshold for microwave ocular injuries (both increased iris vascular leakage and corneal endothelial injury) decreased by 10 fold from 2.6 W/kg (10 mW/cm2) to 0.26 W/kg (1 mW/cm2) in eyes pretreated with the ophthalmic drug. As in Kues' previous experiment [Kues et al. 1985], the exposure was performed in monkeys treated with ketamine immobilization (30-40 mg per 4-7 kg body weight) and halothane anesthesia.
The microwave dosimetry in these experiments was in error. A description of the dosimetric method can be found in their publication [Kues et al. 1985]. A nonperturbing temperature sensor was used in the anterior chamber of the monkey's eye under anesthesia. The steepest portion of the temperature rise in 4 hours was used to calculate the ocular SAR (0.09

Technical Report Microwave Induced Retinal Effects
°C/min at 20 mW/cm2). This procedure did not account for heat loss during a prolonged exposure. Calculation of SARs would have required a correction for the cooling rate of the specimen. A steady-state heating and cooling analysis method was described by Allis et al. [1977]. An alternative method to circumvent this time-consuming procedure was developed and validated [Gambrill et al. 1993; Lu et al. 1993]. Initial calculations indicated that 50 to 64 % of the microwave energy was dissipated from the rabbit in one hour. To obtain an error less than 1 %, the dosimetry exposure should be limited to no more than 10 s. Thus, Kues et al. [1985, 1992] probably underestimated the ocular SAR. The extent of underestimation can not be evaluated because the exposure duration for deriving the steepest portion of the heating curve was not reported.
Corneal endothelial (inner lining cells of the cornea) degeneration was described by Kues et al. [1985] as indicated by cell loss, intracellular vacuolization, and the ability of endothelial nuclei to take up vital stain. However, microwave induced corneal epithelial (outer lining of the cornea) injury was not reported by this group of investigators. The corneal endothelial injury appears to be different from a typical keratitis, an inflammation of the cornea which usually involves exfoliation or ulceration of the corneal epithelium rather than endothelium. Trevithick et al. [1987] determined in rabbits that the threshold for destruction of a single corneal epithelial cell was 33 W/kg from a 35 GHz pulsed microwave source. However, keratitis was not found by Rosenthal et al. [1976] in rabbits exposed to 35 GHz (175 W/kg) or 107 GHz (238 W/kg) microwaves for one hour. Apparently, the threshold for microwave induced corneal epithelial damage is in the same order of magnitude as the microwave-induced lens opacity (cataract) but is an order of magnitude higher than the purported threshold of the microwave-induced retinal injury (« 4 W/kg) reported by Kues et al [1989b, 1990].
Tengroth and Aurell [1974] reported an increased incidence of chorioretinal scar in microwave workers. Ninety-eight persons employed in developing radar equipment were investigated. The exposed group was composed of 68 persons testing radar equipment and measuring microwave radiation or working in experimental laboratories. The control group consisted of 30 persons from the same pool who were not involved with testing. The incidence of chorioretinal scar was 25% (17/68) in the exposed group and 3% (1/30) in the control group. The frequency/wavelength of the microwave, exposure intensity, retinal SAR, duration of exposure, duration of employment, and characteristics of microwave pulses were not reported.
Microwave-induced retinal injury was noted by Paulsson et al. [1979] as neuronal degeneration in the rabbit and by Kues et al. [1989a; 1989b; Kues and McLeod 1990; Kues and Monahan 1992] as submacula detachment, degenerative changes in photoreceptor outer segments, vacuolization of the outer retinal layers, focal retinal detachments, karyolysis of photoreceptors and pyknotic changes of the pigmented epithelium in the monkey. These investigators observed retinal degeneration in experimental animals subjected to repetitive exposure to pulsed microwaves. It could be implied that a cumulative effect was observed. A cumulative effect is the accumulation of minor injuries, which are not repaired between insults, and develop into an observable effect. None of these reports attempted to prove the existence of a cumulative effect in the microwave induced retinal injuries. Paulsson et al. [1979] did not

Technical Report Microwave Induced Retinal Effects
present the dosimetric data. Thus, a common denominator for inter-frequency and inter- laboratory extrapolation is not available. Kues et al. [1989a; 1989b; Kues and Monahan 1992] noted that the threshold SAR for primate retinal degeneration was 3.9 W/kg for 2.45 GHz pulsed microwave (10 (is pulse width, 100 pulses per second, 15 mW/cm2 average power density, or 15 kW/cm2 peak power density) and 3.6 W/kg at 1.25 GHz (10 us pulse width, 0.225 pulses per second, 12.5 mW/cm2 average power density, 5.56 kW/cm2 peak power density) microwaves. Timolol maleate pretreatment was noted to enhance the severity of the retinal injuries in monkeys in a series of 27 four-hour 2.45 GHz pulsed microwave (10 u,s, 100 pulses per second, 5 or 10 mW/cm2, SARs » 1 or 2 W/kg) exposures [Kues and McLeod 1990]. These threshold SARs were lower than the permissible local SAR (8 W/kg spatial average over one gram of tissue) according to ANSI [1982] or IEEE [1991]. However, Kues' experiment suffered from similar deficiencies as those studies on microwave-induced corneal injuries. The monkeys were exposed under ketamine immobilization (0.3 ml or 30 mg) and halothane anesthesia (2.5 % halothane in 97.5 % oxygen, 0.5 1/min).
Because of criticism from the scientific community concerning the use of halothane anesthesia during microwave exposures, Kues' group subsequently exposed unanesthetized monkeys [Kues and Monahan 1992, Kues et al. 1991; 1993]. Degenerative cones were observed in monkeys exposed to 7 four-hour 1.25 GHz pulsed microwaves (0.5 us, 16 pulses per second, average ocular SAR 3.5-4.0 W/kg) [Kues et al. 1991], 9 four-hour 1.25 GHz (0.5 us, 16 pulses per second, ocular SAR 4.0 W/kg) [Kues and Monahan 1992; Kues et al. 1993], and 30 (duration of each exposure was not specified) 2.7 GHz pulsed microwaves (1 us, 20 pulses per second, ocular SAR 2.6 W/kg) [Kues and Monahan 1992]. However, retinal injuries were not observed in monkeys subjected to 2.85 GHz pulsed microwave exposure (1 us, 20 pulses per second, ocular SAR 3.5 W/kg, 3 times per week for 10 weeks) [Kues et al. 1993; 1994]. Differences in specific pulse/frequency parameters and in the SAR due to frequency dependent absorption by the photopigments were suggested by Kues et al. [1993] as the cause of the difference in the effectiveness of various pulsed microwave exposures.
Contrast sensitivity functions are used widely as a measure of basic visual performance. Visual contrast sensitivity was not altered during repeated exposures to 5.6 GHz microwaves [D'Andrea et al. 1992]. The microwave pulses (2.3 us pulse width, 100 pulses per second, 18- 108 mW/cm2 averaged power density, 1-6 W/kg whole-body average SAR) were delivered in daily sessions lasting 30 minutes per session. The pulse parameters in this visual function test were quite different from pulsed microwaves used by Kues. In a follow-up study, the pulse parameters were similar to those used by Kues and visual contrast sensitivity was again unaltered during repeated exposures to 1.3 GHz pulsed microwaves [D'Andrea et al. 1993]. The study was conducted at an SAR of 4 W/kg at the eye (1 W/kg whole-body average SAR) with intermittent exposure (36 hours total, 4 hours per session, 9 sessions total) to 1.3-GHz pulsed microwaves. The pulse characteristics were 0.5 us pulse width, 16 pulses per second, and a 1 MW peak power output of the transmitter.
Yee [1983] reported a reduction of b-wave amplitude and increased c-wave amplitude of the scotopic adapted single flash electroretinogram (ERG) in rabbits exposed to 3 GHz pulsed

Technical Report Microwave Induced Retinal Effects
microwaves with 6 us pulse width and 1875 pulses per second. The average power density was 0.7 mW/cm and the peak power density was 622 mW/cm2 (equivalent to 1.53 kV/m peak electric field). The average power density is less than the IEEE's [1999] maximum permissible exposure limits for controlled environments (10 mW/cm2) and uncontrolled environments (2 mW/cm2) or the IEEE's maximum allowable peak electric field (100 kV/m). The ERG changes became apparent after 3 to 4 hours of exposure and the magnitude of change increased with the duration of exposure. Recovery occurred in half an hour after the exposure. The data presented was normalized to the pre-exposure baseline. Data from a sham-exposed group was not included.
Kues et al. [1991] examined ERG changes in adult Rhesus monkeys before and after 7 four-hour exposures to 1.25 GHz pulsed microwaves (5 |is, 16 pulses per second, 3.5-4.0 W/kg ocular SAR). They noted a 50% reduction in the scotopic single flash response and a 90% reduction in the 30-Hz flicker response following these repetitive exposures. The single flash photopic response was completely extinguished in the post-exposure examination. They attributed the ERG changes to the degeneration of cone photoreceptors. The ERG returned to normal one week after microwave exposures. However, histopathological evidence was not discussed. A slightly different description of the ERG changes was given in their 1992 report [Kues and Monahan 1992]. They reported a 60% reduction in scotopic single response (rod response) and a 90% reduction in the 30-Hz flicker test (cone response) in monkeys exposed to 1.25 GHz pulsed microwaves for 4 hours on three consecutive days for three consecutive weeks (total of 9 exposures) at 4 W/kg ocular SAR (0.5 p.s, 16 pulses per second).
Kues' reports on microwave-induced retinal injuries in the monkey have appeared primarily in meeting abstracts. As such, detailed descriptions of experiments were usually lacking. It is very difficult to determine the actual microwave treatments from anecdotal accounts of exposure history. In addition, the incidence of the retinal injuries indicated either as histopathological changes or ERG changes was never clearly indicated. The number of sham- exposed monkeys and their incidence of histopathological/ERG changes were never reported. This lack of experimental detail and quantitative data makes the task of risk analysis very difficult, if not impossible.
Kues also failed to mention that the 1.25 GHz experiments involved weekly transport of the monkeys between facilities in Baltimore and in Silver Spring, Maryland, a distance of 30 miles each way. Chemical immobilization (30-40 mg ketamine per 4-7 kg body weight) was used before and after each microwave exposure. A host of non-invasive diagnostic evaluations was also performed before and after microwave exposure. These evaluations included slit-lamp examination, fundus photography, fluorophotometry, wide-field specular microscopy and electroretinography. During these procedures, ketamine immobilization was used. It is unclear whether these procedures were applied uniformly in every monkey inducted into the experiments.
Based on Kues' data, one is lead to conclude that the threshold for microwave-induced retinal injuries appeared to be lower than the threshold whole-body average SAR (4 W/kg) and the permissible local SAR (8 W/kg) for personnel protection. In addition, pulsed microwaves

Technical Report Microwave Induced Retinal Effects
appeared to be more potent in inducing ocular injuries than continuous wave microwaves. Due to the potential importance of microwave ocular hazards in relation to health and safety of soldiers, sailors, airmen, and general public, an ocular study using rhesus monkeys was requested by the Tri-Service Electromagnetic Radiation Panel (TERP). This research program represents collaboration and resource sharing among the Army, Navy, and Air Force with the assistance of expertise from Wilmer Eye Institute, Johns Hopkins University and University of Maryland.
The objectives of the research were to identify the presence or the absence of high peak power microwave-induced retinal injuries by studying changes in fundus photographs, angiography, electroretinograms, and histopathology of monkeys exposed to 1.25 GHz pulsed microwaves at 0, 4, 8 and 20 W/kg retinal SAR. The following special considerations were incorporated into the experimental design in the present study:
1). Extensive densitometry and dosimetry were performed prior to experimentation.
2). Transmitter output was continuously monitored and recorded using redundant instrumentation.
3). Extensive pre-exposure screenings were used to assure the retinal normality prior to the acceptance of experimental subjects into the study.
4). Efforts were made to apply all diagnostic procedures uniformly to all subjects regardless of microwave treatments.
5). Graded multiple retinal doses were used to maximize the probability of observing retinal changes caused by microwave exposures.
6). Pre-exposure baselines were used for individual control.
7). Data obtained in the exposed monkeys were further compared to those of sham-exposed monkeys.
8). Concurrent shams were used.
9). Ketamine restraint and general anesthesia were not used during the exposure.
10). A minimum of a 72 hour recovery period was mandatory between pre-screenings and beginning of the repeated exposures.
11). Fluorophotometry was not used.
12). Exposures were randomized.
13). All investigators except one (code keeper) were blind to the experimental treatments.

Technical Report Microwave Induced Retinal Effects
14). Long distance transportation was avoided.
15). Transportation of experimental subjects was accomplished in a metal cage with opaque plastic cover and in an enclosed air-conditioned van for this purpose.
All these procedures were necessary to assure data quality and to avoid introducing unidentified confounding factors and unintentional biases by investigators. The rationale for each of these considerations is explained further in discussion section.

Technical Report Microwave Induced Retinal Effects
2. MATERIAL AND METHODS
2.1 Animal Model
Adult male and female Rhesus monkeys (Macaca mulatta) were used. Their ages were between 4.0 and 9.5 years and body weights between 4.3 and 8.8 kg. They were received as clinically healthy animals free of physical defects and tested negative for tuberculosis and Herpesvirus Simiae (B virus). Monkeys were housed individually in standard stainless steel primate cages in air conditioned rooms. Standard feed (Monkey Diet #5038, PMI Feeds Inc.) and water were available ad libitum. The ambient environment inside the animal room was maintained at 22 ± 1 °C, relative humidity between 50 and 55 % and a minimum of 10 air exchanges per hour of 100 % conditioned fresh air. The photoperiod was 12L.T2D (light on between 0600 and 1800 hours).
Prior to acceptance into the protocol, monkeys were screened against ocular abnormalities by fundus photograph, fluorescein, and indocyanine green angiographies under scanning laser ophthalmoscope (SLO/Angiogram) and electroretinogram (ERG). Twenty five monkeys were screened. Two monkeys each were rejected due to abnormal SLO/angiograms and ERG b-wave amplitudes. One monkey was rejected out of protocol due to hypersensitivity to ketamine xylazine anesthesia. One additional monkey was rejected out of protocol with normal ocular morphology and function due to a quarantine requirement involving an accident with potential zoonotic significance. A total of 19 monkeys was either sham or microwave exposed without anesthesia. Two additional monkeys were used for dosimetry.
2.2 General Procedures
Each monkey was subjected sequentially to stepwise procedures grouped into pre- exposure ocular screening, chair acclimation, microwave/sham exposure, post-exposure evaluation, and euthanization/histopathology evaluation. The pre-exposure screening included ERG evaluation under ketamine (20 mg/kg i.m.) and xylazine (2 mg/ml, i.m.) and on a separate day fiinduscopy under ketamine (20 mg/ml, i.m.) and xylazine (2 mg/ml, i.m.) anesthesia, followed immediately by SLO/angiogram under sodium pentobarbital anesthesia (12-15 mg/kg, i.v.) and acepromazine maleate (0.5-1.0 mg/kg, i.v.) to prevent vomiting.
The chair acclimation and microwave/sham exposures were performed after acceptance of the monkey. They were performed without anesthesia in an anechoic chamber. Chair acclimation included placement of the monkeys in a restraining chair fabricated entirely from a plastic material (PVC, polyvinyl chloride) with head restraints to limit head movements. The chair acclimation was gradually increased to four hours daily for a minimum of 5 days. A monkey was successfully acclimated when it could sit quietly in the chair for 4 hours (Fig. 1).

Technical Report Microwave Induced Retinal Effects
Figure 1. The exposure setup showing the head restraint, upper portion of the restraining chair and open-end waveguide antenna
Three to 4 days after the chair acclimation, monkeys were exposed individually, 4 hours daily, 3 days per week for 3 weeks for a total of 9 exposures. All procedures required a maximum of 4 hours per day over a 4-week period. This allowed two monkeys to be run through the experimental procedures at one time. Two monkeys were exposed separately, one in the morning (0800 to 1200 hours) and one in the afternoon (1230 to 1630 hours). The morning and afternoon exposures were selected randomly from the 4 microwave exposures with the provision that different exposure conditions would be selected for each monkey in a pair.
Twenty-four hours after the last of 9 exposures, the monkey was subjected to post- exposure evaluations which in sequence included ERG under ketamine-xylazine anesthesia, and Fundus Photograph and SLO/Angiograms under sodium pentobarbital anesthesia. Immediately after the last procedure, the animal was euthanized with 3 ml (300 mg) of sodium pentobarbital. Enucleation was performed immediately after the euthanization. Eyeballs were slit at the limbus and immersion fixed in 25 % Karnovsky's fixative (1 % paraformaldehyde and 1.25 % glutaraldehyde in 0.1 M cacodylate buffer pH 7.2). The eyeball was processed and sectioned at 2.5 |im from glycol methacrylate block through the disk and macula and stained with periodic acid Schiffs and Harris' hematoxylin. The endpoints of this study included fundus pictures, retinal angiograms, ERGs (photopic a-, b- wave amplitudes, scotopic a-, b-wave amplitudes, 30 Hz flicker amplitude and scotopic oscillatory potential).
10

Technical Report Microwave Induced Retinal Effects
2.3 Microwave Exposures
The pulsed microwave was generated from an FPS-7 transmitter operated at 1.25 GHz, 1.04 MW peak power, 5.59 (is pulse width at 0, 0.59, 1.18 and 2.79 Hz pulse repetition rates. The retinal specific absorption rates (R-SAR) were 0, 4.28 ± 0.1 (S.D., n= 4), 8.44 ± 0.32 (S.D., n= 3) and 20.16 ± 0.43 (S.D., n= 5) W/kg (See section 2.5). The distance between the frontal orbital ridge of the monkey to the geometric center of the open-end waveguide was 7.6 cm even if the sham exposure was performed.
2.4 Exposure Facility
The microwave pulses were transmitted through a WR650 waveguide system into an anechoic chamber. An open-end WR650 waveguide was used as an antenna. The antenna was configured to provide vertical E and horizontal H polarization. Details of the facility are illustrated in Figure 2.
CIV SOURCE (1160 UHz) TEK 1430A O'SeoJ»
CH. 1 . QCH. 1
^—0.O--CZ].
Ea--o"b--czi..
MATCHED HP LOAD RESISTORS
CRYSTAL DETECTORS (HP 423B)
/IVG. POWER UETERS ' .(HP 43SB)
^^^ |r> POWER SENSORS
(HPS4»1A)
I. 1 . QCH.
OCCULAR/COLONIC TEMPERATURES MESUREMENTS
£
UAU-S PROBES LUXTRON 3000
DATA ACQUISITION SYSTEM
*U ^.^^r
f^
X*
4-PORT WAVEGUIDE SWITCH
//
TO THE SUBJECT
DIRECTIONAL COUPLER (34itB)
TO PEAK POWER METER
DIRECTIONAL COUPLER G«n«r«f Mlomwav»
PEAK POWER METER
YSI 405 PROBE YSI 49 TA
AMBIENT TEMPERATURE MEASUREMENT
DUUUYLOAD McKesson BloServlces
L-Band Block Diagram
Satnam Mathur 9-72-96
Figure 2. Block Diagram of the Exposure Facility
11

Technical Report Microwave Induced Retinal Effects
A four-port 36 dB bi-directional coupler was used to sample forward and reflected powers of the transmission line. For pulse measurements, additional attenuators (70 to 81 dB) were placed on the incident and reflected ports of the bi-directional coupler. The pulse-to-pulse forward and reflected powers were monitored by crystal detectors (HP 423B) connected by a feed-thru terminator (Midwest Microwave, model 2050) to an oscilloscope (Tektronix 2430A). The forward power was also fed to a universal counter (HP 5334A) for measuring pulse repetition rate. The peak powers from one of the forward ports of the bi-directional coupler were attenuated and fed to a power head (General Microwave Corp. 436A) of an automatic peak power meter (General Microwave Corp. Model 478A). Therefore, peak powers were monitored by redundant measurement systems which provided a cross check for the performance of each measurement system. In addition, the pulse spectrum was monitored continuously with a spectrum analyzer (HP 8566B). An E-H tuner inserted between the antenna and the bi-directional coupler were used to minimize the mismatch among various waveguide components. During routine operation, the reflected powers were usually tuned to 13 to 15 dB or more down from the forward powers. Any unused ports were terminated with matching terminators or loads. The ambient temperature of the anechoic chamber was monitored continuously with a telethermometry system (YSI 405 probe and Cole-Parmer Thermistor Thermometer E-08502- 14). An independent air conditioner unit was used to provide freshly conditioned air to the anechoic chamber and to provide isolation and independence for the anechoic chamber from the building environment during the experiment.
For quality assurance, all the power measurements components, such as directional coupler, attenuators, connectors, and cables were periodically calibrated and recorded with a scalar network analyzer (HP 8757C) with matching detectors (HP 85025A) and cables. A sweep oscillator (HP 8350B) with RF-plug in (HP 83525B) was used as a calibrated source. A calibrated bridge (HP 85027) and connector kits were used during component calibration. All the power measurement instruments were factory calibrated annually. All the temperature measurement devices were calibrated in a water bath against a NIST traceable ASTM mercury- in-glass thermometer. The following illustrations provide examples of typical wave forms from the crystal detector output (Fig. 3), the automatic peak power meter (Fig. 4), and the spectrum analyzer (Fig. 5).
The FPS-7 transmitter produced trapezoidal pulses with rise- and fall-time of approximately 0.9 u.s and a 50 % width in 6-us range. These pulse characteristics could vary slightly due to the transmitter settings and tuning. For routine operation, the average power transmitted was calculated to compensate for the wave shape from the net pulse energy (calculated from peak power measurement by trapezoidal rule and transmission efficiency determined from forward and reflected powers) and the pulse repetition rate. The square wave equivalent pulse width calculated from pulse energy and peak power, was 5.59 u,s. These pulse parameters were recorded every 15 minutes during all the exposures throughout the entire study.
12

Technical Report Microwave Induced Retinal Effects
CMl seeitiu A 2|t( 266mU CHI
CM2 59BmU
CHI P-P s 1.14 U CH2 P-P S Z66it> U CHI FALL « i.ezi»! CHI WIDTH X S.Otpi
T .
""">N~__ J/^".,^^ '
\ ' j Figure 3. An Example of Crystal Detectors' Outputs
PERK PWR-1053. KU REF PHR- INST PMR-1020. KM CUR Wh ''.
AT = 1 . ISPs 1 CUR t- V. 2500 .0
KM
2000 .0
1500 .0
1000 .0
500 .0
0 .0
:rpji\..,. Figure 4. An Example of Power Profile of the FPS-7 Pulses
It was apparent that the FPS-7 can produce 1250 MHz (1.25 GHz) pulses without significant side bands. The bandwidth of the FPS-7 pulses was also very narrow. The entire bandwidth of the pulses shown in Figure 5 was less than 20 MHz.
nSwiEr» L25Ö S BUS n_
Y&W 3 >.*H*
I. I J '
Figure 5. An Example of the Pulse Spectrum
13

Technical Report Microwave Induced Retinal Effects
Because the monkey was to be placed 7.6 cm in front of the open-end waveguide antenna, the power densities of the E-H plane and power densities at various distances from the antenna were measured with Narda 8721 probe and 8716 meter positioned by a tri-axial scanner. Instead of the FPS-7 transmitter, a continuous wave microwave source was used to determine the spatial distribution of the power density. Further characterization of the microwave field was performed along the beam path. As expected, power density decreased with the distance from the antenna aperture (Fig. 6). Figures 7 and 8 illustrates the power density profile and power density contour 7.6 cm from the open-end waveguide antenna.
It was apparent from the profile and contour plots that the power density decreased rapidly from the geometric center of the E-H plane. The 3-dB beam size was approximately 6 cm at 7.6 cm from the antenna. The power density decreased to less than 1 % at 15 cm from the center of the E-H plane. The spatial peak power density was 2.79 mW/cm2
per W of transmitted power. The exposure configuration was, therefore, a localized exposure limited to head and neck of the monkey. To obtain a consistent exposure, care in positioning the monkey, chair training and head immobilization were extremely important. All these requirements were incorporated into the design of the present experiment.
20 ,....,., , . , , . . ' Power Transmitted= 5.4 W Maximum P.D.= 15.41 mW/cm2
Narda 8721 probe Narda 8716 meter
15
o
\
Po
we
r D
ensi
ty
\
-^""^ Ours
0 C
V,
1 1 . . 1 . . 1 , .
10 20 30 40 Distance from Aperture (cm)
50
Figure 6. Power Density at the Beam Path
Figure 7. Power Density Profile of the Exposure System at 7.6 cm
14

Technical Report Microwave Induced Retinal Effects
Contour I Ine un It In dB
-2a -15 -1 -5 -0 5 10
X ex Is (cm)
Figure 8. Power Density Contour of the Exposure System at 7.6 cm from the waveguide.
15

Technical Report Microwave Induced Retinal Effects
2.5 Ocular Thermometric Dosimetry
Based on rate of temperature change, a thermometric dosimetry procedure [Gambrill et al. 1993; Lu et al. 1993] with RF transparent temperature probes was used to determine the ocular SAR in monkeys. An 8 channel Luxtron 3000 Fluoroptic Thermometer and 2 Luxtron MAM-05 fiber optic temperature probes (4 sensors each at 5-mm spacing) were used. The fluoroptic thermometer system was operated at 10 Hz. The analog outputs (500 mV/°C) of the fluoroptic thermometer were filtered with 4 Krohn-Hite 3322 filters (2 channels each) operated at 1 Hz low pass. The filtered signal was stored digitally with a computerized data acquisition system operated at 2 Hz acquisition rate. The rate of temperature change (dT/dt in °C/s) was evaluated from the acquired data.
The rate of temperature change during dosimetric exposure (dT/dteXp, 40 s) was adjusted by the average of the rates of temperature change during pre-exposure period (dT/dtpre, 40 s) and post-exposure period (dT/dtpost, 40 s) as follows:
dT/dt = dT/dtexp - [ (dT/dtpre + dT/dt^) / 2]
The local SAR was calculated by the following formula by using average specific heat of tissues (C = 3474 J/kg).
SAR (W/kg) = C • dT/dt
Four replications were performed for each SAR determination. The SAR data is normalized to W/kg per W transmitted power. For ocular dosimetry, the FPS-7 transmitter was operated nominally at 1 MW peak power, 6 (as pulse width, 17.5 Hz pulse repetition rate and 80 to 100 W average transmitter output.
Two 6-year-old female monkey carcasses were used for ocular dosimetry. Their body weights at euthanization by intravenous sodium pentobarbital were 4.5 and 4.9 kg. In order to maintain anatomical intactness of the ocular globes, a fistula was created surgically at each of four quadrants of the ocular globe ~ superior, oral, nasal and temporal ~ through the eyelids (Fig. 9). Blunt dissection was used to create the fistula such that only a thin layer of conjunctiva membrane was left between ocular globe and fistula. Fiber optic temperature probes were inserted along the outer contour of the ocular globe until the last sensor of the probe was resting near and slightly deeper than the limbus. The probe was then positioned carefully and taped to the waveguide surface to retain the contact between probe and tissue. The current procedure represents a retinal SAR rather than an intra-ocular SAR. Sixteen retinal SARs per globe and 32 retinal SARs per carcass were determined. The sequence of SAR determinations is indicated in Fig. 9. For each local ocular SAR, four replicates were obtained. A total of 128 determinations was obtained from each carcass. The ocular SAR was normalized to per W net power delivered to the open-end waveguide antenna for determination of the net power required for experiments and for estimating the ocular SAR from net average power measured.
16

Technical Report Microwave Induced Retinal Effects
Right Nasal (4) Left Nasal (3)
Right Superior (1)
Right Temporal (3)
Right Oral (2)
Left Superior (1)
Left Temporal (4)
Left Oral (2)
Location and Sequence of Peri-ocular (Retinal) SAR Determinations
Figure 9. Location and Sequence of Peri-ocular SAR Determination. The probe was inserted through the eyelid following the contour of the eye to a desired depth. A thin layer of conjunctiva separated the sensor from the eyeball.
2.6 Electroretinogram
Electroretinogram (ERG) was used as pre-exposure screening for ocular health and post- exposure endpoint. The pre-exposure ERG was performed 3 to 4 weeks before the scheduled sham/microwave exposures. The post-exposure ERG was performed 24 hours after the last of scheduled sham/microwave exposures. All the pre-exposure and post-exposure ERGs were performed in an electronically shielded darkroom.
An Electrophysiologic Personal Interfaced Computer System (LKC Technologies, Inc., EPIC-2000) was used. The system was composed of a computer-assisted data acquisition system and controller, Grass Photic Stimulator, Bright Flash Unit, and a Ganzfeld globe for performing electroretinograms. The background luminance of the Ganzfeld globe was 28.8 cd/m2 at 1/4 diaphragm setting. The luminance of the light flash in Ganzfeld globe was 2.2325 cd-s/m2 if the Grass Photic Stimulator was used and 2641.1 cd-s/m2 if the Bright Flash Unit was used. In addition, the Ganzfeld globe has two wheels containing neutral density filters to provide light attenuation from 0 to -40 dB at -2 dB intervals. Three types of electrodes were used. They were ground (attached to inner surface of the leg), indifference (attached to forehead skin surface), and contact lens (ERG-Jet, Life-Tech, Inc. attached to corneal surface) electrodes.
17

Technical Report Microwave Induced Retinal Effects
The monkey was anesthetized initially with ketamine (20 mg/kg, i.m.) and xylazine (2 mg/kg, i.m.). After anesthetization, eyes were covered with gauze and the monkey was transported to a shielded darkroom. The anesthetized monkey was placed in an infant carrier with seat belts for holding the torso and Velcro strip for holding the head in place. The infant carrier was mounted on a pedestal for height and tilt adjustments such that both eyes could be placed in the center of the opening of Ganzfeld globe. Electropaste was used to attach the ground electrode to the inner surface of leg and indifference electrode to the center of forehead. Two to three drops of 1 % tropicamide ophthalmic solution, and 2.5 % phenylephrine hydrochloride ophthalmic solution were instilled into the conjunctiva pouch for numbing the cornea and dilating the iris. The cornea was numbed with two to three drops of 0.5 % proparacain hydrochloride prior to attaching the cornea electrode. The Jet electrode was filled with 2.5 % hydroxypropyl methylcellulose ophthalmic demulcent solution (Gonisol) and then attached to the cornea surface. The eyes were adapted to the darkness (scotopic adaptation) in the shielded dark room for 30 minutes.
The electroretinogram was determined after scotopic adaptation. In sequence, scotopic intensity response curves, scotopic 30 Hz flicker responses and photopic responses were obtained. The intensity (luminance) of the light flashes was expressed in ratio (dB, 10 times log ratio) to the base of 2.2325 cd-s/m2. Scotopic intensity responses were determined using both the Grass Photic Stimulator and the Bright Flash Unit. The light intensities used in determining scotopic intensity response curves were between -40.46 to 24.28 dB at 2 to 4 dB steps from the lowest to the highest intensities covering approximately 6 orders of magnitude. The scotopic 30 Hz flicker responses were tested next. The 30 Hz flicker consisted of photic pulses operated at 2.2325 cd-s/m2 and 30 Hz. The photopic response test was performed next to evaluate the cone photoreceptor function. Background illumination was 28.8 cd/m and a 2.2325 cd-s/m photic pulse was used. The emphasis of the ERG testing was on scotopic and photopic 0 dB responses and 30 Hz flicker responses; two to four duplicates were obtained. For the scotopic intensity response curve, the test was usually not repeated.
It has been recommended [International Standardization Committee 1989] that "rod response" should be first after dark adaptation with a dim white flash of strength 2.5 log unit of the standard white flash (1.5 to 3.0 cd-s/m2). The relationship between ERG b-wave amplitude, R (in u,V), and stimulus intensity, I (in cd-s/m2), given by Naka and Rushton [1966] are as follows:
/" «(/)
^max / + K
where Rmax is the asymptotic amplitude of the b-wave (in |iV), K is the intensity at which b-wave amplitude is half of its asymptotic value (in cd-s/m2), and n determines the slope of the function at / = K. The Rmax and log K can provide additional inference about the pathophysiologic mechanisms underlying retinal disease [Massof et al. 1984; Peachey et al. 1992]. Because of the
18

Technical Report Microwave Induced Retinal Effects
additional diagnostic values (inference of mechanisms of underlying retinal disease versus change in rod photoreceptor function) of Naka-Rushton constants, the b-wave intensity response data were used to derive Naka-Rushton constants according to the method developed by Severns and Johnson [1993].
After the test, Gonisol was washed out with 0.9 % normal saline. If another procedure such as fündus photography or angiogram was to be performed subsequently, a booster dose (10 mg/kg ketamine, i.m.) was administered to maintained surgical anesthesia. Eyes were covered with gauze to maintain moisture and to prevent excessive light exposure during transportation. If fundus photography or angiogram were not planned, the booster dose was not given and the monkey was returned to vivarium for recovery from anesthesia.
2.7 Fundus Photography, Fluorescein Angiography (FA), and Indocyanine Green Angiography (ICG)
These procedures were used both as pre-exposure screening for ocular health and as post- exposure endpoints. Pre-exposure screening was performed independent of the ERG evaluation and was usually performed at least 4 days before the commencement of the scheduled sham/microwave exposures. The post-exposure endpoint studies were performed 24 hours after the last sham/microwave exposures and after the ERG procedures.
The monkey was anesthetized with ketamine (20 mg/kg, i.m.) and xylazine (2 mg/kg, i.m.). The monkey was then transported to another building. During transport, the eyes were covered with gauze and the body with a clean surgical drape to avoid excessive photic exposure and to prevent hypothermia. The monkey was transported to the procedure room for intravenous cannulation. The skin overlying the saphenous vein was clipped and cleaned with 70% ethyl alcohol. A 22-gauge 1" plastic catheter needle was inserted into the saphenous vein followed by withdrawing the metallic needle. The plastic catheter was secured with tape. Intravenous infusion of 0.9% normal saline drips was used to maintain the patency at the rate adequate to keep the vein "open." The monkey was subsequently anesthetized with sodium pentobarbital (10-20 mg/kg, i.v.) through the cannula. Two to 3 drops of 0.5 % proparacain hydrochloride ophthalmic solution, 1 % tropicamide ophthalmic solution, and 2.5 % phenylephrine hydrochloride ophthalmic solution were instilled into the conjunctiva pouch for inducing cycloplegia and mydriasis. To reduce the incidence of post-injection emesis, acepromazine maleate (0.5-1.0 mg/kg, i.v.) was administered approximately 15 minutes before dye injections (fluorescein and indocyanine green). When examining the eyes, the eyelids were held open by an ophthalmic speculum, and the cornea was irrigated frequently with 0.9 % normal saline to prevent drying. The anesthetized subject was placed on an adjustable stage in front of the examining instrument. The animal was secured with tape and Velcro bands to a holding board in a prone position with the head hyper-extended.
Clinical instruments such as fundus camera and scanning laser ophthalmoscope (Rodenstock) were used. Fundus photographs were taken as Polaroid picture and as color slide
19

Technical Report Microwave Induced Retinal Effects
for permanent record and evaluation. FA was accomplished with intravenous injection of a 0.2 ml bolus of 10 % sodium fluorescein (Alcon Labs., Inc.) and repeated up to 1 ml. ICG was accomplished by intravenous injection of a 0.1 ml bolus of indocyanine green (Becton Dickinson and Company). Each bolus of dye injection was followed by 1 ml of 0.9 % normal saline flush. The FA and ICG images were recorded by a video recorder such that permanent records could be maintained and reviewed. If the animal was not scheduled to be euthanized, it was returned to the vivarium.
2.8 Euthanization and Retinal Histopathology
Immediately after the completion of post-exposure FA/ICG angiograms, the monkey was euthanized with intravenous sodium pentobarbital (3 ml, 300 mg) until the heart stopped. Immediately after the heart stopped, bilateral enucleation was performed. The extirpated eyes were slit at the limbus and immersed in the 1/4 strength Karnovsky's fixative (1 % paraformaldehyde and 1.25 % glutaraldehyde) in 0.1 M cacodylate buffer, pH 7.2 at room temperature for 15 minutes. After the initial fixation, the anterior segments were removed and the tissue was returned to fixative. The ocular tissue in 1/4 strength Karnovskys fixative was transported to the ocular histology laboratory at Wilmer Eye Institute Johns Hopkins University. The ocular tissue in fixative was stored refrigerated at 4 °C until it was processed.
Following several washes in 0.1 M cacodylate buffer pH 7.4 at 4 °C, posterior eyecups were dehydrated in graded concentration of ethyl alcohol (30, 50, 70, 80, 90, 95 and 95% v/v) for 30 minutes each on a rotator at room temperature. Tissues were trimmed in 70% steps to a size of approximately 6x8 mm which included the disk and macular region of the posterior pole. The 6-mm dimension was along the inferior to superior plane while the 8-mm dimension was along the temporal plane extending from the nasal aspect of the nerve head. Trimmed tissues were imaged using a calibrated macroscopic setup which included gooseneck fiber optic lighting, and a Hamamatsu CCD camera with a 50 mm lens and 20 mm extension tube. Dehydration in 70% alcohol was resumed following imaging. The remaining peripheral tissue that was not embedded for histopathological evaluation was stored in 70 % alcohol at 4 °C. Following the second 95 % alcohol dehydration step, tissue was infiltrated overnight at room temperature in catalyzed glycol methacrylate polymer (catalyzed JB-4 solution A Polysciences Inc.). The infiltrate was replaced with freshly prepared catalyzed JB-4 solution. Infiltration was resumed in the following morning for 3 additional hours. Tissues were then embedded in 24 mm Wheaton snap cap vial lids which had pre-poured bottoms from the previous day. Blocks were polymerized under vacuum.
Blocks were trimmed so that the macular and disk regions were approached from the inferior region of each eye and would be included in the same plane. Blocks were faced until complete sections of full thickness eyewall were obtained. At that time 4 slides containing 3 sections each (2.5 u,m in thickness) were collected and dried on a slide warmer. The process (collecting 4 slides containing 3 sections each) was repeated at 250-u,m steps until the foveal
20

Technical Report Microwave Induced Retinal Effects
slope was reached at which time 8 slides (24 serial sections) were collected. The blocks were then sealed with clear nail polish and stored desiccated at room temperature for archival storage.
Slides were stained using periodic acid Schiffs (PAS) and Harris' hematoxylin several days after complete drying was achieved. One slide from the first collection step of each eye was used to verify proper timing of the staining procedure prior to staining the remaining slides. In the present experiment, 2 hours in 1 % periodic acid followed by several distilled water rinses and 2 hours in Schiffs reagent yield satisfactory results. Counter staining was carried out for 30 minutes in freshly filtered Harris' hematoxylin. The hematoxylin is blued in tap water for 2 hours. After the staining, a slide was allowed to dry overnight before a coverslip was placed on the stained tissue with permount. Two slides from each 250-um steps up to the fovea and 4 slides each within the fovea were stained and evaluated histologically.
2.9 Microdensitometry of the Optical Density of PAS Reaction
Two slides (3 sections each) through the fovea and optic nerve from each monkey were stained with PAS, in a single batch. From these slides, triplicate sections from each animal were selected for microdensitometric analysis based on the quality of the section free of sectioning artifacts, uniformity of stain, and relative staining intensity. Visually detectable thick or thin sections were avoided. Digital images were collected from the temporal and nasal retinal photoreceptor layer 1 mm from the fovea. A Hamamatsu CCD device mounted on a Zeiss photomicroscope interfaced with a Macintosh Computer was used. The area of retina imaged was 0.04 mm2. A didinium filter and a #45 blue Kodak Wratten filter were used in the illumination path of the microscope to enhance the PAS stain. The voltage of the light source was adjusted to 12 V and neutral density filters were used to avoid overloading the detector. The light intensity was adjusted slightly when collecting images to set the lower limit of the plot profile function of the N.I.H. Image Software (version 1.47) to a relative grey scale value of 40- 50. The value reflected the background staining of the rod inner segments (PAS negative) and was used to correct for any minor differences between background staining density due to variation of section thickness. The gain and offset functions of the CCD controller were not adjusted. Density plot profiles, 5x220 urn (height by length) were obtained through the photoreceptor inner segment layer. The mean optical density of the plot profiles for each region and each animal were averaged and the standard error of the mean was calculated.
2.10 Body Temperature Measurements and Exposure Tolerance
Johnson and Guy [1972] noted that the most investigated and documented effect of RF radiation on biological tissue was the transformation of energy entering the tissues into increased kinetic energy of the absorbing molecules, thereby producing heat in the tissues. The heating resulted from ionic conduction and increased oscillation of dipole molecules such as water and protein. The power absorbed by the tissues will produce a temperature rise that is dependent on the cooling rate of the tissues and duration of exposure. The relation between power absorption
21

Technical Report Microwave Induced Retinal Effects
and temperature rise is extremely complex. The SARs employed in the present study can potentially impose a significant thermal load to the experimental subjects. Because localized RF exposure was employed, it was necessary to assess the temperature at the local exposure area and at the whole-body level. The purpose of this study was to identify the maximum R-SAR that could be administered in an unanesthetized monkey under the exposure configuration employed. Behavioral endpoints (excessive restlessness and vocalization) and facial skin (< 43.0 °C, approximately 2 °C lower than the known threshold for thermal burn) and rectal temperatures (< 41.0 °C, approximately 3 °C above that of a sham-exposed chaired monkey) were used to define the upper limit of a tolerable SAR.
A calibrated infrared camera (Amber, Radiance 1) was used to measure the facial skin temperatures hourly including pre-exposure baseline. After the exposure, a YSI 401 thermistor probe (Yellow Spring Instruments) was inserted to a depth of 5 cm through the anal orifice and a thermistor thermometer (Cole-Parmer E-08502-14) was used to read the rectal temperature. Rectal temperature measurement was also performed in representative monkeys exposed to sham exposure, 4, 8, and 20 W/kg R-SAR.
For determination of the upper limit of tolerable exposure, a 5-year old female monkey was used. The monkey was chaired trained and exposed in the same exposure facility as described in section 2.3. Exposures were performed on 4 consecutive days in an ascending order of 10 and 12; 14 and 16; 18; 22 and 26 W/kg R-SAR. The duration was 2 hours for each exposure except the 26 W/kg exposure, which was terminated at 5 minutes into the exposure due to intolerance. To ascertain that 20 W/kg R-SAR was within the tolerance limit of the monkey, this subject was also exposed at 20 W/kg for 4 hours while the facial skin and rectal temperatures were monitored hourly.
22
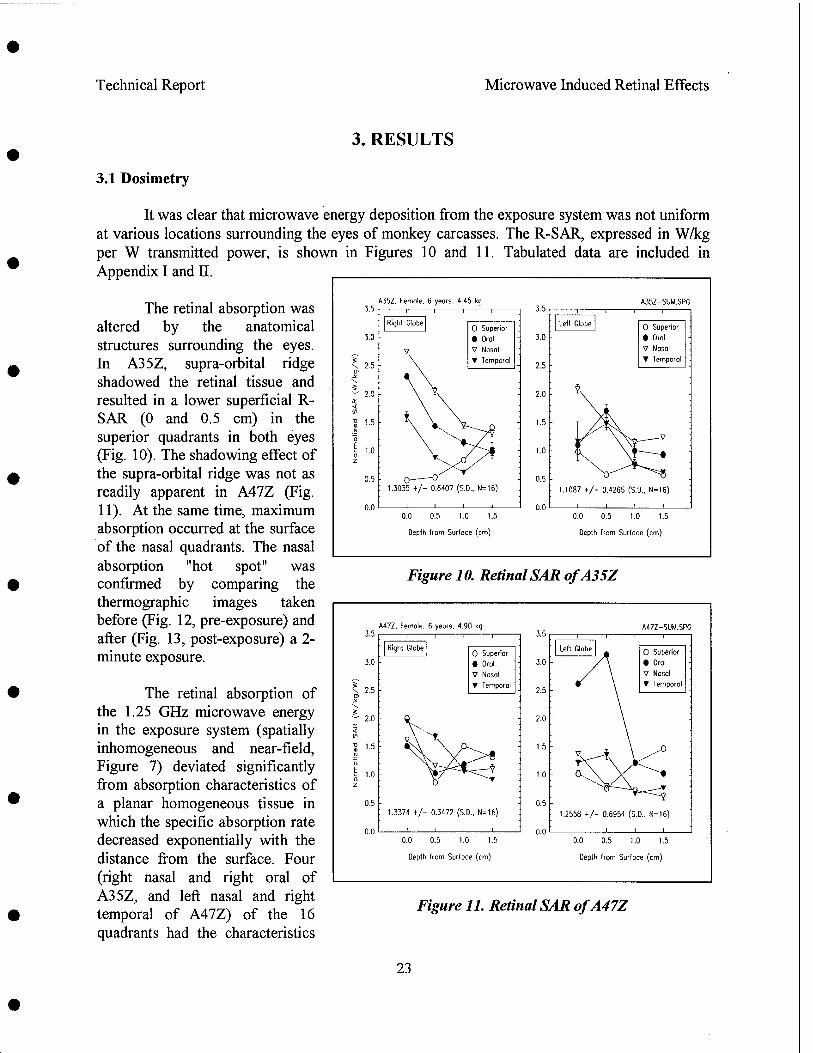
Technical Report Microwave Induced Retinal Effects
3. RESULTS
3.1 Dosimetry
It was clear that microwave energy deposition from the exposure system was not uniform at various locations surrounding the eyes of monkey carcasses. The R-SAR, expressed in W/kg per W transmitted power, is shown in Figures 10 and 11. Tabulated data are included in Appendix I and II.
The retinal absorption was altered by the anatomical structures surrounding the eyes. In A35Z, supra-orbital ridge shadowed the retinal tissue and resulted in a lower superficial R- SAR (0 and 0.5 cm) in the superior quadrants in both eyes (Fig. 10). The shadowing effect of the supra-orbital ridge was not as readily apparent in A47Z (Fig. 11). At the same time, maximum absorption occurred at the surface of the nasal quadrants. The nasal absorption "hot spot" was confirmed by comparing the thermographic images taken before (Fig. 12, pre-exposure) and after (Fig. 13, post-exposure) a 2- minute exposure.
The retinal absorption of the 1.25 GHz microwave energy in the exposure system (spatially inhomogeneous and near-field, Figure 7) deviated significantly from absorption characteristics of a planar homogeneous tissue in which the specific absorption rate decreased exponentially with the distance from the surface. Four (right nasal and right oral of A35Z, and left nasal and right temporal of A47Z) of the 16 quadrants had the characteristics
A35Z, Female. 6 years, 4.45 kg 3.5
3.0
2.5
2.0
1.5
A35Z-SUM.SPG
O Superior
• Oral
V Nosal
T Temporal
1.1087 +/- 0.4265 (S.O.. N=16)
0.0 0.5 1.0 1.5
Oeplh from Surface (cm)
0.0 0.5 1.0 1.5
Depth from Surface (cm)
Figure 10. Retinal SAR ofA35Z
3.5 A47Z, Female, 6 years. 4.90 kg
3.5 A47Z-SUM.SPC
Left Globe Right Globe 0 Superior O Superior
3.0 • Oral
V Nasal
3.0
- /\ • Oral
V Nasal
* 2.5
\ 5 ^ 2.0
▼ Temporal 2.5
2.0
• \ T Temporal
(/I \ ^^ 1 15 ■ ^.\A>s " 1.5
5v--*\ \^° 0
z
^A^ . 1.0
- ^^ ^-v<* 0.5 0.5
1.3374 +/- 0.3472 (S.D., N=16) 1.2558 +/- 0.6954 (S.D., N-16)
0.0 i i i i
0.0 0.5 1.0 1.5 0.0 0.5 1.0 1.5
Deplh from Surfoce (cm) Depth from Surface (cm)
Figure 11. Retinal SAR ofA47Z
23

Technical Report Microwave Induced Retinal Effects
of a depth dependent decrease in SAR. The penetration depths of these four quadrants were 1.80, 1.95, 2.05, and 1.86 cm, respectively. These penetration depths were shallower than the reported penetration depths in tissues of high water content at 915 MHz (3.04 cm) and 1.50 GHz (2.42 cm) [Johnson and Guy 1972]. Due to a narrow beam width, curvature of the ocular globe, and complexity of structure and dielectric properties of tissues within and surrounding the ocular orbit, these penetration depths could only be construed as an end result of many possible combinations of attenuation, refraction, and reflection characteristics of the microwave in a complex object exposed to the 1.25 GHz microwaves. Additional absorption inhomogeneity might be detected if a finer spacing between sensors was used.
The nasal absorption "hot spot" was clearly evident by comparing the thermographic images taken before (Fig. 12, pre-exposure) and after 98.5 W/kg R-SAR exposure (Fig. 13, 2 minute exposure). The warm spot was roughly triangular in shape with the apex between the medial canthi and the base extended downward and laterally to beyond the nostrils.
Figure 12. Pre-exposure Thermographic Image. The ambient temperature was 19.5 °C.
Figure 13. Thermographic Image After Two Minute Exposure. The pulse parameters were 1.25 GHz, 1.0 MWpeak power, 5.56 jus pulse width, 17.44 Hz pps, and 78.8 W averaged transmitted power. Estimated R-SAR was 98.5 W/kg.
The warmest spot around A35Z right eye (Fig. 10) was at the superficial nasal (2.75 W/kg/W) and the coldest at superficial superior (0.48 W/kgAV), a ratio of 5.14. Around the left
24

Technical Report Microwave Induced Retinal Effects
eye of A35Z, the warmest spot was at superficial nasal (2.09 W/kg/W) and the coldest was at the deepest superior spot (0.58 W/kg/W), a ratio of 3.61.
On the other hand, locations of warmest and coldest spots in A47Z were quite different from those of A35Z. Around the right eye of A47Z (Fig. 11), both the warmest (2.01 W/kg/W, superficial) and coldest (0.87 W/kg/W, 0.5 cm in depth) spots were at the superior quadrant. The ratio was 2.32. Around the left eye of A47Z, the warmest spot (3.14 W/kg/W) occurred at 0.5 cm from the surface of the oral quadrant and coldest (0.63 W/kg/W) at deepest of the nasal quadrant. The ratio was 4.98.
While the R-SAR spatial distribution was not uniform varying between eyes and among monkeys, the mean R-SAR over the entire ocular globe was relatively constant between eyes or among animals (Table 1). In fact, the largest ratio among the mean R-SARs of 4 eyes was 1.21. Therefore, the mean R-SAR but not the local R-SAR could be predicted fairly well.
Table 1. Summary of the Retinal Dosimetry in the Monkey*
Monkey Number Right Globe Left Globe
A35Z
A47Z
1.30 ±0.64 (16)
1.34 ±0.35 (16)
1.11 ±0.43 (16)
1.26±0.70 (16)
Average 1.25 ±0.10 (4)
* Values are Mean ± S.D. (n) in W/kgper W net power.
3.2 Behavioral Responses and Signs of Intolerance During Microwave Exposure
The signs of intolerance to the localized exposure were unequivocal. These signs of intolerance were exhibited by monkey B55Z who was reserved for the tolerance study described in the materials and methods section at graded R-SAR from 10 to 26 W/kg. The outward behavior of the monkey was unremarkable in any of the two-hour exposures from 10 to 22 W/kg R-SAR. After an initial restless period, the monkey spent a majority of the time resting and napping. In fact, these were the only outward behaviors observed in any of the experimental groups receiving sham exposures and facial exposures at 4, 8, or 20 W/kg R-SAR. The behavioral intolerance was manifested by B55Z at a 26 W/kg exposure in about 5 minutes. The behavioral signs were arousal from sleep, rapid blinking, and restlessness that resulted in pulling the head out of head holder. Vocalization was not noted. The microwave exposure was terminated when the head was out of head holder. This same monkey was retested at 20 W/kg R- SAR for 4 hours the next day and no intolerance was noted.
25
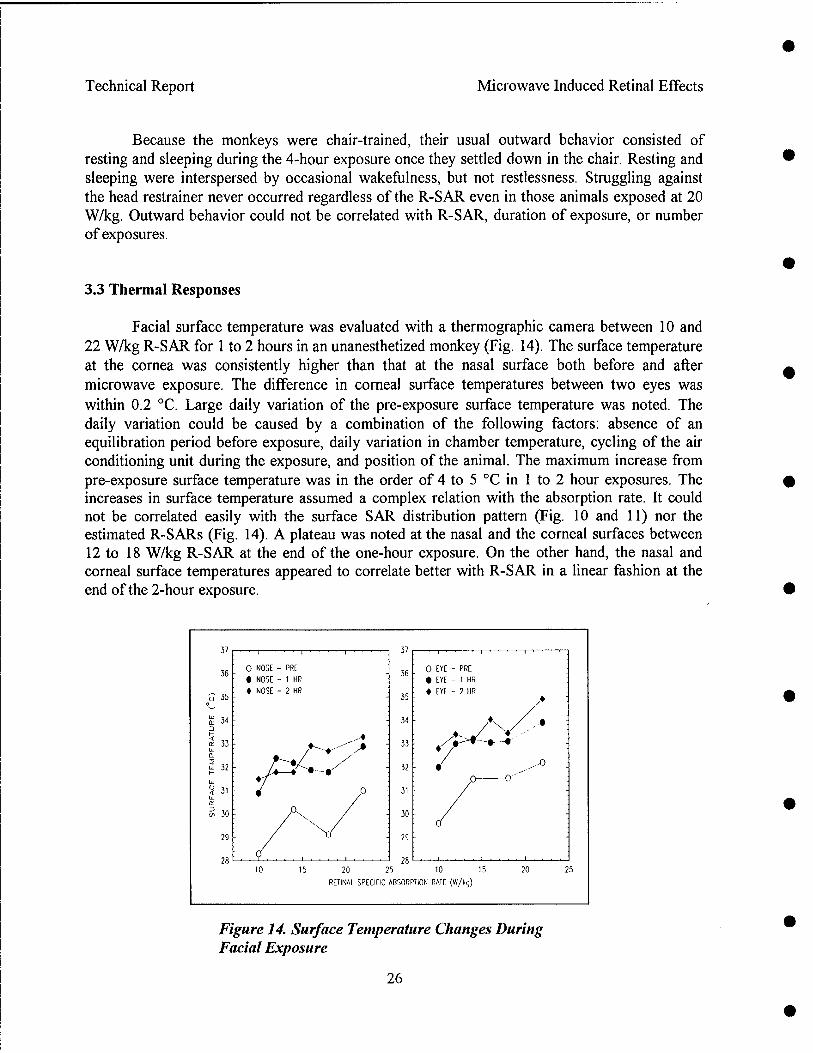
Technical Report Microwave Induced Retinal Effects
Because the monkeys were chair-trained, their usual outward behavior consisted of resting and sleeping during the 4-hour exposure once they settled down in the chair. Resting and sleeping were interspersed by occasional wakefulness, but not restlessness. Struggling against the head restrainer never occurred regardless of the R-SAR even in those animals exposed at 20 W/kg. Outward behavior could not be correlated with R-SAR, duration of exposure, or number of exposures.
3.3 Thermal Responses
Facial surface temperature was evaluated with a thermographic camera between 10 and 22 W/kg R-SAR for 1 to 2 hours in an unanesthetized monkey (Fig. 14). The surface temperature at the cornea was consistently higher than that at the nasal surface both before and after microwave exposure. The difference in corneal surface temperatures between two eyes was within 0.2 °C. Large daily variation of the pre-exposure surface temperature was noted. The daily variation could be caused by a combination of the following factors: absence of an equilibration period before exposure, daily variation in chamber temperature, cycling of the air conditioning unit during the exposure, and position of the animal. The maximum increase from pre-exposure surface temperature was in the order of 4 to 5 °C in 1 to 2 hour exposures. The increases in surface temperature assumed a complex relation with the absorption rate. It could not be correlated easily with the surface SAR distribution pattern (Fig. 10 and 11) nor the estimated R-SARs (Fig. 14). A plateau was noted at the nasal and the corneal surfaces between 12 to 18 W/kg R-SAR at the end of the one-hour exposure. On the other hand, the nasal and corneal surface temperatures appeared to correlate better with R-SAR in a linear fashion at the end of the 2-hour exposure.
36
G 35
a: 34
a 33
2 32
'.i 31
0 EYE - PRE
• EYE - 1 HR
♦ EYE - 2 HR
I , ... I
10 15 20 25
RETINAL SPECIFIC ABSORPTION RATE (W/kg)
Figure 14. Surface Temperature Changes During Facial Exposure
26

Technical Report Microwave Induced Retinal Effects
For a longer duration of exposure at 20 W/kg R-SAR, dynamic change in local body temperatures also varied between exposures of similar intensity (Fig. 15 and 16). It was clearly evident that surface temperatures increased significantly while rectal temperature was maintained at a level lower than the pre-exposure rectal temperature. The nasal surface temperature never exceeded 33.5 °C and corneal surface temperature never exceeded 34.5 °C at 20 W/kg R-SAR. It would require a larger number of experiments to fully characterize the surface temperature response of the animal at various R-SAR used in the present study.
In addition to an elevation of surface temperature above the pre-exposure baseline level, rectal temperatures at 4 and 8 W/kg R-SAR, but not 20 W/kg R-SAR, were elevated above those maintained by the sham-exposed monkeys at the end of 4-hour exposure (Fig. 17). Although a statistically significant thermal effect was detected, none of the rectal temperatures exceeded the level of the pre-exposure rectal temperature.
< cr UJ 0. UJ
40
39
38
37
36
35
34
33
32
31
30
29
28
27
^
=8 S7*
A"" X
/ 20 W/kg R-SAR
• RECTAL ■ : NOSE D : O.D. A : O.S.
| 04/11/97 |
i i i
0 12 3 4
DURATION OF EXPOSURE (HR.)
40 r—
39 -
38 r
37 -
36 :
35 -
34 :
33
32
31
30
29
28
27
| 04/14/97~|
20 W/kg R- SAR
• RECTAL ■ : NOSE □ : O.D. A : O.S.
I 2 3 DURATION OF EXPOSURE (HR.)
Figure 15. Temperature Response of a Monkey Exposed at 20 W/kg R-SAR for 3 hours.
Figure 16. Temperature Response of a Monkey Exposed at 20 W/kg R-SAR for 4 hours.
3.4 Funduscopy
Regardless of the exposure group, pre- and post-exposure fundus pictures were all within normal limits. Scar, tear, edema, hemorrhage, vascular occlusion, vascular tortuousness, abnormal pigmentation, discolored patch, streaks, or hole were not noted. Figure 18 shows the pre- and post-exposure fundus pictures of one representative monkey selected from each of the four experimental groups.
27

Technical Report Microwave Induced Retinal Effects
39.0
38.5
o 38.0
37.5
37.0
~i T"
p-- 0.05 F(3.4ir 777: p' °-01
0 4 8 12 16 20
RETINAL SAR (W/kg) PRE-EXPOSURE
39.0
38.5
38.0
37.5
37.0
Figure 17. Colonic Temperature Responses to Facial Exposures at 0, 4, 8 and 20 W/kg Retinal SAR
Figure 18. Representative Fundus Images (=>). Images from left to right on the top row are sham pre-exposure, sham post-exposure, 4.42 W/kg pre-exposure and 4.42 W/kg post- exposure. Images on the bottom row are 8.14 W/kg pre-exposure, 8.14 W/kg post-exposure, 20 W/kg pre-exposure and 20 W/kg post-exposure. The monkey numbers are the first four letters of the file name.
3.5 Angiography
Again, the pre- and post-exposure angiographies were within normal limits.
28

.3 -t->
o
1 I o Q
0) V D) n E (A 3
V >
a V)
2 a u 0£
?, ° E °> o ■* CO g
N ^
ea
*J LU r- DC
% Q. CO Ol S *
a 5 o <M N ^ TT *
*s
is ^ 0. *- Ol CM £
o 3 N O CM CM r- <
1*- s UJ 3 K 1 Q. o 01 « * a o 5 N o CM CM h- <
r-
(A
111 O U
« a» ■
i-
r- en Ok ^i 3 vi < o
0- CM a E o 4 N X CM CO en
CM
■ l-
r- en O Q. 3 -3 wl
CM 1 o N cn CO CM cn
ti o
P4 *e3 o
o H
cn 3 LU -3 DC e Q.
o < N I CM «0 cn eo
s LU ■
cn 0£ EL
3 Ol
Q § O N ■
cn CO CM cn IO

Technical Report Microwave Induced Retinal Effects
3.6 Electrorctinogram (ERG)
After 30 minutes of dark adaptation, a-wave and b-wave amplitudes and implicit time varied with luminance of the administered light flash. Figure 19 illustrates an example of ERG responses to various luminances over a range of 5.5 log units. The recorded voltage oscillation was expressed as the voltage difference between corneal surface and the indifference electrode. The a-wave was indicated by the first cornea negative deflection of the trace, while the b-wave was indicated by the first cornea positive inflection of the trace following the a-wave. Because of uncertainty in the value of the c-wave in the diagnosis of retinal disease, the c-wave was not evaluated. Both a-wave and b-wave amplitudes (magnitude of deflection or inflection) depended on the luminance of the administered light flash. The a-wave Was not detectable until the
log I
B57Z, DARK ADAPTED. O.D.. 1 0/04/96
Flash onset
TOO ms; 10O /uV
Figure 19. An Example ofElectroretinographic Response- Luminance Relationship of a Dark-Adapted Eye of a Monkey.
luminance reached 0.062 cd-s/m2 (-1.21 log units) or higher. The b-wave could be detected at luminances as low as 0.2 x 10"3 cd-s/m2 (-3.70 log units). The b-wave implicit time (time required to reach the peak inflection) decreased with luminance while amplitude (peak magnitude) increased with the increasing luminance. A similar response (amplitude and implicit time) intensity relationship was also noted in a-wave.
30

Technical Report Microwave Induced Retinal Effects
The ERG response to a dim light flash in the dark adapted eye is accepted clinically as representative of the rod photoreceptor response because of the high sensitivity of rod photoreceptor to a dim light while the cone photoreceptor is insensitive to a dim light. In the present experiment, a dim light flash (3.47 x 10"3 cd-s/m2 or -2.46 log units) was used for electrophysiological evaluation of the rod photoreceptor. It is marked as "rod" in Fig. 19.
Intense light flash can be painful to a conscious person or animal. For this reason, the maximum luminance used clinically is actually dimmer than the luminance that can elicit a maximum ERG response. A painless intense flash is often used clinically to obtain maximum ERG response, a combined response of rod and cone photoreceptors. The luminance used in the present experiment was 2.23 cd-s/m2 or 0.35 log units, which was marked as "max" in Fig. 19.
Although ERG amplitude and implicit time (latency: period from onset of light flash to peak deflection for the a-wave and to peak inflection for the b-wave) of a dark-adapted eye varied with luminance, their relationships to the luminance was by no means simple. Figure 20 shows the complex relationship between implicit time and light intensity. Both the a-wave and fa- wave implicit time decreased with light intensity. The implicit time of the scotopic a-wave and fa- wave reached a minimum at different luminance. The minimum b-wave implicit time appeared to occur around 0.83 cd-s/m2 (-0.08 log units). The minimum a-wave implicit time did not become apparent until the luminance reached 361 cd-s/m2 (2.56 log units).
35
30
B57Z 10/04/96
• O.D. O.S.
1
a —wave
25
20 - *
:
1/)" 15
10 ; • *
• *
• • • - LiJ
l- 5
220
, 4 -3 -2-10 1 2 i
1 1
Q_
200
180
160 r
A •
b—wave
140 : • 120 r * t 100 - s 80 : • 60
40 r * •• •
• • •• • • • • • •" 20
, 1 1 1 1 , 4 -3 -2 -1 0 1 2 3
LOG LUMINANCE (cd-s/m2)
Figure 20. Relationship Between Implicit Time and Flash Luminance.
31

Technical Report Microwave Induced Retinal Effects
The a-wave amplitude increased with luminance above the threshold (Fig. 21). On the other hand, the b-wave intensity-amplitude function was composed of at least two limbs with plateaus or dips at intermediate and intense flash intensities. The first limb of the intensity- amplitude function could be fitted with a sigmoid function such as a Naka-Rushton function described in the materials and methods section. Two constants, Rmax and k can provide additional insight into the mechanism of retinal degenerative diseases involving rod photoreceptors. Solid lines in Figure 21 were the Naka-Rushton function fitted to the first limb of the intensity- amplitude curve. The Rmax and k of the Naka-Rushton function were also evaluated routinely.
B57Z 10/04/96
800 i- O.D.
i '
• b—wove
I ' ' ' ' i
■ o —wove
i i i I i
- 700 r •• • • • • • 600 • • • -. 500 _——•-•-• -. 400 •^-~~*~v^^ -
300 ■ ■ ■ ■ ■ ■ J
a. 200
100
r •s m
m
-
LxJ 0 -■ m- * ■ Hi *±JLE Q _.—,—,—._ 1 —,—.—i.
~) -4 -3 -2 -1 0 1 2 3
_J 900 I ' ,....,... 1
CL
< 800
700 O.S.
• • •
600 r • • • •
• # •
500 •
400 ß-^-~~*~i~ 300 - • ■ ■ ■ ■ ■ J
200 - m. m
100 - m
0 •"""^ m _ ■ ■ ■
_ 4 -3 -2 -1 0 1 2 ^
LOG LUMINANCE (cd-s/m2)
Figure 21. ERG Amplitudes and Flash Luminance
If light flashes are rapidly repeated (flicker), the slowly changing and delayed components of the ERG response tend to cancel out with increasing stimulus frequency while other ERG components having a shorter time course are more resistant to flicker and, thus, stand out clearly. The flicker response has been proven to be one of the most useful methods for analysis of visual function. Clinically, light flashes are repeated at 30 Hz for a short interval. An
32

Technical Report Microwave Induced Retinal Effects
example of ERG response to 30 Hz flicker is illustrated in Figure 22. This method was also included in the present experiment for identifying the visual dysfunctions.
In comparison to ERGs obtained in a dark-adapted eye, both a-wave and b-wave amplitudes were attenuated in a light-adapted eye due to a slow recovery of rod photoreceptor pigments from photo-bleaching. Therefore, ERG response in a light-adapted eye is accepted as a test of cone photoreceptor function because the response to light stimuli in a light-adapted eye is relatively free of a significant contribution by rod photoreceptors. An example of such reduction in response to a clinical "max" photic stimulus (2.23 cd-s/m or 0.35 log units) is shown in Fig. 23. The background illumination for light adaptation was 28.8 cd/m2. The ERG response in a light-adapted eye was used as an electrophysiological method to evaluate cone photoreceptor function. The method was used routinely in the present experiment as part of the test battery.
uU/Jiv
uU/Jiv
Electroretinogram
l: «Hpl tude = 93.2 «V 2! Anplitude = 99.9 ul lap. line : '28.1 ns luv'. Tine =' 29.1 as
5 as pen1 Division
1-362 2-3(3
Figure 22. An Example of 30 Hz Flicker Response. To obtain the flicker response, 2.23 cd-s/m2 light flashes were repeated at 30 Hz.
Electroretinogram
5 tts pep Division
1-2J2 2-273 3-294 4-295
Figure 23. ERG Responses to a 2.23 cd- s/m2 Light Flash in a Dark-adapted (trace 1 and 2) and Light-adapted (28.8 cd/m2, trace 3 and 4) Eye. R denotes the right eye andL, left eye.
Another ERG component of interest is so called "oscillatory potentials." Oscillatory potentials are high frequency ripples at the ascending portion of the b-wave. These ripples are very sensitive to retinal ischemic changes, and a reduction in their amplitude can even precede the appearance of retinopathy [Bresnick 1984]. Examples of oscillatory potentials can be found in Fig. 19 and 23. If the stimulus luminance is intense enough, oscillatory potentials can be obtained by using a 75 Hz high-pass filter. Alternatively, oscillatory potentials can be extracted from ERG traces obtained with a low-cut filter by subtracting the smoothed trace by a moving average from the original trace. An example of the extracted oscillatory potentials by the latter technique is shown in Fig. 24. Five wavelets could be identified. The amplitude indicated was the combined amplitude of the first two wavelets. For consistency, oscillatory potentials were
33

Technical Report Microwave Induced Retinal Effects
always extracted from ERG records obtained by the standard maximum response protocol, i.e., 2.23 cd-s/m2 in a dark-adapted eye.
Because of these luminance-response relationships, the following ERG results are presented as the ratio of post-exposure to pre-exposure responses obtained in defined test conditions. Unless a significant main effect was observed by analysis of variance, no further statistical evaluation was performed.
Intensity - Response ERG
w 0 D 50 H uU/div w hi fc
50 uU/div
l: O.P. Anplitude = 284.9 uU 2: O.F. Amplitude = 202,4 uV 111 11 i 11 111111111 111 11 ■ < i 11 ■ 111 > i i i i 11 ■ 11 ■ i i »11 ■ * 11 <
5 ms pep Division
1-272 2-273
Figure 24. An example of Extracted Oscillatory potentials
3.6.1 Rod Response
The rod response was obtained from a dark-adapted eye with a 3.47 x 10"3 cd-s/m2 white flash. Only the b-wave could be ascertained. The rod b-wave amplitude (Fig. 25, Appendix 3) and implicit time (Fig. 26, Appendix 4) were not affected significantly by the microwave exposures at 4, 8 and 20 W/kg R-SAR.
34

Technical Report Microwave Induced Retinal Effects
ROD RESPONSE, b-WAVE 180
170 -
160
_ 150 &e ~~^ 140 o
° 1 30 QL <L> -D 120 ZJ
Q. 110 E "* 100
90
80
70
(10)
F(3.30)= 1-10; N-S-
//,
(S) (10)
V7777,
'//. (6)
4 8 12 16
Retinal SAR (W/kg)
20
Figure 25. Rod b-wave Amplitude
ROD RESPONSE b-WAVE
F(3.30)=2-17^ N-s- ;
105 (1 0) •
100 -
II (8)
95 " PA (10)
- §§ -_
90 m (6) -
■
:
A 1 1 w.
85
vx 1 # I
4 8 12 16
Retinal SAR (W/kg)
20
Figure 26. Rod b-wave Implicit Time
35

Technical Report Microwave Induced Retinal Effects
3.6.2 Combined Rod and Cone Response
The combined rod and cone response was obtained in a dark-adapted eye with a 2.23 cd- s/m white flash. The appearance of a-wave and b-wave could be ascertained. The post/pre combined rod and cone b-wave amplitude ratios (Fig. 27, Appendix 5) were not different statistically among sham-, 4, 8 or 20 W/kg R-SAR exposed monkeys. On the other hand, a significant main effect was noted in the post/pre ratio of the combined rod and cone b-wave implicit time (Fig. 28, Appendix 6). Student's t-test indicated that post-exposure appearance of b-wave was accelerated significantly (a shortened implicit time) in monkeys exposed at 8 W/kg R-SAR only.
120
E
COMBINED RESPONSE, b-WAVE
(10) (8)
M
lb
F(3.3or 1f56: N'3-
(10)
■ (6)
"ZW/
0 4 8 12 16
Retinal SAR (W/kg)
52
m 4
Figure 2 7. Combined b-wave Amplitude
A main effect was not statistically significant for the post/pre ratio of the combined rod and cone a-wave amplitude (Fig. 29, Appendix 7) or implicit time (Fig. 30, Appendix 8).
3.6.3 Oscillatory Potentials
The oscillatory potentials were the combined amplitude of the first 2 oscillatory potentials extracted from the combined rod and cone response in the dark-adapted eye elicited by a 2.23 cd-s/m2 white flash. Facial microwave exposures did not significantly alter the post/pre amplitude ratio of the oscillatory potentials (Fig. 31, Appendix 9).
36

Technical Report Microwave Induced Retinal Effects
COMBINED RESPONSE. b-WAVE
(8)
95
90
(10)
X
V/ 85 '
'//,
F = 4.49; p< 0.05 (3.30)
▼ : p< 0.05 by t-test
(10)
I (6)
w A i-
4 8 12
Retinal SAR (W/kg)
16 20
F/g«re 2& Combined b-wave Implicit Time
COMBINED RESPONSE. a-WAVE
125
120
115
8 HO _o "o 105
<U -o 100
< 90
85
80
(8)
(10)
F ,= 2.66; N.S. f(3.30)
(10)
(6)
w/4
^i w,
4 8 12
Retinal SAR (W/kg)
16 20
Figure 29. Combined a-wave Amplitude
37

Technical Report Microwave Induced Retinal Effects
COMBINED RESPONSE. a-WAVE
105
o 100
95
1 1 1 1 1 1
E(330)= 1.73; N.S. :
1 do) (8) :
[ (io) ;
P 1 § fKi 1 -
} § w
i i
8 12 16
Retinal SAR (W/kg)
Figure 30. Combined a-wave Implicit Time
COMBINED RESPONSE, OSCILLATORY POTENTIAL 240
220
200
£S 180 o
"5 1R0 Q: a) "5 140
j= 120 <
100
80
60
F(3.30,= 288^ N' (10)
(10) I (8)
(6)
B
"i m
4 8 12 16
Retinal SAR (W/kg)
20
Figure 31. Oscillatory Potentials of the Combined Rod and Cone Response
38

Technical Report Microwave Induced Retinal Effects
3.6.4 30 Hz Flicker Response
The 30 Hz flicker response was obtained in the dark-adapted eye elicited by 2.23 cd-s/m white flashes operated at 30 Hz. Facial microwave exposures did not significantly affect the post/pre amplitude ratio of the 30 Hz flicker response in the dark-adapted eye (Fig. 32, Appendix 10).
30 Hz FLICKER RESPONSE
E <
(10)
(6)
CO)
(8)
^ WZ77X V/M 8 12 1«
Retinal SAR (W/kq)
20
Figure 32. Amplitude Ratio of the 30 Hz Flicker Response
3.6.5 Cone Response
Cone response referred to the ERG response in a light adapted eye to a light flash (2.23 cd-s/m2) with a 28.8 cd/m2 background illumination. A significant main effect was noted in the post/pre b-wave amplitude ratio (Fig. 33, Appendix 11). In comparison to the sham exposed group, the post/pre b-wave amplitude ratio increased in monkeys exposed at 8 and 20 W/kg R- SAR. An example of the post-exposure enhancement of b-wave amplitude is shown (Fig. 34).
Because an amplitude ratio was used, pre-exposure and post-exposure amplitudes were examined further in detail (Fig. 35). Results of statistical analysis by paired t-test on correlated data from each individual eye indicated that the post-exposure amplitude was consistently higher than the pre-exposure amplitude in monkeys exposed at 8 and 20 W/kg R-SAR. However, the post-exposure b-wave amplitude was not truly "supra-normal" in monkeys exposed at 8 and 20
39

Technical Report Microwave Induced Retinal Effects
W/kg R-SAR because these microwave exposures did not enhance the photopic b-wave out of the normal range observed in the untreated controls (Shams).
CONE RESPONSE, b-WAVE 170
a.
3 130
E < 120
F = 3.68; p- 0.05 (3.30) '
(6)
(8)
(10)
y/x/A V/X/A
(10)
«
8 12 16
Retinal SAR (W/kq)
Figure J5. Effect of Microwave Exposure on Cone b-wave Response
Electroretinogram
5 «s per Division
1-4« 2-450 3-452 4-934 5-936 t-938
Figure 34. An Example of Post-exposure b-wave Enhancement of Cone Response. Trace 1, 2 and 3 are pre-exposure cone responses. Trace 4, 5, and 6 are post-exposure responses.
40
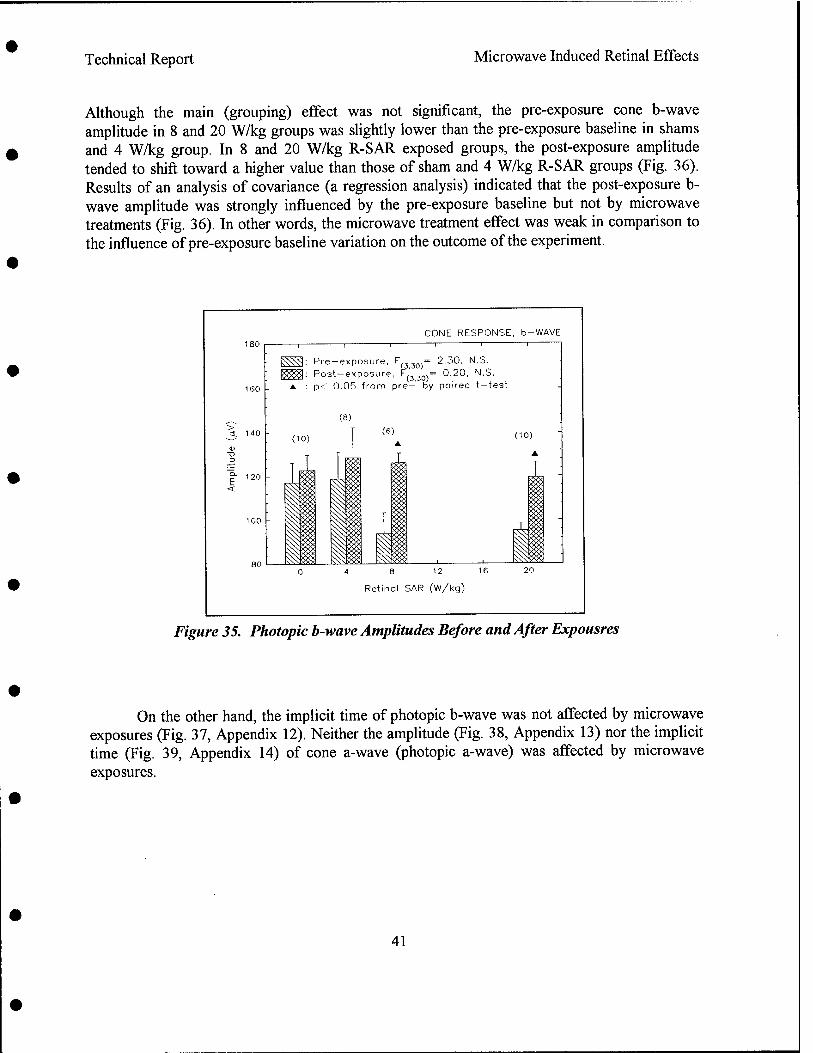
Technical Report Microwave Induced Retinal Effects
Although the main (grouping) effect was not significant, the pre-exposure cone b-wave amplitude in 8 and 20 W/kg groups was slightly lower than the pre-exposure baseline in shams and 4 W/kg group. In 8 and 20 W/kg R-SAR exposed groups, the post-exposure amplitude tended to shift toward a higher value than those of sham and 4 W/kg R-SAR groups (Fig. 36). Results of an analysis of covariance (a regression analysis) indicated that the post-exposure b- wave amplitude was strongly influenced by the pre-exposure baseline but not by microwave treatments (Fig. 36). In other words, the microwave treatment effect was weak in comparison to the influence of pre-exposure baseline variation on the outcome of the experiment.
CONE RESPONSE, b-WAVE
160
a. 140
E <
Pre-exposure, F. .= 2.30, N.S. Post-exposure, F(3J0)= 0.20, N.S. p< 0.05 from pre- by paired t-test
(10)
0 4 8 12 16 20
Retinal SAR (W/kg)
Figure 35. Photopic b-wave Amplitudes Before and After Expousres
On the other hand, the implicit time of photopic b-wave was not affected by microwave exposures (Fig. 37, Appendix 12). Neither the amplitude (Fig. 38, Appendix 13) nor the implicit time (Fig. 39, Appendix 14) of cone a-wave (photopic a-wave) was affected by microwave exposures.
41

Technical Report Microwave Induced Retinal Effects
200 CONE RESPONSE. b-WAVE
o • Sham D 4 W/kg A B W/kg ♦ 20 W/kg
100 150 PRE-EXPOSURE AMPLITUDE (/iV)
Figure 36. Relationship between Post-exposure and Pre-exposure Photopic b-wave Amplitudes
110 CONE RESPONSE. b-WAVE
a. 90
(10) (8)
Ä (6)
X 7Z77Z
w
F = 2.08; N.S.
(10)
8 12 16
Retinal SAR (W/kg)
i y
Ä 20
Figure 3 7. Cone b-wave Implicit Time and Microwave Exposure
42

Technical Report Microwave Induced Retinal Effects
o 140
£ 120 <
(10)
CONE RESPONSE, ci-WAVE -i r~
F(3.3or a47; N-s-
(6)
%.
(8)
i o 4 a 12 1 e
Retinal SAR (W/kg)
(10)
y,
Figure 38. Cone a-wave Amplitude and Microwave Exposures
CONE RESPONSE, a-WAVE
(10)
F(3.30)= °-97' NS-
(10)
Z
(8)
L (6)
m. ■M 0 4 8 12 1
Retinal SAR (W/kg)
6 20
Figure 39. Cone a-wave Implicit Time and Microwave Exposure
43
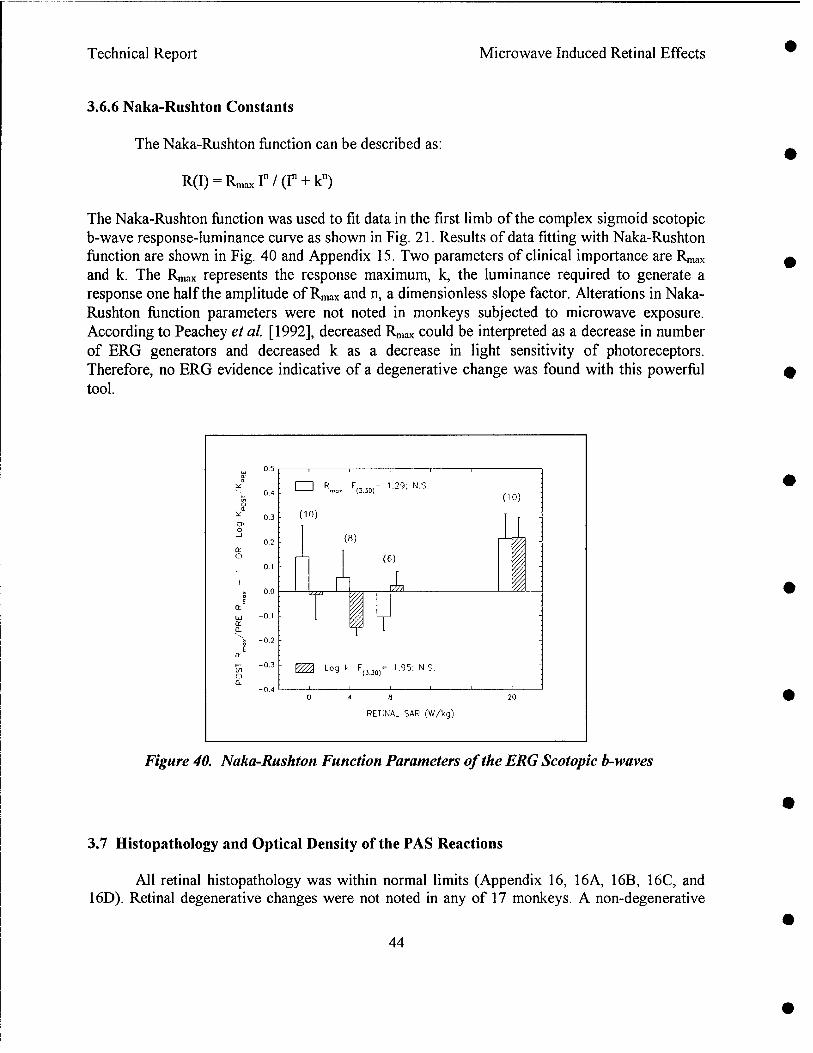
Technical Report Microwave Induced Retinal Effects
3.6.6 Naka-Rushton Constants
The Naka-Rushton function can be described as:
R(I) = RmaxIn/(In + kn)
The Naka-Rushton function was used to fit data in the first limb of the complex sigmoid scotopic b-wave response-luminance curve as shown in Fig. 21. Results of data fitting with Naka-Rushton function are shown in Fig. 40 and Appendix 15. Two parameters of clinical importance are Rmax
and k. The Rn,ax represents the response maximum, k, the luminance required to generate a response one half the amplitude of Rmax and n, a dimensionless slope factor. Alterations in Naka- Rushton function parameters were not noted in monkeys subjected to microwave exposure. According to Peachey et al. [1992], decreased Rmax could be interpreted as a decrease in number of ERG generators and decreased k as a decrease in light sensitivity of photoreceptors. Therefore, no ERG evidence indicative of a degenerative change was found with this powerful tool.
0.4
0.3
0.2
0.1
0.0
-0.1
-0.2
-0.3
-0.4
□ R™. F(3.3or U2g- N-;
(10)
(10)
(8)
(6)
i I
f T Log k F(3J0)= 1.95; N.!
0 4 8
RETINAL SAR (W/kg)
Figure 40. Naka-Rushton Function Parameters of the ERG Scotopic b-waves
3.7 Histopathology and Optical Density of the PAS Reactions
All retinal histopathology was within normal limits (Appendix 16, 16A, 16B, 16C, and 16D). Retinal degenerative changes were not noted in any of 17 monkeys. A non-degenerative
44

Technical Report Microwave Induced Retinal Effects
retinal change was noted, consisting of an enhancement in uptake of the Periodic Acid Schiff (PAS) stain Figure 41 shows examples of PAS negative images in the left-hand column and PAS positive images in the right hand column. In comparison with images in the left-hand column images on the right hand column showed darker cone photoreceptors (brilliant red under microscope, PAS positive). The increased uptake of PAS stain was in the inner segments of the cone photoreceptors, mainly in the myoid and in the outer area surrounding the ellipsoid. The PAS uptake enhancement could be uniform or vary between photoreceptors. Distortion in outer segments was noted due to imperfect tissue fixation. No other histopathologic change was noted in these retinas.
45

Technical Report Microwave Induced Retinal Effects
Figure 41. PAS Enhancement (•*). These are representative photomicrographs from monkeys exposed 4 hours daily, 3 days per week for 3 weeks, a total of 9 exposures. Both PAS positive (right column) and negative (left column) are included Comments on morphology of outer segments are also included
46
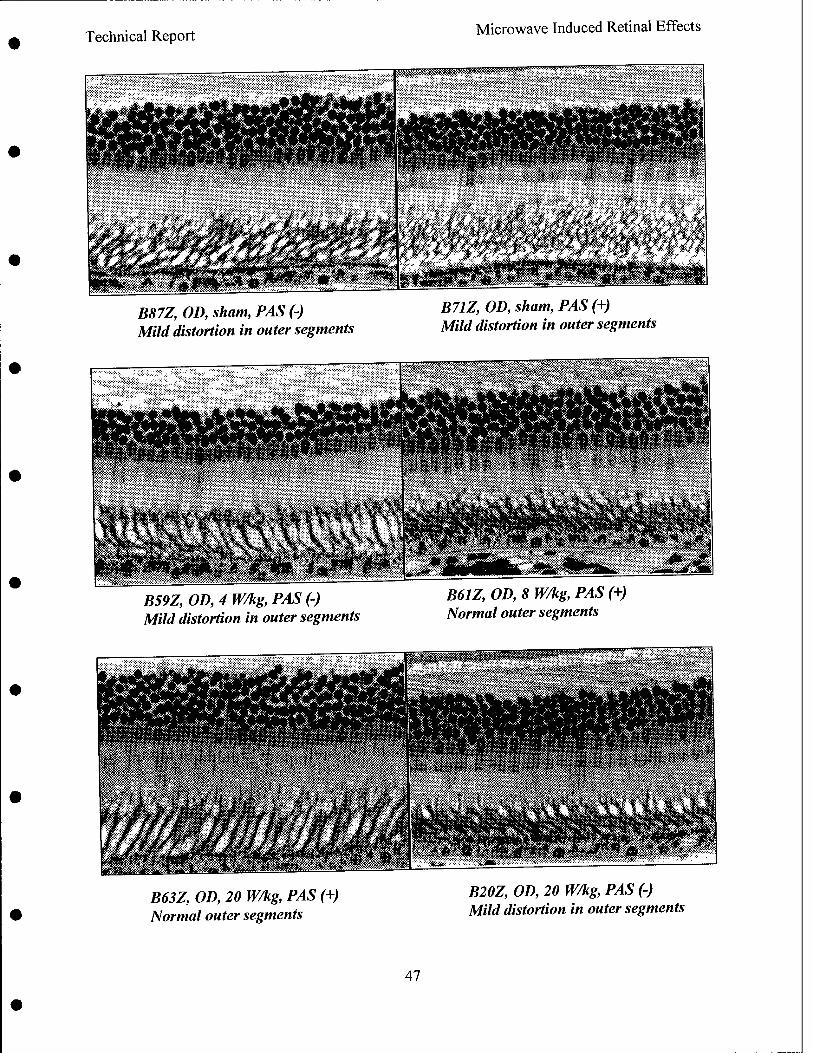
Technical Report Microwave Induced Retinal Effects
B87Z, OD, sham, PAS (-) Mild distortion in outer segments
B71Z, OD, sham, PAS (+) Mild distortion in outer segments
■rrz —"^ *» - ■ %* ~ ~
B59Z, OD, 4 W/kg, PAS (-) Mild distortion in outer segments
B61Z, OD, 8 W/kg, PAS (+) Normal outer segments
B63Z, OD, 20 W/kg, PAS (+) Normal outer segments
B20Z, OD, 20 W/kg, PAS (-) Mild distortion in outer segments
47

Technical Report Microwave Induced Retinal Effects
The occurrence rate of PAS positive cone photoreceptors is shown in Table 2 and Appendix 16. The rates of PAS positive were equal between retinas of shams and 20.2 W/kg exposed monkeys. The PAS positive was not found in any of 4 monkeys exposed at 4.3 W/kg. In contrast, PAS positive was found in every retina examined in 3 monkeys exposed at 8.4 W/kg.
Table 2. Occurrence Rate of the PAS Positive Microscopically
SAR Number of Eyes Number of Eyes (W/kg) with Enhanced PAS Examined
0 2 5
4.3 0 4
8.4 3 3
20.2 2 5
To ascertain the difference in PAS reaction, the optical density of the photoreceptors' inner segment was evaluated. The microwave treatment, PAS reactivity, optical density of the inner segment, and post-exposure photopic (cone) b-wave amplitude are tabulated in Appendix 17. It was clearly evident that post-exposure photopic (cone) b-wave amplitude did not correlate with the optical density of PAS, an index of glycogen storage (Fig. 42).
3 UJ o
a o \— o
in o 0-
r>
22U i i i i | i > i i | ■ i i i -"■'! ' 1 ' ' • ' 1 ' ' ' ' 1 ' ' . . | . 1 . , . . T ! | • 1 1 1 | . 1 1
o SHAM. PAS - ■
200 • A B
SHAM, PAS + 4 W/kg, PAS - 8 W/kg. PAS +
-
i«n O 20 W/kq. PAS - -
A
♦ 20 W/KG. PAS + "
160
140 ■ •
:
120
O
o o
■ ■
100 L o A
4*
:
80 1 A -
50 60 70 80 90 100 110 120 130 140 150 160
PA? OF'TICAL DENSITY
Figure 42. Microwave Exposures, Microdensitometry, PAS Reactivity and Post-exposure Photopic b-wave Amplitude
48

Technical Report Microwave Induced Retinal Effects
A demarcating line in PAS optical density (« 80, dotted line) could be used as a criterion to separate the PAS reactivity (positive or negative) during the microscopic evaluation. Quantitatively, the PAS optical density was not different among treatment groups (F(313)= 1.28; N.S.).
3.8 Special Cases, B06Z and 748Z
Alterations in ERG and/or retinal degeneration were noted in these two monkeys. Because of unusual case histories of these two monkeys, they were treated as special cases. In order to determine the ERG abnormality, the normal range (mean ± 2 S. D.) was determined from all the pre-exposure ERG baselines excluding these two special cases. These normal ranges are included in Appendix 18.
3.8.1 Monkey B06Z
Monkey B06Z was a 5-year old, 5.6-kg male rhesus monkey, who was exposed nine times to L-band, microwaves at 8.6 W/kg average R-SAR. During the pre-exposure ERG baseline determination, difficulty was encountered in anesthetizing B06Z with ketamine- xylazine. Four additional supplemental doses of ketamine-xylazine (28-mg ketamine and 5.6 mg xylazine per supplemental dose, 5 mg/kg ketamine and 1 mg/kg xylazine) were administered successively to achieve a stage of surgical anesthesia for ERG determination. Subsequently, monkey B06Z developed loose bowel movements during microwave exposure. The symptom was recurrent in nature and would appear during the later part of each weekly exposure, returning to normal after the animal was returned to vivarium. Twenty-four hours after the completion of 3 weekly exposures (9 exposures total), significant weight loss (1.2 kg) was noted. Because of this unusual occurrence, necropsy was requested after the completion of all post- exposure experimental procedures. Typhylocolitis was diagnosed (Appendix 19).
The pre-exposure baseline was all within normal limits, including fundus pictures, angiograms, and electroretinograms. Post-exposure fundus pictures and angiograms remained within normal limits. However, a host of ERG abnormalities was noted. These ERG abnormalities were bilateral depression of rod b-wave amplitude (Fig. 43, Appendix 3), bilateral depression of combined rod and cone b-wave amplitude (Fig. 44, Appendix 5), unilateral depression (O.S.) of combined rod and cone a-wave amplitude (Fig. 44, Appendix 7), bilateral depression of 30 Hz flicker amplitude (Fig. 45 and 46, Appendix 10), bilateral depression of cone b-wave amplitude (Fig. 47, Appendix 11), and bilateral depression of cone a-wave amplitude (Fig. 47, Appendix 13). Changes in implicit time were variable. They were normal rod b-wave implicit time (Fig. 43, Appendix 4), accelerated appearance of combined rod and cone b- wave (Fig. 44, Appendix 6), delayed appearance (O.S. only) of combined rod and cone a-wave (Fig. 44, Appendix 8), normal cone b-wave implicit time (Fig. 47, Appendix 12), and delayed appearance of cone a-wave (Fig. 47, Appendix 14). The post-exposure oscillatory potentials were lower than the pre-exposure oscillatory potentials in this monkey (Fig. 48, Appendix 9).
49

Technical Report Microwave Induced Retinal Effects
However, both pre-exposure and post-exposure oseil.atory po.e„,ia,s of B06Z were within normal limits due to a greater variation of the oso.lla.ory potenPals.
Intensity - Response ERG
5 »s nr Bi»ision
1-W5 2-119 3-W1 4-«2
Figure 43. Rod Response ofB06Z. Trace 1 and 2 are pre-exposure baseline. Trace 3 and 4 are post-exposure ERG. R denotes O.D., andL, O.S. Post-exposure depression ofb-wave amplitude is clearly evident.
Electroretinogram
S K UP livisim
1-M7 2-521
Figure 45. 30 Hz Flicker Response ofB06Z Right Eye. Trace 1 was pre-exposure baseline, and trace 2, post-exposure. The post-exposure amplitude was depressed
Intensity - Response ERG
SKI» linision
1-031 2-132 3-5113 *"584
Figure 44. Combined Rod and Cone Response ofB06Z. For legends, see Fig. 43. Post- exposure a-wave and b-wave amplitudes were depressed The b-wave was accelerated or aborted, while a-wave was delayed slightly.
Electroretinogram
w 0 D H H iJ
a S
l: «wlltuie : M.* «V 21.5 III IIVIIIU«* " ."•» " "■ ■■—,--■7— _'-i/'
SM|» livision
1-04B 2-522
Figure 46. 30 Hz Flicker Response ofB06Z Left Eye. For legends, see Fig. 44. The post- exposure amplitude was also depressed
50

Technical Report Microwave Induced Retinal Effects
Electroretinogram
5 us IP» Division
1-957 2-958 3-531 4-532
Figure 47. Cone Response ofB06Z. For legends, see Fig. 43. Post-exposure b-wave amplitudes were depressed and a-wave amplitudes were not Post-exposure a-wave implicit time was delayed but b-wave implicit time was within normal limit
Intensity - Response ERG
» 29 Q uV/Jiv
P H H
*-) 29 ft uV/Jiv
2
35
i-»IA i UJJ'H
.ftU J^APx jKflj'U)4y-^/-vv\^^^A^'^VV-^^--Wv-^
1: t,P, Wl i tu Je : 117.« Iä 2: 0,P, AwlituJe = 31,5 nil
5 us pep Division
1-931 2-5B3
Figure 48. Oscillatory Potentials ofB06Z Right Eye. Trace 1 is pre-exposure baseline and 2, post-exposure data. The amplitude of post-exposure wavelets was greatly depressed Due to large variation in oscillatory potentials in rhesus monkeys, the post-exposure change was within normal ranges.
Histopathologically, mild scatter karyolysis (Fig. 49) and a small foveal/macular detachment were found. The retinal detachment was a very well circumscribed area circular in shape 3.5 mm in diameter and a maximum separation of 1 mm under the fovea (Fig. 50). The separation occurred between the outer segments of the photoreceptor layer and the pigmented epithelium layer. The karyolysis was indicated by lack of hematoxylin staining of the nuclei sap of cone photoreceptors. The content and morphology of chromatin was more variable. Karyolysis of cone photoreceptors was associated with the detachment; it was more abundant in the center of detachment and was rarely seen outside the detachment.
3.8.2 Monkey 748Z
Monkey 748Z was a 9.5-year-old, 8.6-kg male rhesus monkey who was used to simulate the repetitive ketamine/xylazine doses used in monkey B06Z. Four weeks prior to microwave exposures, ketamine and xylazine were administered according to the dose schedule of B06Z, i.e., 86 mg (10 mg/kg) ketamine followed by 4 supplemental doses of 44 mg (5 mg/kg) ketamine and 8.8 mg (1 mg/kg) xylazine separated by a 5 minute interval between doses. The monkey was subsequently exposed to the L-band microwaves at 4.1 W/kg average R-SAR 4 hrs/day and 3 days/week for 3 weeks to a total of 9 exposures.
51

Technical Report Microwave Induced Retinal Effects
Figure 49. Karyolysis of the Cone Photoreceptors. This photomicrograph was obtained from B06Z. Several nuclei in the outer nuclear layer showed a lacking of staining.
•■& H %, $"'■ V'i SWv.tr'ii'V'V'-W'j'-v -■: ■•.i .;■: ■:■:*■>%A"? > .-,>■-. ■■■:•■>■ -w-gi *.■• .J ,• ■•><?»•. ; J-".'-:v- ■, .■• .>*
Figure 50. Retinal Detachment ofB06Z.
52

Technical Report Microwave Induced Retinal Effects
The pre-exposure baseline including fundus pictures, angiograms and ERG were all within normal limits. Post-exposure fundus pictures and angiograms were also within normal limits. Post-exposure ERG showed a minor depression in cone photoreceptor function from its pre-exposure baseline. The post-exposure/pre-exposure ratio of the 30 Hz flicker amplitude (Appendix 10, O.D.= 48 %, O.S.= 53 %) and cone b-wave amplitude (Appendix 11, O.D.= 61 %, O.S.= 68 %) were depressed. However, the absolute magnitude of the post-exposure 30 Hz flicker amplitude and cone b-wave amplitude were within the population normal limits (Appendix 18). On the other hand, absolute magnitude of the combined rod and cone b-wave amplitudes from both eyes (Appendix 5) was below the lower limit of the population (Appendix 18) but not the post-exposure/pre-exposure ratio. A low but within normal limits pre-exposure combined rod and cone b-wave amplitude was the main contributor to the failure of revealing a reduced post-exposure/pre-exposure ratio. Other than a positive PAS reaction, no other histopathologic changes were noted (Appendix 16).
53

Technical Report Microwave Induced Retinal Effects
4. DISCUSSION
4.1 The Present Study
Monkeys were exposed for a total of 36 hours to pulsed microwaves at 1.30 MW/kg spatially averaged temporal peak retinal R-SAR, and spatially and temporally averaged R-SARs of 4.28, 8.44 and 20.16 W/kg. No evidence of retinal injuries was found in clinical morphology (abnormal fundus picture or angiogram), histopathology (degeneration), or electrophysiology (depressed a- or b-wave amplitudes, and delayed a- or b-wave implicit times). These negative findings are in contrast to previous reports of "microwave-induced retinitis" characterized by photoreceptor degeneration and ERG amplitude depression in monkeys subjected to similar microwave exposure at a local ocular SAR of 4 W/kg [Kues et a\. 1989a, 1989b, 1991, 1994, Kues and McLeod 1990, Kues and Monahan 1992].
Methods used to determine early retinopathy in the present study included ophthalmoscopy, electroretinography, and histological examinations. These procedures are well established in retinal toxicity testing identifying retinotoxins such as organophosphate pesticide (Fenthion) and anthelmintic Amoscante [Imai et al. 1983, Maertins et al. 1993]. It has been concluded that ERG inhibition appeared before any structural damage could be detected. Apparently, the absence of demonstrable retinal injuries (degeneration) caused by microwave exposure in the present study was not a result of technical inadequacies or a lack of sensitivity in detecting retinal injury caused by microwave exposure.
4.2 Effects in Current Experiment
In contrast to Kues' findings, no evidence of histological and electrophysiological changes was found in 12 monkeys exposed at 4 to 20 W/kg retinal SAR or 5 sham-exposed monkeys (a total of 17 animals). Instead, histopathological and electrophysiological changes such as enhanced periodic acid Schiff (PAS) reactivity of cone photoreceptors, enhanced photopic (cone) b-wave amplitude and shortened combined b-wave implicit time were found. None of these changes are accepted indications of degenerative change in the retina. Therefore, Kues' hypothesis on retinal susceptibility to pulsed microwave induced retinal degeneration (injury) was not supported by the results of the present study.
4.2.1 Enhanced ERG Amplitudes
An extensive ERG evaluation was performed in the present study in microwave-exposed and sham-exposed monkeys. The ERG rod (scotopic) response was evaluated under a standard protocol recommended by the International Society for Clinical Electrophysiology of Vision [Marmor and Zrenner 1995], and by Naka-Rushton intensity-response functions [Severns and Johnson 1993, Massof et al. 1984]. The ERG cone (photopic) response was also evaluated under a standard protocol and by 30-Hz flickers. In addition, standard mixed response (maximum response) and oscillatory potentials were evaluated. Effects of microwave exposures were evaluated against values obtained in sham-exposed monkeys as a post-exposure/pre-exposure ratio and as absolute magnitudes. From these results, it was concluded that cone photoreceptors are more susceptible than rod photoreceptors to enhancement effects of microwave exposure. However, reduction (inhibition) in ERG cone response was not noted unless other confounding
54

Technical Report Microwave Induced Retinal Effects
factors were present (high ketamine dose, colitis, special cases, 748Z and B06Z). It is evident that the post-exposure/pre-exposure ratio with pre-exposure baseline serving as control within each individual was more sensitive than absolute magnitude in which individual variation was taken into consideration (Appendix 21). However, the post-exposure/pre-exposure ratio was prone to technical error when ERG amplitude was low. This was the case in rod b-wave, a lower confidence limit could not be established due to individual variation (Appendix 4). Correlation to histopathologic changes (detachment and karyolysis) was only apparent when reduction in ERG absolute amplitude (30 Hz flicker and cone b-wave amplitudes) was below the normal range (B06Z). A reduction in post-exposure/pre-exposure ratio without the pre-exposure absolute value exceeding the normal range did not result in discernable histopathologic change (748Z) (Appendix 21). In addition, the monkey with retinal detachment also had reduced amplitudes in other ERG endpoints such as rod b-wave, combined b-wave and, possibly, combined a-wave.
Enhanced ERG amplitudes can be caused by low-dose retinal toxins or metabolic inhibitors [Novell 1958] and can occur prior to the appearance of retinal degeneration later observed as ophthalmoscopic and histopathological changes, depression of ERG amplitudes, and delayed appearances of a- and b-waves. Agents known to cause transient enhancement of ERG amplitudes are sodium azide, trichloroethylene, sodium pentobarbital [Novell 1958], hyperbanc oxygen [Ray and Hawgood 1977], ischemia [Brunette et al. 1986], and sodium iodate [Adachi- Usami et al. 1992, Hosoda et al. 1993, Sugimoto et al. 1996]. Similar progressive alterations in ERG, from enhancement to depression, were noted in siderosis caused by intraocular metal particles [Knave 1969]. ERG enhancement could occur in humans with or without clinical signs of optical nerve atrophy [Feinsod et al. 1971a, 1971b], Because of the correlation between enhanced ERG amplitude and the presence of reduced or extinguished visual evoked potentials, the ERG enhancement was hypothesized to result from abolition of a physiologic rivalry between photoreceptor's increasing sensitivity in the dark and inhibitory cerebral influence upon retinal activity exerted via efferent fibers in the optic nerve [Feinsod et al. 1971a, 1971b]. Pharmacologically-enhanced ERG amplitudes in isolated retina in vitro could be achieved by dopaminergic antagonists (haloperidol and chlorpromazine), anticholinergic drug (atropine) and monoamine uptake inhibitor (amitriptyline) [Nakagawa et al. 1988] or in vivo in rabbits after dopamine depletion by intravitreal injection of 6-hydroxydopamine [Oliver et al. 1987]. Dopamine has been shown in rabbits to be synthesized and degraded in a subset of amacrine (interamacrine) cells located at the junction of the inner plexiform and inner nuclear layers [Dowling and Ehinger 1978]. Most likely, enhanced ERG amplitude is a physiological event originating in inner retina or optic nerve, not in photoreceptors. Therefore, it is not surprising to find enhanced ERG amplitudes in the absence of identifiable histopathological change in photoreceptors. Also, retinal histopathologic changes were not evident until ERG amplitudes switched from enhancement to inhibition. Lacking conclusive evidence of ERG amplitude reduction and delayed appearance in ERGs, it was concluded that microwaves could alter physiological functions of the retina but the effect had not progressed to degeneration, injury or retinitis.
4.2.2 Enhanced PAS Reactivity
Variations in PAS reactions among cone photoreceptors of monkeys subjected to different microwave treatments poses an interesting question regarding the participation of glucose-glycogen balance in retinal pathogenesis. The PAS stain is used histologically for
55

Technical Report Microwave Induced Retinal Effects
identifying the presence of glycogen, mucin, and basement membrane. The intracellular PAS stain in retinal cells indicates the presence of a significant amount of glycogen. Frequently, reduction or depletion in glycogen stores may be the only change that precede the appearance of other histopathological alterations during retinal degeneration caused by ischemia. In human and monkey retina, glycogen is found in the inner layers of retina from the nerve fiber to the outer plexiform layer, Muller's cells and cones but not rod photoreceptors [Mizuno and Sato 1975]. It was indicated that retinal glycogen existed in a dynamic state between glycogen synthesis and glucose utilization [Kuwabara 1964]. In reaction to anoxic or ischemic conditions, the retina manifests injury first by a reduction or depletion of glycogen storage, followed by impaired function (reduction in ERG amplitudes), and finally by tissue damage (e.g., mitochondrial swelling, vacuolization histopathologically) [Ames and Gurian 1963, Ames 1965, Wassilewa et al. 1976, Johnson 1977]. Photoreceptors are known to be more resistant to anoxia and ischemia than brain or other retinal neuronal cells [Noel 1958] possibly owing to higher glycogen content, allowing adaptation to anoxic conditions by a larger reserve of anaerobic glycolysis. Possibly for the same reason, Brünett et al. [1986] demonstrated that cones were more resistant to ischemia- induced hyperactivity than rods but cones do not recover as well as rods.
A recent study on glucose accessibility of primate rod and cone photoreceptors indicated otherwise [Nihira et al. 1995]. This study found that both rod and cone photoreceptors had the biochemical capability (glucose transporter protein for facilitated glucose entry into photoreceptors) to transport exogenous glucose. However, glycogen phosphorylase (the rate- limiting enzyme for glycogenolysis) was found in cone but not in rod photoreceptors. From these observations, Nihira et al. [1995] concluded that cones could be more resistant to acute reductions in circulating glucose but are more prone to acidosis damage in hypoxic conditions due to increased lactic acid production through glycogenolysis and anaerobic glycolysis.
Based on an in vitro study, glucose deprivation was more damaging to retina than hypoxia as measured by the recovery of inhibited light-evoked responses [Ames and Guiron 1963]. A synergistic effect of glucose deprivation and hypoxia was also noted. In addition, higher incubation temperature appeared to accelerate the occurrence of an irreversible damage on light evoked responses caused by combined glucose deprivation and hypoxia. One of Kues' proposed mechanisms (pathogenesis) of microwave-induced retinal injury was disruption of the retinal microcirculation. If this is the case, cone photoreceptors would be more sensitive to hypoxic acidosis and would be the primary cells which showed degenerative changes and reduction in function (reduction in photopic b-wave amplitude). ERG b-wave amplitudes were known to be rather resistant to hypoxia and b-wave alterations were not noted until the arterial oxygen partial pressure decreased from 100 mm Hg to 40 mm Hg [Lisenmeier et al. 1983, Linsenmier 1990]. All retinal tissue is known to be susceptible to acute ischemia induced by an increase in intraocular pressure near or above the systemic arterial pressure in owl monkeys [Anderson and Davis 1975]. Presumably, both nutrient (glucose) and oxygen supplies were limited in the pressure induced ischemia, therefore, a synergistic effect between glucose and oxygen availabilities could occur. It is interesting to note that the only retinal injury case observed in the present study (karyolysis and extinction of photopic b waves) was in a monkey (B06Z, Appendix 16) exposed to microwave at 8.6 W/kg (a thermogenic SAR, Fig. 17) with colitis which could have a reduced carbohydrate intake or disturbed glucose availability. In other words, retinal injury occurred in the present study only in a condition that other predisposing factors co-existed with the microwave exposure.
56

Technical Report Microwave Induced Retinal Effects
It is known that the retinas of alloxan-diabetic rats show increased glycogen synthesis in vitro and accumulation of glycogen in vivo [Kurimoto et al. 1965]. Compensatory retinal accumulation of glycogen was noted in various species of animals in response to hypoxia [Kuwabara 1965, Antal 1979, Schuschereba et al. 1983]. However, compensatory glycogen accumulation occurred primarily in Müller cells, not in cone photoreceptors. In contrast to cone glycogen depletion, increased glycogen accumulation in cone photoreceptors has not been reported as a marker for subsequent events leading to photoreceptor degeneration. In the absence of ERG depression, histopathological changes or a correlation between enhancement of PAS reactivity and ERG amplitude, variation in PAS reactivity observed in the present study could only point to a physiological variation instead of a pathological state.
4.3 Rues' Results
Although the report of retinal effects of 1.25 GHz pulsed microwaves first appeared in 1989 in an abstract form [Kues et al. 1989], Kues et al. did not provide a detailed description of the histopathological and electroretinogram changes until 1995 [Kues et al. 1995]. The description of "microwave-induced retinal injuries" can also be found in two consecutive final reports submitted by Kues [1992, 1993] but these reports were not widely disseminated. According to these abstracts and reports [Kues et al. 1995, Kues 1992, 1993], the purported microwave-induced retinal changes were from 11 monkeys exposed to 1.25 GHz pulsed microwaves with the generator output set at 1 MW peak power. Two different pulse modulations were used, i.e., 1 Hz repetition rate and 10 \xs pulse width, or at 16 Hz and 0.5 (is to produce 4 W/kg local ocular SAR. The exposure history in one monkey was not specified. In addition, 3 sham-exposed monkeys were used (15 animals total, Appendix 20). The microwave exposure was 4 hours per day, 3 days per week for 3 weeks for a total of 9 exposures or 36 hours. Their description of retinal changes are as follows. Light and TEM (transmission electron microscopy) examinations of microwave-exposed eyes demonstrated a variety of retinal changes including effects on the RPE (retinal pigmented epithelium), the inner and outer segments, the inner and outer nuclear layers, the inner and outer plexiform layers, ganglion cells, and nerve fiber layer. A transient decrease in scotopic (rod) response was observed right after microwave exposure. The decreased scotopic response appeared to recover shortly following termination of exposure. A more dramatic decrease (20 to 90%) was observed in photopic (cone) response and this decrease had not recovered 8 months post-exposure. The above description is consistent with typical histopathological and electrophysiological changes defined as retinal degenerative changes.
4.4 SAR versus Peak-Power to Pulse-Length Ratio
From the apparent difference in ability to induce retinal injuries by 2.85 GHz (3.5 W/kg, negative retinal injury) and 1.25 GHz (3.8-4.0 W/kg, positive retinal injury), Kues et al. [1993] conceived the concept that differences in specific pulse/frequency parameters, or specific exposure parameters might be more important than average SAR. In the following year, they further suggested that the ratio of peak-power to pulse-length was an important factor in the induction of retinal changes [Kues et al. 1994], and indirectly indicated the importance of rise time. However, rise time in a pulsed microwave with a known carrier contributes primarily to the spread of bandwidth surrounding the carrier frequency. Bandwidth dispersion was calculated by one of the authors (SPM) on three different 1.25 GHz 6.2 us pulses: square wave (0 rise time, 0
57

Technical Report Microwave Induced Retinal Effects
fall time), Cober pulse (50 ns rise time, 1 us fall time) and FPS-7 pulse (1.3 us rise time, 2.0 us fall time). These calculations indicated that 50-dB bandwidth was ±15 MHz for a square wave, ±7 MHz for the Cober pulse and ±1.5 MHz for the FPS-7 pulse. The contribution of rise time to band width dispersion was well within the range of inherent pulse-to-pulse variation of the transmitters (Fig. 5, -8 MHz and +15 MHz from center frequency). Therefore, absorption of pulse energy should not be altered by differences in rise times unless an error is made in the integration of the pulses. Because of the carrier, photon energy is the same regardless of the difference in pulse modulation. Apparently, any enhancement due to a large peak-power to pulse-length ratio is not due to changes in photon energy or the absorption of pulse energy.
If the peak-power to pulse-length ratio was an important factor, the usual experimental practice is to design the experiment by assigning experimental subjects as evenly as possible to evaluate the factor under study. Apparently, this was not the case in Kues' experiment, out of 11 monkeys with known exposure histories, 2 were subjected to 10 p.s pulses, 8 to 0.5 p.s pulses, while one monkey was exposed to both pulses (Appendix 20). Excluding two monkeys without exposure histories and histopathology, Kues' 1.25 GHz experiments appeared to support his hypothesis on the importance of peak-power to pulse-length ratio in pulsed microwave-induced cone photoreceptor injuries because 4 of 8 monkeys subjected to short pulses (1 MW, 0.5 us, 16 Hz) exhibited karyolysis in cone photoreceptors and neither of 2 monkeys exposed to longer pulses (1 MW, 10 |is, 1 Hz) exhibited any histopathological changes in retina. However, these results may be confounded by the use of a fluorophotometry procedure. Fluorophotometry as a confounding factor will be analyzed in section 4.5.3. It is sufficient to point out that retinal histopathological changes did appear in one eye of the two sham-exposed monkeys subjected to fluorophotometry in Kues' experiments. In addition, 3 of 4 monkeys exposed to 0.5 p,s pulses without retinal injury were exposed at 2 inches from the open-end waveguide antenna and received a higher SAR than the 4 monkeys exposed to 0.5 u.s at 3 inches who did exhibit retinal injuries.
At the same peak SAR, specific absorption per pulse (SApUise = SARpeak x pulse width) is proportional to pulse width and SApuise is smaller in a shorter pulse. To maintain a constant temporal average SAR between various pulses with the same SARpeak, pulse repetition rate must change inversely with pulse width (SAR = SARpeak x pulse width x pulse repetition rate). To accept the concept of a peak power to pulse length ratio as a modifier or enhancer of microwave- induced bioeffects, modulation frequency (pulse repetition rate) has to be considered. Otherwise, a "window" effect has to be assumed because the enhancement process will be defined as "the smaller the SA per pulse, the larger the effect" which is contradictory to basic toxicological principles. Alternatively, pulse modulation enhancement effect, i.e., "the higher the pulse repetition rate, the larger the effect", is plausible and within the content of toxicological principles if each pulse delivers an adequate pulse energy to elicit an effect.
Enhancement by modulation frequency of a high-peak power microwave appears to be an attractive mechanism to explain a pulse enhancement effect if the modulation frequency is considered in conjunction with the thermoelastic effect. A widely known effect, which is specific
58

Technical Report Microwave Induced Retinal Effects
to pulsed microwaves with high-peak power, is the auditory sensation elicited by microwave pulses. The auditory sensation is perceived as clicking or buzzing originating in or from the back of the head and corresponds to pulse-repetition rate. The auditory effect has been the subject of several reviews [Lin 1978, Chou et al. 1982, NCRP 1986]. It is generally accepted that the pulse microwave induced audible sound is generated from a thermoelastic expansion of brain tissue that launches an acoustic (mechanical) wave detected by hair cells in the cochlea. Mechanical stress and fatigue can thus be correlated to modulation frequency. For pulsed microwaves with pulse width shorter than 30 u,s, the microwave-induced auditory threshold is independent of temporal peak power density (or temporal peak specific absorption) and it is entirely dependent on the energy density of the microwave pulse or SApUise. The threshold SApUiSe has been determined in human volunteers [Guy et al. 1975], cats [Guy et al. 1975] and rats [Chou et al. 1985] at 16, 10-12 and 0.9-18 mJ/kg respectively. The smaller SApUise used by Kues et al. was 250 mJ/kg (4 W/kg -h 16 Hz) which was more than adequate to elicit thermoelastic acoustic waves in the cranium. The hypothesis of mechanical stress or fatigue caused by modulation frequency is interesting but has not been demonstrated satisfactorily in the retinal tissue.
4.5 Present Methods and Kues' Methods
Different results obtained by Kues and us are difficult to reconcile because none of Kues' informal publications, including final reports contained a complete detail of their experimental approach regarding the pulsed microwave induced retinal injury. This lack of information creates difficulties in reconstructing the exposure parameters used in their experiments. Careful examination of Kues1 meeting abstracts [Kues et al. 1998b, Kues and McLeod 1990, Kues et al. 1991, 1993, 1994, 1995], final reports [Kues 1992, 1993], an archival laboratory notebook kept at Walter Reed Army Institute of Research, and knowledge from personnel involved with the Kues' project revealed some fundamental differences in experimental approaches between Kues' and our laboratories. They are:
1) Pulse characteristics, 2) Procedure for SAR determination, 3) Animals and their handling, 4) Diagnostic procedures.
The same WR650 open-end waveguide antenna and nominal peak output power (1 MW) were used in both laboratories. However, two different transmitters were used, i.e., Cober by Kues and FPS-7 by us. As indicated in the Materials and Methods (section 2.3 Exposure Facility, figures 3, 4, and 5), the FPS-7 produced 1.25 GHz trapezoid pulses with rise time in the 1 u,s range and an equivalent pulse width of 5.59 u,s. On the other hand, the Cober produced 1.25 GHz trapezoid pulses with a 50-ns rise time. Two pulse widths (10 and 0.5 u,s) were employed by Kues et al.
59

Technical Report Microwave Induced Retinal Effects
4.5.1 Dosimetry
Similar equipment (Luxtron MAM-05 probe and Luxtron 3000) was used for thermometric dosimetry between Kues' and the present studies. Details of Kues' dosimetry procedure can found in his final report [Kues 1993] Attachments A and B. A 3.6-kg monkey carcass was used. The MAM-05 probe was inserted through a small wound into the eye. Both upward and downward insertions were used. The monkey carcass was placed 2 inches (5.1 cm) in front of the open-end waveguide antenna. The dosimetry results indicated that "intra-ocular" SAR was 1.40 ± 0.49 (mean ± S.D., n= 12, 3 runs of 4 sensors each) W/kg per W forward power. It is immediately apparent that SAR reported by Kues was not a reliable retinal SAR because:
1). Anatomical integrity of the eye was not preserved. 2). And most monkeys were exposed at 3 inches from the open-end waveguide not at 2 inches as performed in the dosimetry (Appendix 20).
Due to a near field exposure, estimation of SAR from 2 inches to 3 inches is inappropriate. Extensive retinal dosimetry, described in the Material and Methods and Results sections, has been performed in the present study. Assuming that a similar absorption occurred in Kues' monkey, the most likely R-SAR for the majority of Kues' monkeys was between 11.3 and 12.5 W/kg (9 and 10 W forward power multiplied by the mean R-SAR 1.25 W/kgAV in Table 1) and even higher in three monkeys with normal retinal histopathology (1 IF, 82-105 and 82-101, Appendix 20) exposed at 2 inches from the open-end waveguide antenna. The SAR (4 W/kg) reported by Kues appears to be higher by at least by a factor of 3 or more.
4.5.2 Ketamine
One confounding factor in Kues1 study was the use of ketamine as a tranquilizer for moving the monkeys in and out of the chair. Upon repetitive administration, animals are known to quickly build up resistance to ketamine [Cumming 1976, Livingston and Waterman 1978]. In Kues' experiments, it was highly probable that the ketamine dose would have been increased to achieve the same effect in monkeys. Reports of the consequences of a high ketamine dose could be retinal ultrastructural changes within one hour after the ketamine administration (30 mg/kg body weight) in rabbits [Antal 1979], or a transient loss of vision for 25 to 30 minutes in humans after regaining full consciousness from intra-muscular and intravenous ketamine monoanesthesia at doses from 1.5 to 2.6 mg/kg [Fine 1974]. The ketamine-induced ultrastructural changes were similar to those induced by hypoxia [Antal 1979]. They were fragmentation of the photoreceptor inner segment, vacuolization of the photoreceptor outer segment, pyknosis and appearance of perinuclear cisterns in the outer nuclear layer, vacuolization and chromatin condensation of the inner nuclear layer, vacuolization of ganglion cells, vacuolization of the outer and inner plexiform layers, and diminution of glycogen content of Muller glial cells. In other words, none of the retinal tissues were spared. Three days after high doses of ketamine, the ultrastructural changes regressed and only occasional vacuolization was noted. Since its introduction into clinical anesthesia, ketamine has been given intravenously for induction and maintenance of general anesthesia without respiratory assistance and oxygen administration, in the belief that it
60

Technical Report Microwave Induced Retinal Effects
causes neither respiratory depression nor airway obstruction from jaw relaxation. However, severe arterial hypoxemia, and transient and prolonged apnea have been reported [Zsigmond et cd. 1976, Van Wijhe et al 1986].
Depending on the method of induction and the basis for comparison, the opinion on hypoxia- (ischemia-) induced retinopathy appears to vary among investigators. The effect of reduced oxygen tension on the retina has been discussed previously in sections dealing with glucose/glycogen availability. Noell [1958] concluded from his review that anoxia or ischemia of human eyes could not produce irreversible retinal damage unless the ischemia was extended for more than 30 minutes. Complete recovery of the rabbit's visual cells (photoreceptors) occurred even when ischemia was imposed for 60-75 minutes. Retinal ganglion cells and bipolar cells in the rat degenerated after 20 minutes of ischemia whereas visual cell death required about twice as long. On the other hand, Anderson and Davies [1975] reported that experimental increase of the intraocular pressure first caused damage to photoreceptors, pigment cells, and nerve fibers, then all nervous elements involved. The Muller's cells and astroglia remained normal. Johnson [1977] investigated the time relationship of the retinal damage caused by artificial elevation in intraocular pressure in rabbits. A pressure elevation of 30-minute duration caused pathological changes in the first neuron (photoreceptor), whereas the other nervous elements were only damaged by pressure elevations for 60-90 minutes. Following pressure increases for 90-120 minutes, however, the pigment epithelium and Muller's cells also developed pathologic alterations. It can be concluded that prolonged hypoxia/ischemia can damage all layers of retina if the duration of the ischemia persists long enough. However, it is not clear whether repetitive administration of low doses of ketamine can induce retinopathy.
There are similarities in ultrastructure changes of Kues' monkeys to retinal changes in rabbits receiving high dose ketamine [Antal 1979], but the extent of nuclei degeneration (karyolysis, Appendix 20) was far more advanced in Kues' monkeys. In the present study, 15- mg/kg ketamine was administered approximately 2 hours before enucleation without any clinical morphological, histopathological and electrophysiological evidence of retinopathy. On the other hand, two of the monkeys (section 3.8 Special (Stses, B06Z and 748Z), which received a high dose of ketamine (50 mg/kg, a dose higher than the threshold for inducing ultrastructural changes in retina in rabbits) 3 weeks before enucleation, showed a photopic b-wave depression with and without corresponding histopathological changes (karyolysis and focal detachment). It is possible that repetitive microwave exposures will enhance the severity of a high dose ketamine- induced degeneration or interfere with the repair of ultrastructure (histopathologic) changes. The hypothesis of synergistic effect between microwave exposure and ketamine has never been tested experimentally.
4.5.3 Fluorophotometery
One of the Kues' diagnostic procedures [Kues 1992, 1993] which was not used by us was fluorophotometry for evaluation of the blood-aqueous barrier. For fluorophotometry, halothane anesthesia (2.5 % Halothane, 97.5 % oxygen, 0.5 L/mim), 0.3 ml of 10 % sodium fluorescein and a Coherent Radiation Fluorotron Master fluorophotometer were used. However, not all of
61

Technical Report Microwave Induced Retinal Effects
Kues' monkeys were subjected to this procedure (Appendix 20). The rationale for not evaluating all monkeys was "Since this procedure can interfere with the results of some of the other diagnostic evaluations not all animals were given this test" [Kues 1993, page 8]. As indicated previously, histopathologic changes were found in animals subjected to fluorophotometry with the exception of monkey 6D; who had an incomplete exposure history. Although the majority of monkeys (9 out of 11) showed a post-exposure reduction in ERG cone responses (Appendix 20), further analysis showed a poor correlation between the occurrences of histopathologic changes and reduction in ERG cone responses. Out of 9 monkeys that showed a reduction in ERG cone response, 5 had normal histopathologic findings. If histolopathologic findings are used as markers for the presence of retinal (or cone) degeneration, the poor correlation could be interpreted to mean that reduction in ERG cone response is noisier (prone to false positive) or it is more sensitive (physiological changes precede pathological changes) than the histopathologic findings. With the absence of ERG data from sham exposed monkeys in Kues' study, neither of the alternative interpretations can be evaluated with confidence.
Halothane inhalation anesthesia is known to inhibit respiration at any concentration and to reduce systemic arterial pressure, cardiac contractile force, cardiac output, and total peripheral resistance. The inhibitory action of halothane on circulation is increasingly pronounced as the level of anesthetic is increased. Hypoxia can occur. When human or primate subjects were under halothane anesthesia, it was noted that cone dark adaptation was severely retarded, while no effect on ERG b-wave amplitude was noted [Norren and Padmos 1975]. Previous discussion has indicated the ERG b-wave amplitude is sensitive to hypoxic inhibition. Without adequate control on retinal oxygenation, reduced ERG amplitude can occur. Although the long-term effect and effect of repetitive halothane anesthesia on retina are not known, it is probably wise to use ketamine anesthesia to avoid respiratory and circulatory complications caused by halothane.
With an increased oxygen concentration in the inhaled gas mixture, hypoxia could be relieved. However, the retina is prone to injury caused by increased oxygen tension under hyperbaric conditions or by increased oxygen concentration under normobaric conditions. Severe oxygen toxicity has long been known. Noell [1958] indicated that visual cell death occurred during exposure to oxygen concentrations as low as 60 % at ambient pressure for 5 days. Ninety to one hundred percent oxygen at ambient pressure destroyed the majority of visual cells within 40 to 48 hours. Furthermore, ERG b-wave is affected selectively and rapidly. Oxygen at 1 atmosphere reduced the amplitude of all ERG components in 15 hours and recovery was limited to the fraction of ERG that had been reduced for less than 8 hours [Noell 1958]. Retinal detachment was also found in animals subjected to prolonged oxygen at 1 atmosphere for 72 hours [Beehler 1964]. Similar oxygen sensitivity was also noted in newborn rats serving as an animal model for retinopathy of prematurity [Penn and Thum 1989]. Oxygen effects, which included decreases in the retinal vasculature and irreversible reduction in b-wave amplitudes, could be noted in neonatal rats reared in 40% oxygen. It has been hypothesized that oxygen induced a change in the permeability of the choroidal blood vessels, possibly through its toxic effects on endothelial cells [Nichols and Lambertsen 1969]. In view of an increased leakage of blood-aqueous barrier (between blood vessels of iris and ciliary body and aqueous humor) in
62

Technical Report Microwave Induced Retinal Effects
some of Kues1 monkeys, oxygen effects on the choroidal endothelium cannot be discounted entirely.
Another potential complication from fluorophotometry in Kues' study was the administration of sodium fluorescein in combination with intense light. Hochheimer etal. [1987] demonstrated that intravenous administration of 1 ml of 25 % sodium fluorescein (a higher dose than that used by Kues) in rabbits could reduce the amount of blue light needed to induce a phototoxic retinal lesion by almost a log unit from 1.6 to 0.2 W/cm2. Sperling [1985] demonstrated that intermittent exposure to intense narrow-band light for 1.5 to 2 hours on six or seven successive days under behavioral control in awake, performing rhesus monkeys resulted in irreversible blue-sensitive cone activity after blue light (463 nm, 1 mW/cm2 or less) and long- tern loss of green-sensitive cone activity after the green exposure (510 nm, 1 mW/cm2). Under anesthesia, a 2-hour exposure to 1 mW/cm2 of 463-nm radiation produced extensive damage to the retinal pigmented epithelium. In comparison to rats maintained under 750 lux (0.11 mW/cm2), 14:10 light-dark cycle, a significant reduction in thickness of the outer nuclear layer was noted in rats maintained under 1080 lux (0.16 mW/cm2) constant light for 9 days or longer [Johnson et al. 1986]. It has also been demonstrated that long term light history of animals determined the sensitivity of the photoreceptors to light damage [Birch and Jacobs 1980, Noell and Albrecht 1971]. Therefore, factors associated with fluorophotometry, if not controlled adequately, may very well be the cause of retinal damage.
4.5.4 Transportation
An additional confounding factor in Kues' study could be the weekly transportation between Silver Spring and Baltimore in daylight. If care was not exercised, light damage of the retina could result. Noell [1965] noted the most important variable in determining the effectiveness of excessive light on retinal damage was body (and eye) temperature, i.e., the higher body temperature, the greater the light induced damage. The synergistic effect of ocular temperature on light induced damage would become even more important if the monkey was transported immediately after microwave exposure because the ocular temperature would still be elevated.
4.6 Conclusion
The consistency between ERG and histopathology in the present study points to an absence of a microwave retinal effect. A review of previous work reporting retinal effects revealed a number of confounding factors. These include: (1) Methods used to calculate retinal SAR underestimated actual SAR. (2) Repeated use of ketamine anesthesia would have resulted in the development of tolerance and higher ketamine doses that could have induced ischemia and retinal damage. (3) Fluorophotometry procedures could cause retinal damage. (4) Exposure of animals to uncontrolled ambient conditions prior to or following microwave or sham exposure could confound experimental results. Therefore, it is premature to conclude that microwave radiation can cause retinopathy at 4 W/kg average ocular SAR.
63

Technical Report Microwave Induced Retinal Effects
5. REFERENCES
Adachi-Usami E, Mizota A, Ikeda H, Hanawa T, and Kimura T [1992]: Transient increase of b- wave in the mouse retina after Sodium iodate injection. Invest. Ophthalmol. Visual Sei. 33: 31093113.
Allis JW, Blackman CF, Fromme ML, and Benane SG [1977]: Measurement of microwave radiation absorbed by biological system. 1. Analysis of heating and cooling data. Radio Sei. 12 (Suppl.): 1S-8S.
Ames A III [1965]: Studies of morphology, chemistry and function in isolated retina. In: Biochemistry of the Retina. Ed.: Graymore CN, New York, NY: Academic Press, pp 22-30.
Ames A III and Gurian [1963]: Effects of glucose and oxygen deprivation on function of isolated mammalian retina. J. Neurophysiol. 26: 617-634.
Anderson DR, and Davis EB [1975]: Sensitivities of ocular tissues to acute pressure-induced ischemia. Arch. Ophthalmol. 93: 367-274.
ANSI (American National Standards Institute) [1982]: American National Standard Safety Levels with Respect to Human Exposure to Radiofrequency Electromagnetic Fields, 300 kHz to 100 GHz. ANSI C95.1-1982. New York, NY: American National Standards Institute.
Antal M [1979]: Ketamine-induced ultrastructural changes in the retina. Albrecht v. Graefes Arch. Klin. Exp. Ophthal. 210: 43-53.
Beehler CC, Newton NL, Culver JF, and Tredici T [1964]: Retinal detachment in adult dogs resulting from oxygen toxicity. Arch. Ophthalmol. 71: 665-670.
Birch DG, and Jacobs [1980]: Light induced damage to photopic and scotopic mechanisms in rat depends on rearing conditions. Exp. Neurol. 68: 269-283.
Brunette JR, Olivier P, Zaharia M, Blondeau P and Lafond G [1986]: Rod-cone differences in response to retinal ischemia in rabbit. Doc. Ophthal. 63: 359-365.
Bresnick GH, Korth K, Groo A and Palta M [1984]: Electroretinographic oscillatory potentials predict progression of diabetic retinopathy. Preliminary report. Acta Ophthalmol. 102: 1307- 1311.
Carpenter R [1979]: Ocular effects of microwave radiation. Bull. N.Y. Acad. Sei. 55: 1048-1057.
Chou CK, Guy AW and Galambos R [1982]: Auditory perception of radio-frequency electromagnetic fields. J. Acoust. Soc. Am. 71: 1321-1334.
64

Technical Report Microwave Induced Retinal Effects
Chou C-K, Yee K-C, and Guy AW [1985]: Auditory response in rats exposed to 2,450 MHz electromagnetic fields. Bioelectromagnetics 6: 323-326.
Creighton MO, Larsen LE, Stewart-DeHaan PJ, Jacobi JH, Sanwal M, Baskerville JC, Bässen HE, Brown DO, and Trevithick JR [1987]: In vitro studies of microwave-induced cataract, n. Comparison of damage observed for continuous wave and pulsed microwaves. Exp. Eye Res. 45: 233-246.
Cumming JF [1976]: The development of an acute tolerance to ketamine. Anesth. Analg. 55: 788-791.
D'Andrea JA, Gandhi OP, and Lords JL [1977]: Behavioral and thermal effects of microwave radiation at resonant and nonresonant wavelengths. Radio Sei. 12 (suppl.): 251S-256S.
D'Andrea JA, Thomas A, Hatcher DJ, and DeViette TL [1992]: Rhesus monkey contrast sensitivity during exposure to high peak power 5.6-GHz microwave pulses. In: Abstracts of the First World Congress for Electricity and Magnetism in Biology and Medicine.
D'Andrea JA, Thomas A, Hatcher DJ, and DeViette TL [1993]: Rhesus monkey contrast sensitivity during extended exposure to high peak power 1.3-GHz microwave pulses. In: Abstracts of the 15th Bioelectromagnetics Society Annual Meeting.
deLorge JO [1976]: Behavior and temperature in rhesus monkeys exposed to low level microwave irradiation. Report NAMRL-1222. Pensacola,FL: Naval Aerospace Medical Research Laboratory (AD A021769).
deLorge JO [1979]: Operant behavior and colonic temperature of squirrel monkeys during microwave irradiation. Radio Seil 14 (suppl.): 217S-225S.
deLorge JO, and Ezell CS [1980]: Observing-response of rats exposed to 1.28 and 5.62 GHz microwaves. Bioelectromagnetics 1: 183-198.
Dowling JE, and Ehinger B [1978]: Synaptic organization of the dopaminergic neurons in the rabbit retina. J. Comp. Neurol. 180: 203-220.
Feinsod M, Rowe H, and Auerbach E [1971a]: Changes in the electroretinogram in patients with optic nerve lesions. Doc. Ophthal. 29: 169-200.
Feinsod M, Rowe H, Auerbach E [1971b]: Enhanced retinal responses without signs of optic nerve involvement. Doc. Ophthal. 29: 201-211.
Fine J, Weissman J, and Finestone SC [1974]: Side effects after ketamine anesthesia: transient blindness. Anesth. Analg. 53: 72-74.
65

Technical Report Microwave Induced Retinal Effects
Gambrill CS, DeAngelis ML, and Lu S-T [1993]: Error analysis of a thermometric microwave- dosimetry procedure. In: Electricity and Magnetism in Biology and Medicine. Ed.: Blank M, San Francisco, CA: San Francisco Press, pp 593-595.
Guy AW, Chou CK, and Lin JC [1975]: Microwave-induced acoustic effects in mammalian auditory systems and physical materials. Ann. N.Y. Acad. Sei. 247: 194-218.
Guy AW, Lin JC, Kramar PO, and Emery AF [1975]: Effect of 2450 MHz radiaiton on the rabbit eye. IEEE Trans. Microwave Theory Tech. 23: 492-498.
Hochheimer BF, Lutty GA, and D'Anna SA [1987]: Ocular fluorescein phototoxicity. Appl. Optics 26: 1473-1479.
Hosoda L, Adachi-Usami E, Mizota A, Hanawa T, and Kimura T [1993]: Early effects of sodium iodate injection on ERG in mice. Acta Ophthalmol. 71: 616-622.
Imai H, Miyata M, Uga S, and Ishikawa S [1983]: Retinal degeneration in rats exposed to an organophosphate pesticide (Fenthion). Environ. Res. 30: 453-465.
IEEE (Institute of Electrical and Electronics Engineers, Inc.) [1999]: IEEE Standard for Safety Levels with Respect to Human Exposure to Radio Frequency Electromagnetic Fields, 3 kHz to 300 GHz. New York, NY: The Institute of Electrical and Electronic Engineers, Inc.
International Standardization Committee [1989]: Standard for clinical electroretinography. Arch. Ophthalmol. 107: 816-819.
Johnson CC, and Guy AW [1972]: Nonionizing electromagnetic wave effects in biological materials and systems. Proc. IEEE 60: 692-718.
Johnson DD, O'Steen WK, and Duncan TE [1986]: Photically-induced retinal damage in diabetic rats. Current Eye Res. 5: 1-7.
Johnson NF [1977]: Retinal glycogen content during ischaemia. Albrecht v. Graefes Arch. Klin. Exp. Ophthal. 203: 271-282.
Knave B [1969]: Electroretinography in eyes with retained intraocular metallic foreign bodies. Acta Ophthalmol. Supplement 100: 1-63.
Kues H [1992]: Effects of microwave radiation on humans. Monkeys exposed to 1.25 GHz pulsed microwaves. Defense Technical Information Center, ADA249997.
Kues HA [1993]: High peak power microwaves: A health hazard. Defense Technical Information Center, ADA277168.
66

Technical Report Microwave Induced Retinal Effects
Kues HA, Hirst LW, Lutty GA, D'Anna SA, Dunkelberger GR [1985]: Effects of 2.45-GHz microwaves on primate corneal endothelium. Bioelectromagnetics 6: 177-188.
Kues HA, McLeod DS, DAnna SA, Lutty GA, and Monahan JC [1989a]: Pulsed microwave- induced ocular pathology in non-human primates. In: Abstracts of the 11th Bioelectromagnetics Society Annual Meeting.
Kues HA McLeod DS, D'Anna SA, Lutty GA, Gambrill C, and Elson EC [1989b]: Ocular changes following exposure to high peak pulsed 1.25 GHz microwaves. In: Abstracts of the 11th Bioelectromagnetics Society Annual Meeting.
Kues HA, and McLeod DS [1990]: Retinal changes in the primate following pulsed 2.45 GHz exposure. In: Abstracts of the 12th Bioelectromagnetics Society Annual Meeting.
Kues HA, McLeod DS, D'Anna SA Johnson MA Perry CR, and Monahan JC [1991]: Microwave-induced electroretinographic changes in primates. In: Abstracts of the 13th Bioelectromagnetics Society Annual Meeting.
Kues HA, and Monahan JC [1992]: Microwave-induced changes to the primate eye. Johns Hopkins APL Tech. Dig. 13: 244-255.
Kues HA, and Monahan JC [1992a]: Pulsed microwave-induced ocular changes in the restrained non-human primate. In: Abstracts of the First World Congress for Electricity and Magnetism in Biology and Medicine.
Kues HA, Monhan JC, D'Anna SA McLeod, Lutty, and Koslow S [1992]: Increased sensitivity of the non-human primate eye to microwave radiation following ophthalmic drug pretreatment. Bioelectromagnetics 13: 379-394.
Kues HA, D'Anna SA Johnson MA Lutty GA, and Monahan JC [1993]: Absence of comparable ocular effects in animals exposed to pulsed microwave radiation from two separate systems. In: Abstracts of the 15th Bioelectromagnetics Society Annual Meeting.
Kues HA, D'Anna SA Johnson MA Green WR, Brooks LJ, and Monahan JC [1994]: The importance of specific microwave parameters for the induction of ocular effects in the non- human primate. In: Abstracts of the 16th Bioelectromagnetics Society Annual Meeting.
Kues HA, D'Anna SA, Johnson MA Green WR, and Monahan JC [1995]: Retinal damage following repeated exposure to pulsed 1.25 GHz at an average local SAR of 4 mW/g. In: Abstracts of 17th Bioelectromagnetics Society Annual Meeting.
Kurimoto S, Newell FW, and Farkas TG [1965]: Glycogen synthesis by the rat retina. In: Biochemistry of the Retina. Ed.: Graymore CN, New York, NY: Academic Press, pp 31-35.
67

Technical Report Microwave Induced Retinal Effects
Kuwabara T [1965]: Some aspects of retinal metabolism revealed by histochemistry in Müller cells in the pathological condition. In: Biochemistry of the Retina. Ed.: Graymore CN, New York, NY: Academic Press, pp 93-98.
Lin JC [1978]: Microwave Auditory Effects and Applications. Springfield: Charles C. Thomas.
Linsenmeier RA [1990]: Electrophysiological consequences of retinal hypoxia. Graefe's Arch. Clin. Exp. Ophthalmol. 228: 143-150.
Linsenmeier RA, Mines AH, and Steinberg RH [1983]: Effects of hypoxia and hypercapnia on the light peak and electroretinogram of the cat. Invest. Ophthalmol. 24: 37-46.
Livingston A, and Waterman AE [1978]: The development of tolerance to ketamine in rats and the significance of hepatic metabolism. Br. J. Pharmacol. 64: 63-69.
Lu S-T, DeAngelis ML, and Gambrill [1993]: Ocular microwave thermometric dosimetry and thermometry in the rabbit. In: Electricity and Magnetism in Biology and Medicine. Ed.: Blank M, San Francisco, CA: San Francisco Press, Inc., pp 675-678.
Maertins T, Kroetlinger F, Sander E, Pauluhn J, and Machemer L [1993]: Electroretinographic assessment of early retinopathy in rats. Arch. Toxicol 67: 120-125.
Marmor MF, and Zrenner E [1995]: Standard for clinical electroretinography (1994 update). Doc. Ophthalmol. 89: 199-210.
Massof R, Wu L, Finkelstein D, Perry C, Starr SJ, Johnson MA [1984]: Properties of electroretinographic intensity-response functions in retinitis pigmentosa. Doc. Ophthalmol. 57: 279-296.
Michaelson SM, and Lin JC [1987]: Cataract and other ocular effects. In: Biological effects and Health Implications of Radiofrequency Radiation. New York, NY: Plenum Press, pp 183-197.
Mizuno K, and Sato K [1975]: Reassessment of histochemistry of retinal glycogen. Exp. Eye Res. 21:489-497.
Naka, KI, and Rushton WAH [1966]: S-potentials from colour units in the retinal offish (Cyprindae). J. Physiol. 185: 536-555.
Nakagawa T, Kurasaki S, Masuda T, Ukai K, Kubo S, and Kadono H [1988]: Effects of some psychotropic drugs on the b-wave of the electroretinogram in isolated rabbit retina. Japan. J. Pharmacol 46: 97-100.
68

Technical Report Microwave Induced Retinal Effects
NCRP [1986]: Perception of PFEM fields. In Biological Effects and Exposure Criteria for Radiofrequency Fields. Bethesda: National Research Council on Radiation Protection and Measurements, pp. 175-180.
Nichols CW, and Lambertsen CJ [1969]: Effects of high oxygen pressures on the eye. N. Engl. J. Med. 281:25-30.
Nihira M, Anderson K, Gorin FA, and Burns MS [1995]: Primate rod and cone photoreceptors may differ in glucose accessibility. Invest. Ophthalmol. 36: 1259-1270.
Noell WK [1958]: Differentiation, metabolic organization, and viability of the visual cell. AM. A Arch. Ophthalmol. 60: 702-733.
Noell WK [1965]: Aspects of experimental and hereditary retinal degeneration. In: Biochemistry of the Retina. Ed.: Graymore CN, New York, NY: Academic Press, pp. 51-72.
Noell WK, and Albrecht R [1971]: Irreversible effects of visible light on the retina: role of vitamine A. Science 172: 76-80.
Norren DV, and Padmos P [1975]: Cone dark adaptation: the influence of halothane anesthesia. Invet. Ophthalmol. 14:212-227.
Olivier P, Jolicoeur FB, Lafond G, Drumheller A, and Brunette JR [1987]: Effects of retinal dopamine depletion on the rabbit electroretinogram. Doc. Ophthalomol. 66: 359-371.
Paulsson LE, Hamneius Y, Hasson HA and Sjostrand J [1979]: Retinal damage experimentally induced by microwave radiation at 55 mW/cm2. Acta Ophthalmol. 57: 183-197.
Peachey NS, Alexander KR, Derlacki DJ, and Fishman GA [1992]: Light adaptation and the luminance-response function of the cone electroretinogram. Doc. Ophthalmol. 79: 363-369.
Penn JS, and Thum LA [1989]: The rat as an animal model for retinopathy of prematurity. Prog. Clin.Biol. Res. 314:623-642.
Ray DE, and Hawgood J [1977]: Influence of systemic factors on hyperbaric oxygen toxicity in the rat visual system. Aviat. Space Environ. Med. 48: 1046-1050.
Rosenthal SW, Birenbaum L, Kaplan IT, Metlay W, Snyder WZ, and Zaret MM [1976]: Effects of 35 and 107 GHz microwaves on the rabbit eye. In: Biological Effects of Electromagnetic Waves, Vol. 1. Ed.: Johnson CC, and Shore ML, Rockville, MD: Food and Drug Administration, HEWPubl. (FDA)-77-8010, pp 110-128.
69

Technical Report Microwave Induced Retinal Effects
Schuschereba ST, Friedman HI, DeVenuto F, and Beatrice ES [1983]: Morphologic effects on the retina of massive exchange transfusion with stroma-free hemoglobin solution. Lab. Investigation 48: 339-352.
Sperling HG [1985]: Intense spectral light induced cone-specific lesions of the primate retina and the effects of anaesthesia. Doc. Ophthalmol. 55: 153-167.
Sugimoto S, Imawaka M, Kurata K, Kanamaru K, Ito T, Sasaki S, Ando T, Saijo T, and Sato S [1996]: A procedure for recording electroretinogram (ERG) and effect of Sodium iodate on ERG in mice. Japan. J. Toxicol. Sei. 21 (Suppl.): 15-32.
Stewart-Dehaan PJ, Creighton MO, Jacobi JH, Ross Sanwal M, Guo TC, Guo WW, and Trevithick JR [1983]: In vitro studies of microwave-induced cataract: Separation of field and heating effects. Exp. Eye Res. 36: 75-90.
Stewart-DeHaan PJ, Creighton MO, Larsen LE, Jacobi JH, Sanwal M, Baskerville JC, and Trevithick Jr [1985]: In vitro studies of microwave-induced cataract: Reciprocity between exposure duration and dose rate for pulsed microwaves. Exp. Eye Res. 40: 1-13.
Severns ML, and Johnson MA [1993]: The variability of the b-wave of the electroretinogram with stimulus luminance. Doc. Ophthalmol. 84: 291-299.
Tengroth B, and Aurell E [1974]: Retinal changes in microwave workers. In: Biologic Effects and Health Hazards of Microwave Radiaiton. Ed.: Czerski P, Silverman C, Ostrowski K, Suess ML, and Waldeskog B, Warsaw, Poland: Polish Medical Publishers, pp 302-305.
Trevithick JR, Creighton MP, Sanwal M, Brown DO, and Bässen HI [1987]: Histopathological studies of rabbit cornea exposed to millimeter waves. Proc. IEEE EMBS Conf. 9: 695-697.
Van Wijhe M, Strieker BHC, and Rejger VS [1986]: Prolonged apnea with ketamine. Br. J. Anaesth. 58: 573-574.
Wassilewa P, Hockwin O., and Korte I [1976]: Glycogen concentration changes in retina, vitreous body and other eye tissues caused by disturbances of blood circulation. Albrecht. v. Graefes Arch. Klin. Exp. Ophthal. 199: 115-120.
Yee KC [1983]: Interaction of RF and MW with the living systems: Research and experience in China. In: Biological Effects and Dosimetry of Non-ionizing Radiation, Radiofrequency and Microwave Energies, Ed.: Grandolfo M, Michaelson SM, and Rindi A, New York, NY: Plenum Press, pp. 501-530.
Zsigmond EK, Matsuki A, Kothary SP, and Jallad M [1976]: Arterial hypoxemia caused by intravenous ketamine. Anesth. Analg. 55: 311-314.
70

Technical Report Microwave Induced Retinal Effects
6. ACKNOWLEDGEMENT AND APPENDICES
ACKNOWLEDGEMENT: The authors wished to acknowledge the technical assistance provided by Michael Belt, Don Hatcher, David D. Cox (U.S. Navy), Frank Weathersby, Kevin Kosub (Veridian), Cary Richardson (Geocenter), Andre Akers, SSgt. Sally Ruiz, SSgt. Janis Loveday (U.S. Army), TSgt. Leland Johnson, TSgt. Maurice Täte, SSgt. Vincenet Zavala, SSgt. David Hernandez, SrA. Jason Cochetti and SrA. Mike Lilly (U.S. Air Force).
71

Technical Report Microwave Induced Retinal Effects
Appendix 1. Results of Ocular Dosimetry in A35Z*
Right Eye Depth (cm) Nasal Temporal Superior Oral
0.0 2.75 ±0.09 1.60±0.17 0.49 ±0.08 2.31 ±0.08
0.5 2.06 ±0.13 0.89 ±0.06 0.53 ±0.03 1.44 ±0.10
1.0 1.45 ± 0.11 0.62 ±0.05 0.84 ±0.10 1.15 ±0.13
1.5 1.31 ±0.12 1.01 ±0.28 1.41 ±0.06 0.99 ±0.14
Left Eye Depth (cm) Nasal Temporal Superior Oral
0.0 2.09 ±0.15 1.17 ±0.07 0.99 ±0.34 1.11 ±0.18
0.5 1.51 ±0.18 1.48 ±0.23 0.58 ±0.10 1.71 ±0.24
1.0 1.16±0.14 0.75 ± 0.08 0.78 ±0.15 1.01 ±0.25
1.5 1.25 ±0.07 0.63 ± 0.08 0.58 ±0.06 0.94 ±0.12
* A35Z was a 4.45 kg 6 years old female monkey. SAR data shown is Mean ± S.D. from 4 replicates, which is normalized to W/kg per W transmitted power. Specific absorption rate was determined from pulsed exposures at 1.25 GHz carrier, 1.18 MW peak power, 5.56 |is pulse width and 17.44 Hz for 40 seconds.
72

Technical Report Microwave Induced Retinal Effects
Appendix 2. Results of Ocular Dosimetry in A47Z"
Right Eye Depth (cm) Nasal Temporal Superior Oral
0.0 1.62 ±0.06 1.95 ±0.04 2.00 ± 0.07 1.51 ±0.01
0.5 1.17 ±0.05 1.68 ±0.12 0.87 ±0.03 1.03 ±0.02
1.0 1.06 ±0.07 1.09 ±0.05 1.51 ±0.07 1.19±0.01
1.5 1.11 ±0.15 0.92 ± 0.05 1.32 ±0.06 1.38 ±0.02
Left Eye Depth (cm) Nasal Temporal Superior Oral
0.0 1.38 ±0.03 1.22 ±0.12 1.02±0.11 2.62 ± 0.09
0.5 0.81 ±0.04 1.37±0.17 0.77 ±0.06 3.14±0.10
1.0 0.74 ± 0.06 0.68 ± 0.06 1.22 ±0.06 1.22 ±0.03
1.5 0.63 ±0.12 0.78 ± 0.07 1.47 ±0.07 1.03 ±0.04
* A47Z was a 4.90 kg 8 years old female monkey. SAR data shown is Mean ± S.D. from 4 replicates which is normalized to W/kg per W transmitted power. Specific absorption rate was determined from pulsed exposures at 1.25 GHz carrier, 1.08 MW peak power, 6.04 \xs pulse width and 17.46 Hz for 40 seconds.
73

Technical Report Microwave Induced Retinal Effects
Appendix 3 (part 1 of 2) ERG-Rod Response, b-Wave Amplitude (uV)
Scotopic Adapted, White Flash (3.47 x 10"3 cd-s/m2)
A. Sham
Animal SAR (W/kg)
Right Eye Left Eye Number
Pre Post Ratio (%) Pre Post Ratio (%)
B89Z 0 250.49 241.95 96.59 265.61 264.03 99.41
B57Z 0 279.76 339.51 121.36 278.05 309.02 111.14
B87Z 0 259.76 224.39 86.38 270.73 184.63 68.20
B71Z 0 191.71 218.79 114.13 177.56 221.83 124.93
892Z 0 91.10 247.93 272.15 74.76 206.10 275.68
The mean ratio was 137.00 ± 23.43 % (S.E, n= 10). The pre-exposure amplitude was 213.95 ± 24.51 u.V (S.E., n= 10). The post-exposure amplitude was 245.82 ± 14.99 uV (S.E., n= 10).
B. 4 W/kg
Animal SAR (W/kg)
Right Eye Left Eye Number
Pre Post Ratio (%) Pre Post Ratio (%)
B45Z 4.23 178.05 185.85 104.38 107.32 197.80 184.31
B93Z 4.19 234.64 237.20 101.09 219.27 237.44 108.29
B59Z 4.29 240.00 330.66 137.78 251.95 303.66 120.52
B14Z 4.42 202.68 167.56 82.67 178.54 182.68 102.32
748Z* 4.05 185.61* 135.37* 72.93* 153.66 137.56* 89.52*
* Monkey 748Z received high dose of ketamine and xylazine 4 weeks before exposure. Data was excluded and treated as a special case. The mean ratio was 117.67 ± 11.06 % (S.E., n= 8). Exluding 748Z, the pre-exposure amplitude was 201.56 ± 16.58 uV (S.E., n= 8). Excluding 748Z, the post-exposure amplitude was 230.36 ± 21.04 uV (S.E., n= 8).
74

Technical Report Microwave Induced Retinal Effects
Appendix 3 (part 2 of 2) ERG-Rod Response, b-Wave Amplitude (uV)
Scotopic Adapted, White Flash (3.47 x 10"3 cd-s/m2)
C. 8 W/kg
Animal SAR (W/kg)
Right Eye Left Eye Number
Pre Post Ratio (%) Pre Post Ratio (%)
B61Z 8.39 179.15 166.10 92.72 191.22 170.98 89.42
B51Z 8.78 235.13 173.66 73.86 230.98 192.68 83.42
929Z 8.14 188.54 163.66 86.80 179.76 164.63 91.58
B31Z rejected — ~ -- -- ~ ~
B06Z* 8.64 208.66* 65.24* 31.27* 159.15* 62.07* 39.00*
* Monkey B06Z developed diarrhea and dehydration during exposure. Data was excluded and treated as a special case. Monkey B31Z was rejected during the stage of chair acclimation. Excluding B06Z, the mean ratio was 86.30 ± 2.84 % (S.E., n= 6). Excluding B06Z, the pre-exposure amplitude was 200.80 ± 10.40 uV (S.E., n= 6). Excluding B06Z, the post-exposure amplitude was 171.95 ± 4.44 uV (S.E., n= 6).
D. 20 W/kg
Animal SAR (W/kg)
Right Eye Left Eye Number
Pre Post Ratio (%) Pre Post Ratio (%)
B63Z 20.09 189.27 163.22 86.24 188.42 200.49 106.41
B20Z 20.71 150.25 140.86 93.75 140.37 93.42 66.55
B43Z 19.58 119.51 254.63 213.06 106.10 246.10 231.95
B48Z 20.41 198.05 133.66 67.49 174.15 121.22 69.61
A72Z 20.00 185.49 143.66 77.45- 166.22 186.83 112.40
The mean ratio was 112.49 ± 19.05 % (S.E., n= 10). The pre-exposure amplitude was 161.78 ± 10.00 uV (S.E., n= 10). The post-exposure amplitude was 168.41 ± 16.76 uV (S.E., n= 10).
75

Technical Report Microwave Induced Retinal Effects
Appendix 4 (part 1 of 2) ERG-Rod Response, b-Wave Implicit Time (ms)
Scotopic Adapted, White Flash (3.47 x 10"3 cd-s/m2)
A. Sham
Animal SAR (W/kg)
Right Eye Left Eye Number
Pre Post Ratio (%) Pre Post Ratio (%)
B89Z 0 88.75 88.25 99.44 89.25 89.25 100.00
B57Z 0 110.50 98.00 88.69 102.00 99.00 97.06
B87Z 0 79.00 89.50 113.29 82.00 92.50 112.80
B71Z 0 98.50 106.25 107.87 96.00 110.25 114.84
892Z 0 108.50 86.25 79.49 113.00 86.75 76.77
The mean ratio was 99.03 ± 4.36 % (S.E., n= 10). The pre-exposure rod b-wave implicit time was 96.75 ± 3.76 ms (S.E., n= 10). The post-exposure rod b-wave implicit time was 94.60 ± 2.67 ms (S.E., n= 10).
B. 4 W/kg
Animal SAR (W/kg)
Right Eye Left Eye Number
Pre Post Ratio (%) Pre Post Ratio (%)
B45Z 4.23 109.50 82.50 75.34 112.50 82.50 73.33
B93Z 4.19 93.38 109.50 117.26 95.50 101.25 106.02
B59Z 4.29 96.50 81.00 83.94 98.00 81.00 82.65
B14Z 4.42 93.00 92.50 99.46 101.00 89.00 88.12
748Z* 4.05 92.50* 86.50* 93.51* 93.00* 93.00* 100.00*
* Monkey 748Z received high dose of ketamine and xylazine 4 weeks before exposure. Data was excluded and treated as a special case. The mean ratio was 90.75 ± 5.47 % (S.E., n= 8). Excluding 748Z, the pre-exposure rod b-wave implicit time was 99.92 ± 2.59 ms (S.E., n=8). Excluding 748Z, the post-exposure rod b-wave implicit time was 89.91 ± 3.75 ms (S.E., n=8).
76

Technical Report Microwave Induced Retinal Effects
C. 8 W/kg
Appendix 4 (part 2 of 2) ERG-Rod Response, b-Wave Implicit Time (ms)
Scotopic Adapted, White Flash (3.47 x 10"3 cd-s/m2)
Animal SAR (W/kg)
Right Eye Left Eye Number
Pre Post Ratio (%) Pre Post Ratio (%)
B61Z 8.39 101.00 84.50 83.66 100.00 85.00 85.00
B51Z 8.78 105.00 80.25 76.43 106.50 80.75 75.82
929Z 8.14 88.00 83.00 94.32 87.50 83.00 94.86
B31Z rejected — ~ — — ~ ~
B06Z* 8.64 105.75* 101.25* 95.74* 105.00* 102.75* 97.86*
* Monkey B06Z developed diarrhea and dehydration during exposure. Data was excluded and treated as a special case. Monkey B31Z was rejected during the stage of chair acclimation. Excluding B06Z, the mean ratio was 85.02 ± 3.38 % (S.E., n= 6). Excluding B06Z, the pre-exposure rod b-wave implicit time was 98.00 ± 3.39 ms (S.E., n=6). Excluding B06Z, the post-exposure rod b-wave implicit time was 82.75 ± 0.79 ms (S.E., n=6).
D. 20 W/kg
Animal SAR (W/kg)
Right Eye Left Eye Number
Pre Post Ratio (%) Pre Post Ratio (%)
B63Z 20.09 123.50 106.83 86.50 121.50 105.50 86.83
B20Z 20.71 106.25 86.50 81.41 107.00 86.00 80.37
B43Z 19.58 111.50 95.50 85.65 110.75 94.50 85.33
B48Z 20.41 84.50 79.00 93.49 85.00 75.50 88.82
A72Z 20.00 105.00 103.00 98.10 106.00 107.00 100.94
The mean ratio was 88.74 ± 2.14 % (S.E, n= 10). The pre-exposure rod b-wave implicit time was 106.10 ± 4.09 ms (S.E., n= 10). The post-exposure rod b-wave implicit time was 93.93 ± 3.71 ms (S.E., n= 10).
77

Technical Report Microwave Induced Retinal Effects
Appendix 5 (part 1 of 2) ERG-Combined Rod and Cone Response, b-Wave Amplitude (u.V)
Scotopic Adapted, White Flash (2.23 cd-s/m )
A. Sham
Animal SAR (W/kg)
Right Eye Left Eye Number
Pre Post Ratio (%) Pre Post Ratio (%)
B89Z 0 746.22 512.20 68.64 485.06 523.21 107.87
B57Z 0 618.30 635.37 102.76 587.50 618.90 105.34
B87Z 0 473.78 469.27 99.05 476.83 400.49 83.99
B71Z 0 457.62 488.54 106.76 434.15 467.32 107.64
892Z 0 390.86 514.63 131.67 345.13 444.52 128.80
The mean ratio was 104.25 ± 5.86 % (S.E., n= 10). The pre-exposure amplitude was 501.55 ± 37.38 U.V (S.E., n= 10). The post-exposure amplitude was 507.45 ± 23.08 uV (S.E., n= 10).
B. 4 W/kg
Animal SAR (W/kg)
Right Eye Left Eye Number
Pre Post Ratio (%) Pre Post Ratio (%)
B45Z 4.23 468.60 536.89 114.57 365.85 545.43 149.09
B93Z 4.19 420.37 438.05 104.21 408.54 425.85 104.24
B59Z 4.29 558.54 509.15 91.16 559.15 499.39 89.31
B14Z 4.42 428.97 398.29 92.85 436.89 386.59 88.49
748Z* 4.05 276.10* 235.61* 85.34* 254.64* 228.54* 89.75*
* Monkey 748Z received high dose of ketamine and xylazine 4 weeks before exposure. Data was excluded and treated as a special case. Excluding 748Z, the mean ratio was 104.24 ± 7.18 % (S.E., n= 8). Excluding 748Z, the pre-exposure amplitude was 455.86 ± 24.66 u,V (S.E., n= 8). Excluding 748Z, the post-exposure amplitude was 467.46 ± 22.19 uV (S.E., n= 8).
78

Technical Report Microwave Induced Retinal Effects
Appendix 5 (part 2 of 2) ERG-Combined Rod and Cone Response, b-Wave Amplitude (u,V)
Scotopic Adapted, White Flash (2.23 cd-s/m )
C. 8 W/kg
Animal SAR (W/kg)
Right Eye Left Eye Number
Pre Post Ratio (%) Pre Post Ratio (%)
B61Z 8.39 382.57 264.39 69.11 396.95 326.10 82.15
B51Z 8.78 403.05 383.78 95.22 401.95 383.17 95.33
929Z 8.14 398.90 333.84 83.69 408.54 319.21 78.13
B31Z rejected — ~ — -- ~ —
B06Z 8.64 399.39* 90.70* 22.71* 364.40* 68.10* 18.69*
* Monkey B06Z developed diarrhea and dehydration during exposure. Data was excluded and treated as a special case. Monkey B31Z was rejected during the stage of chair acclimation. Excluding B06Z, the mean ratio was 83.94 ± 4.14 % (S.E., n= 6). Excluding B06Z, the pre-exposure amplitude was 398.66 ± 3.60 uV (S.E., n= 6). Excluding B06Z, the post-exposure amplitude was 335.08 ± 18.27 uV (S.E., n= 6).
D. 20 W/kg
Animal SAR (W/kg)
Right Eye Left Eye Number
Pre Post Ratio (%) Pre Post Ratio (%)
B63Z 20.09 396.59 358.29 90.34 387.56 372.32 96.07
B20Z 20.71 385.73 375.24 97.28 391.95 354.15 90.36
B43Z 19.58 299.39 404.63 135.15 281.71 407.07 144.50
B48Z 20.41 387.93 404.27 104.21 360.73 351.52 97.45
A72Z 20.00 367.07 303.30 82.63 335.49 228.66 68.16
The mean ratio was 100.62 ± 7.27 % (S.E., n= 10). The pre-exposure amplitude was 359.42 ±12.92 uV (S.E., n= 10). The post-exposure amplitude was 355.95 ± 17.31 u,V (S.E., n= 10).
79

Technical Report Microwave Induced Retinal Effects
Appendix 6 (part 1 of 2) ERG-Combined Rod and Cone Response, b-Wave Implicit Time (ms)
Scotopic Adapted, White Flash (2.23 cd-s/m2)
A. Sham
Animal SAR (W/kg)
Right Eye Left Eye Number
Pre Post Ratio (%) Pre Post Ratio (%)
B89Z 0 47.00 47.25 100.53 47.00 47.75 101.60
B57Z 0 45.25 47.00 103.87 46.25 47.50 102.70
B87Z 0 46.60 44.50 95.49 45.75 44.50 97.27
B71Z 0 47.50 46.50 97.89 46.25 45.50 98.38
892Z 0 49.25 47.25 95.94 49.00 46.25 94.39
The mean ratio was 98.81 ± 1.02 % (S.E., n= 10). The pre-exposure implicit time was 46.99 ± 0.41 ms (S.E., n= 10). The post-exposure implicit time was 46.40 ± 0.38 ms (S.E., n^ 10).
B. 4 W/kg
Animal SAR (W/kg)
Right Eye Left Eye Number
Pre Post Ratio (%) Pre Post Ratio (%)
B45Z 4.23 46.50 43.75 94.09 47.50 44.50 93.68
B93Z 4.19 47.25 51.00 107.94 46.75 51.50 110.16
B59Z 4.29 48.25 46.25 95.85 50.25 45.00 89.55
B14Z 4.42 43.75 47.50 108.57 43.75 46.00 105.14
748Z* 4.05 46.75 45.50 97.33 46.75 44.75 95.72
* Monkey 748Z received high dose of ketamine and xylazine 4 weeks before exposure. Data was excluded and treated as a special case. Excluding 748Z, the mean ratio was 100.62 ± 2.88 % (S.E., n= 8). Excluding 748Z, the pre-exposure implicit time was 46.75 ± 0.77 ms (S.E., n= 8). Excluding 748Z, the post-exposure implicit time was 46.94 ± 1.03 ms (S.E., n= 8).
80

Technical Report Microwave Induced Retinal Effects
Appendix 6 (part 2 of 2) ERG-Combined Rod and Cone Response, b-Wave Implicit Time (ms)
Scotopic Adapted, White Flash (2.23 cd-s/m2)
C. 8 W/kg
Animal SAR (W/kg)
Right Eye Left Eye Number
Pre Post Ratio (%) Pre Post Ratio (%)
B61Z 8.39 46.50 38.50 82.80 46.25 38.50 83.24
B51Z 8.78 48.25 43.75 90.67 47.75 43.25 90.58
929Z 8.14 46.50 44.00 94.62 46.25 46.25 100.00
B31Z rejected ~ ~ ~ ~ ~ —
B06Z 8.64 50.50 34.75 68.81 50.25 34.25 68.16
* Monkey B06Z developed diarrhea and dehydration during exposure. Data was excluded and treated as a special case. Monkey B31Z was rejected during the stage of chair acclimation. Excluding B06Z, the mean ratio was 90.32 ± 2.70 % (S.E., n= 6). Excluding B06Z, the pre-exposure implicit time was 46.92 ± 0.35 ms (S.E., n= 6). Excluding B06Z, the post-exposure implicit time was 42.38 ± 1.30 ms, (S.E., n= 6).
D. 20 W/kg
Animal SAR (W/kg)
Right Eye Left Eye Number
Pre Post Ratio (%) Pre Post Ratio (%)
B63Z 20.09 48.50 45.75 94.33 48.50 46.50 95.88
B20Z 20.71 47.50 49.25 103.68 47.50 47.75 100.53
B43Z 19.58 49.50 46.25 93.43 50.75 45.25 89.16
B48Z 20.41 43.25 40.00 92.49 42.25 40.75 96.45
A72Z 20.00 48.50 47.50 97.94 50.75 46.50 91.63
The mean ratio was 95.55 ± 1.37 % (S.E., n= 10). The pre-exposure implicit time was 46.40 ± 0.85 ms (S.E., n= 10). The post-exposure implicit time was 45.55 ± 0.93 ms (S.E., n= 10).
81

Technical Report Microwave Induced Retinal Effects
Appendix 7 (part 1 of 2) ERG-Combined Rod and Cone Response, a-Wave Amplitude (u.V)
Scotopic Adapted, White Flash (2.23 cd-s/m2)
A. Sham
Animal SAR (W/kg)
Right Eye Left Eye Number
Pre Post Ratio (%) Pre Post Ratio (%)
B89Z 0 -283.54 -300.72 106.06 -292.69 -319.82 109.27
B57Z 0 -236.28 -226.22 95.74 -228.66 -225.61 98.67
B87Z 0 -232.93 -269.51 115.70 -240.85 -203.66 84.56
B71Z 0 -255.80 -238.42 93.21 -250.92 -229.64 91.52
892Z 0 -206.06 -300.31 145.74 -225.61 -268.29 118.92
The mean ratio was 105.94 ± 5.62 % (S.E, n= 10). The pre-exposure amplitude was -245.33 ± 8.37 uV (S.E., n= 10). The post-exposure amplitude was -258.22 ± 12.42 uV (S.E., n= 10).
B. 4 W/kg
Animal SAR (W/kg)
Right Eye Left Eye Number
Pre Post Ratio (%) Pre Post Ratio (%)
B45Z 4.23 -267.69 -302.44 112.98 -195.73 -303.36 154.99
B93Z 4.19 -233.05 -260.00 111.56 -220.49 -254.15 115.27
B59Z 4.29 -267.68 -266.16 99.43 -267.38 -283.54 106.04
B14Z 4.42 -264.63 -231.22 87.37 -279.58 -239.76 85.76
748Z* 4.05 -242.32* -285.12* 117.66* -215.86* -257.56* 119.32*
* Monkey 748Z received high dose of ketamine and xylazine 4 weeks before exposure. Data was excluded and treated as a special case. Excluding 748Z, the mean ratio was 109.18 ± 7.66 % (S.E, n= 8). Excluding 748Z, the pre-exposure amplitude was -249.53 ± 10.45 \xV (S.E., n= 8). Excluding 748Z, the post-exposure amplitude was -267.58 ± 9.53 uY (S.E., n= 8).
82

Technical Report Microwave Induced Retinal Effects
Appendix 7 (part 2 of 2) ERG-Combined Rod and Cone Response, a-Wave Amplitude (uV)
Scotopic Adapted, White Flash (2.23 cd-s/m2)
C. 8 W/kg
Animal SAR (W/kg)
Right Eye Left Eye Number
Pre Post Ratio (%) Pre Post Ratio (%)
B61Z 8.39 -216.59 -139.76 64.53 -233.42 -187.56 80.35
B51Z 8.78 -213.66 -200.61 93.89 -212.32 -190.92 89.92
929Z 8.14 -227.20 -196.95 86.69 -216.95 -203.97 94.02
B31Z rejected ~ ~ — ~ ~ —
B06Z 8.64 -231.22* -164.52* 71.15* -190.25* -145.98* 76.73*
* Monkey B06Z developed diarrhea and dehydration during exposure. Data was excluded and treated as a special case. Monkey B31Z was rejected during the stage of chair acclimation. Excluding B06Z, the mean ratio was 84.90 ± 4.58 % (S.E., n= 6). Excluding B06Z, the pre-exposure amplitude was -220.02 ± 3.43 uV (S.E., n= 6). Excluding B06Z, the post-exposure amplitude was -186.63 ± 9.69 u,V (S.E., n= 6).
D. 20 W/kg
Animal SAR (W/kg)
Right Eye Left Eye Number
Pre Post Ratio (%) Pre Post Ratio (%)
B63Z 20.09 -186.83 -218.07 116.72 -197.56 -216.22 109.45
B20Z 20.71 -277.20 -237.44 85.66 -296.34 -213.17 71.93
B43Z 19.58 -197.08 -213.29 108.23 -176.35 -210.25 119.22
B48Z 20.41 -175.61 -194.52 110.77 -158.66 -174.70 110.11
A72Z 20.00 -213.17 -205.98 96.63 -185.86 -178.42 96.00
The mean ratio was 102.47 ± 4.70 % (S.E., n= 10). The pre-exposure amplitude was -206.47 ± 14.24 uV (S.E., n= 10). The post-exposure amplitude was -206.21 ± 5.99 uV (S.E., n= 10).
83

Technical Report Microwave Induced Retinal Effects
Appendix 8 (part 1 of 2) ERG-Combined Rod and Cone Response, a-Wave Implicit Time (ms)
Scotopic Adapted, White Flash (2.23 cd-s/m2)
A. Sham
Animal SAR (W/kg)
Right Eye Left Eye Number
Pre Post Ratio (%) Pre Post Ratio (%)
B89Z 0 16.00 15.25 95.31 15.50 14.75 95.16
B57Z 0 14.75 15.00 101.69 14.75 15.50 105.08
B87Z 0 14.50 14.50 100.00 15.00 14.50 96.67
B71Z 0 15.25 14.50 95.08 15.50 14.75 95.16
892Z 0 16.25 15.00 92.31 16.50 15.25 92.42
The mean ratio was 96.89 ± 1.30 % (S.E., n= 10). The pre-exposure implicit time was 15.40 ± 0.21 ms (S.E., n= 10). The post-exposure implicit time was 14.90 ± 0.11 ms (S.E., n= 10)
B. 4 W/kg
Animal SAR (W/kg)
Right Eye Left Eye Number
Pre Post Ratio (%) Pre Post Ratio (%)
B45Z 4.23 15.50 14.50 93.55 16.50 14.00 84.85
B93Z 4.19 15.00 16.00 106.67 14.75 15.00 101.69
B59Z 4.29 15.00 14.50 96.67 15.75 14.50 92.06
B14Z 4.42 14.50 14.50 100.00 14.75 14.50 98.31
748Z* 4.05 16.25* 16.00* 98.46* 17.25* 16.25* 94.20*
* Monkey 748Z received high dose of ketamine and xylazine 4 weeks before exposure. Data was excluded and treated as a special case. Excluding 748Z, the mean ration was 96.73 ± 2.35 % (S.E., n= 8). Excluding 748Z, the pre-exposure implicit time was 15.22 ± 0.23 ms (S.E., n= 8). Excluding 748Z, the post-exposure implicit time was 14.69 ± 0.21 ms (S.E., n= 8).
84

Technical Report Microwave Induced Retinal Effects
Appendix 8 (part 2 of 2) ERG-Combined Rod and Cone Response, a-Wave Implicit Time (ms)
Scotopic Adapted, White Flash (2.23 cd-s/m2)
C. 8 W/kg
Animal SAR (W/kg)
Right Eye Left Eye Number
Pre Post Ratio (%) Pre Post Ratio (%)
B61Z 8.39 15.25 13.50 88.52 15.25 13.50 88.52
B51Z 8.78 16.25 14.25 87.69 16.25 14.00 86.15
929Z 8.14 15.50 14.75 95.16 15.50 15.25 98.39
B31Z rejected ~ ~ -- ~ ~ ~
B06Z* 8.64 15.25* 16.25* 106.56* 15.50* 17.75* 114.52*
* Monkey B06Z developed diarrhea and dehydration during exposure. Data was excluded and treated as a special case. Monkey B31Z was rejected during the stage of chair acclimation. Excluding B06Z, the mean ratio was 90.74 ± 1.99 % (S.E, n= 6). Excluding B06Z, the pre-exposure implicit time was 15.67 ± 0.19 ms (S.E., n= 6). Excluding B06Z, the post-exposure implicit time was 14.21 ± 0.28 ms (S.E., n= 6).
D. 20 W/kg
Animal SAR (W/kg)
Right Eye Left Eye Number
Pre Post Ratio (%) Pre Post Ratio (%)
B63Z 20.09 16.00 15.00 93.75 16.50 14.50 87.88
B20Z 20.71 15.25 15.50 101.64 15.50 16.00 103.23
B43Z 19.58 17.25 14.50 84.06 16.75 14.25 85.07
B48Z 20.41 13.50 13.50 100.00 14.00 14.00 100.00
A72Z 20.00 16.50 15.50 93.94 17.00 15.50 91.18
The mean ration was 94.08 ± 2.21 % (S.E., n= 10). The pre-exposure implicit time was 15.83 ± 0.40 ms (S.E., n= 10). The post-exposure implicit time was 14.83 ± 0.25 ms (S.E., n= 10).
85

Technical Report Microwave Induced Retinal Effects
Appendix 9 (part 1 of 2) ERG-Oscillatory Potentials (uV)
Scotopic Adapted, White Flash (2.23 cd-s/m2)
A. Sham
Animal SAR (W/kg)
Right Eye Left Eye Number
Pre Post Ratio (%) Pre Post Ratio (%)
B89Z 0 232.9 238.4 102.36 256.1 240.2 93.79
B57Z 0 201.2 181.1 90.01 197.6 139.0 70.34
B87Z 0 211.0 204.1 96.73 215.2 202.4 94.05
B71Z 0 246.3 136.8 55.54 209.1 141.0 67.43
892Z 0 124.0 114.5 92.34 103.4 99.1 95.84
The mean ratio was 85.84 ± 4.92 % (S.E, n= 10). The pre-exposure amplitude was 199.68 ± 15.61 uV (S.E., n= 10). The post-exposure amplitude was 169.66 ± 15.97 uV (S.E., n= 10).
B. 4 W/kg
Animal SAR (W/kg)
Right Eye Left Eye Number
Pre Post Ratio (%) Pre Post Ratio (%)
B45Z 4.23 272.6 225.0 82.54 214.0 237.2 110.84
B93Z 4.19 97.3 87.1 89.52 96.0 86.3 89.90
B59Z 4.29 92.1 112.2 121.82 72.0 99.4 138.06
B14Z 4.42 204.7 213.4 104.25 188.3 220.9 117.31
748Z* 4.05 79.6* 62.4* 78.39* 69.5* 68.4* 98.42*
* Monkey 748Z received high dose of ketamine and xylazine 4 weeks before exposure. Data was excluded and treated as a special case. Excluding 748Z, the mean ratio was 106.78 ± 6.69 % (S.E., n= 8). Excluding 748Z, the pre-exposure amplitude was 154.63 ± 26.24 |iV (S.E., n= 8). Excluding 748Z, the post-exposure amplitude was 160.19 ± 24.44 u.V (S.E., n= 8).
86

Technical Report Microwave Induced Retinal Effects
Appendix 9 (part 2 of 2) ERG-Oscillatory Potentials (uV)
Scotopic Adapted, White Flash (2.23 cd-s/m2)
C. 8 W/kg
Animal SAR (W/kg)
Right Eye Left Eye Number
Pre Post Ratio (%) Pre Post Ratio (%)
B61Z 8.39 193.9 130.5 67.30 195.7 133.4 68.17
B51Z 8.78 92.7 110.2 118.88 82.7 129.3 156.35
929Z 8.14 143.5 68.6 47.80 160.4 73.6 45.89
B31Z rejected — ~ — -- ~ ~
B06Z* 8.64* 123.9* 41.2* 33.25* 104.4* 38.8* 37.16*
* Monkey B06Z developed diarrhea and dehydration during exposure. Data was excluded and treated as a special case. Monkey B31Z was rejected during the stage of chair acclimation. Excluding B06Z, the mean ratio was 84.02 ± 18.03 (S.E., n= 6). Excluding B06Z, the pre-exposure amplitude was 144.82 ± 19.85 uV (S.E., n= 6). Excluding B06Z, the post-exposure amplitude was 107.60 ± 12.03 uV (S.E., n= 6).
D. 20 W/kg
Animal SAR (W/kg)
Right Eye Left Eye Number
Pre Post Ratio (%) Pre Post Ratio (%)
B63Z 20.09 144.6 167.1 115.56 126.1 178.0 141.16
B20Z 20.71 179.9 139.1 77.32 200.1 116.7 58.32
B43Z 19.58 40.2 186.0 462.69 56.6 198.1 350.00
B48Z 20.41 97.6 136.6 139.96 81.7 132.0 161.57
A72Z 20.00 109.8 126.2 114.94 100.7 103.6 102.88
The mean ratio was 172.44 ± 41.01 (S.E, n= 10). The pre-exposure amplitude was 113.70 ± 16.02 uV (S.E., n= 10). The post-exposure amplitude was 148.34 ± 10.06 uV (S.E., n 10).
87

Technical Report Microwave Induced Retinal Effects
Appendix 10 (part 1 of 2) ERG-30 Hz Flicker Amplitude (uV)
Scotopic White Flashes (2.23 cd-s/m2)
A. Sham
Animal SAR (W/kg)
Right Eye Left Eye Number
Pre Post Ratio (%) Pre Post Ratio (%)
B89Z 0 116.10 104.60 90.09 115.35 112.30 97.36
B57Z 0 104.00 118.00 113.46 107.56 113.20 105.24
B87Z 0 80.85 110.00 136.05 77.80 93.30 119.92
B71Z 0 83.55 98.05 117.35 91.80 80.20 87.36
892Z 0 79.00 130.50 165.19 77.10 109.15 141.57
The mean ratio was 117.36 ± 7.77 % (S.E., n= 10). The pre-exposure amplitude was 93.31 ± 5.04 uV (S.E., n= 10). The post-exposure amplitude was 106.93 ± 4.40 uV (S.E., n= 10).
B. 4 W/kg
Animal SAR (W/kg)
Right Eye Left Eye Number
Pre Post Ratio (%) Pre Post Ratio (%)
B45Z 4.23 91.00 84.25 92.58 74.25 92.30 124.31
B93Z 4.19 67.35 62.10 92.20 62.80 56.10 89.33
B59Z 4.29 122.80 107.35 87.42 124.10 107.70 86.78
B14Z 4.42 92.40 84.75 91.72 91.60 85.70 93.56
748Z* 4.05 104.25* 48.45* 46.47* 85.00* 44.65* 52.53*
* Monkey 748Z received high dose of ketamine and xylazine 4 weeks before exposure. Data was excluded and treated as a special case. Excluding 748Z, the mean ratio was 94.74 ± 4.31 % (S.E., n= 8). The pre-exposure amplitude was 90.79 ± 8.18 uV (S.E., n= 8). The post-exposure amplitude was 85.03 ± 6.59 u,V (S.E., n= 8).
88

Technical Report Microwave Induced Retinal Effects
Appendix 10 (part 2 of 2) ERG-30 Hz Flicker Amplitude (uV)
Scotopic White Flashes (2.23 cd-s/m2)
C. 8 W/kg
Animal SAR (W/kg)
Right Eye Left Eye
Number Pre Post Ratio (%) Pre Post Ratio (%)
B61Z 8.39 75.25 129.75 172.43 75.00 126.70 168.93
B51Z 8.78 77.35 100.25 129.61 78.75 97.20 123.43
929Z 8.14 109.70 64.25 58.57 119.27 109.80 92.06
B31Z rejected ~ — ~ ~ « --
B06Z* 8.64 80.40* 31.23* 38.84* 84.15* 27.63* 32.83*
* Monkey B06Z developed diarrhea and dehydration during exposure. Data was excluded and treated as a special case. Monkey B31Z was rejected during the stage of chair acclimation. Excluding B06Z, the mean ratio was 124.17 ± 17.98 % (S.E., n= 6). Excluding B06Z, the pre-exposure amplitude was 89.22 ± 8.10 uV (S.E., n= 6). Excluding B06Z, the post-exposure amplitude was 104.66 ± 9.75 U.V (S.E., n= 6).
D. 20 W/kg
Animal Number
SAR (W/kg)
Right Eye Left Eye
Pre Post Ratio (%) Pre Post Ratio (%)
B63Z
B20Z
B43Z
B48Z
A72Z
20.09 75.53 91.20 120.75 77.30 88.65 114.68
20.71 73.00 63.30 86.71 59.05 73.70 124.81
19.58 44.40 123.05 277.14 43.15 131.80 305.45
20.41 105.65 121.80 115.29 97.20 114.20 117.49
20.00 70.10 99.35 141.73 66.95 77.95 116.43
The mean ratio was 152.05 ± 23.68 % (S.E., n= 10). The pre-exposure amplitude was 71.24 ± 6.32 uV (S.E., n- 10). The post-exposure amplitude was 98.50 ± 7.40 uV (S.E., n= 10).
89

Technical Report Microwave Induced Retinal Effects
Appendix 11 (part 1 of 2) ERG-Cone Response, b-Wave Amplitude (|j.V)
Photopic (28.8 cd/m2) Adapted, White Flash (2.23 cd-s/m2)
A. Sham
Animal SAR (W/kg)
Right Eye Left Eye Number
Pre Post Ratio (%) Pre Post Ratio (%)
B89Z 0 138.42 119.92 86.63 141.28 129.66 91.78
B57Z 0 162.28 151.95 93.63 154.79 155.12 100.21
B87Z 0 98.89 115.20 116.49 101.38 105.20 103.77
B71Z 0 84.63 95.31 112.62 88.15 89.15 101.13
892Z 0 105.25 142.39 135.29 96.71 123.17 127.36
The mean ratio was 106.89 ± 5.00 % (S.E., n= 10). The pre-exposure amplitude was 119.18 ± 8.53 u.V (S.E., n= 10). The Post-exposure amplitude was 122.71 ± 7.14 uV (S.E., n= 10). The difference between pre-exposure and post-exposure amplitudes was not significant by paired t-test (t= 2.31, p= 0.08).
B. 4 W/kg
Animal SAR (W/kg)
Right Eye Left Eye Number
Pre Post Ratio (%) Pre Post Ratio (%)
B45Z 4.23 119.94 146.50 122.14 91.22 145.45 159.45
B93Z 4.19 84.15 84.02 99.85 92.56 82.80 89.46
B59Z 4.29 160.43 178.78 111.44 181.89 178.46 98.11
B14Z 4.42 107.28 107.49 100.20 113.75 104.70 92.04
748Z* 4.05 119.76* 73.11* 61.05* 109.51* 74.24* 67.79*
* Monkey 748Z received high dose of ketamine and xylazine 4 weeks before exposure. Data was excluded and treated as a special case. The mean ratio was 109.09 ± 8.10 % (S.E., n= 8). The pre-exposure amplitude was 118.90 ± 12.34 u.V (S.E., n= 8). The post- exposure amplitude was 128.53 ± 13.83 uV (S.E., n= 8). The difference between pre-exposure and post-exposure amplitudes was not significant by paired t-test (t= 1.23, p= 0.26).
90

Technical Report Microwave Induced Retinal Effects
Appendix 11 (part 2 of 2) ERG-Cone Response, b-Wave Amplitude (u,V)
Photopic (28.8 cd/m2) Adapted, White Flash (2.23 cd-s/m2)
C. 8 W/kg
Animal SAR (W/kg)
Right Eye Left Eye Number
Pre Post Ratio (%) Pre Post Ratio (%)
B61Z 8.39 65.51 125.12 190.99 70.85 117.32 165.59
B51Z 8.78 91.46 122.20 133.61 95.96 114.02 118.82
929Z 8.14 113.76 136.79 120.24 125.32 141.41 112.84
B31Z rejected ~ ~ ~ — ~ ~
B06Z* 8.64 96.10* 7.56* 7.87* 106.34* 6.54* 6.15*
* Monkey B06Z developed diarrhea and dehydration during exposure. Data was excluded and treated as a special case. Monkey B31Z was rejected during the stage of chair acclimation. Excluding B06Z, the mean ratio was 140.35 ± 12.74 % (S.E., n= 6). Excluding B06Z, the pre-exposure amplitude was 93.81 ± 9.54 uV (S.E., n= 6). Excluding B06Z, the post-exposure amplitude was 126.14 ± 4.43 uV (S.E., n= 6). The difference between pre-exposure and post-exposure amplitudes was significant by paired t-test (t= 4.57, p= 0.006).
D. 20 W/kg
Animal SAR (W/kg)
Right Eye Left Eye Number
Pre Post Ratio (%) Pre Post Ratio (%)
B63Z 20.09 78.38 95.25 121.52 84.19 93.61 111.19
B20Z 20.71 87.78 103.71 118.15 92.66 100.95 108.95
B43Z 19.58 91.22 150.78 165.29 94.54 152.68 161.50
B48Z 20.41 116.19 129.03 111.05 109.35 126.34 115.54
A72Z 20.00 99.17 112.68 113.62 97.27 130.12 133.77
The mean ratio was 126.06 ± 6.62 % (S.E., n= 10). The pre-exposure amplitude was 95.08 ± 3.56 uV (S.E., n= 10). The post-exposure amplitude was 119.52 ± 6.85 uV (S.E., n= 10). The difference between pre-exposure and post-exposure amplitudes was significant by paired t-test (t= 4.00, p= 0.003).
91
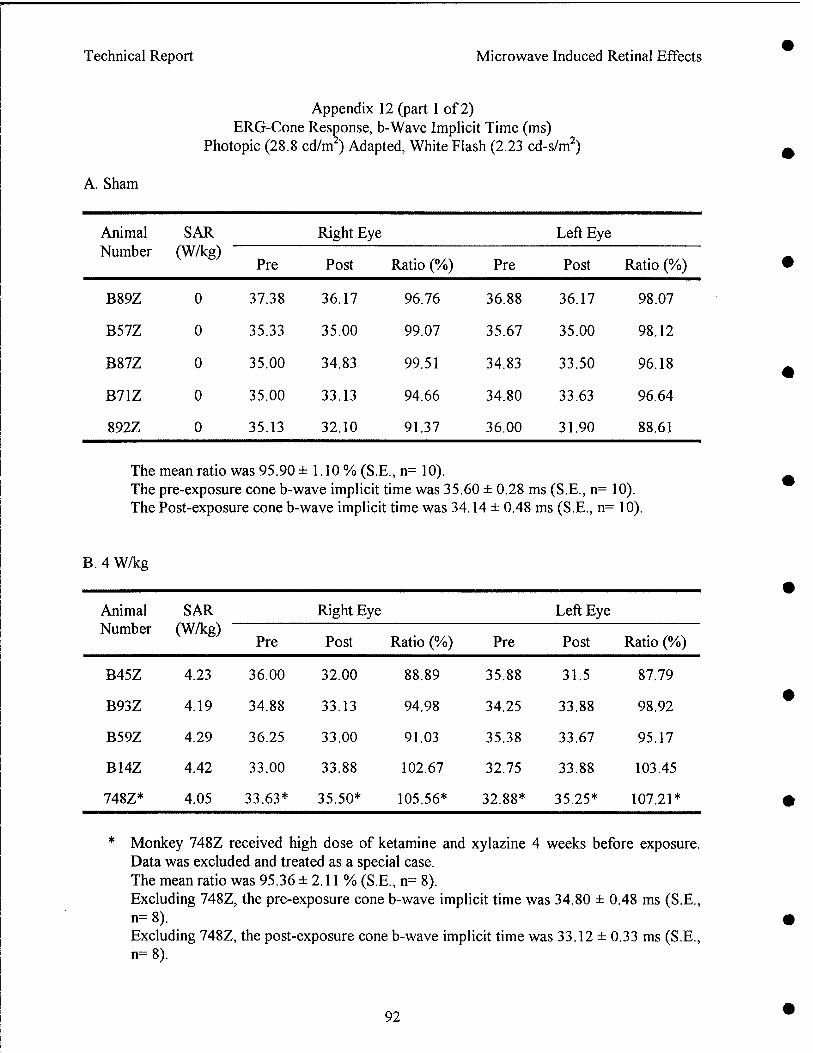
Technical Report Microwave Induced Retinal Effects
Appendix 12 (part 1 of 2) ERG-Cone Response, b-Wave Implicit Time (ms)
Photopic (28.8 cd/nT) Adapted, White Flash (2.23 cd-s/m2)
A. Sham
Animal SAR (W/kg)
Right Eye Left Eye Number
Pre Post Ratio (%) Pre Post Ratio (%)
B89Z 0 37.38 36.17 96.76 36.88 36.17 98.07
B57Z 0 35.33 35.00 99.07 35.67 35.00 98.12
B87Z 0 35.00 34.83 99.51 34.83 33.50 96.18
B71Z 0 35.00 33.13 94.66 34.80 33.63 96.64
892Z 0 35.13 32.10 91.37 36.00 31.90 88.61
The mean ratio was 95.90 ±1.10 % (S.E., n= 10). The pre-exposure cone b-wave implicit time was 35.60 ± 0.28 ms (S.E., n= 10). The Post-exposure cone b-wave implicit time was 34.14 ± 0.48 ms (S.E., n= 10).
B. 4 W/kg
Animal SAR (W/kg)
Right Eye Left Eye Number
Pre Post Ratio (%) Pre Post Ratio (%)
B45Z 4.23 36.00 32.00 88.89 35.88 31.5 87.79
B93Z 4.19 34.88 33.13 94.98 34.25 33.88 98.92
B59Z 4.29 36.25 33.00 91.03 35.38 33.67 95.17
B14Z 4.42 33.00 33.88 102.67 32.75 33.88 103.45
748Z* 4.05 33.63* 35.50* 105.56* 32.88* 35.25* 107.21*
* Monkey 748Z received high dose of ketamine and xylazine 4 weeks before exposure. Data was excluded and treated as a special case. The mean ratio was 95.36 ±2.11 % (S.E, n= 8). Excluding 748Z, the pre-exposure cone b-wave implicit time was 34.80 ± 0.48 ms (S.E., n=8). Excluding 748Z, the post-exposure cone b-wave implicit time was 33.12 ± 0.33 ms (S.E., n=8).
92

Technical Report Microwave Induced Retinal Effects
Appendix 12 (part 2 of 2) ERG-Cone Response, b-Wave Implicit Time (ms)
Photopic (28.8 cd/m2) Adapted, White Flash (2.23 cd-s/m2)
C. 8 W/kg
Animal SAR (W/kg)
Right Eye Left Eye Number
Pre Post Ratio (%) Pre Post Ratio (%)
B61Z 8.39 34.38 30.33 88.22 33.88 30.00 88.55
B51Z 8.78 40.17 34.75 86.51 39.17 35.00 89.35
929Z 8.14 35.86 34.50 96.21 35.71 34.50 96.61
B31Z rejected — -- ~ ~ — --
B06Z* 8.64 33.75* 36.75* 108.89* 33.92* 37.75* 111.29*
* Monkey B06Z developed diarrhea and dehydration during exposure. Data was excluded and treated as a special case. Monkey B31Z was rejected during the stage of chair acclimation. Excluding B06Z, the mean ratio was 90.91 ± 1.78 % (S.E., n= 6). Excluding B06Z, the pre-exposure cone b-wave implicit time was 36.53 ± 1.05 ms (S.E., n=6). Excluding B06Z, the post-exposure cone b-wave implicit time was 33.58 ± 0.96 ms (S.E., n=6).
D. 20 W/kg
Animal SAR (W/kg)
Right Eye Left Eye Number
Pre Post Ratio (%) Pre Post Ratio (%)
B63Z 20.09 35.75 32.60 91.19 35.67 33.30 93.36
B20Z 20.71 34.00 37.75 111.03 34.00 36.13 106.26
B43Z 19.58 39.10 36.30 92.84 35.20 35.80 101.70
B48Z 20.41 32.70 31.40 96.02 32.83 30.90 94.12
A72Z 20.00 35.60 34.50 96.91 36.20 33.75 93.23
The mean ratio was 97.67 ± 2.08 % (S.E., n= 10). The pre-exposure cone b-wave implicit time was 35.11 ± 0.59 ms (S.E., n= 10). The post-exposure cone b-wave implicit time was 34.24 ± 0.71 ms (S.E., n= 10).
93

Technical Report Microwave Induced Retinal Effects
Appendix 13 (part 1 of 2) ERG-Cone Response, a-Wave Amplitude (u.V)
Photopic (28.8 cd/m2) Adapted, White Flash (2.23 cd-s/m2)
A. Sham
Animal SAR (W/kg)
Right Eye Left Eye Number
Pre Post Ratio (%) Pre Post Ratio (%)
B89Z 0 -60.61 -49.84 82.23 -54.88 -47.15 85.91
B57Z 0 -30.16 -49.39 163.76 -35.93 -51.50 143.33
B87Z 0 -40.57 -46.34 114.22 -43.09 -42.52 98.68
B71Z 0 -34.51 -34.23 99.19 -30.69 -26.73 87.10
892Z 0 -62.08 -91.95 148.12 -52.87 -81.95 155.00
The mean ratio was 117.75 ± 10.01 % (S.E, n= 10). The pre-exposure amplitude was -44.54 ± 3.85 uV (S.E., n= 10). The post-exposure amplitude was -52.16 ± 6.33 uV (S.E., n= 10).
B. 4 W/kg
Animal SAR (W/kg)
Right Eye Left Eye Number
Pre Post Ratio (%) Pre Post Ratio (%)
B45Z 4.23 -60.61 -39.68 65.47 -46.95 -46.08 98.15
B93Z 4.19 -35.55 -34.09 95.89 -25.00 -41.28 165.12
B59Z 4.29 -68.78 -78.29 113.83 -63.01 -78.05 123.87
B14Z 4.42 -64.02 -41.22 64.39 -60.94 -45.18 74.14
748Z* 4.05 -64.09* -62.62* 97.71* -57.68* -55.30* 95.87*
* Monkey 748Z received high dose of ketamine and xylazine 4 weeks before exposure. Data was excluded and treated as a special case. The mean value was 100.10 ± 12.06 % (S.E., n= 8). The pre-exposure amplitude was -53.11 ± 6.18 u.V (S.E., n= 8). The post-exposure amplitude was -50.48 ± 6.18 uV (S.E., n= 8).
94

Technical Report Microwave Induced Retinal Effects
Appendix 13 (part 2 of 2) ERG-Cone Response, a-Wave Amplitude (uV)
Photopic (28.8 cd/m2) Adapted, White Flash (2.23 cd-s/m2)
C. 8 W/kg
Animal SAR (W/kg)
Right Eye Left Eye Number
Pre Post Ratio (%) Pre Post Ratio (%)
B61Z 8.39 -37.72 -29.63 78.55 -40.49 -36.53 90.22
B51Z 8.78 -15.37 -44.73 291.02 -37.15 -39.03 105.06
929Z 8.14 -41.39 -38.14 92.15 -43.07 -41.01 95.22
B31Z rejected ~ — ~ ~ ~ ~
B06Z* 8.64 -30.16* -20.08* 66.58* -26.83* -19.67* 73.31*
* Monkey B06Z developed diarrhea and dehydration during exposure. Data was excluded and treated as a special case. Monkey B31Z was rejected during the stage of chair acclimation. Excluding B06Z, the mean ratio was 125.37 ± 33.31 % (S.E., n= 6). Excluding B06Z, the pre-exposure amplitude was -35.87 ± 4.20 u,V (S.E., n= 6). Excluding B06Z, the post-exposure amplitude was -38.18 ± 2.06 u.V (S.E., n= 6).
D. 20 W/kg
Animal SAR (W/kg)
Right Eye Left Eye Number
Pre Post Ratio (%) Pre Post Ratio (%)
B63Z 20.09 -23.34 -45.17 193.53 -24.27 -49.51 204.00
B20Z 20.71 -42.08 -35.13 83.48 -41.35 -44.22 106.94
B43Z 19.58 -36.25 -42.70 117.79 -38.95 -44.47 114.17
B48Z 20.41 -30.23 -33.00 109.16 -31.24 -33.59 107.52
A72Z 20.00 -64.09 -62.62 97.71 -57.68 -55.30 95.87
The mean ratio was 122.99 ± 13.03 % (S.E., n= 10). The pre-exposure amplitude was -38.96 ± 4.21 uV (S.E., n= 10). The post-exposure amplitude was -43.72 ± 3.70 uV (S.E., n= 10).
95

Technical Report Microwave Induced Retinal Effects
Appendix 14 (part 1 of 2) ERG-Cone Response, a-Wave Implicit Time (ms)
Photopic (28.8 cd/nf) Adapted, White Flash (2.23 cd-s/m2)
A. Sham
Animal SAR (W/kg)
Right Eye Left Eye Number
Pre Post Ratio (%) Pre Post Ratio (%)
B89Z 0 14.88 14.17 95.23 14.25 14.17 99.44
B57Z 0 13.50 14.25 105.56 13.67 14.50 106.07
B87Z 0 13.17 13.67 103.80 13.83 13.67 98.84
B71Z 0 13.90 12.63 90.86 14.20 13.00 91.55
892Z 0 14.63 13.80 94.33 14.88 13.90 93.41
The mean ratio was 95.75 ± 1.49 % (S.E., n= 10). The pre-exposure cone a-wave implicit time was 14.04 ± 0.11 ms (S.E., n= 10). The Post-exposure cone a-wave implicit time was 13.43 ± 0.14 ms (S.E., n= 10).
B. 4 W/kg
Animal SAR (W/kg)
Right Eye Left Eye Number
Pre Post Ratio (%) Pre Post Ratio (%)
B45Z 4.23 14.50 12.83 88.48 14.38 13.17 91.59
B93Z 4.19 13.88 13.63 98.20 14.13 13.50 95.54
B59Z 4.29 13.63 13.67 100.29 13.88 14.00 100.86
B14Z 4.42 13.75 13.00 94.55 14.13 13.63 96.46
748Z* 4.05 13.75* 15.25* 110.91* 13.88* 14.88* 107.20*
* Monkey 748Z received high dose of ketamine and xylazine 4 weeks before exposure. Data was excluded and treated as a special case. The mean ratio was 97.91 ± 1.81 % (S.E, n= 8). Excluding 748Z, the pre-exposure cone a-wave implicit time was 14.04 ±0.11 ms (S.E., n=8). Excluding 748Z, the post-exposure cone a-wave implicit time was 13.43 ± 0.14 ms (S.E., n=8).
96

Technical Report Microwave Induced Retinal Effects
Appendix 14 (part 2 of 2) ERG-Cone Response, a-Wave Implicit Time (ms)
Photopic (28.8 cd/m2) Adapted, White Flash (2.23 cd-s/m2)
C. 8 W/kg
Animal SAR (W/kg)
Right Eye Left Eye Number
Pre Post Ratio (%) Pre Post Ratio (%)
B61Z 8.39 12.88 11.83 91.85 13.50 12.00 88.89
B51Z 8.78 15.00 13.13 87.53 14.67 13.75 93.73
929Z 8.14 13.14 12.67 96.42 13.64 13.83 101.39
B31Z rejected -- ~ — ~ ~ —
B06Z* 8.64 14.25* 17.50* 122.81* 14.17* 19.00* 134.09*
* Monkey B06Z developed diarrhea and dehydration during exposure. Data was excluded and treated as a special case. Monkey B31Z was rejected during the stage of chair acclimation. Excluding B06Z, the mean ratio was 93.30 ± 2.08 % (S.E., n= 6). Excluding B06Z, the pre-exposure cone a-wave implicit time was 13.81± 0.35 ms (S.E., n=6). Excluding B06Z, the post-exposure cone a-wave implicit time was 12.81 ± 0.35 ms (S.E., n=6).
D. 20 W/kg
Animal SAR (W/kg)
Right Eye Left Eye Number
Pre Post Ratio (%) Pre Post Ratio (%)
B63Z 20.09 13.50 13.40 99.26 14.17 13.70 96.68
B20Z 20.71 13.70 15.00 109.49 13.70 14.38 104.96
B43Z 19.58 14.30 13.00 90.91 14.90 13.10 87.92
B48Z 20.41 12.10 12.30 101.65 12.00 12.20 101.67
A72Z 20.00 15.20 14.50 95.39 15.30 13.50 88.24
The mean ratio was 97.62 ± 2.27 % (S.E., n= 10). The pre-exposure cone a-wave implicit time was 13.89 ± 0.36 ms (S.E., n= 10). The post-exposure cone a-wave implicit time was 13.51 ± 0.29 ms (S.E., n= 10).
97

Technical Report Microwave Induced Retinal Effects
Appendix 15 (part 1 of 4) Naka-Rushton Function Parameters of the ERG Scotopic b-waves
A. Sham
Animal No. Pre- ■exposure Base ine Post- -exposure Response And Eye
•Kmax logk n Kmax logk N
B89Z, OD 346.19 -2.8515 1.0069 404.08 -2.4727 0.6541
B89Z, OS 358.06 -2.7210 0.9497 416.88 -2.5560 0.5312
B57Z, OD 489.74 -2.5888 0.9697 485.65 -2.7284 0.9967
B57Z, OS 439.19 -2.7074 1.0054 450.53 -2.6980 0.9846
B87Z, OD 346.37 -2.6561 0.8183 286.44 -2.7879 1.2555
B87Z, OS 350.05 -2.7125 0.8336 252.59 -2.7829 1.0713
B71Z, OD 327.00 -2.3399 0.5966 312.21 -2.7500 0.9856
B71Z, OS 3 28'. 15 -2.2221 0.4970 317.53 -2.7658 0.8038
892Z, OD 247.98 -2.6445 0.6042 359.31 -2.6230 1.1793
892Z, OS 178.86 -2.9380 1.1059 383.07 -2.4082 0.7278
MEAN 341.16 -2.6445 366.83 -2.6573
S.E. ±27.39 ±0.0685 ±23.63 ±0.0431
N 10 10 10 10 10 10
* Naka-Rushton Function: R = R^ In / (In + kn). The first limb of b-wave intensity- response curve was used. Consult text and figure 21 for details. NA= not available
98

Technical Report Microwave Induced Retinal Effects
Appendix 15 (part 2 of 4) Naka-Rushton Function Parameters of the ERG Scotopic b-waves
B. 4 W/kg
Animal No. Pre- ■exposure Baseline Post- ■exposure Response and Eye
IMIMX logk n IVnax logk n
B45Z, OD 278.34 -2.7671 1.2197 396.93 -2.8073 0.7323
B45Z, OS 249.48 -2.6156 0.8269 412.48 -2.6471 0.7678
B93Z, OD 274.16 -2.8249 0.9237 267.96 -2.9342 1.0359
B93Z, OS 278.75 -2.7499 0.8474 265.08 -2.9408 0.9671
B59Z, OD 418.16 -2.5570 0.7720 381.16 -2.8152 1.2627
B59Z, OS 426.32 -2.5604 0.8469 325.33 -2.8701 1.3284
B14Z, OD 295.57 -2.6585 0.8546 278.49 -2.7497 0.7513
B14Z, OS 346.42 -2.4530 0.7947 290.73 -2.5847 0.5454
748Z, OD** 232.05 -2.6346 1.3108 257.83 -2.6874 1.7797
748Z, OS** 212.13 -2.7196 0.8245 226.16 -2.6809 1.5567
MEAN 320.90 -2.6483 327.27 -2.7936
S.E. ±24.18 ±0.0445 ±21.60 ±0.0453
N 8 8 8 8 8 8
* Naka-Rushton Function: R = R™ In / (In + kn). The first limb of b-wave intensity- response curve was used. Consult text and figure 21 for details.
** Monkey 748Z received high dose of ketamine and xylazine 4 weeks before exposure. Data was listed and treated as a special case.
99

Technical Report Microwave Induced Retinal Effects
Appendix 15 (part 3 of 4) Naka-Rushton Function Parameters of the ERG Scotopic b-waves
C. 8 W/kg
Animal No. Pre- -exposure Baseline Post- -exposure Response and Eye
Rmax logk n *Mnax logk n
B61Z, OD 363.68 -2.5811 0.7590 237.20 -2.3653 0.9450
B61Z, OS 311.83 -2.4954 0.7776 263.33 -2.4213 0.8682
B51Z, OD 326.95 -2.3872 0.8480 323.57 -2.4189 0.5188
B51Z, OS 305.96 -2.4357 0.8448 316.42 -2.6303 0.5731
929Z, OD 255.58 -2.7353 0.8664 235.57 -2.7458 1.0428
929Z, OS 244.91 -2.8087 0.9081 228.01 -2.7168 0.9811
B06Z, OD 285.68 -2.6102 0.7688 267.35 NA NA
B06Z, OS 264.85 -2.5161 0.8653 228.01 NA NA
MEAN 301.49 -2.5739 267.35 -2.5497
S.E. ±18.21 ±0.0686 ±17.33 ±0.0684
N 6 6 6 6 6 6
* Naka-Rushton Function: R = Rmax In / (In + kn). The first limb of b-wave intensity- response curve was used. Consult text and figure 21 for details. Monkey B06Z was treated as a special case because of colitis. Post-exposure b-waves were absent in B06Z, therefore, no Naka-Rushton function parameters were obtained. The pre-exposure values were shown but not included in statistics. NA= not available, because b waves were extinguished after exposure.
100

• Technical Report Microwave Induced Retinal Effects
Appendi x 15 (part 4 of 4) Naka-Rushton Function Parameters of the ERG Scotopic b-waves
• D. 20 W/kg
Animal No. and Eye
Pre-exposure Baseline Post- exposure Response
• ■Kfliax logk n *Mnax Logk n
B63Z, OD 242.34 -2.5895 2.1409 247.92 -2.3400 0.7240
B63Z, OS 231.88 -2.7910 1.4497 324.94 -2.0486 0.5962
B20Z, OD 217.14 -2.3400 0.8086 301.16 -1.9900 0.4494
• B20Z, OS 222.73 -2.4104 0.7591 242.63 -2.2164 0.5087
B43Z, OD 198.52 -2.4823 0.5701 299.24 -2.5993 0.8215
B43Z, OS 175.78 -2.4727 0.5669 328.38 -2.5267 0.7432
# B48Z, OD 267.64 -2.5790 0.7766 302.70 -2.1359 0.7555
B48Z, OS 269.60 -2.4976 0.7107 249.53 -2.3646 0.8496
A72Z, OD 201.87 -2.8408 1.1059 187.01 -2.6413 0.8676
•
A72Z, OS 191.84 -2.0890 1.0450 166.57 -2.7675 1.3212
MEAN 221.87 -2.5812 265.01 -2.3630
S.E. ±9.95 ±0.0557 ±17.74 ±0.0840
•
N 10 10 10 10 10 10
* Naka-Rushton Function "■ ~ -Kmax In / (f + It :n). The first limb of b-wave intensity- response curve was used. Consult text and figure 21 for details. NA= not available
•
•
• 101

Technical Report Microwave Induced Retinal Effects
Appendix 16 (part 1 of 2) Summary of Histopathologic Changes
Animal # SAR Outer Inner (W/kg) RPE Segments Segments Nuclei Other
B89Z 0 NC Moderate NC NC NC OD Distortion*
B57Z 0 NC Moderate NC NC NC OS Distortion
B87Z 0 NC Mild NC NC Mild Disc Cupping OD Distortion
B71Z 0 NC Mild PAS+ NC NC OD Distortion
892Z 0 NC Mild PAS+ NC NC OD Distortion
B45Z 4.23 NC Moderate NC NC NC OD Distortion*
B93Z 4.19 NC Moderate NC NC NC OS Distortion*
B59Z 4.29 NC Mild NC NC NC OD Distortion
B14Z 4.42 NC Mild NC NC NC OD Distortion
B61Z 8.39 NC NC PAS+ NC NC OD
B51Z 8.78 NC Mild PAS+ NC NC OD Distortion
929Z 8.14 NC Mild PAS+ NC Artifactual Macular OD Distortion Retinal Detachment
102

Technical Report Microwave Induced Retinal Effects
Appendix 16 (part 2 of 2) Summary of Histopathologic Changes
Animal # SAR (W/kg) RPE
Outer Segments
Inner Segments Nuclei Other
B63Z OD
20.09 NC NC PAS+ NC Slight Disc Cupping
B20Z OD
20.71 NC Mild Distortion
NC NC NC
B43Z OD
19.58 NC Mild Distortion
NC NC NC
B48Z OD
20.41 NC Moderate Distortion
NC NC Moderate Disc Cupping
A72Z OD
20.00 NC NC PAS+ NC Slight Disc Cupping
B06Z OD
8.64 NC Moderate Distortion
NC Mild Cone Karyolysis
Possible Serous Macular
Detachment**
748Z OS
4.05 NC Mild Distortion
PAS+ NC NC
NC = No Change
* Probably artifactual because of less than optimum preservation in other retinal elements. ** May be artifactual, see fundus photos and/or SLO for confirmation.
103

Technical Report Microwave Induced Retinal Effects
Appendix 16A. Histopathology (sham)
B89Z, OD, 11/15/96, sham, PAS (-) moderate distortion in outer segments
B57Z, OS, 12/12/96, sham, PAS (-) moderate distortion in outer segments
B87Z, OD, 02/21/97, sham, PAS (-) mild distortion in outer segments
B71Z, OD, 05/02/97, sham, PAS (+) mild distortion in outer segments
892Z, OD, 08/21/97, sham, PAS (+) mild distortion in outer segments
104

Technical Report Microwave Induced Retinal Effects
Appendix 16B. Histopathology (4 W/kg)
B45Z, OD, 11/15/96, 4.23 W/kg, PAS (-) moderate distortion in outer segments
B93Z, OS, 12/12/96, 4.19 W/kg, PAS (-) moderate distortion in outer segments
B59Z, OD, 03/27/97, 4.29 W/kg, PAS (-) mild distortion in outer segments
B14Z, 05/30/97, 4.42 W/kg, PAS (-) mild distortion in outer segments
^^^^^^B ::::::>^A^ft^«^Ai^^H^#»^
* ü Wm *£ * ;
%>
IlkA^W.^ V^*" * VS$MI? ^*
<*. "• m'i ■- -mm*''
VMS ^v «.
748Z, OS, 11/06/97, 4.05 W/kg, PAS (+) mild distortion in outer segments • high ketamine dose
105

Technical Report Microwave Induced Retinal Effects
Appendix 16C. Histopathology (8 W/kg)
B61Z, OD, 02/21/97, 8.93 W/kg, PAS (+) normal outer segments
B51Z, OD, 03/27/97, 8.78 W/kg, PAS (+) mild distortion in outer segments
929Z, OD, 07/24/97, 8.14 W/kg, PAS (+) mild distortion in outer segments
B06Z, OD, 06/26/97, 8.64 W/kg, PAS (-) moderate distortion in outer segments • high ketamine dose • enterothyphlocolitis
106

Technical Report Microwave Induced Retinal Effects
Appendix 16D. Histopathology (20 W/kg)
B63Z, OD, 05/02/97, 20.09 W/kg, PAS (+) normal outer segments
B20Z, OD, 05/30/97, 20.71 W/kg, PAS (-) mild distortion in outer segments
B43Z, OD, 06/26/97, 19.58 W/kg, PAS (-) mild distortion in outer segments
B48Z, OD, 07/24/97, 20.41 W/kg, PAS (-) moderate distortion in outer segments
A72Z, OD, 08/21/97, 20.00 W/kg, PAS (+) normal outer segments
107

Technical Report Microwave Induced Retinal Effects
Appendix 17 PAS Microdensitometry and Post-exposure ERG Photopic White b-Wave Amplitude (u,V)
Monkey SAR (W/kg)
Eye (PAS enhanced)
PAS Optical Density Photopic b Number
Nasal Temporal Amplitude
B89Z sham O.D. (-) 64.68 ± 2.82 69.70 ±6.46 119.92
B57Z sham OS. (-) 71.66 ±6.57 69.77 ±5.04 155.12
B87Z sham O.D. (-) 60.11 ±1.82 64.68 ±2.83 115.20
B71Z sham O.D. (+) 103.50± 5.18 114.77 ±3.67 95.31
892Z sham O.D. (+) 140.26 ±10.05 147.72 ±12.37 142.39
B45Z 4.23 W/kg O.D. (-) 74.37 ±4.53 59.61 ±1.33 146.50
B93Z 4.19 W/kg O.S. (-) 68.63 ±5.55 68.34 ±2.58 82.80
B59Z 4.29 W/kg O.D. (-) 69.16 ±2.90 68.66 ±8.91 178.78
B14Z 4.42 W/kg O.D. (-) 72.79 ±1.34 66.55 ±7.91 107.49
B61Z 8.39 W/kg O.D. (+) 101.72 ±9.57 108.57 ±10.75 125.12
B51Z 8.78 W/kg O.D. (+) 119.17± 14.23 138.72 ±6.66 122.20
929Z 8.14 W/kg O.D. (+) 79.84 ±4.72 108.98 ±9.05 136.79
B63Z 20.09 W/kg O.D. (+) 101.23 ±9.99 113.64±2.16 95.25
B20Z 20.71 W/kg O.D. (-) 67.06 ±4.50 60.05 ± 7.42 103.71
B43Z 19.58 W/kg O.D. (-) 71.74 ±1.06 73.89 ±2.30 150.78
B48Z 20.41 W/kg O.D. (-) 73.76 ±6.34 76.41 ±5.44 129.03
A72Z 20.00 W/kg O.D. (+) 148.60 ± 12.37 145.49 ±8.29 112.68
B06Z* 8.64 W/kg O.D. (-) 69.61 ± 7.03 68.96 ±0.54 7.56
748Z* 4.05 W/kg O.S. (+) 97.47 ± 2.07 102.20 ±10.51 74.24
* Special cases.
108

Technical Report Microwave Induced Retinal Effects
Appendix 18 Normal Ranges for Standard Flash Electroretinogram in Rhesus Monkeys*
Parameter Average Lower Limit Upper Limit
Rod b-wave Amplitude 193.37 uV 85.07 uV 301.67 uV
Rod b-wave Implicit Time 98.65 ms 76.75 ms 120.55 ms
Combined b-wave Amplitude 430.84 uV 244.18 uV 617.50 uV
Combined b-wave Implicit Time 47.13 ms 43.15 ms 51.11ms
Combined a-wave Amplitude -230.42 uV -158.60 uV -302.24 uV
Combined a-wave Implicit Time 15.53 ms 13.81 ms 17.25 ms
Oscillatory Potentials Amplitude 154.12 uV 27.16 uV 281.08 uV
30 Hz Flickers Amplitude 85.50 uV 43.52 uV 127.48 uV
Cone b-wave Amplitude 106.96 uV 52.40 uV 161.52 uV
Cone b-wave Implicit Time 35.43 ms 32.01 ms 38.85 ms
Cone a-wave Amplitude -43.38 uV -15.34 uV -71.42 uV
Come a-wave Implicit Time 13.97 ms 12.43 ms 15.51 ms
* Data were obtained from 17 adult 5-9 year old Rhesus monkeys of both genders adapted to darkness for more than 30 minutes. Values from both eyes were included (n= 34). Upper and lower limits were ± 2 S.D. of the mean. The sequence of testing was Rod response, combined cone and rod response, 30 Hz flickers response and cone response. Rod response was evaluated with a 3.47 x 10"3 cd-s/m2 white flash in a dark-adapted eye. Combined rod and cone response was evaluated with a 2.23 cd-s/m2 white flash in a dark- adapted eye. Oscillatory potentials were the combined amplitude of the first two wavelets of the combined rod and cone response. The 30 Hz flickers amplitude was evaluated with 2.23 cd-s/m2 white flashes flickering at 30 Hz in a dark-adapted eye. The cone response was evaluated with a 2.23 cd-s/m2 white flash with a 28.8 cd/m2 background illumination. Because the complex nature of response-luminance relationship, these values applied only to the evaluation conditions used as indicated.
109

Technical Report Microwave Induced Retinal Effects
Appendix 19 Necropsy Report (B06Z)
INTERUM REPORT
Species: Rhesus (Maccaca mulatta) Animal number: B06Z Accession number: N97-0151 Date of death: 26 June 1997 Date of Preliminary report: 26 June 1997 Date of Final report:
HISTORY: This animal has a history of having diarrhea. This monkey was anesthetized and euthanized as per protocol, and the eyes were harvested by the investigator.
GROSS FINDINGS: General: The carcass of this juvenile male Rhesus monkey (chest tattoo number B06Z) is thin, but adequately muscled with scant discernible subcutaneous or cavitary adipose tissue. The dorsal processes of the entire vertebral column are prominent (possibly muscle atrophy, or secondary to diarrhea and weight loss). Respiratory system: The lungs are diffusely mottled red (congestion). On the diaphragmatic aspect of the right caudal lung lobe, there is a round dome shaped emphysematous nodule that is 6 mm diameter and extends above the pleural surface approximately 3-4 mm (possibly due to lung mites). Between the caudal margin of the left inferior lung lobe and the pleural surface of the thorax, there is a single fine fibrous adhesion. On the center of the anterior surface of the left apical lung lobe, there is an irregularly shaped hard white mass that is 2 mm at greatest dimension (probably mineralization). Cardiovascular system: No gross lesions detected (NGLD). Spleen: (NGLD) Liver/gallbladder: (NGLD) Endocrine glands: The head of the pancreas is covered by a thin shiny gelatinous film, and there is a segmental loss of lobular definition (interstitial edema). Gastrointestinal tract: The cecum and colon are diffusely and uniformly distended by gas and fluid greenish-gray intestinal contents, and the serosal blood vessels are distended and more prominent than normal (congestion). All of the mesenteric lymph nodes are mildly enlarged. Urinary system: (NGLD) Testes, ovaries, uterus, accessory sex glands: (NGLD) Ears and eyes: The eyes have been harvested by the investigator. No gross lesions are detected in the ears. Brain: (NGLD) Spinal cord: (NGLD) Bone marrow, bones, and joints: (NGLD) Musculature: (NGLD)
GROSS DIAGNOSES: Cecum; colon: Typhylocolitis, with diarrhea with gaseous distention Lungs: Congestion Pancreas: Edema Carcass: Thin
110

Technical Report Microwave Induced Retinal Effects
LABORATORY FINDINGS: Swabs were taken of the jejunum, cecum and colon and submitted to the laboratory for culture. No Salmonella, Shigella, Campylobacter, Vibrio, or Yersinia were isolated from any of the submitted samples.
MICROSCOPIC FINDINGS: Slide 1: Lung: In the sections of lungs examined histologically there is a mild infiltration of plasma cells neutrophils and occasional lymphocytes in the bronchiolar epithelial lining. There is a similar inflammatory infiltrate around the terminal airways and there is a focal area where there is marked type II pneumocyte hyperplasia. The alveoli contain large numbers of distended pulmonary alveolar macrophages (PAM). In this area there is also marked congestion and multifocal hemorrhage. The BALT adjacent to the bronchial multifocally exhibits lymphoid depletion.
Slide 2: Trachea: Tracheitis, subacute, diffuse, minimal Thyroid Gland: Follicular cysts, focal Adipose Tissue: Atrophy, diffuse, moderate Parathyroid gland; esophagus; tongue: Within normal limits (WNL)
Slide 3: Heart: Diffusely affecting the papillary muscles in the endocardial surface of the left ventricle. Myocardiocytes are diffusely shrunken and separated by increased or expanded interstitium. The interstitium is expanded by clear space interpreted to be edema. Within in the remainder of the myocardium there are numerous large finely stippled nuclei. The myocardiocytes are diffusely shrunken and exhibits one or more of the following changes: cytoplasmic, hyalinization, vacuolization
Slide 4: Spleen: The red pulp is diffusely congested with small to moderate populations of neutrophils and tingible body macrophages. Multifocally the white pulp exhibits lymphoid depletion (hialosis). Mesenteric, splenic: Serosa atrophy of fat, diffuse, severe Lymph node, axillary, sinuses: Reticuloendothelial hyperplasia , diffused, marked with mild histiocytosis. Lymph node, axillary, cortex: Lymphoid depletion, multifocal, mild Adipose tissue, axillary: Atrophy, diffuse, moderate
Slide 5: Liver: Congestion, diffuse, moderate Gall Bladder: WNL
Slide 6: Kidney, right: Glomeruli, Bowman's space, eosinophilic (proteinaceous) material diffuse, mild to moderate. Collecting ducts syncytial cell formation, multifocal, moderate with intraepithelial vacuolization. Kidney, right: Proximal confluent tubules: Degeneration and vacuolization, diffuse, moderate Kidney, right: Nephritis, interstitial, subacute, multifocal, minimal Kidney, right, distal tubules: Degeneration necrosis with condensation, multifocal, moderate Adrenal Gland, right: Congestion, multifocal, mild Adipose tissue, Perirenal: Atrophy, diffuse, moderate
111

Technical Report Microwave Induced Retinal Effects
Ureter, right: Increased numbers of binucleated cell, multifocal, moderate
Slide 7: Kidney, left: Changes similar to those seen in the right kidney but also with lobulation of the glomerular tufts and multifocal mineralization within the medulla. Adrenal gland, left: WNL Adipose tissue, perirenal: Atrophy, diffuse, moderate Ureter, epithelium: Increased numbers of binucleated cells, multifocal, moderate Slide 8: Diaphragm; duodenum; pancreas: WNL Stomach, cardia colon: Edema, diffuse, moderate with multifocal lymphoplasmacytic gastritis
Slide 9: Jejunum: Diffusely effecting the mucosal surface villi are separated by clear space interpreted to be edema and increased numbers of lymphocytes and plasma cells and multifocal within the submucosal lamina propria there are low numbers of lymphocytes and plasma cells. Jejunum: Enteritis, lymphoplasmacytic, diffuse , moderate with submucosal hemorrhage Colon: Colitis, subacute, lymphoplasmacytic and histiocytic, diffuse, moderate Urinary Bladder: Essential normal but with increased binuculate and trinuculate transitional epithelial cells. Stomach, fundus: Gastritis, subacute, multifocal, minimal
Slide 10: Lymph node, mesenteric: Sinus histiocytosis, diffuse moderate with mild eyrthrophagocytosis Lymph node, mesenteric, cortex: Lymphoid depletion, multifocal, moderate (possibly amyloid) Stomach, pylorus: Gastritis, lymphoplasmacytic, diffuse, mild Ileum: Enteritis, plasmacytic, diffuse, moderate with numerous Mott cells and multifocal accumulation of homogenous hyalinized eosinophilic material
Slide 11: Cecum: Typhlitis, plasmacytic and histiocytic, subacute, diffuse, mild with multifocal crypt ectasia, crypt abscesses, and interstitial edema. Prostate; seminal vesicles: WNL
Slide 12: Rectum: Proctatitis, plasmacytic and histiocytic, subacute, diffuse, mild Testis, right; Epididymis, right: WNL
Slide 13: Testis, left; Epididymis, left: WNL Spinal Cord, cervical: WNL
Slide 14: Spinal Cord, thorax: WNL
Slide 15: Spinal Cord, lumbar: WNL
Slide 16: Spinal Cord, sacrum: WNL
Slide 17: Cerebrum, occipital lobe: Gliosis, subacute, diffuse, moderate. Pituitary gland: WNL.
112

Technical Report Microwave Induced Retinal Effects
Slide 18: Cerebrum, parietal lobe; cerebellum: Gliosis, subacute, diffuse, moderate.
Slide 19: Cerebrum; pons: Gliosis, subacute, diffuse, moderate.
Slide 20: Cerebrum, at the level of the mammillary bodies: Gliosis, subacute, diffuse, moderate.
Slide 21: Cerebrum, at the level of the optic chiasma: Gliosis, subacute, diffuse, moderate.
Slide 22: Cerebrum, olfactory lobe: Gliosis, subacute, diffuse, moderate.
Slide 23: Sternum: In decal
SIGNIFICANT FINDINGS: Intestine: Enterothyphlocolitis, lymphoplasmacytic, diffuse, moderate. Heart, endocardium and papillary muscles: Necrosis, acute, moderate. Cerebrum; cerebellum: Gliosis, diffuse, moderate. Spleen; lymph nodes; BALT; GALT: Lymphoid depletion, multifocal, mild to moderate. Lung: Type II pneumocyte hyperplasia, focal, mild, with lipid pneumonia. Adipose tissue: Atrophy
COMMENT: Other than the typhylocolitis, there are no significant gross lesions detected in the carcass of this Rhesus monkey. (I am attributing the diffuse yellow discoloration to protocol procedures.) This is a preliminary report. As soon as the microscopic examination of the harvested tissues has been completed, a final report will be submitted.
113

w 1—<
03 Ö
*} t>0-—> M O C/3
XI .SO CD o ao 3 2 9. 13
£ "O W PS1
£
o a
C
"c/S 0)
ä o
e e
CO
©
a
I
o a,
"3 ü
'3 o <u H
£>0 O
a, e
3 k
<u
g •a « 1 o fi o
(3 t-l O o o
J3 3 „C5 9
UH d z
OH CL,
o §
--< (N
5 00
a, u u
5 p.
s o Ü
'S
o
a u u s o s
o o
o
& £ MS
60
•s o c
-> -> as
VO O
->->-> 00
Z S ON
<N r-H
C- r—t
-> I
-f as
ON
->
-> <n t-H
o „ ■ ->
1 < <: o r—< Ä z"
z~
00 r--
z* 00 z
Tj
< Z
o P Ö
(J «
b 5
.2 ä
1 •a a 8 u
<L> a.
03
•S .s
T3 (U
W
Si O e
'I 4>
T3 (L> w 03 2i O <u
T3
J03 <L>
<J g
00 P OO
s o 13 ■*-»
O e
13 u in W
u T3
<-> .:
&:
T3 u US
o <u
•8
0)
•a T3 (L>
o o a, a
S £ SO VO VO VO X VO
t-H
l/f i/T «3 «r 11 i in >T) V~l IT) "^ o IT)
o o o o O -H o
_, P w P as ro VO t-H l—I
W w
z -> * s r- ON Wl <l) 00 CN 00
-» -> z m o tN o t~~ >n 00
ON
00
as oo 00
VO
r4
W
3 o
u u
x>
o 3 ns
£ £
I
m o Z
I I I I z z z z
£ £
z
z
I
O T—I ** <n I—t Tl o fS o o © fS
(i. T* W w ■T1 1 ■
1—4 1
»-H 1
rj l-H <N l-H (N rvi <N <s rj '-H <N <N <N 00 00 00 00 00
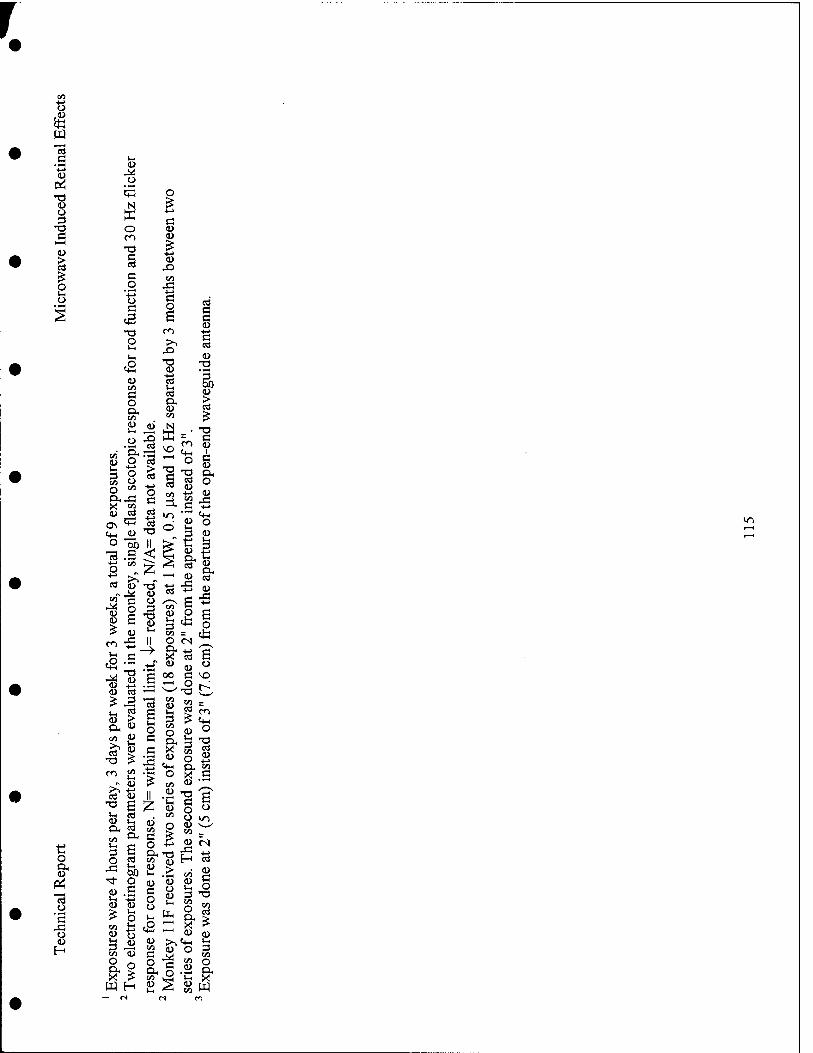
r
'S ö • S CD
« ^ Ä
o
T3 s o <L> O 3 i3
"O o (D e CO <U i—i I <D T3
Ö cd
£ Ö CO O l-H o
O J3
cd
% c O
s S3 S3 CD
T3 en cd O
l-H >>
l-l CD ,o T3 T) «M CD 1 c a CD o CO
OH CD CO
£ £
to CD
U l-c
Ü
o
ui
*3
nste
adof
3".
th
e op
en-e
nd
xpos
un
sh s
cot
$3
T3 S3 cd CO
ZL
ON
Cd CO
cd td ö Q O
«4-c u *o 3 <U o *öb IL j>~ £ S
*c3 .5 < & CD +J
o H->
°CO £ S 2 S. Q cd Cd
co~
<D
'S O £
-a CD o
<D 1-4
Id /—*\
CO CD l-H 3 CO
at 2
" fr
om th
m
) fr
om th
e
en l-l
«4-1
J3
.s II
-> O
+-T <D <D ° CD £ oo S3 ^O
■SO £ J3 "e3 CO
CD CO -
5 en > «41
l-H <D
CO £ l-i 3
D. CD O CO
O OH X <D
«4-H
(D O CO CD
e
posu
r st
ead
en CO l-l (L> "£ o
CO g.s
cd « II .2 o u T3 s £ CD
Ui <D OH
cd CD «3
CO
O 8e C/5
o 3 O
a, S P3
s > o +■» OH T3 co n> £ 'S
a, <D J3 <D ,>
expo
sure
s,
e w
as d
one
"as o c o
■*■
<D V-i
CO
O C
tl Ui O I-.
+-> o
CD e o o
«2
'<3 o a» I-*
<D 3 CO
<D CD >>«4-l tl H "53 W3 (D
o
O 3 CO
O a, X i o
a, CO
Ü OH 'ir! X
W H s S w
lO

to
3 /~\ t v ^^ -> v 2
1 1 -> CN
-> 00~
NO"
oo" ^> o" tN cd VO NO w tN f^
i
J ü
Si*
§ 3-
o^- ON co
0s- ON
0s
O ox
CO
0s- ox
CO
1 43 w 2 in
8 s CU —1 -^ -^ ^> „ £
o t-H W
ith D
%
bas
el
m"
0s
ON
0s
co
NO i—i
0s-
en
o~- ON
oo"
o~- 00
o" tN
0s-
o co tN r- CO NO
2 ö o
W on z e
ampl
itude
gi
c Fi
ndin
hmen
t (7
48Z
)*
.V,
chan
ges)
2 oo" CO
0s-
ON" CN
6s-
oo" in tN
■
0s- ON 0s-
•*"
0s-
£ in" in
0s
CD O c CD
T3
^ o o O t-H cn 00 in O
Ü o ON ON *—( in VO ON O
f* 'S CD
o o O 3. cO ^
Q .0 -^
in" g £ £ O
C
r-H
S3
Wit
hout
: %
bas
el
vo" co
vo" CO
00 (N oo" co" co" CO
J3
S o CO +->
<u g 0s 0s-
1
0s- oo 6s- 0s-
i
0s- CO O co m r~- r—1 00
4TS r- 00 '-' ^r >o ON II ->
CO
K.S E '•3 ^3 c (L) a, 89
S3 *0 co
tN 00 tN O r- tN
, CD O C3
£ O CO o CO
1 CN sO ■ CD
iG # i i i « § s U j
m 00
tN
<u
3
ON
»—1 1
CD *o 3
TT ■t in
in
i
C o CD
c +->
II
00
t (U "E, E
"a. CD
3 4-J
CD
3
CD
3 d
o 3 CO cO ■4-> ."5 Q
o • t—<
to
"E, E CO
cO
CD > 03
i CO
"H. S ccj
CD
"E, B CO
CD >
"E. S CO
CD >
Ö CD
CO
e
o CD
H
o CU
C
Eo T3 CD C
IS E
CD
IS s
o
3
CO
i X>
CD C
CO
i CO
CD C
o CO
CO
o o o o o o CO l-l o o CO o o
*
1

REPORT DOCUMENTATION PAGE Form A/proved OMB No. 07040188
Mfc rafortlig Ivrdin for Ok vlhctkii il WimKkn ta inbnfM a linnet 1 Nw pi rasjoit«, AttMi IM lim fie lurim» taniclii«!. »iithin «titiu «Ml miim llirnrin iitf «liMiMn flu cdti mtM am «Mkimn aA wnw» to «Metigii .1 iikn»t»i M rniatiu wiim *> tart. •«..1. «nt »B»r npict .1 Ikii afccl»! if AukA mcMiq >3EE*fa^dA'ShtS ££ SSS.t Iriimta. Q,>.mt.r..ml fepHU «15 Mftnon Oirislfclnny. Suite T2M. Mi«tML M 2ZMMOT2. »*) n Ite Offic. if M.m«..it>i>l M»t bjlnwgit *ta«t.nPÄaT7olmMlTXIi,torM M501
i.AOENcVüSEdsiVfl»™^ XHEfidftT DATE 28/02/2000
». TITLE AND SUBTITLE
RETINAL EFFECTS OF HIGH PEAK POWER MICROWAVES IN RHESUS MONKEYS
Final
(Continue)
B. ÄUTHOR(S)
Shin-Tsu Lu; Ph.D.; McKesson BioServices Satnam P. Macnur; Ph.D.; McKesson BioServices John A. D'Andrea; Ph.D.; Naval Health Research Center Detachment 7. PERFORMING ORGANIZATION NAME(S) AND AOQRESSIESI
U.S. Anny Medical Research Detachment, Walter Reed Army Institute of Research Brooks AFB, Texas Naval Health Research Center Detachment, Brooks AFB, Texas U.S. Air Force Research Laboratory, Brooks AFB, Texas
9. SPONSORING/MONITORING AGENCY NAMEIS) ÄNÖÄbDRESSKsi" Air Force Research Laboratory (AFSC) Human Effectiveness Directorate 8315 Hawks Road Brooks Air Force Base, Texas 78235-5324
ImmhfiM*™* a. Approved for public release: distribution unlimited
U. S. Army Medical Research and Materiel Command 504 Scott Street
Ft. Detrick, MD 21072-5012 Bruce Stuck /210YS36-4671
5. FUNDING MIMERS'
Contract Numbers: AF#41624-96-C-9009 ARMY # DAMDI7-94-C-4069
Program Element Number: Navy 6,3/ Army 622782 AF 62202F (Continue)
8. PERFORMING ORGANIZATION ~~ REPORT NUMBEH USAMRD WRAIR 9907 006 TX
NHRC DET 99-01 AFRL-HE-BR-TR-I999-0231
1O.SPONS0fllNGfMOIlliTGRUUG AGENCY REPORT NUMBER
NHRC DET, AFRL/HEDR, USAMCMR
12». DISTRIBUTION AVAILABILITY STATEMENT ~ " Will be published in Bioelectromagnetics in 2000
Jzb.DlsfftlBUTlbNcbOE
13. ABSTRACT ff/axmrn 200 wonts) """" _____ , _
This report summarized current progress in Tri-Service research efforts on the retinal effects of 1.25 GHz high peak power microwaves in Rhesus monkeys. Pre-exposure fundus photographs, retinal angiograms, and electroretinograms (ERG) were obtained to screen for normal ocular structure and function and, after exposure, as endpoints of the study. Histopathology of the retina was used as an additional endpoint. Seventeen monkeys were randomly assigned to receive sham exposure or pulsed microwave exposures. Microwaves were delivered anteriorly to the face at 0, 4.4, 8.1 or 20.2 W/kg spatially and temporally averaged retinal specific absorption rates (R-SAR). The pulse characteristics were 1.04 MW <~ 1.30 MW/kg temporal peak R-SAR), 5.59 us pulse length at 0, 0.59, 1.18 and 2.79 Hz pulse repetition rates. Exposure was 4 hr per day and 3 days per week for 3 weeks, for a total of 9 exposures. The pre-exposure and post-exposure fundus pictures and angiograms were all within normal limits. The response of cone photoreceptors to light flash was enhanced in monkeys exposed at 8 or 20 W/kg R-SAR but not in monkeys exposed at 4 W/kg R-SAR. Scotopic (rod) response, maximum (combined cone and rod) response and Naka-Rushton Rmax and log k of scotopic b-waves were all within normal. Retinal histopathology revealed the presence of an enhanced glycogen storage in photoreceptors distributed evenly among sham (2/5), 8 W/kg (3/3) and 20 W/kg (2/5) exposed monkeys, while enhanced glycogen storage was not observed in the 4 W/kg (0/4) exposed group. Supranormal cone photoreceptor b-wave was R-SAR dependent, and may be an early indicator of mild inury. However, no evidence of degenerative changes and ERG depression was seen. (see continuation on back) IDJ ^UHJrl.l I rNRnS H. SUBJECT TEAMS
Microwaves, Rhesus Monkey, High Peak Power, Electroretinogram, Retinal Angiogram, Fundus Photograph, Retinal Histopathology.
17. SECURITY CLASSIFICATION OF REPORT
Unclassified
«'.'SKÜRltfcLASSIFIcAYlON OF THIS PAGE
Unclassified
T6.SECURITY CiASSjf ICATIÖN OF ABSTRACT
Unclassified
i'a NUMBER^ PAISES"'
122 Is. PRICE CODE
20. LIMITATION OF ABSTRACT
UL

1
Continue from front page:
5. Project # Navy 706 Array 878 AF 7757B330
Work Unit # NMRDC #63706. M00096, DN241243 AF 775B330
6. Author(s)
John M. Ziriax; Ph.D.; Naval Health Research Center Detachment James H. Merritt; U.S. Air Force Research Laboratory Gerard Lutty; Ph.D.; Johns Hopkins University D. Scott McLeod; Johns Hopkins University Mary Johnson; Ph.D.; University of Maryland
9. Performing Organization Name(s) and Address(es)
Naval Medical Research and Development Command National Naval Medical Center Bldg. 1, Tower 12 8901 Wisconsin Avenue Bethesda, MD 20889-5044
14. Abstract
We concluded that retinal injury is very unlikely at 4 W/kg. Functional changes that occur at higher R-SAR are probably reversible since we saw no evidence of histopathologic correlation with ERG changes.

p&m^&mmm-tms UNITED STATES AIR FORCE RESEARCH LABORATORY
A MMHmfim&M„ MODEL OF A ÄAHERTE TRANSVERSE
ELECTROMAGNETIC CELL, I
AIR FORCE RESEARCH iAeORATBR? mmm EFFECTIVENESS öiRicTORA? E
MREGTf P EtSERSY BfOEFPICTTS DIVISION 25Ö3 Giifingham Driv®, Bulking 1fS
Brooks AF8, Texas 7823S-51Ö2
Sateaaft l^»ihi«r
&3Ö8 Hawks Road, BSdg
H^jr ttSi

NOTICES
Tttis report IspwblMed in the Mireis* of «^enäflcmä technical irtfortflation excftange and does «ot «»ßslityits a^pFövai ör djsapprevaiof its ideas or findings.
Using Government drawings, specifications, or other data included in this document for any purpose other than Government-related procurement does not M any way obligate the US Covernmenfc The fact that the Government formulated or suppled the drawings, specifications, or other data, does not license the holder or say other person or corporation, or convey any rights or permission to manufacture, use, or seii any patented invention that may reiate to them.
The Office of **«&!«: Affairs has reviewed this report, and it is releasaeie to the National Technical Information Service, where it will foe avaftable to the general public, including foreign nationals.
<5i~>*
reviewed and is approved for publication.
Prefect ^ent*s*
RICHARD L MILLER, Ph.D. Chief, Directed Energy Sleeffeets DWflon
OESTiRtlCTIOM NöTIßi - Destroy by any method that wiJt prevent disclosure of contents or reconstmctien ofthe document.

REPORT DOCUMENTATION PAGE Form Approved OMB No. 0704-0188
Public repotting burden for this coHacrJon of information I« estimated to overage 1 hour par ruponM. including tha time for »viewing Instructions. searching altering data sources, gathering end maintaining tha data needed, and completing end completing and reviewing tha colection of information. Send comments regarding this burden eatimete or any other espect of this eolection at information, including suggestions for reducing this burden, to Washington Headquarters Services. Directorate for Information Operation» end Reports. 1215 Jefferson Devis Highwey. Suite 1204. Arlington. VA 22202-4302, end to the Office of Manogement and Budget. Paperwork Reduction Project (0704-01881. Washington. DC 20503. ;
1. AGENCY USE ONLY (Leave blank) 2. REPORT DATE May 1999
3. Interim Report- February 1998 -January 1999
4. TITLE AND SUBTITLE A Mathematical Model of a Gigahertz Transverse Electromagnetic Cell, I
AUTHOR(S)
Sherwood Samn Satnam Mathur
5. FUNDING NUMBERS
PE - 62202F PR - 7757 TA - B4 WU - 02
7. PERFORNIINS ORGANIZATION NAME(S) AND ADDRESS(ES)
USA-MCMR McKesson HBOC Bio-Services 8308 Hawks Road, Bldg 1168 Brooks AFB TX 78235-5460
8. PERFORMING ORGANIZATION REPORT NUMBER
9. SPONSORING/MONITORING AGENCY NAME(S) AND ADDRESS(ES) Air Force Research Laboratory Human Effectiveness Directorate Directed Energy Bioeffects Division 2509 Gillingham Drive Bldg 175 Brooks Air Force Base TX 78235-5118
10. SPONSORING/MONITORING AGENCY REPORT NUMBER AFRL-HE-BR-TR 1999-0219
11. SUPPLEMENTARY NOTES Air Force Research Laboratory Technical Monitor: Dr. Sherwood Samn, 210-536-5708
12a. DISTRIBUTION/AVAILABILITY STATEMENT
Approved for public release; distribution unlimited
12b. DISTRIBUTION CODE
13. ABSTRACT (Maximum 200 words)
A mathematical model for transverse electromagnetic (TEM) cell has been constructed. The model estimates the electric field inside rectangular or flared TEM cells driven by a wideband electromagnetic current pulse. The finite difference time domain (FDTD) approach is used.
14. SUBJECT TERMS Transverse electromagnetic cell, wideband electromagnetic pulse, finite difference time domain, mathematical model
15. NUMBER OF PAGES 24
16. PRICE CODE
17. SECURITY CLASSIFICATION OF REPORT
UNCLASSIFIED
18. SECURITY CLASSIFICATION OF THIS PAGE
UNCLASSIFIED
19. SECURITY CLASSIFICATION OF ABSTRACT
UNCLASSIFIED
20. LIMITATION OF ABSTRACT
UL
N3N 7540-01 -280-5500 Standard Form 298 (Rev.2-89) Prescribed by ANSI Std. Z39-18 298-102

(Include Report Document Page Here)

Contents
INTRODUCTION 1
THE GTEM CELL 4
A MATHEMATICAL MODEL 4
COMPUTATIONAL RESULTS 7
CONCLUSION 15
BIBLIOGRAPHY 16

List of Figures
1 An UltraWide-Band (UWB) Exposure Facility and Data Acquisition System. 2 2 Dimensions of the GTEM Cell 3 3 Excitation Plane Q. (Not to scale) 4 4 NBC Cell 7 5 Potential (V) in Excitation Plane 8 6 Calculated and Measured Relative E Field for 100 MHz Sinusoidal Input. . . 8 7 Calculated and Measured Relative E Field for 500 MHz Sinusoidal Input. . . 9 8 Calculated and Measured Relative E Field for 1 GHz Sinusoidal Input. ... 9 9 Calculated E Field in Excitation Plane for V=42.75 kV 10 10 Selected Cross Sections of the GTEM cell 11 11 Simulated Input Voltage Source 13 12 Calculated Ey at 4 points in CS BB vs Measured Ey 13 13 Contour Plot of Measured Peak E 14 14 Contour Plot of Calculated Peak E 14
in
A Mathematical Model of a Gigahertz Transverse Electromagnetic Cell, I.
INTRODUCTION The Gigahertz Transverse Electromagnetic Cell (GTEM) has become a popular tool in the electromagnetic compatibility community for testing radiated emission and immunity (sus- ceptibility) work [5, 6, 13, 19]. Recently it has found use in the electromagnetic dosimetry community [8]. Whatever the application, it is important to know exactly what the field characteristics are inside the cell, both before and after a test object is placed in it. The field characteristics in an empty cell can be obtained by direct measurement. However, once an object is placed in the cell, the field is disturbed and it is no longer easy to know or even mea- sure the field experienced by the object [14, 15, IG]. Mathematical modeling hence becomes indispensable. Using measurements from an empty cell, one can validate a mathematical model of the cell. Knowing the electrical properties of the object being tested, one can then estimate the field experienced by the test object using the model. Moreover, the scattered field from the object, if measured, can also be used to further validate the mathematical model.
Mathematical analysis of various aspects of GTEM cells can either be theoretical [11, 17, 18, 21, 22, 23, 28, 29, 31, 32] or computational (modeling) [9, 12, 16, 25]. Here we describe our initial efforts to model a 1.92m-long GTEM cell (Sandia National Laboratories, Albuqueque, New Mexico) using a finite difference time domain method. The GTEM cell modeled is part of an ultrawide-band (UWB) exposure system currently in use at U.S. Army-Medical Research and Material Command (USA-MCMR) to study the bioeffects of RF radiation in experimental animals. A precise knowledge of the electric field inside the test subject is required to calculate the energy absorption rate in the animal.

•c t? 00 en r^ Q) tr> 10
Q: 1 s. o 5: o o
TO *~ F »— P u: ro m
CD
CL
O Q
E 4)
>> U1
a o
3 cr u < C CO
o a x
D -o c <d
03 ■ v
«3
a <
3 WD

CD C re
ro ü
'€ 0) >
c o o a
(0 c CO o (A
«M C/> (0 c (/) O
E 0) Ü t- .Q _ 0) u. ^™
J- O 0) (A O
cr n o
o
< cr a> u.
ill H O
_l ■ ■
sz C\|
.-■"""'
I
01 CD u.
ä\ c
Q. OT N-n CM re
878.7

THE GTEM CELL
A detail description of the GTEM cell and related electronics and issues can be found in the references [1, 24]. A schematic of the UWB exposure facility and acquisition system is shown in Figure 1 and the dimensions of the GTEM Cell (in a vertical cross section) are shown in Figure 2.
A MATHEMATICAL MODEL To calculate the electromagnetic field inside the GTEM cell, we use a finite difference time domain (FDTD) code modified from Kunz and Luebbers [20]. This is basically the Yee's algorithm [30] enhanced with more recent treatment of absorbing boundary conditions [3, 4].
A. Source
Instead of modeling the complete GTEM cell starting from the source (a spark-gap pulse generator) outside the main chamber, we assumed that the field inside the cell is driven by an equivalent source that is spread over an excitation plane (more precisely, a square annulus) located near the entrance to the cell. In particular, if the base plane (cross section AA' in Figure 2) of the cell is located at z = 0, then the excitation plane is assumed to be located at z = z, where z, has a magnitude equivalent to the thickness of a few Yee's cells. The excitation plane, a region Ü in the cross section of the GTEM cell at z = z„ is depicted in Figure 3.
Figure 3: Excitation Plane fi. (Not to scale)

Assume, at a given time t, the inner rectangle, which corresponds to the septum of the GTEM cell, has a uniform voltage V^p^t) and the outer rectangle, which corresponds to the
ex conductive walls of the cell, is grounded, then the electric field E {x,y,z,,t) in fi induced by V^pt(<) can be calculated by
ex E {x,y,zt,t) = -V<f,{x,y,t)
where the potential <j> is the unique solution of the 2-dimensional Laplace's Equation
v24> = o in n (1)
subject to the boundary condition
Six t)= I ^P*^ for ^'^ € inner rectangle
\ 0 for (a;, y) G outer rectangle
It can easily be verified that if
where K, is a constant and $(<) is an arbitrary function of t and if (f>m(x,y) is the unique solution to Equation (1) subject to the boundary condition
then
where
A { \ _ / K» for (x,y) G inner rectangle <Pm\x>y) ~ j 0 for (zyj e outer rectangle
*(*.»,') = *»(*.v)-*(0 ex
E (x,y,z„t) = -V<ß{x,y,t)
= -*(*)V^m(«,y)
ex Em (*,V):=-V0m(*,y)
This implies that we only have to solve Equation (1) once for (f>m(x, y) to determine the exci- ,ex
tation field E (x,y,zm,t) for all time t. Some additional discussion on the implementation of excitation sources in FDTD can be found in [2, 7].

B. Boundary Conditions
The GTEM cell is terminated by an anechoic wall consisting of a series of resistive low frequency terminators and pyramidal microwave absorbers for the high frequency end of the frequency spectrum. These are constructed to minimize reflections at the terminal end that could compromise the field at a test site within the cell. We model this by placing a Berenger's perfectly matched layer (PML) [3, 4] at this terminal end to simulate non- reflection of electromagnetic waves. We aleo place a PML at the base plane (cross section A A' in Figure 2) to absorb fictitious backward waves generated by the assumed excitation plane. The four other walls of the GTEM cell are modeled faithfully as perfectly electrically conducting (PEC) boundary.
C. Staircase Errors
The GTEM cell is flared. The side walls cannot all be aligned with the rectangular grid axes in FDTD. It is well known that this leads to so-called staircase errors in the computations. For the work reported here, we took the simple, albeit inefficient, approach of using smaller mesh sizes to minimize these errors. More sophisticated methods such as locally conforming FDTD schemes [26] will be used in the future.

RESULTS
We have tested our computational method on several different TEM cells using a variety of input sources. The results have been excellent on simple cases and reasonable on more complex ones. We will report on two cases below.
I. A Non-flared Square cell
In this computational experiment, we use the square TEM cell (the " NBS cell ") studied first experimentally by Crawford [10] and latter theoretically (quasi-statically) by Spiegel [27]. This square cell has dimensions shown in Figure 4.
Figure 4: NBC Cell.
Unlike Spiegel's theoretical cell, the. cell we studied has a finite non-zero thickness that is one FDTD cell thick. The FDTD cell we used is 5 mm thick. The input for this compu- tational experiment is sinusoidal. Three frequencies were chosen: 100 MHz, 500 MHz, and 1 GHz. The cutoff frequency for the first order TE mode (TEio) for this cell is slightly above 500 MHz [10].
We picked a the TEM cell that is 100 cm long (in the z-direction) and monitored the electric field at approximately the same locations where measurements were made by Craw- ford [10] and also by Spiegel, et al [27]. The cross section in which these points are taken is halfway (z = 50 cm) along the TEM cell. The results are shown in Figures 4 through 7. Figure 5 shows the potential field in the cross section at z = 2.5 cm. Figures 6 through 8 are the relative time-averaged magnitude of the electric field when using the frequencies 100 MHz, 500 MHz, and 1 GHz respectively. Also shown are the measured values. There is general agreement between the measured and the calculated. As expected, the first two calculated fields are practically identical, as they are both below cutoff.

figscs© & Fö!«ffi£M {¥) m ExmiMmn Pis&e.
14
<£?«:
■ v s 1~
f*Ü^«*^.5-.W#ÜÜ'
* * Vif: <S * *t » .£ }4
s üsss ^.*s?:^sB|.ii:-äJifis^S!
IspMt? 0aieai^ed Md MsästieesS Islatbe 1 MM ibr 1iO MH® ÄtsssÄiliipA

I
«!, E**
i-M fttfaiMf.v-
**"''""*™u"'™'w" if » SS s ?*
lip*s 7; fMmh&mL sad Jfeseaed S^fe«%^B:^^■;^^CKl|.■MBM.SI*ie^d^|a^El^
«.**■"•■■■•■■■■»*•■•>
■8 *
5» * fsj.TSWt |» * **?.»«
ja a
■»■tc
■■K- K ■» « :.», « tt»*W*S»S»* «1*6 f!«S}»-<fe*S&a>f
Mjpr© S: «ß^culateÄ aad Mes&fm&l Eekfek« B Meld for I QMs: SfonsöMsl Ia|ml.

XL A flared cell driven by a wide-baiid pulse
Th* <ITEM cell sliöwö in Figure 1 feas dimtimmxi.$ nkoy^n hn Figure 2 a$ä.F%a# J$. fie UWB pulse, applied k> the GTBM cell ca» be approximated by
# a» IJS&'TIE 4-10: s"'!
Tkh pnlm fcas a sis© fcfo&eof ISO ps stad a. pike .m4:fcfe öl I *ts> TM& h 4$pi$i®A m Pigtif« 1L
gAfckm #^1«, $') similar m sl.a$«a te> tfe&i stosrat m lig&fe ■§;. 'Ife cosr«s|3?3»iiog .^oiis* ieM
> i
H \
* \ \ i i : it \ i i i / "•- \ \ > < i i i i i 1 I /—
> / I > < : i i > ' 1 >. \ •>•. v.
* r /■ *' * ? < \
«• «s
Mp*>e t: CMetiMM E FkM k Exsifeaiaos BI«MS &» ¥™42,?S fe¥.
10

* ■O'
©
*** a m m
<
&
~;«2t! -^
^WAWW.;W»>?
'• •',.'• ^■■■■i«-/v----<—•, c'rjß. "~~~^—^~ • i
S? Pi
«ft'.
fa»
4
CM «5
CM
*3*
-WQOk
V
..V
■>
Ä
>SS-*:S?'il£ .A.
„<?:, 0^
t^&vX:':* *tf
■ fc^^y.^j
«> :o o .■^f*1
o CM };x:v::Jx v; 4fK<
i iis
.™.„...,...,,,..,:^ :
V
'^
,;*:
m if its j » {■:■:•: :v"-:-:v:v:-:->
03 p:iifii C teiiit o |?:?&S::M:<
hy »»K-x-X'r
c jllffggwl o |**S*S::J:;|
*■*** *"< {:•:•:••: ■:■?.:••■<•:<
o l«ZZki':-M <u i?x?l?«:-S:!S
CO pllili
e E
'■£ cm
W m M
E
•«'»
K->^xi<*:wÄf:S¥Ä-Ä<y: >>y^^^>>V>^/<V>^vS)-H-t-iv i,,,¥
C
m m m s
o
W
:u

Using this pulse, we calculated the field inside the cell using FDTD. The main parameters
used are:
space discretization: Ax — 0.005 m
space discretization: Ay = 0.005 m
space discretization: Az = 0.005 m
time step: At = 9.629 x 10~12sec
These values are dictated by the high frequency content of the pulse and the stability
requirement of the method [20]. In our simulation, we calculated the E field at several points in the proximity of the
location where the actual measurements had previously been taken. These selected points are in the center of cross section BB' (Figure 2) near the bottom of the cell. Figure 12 compares the calculated Ey at the selected points to the measured Ey. The amplitude Vm
of the voltage source at the excitation plane was picked (trial and error) to be 42.75 kV in this particular calculation.
We have also measured and calculated several indices related to the E field at each point in a grid (not shown here) on the bottom wall ("parallel" to the septum). Among these indices is the peak intensity of the E field. From this a contour plot is made. This is shown in Figure 13. We used the model to calculate the peak E field intensity at approximately the same points and constructed the corresponding contour plot. This is shown in Figure 14. The two contour plots, Figure 13 and Figure 14 are qualitatively similar. (At this time, we have not fine tuned the choice of the amplitude Vm of the voltage source at the excitation plane to make the comparison better.)
12

m J*JDi^8tte?SW
u i
* * iiJ
ISptte l fa §im&)iab$& Xaptt \y&E^e Bamm,
- V-USl« — ixlgflR - i*£CäS ~ Vs?°^ <.- t; SS«$W$i.
J x »Ssr<S tat <:<*»* siCS S*
ii 'iii'"" "as;
f%s** ■!& CÄtaf % «fc I wmm m m m.
11

w ■■■■r—'"^—<—i—■—»—^-^v^m^ „—~-• -—SS.?581~
ttS'
'"""•■■••■»sä»-..
"•^'"""" ^•sw •■-,. *****
y ^ ,-* * *** ■»■a»? •'
W » * « » 89 3! St * «6
Wr- '' »»»—~—•» >«.m~r , , , ^
*;:-™::r~~:.™.™.. -— *ss» |'-- St.»*-
-J »s»< ""- SO!-. ■••- ^
4—O""*^ "-...
*T «.«$9* i~™.
*f -«?«*—.—...„_ —es^
Pigste ,14; Öealöör Pic* of Cale«kl«I Peak 1,
14;

CONCLUSION In this report we have described a general mathematical model that can be used to estimate the electric field in a large class of TEM cells. An excitation plane was used to simulate the input to the GTEM cell and the popular FDTD method was then used to calculate the
field anywhere and anytime inside the cell. To our knowledge this is the first documented use of FDTD to model an ultrawide-band exposure system. We tested our model on the simple (square) NBC cell and on a flared GTEM cell. The results have been reasonable in all cases. We believe this effort has laid the foundation for further fruitful research. Future improvements to the model include implementing methods to reduce staircase errors and to allow for multiple grids. These improvements are necessary for the efficient and accurate modeling of relatively small objects placed in the cell. When accomplished, they will have increased the scope and capability of electromagnetic compatibility and dosimetry research.
15

Bibliography
[1] J. Z. Bao, J.C. Lee, M. E. Belt, D. D. Cox, S. P. Mathur, and S. T. Lu, Error Correc- tion in Transient Electromagnetic Field Measurements Using Deconvolution Techniques, Ultra-Wideband, Short-Pulse Electromagnetics, vol. 3, pp. 373-380, 1997.
[2] G. Bellanca, High-Accuracy Assigned Power Excitation for the FDTD Technique, IEEE Microwave and Guided Wave Letters, vol. 7, pp. 411-413, 1997.
[3] J. P. Berenger, A Perfectly Matched Layer for the Absorption of Electromagnetic Waves, J. Comput. Physics, vol 114, pp. 185-200, 1994.
[4] J. P. Berenger, Three-Dimensional Perfectly Matched Layer for the Absorption of Elec- tromagnetic Waves, J. Comput. Physics, vol 127, pp. 363-379, 1996.
[5] E. L. Bronaugh, Simplifying EMI immunity (susceptibility) tests in TEM cells, Symp. Record IEEE 1990 Internation. Symp. Electromagn. Compat., Aug. 21-23, Washington, pp. 488-491, 1990.
[6] J. T. Brown, Using TEM cells for shielding performance evaluation, Symp. Record IEEE 1990 Internation. Symp. Electromagn. Compat., Aug. 21-23, Washington, pp. 495-499, 1990.
[7] D. N. Buechler, D. H. Roper, C. H. Durney, and D. A. Christensen, Modeling Sources in the FDTD Formulation and Their Use in Quantifying Source and Boundary Condition Errors, IEEE Trans. Microwave Theory and Tech., vol 43, pp. 810-814, 1995.
[8] M. Burkhardt, K. Pokovic, M. Gnos, T. Schmid, and N. Küster, Numerical and Ex- perimental Dosimetry of Petri Dish Exposure Setups, Bioelectromagnetics, vol 17, pp. 483-493, 1996
[9] J. H. Collins and P. Daly, Calculations for Guided Electromagnetic Waves using Finite- Difference Methods, J. Electronics and Control, vol. 14, pp. 361-380, 1963.
[10] M. L. Crawford, Generation of Standard EM Fields Using TEM Transmission Cells, IEEE Trans. Electromag. Compat., vol. 16, No. 4, pp. 189-195, Nov, 1974.
16

[11] 0. R. Cruzan and R. V. Garver, Characteristic Impedance of Rectangular Coaxil trans- mission lines, IEEE Trans. Microwave Theory Tech., vol. MTT-12, pp. 488-495, 1964.
[12] S. K. Das and B. K. Sinha Numerical Solution of Higher Order Mode Cut-Off Frequencies in Symmetric TEM Cells Using Finite Element Method, IEEE Trans. Electromagn. Compat., vol 32, pp. 264-268, 1990.
[13] D. Hansen, P. Wilson, D. Koenigstein, and H. Schaer, A broadband alternative EMC test chamber based on a TEM cell anechoic-chamber hybrid concept, in Int. Symp. Elec- tromag. Compat., Nagoya, Japan, Sept. 1989
[14] D. Hansen, D. Ristau, T. Spaeth, W. A. Radasky, and Kenneth S. Smith, Expansions on the GTEM Field Structure Problem, Proceedings of the IEEE Electromagnetic Com- patibility Sym. 1995, Atlanta, pp. 538-542, Aug. 1995.
[15] D. Hansen, D. Ristau, W. A. Radasky, and K. S. Smith, Sources of Problems in the GTEM Field Structure and Recommended Solutions, Proceedings of the IEEE Electro- magnetic Compatibility Sym. 1996, Santa Clara, pp. 48-51, Aug. 1996.
[16] J. Van Hesc, L. Martens, D. De Zutter, C. De Wagter, L. O. G. Malmgren, B. R. R. Person, and L.G. Salford, Simulation of the Effect of Inhomogeneities in TEM Trans- mission Cells using the FDTD-Method, IEEE Trans. Electromagn. Compat., vol 34, pp. 292-298, 1992.
[17] K. Huang and W. Lin, Calculation of Characteristic Impedance of Broadband TEM Cell (BTEM Cell), Microwave and Optical Technology Letters, vol. 4, No. 12, pp. 555-557, Nov. 1991.
[18] K. Huang and Y. Liu, A Simple Method for Calculating Electric and Magnetic Fields in GTEM Cell, IEEE Trans. Electromag. Compat., vol. 36, No. 4, pp. 355-358, Nov. 1994.
[19] D. Koenigstein and D. Hansen, A new family of TEM-cells with enlarged bandwidth and optimized working volume, in 7th Symp. Electromag. Compat., Zurich, Mar. pp. 127-132, 1987.
[20] K. Kunz and R. Luebbers, The Finite Difference Time Domain Method for Electromag- netics, CRC Press, 1993.
[21] R. Lampe, P. Klock, D. Tanner, and P. Mayes, Analysis and Experiment Concerning the Cutoff Frequencies of Rectangular Striplines, IEEE Trans. Microwave Theory Tech., vol. MTT-34, No. 8, pp. 898-899, Aug. 1986.
[22] R. De Leo, T. Rozzi, C. Svara, and L. Zappelli, Rigorous Analysis of the GTEM Cell, IEEE Trans. Microwave Theory Tech., vol. MTT-39, No. 3, pp. 488-500, Mar. 1991.
17

[23] R. De Leo, L. Pierantoni, T. Rozzi, and L. Zappelli, Dipole Excitation and Scattering by Spherical Objects in GTEM Cell, IEEE Trans. Microwave Theory Tech., vol. 42, No. 9, pp. 1700-1708, Sep. 1994.
[24] Shin-Tsu Lu, Satnam, P. Mathur, Yahya Akyel, and Jonathan Lee, Ultrawide-Band Electromagnetic Pulses Induced Hypotension in Rats, Physiology and Behavior, vol. 65, Nos. 4/5, pp. 753-761, 1999.
[25] William A. Radasky, Kenneth S. Smith, Diethard Hansen and Detlef Ristau, Calcula- tions and Measurements of Fast EM Pulses in the GTEM Cell, Proceedings of the IEEE Electromagnetic Compatibility Sym. 1996, Santa Clara, pp. 52-57, Aug. 1996.
[26] C. J. Railton and J.B. Schneider, An Analytical and Numerical Analysis of Several Locally Conformal FDTD Schemes, IEEE Trans. Microwave Theory and Techniques, vol. 47, no. 1, pp. 56-66, 1999.
[27] R. J. Spiegel, W. T. Joines, C. F. Blackman, and A. W. Wood, A Method for Calculat- ing Electric and Magnetic Fields in TEM Cells at ELF, IEEE Trans. Electromagnetic Compatibility, Vol. EMC-29, No. 4, Nov 1987.
[28] C. Wan, Conformal Mapping Analysis of a Modified TEM Cell, IEEE Trans. Electro- magn. compat., vol 35, pp. 109-113, 1993.
[29] P. F. Wlilson and M. T. Ma, Simple Approximation Expressions for Higher Order Mode Cutoff and Resonant Frequencies in TEM Cells, IEEE Trans. Electromag. Compat., vol. 28, No. 3, pp. 125-130, Aug, 1986.
[30] K. S. Yee, Numerical solution of initial boundary value problems involving Maxwell's equations in isotropic media, IEEE Trans. Antennas and Propagation, vol. 14, pp. 302- 307, 1966.
[31] J. Zhang and J. M. Fu, Higher Order Mode Cutoff Frequencies in TEM Cells Calculated with TLMMethod, IEEE Trans. Electromag. Compat., vol. 30, No. 4, pp. 563-567, Nov, 1088.
[32] J. Zhang A Note on the Cutoff Frequency of TEol Mode in TEM Cells, IEEE Trans. Electromag. Compat., vol. 33, No. 2, pp. 145-146, May, 1991.
18