Daily-life activities and in-shoe forefoot plantar pressure in patients with diabetes
7
Daily-life activities and in-shoe forefoot plantar pressure in patients with diabetes Nick A. Guldemond a, * , Pieter Leffers b , Antal P. Sanders c , Nicolaas C. Schaper d , Fred Nieman e , Geert H.I.M. Walenkamp a a Department Orthopaedic Surgery, University Hospital Maastricht, P.O. Box 5800, 6202 AZ Maastricht, The Netherlands b Department of Epidemiology, Fac. Medicine, Maastricht University, The Netherlands c Department Rehabilitation Medicine, University Hospital Maastricht, The Netherlands d Department Internal Medicine, University Hospital Maastricht, The Netherlands e Department Clinical Epidemiology and Medical Technology Assessment, University Hospital Maastricht, The Netherlands Received 21 April 2006; accepted 17 November 2006 Available online 21 December 2006 Abstract Objective: To assess differences regarding in-shoe forefoot plantar pressure (PP) in patients with diabetes during various daily-life activities. Research design and methods: In-shoe PP was measured in 93 patients during: level walking, ramp and stair walking, turning in different settings and while performing the Up & Go test. Separate PPs were determined for the big toe and metatarsal (mt) regions one to five. Results: Across all activities, similar PPs were measured in the big toe and mt-1 to mt-3 region. Lower PPs were measured in mt-4 and mt-5 region. PPs during level walking were mostly higher when compared to the other activities ( p .030). Turning while level walking resulted in higher PPs than turning while performing the other activities ( p .033). Higher PPs were measured for both ramp and stair ascending when compared to descending ( p .001). In the big toe region, stair descending resulted in higher PPs than ascending ( p .001). Across all activities, patients with neuropathy had lower PPs (overall mean 28 kPa) than patients without neuropathy. Conclusions: Level walking resulted in the highest forefoot PPs during daily-life activities. Patients with neuropathy had lower PPs than patients without neuropathy. # 2006 Elsevier Ireland Ltd. All rights reserved. Keywords: Daily activities; Diabetic foot; Plantar pressure; Screening 1. Introduction Since the introduction of electronic equipment for plantar pressure measurement, the majority of research regarding the biomechanics of the diabetic foot has been performed with pressure sensitive platforms and has been focused mainly on plantar bare foot loading. The application of pressure sensitive platforms is limited to laboratory settings and most platforms allow only one step per run for recording. At the beginning of the 1990s, commercial equipment for in-shoe pressure measurement became available and is now commonly used in research as well as in clinical settings. In-shoe www.elsevier.com/locate/diabres Diabetes Research and Clinical Practice 77 (2007) 203–209 * Corresponding author. Tel.: +31 43 3875031; fax: +31 43 3874893. E-mail addresses: [email protected], [email protected] (N.A. Guldemond). 0168-8227/$ – see front matter # 2006 Elsevier Ireland Ltd. All rights reserved. doi:10.1016/j.diabres.2006.11.006
-
Upload
independent -
Category
Documents
-
view
1 -
download
0
Transcript of Daily-life activities and in-shoe forefoot plantar pressure in patients with diabetes
www.elsevier.com/locate/diabres
Diabetes Research and Clinical Practice 77 (2007) 203–209
Daily-life activities and in-shoe forefoot plantar pressure
in patients with diabetes
Nick A. Guldemond a,*, Pieter Leffers b, Antal P. Sanders c, Nicolaas C. Schaper d,Fred Nieman e, Geert H.I.M. Walenkamp a
a Department Orthopaedic Surgery, University Hospital Maastricht, P.O. Box 5800, 6202 AZ Maastricht, The Netherlandsb Department of Epidemiology, Fac. Medicine, Maastricht University, The Netherlands
c Department Rehabilitation Medicine, University Hospital Maastricht, The Netherlandsd Department Internal Medicine, University Hospital Maastricht, The Netherlands
e Department Clinical Epidemiology and Medical Technology Assessment, University Hospital Maastricht, The Netherlands
Received 21 April 2006; accepted 17 November 2006
Available online 21 December 2006
Abstract
Objective: To assess differences regarding in-shoe forefoot plantar pressure (PP) in patients with diabetes during various daily-life
activities.
Research design and methods: In-shoe PP was measured in 93 patients during: level walking, ramp and stair walking, turning in
different settings and while performing the Up & Go test. Separate PPs were determined for the big toe and metatarsal (mt) regions
one to five.
Results: Across all activities, similar PPs were measured in the big toe and mt-1 to mt-3 region. Lower PPs were measured in mt-4
and mt-5 region. PPs during level walking were mostly higher when compared to the other activities ( p � .030). Turning while level
walking resulted in higher PPs than turning while performing the other activities ( p � .033). Higher PPs were measured for both
ramp and stair ascending when compared to descending ( p � .001). In the big toe region, stair descending resulted in higher PPs
than ascending ( p � .001). Across all activities, patients with neuropathy had lower PPs (overall mean 28 kPa) than patients without
neuropathy.
Conclusions: Level walking resulted in the highest forefoot PPs during daily-life activities. Patients with neuropathy had lower PPs
than patients without neuropathy.
# 2006 Elsevier Ireland Ltd. All rights reserved.
Keywords: Daily activities; Diabetic foot; Plantar pressure; Screening
1. Introduction
Since the introduction of electronic equipment for
plantar pressure measurement, the majority of research
* Corresponding author. Tel.: +31 43 3875031;
fax: +31 43 3874893.
E-mail addresses: [email protected], [email protected]
(N.A. Guldemond).
0168-8227/$ – see front matter # 2006 Elsevier Ireland Ltd. All rights re
doi:10.1016/j.diabres.2006.11.006
regarding the biomechanics of the diabetic foot has been
performed with pressure sensitive platforms and has
been focused mainly on plantar bare foot loading. The
application of pressure sensitive platforms is limited to
laboratory settings and most platforms allow only one
step per run for recording. At the beginning of the
1990s, commercial equipment for in-shoe pressure
measurement became available and is now commonly
used in research as well as in clinical settings. In-shoe
served.

N.A. Guldemond et al. / Diabetes Research and Clinical Practice 77 (2007) 203–209204
plantar pressure measurement provides the opportunity
for collecting multiple steps per run.
In-shoe plantar pressure is usually measured during
walking straight on level ground. In previous reports, it
was questioned whether such plantar pressures were
representative for plantar pressures during activities of
daily living [1–3]. Until now, only a few studies have
evaluated in-shoe plantar pressures under more real life
circumstances [2–6]. Only one of these studies was
performed in patients with diabetes and peripheral
neuropathy. Several results of these small sample size
studies were conflicting, e.g. one found that plantar
pressures were lower during turning than straight level
walking [2], while others found the opposite [3,5]. The
primary objective of the present study was to determine
differences between various activities regarding fore-
foot in-shoe plantar pressures in diabetic patients. The
secondary objective was to evaluate whether there were
differences for these activities as far patients with and
without peripheral neuropathy were concerned. We
compared straight level walking with turning, with the
Up & Go test and with ramp and stair walking.
2. Materials and methods
2.1. Patients
Diabetic patients were selected from the medical outpa-
tient clinic of the University Hospital Maastricht. Inclusion
criteria were diabetes mellitus type 1 (longer than 10 years
after date of diagnosis) or type 2 (at least 1 year after date of
diagnosis); age between 30 and 75 years and able to perform
daily-life activities without supporting devices. Exclusion
criteria were a history of rheumatoid arthritis, foot trauma
Table 1
Patient characteristics
n
Gender (female/male)
Type of DM (1/2)
Female Male
Mean S.D. Min–max Mean S.D. Mi
Age (years) 56.3 9.06 34–69 50.9 9.52 3
Duration diabetes
(years)
13.8 10.16 3–39 11.6 7.70
HBa1c (%) 8.31 1.51 5.9–10.7 8.15 1.08 5.
Body mass index
(kg/m2)
28.9 5.17 19.8–39.6 28.2 4.83 20.
VPT 12.3 4.06 5.2–20.5 13.9 5.18 5.
Walking speed (m/s) 1.04 0.11 0.91–1.28 1.08 0.16 0.7
PNP+, peripheral polyneuropathy; PNP�, no peripheral polyneuropathy; D
hemoglobin A1c.
surgery of the foot and/or severe deformity. The latter included
pes cavus, i.e. an excessively elevated foot arch, hallux valgus
more than 158 and severe toe deformity. The degree of hallux
valgus was measured according to the guidelines of the
American Academy of Orthopaedic Surgeons [7]. The pre-
sence of claw toe, mallet toe, curly toe or hammer toe
deformity, was scored according to the definitions of Myerson
and Shereff [8]. The degree of toe deformity was arbitrarily
defined as less (minor), the same (significant) or more (severe)
than the definitions described by Myerson and Shereff,
whereas ‘normal toe’ was recorded if there was no malalign-
ment present. In addition, the medial arch height was sub-
jectively classified as: no arch; lowered arch; normal arch;
elevated arch and excessively elevated arch. Before the start of
the study, patients were informed about all study procedures
and their possible risks. The Research Ethical Committee of
the University Hospital Maastricht approved the study.
Ninety-three eligible patients were screened for peripheral
neuropathy through determination of the vibration perception
thresholds (VPT) at the apex of the hallux with a biothesi-
ometer (Biomedical, Newbury OH) [9–11]. AVPT higher than
25 V was used as the diagnostic criterion for peripheral
neuropathy: �25 V = PNP�, >25 V = PNP+. Table 1 con-
tains descriptive data with respect to gender, age, body mass
index (BMI), duration of diabetes, VPT, HBa1c and walking
speed.
2.2. Procedures
The following timed activities were evaluated: level walk-
ing, the Up & Go test, ascending and descending a ramp and a
flight of stairs (Table 2). Level walking: patients walked two
lengths of 10 m (turn excluded) indoors on a concrete floor in
one single run. Ascending and descending a ramp: patients
ascended and descended a 15% grade ramp of 4 m and turned
on a platform of 62 cm length by 81 cm width. This was a
PNP� PNP+
49 44
30/19 29/15
18/31 9/35
Female Male
n–max Mean S.D. Min–max Mean S.D. Min–max
2–70 64.9 8.79 49–75 58.8 10.42 34–72
1–32 18.1 11.35 2–40 16.3 11.39 3–45
1–9.7 8.25 1.29 6.3–11.8 8.16 1.25 5.7–12.0
1–38.0 31.2 7.37 20.0–45.7 29.6 6.44 19.8–45.3
7–23.3 41.9 9.79 24.8–50.0 41.3 11.84 14.5–50.0
1–1.50 0.85 0.13 0.67–1.09 1.05 0.20 0.60–1.38
M, diabetes mellitus; VPT, vibration perception threshold; HbA1c,
N.A. Guldemond et al. / Diabetes Research and Clinical Practice 77 (2007) 203–209 205
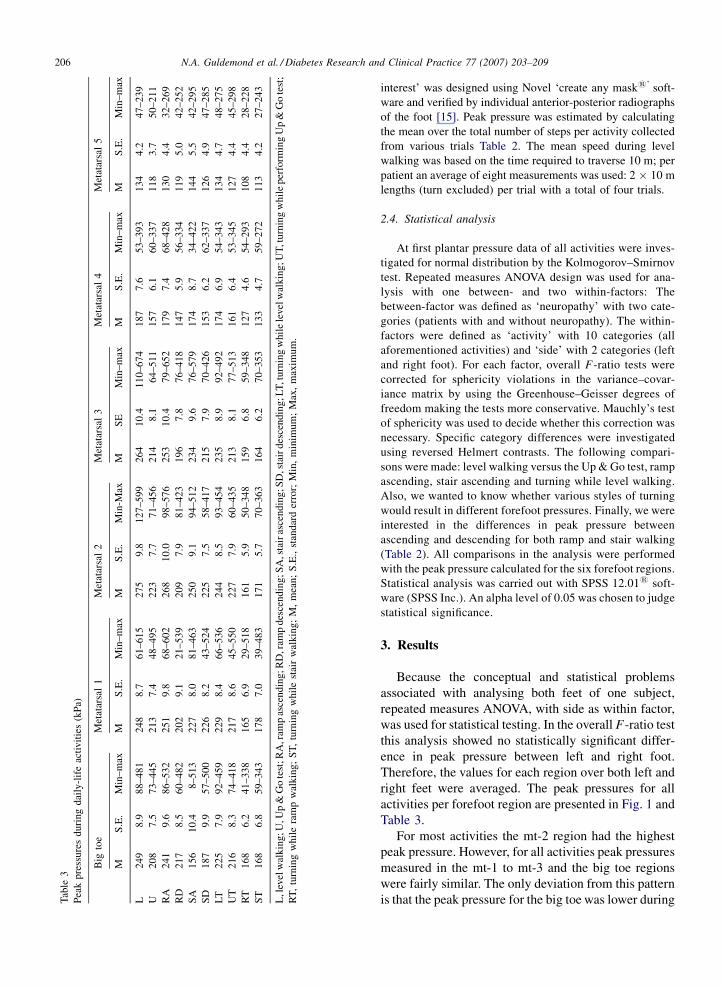
Fig. 1. Peak pressures during daily-life activities. L, level walking; U,
Up & Go test; RA, ramp ascending; RD, ramp descending; SA, stair
ascending; SD, stair descending; LT, turning while level walking; UT,
turning while performing Up & Go test; RT, turning while ramp
walking; ST, turning while stair walking; mt, metatarsal; kPa, kilo-
Pascal.
Table 2
Information about activities, number of steps used for analysis and groups of comparison for statistical testing
Activity Trials per patient Distance per trial Turns clockwise Turns counter-clockwise Average number of steps
per patient used for analysis
Straight on performance Turns
Level walking 4 2 m � 10 m 2� 2� 40 8
Up & Go test 2 2 m � 3 m 1� 1� 8 4
Ramp ascending 2 2 m � 4 m 1� 1� 6 4
Ramp descending 2 2 m � 4 m 1� 1� 6
Stair ascending 2 2 m � 3 m 1� 1� 14 4
Stair descending 2 2 m � 3 m 1� 1� 14
Groups of comparison
Level walking vs. other activities L vs. U L vs. RA L vs. SA L vs. LT
Turning while level walking vs. turning during other activities LT vs. UT LT vs. RT LT vs. ST UT vs. RT UT vs. ST RT vs. ST
Ascending vs. descending RA vs. RD SA vs. SD
L, level walking; U, Up & Go test; RA, ramp ascending; RD, ramp descending; SA, stair ascending; SD, stair descending; LT, turning while level
walking; UT, turning while performing Up & Go test; RT, turning while ramp walking; ST, turning while stair walking.
typical a situation in which a subject would turn at a low speed
with a small perimeter. Upstairs and downstairs walking:
patients were asked to ascend and descend 10 stairs in their
usual manner (step height 18 cm; board depth 27 cm; 33 grade
inclination). Unilateral use of a handrail was obligatory and
they turned on the landing of the stairwell. For the aforemen-
tioned activities patients were instructed to walk and turn at a
safe and comfortable pace. Timed Up & Go test: patients were
asked to rise from a standard chair (seat height 45 cm), walk to
and turn around a pylon, which was placed 3 m from the chair,
and return to a sitting position in the chair [12]. Patients were
instructed to ‘‘perform the activity as quickly as you can
without overexerting yourself’’. This was a typical test situa-
tion in which a subject would accelerate and decelerate at a
relatively high speed in combination with a turn around a
small perimeter.
During all activities plantar peak pressures were measured
with a frequency of 50 Hz per sensor with the Pedar Insole-
system1 (Novel, Munich Germany). The Pedar insoles con-
sisted of a matrix of 99 sensors with an average individual
sensor effective area of approximately 1.5 cm2 and were
placed in both shoes between the socks and shoes. For patient
measurement, the insoles were calibrated to absolute values
using the Trublu1 calibration device (Novel, Munich Ger-
many). A ‘relative or zero calibration’ was performed imme-
diately before each trial by unloading each insole. The Pedar
processing unit was worn in a waist pocket. Plantar pressure
data were recorded with a computer through a 15 m umbilical
cable which was guided during the measurements. All patients
performed the activities in a randomized order in standard
socks and shoes of various widths and neutral fore-/rear foot
height (males: Van Lier: outer sole hardness, i.e. shore type A:
68, No 814 Loon op Zand, Netherlands and females: Durea
Greenway: outer sole shore type A: 63, No 6548 Drunen
Netherlands). These shoes are oxford style shoes with a
relatively stiff innersole material (Shore A higher than 60
[13]) They were used in order to minimize the influence of
‘cushioning’ on plantar pressure loading and without any
specific adaptation they are not necessarily appropriate for
diabetic feet. This type of shoe is close to what is commonly
worn in the Dutch elderly population. The shoe fitting was
checked according the guidelines described by Shor [14].
Time was measured to the nearest 1/10 of a second using a
stopwatch with interval memory storage.
2.3. Data processing
Pedar Expert1 software (Novel, Munich Germany) was
used to select steps from the raw data files. The assignment of
steps to walking or turning was made by using the recording
time in the data files and the stopwatch intervals. The evalua-
tion was focused on six forefoot regions: big toe and meta-
tarsal one (mt-1) to five (mt-5). The mask for these ‘regions of
N.A. Guldemond et al. / Diabetes Research and Clinical Practice 77 (2007) 203–209206T
able
3
Pea
kp
ress
ure
sd
uri
ng
dai
ly-l
ife
acti
vit
ies
(kP
a)
Big
toe
Met
atar
sal
1M
etat
arsa
l2
Met
atar
sal
3M
etat
arsa
l4
Met
atar
sal
5
MS
.E.
Min
–m
axM
S.E
.M
in–
max
MS
.E.
Min
-Max
MS
EM
in–
max
MS
.E.
Min
–m
axM
S.E
.M
in–
max
L2
49
8.9
88
–48
12
48
8.7
61
–61
52
75
9.8
12
7–5
99
26
41
0.4
11
0–6
74
18
77
.65
3–
39
31
34
4.2
47
–2
39
U2
08
7.5
73
–44
52
13
7.4
48
–49
52
23
7.7
71
–45
62
14
8.1
64
–51
11
57
6.1
60
–33
71
18
3.7
50
–2
11
RA
24
19
.68
6–
53
22
51
9.8
68
–60
22
68
10
.09
8–
57
62
53
10
.47
9–
65
21
79
7.4
68
–42
81
30
4.4
32
–2
69
RD
21
78
.56
0–
48
22
02
9.1
21
–53
92
09
7.9
81
–42
31
96
7.8
76
–41
81
47
5.9
56
–33
41
19
5.0
42
–2
52
SA
15
61
0.4
8–
513
22
78
.08
1–
46
32
50
9.1
94
–51
22
34
9.6
76
–57
91
74
8.7
34
–42
21
44
5.5
42
–2
95
SD
18
79
.95
7–
50
02
26
8.2
43
–52
42
25
7.5
58
–41
72
15
7.9
70
–42
61
53
6.2
62
–33
71
26
4.9
47
–2
85
LT
22
57
.99
2–
45
92
29
8.4
66
–53
62
44
8.5
93
–45
42
35
8.9
92
–49
21
74
6.9
54
–34
31
34
4.7
48
–2
75
UT
21
68
.37
4–
41
82
17
8.6
45
–55
02
27
7.9
60
–43
52
13
8.1
77
–51
31
61
6.4
53
–34
51
27
4.4
45
–2
98
RT
16
86
.24
1–
33
81
65
6.9
29
–51
81
61
5.9
50
–34
81
59
6.8
59
–34
81
27
4.6
54
–29
31
08
4.4
28
–2
28
ST
16
86
.85
9–
34
31
78
7.0
39
–48
31
71
5.7
70
–36
31
64
6.2
70
–35
31
33
4.7
59
–27
21
13
4.2
27
–2
43
L,l
evel
wal
kin
g;U
,Up
&G
ote
st;R
A,r
amp
asce
nd
ing
;RD
,ram
pd
esce
nd
ing
;SA
,sta
iras
cen
din
g;S
D,s
tair
des
cen
din
g;L
T,t
urn
ing
wh
ile
level
wal
kin
g;U
T,t
urn
ing
wh
ile
per
form
ing
Up
&G
ote
st;
RT
,tu
rnin
gw
hil
era
mp
wal
kin
g;
ST
,tu
rnin
gw
hil
est
air
wal
kin
g;
M,
mea
n;
S.E
.,st
and
ard
erro
r;M
in,
min
imu
m;
Max
,m
axim
um
.
interest’ was designed using Novel ‘create any mask1’ soft-
ware and verified by individual anterior-posterior radiographs
of the foot [15]. Peak pressure was estimated by calculating
the mean over the total number of steps per activity collected
from various trials Table 2. The mean speed during level
walking was based on the time required to traverse 10 m; per
patient an average of eight measurements was used: 2 � 10 m
lengths (turn excluded) per trial with a total of four trials.
2.4. Statistical analysis
At first plantar pressure data of all activities were inves-
tigated for normal distribution by the Kolmogorov–Smirnov
test. Repeated measures ANOVA design was used for ana-
lysis with one between- and two within-factors: The
between-factor was defined as ‘neuropathy’ with two cate-
gories (patients with and without neuropathy). The within-
factors were defined as ‘activity’ with 10 categories (all
aforementioned activities) and ‘side’ with 2 categories (left
and right foot). For each factor, overall F-ratio tests were
corrected for sphericity violations in the variance–covar-
iance matrix by using the Greenhouse–Geisser degrees of
freedom making the tests more conservative. Mauchly’s test
of sphericity was used to decide whether this correction was
necessary. Specific category differences were investigated
using reversed Helmert contrasts. The following compari-
sons were made: level walking versus the Up & Go test, ramp
ascending, stair ascending and turning while level walking.
Also, we wanted to know whether various styles of turning
would result in different forefoot pressures. Finally, we were
interested in the differences in peak pressure between
ascending and descending for both ramp and stair walking
(Table 2). All comparisons in the analysis were performed
with the peak pressure calculated for the six forefoot regions.
Statistical analysis was carried out with SPSS 12.011 soft-
ware (SPSS Inc.). An alpha level of 0.05 was chosen to judge
statistical significance.
3. Results
Because the conceptual and statistical problems
associated with analysing both feet of one subject,
repeated measures ANOVA, with side as within factor,
was used for statistical testing. In the overall F-ratio test
this analysis showed no statistically significant differ-
ence in peak pressure between left and right foot.
Therefore, the values for each region over both left and
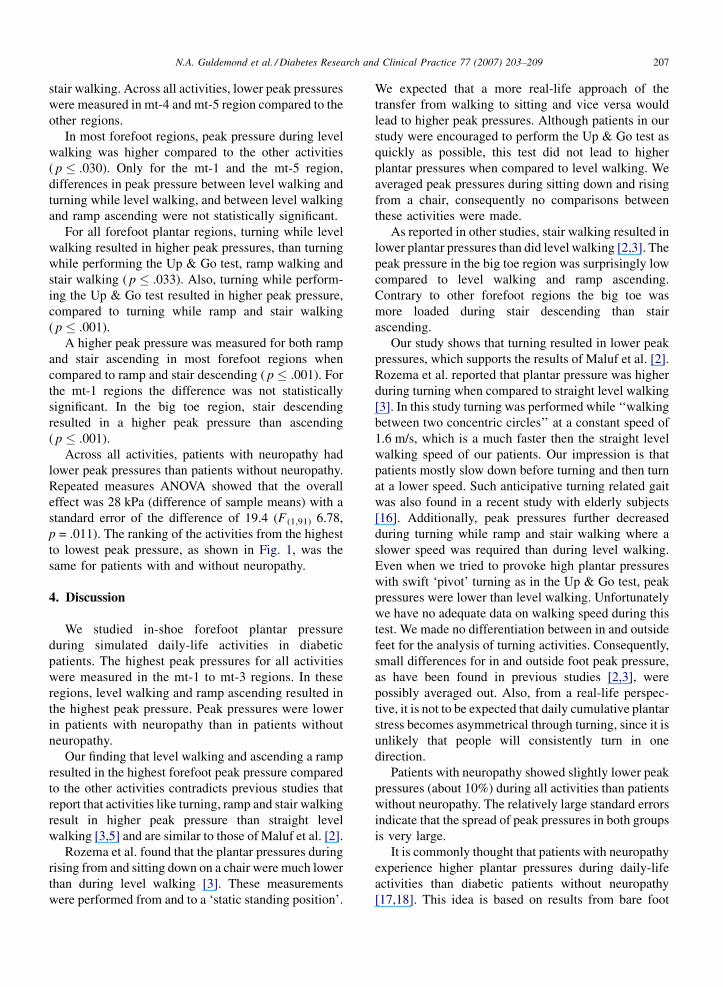
right feet were averaged. The peak pressures for all
activities per forefoot region are presented in Fig. 1 and
Table 3.
For most activities the mt-2 region had the highest
peak pressure. However, for all activities peak pressures
measured in the mt-1 to mt-3 and the big toe regions
were fairly similar. The only deviation from this pattern
is that the peak pressure for the big toe was lower during
N.A. Guldemond et al. / Diabetes Research and Clinical Practice 77 (2007) 203–209 207
stair walking. Across all activities, lower peak pressures
were measured in mt-4 and mt-5 region compared to the
other regions.
In most forefoot regions, peak pressure during level
walking was higher compared to the other activities
( p � .030). Only for the mt-1 and the mt-5 region,
differences in peak pressure between level walking and
turning while level walking, and between level walking
and ramp ascending were not statistically significant.
For all forefoot plantar regions, turning while level
walking resulted in higher peak pressures, than turning
while performing the Up & Go test, ramp walking and
stair walking ( p � .033). Also, turning while perform-
ing the Up & Go test resulted in higher peak pressure,
compared to turning while ramp and stair walking
( p � .001).
A higher peak pressure was measured for both ramp
and stair ascending in most forefoot regions when
compared to ramp and stair descending ( p � .001). For
the mt-1 regions the difference was not statistically
significant. In the big toe region, stair descending
resulted in a higher peak pressure than ascending
( p � .001).
Across all activities, patients with neuropathy had
lower peak pressures than patients without neuropathy.
Repeated measures ANOVA showed that the overall
effect was 28 kPa (difference of sample means) with a
standard error of the difference of 19.4 (F (1,91) 6.78,
p = .011). The ranking of the activities from the highest
to lowest peak pressure, as shown in Fig. 1, was the
same for patients with and without neuropathy.
4. Discussion
We studied in-shoe forefoot plantar pressure
during simulated daily-life activities in diabetic
patients. The highest peak pressures for all activities
were measured in the mt-1 to mt-3 regions. In these
regions, level walking and ramp ascending resulted in
the highest peak pressure. Peak pressures were lower
in patients with neuropathy than in patients without
neuropathy.
Our finding that level walking and ascending a ramp
resulted in the highest forefoot peak pressure compared
to the other activities contradicts previous studies that
report that activities like turning, ramp and stair walking
result in higher peak pressure than straight level
walking [3,5] and are similar to those of Maluf et al. [2].
Rozema et al. found that the plantar pressures during
rising from and sitting down on a chair were much lower
than during level walking [3]. These measurements
were performed from and to a ‘static standing position’.
We expected that a more real-life approach of the
transfer from walking to sitting and vice versa would
lead to higher peak pressures. Although patients in our
study were encouraged to perform the Up & Go test as
quickly as possible, this test did not lead to higher
plantar pressures when compared to level walking. We
averaged peak pressures during sitting down and rising
from a chair, consequently no comparisons between
these activities were made.
As reported in other studies, stair walking resulted in
lower plantar pressures than did level walking [2,3]. The
peak pressure in the big toe region was surprisingly low
compared to level walking and ramp ascending.
Contrary to other forefoot regions the big toe was
more loaded during stair descending than stair
ascending.
Our study shows that turning resulted in lower peak
pressures, which supports the results of Maluf et al. [2].
Rozema et al. reported that plantar pressure was higher
during turning when compared to straight level walking
[3]. In this study turning was performed while ‘‘walking
between two concentric circles’’ at a constant speed of
1.6 m/s, which is a much faster then the straight level
walking speed of our patients. Our impression is that
patients mostly slow down before turning and then turn
at a lower speed. Such anticipative turning related gait
was also found in a recent study with elderly subjects
[16]. Additionally, peak pressures further decreased
during turning while ramp and stair walking where a
slower speed was required than during level walking.
Even when we tried to provoke high plantar pressures
with swift ‘pivot’ turning as in the Up & Go test, peak
pressures were lower than level walking. Unfortunately
we have no adequate data on walking speed during this
test. We made no differentiation between in and outside
feet for the analysis of turning activities. Consequently,
small differences for in and outside foot peak pressure,
as have been found in previous studies [2,3], were
possibly averaged out. Also, from a real-life perspec-
tive, it is not to be expected that daily cumulative plantar
stress becomes asymmetrical through turning, since it is
unlikely that people will consistently turn in one
direction.
Patients with neuropathy showed slightly lower peak
pressures (about 10%) during all activities than patients
without neuropathy. The relatively large standard errors
indicate that the spread of peak pressures in both groups
is very large.
It is commonly thought that patients with neuropathy
experience higher plantar pressures during daily-life
activities than diabetic patients without neuropathy
[17,18]. This idea is based on results from bare foot
N.A. Guldemond et al. / Diabetes Research and Clinical Practice 77 (2007) 203–209208
plantar pressure studies, which showed that patients
with neuropathy have higher plantar pressure than
patients without neuropathy or healthy controls [19–
26]. Our study shows that in-shoe plantar pressure
during daily life activities is lower in neuropathic
patients. The present analysis was not focused on the
causal mechanism for the explanation of the difference
in plantar pressure between patients with and without
neuropathy. The slower walking speed of patients with
neuropathy probably explains at least part of the
difference in peak pressure, while also adaptive gait
style may play a role. We studied diabetic patients
without severe deformities, limited joint mobility and
gait abnormalities. Some of the results might well be
different in patients with these complications of
diabetes. Further studies in such patient groups are
warranted.
The present study is an added piece in the puzzle of
how foot ulcers develop. In general, daily plantar foot
loading has four determinants: (1) footwear, (2)
performed activity, (3) number of loading cycles and
(4) the temporal pattern of activities.
It is obvious that activity patterns between indivi-
duals vary a lot. Armstrong et al. [27] showed that intra-
individual activity fluctuates; periods of inactivity are
punctuated by relatively sudden pulses of activity over a
short time frame. From the study of Maluf et al. [2] and
our own study it appears that straight level walking for a
longer period of time seems to be less favourable
activity than ‘moving around the house’. Because of the
large variation in used personal footwear and plantar
loading characteristics, inter-individual differences
must be considered in estimating risk for ulceration
in an ‘every day’ perspective.
5. Conclusions
Level walking and ascending a ramp resulted in the
highest forefoot peak pressure compared to other
simulated daily-life activities such as ramp descending,
stair walking, rising from and sitting down on a chair.
Compared to descending, ascending a ramp or stairs
resulted in higher peak pressures. An exception is the
big toe region which had a lower pressure during stair
ascending. Across all activities and plantar regions,
peak pressures were lower for patients with neuropathy
than patients without neuropathy.
Acknowledgement
This study was supported by the Dutch Diabetes
Research Foundation.
References
[1] P. Cavanagh, F. Hewitt, J. Perry, In shoe plantar pressure
measurement: a review, Foot 2 (1992) 185–194.
[2] K.S. Maluf, R.E. Morley Jr., E.J. Richter, J.W. Klaesner, M.J.
Mueller, Foot pressures during level walking are strongly asso-
ciated with pressures during other ambulatory activities in
subjects with diabetic neuropathy, Arch. Phys. Med. Rehabil.
85 (2) (2004) 253–260.
[3] A. Rozema, J.S. Ulbrecht, S.E. Pammer, P.R. Cavanagh, In-shoe
plantar pressures during activities of daily living: implications
for therapeutic footwear design, Foot Ankle Int. 17 (6) (1996)
352–359.
[4] J. Grampp, J. Willson, T. Kernozek, The plantar loading varia-
tions to uphill and downhill gradients during treadmill walking.,
Foot Ankle Int. 21 (3) (2000) 227–231.
[5] S. Lundeen, K. Lundquist, M.W. Cornwall, T.G. McPoil, Plantar
pressures during level walking compared with other ambulatory
activities, Foot Ankle Int. 15 (6) (1994) 324–328.
[6] A. Szczepaniak, B. Dredrup, A. Guttmann, H.H. Wetz, Plantar
loading pattern in step-to level and stair climbing, in: Biome-
chanics of The Lower Limb in Health, Disease and Rehabilita-
tion, University of Salford, Salford (Greater Manchester),
2003 .
[7] AAOS, Joint Motion: Method of Measuring and Recording.
Churchill-Livingstone 1965. Chicago. ISBN: 0892030909.
[8] M.S. Myerson, M.J. Shereff, The pathological anatomy of claw
and hammer toes, J. Bone Joint. Surg. Am. 71 (1) (1989) 45–49.
[9] R.W. van Deursen, M.M. Sanchez, J.A. Derr, M.B. Becker, J.S.
Ulbrecht, P.R. Cavanagh, Vibration perception threshold testing
in patients with diabetic neuropathy: ceiling effects and relia-
bility, Diabet. Med. 18 (6) (2001) 469–475.
[10] S. Bloom, S. Till, P. Sonksen, S. Smith, Use of a biothesiometer
to measure individual vibration thresholds and their variation in
519 non-diabetic subjects, Br. Med. J. (Clin. Res. Ed.) 288
(6433) (1984) 1793–1795.
[11] P.J. Dyck, P.C. O’Brien, Quantitative sensation testing in epi-
demiological and therapeutic studies of peripheral neuropathy,
Muscle Nerve 22 (6) (1999) 659–662.
[12] D. Podsiadlo, S. Richardson, The timed ‘‘Up & Go’’: a test of
basic functional mobility for frail elderly persons, J. Am. Geriatr.
Soc. 39 (2) (1991) 142–148.
[13] G. Charanya, K.M. Patil, V.B. Narayanamurthy, R. Parivalavan,
K. Visvanathan, Effect of foot sole hardness, thickness and
footwear on foot pressure distribution parameters in diabetic
neuropathy, Proc. Inst. Mech. Eng. [H] 218 (6) (2004) 431–443.
[14] R. Shor, Shoe fitting for the at-risk diabetic patient: a proper
fitting shoe leads to better treatment results, Podiat. Manage
(October) (2003).
[15] R.E. Weijers, G.H. Walenkamp, H. van Mameren, A.G. Kessels,
The relationship of the position of the metatarsal heads and peak
plantar pressure, Foot Ankle Int. 24 (4) (2003) 349–353.
[16] P. Meinhart-Shibata, M. Kramer, J.A. Ashton-Miller, C. Persad,
Kinematic analyses of the 180 degrees standing turn: effects of
age on strategies adopted by healthy young and older women,
Gait Posture 22 (2) (2005) 119–125.
[17] P.R. Cavanagh, G.G. Simoneau, J.S. Ulbrecht, Ulceration,
unsteadiness, and uncertainty: the biomechanical consequences
of diabetes mellitus, J. Biomech. 26 (Suppl. 1) (1993) 23–40.
[18] A. Veves, H.J. Murray, M.J. Young, A.J. Boulton, The risk of foot
ulceration in diabetic patients with high foot pressure: a pro-
spective study, Diabetologia 35 (7) (1992) 660–663.
N.A. Guldemond et al. / Diabetes Research and Clinical Practice 77 (2007) 203–209 209
[19] R.M. Stess, S.R. Jensen, R. Mirmiran, The role of dynamic
plantar pressures in diabetic foot ulcers, Diab. Care 20 (5) (1997)
855–858.
[20] J.E. Shaw, C.H. van Schie, A.L. Carrington, C.A. Abbott, A.J.
Boulton, An analysis of dynamic forces transmitted through the
foot in diabetic neuropathy, Diab. Care 21 (11) (1998) 1955–
1999.
[21] I.A. Stokes, I.B. Faris, W.C. Hutton, The neuropathic ulcer and
loads on the foot in diabetic patients, Acta Orthop. Scand. 46 (5)
(1975) 839–847.
[22] E.C. Katoulis, A.J. Boulton, S.A. Raptis, The role of diabetic
neuropathy and high plantar pressures in the pathogenesis of foot
ulceration, Horm. Metab. Res. 28 (4) (1996) 159–164.
[23] R.G. Frykberg, L.A. Lavery, H. Pham, C. Harvey, L. Harkless, A.
Veves, Role of neuropathy and high foot pressures in diabetic
foot ulceration, Diab. Care 21 (10) (1998) 1714–1719.
[24] G.C. Ctercteko, M. Dhanendran, W.C. Hutton, L.P. Le
Quesne, Vertical forces acting on the feet of diabetic patients
with neuropathic ulceration, Br. J. Surg. 68 (9) (1981) 608–
614.
[25] L. Uccioli, A. Caselli, C. Giacomozzi, V. Macellari, L. Giurato,
L. Lardieri, et al., Pattern of abnormal tangential forces in the
diabetic neuropathic foot, Clin. Biomech. (Bristol, Avon) 16 (5)
(2001) 446–454.
[26] Z. Pataky, J.-P. Assal, P. Conne, H. Vuagnat, A. Golay, Plantar
pressure distribution in type 2 diabetic patients without periph-
eral neuropathy and peripheral vascular disease, Diabet. Med. 22
(6) (2005) 762–767.
[27] D.G. Armstrong, L.A. Lavery, K. Holtz-Neiderer, M.J. Mohler,
C.S. Wendel, B.P. Nixon, et al., Variability in activity may
precede diabetic foot ulceration, Diab. Care 27 (8) (2004)
1980–1984.