Bata Shoe Company (Bangladesh) Limited - dhaka stock ...
13
2018 2017 March March Taka Taka Net Asset Value (NAV) 4,400,666,527 3,728,216,013 NAV Per Share 321.69 272.53 Earnings Per Share (EPS) 12.86 12.55 Net Operating Cash Flow Per Share (51.89) (36.77) Bata Shoe Company (Bangladesh) Limited Financial Highlights
-
Upload
khangminh22 -
Category
Documents
-
view
3 -
download
0
Transcript of Bata Shoe Company (Bangladesh) Limited - dhaka stock ...

2018 2017
March March
Taka Taka
Net Asset Value (NAV) 4,400,666,527 3,728,216,013
NAV Per Share 321.69 272.53
Earnings Per Share (EPS) 12.86 12.55
Net Operating Cash Flow Per Share (51.89) (36.77)
Bata Shoe Company (Bangladesh) Limited
Financial Highlights
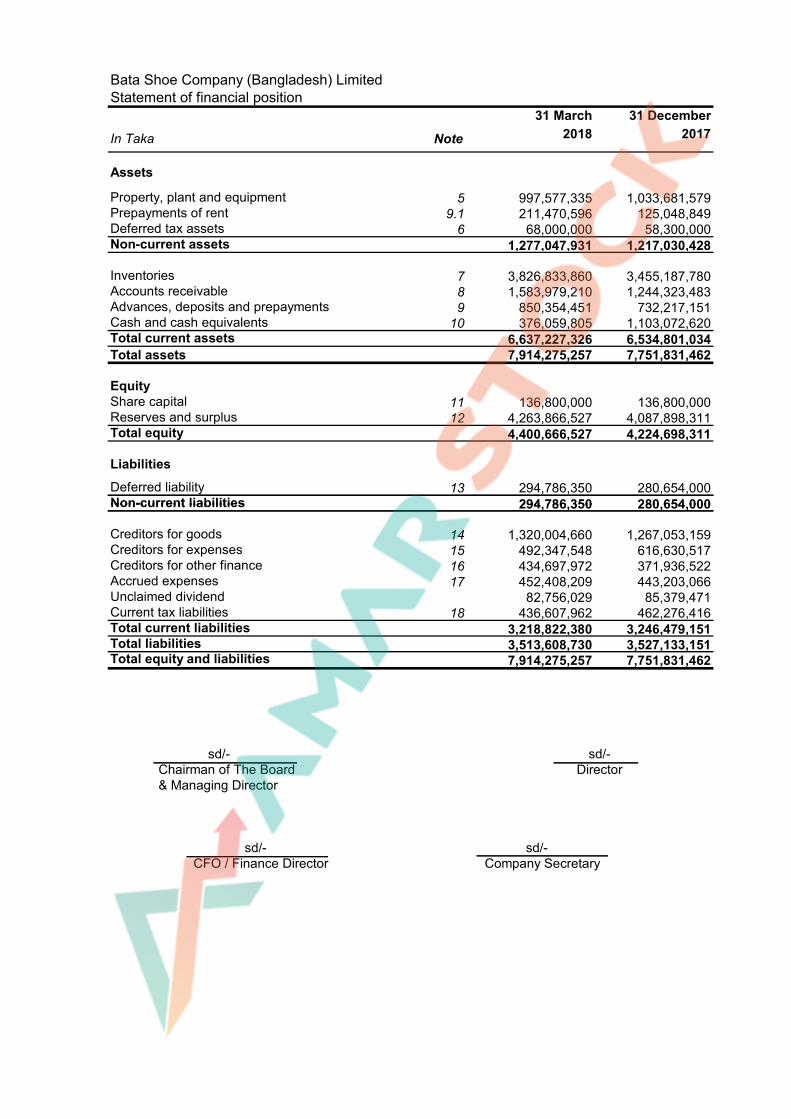
31 March 31 December
In Taka Note 2018 2017
Assets
Property, plant and equipment 5 997,577,335 1,033,681,579 Prepayments of rent 9.1 211,470,596 125,048,849 Deferred tax assets 6 68,000,000 58,300,000 Non-current assets 1,277,047,931 1,217,030,428
Inventories 7 3,826,833,860 3,455,187,780 Accounts receivable 8 1,583,979,210 1,244,323,483 Advances, deposits and prepayments 9 850,354,451 732,217,151 Cash and cash equivalents 10 376,059,805 1,103,072,620 Total current assets 6,637,227,326 6,534,801,034 Total assets 7,914,275,257 7,751,831,462
EquityShare capital 11 136,800,000 136,800,000 Reserves and surplus 12 4,263,866,527 4,087,898,311 Total equity 4,400,666,527 4,224,698,311
Liabilities
Deferred liability 13 294,786,350 280,654,000 Non-current liabilities 294,786,350 280,654,000
Bata Shoe Company (Bangladesh) LimitedStatement of financial position
Non-current liabilities 294,786,350 280,654,000
Creditors for goods 14 1,320,004,660 1,267,053,159 Creditors for expenses 15 492,347,548 616,630,517 Creditors for other finance 16 434,697,972 371,936,522 Accrued expenses 17 452,408,209 443,203,066 Unclaimed dividend 82,756,029 85,379,471 Current tax liabilities 18 436,607,962 462,276,416 Total current liabilities 3,218,822,380 3,246,479,151 Total liabilities 3,513,608,730 3,527,133,151 Total equity and liabilities 7,914,275,257 7,751,831,462
sd/- sd/-Chairman of The Board Director& Managing Director
sd/- sd/-CFO / Finance Director Company Secretary
Chartered Accountants

In Taka Note
Revenue 19 2,022,242,711 1,993,560,037 Cost of sales 20 (1,172,417,314) (1,165,847,537)Gross profit 849,825,397 827,712,500 Exchange gain(loss) 1,070,992 (1,078,126)Other income (loss) 21 (2,285,445) (383,628)Administration, selling and distribution expenses (596,011,634) (579,567,631)Operating profit 252,599,310 246,683,115 Finance income 22 3,214,705 4,969,078 Finance expense 23 (2,057,998) (1,200,000)Net finance income 1,156,707 3,769,078 Profit before contribution to WPPF 253,756,017 250,452,193 Contribution to workers' profit participation fund (12,687,801) (12,522,610)Profit before tax 241,068,216 237,929,583 Income tax expense (65,100,000) (66,300,000)Profit for the year 175,968,216 171,629,583 Other comprehensive income - - Total comprehensive income 175,968,216 171,629,583
Earnings per share:Basic & diluted earnings per share (par value Tk 10) in Taka 12.86 12.55
No diluted earnings per share is required to be calculated for the period as there was no potentially
Bata Shoe Company (Bangladesh) LimitedStatement of profit or loss and other comprehensive income
for the period ended 31 March
2018 2017
sd/- sd/-
Chairman of The Board Director
& Managing Director
sd/- sd/-CFO / Finance Director Company Secretary
- Chartered Accountants
No diluted earnings per share is required to be calculated for the period as there was no potentially dilutive ordinary shares during the period. So, both basic and diluted earning per share are same.

Non-Reserve on distributable
Share revaluation special General Retained Total
In Taka Capital of land reserve reserve earnings equity
Balance at 1 January 2018 136,800,000 60,631,183 998,620 48,863,000 3,977,405,508 4,224,698,311
Total comprehensive income Profit for the Period - - - - 175,968,216 175,968,216 Other comprehensive income - - - - - - Total comprehensive income - - - - 175,968,216 175,968,216 Transaction with owners Interim dividend 2018 - - - - - - Final dividend 2017 - - - - - -
Bata Shoe Company (Bangladesh) Limited
Statement of changes in equityfor the period ended 31 March 2018
Final dividend 2017 - - - - - - Balance at 31 March 2018 136,800,000 60,631,183 998,620 48,863,000 4,153,373,724 4,400,666,527
Non-Reserve on distributable
Share revaluation special General Retained TotalIn Taka Capital of land reserve reserve earnings equityBalance at 1 January 2017 136,800,000 60,631,183 998,620 48,863,000 3,309,293,627 3,556,586,430
Total comprehensive income Profit for the Period - - - - 171,629,583 171,629,583 Other comprehensive income - - - - - - Total comprehensive income - - - - 171,629,583 171,629,583 Transaction with owners Interim dividend 2017 - - - - - - Final dividend 2016 - - - - - - Balance at 31 March 2017 136,800,000 60,631,183 998,620 48,863,000 3,480,923,210 3,728,216,013
for the period ended 31 March 2017

In Taka
Cash flows from operating activitiesCash receipts from customers 1,682,815,848 1,543,763,722 Cash payments to and on behalf of employees (324,979,327) (332,567,004)Cash payments for deferred liabilities (4,544,756) (2,253,850)Cash payments to suppliers and contractors for goods and services (1,950,868,341) (1,617,017,049)Cash generated from operating activities (597,576,576) (408,074,181)
Interest received from STD account - 140,000 Income tax paid (112,263,260) (95,076,313)Net cash from operating activities (709,839,836) (503,010,494)
Cash flows from investing activitiesProceed from sales of property, plant and equipment 304,535 98,858 Acquisition of property, plant and equipment (14,854,072) (14,777,194)Net cash used in investing activities (14,549,537) (14,678,336)
Cash flows from financing activitiesDividend paid (2,623,442) (4,192,860)Net cash used in financing activities (2,623,442) (4,192,860)Net cash increase/(decrease) in cash and cash equivalents (727,012,815) (521,881,690)Cash and cash equivalents at 1 January 1,103,072,620 912,256,111 Cash and cash equivalents at 31 March 376,059,805 390,374,421
Bata Shoe Company (Bangladesh) LimitedStatement of cash flows
for the period ended 31 March2018 2017
Cash and cash equivalents at 31 March 376,059,805 390,374,421
Closing cash and cash equivalents have been arrived at as followsCash and cash equivalents 376,059,805 390,374,421
376,059,805 390,374,421

1. Reporting entity
2. Basis of accounting
Notes to the Financial Statements
Bata Shoe Company (Bangladesh) Limited (hereinafter referred to as ("Bata"/"the Company") is a publicCompany limited by shares. It was incorporated in Bangladesh in 1972 under the Companies Act 1913.The address of the registered office of the Company is Tongi, Gazipur, Bangladesh. The Company is oneof the operating companies of worldwide Bata Shoe Organization (BSO). The shares in the Company arelisted in both Dhaka Stock Exchange (DSE) and Chittagong Stock Exchange (CSE) and mostly held byBafin (Nederland) B.V. The financial year of the Company covers one year from 1 January to 31December.
The Company is mainly engaged in manufacturing and marketing of leather, rubber, plastic, canvasfootwear, hosiery and accessories items. Manufacturing plants of the Company are situated at Tongi andDhamrai.
The financial statements have been prepared in accordance with Bangladesh Financial ReportingStandards (BFRS), the Companies Act 1994, the Securities and Exchange Rules 1987 and otherapplicable laws and regulations.
The titles and format of these financial statements follow the requirements of BFRSs which are to someextent different from the requirements of the Companies Act 1994. However, such differences are notmaterial and in the view of management BFRSs titles and format give better presentation to theshareholders.
3. Functional and presentational currency
4. Use of judgments and estimates
These financial statements are presented in Bangladesh Taka (Taka/Tk) which is both functional andpresentational currency of the Company. The amounts in these financial statements have been roundedoff to the nearest Taka .
In preparing these financial statements, management has made judgments, estimates and assumptionsthat affect the application of company's accounting policies and the reported amounts of assets,liabilities, income and expenses. Actual results may differ from these estimates.
shareholders.
Estimates and underlying assumptions are reviewed on an ongoing basis. Revision to estimates arerecognised prospectively.

B. Assumptions and estimation uncertainties
Note 5 Property, plant & equipment
Note 6 Deferred tax assets (liabilities)Note 7 InventoriesNote 8 Accounts receivableNote 13 Deferred liabilityNote 18 Current tax liabilities
C. Measurement of fair values
A number of the Company’s accounting policies and disclosures require the measurement of fair values,for both financial and non-financial assets and liabilities.
The Company has an established control framework with respect to the measurement of fair values.Management has the overall responsibility for overseeing all significant fair value measurements,
A. Judgments
Information about judgments made in applying accounting policies that have the most significant effectson the amounts recognised in the financial statements is included in the following note:
Information about assumptions and estimation uncertainties that have a significant risk of resulting in amaterial adjustment in the period ending 31 March 2018 is included in the following notes:
• Level 1: quoted prices (unadjusted) in active markets for identical assets or liabilities.
When measuring the fair value of an asset or a liability, the Company uses market observable data as faras possible. Fair values are categorised into different levels in a fair value hierarchy based on the inputsused in the valuation techniques as follows.
• Level 2: inputs other than quoted prices included in Level 1 that are observable for the asset or liability,either directly (i.e. as prices) or indirectly (i.e. derived from prices).
• Level 3: inputs for the asset or liability that are not based on observable market data (unobservableinputs).
If the inputs used to measure the fair value of an asset or a liability might be categorised in differentlevels of the fair value hierarchy, then the fair value measurement is categorised in its entirety in thesame level of the fair value hierarchy as the lowest level input that is significant to the entiremeasurement.
The Company recognises transfers between levels of the fair value hierarchy at the end of the reportingperiod during which the change has occurred.
Management has the overall responsibility for overseeing all significant fair value measurements,including Level 3 fair values.
Management regularly reviews significant unobservable inputs and valuation adjustments. If third partyinformation, such as broker quotes or pricing services, is used to measure fair values, then the valuationteam assesses the evidence obtained from the third parties to support the conclusion that suchvaluations meet the requirements of BFRS, including the level in the fair value hierarchy in which suchvaluations should be classified.

5. Property, plant and equipment
In Taka
CostBalance at 1 January 2017 86,057,856 387,878,141 826,246,342 14,450,909 897,699,329 4,136,167 2,216,468,744 Additions - 4,023,917 9,139,484 8,901,880 158,924,819 41,399,210 222,389,310 Transfers - - - - - (11,511,046) (11,511,046)Disposals - - - - (43,900,319) - (43,900,319)Balance at 31 December 2017 86,057,856 391,902,058 835,385,826 23,352,789 1,012,723,829 34,024,331 2,383,446,689
Balance at 1 January 2018 86,057,856 391,902,058 835,385,826 23,352,789 1,012,723,829 34,024,331 2,383,446,689 Additions - - - - 11,930,603 2,923,469 14,854,072 Transfers - - - - - - - Disposals - - - - (15,400,067) - (15,400,067)Balance at 31 March 2018 86,057,856 391,902,058 835,385,826 23,352,789 1,009,254,365 36,947,800 2,382,900,694
Accumulated depreciation
Notes to the financial statements (continued)
Freehold land Building
Plant and
machinery Vehicles
Furniture,
fixtures and
office equipment Total
Under
construction
Accumulated depreciation
Balance at 1 January 2017 - 204,995,979 542,145,029 14,450,909 469,637,017 - 1,231,228,934 Depreciation for the year - 8,107,549 37,571,697 1,780,376 103,456,021 - 150,915,643 Adjustment for disposal/transfers - - - - (32,379,467) - (32,379,467)Balance at 31 December 2017 - 213,103,528 579,716,726 16,231,285 540,713,571 - 1,349,765,110
Balance at 1 January 2018 - 213,103,528 579,716,726 16,231,285 540,713,571 - 1,349,765,110 Depreciation for the year - 2,449,388 14,135,298 1,167,639 30,297,296 - 48,049,621 Adjustment for disposal/transfers - - - - (12,491,372) - (12,491,372)Balance at 31 March 2018 - 215,552,916 593,852,024 17,398,924 558,519,495 - 1,385,323,359
Carrying amounts
At 31 December 2017 86,057,856 178,798,530 255,669,100 7,121,504 472,010,258 34,024,331 1,033,681,579 At 31 March 2018 86,057,856 176,349,142 241,533,802 5,953,865 450,734,870 36,947,800 997,577,335
5.1 Allocation of depreciation
2018 2017In Taka 31-Mar 31-Mar
Cost of sales 11,397,556 11,263,810 Administration, selling and distribution expenses 36,652,065 32,031,470
48,049,621 43,295,280
The Company revalued its land of Tongi factory at 1979 by Tk. 60,631,183.
Building includes properties at 24 Bangabandhu Avenue, Dhaka which were purchased in 1985 from the Government of Bangladesh at a cost of Tk 5,344,417. Sale deed is yet to beexecuted.

6. Deferred tax assets (liabilities)
2018 Recognised
Net balance in profit Deferred tax Deferred taxIn Taka at 1 January or loss Net assets liabilities
Property, plant and equipment (38,060,100) (5,694,127) (32,365,973) - (32,365,973)Deferred rent 11,552,109 109,996 11,442,113 11,442,113 Deferred liability 70,163,448 (3,533,140) 73,696,588 73,696,588 - Bad & doubtful debt provision 7,311,939 - 7,311,939 7,311,939 - Personal account provision 7,327,670 - 7,327,670 7,327,670 - Rounded off 4,934 (582,729) 587,663 587,663 - Deferred tax assets (liabilities) 58,300,000 (9,700,000) 68,000,000 100,365,973 (32,365,973)Net deferred tax assets 68,000,000
2017 RecognisedNet balance in profit Deferred tax Deferred tax
In Taka at 1 January or loss Net assets liabilities
Property, plant and equipment (46,620,914) (8,560,814) (38,060,100) - (38,060,100)Deferred rent 10,170,022 (1,382,087) 11,552,109 11,552,109 Deferred liability 70,145,658 (17,790) 70,163,448 70,163,448 - Bad & doubtful debt provision 6,599,115 (712,824) 7,311,939 7,311,939 - Personal account provision 6,633,215 (694,455) 7,327,670 7,327,670 - Rounded off 72,904 67,970 4,934 4,934 - Deferred tax assets (liabilities) 47,000,000 (11,300,000) 58,300,000 96,360,100 (38,060,100)Net deferred tax liabilities 58,300,000
7. Inventories
In Taka Note 2018 2017
31-Mar 31-Dec
Notes to the financial statements (continued)
Balance as at 31 March
Balance as at 31 December
31-Mar 31-Dec
Raw materials 552,085,788 324,655,896 Work in process 63,254,775 77,583,729 Finished goods 3,211,493,297 3,052,948,155
3,826,833,860 3,455,187,780
8. Accounts receivable
In Taka Note 2018 2017
31-Mar 31-DecTrade receivables
- Export customers - Non BSO companies 1,328,773 1,325,144 - Export customers - BSO companies 898,817 - - Receivables from dealers 1,561,640,968 1,238,267,940 - Receivables from footin customers - 53,422 - Receivables from institutional sale 34,702,606 19,497,795
1,598,571,164 1,259,144,301 Other receivables
- Interest receivable 6,770,080 3,555,375 - VAT claims 4,439,522 4,820,272 - Insurance claim 3,446,200 6,051,291
14,655,802 14,426,938 1,613,226,966 1,273,571,239
Provision for doubtful debts 9.1 (29,247,756) (29,247,756) 1,583,979,210 1,244,323,483
8.1 Provision for doubtful debts
In Taka Note 2018 2017
31-Mar 31-Dec
Balance as at 1 January 29,247,756 26,396,461 Provision made / (reverse) during the year/period - 2,851,295 Balance as at 31 December 29,247,756 29,247,756
9. Advances, deposits and prepayments

Notes to the financial statements (continued)
In Taka Note 2018 2017
31-Mar 31-DecAdvances (considered good) to:
Agents and employees 21,083,275 20,012,623 Suppliers against materials and services 5,454,357 3,030,475
26,537,632 23,043,098 Security and other deposits 724,307,706 576,826,361 Prepayments to landlords-current portion 9.1 99,509,113 132,347,692
850,354,451 732,217,151
9.1 Prepayments of rent
In Taka Note 2018 2017
31-Mar 31-Dec
Prepayments to landlords 310,979,709 257,396,541 Less: Current portion 10 99,509,113 132,347,692 Non-current portion 211,470,596 125,048,849
10. Cash and cash equivalents
In Taka Note 2018 2017
31-Mar 31-Dec
Cash in hand 63,288 6,846 Cash at bank 124,996,517 949,065,774 Fixed deposit 251,000,000 154,000,000
376,059,805 1,103,072,620
11. Share capital
Taka in million Note 2018 2017
31-Mar 31-DecAuthorised:
20,000,000 ordinary shares of Tk 10 each 200,000,000 200,000,000 200,000,000 200,000,000
Issued, subscribed and paid up:2,850,723 ordinary shares of Tk 10 each issued for cash 28,507,230 28,507,230
10,829,277 ordinary shares (including 7,202,400 bonus shares)of Tk 10 each issued for consideration other than cash 108,292,770 108,292,770
136,800,000 136,800,000
12. Reserves and surplus
In Taka Note 2018 2017
31-Mar 31-Dec
Reserve on revaluation of land 60,631,183 60,631,183 Non-distributable special reserve 13.1 998,620 998,620 General reserve 48,863,000 48,863,000 Retained earnings 13.2 4,153,373,724 3,977,405,508
4,263,866,527 4,087,898,311
12.1 Non-distributable special reserve
12.2 Retained earnings
In Taka Note 2018 2017
31-Mar 31-Dec
Balance as at 1 January 3,977,405,508 3,309,293,627 Profit for the year/period 175,968,216 1,126,391,881 Interim dividend - (314,640,000)Final dividend - (143,640,000)
This represents 90% of the cumulative post-tax profit in respect of certain categories of income up to 1992 as defined anddirected by Bangladesh Bank. Since 1993, the requirement for continuing to create such special reserve is applicable only to the profit on sale of immovable assets such as land, buildings etc.
Final dividend - (143,640,000) 4,153,373,724 3,977,405,508
13. Deferred liability

Notes to the financial statements (continued)
In Taka Note 2018 2017
31-Mar 31-Dec
Balance as at 1 January 280,654,000 280,582,630 Add: Provision made / (reversed) during the year/period 18,677,106 76,000,349
299,331,106 356,582,979 Less: Paid during the year 4,544,756 75,928,979
294,786,350 280,654,000
14. Creditors for goods
In Taka Note 2018 2017
31-Mar 31-Dec
Payable to local suppliers 1,285,592,311 1,258,248,373 Payable to Foreign suppliers - - Payable to BSO companies 34,412,349 8,804,786
1,320,004,660 1,267,053,159
15. Creditors for expenses
In Taka Note 2018 2017
31-Mar 31-Dec
Payable to local suppliers 126,459,937 147,690,280 Payable to Foreign suppliers 3,266,789 2,670,788 Payable to Global Footwear Services 132,678,000 104,546,400 Payable to BSO companies 229,942,822 361,723,049
492,347,548 616,630,517
16. Creditors for other finance
In Taka Note 2018 2017
31-Mar 31-Dec
Workers' profit participation fund 100,829,847 83,593,646 Personal accounts of employees and agents 85,920,552 87,060,001 Security and other deposits 72,104,554 72,931,902 Provident fund 7,449,818 8,991,187 Tax deducted at source 44,031,997 57,342,480 Pension fund 827,131 642,111 VAT deducted at source 24,804,692 1,185,030 Salary and wages payable 50,998,010 22,106,806 Others 47,731,371 38,083,359
434,697,972 371,936,522
17 Accrued expenses
In Taka Note 2018 2017
31-Mar 31-Dec
Bonus 113,139,794 81,000,000 Utility 11,852,846 7,600,000 Legal & audit fee 4,099,905 3,321,300 Royalty 33,006,771 45,710,404 Joint venture commission 6,656,276 8,683,575 Other accrued liabilities 283,652,617 296,887,787
452,408,209 443,203,066
18. Current tax liabilities
In Taka Note 2018 2017
31-Mar 31-Dec
Income tax paid 75,640,601 271,423,979 Provision for income tax 512,248,563 733,700,395
436,607,962 462,276,416

19. RevenueFirst quarter First quarter
ended ended
In Taka 31-Mar-18 31-Mar-17
Local
Shoe 1,920,434,767 1,891,839,288
Hosiery & accessories 97,789,806 97,942,577
Export 4,018,138 3,778,172
2,022,242,711 1,993,560,037
20 Cost of goods soldFirst quarter First quarter
ended ended
In Taka 31-Mar-18 31-Mar-17
Opening stock of finished goods 3,052,948,155 2,333,669,427
Add: Cost of goods manufactured (Note 20.1) 951,700,474 1,060,789,849
Finished goods purchased 379,261,982 492,580,794
4,383,910,611 3,887,040,070
Less: Closing stock of finished goods 3,211,493,297 2,721,192,533 Less: Closing stock of finished goods 3,211,493,297 2,721,192,533
1,172,417,314 1,165,847,537
20.1 Cost of goods manufactured
Cost of materials consumed (Note 20.1.1) 710,391,719 835,974,760
Direct wages 125,421,375 131,494,104
835,813,094 967,468,864
Manufacturing overhead 101,558,425 98,749,196
Difference in work in process:
Work in process at beginning 77,583,729 61,818,628
Work in process at closing 63,254,774 67,246,839
14,328,955 (5,428,211)
Cost of goods manufactured 951,700,474 1,060,789,849
20.1.1Cost of materials consumed
Opening stock of raw materials 324,655,896 383,180,358
Add: Purchase 937,899,663 917,093,619
Materials available for use 1,262,555,559 1,300,273,977
Less: Sale proceeds of wastage scrap 78,052 -
1,262,477,507 1,300,273,977
Less: Closing stock of raw materials 552,085,788 464,299,217
710,391,719 835,974,760

21. Other incomeFirst quarter First quarter
ended ended
In Taka 31-Mar-18 31-Mar-17
Gain/(loss) on disposal of property, plant and equipment (2,604,160) (484,262)
Discount for early payment 318,715 100,634
(2,285,445) (383,628)
22. Finance income
First quarter First quarter
ended ended
In Taka 31-Mar-18 31-Mar-17
Interest on short term deposit - 3,214,705 4,969,078
23. Finance expenses
First quarter First quarterFirst quarter First quarter
ended ended
In Taka 31-Mar-18 31-Mar-17
Interest on personal account - 2,057,998 1,200,000