University of Dhaka - CRP BANGLADESH
107
KNOWLEDGE, ATTITUDE AND BARRIER TO EVIDENCE – BASED PRACTICE AMONG PHYSIOTHERAPISTS IN SELECTED DISTRICTS OF NEPAL By Shristi Bajracharya ©2018 Shristi Bajracharya Submitted in Partial Fulfillment of the Requirements for the Degree of MSc in Rehabilitation Science June 2018 Bangladesh Health Professions Institute (BHPI) Faculty of Medicine University of Dhaka
-
Upload
khangminh22 -
Category
Documents
-
view
0 -
download
0
Transcript of University of Dhaka - CRP BANGLADESH

KNOWLEDGE, ATTITUDE AND BARRIER TO EVIDENCE –
BASED PRACTICE AMONG PHYSIOTHERAPISTS IN
SELECTED DISTRICTS OF NEPAL
By
Shristi Bajracharya
©2018 Shristi Bajracharya
Submitted in Partial Fulfillment of the Requirements for the Degree of
MSc in Rehabilitation Science
June 2018
Bangladesh Health Professions Institute (BHPI) Faculty of Medicine
University of Dhaka

SUPERVISOR’S STATEMENT
As the supervisor of Ms Shristi Bajracharya's Thesis work, I certify that I consider her
thesis “Knowledge, Attitude and Barrier to Evidence Based Practice among
Physiotherapists in selected districts of Nepal” to be suitable for examination.
………………………
Mohammad Anwar Hossain
Associate Professor
Department of Physiotherapy
BHPI
(Supervisor)
Date:


DECLARATION
• This work has not previously been accepted in substance for any degree and is not
concurrently submitted in candidature for any degree.
• This dissertation is being submitted in partial fulfillment of the requirements for the
degree of MSc in Rehabilitation Science.
• This dissertation is the result of my own independent work/investigation, except
where otherwise stated. Other sources are acknowledged by giving explicit
references.
A Bibliography is appended.
• I confirm that if anything identified in my work that I have done plagiarism or any
form of cheating that will directly awarded me fail and I am subject to disciplinary
actions of authority.
• I confirm that the electronic copy is identical to the bound copy of the Thesis.
Signature:
Name: Shristi Bajracharya
Date:

i
ACKNOWLEDGEMENT
In the beginning, I would like to remember almighty for providing me with all the
strength in order to complete this study. Secondly I would like to thank my family
members for all the support and inspiration throughout the study. Then, I gratefully
acknowledge my honorable supervisor, Mohammad Anwar Hossain, BHPI, CRP,
Savar for his valuable supervision, guidance and feedback during study period.
I would also like to thank Nepta-Nepal. the professional body under World
Confederation of Physical Therapy for providing all the necessary help, from giving
information of the hospitals and rehabilitation centres to suggesting me in the study
and also in the process of distribution of the questionnaire to different districts as
well.
Additionally, I am thankful to all of my honorable teachers specially course
coordinator and Assistant Professor, Muhammad Millat Hossain, Department of
Rehabilitation Science , S.J.M. Ummul Ambia, Lecturer- Department of
Rehabilitation Science, Shamima Islam Nipa, Lecturer- Department of Rehabilitation
Science for their support and guidance throughout the study period.
I also would like to thank all of my friends for their direct and indirect inspiration,
suggestion as well as support. If it was not for working together in a group with the
friends, it would not have been better and fun..I would also like to thank all the
Physiotherapists who took time out of their busy schedule in order to fill in the
questionnaire.

ii
TABLE OF CONTENTS
Acknowledgement i
Table of Contents ii
List of Figures iii-iv
List of Tables v
List of Annexes vi
List of Abbreviations and Acronyms vii
Abstract viii-ix
CHAPTER I: INTRODUCTION
1.1 Background 1-3
1.2 Justification 4
1.3 Research question 5
1.4 Operational definition 6
CHAPTER II: LITERATURE REVIEW 7-16
CHAPTER III: RESEARCH METHODOLOGY
3.1 Conceptual framework 17
3.2 Study Objectives 18
3.2.1 General Objective 18
3.2.2 Specific objective 18
3.3 Study design 19
3.4 Study Population 19
3.5 Study area/Study site 19
3.6 Study Period 19
3.7 Sample size determination 20-21
3.8 Inclusion &Exclusion criteria 21
3.9 Sampling Technique 21-22
3.10 Data collection tool 23

iii
3.11 Data collection technique 24-25
3.12 Data analysis, Data management 25-28
3.13 Quality control, Quality assurance 28
3.14 Ethical Consideration 29
CHAPTER-IV :RESULTS
4 Socio-Demographic Characteristics of Respondents
4.1 Gender of Physiotherapists 30
4.2 Age of Physiotherapists 31
4.3 Specialization level of Physiotherapists 32
4.4 Number of years working as a Physiotherapists 33
4.5 Number of patients seen in a day 34
4.6 Number of Physiotherapists working in area of practice 35
4.7 Number of Physiotherapists on basis of area of practice
35
4.8 Majority of Patients Treated 36
4.9 Percentage of time spent in patient care 37
4.10 Percentage of time spent in reading scientific article 38
4.11 Representation of gender and age of Physiotherapists 39
4.12 Representation of gender and number of hours worked per week 40
4.13 Measure of attitudes and belief of Evidence Based Practice 41-42
4.14 Association between attitudes and demographics 43-44
4.15 Binary logistic regression for attitudes and factors associated with it 45-46
4.16 Measures of skills ,education and knowledge for EBP 47-48
4.17 Association Between Knowledge and Demographics 49-50
4.18 Binary logistic regression for knowledge skills and factor associated
with it
51-53
4.19 Self-reported knowledge regarding research terms 54
4.20 Measure of understanding of terms among respondents 55

iv
4.21 Logistic regression between understanding of research terms and
demographics
56
4.22 Respondents understanding and use of practice guidelines 57
4.23 Attention to Literature 58-59
4.24 Association between attitude and attention to literature
60
4.25 Access and Availability of resource to access information
61-62
4.26 Barriers towards Evidence Based Practice
63-65
CHAPTER –V :DISCUSSION 66-71
5.1 Limitation 72
CHAPTER-VI: CONCLUSION &RECOMMENDATION 73-74
References 75-80
Annexes
Annex-I Informed consent i
Annex-II Questionnaire ii-xii
Annex-III Approval Letter xiii
Annex-III Approval of thesis proposal xiv

v
LIST OF FIGURES
Figure 1 Distribution of respondents by Gender ....................................................... 30
Figure 2 Distribution of respondents by age ............................................................ 31
Figure 3 Distribution of respondents by specialization level..................................... 32
Figure 4 Distribution of respondents by area of practice........................................... 35
Figure 5 Distribution of respondents by majority of patients treated ......................... 36
Figure 6 Distribution of respondents by percentage of time spent in patient care ...... 37
Figure 7 Distribution of respondent by percentage of time spent in reading scientific
article ..................................................................................................................... 38
Figure 8 knowledge regarding research terms .......................................................... 54
Figure 9 Respondents understanding and use of practice guidelines ......................... 57
Figure 10 Self-reported articles read per month........................................................ 58
Figure 11Self reported use of Evidence .................................................................... 59
Figure 12 Access to search engines at place of work ................................................ 61
Figure 13 Access to search engines away from work……………………………………………………61
Figure 14 Respondents work support for research practice ....................................... 62
Figure 15 Self-reported ranking of barrier to Evidence Based Practice ..................... 63

vi
LIST OF TABLES
Table 1 Distribution of number of years working as a
Physiotherapist……………………………………………………………..33
Table 2 Distribution of number of hours worked per week ....................................... 33
Table 3 Distribution of number of patients seen in a day ......................................... 34
Table 4 Distribution of number of Physiotherapists working in area of practice ...... 34
Table 5 Representation of Gender and age of Physiotherapists ................................ 39
Table 6 Representation of Gender & no of hours worked per week ....................... 40
Table 7 Measure of attitude and belief towards EBP………………………………..47
Table 8 Association between attitude and demographics…………………………...41
Table 9 Binary logistic regression analysis for attitude and factors associated with
the respondent ........................................................................................... 43
Table 10 Measure of skills and knowledge required for Evidence Based Practice ... 45
Table 11 Association between knowledge and demographic variable ...................... 47
Table 12 Binary logistic regression analysis for skills, knowledge and factors
associated with the respondent ................................................................................. 51
Table 13 Knowledge regarding research terms ........................................................ 55
Table 14 Logistic regression analysis between understanding of the research terms
and demographic variables ...................................................................................... 56
Table 15 Association between attitude and attention to literature
................................................................................................................................ 60

vii
List of abbreviations
EBP: Evidence Based Practice
EBPT: Evidence Based Physical Therapy
NHPC: Nepal Health Professional Council
NHRC: Nepal Health Research Council
PT: Physical Therapy
SPSS: Statistical Package for Social Sciences
WCPT: World Confederation of Physical Therapy
χ2
: Chi square

viii
Abstract
Introduction
Evidence based Practice is the conscientious, explicit and judicious use of current best
evidence in making decisions about the care of individual patients (conscientious: based
on principles, explicit: clear, judicious: sensible) (Sackett et al., 1996). Evidence based
practice was started from 1990 in Physiotherapy and in Nepal from 2010 (Hoffman et al.,
2010).
Objective: The objective of the study was to determine the level of Knowledge, Attitude
and Barriers towards Evidence Based practice among physiotherapists
Methods: A cross-sectional study was carried out. Sample size consisted of 164
Physiotherapists. Data were collected from the Physiotherapists working in different
hospitals and rehabilitation centers of Nepal. The questionnaire was adapted from the
standard questionnaire by Jette et al and Yahui & Swaminathan. Self-reported
questionnaires were distributed and collected later. Data were analyzed using SPSS
.Mainly descriptive and inferential statistics were used and Chi-square tests and multiple
logistic regression analysis were carried out.
Results
It was found that the Physiotherapists had positive attitude towards EBP with 95.2%
agreeing or strongly agreeing that EBP is necessary in practice of Physical Therapy and
also overall total mean score of 34.73(72.35%) out of 48 and overall mean 2.8 out of 4.It
was also found that Physiotherapists had moderate knowledge towards Evidence Based
Practice with overall total mean score of 19.18(68.5%) out of 28 and overall mean of 2.74
out of 4.Only 68.3% of the respondents agreed the fact that they were confident in their
ability to critically review professional literature. It was found that those having
specialization degree had five times greater knowledge than without specialization. They
tend to be more familiar with the research terms. The respondents seemed to have good
understanding of research terms with maximum of the respondents not understanding the
term odds ratio. Availability of search engines at home and away from home were similar.
Significant associations were seen between knowledge, attitude and specialization level,
gender, facility at which Physiotherapist work and number of patients seen in a day. It was
found that only 32.3% of the Physiotherapists read less than 2 articles in a month. Major

ix
barrier to Evidence based practice were obtained insufficient time and traditional methods
of treatment.
Conclusion & Discussion
Physical Therapists of Nepal stated they had positive attitude towards Evidence-Based
Practice with majority of the Physiotherapists interested in learning more about the topic.
They were of the opinion that they needed to increase the use of evidence in practice. They
thought major barrier as insufficient time hence continuous professional development
trainings that incorporate EBP were of greater importance.
Key words: Knowledge, Attitude, Barrier, Evidence-Based Practice

Page 1 of 80
Chapter-I: INTRODUCTION
1.1 Background
Evidence based Practice is the conscientious, explicit and judicious use of current best
evidence in making decisions about the care of individual patients (conscientious: based
on principles, explicit: clear, judicious: sensible) (Sackett et al., 1996). “According to
Bohannon & Le Veau (1986), the objective of human service professions is such as
Physiotherapy is to improve the status of patient or client and all interventions aimed at
achieving this goal should be found on knowledge that is research based”. It seems that the
importance of Evidence based practice had been recognized long back and has been
emphasized since two decades by many authors (Turner & Whitfield, 1997).
According to definition of WHO, Physiotherapists assess, plan and implement; rehabilitate
programs that improve or restore human motor functions, maximize movement ability,
relieve pain syndromes and treat or prevent physical challenges associated with injuries,
disease and other impairments (WHO, 2013). It has been seen that professionals in clinical
healthcare welcome Evidence Based Practice although there are numerous chances for
actual bedside application for EBP and numerous improvements regarding Evidence
Based Practice (Ubbnik et al., 2018).
Physiotherapy started in Nepal during 1970’s with the specialists from India and abroad
providing basic training to few number of Nepalese. In 1983 Institute of Medicine under
Tribuhan University started Diploma course (NEPTA, 2017).The course continued from
1983 to 1990 producing 50 Diploma level Physiotherapist. At 1990 few organizations also
provided 3 months Primary Rehabilitation Training. Kathmandu University in 2002 again
started 3 years Diploma level course. It produced about 90 Physiotherapists until 2009.
After that, keeping in mind about the world scenario and in order to improve the level of
the course; Kathmandu University stopped Diploma level course and started the first ever
Bachelor’s degree in Physiotherapy in 2000(NEPTA, 2017).
Evidence based practice started from 1990 in Physiotherapy and in Nepal from 2010
(Hoffman et al., 2010). Physiotherapy profession in Nepal has been an emerging
professions with 2000 Physical therapists registered under NHPC (Nepal Health
Professional Council). There is no research regarding the application of Evidence Based

Page 2 of 80
Practice among Physiotherapists in Nepal. Evidence Based Practice is one of the most
important aspect these days in any profession. It is much preferred all over the world
.Hence, in order to develop the base of evidence based practice, it is important to know
about the knowledge and attitude regarding evidence based practice and also the major
barriers regarding practice of Evidence-Based Practice (Grol & Wensing, 2004). Evidence
Based Practice involves the integration of the best available research evidence with
clinical expertise and patient values and circumstances to make best decision regarding
patient care. As the evidence based practice expands, it is important to assess if the
rehabilitation professionals are able to locate, evaluate as well as apply evidence to guide
practice (Ubbnik et al., 2017).
World Confederation of Physical Therapists (2003) declared a policy statement on EBP, in
which they stated that “Physical therapists have a responsibility to use evidence to inform
practice and ensure that the management of patients/clients, carers and communities is
based on the best available evidence”. Evidence based Practice mainly comprises of
5A’s.They are Ask, Assess, Acquire, Appraise and Apply. Any hindrances in one of the
process would result in the barrier to evidence based practice (Condon et al., 2016).
Numerous barriers have been experienced by the therapists for evidence based practice.
Numerous researches have been carried out in the Western countries but there still exists
lack of enough research regarding Evidence based practice in Nepal. Evidence Based
Practice mainly bridges the gap between practice and research. It is of much importance to
move from opinion based practice to evidence based practice. EBP is one marker for life-
long learning (Ramirez-velez et al., 2015). It needs patient-centered learning which is
totally lacking in developing countries. Applying EBP in practice is very essential. It
should be recognized and practice through Evidence-Based policies to make it happen.
There certainly are problem of adherence among the seniors. Habits are hard to change
(Grol & Wensing, 2004) .Sometimes it takes lifetime to implement and take it to action for
real life. Knowing alone is not enough, we must apply and implement. So, in order to
bring it into practice, we need to act and have good appraisal skills and also ability to
criticize own practice and attitude to evidence base (Hakkennes & Dodd, 2008).
One of the major barriers to Evidence based practice in Nepal is also the limited research
due to lack of funding, poor health research planning and policies, lack of proper training
and underdeveloped research culture (Teijlingen, 2015). The main barrier to EBP could be

Page 3 of 80
inaccessibility as well. Unavailability of computer facilities and internet except in the
bosses’ office produces great challenge towards the practice. On the other hand, in the
developed countries, use of outdated books has minimized due to availability and
accessibility of information technology. Computer and information technology has been
an essential component for faster patient care (Grol & Wensing, 2004).
According to earlier studies in England, Canada and USA, it was hypothesized that
differences may exists on the basis of year since graduation and the level of education
attained (Iles et al., 2006).
Research skills and understanding of research terms are one of the most important factor
towards evidence based practice. Although many Physiotherapists have explained about
the complete understanding of the research terms but McColl et al. (1998) found out that
the Physiotherapists that said could understand the terms were not able to explain it
satisfactorily as that required for the teaching The study also suggested that five steps of
Evidence Based Practice as those proposed in literature has not been followed by the
Physiotherapists due to lack of time as the major barrier, even after understanding about
their importance (Iles et al., 2006).
According to the literature by Upton & Lewis (1999), the dual concept of Evidence-Based
Practice and clinical effectiveness became increasingly important in health care in those
years that government developed plans for establishment of national Institute for Clinical
Excellence in UK.

Page 4 of 80
1.2 Justification
Evidence-Based Practice is most accepted method for clinical as well as rehabilitation
practice but there is no information regarding knowledge of Evidence based practice,
hence this needs to be carried out in Nepal as well. There is huge discrepancy between the
amount of research evidence that exists and the use of this evidence within clinical health
practice. No evidence has been shown in Nepal as such but research in Canada has shown
that more than 40% of the patients do not get evidence based care. It is shown that more
that 20% of provided care is unnecessary or potentially harmful for the patients. An
investigation carried out in Sweden revealed that 8.6% of patients were injured in hospital
care due to lack of actual knowledge. In order to reduce such injuries evidence based
practice needs to be implemented. According to by Ploeg and others, there are several
factors affecting the implementation of Evidence-based Practice such as health care
provider’s attitude, beliefs, support, and integration of recommendation at organizational
level. It has been stated that it is important to understand about the barriers to carry out
specific activity for proper implementation of it. Research work that is carried out in Nepal
is very few and regarding Evidence Based Practice, no research work has been carried out
till this date. It is quite important to be updated with research and for that Evidence Based
Practice needs to be brought into focus. Only with proper research health professionals can
be updated regarding various practices as it has been seen that whatever taught as
important at one aspect of time no longer remained important in 15 years of time later on.
Rehabilitation Professionals as well as health professionals require right attitude,
knowledge and confidence to carry out evidence based practice.

Page 5 of 80
1.3 Research Question
What is the level of knowledge, attitudes and barriers to evidence based practice in Nepal?

Page 6 of 80
1.4 Operational Definition
Evidence Based Practice
Evidence Based Practice incorporates current best evidence with the therapists experience
and patient’s decision making for the sake of better patient care.
Attitude
Attitude is way of thinking towards someone or something which can be seen in
someone’s behavior. It is manner, disposition, and feeling, position with regard to person
or thing.
Knowledge
Knowledge can be defined as the understanding of the subject or facts that one obtains
from understanding or education. Not only the attainment of knowledge but the
organization of knowledge is the most important aspect. For performance of better results
utilization of knowledge is considered important.
Barrier
Barrier can be explained as any obstacle faced by an individual towards performing a
certain act. Barrier is hindrance faced in performance of the certain activity. In case of the
research, the major barrier towards evidence based practice are time constraints, lack of
resources
Physiotherapist
Physiotherapists are the health care professionals who assess, diagnose and treat patients
to prevent any form of disability or disease. Physiotherapists work in various clinical
setting or rehabilitation centers. Some Physiotherapists even have started their services in
community. It has been a new profession in developing countries. People have slowly
started understanding the importance of Physiotherapy .The profession still needs to be
integrated and research is one of the important aspect for upliftment of the profession.

Page 7 of 80
Chapter II: LITERATURE REVIEW
Evidence Based Medicine
Evidence based Medicine is mainly about integrating individual clinical expertise and the
best clinical experience. Its philosophical origin extends back to mid 19th century Paris
earlier and remains a hot topic for clinician’s, public health practitioners, purchasers,
planners and the public. “Criticism to Evidence Based Practice has been from being old
hat to it being dangerous innovation perpetrated by the arrogant to serve cost cutters and
suppress clinical freedom.” It was said that good doctors used both individual clinical
expertise and the best available external evidence and neither one alone is enough (Sackett
et.al, 1996).
Evidence Based Practice
The new approaches to clinical decision making and practice that is the Evidence Based
Practice has come as a new paradigm shift towards health care practice (Swinkels et al.,
2002).The conceptual philosophical idea of Evidence based Practice evolves from
Evidence based Medicine and date back to 19th century (Sackett at al., 1996).However Mc
Master University in Ontario, Canada actively promoted Evidence Based practice in early
1990s and called it paradigm shift towards medicine (Turner, 2001). Evidence Based
Practice is therefore new shift to decision making about patient care that de-emphasizes
intuitions, routine and unsystematic clinical experiences which by its nature relies on
decisions based on past experiences and or knowledge that was acquired years ago in
undergraduate and professional development courses as sufficient grounds for clinical
decision making (O Brien, 2001). Rather it stresses the use of high quality evidence from
clinical research along with clinical expertise and patient values (Jette et al., 2003).
Evidence Based Practice is the method of clinical decision making that requires result of
primary research to be made accessible to those involved in clinical decision making
process. Guidelines for Evidence Based Practice have been discussed in various medicines
including public and community health, general practice, critical care medicine, obstetrics
and nursing. Criticisms to lack of research utilization have been labeled at number of
health care professionals including medical professionals. Surveys into clinical application
of research findings have been undertaken in discipline such as social work, nursing,
psychology and general medicine. Evidence Based Practice is considered to be best

Page 8 of 80
practice for Physiotherapy profession as the profession has been considered to be the one
which uses treatment techniques that has little scientific foundation. If this perception is
wished to be changed then it should embrace scientific method and become users of
research (Turner et al., 1997).
Initiative towards Evidence Based practice
As other health profession, Physiotherapy has also incorporated Evidence Based Practice
with time. The initiatives have been taken both by the regulatory bodies like members of
WCPT or the academic institutions throughout the world. The examples of the initiatives
are as follows:
1. WCPT declaration on position statement on Evidence Based Practice on both
training as well as practice (WCPT, 2003).
2. Development of 398 evidence-based Physiotherapy practice guidelines including
those on selected rehabilitation interventions on conditions such as knee, shoulder,
neck and low back pain as well as manual therapy approaches (Moore, 2003).
3. An increase in publication of research-related activities as indicated in Pedro
(Maher et al., 2004).
4. Establishment of Physiotherapy database such as physiobase.com
5. Increase in research related activities in certain Physiotherapists in Sweden and
United Kingdom (Bury, 1997).
Engaging with both research and clinical findings can enhance the proficiency of
Physiotherapists clinical practice and help prevent misuse, overuse and underuse of health
care services (Kumar et al., 2010). Despite the clear benefits of EBP, its uptake within
Physiotherapy has been quite inconsistent in quality. There have been concerns about the
compatibility of the aspects of EBP and lack of clinically relevant research have been
raised by researchers and clinicians too (Chan & Clough., 2010).
Most of the Physiotherapists believe in clinical practice to be based on best evidence.
Practitioners mainly reported relying on courses and in-service training for informing
practice (Stevenson, 2004).
The barriers and enablers to Evidence Based Practice were workplace culture, ability to
change senior colleagues views, suspicion of research time, money and involvement with

Page 9 of 80
clinical interest group and best dissemination of best evidence information (Barnard.,
2001).
World Confederation of Physical Therapy Policy Statement
In the 13th general meeting of World Confederation of Physical Therapy(WCPT) in 1995,
several declaration of EBP were adopted relative to Evidence Based Practice(EBP).One of
the principles adopted include the fact that PT’s have a duty and responsibility to use
techniques and technology that have been evaluated scientifically. They also have the
responsibility to not use the technique or evidence that is unsafe or ineffective. Also, it
states that evidence should be integrated with clinical experience taking into consideration
beliefs, values and cultural context of local environment as well as patient client
preferences. Evidence-Based Practice in more achievable in places that embraces and
promotes evidence based practice. There are generally 2 methods for decision making.
One method incorporates the quick and effortless where one makes decision based on
prior experience and the second method where World Confederation of Physical Therapy
(WCPT) encourages its member organizations to do the following:
Work with managers and organizations to provide adequate structures, resources
infrastructures and learning opportunities to ensure the delivery of highest quality
of Physical therapy services possible.
Be able to evaluate practice critically, raise questions regarding the practice and
utilize the best practice after critically appraising the practice for better outcomes.
Facilitate the life-long learning activities by introducing Evidence-Based Practice
in the entry-level learning and extending through the professional development
trainings to incorporate best evidence based practice among the Physical
Therapists.
Call on national government and non-government organizations to facilitate and
promote evidence based health services by providing resources such as internet,
library, computers, online databases and training in Evidence Based Practice etc.

Page 10 of 80
Attitude, Knowledge, skill and educational preparation for Evidence Based Practice
Many literatures suggests that Evidence Based Practice(EBP) has been taken positively
that is Physiotherapists have positive attitude towards Evidence Based Practice and also
have knowledge regarding it but in most instances Physiotherapists tend to use the
knowledge acquired during the entry-level training rather than the relevant literature
search at the current period of time (Cimoli, 2012).
It has been often stated in the literature that Physiotherapists may be confused regarding
what the term “evidence” actually refers to and therefore what type of evidence they
should implement in practice. It was also found that greater educational qualification
meant life-long learning which contributed to adoption of Evidence Based Practice.
Information technology has been found to play major role in any education as well as
Evidence Based Practice. In a study with UK-AHPs a gap was found in confidence in
understanding 5 step processes in EBP and skills required to implement that knowledge.
The gap in knowledge may be prevalent as many had graduated before the introduction of
information technology in health care setting (Scurlock-Evans et al., 2014).
A first step in closing the knowledge-to-practice gap is to identify which knowledge
translation interventions are most effective in promoting knowledge acquisition.
According to Miller’s (1990), knowledge acquisition is an important initial outcome
because it creates a strong foundation for promoting change in clinicians’ attitudes and
practice behaviors, with the ultimate goal of improving patient-related outcomes
EBP practice in Occupational Therapists and Physical Therapists
Evidence-based practice (EBP) is a process through which research and clinical
experience are synthesized and applied in the clinical context. Like all health
professionals, occupational therapists (OTs) and physiotherapists (PTs) are expected to use
EBP to optimize health care resources by using the most effective interventions for their
clients. In fact, it may be considered unethical not to offer clients new and appropriate
interventions (Kumar et al., 2010). Despite this expectation, personal obligation, and
ethical aspects, this is not always the case. Thus, research findings may not be
implemented in clinical practice in a timely manner (or at all), causing a knowing-doing
gap. In other words, what is known from research is not always implemented in clinical
practice (Cochrane et al., 2007). For example, previous research has shown that although

Page 11 of 80
Occupational Therapists (OTs) are willing to access new knowledge to guide clinical
practice, they do not implement research findings to the fullest extent possible. The same
gap has been observed among PTs (Richardson et al., 2010). The existence of this gap
may compromise quality in occupational therapy, physiotherapy, and client value.
Along with PTs’ positive response to EBPT, a series of initiatives has been proposed
which have been designed to generate, evaluate and disseminate research and put such
results into practice. However, as the amount of PT research has increased dramatically
during recent decades this has made it difficult for many PTs to keep up with advances in
research and put findings into practice (Sackett et.al, 1995).
Perception of research
There were certain barriers in perception to Evidence-Based Practice. Some Physical
Therapists thought Evidence Based Practice to be limited, difficult to translate in real
world, inaccessible resulting in EBP failing to take the limitation of clinical practice
setting to account.
One of the important factors is that there is no one method that fits all for enhancing
Evidence Based Practice. Physiotherapists working in different sectors have different
educational needs and encounter different barriers. Henceforth, assessing organizational
culture prior to development of educational interventions is essential.
Steps of Evidence Based Practice
Five steps of Evidence Based Practice mainly comprises of Ask, Access, Appraise, Apply,
Assess. “Ask” mainly can be described as ability to ask a research question depending on
a problem that needs to be solved. “Access” can be defined as designing and conducting a
search strategy choosing comprehensive search terms and the most appropriate databases.
Using appropriate chosen Critical Appraisal tools, the evidence is appraised for suitability
to answer research question, assess bias, suitability of analysis, reliability of outcome
measures. “Apply” is basically evidence is applied to clinical situation or to respond to a
specific research question. “Assess” is basically integration, evaluation and adaptation of
practice based on evidence and application of these findings.
1. Ask the question: Eight studies reported on this to be asking a clinical question.
Some identified them as frequency in which clinician identified gap in clinical

Page 12 of 80
knowledge that was required to guide patient care. Some of the studies explained it
as if Physiotherapists were able to formulate question to formulate literature
search. It is said that 75% of health care professionals including Physiotherapists
actively seek practice guidelines (Heiwe et al.,2011). 49% of respondent suggested
that they should conduct their own literature review (Salbach et al.,2009).
2. Acquire the evidence: Across studies Physiotherapists confirmed their ability in
conducting literature searches; however frequency of conducting searches were
very low. Two qualitative studies sought the views of Physiotherapists on when
and if they had the ability to acquire and assess research information. Nisalgard
and Lohse(2011) reported that 8% of Physiotherapists searched database
weekly,20% monthly and 50% several times where as 23% never searched
literature.
3. Appraise the literature: Researches have reported on whether or not
Physiotherapists have ability to appraise evidence critically. Across studies have
shown 50% of respondents confident in appraising or interpreting literature, also
high proportions had difficulty in interpreting statistical results or had poor level of
research skills.(Gorgon et al.,2012)
4. Apply results to patients: Studies have suggested that applying results to the
patients would include the barriers .No studies cited example of a Physiotherapists
applying information gathered through EBP process to an individual patients.
Qualitative results were more informative as those studies explored the issues
surrounding implementation of EBP process. Organizational support was
considered essential to have the time and resources necessary to undertake
the EBP process. One of the Canadian study such as professional obligation or
inter-professional communication drove participants to use Evidence-based
outcomes measures. Certain studies suggest that 70% to 80% Physiotherapists
apply or use literature ;20% of the respondents reported that literature results not
relevant to their practice (Jansen at al.,2012).
5. Assessing the impact of Evidence-Based Practice: It is the evaluation of
effectiveness and efficiency in executing previous steps. Literature showed that
Physiotherapists had a lack of agreement with guidelines in general ,had doubt
about the credibility of guidelines and commented on the lack of time to apply
guidelines and commented on the lack of time to apply guidelines and interpret the
results of outcome measures (Van Bodegom-Vos et al. 2012). Studies showed that
Page 13 of 80
respondents infrequently measured the outcomes of the EBP process in relation to
an individual patient’s care.
Importance of Evidence-Based Practice
Many influential Physiotherapist representatives including Physiotherapy professionals,
researchers, practitioners and policy makers have argued that Physiotherapists have moral
and professional obligation to follow diagnosis and treatment methods merely based on
opinion, anecdotal evidence of success or simply because they are experience based
habitual practice. The move towards a more evidence-based physiotherapy practice has
been a “pressuring issue” in Physiotherapy driven by profession’s collective need to
validate its position in health care. (Taylor & Copeland, 2006)
Evidence Based Physiotherapy has been possible due to enormous increase in volume and
accessibility of high quality clinical research in recent years. Throughout the world, the
demand for and interest in applying evidence to Physiotherapy practice has grown in the
past decade. This particularly has been witnessed by increase in publication related to
evidence in Physiotherapy. It has been shown in studies that clinically relevant researches
as well as clinical expertise are important components of Evidence based practice and
identification and application of patient preferences should be the part of clinical decision
making (Akinbo et al., 2008).
Clinicians are being told to embrace evidence-based practice. This pressure is evident in
the treatment of patients, where adherence to clinical guidelines significantly improves
patient outcomes .However, a gap exists between the scientific evidence and its
application in clinical practice (Turner & Mjolne, 2001). According to Canadian Institute
of Health Website (2006), recognition of this dilemma has led to an increase interest in
knowledge translation (KT), which is the exchange, synthesis and ethically sound
application of knowledge within a complex system of interactions among researchers and
users.
Many of the researches identified Evidence based Practice as important with
Physiotherapists explaining about its important role in decision making. However,
misconceptions regarding EBP have also been identified. Therapists felt that drive towards
EBP was economic, rather than quality of care.
Challenges of Physiotherapists

Page 14 of 80
There are number of challenges faced by Physical Therapists attempting research for
clinical decision making. The three major challenges include research methods, clinician’s
skill and administrative factors (Akinbo et al., 2008). Attaining the knowledge to
critically appraise the research and or conduct a comprehensive database search that has
been identified are considered to be important factors. Physiotherapists at often times
report low levels of self-confidence in undertaking either of these activities. Time also has
been considered to be one of the major hindrances in successful implementation of
Evidence-Based Practice. Clinicians need to have adequate time for Evidence Based
Practice activities. In order to address the recognized issue of time, researchers have
pointed out the professional development training for Physiotherapists that mainly focuses
on Evidence-Based Practice (Cimoli, 2012).
Barriers to Evidence Based Practice as mentioned by doctors and nurses included lack of
time to read evidence, lack of facilities or resources, lack of staff experienced in EBP, lack
of training for Evidence based practice, lack of support from staff and management, lack
of awareness regarding research and evidence not general sable in own settings (Long et
al.,2011)
Numerous barriers has been seen, one barrier among them was enormous amount of health
care literature published every year which made it difficult for the medical professionals to
keep up to date. It’s been estimated that 8000 articles are published every day and family
medical practitioner will need to dedicate approximately 20 hours a day to stay abreast of
new evidence (Alper et al., 2004).
No evidence as such has been obtained regarding Evidence-Based Practice among
Physiotherapists but perception and attitudes towards Evidence-Based Practice among
nurses and nursing students in Nepal has been carried out. The greatest barriers
experienced were lack of time and resources, difficulty in understanding research articles
and translating the findings to practice, limited autonomy to change practice based on
evidence.
Barriers are typically context-dependent; implementation strategies should thus be tailored
according to their context and specific barriers must be identified. The most frequently
reported barrier concerns limited time, thereby constraining the identification and
interpretation of research evidence; not being able to apply research findings to clinical
practice has also been reported (Grimmer et al., 2007). Tilson & Mikan (2014) have

Page 15 of 80
recently identified other common barriers, including an inability to determine the
legitimacy of research findings, insufficient research literature on specific patients’
problems, deficient information regarding retrieval skills and an inability to incorporate
patient preferences into decision-making, such results coinciding with those reported by
Jette et al. (2003).
Impact of Evidence Based Practice
It has been found that despite attributing improved patient outcomes to the use of EBP or
research based evidence, no studies examined the impact of the EBP process on patient
outcomes. One intervention study looking at the adherence to clinical guidelines found
small changes in adherence in certain areas of practice(yellow flag identification) but large
increases in others (use of functional outcome measures). However there was no
improvement in patient outcome, cost of treatments as a result of Physiotherapists training
around guidelines. Only one study reported improved patient outcomes as a result of
adhering to clinical guidelines .There is no control group to measure size (Rebbeck et al.,
2006). Bekkering et al. (2005) noted similar findings with the implementation of back pain
management guidelines. This raises a question of whether or not patient outcomes are
improved as a result of the implementation of clinical guidelines .To answer this, clinical
audit on a large scale of patient outcomes related to clinical guidelines or other evidence
has potential for the Physiotherapy profession to demonstrate its value proposition for the
improvement of health outcomes.
Bardan (1995) however acknowledges that several factors can influence or control the
course of health care practice. The factors may include information, education,
communication and human resources development, socio-humanistic development of
practice, modern technologies and technology transfer system, environmental factors and
capability of science and technology to forecast and assess
Access and Availability
Regarding physiotherapy (PT), there is growing acceptance of an EBP-based approach
which is referred to herein after as Evidence-Based Physical Therapy (EBPT). A study
conducted by Jette et al. (2003) found out that the evidence based practice was mainly
carried out where the web based service was provided via accessibility of computer
technology and also the service environment. Sackett et al. (1991) found out that the

Page 16 of 80
younger generation of Physiotherapists had greater tendency to go for web based
information compared to others as the older generations mainly focused on peer to peer
review. The study area is in Nepal. It is a landlocked country located in South-East Asia
with estimated population of about 26.4 million with male population of 12.8 million and
female of 13.6 million. It is spread over the area of 147,181 square kilometer. It is the 48th
largest country by population and 93rd
largest country by area. It has mainly three regions.
Himalayan, Hilly and Terai region.
In Nepal, health services are provided by both Government as well as private hospitals
according to guidelines of Ministry of Health and Population. The majority of
Physiotherapists are in private and government hospitals. Before only countable number of
Physiotherapists were in the Government hospitals with only technicians but after the
massive earthquake in 2015 with many of the people requiring rehabilitation ,the need for
Physiotherapists were understood by the Government and different Government hospitals
recruited Physiotherapists. Still many district hospitals lack Physiotherapists and there are
no Physiotherapists in health centers and health posts.
Health facilities under Ministry of Health and Population
Facility 2012/13 2013/14 2014/15
Hospitals 87 95 102
Primary Health
centers
207 208 201
Health Posts 1689 1559 3808
Sub-Health Posts 2127 2247
Hospital beds
(available)
5127 5998 6253
Source: Department of health services, MOHP: Ministry of Health & Population

Page 17 of 80
Chapter-III RESEARCH METHODOLOGY
Independent variable Dependent variable
Characteristics of
Physiotherapists
Work experience
Current role in therapy
center
Hours of work per week
Patients seen per day
Type of facility
Place of Qualification
Degree earned
Code of ethics
Prior training to
evidence based practice
Stimulating environment
Clinical reasoning skills
and practice within
environment
Percentage of times
spent in patient care
Attention to Literature
Access and availability of
literature
Number of articles read in a
month
Percentage of time spent in
reading scientific article
Demographic variables
Age
Sex
Knowledge,
Attitude and
Barrier to
Evidence based
Practice
Access to and availability
of literature
Access at work
Access away from work

Page 18 of 80
3.2 Objectives
3.2.1 General Objectives
To identify the level of beliefs, knowledge and attitude of Nepalese physiotherapists
(members of Nepal Health professional Council) regarding evidence based practice and to
determine major barriers for implementing evidence based practice
3.2.2 Specific Objectives
To analyze the knowledge and understanding of the importance of Evidence Based
Practice among the physiotherapists of Nepal
To assess the attitude of Physiotherapists regarding Evidence Based Practice for
better quality services to the patients and betterment of their profession
To determine the availability of the facilities for the encouragement of Evidence
Based Practice.
To discuss the major barriers to Evidence Based Practice
To describe associations among the elements listed and characteristics of Physical
therapists and their practice environment.

Page 19 of 80
3.3 Study Design
Cross-sectional study design was used. Cross-sectional design is majorly used to find out
the quantitative information of different variable of the study. Piel et al. (1982) stated
exploratory study design aims to explore new area or at least one about which is little
known in the local context. Hence data were collected from the participants to reveal the
relationship and other variables of interest. As it has been known that cross sectional
studies provide a snapshot of related characteristics in a population at a given point in time
(Franenkel & Wallen 2000), data was collected using a self-administered standard
Questionnaire
3.4 Study Population
Study population were mainly the physiotherapists of Nepal registered under Nepal Health
Professional Council (NHPC).There are total of 1166 Physiotherapists permanently
registered in NHPC according to the recent document. Among them those in specialization
and first level that is 1000 were under the study population.
3.5 Study area/Site
Data were collected from Physiotherapists working in hospitals and rehabilitation centers
as well as community of different districts. The districts included were Kathmandu,
Bhaktapur, Lalitpur, Kavre, Gorkha, Jumla, Jiri, Kaski, Rasuwa, Sarlahi and Chitwan.
Kathmandu, the capital city has the maximum concentration of Physiotherapists working
in different clinics and rehabilitation centers of Nepal. Other districts have only few
Physiotherapists and those working in the community are even lesser in number. The
Physiotherapists working in Kavre district has the only institution providing Bachelors in
Physiotherapy in Nepal. As for in Kathmandu, Bhaktapur and Lalitpur several hospitals,
rehabilitation centers and polyclinics are present.
3.6 Study period
Total study period was 6 months. The study period was from December 2017 to May
2018.

Page 20 of 80
3.7 Sample Size determination
According to the data of Nepal Health Professional Council, there were about 1166
permanently registered physiotherapists in Nepal. Among them 111 were in specialization
level, 889 in level one, 104 in level two and 62 in level three. As the preference was
Physiotherapists who had completed Bachelors degree. Hence the sample size was taken
including only the Physiotherapists of specialization and level one. Information of the
Physiotherapists and their working place were obtained from NEPTA-Nepal which is also
a member of WCPT (World Confederation of Physical Therapists).
We know Sample size (no ) = 𝑧2𝑝𝑞
𝑑2
Here z is a constant
Where z= 1.96
p is the estimated proportion of attribute present in the population
d is the desired level of precision
For the sample size (n)
p=0.5
q=1-p
d=0.07
Sample size (no ) =1.96∗1.96∗0.5∗0.5
𝑂.𝑂7 ∗(0.07)
=196
We found that for finite population with precision of 7% and prevalence of 50% a sample
size 196.As the population had small sample size, we know that the sample size could be
slightly reduced.
Hence (n) = 𝑛𝑜
1+𝑛0−1
𝑁

Page 21 of 80
Given that total population (N) =1000
(n) = 196
1+196−1
1000
=164
Finite population correlation for proportion gives a sample size of 164.
3.8 Inclusion and exclusion criteria
Inclusion Criteria:
Physiotherapists from Nepal who are registered under Nepal Health professional Council.
(NHPC)
Physiotherapists who are currently working in Kathmandu, Bhaktapur, Lalitpur and Kavre
and other districts
Physiotherapists from above mentioned districts practicing in clinics, hospitals, private
practice, home visits and rehabilitation centers.
Exclusion criteria
Physiotherapists who do not fall in level one and specialization level.
Physiotherapists not practicing at the time of study.
Physiotherapists working outside Nepal
3.9 Sampling Technique
Non–probability sampling process that includes purposive sampling was used as in this
process the investigator can use one’s own judgment for the sake of making decisions on
choice of sample items and includes sample which is more typical in regard to
characteristics under investigation. So, the districts Kathmandu, Kaski and others were
chosen, where maximum number of hospitals, clinics and rehabilitation centers were
present and where more concentration of Physiotherapist were available. The non-
probability purposive sampling technique was used in choosing the districts as the method
is often used in research for community studies whereby the researcher judgmentally

Page 22 of 80
selects one or few communities because they are considered either typical or outstanding
examples of variables with which the researcher is concerned (Piel et al., 1982).
Procedure
Nepal Health Professional Council provided only the name and contacts address. So as
information could not be obtained from Nepal Health Professional council regarding their
contact number or place of work. Face book page of Nepta-Nepal was used for the
information of the Physiotherapists. At first major rehabilitation centers in and around
Kathmandu valley were approached and data was collected from the Physiotherapists
having permanent registration. Cross-check was done by the list provided by NHPC. Total
sample of 90 was collected by this process. The hospitals in Kathmandu that were
included were the major hospitals of Nepal. The names and hospitals are not mentioned as
the anonymity had to be maintained. Additional help was taken from Nepta-Nepal
regarding the working place of Physiotherapist there. Also information was obtained that
in Kaski 19 Physiotherapists were working .The information was not present with NHPC
so help was taken from Nepta-Nepal facebook page. A representative from Nepta-Nepal
helped in distributing the forms and collecting them back. Total of 10 Questionnaires were
distributed in Kaski. Similarly from Sarlahi which has a rehabilitation Centre, a
Physiotherapist from the centre distributed 8 questionnaires which were later collected by
a representative there. And similarly from Jumla, Mugu and Surkhet where only one
Physiotherapists each were appointed from the non-governmental organization. Gorkha
also had few Physiotherapists working in the non-governmental organization, so the
representative Physiotherapists collected and sent the questionnaire back. Also 7
Physiotherapist were working in Chitwan according to Nepta-Nepal. Also questionnaires
were distributed to the Physiotherapists of Jiri and Rasuwa 1 each who were working in
the community and were working in non-governmental organization. It was clear from the
information obtained that maximum concentration of Physiotherapists were centralized in
Kathmandu valley with sparse number in other districts. Hence maximum sample included
from Kathmandu districts and only few from the other districts. During the period of data
collection 1st Physio-fit Table-tennis tournament was conducted in Kathmandu. There was
participation of maximum number of Physiotherapists in the competition. Hence a sample
of 25 was obtained from the tournament as well. Hence total of 164 sample was collected
at the end who were all registered under Nepal Health Professional Council.

Page 23 of 80
3.10 Data Collection tools
A self-reported questionnaire was used for data collection Known as Evidence Based
Practice Questionnaire
Questionnaire
Survey tool was the adaptation from self-reported questionnaire adapted by Jette et.al
(2003) which was originally used to study attitudes of physician and general practitioner
towards evidence-based medicine and also the structured questionnaire used by Yahui &
Swami Nathan (2017) regarding Knowledge, Attitudes and Barriers to Evidence based
practice among Physiotherapists in Malaysia.
Evidence Based Practice Questionnaire
The final structured questionnaire was prepared that consisted of 2 sections. First,
demographic part and second section that consisted of questions regarding knowledge,
attitude and barriers. Questions were prepared relatively shorter in length keeping in mind
that greater the length of the questionnaire lower the response rate (Oppenheim, 1992).
Total of 40 questions were prepared for the questionnaire where question 1 to 11 consisted
of demographic and practice data; questions 12 to 23 mainly inquired about personal
understanding, attitudes and beliefs and interest to and motivation to engage in Evidence-
Based Practice. Question 26, 27, 30 enquired about the use of and access to practice
guidelines. Questions 24, 25, 34, 35, 36 and 38 answers about educational background and
knowledge and skills related to accessing and interpreting information. Questions 28,
29,31,32,33 are about access and availability of resources to promote Evidence Based
Practice. Survey item 39 and 40 answered the questions regarding perceived barriers to
Evidence Based Practice. Responses to most of the items concerning attitudes and beliefs
and knowledge and skills related to Evidence based Practice were addressed using 5 point
Linkert Scale with “strongly disagree” and “strongly agree” as the anchors. Several items
related to access to information required yes/no responses. Data type was the interval type.
Data source was from the measurement tool for evidence based practice. Permission was
taken to use the tool via email .Once the permission was granted the measurement tool
was used. The variables for study were knowledge, attitude and barrier.

Page 24 of 80
3.11 Data collection Technique
Initially permission was taken from Institutional Review Board (IRB) of Bangladesh
Health Professional Institute. Then as the research was to be conducted in Nepal, data
collection process started after permission from Nepal Health Research Council. Also,
permission was taken from the concerned authority of the hospitals. Finally after consent
forms were filled by the participants, data were collected from the self-reported
questionnaire filled by the physiotherapists and sent back to the investigator.
Questionnaire adapted from Jette et.al and Yahui & Swaminathan were used. Permissions
were not taken from the respective hospitals as the survey only required information from
Physiotherapists. Some Physiotherapists were concerned regarding the mentioning of the
name of the hospitals and rehabilitation centres. Hence the anonymity of the name and
rehabilitation centre was maintained.
Pilot Study
To evaluate content validity, draft of questionnaire was sent to 5 experienced Physical
therapists working in different units in Nepal. Certain changes in the questionnaire were
made after the suggestion to fit to the Physiotherapists of Nepal. The Physiotherapists
suggested in including more of multiple choice questions and decreasing the number of
questions to suit the busy schedule during the work.
After pilot-study, questionnaires were distributed to different hospitals and rehabilitation
centre of Kathmandu. The questionnaires were distributed and some places they were
collected at the time of delivery and other places they were collected later due to the busy
schedule in hospitals. To the ones distributed to be collected later; reminder had to be
made to the concerned authority and the head of the department via phone calls. Most of
the Physiotherapists had filled the survey questionnaire by the second call. As for others
several reminder had to be made in order to fill in the questionnaires. As for those outside
of Kathmandu valley the representatives from the districts took the questionnaire to
distribute them in January and were returned by March 6.Several contacts were made in
between to make sure the questionnaire were filled. During the entire process of
distribution of the questionnaires it was expected that several questionnaires would be lost
or misplaced .Hence the questionnaires were printed in more numbers than the actual
sample size of 164.The final data collected were 164. Initially care was taken that total of

Page 25 of 80
164 items would be collected as the sample size was obtained after 7% of precision. Hence
reduction in sample size than that would not be significant as such.
3.12 Data analyses/ Data Management.
Data were analyzed using SPSS version 16 for Microsoft Windows. First the
collected data were entered in Microsoft Excel. Then once all the data were
collected and entered in Microsoft Excel it was exported to SPSS. All responses
pertaining to variables Demographic data and attitude and knowledge to Evidence-
Based Practice were first classified as nominal and ordinal data categories. The
data were then transformed to numerical categories.
Descriptive analyses were used to determine frequency and percentages and the
obtained information were shown in bar charts, pie charts and tabular formats.
Cross tabs were also obtained for the various demographic variables. The questions
that enquired about the attitude, knowledge, skills and understanding were shown
on the basis of their mean and standard deviation. Overall score was obtained
along with overall mean and overall percentage and were represented in table. The
average mean scores were used in order to determine the overall attitude,
knowledge and skills and understanding of the research terms
Inferential statistics Chi square test was used to examine degree of associations.
Responses of items measuring education, knowledge, skill, attitude and belief, age,
highest degree attained and work experience and others. Association was also
determined between attitude and attention to literature. If there were some
associations between the variables in Chi-square tests then only further regression
analysis was carried out for determination of odds ratio
A p value of <.05 was considered as significant

Page 26 of 80
Chi-square test
O = Observed frequency
E=Expected frequency
χ2 =
∑(O−E)2
E =
(75−69.7)2
69.7 +
(11−16.3)2
16.3 +
(58−63.3)2
63.3 +
(20−14.7)2
14.7
= 0.41 + 1.72 + 0.44 + 1.91+ 4.4 = 4.41
In this way researcher has calculated all the chi-square value and presented in the table
EBP variables Factor Level χ2 p value
Strong Evidence is
lacking to support
most of the
intervention I use
with my patient
Gender Male
Female
4.4 .03

Page 27 of 80
After examining the response frequencies and before examining association between
variables, some variable categories were collapsed in order to proceed to further analysis
in order to use them as dependent measure in logistic regression analysis.
For those item with 5 point Linkert Scale and positive response set that is agreement with
the statement suggested positive regard for EBP, the “strongly agree” and “agree”
categories were combined and then “neutral”, “disagree” and “strongly disagree”
categories were combined so that responses fell into 1 of 2 categories “agree” or
“disagree”. For items with negative response set, the “neutral” category was combined
with “agree” and “strongly agree” and “disagree” and “strongly disagree” were combined
so that they formed two categories 1 and 2.The item measuring number of articles read on
average month was categorized as less than 2, 2 to 5, 6 to 10, 10 to 15 and greater than 15.
Low number of articles read represented poor attention to EBP which was inconsistent
with the motive of EBP.
For items that were designed to measure the understanding of the research terms, the
understand completely and understand somewhat categories were combined so that 2
category response was obtained.
Linear regression analyses were carried out for the data which had no outliers. After
examining response frequencies, and before examining the associations between variables,
some variable category were collapsed in order to allow further analysis using them as
independent measures in logistic regression analysis. As distribution of data were not
uniform for regression analysis. Data were collapsed. The redistribution of age was done
and it was re-categorized to (20 -24), (25-29) and greater than 29 in order to obtain stable
models. Similarly, in the field of specialization as subsamples were small. They were
collapsed and categorized into specialization and no specialization level. Similarly for best
described facility at which Physiotherapists worked were categorized as acute care
hospitals and others.
In order to run regression analysis between understanding of research terms and
demographic variables the scores were summed for all 8 items and then median was
obtained after which they were recoded into less than median and greater than median
forming two categories. Items regarding practice guidelines, attention to literature and
barriers to Evidence Based Practice were represented in bar diagrams and pie charts.

Page 28 of 80
Odds ratio mainly provides the estimate for relationship between binary (yes or no)
variables using logistic regression. Also enables to examine the effects of other variables
using logistic regression. It is said that odds ratio is generally 1 if there is no relationship.
In the context of our study odds ratios and their 95% confidence intervals were determined
for each level of the independent variables in the models that were significant
3.13 Quality Control/Quality assurance
In order to ensure that the questions has been well understood by the participants and there
would be no problem in answering the question. A small check was carried out among just
a few number of participants. The team of 5 senior Physiotherapists chosen for the process
and the modifications were done according to the suggestions provided. It is very
important for the researcher to perform a field test before collecting data as it helps the
researcher to refine data collection, plan and justify reliability and validity of the questions
in order to fit in the context of Nepal. The field test is generally conducted in order to
identify any difficulties that exist in the questionnaire. Once it had been ensured that no
problem in filling the questionnaire will be used for data collection during the research.

Page 29 of 80
3.13 Ethical Consideration
Initially permission was taken from Institutional Review Board of Bangladesh Health
Professionals to conduct the research on the topic that included knowledge, attitude and
barriers towards Evidence Based Practice.
As the data had to be collected in Nepal permission was taken from Nepal Health
Research Council. Data collection process was started after permission from the
Nepal Health Research Council
Information sheet were given to the participants regarding the type of research and
Questionnaire and also describing the ethical issues. It was clearly mentioned on
the information sheet that their willingness to participate in the research was purely
voluntary and they were not forceful in participating in the survey in case they did
not wish to.
Consent form was also given to the participants and they should have signed the
questionnaires if they wished to participate in the study.
It was ensured that the information provided would be kept confidential and they
had the right to not answer or withdraw from the study even after giving consent
beforehand. It was informed to the Physiotherapy department that the name of the
institutions would not be mentioned anywhere and also confidentiality regarding
the name of the participants would be maintained. There would be the mention of
only codes and only the main researcher would have the access to the code.
It was ensured that no harm would be done to anyone during the process of
research
It was clearly explained that even though no direct benefit would be obtained to the
Physiotherapists by participating in the survey but it would help in the process of
continuous professional development as Evidence Based Practice is one of the
most accepted practice in the health profession.
It was mentioned to the Physiotherapy department head that the researcher would
be available to answer any questions of the participant related to the research

Page 30 of 80
CHAPTER-IV Results
4. Socio-Demographic Characteristics of the respondents
4.1Gender of Physiotherapists
The bar chart in figure 1 shows that the total number of respondents 47.6% (78) were male
and 52.4% (86) were female. Male respondents were slightly lower than the female
respondents.
Figure 1. Distribution of respondents by Gender
47.6
52.4
45
46
47
48
49
50
51
52
53
Male Female
Per
cen
tage
s

Page 31 of 80
4.2 Age of Physiotherapists
The bar diagrams in figure 2 shows the distribution of respondents by age. Here the
maximum number of Physiotherapists fell under 20-30 years of age which makes around
78.8%(129) followed by 30 to 40 years which made 16.5%(27).Only 1.8% (3) fell under
41-50 years of age and 3% (5) were above 50 years of age. The median age of the
respondents was obtained to be 27 and mean age was obtained 28.63.Since there are
outliers present in the data the media was taken in this context. The average age of the
respondents was 27 (SD = 6.02). The respondents participating in the study were relatively
young.
Figure 2.Distribution of respondents by age
78.7
16.5
1.8 3
0
10
20
30
40
50
60
70
80
90
21-30 31-40 41-50 >50
Per
cen
tage
s

Page 32 of 80
4.3 Specialization level of Physiotherapists
It can be seen from figure 3 that 65.2% (107) of the Physiotherapists had no specialization
which shows that more than 50% of the Physiotherapists did not have specialization
degree. 14.6% (24) has Musculoskeletal as their specialization degree which is the highest
percentage of the specialization level.9.8% (16) of the Physiotherapists had Neurology as
their specialization level which is the second highest.2.4% (4) each had cardio respiratory
and pediatric as their specialization. 1.2% (2) had sports as their specialization level and
4.3% (7) were others mainly Masters in rehabilitation Science as their specialization.
Figure 3.Distribution of respondents by specialization level
65.2
14.6
2.4
9.8
2.4 1.24.3
0
10
20
30
40
50
60
70
Per
can
tage
s
Series1

Page 33 of 80
Table 1.Distribution by number of years working as a Physiotherapist
No of years working as a Physiotherapists
No of years N %
<2 65 39.6
2-5 55 33.5
6-10 30 18.3
>10 14 8.5
4.4 Number of years working as a Physiotherapist
The above table 1 shows that maximum number of respondents working as
Physiotherapists for less than 2 years were 39.6% (65) and respondents working for 2 to 5
years were 33.5%(55). Respondents who worked for 6 to 10 years were 18.3% (30) and
those who worked for more than 10 years were 8.5% (14). There were few percentages
who had worked more than 10 years as Physiotherapy profession was introduced in later
years in Nepal.
Table 2. Distribution of number of hours worked per week
Distribution of no of hours worked per week
No of hours N %
<20 6 3.7
20-30 11 6.7
31-40 36 22
>40 111 67
Also table showed that 67%(111) of the respondent Physiotherapist worked for more than
40 hours and only 3.7%(6) worked for less than 20 hrs per week. Hence it can be said
maximum percentage of Physiotherapist worked for more than 40 hours per week which
showed the maximum work load of Physiotherapists.
Page 34 of 80
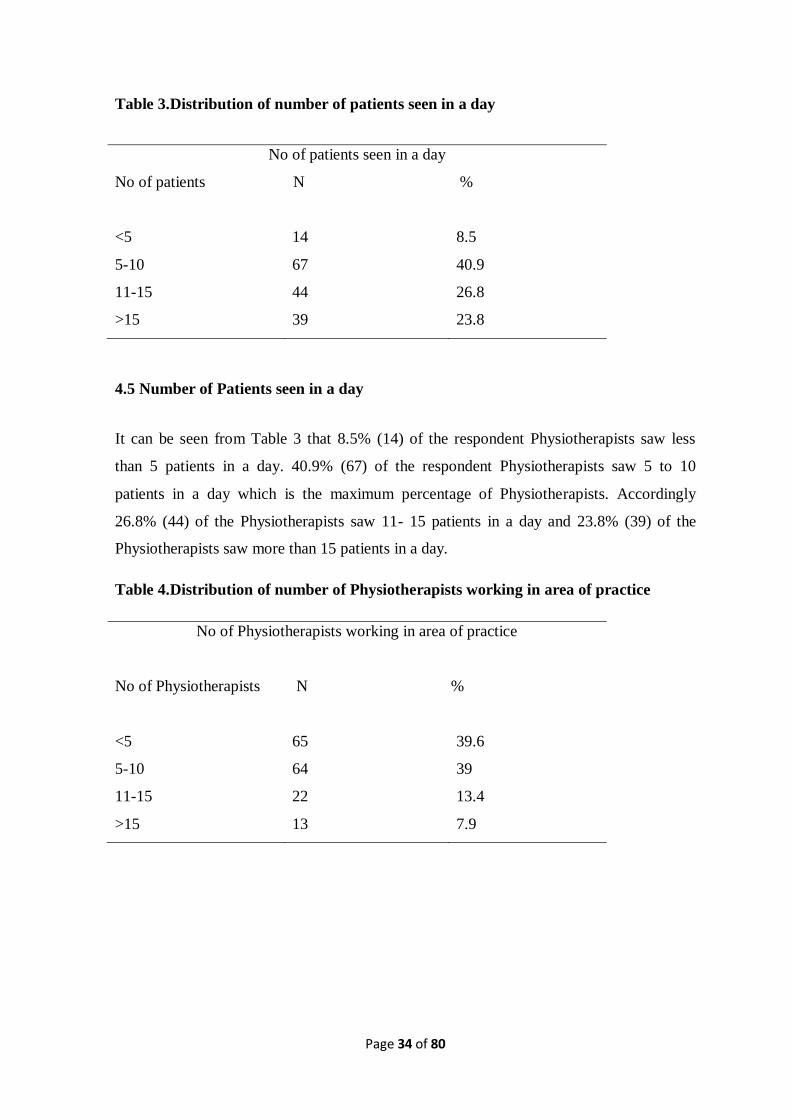
Table 3.Distribution of number of patients seen in a day
No of patients seen in a day
No of patients N %
<5 14 8.5
5-10 67 40.9
11-15 44 26.8
>15 39 23.8
4.5 Number of Patients seen in a day
It can be seen from Table 3 that 8.5% (14) of the respondent Physiotherapists saw less
than 5 patients in a day. 40.9% (67) of the respondent Physiotherapists saw 5 to 10
patients in a day which is the maximum percentage of Physiotherapists. Accordingly
26.8% (44) of the Physiotherapists saw 11- 15 patients in a day and 23.8% (39) of the
Physiotherapists saw more than 15 patients in a day.
Table 4.Distribution of number of Physiotherapists working in area of practice
No of Physiotherapists working in area of practice
No of Physiotherapists N %
<5 65 39.6
5-10 64 39
11-15 22 13.4
>15 13 7.9

Page 35 of 80
4.6 Number of Physiotherapists working in area of practice
It can be seen from table 4 that 39.6% (65) of the Physiotherapists had less than 5
Physiotherapists working in the area of practice followed by 39% (64) of the
Physiotherapists who had 5 to 10 Physiotherapists working in the place of their work.
Only 7.9% (13) of the respondents working area had more than 15 Physiotherapists
working in their area of practice and 13.4% (22) had 11 to 15 Physiotherapists working in
their area of practice.
4.7 Number of Physiotherapists on basis of area of practice
Bar graph in figure 4 shows that 54.3% (89) of the respondent Physiotherapists worked in
the acute care hospital which the highest percentage, followed by 36% (22) working in
rehabilitation centers and 36%(22) working in rehabilitation centers and finally 5.5% (9)
working in Community Based Rehabilitation. Private-care outpatient centre, home-service
and university accounted for only minimal percentage which were 2.4% (4), 2.4 % (4) and
4.9 % (8) respectively. Maximum numbers of Physiotherapists worked in acute care
hospitals.
Figure4. Distribution of respondents by area of practice
54.322
2.42.4
4.95.5
8.5
0 10 20 30 40 50 60
Acute care hospital
Private-care outpatient centre
University
Government-hospital
Percentages

Page 36 of 80
4.8 Majority of Patients Treated
It can be seen from the pie chart in figure 5 that maximum number of respondent treated
orthopedic cases making the highest percentage of 45.7% (75) followed by neurological
cases which constituted of about 31.7% (52) and then by cardiovascular cases which
comprised of about 7.9%(13).Other cases that the Physiotherapists treated were 14.6%
(24).
Figure 5. Distribution of respondents by majority of patients treated
45.70%
7.90%
31.70%
14.60%
orthopedic
cardio-vascular
neurologic
Others

Page 37 of 80
4.9 Percentage of time spent in patient care
Figure 6 above in bar graph shows that respondents who spent more than 61-80
percentage of time spent in patient care were 56.09 % (92) .Only 9.14% (15) of the
respondents spent less 20 to 40 percent of the time in patient care. 15.24% (25) of the
respondents spent 41-60 percent of their time in patient care and 19.52% (32) of the
respondents spent more than 81 to 100 percent of their time in patient care
Figure 6. Distribution of respondents by percentage of time spent in patient care
9.14
15.24
56.09
19.52
0
10
20
30
40
50
60
20-40 41-60 61-80 81-100
Per
cen
tage
Percentage of time spent in patient care

Page 38 of 80
4.10 Percentage of time spent in reading scientific article
Here the figure 7 shows that 46.01%(75) spent less than ten percent of their total time in
reading scientific article.37.42(61) percent spent 10 to 20 percent of their time in reading
scientific article.14.11% (23) of the respondent spent 21 to 30 percent of their time in
reading scientific article.1.84% (3) of the respondent spent 31 to 40 percent of their time in
reading scientific article and only 0.62% (1) of the respondent spent more than 40% of
their time in reading scientific article.
Figure7. Percentage of time spent in reading scientific article
46.01
37.42
14.11
1.84 0.610
5
10
15
20
25
30
35
40
45
50
<10 10-20 21-30 31-40 >40
Per
cen
tage
s

Page 39 of 80
Table 5. Representation of Gender and age of Physiotherapists
Age in years
Total 21-30 31-40 41-50 >50
Gender
of the
Physioth
erapists
female N 76 8 1 1 86
% 46.3% 4.9% .6% .6% 52.4%
male N 53 19 2 4 78
% 32.3% 11.6% 1.2% 2.4% 47.6%
Total N 129 27 3 5 164
% of Total 78.7% 16.5% 1.8% 3.0% 100%
4.11 Representation of Gender and age of Physiotherapists
The above table number 4 shows that 46.3% of total respondent Physiotherapists who were
female fell under 21 to 30 years of age and 32.3% of total male Physiotherapists fell under
21 to 30 years of age.

Page 40 of 80
Table 6. Representation of Gender and no of hours worked per week
4.12 Representation of Gender and number of hours worked per week
Here the above figure shows that 33.5% of female and 34.1% of male worked for more
than 40 hours per week that is maximum percentage of both male and female work for
more than 40 hours. Also, only minimal number of both male and female respondents
works for less than 20 hours where male comprised of 1.2% and female 2.4%.
Representation of Gender of the Physiotherapists & No of hours worked per week
No of hours worked per week
Total <20 20-30 31-40 >40
Gender of the
Physiotherapists
female N 4 8 19 55 86
% 2.4% 4.9% 11.6% 33.5% 52.4%
male N 2 3 17 56 78
% 1.2% 1.8% 10.4% 34.1% 47.6%
Total N 6 11 36 111 164
% 3.7% 6.7% 22.0% 67.7% 100.0%

Page 41 of 80
Table 7. Measure of attitude and belief towards EBP
EBP helps me make decision about patient care 2 (1.2)
2 (1.2)
13 (7.9)
96 (58.5)
51 (31.1)
3.17
0.72
EBP does not take into account patient preferences 4 (2.4)
32 (19.5)
60 (36.6)
58 (35.4)
10 (6.1)
2.23
0.91
I need to increase use of Evidence in my daily practice 3 (1.8)
2 (1.2)
14 (8.5)
110 (67.1)
35 (21.3)
3.05
0.71
Literature and research findings help improve patient care. 1 (0.6)
1 (0.6)
6 (3.7)
91 (55.5)
65 (39.6)
3.33
0.63
I am interested in attending courses related to EBP. 1 (0.6)
1 (0.6)
11 (6.7)
91 (55.5)
60 (36.6)
3.27
0.66
Strong Evidence is lacking to support most of the intervention I use with my patient.
7 (4.3)
72 (43.9)
54 (32.9)
30 (18.3)
1 (0.6)
1.67
0.84
Evidence Based Practice is time consuming and places burden on me.
0 17 (10.4)
61 (37.2)
73 (44.5)
13 (7.9)
2.5
0.78
Overall Mean (SD) 2.89
0.56
Total score (0 to 48) 34.73 Percentage Mean 73.25
Statement Strongly disagree (N/%)
Disagree (N/%)
Neutral (N/%)
Agree (N/%)
Strongly agree(N/%)
Mean
(SD)
Application of EBP is necessary in the practice of Physical Therapy 5 (3)
1 (0.6)
1 (0.6)
61 (37.2)
96 (58.5)
3.48
0.817
Literature and research are useful in day to day practice 4 (2.4)
1 (0.6)
5 (3)
82 (50)
72 (43.9)
3.32
EBP places unreasonable demand on Physical Therapists 12 (7.3)
29 (17.7)
40 (24.4)
59 (36)
24 (14.6)
2.33 1.14
I am interested in learning or improving the skills necessary to incorporate EBP in my practice.
4 (2.4)
1 (0.6)
11 (6.7)
100 (61)
48 (21.3)
3.14
0.76
EBP improves quality of patient care 6 (3.7)
0 (0)
6 (3.7)
88 (53.7)
64 (39)
3.24
0.83

Page 42 of 80
4.13 Measure of attitude and belief towards EBP
Attitudes towards Evidence Based Practice were measured by respondents’ indicating
their responses to 12 statements on five point Linkert Scale (0= strongly disagree; 4 =
strongly agree) for positive set of questions which in the above table are the questions 1, 2,
4,5,6,8,9,10 and the remaining negative set of questions 3,7,11 and 12 on five point
Linkert Scale (0 = strongly agree; 4= strongly disagree).Lower scores indicated more
negative attitudes and higher scores indicated more of positive attitude. Responses for the
questions concerning attitudes are summarized in table 3.The cronbach’s alpha reliability
for the scale was 0.65.Positive attitudes were reflected by the overall mean score of 2.89
with majority of the respondents agreeing or strongly agreeing to positive questions and
majority of the respondents disagreeing or strongly disagreeing to negative questions. The
average score was obtained 34.73 with the percentage of 72.35%.
Respondents showed they generally had positive attitude towards evidence based practice
with majority of them sticking to agree or strongly agree in the statement Evidence Based
Practice is necessary in practice of Physical Therapy (95.7%), literature and research are
useful in day to day practice (93.9%), EBP improves quality of patient care (92.7%), EBP
helps to make decision about patient care (89.6%). Physiotherapists of about 50.6%
responded that they disagreed or strongly disagreed that EBP places unreasonable demand
on Physical Therapists. There were Physiotherapists who responded neutral towards the
question. About 24.4% of the Physiotherapists responded that they were neutral towards
the fact that EBP places an unreasonable demand to the Physical therapists. There were
neutral attitudes towards the question EBP does not take into account patient preferences
where 36.6% of the respondents responded neutral.
It was mostly seen that many respondents believed strong evidence was lacking in support
of most of the interventions they used in their practice.81.1% stated they agreed or
strongly agreed with the statement and only 18.9% stated they disagreed or strongly
disagreed with the statement.88.4% responded that they agreed or strongly agreed to the
statement that they need to increase use of evidence in their practice.92.1% of the
respondents agreed or strongly agreed that they were interested in attending courses
related to Evidence Based Practice.

Page 43 of 80
Table 8. Association between attitude and demographics
EBP variables Factor Level χ2 p value df
Strong Evidence is
lacking to support
most of the
intervention I use
with my patient
Gender Male
Female
4.4 .03 1
I need to increase use
of Evidence in my
daily Practice
Specialization No
specialization
Specialization
5.32 .021 1
EBP places
unreasonable
demand on
Physiotherapists
No of
Physiotherapist
working in area of
practice
<5
5-10
11-15
>15
14.94 .02 3
No of hours worked
per week
<20
20-30
31-40
>40
9.208 .027 3
Literature and
research are useful in
day to day practice
Facility at which
respondent work
Acute care
hospital
Others
5.91 .018 1
No of patients seen
in a day
<5
5-10
11-15
>15
10.29 .01 3
I am interested in
learning or
improving the skills
necessary to
incorporate EBP in
my practice.
No of patients seen
in a day
<5
5-10
11-15
>15
20.19 .00 3
No of hours worked
per week
<20
20-30
31-40
>40
24.05 .00 3

Page 44 of 80
4.14 Association between attitude and demographics
Pearson chi square provides χ2
value 4.4 with p value = .03. Hence, the test is highly
significant at 1% level significance. Hence there is evidence to conclude that the
relationship between the two variables that are attitude and belief and Gender was
significant. As compared to the table value where χ2=3.54 the χ
2value obtained was 4.4
which was more than the table value
Pearson chi square provides χ2
value 14.94 with p value = .02. Hence, the test is highly
significant at 3% level significance. Hence there is strong evidence to conclude that the
relationship between the two variables that are attitude and belief and Physiotherapist
working in area of practice was significant. As compared to the table value where χ2=7.81
the χ2 value obtained was1 4.94 which was more than the table value.
Pearson chi square provides χ2
value 5.91 with p value = .028. Hence, the test is highly
significant at 2% level significance. Hence there is strong evidence to conclude that the
relationship between the two variables that are attitude and belief and facility at which
respondent work was significant. As compared to the table value where χ2=5.99 the χ2
value obtained was 5.91 which was more than the table value.
Pearson chi square provides χ2
value 5.32 with p value = .021. Hence, the test is highly
significant at 1% level significance. Hence there is strong evidence to conclude that the
relationship between the two variables that are attitude and belief and specialization was
significant. As compared to the table value where χ2=3.54 the χ2
value obtained was 5.32
which was more than the table value.
Pearson chi square provides χ2
value 24.05 with p value = .00. Hence, the test is highly
significant at 3% level significance. Hence there is strong evidence to conclude that the
relationship between the two variables that are attitude and belief and number of hours
worked per week was significant. As compared to the table value where χ2=7.81 the χ2
value obtained was 24.05 which was more than the table value.
Pearson chi square provides χ2
value 20.19 with p value = .00. Hence, the test is highly
significant at 3% level significance. Hence there is strong evidence to conclude that the
relationship between the two variables that are attitude and belief and number of patients
seen in a day was significant. As compared to the table value where χ2=7.81 the χ2
value
obtained was 20.19 which was more than the table value.

Page 45 of 80
Table 9. Binary logistic regression analysis for attitude and factors associated with
the respondent
Attitude or
Belief
Factor Level n Odds ratio
(95% CI)
P N df
I need to
increase use
of Evidence
in my daily
Practice
Specialization
Level
Specialization
No
specialization
56
108
5.044(1.12-
22.69)
Reference
.035 164 1
Literature
and research
findings
help
improve
patient care
Facility at
which
Physiotherapists
work
Acute care
hospital
Others
89
75
9.05(1.088-
75.39)
Reference
.042 164 1
4.15 Binary logistic regression for attitudes and factors associated with it
Here the above table 8 shows logistic regression between variables of attitude and factors
associated with it. Binary logistic regression was used examine relationship between
variables of attitude and specialization level and facility at which Physiotherapists work.
The results were presented in the table. Before conducting regression analysis the
specialization level were grouped into specialization and no specialization as very few
were in different specialization level. The fusions were done in order to obtain stable
models. Variable of attitude that is Physiotherapists need to increase use of Evidence in
daily practice was found to be statistically significant with specialization level.
Physiotherapists having specialization level thought it was necessary to increase the use of
Evidence in daily practice five times more than those having no specialization (p =.035,
95% CI: 1.12-22.69).
Also regressions were carried out for attitude variable that is literature and research
findings help improve patient care and facility at which Physiotherapist work. As the
facility at which Physiotherapist worked had no homogenous distribution. Hence, they
were combined into acute care hospital and others in order to obtain stable models.
Variable of attitude that is Literature and research findings help improve patient care was

Page 46 of 80
found statistically significant with the facility at which Physiotherapists worked.
Physiotherapists who worked in acute care hospital felt literature and research findings
help improve patient 5 times than those of others. (p= .04, 95% CI: 1.088-75.39

Page 47 of 80
Table 10: Measure of skills and knowledge required for Evidence Based Practice
Statement Strongly
disagree
(N/%)
Disagree
(N/%)
Neutral
(N/%)
Agree
(N/%)
Strongly
agree
(N/%)
Mean
(SD)
1 I am able to
conduct search
to answer my
clinical
questions
confidently
1
(0.6)
2
(1.2)
27
(16.5)
107
(65.2)
26
(15.9)
2.95
0.65
2 I am confident
in my ability to
critically review
professional
literature
3
(1.8)
8
(4.9)
41
(25)
98
(59.8)
14
(8.5)
2.68
0.73
3 I use practice
guidelines in my
practice
1
(0.6)
5
(3)
62
(37.8)
85
(51.8)
11
(6.7)
2.61
0.68
4 I am able to
incorporate
patient
preferences with
practice
guidelines
1
(0.6)
7
(4.3)
58
(35.4)
90
(54.9)
8
(4.9)
2.59
0.68
5 I learnt
foundations for
EBP in my
academic years
3
(1.8)
13
(7.9)
20
(12.2)
80
(48.8)
48
(29.3)
2.96
0.94
6 I received
formal training
in search
strategies for
finding research
relevant to my
practice
4
(2.4)
44
(26.8)
33
(20.1)
66
(40.2)
17
(10.4)
2.29
1.05
7 I am familiar
with the medical
search engines
.e.g PEDro,
PubMed
4
(2.4)
8
(4.9)
14
(8.5)
79
(48.2)
59
(36)
3.1
0.92
Overall Mean
(SD)
2.74
0.27
Total Score(0-
28)
(%) Percentage
19.18
(68.5%)

Page 48 of 80
4.16 Measure of Skills, education and knowledge for Evidence Based Practice
The required skills for Evidence Based Practice which in turn associated with knowledge
were measured using the 5 point Linkert scale. (0= strongly disagree, 4 =strongly agree)
were the anchors and all the question set were positive. Lower scores indicated lower
skills and higher scores in turn indicated higher skills. The alpha cronbach’s scale of
reliability was obtained 0.7 for the scale. The mean score of 2.7 indicated modeerate skills
among the Physiotherapists to acquire Evidence Based practice. The standard deviation
was obtained 0.27 which is lesser than the mean score indicating the significance. The
average score of the total was obtained 19.18 with the mean percentage of 68.5.
In the question mentioning the learning of Evidence Based Practice during the academic
years 78% agreed that they did learn EBP in their academic years.48.8% agreed and
29.3% strongly agreed that they learnt Evidence Based Practice during their academic
years.68.3% agreed or strongly agreed that they are confident in the ability to critically
review professional literature.81.1% responded that they agreed or strongly agreed that
they are able to conduct search to answer my clinical questions confidently.
Around 84.1% of the respondent agreed or strongly agreed that they were familiar with the
medical search engines such as Pub Med and Pedro
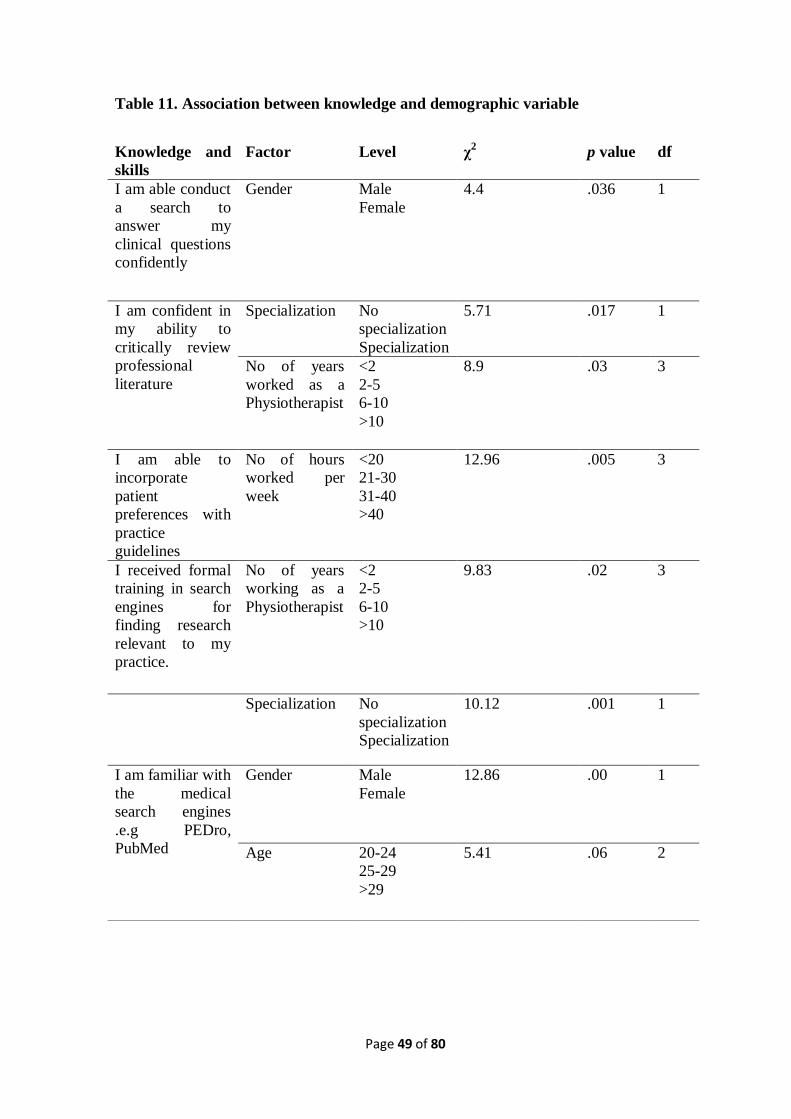
Page 49 of 80
Table 11. Association between knowledge and demographic variable
Knowledge and
skills
Factor Level χ2 p value df
I am able conduct
a search to
answer my
clinical questions
confidently
Gender Male
Female
4.4
.036 1
I am confident in
my ability to
critically review
professional
literature
Specialization No
specialization
Specialization
5.71
.017 1
No of years
worked as a
Physiotherapist
<2
2-5
6-10
>10
8.9 .03 3
I am able to
incorporate
patient
preferences with
practice
guidelines
No of hours
worked per
week
<20
21-30
31-40
>40
12.96 .005 3
I received formal
training in search
engines for
finding research
relevant to my
practice.
No of years
working as a
Physiotherapist
<2
2-5
6-10
>10
9.83 .02 3
Specialization No
specialization
Specialization
10.12 .001 1
I am familiar with
the medical
search engines
.e.g PEDro,
PubMed
Gender Male
Female
12.86 .00 1
Age 20-24
25-29
>29
5.41 .06 2

Page 50 of 80
4.17 Association between knowledge and demographics
Table 10 shows the association between knowledge and skills with its associated factor.
Pearson chi square provides χ2
value 12.86 with p value = .00. Hence, the test is highly
significant at 1% level significance. Hence there is strong evidence to conclude that the
relationship between the two variables that are knowledge and skills (familiarity with
medical search engines) and Gender was significant. As compared to the table value where
χ2=3.54 the χ
2value obtained was 12.86 which was more than the table value
Pearson chi square provides χ2
value 4.4 with p value = .036. Hence, the test is highly
significant at 1% level significance. Hence there is strong evidence to conclude that the
relationship between the two variables that are knowledge and skills (familiarity with
medical search engines) and Gender was significant. As compared to the table value where
χ2=3.54 the χ
2value obtained was 4.38 which was more than the table value
Pearson chi square provides χ2
value 10.12 with p value = .001. Hence, the test is highly
significant at 1% level significance. Hence there is strong evidence to conclude that the
relationship between the two variables that are knowledge and skills and specialization
level was significant. As compared to the table value where χ2=3.54 the χ
2 value obtained
was 10.54 which was a little more than the table value. Only marginal significance was
found between age of the Physiotherapist and knowledge and belief. χ2 (3, N=163) = 5.41,
p = 0.06.
Pearson chi square provides χ2
value 12.96 with p value = .005. Hence, the test is highly
significant at 3% level significance. Hence there is strong evidence to conclude that the
relationship between the two variables that are knowledge and skills and number of hours
worked per week was significant. As compared to the table value where χ2=7.81 the
χ2value obtained was 12.96 which was more than the table value
Pearson chi square provides χ2
value 9.83 with p value = .02. Hence, the test is not
significant at 6% level significance. Hence there is evidence to conclude that the
relationship between the two variables that are knowledge and skills (familiarity with
medical search engines) and number of years working as a Physiotherapist was not
significant. As compared to the table value where χ2=12.59, the χ
2value obtained was 9.83
which was less than the table value

Page 51 of 80
Table 12. Binary logistic regression analysis for skills, knowledge and factors
associated with the respondent
Knowledge
and skills
Factor Level N Odds ratio
(95% CI)
P N df
I am able
conduct a
search to
answer my
clinical
questions
confidently
Gender Female
Male
86
77
Reference
2.44 (1.042 -
5.721)
.04 163 1
I am confident
in my ability
to critically
review
professional
literature
Number of
years working
as
Physiotherapist
<2
2-5
6-10
>10
65
55
30
14
Reference
2.6 (1.1-5.7)
2.2(0.8-5.7)
4.8(1-23.3)
.035
.018
.099
.050
162 3
Specialization
No
Specialization
specialization
108
56
Reference
2.5(1.1-5.3)
.01
163 1
I received
formal
training in
search engines
for finding
research
relevant to my
practice.
No of years
working as a
Physiotherapist
<2
2-5
6-10
>10
65
55
30
14
Reference
.13 (.2-1.1)
.51 (.3-1.7)
.04(1.1-24.82)
.04 164 3
I am familiar
with the medical
search engines
Gender Female
Male
86
77
Reference
6.35 (2.08 -19.42)
.001 163 1
Age 20-24
25-29
>29
31
83
50
Reference
2.4 (.90-8.4)
3.6(1.1-12.3)
.078
.079
.034
163 2

Page 52 of 80
4.18 Binary logistic regression for knowledge, skills and factors associated with it
Here the table 10 shows the results of binary logistic regression between knowledge and
skills and the factors associated with the respondents. Variable of knowledge and skill that
is Physiotherapists ability to conduct search to answer clinical questions confidently and
Gender were found statistically significant. It was found that male respondents thought
they were able to conduct search to answer clinical questions confidently two times more
than female.
Statistically significant result was obtained between the variable of skill and knowledge
that is confidence in ability to critically review professional literature and number of years
working as a Physiotherapist. It can be seen from the table that Physiotherapists who
works 2 to 5 years as physiotherapists thought they were 2.6 times confident in ability to
critically review professional literature. Those working for 6 to 10 years thought they were
2.2 times more confident in their ability to review professional literature. Physiotherapists
working more than 10 years thought they were 4.8 times more confident in their ability to
critically review professional literature.
There was also statistically significant relationship between specialization and ability to
critically review professional literature. (p) = .03.Respondents with specialization thought
they were able to critically review professional literature two times more than those having
no specialization.
Also statistically significant relationship was found between knowledge and skill variable
that is receiving of formal training in search strategies for finding research relevant to
practice and knowledge and skills. (p)= .04 .Physiotherapists working more than 10 years
agreed they received formal training in search strategies for finding research relevant to
practice than those who worked less than 2 years but respondents who worked 2-5 years
and 6 to 10 years agreed 0.57 times and 0.75 times lesser that they received formal
training in search strategies for finding research relevant to their practice
It can be seen in the table that there is significant relationship between variable
physiotherapist’s familiarity with the medical search engine and gender with p =.001. It

Page 53 of 80
was found that male respondents thought they were 6.35 times familiar with the medical
search engines than female.
Only marginally significant association was obtained between age and familiarity with the
medical search engines. However, significant association was found between 20-24 and
greater than 29 years of age (p) = .034. It showed that Physiotherapist who were greater
than 29 years of age thought they were familiar with medical search engines 3.6 times than
those with 20-24 years of age. Only marginally significant association was found between
20-24 years of age and 25 to 29 years of age.

Page 54 of 80
Figure 8. Knowledge regarding research terms
Fig 3:Self-reported knowledge of specific terms
4.19 Self –reported knowledge regarding research terms
It can be seen from the figure 3 that more than 50% of the respondent understood
completely the terms. Physiotherapists actually understood all of the terms relative risk,
absolute risk, systematic review and meta-analysis. This result could be misleading as well
as literatures also suggested that even though maximum number of Physiotherapists said
they understood the terms but were not able to explain them when asked. Heterogeneity is
the term where there were equal percentages that understood, did not understand and
understood completely. Odds ratio is the term that maximum respondents said they
understood somewhat.34.1% said they did not understand the term followed by 32.3% that
said they understood somewhat and 33.5% that said they understood completely. Relative
risk and absolute risks seems to be the terms where only lesser percentage said they did
not understand. Only 5.4% of the respondents said they did not understand the term
relative risk and 6.7% of the respondents said they did not understand the term absolute
0
10
20
30
40
50
60
70
pe
rce
nta
ges
Self-Reported knowledge of specific terms
Do not understand
Understand somewhat
Understand completely

Page 55 of 80
risk. There were few missing data with one missing data in odds ratio and 2 missing data
in confidence interval where respondent did not answer to the question.
Table 13. Knowledge regarding research terms
Understanding of the
terms
Mean Standard deviation N
Relative risk 1.49 0.60 164
Absolute risk 1.51 0.62 164
Systematic review 1.47 0.69 164
Odds ratio 0.99 0.74 162
Meta-analysis 1.12 0.85 164
Confidence Interval 1.05 0.80 163
Heterogeneity 0.99 0.82 164
Publication bias 1.17 0.77 164
Overall Mean Score 1.22 0.22 164
4.20 Measure of understanding of the terms among the respondents
Knowledge of respondents regarding various terms were determined by their responses on
8 questions on three point Linkert scale (0 = do not understand; 1=understand somewhat;
2=understand completely). The cronbach’s alpha test for reliability for the scale was
obtained to be 0.89 which is highly significant. The overall mean score for the
understanding of the terms is 1.22.Hence it can be said that there is good understanding of
the terms among the respondents regarding the research terms.

Page 56 of 80
Table 14. Logistic regression analysis between understanding of the research terms
and demographic variables
4.21 Logistic regression between understanding of research terms and demographics
The table shows statistically significant association between Level of specialization and
knowledge regarding specific terms. (p=.004). It was found that the specialization level
respondents thought they had the understanding of the research terms three times than that
of those respondents who did not have any specialization
Factor Level N Odds ratio
(95% CI)
p df
Specialization Specialization
No
specialization
56
107
2.6 (1.3 -5.2)
Reference
.004 1
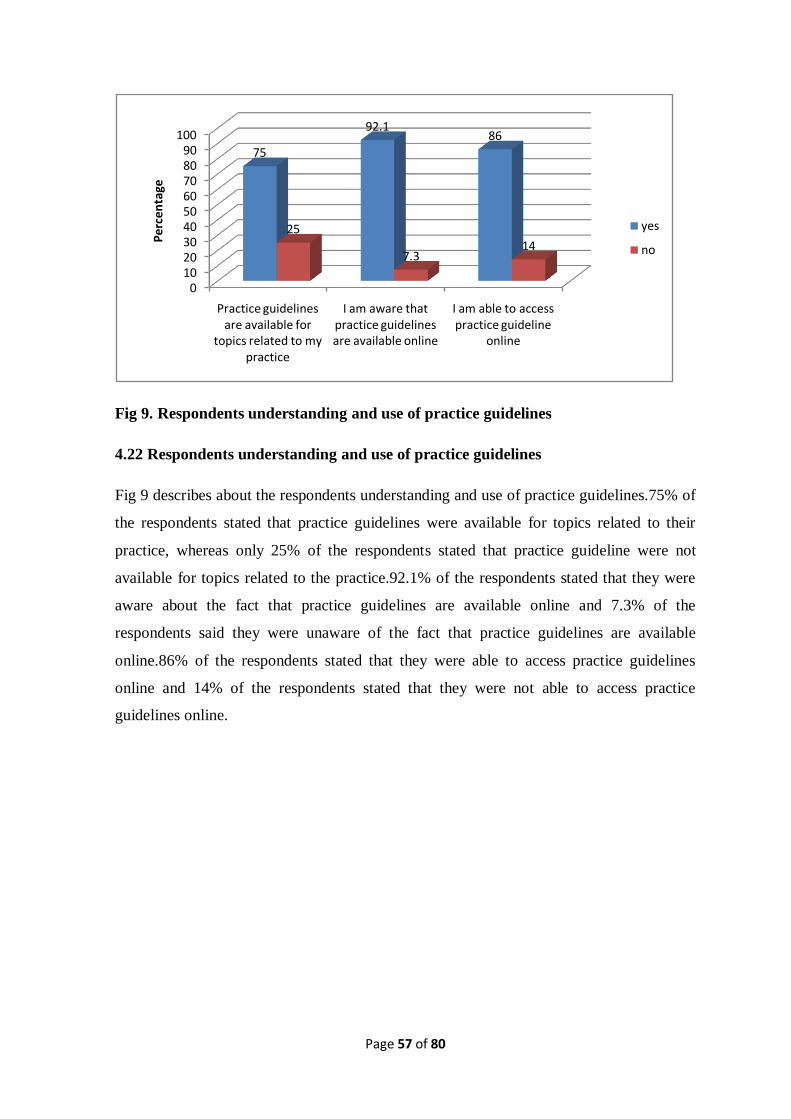
Page 57 of 80
Fig 9. Respondents understanding and use of practice guidelines
4.22 Respondents understanding and use of practice guidelines
Fig 9 describes about the respondents understanding and use of practice guidelines.75% of
the respondents stated that practice guidelines were available for topics related to their
practice, whereas only 25% of the respondents stated that practice guideline were not
available for topics related to the practice.92.1% of the respondents stated that they were
aware about the fact that practice guidelines are available online and 7.3% of the
respondents said they were unaware of the fact that practice guidelines are available
online.86% of the respondents stated that they were able to access practice guidelines
online and 14% of the respondents stated that they were not able to access practice
guidelines online.
0102030405060708090
100
Practice guidelines are available for
topics related to my practice
I am aware that practice guidelines are available online
I am able to access practice guideline
online
75
92.186
25
7.314
Pe
rce
nta
ge
yes
no

Page 58 of 80
4.23 Attention to Literature
This category included questions regarding reading literature related to clinical practice,
how often Physiotherapists use Evidence Based Practice and searching of the literature
using relevant search engienes.
Fig 10. Self-reported articles read per month
Figure 10 clearly gives the picture of number of articles read per month. It shows that only
32.3% of the respondents read less than 2 articles per month which clearly shows that
remaining respondents read more than 2 articles per month. Also, Salbach (2010) reported
33% of Physiotherapists read less than 2 articles per month which is similar to our
findings. 44.5% of the respondent read 2 to 5 articles in a month which is the highest
percentage of it recorded and only 3.7% read more than 16 articles per month.12.8% of the
total respondents read 6 to 10 articles per month and 6.7% read 11 to 15 articles per
month.
32.3
44.5
12.8
6.73.7
0
5
10
15
20
25
30
35
40
45
50
<2 2 to 5 6 to 10 11 to 15 >16
Self-reported articles read per month

Page 59 of 80
Fig 11. Self-reported use of Evidence
The above figure 11 shows the self-reported use of professional literature and research
findings in the process of clinical decision making. The chart clearly shows that maximum
of 39% of the respondents often used professional literature for clinical decision making.
And 16.5% responded that they always used Evidence-Based Practice followed by 32.9%
of the Physiotherapist respondents who said they used evidence based practice sometimes
followed by only 11.6% of the Physiotherapist respondents who used the literature rarely.
Physiotherapist respondents were asked a question regarding the search engines they used
for searching the literature. The medical search engines used by the respondents were Pub
Med, Pedro, Physiopedia, Google scholar, Wikipedia, Elseilver, Tos PT, Med Plus, Med
Scape, Mayo Clinic, Cochrane, JosPT, SCI hub, Pedro, NCBI, Pub Central , elearn SCI,
Science Direct, Embase, SAGE etc
No association was found between the number of articles read and access of articles at
home and access to articles outside place of work. Also no association could be found
between the frequency at which the respondents used literature for clinical decision
making and no of articles read per month.
11.6
32.9
39
16.5
0
5
10
15
20
25
30
35
40
45
rarely sometimes often always
Pe
rce
nta
ges

Page 60 of 80
Table 15. Association between attitude and attention to literature
Factor Level χ2 p value df
Use of
professional
literature and
literature
findings
Rarely
Sometimes
Often
Always
11.91 .008 3
No of articles
read per month
<2
2-5
6-10
11-15
>15
9.50 .050 4
4.24 Association between attitude and attention to literature
The above table14 shows that the Pearson chi square provides χ2 value 11.91 with p
value
= .008.Therefore, the test is highly significant at 3% level of significance. Hence there is
strong evidence to conclude that the relationship between the two variables (Attitude and
use of literature findings and literature search) is significant.
Also, Pearson chi square provides χ2 value 9.50 with p value = .050.Hence, the test is
marginally significant at 4% level significance. Hence there is only less evidence to
conclude that the relationship between the two variables that are attitude and no of articles
read per month is significant. As compared to the table value where χ2 =9.49 the chi-
square value obtained was 9.50 which was a little more than the table value.

Page 61 of 80
4.25 Access and Availability of resource to access information
Fig 12 Access to search engines at place of work
Fig 13 Access to search engines away from work
It can be seen from the above figure 12 that 72% of the respondents said they had access
to search engines at place of work and remaining 28% did not have access to search
engines at their place of work .In this way it can be seen that maximum respondents had
search engines at their place of work which is good for Evidence Based Practice.
Fig 13 shows that around 77.4% of the respondent said that they had access to the search
engines outside their place of work and only 22.56% of the respondents said they had no
access to search engines outside their place of work.
77%
23%
yes
no
77.40%
22.50%
yes
no

Page 62 of 80
Fig 14 Respondents work supports use of current research practice
Figure 14 clearly shows that around 64% agreed or strongly agreed that their work place
supported the use of current research in practice.29.26% were neutral towards the
workplace support to use current research. Only about 6.5% of the respondents disagreed
or strongly disagreed that their workplace supported use of current research in practice. It
is good that around 64% of the workplace had positive attitude towards Evidence Based
Practice. There was no significant association found between access to and availability of
literature which showed that no association was found between the type of facility and
access to search engines at place of work.
1.82
4.87
29.26
46.34
17.68
0 10 20 30 40 50
strongly disgaree
disagree
neutral
agree
strongly agree

Page 63 of 80
4.26 Barriers towards Evidence Based Practice
Fig: 15 Self reported ranking of Barriers to Evidence Based Practice
Figure 15 clearly depicts the picture of barriers towards Evidence-Based Practice. The
maximum number of participants that is 67.06% indicated that insufficient time was one
of the top three barriers to Evidence-Based Practice.62.8% of the respondents stated lack
of research skills to be among the top three barriers to Evidence Based Practice followed
by inability to apply research findings in patient population where 61.6% of the
respondents marked it as top 3 barriers to Evidence Based Practice. Limited access to
search engines was considered to be the top 3 barriers to Evidence Based Practice by
around 53.04% of the respondents. Around 34.1% of the respondents ranked lack of
support from colleagues as top three barriers to Evidence Based Practice. Lack of interest
has been stated as top 3 barriers to Evidence Based Practice by only 23.8% of the
respondents which is the minimal percentage among the 6 options.
28.6518.29
4.9 4.914.6
25.6
17.68
17.68
9.1 9.1
29.920.7
20.73
17.07
9.820.1
17.1 16.5
0
10
20
30
40
50
60
70
80
Insufficient time
Limited access to
search engienes
Lack of interest
Lack of support
from colleagues
Inabilityto apply
research findings in
patient population
Lack of research
skills
Pe
rce
nta
ge
Third in importance
second in importance
First in importance

Page 64 of 80
Barriers
The major barriers that were described by the Physiotherapists other than the ones
mentioned in the Questionnaire were as follows. They mentioned cross-cultural
adaptability and socio-economic factor as the barriers. Lack of awareness among the
patient, Lack of interest as well as the traditional beliefs of the patients and the impact of it
on their mindset was also considered to be the greatest barriers towards Evidence based
Practice. Other Physiotherapists stated about the lack of adequate time in the hospital due
to heavy patient flow.
Lack of sufficient research equipment was also considered to be the barrier towards
Evidence-Based Practice. These include mainly lack of access to maximum number of
articles as they need to be paid and also the lack of access to full articles. They feel that
the Evidence Based Practice is recent advancements which are not readily available in
developing countries. Lack of co-operation from the higher authorities also has been seen
as a major hindrance towards Evidence Based Practice. It was known during the visit to
different hospitals and meeting the Physiotherapists that the doctors had access to certain
search engines as well as the articles but as per in the Physiotherapy department it was not
accessible. It seemed that Physical Therapists needed to talk to the concerned authority
regarding the access to the various articles and search engines. Physiotherapists have also
mentioned that in case where strong recommendation by the doctors regarding some cases
for literature search was made, the articles were searched for.
They have also pointed out that the articles published do not have a valid source in
number of cases. Also numerous literatures have focused on the fact about the credibility
of the articles that are present till date. The other group of Physiotherapists argued about
the limited quality article and also few emphasized on the limited quality articles that can
be trusted on for the Evidence-Based Practice. Physiotherapist and Patient ratio is also the
other factor that Physical Therapists find it as a barrier for Evidence Based Practice that is
Physiotherapists need to treat maximum number of patients. Lack of proper environment
as well as lack of motivation was also considered to be the barriers to Evidence Based
Practice by the Physiotherapists. This includes lack of support from the fellow researchers,
also lack of team, and understanding among the team as well as lack of encouragement in
the team. Some Physical therapists consider it to be time-consuming and others state about
the lack of knowledge related to medical search engines.

Page 65 of 80
Physical Therapists have also focused on the lack of governance from the Physiotherapy
bodies like NEPTA. Several literatures have described about the importance of continuous
professional improvement in terms of Evidence Based Practice. Also lack of enough
seminar and conferences regarding the particular subject has been demotivating factor for
certain number of Physical Therapists. This in turn leads to lack of awareness among the
Physical Therapists themselves.
The difficulty in understanding of certain terminology used in the literature also makes it
difficult for certain Physical therapists to conduct Evidence Based Practice.

Page 66 of 80
CHAPTER-V DISCUSSION
The main purpose of the study was to find out about the level of attitude and knowledge
towards Evidence based practice and also to list out the major barriers towards Evidence-
Based practice. The demographics section consisted of information regarding the
respondent Physiotherapists and also the factors that could associate with the level of
knowledge and attitude and could create barriers for Evidence-based practice.
In the demographic section total male respondents were 47.6% and the female respondents
were 52.4% .This percentage varied from the two other study by Jette et al where total
male respondents were32.8% and female respondents were 32.8% and also from Yahui &
Swaminathan where total male percentage were 25.5% and female percentage were
73.5%.
Maximum percentage of respondents was in the age group 21-30 years and similar was
found in the study by Yahui & Swaminathan where maximum number that is 85.3% of the
respondents lie in the age group 25 to 34. However study by Akinbo et al. (2008) found
maximum number of Physiotherapists between 30 to 39 years of age that is 58%.
As far as specialization level is concerned, maximum of 65.2% had no specialization and
remaining of those who had specialization 14.6% had musculoskeletal as their major
specialization. According to the study by Jette et al. (2003), demographics had 54.8% as
clinical instructor and 5.3% had specialization in orthopedics.
Maximum number of respondents fell into the category where number of years worked as
a Physiotherapist were less than 2 years which comprised about 39.6%.According to the
study by Yahui & Swaminathan (2017) number of years worked as Physiotherapists
between 5 to 10 years was 23.5% compared to the result obtained in the study where
33.5% worked between 5 to 10 years of age.
A study by Ramirez –Velez et al. (2015) showed that number of Physiotherapists working
less than 20 hours per week was 10.7% and other study by Jette et al.(2003) showed
number of Physiotherapists who worked less than 20 hours per week were 7.2%. The
researcher’s study showed that only 3.7% of the Physiotherapists worked less than 20
hours per week and 62% of the Physiotherapists worked more than 40 hours per week
compared to the study with Ramirez et al. (2015) where 32.4% worked more than 40 hours
per week. But, Jette et al. (2003) had similar results where 59.2% worked more than 40

Page 67 of 80
hours per week. The results obtained in the study clearly describes about the overload of
work among the Physiotherapists. Maximum numbers of Physiotherapists work for more
hours in a week arising question regarding the time for reading scientific articles in order
to incorporate EBP.
The researcher showed that 23.8% saw more than 15 patients in a day and only 8.5% saw
less than 5 patients in a day. According to the study by Akinbo et al. (2008) 22% saw
more than 15 patients in a day 16% saw less than 5 patients in a day which had similar
findings. Our study showed that 39.6% of the respondents had less than 5 Physiotherapist
working in area of practice, 7.9 % of the respondents had more than 15 Physiotherapists
working in area of practice. The study by Ramirez-Velez et al. (2015) showed that 39.2%
of Physiotherapists had less than 5 Physiotherapists working in their area of practice which
showed similar percentage as our studies and 16.7% had more than 15 Physiotherapists
working in their area of practice which is slightly greater than that obtained from our
study.
There was variation in the facility that best described the place where the Physiotherapists
worked. Researcher’s study showed that 54.3% of the Physiotherapists worked at the acute
care hospital. A study by Jette et el. (2003) showed that maximum number of
Physiotherapists 34.2% worked in a private out-patient clinic and only 13.5% worked in
acute care hospitals. A recent study by Yahui & Swaminthan (2017) showed that around
21.6% of the Physiotherapists worked in government hospital compared to 8.5% of the
Physiotherapists who worked in government hospital in our study. The slight increase of
Physiotherapists in government hospital in Nepal has been possible after massive
earthquake during 2015.It was then that the need for rehabilitation and role of Physical
therapists were recognized in government level and vacancies were announced in different
posts foe the Physiotherapists.
The results obtained suggested that Physiotherapists had generally positive attitude
towards Evidence-Based Practice. Majority of the Physical Therapists thought application
of EBP was necessary in practice of Physical Therapy and literature and research were
useful in day to day practice. Also they believed Evidence–Based practice improved
quality of patient care. A similar survey in Nigeria reported that maximum of 99% agreed
or strongly agreed EBP is necessary. Literature is useful to practice (98%), EBP improves
quality of patient care (98%), they need to increase use of Evidence in their daily practice

Page 68 of 80
(99%), and evidence helps in decision-making (88%). Sixty-nine percent disagreed or
strongly disagreed EBP places unreasonable demand on Physical Therapists. In the study
neutral was chosen most often in the item, EBP does not take into account patient
preferences (Akinbo et al., 2008). The findings were similar to our study. The beliefs had
been reflected in prior studies of physicians and nurses as well. McColl et al. (1998) found
that most physicians, general practitioners surveyed in United Kingdom agreed that
practicing using evidence improve patient care. A similar study by Jette et al. (2003)
discussed about proponents of EBP , however, have frequently reiterated that evaluation
of patient preferences, circumstances and values is part of clinician’s decision in
determining appropriate intervention.
In a study by Karki et al. (2015) among nurses regarding the attitude towards Evidence-
Based Practice the mean score of 3.6 was considered as positive attitudes towards
Evidence Based where score was from 1 to 5. In our study the mean score of 2.89 was
obtained for score from 0 to 4 which indicated positive attitude in our study as well (Karki
et al., 2015).
In our results association was seen between EBP variables and Gender, specialization,
number of Physiotherapist working in area of practice, facility at which Physiotherapist
work, number of patients seen in a day and number of hours worked per week. No
association was seen between the age as mentioned by Akinbo et al. (2008) in Nigeria.
The article also showed association between attitude and belief and years since licensure
which was not shown in our study.
As contrast to the study by Jette et al. (2003), where belief about whether evidence existed
to support their practice was not related depending or area of practice, our study found out
that respondents working on area of practice that is acute care hospital believed literature
and research helped to improve patient care nine times than those who worked at other
facility.
As with many studies regarding attitudes towards Evidence-Based Practice. Maximum
number of Physiotherapists showed positive attitude towards Evidence-based practice
In this study 68.3% of the Physiotherapists agreed or strongly agreed that they were
confident in their ability to critically review professional literature which was somewhat
similar to that attained by Jette et al. (2003), where 55% of the respondent stated they were

Page 69 of 80
confident in their skills. Also in the study, 70% of the respondents agreed or strongly
agreed that they had knowledge regarding search engines where as our study stated that
84.2% of the Physiotherapists had knowledge regarding the search engines. Also, study by
Jette et al. (2003) forty-two percent agreed and forty percent strongly agreed that they
engaged in educational sessions in foundations of EBP and our study showed 48.8%
strongly agreed and 29.3% agreed in learning EBP in academic years. In both study it
showed respondents diverse nature in expressing whether or not they had learnt about
EBP in their academic years.
The mean score of 2.74 was obtained for score measuring from (0 to 4) as compared to the
knowledge and skill scores of nurses that was 4.1 measuring from (1 to 6). The knowledge
regarding Physiotherapists could be considered moderate with mean percentage of 68.5%.
It was found in the study by Akinbo et al. (2008) that significant association was found
between knowledge and skills for Evidence based practice and variable age. Our study
found association between age, gender, specialization, number of years worked as a
Physiotherapists and number of hours worked per week. For stable models where
regression analysis could be carried out our study showed that Physiotherapists receiving
of formal training was greater in less than 2 years of working as a Physiotherapists rather
than greater years of work experience. This could be explained by introduction to
Evidence based practice in later years in Physiotherapy.
The study by Jette et al. (2003) discussed about those having bachelors degree as their
highest certificate were less likely to have the skills or training required for evidence-
based practice compared to those with masters degree. Similarly in our study those having
specialization degree were more confident in their ability to critically review professional
literature.
Also the understanding of certain research terms was associated with highest degree
obtained. As obtained in the study by Jette et al. (2003) respondents with baccalaureate
degrees had less knowledge of the research terms rather than those having masters’
degree. Similar findings were obtained in our study where those having specialization
degree were two times more likely to understand the terms rather than those not having
specialization degree. This could be explained by the fact that those Physiotherapist
having specialization degree need to perform a research thesis for the sake of partial
fulfillment of their course. Hence they have come along with the research terms. The least

Page 70 of 80
understood word like in Illes et al. (2006) was odds ratio and similar findings were
obtained in our study. Our study also showed heterogeneity and confidence interval as the
least understood words. McColl et al. (1998) found that of those who indicated they could
explain a term to others; in fact no one could do so satisfactorily according to essential
teaching criteria. Hence level of understanding in our study may be over-estimated as well.
A study by Yahui & Swaminathan (2017) stated that 30.4% of the Physiotherapists read
less than two articles in a day which was similar to our study where 32.3% of the
Physiotherapists read less than 2 articles in a day. Only 4% read more than 15 articles in a
day compared to our study where3.7% read more than 15 articles in a month which
showed similar result. It was found that there were no respondents who never used
professional literature and research findings compared to the study where 4.9% never used
literature search.46.1% of the respondents in the article used sometimes compared to our
study where 32.9% used professional literature sometimes. Prescott et al. (1997) found out
that depending on database 10% to 90% of sample of general practitioner in the United
Kingdom referred to the sources occasionally.
Use of evidence in practice is possible only when there is efficient access to information
resources. Efficiency mainly requires easy retrieval of information, use of online resources
and skill in finding relevant resources. The respondents had access to information.
Respondents had access to information more at home compared to work
Maximum number of Physiotherapists have stated about the availability and use of
practice guidelines to be yes. However the authenticity of the response cannot be
confirmed without the qualitative study as well. It’s very natural for the respondents to say
yes regarding the questions but reality may not be the same. However the article by Jette et
al., 2003 did not included the result in their part of report and the reason for it was not
mentioned. 77% had access to search engines at home compared to 72% who had access
to search engines away from home. Article by Jette et al. (2003) had 89% access to search
engines at work and 65% access to search engines away from work. No significant
association was seen between the type of attention and access and availability in both the
article as well as our study.
According to the article by Grol & Wensing (2004), perceived barriers to implementing
change had cognitive factors, attitude of physician, social and organizational context and

Page 71 of 80
economic context. The major barrier was found to be time in our study with 28.65% citing
as 1st in importance as a major barrier.
Gosling (2004) stated main barrier towards adoption of system was lack of training
associated with its use. Jette et al. (2003) reported 67% of the respondents’ stated
insufficient time as one of the top three barriers. Palfreyman et al. (2003) also described
about the insufficient time as the most difficult barrier to overcome for both nurses and
Physiotherapists. When asked regarding the barriers among the Physiotherapists in other
item some have stated that time is no barrier to Evidence based practice.
Only 4.9% of the respondents from our study have cited lack of support from colleagues
as the barrier first in importance. However Restas (2003) have stated lack of support from
colleagues as top barrier to Evidence-based practice. Support from the colleagues also is
one of the important factor responsible for support in EBP. As the other researchers time
was obtained as the major barriers to Evidence Based Practice. In case of study by Jette et
al. (2003) time was considered to be major barrier to Evidence Based Practice with 67% of
the respondents ranking it as the major barriers to Evidence Based practice where co-
incidentally same figure of 67.02% was obtained for our study. And other similarity was
that of a lack of interest where only minimal percentage of the respondents considered as
the top 3 barriers to Evidence-Based Practice. Our study indicated the total percentage of
23.85 of the respondents whereas the study by Jette et al. (2003) showed only 11% of the
respondents said it as one of the topmost 3 barriers. The barriers obtained from Nepal have
been similar as those of the other countries such as access to the studies and Continuous
Education Program (Haynes & Haines, 1998). Lack of time has been cited as a major
barrier in majority of the articles (Jette et al., 2003; Mc Coll et al., 1998).Lack of access to
full articles also has been one of the major barriers pertaining towards Evidence-Based
Practice (Bennett at al.,2007). Also other factor that the respondents majorly focused on
was the quality of the articles published ( Petrisor & Bhandari, 2006)

Page 72 of 80
5.1 Limitations of the study
There have been certain limitations in the study which are as follows
1.The sampling technique used in the study was purposive sampling ,hence there were
chances of certain bias as the Physiotherapists were chosen purposively without random
sampling as only the name of the Physiotherapists were present with Nepal Health
Professional Council and no further information could be obtained.
2. The sample size was obtained at 7% precision as the time was limited as so were the
resources .As the sample size was relatively small there could be some bias in the
representative of the entire population.
3. The questionnaires were self-reported hence there are chances where Physiotherapists
did not answer truthfully and just ticked on the best answer possible in order to obtain
positive responses.
4. The reliability score for one item was less for the questionnaire.
5. Other bias could come from our decision to collapse into just two categorized that is
agree and disagree in order to carry out further analysis of regression. It is said that
information is lost when data are reduced into simple categories of positive and negative
response. Such data reduction and application of logistic model shows abrupt change in
odds at a point chosen for distinguishing 2 different categories for the variable.

Page 73 of 80
CHAPTER -VI CONCLUSION AND RECOMMENDATION
6.1 Conclusion
Physical therapists of Nepal who were registered under Nepal Health Research Council
had positive attitude towards Evidence-based practice. It was found that the
Physiotherapists were interested in learning more about Evidence-Based practice and
thought it was necessary in practice of Physical therapy. There were significant association
between variable of attitude and specialization level and facility at which the
Physiotherapists worked. They had moderate knowledge regarding evidence based
practice .They had relatively good understanding regarding the research terms as obtained
from our study. There were association with specialization level, age and number of years
working as a Physiotherapists and knowledge and skill variables with those having
specialization level and lower work experience having more knowledge and skills
regarding Evidence based practice. This probably could be because of greater use of
internet and online resources in the recent years. Relation was obtained between attention
the literature and attitude towards evidence-based practice. Access to literature was more
away from work then at the work. The major barrier to Evidence based practice measured
was insufficient time followed by lack of research skills and then limited access to search
engines. The findings obtained from the study have several practical implications.

Page 74 of 80
6.2 Recommendations
The quantitative study alone do not seem that effective in ways that they just answer the
questions and there are very less chances to keep the views of the individual
Physiotherapists regarding the particular topic. Mixed study is much more effective to see
whatever results have been obtained can be compared to what has been explained in
qualitative study. In future mixed study would be more effective to be carried out to
understand about the attitude regarding Evidence Based Practice. Also Focus group
discussion could be one the effective measures towards generating conclusion regarding
Evidence-Based practice. The study consisted of lesser sample size as it meant mainly for
the academic purpose. In future study could be carried out with greater sample size so that
it becomes more representative of the entire population. The study can be carried out after
any workshop or symposium related to Evidence-based practice so that the attitude and
knowledge so that change regarding Evidence-based practice can be seen.During the
study, data collection were conducted by visiting different hospitals and rehabilitation
centers for some interaction among the Physiotherapists where they generally shared about
the doctors having access to medical search engines in their department where as
Physiotherapists unaware about the availability of search engines. These matters could be
solved by effective communication with the authority and the Physiotherapists working in
the hospitals for effective treatment measures.Mainly Physiotherapists having no
specialization had less knowledge regarding Evidence-Based practice than those having
specialization, hence it is important to carry out continuous professional development
programs for improvement of Evidence based practice. Insufficient time is also one of the
major barriers towards Evidence based practice. Hence EBP trainings need to be included
for continuous quality improvement of Physiotherapy profession.

Page 75 of 80
References
Aarons, G. A., Cafri, G., Lugo, L., & Sawitzky, A. (2012). Expanding the domains of
attitudes towards evidence-based practice: The evidence based practice attitude
scale-50. Administration and Policy in Mental Health and Mental Health Services
Research, 39(5), 331–340. https://doi.org/10.1007/s10488-010-0302-3
Akinbo, S., Odebiyi, D., Okunola, T., Aderoba, O. (2008). Evidence-Based Practice:
Knowledge, Attitudes and Beliefs of Physiotherapists in Nigeria. The Internet
Journal of MedicalInformatics, 4,2.Retrieved from http://ispub.com/IJMI/4/2/3229.
Alper ,B.,S., Hand ,J.,A., Elliott, S.,G., Kinkada, S., Hauan ,M.,J., Onion, D.,K., Sklar
,B.M. (2004).How much effort is needed to keep up with the literature relevant for
primary care? J Med Libr Assoc,92,429–37.
Barnard, S., Wiles, R. (2001). Evidence-based physiotherapy: physiotherapists’ attitudes
and experiences in the Wessex area. Phys Ther, 87,115–124.
Bekkering, G., E., Van Tulder, M., W., Hendriks, E., J., Koopmanschap, M.,A.,Knol,
D.,L., Bouter, L.,M.(2005). Implementation of clinical guidelines on physical
therapy for patients with low back pain: randomized trial comparing patient
outcomes after a standard and active implementation strategy. Phys Ther
85,544–555.
Bland, J. M., & Altman, D. G. (2000). The odds ratio. Bmj, 320(7247), 1468.
https://doi.org/10.1136/bmj.320.7247.14.
Bennett, S., McKenna, K., Hoffmann, T., Tooth, L., McCluskey, A., Strong, J. (2007). The
value of an Evidence database for occupational therapists: an international online
survey. Int J Med Inform ,76, 507e13.
Canadian Institutes of Health Website. (2006). Knowledge Translation. Retrieved from
http://www.cihr-irsc. gc.ca/e/8505.html.
Chan, S., Clough, A. (2010). A critical evaluation of evidence-based practices of
Physiotherapy in musculoskeletal medicine. IMM, 32,163–6.

Page 76 of 80
Cochrane, L.J., Olson, C.A., Murray, S., Dupuis, M., Tooman, T. (2007).Gaps between
knowing and doing: understanding and assessing the barriers to optimal health
care. Journal of Continuing Education in the Health Professionals. 27, 94-102.
Fristedt, S., Areskoug, J. K., Kammerlind, A. (2016). Factors Influencing the Use of
Evidence-Based Practice among Physiotherapists and Occupational Therapists in
Their Clinical Work. The Internet Journal of Allied Health Sciences and Practice.
14(3).Retrieved from https://www.researchweb.org/is/lj/ansokan/217181.
Aarons, G. A., Cafri, G., Lugo, L., & Sawitzky, A. (2012). Expanding the domains of
attitudes towards evidence-based practice: The evidence based practice attitude scale-
50. Administration and Policy in Mental Health and Mental Health Services
Research, 39(5), 331–340. https://doi.org/10.1007/s10488-010-0302-3
Glynn, E.A. (2003). An evidence based national quality and measurement and reporting
system.Medcare, 41(1), I8-I15.
Gorgon, E.,J.,R, Barrozo , H.,G.,T, Mariano ,L.,G., Rivera, E.,F. (2012). Research
evidence uptake in a developing country: a survey of attitudes, education
andself-efficacy, engagement, and barriers among physical therapists inthe
Philippines. J Eval Clin Pract .
Grimmer-Somers, K., Lekkas, P., Nyland, L., Young, A., & Kumar, S.
(2007).Perspectives on research evidence and clinical practice: a survey of
Australian physiotherapists. Physiotherapy Research International, 12(3), 147–61.
Haynes ,B., Haines, A.(1998). Barriers and bridges to evidence based clinical practice. Br
Med J ,317:273e6.
Hakkennes, S., & Dodd, k. (2008) .Guideline implementation in allied health
professionals: a systematic review literature. QualSaf Health care, 17, 296-300.
Heiwe S, Kajermo KN, Tyni-Lenné R, Guidetti S, Samuelsson M,Andersson I-L, et
al. (2011). Evidence-based practice: attitudes, knowledge and behaviour among
allied health care professionals. Int J Qual HealthCare ,23,198–209.
Iles, R., & Davidson, M. (2006). Evidence based practice: a survey of physiotherapists’
current practice. Physiotherapy Research International, 11(2), 93–103.

Page 77 of 80
https://doi.org/10.1002/pri.
Jansen, L., Rasekaba, T., Presnell, S., Holland, A.E. (2012). Finding evidence to support
practice in allied health: peers, experience, and the internet. J Allied Health
41,154–61.
Jewell , D.,V., Moore, J.,D., Goldstein, M.,S. (2013). Delivering the physical therapy
value proposition: a call to action. Phys Ther ,93,104–14.
Karin, H., Filip, S., Jo, G., & Bert, A. (2009). Obstacles to the implementation of
evidence-based physiotherapy in practice: A focus group-based study in Belgium
(Flanders). Physiotherapy Theory and Practice, 25(7), 476–488.
https://doi.org/10.3109/09593980802661949
Karki, S., Acharya, R., Budhwani, H., Shrestha, P., Chalise, P., Shrestha, U., Gautam, K.
& Wilson, L. (2015). Perceptions and Attitudes towards Evidence Based Practice
among Nurses and Nursing Students in Nepal. Kathmandu University Medical
Journal,52(4),308-15.
Kumar, S., Grimmer-Somers, K., & Hughes, B. (2010). The ethics of evidence
implementation in health care. Physiotherapy Research International, 15, 96-102.
Lyons, C., Brown, T., Tseng, M.H., Casey, J., & McDonald, R. (2011). Evidence-based
practice and research utilization: Perceived research knowledge, attitudes, practices
and barriers among Australian pediatric occupational therapists. Australian
Occupational Therapy Journal.58, 178-86.
Maigeh, E.P. (2003).The Perceived Attitudes, Knowledge and Barriers Towards Evidence-
Based Practice Amongst Physiotherapists in Tanzania (Master’s Thesis). Retrieved
from
http://etd.uwc.ac.za/xmlui/bitstream/handle/11394/1454/Maigeh_MSC_2004.pdf?s
equence=1.
McColl A, Smith H, White P, Field J. (1998).General practitioner's perceptions of the
route to evidence based medicine: a questionnaire survey. Br Med J,316, 361e5
Menon, A., Korner-Bitensky, N., Kastner, M., McKibbon, K.A., Straus, S. (2009).
Strategies for rehabilitation professionals to move evidence based knowledge into

Page 78 of 80
practice: A systematic Review. Journal Rehabilitation Medicine.41, 1024-
1032.Retrieved from https://www.ncbi.nlm.nih.gov/pubmedhealth/PMH0027413/.
MGraham, F., Robertson, L. & Anderson. (2013). New Zealand occupational therapists’
views on evidence-based practice: A replicated survey of attitudes, confidence and
behaviors. Australian Occupational Therapy Journal, 60, 120-128.
Ministry of Health - MOH/Nepal, New ERA/Nepal, and ICF. 2017. Nepal Demographic
and Health Survey 2016. Kathmandu, Nepal: MOH/Nepal, New ERA, and ICF.
Available at http://dhsprogram.com/pubs/pdf/FR336/FR336.pdf.
Mota da Silva, T., da Cunha Menezes Costa, L., Garcia, A. N., & Costa, L. O. P. (2015).
What do physical therapists think about evidence-based practice? A systematic
review. Manual Therapy, 20(3), 388–401. https://doi.org/10.1016/j.math.2014.10.009
Nilsagård ,Y., Lohse, G.(2010). Evidence-based physiotherapy: a survey of knowledge,
behavior, attitudes and prerequisites. Adv Physiother, 12,179–86.
Panhale, V.P., & Bellare, B. (2015).Evidence-Based Practice among Physiotherapy
Practitioner in Mumbai. Education for health, 28(2) .Retrieved from
http://www.educationforhealth.net.
Palfreyman,S.,Tod,A. & Doyle,J. (2003). Comparing evidence-based practice of nurses
and Physiotherapists. British Journal of Nursing, 12(4).
https://doi.org/10.12968/bjon.2003.12.4.11165.
Petrisor B, Bhandari M. ( 2006).Principles of teaching evidence-based medicine.
Injury,37,335e9.
Ploeg, J., Eccles, M., & Tetroe, J. (2007). Factors influencing best practice guideline
implementation: lessons learned from administrators, nursing staff and project
leaders. Worldviews Evidence Based Nursing, 4, 210-219.
Ramírez-Vélez1, R., Bagur-Calafat M. C., Correa-Bautista,J.E. &Girabent-Farrés,
M.(2015).Barriers against incorporating evidence based practice in physical
therapy in Colombia: current state and factors associated .BMC Medical
Education, 15, 220.

Page 79 of 80
Rebbeck , T., Maher, C.G., Refshauge , K.M.(2006). Evaluating two implementation
strategies for whiplash guidelines in physiotherapy: a cluster randomised trial.
Aust J Physiother ,52,165–74.
Rycroft-Malone, J. (2015). From knowing to doing - from the academy to practice.
International Journal of Health Policy and Management, 2, 45-6.
http://dx.doi.org/10.1186/s12909-015-0502-3.
Sackett, D. L., Rosenberg, W.M. C., Gray, J. A. M., Haynes R Brian, Richardson W .S.(
1996). Evidence based medicine: what it is and what it isn't, BMJ, 312 -71.
Salbach, N.,M., Guilcher, S., J.,T., Jaglal, S.,B., Davis, D.,A. (2009). Factors influencing
information seeking by physical therapists providing stroke management. Phys
Ther ,89, 1039–50.
Scurlock-Evans, L., Upton, P., & Upton, D. (2014). Evidence-Based Practice in
physiotherapy: A systematic review of barriers, enablers and interventions.
Physiotherapy (United Kingdom), 100(3), 208–219.
https://doi.org/10.1016/j.physio.2014.03.001
Swedish National Board of Health and Welfare. (2011). Management System for
Systematic Quality Work. Swedish National Board of Health and Welfare,
Stockholm.
Stevenson, K., Lewis, M., Hay, E. (2004). Do physiotherapists’ attitudes towards
evidence-based practice change as a result of an evidence-based educational
programme. J Eval Clin Pract,10,207–1.
Straus, S.E, Glasziou, P., Richardson, S.W, Haynes, B.R. (2011). Evidence-Based
Medicine How to Practice and Teach it. 4th ed. London: Churchill Livingstone.

Page 80 of 80
Teijlingen.,V.,E. (2015).PARI: Strengthening Health Research in Nepal. [Power point
Slides] Retrieved
fromhttp://blogs.bournemouth.ac.uk/research/files/2015/04/Presentation-April-
2015-Soc-Sci-Baha.pdf.
Turner, P., & Whitfield, T. W. (1997). Physiotherapists’ use of evidence based practice: a
cross-national study. Physiotherapy Research International : The Journal for
Researchers and Clinicians in Physical Therapy, 2(1), 17–29.
https://doi.org/10.1002/pri.76.
Turner, P., & Mjolne I. (2001). Journal provision and the prevalence of journal clubs: a
survey of physiotherapy departments in England and Australia. Physiother Res Int,
6(3), 157–69.
Upton, D., & Lewis, B. (1998). Clinical effectiveness and EBP: Design of a questionnaire.
International Journal of Therapy and Rehabilitation, 5(12), 647–650.
https://doi.org/10.12968/bjtr.1998.5.12.14028
Van Bodegom-Vos , L., Verhoef, J., Dickmann, M., Kleijn, M., van Vliet, I.,
Hurkmans , E., et al.(2012). A qualitative study of barriers to the
implementation of a rheumatoid arthritis guideline among generalist and
specialist physical therapists. Phys Ther ,92,1292–305
Watkins, C., Timm, A., Gooberman-Hill, R., Harvey, I., Haines, A., & Donovan J. (2004).
Factors affecting feasibility and acceptability of a practice-based educational
intervention to support evidence-based prescribing: a qualitative study. FamPract ,
21 (6), 661-669. http://dx.doi.org/10.1037/a0021370.
World Confederation for Physical Therapy. (2003). Policy statement: evidence-based
practice. Retrieved from http://www.wcpt.
org/sites/wcpt.org/files/files/PS_EBP_Sept2011.pdf.
Yahui, C.H., & Swaminathan, N. (2017).Knowledge, attitude and barrier towards evidence
based practice among physiotherapists in Malaysia.Hong Kong Physiotherapy
Journal, 37, 10. http://dx.doi.org/10.1016/j.hkpj.2016.12.002.

i
ANNEX I: Informed consent
Information Sheet & Consent Form
Title: Knowledge, Attitude and Barrier to Evidence Based Practice among Physiotherapists
in selected districts Nepal
Dear participant
Namaste,
I Shristi Bajracharya, a student of Dhaka University, currently pursuing Masters degree in
Rehabilitation Science under the supervision of Mr. Mohammad Anwar Hossain at Bangladesh
Health Professional Institute. I would like to request you to participate in the research study to find
out about the knowledge, Attitude and Barrier to Evidence Based Practice among Physiotherapists
in Nepal.If you participate in the research study you will be asked to fill in the Questionnaire that
consists of several questions. The research will be directly beneficial for professional development
of all the Physiotherapists of Nepal as it is mainly responsible for determining knowledge,
attitude and barrier to Evidence-based Practice which is the most practiced and considered useful
all over the world . Please try to give truthful answers as much as possible. If you have any
questions regarding the survey and questionnaire you may ask the researcher.
Agreeing to this study gives researcher permission to use the information given by you and it is
mandatory for the research. The information will be used but the information that can identify you
will not be disclosed or published. Participating in the study is completely voluntary and you may
chose not to participate as well.
I have read the above information, or it has been read to me. I have had the opportunity to ask
questions about it and any questions I have been asked have been answered to my satisfaction. I
consent voluntarily to be a participant in this study.
Name of Participant__________________
Signature of Participant ___________________
Date ___________________________

ii
ANNEX:II
Knowledge attitude and Barrier to
Evidence Based Practice among Physiotherapists in selected districts of
Nepal
A Cross-Sectional Study
Code: Email:
Demographic Data
1. Gender
o Male
o Female
2. Age
3. Please indicate your field of specialization?
o No specialization
o Musculoskeletal
o Cardio respiratory
o Neurology
o Pediatric
o Sports
Others Please state : _______________________
4. How long have you been working as a physiotherapist?
o <2 years
o 2-5 years
o 5-10 years

iii
o >10 years
5. How many hours do you work per week?
o <20
o 20-30
o 31-40
o >40
6. On average, how many patients do you see in a day?
o <5
o 5-10
o 11-15
o >15
7. How many physiotherapists are currently working in your area of practice?
o <5
o 5-10
o 11-15
o >15
8. The majority of patients and types of problems you see on a daily basis are __________
cases.
o Orthopedic
o Cardio-respiratory
o Neurological
o Pediatric (<18 years)

iv
o Geriatric (>65 years)
o Sports
o Others Please state: __________
o Do not treat patients
9.
a. In a typical month, how many articles do you Read/Review research/literature related
to your clinical practice
b. Use professional literature and research findings in the process of clinical decision
making.
o Never
o Rarely
o Sometimes
o Often
o Always
10. Which of the following best describes the facility at which you do most of the patient
care?
o Acute care hospital
o Rehabilitation centre
o Private owned out- patient clinic
o Home service
o University
o Community Based Rehabilitation

v
11. Please indicate the percentage of your total work time that you spend in each type of
activity during a typical month.
Example: Patient care e 70%; Reading scientific article e 20%; Teaching e 10%
o Patient care _______%
o Reading scientific article _______%
o Teaching _______%
Part 2
This section inquires about personal under-standing, attitudes towards and perceived benefits
and limitations of Evidence-based Practice.
12. Application of EBP is necessary in the practice of physical therapy
o Strongly disagree
o Disagree
o Neutral
o Agree
o Strongly agree
13. Literature and research are useful in day to day practice
o Strongly disagree
o Disagree
o Neutral
o Agree
o Strongly agree
14. EBP places an unreasonable demand on Physical therapists
o Strongly disagree
o Disagree
o Neutral

vi
o Agree
o Strongly agree
15. I am interested in learning or improving the skills necessary to incorporate EBP into
my practice
o Strongly disagree
o Disagree
o Neutral
o Agree
o Strongly agree
16. EBP improves quality of patient care
o Strongly disagree
o Disagree
o Neutral
o Agree
o Strongly agree
17. EBP helps me make decisions about patient care
o Strongly disagree
o Disagree
o Neutral
o Agree
o Strongly agree
18. EBP does not take into account patient preferences
o Strongly disagree
o Disagree

vii
o Neutral
o Agree
o Strongly agree
19. I need to increase use of evidence in my daily practice
o Strongly disagree
o Disagree
o Neutral
o Agree
o Strongly agree
20. Literature and research findings help improve patient care.
o Strongly disagree
o Disagree
o Neutral
o Agree
o Strongly agree
21. I am interested in attending courses relating to EBP.
o Strongly disagree
o Disagree
o Neutral
o Agree
o Strongly agree

viii
22. Strong evidence is lacking to support most of the interventions I use with my patient.
o Strongly disagree
o Disagree
o Neutral
o Agree
o Strongly agree
23. Evidence-based Practice is time-consuming and places burden on me.
o Strongly disagree
o Disagree
o Neutral
o Agree
o Strongly agree
Following question inquires about personal use and knowledge of clinical practice
guidelines
24. I am able to conduct a search to answer my clinical questions confidently.
o Strongly disagree
o Disagree
o Neutral
o Agree
o Strongly agree
25. I am confident in my ability to critically review professional literature.
o Strongly disagree

ix
o Disagree
o Neutral
o Agree
o Strongly agree
26. Practice guidelines are available for topics related to my practice
o Yes
o No
o Do not know
27. I use practice guidelines in my practice
o Strongly disagree
o Disagree
o Neutral
o Agree
o Strongly agree
28. I am aware that practice guideline are available online
o Yes
o No
29. I am able to access practice guideline online
o Yes
o No
30. I am able to incorporate patient preferences with practice guidelines
o Strongly disagree
o Disagree
o Neutral
o Agree
o Strongly agree

x
The following section enquires about availability of resources to access information
and personal skill in using those resources
31. I have access to search engines in my place of work.
o Agree
o Disagree
32. My place of work supports the use of current research in practice.
o Strongly disagree
o Disagree
o Neutral
o Agree
o Strongly agree
33. I have access to search engines outside my place of work.
o Agree
o Disagree
34. I learned the foundations for EBP during my academic years.
o Strongly disagree
o Disagree
o Neutral
o Agree
o Strongly agree

xi
35. I received formal training in search strategies for finding research relevant to my
practice.
o Strongly disagree
o Disagree
o Neutral
o Agree
o Strongly agree
36. I am familiar with the medical search engines. Example: PubMed, PEDro
o Strongly disagree
o Disagree
o Neutral
o Agree
o Strongly agree
37. Please indicate the medical search engine(s) that you use.
_________________________________________

xii
38. My understanding of the following terms is:
Term Understand
completely
Understand
somewhat
Do not understand
Relative risk
Absolute risk
Systematic review
Odds ratio
Meta-analysis
Confidence Interval
Heterogeneity
Publication bias
39. Rank your barriers (from 1 to 6) to the use of evidence-based practice in your daily
practice.
Example: 1 greatest barrier; 6 weakest barrier
____ Limited access to search engines
____ In-sufficient time
____ Lack of interest
____ Lack of support from colleagues
____ Inability to apply research findings in my patient population
____ Lack of research skills
40. Please indicate other barrier(s) to the use of Evidence-based Practice.
_______________
Thank you for participating in this survey.
xiii
ANNEX III: Approval Letter

xiv
ANNEX-IV Approval of thesis proposal