D6.3 (D21) Transition Challenges.pdf - Medeas
381
This project has received funding from the European Union’s Horizon 2020 research and innovation programme under grant agreement No 691287 EU Framework Program for Research and Innovation actions (H2020 LCE-21-2015) Project Nr: 691287 Guiding European Policy toward a low-carbon economy. Modelling sustainable Energy system Development under Environmental And Socioeconomic constraints D6.3 (D21) Transition Challenges Version 4 Due date of deliverable: 23/09/2019 Actual submission date: 27/09/2019
-
Upload
khangminh22 -
Category
Documents
-
view
0 -
download
0
Transcript of D6.3 (D21) Transition Challenges.pdf - Medeas
This project has received funding from the European Union’s Horizon 2020 research and innovation programme under grant agreement No 691287
EU Framework Program for Research and Innovation actions (H2020 LCE-21-2015)
Project Nr: 691287
Guiding European Policy toward a low-carbon
economy. Modelling sustainable Energy
system Development under Environmental
And Socioeconomic constraints
D6.3 (D21) Transition Challenges
Version 4
Due date of deliverable: 23/09/2019 Actual submission date: 27/09/2019

Pg. Marítim de la Barceloneta, 37-49 08003 Barcelona www.medeas.eu [email protected] T +34 93 230 95 00 F +34 93 230 95 55
This project has received funding from the European Union’s Horizon 2020 research and innovation programme under grant agreement No 691287
2
Disclaimer of warranties and limitation of liabilities
This document has been prepared by MEDEAS project partners as an account of work carried out
within the framework of the EC-GA contract no 691287. The information and views set out in this
report are those of the author(s) and do not necessarily reflect the official opinion of the European
Union. Neither the European Union institutions and bodies nor any person acting on their behalf
may be held responsible for the use which may be made of the information contained therein.
Neither Project Coordinator, nor any signatory party of MEDEAS Project Consortium Agreement,
nor any person acting on behalf of any of them:
(a) makes any warranty or representation whatsoever, express or implied,
(i). with respect to the use of any information, apparatus, method, process, or similar
item disclosed in this document, including merchantability and fitness for a
particular purpose, or
(ii). that such use does not infringe on or interfere with privately owned rights, including
any party's intellectual property, or
(iii). that this document is suitable to any particular user's circumstance; or
(b) assumes responsibility for any damages or other liability whatsoever (including any
consequential damages, even if Project Coordinator or any representative of a signatory
party of the MEDEAS Project Consortium Agreement, has been advised of the possibility of
such damages) resulting from your selection or use of this document or any information,
apparatus, method, process, or similar item disclosed in this document.
Pg. Marítim de la Barceloneta, 37-49 08003 Barcelona www.medeas.eu [email protected] T +34 93 230 95 00 F +34 93 230 95 55
This project has received funding from the European Union’s Horizon 2020 research and innovation programme under grant agreement No 691287
3
Document info sheet
Lead Beneficiary: ARU
WP: WP6 Impacts
Task: Task 6.3 Challenges in Transition
Authors: Kat Buchmann (ARU), Aled Jones (ARU), Johanna Schönecker (ARU), Yiyun Zhang (ARU),
Nick King (ARU), Paul Stricker (ARU), Rebecca Spannenkrebs (ARU), Jordi Solé Ollé (CSIC), Roger
Samsó (CSIC), Teresa Madurell (CSIC)
Dissemination level : Public
Pg. Marítim de la Barceloneta, 37-49 08003 Barcelona www.medeas.eu [email protected] T +34 93 230 95 00 F +34 93 230 95 55
This project has received funding from the European Union’s Horizon 2020 research and innovation programme under grant agreement No 691287
4
Table of contents
DISCLAIMER OF WARRANTIES AND LIMITATION OF LIABILITIES .................................................. 2
DOCUMENT INFO SHEET ............................................................................................................ 3
TABLE OF CONTENTS ................................................................................................................. 4
SCOPE OF DOCUMENT (ABSTRACT IN DELIVERABLES) ................................................................ 8
EXECUTIVE SUMMARY ............................................................................................................... 9
1. INTRODUCTION TO DELIVERABLE ......................................................................................... 16
2. CLIMATE CHANGE ADAPTATION .......................................................................................... 17
LIST OF ABBREVIATIONS AND ACRONYMS ................................................................................................................................ 17
2.1. INTRODUCTION ..................................................................................................................................................................... 19
2.2. CHANGES IN ENERGY DEMAND .......................................................................................................................................... 20
2.3. CHANGES IN ENERGY SUPPLY............................................................................................................................................. 25
2.2.1 Effects of climate change on wind power ......................................................................................................... 26
2.2.2. Effects of climate change on solar power ........................................................................................................ 34
2.2.3. Effects of climate change on hydroelectric power ....................................................................................... 40
2.2.4. Effects of climate change on biofuel .................................................................................................................. 47
2.2.5. Effects of climate change on oil and gas .......................................................................................................... 53
2.2.6. Effects of climate change on coal mining ........................................................................................................ 58
2.2.7. Issues of permafrost thawing and energy infrastructure.......................................................................... 63
2.4. IMPLICATIONS FOR MEDEAS ............................................................................................................................................ 68
2.4. REFERENCES .......................................................................................................................................................................... 69
3. RESOURCE SCARCITY ISSUES AND RES TRANSITION .............................................................. 73
LIST OF ABBREVIATIONS AND ACRONYMS ................................................................................................................................ 73
3.1. INTRODUCTION ..................................................................................................................................................................... 74
3.2. ENERGY TRENDS ................................................................................................................................................................... 75
3.2.1. Fossil fuels .................................................................................................................................................................... 75
3.2.2. Nuclear .......................................................................................................................................................................... 81
3.2.3. Renewables .................................................................................................................................................................. 83
3.2.4. Implications for MEDEAS ....................................................................................................................................... 85
3.3. RARE EARTH ELEMENTS AND METALS ............................................................................................................................ 87
3.3.1. Demand for Rare Earth Elements and Metals ............................................................................................... 87
3.3.2 Supply of Rare Earth Elements ............................................................................................................................. 98
3.3.3. Implications for MEDEAS .................................................................................................................................... 110
3.4. REFERENCES ........................................................................................................................................................................ 112
Pg. Marítim de la Barceloneta, 37-49 08003 Barcelona www.medeas.eu [email protected] T +34 93 230 95 00 F +34 93 230 95 55
This project has received funding from the European Union’s Horizon 2020 research and innovation programme under grant agreement No 691287
5
4. FINANCING CROSS-BORDER ELECTRICITY INFRA-STRUCTURE REQUIRED FOR RES TRANSITION
..............................................................................................................................................117
LIST OF ABBREVIATIONS AND ACRONYMS .............................................................................................................................. 117
4.1. INTRODUCTION ................................................................................................................................................................... 120
4.2. PROJECTS OF COMMON INTEREST (PCIS) ..................................................................................................................... 121
4.3. AMOUNT OF FUNDING NEEDED ........................................................................................................................................ 123
4.4 WHERE IS GRID REINFORCEMENT NEEDED? .................................................................................................................. 126
4.5. CAUSES OF INVESTMENT GAP ........................................................................................................................................... 131
4.6. FUNDING MODELS ............................................................................................................................................................... 134
4.6.1. Regulated Asset Base (RAB) ............................................................................................................................... 134
4.6.2. Merchant Investment model .............................................................................................................................. 139
4.6.3. Hybrid investment models .................................................................................................................................. 143
4.7. INVESTORS AND FUNDING SOURCES ................................................................................................................................ 144
4.7.1. EU funding ................................................................................................................................................................ 144
4.7.2. Public financial institutions ............................................................................................................................... 148
4.7.3. Pension funds, insurance companies, SWFs ................................................................................................. 150
4.7.4. Commercial banks ................................................................................................................................................. 155
4.8. COST - BENEFIT ALLOCATION ISSUES ............................................................................................................................. 156
4.8.1. Regulatory issues, case studies ......................................................................................................................... 156
4.8.2. Inter-TSO compensation (ITC) .......................................................................................................................... 161
4.8.3. Capacity Remuneration Mechanisms (CRMs) ............................................................................................. 165
4.8.4. Implications from cost benefit analyses for MEDEAS .............................................................................. 166
4.9. CURRENT AND FUTURE GOVERNANCE ............................................................................................................................ 171
4.10. INTERCONNECTIONS WITH 3RD COUNTRIES ................................................................................................................ 174
4.11. IMPLICATIONS FOR MEDEAS ....................................................................................................................................... 177
REFERENCES ................................................................................................................................................................................ 178
5. GRID FLEXIBILITY ................................................................................................................190
LIST OF ABBREVIATIONS AND ACRONYMS .............................................................................................................................. 190
5.1. INTRODUCTION ................................................................................................................................................................... 192
5.2. GRID MANAGEMENT FOR LARGE-SCALE RES DEPLOYMENT ...................................................................................... 194
5.3. MEDEAS AND ELECTRIC GRIDS ....................................................................................................................................... 197
5.4. DISCUSSION AND CONCLUSIONS ....................................................................................................................................... 207
5.5. REFERENCES ........................................................................................................................................................................ 210
6. ELECTRICITY PRICING AS A TOOL FOR RES TRANSITION ........................................................214
LIST OF ABBREVIATIONS AND ACRONYMS .............................................................................................................................. 214
6.1. INTRODUCTION ................................................................................................................................................................... 215
6.2. COSTS OF SIGNIFICANT RES EXPANSION ........................................................................................................................ 218
6.3. MEDEAS MODEL AND SCENARIOS .................................................................................................................................. 221
6.3.1. MEDEAS and costs of significant RES expansion ....................................................................................... 222
Pg. Marítim de la Barceloneta, 37-49 08003 Barcelona www.medeas.eu [email protected] T +34 93 230 95 00 F +34 93 230 95 55
This project has received funding from the European Union’s Horizon 2020 research and innovation programme under grant agreement No 691287
6
6.3.2. Investment costs for RES in MEDEAS World and EU................................................................................ 227
6.4. Discussion and conclusions .............................................................................................................................. 233
6.5. References .................................................................................................................................................................. 235
7. ENERGY POVERTY EFFECTS OF RES TRANSITION ..................................................................238
LIST OF ABBREVIATIONS AND ACRONYMS .............................................................................................................................. 238
7.1. INTRODUCTION ................................................................................................................................................................... 239
7.2. ELECTRICITY PRICE EFFECTS OF RES EXPANSION........................................................................................................ 240
7.3. DEFINING AND MEASURING ENERGY POVERTY ............................................................................................................. 244
7.4. EUROPEAN REGIONAL DIFFERENCES IN ENERGY POVERTY ......................................................................................... 249
7.5. HOUSING AND COMMUNITY ENERGY PARTICIPATION .................................................................................................. 255
7.6. IMPLICATIONS FOR MEDEAS .......................................................................................................................................... 259
7.7. REFERENCES ........................................................................................................................................................................ 260
8. ENVIRONMENTAL IMPACTS OF RES TRANSITION .................................................................267
LIST OF ABBREVIATIONS AND ACRONYMS .............................................................................................................................. 267
8.1. INTRODUCTION ................................................................................................................................................................... 269
8.2. METHODOLOGY ................................................................................................................................................................... 271
8.3 LITERATURE REVIEW ON ENVIRONMENTAL IMPACTS .................................................................................................. 272
8.3.1 Power supply ............................................................................................................................................................. 272
8.3.2 Energy transmission and distribution ............................................................................................................ 289
8.3.1 Terrestrial power cables ...................................................................................................................................... 291
8.3.2 Submarine power cables ...................................................................................................................................... 292
8.3.3 Electrical Energy Storage (EES) ....................................................................................................................... 294
8.4 MEDEAS MODEL RESULTS ................................................................................................................................................ 299
8.4.1 Water ........................................................................................................................................................................... 299
8.4.2 Land.............................................................................................................................................................................. 301
8.4.3 GHG emissions .......................................................................................................................................................... 304
8.4.4 Impacts associated to Storage ........................................................................................................................... 305
8.4.5 Fossil fuel utilisation .............................................................................................................................................. 308
8.5 DISCUSSION ........................................................................................................................................................................... 310
8.5.1 Identification of impacts from the literature ............................................................................................... 310
8.5.2 Simulation results ................................................................................................................................................... 312
8.6 CONCLUSIONS ....................................................................................................................................................................... 316
8.7 REFERENCES ......................................................................................................................................................................... 317
9. CONCLUSIONS – CHALLENGES & RECOMMENDATIONS........................................................328
9.1. CHALLENGES ........................................................................................................................................................................ 329
9.1.1. Climate Change Adaptation ............................................................................................................................... 329
9.1.2. Resource Scarcity ................................................................................................................................................... 330
9.1.3. Financing cross-border energy infrastructure ........................................................................................... 331
9.1.4. Grid Flexibility ......................................................................................................................................................... 332
Pg. Marítim de la Barceloneta, 37-49 08003 Barcelona www.medeas.eu [email protected] T +34 93 230 95 00 F +34 93 230 95 55
This project has received funding from the European Union’s Horizon 2020 research and innovation programme under grant agreement No 691287
7
9.1.5. Electricity pricing as a tool for RES expansion ........................................................................................... 333
9.1.6. Energy Poverty ........................................................................................................................................................ 334
9.1.7. Environmental impacts ....................................................................................................................................... 335
9.2. FIVE KEY RECOMMENDATIONS ......................................................................................................................................... 337
9.2.1. Climate Change Adaptation ............................................................................................................................... 337
9.2.2. Resource scarcity ................................................................................................................................................... 338
9.2.3. Financing cross-border electricity .................................................................................................................. 339
9.2.4. Grid flexibility .......................................................................................................................................................... 340
9.2.5. Electricity pricing as a tool for RES deployment ....................................................................................... 341
9.2.6. Energy poverty ........................................................................................................................................................ 342
9.2.7. Environmental impacts ....................................................................................................................................... 343
APPENDIX I: MEDEAS WORKSHOP ..........................................................................................344
Large group general discussion ................................................................................................................................... 345
Small group discussion on third countries ............................................................................................................... 348
Small group discussion on cost - benefit allocation.............................................................................................. 349
Small group discussion on governance issues ........................................................................................................ 352
APPENDIX II: MEDEAS TRANSITION SCENARIO ........................................................................353
GLOBAL TRANSITION SCENARIO ............................................................................................................................................... 353
Techno-ecological potentials and deployment rates ........................................................................................... 353
Desired GDPpc and population growth ..................................................................................................................... 355
EUROPEAN TRANSITION SCENARIO ......................................................................................................................................... 363
Techno-ecological potentials and deployment rates ........................................................................................... 363
Desired GDPpc and population growth ..................................................................................................................... 365
Objective energy intensities ........................................................................................................................................... 365
LIST OF TABLES .......................................................................................................................373
LIST OF FIGURES .....................................................................................................................376
Pg. Marítim de la Barceloneta, 37-49 08003 Barcelona www.medeas.eu [email protected] T +34 93 230 95 00 F +34 93 230 95 55
This project has received funding from the European Union’s Horizon 2020 research and innovation programme under grant agreement No 691287
8
Scope of document (Abstract in Deliverables)
This report presents results from Task 6.3 on the challenges that Europe may face during the energy
transition. The challenges addressed here focus on the following areas:
● Climate change adaptation of the energy sector
● Resource scarcity
● Financing cross border electricity infrastructure
● Grid congestion management
● Electricity pricing as a tool for RES expansion
● RES expansion effects on energy poverty
● Environmental impacts of RES expansion
The report is based on an extensive literature review, interviews and workshops
Pg. Marítim de la Barceloneta, 37-49 08003 Barcelona www.medeas.eu [email protected] T +34 93 230 95 00 F +34 93 230 95 55
This project has received funding from the European Union’s Horizon 2020 research and innovation programme under grant agreement No 691287
9
Executive summary
The following sections provides short executive summaries of each of the following chapters. The
overall deliverable concludes after these chapters with a list of prioritised challenges gleaned from
the analysis of these issues. This in turn is followed by five policy recommendations.
Summary of Section 6.3a Climate Change Adaptation
Section 6.3a concerns the likely future impacts within Europe resulting from projected climate
changes on wind, solar and hydroelectric power generation, biomass crops, oil and gas
infrastructure, coal mining, and energy infrastructure in permafrost regions. As the current set of
MEDEAS models doesn’t consider direct climate effects on our ability to generate energy
endogeneously, Section 6.3a aims to investigate such effects and their potential impact on MEDEAS
and the validity of its results. For wind power generation, there will likely be regional changes in
wind patterns and power output, which may largely balance out over Europe, though wind power
may make an increasing contribution as it becomes more competitive. Solar power generation
potential may also experience regional shifts, with an increase in photovoltaic generation potential
in southern parts of Europe, and limited changes or an overall reduction in more northerly areas,
due to increased cloudiness. Hydroelectric power generation capacity is spatially restricted within
Europe, but in Austria climatic shifts may lead to changes in the timing of precipitation and runoff,
though complexities in the modelling means that the impact on generation potential is uncertain.
In Norway, future climatic changes are likely to be beneficial, with increased runoff in zones where
hydroelectric capacity is already located, combined with decreased future power demands. Across
Europe, new hydroelectric sites may become available in future.
For biomass crops, climatic changes are likely to allow certain crops to be grown more extensively
in more northerly parts of Europe in future, whilst some crops may become unsuited to southern
Europe unless changes are made to agricultural practices. Biomass is however likely to become an
increasingly less important component of renewable energy in future, which will reduce pressure
on agricultural land. Oil and gas infrastructure may be impacted by increased storminess and storm
surges as a result of climatic changes, and may experience increased operational costs due to
decreasing weather windows and increased regulation. Coal mining may be impacted by operational
challenges such as increased temperatures leading to labour and water shortages, or ground
instability caused by increased precipitation. Climatic shifts may also exacerbate existing
environmental impacts such as ecosystem damage, acid mine drainage and the wind transport of
contaminated dust. Permafrost regions in Europe are located in the Fennoscandia (Arctic) and the
Pg. Marítim de la Barceloneta, 37-49 08003 Barcelona www.medeas.eu [email protected] T +34 93 230 95 00 F +34 93 230 95 55
This project has received funding from the European Union’s Horizon 2020 research and innovation programme under grant agreement No 691287
10
Alpine regions, and energy infrastructure in those regions may potentially be severely impacted by
climatic shifts. Up to 70% of the infrastructure in the Arctic regions may be susceptible to the effects
of ground thaw, which may occur rapidly and be uneconomic to tackle at the regional scale with
engineering solutions.
Summary of Section 6.3b Resource Scarcity
MEDEAS is a physical model of the energy transition and therefore the impact of resource scarcity
is a key consideration. As such Section 6.3b considers resource scarcity and its impact on the energy
sector.
This chapter explores the availability for key resources required by the energy sector. This includes
trends in fossil fuel scarcity (including depletion curves but also access due to geopolitical factors),
as well as metals and rare earth elements that are required for renewable generation and storage
capacities. The analysis in this chapter was done based on a literature review and demand models.
Rare earth elements in particular are a critical component in the development of renewable
technologies. Their future supply depends on increased mining, recycling and re-use or substitution
for alternative elements. The elements that are most constrained by current resource estimates are
Indium, Manganese and Tellurium. However, these three are more than 50% recycled currently and
investment into future supply or finding alternatives is increasing making it difficult to predict the
exact implications for the future of the EU energy sector. The cost of extraction alongside the
changes in prices due to supply-demand challenges will have a significant impact on future usage
for each of the resources considered here.
Summary of Section 6.3c Financing cross-border infrastructure
The subsequent section concerns the electricity interconnection infrastructure that needs to be
built for a large-scale transition to renewable energy sources and a shift away from fossil fuels. As
the current set of MEDEAS models lacks the spatial and temporal resolution to adequately represent
RE intermittency patterns across Europe and does not contain finance at all, this chapter is based
mainly on a literature review and a workshop on infrastructure finance that was held in November
2018 in London.
It iterates both the extent of infrastructure that will likely be needed (according to different models
other than MEDEAS) as well as financing required for this. Due to the intermittency of RE and vastly
different solar and wind energy potential depending on geographic location, to secure supply and
due to greater electrification of the transport and heating sector, further cross-border
Pg. Marítim de la Barceloneta, 37-49 08003 Barcelona www.medeas.eu [email protected] T +34 93 230 95 00 F +34 93 230 95 55
This project has received funding from the European Union’s Horizon 2020 research and innovation programme under grant agreement No 691287
11
interconnection will be necessary for a low carbon energy transition. Interconnection most needed
in island states such as Malta and Cyprus, “electric peninsulas” such as Spain and Portugal and
among some former communist countries which were not connected to Western Europe previously.
The chapter assesses current funding models for interconnectors, mostly Regulated Asset Base
(RAB) in the EU, and potential and current finance sources for cross-border electricity infrastructure.
This includes EU funding through e.g. the Connecting Europe Facility (CEF) and the European Fund
for Strategic Investments (EFSI), public financial institutions such as KfW and ICO, commercial banks
and insurance funds and pensions funds. The following segments zoom in on effects of the
interconnectors’ cross-border nature, especially cost-benefit allocation for projects involving more
than one country. We examine current remuneration tools for transit countries which may not
accrue any benefits from additional electricity transmission to another state, such as the Inter-TSO
compensation (ITC) mechanism. We furthermore explore different regulatory issues and ways in
which lack of harmonisation dis-incentivises investment.
One important challenge in future cross-border interconnection is that some countries will have
negative effects from further interconnection or will act purely as transit countries. Therefore we
assessed current cost-benefit allocation mechanisms within the EU for interconnection.
This is followed by interconnection projects with 3rd countries, such as Desertec and post-Brexit the
UK.
Summary of Section 6.3d Grid Flexibility
The massive deployment of RES will have, and has, technical and technological issues that need to
be carefully addressed and thus analysed to propose plans and strategies to overcome them. Grid
issues are one such major difficulty a renewable transition will face. Here we will examine two of
these issues: a) the necessary grid flexibility to deal with a high share of RES and, b) electric grid
congestion management. Grid flexibility could smooth residual load and intermittency issues. Grid
flexibility can be achieved through four existing strategies: storage, demand side management
(DSM), power to X technologies (PtX) and curtailment.
We will focus on the parts of the MEDEAS model related to the RES storage technologies and
demand side management (DSM). The results show the limitation of storage for EV electric
batteries, which worsen when the scenario is scaled up (TRANS scenario). The overall contribution
of this storage technology compared with PSH (Pumped-Storage Hydroelectricity) is very low within
the MEDEAS scenario. However, we note that this is based on current technology assumptions.
Pg. Marítim de la Barceloneta, 37-49 08003 Barcelona www.medeas.eu [email protected] T +34 93 230 95 00 F +34 93 230 95 55
This project has received funding from the European Union’s Horizon 2020 research and innovation programme under grant agreement No 691287
12
In contrast, the role of Demand Side Management (DSM), in this case reducing electricity demand
through slowing down economic growth, modelled through lowering GDP and GDP variation
externally, is very significant. The stabilisation of the GDP and the effect on demand has important
effects for integrating variable renewable energy (VRE) in the energy mix, particularly when there is
already a high RES penetration.
The simulation results show a total installed storage capacity of 1661 TWh at the end of the
simulation period (year 2050), while studies using hourly models and different storage technologies
account for different kinds of storage and arrive at a much lower capacity needed: 320 TWh.
Although storage and DSM must play an essential role in the development and penetration of VRE
and the MEDEAS_eu model is pointing this out, future developments of the model must account for
other technologies such as PtX, which will play an important role in the renewable transition.
However, our model results are useful to explore the potentials of the most developed current
storage technologies.
Summary of Section 6.3e Electricity pricing as a tool for RES
expansion
Economic mechanisms that can influence the energy market by acting on the electricity price,
differentiating by energy production (RES or non-RES) are some of different tools that favour RES
deployment.
The main issues associated with the price of electricity are affordability for consumers and stability
of costs for investors. One aspect of such affordability relates with the pricing of electricity in a free
market, which is the trade-off between two aspects: benefits and costs. There is the need for
revenues that compensate initial investments and running costs, fulfil the investors’ expectations
and allow the TSO and DSO to obtain benefits. The current energy market was developed around a
thermal power system (low fixed cost and higher marginal cost). As a new entrant RES (having high
fixed cost and low marginal cost) has, in the past, had difficulty competing in a totally free market
with no taxes or levies to favour it (and indeed with taxes that favour the incumbent non RES
technologies).
We have provided some MEDEAS models (World and EU) simulations to evaluate investment cost
time evolution, thus providing quantities that could help in both evaluation of LCOE and additional
investments in grid and storage technologies. To have an indirect estimation of the effort in the
investments in RES and their relative implementation we provide the share of RES in the energy mix.
Pg. Marítim de la Barceloneta, 37-49 08003 Barcelona www.medeas.eu [email protected] T +34 93 230 95 00 F +34 93 230 95 55
This project has received funding from the European Union’s Horizon 2020 research and innovation programme under grant agreement No 691287
13
The simulations shown here introduce a new scenario in MEDEAS (TRANS scenario) to produce a
100% RES economy in 2050, within a framework of a stationary economy. The results show that this
pathway is technically feasible, but the deployment rates of RES are huge compared with the current
ones (and even compared to the rates introduced in the OLT scenario). Another aspect analysed
here is the investment needed for the transition. At World level the investment must grow to
achieve a maximum before 2040 around 3.6 T$/year, which means 5.3 % of the global GDP (from
the model output) for this period. For the EU case the maximum investment is 0.7T$/year, which
relates roughly to 5% of the EU GDP (model projected) for this year in TRANS scenario. The
advantages of following this scenario are the high level of decarbonisation, thus reducing the
climate change impacts on the economy and society. However, such a scenario implies high rates of
RES deployment, which in turn will require high investments in RES.
Summary of Section 6.3f Energy Poverty
The subchapter on energy poverty starts out with a discussion of energy poverty definitions and
measurements. This is followed by a discussion of ways in which a renewable energy transition has
affected the electricity price in the past. This of course provides certain caveats for a renewable
energy transition as envisioned by MEDEAS. The literature review provides important insights into
which policies need to accompany the MEDEAS RE transition in order to protect the poorest
Europeans from energy poverty.
We note however that only electricity price increases are ever discussed, although the price has also
gone up for other energy sources. There is furthermore a discussion of the fact that energy poverty
is geographically very distinct – energy poverty is most severe in mostly Mediterranean and former
communist countries. In addition to the price of electricity, energy inefficient buildings, energy
efficiency of appliances as well as whether the house is shaded by trees e.g. or in an inner city heat
island, play a strong role in determining whether a household will be energy poor. We use the
examples of Austria and Bulgaria to provide case studies of how geographic location and history
determine the extent of energy poverty. The chapter also discusses a few policies that have been
suggested to address energy poverty.
We conclude with a discussion of policies that can address energy poverty.
Summary of Section 6.3g Environmental Impacts
The transition will require structural changes both in the supply and the demand side of the energy
system. Those changes will involve the construction of new infrastructure and the upgrade of the
Pg. Marítim de la Barceloneta, 37-49 08003 Barcelona www.medeas.eu [email protected] T +34 93 230 95 00 F +34 93 230 95 55
This project has received funding from the European Union’s Horizon 2020 research and innovation programme under grant agreement No 691287
14
existing one, for renewable energy generation, transmission and distribution (T & D) and storage.
All economic sectors will also have to undergo an adaptation process to be able to use that energy
(i.e. electrification). Although the potential positive impacts of those changes may outweigh the
negative ones, an analysis of both is required to provide policy makers with the information required
for them to bet for one technology or the other, based on environmental criteria.
In this subchapter the environmental impacts associated with the future renewable energy
generation, T & D and storage are identified and, when possible, quantified. The identification of
impacts is done through an extensive bibliographical review of supply-side technologies. This review
is also intended as an inventory of the key technologies, either already available or in development,
for the future energy supply of the EU. On the other hand, the quantification of the overall impacts
on land, water and the GHG of the transition is made based on the results of simulations run with
the MEDEAS model. When the model allows it, the technology responsible for those impacts is also
identified. In addition, the required storage capacity is used as an indicator of the magnitude of the
potential impacts associated with the mining of the required materials to build batteries. Finally,
the decrease of the overall demand of fossil fuels is used as an indicator of the potential positive
impacts of the decrease in the activity of industry behind its supply.
The land occupation and water utilisation associated with the deployment of new RE infrastructure
and the GHG emissions are quantified. On the other hand, the impacts of the power grid are only
identified from literature, since the MEDEAS_eu model does not simulate grid infrastructure.
Despite the impacts associated with storage technologies not being directly evaluated, we quantify
transition storage requirements and discuss the potential environmental impacts of such storage
capacity. The reduction of the consumption of non-renewable energy sources is also estimated in
order to discuss potential positive impacts of the transition. The environmental impacts of the
electrification process cannot be simulated with the model either, and is only briefly discussed in
this work.
Results from the simulations run in this work indicate that the water footprint of our society will
decrease if we engage in the transition process through a scenario similar to the TRANS scenario
(ca. 25% less water use compared to BAU by 2050). The GHG emissions will also progressively
decrease, with the exception of an initial peak between 2020 and 2030.
The growing storage demand will require the construction of batteries, which will put a strain on
the required materials, and hence increase the impacts associated with their extraction process.
Pg. Marítim de la Barceloneta, 37-49 08003 Barcelona www.medeas.eu [email protected] T +34 93 230 95 00 F +34 93 230 95 55
This project has received funding from the European Union’s Horizon 2020 research and innovation programme under grant agreement No 691287
15
On the other hand, all theoretically available land for RES deployment will be exhausted by 2047,
leaving no space for further on-land RE deployment and leaving less than 2% of the total EU soil
available as animal habitat and plants (currently it is around 16%) and unaffected by human
activities. This thus has severe negative implications for biodiversity and nature. Crops for biofuels
were identified as the main cause for such land requirements, which take almost 3 times the land
occupied by all RE power plants combined.
A final discussion is made on the main impacts identified and its quantification and on the limitations
and potential improvement areas of the MEDEAS model to make it better suited for the analysis of
the environmental impacts of the transition.
Pg. Marítim de la Barceloneta, 37-49 08003 Barcelona www.medeas.eu [email protected] T +34 93 230 95 00 F +34 93 230 95 55
This project has received funding from the European Union’s Horizon 2020 research and innovation programme under grant agreement No 691287
16
1. Introduction to deliverable This deliverable explores the impact of the transition envisaged within the MEDEAS model with
regards to specific transition challenges that may be faced. These transition challenges include:
• Climate change adaptation
• Resource scarcity
• Financing cross border infrastructure
• Grid congestion management
• Pricing as a tool
• Energy poverty
• Environmental impacts
Each section outlines the specific issues explored under the headings above and how they relate to
the transition modelled under MEDEAS. Some of these elements are not directly modelled by
MEDEAS – instead deliverable 6.3 assesses challenges and barriers that need to be taken into
account with such a transition. The 6.3 subchapters on 6.3a) climate change adaptation, 6.3b)
resource scarcity, 6.3c) crossborder infrastructure finance and 6.3f) energy poverty are based on
extensive state of the art literature reviews and reviews of other existing models. The subchapter
on 6.3d) grid flexibility, 6.3e) electricity pricing as a tool and 6.3g) environmental impacts are instead
based on the TRANS scenario described below.
Please note that at the time of writing the MEDEAS model development was – and still is – an
ongoing process. In its most current update from June 2019 (MEDEAS_w 1.3 and MEDEAS_eu 1.2)
the model saw substantial improvements and new features regarding (a) exogenous energy
intensity targets, (b) modelling of fuel replacement and (c) energy imports. However, as a
consequence the results from earlier scenarios (especially the OLT scenario) changed substantially,
requiring new scenario assumptions in order to use the new features to its fullest potential - a
process that eventually resulted in the development of the TRANS scenario for subchapters 6.3d,
6.3e and 6.3g.
The final section brings together the key issues identified and summarises five key
recommendations each and prioritises a list of challenges that need to be addressed jointly with the
energy transition.
Pg. Marítim de la Barceloneta, 37-49 08003 Barcelona www.medeas.eu [email protected] T +34 93 230 95 00 F +34 93 230 95 55
This project has received funding from the European Union’s Horizon 2020 research and innovation programme under grant agreement No 691287
17
2. Climate Change Adaptation
List of abbreviations and acronyms
ALADIN Aire Limitée Adaption dynamique Développement Inter-National [model
title]
AMD Acid Mine Drainage
CSIRO2 Commonwealth Scientific and Industrial Research Organisation model 2
[model title]
CGCM2 Coupled Global Climate Model 2 [model title]
CMIP5 Coupled Model Intercomparison Project phase 5 [project title]
CSP Concentrated Solar Power
EJ Exa Joules
EWP Extractable Wind Power
GCM General Circulation Model
GHG Greenhouse Gases
GW Giga Watts
HadAM Hadley Centre Atmospheric Model [model title]
HBV Hydrologiska Byråns Vattenbalansavdelning [model title]
IPCC Intergovernmental Panel on Climate Change
LCOE Levelised Cost of Electricity
LSP Land Surface Processes
MAGT Mean Annual Ground Temperature
MARKAL MARKet ALlocation [model title]
Pg. Marítim de la Barceloneta, 37-49 08003 Barcelona www.medeas.eu [email protected] T +34 93 230 95 00 F +34 93 230 95 55
This project has received funding from the European Union’s Horizon 2020 research and innovation programme under grant agreement No 691287
18
Mtoe Million tonnes oil equivalent
NAO North Atlantic Oscillation
OCS Outer Continental Shelf
PACE Permafrost and Climate in Europe [project title]
PCM Pollution Climate Mapping [model title]
POLES Prospective Outlook on Long-term Energy Systems [model title]
PV Photovoltaic
RCM Regional Circulation Model
RCP Representative Concentration Pathways
RegCM3 Regional Climate Model version 3 [model title]
REMO REgional MOdel [model title]
RSDS Surface-downwelling shortwave radiation
SRC Short Rotation Coppice
SRES Special Report on Emissions Scenarios
TWh Tera Watt hours
UKCIP02 UK Climate Impacts Programme 2002 [project title]
UKCP09 UK Climate Projections 2009 [model title]
Pg. Marítim de la Barceloneta, 37-49 08003 Barcelona www.medeas.eu [email protected] T +34 93 230 95 00 F +34 93 230 95 55
This project has received funding from the European Union’s Horizon 2020 research and innovation programme under grant agreement No 691287
19
2.1. Introduction
In this chapter, we initially assessed changes in energy demand from heating and cooling needs and
then future changes in energy supply through climate change effects on the energy sector and
energy production itself. For this, we conducted a literature review and summarise other models as
MEDEAS does not feature the impact of climate change on e.g. biofuels or solar power changes. We
note that heating and cooling needs will radically shift and that energy demand for cooling will likely
increase. The subsequent analysis of existing models’ predictions for different sub-segments of the
energy sector shows however that due to climate change, solar and wind power patterns will shift
– with an increased cloud cover leading to reduction of solar potential in some areas e.g. and at the
same time lower wind speed leading to a loss in other locations in Europe. In the North Sea, wind
speed but also waves may increase – a mixed bag for offshore wind. Negative effects from coal
mining, both for the environment and worker’s health will increase. While biofuels due to land
allocation issues can only be one tool in our future energy toolbox, the geographical conditions will
shift similar to wind and solar power. Perhaps the most extreme future changes to capacity to
generate energy will be experienced in areas in which permafrost will thaw. This will destabilise all
existing energy infrastructure.
Pg. Marítim de la Barceloneta, 37-49 08003 Barcelona www.medeas.eu [email protected] T +34 93 230 95 00 F +34 93 230 95 55
This project has received funding from the European Union’s Horizon 2020 research and innovation programme under grant agreement No 691287
20
2.2. Changes in Energy Demand
Key Future Challenges for Heating and Cooling
• The energy behaviours of European citizens will change over the next three decades. Aligning
these behavioural changes (energy demand) to match the energy supply is critical.
• Local energy storage technologies could be key in achieving a more efficient energy system.
• Moving heating away from a predominantly fossil fuel (gas) based system to a renewable
system is difficult.
Summary of Key Points
• Heating demand is currently an order of magnitude higher in Europe than cooling demand
(see also section 2.3.1.3 in MEDEAS Deliverable 4.1, “Adjustment of energy demands to
account for all non-commercial heat”).
• The increase in global cooling demand due to climate change represents the most significant
change in energy demand change for buildings.
While MEDEAS uses WIOD and historic trends in energy intensity to determine the relative energy
intensity for sectors, also calculating feedback loops in the residential sector (see section 3.2.3.3 in
MEDEAS Deliverable 2.1) and the overall likely energy demand of the economy (see Methodology
in MEDEAS Deliverable 3.3), climate change may impact this demand over time. Recommendations
for the MEDEAS model with regards to heating and cooling have been described earlier (see
MEDEAS Deliverable 2.2: Annex 12). This impact is not included in the standard scenarios presented
by MEDEAS however it is possible to change the parameters used to explore the potential impact of
this feedback loop in more detail.
In this section we outline some other studies that have focussed on the likely impact of climate
change on energy demand to highlight potential changes to the parameters used in the MEDEAS
model relating to the final energy demand for heat (see section 2.3.1.3 in MEDEAS Deliverable 4.1).
However, as the impacts are highly uncertain, seasonal and vary significantly by country we would
recommend that this is done on the MEDEAS country models rather than globally or European.
Estimating future energy demand is difficult (see MEDEAS Deliverable 2.2: Annex 12 ; Levesque et
al., 2018 ; Dowling, 2013 ; Klein et al., 2013). Energy demand from heating and cooling is driven by
a number of factors including building design, floor space, occupancy, technology deployment and
usage, behaviour, efficiency and the local climatic conditions. However, many studies have explored
Pg. Marítim de la Barceloneta, 37-49 08003 Barcelona www.medeas.eu [email protected] T +34 93 230 95 00 F +34 93 230 95 55
This project has received funding from the European Union’s Horizon 2020 research and innovation programme under grant agreement No 691287
21
potential future scenarios, with a number of assumptions, to understand the potential range of the
impact of climate change on local climatic conditions may have on heating and cooling demand
changes.
Currently (Issac & van Vuuren, 2009), Western Europe experiences 2621 heating degree days (HDD)
per annum (defined as the sum of degrees below a threshold, taken as 18oC in Europe, multiplied
by the number of days) and 285 cooling degree days (CDD) per annum (defined as the sum of
degrees above a threshold, taken as 18oC, multiplied by the number of days). We note that other
models use different thresholds for HDD and CDD and in particular use a temperature range for
where no heating or cooling is needed (for example, Golombek et al. (2012) use 18oC – 22oC, while
Dowling (2013) use 15oC – 18oC and Cartalis et al. (2001) use 15.5oC – 18oC). These different
threshold assumptions will have significant impacts on projected energy demands (especially across
seasons) and of course, in practice, individual households have different personal temperature
thresholds. In addition, the cultural influence on the update of particular technologies is significant
with, for example, Portugal having a relatively low uptake of air conditioning for cooling compared
with other countries with similar climates (Klein et al., 2013). However, overall the energy demand
for heating in Western Europe (which includes both MEDEAS country models) is much more
significant than that for cooling.
Long term climate change trends, in particular changes to average temperature or rainfall patterns,
can impact heating and cooling demands in residential and industry (Schaeffer et al., 2012). The
impact can be direct (change in demand for cooling and heating in buildings) or indirect (increased
demand for water in refrigeration). Heating and cooling in residential and commercial buildings
represents over half of the total energy demand for buildings including space heating (32% for
residential, 33% for commercial), water heating (24% for residential, 12% for commercial) and
cooling (2% for residential, 7% for commercial) (Ürge-Vorsatz et al., 2015).
Empirical studies have found that energy demand follows a U-shaped curve (Schaeffer et al., 2012)
whereby in regions with a lower average temperature there is a higher energy demand from
heating, while in regions with a higher average temperature there is a higher energy demand from
cooling. In intermediate temperature regions there may be no need for heating or cooling.
Therefore, the global impact of climate change on energy demand from heating and cooling is
difficult to predict.
Using the Shared Socio-economic Pathways (SSPs), Levesque et al. (2018) use the Energy Demand
GEnerator (EDGE) model to show a small drop in total energy demand globally for all SSP pathways
but a significant increase in global demand for cooling, in particular in SSP2 and SSP5. Space cooling
Pg. Marítim de la Barceloneta, 37-49 08003 Barcelona www.medeas.eu [email protected] T +34 93 230 95 00 F +34 93 230 95 55
This project has received funding from the European Union’s Horizon 2020 research and innovation programme under grant agreement No 691287
22
in SSP2 increases by over a factor of 100. However, the largest changes in heating and cooling
demand globally are driven by a rising standard of living (as well as rising temperature) in developing
countries.
In Europe, which has a range of temperate regions, the impact of climate change very much depends
on the scenarios considered and the particular country under consideration with southern Europe
likely to face an increased need for cooling and northern Europe likely to face a reduced need for
heating. This differentiated change in demand obviously has implications for the electricity
generation network and grid across Europe. If should also be noted that hotter or colder days could
have an impact on fuel consumption in transport with an increased demand for heating or cooling
while travelling (Schaeffer et al., 2012).
Using a Frozen Efficiency Scenario and the High Energy Building (3CSEP-HEB) model Ürge-Vorsatz et
al. (2015) show that the heating and cooling demand (including water heating) for Western Europe
(WEU) and Eastern Europe (EEU) decrease between 2010 and 2050. In WEU for example, they
project that residential buildings will see a drop of 11% in energy used for heating and cooling
between 2010 and 2050 and for commercial buildings a drop of 33%. In EEU the figures are a drop
of 6% for both residential and commercial (Ürge-Vorsatz et al., 2015). This assumes that across
Europe, on average, the number of households increases while the number of people in each
household reduces.
Using a different model and set of assumptions Issac and van Vuuren (2009) project that Western
Europe will see overall energy demand as a result of cooling increase by 261% between 2000 and
2050, with the Rest of Europe increasing by 6537%. For heating they project a 25% decrease in
Western Europe and a small 1% increase in the Rest of Europe (Isaac & van Vuuren, 2009). However,
as current cooling demand is very low this represents an overall reduction in demand for heating
and cooling for Western Europe which is similar to those in Ürge-Vorsatz et al. (2015) and other
studies (Golombek et al., 2012). An alternative regionalisation of Europe which is more aligned to
the overall climate change trends sees energy demand in Northern Europe substantially reduce due
to the change in heating demand while the energy demand in Southern Europe substantially
increase due to the change in cooling demand (Dowling, 2013). We do note that it is not always
possible to directly compare each of these studies as they use different geographic scopes,
assumptions on temperature thresholds, baseline years and end years.
A number of studies have explored possible changes in energy demand due to the long term climate
change trend in particular European countries and cities (see for example, Papakostas & Slini, 2017
who explore cooling in Athens and Thessaloniki, or Berger et al., 2014 for Vienna). Table 1
Pg. Marítim de la Barceloneta, 37-49 08003 Barcelona www.medeas.eu [email protected] T +34 93 230 95 00 F +34 93 230 95 55
This project has received funding from the European Union’s Horizon 2020 research and innovation programme under grant agreement No 691287
23
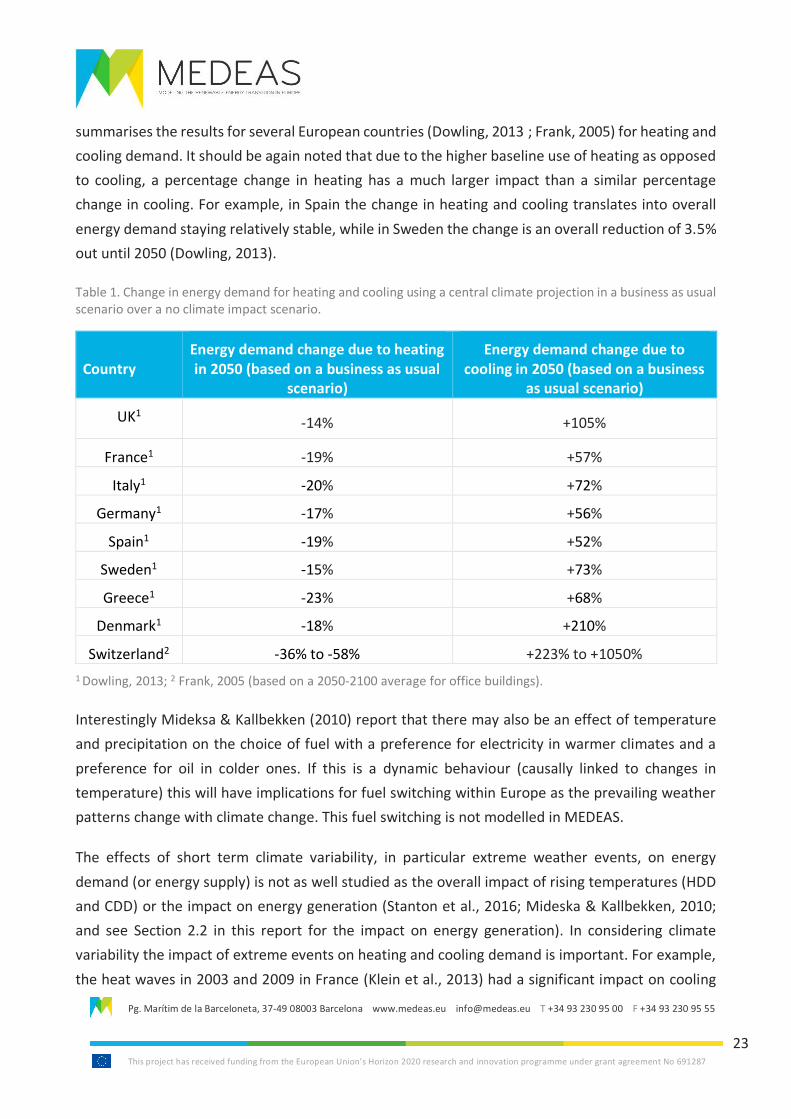
summarises the results for several European countries (Dowling, 2013 ; Frank, 2005) for heating and
cooling demand. It should be again noted that due to the higher baseline use of heating as opposed
to cooling, a percentage change in heating has a much larger impact than a similar percentage
change in cooling. For example, in Spain the change in heating and cooling translates into overall
energy demand staying relatively stable, while in Sweden the change is an overall reduction of 3.5%
out until 2050 (Dowling, 2013).
Table 1. Change in energy demand for heating and cooling using a central climate projection in a business as usual scenario over a no climate impact scenario.
Country Energy demand change due to heating in 2050 (based on a business as usual
scenario)
Energy demand change due to cooling in 2050 (based on a business
as usual scenario)
UK1 -14% +105%
France1 -19% +57%
Italy1 -20% +72%
Germany1 -17% +56%
Spain1 -19% +52%
Sweden1 -15% +73%
Greece1 -23% +68%
Denmark1 -18% +210%
Switzerland2 -36% to -58% +223% to +1050%
1 Dowling, 2013; 2 Frank, 2005 (based on a 2050-2100 average for office buildings).
Interestingly Mideksa & Kallbekken (2010) report that there may also be an effect of temperature
and precipitation on the choice of fuel with a preference for electricity in warmer climates and a
preference for oil in colder ones. If this is a dynamic behaviour (causally linked to changes in
temperature) this will have implications for fuel switching within Europe as the prevailing weather
patterns change with climate change. This fuel switching is not modelled in MEDEAS.
The effects of short term climate variability, in particular extreme weather events, on energy
demand (or energy supply) is not as well studied as the overall impact of rising temperatures (HDD
and CDD) or the impact on energy generation (Stanton et al., 2016; Mideska & Kallbekken, 2010;
and see Section 2.2 in this report for the impact on energy generation). In considering climate
variability the impact of extreme events on heating and cooling demand is important. For example,
the heat waves in 2003 and 2009 in France (Klein et al., 2013) had a significant impact on cooling

Pg. Marítim de la Barceloneta, 37-49 08003 Barcelona www.medeas.eu [email protected] T +34 93 230 95 00 F +34 93 230 95 55
This project has received funding from the European Union’s Horizon 2020 research and innovation programme under grant agreement No 691287
24
demand (in 2009 the heatwave also shut down a third of the nuclear plants in France). Additionally,
often it is the variation in temperature that determines the efficiency, and therefore energy load
requirements, for these systems (Schaeffer et al., 2012). Research into particular extreme weather
impacts depends heavily on building design and responsive and while a small number of studies
explore this under different climate futures (see for example, Berger et al., 2014) this research is
still in its infancy.
Pg. Marítim de la Barceloneta, 37-49 08003 Barcelona www.medeas.eu [email protected] T +34 93 230 95 00 F +34 93 230 95 55
This project has received funding from the European Union’s Horizon 2020 research and innovation programme under grant agreement No 691287
25
2.3. Changes in Energy Supply
Several of the papers that contribute to the following subsections make reference to the Special
Report on Emissions Scenarios (SRES) (IPCC, 2000), and in particular the A1B emission scenario
which is outlined in that document. The A1B scenario is summarised here, to provide a reference
for the following subsections: ‘’This scenario describes a future world of very rapid economic growth,
global population that peaks in mid-century and declines thereafter, and the rapid introduction of
new and more efficient technologies with a balanced use of renewable and fossil fuel power
generation’’ (Crook et al, 2011).
Additionally, the Representative Concentration Pathways (RCPs) are referred to in several of the
following subsections. The RCPs apply additional radiative forcing of 2.6, 4.5, 6.0 and 8.5 W m-2,
corresponding approximately to CO2 concentrations in the range 490 to >1370 ppm CO2-equivalent,
and mean end-of-century temperature rises of 1.0 to 3.7°C. The complete time series for each RCP
scenario is 2006-2100 (Aalto et al, 2017 and Hdidouan and Staffell, 2016).
Pg. Marítim de la Barceloneta, 37-49 08003 Barcelona www.medeas.eu [email protected] T +34 93 230 95 00 F +34 93 230 95 55
This project has received funding from the European Union’s Horizon 2020 research and innovation programme under grant agreement No 691287
26
2.2.1 Effects of climate change on wind power
Key Future Challenges for Wind Power
• A future reduction of overall wind power output is expected in southern Europe. Wind will
decrease in particular around the Mediterranean basin.
• Several operational challenges are likely to arise from climate change, primarily in Northern
Europe and Scandinavia :
o Direct icing and other cold-weather problems are projected to decrease significantly,
but construction and ongoing operation of wind infrastructure in these regions are
likely to be adversely affected by changes to distribution and extent of permafrost.
o Operating conditions for offshore (and to a lesser extent onshore) capacity will
become more difficult and less economic due to increase storminess.
• Uncertainty over climatic projections, the role of government policy (i.e. subsidies) and
changes in the costs associated with developing wind capacity also present potential
difficulties for maintaining the growth in wind capacity.
Summary of Key Points
• The literature review shows that the contribution of wind energy to total worldwide
electricity production has been and continues to grow rapidly, and that a large proportion of
that growth has taken place within Europe.
• Long-term patterns of change in EWP (energy from wind power) are likely to predominantly
result from climate change, with the changes to be estimated at approximately 15-20%, with
a high level of confidence.
• This will comprise an increase or decrease depending on region, but due to compensating
effects between countries the output of the whole European fleet is expected to be stable
across the 21st century.
• Modelling of future Bulgarian wind forces indicates the potential for an increase in wind of
up to 14% in the eastern and south-eastern region, and a decrease of up to 12% in the central
and south-western region.
• The POLES (Prospective Outlook on Long-term Energy Systems) model projected growing
contribution of wind power in Europe over the 21st century, due to a relative improvement
in the competitiveness of wind power in comparison to thermal power generation, rather
than a change in the efficiency of wind generation.
Pg. Marítim de la Barceloneta, 37-49 08003 Barcelona www.medeas.eu [email protected] T +34 93 230 95 00 F +34 93 230 95 55
This project has received funding from the European Union’s Horizon 2020 research and innovation programme under grant agreement No 691287
27
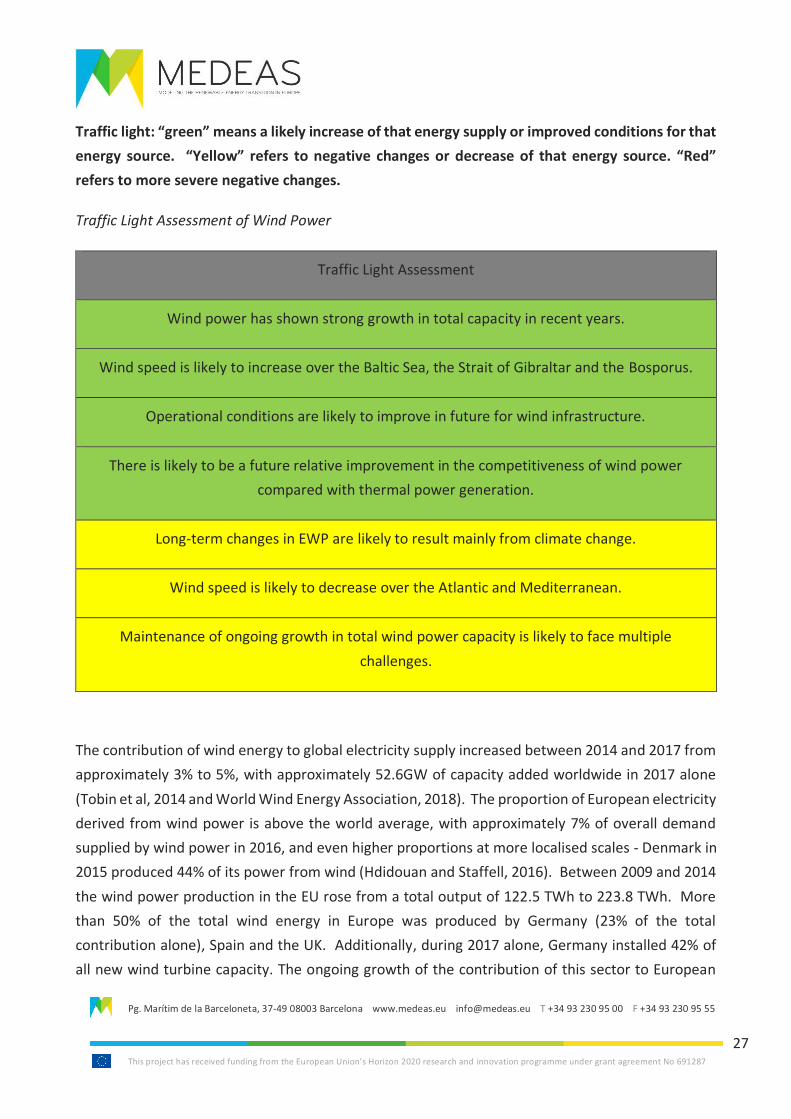
Traffic light: “green” means a likely increase of that energy supply or improved conditions for that
energy source. “Yellow” refers to negative changes or decrease of that energy source. “Red”
refers to more severe negative changes.
Traffic Light Assessment of Wind Power
Traffic Light Assessment
Wind power has shown strong growth in total capacity in recent years.
Wind speed is likely to increase over the Baltic Sea, the Strait of Gibraltar and the Bosporus.
Operational conditions are likely to improve in future for wind infrastructure.
There is likely to be a future relative improvement in the competitiveness of wind power
compared with thermal power generation.
Long-term changes in EWP are likely to result mainly from climate change.
Wind speed is likely to decrease over the Atlantic and Mediterranean.
Maintenance of ongoing growth in total wind power capacity is likely to face multiple
challenges.
The contribution of wind energy to global electricity supply increased between 2014 and 2017 from
approximately 3% to 5%, with approximately 52.6GW of capacity added worldwide in 2017 alone
(Tobin et al, 2014 and World Wind Energy Association, 2018). The proportion of European electricity
derived from wind power is above the world average, with approximately 7% of overall demand
supplied by wind power in 2016, and even higher proportions at more localised scales - Denmark in
2015 produced 44% of its power from wind (Hdidouan and Staffell, 2016). Between 2009 and 2014
the wind power production in the EU rose from a total output of 122.5 TWh to 223.8 TWh. More
than 50% of the total wind energy in Europe was produced by Germany (23% of the total
contribution alone), Spain and the UK. Additionally, during 2017 alone, Germany installed 42% of
all new wind turbine capacity. The ongoing growth of the contribution of this sector to European
Pg. Marítim de la Barceloneta, 37-49 08003 Barcelona www.medeas.eu [email protected] T +34 93 230 95 00 F +34 93 230 95 55
This project has received funding from the European Union’s Horizon 2020 research and innovation programme under grant agreement No 691287
28
(and global) power generation capacity is likely to be affected by a range of factors, one of which is
the projected impacts of climate change on the availability and utility of the wind energy resource
across Europe and the world (see expert elicitation in MEDEAS Deliverable 5.1).
Climate change effects on wind energy capacity in Europe
Wind energy is susceptible to the effects of climate change because wind turbines are ‘fuelled’ by
near-surface winds ; the pattern and intensity of which are directly affected by the global
atmosphere and hydrosphere energetic balance. The power output of wind turbines is proportional
to the cube of wind speed 1, so even minor variations in wind speed can affect the total amount of
energy that can be harvested. Furthermore, the overall potential of any given wind resource is
largely dictated by the upper percentiles of the wind speed distribution (Tobin et al, 2014 and Pryor
and Barthelmie, 2009).
The primary mechanism by which climate change may impact the potential of the global wind
resource is through changes to the geographical wind patterns, but also the inter- and intra-annual
variability of these patterns. Other factors which are susceptible to the influence of climatic changes
include turbulence (changeability), direction (prevalence) and the frequency of extreme events
(Dowling, 2013).
Tobin et al (2014) considered the changes in wind energy over the whole of Europe during the 21st
century using a multi-model ensemble of 15 regional climate projections taken from the ENSEMBLES
project, under the moderate SRES A1B emission scenario. This identified that near-surface wind
speeds are projected to decrease over most of the Atlantic and Mediterranean basins, with the
largest decrease over the Mediterranean. Conversely, a small increase in wind speed is expected
over the whole Baltic Sea - though this is likely to be confined to the Baltic basin and not
neighbouring land areas - and also the Strait of Gibraltar and the Bosporus (see expert elicitation in
MEDEAS Deliverable 5.1).
Changes in Extractable Wind Power (EWP) were found to be less than 10% by mid-century and 15%
by late century over 80% of Europe including the oceanic regions; all of the models project changes
were within 15% by mid to 20% by late century over about 95% of Europe. Overall, these results
allow the bounds of wind power changes to be estimated at approximately 15-20% over Europe,
1 This is described as by the Danish Wind Energy Association (2003) as follows: “The wind speed is extremely important for the amount of energy a wind turbine can convert to electricity: The energy content of the wind varies with the cube (the third power) of the average wind speed, e.g. if the wind speed is twice as high it contains 2 3 = 2 x 2 x 2 = eight times as much energy. “
Pg. Marítim de la Barceloneta, 37-49 08003 Barcelona www.medeas.eu [email protected] T +34 93 230 95 00 F +34 93 230 95 55
This project has received funding from the European Union’s Horizon 2020 research and innovation programme under grant agreement No 691287
29
with a high level of confidence. Changes within the working ranges of the turbines were found to
be a large contributor to these figures.
Assessment of season variation indicates that projected mid-century changes in EWP exhibit a
strong seasonality over some regions. EWP is expected to undergo a robust decrease in autumn /
spring by the middle of the century over the Iberian Peninsula, whilst EWP is projected to increase
in spring / (to a lesser extent) summer over the Baltic Sea, and to weakly increase in winter /
decrease in summer over the British Isles. Overall, the magnitude of seasonal changes as assessed
by the ensemble mean is not likely to exceed 10% in Europe. These findings indicate that the wind
power generated by the whole European fleet is expected to be stable across the 21st century, due
to compensating effects between countries. However, this will increase the demand for inter-
regional electricity exchange, and thus cross-border infrastructure is of special interest (see Chapter
4 for details on the relevance of cross-border infrastructure and the finance needed for this).
The ensemble mean annual changes in surface wind speed and EWP are not expected to change
between the mid and late 21st century, though there may be amplified magnitude in most regions
by a few percent. The long-term patterns of changes appear to result from long-term climate
change, rather than multi-decadal variability. This is consistent with the tendency projected under
climate change for general changes in large-scale circulation, such as the poleward expansion of the
Hadley Cell 2, the northward displacement of the jet stream and storm tracks, and the increase in
the north-south pressure gradient with decreased pressures over northern Europe and increased
pressures over southern Europe (Tobin et al, 2014 and Pryor and Barthelmie, 2009).
Air density, which is inversely proportional to the air temperature, changes the energy density in
the wind, which impacts the power output of the wind turbines. As such, a projected increase of
the air temperature will lead to slight declines in air density and therefore a small (but not negligible)
reduction in power production. Air temperatures at high and low extremes are an important
consideration for the location and operation of wind turbines, due to their ability to alter the
physical properties of component material (e.g. embrittlement of rubber seals). Nonetheless, in
northern Europe where the greatest concentration of wind turbines is currently deployed, changes
to air temperature patterns will on balance likely be beneficial to wind turbine operation, with fewer
extremely cold conditions.
2 Harvard School of Engineering and Applied Science (2019) describe Hadley Cells as “the low-latitude overturning
circulations that have air rising at the equator and air sinking at roughly 30° latitude. They are responsible for the trade winds in the Tropics and control low-latitude weather patterns”.
Pg. Marítim de la Barceloneta, 37-49 08003 Barcelona www.medeas.eu [email protected] T +34 93 230 95 00 F +34 93 230 95 55
This project has received funding from the European Union’s Horizon 2020 research and innovation programme under grant agreement No 691287
30
Spiridonov and Valcheva (2017) applied the ALADIN (Aire Limitée Adaption dynamique
Développement Inter-National) regional model to assess wind (and solar ; refer to Section 2.2.2)
energy potential change within Bulgaria during the period 2021-2050. The model produces 10 km-
resolution spatial maps showing changes in percentages relative to the 1961-1990 reference period,
with wind energy potential calculated based on rated power from accumulated nominal capacities
during the reference period and the future period. The model found the project wind energy
changes to range between -12 and + 14 %. The most significant increase of wind energy was
modelled in the eastern and south-eastern region of Bulgaria (8-14%), and in central and south-
western Bulgaria the wind energy potential was modelled to decrease 8-12 % and 4-6%,
respectively. In other regions of the country annual wind energy ranges from - 2 to + 2%. Projected
future seasonality was also assessed, which identified that winter had the largest reduction of wind
power compared to the other seasons in central, south-western and coastal Bulgaria. Conversely,
the largest increase is expected in summer, with the largest increases projected in coastal areas and
the south-western regions of Bulgaria.
Climate change effects on wind energy infrastructure in Europe
In addition to macro-scale changes to regional and global atmospheric energy budgets/circulation,
climate change may also affect the availability and utility of the wind resource, namely through
extreme wind loads, icing of wind turbines, changes to permafrost, changes to air density, extreme
air temperatures and wind-wave interactions. These possible effects of climate change on wind
energy supply, some positive, others negative, will be considered in turn in the subsequent
paragraphs.
Pryor and Barthelmie (2009) assessed modelling outputs which considered the potential for high
wind speeds to evolve as a result of changing storm intensity and tracking. These indicate some
evidence for increased magnitude of wind speed extremes over northern Europe, which is
consistent with a tendency towards poleward displacement of storm tracks and fewer but more
intense mid-latitude cyclones, which could have an adverse effect on future wind generation.
Icing on wind turbines represents a major challenge to installation and operation in high and arctic
latitudes; severe icing can lead to turbine stoppages, and even modest accumulation of ice
substantially reduces electrical power production, and significantly degrades annual power
production. A study for the A2 and B2 SRES scenarios over northern Europe indicated substantial
declines in the occurrence of icing frequency (up to 100% in some areas of Scandinavia), depending
on the location and elevation of the site. This would thus increase wind energy potentials in higher
latitudes. The weight of wind turbines, plus the system frequencies and variable forces exerted by
Pg. Marítim de la Barceloneta, 37-49 08003 Barcelona www.medeas.eu [email protected] T +34 93 230 95 00 F +34 93 230 95 55
This project has received funding from the European Union’s Horizon 2020 research and innovation programme under grant agreement No 691287
31
the rotating turbine make foundation design a crucial consideration. In high latitude locations
where turbines are founded in permafrost, an additional challenge is that warming trends have been
noted to potentially impact the expanse and depth of permafrost, which could potentially affect the
viability of existing and future wind generation capacity. This is discussed in more detail in Section
2.2.7.
For offshore wind capacity, which makes up a large proportion of the growth in installed wind
capacity, changes in atmospheric circulation have the potential to modify wind-wave interactions.
A study of the northeast Atlantic reported the current 20-year return period wave could be expected
to occur every 4-12 years by 2080, combined with an increase in significant wave height of 5-8% by
2100. These factors could potentially prove progressively more challenging for the installation and
operation of existing and future offshore wind generation capacity (Pryor and Barthelmie, 2009).
Side et al (2013) identify that developers are having to consider the direct potential impacts of
climate change on their structures in terms of damage due to increased storminess, as a result of
climate change. The HadAM3H model (used in The UK Climate Impacts Programme 2002 (UKCIP02))
suggested (with low confidence) that winter storms and mild, wet and windy weather can be
expected to become more frequent in coming decades. For structures and the operations
associated with their deployment, inspection, maintenance and eventual removal, there are not
only implications from each of the individual discrete predictions independently, but also where
combinations of extreme events occur, e.g. storm surges and extreme waves may be generated by
the same storm event. The ‘weather windows’ where maintenance can be undertaken may also
become less frequent, with implications for operability and costs associated with offshore wind
turbines. The implications of climate change on offshore infrastructure is discussed in more detail
in Section 2.2.5.
Climate change effects on wind energy compared to other energy
sources
In response to research regarding changes to physical wind resource and the challenges for wind
energy infrastructure in response to climatic changes, other studies have analysed the relative
performance of wind against other energy sources under developing climatic changes, and the
changing financial competitiveness of wind energy under the different climate change scenarios.
Dowling (2013) undertook an assessment of the impact of four climate scenarios on the European
energy system using the Prospective Outlook on Long-Term Energy Sources (POLES) energy model.
POLES is a global partial equilibrium simulation model for the development of energy scenarios up
Pg. Marítim de la Barceloneta, 37-49 08003 Barcelona www.medeas.eu [email protected] T +34 93 230 95 00 F +34 93 230 95 55
This project has received funding from the European Union’s Horizon 2020 research and innovation programme under grant agreement No 691287
32
to the year 2050. The climate impact analysed by POLES included changes in on- and off-shore wind,
solar (PV only ; refer to Section 2.2.2) and hydroelectric, as well as other factors such as the changes
in heating and cooling requirements for the residential and services sector, and the efficiency of
thermal power plants (the finding of the POLES analyses for the other energy sources are discussed
in their respective subsections). The POLES model uses a hierarchical structure of interconnected
modules at the international, regional and national level, which produce detailed world energy
system scenarios allowing the analysis of strategic areas including emission control policies,
technology development and price feedbacks. The model breaks down the world into 47 regions
(31 countries and 16 country aggregates) which allows for the simulation of a complete energy
balance for each region. For the analysis of the European energy system, climate change A1B and
E1 (low emission) scenarios were applied to four climatic runs using climate variables taken from
the ENSEMBLES archive (including average daily temperature, average annual precipitation and
average annual wind speed).
This showed that total primary energy demand is lower under runs containing climate change
impacts compared to runs with no climate change impacts, and that climate change impacts on the
E1 scenario are less pronounced than those in the A1B scenario. Significant differences exist
between regions within the EU, with the Spanish (representing southern Europe) energy system
being more vulnerable than the Swedish (northern Europe) system, and the changes in wind energy
output at each time period (compared to the base time period) for the three A1B climate change
runs as being on average close to zero in the model. This was found to be due to a relative
improvement in the competitiveness of wind power in comparison to thermal power generation,
rather than a change in the efficiency of wind generation.
Hdidouan and Staffell (2016) analysed the financial aspects of wind energy in the UK. They note
that the UK has some of the most substantial wind resources in Europe, which is primarily due to
the British Isles being at a nexus of several mid-latitude air currents that result in a variety of non-
extreme weather phenomena, and the thermal moderation provided by the Gulf Stream, the
European continental landmass and Arctic air masses. The UK’s mid-latitude location also means
that seasonality is important for how wind energy is delivered and redistributed : low pressure
storm systems (extratropical cyclones) from the mid-Atlantic vary greatly by season, with average
wind speeds being 50% higher in the winter than in the summer. The UK’s wind speeds are however
noted to be particularly difficult to project, as they depend on simulating atmospheric phenomena
that are not fully understood.
Pg. Marítim de la Barceloneta, 37-49 08003 Barcelona www.medeas.eu [email protected] T +34 93 230 95 00 F +34 93 230 95 55
This project has received funding from the European Union’s Horizon 2020 research and innovation programme under grant agreement No 691287
33
Hdidouan and Staffell (2016) considered the average cost of energy from wind generation, known
as the levelised cost of electricity (LCOE). Climate model projections show wind resource potentials
increasing in some areas whilst reducing in others. LCOE scales with a 1:1 inverse relationship to
the amount of wind available (where all other variables remain constant) ; so increased wind energy
potentials may not directly lead to greater energy revenues (or a stronger investment incentives).
This nonlinear response is due to the complex behaviour of electricity markets.
Tobin et al (2014) identify that EWP is likely to increase over the Baltic Sea and the British Isles,
though across the majority (80%) of Europe the changes in EWP are projected to be no greater than
±15% overall by the late 21st century. Hdidouan and Staffell (2016) considered the potential for
increases in wind energy potential for the British Isles in more detail, and identified that projected
changes in wind distribution will likely not significantly impact annual wind energy output.
Pg. Marítim de la Barceloneta, 37-49 08003 Barcelona www.medeas.eu [email protected] T +34 93 230 95 00 F +34 93 230 95 55
This project has received funding from the European Union’s Horizon 2020 research and innovation programme under grant agreement No 691287
34
2.2.2. Effects of climate change on solar power
Key Future Challenges for Solar Power
• With climate change, solar energy potential through photovoltaics will increase with more
sun in some regions of Europe.
• Nonetheless, increased clouds and wind in Northern Europe is projected to lead to
reductions of PV potential across Europe by about 10% overall.
o Solar capacity deployment will need to be strategically planned to minimise the loss
of solar generation across Europe.
Summary of Key Points
• The contribution of solar energy to total worldwide electricity production has been and
continues to grow rapidly, and that a large proportion of that growth has taken place within
Europe.
• The use of PV generation is widespread across latitudes, whilst CSP is restricted to the
sunnier tropical and subtropical zones globally.
• Climate modelling using the A1B scenario for the period 2010-80 identified that global PV
and CSP output will see increases in Europe and China.
• Modelling under different RCPs in Europe indicated that PV potential increases by a small
amount in Southern Mediterranean regions and decreases by a larger amount in the
northernmost parts of Europe, with little change in mid-latitude Europe. This concurs with
a change to the North Atlantic Oscillation (NAO) inducing windier and cloudier conditions in
northern Europe.
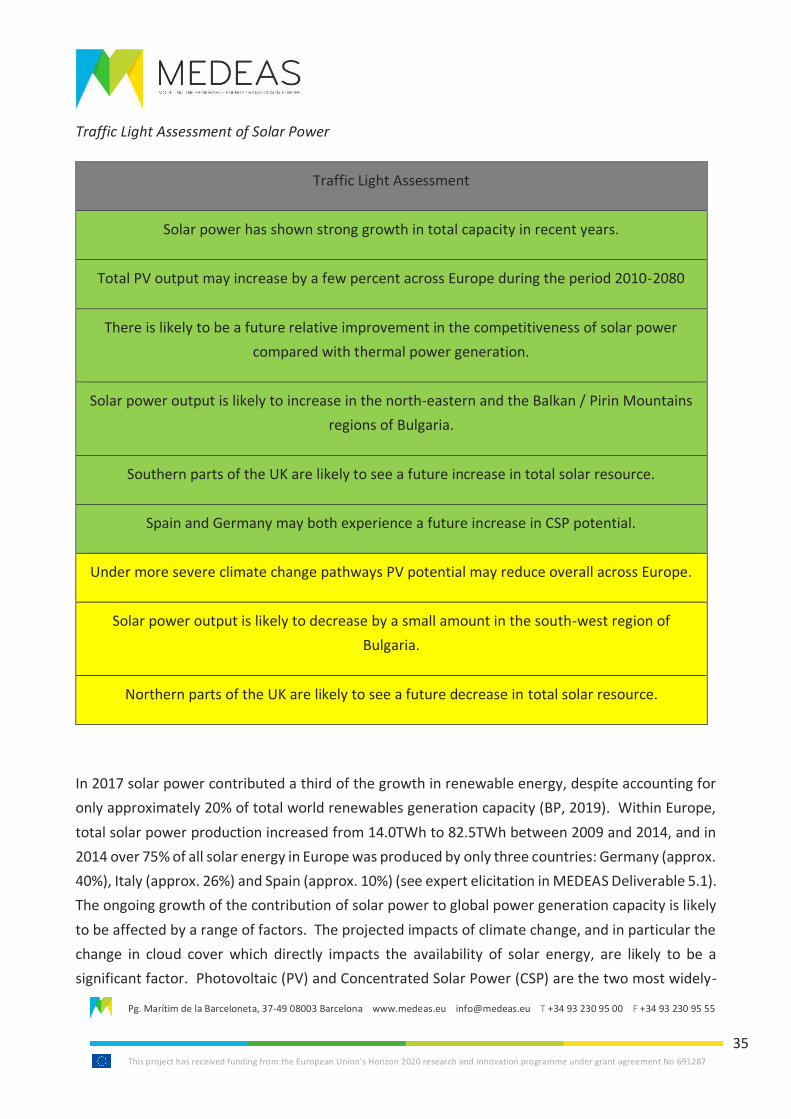
Pg. Marítim de la Barceloneta, 37-49 08003 Barcelona www.medeas.eu [email protected] T +34 93 230 95 00 F +34 93 230 95 55
This project has received funding from the European Union’s Horizon 2020 research and innovation programme under grant agreement No 691287
35
Traffic Light Assessment of Solar Power
Traffic Light Assessment
Solar power has shown strong growth in total capacity in recent years.
Total PV output may increase by a few percent across Europe during the period 2010-2080
There is likely to be a future relative improvement in the competitiveness of solar power
compared with thermal power generation.
Solar power output is likely to increase in the north-eastern and the Balkan / Pirin Mountains
regions of Bulgaria.
Southern parts of the UK are likely to see a future increase in total solar resource.
Spain and Germany may both experience a future increase in CSP potential.
Under more severe climate change pathways PV potential may reduce overall across Europe.
Solar power output is likely to decrease by a small amount in the south-west region of
Bulgaria.
Northern parts of the UK are likely to see a future decrease in total solar resource.
In 2017 solar power contributed a third of the growth in renewable energy, despite accounting for
only approximately 20% of total world renewables generation capacity (BP, 2019). Within Europe,
total solar power production increased from 14.0TWh to 82.5TWh between 2009 and 2014, and in
2014 over 75% of all solar energy in Europe was produced by only three countries: Germany (approx.
40%), Italy (approx. 26%) and Spain (approx. 10%) (see expert elicitation in MEDEAS Deliverable 5.1).
The ongoing growth of the contribution of solar power to global power generation capacity is likely
to be affected by a range of factors. The projected impacts of climate change, and in particular the
change in cloud cover which directly impacts the availability of solar energy, are likely to be a
significant factor. Photovoltaic (PV) and Concentrated Solar Power (CSP) are the two most widely-
Pg. Marítim de la Barceloneta, 37-49 08003 Barcelona www.medeas.eu [email protected] T +34 93 230 95 00 F +34 93 230 95 55
This project has received funding from the European Union’s Horizon 2020 research and innovation programme under grant agreement No 691287
36
installed solar technologies for large-scale electricity generation, which are able to make different
use of the direct and diffuse forms of solar irradiance 3. CSP relies on direct solar irradiance so tends
to be concentrated within the Earth’s ‘sun belt’ of approximately 40°N to 40°S, whilst PV can utilise
both direct and diffuse solar irradiance, so is used within the sun belt and also at higher latitudes
(Crook et al, 2011).
Dowling (2013) identifies that changes in temperature alter the electrical efficiency of commercial
grade, silicon-based solar photovoltaic panels, with the relationship being linear, negative
(decreasing efficiency with rising temperature) and relatively constant across types of PV panel.
Silicon-based PV panels may be replaced in due course by other technologies which are better suited
to the higher average temperature expected due to climate change, which may in turn lessen the
impact of reducing efficiency at higher temperatures.
Crook et al (2011) undertook an assessment of climate change impacts on several global regions
(Europe, western USA, Saudi Arabia, Algeria, Australia and China) using data from two large climate
models, in which the SRES A1B scenario was used to provide climate forcing to assess future climate
change during the period 2010-80. This identified that PV output is likely to increase by a few
percent in Europe and China, undergo only minor change in Algeria and Australia, and decrease by
a few percent in the western USA and Saudi Arabia. CSP output was found to increase by more than
10% in Europe, increase by several percent in China and a few percent in the western USA and Saudi
Arabia. The lower absolute insolation in Europe would still make PV the more economic choice in
that region by late century.
The importance of the role of aerosols (in the form sulphur emissions) is shown by the analysis of
these emissions in different parts of the world, relative to Europe. Sulphur emissions decrease
slowly over the model run in Europe (and North America) where clean air acts have imposed controls
on these emissions. By contrast, in the developing nations such as China, sulphur emissions in the
A1B scenario were found to peak at 2020, and then decline due to air quality controls after that
date. Total insolation in China therefore decreases in the model, and subsequently increases, which
is likely to be caused by sulphate aerosols and their effects on cloud properties.
3 Vaisala Energy (2018) defines direct solar irradiance as “the amount of solar radiation received per unit area by a
surface that is always held perpendicular (or normal) to the rays that come in a straight line from the direction of the sun at its current position in the sky », and diffuse solar irradiance as « the amount of radiation received per unit area by a surface (not subject to any shade or shadow) that does not arrive on a direct path from the sun, but has been scattered by molecules and particles in the atmosphere and comes equally from all directions”.
Pg. Marítim de la Barceloneta, 37-49 08003 Barcelona www.medeas.eu [email protected] T +34 93 230 95 00 F +34 93 230 95 55
This project has received funding from the European Union’s Horizon 2020 research and innovation programme under grant agreement No 691287
37
Jerez et al. (2015) undertook a modelling study covering Europe, using five Regional Climate Models
to downscale five Global Climate Models under Representative Concentration Pathway (RCP) 4.5
and 8.5, to assess changes to potential PV output (PV potential). The pattern of change for mean
surface-downwelling shortwave (RSDS) radiation (2070-2099 vs 1970-1999 climatologies) under
RCP8.5 showed an increase in RSDS (by approximately +5 Wm-2) in the Southern Mediterranean
regions and decreasing RSDS northwards (approximately -10 Wm-2 to -20 Wm-2 in the northernmost
areas), and an intermediate area where the modelled change is not robust.
The latitude-dependent response is typical of the North Atlantic Oscillation (NAO)4 during its
positive phase, which induces windier and cloudier conditions in northern Europe, less windy and
cloudy southwards, in comparison with prevailing conditions during its negative phases. More
intense, frequent or persistent positive NAO phases would lead to enhanced solar radiation in
southern areas within Europe, and conversely depleted solar radiation in northern areas. The
ensemble mean projected changes for PV potential reductions of approximately -10% across Europe
under RCP8.5.
Despite these modelled changes, Jerez et al (2015) conclude that PV systems are likely to expand
over the 21st century, which combined with technological and politico-economical aspects (e.g.
increased lifetime of PV installations, price decreases and appropriate policies supporting PV system
deployment) should counteract negative climate-change effects on the resource availability.
Therefore, on balance climate change is not expected to compromise future PV development in
Europe.
The POLES modelling undertaken by Dowling (2013) identified that solar electricity generation is
higher across the four climate change scenarios compared to the no climate change scenarios,
reaching a total 2050 output of approximately 40TWh. In a similar manner to that modelled for
wind power (refer to Section 2.2.1 for further discussion), the predominant impact on solar output
comes from becoming more competitive compared to thermal power sources. This increased
competitiveness is slightly offset by the decreased electrical efficiency of PV panels with rising
temperatures under climate change.
As described in Section 2.2.1, Spiridonov and Valcheva (2017) applied the ALADIN model to calculate
expected percentage changes in annual solar energy potential (based on projected changes in short-
wave solar radiation) for Bulgaria over the period 2021-2050 relative to a 1961-1990 reference
4 The North Atlantic Oscillation is a weather phenomenon consisting of the permanent low pressure over Iceland and the permanent high pressure over the Azores. These two together control the strength of westerly wind in Europe.
Pg. Marítim de la Barceloneta, 37-49 08003 Barcelona www.medeas.eu [email protected] T +34 93 230 95 00 F +34 93 230 95 55
This project has received funding from the European Union’s Horizon 2020 research and innovation programme under grant agreement No 691287
38
period. The model calculated that there will likely be an increase of 2-3.5% in the north-eastern
region of the country, and 2-6% in the Balkan and Pirin Mountains areas. In other parts a more
modest increase of up to 2% can be expected. A decrease of 0.5% is expected in the south-west
region. In terms of seasonality, solar radiation is projected to increase in winter in the whole
country, but particularly in central, north-eastern and mountain areas. In summer, solar radiation
is projected to increase in the northern and southern regions of the country.
Wild et al. (2017) applied 39 CMIP5 models (using the RCP 8.5 scenario) to assess possible changes
in CSP generation potential in a number of locations around the world between 2006 and 2049,
relative to the decadal mean in the reference period 2006 - 2015. As noted by Jerez et al. (2015),
the southern Mediterranean is likely to see an increase in surface-downwelling shortwave radiation
(RSDS), and one of the locations considered by Wild et al. (2017) for likely changes to CSP potential
is southern-central Spain. The modelling identified that Spain is likely to experience an increase in
CSP potential of 0.15 % per year over the modelling period (and 0.2 % per year in Germany, which
was also one of the locations considered in this paper).
Burnett et al. (2014) undertook a study covering the UK only, using the UKCP09 probabilistic climate
projections. This study identified that cloud cover characteristics, and their impact on solar
irradiance levels, are the most important climate change factor to consider for the UK solar
resource. Human activity causing an increase in atmospheric particles (aerosols) could lead to an
increase in cloud cover, by increasing the amount of cloud condensation nuclei.
The UKCP09 projections comprise 3 different future climate scenarios corresponding to low,
medium and high greenhouse gas emissions. Two 30-year duration time periods were considered;
the 2050s (comprising the time period 2040-2069) and the 2080s (comprising the time period 2070-
2099). The study identified that for a medium emissions scenario, during the period 2040-69 there
will be a reduction in the solar resource over winter months in all regions (most apparent in
northerly regions), and an increase (approximately +8%) in solar resource in the summer months
(particularly in southerly and south-westerly regions). The summer months in northern Scotland
show a minor decrease (approximately -3%) relative to the zero response for the period between
spring and autumn.
Overall, this suggests that in a medium emissions scenario most southern parts of the UK will get
sunnier and will therefore benefit from an increased summer solar energy resource, whilst the
relatively poor resources in the northern parts of the UK will decrease slightly. All regions of the UK
will have increased cloud cover in winter, and therefore a slightly reduced solar energy resource. If
a high emissions scenario is assumed, the study concluded that the UK will see an overall increase

Pg. Marítim de la Barceloneta, 37-49 08003 Barcelona www.medeas.eu [email protected] T +34 93 230 95 00 F +34 93 230 95 55
This project has received funding from the European Union’s Horizon 2020 research and innovation programme under grant agreement No 691287
39
in its solar energy resource of 3.6% for the 2040-69 period, which will increase to 4.4% for the 2070-
99 period.
Pg. Marítim de la Barceloneta, 37-49 08003 Barcelona www.medeas.eu [email protected] T +34 93 230 95 00 F +34 93 230 95 55
This project has received funding from the European Union’s Horizon 2020 research and innovation programme under grant agreement No 691287
40
2.2.3. Effects of climate change on hydroelectric power
Key Future Challenges for Hydroelectric Power
• Regions that are subject to prolonged dry periods may experience large reductions in output
from exiting hydroelectric capacity, as was experienced by Europe during 2017. Low levels
of precipitation over that year led to large reductions in output across all European regions.
• Regions with the greatest hydroelectric capacity and potential (i.e. mountainous areas such
as the European Alps) are likely to continue to be subject to some of the most severe climate
change impacts.
• Different regions of Europe are likely to experience differing gains and losses to their
hydroelectric generation potential under future climate change, which presents challenges
for matching these changes to likely future distributions of power demand.
Summary of Key Points
• The distribution of hydroelectric power generation capacity is very geographically specific in
Europe, with capacity restricted to locations with mountainous regions and / or large rivers.
• The European Alpine Region has already experienced strong climate change, and this is
expected to continue into the 21st century. Climate models show a shift towards earlier
snow melt runoff (especially months of February to May) and a decrease in the summer
months (July to August/September), with general positive changes in temperature resulting
in a reduction in runoff required for run off river storage e.g.
• AUSTRIA: For the case of Austria, the spread of average annual power output change in the
period 2031-2050 over the contrasting climate change and hydrology scenarios is not more
than approximately ±5%. Goler et al (2016) undertook climate modelling using ALADIN ,
REMO and RegCM3 climate models (for scenario A1B), and hydrological modelling using the
HBV model, for Austria. REMO and RegCM3 identified that average specific discharge and
basin yield is projected to fall. The ALADIN model projects a dry climate in all of the study
areas. Higher winter discharges in river basins are however predicted.
• NORWAY: For Norway, different climate scenarios were applied to produce climate
projections for seven representative locations around the country. The average output was
found to increase by between 3.7 and 13.5% for different locations and climate projections,
with the most significant increase being experienced in the West and the North, where much
of the Norwegian hydroelectric capacity is located. This identified that end-use electricity
demand is likely to decrease as total output rises, giving a generally beneficial effect to the
Norwegian hydroelectric sector.
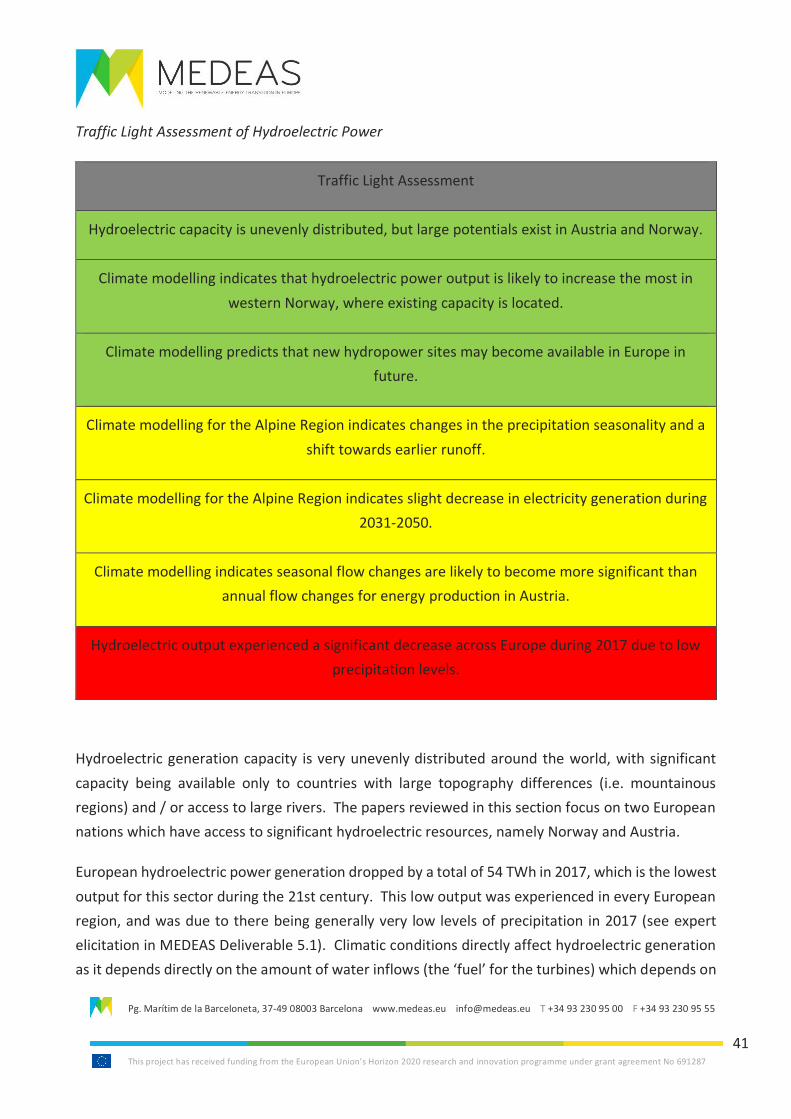
Pg. Marítim de la Barceloneta, 37-49 08003 Barcelona www.medeas.eu [email protected] T +34 93 230 95 00 F +34 93 230 95 55
This project has received funding from the European Union’s Horizon 2020 research and innovation programme under grant agreement No 691287
41
Traffic Light Assessment of Hydroelectric Power
Traffic Light Assessment
Hydroelectric capacity is unevenly distributed, but large potentials exist in Austria and Norway.
Climate modelling indicates that hydroelectric power output is likely to increase the most in
western Norway, where existing capacity is located.
Climate modelling predicts that new hydropower sites may become available in Europe in
future.
Climate modelling for the Alpine Region indicates changes in the precipitation seasonality and a
shift towards earlier runoff.
Climate modelling for the Alpine Region indicates slight decrease in electricity generation during
2031-2050.
Climate modelling indicates seasonal flow changes are likely to become more significant than
annual flow changes for energy production in Austria.
Hydroelectric output experienced a significant decrease across Europe during 2017 due to low
precipitation levels.
Hydroelectric generation capacity is very unevenly distributed around the world, with significant
capacity being available only to countries with large topography differences (i.e. mountainous
regions) and / or access to large rivers. The papers reviewed in this section focus on two European
nations which have access to significant hydroelectric resources, namely Norway and Austria.
European hydroelectric power generation dropped by a total of 54 TWh in 2017, which is the lowest
output for this sector during the 21st century. This low output was experienced in every European
region, and was due to there being generally very low levels of precipitation in 2017 (see expert
elicitation in MEDEAS Deliverable 5.1). Climatic conditions directly affect hydroelectric generation
as it depends directly on the amount of water inflows (the ‘fuel’ for the turbines) which depends on
Pg. Marítim de la Barceloneta, 37-49 08003 Barcelona www.medeas.eu [email protected] T +34 93 230 95 00 F +34 93 230 95 55
This project has received funding from the European Union’s Horizon 2020 research and innovation programme under grant agreement No 691287
42
precipitation (which is represented as rainfall-runoff in models) and evaporation rates, and also
competing water demands (such as for irrigation, which is dictated in part by climatic conditions).
Wagner et al (2016) describe the Alpine region as one of the most climatically vulnerable areas in
Europe, having warmed at a rate about twice as large as the average northern hemisphere from the
late 19th to the end 20th century, resulting in an increase in mean annual temperature of about
+2°C. The intensity and frequency of precipitation has changed as well, though the magnitude and
direction of the changes has depended on the region and season. In coming decades, the
temperatures are expected to continue to increase and the seasonality of precipitation (increases
in winter and decreases in summer) is also expected to change, with the intensity and frequency of
extreme precipitation events expected to increase. Case studies gathered by Wagner et al (2016)
have shown that the expected future changes will alter the runoff dynamics of rivers in the European
Alpine region, in which significant hydroelectric capacity is located, with much of that being within
Austria.
The implications for Europe’s hydro power potential have been analysed at the country scale using
a global water model driven by climate change projections from General Circulation Models (GCMs).
Wagner et al (2016) have undertaken a first assessment of the impact of climate change on stream
flows, and therefore power generation of run-of-the-river plants, based on a scheme-scale analysis
in the entire Alpine region to the year 2050. Expected changes in the discharge characteristics of
101 (sub-) catchments were analysed for the periods 1961-1990 (historical reference period), 2011-
2030, and 2031-2050 using a rainfall-runoff model on a monthly time-step, driven by precipitation
and temperature, using data obtained from the four selected high-resolution climate scenarios. A
total of four regional climate models (RCMs) from the ENSEMBLES project were applied, based on
scenario A1B and 8 different GCM simulations, using new downscaled CMIP5 global climate
projections and new RCPs. The spread of the selected scenarios was taken as representative for
model uncertainty within the A1B scenario. The models are summarised as follows :
• Model # 1 incorporates a very warm and dry climate change signal in summer / mild
conditions in winter (‘warm-dry’) ;
• Model # 2 incorporates a very wet and warm climate change signal in both summer and
winter (‘humid-warm’) ;
• Model # 3 incorporates the special case of a stronger summer than winter warming (‘warm-
summer’) ; and
• Model # 4 has precipitation shifted towards winter season but with little change overall
(‘moderate’).
Pg. Marítim de la Barceloneta, 37-49 08003 Barcelona www.medeas.eu [email protected] T +34 93 230 95 00 F +34 93 230 95 55
This project has received funding from the European Union’s Horizon 2020 research and innovation programme under grant agreement No 691287
43
A hydrological model used temperature and precipitation input data from the four climatic scenarios
to simulate runoff for the two periods 2011-2030 and 2031-2050. The length of the time series for
the runoff modelling ranged from 10 to 60 years, and the size of the catchments modelled ranged
from 150 km2 to more than 100,000 km2. For the case of Austria, projected changes in average
annual electricity generation are for an increase of almost 4% in the humid-warm scenario in the
period 2031-2050, and a decrease by about 4% in the moderate scenario for the same time period.
The climate change signals for the catchments and time periods considered, indicate that for the
individual catchments of the gauging stations (Kienstock and Passau-Ingling, located on the rivers
Danube and Inn) there will be a change in temperature from +0.7 to +2.5°C/+0.7 to +2.7°C
respectively, and in precipitation terms from +5mm/year to +106mm/year and from -11mm/year
to +111mm/year, respectively. These results reflect the complex behaviour of the climate in the
Alpine Region, with relatively low variability in projected temperature increases but a more diverse
picture in terms of precipitation changes. Other processes modelled are snow storage, snow melt,
evapotranspiration, soil water storage, groundwater storage and water exchange with neighbouring
catchments. A shift towards earlier runoff (especially months of February to May) and decrease in
the summer months (July to August/September) are observable, particularly for the small and more
mountainous catchments. This is due to increased glacier melting, which act as seasonal storage for
precipitation and thus hydropower generation.
There is a warming trend in all four scenarios, with monthly variations up to +190% are observed
due to seasonal changes and a shift towards higher runoff, especially in March and April. The
strongest decrease (-70%) is observed in the summer months of July and August (most pronounced
in the warm-dry scenario for the period 2031-2050, compared to 1961-1990). Overall, the
consistent positive changes in temperature generally result in less runoff compared to the changes
in precipitation.
Hydropower plants are not able to convert the total available river runoff to electrical power,
therefore changes in runoff might have diverse effects on the actual power generation. Changes in
stream flow at higher levels may not affect the energy output if the additional water is passing the
hydro power plant via a spillway. However, runoff shifts e.g. to earlier months of the year (due to
the warming trend resulting in less snow storage and earlier snow melt) could lead to an increase in
power output of the plant if these water volumes were previously lost via the spillway and could
instead be used to generate power.
Seasonal shifts have a large impact on hydroelectric generation, as the time of year at which
production in Austria is optimal is spring (due to the flow of meltwater from the Alps), and the least
Pg. Marítim de la Barceloneta, 37-49 08003 Barcelona www.medeas.eu [email protected] T +34 93 230 95 00 F +34 93 230 95 55
This project has received funding from the European Union’s Horizon 2020 research and innovation programme under grant agreement No 691287
44
optimal time of year is February. All of the climate scenarios produce a shift of peak electricity
production towards the winter and spring (particularly Feb to May) and a decrease of electricity
production from hydropower in the summer months (particularly July to August) for all except the
warm-summer scenario. Changes in runoff and hydropower production are mainly a function of the
projected changes in precipitation, however a closer look reveals that other factors contribute too.
In particular, the projected temperature increases generally lead to a decrease in runoff due to
increased evapotranspiration, which results in lower values compared to the changes in
precipitation. For the time period 2031-2050, the warm-dry scenario suggests an increase in
precipitation of nearly 40% of the catchments, but no increased runoff occurs because the
additional water evaporates due to the higher temperatures. Future changes in soil properties, land
use (e.g. an increase in groundwater abstraction for agricultural use will lead to additional runoff
reduction and consequently less hydropower production, especially in the summer months) and
vegetation cover are likely to be factors in the transformation of precipitation to runoff, but these
cannot be modelled currently.
Overall, the climate projections and results from the hydrological/hydropower models show some
clear trends, however the variability in the precipitation patterns, in contrast to general warming
trends in all four climate scenarios, means that there is not an overall strong change in hydroelectric
potential. There are changes in the seasonality and a shift towards earlier runoff in all four climate
scenarios to some extent, which is related to a general warming trend, through their magnitudes
are different. For the whole Alpine Region a slight decrease average annual electricity generation
during 2031-2050 for all climate scenarios considered (up to -8%), whilst for Austria alone, the result
is more diverse, as two scenarios result in a slight increase (not more than approx. +5%), whereas
the other two scenarios result in a slight decrease (not more than approx. -5%).
Goler et al (2016) assessed the impact of climate change on river discharges in Austria, but did not
model the impact on future hydroelectric potential. Data from climate scenario A1B for the period
1951–2100 was input to the ALADIN (refer to Section 2.2.1), REMO and RegCM3 regional climate
models (which are driven by global climate models). Bias in these models was corrected against the
observational EOBS and Alpine Precipitation data sets, to allow calculation of a temperature vertical
profile at the elevations of 250, 750, 1250, 1750, 2500, and 3000 metres. The climate data was then
input to an improved version of the HBV hydrological model which incorporates meltwater from
snow and glaciers; surface, subsurface, and groundwater flows; and evapotranspiration data, to
calculate daily discharges for four different basins.
Pg. Marítim de la Barceloneta, 37-49 08003 Barcelona www.medeas.eu [email protected] T +34 93 230 95 00 F +34 93 230 95 55
This project has received funding from the European Union’s Horizon 2020 research and innovation programme under grant agreement No 691287
45
The climate modelling identified an increase in temperature in all of the basins, which will generate
an increase in evaporation. The RegCM3 model projected an increase in the precipitation of 50
mm/yr, and the REMO model projected 33 mm/yr, for one basin over the period 1981-2010 to 2081-
2100. The average specific discharge is however projected to fall 3 mm/yr, and the basin yield by
18 mm/yr. The ALADIN model projects a dry climate for each of the basins for the second half of
the 21st century, with the reduced precipitation together with the increased evaporation leading to
a large reduction in the water availability. The authors conclude that changes to seasonal flows are
likely to be more significant for energy production than changes to annual flows, with higher
discharges during winter in some basins due to the higher temperatures producing more snowmelt,
thus leading to a reduction in the number of days of low water. These conclusions are broadly in
agreement with the findings of Wagner et al (2016), though the projections of annual discharge
decreases are somewhat more pessimistic.
Seljom et al (2011) state that electricity production in Norway is based mainly on hydroelectric
generation capacity. Climate change has the potential to impact hydroelectric generation through
changes to precipitation rates (this is already happening, with an increase in output due to increased
precipitation rates) and also via changes in end use. Electricity is frequently used for space heating
in Norway, and generally rising temperature across the country due to climate change could
therefore potential reduce overall demands on hydroelectric capacity.
This paper aimed to identify the effects of climate change on the Norwegian energy system to 2050,
with a focus on the influence of climate change on precipitation and end-use demand. Data from
six different IPCC scenarios (including A1B) were applied in several Global Climate Models to
produce 10 climate ‘experiments’ for 20 geographical locations, of which seven (representing
coastal and inland climates) were used for study of prevailing climatic conditions, which then fed
into a Norway-focused version of the International Energy Agency MARKAL energy model.
Future increase in Norwegian hydroelectric power output were found to vary between 3.7 and
13.5% in the different ‘experiments’, with a general increase in the mean precipitation rates in most
areas and seasons across Norway (although the variability between individual scenarios and
geographical areas was found to be large). Additionally, the climatic effect on the precipitation
levels did not show a clear relation to the CO2 concentration/temperature, as the experiment with
the largest CO2 emissions was found to result in the smallest increase in inflow to hydroelectric
plants.
Overall, the largest percentage change was found to be in the West and the North – the large
increase in the West is beneficial because the largest part of Norwegian hydroelectric power
Pg. Marítim de la Barceloneta, 37-49 08003 Barcelona www.medeas.eu [email protected] T +34 93 230 95 00 F +34 93 230 95 55
This project has received funding from the European Union’s Horizon 2020 research and innovation programme under grant agreement No 691287
46
production capacity is located in that region. Additionally, a reduced end-use demand for
hydroelectric-supplied space heating was identified, making the impacts of climate change on the
Norwegian hydroelectric sector generally beneficial.
The analysis undertaken by Dowling (2013) used the LISFLOOD model for all hydropower plants in
Europe, which formed an input to the main POLES model. The climate forcing described in Section
2.2.1 was applied to create variations in rainfall, leading to changes in surface water at each
hydropower station. The model identified a change in hydropower output of less than 1 million
tonnes oil equivalent (Mtoe) (with larger differences in some years reaching 2 Mtoe) by 2050, and
also predicted that the change to installed hydropower capacity (of the European total) by 2050 is
1-2% (depending on the scenario applied). The model also predicted that new hydropower sites (on
currently unexploited rivers and catchment areas) may become suitable in the future under
scenarios with increased rainfall.
Pg. Marítim de la Barceloneta, 37-49 08003 Barcelona www.medeas.eu [email protected] T +34 93 230 95 00 F +34 93 230 95 55
This project has received funding from the European Union’s Horizon 2020 research and innovation programme under grant agreement No 691287
47
2.2.4. Effects of climate change on biofuel
Key Future Challenges for Biofuels
• The primary challenge for biofuels is maintaining a place in future renewable energy
strategy, particularly in Europe. Any direct or perceived competition with land development
and/or food production is likely to make this highly difficult, and as such they are likely to
only retain a niche role, e.g. though the use of agricultural wastes for space heating.
• Climate change projections indicate that regions of southern Europe where biofuel crops can
currently be successfully grown will suffer significant losses in output where temperatures
rise and precipitation reduced significantly in future (though this will likely be offset by
greatly improved growing conditions in northern Europe).
• This is reflected worldwide, with worldwide agricultural output (including biofuel crops) is
already highly vulnerable to changeable climate.
• There is increasing pressure to produce more food for a growing global population, which is
occurring concurrently with the need to find effective substitutes for dwindling fossil
petroleum supplies. The potential for these to compete for land development, and thereby
create more climate change (in a feedback loop) is labelled as the ‘trilemma challenge’.
• However, the use of first generation biofuels as petroleum substitutes has largely fallen out
of favour since the late 2000s, and as such the potential for the ‘trilemma challenge’ to
become serious has diminished significantly.
Summary of Key Points
• Although the European Commission still promotes (first generation, agriculturally-derived)
biofuels as a means to reduce the carbon intensity of transport and other fuels used across
Europe, they are generally often no longer viewed as forming a part of an effective
renewable energy strategy.
• Biofuels will be subject to climate change impacts. Climate scenarios identified that a greater
variety of biofuel crops will extend into northern Europe by the 2080s due to increase
temperatures and rainfall in all scenarios, whilst southern Europe appears to be vulnerable
to severely reduced variety and overall production due to increased temperatures and
reduced precipitation.
• Within the UK, modelling indicates that existing bioenergy crops will likely remain largely
unchanged apart from some changes in regional distribution. Climatic changes in the 2020s,
2050s and 2080s may allow the introduction of new bioenergy crops such as sunflowers and
olives to the UK.
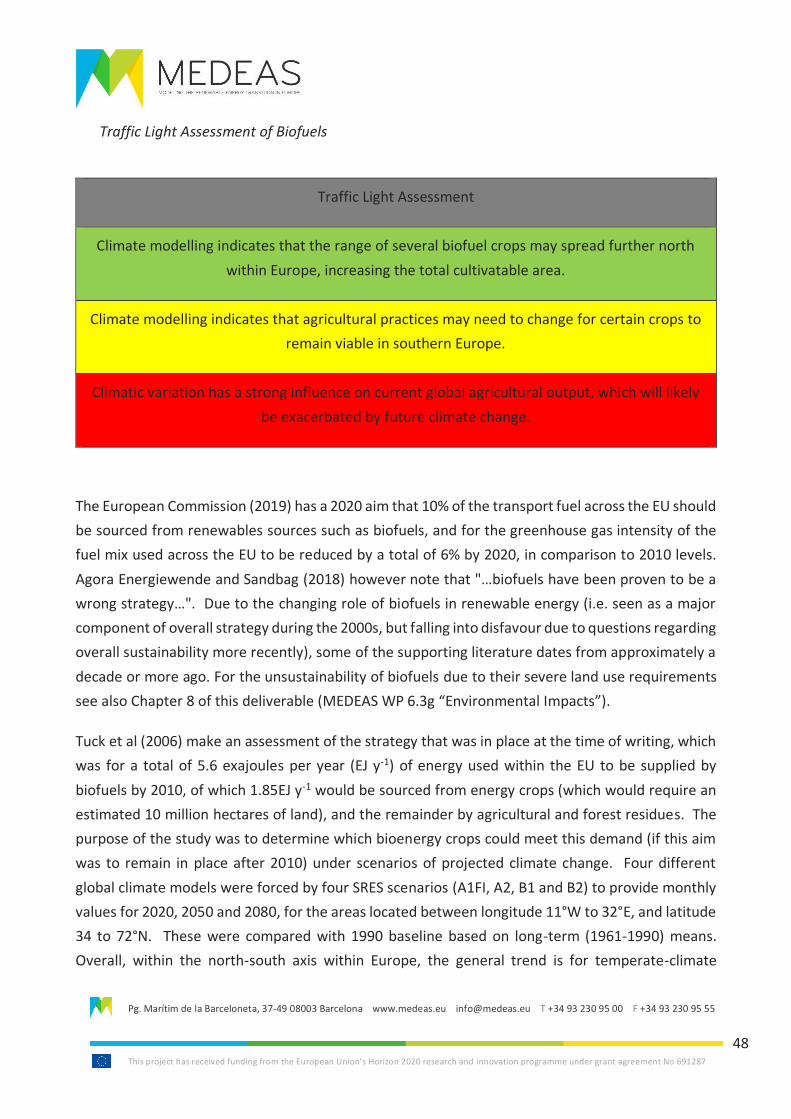
Pg. Marítim de la Barceloneta, 37-49 08003 Barcelona www.medeas.eu [email protected] T +34 93 230 95 00 F +34 93 230 95 55
This project has received funding from the European Union’s Horizon 2020 research and innovation programme under grant agreement No 691287
48
Traffic Light Assessment of Biofuels
Traffic Light Assessment
Climate modelling indicates that the range of several biofuel crops may spread further north
within Europe, increasing the total cultivatable area.
Climate modelling indicates that agricultural practices may need to change for certain crops to
remain viable in southern Europe.
Climatic variation has a strong influence on current global agricultural output, which will likely
be exacerbated by future climate change.
The European Commission (2019) has a 2020 aim that 10% of the transport fuel across the EU should
be sourced from renewables sources such as biofuels, and for the greenhouse gas intensity of the
fuel mix used across the EU to be reduced by a total of 6% by 2020, in comparison to 2010 levels.
Agora Energiewende and Sandbag (2018) however note that "…biofuels have been proven to be a
wrong strategy…". Due to the changing role of biofuels in renewable energy (i.e. seen as a major
component of overall strategy during the 2000s, but falling into disfavour due to questions regarding
overall sustainability more recently), some of the supporting literature dates from approximately a
decade or more ago. For the unsustainability of biofuels due to their severe land use requirements
see also Chapter 8 of this deliverable (MEDEAS WP 6.3g “Environmental Impacts”).
Tuck et al (2006) make an assessment of the strategy that was in place at the time of writing, which
was for a total of 5.6 exajoules per year (EJ y-1) of energy used within the EU to be supplied by
biofuels by 2010, of which 1.85EJ y-1 would be sourced from energy crops (which would require an
estimated 10 million hectares of land), and the remainder by agricultural and forest residues. The
purpose of the study was to determine which bioenergy crops could meet this demand (if this aim
was to remain in place after 2010) under scenarios of projected climate change. Four different
global climate models were forced by four SRES scenarios (A1FI, A2, B1 and B2) to provide monthly
values for 2020, 2050 and 2080, for the areas located between longitude 11°W to 32°E, and latitude
34 to 72°N. These were compared with 1990 baseline based on long-term (1961-1990) means.
Overall, within the north-south axis within Europe, the general trend is for temperate-climate
Pg. Marítim de la Barceloneta, 37-49 08003 Barcelona www.medeas.eu [email protected] T +34 93 230 95 00 F +34 93 230 95 55
This project has received funding from the European Union’s Horizon 2020 research and innovation programme under grant agreement No 691287
49
cereals, oilseeds, starch and biofuel crops to decline in range from the most southern areas of
Europe with time.
Bioenergy crops are annual or perennial species that are specifically cultivated to produce solid,
liquid or gaseous fuels. In addition to these specific crops, organic residues and wastes from food
crops can also be used for producing energy (e.g. cereal straw). Four principal groups of bioenergy
crops are oil crops, cereals, starch crops and solid biofuel, which are described in more detail as
follows :
• Oil crops, which includes oilseed rape/canola, linseed, field mustard, hemp, sunflower,
safflower castor oil, olive and groundnut. This group is subdivided into temperate (e.g.
canola, linseed) and Mediterranean (e.g. sunflower, olive) groups ;
• Cereals, which include barley, wheat, oat and rye. The grains are used directly to produce
ethanol, and the straw can be used as a solid biofuel (these were noted to be the primary
biofuel sources from agricultural activities in Europe at the time of the study) ;
• Starch crops, which include potato, sugar beet, sugar cane. These are a source of ethanol
when the starch they produce is fermented ; and
• Solid biofuel crops, which include cardoon, sorghum, prickly pear, (whole-crop) maize and
short rotation coppice (SRC). These crops can be used produce heat and/or electricity, either
directly through combustion or indirectly through conversion for use as fuels such as
methanol.
The primary output of this study were crop suitability maps, based on prevailing climatic conditions.
These were based on minimum/maximum monthly temperatures at different times of year, and
precipitation requirements, with all crops assumed to be rain-fed and unprotected from frost, with
no account taken of soil type, slope, yield or economic considerations.
For the oil crops, the climatic requirement of oil seed rape and linseed mean that currently they can
potentially be grown across most of Europe, with linseed extending into Northern Scandinavia.
Sunflower, castor and olive currently have a wide potential distribution south of 54°N, but
groundnut and safflower are restricted to small areas in SW Europe. Under the climate change
scenarios, all of the models predict that oilseed rape will remain very widespread throughout
southern and central Europe (35-64°N), with a small increase in potential area 55-64°N. Linseed
distribution will largely shift from southern to northern Europe, whilst distributions of sunflower in
central Europe vary greatly by scenario. Safflower and castor will likely remain restricted to
southern Europe whilst olives may spread to central Europe.
Pg. Marítim de la Barceloneta, 37-49 08003 Barcelona www.medeas.eu [email protected] T +34 93 230 95 00 F +34 93 230 95 55
This project has received funding from the European Union’s Horizon 2020 research and innovation programme under grant agreement No 691287
50
Debaeke et al (2016) discuss the potential future impacts of climate change on sunflower crops in
particular. They note that this crop is currently grown primarily in southern and eastern regions of
Europe, and in future the crops could be exposed to heat stress and drought during its growing
cycle, potentially resulting in severe yield loss, oil content decrease, and fatty acid alterations. These
effects in these regions may potentially be ameliorated through appropriate breeding (earliness,
stress tolerance), crop management (planting dates), and shifting of growing areas. Another effect
may be that cultivation may be possible in northern parts of Europe where sunflower cannot be
grown currently. If the crop was introduced to these areas, it could contribute to diversification of
the cereal-based cropping systems that currently dominate in that region, and would result in
relatively lower greenhouse gas emissions compared to cereals and oilseed rape.
For cereals, barley, wheat, oats and rye can currently be potentially grown throughout the majority
of Europe with the exception of south of 44°N (oats) and north of 65°N (except for barley). Barley
is most widespread due to its lower water requirements, but under the climate change scenarios it
is likely to undergo a substantial decline in southern Europe (this is likely due to the fact that
temperatures >30°C are likely to adversely affect production). The other cereals will likely stay
stable in central Europe, but undergo a significant increase into Scandinavia by the 2080s. For the
starch crops there is a significant decline in importance, with all of the models predicting a decline
of up to 50% of total land within central Europe compared to the 1990 baseline, whilst sugarcane is
predicted to remain a very minor crop in Europe in the future.
For the solid biofuel crops, sorghum and prickly pear are predicted to remain restricted to south of
54°N by the 2080s, whilst maize is likely remain very widespread in southern and central Europe,
and will considerable extend its range north of 65°N. Reed canary grass and SRC are currently
widespread in much of Europe, and are likely to spread to the northern parts of the UK and
Scandinavia, where they may be able to grow in a further 50% of the land area. Eucalyptus could
also potentially be grown nearly everywhere south of 55°N under the climate projections.
The decline is generally most pronounced with the HadCM3 model, due to both temperature and
rainfall effects as this model predicts the greatest increase in temperature and greatest decline in
annual rainfall in that region. In the east-west axis, the models HadCM3 and CGCM2 generally show
greater changes in the west than CSIRO2 and PCM for temperate crops, due to the a combination
of rainfall and temperature effects.
In general, the Mediterranean oilseed/solid biofuel crops (currently limited to southern Europe) are
likely to extend further north with time (with the effects most pronounced by the 2080s), generally
due to higher summer temperatures, and the temperate oilseeds, cereals, starch crops and biofuels
Pg. Marítim de la Barceloneta, 37-49 08003 Barcelona www.medeas.eu [email protected] T +34 93 230 95 00 F +34 93 230 95 55
This project has received funding from the European Union’s Horizon 2020 research and innovation programme under grant agreement No 691287
51
will potentially become much more widespread in northern Europe. This will result in an increased
choice of bioenergy crop over much of Europe under future climate projections, however southern
Europe appears to be vulnerable to severely reduced variety and overall production due to
increased temperatures and reduced precipitation. If bioenergy crops are to remain viable in these
areas in future, efforts will be required to breed strains that are high temperature/drought resistant,
and/or alternative agricultural approaches such as earlier seed sowing will need to be implemented.
Bellarby et al (2010) undertook modelling of the impacts of climate change for 26 bioenergy crops
within the UK only using the UKCIP02 model for the 2020s, 2050s and 2080s (using a 1961-1990
baseline) for the SRES B1, B2, A2 and A1F1 (low, medium-low, medium-high and high) scenarios, at
5 km resolution. The impacts on crop growth due to climate change were assessed on the basis of
elevation, temperature, and high and low rainfall. The findings of the modelling were that the
majority of the bioenergy crop types currently grown in the UK are likely to remain widespread,
though some crops (notably crops of the Miscanthus genus, SRC, willow and poplar) may become
less suited to southeast England (where precipitation levels are predicted to change significantly)
and may therefore may become more prevalent in other more northern parts of the UK.
Additionally, some crops that are not suited to the current UK climate could potentially be
introduced, with cardoon and sorghum likely suitable for cultivation in England, and sunflower, olive
and kenaf may be suited to more extensive areas of the UK. The authors note that the model used
is relatively simple and therefore has high uncertainty, with minor modifications leading to quite
different results, but that it can still provide a guide for identifying areas and crops that are most
likely to be impacted by the largest degree of climate change.
The tendency towards regions with drier warm-temperate or subtropical climates having to adapt
their current agricultural practices to harsher future conditions under projected climate change is
reiterated by Howden et al (2007), who note that a total of approximately 1.2 – 1.5 billion hectares
of land worldwide was under crops (and another 3.5 billion hectares was being grazed) at the time
of writing, and that agriculture in all forms is generally highly sensitive to climate variations, which
is the dominant source of current inter-annual variability in the productivity in many regions.
The El Niño Southern Oscillation, which is associated with cycles of drought and flooding in different
parts of the world, is by itself responsible for between 15% and 35% of global yield variation in
wheat, oilseeds and coarse grains, and as such has a significant influence on the viability of biofuel
crops. This study also notes that biofuels themselves are a strong influencer on demand for
agricultural land, and the markets for agricultural produce, which in turn affects the ability of
farmers to adapt their practices to changing climate.
Pg. Marítim de la Barceloneta, 37-49 08003 Barcelona www.medeas.eu [email protected] T +34 93 230 95 00 F +34 93 230 95 55
This project has received funding from the European Union’s Horizon 2020 research and innovation programme under grant agreement No 691287
52
Harvey and Pilgrim (2010) discuss how land as a limited global resource is likely to become the focus
of intensified competition from a variety of uses over the course of the 21st century. The study
focuses on two unifying drivers for increased competition for land: the increased demand for
transport energy (i.e. biofuels, for vehicles and aircraft), and the increased demand for food.
The study makes the assumption that increased demand for energy and materials will increase
competition for land as petroleum-based fuels become ever-less available and at more volatile cost
in future, and that substitutes will be largely met in significant measure primarily by biofuels. It
also assumes that liquid fuels are, and will continue to be for the foreseeable future, the only
credible means of powering aircraft.
The first Green Revolution supported a large increase in human population with only an
approximate 10% increase (approx. 1.5 million hectares) in total cultivated area of land globally.
The gains from that revolution are however diminishing, particularly as rates of consumption of the
three main grains (wheat, maize and rice) and animal products rise, which is occurring at the same
time as the predicted emergence of an energy gap of up to 10-15% between supply and demand of
hydrocarbons over the next two decades (up to approximately 2030). Where increased demand for
food and energy combine, pressure on land conversion may be significantly increased. This could
feasibly lead to further climate change, which in turn may affect productivity and availability of land,
so potentially creating a feedback – this is the ‘trilemma challenge’.
Harvey and Pilgrim (2010) considered biofuels to be the most likely substitute for liquid fuel that
would be promoted as the substitute for oil, whether for objectives of energy security, economy, or
sustainability. Europe was considered to be one of the three major biofuel producing regions of the
world, alongside the USA and Brazil, and was at the time the major biodiesel producer in the world,
>80% of which was derived from rapeseed. A large part of the reason for this predominance was
the rapid ‘dieselisation’ of the European vehicle fleet up to the time of the study. However, this
move towards a predominantly diesel European vehicle fleet, as well the more general view of first
generation biofuels as the foremost solution to petroleum depletion, has largely fallen out of favour
since 2010 (Agora Energiewende and Sandbag, 2018). As such, several of the land development
pressures described by Harvey and Pilgrim (2010) are likely no longer as pressing as they were at
the time of writing in 2010.
Pg. Marítim de la Barceloneta, 37-49 08003 Barcelona www.medeas.eu [email protected] T +34 93 230 95 00 F +34 93 230 95 55
This project has received funding from the European Union’s Horizon 2020 research and innovation programme under grant agreement No 691287
53
2.2.5. Effects of climate change on oil and gas
Key Future Challenges for Oil and Gas
• Climate change is likely to present significant risk challenges for oil and gas production
infrastructure.
• This is particularly the case for the infrastructure that is located offshore (the coastal zone,
outer continental shelf, and in deep water), due to greater storminess. In the Northern
Hemisphere a trend for increasing wave height has been observed, though some studies
indicate that the peak may already have been passed. Storm intensity is likely to increase,
with increased cyclone activity in the tropics/subtropics (which can lead directly to severe
infrastructure damage), and for the North Atlantic modelling indicates that winter storms
are also expected to become more frequent. Tidal surges are also expected to become
larger, and surge events could present a potential hazard where they combine with
increased storm energy. Seabed scour could be worsened by storms and surges, and this
has the potential to directly damage infrastructure, particularly undersea pipelines.
Increased lightning events may present risk of varying types of damage.
• Aside from direct damage to infrastructure, climate change may reduce the frequency and
duration of ‘weather windows’ in which construction, maintenance etc. takes place, and may
lead via ‘external’ environmental and ecological impacts to a shift to more stringent
regulation of the hydrocarbon industry.
• For onshore oil and gas infrastructure in high-latitude regions, which provide supplied to
Europe, permafrost melting may have significant impacts on existing infrastructure.
Traffic Light Assessment of Oil and Gas
Traffic Light Assessment
Climate modelling indicates that winter storms and mild, wet and windy weather may become
more frequent in European offshore oil and gas-producing areas.
Seabed scour caused by future increasing storm surges have the potential to damage
underwater oil and gas infrastructure.
Pg. Marítim de la Barceloneta, 37-49 08003 Barcelona www.medeas.eu [email protected] T +34 93 230 95 00 F +34 93 230 95 55
This project has received funding from the European Union’s Horizon 2020 research and innovation programme under grant agreement No 691287
54
Increasing regulation in climate impacted-areas may increase the cost of offshore oil and gas
operations.
Diminishing future ‘weather windows’ for at-sea working may increase the cost of offshore oil
and gas operations.
Oil and gas extraction fields in onshore permafrost zones may be susceptible to future thaw-
related ground instability
Oil and gas continue to provide a large and growing component of the world energy mix.
Oil currently provides the overwhelming majority of transport fuel (i.e. for vehicles, ships and
aircraft) across the world, and natural gas is used for a major component of electricity production
in many parts of the world, and also is an important or primary energy feedstock for many vital
industrial processes (such as fertiliser and cement production). World oil consumption growth
averaged 1.8%, or 1.7 million barrels per day, above its 10-year average of 1.2%, and gas
consumption rose by 96 billion cubic metres, or 3%, during 2017 (BP, 2018).
Burkett (2011) notes that the infrastructure for obtaining and distributing oil and gas is potentially
vulnerable to the effects of future climate change, particularly where that infrastructure is located
offshore, or close to coastlines. As climate change impacts intensify in the coming decades changes
in marine and coastal systems are likely to affect the potential for energy resource development in
the coastal zone and outer continental shelf (OCS). The capacity for expanding and maintaining
onshore and offshore support facilities and transportation networks is also likely to be impacted by
climatic influences.
Within the Northern Hemisphere a trend over the span of several decades for increasing wave
height has been observed. Increased wave heights have the potential to damage offshore and
coastal drilling and production platforms, onshore support facilities, transportation infrastructure
(e.g. bridge supports) and to cause pipeline damage (and exposure / damage to buried pipelines).
Although not yet fully understood, this trend in increasing wave height is potentially related to the
positive phase of the NAO, and also Tropical Ocean warming. Side et al (2013) however note that
an appraisal of NAO records indicates that in the North Atlantic near Norway extreme wave events
Pg. Marítim de la Barceloneta, 37-49 08003 Barcelona www.medeas.eu [email protected] T +34 93 230 95 00 F +34 93 230 95 55
This project has received funding from the European Union’s Horizon 2020 research and innovation programme under grant agreement No 691287
55
before 1960 were likely to have been more severe than those experienced since, whilst on the wider
scale significant wave heights have been reducing in the autumn since a peak in 1980-1985.
An increase in storm intensity due to climatic changes is largely associated with tropical and
subtropical regions (which includes major oil and gas producing areas such as the Gulf of Mexico),
although extra-tropical cyclones (such as Atlantic hurricane ‘remnants’) may also become more
numerous (Burkett, 2011), and have the potential to impact western/northern Europe by causing
damage to offshore platforms and above-surface pipelines (such as those located in the North Sea).
Side et al (2013) note that the HadAM3H model as used in UKCIP02 indicates (with low confidence)
that winter storms and mild, wet and windy weather were expected to become more frequent.
Although there is a southward shift in the North Atlantic storm track in this model, the increase in
frequency occurs to the southwest of the British Isles, and wave modelling indicates that seasonal
mean and extreme waves are generally expected to increase slightly to the southwest, reduce to
the north of the British Isles, and experience little change in the North Sea.
Surge events in the waters around the UK are also noted to be linked to extra-tropical weather
patterns, which produce a wide variety of dynamic responses. When considering tidal surges,
attention is usually given to the extreme high water levels generated at the coast. However, fast-
flowing offshore currents are also generated during both positive (high coastal water levels) and
negative (lower coastal water levels) surge events. Around the UK the size of storm surge expected
to occur on average about once in every 50 years is projected to increase by less than 0.9mm per
year, which will be largely indistinguishable from natural variability in most locations. There is
however potential for storm surges and extreme waves to be generated by the same storm event.
Structures located beneath the sea surface are mostly in deep water and with increasing depth such
structures are less prone to the destructive influence of surface waves. Storm surges may however
cause an increase in seabed currents, which can lead to enhanced scour around structures at the
seabed. For large, gravity-based hydrocarbon extraction structures, problems associated with scour
have been well-studied, but there are as yet no studies as to how seabed scour may be exacerbated
by climate change. Although there have been recorded incidences of mooring failure and damage
of floating hydrocarbon structures, there has been only one major floating offshore platform
disaster associated with a storm event in the North Sea. In most cases the design lifetime of oil and
gas installations is on the order of 25-50 years, and with declining production in the North Sea, many
of these structures will likely be decommissioned in the near future, where they cannot satisfy
changes in design criteria brought about by changing climatic conditions. Where this is not possible,
the replacement or modification of existing structures would likely involve substantial costs.
Pg. Marítim de la Barceloneta, 37-49 08003 Barcelona www.medeas.eu [email protected] T +34 93 230 95 00 F +34 93 230 95 55
This project has received funding from the European Union’s Horizon 2020 research and innovation programme under grant agreement No 691287
56
In the surf zone/near-shore waters, pipelines are vulnerable to forces from waves, particularly
during high-energy storm events, and as a consequence it is standard for a high level of protection
to be provided in such zones, mostly by burial and rock dumping. In the UK OCS significant lengths
of hydrocarbon pipeline is located in deeper waters where currents close to the seabed, rather than
wave action, are more influential on the status of the pipeline. Seabed scouring occurs continually
but may be exacerbated during storm surges, and in extreme cases sediment scour may leave
stretches of the pipeline unsupported, resulting in spanning. Also, continued exposure of a pipeline
to current can create vortex shedding-induced vibrations, which could potentially create stresses
sufficient to eventually result in pipeline fracture.
Cruz (2010) notes the potential for very large and intense storms (hurricanes and typhoons) to cause
severe damage to hydrocarbon infrastructure in various major producing regions in several
locations around the world. There are increasing risks associated with these storms, as they are
likely to become more frequent and intense with climate change, with higher wind speeds and
heavier precipitation. Hurricanes Katrina and Rita impacted the Gulf of Mexico oil and gas industry
severely during the 2005 Atlantic hurricane season. More than 2000 offshore oil and gas platforms
were affected during these events, 163 were completely destroyed, hundreds of kilometres of oil
and gas pipelines were displaced or broken (inland and offshore), and much infrastructure remained
out of operation many months after the storms. The frequency of lightning events is also expected
to increase with the predicted rise in frequency/ intensity of meteorological hazards with projected
climate change. Up- and downstream oil and gas industry activities vulnerable to lightning impact,
due to the risk of fire, explosion and release of hazardous materials. Existing lightning protection
measures, such as e.g. grounding of equipment or the installation of lightning rods or circuit
breakers, may be insufficient for these new conditions.
Burkett (2011) and Side et al (2013) note that as well as the increased forces and stresses that
structures might have to withstand in the future, many aspects of the deployment, operation and
maintenance of oil and gas infrastructure will be affected by potentially-diminishing ‘weather
windows’ for at-sea working. Reduction in weather window occurrence could also have significant
implications for many of the monitoring and maintenance activities that are currently carried out
for oil and gas industry structures, including pipelines.
Burkett (2011) also highlights that another, indirect effect of climate change-induced warming of
coastal waters is the potential perturbation of the finely-balanced environments (energy, salinity,
and water level gradients) and ecosystems that exist in these zones. Seasonally elevated water
temperatures can be associated with algal blooms, and a sea surface temperature rise
Pg. Marítim de la Barceloneta, 37-49 08003 Barcelona www.medeas.eu [email protected] T +34 93 230 95 00 F +34 93 230 95 55
This project has received funding from the European Union’s Horizon 2020 research and innovation programme under grant agreement No 691287
57
approximately 1°C or more above the monthly maximum can lead to coral bleaching. Changes to
oceanic pH and salinity due to increased atmospheric CO2, and rising atmospheric temperatures,
also have the potential to impact marine ecosystems. Although unlikely to directly impact current
coastal or offshore oil and gas operations, effects such as these have the potential to significantly
affect the regulatory and political environment in which existing and future oil and gas facilities
operate.
Hjort et al (2018) identify that 45% of the hydrocarbon extraction fields in the Russian Arctic (and
69% of the pan-Arctic residential, transportation and industrial infrastructure) are located in high-
hazard regions where the ground is susceptible to permafrost thaw-related ground instability. Also,
oil and natural gas transportation routes from the production areas to European markets may also
be at considerable risk, as they are in the area in which near-surface thawing effects may occur by
2050. The Yamal-Nenets Region in north-western Siberia accounts for more than one-third of the
European Union’s pipeline natural gas imports, and is one of the areas at high risk for infrastructure
damage due to thaw-related ground instability. The effects of permafrost thaw are discussed in
more detail in Section 2.2.7.
Pg. Marítim de la Barceloneta, 37-49 08003 Barcelona www.medeas.eu [email protected] T +34 93 230 95 00 F +34 93 230 95 55
This project has received funding from the European Union’s Horizon 2020 research and innovation programme under grant agreement No 691287
58
2.2.6. Effects of climate change on coal mining
Key Future Challenges for Coal Mining
• Increasing temperatures may lead directly to more difficult work conditions for coal miners,
damage to equipment and increased risk from wildfires and windstorms.
• Changes to precipitation levels may result in water scarcity (affecting the mining process
itself, and potentially causing conflicts with other users) or alternatively flooding events due
to extreme rainstorm events.
• Climate change-induced extreme weather events may increase the risk of spontaneous mass
movements, including slippage of waste rock, the failure of tailings dams, and more general
hazardous earth movements in mining areas.
• Water scarcity and hotter temperatures may make it more difficult to re-establish vegetative
cover following mine closure, and will likely increase energy demand for cooling.
• Climate change may exacerbate many of the environmental impacts of mining, as follows :
o The release of toxic heavy metals from AMD may increase under climate change
conditions, which may lead to greater contamination of water resources and soil, and
release of contaminated dust.
o Ecosystems are directly impacted by the construction and operations of mines, and
forms of mining such as mountaintop removal may add additional stress to
ecosystems that are already being affected by climate change.
o Generally drier conditions and changing wind patterns may result in greater dust
transport over greater distances.
Summary of Key Points
• Coal continues to be a large component of global electrical generation capacity and as a
source of industrial heat, and its use has continued to show growth in recent years.
• Coal mines were built on the assumption of a stable climate, and every stage of the mine
lifecycle is vulnerable to impacts arising from climate change.
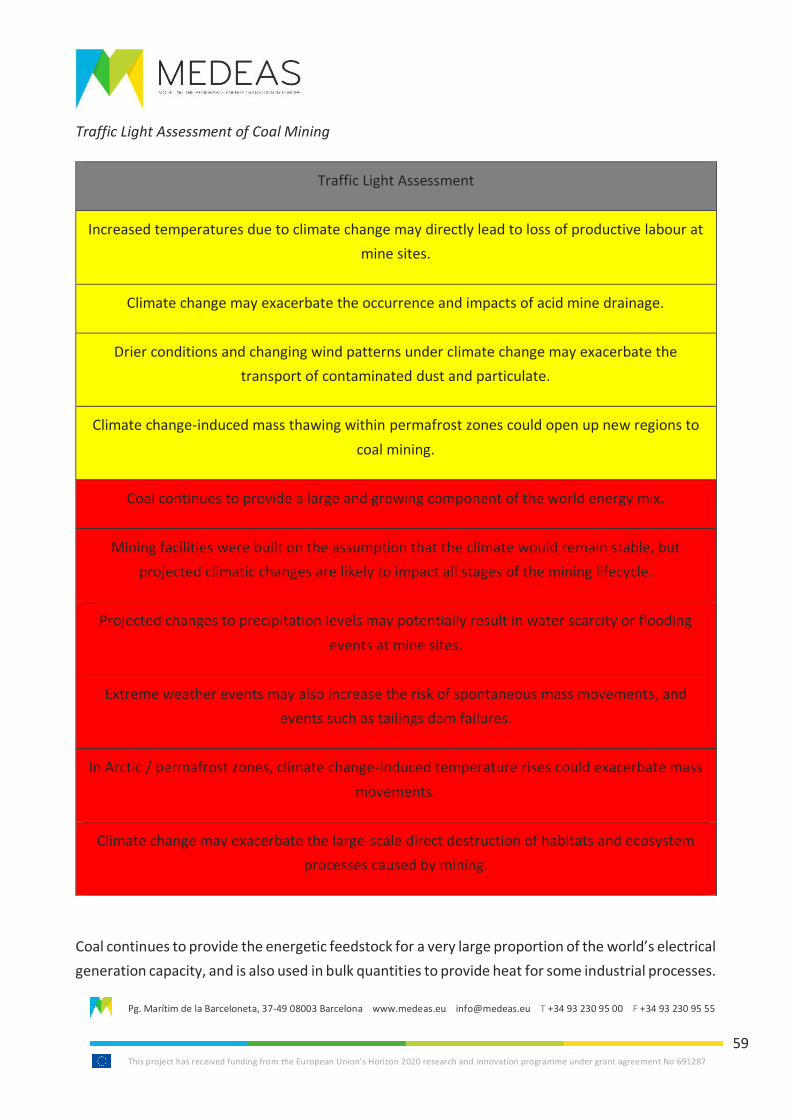
Pg. Marítim de la Barceloneta, 37-49 08003 Barcelona www.medeas.eu [email protected] T +34 93 230 95 00 F +34 93 230 95 55
This project has received funding from the European Union’s Horizon 2020 research and innovation programme under grant agreement No 691287
59
Traffic Light Assessment of Coal Mining
Traffic Light Assessment
Increased temperatures due to climate change may directly lead to loss of productive labour at
mine sites.
Climate change may exacerbate the occurrence and impacts of acid mine drainage.
Drier conditions and changing wind patterns under climate change may exacerbate the
transport of contaminated dust and particulate.
Climate change-induced mass thawing within permafrost zones could open up new regions to
coal mining.
Coal continues to provide a large and growing component of the world energy mix.
Mining facilities were built on the assumption that the climate would remain stable, but
projected climatic changes are likely to impact all stages of the mining lifecycle.
Projected changes to precipitation levels may potentially result in water scarcity or flooding
events at mine sites.
Extreme weather events may also increase the risk of spontaneous mass movements, and
events such as tailings dam failures.
In Arctic / permafrost zones, climate change-induced temperature rises could exacerbate mass
movements.
Climate change may exacerbate the large-scale direct destruction of habitats and ecosystem
processes caused by mining.
Coal continues to provide the energetic feedstock for a very large proportion of the world’s electrical
generation capacity, and is also used in bulk quantities to provide heat for some industrial processes.
Pg. Marítim de la Barceloneta, 37-49 08003 Barcelona www.medeas.eu [email protected] T +34 93 230 95 00 F +34 93 230 95 55
This project has received funding from the European Union’s Horizon 2020 research and innovation programme under grant agreement No 691287
60
Global consumption of coal increased by 25 Mtoe (or 1% ; the first growth since 2013) in 2017,
though its use in primary energy fell to 27.6% (the lowest since 2004). Within Europe the total
consumption of coal was 296.4 Mtoe in 2017 (an approximate 0.4% increase over the 2016
consumption of 295.1 Mtoe), of which Germany, Poland and the Czech Republic were the
predominant European Union consumers (71.3, 48.7 and 16.0 Mtoe, respectively ; all of these
countries used less coal in 2017 than 2016). Outside of the EU but within Europe, Turkey is also a
major coal consumer (44.6 Mtoe in 2017) (BP, 2018).
Mines and their supporting infrastructure are vulnerable to the effects of future climate change.
Both Phillips (2016) and Odell et al (2018) note that the literature on the subject of the vulnerability
of the surface mining sector to climate change is limited, but both papers do highlight a number of
ways in which mining (including coal mining) may be impacted by climate change effects. Odell et
al (2018) note that a large part of the vulnerability of the sector arises from the fact that mining
facilities were built on the assumption that the climate would remain stable. Climate change is
however likely to adversely impact the economics and practicalities associated with all stages of the
mining lifecycle, including exploration, extraction, production, transportation, product shipping, and
decommissioning/reinstatement.
Increased temperatures due to climate change may directly lead to loss of productive labour (either
in the longer term through difficulties in sourcing workers due to generally harsh working
conditions, or in the short term due to day-to-day health and safety concerns and constraints),
damage to equipment and increased risk from wildfires and windstorms that may directly impact
mines. Changes to precipitation levels may result in water scarcity (mining is water-intensive in both
the extraction and processing stages, and competing demands with other local users such as
ecosystems and local communities may be exacerbated) or alternatively flooding events due to
extreme rainstorm events. Phillips (2016) notes that there may also be some feedback loops
between climate change and mining, because it involves the removal of vegetation and disturbs
surface hydrology (e.g. drainage, infiltration and surface flow), so both dry conditions and the extent
and impacts of flooding could be worsened by mines. In the event of flooding, the sediment load
(which may be heavy metal contaminated) may be increased. Near-shore mines also may
potentially be directly vulnerable to climate change-induced sea-level rise.
Extreme weather events may also increase the risk of spontaneous mass movements of the material
generated as part of the mining process. Large-scale mining generates open rock faces, spoil piles
and tailings ponds retained by dams and other earth structures, and precipitation saturation and/or
flooding events could result in the slippage of waste rock, the failure of tailings dams, or more
general hazardous earth movements in mining areas. Nelson and Schuchard (2011) expand on this
Pg. Marítim de la Barceloneta, 37-49 08003 Barcelona www.medeas.eu [email protected] T +34 93 230 95 00 F +34 93 230 95 55
This project has received funding from the European Union’s Horizon 2020 research and innovation programme under grant agreement No 691287
61
by noting that more frequent and intense climatic events may damage mine transportation routes,
energy infrastructure and equipment, which will in turn disrupt construction and operations. Very
heavy rain events and increased erosion may affect slope stability near opencast mines, disrupt
access roads and hamper maintenance. Tailings dam failures resulting from heavy rainfall may lead
to direct loss of life, and also cause the discharge of contaminated water into surrounding areas,
potentially leading to high remediation and other liabilities, impacts on community health and
safety, and significant potential for reputational damage.
In terms of hydrological processes, surface mining operations in general require large quantities of
water for basic functions like mineral extraction and processing. A reduction in precipitation is a
likely impact of projected climate change in many areas of the world and this could exacerbate any
conflicts mines have with other local water users. Water scarcity and hotter temperatures may
make it more difficult to re-establish vegetative cover following mine closure, and will likely increase
energy demand to cool underground mines and surface facilities. This may also lead to increased
prevalence of tropical diseases, potentially exacerbating staffing problems. Fluctuating
temperatures may also increase energy demand and strain the capacity of transmission and
distribution facilities can disrupt supplies to operations.
Phillips (2016) considers how the environmental impacts of mining may be exacerbated by climate
change. Although this is not a direct appraisal of how climate change may impact the operation and
viability of mines, it may nonetheless be indirectly relevant as the planning, regulation and future
operations of mines will depend on current environmental impacts being manageable. If climate
change were to significantly increase the existing environmental impacts of mines, this could result
in serious future implications for the mining industry. This study explores five themes relating to
mining activities : heavy metals, hydrological processes and resources, ecological impacts, air
pollution and mass movements.
Acid mine drainage (AMD) is a mechanism by which heavy metal contamination is generated, and is
caused by the release of aqueous metals from the oxidation of metal sulphides, usually due to water
infiltration into or precipitation onto waste spoil material or exposed rock surfaces. This can result
in the direct contamination of soil (potentially impacting mine revegetation and/or causing crop
contamination) and water resources, or the release of contaminated dust. Climate change may
exacerbate the occurrence and impacts of AMD by raising oxidation rates due to increased air
temperature, increased saturation of rock through increased precipitation and raised surface water
and groundwater levels, and increased transport of contaminants (aqueous or in sediment) via
flooding, and increased wind transport of contaminated dusts.
Pg. Marítim de la Barceloneta, 37-49 08003 Barcelona www.medeas.eu [email protected] T +34 93 230 95 00 F +34 93 230 95 55
This project has received funding from the European Union’s Horizon 2020 research and innovation programme under grant agreement No 691287
62
Mining often results in large-scale direct destruction of habitats and ecosystem processes by land
clearance and excavation. Mountaintop removal mining is an invasive technique largely used for
coal mining, which involves the complete mass removal (usually by blasting) of rock overburden
over coal seams, so is particularly destructive of ecosystems and has a range of secondary
environmental effects, including contamination of waterways through spoil dumping. Odell et al
(2018) describe an additional ecosystem impact unique to mountaintop removal mining, which is
the destruction of habitats that may be vital to species and ecosystems already under stress from
climate change. If 300 m were to be removed from mountaintops over a large area, this could
equate to as much as 1.95°C temperature difference in terms of elevation. Any species that have
already been forced to relocate to higher elevations due to climate change (i.e. that were using
mountain tops as ‘refuges’) would then find no alternative habitat at ideal temperature in
landscapes where this technique had been used, and therefore mining in this way could increase
regional rates of species extinction and ecosystem loss.
In terms of air pollution, mines generate dust and particulate matter from sources such as
transportation on haul roads, wind erosion of stockpile and open surfaces (benches, slopes, tailings
etc.), overburden removal, crushing and grinding etc. Generally drier conditions and changing wind
patterns (including more intense wind events) due to climatic conditions may transport greater
volumes of dust and particulate over greater distances. This dust and particulate may be hazardous
in its own right, and / or may transport elevated concentrations of contaminants such as heavy
metals to locations remote from the mine, potentially impacting human health, ecosystems and
environments such as waterways.
Mass movements may include the large-scale, sudden events as described by Odell et al (2018) and
Nelson and Schuchard (2011), but could also cover smaller/slower events such as creep and
solifluction 5, which could still impact the viability of mining operations over time. In Arctic /
permafrost zones, climate change-induced temperature rises could directly affect the slope stability
of previously-frozen terrain. In relation to this, Nelson and Schuchard (2011) note another potential
future influence from climate change in permafrost regions : mass thawing could open up these
regions to mining (including coal mining) through improved accessibility (via new roads and
northern sea channels free of ice, allowing longer and more efficient shipping), and a less hostile
climate. This is discussed in more detail in Section 2.2.7.
5 Defined by Harris et al (2008) as slow (several mm to several cm per annum) mass movement.
Pg. Marítim de la Barceloneta, 37-49 08003 Barcelona www.medeas.eu [email protected] T +34 93 230 95 00 F +34 93 230 95 55
This project has received funding from the European Union’s Horizon 2020 research and innovation programme under grant agreement No 691287
63
2.2.7. Issues of permafrost thawing and energy infrastructure
Key Future Challenges Relating to Permafrost Thawing
• Thawing of ice-rich, fine-grained soil can cause lowered soil shear strength. This can directly
affect any overlying structures, and can also indirectly damage infrastructure via increased
incidents of mass movement.
• Considering RCP 2.6/4.5/8.5, up to 70% of pan-Arctic infrastructure in the permafrost
domain is in area susceptible to thaw-related ground instability due to thaw of near-surface
permafrost by 2050.
• Even if Paris Agreement targets are achieved, the majority of fundamental Arctic
infrastructure will be at risk, impacting up to approximately 3.6 million people / 75% of the
permafrost region population.
• Consideration of a high-latitude Fennoscandia region was modelled using an ensemble
approach and RCP 2.6/4.5/8.5 indicates the potential for a notable reduction in the current
periglacial climate realm over the region and by the end of the 21st century.
• These changes in perennial ground ice is likely to increase the risk of rapid slope
displacements and thaw subsistence, with likely severe impacts on existing infrastructure
and infrastructure development.
Summary of Key Points
• Permafrost covers approximately 25% of the Earth’s terrestrial areas and is a key component
of the global cryosphere, and in Europe, permafrost occurs primarily in Svalbard, Iceland,
Fennoscandia and the Alpine Region.
• European permafrost areas are likely to be highly vulnerable to climate change-induced
melting.
• The PACE project, which established a north-south European transect of permafrost
monitoring boreholes, has noted a strong ground warming trend (up to 1°C increase), which
has occurred during all seasons, though the warming has been especially pronounced during
the autumn and winter, for a borehole site in the Swiss Alps.
• Construction and maintenance of infrastructure in permafrost regions represent an
engineering challenge. Ground ice is the main problem directly affecting infrastructure, with
its susceptibility to creep and (in particular) melt.
• Specially adapted construction and maintenance techniques are necessary to ensure the
longevity of any infrastructure located in permafrost regions.
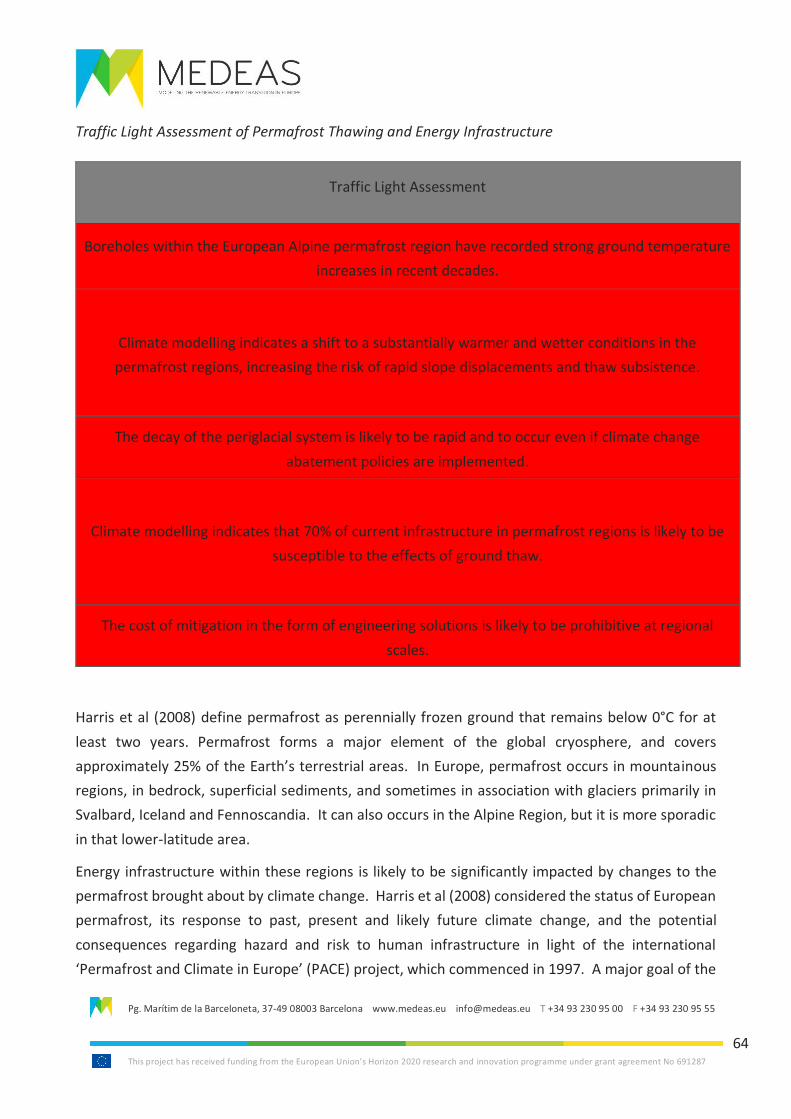
Pg. Marítim de la Barceloneta, 37-49 08003 Barcelona www.medeas.eu [email protected] T +34 93 230 95 00 F +34 93 230 95 55
This project has received funding from the European Union’s Horizon 2020 research and innovation programme under grant agreement No 691287
64
Traffic Light Assessment of Permafrost Thawing and Energy Infrastructure
Traffic Light Assessment
Boreholes within the European Alpine permafrost region have recorded strong ground temperature
increases in recent decades.
Climate modelling indicates a shift to a substantially warmer and wetter conditions in the
permafrost regions, increasing the risk of rapid slope displacements and thaw subsistence.
The decay of the periglacial system is likely to be rapid and to occur even if climate change
abatement policies are implemented.
Climate modelling indicates that 70% of current infrastructure in permafrost regions is likely to be
susceptible to the effects of ground thaw.
The cost of mitigation in the form of engineering solutions is likely to be prohibitive at regional
scales.
Harris et al (2008) define permafrost as perennially frozen ground that remains below 0°C for at
least two years. Permafrost forms a major element of the global cryosphere, and covers
approximately 25% of the Earth’s terrestrial areas. In Europe, permafrost occurs in mountainous
regions, in bedrock, superficial sediments, and sometimes in association with glaciers primarily in
Svalbard, Iceland and Fennoscandia. It can also occurs in the Alpine Region, but it is more sporadic
in that lower-latitude area.
Energy infrastructure within these regions is likely to be significantly impacted by changes to the
permafrost brought about by climate change. Harris et al (2008) considered the status of European
permafrost, its response to past, present and likely future climate change, and the potential
consequences regarding hazard and risk to human infrastructure in light of the international
‘Permafrost and Climate in Europe’ (PACE) project, which commenced in 1997. A major goal of the
Pg. Marítim de la Barceloneta, 37-49 08003 Barcelona www.medeas.eu [email protected] T +34 93 230 95 00 F +34 93 230 95 55
This project has received funding from the European Union’s Horizon 2020 research and innovation programme under grant agreement No 691287
65
PACE project was to establish a continental scale north-south transect of permafrost monitoring
stations.
There has been awareness of permafrost sensitivity to global warming for several decades, but the
emphasis has primarily been for impacts in the Arctic region. The condition of European permafrost
is important because it reflects not only the prevailing environmental conditions, but also past
climate cycles, since the response to perturbations in the upper boundary (ground surface) thermal
conditions are often of longer duration than that of the forcing climate signals.
The period from 1940 to 1975 was one of widespread cooling in the Arctic, affecting Iceland and
Svalbard, but in continental Europe cooling was confined to the northern and western regions. All
of the PACE permafrost borehole sites have been exposed to atmospheric warming in all seasons
since 1975, though the warming has been especially pronounced during the autumn and winter for
the northernmost borehole site.
In the Murtèl-Corvatsch region of the Swiss Alps the 58m deep PACE borehole recorded
temperatures between 1987 and 1994. This identified rapid warming in the uppermost 25m, with
the temperature rising by approximately 1.0°C during this period at a depth of 11.6m below the
surface. Mean annual surface temperature is estimated to have increased from -3.3°C to -2.3°C and
probably exceeded previous maximum temperatures during the 20th century.
Modelling climate change impacts on permafrost temperature must consider seasonal changes,
with particular emphasis on snow cover thickness and duration, in addition to mean annual air
temperatures and precipitation. Permafrost areas within Europe are generally characterised by a
landscape made up of steep bedrock slopes, coarse-grained scree slopes with gradients close to the
angle of repose where rock glaciers are often initiated, and lower gradient footslopes with finer
grained sediments.
Construction and infrastructure maintenance in permafrost regions represent an engineering
challenge. Ground ice is the main problem directly affecting infrastructure, with its susceptibility to
creep 6 and melt. Thawing of ice-rich, fine-grained soil can cause thaw consolidation, raised pore
pressures, reduced effective stresses, and in consequence, lowered soil shear strength. This can
directly affect any overlying structures, and can also indirectly damage infrastructure via increased
6 The Norwegian University of Science and Technology (2019) defines creep as “a time dependent process in which
materials accumulate strains (deformations) under the influence of constant (effective) stresses. Creep of geomaterials can be often observed in slopes where it manifests as…slow downhill movement of soil and rock mass.”
Pg. Marítim de la Barceloneta, 37-49 08003 Barcelona www.medeas.eu [email protected] T +34 93 230 95 00 F +34 93 230 95 55
This project has received funding from the European Union’s Horizon 2020 research and innovation programme under grant agreement No 691287
66
incidents of mass movement, as shallow slope failures may occur when soil thawing is rapid and soil
ice content is high or when heavy rainfall leads to rapid saturation of shallow active layers.
In Europe, mountain permafrost contains significant amounts of infrastructure related to tourism,
communication or power-related industries and is of high economic and social significance. Global
climate change adds significant uncertainty to the design of infrastructure in these permafrost
regions, as how and to what extent climate change will affect sites where infrastructure currently
exists and where infrastructure may be located in the future, how existing infrastructure and slope
stability are likely to be impacted how infrastructure will affect the influence of climate change, and
how planning and design practices will need to change.
The challenges of infrastructure development in permafrost environments are related generally to
the thawing of ground ice. The construction process itself alters the thermal regime in the ground,
and climate change will lead to ongoing changes to the thermal regime. The design life of structures
built in permafrost environments is only approximately 30-50 years (in contrast to the 50-100 years
in conventional environments), but it is likely that monitoring and adaptation strategies have to be
implemented over long periods, to allow modifications to be made to the infrastructure as ground
conditions change.
Hjort et al (2018) mapped infrastructure hazard areas in the Northern Hemisphere’s permafrost
regions at high spatial resolution under projected climatic changes, and quantified the proportion
of engineered structures in area where ground subsidence and loss of ground bearing capacity could
damage infrastructure by 2050. Their analysis identified that 70% of current infrastructure in the
permafrost domain is in areas with high potential for thaw of near-surface permafrost by 2050.
One-third of the pan-Arctic infrastructure is located in high hazard regions where the ground is
susceptible to thaw-related ground instability (i.e. where ground subsidence and loss of structural
bearing capacity could severely damage the integrity of infrastructure). This demonstrates that most
fundamental Arctic infrastructure will be at risk even if the Paris Agreement target is achieved and
that approximately 3.6 million people, (representing three quarters of the current population in the
Northern Hemisphere permafrost area) may potentially be affected by damage to infrastructure
associated with permafrost thaw.
The large-scale degradation of permafrost has already been linked to damage to large numbers of
infrastructure components and negative ecosystem impacts across the Arctic. Detrimental effects
on engineered structures, socio-economic activities and natural systems are therefore likely to occur
throughout the permafrost domain under climate warming. Mitigation in the form of engineering
Pg. Marítim de la Barceloneta, 37-49 08003 Barcelona www.medeas.eu [email protected] T +34 93 230 95 00 F +34 93 230 95 55
This project has received funding from the European Union’s Horizon 2020 research and innovation programme under grant agreement No 691287
67
solutions (e.g. adaptation strategies and structures such as insulation and thermosyphons) may
alleviate some of these problems, but their economic cost may be prohibitive at regional scales.
Aalto et al (2017) note that the responses of periglacial (areas in proximity to glaciers and ice sheets)
land surface processes (LSPs) to climate change-induced warming are likely to be highly uncertain.
A rapid response is likely however, given that the broad-scale distribution of cryogenic ground
processes is coupled with climatic gradients and often, but not necessarily, with the presence of
permafrost. The current and likely future extent of the periglacial climate realm across a 78,000km2,
high-latitude Fennoscandia region was modelled using an ensemble approach, using forcing from
three RCP scenarios (2.6/4.5/8.5) and two time periods (2040-2069 and 2070-2099), averaged over
23 CMIP5 climate simulations.
The modelling results indicate the potential for a notable reduction in the current periglacial climate
realm over the study area and by the end of the 21st century it is likely that active periglacial LSPs
will continue to exist only at high elevations. The approximate upper limit for cryogenic ground
processes to continue is a mean annual air temperature increase of 2°C, and the modelling results
show that even optimistic emission pathways are likely to initiate substantial alterations in the
extent of the periglacial climate realm.
The changes to the extent of periglacial conditions in the study area are largely due to a move to a
climate that will be substantially warmer and wetter than present conditions, and the strong
coupling of topmost soil layer with lower atmosphere conditions. Water precipitation is modelled
to increase from 285mm (±57mm; baseline) to 350mm (±35mm 2040-2069, RCP 2.6) and further to
387mm (±82mm; 2040-2069, RCP 8.5), and the mean elevation of the periglacial climate is projected
to increase from 509m above sea level (asl) (±199; baseline) to 650m asl (±247; 2070-2099, RCP 2.6),
to 686m asl (±248; 2070-2099, RCP 4.5) and to 755m asl (±252; 2070-2099, RCP 8.5).
A notable consequence of these temperature- and precipitation-driven changes in perennial ground
ice is the likely increase in the risk of rapid slope displacements and thaw subsistence, with likely
severe impacts on existing infrastructure and infrastructure development, including energy
infrastructure. The decay of the periglacial system is likely to be rapid towards the end of this
century, irrespective of the climate change mitigation policies that are implemented.
Pg. Marítim de la Barceloneta, 37-49 08003 Barcelona www.medeas.eu [email protected] T +34 93 230 95 00 F +34 93 230 95 55
This project has received funding from the European Union’s Horizon 2020 research and innovation programme under grant agreement No 691287
68
2.4. Implications for MEDEAS
This chapter showed that while energy demand is projected to rise in the future, partially to adapt
to changing climates (cooling needs e.g.), our capacity to produce this energy in many locations in
Europe will deteriorate precisely due to climate change. This is especially the case for hydropower,
oil and gas. But also wind and solar power efforts will need to be adapted as climate change impacts
both the strength of winds, the costs of offshore infrastructure, as well as cloud cover.
While currently MEDEAS models the energy sector at an aggregated geographical scale it is
important to note that the climate change impacts considered here are very location-specific.
Therefore, it is important to consider the average impact of climate change on future projections
and this is what the MEDEAS model attempts to do currently. In future, especially with EU and
country level modelling efforts more consideration will need to be given to the geographic
implications of energy assets and the impacts of climate change. In particular there may be an
optimal way to deploy energy infrastructure that minimises the impacts of climate change (for
example, where to deploy solar or hydro across the EU to maximise efficiency).
We do not make these recommendations here but note that for future MEDEAS enhancements this
should be considered either in detail or at the least through a non-linear function that can moderate
the climate change feedback onto the energy output.
Pg. Marítim de la Barceloneta, 37-49 08003 Barcelona www.medeas.eu [email protected] T +34 93 230 95 00 F +34 93 230 95 55
This project has received funding from the European Union’s Horizon 2020 research and innovation programme under grant agreement No 691287
69
2.4. References
Aalto, J., Harrison, S., Luoto, M., 2017. Statistical modelling predicts almost complete loss of
major periglacial processes in Northern Europe by 2100. Nature Communications, 8, 515.
Agora Energiewende and Sandbag, 2018. The European Power Sector in 2017. State of Affairs
and Review of Current Developments. https://sandbag.org.uk/wp-
content/uploads/2018/01/EU-power-sector-report-2017.pdf
Bellarby, J., Wattenbach, M., Tuck, G., Glendining, M. J., Smith, P., 2010. The potential
distribution of bioenergy crops in the UK under present and future climate. Biomass and
Bioenergy. 34 (12): 1935-1945.
Berger, T., Amann, C., Formayer, H., Korjenic, A., Pospischal, B., Neururer, C., & Smutnye, R.,
2014. Impacts of climate change upon cooling and heating energy demand of office buildings in
Vienna, Austria. Energy and Buildings. 80, 517–530.
BP, 2018. BP Statistical Review of World Energy, 67th Edition. Accessed 21 January 2019, at
https://www.bp.com/content/dam/bp/business-sites/en/global/corporate/pdfs/energy-
economics/statistical-review/bp-stats-review-2018-full-report.pdf
Burkett, V., 2011. Global climate change implications for coastal and offshore oil and gas
development. Energy Policy. 39 (12): 7719-7725.
Burnett, D., Barbour, E., Harrison, G. P., 2014. The UK solar energy resource and impact of
climate change. Renewable Energy. 71, 333-343.
Cartalis, C., Synodinou, A., Proedrou, M., Tsangrassoulis, A. & Santamouris, M., 2001.
Modifications in energy demand in urban areas as a result of climate changes: an assessment
for the southeast Mediterranean region. Energy Conservation and Management. 42, 1647-1656
Crook, J.A., Jones, L.A., Forster, P.M. and Crook, R., 2011. Climate change impacts on future
photovoltaic and concentrated solar power energy output. Energy & Environmental Science,
4(9): 3101-3109.
Cruz, A. M., 2010. Vulnerability of oil and gas infrastructure to climate change and extreme
weather events. Joint ICTP-IAEA Workshop on Vulnerability of Energy Systems to Climate
Change and Extreme Events, 19-23 April 2010.
Danish Wind Energy Association, 2003. The Power of the Wind : Cube of Wind Speed. Accessed
26 February 2019 at http://xn--drmstrre-64ad.dk/wp-
content/wind/miller/windpower%20web/en/tour/wres/enrspeed.htm
Pg. Marítim de la Barceloneta, 37-49 08003 Barcelona www.medeas.eu [email protected] T +34 93 230 95 00 F +34 93 230 95 55
This project has received funding from the European Union’s Horizon 2020 research and innovation programme under grant agreement No 691287
70
Debaeke, P., Casadebaig, P., Flenet, F., Langlade, N., 2017. Sunflower crop and climate change :
vulnerability, adaptation and mitigation potential from case-studies in Europe. Oilseeds & fats:
Crops and Lipids. 24 (1): D102.
Dowling, P., 2013. The impact of climate change on the European energy system. Energy Policy.
60, 406-417.
European Commission, 2019. Biofuels. Accessed 14 February 2019 at
https://ec.europa.eu/energy/en/topics/renewable-energy/biofuels
Frank, T., 2005, Climate change impacts on building heating and cooling energy demand in
Switzerland. Energy and Buildings. 37 (11): 1175–1185.
Goler, R.A., Frey, S., Formayer, H. and Holzmann, H., 2016. Influence of climate change on river
discharge in Austria. Meteorologische Zeitschrift, 25(5): 621-626.
Golombek, R. Kittelsen, S.A.C. & Haddeland, I., 2012. Climate change: impacts on electricity
markets in Western Europe. Climatic Change. 113 (2): 357–370.
Harris, C., Arenson, L.U., Christiansen, H.H., Etzelmüller, B., Frauenfelder, R., Gruber, S., Haeberli,
W., Hauck, C., Hoelzle, M., Humlum, O. and Isaksen, K., 2009. Permafrost and climate in Europe:
Monitoring and modelling thermal, geomorphological and geotechnical responses. Earth-
Science Reviews. 92(3-4): 117-171.
Harvard School of Engineering and Applied Sciences (2019) Hadley Cells. Accessed 26 February
2019 at
https://www.seas.harvard.edu/climate/eli/research/equable/hadley.html
Harvey, M. and Pilgrim, S., 2011. The new competition for land : Food, energy and climate
change. Food Policy. 36: S40-S51.
Hdidouan, D., and Staffell, I., 2017. The impact of climate change on the levelised cost of wind
energy. Renewable Energy. 101: 575-592.
Hjort, J., Karjalainen, O., Aalto, J., Westermann, S., Romanovsky, V. E., Nelson, F. E., Etzelmüller,
B., Luoto, M., 2018. Degrading permafrost puts Arctic infrastructure at risk by mid-century.
Nature Communications. 9 (1): 5147.
Howden, S. M., Soussana, J. F., Tubiello, F. N., Chhetri, N., Dunlop, M., Meinke, H., 2007.
Adapting agriculture to climate change. Proceedings of the National Academy of Sciences. 104
(50): 19691-19696.
Pg. Marítim de la Barceloneta, 37-49 08003 Barcelona www.medeas.eu [email protected] T +34 93 230 95 00 F +34 93 230 95 55
This project has received funding from the European Union’s Horizon 2020 research and innovation programme under grant agreement No 691287
71
Intergovernmental Panel on Climate Change, 2000. Special Report on Emissions Scenarios.
Cambridge University Press.
Isaac, M. and Van Vuuren, D.P., 2009. Modeling global residential sector energy demand for
heating and air conditioning in the context of climate change. Energy Policy. 37(2): 507-521.
Jerez, S., Tobin, I., Vautard, R., Monávez J. P., López-Romero, J. M., Thais, F., Bartok, B.,
Christensen, O. B., Colette, A., Déqué, M., Nikulin, G., Kotlarski, S., van Meijgaard, E., Teichmann,
C., Wild, M., 2015. The impact of climate change on photovoltaic power generation in Europe.
Nature Communications. 6: 10014.
Klein D.R., Olonscheck M., Walther C. & Kropp J.P., 2013. Susceptibility of the European
electricity sector to climate change. Energy. 59 (0): 183-193.
Levesque, A., Pietzcker, R.C., Baumstark, L., De Stercke, S., Grübler, A. & Luderer, G., 2018. How
much energy will buildings consume in 2100? A global perspective within a scenario framework.
Energy. 148: 514-527.
Mideksa T.K. & Kallbekken, S., 2010. The impact of climate change on the electricity market: A
review. Energy Policy. 38: 3579–3585.
Nelson, J., Schuchard, R., 2011. Adapting to Climate Change : A Guide for the Mining Industry.
Business for Social Responsibility (10).
Norwegian University of Science and Technology, 2019. Creep of Geomaterials. Accessed 28
February 2019 at https://www.ntnu.edu/creep
Odell, S. D., Bebbington, A., Frey, K. E., 2018. Mining and climate change : A review and
framework for analysis. The Extractive Industries and Society. 5 (1): 201-214.
Papakostasa, K.T. & Slinib, T., 2017. Effects of Climate Change on the Energy Required for the
Treatment of Ventilation Fresh Air in HVAC Systems: The Case of Athens and Thessaloniki.
Procedia Environmental Sciences. 38: 852 – 859.
Phillips, J., 2016. Climate change and surface mining : A review of environment-human
interactions & their spatial dynamics. Applied Geography. 74: 95-108.
Pryor, S. C., and Barthelmie, R. J., 2010. Climate change impacts on wind energy : A review.
Renewable and Sustainable Energy Reviews. 14 (1): 430-437.
Schaeffer R., Szklo A.S., Pereira de Lucena A.F., Moreira Cesar Borba B.S., Pupo Nogueira L.P.,
Fleming F.P., Troccoli, A., Harrison, M. & Boulahya, M.S., 2012. Energy sector vulnerability to
climate change: a review. Energy. 38 (1): 1-12.
Pg. Marítim de la Barceloneta, 37-49 08003 Barcelona www.medeas.eu [email protected] T +34 93 230 95 00 F +34 93 230 95 55
This project has received funding from the European Union’s Horizon 2020 research and innovation programme under grant agreement No 691287
72
Seljom, P., Rosenberg, E., Fidje, A., Haugen, J. E., Meir, M., Rekstad, J., Jarslet, T., 2011.
Modelling the effects of climate change on the energy system – A case study of Norway. Energy
Policy. 39 (11): 7310-7321.
Side, J., Harris, R., Woolf, D., Bell, M., Brooks, A., 2013. Impacts of climate change on built
structures (offshore). Marine Climate Change Impacts Partnership : Science Review. 295-301.
Spiridonov, V. and Valcheva, R., 2017. The Impact of Climate Change (until 2050) on the potential
of renewable energy sources (wind and solar radiation) for the territory of Bulgaria. Poster for
the 27th ALADIN Workshop & HIRLAM All Staff Meeting 2017, 3-7/04/2017, Helsinki, Finland.
Stanton, M.C.B., Dessai, S. & Paavola, J., 2016. A systematic review of the impacts of climate
variability and change on electricity systems in Europe. Energy. 109: 1148-1159.
Tobin, I., Vautard, R., Balog, I., Bréon, F., Jerez, S., Ruti, P. M., Thais, F., Vrac, M., Yiou, P., 2015.
Assessing climate change impacts on European wind energy from ENSEMBLES high-resolution
climate projections. Climate Change. 128 (1-2): 99-112.
Tuck, G., Glendining, M. J., Smith, P., House, J. I., Wattenbach, M., 2006. The potential
distribution of bioenergy crops in Europe under present and future climate. Biomass and
Bioenergy. 30 (3): 183-197.
Ürge-Vorsatz, D., Cabeza, L.F., Serrano, S., Barreneche C. & Petrichenko, K., 2015. Heating and
cooling energy trends and drivers in buildings. Renewable and Sustainable Energy Reviews. 41,
85–98.
Vaisala Energy, 2019. Glossary of Technical Renewable Energy Terminology. Accessed 26
February 2019 at https://www.3tier.com/en/support/glossary/#dif
Wagner, T., Themessl, M., Schüppel, A., Gobiet, A., Stigler, H., Birk, S., 2017. Impacts of climate
change on stream flow and hydro power generation in the Alpine Region. Environmental Earth
Sciences. 76 (1): 1-22.
Wild, M., Folini, D., Henschel, F., 2017. Impact of climate change on future concentrated solar
power (CSP) production. AIP Conference Proceedings 1810.
World Wind Energy Association, 2018. Wind power capacity reaches 539GW, 52.6GW added in
2017. Accessed 18 January 2019, at http://wwindea.org/blog/2018/02/12/2017-statistics/
Pg. Marítim de la Barceloneta, 37-49 08003 Barcelona www.medeas.eu [email protected] T +34 93 230 95 00 F +34 93 230 95 55
This project has received funding from the European Union’s Horizon 2020 research and innovation programme under grant agreement No 691287
73
3. Resource scarcity issues and RES transition
List of abbreviations and acronyms
CLD Central Lanthanide Deposit
EIA Energy Information Administration
NiMH Nickel–metal hydride battery
REE Rare Earth Elements
SmCO samarium cobalt magnet
ELEMENTS:
La Lanthanum
Ce Cerium
Pr Praseodymium
Nd Neodymium
Sm Samarskite
Eu Europium
Gd Gadolinium
Tb Terbium
Dy Dysprosium
Er Erbium
Th Thulium
Yb Ytterbium
Pg. Marítim de la Barceloneta, 37-49 08003 Barcelona www.medeas.eu [email protected] T +34 93 230 95 00 F +34 93 230 95 55
This project has received funding from the European Union’s Horizon 2020 research and innovation programme under grant agreement No 691287
74
3.1. Introduction
In this chapter, we assessed resources needed for energy production. This includes known resources
of fossil fuels, materials required to generate nuclear energy as well as rare earth materials needed
for the vast majority of modern technology, from batteries to electric cars to screens of any type to
solar panels and wind turbines. The availability or inversely lack thereof represents thus a key barrier
to the kind of renewable energy transition envisioned by the MEDEAS project. This chapter is based
on literature reviews and other models.
The chapter proceeds in the following fashion: We initially detail proved reserves of oil, coal and
natural gas. After that we show uranium sources, whose depletion has been found imminent by
different studies – thus if we were to pursue a nuclear path, we would need to recycle military
uranium. Following a brief assessment of the needs of further investment in RES infrastructure (see
also chapter 4), we then turn to the most fundamental resource other than finance for a renewable
energy transition – rare earth elements. The second part of this chapter details the known use of
rare earth elements compared with the known deposits. We focus our analysis on three hosting
minerals (bastnaesite, monazite and xenotime) as for most others, the concentration of REEs is too
low to make extraction economically viable. A key issue that makes REE supply so complex, other
than that only a small number of countries hold almost all known deposits, is precisely the fact that
REEs often get mined as a by-product of a primary other ore. This makes assessing the depletion
rates and the adjustment of supply with changing demand highly complex – and thus represents a
significant barrier to any largescale renewable energy transition without energy demand curb, such
as studied in the MEDEAS project.
Pg. Marítim de la Barceloneta, 37-49 08003 Barcelona www.medeas.eu [email protected] T +34 93 230 95 00 F +34 93 230 95 55
This project has received funding from the European Union’s Horizon 2020 research and innovation programme under grant agreement No 691287
75
3.2. Energy trends
3.2.1. Fossil fuels
Estimates of future fossil fuel availability vary dramatically and depend on a number of factors. One
route to estimate the availability of fossil fuels is to use the depletion curves (see MEDEAS
Deliverable 4.1) for each resource type and project these forward. However, here we explore the
geopolitical aspects of resource availability as well as the absolute resource availability (not
replicating the earlier study on depletion curves). The geopolitics of fossil fuels is likely to add a
further constraint to fossil fuel availability.
A country’s access to natural resources, such as fossil fuels, is influenced by physical, market,
financial and geopolitical issues. As Europe plans for a significant energy transition over the
upcoming decades, as modelled by MEDEAS, the access to resources at reasonable prices is critical.
Fossil fuels are unevenly distributed globally. Some countries have no fossil reserves of their own,
or very little (e.g. Japan), and are entirely dependent on the world market and market prices. Other
countries, such as Iraq, Saudi Arabia, Kuwait and Venezuela have substantial reserves and are able
to influence international prices through their exports.
The overall geographical pattern is well understood, with the greatest concentration of oil reserves
and production in the Middle East, and the highest rates of consumption per head in Western
Europe, North America, and Japan. Combining data about both reserves and consumption, the
clearest conclusion to be drawn is the vulnerability of Europe, the region with the lowest reserves
of oil.
As a test of reliance on international trade for access to energy we use a simple measure – the
number of years left that domestic reserves could meet domestic demand. We produce maps that
compare the domestic availability and consumption of oil (Figure 1), gas (Figure 2) and coal (Figure
3) across Europe. The units used are “years left” i.e. how many years of internal fossil fuel
consumption (at the current rate) could be provided for by existing domestic reserves. These figures
are arrived at by dividing total reserves by consumption per year. Note that both consumption rates
and reserves can change over time so this is a snapshot approach. The data used is from 2012.
Countries with small oil reserves but zero or close to zero reported consumption are shown in the
maps as having over 100 “years left” of reserves. Low consumption may be due to low economic
development or no current access to that particular fossil fuel.
Pg. Marítim de la Barceloneta, 37-49 08003 Barcelona www.medeas.eu [email protected] T +34 93 230 95 00 F +34 93 230 95 55
This project has received funding from the European Union’s Horizon 2020 research and innovation programme under grant agreement No 691287
76
There is a need to use the interpretation of “proved reserves” with caution, since these can both
increase, through investment in exploration and extraction, as well as decrease. When consumption
is outpaced by increases in proven reserves this shows up as an increase in “years left”, for example
in Kazakhstan. Investment can be stimulated by an increase in fossil fuel price on the world market,
by a reduction in the availability of other energy sources, or by changes in the technology of
extraction. For example, the situation since 2012 has changed with the development of shale oil
production in the USA, which has affected its dependence on overseas suppliers but the exploitation
of shale is highly dependent on the global price of oil.
Investment can alternatively be drastically reduced if investors became convinced that governments
are serious about restraining carbon dioxide emissions from fossil fuels, as most fossil fuel reserves
could not then be used. The maps therefore show a ‘snapshot’ in time, reflecting existing reserves
based on the current situation. It is necessary to be cautious about extrapolating these figures into
the future without looking at the influences on future exploration, extraction and investment.
However, they broadly signify a dependence on international markets and imports for particular
countries. Therefore, they show an additional energy security driver which will form part of the
decision making process for future energy investments.
For coal there is a general trend for “years left” to have increased globally. This can be attributed to
a fall in the rate of consumption of coal in most countries. The data on coal makes one trend very
clear – the abundance of coal in key emerging markets such as Russia, India, China, Latin America
and Africa. In addition the US, Canada and Australia have significant coal reserves. Therefore, the
world is likely to continue to be able to exploit coal in energy production, either directly or through
the conversion of coal into gas or liquid fuels. However, climate change agreements and legislation
will impact on the feasibility of coal as a future energy source. From a climate change perspective
such a continued coal consumption is not desirable.
Four of Europe’s largest economies – Germany, UK, France and Italy – have few “years left” of
natural gas. Italy and France have less than one year of domestic natural gas left (that is they are
almost entirely dependent on imports). In the UK, the low current figures represent a marked
decline from earlier years when natural gas was being supplied from the North Sea. The UK’s “years
left” figure may increase as a result of the development of hydraulic fracturing. However, with the
recent drop in gas prices on international markets a portion of these reserves are no longer
economic to exploit. Where high figures reflect large natural gas reserves, such as Qatar with over
1000 “years left”, Norway with 420 years, and Russia 108 years, these countries have significant
capacity to export natural gas.
Pg. Marítim de la Barceloneta, 37-49 08003 Barcelona www.medeas.eu [email protected] T +34 93 230 95 00 F +34 93 230 95 55
This project has received funding from the European Union’s Horizon 2020 research and innovation programme under grant agreement No 691287
77
Resources currently not owned by any country, e.g. natural resources such as Arctic oil reserves,
which are not recorded in any country’s national resources accounts, have not been included in our
calculations.
Working with global variables and indicators is often difficult due to the nature of the underlying
statistics used to derive the data. Over the past three decades statistical offices have provided
increasingly comparable data, while the development of a harmonised statistical framework based
on standard methodologies for data collection and analysis has led to the creation of more
comprehensive data sets. The availability of a statistical framework harmonised across countries
helped the reconciliation and alignment of statistical accounts in the Central and Eastern Europe
countries that joined the European Union in 2004 and 2007. However, the degree of accuracy of
data collection and its consistency varies considerably across countries and areas of analysis.
The following are the key sources of data for these maps:
Oil
Data from EIA (Energy Information Administration) International Energy Statistics
• Consumption: http://www.eia.gov/cfapps/ipdbproject/IEDIndex3.cfm
• Reserves: http://www.eia.gov/cfapps/ipdbproject/IEDIndex3.cfm
Coal
Data from BP Statistical Yearbook data
• Consumption: http://www.eia.gov/cfapps/ipdbproject/IEDIndex3.cfm
• Reserves: http://www.bp.com/en/global/corporate/about-bp/energy-
economics/statistical-review-of-worldenergy-2013.html
Natural Gas
Data from EIA (Energy Information Administration) International Energy Statistics:
• Consumption: http://www.eia.gov/cfapps/ipdbproject/IEDIndex3.cfm
• Reserves: http://www.eia.gov/cfapps/ipdbproject/IEDIndex3.cfm
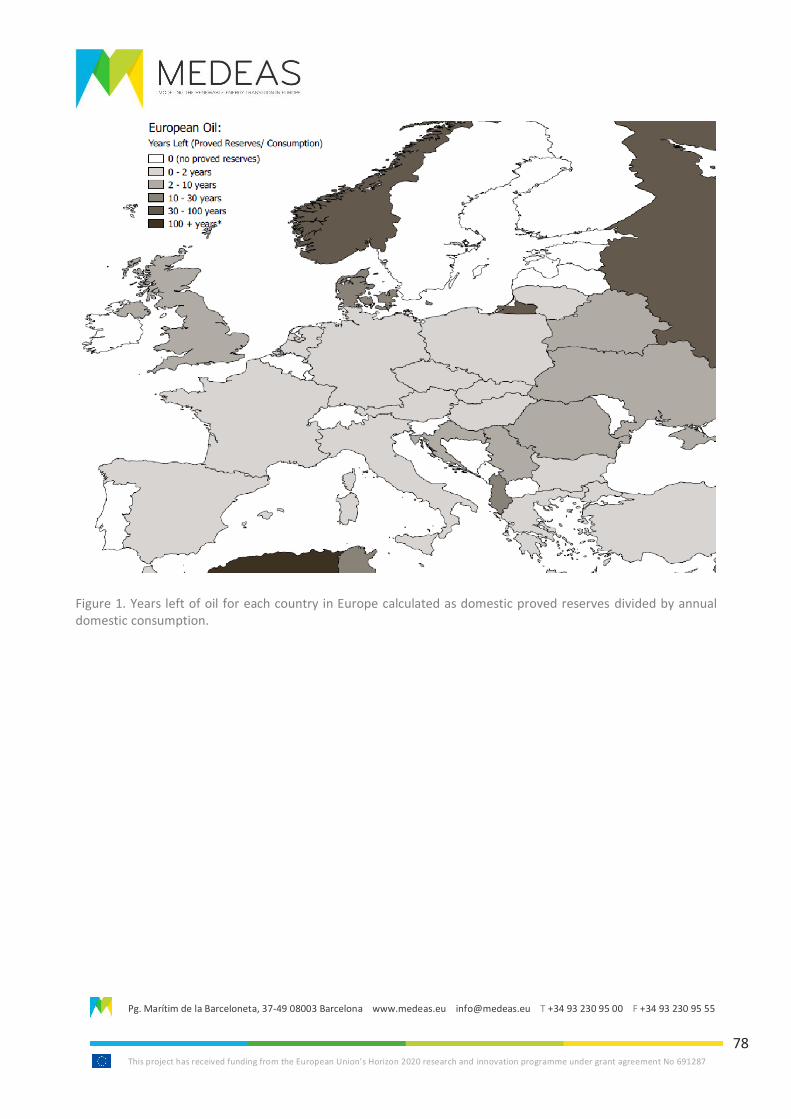
Pg. Marítim de la Barceloneta, 37-49 08003 Barcelona www.medeas.eu [email protected] T +34 93 230 95 00 F +34 93 230 95 55
This project has received funding from the European Union’s Horizon 2020 research and innovation programme under grant agreement No 691287
78
Figure 1. Years left of oil for each country in Europe calculated as domestic proved reserves divided by annual domestic consumption.
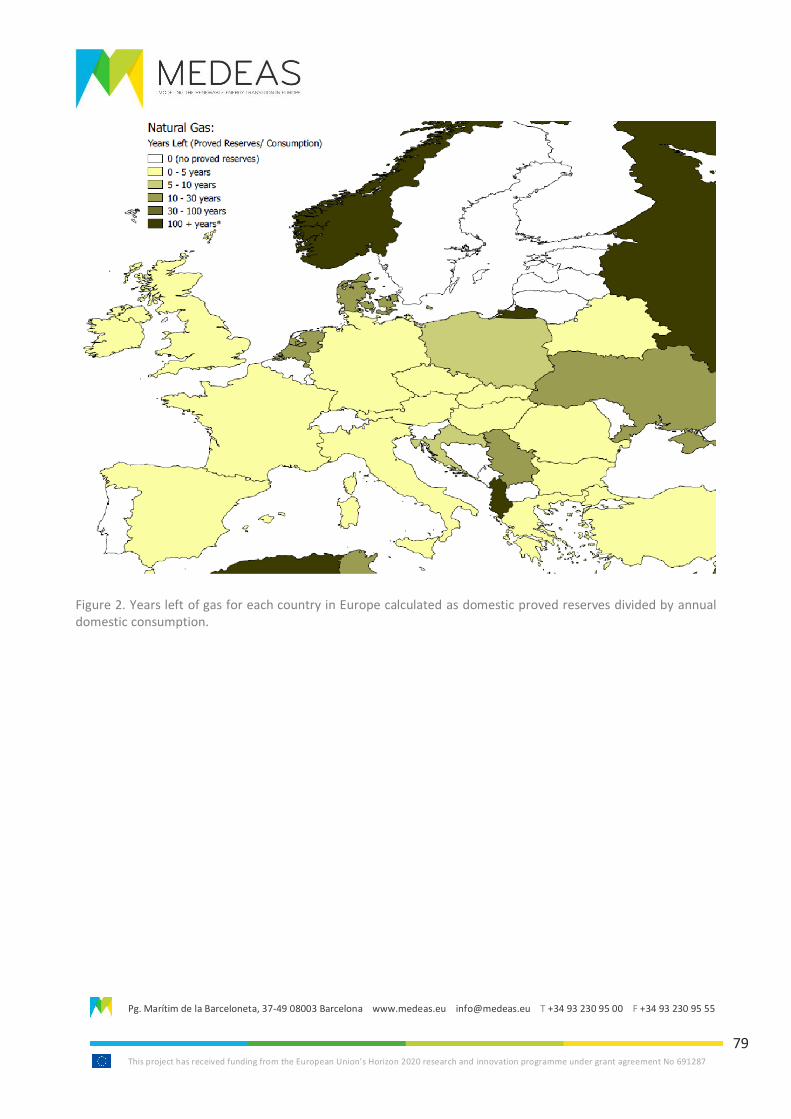
Pg. Marítim de la Barceloneta, 37-49 08003 Barcelona www.medeas.eu [email protected] T +34 93 230 95 00 F +34 93 230 95 55
This project has received funding from the European Union’s Horizon 2020 research and innovation programme under grant agreement No 691287
79
Figure 2. Years left of gas for each country in Europe calculated as domestic proved reserves divided by annual domestic consumption.
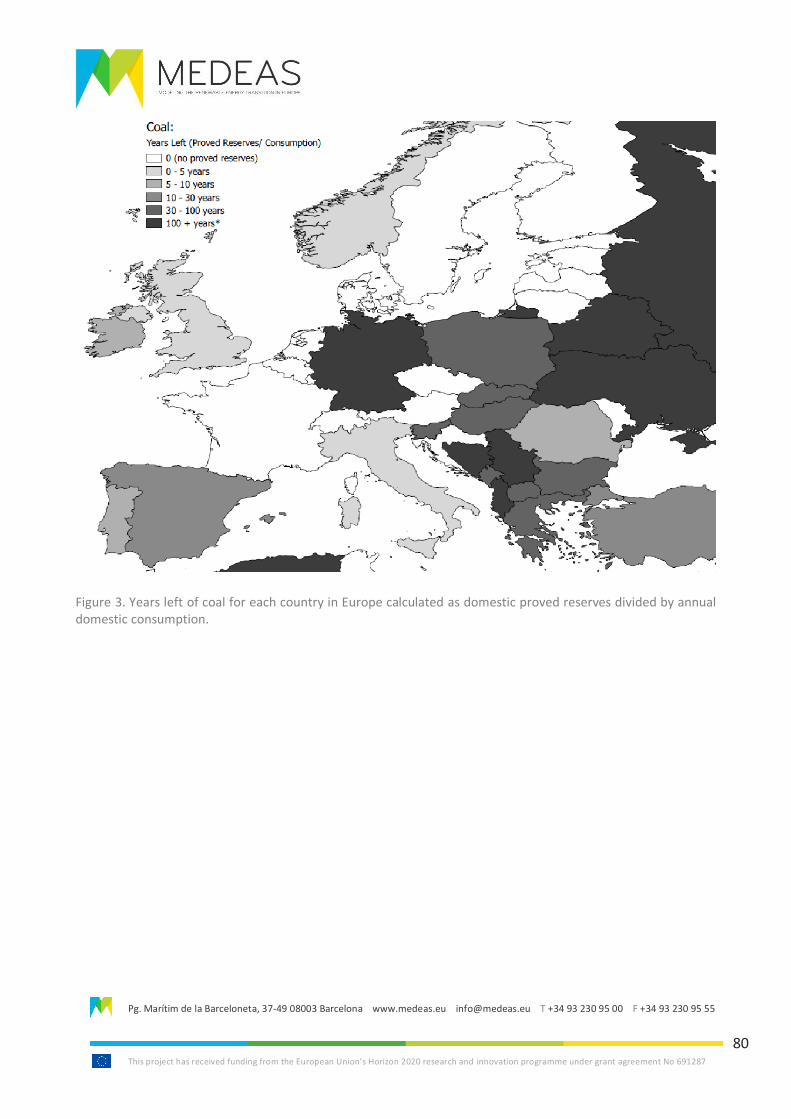
Pg. Marítim de la Barceloneta, 37-49 08003 Barcelona www.medeas.eu [email protected] T +34 93 230 95 00 F +34 93 230 95 55
This project has received funding from the European Union’s Horizon 2020 research and innovation programme under grant agreement No 691287
80
Figure 3. Years left of coal for each country in Europe calculated as domestic proved reserves divided by annual domestic consumption.
Pg. Marítim de la Barceloneta, 37-49 08003 Barcelona www.medeas.eu [email protected] T +34 93 230 95 00 F +34 93 230 95 55
This project has received funding from the European Union’s Horizon 2020 research and innovation programme under grant agreement No 691287
81
3.2.2. Nuclear
According to Cameco (2010), one of the world’s largest uranium producers, and based on 2008
World Nuclear Association data, production from world uranium mines supplies 67% of the
requirements of global nuclear power utilities. The rest (33%) comes from secondary sources, or
inventories held by utilities, other fuel cycle companies and governments, as well as recycled
materials from military nuclear programmes, used and reprocessed reactor fuel and uranium from
depleted stockpiles. This gap between supply and demand is not a new phenomenon. The World
Nuclear Association (2011) reveals that the world has been in uranium ore deficit since the mid-
1980s, when the shortfall of supplies for civil power started to be made up by the higher production
into military inventories during the Cold War years.
Demand for uranium is difficult to predict given recent changes in nuclear programmes of various
countries including several in Europe such as Germany pulling back from growth in the nuclear
industry. However, growth in China and India in particular could still see a significant increase in
demand for uranium. In 2001, the International Atomic Energy Agency (IAEA, 2001) conducted an
‘Analysis of Uranium Supply to 2050’, showing a peak and decline of supply based on extraction of
all available resources – both high and low cost. Their analysis shows a peak occurring in 2024, if
highest cost resources are included, with a peak occurring sooner if this does not occur.
Relying on continued supply into the future from secondary sources, which for the past 10 – 15
years have supplied fuel to a third of the world’s nuclear reactors, is not possible. Cameco has said
that, with the exception of recycled material, secondary supplies are finite and will be depleted over
the next few years. In particular, the US-Russia Highly-Enriched-Uranium (HEU) agreement in which
Russia has been supplying uranium to the western market through a programme of dismantling a
significant proportion of its nuclear weaponry, ended in 2013. Russia holds the world’s largest stock
of HEU, the majority of which is in its military stockpile.
The end of the Russian programme is likely to coincide with a general end to secondary supply
sources in the near-term. A 2009 study by Michael Dittmar (Dittmar, 2009) states that due to an
almost unavoidable yearly drawdown of 10,000 tonnes from worldwide civilian uranium stocks
(which totalled roughly 50,000 tonnes in that year) civilian stocks will be essentially exhausted by
2015. It concludes that “all data indicate that a uranium supply shortage in many OECD countries
can only be avoided if the remaining military uranium stocks from Russia and the USA, estimated to
be roughly 500,000 tons are made available to the other countries”, which it deems strategically
unlikely. However, rising global uranium prices since that study increased supply. However,
following the Fukushima nuclear accident prices for uranium fell leading to a supply deficit again

Pg. Marítim de la Barceloneta, 37-49 08003 Barcelona www.medeas.eu [email protected] T +34 93 230 95 00 F +34 93 230 95 55
This project has received funding from the European Union’s Horizon 2020 research and innovation programme under grant agreement No 691287
82
with a current expectation of stocks being exhausted still being imminent - by 2023 (Outsider Club,
2019).
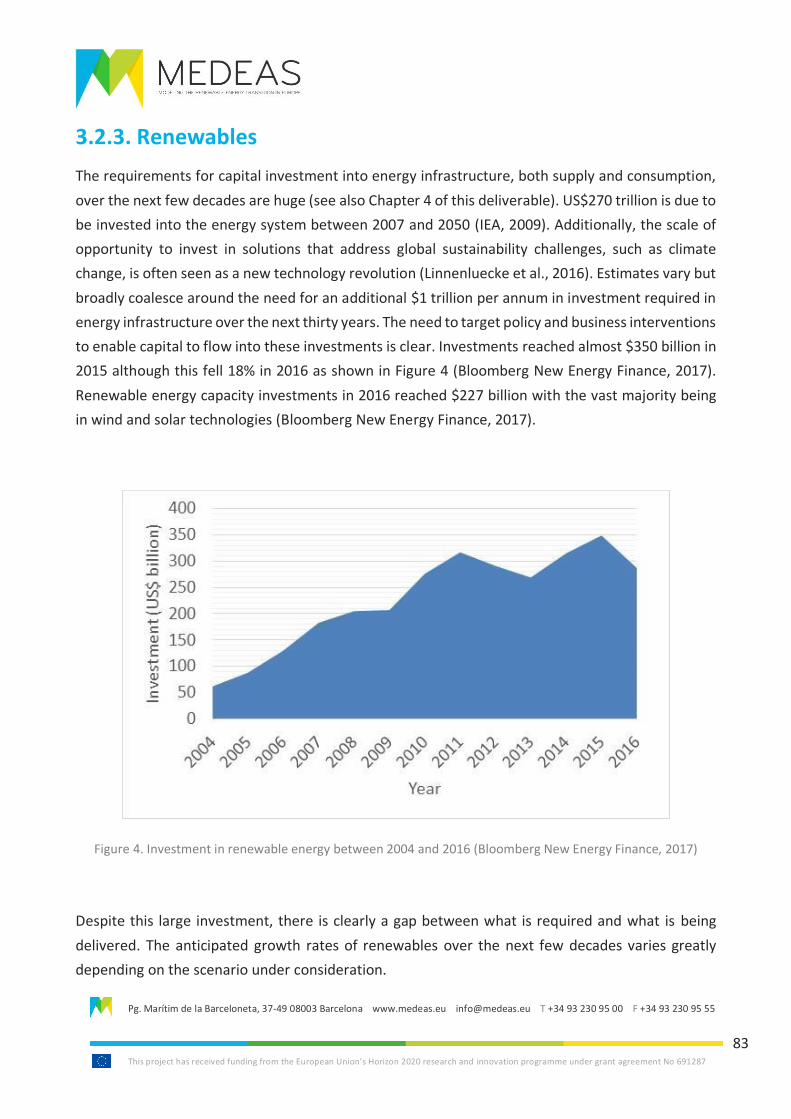
Pg. Marítim de la Barceloneta, 37-49 08003 Barcelona www.medeas.eu [email protected] T +34 93 230 95 00 F +34 93 230 95 55
This project has received funding from the European Union’s Horizon 2020 research and innovation programme under grant agreement No 691287
83
3.2.3. Renewables
The requirements for capital investment into energy infrastructure, both supply and consumption,
over the next few decades are huge (see also Chapter 4 of this deliverable). US$270 trillion is due to
be invested into the energy system between 2007 and 2050 (IEA, 2009). Additionally, the scale of
opportunity to invest in solutions that address global sustainability challenges, such as climate
change, is often seen as a new technology revolution (Linnenluecke et al., 2016). Estimates vary but
broadly coalesce around the need for an additional $1 trillion per annum in investment required in
energy infrastructure over the next thirty years. The need to target policy and business interventions
to enable capital to flow into these investments is clear. Investments reached almost $350 billion in
2015 although this fell 18% in 2016 as shown in Figure 4 (Bloomberg New Energy Finance, 2017).
Renewable energy capacity investments in 2016 reached $227 billion with the vast majority being
in wind and solar technologies (Bloomberg New Energy Finance, 2017).
Figure 4. Investment in renewable energy between 2004 and 2016 (Bloomberg New Energy Finance, 2017)
Despite this large investment, there is clearly a gap between what is required and what is being
delivered. The anticipated growth rates of renewables over the next few decades varies greatly
depending on the scenario under consideration.
Pg. Marítim de la Barceloneta, 37-49 08003 Barcelona www.medeas.eu [email protected] T +34 93 230 95 00 F +34 93 230 95 55
This project has received funding from the European Union’s Horizon 2020 research and innovation programme under grant agreement No 691287
84
The majority of current research has explored the need for more investment and better policy to
enable the transition to a low carbon economy. The resource requirements to underpin this
transition is less well understood although is of increasing interest (World Bank Group, 2017) with
key requirements for both metals such as aluminium, iron, lithium, neodymium, copper and silver,
and rare earth metals. It is also worth noting that past predictions and studies have been overly
conservative when predicting the growth of renewable technology (World Bank Group, 2017). This
pessimism could be due to a number of the projections being made using standard models more
used to exploring fossil fuel roll-out coupled with a lack of understanding associated with technology
learning curves and cost reductions. Therefore, other studies are likely to be under-estimations
around the required materials inputs for the future renewable infrastructure deployment.
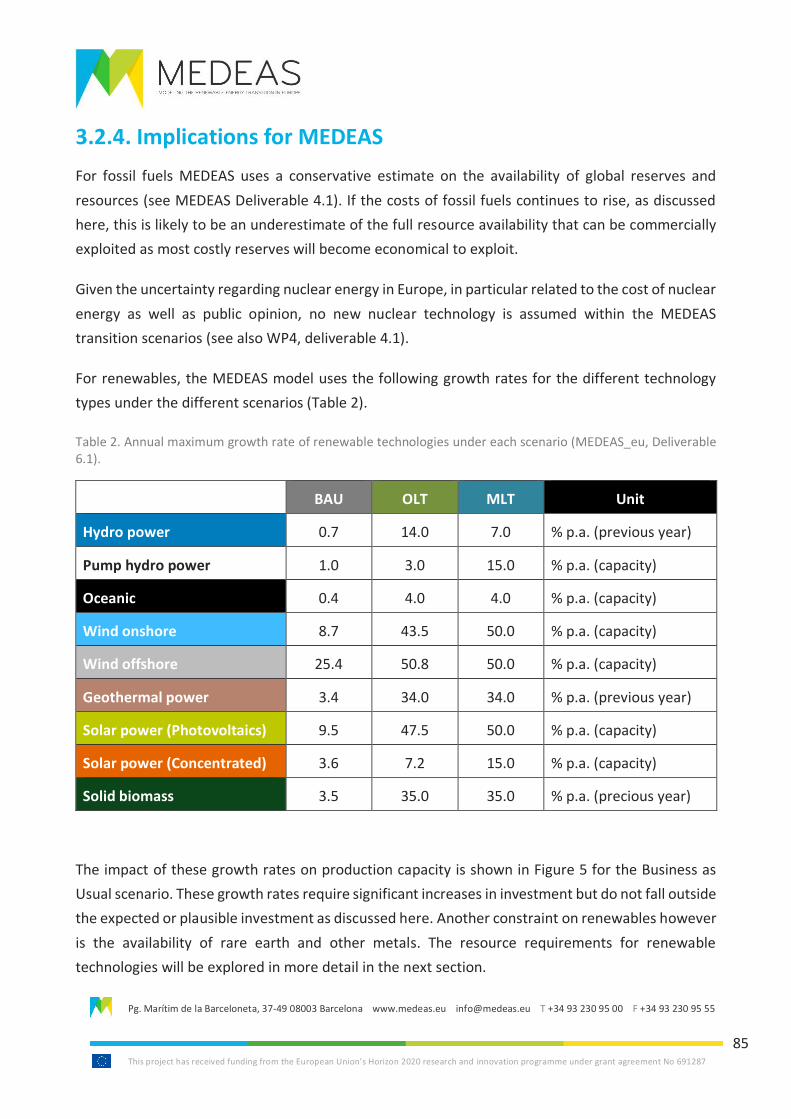
Pg. Marítim de la Barceloneta, 37-49 08003 Barcelona www.medeas.eu [email protected] T +34 93 230 95 00 F +34 93 230 95 55
This project has received funding from the European Union’s Horizon 2020 research and innovation programme under grant agreement No 691287
85
3.2.4. Implications for MEDEAS
For fossil fuels MEDEAS uses a conservative estimate on the availability of global reserves and
resources (see MEDEAS Deliverable 4.1). If the costs of fossil fuels continues to rise, as discussed
here, this is likely to be an underestimate of the full resource availability that can be commercially
exploited as most costly reserves will become economical to exploit.
Given the uncertainty regarding nuclear energy in Europe, in particular related to the cost of nuclear
energy as well as public opinion, no new nuclear technology is assumed within the MEDEAS
transition scenarios (see also WP4, deliverable 4.1).
For renewables, the MEDEAS model uses the following growth rates for the different technology
types under the different scenarios (Table 2).
Table 2. Annual maximum growth rate of renewable technologies under each scenario (MEDEAS_eu, Deliverable 6.1).
BAU OLT MLT Unit
Hydro power 0.7 14.0 7.0 % p.a. (previous year)
Pump hydro power 1.0 3.0 15.0 % p.a. (capacity)
Oceanic 0.4 4.0 4.0 % p.a. (capacity)
Wind onshore 8.7 43.5 50.0 % p.a. (capacity)
Wind offshore 25.4 50.8 50.0 % p.a. (capacity)
Geothermal power 3.4 34.0 34.0 % p.a. (previous year)
Solar power (Photovoltaics) 9.5 47.5 50.0 % p.a. (capacity)
Solar power (Concentrated) 3.6 7.2 15.0 % p.a. (capacity)
Solid biomass 3.5 35.0 35.0 % p.a. (precious year)
The impact of these growth rates on production capacity is shown in Figure 5 for the Business as
Usual scenario. These growth rates require significant increases in investment but do not fall outside
the expected or plausible investment as discussed here. Another constraint on renewables however
is the availability of rare earth and other metals. The resource requirements for renewable
technologies will be explored in more detail in the next section.
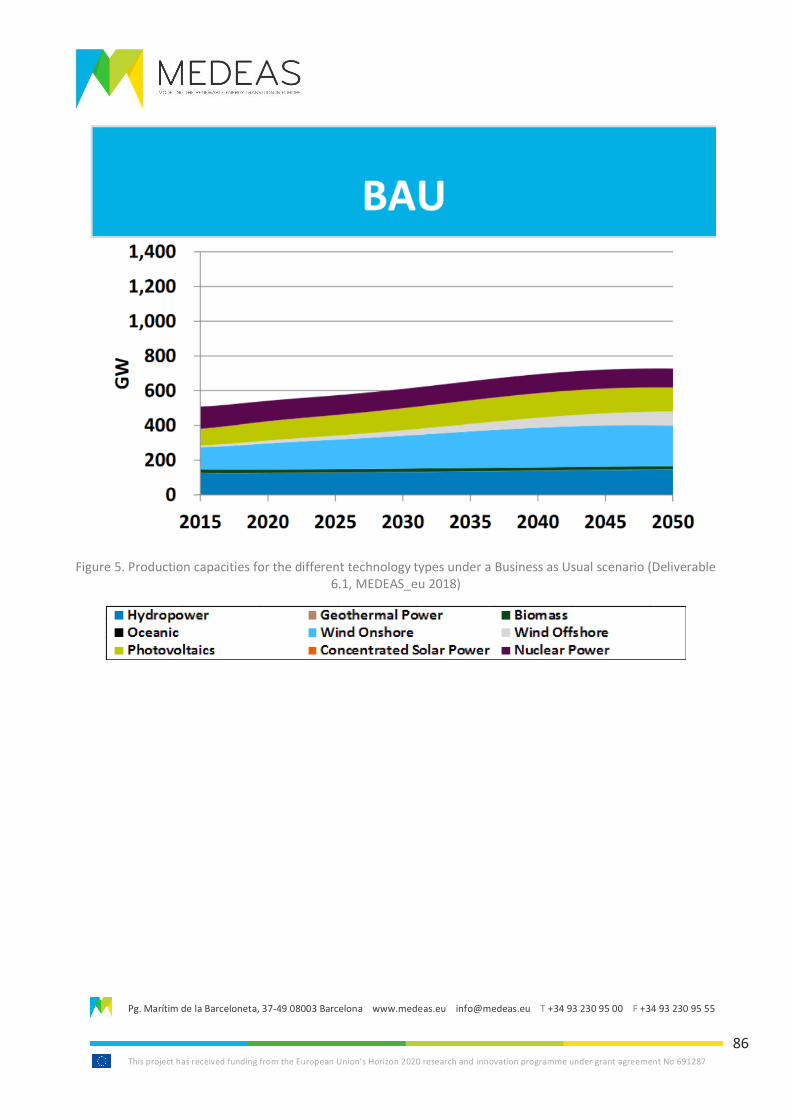
Pg. Marítim de la Barceloneta, 37-49 08003 Barcelona www.medeas.eu [email protected] T +34 93 230 95 00 F +34 93 230 95 55
This project has received funding from the European Union’s Horizon 2020 research and innovation programme under grant agreement No 691287
86
Figure 5. Production capacities for the different technology types under a Business as Usual scenario (Deliverable 6.1, MEDEAS_eu 2018)
Pg. Marítim de la Barceloneta, 37-49 08003 Barcelona www.medeas.eu [email protected] T +34 93 230 95 00 F +34 93 230 95 55
This project has received funding from the European Union’s Horizon 2020 research and innovation programme under grant agreement No 691287
87
3.3. Rare Earth Elements and Metals
3.3.1. Demand for Rare Earth Elements and Metals
Over the past few decades Rare Earth Elements (REEs) have become a crucial resource for an
increasing number of technologies (APS, 2011). Their chemical attributes were discovered to be
beneficial in numerous applications and processes, often making them indispensable or even
irreplaceable. The different fields of applications can be broken down into seven major groups
including catalysts, ceramics, phosphors, glass and polishing, batteries, metal alloys and magnets.
Access to REEs has been highlighted as a potential bottleneck in the low carbon energy transition
(Moss et al., 2011, Moss et al., 2013, World Bank Group, 2017, European Commission, 2014). In
particular currently REEs are deemed to have high risk associated with rapid demand growth,
extreme geographic concentration of mines (predominantly in China) and commensurate political
risk of the major supplying country (Moss et al., 2013).
Making up 20 % of the volume traded in 2008, catalysts are a considerably important application of
REEs with most of the demand generated by the automobile sector (Cox, 2010). For instance REEs
are used when cracking fluids in petroleum refining, and thereby play an important role in the fuel
production. Furthermore they function as catalytic connectors, neutralising potentially toxic
remains of combustion processes in any fuel driven engine (Goonan, 2011). As additives in diesel
they increase the temperature resistance and contribute to fuel efficiency (Lusty et al, 2010;
Henderson et al, 2013). In total the REE concentration in end product fuels lies between 1.5% and
5%. Although the automobile industry is a very important driver of the world economy, catalysts
only make up 5 % of the global trade with REEs value wise, indicating a lower margin for REE in that
sector. The most in demand element in that context is Lanthanum with 66 % followed by Cerium
with 32 % of total demand in 2008 (Bade, 2010).
Another important but rather small field of application is ceramic production. With a share of 3 %
of the total trade value and 6 % of the total trade volume in 2008, this sector is the smallest we
consider (Cox, 2010). Usually REEs are used to control the colour of ceramics (Campbell et al., 2010).
Beyond optics, adding REEs to ceramics can have beneficial effects on the physical properties, like
increasing strength and toughness (Lusty et al., 2010). Another application are the functional
ceramics, which are integrated in microwaves’ dielectric (Guanming, 2007). The most in demand
element is Yttrium, covering 53 % of the global demand of REEs for ceramics in 2008, followed by
Lanthanum with 17 % (Bade, 2010).
Pg. Marítim de la Barceloneta, 37-49 08003 Barcelona www.medeas.eu [email protected] T +34 93 230 95 00 F +34 93 230 95 55
This project has received funding from the European Union’s Horizon 2020 research and innovation programme under grant agreement No 691287
88
One of the largest markets for REEs is the glass industry and the polishing powder production.
Combined they made up about 22 % of the trade volume in 2008 (Cox, 2010). Besides their
colourising or decolourising effects, their most important contribution is absorbing ultraviolet light.
Due to its irreplaceability and its application in glass polishing, Cerium covers 65 % of the global
demand for REEs originating in glass production (Bade, 2010). Polishing powder is especially
dependent on REEs, and contains between 66 and 95 % REEs (Goonan, 2011).
With a volume share of 7 %, phosphors appear to be a rather small field of application. However,
due to many high end products containing phosphors, the profit margins are high, causing
phosphors to cover 32 % of the trade value realised in 2008 (Cox, 2010; Castor et al., 2006). The
main driver behind this are electronic devices with coloured light emitting display like televisions,
smart phones and computer screens. Although a variety of REEs are needed to produce colour
displaying screens, Yttrium is by far the most important and comes up for 69 % of the demand
generated by phosphor production (Bade, 2010).
A very diverse field comprising many different applications are metal alloys. They contribute 14 %
of the value and 18 % of the volume of the REE-trade in 2008 (Cox, 2010). These additives improve
selected physical properties. For example a mixture of cerium, lanthanum and neodymium with iron
and magnesium oxide, commonly referred to as mischmetal, is used in ignition devices like lighters
or torches (Lusty et al., 2010). High demand for this specific applications makes cerium and
lanthanum the most important for alloying purposes, covering 52 and 26 %, respectively, of the
demand arising from producing metal alloys (Bade, 2010). Another application are super alloys.
Although they generate less demand they are essential for high-tech applications. They combine a
number of desirable attributes, like heat resistance, mechanical strength and corrosion resistance
and are therefore often used in gas-turbines or electric generators (Krishnamurthy et al., 2004). A
third application is using REEs to store hydrogen. The advantage over usual compression is higher
safety, lower volume and weight (Krishnamurthy et al., 2004).
Closely linked to the ability of storing hydrogen is the usage of REEs in batteries and fuel cells. By
construction those require hydrogen to cluster at one of the electrodes. The metal mixture that is
currently used contains, besides other metals, large amounts of rare earth metals (Lusty et al, 2010).
The most important REE in this context is Lanthanum, making up 50 % of the total demand
associated with battery alloys, followed by cerium with 34 % (Bade, 2010).
The last and most important application of REEs are magnets. Since the mid-1980s permanent
magnets made of a neodymium iron boron mixture have become the standard for most magnetic
applications (Campbell et al., 2010). With electronics and computers advancing quickly during the
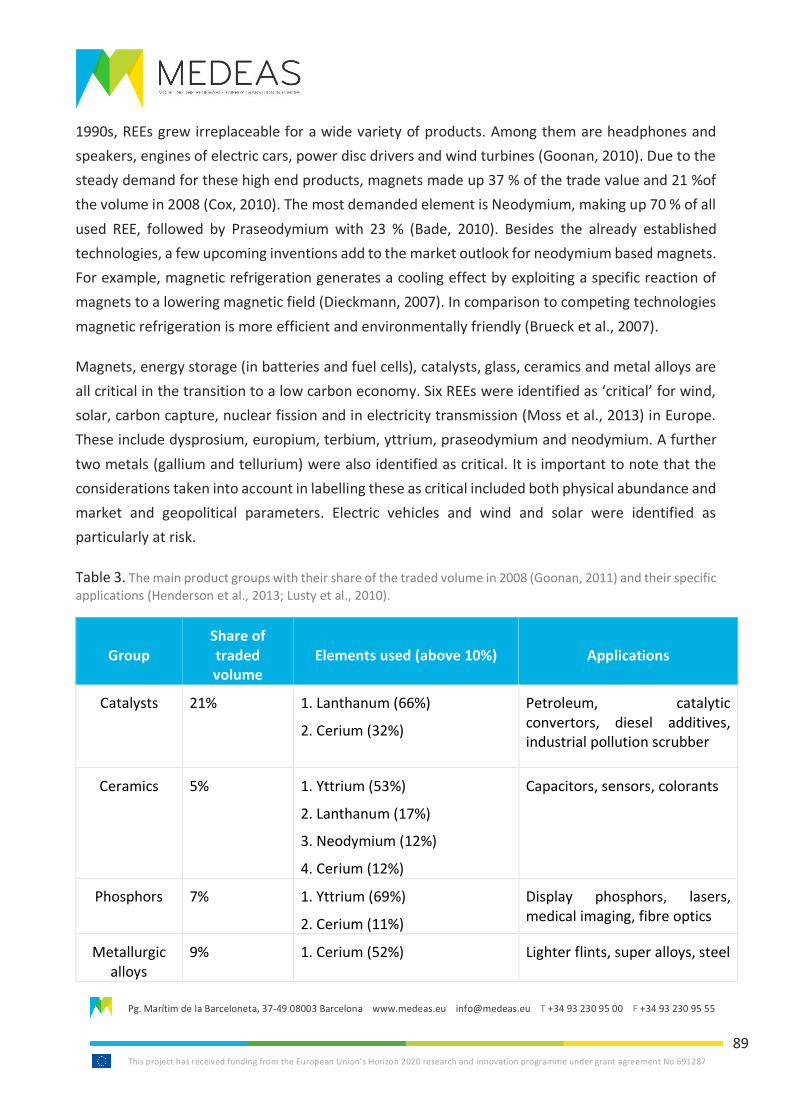
Pg. Marítim de la Barceloneta, 37-49 08003 Barcelona www.medeas.eu [email protected] T +34 93 230 95 00 F +34 93 230 95 55
This project has received funding from the European Union’s Horizon 2020 research and innovation programme under grant agreement No 691287
89
1990s, REEs grew irreplaceable for a wide variety of products. Among them are headphones and
speakers, engines of electric cars, power disc drivers and wind turbines (Goonan, 2010). Due to the
steady demand for these high end products, magnets made up 37 % of the trade value and 21 %of
the volume in 2008 (Cox, 2010). The most demanded element is Neodymium, making up 70 % of all
used REE, followed by Praseodymium with 23 % (Bade, 2010). Besides the already established
technologies, a few upcoming inventions add to the market outlook for neodymium based magnets.
For example, magnetic refrigeration generates a cooling effect by exploiting a specific reaction of
magnets to a lowering magnetic field (Dieckmann, 2007). In comparison to competing technologies
magnetic refrigeration is more efficient and environmentally friendly (Brueck et al., 2007).
Magnets, energy storage (in batteries and fuel cells), catalysts, glass, ceramics and metal alloys are
all critical in the transition to a low carbon economy. Six REEs were identified as ‘critical’ for wind,
solar, carbon capture, nuclear fission and in electricity transmission (Moss et al., 2013) in Europe.
These include dysprosium, europium, terbium, yttrium, praseodymium and neodymium. A further
two metals (gallium and tellurium) were also identified as critical. It is important to note that the
considerations taken into account in labelling these as critical included both physical abundance and
market and geopolitical parameters. Electric vehicles and wind and solar were identified as
particularly at risk.
Table 3. The main product groups with their share of the traded volume in 2008 (Goonan, 2011) and their specific
applications (Henderson et al., 2013; Lusty et al., 2010).
Group Share of traded volume
Elements used (above 10%) Applications
Catalysts 21%
1. Lanthanum (66%)
2. Cerium (32%)
Petroleum, catalytic convertors, diesel additives, industrial pollution scrubber
Ceramics 5%
1. Yttrium (53%)
2. Lanthanum (17%)
3. Neodymium (12%)
4. Cerium (12%)
Capacitors, sensors, colorants
Phosphors 7% 1. Yttrium (69%)
2. Cerium (11%)
Display phosphors, lasers, medical imaging, fibre optics
Metallurgic alloys
9% 1. Cerium (52%) Lighter flints, super alloys, steel
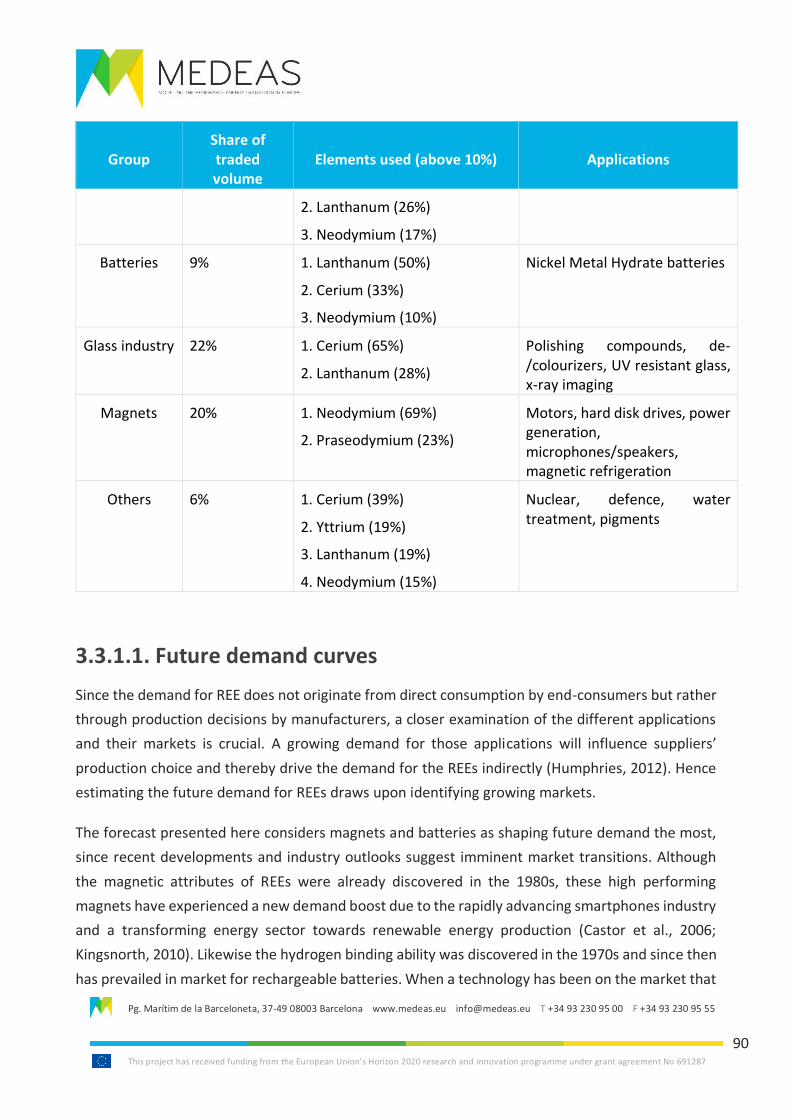
Pg. Marítim de la Barceloneta, 37-49 08003 Barcelona www.medeas.eu [email protected] T +34 93 230 95 00 F +34 93 230 95 55
This project has received funding from the European Union’s Horizon 2020 research and innovation programme under grant agreement No 691287
90
Group Share of traded volume
Elements used (above 10%) Applications
2. Lanthanum (26%)
3. Neodymium (17%)
Batteries 9% 1. Lanthanum (50%)
2. Cerium (33%)
3. Neodymium (10%)
Nickel Metal Hydrate batteries
Glass industry 22% 1. Cerium (65%)
2. Lanthanum (28%)
Polishing compounds, de-/colourizers, UV resistant glass, x-ray imaging
Magnets 20% 1. Neodymium (69%)
2. Praseodymium (23%)
Motors, hard disk drives, power generation, microphones/speakers, magnetic refrigeration
Others 6% 1. Cerium (39%)
2. Yttrium (19%)
3. Lanthanum (19%)
4. Neodymium (15%)
Nuclear, defence, water treatment, pigments
3.3.1.1. Future demand curves
Since the demand for REE does not originate from direct consumption by end-consumers but rather
through production decisions by manufacturers, a closer examination of the different applications
and their markets is crucial. A growing demand for those applications will influence suppliers’
production choice and thereby drive the demand for the REEs indirectly (Humphries, 2012). Hence
estimating the future demand for REEs draws upon identifying growing markets.
The forecast presented here considers magnets and batteries as shaping future demand the most,
since recent developments and industry outlooks suggest imminent market transitions. Although
the magnetic attributes of REEs were already discovered in the 1980s, these high performing
magnets have experienced a new demand boost due to the rapidly advancing smartphones industry
and a transforming energy sector towards renewable energy production (Castor et al., 2006;
Kingsnorth, 2010). Likewise the hydrogen binding ability was discovered in the 1970s and since then
has prevailed in market for rechargeable batteries. When a technology has been on the market that
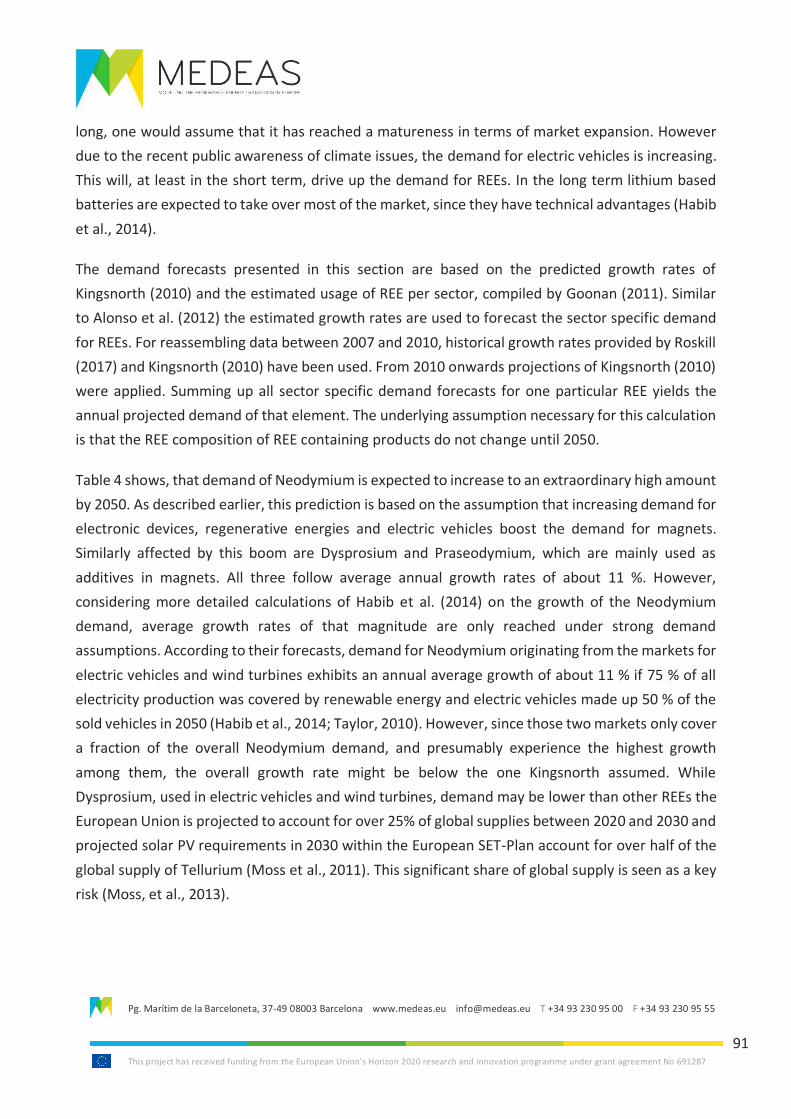
Pg. Marítim de la Barceloneta, 37-49 08003 Barcelona www.medeas.eu [email protected] T +34 93 230 95 00 F +34 93 230 95 55
This project has received funding from the European Union’s Horizon 2020 research and innovation programme under grant agreement No 691287
91
long, one would assume that it has reached a matureness in terms of market expansion. However
due to the recent public awareness of climate issues, the demand for electric vehicles is increasing.
This will, at least in the short term, drive up the demand for REEs. In the long term lithium based
batteries are expected to take over most of the market, since they have technical advantages (Habib
et al., 2014).
The demand forecasts presented in this section are based on the predicted growth rates of
Kingsnorth (2010) and the estimated usage of REE per sector, compiled by Goonan (2011). Similar
to Alonso et al. (2012) the estimated growth rates are used to forecast the sector specific demand
for REEs. For reassembling data between 2007 and 2010, historical growth rates provided by Roskill
(2017) and Kingsnorth (2010) have been used. From 2010 onwards projections of Kingsnorth (2010)
were applied. Summing up all sector specific demand forecasts for one particular REE yields the
annual projected demand of that element. The underlying assumption necessary for this calculation
is that the REE composition of REE containing products do not change until 2050.
Table 4 shows, that demand of Neodymium is expected to increase to an extraordinary high amount
by 2050. As described earlier, this prediction is based on the assumption that increasing demand for
electronic devices, regenerative energies and electric vehicles boost the demand for magnets.
Similarly affected by this boom are Dysprosium and Praseodymium, which are mainly used as
additives in magnets. All three follow average annual growth rates of about 11 %. However,
considering more detailed calculations of Habib et al. (2014) on the growth of the Neodymium
demand, average growth rates of that magnitude are only reached under strong demand
assumptions. According to their forecasts, demand for Neodymium originating from the markets for
electric vehicles and wind turbines exhibits an annual average growth of about 11 % if 75 % of all
electricity production was covered by renewable energy and electric vehicles made up 50 % of the
sold vehicles in 2050 (Habib et al., 2014; Taylor, 2010). However, since those two markets only cover
a fraction of the overall Neodymium demand, and presumably experience the highest growth
among them, the overall growth rate might be below the one Kingsnorth assumed. While
Dysprosium, used in electric vehicles and wind turbines, demand may be lower than other REEs the
European Union is projected to account for over 25% of global supplies between 2020 and 2030 and
projected solar PV requirements in 2030 within the European SET-Plan account for over half of the
global supply of Tellurium (Moss et al., 2011). This significant share of global supply is seen as a key
risk (Moss, et al., 2013).
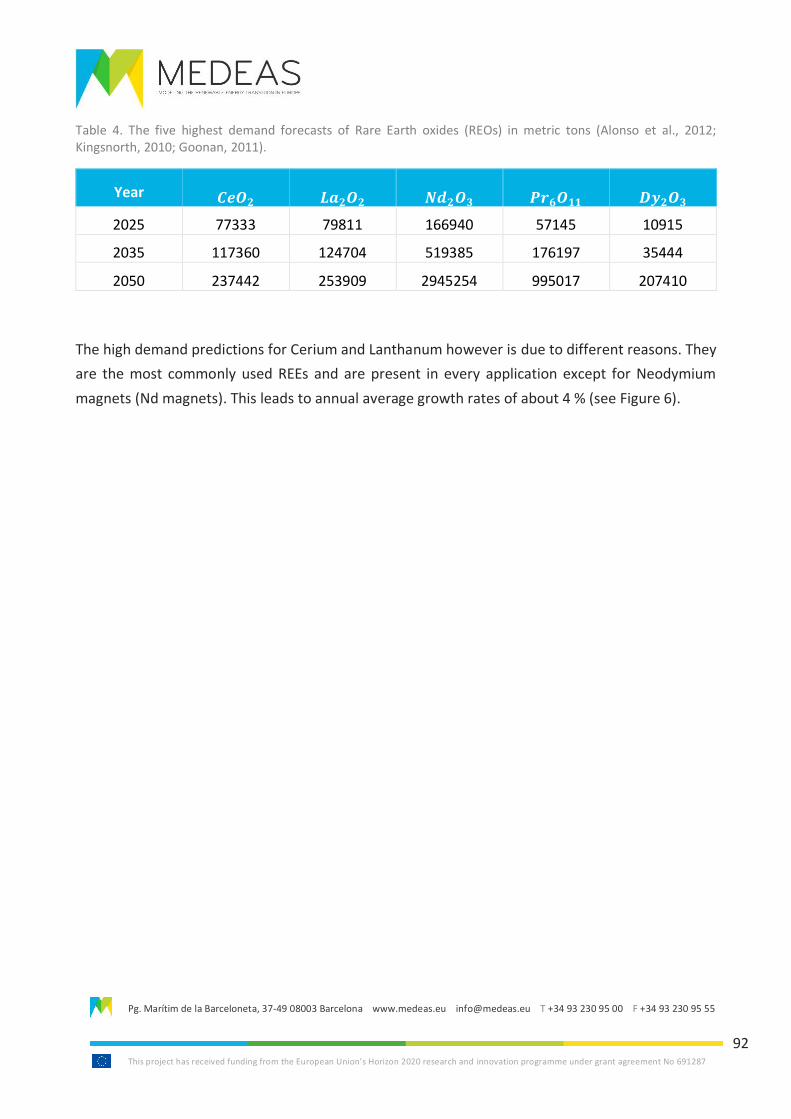
Pg. Marítim de la Barceloneta, 37-49 08003 Barcelona www.medeas.eu [email protected] T +34 93 230 95 00 F +34 93 230 95 55
This project has received funding from the European Union’s Horizon 2020 research and innovation programme under grant agreement No 691287
92
Table 4. The five highest demand forecasts of Rare Earth oxides (REOs) in metric tons (Alonso et al., 2012; Kingsnorth, 2010; Goonan, 2011).
Year 𝑪𝒆𝑶𝟐 𝑳𝒂𝟐𝑶𝟐 𝑵𝒅𝟐𝑶𝟑 𝑷𝒓𝟔𝑶𝟏𝟏 𝑫𝒚𝟐𝑶𝟑
2025 77333 79811 166940 57145 10915
2035 117360 124704 519385 176197 35444
2050 237442 253909 2945254 995017 207410
The high demand predictions for Cerium and Lanthanum however is due to different reasons. They
are the most commonly used REEs and are present in every application except for Neodymium
magnets (Nd magnets). This leads to annual average growth rates of about 4 % (see Figure 6).
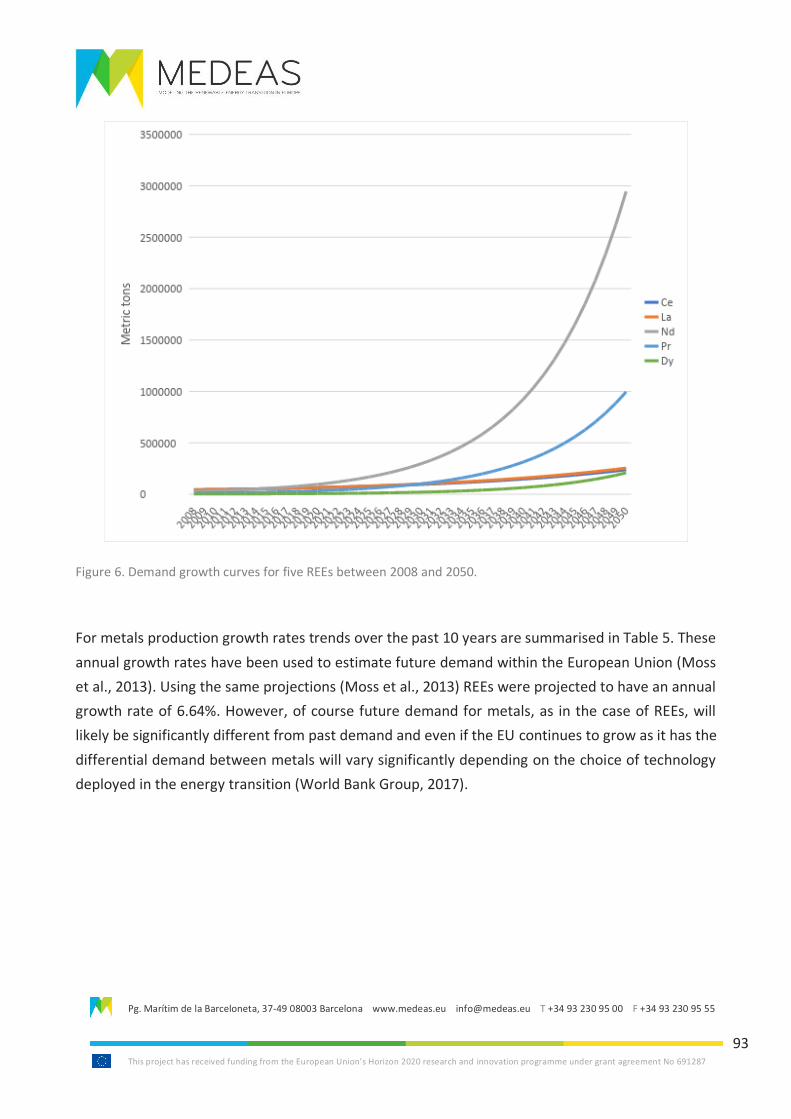
Pg. Marítim de la Barceloneta, 37-49 08003 Barcelona www.medeas.eu [email protected] T +34 93 230 95 00 F +34 93 230 95 55
This project has received funding from the European Union’s Horizon 2020 research and innovation programme under grant agreement No 691287
93
Figure 6. Demand growth curves for five REEs between 2008 and 2050.
For metals production growth rates trends over the past 10 years are summarised in Table 5. These
annual growth rates have been used to estimate future demand within the European Union (Moss
et al., 2013). Using the same projections (Moss et al., 2013) REEs were projected to have an annual
growth rate of 6.64%. However, of course future demand for metals, as in the case of REEs, will
likely be significantly different from past demand and even if the EU continues to grow as it has the
differential demand between metals will vary significantly depending on the choice of technology
deployed in the energy transition (World Bank Group, 2017).
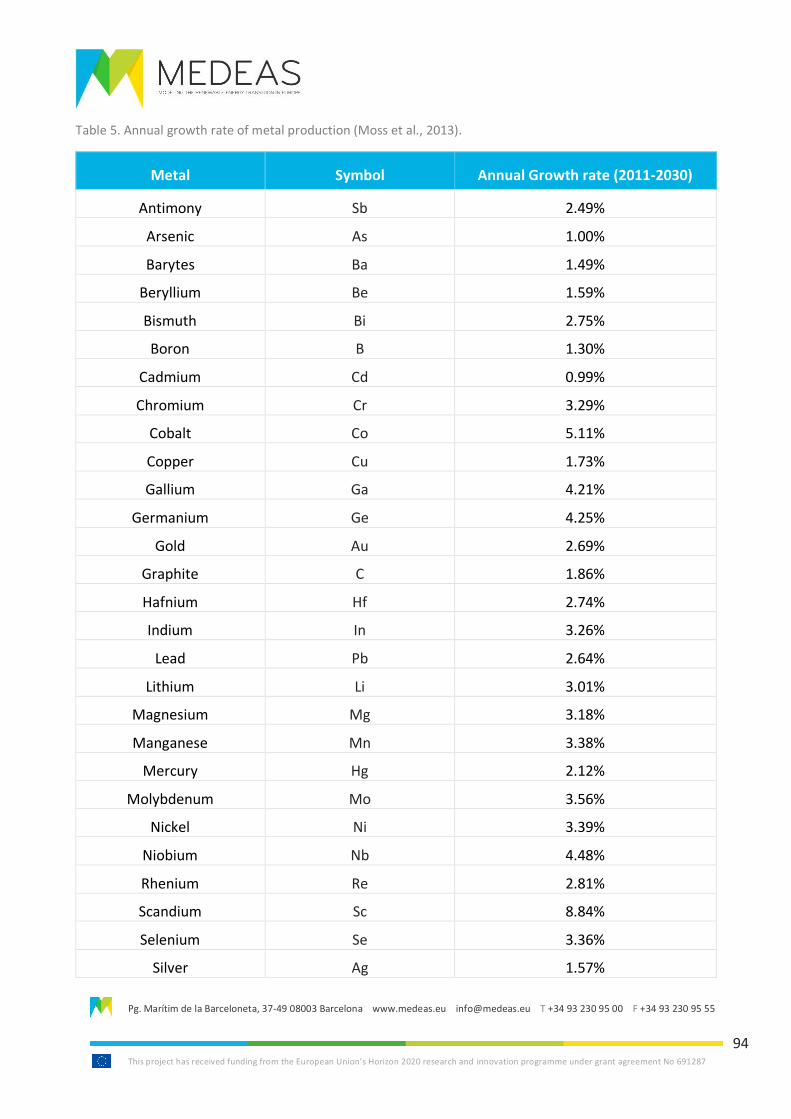
Pg. Marítim de la Barceloneta, 37-49 08003 Barcelona www.medeas.eu [email protected] T +34 93 230 95 00 F +34 93 230 95 55
This project has received funding from the European Union’s Horizon 2020 research and innovation programme under grant agreement No 691287
94
Table 5. Annual growth rate of metal production (Moss et al., 2013).
Metal Symbol Annual Growth rate (2011-2030)
Antimony Sb 2.49%
Arsenic As 1.00%
Barytes Ba 1.49%
Beryllium Be 1.59%
Bismuth Bi 2.75%
Boron B 1.30%
Cadmium Cd 0.99%
Chromium Cr 3.29%
Cobalt Co 5.11%
Copper Cu 1.73%
Gallium Ga 4.21%
Germanium Ge 4.25%
Gold Au 2.69%
Graphite C 1.86%
Hafnium Hf 2.74%
Indium In 3.26%
Lead Pb 2.64%
Lithium Li 3.01%
Magnesium Mg 3.18%
Manganese Mn 3.38%
Mercury Hg 2.12%
Molybdenum Mo 3.56%
Nickel Ni 3.39%
Niobium Nb 4.48%
Rhenium Re 2.81%
Scandium Sc 8.84%
Selenium Se 3.36%
Silver Ag 1.57%
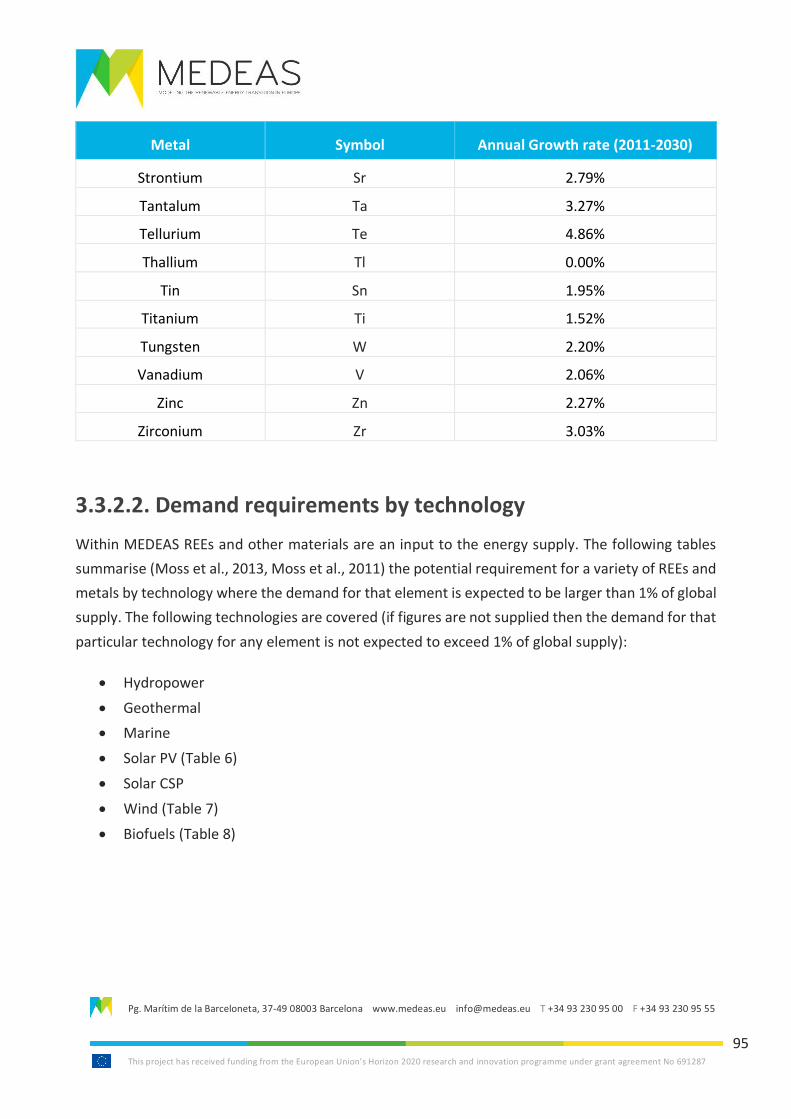
Pg. Marítim de la Barceloneta, 37-49 08003 Barcelona www.medeas.eu [email protected] T +34 93 230 95 00 F +34 93 230 95 55
This project has received funding from the European Union’s Horizon 2020 research and innovation programme under grant agreement No 691287
95
Metal Symbol Annual Growth rate (2011-2030)
Strontium Sr 2.79%
Tantalum Ta 3.27%
Tellurium Te 4.86%
Thallium Tl 0.00%
Tin Sn 1.95%
Titanium Ti 1.52%
Tungsten W 2.20%
Vanadium V 2.06%
Zinc Zn 2.27%
Zirconium Zr 3.03%
3.3.2.2. Demand requirements by technology
Within MEDEAS REEs and other materials are an input to the energy supply. The following tables
summarise (Moss et al., 2013, Moss et al., 2011) the potential requirement for a variety of REEs and
metals by technology where the demand for that element is expected to be larger than 1% of global
supply. The following technologies are covered (if figures are not supplied then the demand for that
particular technology for any element is not expected to exceed 1% of global supply):
• Hydropower
• Geothermal
• Marine
• Solar PV (Table 6)
• Solar CSP
• Wind (Table 7)
• Biofuels (Table 8)
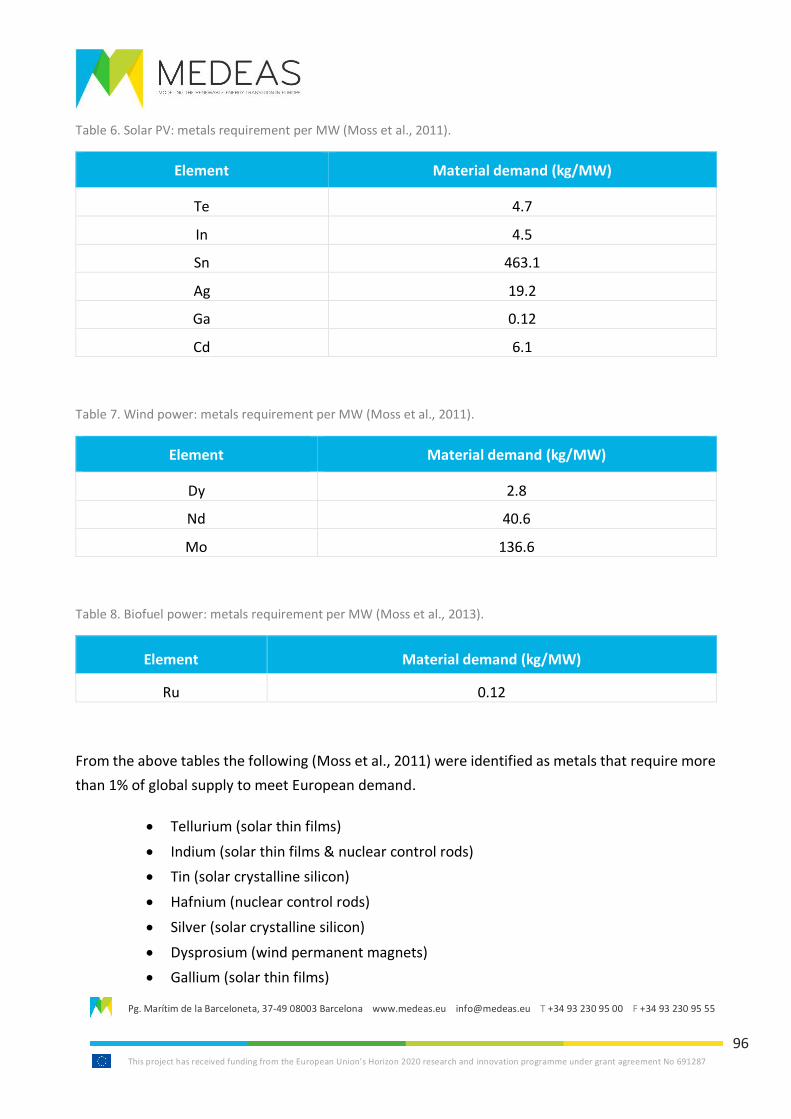
Pg. Marítim de la Barceloneta, 37-49 08003 Barcelona www.medeas.eu [email protected] T +34 93 230 95 00 F +34 93 230 95 55
This project has received funding from the European Union’s Horizon 2020 research and innovation programme under grant agreement No 691287
96
Table 6. Solar PV: metals requirement per MW (Moss et al., 2011).
Element Material demand (kg/MW)
Te 4.7
In 4.5
Sn 463.1
Ag 19.2
Ga 0.12
Cd 6.1
Table 7. Wind power: metals requirement per MW (Moss et al., 2011).
Element Material demand (kg/MW)
Dy 2.8
Nd 40.6
Mo 136.6
Table 8. Biofuel power: metals requirement per MW (Moss et al., 2013).
Element Material demand (kg/MW)
Ru 0.12
From the above tables the following (Moss et al., 2011) were identified as metals that require more
than 1% of global supply to meet European demand.
• Tellurium (solar thin films)
• Indium (solar thin films & nuclear control rods)
• Tin (solar crystalline silicon)
• Hafnium (nuclear control rods)
• Silver (solar crystalline silicon)
• Dysprosium (wind permanent magnets)
• Gallium (solar thin films)

Pg. Marítim de la Barceloneta, 37-49 08003 Barcelona www.medeas.eu [email protected] T +34 93 230 95 00 F +34 93 230 95 55
This project has received funding from the European Union’s Horizon 2020 research and innovation programme under grant agreement No 691287
97
• Neodymium (wind permanent magnets)
• Cadmium (solar thin films)
• Nickel (various, steel alloys)
• Molybdenum (wind steel alloys)
• Selenium (solar thin films).
Pg. Marítim de la Barceloneta, 37-49 08003 Barcelona www.medeas.eu [email protected] T +34 93 230 95 00 F +34 93 230 95 55
This project has received funding from the European Union’s Horizon 2020 research and innovation programme under grant agreement No 691287
98
3.3.2 Supply of Rare Earth Elements
3.3.2.1. Current supply
In order to assess how many resources are available for mining, first one has to look briefly into
REE’s natural occurrences. Contrary to their name, REEs are not particularly rare in the earth’s crust.
In fact they are relatively abundant; Cerium for example is about as abundant as copper (Haque et
al., 2014). However unlike other metals, concentrations of REMs are mostly so low that mining
would not be economically feasible. Additionally, due to their very similar physical attributes, REEs
never occur isolated, but in mixtures, which have to be separated by a costly process in order to
extract a single element. Since the supply is bound to the composition of the respective hosting
mineral, mining cannot be conducted in a demand complementing way.
History has shown that depending on which application experiences a high demand, a few REEs are
in high demand while others are not. Since the mining companies cannot change the composition
of the REE ores, higher volumes have to be mined and less demanded elements have to be
stockpiled, leading to very high prices for the few scarce, demanded elements. This market friction
is commonly referred to as the “balance problem” (Binnemanns et al., 2013a). The composition of
those mixtures is highly correlated to the hosting mineral the REEs are found in. Up until now there
are over 200 different minerals identified that can carry REE (Kanazawa et al., 2006); however only
a few of them are abundant enough to make an extraction feasible. Therefore we focus on giving a
brief overview of three of the most important minerals, bastnaesite, monazite and xenotime, their
properties and occurrences (Ober, 2017).
Bastnaesite is the most abundant mineral, and the most important for global supply. In its natural
occurrence it usually contains either lanthanum, cerium or yttrium as the predominant element,
which makes it a carrier of light rare earth metals (Krishnamurthy et al., 2004). This carbonate
fluoride mineral occurs usually in vein deposits or disseminated in carbonate silicate rocks. The
absence of radioactive thorium makes mining easier, cheaper and less contaminating compared to
other minerals (Weber et al., 2012).
Monazite is a phosphate mineral, which occurs in crystalized form in a variety of deposits. For one
it can be found in acidic igneous rocks, metamorphic rocks and veins. Due to its molecular stability
in its crystalized form, it also appears in placer deposits and beach sands as detrital material
(Krishnamurthy et al., 2004). Generally monazite carries light rare earth metals like cerium,
lanthanum or neodymium, but also heavy elements like yttrium. Occasionally it is also associated
with thorium, which can increase disposal or stockpiling costs.
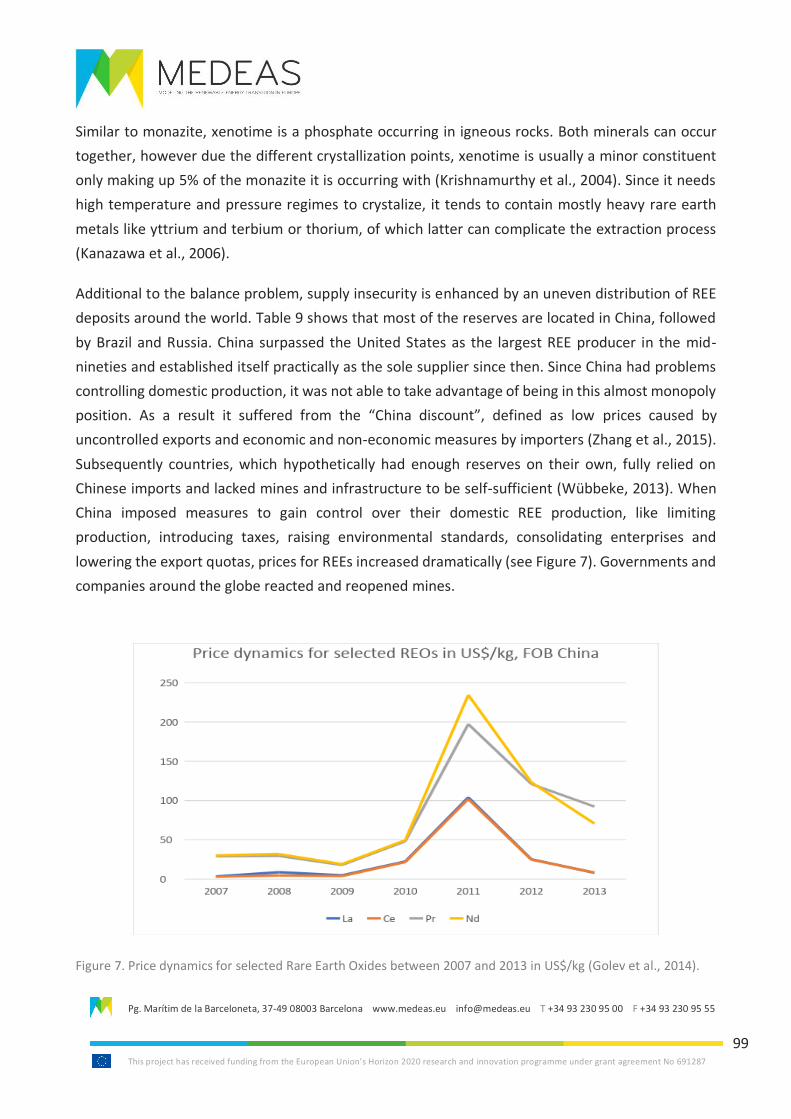
Pg. Marítim de la Barceloneta, 37-49 08003 Barcelona www.medeas.eu [email protected] T +34 93 230 95 00 F +34 93 230 95 55
This project has received funding from the European Union’s Horizon 2020 research and innovation programme under grant agreement No 691287
99
Similar to monazite, xenotime is a phosphate occurring in igneous rocks. Both minerals can occur
together, however due the different crystallization points, xenotime is usually a minor constituent
only making up 5% of the monazite it is occurring with (Krishnamurthy et al., 2004). Since it needs
high temperature and pressure regimes to crystalize, it tends to contain mostly heavy rare earth
metals like yttrium and terbium or thorium, of which latter can complicate the extraction process
(Kanazawa et al., 2006).
Additional to the balance problem, supply insecurity is enhanced by an uneven distribution of REE
deposits around the world. Table 9 shows that most of the reserves are located in China, followed
by Brazil and Russia. China surpassed the United States as the largest REE producer in the mid-
nineties and established itself practically as the sole supplier since then. Since China had problems
controlling domestic production, it was not able to take advantage of being in this almost monopoly
position. As a result it suffered from the “China discount”, defined as low prices caused by
uncontrolled exports and economic and non-economic measures by importers (Zhang et al., 2015).
Subsequently countries, which hypothetically had enough reserves on their own, fully relied on
Chinese imports and lacked mines and infrastructure to be self-sufficient (Wübbeke, 2013). When
China imposed measures to gain control over their domestic REE production, like limiting
production, introducing taxes, raising environmental standards, consolidating enterprises and
lowering the export quotas, prices for REEs increased dramatically (see Figure 7). Governments and
companies around the globe reacted and reopened mines.
Figure 7. Price dynamics for selected Rare Earth Oxides between 2007 and 2013 in US$/kg (Golev et al., 2014).
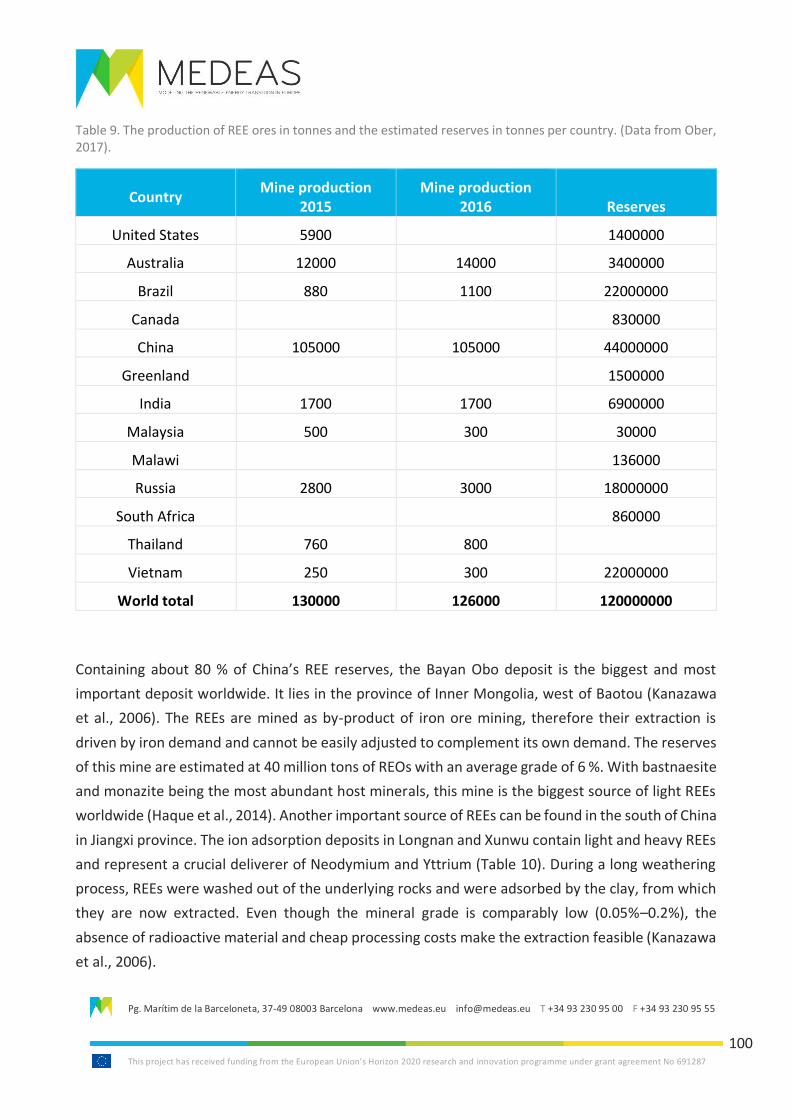
Pg. Marítim de la Barceloneta, 37-49 08003 Barcelona www.medeas.eu [email protected] T +34 93 230 95 00 F +34 93 230 95 55
This project has received funding from the European Union’s Horizon 2020 research and innovation programme under grant agreement No 691287
100
Table 9. The production of REE ores in tonnes and the estimated reserves in tonnes per country. (Data from Ober, 2017).
Country Mine production
2015 Mine production
2016 Reserves
United States 5900 1400000
Australia 12000 14000 3400000
Brazil 880 1100 22000000
Canada 830000
China 105000 105000 44000000
Greenland 1500000
India 1700 1700 6900000
Malaysia 500 300 30000
Malawi 136000
Russia 2800 3000 18000000
South Africa 860000
Thailand 760 800
Vietnam 250 300 22000000
World total 130000 126000 120000000
Containing about 80 % of China’s REE reserves, the Bayan Obo deposit is the biggest and most
important deposit worldwide. It lies in the province of Inner Mongolia, west of Baotou (Kanazawa
et al., 2006). The REEs are mined as by-product of iron ore mining, therefore their extraction is
driven by iron demand and cannot be easily adjusted to complement its own demand. The reserves
of this mine are estimated at 40 million tons of REOs with an average grade of 6 %. With bastnaesite
and monazite being the most abundant host minerals, this mine is the biggest source of light REEs
worldwide (Haque et al., 2014). Another important source of REEs can be found in the south of China
in Jiangxi province. The ion adsorption deposits in Longnan and Xunwu contain light and heavy REEs
and represent a crucial deliverer of Neodymium and Yttrium (Table 10). During a long weathering
process, REEs were washed out of the underlying rocks and were adsorbed by the clay, from which
they are now extracted. Even though the mineral grade is comparably low (0.05%–0.2%), the
absence of radioactive material and cheap processing costs make the extraction feasible (Kanazawa
et al., 2006).
Pg. Marítim de la Barceloneta, 37-49 08003 Barcelona www.medeas.eu [email protected] T +34 93 230 95 00 F +34 93 230 95 55
This project has received funding from the European Union’s Horizon 2020 research and innovation programme under grant agreement No 691287
101
The second biggest supplier of REEs on the global market is Australia. Its main resources lie in Mount
Weld, located in the west of Australia, south of Laverton. The main mineral is bastnaesite, which
makes it the second largest contributor of light REEs on the world. However there are also
phosphate related minerals like monazite or xenotime. With estimated reserves of 7.7 million tons
of rare earth oxides at a grade of 12%, the mine hosts the most potent ores worldwide (Haque et
al., 2014). Besides Mount Weld, Australia is also in endowed with considerable amounts of heavy
rare earth metals hosted in placer deposits on the east, south, and west coast. Although they
developed through different processes and have different geological histories, their main REE
containing minerals are monazite and xenotime.
The USA’s biggest mine lies in southern California at Mountain Pass. According to estimates there
are about 28 million tons of rare earth oxides with an average grade of 8%-10%, mainly deposited
in bastnaesite. The last owner of that mining site, Molycorp, had to file bankruptcy in 2015 and
eventually sold the mine. Legal disputes over the mining rights leave the mine’s future in uncertainty
(Church, 2017). One of the main reasons for the mine’s struggle are the unpredictable price
fluctuations, which have proven to make operating the mine unfeasible. Never the less it is worth
mentioning, since the fully equipped mining site can be activated again if prices stabilize at a higher
plateau.
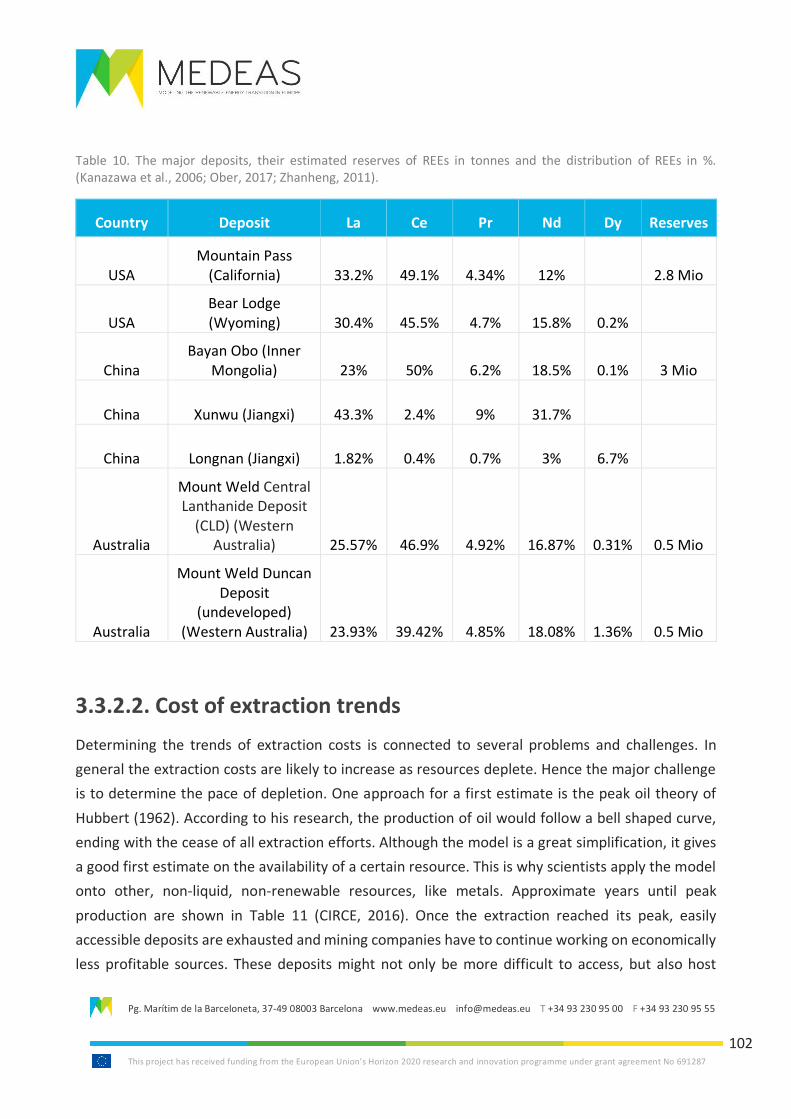
Pg. Marítim de la Barceloneta, 37-49 08003 Barcelona www.medeas.eu [email protected] T +34 93 230 95 00 F +34 93 230 95 55
This project has received funding from the European Union’s Horizon 2020 research and innovation programme under grant agreement No 691287
102
Table 10. The major deposits, their estimated reserves of REEs in tonnes and the distribution of REEs in %. (Kanazawa et al., 2006; Ober, 2017; Zhanheng, 2011).
Country Deposit La Ce Pr Nd Dy Reserves
USA Mountain Pass
(California) 33.2% 49.1% 4.34% 12%
2.8 Mio
USA Bear Lodge (Wyoming) 30.4% 45.5% 4.7% 15.8% 0.2%
China Bayan Obo (Inner
Mongolia) 23% 50% 6.2% 18.5% 0.1% 3 Mio
China Xunwu (Jiangxi) 43.3% 2.4% 9% 31.7%
China Longnan (Jiangxi) 1.82% 0.4% 0.7% 3% 6.7%
Australia
Mount Weld Central Lanthanide Deposit
(CLD) (Western Australia) 25.57% 46.9% 4.92% 16.87% 0.31% 0.5 Mio
Australia
Mount Weld Duncan Deposit
(undeveloped) (Western Australia) 23.93% 39.42% 4.85% 18.08% 1.36% 0.5 Mio
3.3.2.2. Cost of extraction trends
Determining the trends of extraction costs is connected to several problems and challenges. In
general the extraction costs are likely to increase as resources deplete. Hence the major challenge
is to determine the pace of depletion. One approach for a first estimate is the peak oil theory of
Hubbert (1962). According to his research, the production of oil would follow a bell shaped curve,
ending with the cease of all extraction efforts. Although the model is a great simplification, it gives
a good first estimate on the availability of a certain resource. This is why scientists apply the model
onto other, non-liquid, non-renewable resources, like metals. Approximate years until peak
production are shown in Table 11 (CIRCE, 2016). Once the extraction reached its peak, easily
accessible deposits are exhausted and mining companies have to continue working on economically
less profitable sources. These deposits might not only be more difficult to access, but also host
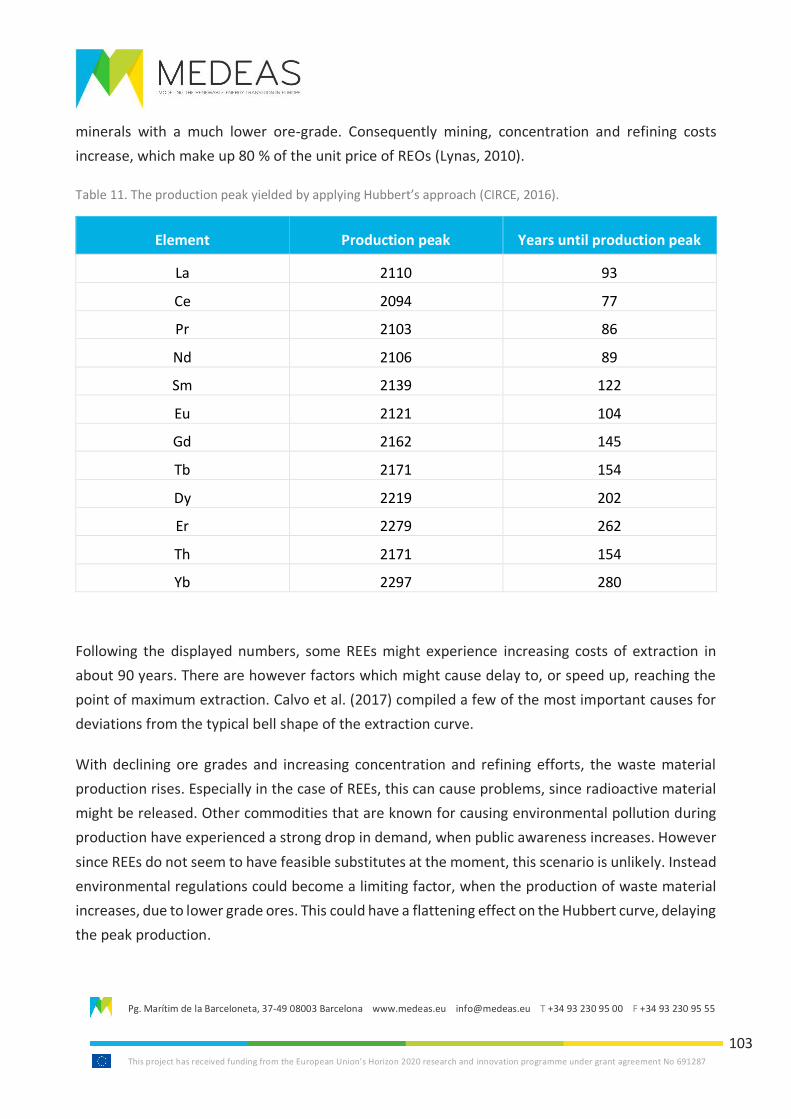
Pg. Marítim de la Barceloneta, 37-49 08003 Barcelona www.medeas.eu [email protected] T +34 93 230 95 00 F +34 93 230 95 55
This project has received funding from the European Union’s Horizon 2020 research and innovation programme under grant agreement No 691287
103
minerals with a much lower ore-grade. Consequently mining, concentration and refining costs
increase, which make up 80 % of the unit price of REOs (Lynas, 2010).
Table 11. The production peak yielded by applying Hubbert’s approach (CIRCE, 2016).
Element Production peak Years until production peak
La 2110 93
Ce 2094 77
Pr 2103 86
Nd 2106 89
Sm 2139 122
Eu 2121 104
Gd 2162 145
Tb 2171 154
Dy 2219 202
Er 2279 262
Th 2171 154
Yb 2297 280
Following the displayed numbers, some REEs might experience increasing costs of extraction in
about 90 years. There are however factors which might cause delay to, or speed up, reaching the
point of maximum extraction. Calvo et al. (2017) compiled a few of the most important causes for
deviations from the typical bell shape of the extraction curve.
With declining ore grades and increasing concentration and refining efforts, the waste material
production rises. Especially in the case of REEs, this can cause problems, since radioactive material
might be released. Other commodities that are known for causing environmental pollution during
production have experienced a strong drop in demand, when public awareness increases. However
since REEs do not seem to have feasible substitutes at the moment, this scenario is unlikely. Instead
environmental regulations could become a limiting factor, when the production of waste material
increases, due to lower grade ores. This could have a flattening effect on the Hubbert curve, delaying
the peak production.
Pg. Marítim de la Barceloneta, 37-49 08003 Barcelona www.medeas.eu [email protected] T +34 93 230 95 00 F +34 93 230 95 55
This project has received funding from the European Union’s Horizon 2020 research and innovation programme under grant agreement No 691287
104
Since the Hubbert model is based on the assumption of a symmetric consumption path, it neglects
external shocks that might influence consumption, other than depletion of the mineral. Social and
political events, like war or a trade embargo, can cause a deviation from the assumed consumption
path. In the case of REMs, China’s introduction of export quotas is a perfectly fitting example for a
political event that disturbs previously reigning trends. Massari et al. (2013) examined historic price
trends between 1991 and 2012 and identified two phases of price regimes. In the period 1991 to
2007 production has increased gradually from 50000 t/year to 130000 t/year accompanied by price
decay from 13 US$/t to 5US$/t. When becoming an important consumer itself, China introduced
export quotas, which triggered prices to peak in 2011. Cerium prices increased form 4.5 US$/kg
(2009) to 158 US$/kg (2011), similarly the price of neodymium increased from 14 US$/kg to 248.5
US$/kg over the same period. Just one year after, prices experienced a sharp decay of 73 % for
cerium and 52 % for neodymium. This high volatility caused uncertainty among market participants,
and forced them to take up efforts to open up mines outside China. The increased global mining
activity speeds up depletion.
Another anomaly about the REEs market is the balance problem. Some mines extract REE as a by-
product of a different, more valuable, metal. Subsequently the mining efforts are determined by the
demand for the more precious metal, causing a decoupling of supply and demand for the REEs.
Depending on the major metal, this can lead to overproduction or shortages of certain REEs and
therefore speed up or delay the peak production.
The last factor that might have an influence on the peak production in the future is recycling.
Tapping secondary resources by landfill mining, or scrap recycling reduces the demand for REEs
extracted from primary resources.
3.3.2.3. Future supply: Increased mining
When looking for potential increases in REEs one may consider two different sources: an increase
in mining by geological research and the discovery of new potential mining sites. Triggered by the
price peaks in 2011 many companies and countries intensified their efforts to find extractable REE
sources. In 2011 more than 200 research projects on potential mining sites were recorded. Since
setting up a mine comes with high regulations, limitations and risk, only a handful of them are likely
to become the cornerstone of actual mining activities (Lusty et al., 2011).
In addition to all regulatory requirements, mines outside China face tough competition, with
unequal market conditions. Since China mostly produces REEs as a by-product or extracts them from
clay, mining costs are comparably low. Additionally environmental regulations are less strict, which
Pg. Marítim de la Barceloneta, 37-49 08003 Barcelona www.medeas.eu [email protected] T +34 93 230 95 00 F +34 93 230 95 55
This project has received funding from the European Union’s Horizon 2020 research and innovation programme under grant agreement No 691287
105
gives Chinese companies an extra advantage (Schüler et al., 2011). The mines at Mount Weld and
Mountain Pass reflect the uncertainty caused by China’s dominance on the market fairly well. Both
mines reopened in the aftermath of the price peaks in 2011, entering the market with the latest
technology. Despite big support and heavy investments Mountain Pass Molycorp had to file
bankruptcy, indicating the difficult market conditions (Church, 2017).
Indeed mining of REEs in Europe is currently not active however, there are potential deposits in
Sweden, Norway, Greenland and Finland and smaller deposits in a number of other European
countries (Moss, et al., 2013, European Commission, 2014). For example, Kvanefjeld in Greenland is
claimed to be the world’s second largest deposit of REEs and a mining licence was submitted in 2015
by Greenland Minerals and Energy.
However, what is clear is that the anticipated increase in resource requirements especially for
metals and REEs is significant and to avoid volatility in commodity markets caused by
supply/demand imbalances (World Bank Group, 2017) a coherent approach to predicting demand
and investing in supply is required.
3.3.2.4. Future supply: Recycling and re-use
Alternative to looking for new mining sites, one could focus on the minerals that already have been
extracted and processed and now rest as scrap in landfills and waste disposals. Examining the rare
earth lifecycle, Graedel et al. (2014) come to the conclusion that REEs are lost on almost every level
of the value chain. Beginning with inefficient extraction methods used for example in China
(Wübbeke, 2013), the disposal of REEs mined as a by-product, incomplete separation procedures,
unused metal scraps from the production of consumer goods and finally the disposal of those (Du
et al., 2011). In summary recycling can take place at three different phases of the value chain. “Direct
recycling” refers to every scrap recovery that takes place during manufacturing final goods, whereas
“urban mining” describes the usage of disposed final goods. A third category, described as “landfill
mining”, defines the recovery of metals from historic urban or industrial waste (Binnemanns et al.,
2013b).
For the year 2007 the pre consumer scraps were estimated to amount of about 16 Gigagrams of
rare earth oxides, which makes up 12 % of the ores that were mined in that year. If the waste
produced through mining is accounted for as well, 28 % of the mined ores are lost before entering
the consumer market (Du et al., 2011). Since only some of this material is stockpiled and brought
back into the value chain at some point, most of it is disposed in landfills. The figures of 2007 suggest
that there is a huge potential for recycling on the supply side, which could be activated, if market
Pg. Marítim de la Barceloneta, 37-49 08003 Barcelona www.medeas.eu [email protected] T +34 93 230 95 00 F +34 93 230 95 55
This project has received funding from the European Union’s Horizon 2020 research and innovation programme under grant agreement No 691287
106
conditions or political incentives would make more efficient mining and manufacturing procedures
profitable.
A so far almost untouched field of recycling is urban recycling. In 2011 only 1 % of post-consumer
scrap was recycled (Graedel et al., 2011). The main reasons for this are inefficient collection,
technical difficulties and a lack of incentives. Although market uncertainty might make investments
into recycling risky for the individual company, expectation is that a collective commitment to a
higher recycling effort would benefit the market greatly in many ways. Besides reducing the supply
risks, recycling could help solve one of biggest problems of the market: the balance problem. By
recycling metals that experience a high demand, pressure on the mining industry is relieved and
price differences between the REEs can be evened out, possibly to an extent that the prices actually
reflect market value. Mining companies could make their margin based on all their REE products
and not only on those with high demand. Additionally recycling reduces environmental pollution
simply by the fact that it does not require the disposal of radioactive material (Binnemanns et al.,
2013). Although the great price peaks in 2011 have been the kick off for several research projects
on efficient urban recycling methods, most of them have remained at the laboratory scale.
Focussing on the most important applications of REEs, the following give a brief overview of current
status and potential of recycling.
Industrial or landfill recycling also require a stable and high price for the REEs to justify the cost of
recovery. While the recycling rates for some REEs and metals are currently high, for example lead,
ruthenium and indium have recycling rates higher than 50% (Moss et al., 2013), the investment
needed to increase these recycling rates, unless collection and treatment occurs for other reasons
(such as waste regulations), means high prices of these elements going forward. For example,
projections show that a price of $45/tonne or Neodynium and $2,500/tonne of Dysprosium are
required (Moss et al., 2013).
The recycling potential of permanent magnets strongly depends on the application they are built in.
Up to 30 % of the manufactured magnets are lost during the shaping process and are disposed as
scrap. Considering the forecasted growth of the magnet applications of up to 12 %, manufacturers
cannot afford to leave behind such amounts of REEs for much longer. When it comes to the final
goods, different applications require different recycling methods. Magnets built in wind turbines for
example would be suitable for reuse, since melting them down would be energy inefficient. The
majority of the magnets however are built into small electronic devices, like HDD, headphones or
speakers, which makes it difficult to extract them. Once those products are shredded, the magnetic
pieces attach to other metallic scrap and make an easy separation impossible. Binnemans et al.
Pg. Marítim de la Barceloneta, 37-49 08003 Barcelona www.medeas.eu [email protected] T +34 93 230 95 00 F +34 93 230 95 55
This project has received funding from the European Union’s Horizon 2020 research and innovation programme under grant agreement No 691287
107
(2013) lists several different methods with their advantages and disadvantages and also state that
under laboratory conditions a recovery of up 95 % is possible.
A likewise important application of neodymium are the NiMH batteries, for which demand is
estimated to increase due to a shift towards electric vehicles. The high REE compound of 10 – 12 %
makes them a valuable resource for urban mining. Especially as separation methods achieve a
recovery of up to 97.5 % of the used REE material under laboratory conditions (Binnemanns et al.,
2013). Umicore and Rhodia developed a separation method for extracting precious metals like REEs
or Lithium from rechargeable batteries and opened a pilot recycling factory near Antwerp in Belgium
in 2011. The plant has a capacity to process 150 thousand (hybrid) electric vehicle batteries or 250
million mobile-phone batteries and could become the blueprint of future recycling sites
(Binnemanns et al., 2013).
In order to quantify potential REE reflux Binnemanns et al. (2013) calculated a rough estimate of
possible recyclable amounts under two different ad-hoc assumptions. In a pessimistic scenario they
assumed the overall recovery rate to be 16.5 % for magnets and 20 % for batteries. In a more
optimistic scenario they chose a 33 % overall recovery rate for magnets and a 35 % rate for batteries.
Those overall recovery rate consider the collection rate as well as the recycling efficiency. Applying
those rates onto the global in-use REE stocks, put together by Du et al. (2011), Binnemanns
calculated that the reflux from recycling magnets and batteries could be between 4300 and 8350
tons of REE. In comparison to previously presented demand forecasts, those number appear
insignificantly small, which is due to different applied growth rates.
3.3.2.5. Future supply: Options for substitution
Since scientific research is a very expensive investment, it is usually only conducted when expected
price increases or supply shortages suggest future profits as an incentive. Therefore research on REE
substitutes mostly focuses on elements that are either difficult to extract or that are expected to
experience a supply shortage. As shown in the previous chapters, the elements with the highest
projected demand growth, which is connected to a higher supply risk, are neodymium,
praseodymium and dysprosium.
Substituting any technology can be done two ways. Either by developing a whole new product
design or keeping the old design but replacing the critical compound by a suitable cheaper substitute
(Weber et al., 2012). Given the very unique attributes of REEs, finding a direct replacement has
proven to be difficult (Haxel et al., 2002). Therefore the alternatives and ongoing research for
options without REE additives is key (Schueler et al., 2011).
Pg. Marítim de la Barceloneta, 37-49 08003 Barcelona www.medeas.eu [email protected] T +34 93 230 95 00 F +34 93 230 95 55
This project has received funding from the European Union’s Horizon 2020 research and innovation programme under grant agreement No 691287
108
One of the main drivers of neodymium and dysprosium demand are electric vehicles. Their motors
usually use some kind of magnet to convert electricity into physical force. Currently there are two
types of motors built into electric vehicles. The synchronous motor uses a neodymium magnet and
is the most efficient motor available for large scale productions. However, due to its high costs, the
asynchronous motor is still the most widely used motor, although it is bigger and less efficient. An
alternative to the two established motors could be a synchronous motor running with
electromagnets instead of neodymium magnets. Since this motor uses three times as much copper
as every alternative, the independence from REEs would be traded towards a dependence from
copper. Another possibility could be a permanent motor based on a ferrite magnet. It comes at
much lower production costs but features also only a quarter of the magnetic power of the
neodymium based alternative. A third option could be developed based upon reluctance motors. If
combined with a permanent magnet, they are able to achieve an even better performance than the
common motors. One of their major disadvantages is the noise emittance, which makes them
unsuitable for passenger vehicles at present.
The second most important contributors to neodymium and dysprosium demand growth are
computer and other small electronic devices. Almost one third of all neodymium magnets are used
for storage technologies like hard disk drives (HDD); another tenth for acoustic applications, such as
earphones, reading or writing heads and speakers (Habib et al., 2014; Kara et al., 2010). For the past
few decades the HDD has been the most common storage compound. Information, saved on the
disks, is accessed, written or changed through arm assembly driven by voice-coil-motor, which is
powered by a permanent magnet. With the invention of solid state drives (SSD), a new generation
of data storage devices challenges the supremacy of HDDs. SSDs have a number of advantages over
their established competitor, such as less vulnerability towards physical shocks, less latency, less
noise emittance and their independence from REEs. Due to high production costs it is unlikely, that
SSDs will take over the market completely in the near future. However, as more research is
conducted and production is expanded, expectation are that SSDs will keep increasing their market
share.
Although covering a smaller portion of the overall neodymium demand, wind turbines are no less
important than the previously described applications, due to their high societal value and
contribution to future power production. Currently there are two different technologies available
on the market. The gear drive wind turbine uses a gear box to increase the rotation speed applied
onto the generator. While this generator works with an electromagnet, the competing direct drive
uses stronger, REE doped, permanent magnets and thus is not reliant upon a gear box. Although
both turbines generate a comparable amount of power, the direct drive needs less maintenance
Pg. Marítim de la Barceloneta, 37-49 08003 Barcelona www.medeas.eu [email protected] T +34 93 230 95 00 F +34 93 230 95 55
This project has received funding from the European Union’s Horizon 2020 research and innovation programme under grant agreement No 691287
109
and is for this reason favourable for offshore wind parks (Speirs et al., 2013). However with prices
for neodymium increasing, the gearbox might become attractive again, if its efficiency and lifetime
could be increased.
Besides reconsidering product design, finding direct substitutes is the other strategy to overcome
imminent supply shortages. Since REE based magnets are the critical input in most of the above
mentioned applications, research on alternative magnets is a focus. A potential option for smaller
devices is the samarium cobalt magnet (SmCo). Although the production is complex and expensive,
they do not require a coating process like neodymium magnets do. Since the cost for coating do not
depend on the size of the magnet, SmCo magnets could become economically feasible for smaller
devices, if prices of neodymium magnets keep increasing. Another prospect compound for magnets
is iron nitride, which is already used in transformers (Monson et al., 2015). Most of the ongoing
research focuses on reducing the REE use by increasing the efficiency of neodymium magnets. To
accomplish this target, most recent approaches try to use nanoparticles and manipulate molecular
alignment. (Weber et al., 2012).
The last application that is considered in this paper are Nickel Metal Hydrate (NiMH) batteries. With
the increase of electric vehicle production, neodymium demand will also be driven by an increasing
demand for Nickel Metal Hydrate (NiMH) batteries. This effect is expected to be only occurring in
the short to mid run, since lithium (Li) ion batteries are likely to take over the whole market in the
long run (Vikström et al., 2013). Being the most powerful battery on the market, the Li ion battery
only faces some safety and price issues before becoming the undisputed market leader (Pillot,
2009). A potential supply shortage of REEs could even speed up that process.
Pg. Marítim de la Barceloneta, 37-49 08003 Barcelona www.medeas.eu [email protected] T +34 93 230 95 00 F +34 93 230 95 55
This project has received funding from the European Union’s Horizon 2020 research and innovation programme under grant agreement No 691287
110
3.3.3. Implications for MEDEAS
Given the uncertainty in resource availability of rare earth and other metals, in particular when
considering the ability for substitution, recycling, re-use, efficiency or increased investment in
extraction, it is difficult to put absolute constraints on the availability of these elements. Within
MEDEAS estimates of these constraints have been made (Table 34, Deliverable 4.1) which is
reproduced below (Table 12). The elements that are most constrained by current resource
estimates given the MEDEAS model assumptions are Indium, Manganese and Tellurium. However,
as noted above these three are more than 50% recycled currently so the absolute resource
constraints may be too harsh. Therefore, while the MEDEAS model has the ability to warn the user
when a particular resource is over exploited, none of the proposed scenarios are constrained by
their supply.
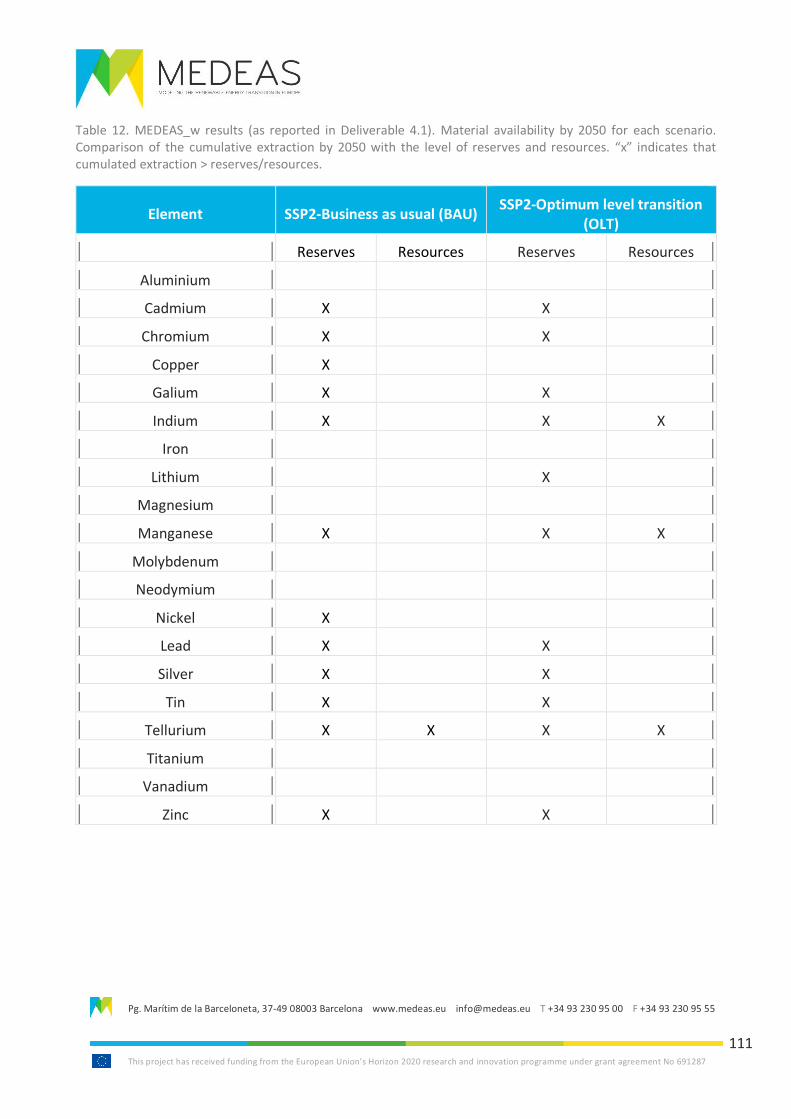
Pg. Marítim de la Barceloneta, 37-49 08003 Barcelona www.medeas.eu [email protected] T +34 93 230 95 00 F +34 93 230 95 55
This project has received funding from the European Union’s Horizon 2020 research and innovation programme under grant agreement No 691287
111
Table 12. MEDEAS_w results (as reported in Deliverable 4.1). Material availability by 2050 for each scenario. Comparison of the cumulative extraction by 2050 with the level of reserves and resources. “x” indicates that cumulated extraction > reserves/resources.
Element SSP2-Business as usual (BAU) SSP2-Optimum level transition
(OLT)
Reserves Resources Reserves Resources
Aluminium
Cadmium X X
Chromium X X
Copper X
Galium X X
Indium X X X
Iron
Lithium X
Magnesium
Manganese X X X
Molybdenum
Neodymium
Nickel X
Lead X X
Silver X X
Tin X X
Tellurium X X X X
Titanium
Vanadium
Zinc X X
Pg. Marítim de la Barceloneta, 37-49 08003 Barcelona www.medeas.eu [email protected] T +34 93 230 95 00 F +34 93 230 95 55
This project has received funding from the European Union’s Horizon 2020 research and innovation programme under grant agreement No 691287
112
3.4. References
Alonso, E., Sherman, A.M., Wallington, T.J., Everson, M.P., Field, F.R., Roth, R. and Kirchain, R.E.,
2012. Evaluating rare earth element availability: A case with revolutionary demand from clean
technologies. Environmental Science & Technology. 46(6): 3406-3414.
APS, 2011. Energy Critical Elements: Securing Materials for Emerging Technologies, American
Physical Society Panel on Public Affairs and the Materials Research Society.
Bade, Roger, 2010. Rare earths review – Is the hype justified? Libertas Capital Corporate Finance
Limited, 79, accessed June 8, 2017, at https://www.slideshare.net/RareEarthsRareMetals/libertas-
rareearthreview
Binnemans, K., Jones, P.T., Van Acker, K., Blanpain, B., Mishra, B. and Apelian, D., 2013a. Rare-earth
economics: the balance problem. Journal of the Minerals, Metals & Materials Society (Jom). 65 (7):
846-848.
Binnemans, K., Jones, P.T., Blanpain, B., Van Gerven, T., Yang, Y., Walton, A. and Buchert, M., 2013b.
Recycling of rare earths: a critical review. Journal of Cleaner Production. 51: 1-22.
Bloomberg New Energy Finance, 2017, Global trends in clean energy investment, Bloomberg New
Energy Finance, London, UK
Brück, E., Tegus, O., Thanh, D.C. and Buschow, K.H.J., 2007. Magnetocaloric refrigeration near room
temperature. Journal of Magnetism and Magnetic Materials. 310 (2): 2793-2799.
Calvo, G., Valero, A. and Valero, A., 2017. Assessing maximum production peak and resource
availability of non-fuel mineral resources: Analyzing the influence of extractable global resources.
Resources, Conservation and Recycling. 125: 208-217.
Cameco, 2010, ‘Uranium 101: Markets’, Cameco (March 2010)
Campbell, Max, and Keane, Chris, 2010, Rare earth colorants: Ceramics Today, accessed June 8,
2017, at http://www.ceramicstoday.com/articles/lanthanides.htm.
Castor, S.B. and Hedrick, J.B., 2006. Rare earth elements. Industrial minerals volume, 7th edition:
Society for mining, metallurgy, and exploration, Littleton, Colorado, 769-792.
CIRCE (Research Centre for Energy Resources and Consumption) (2016). Raw materials: production,
reserves, resources, uses and recycling. Hubbert peaks and future production. Guiding European
Policy toward a low-carbon economy. Barcelona: MEDEAS, 242-288.
Pg. Marítim de la Barceloneta, 37-49 08003 Barcelona www.medeas.eu [email protected] T +34 93 230 95 00 F +34 93 230 95 55
This project has received funding from the European Union’s Horizon 2020 research and innovation programme under grant agreement No 691287
113
Church, S.. 2017. America's Only Rare Earth Mine Is Stuck in a Distressed Debt Dispute. Bloomberg,
accessed Sept 01, 2017, at https://www.bloomberg.com/news/articles/2017-06-22/the-distressed-
debt-standoff-over-america-s-only-rare-earth-mine.
Convery, F., Redmond, L., 2007, Market and Price Developments in the European Union Emissions
Trading Scheme, Review of Environmental Economics and Policy, 1 (1), 88-111
Cox, C., 2010. Rare Earths: Facing New Challenges in the New Decade. In SME Annual Meeting.
Dieckmann, J., 2007. Magnetic refrigeration. American Society of Heating, Refrigerating and Air-
Conditioning Engineers (ASHRAE) Journal, 49(8), 74.
Dittmar, M., 2009. The Future of Nuclear Energy: Facts and Fiction Chapter II: What is known about
Secondary Uranium Resources?.
Du, X. and Graedel, T.E., 2011. Uncovering the global life cycles of the rare earth elements. Nature:
Scientific reports. 1 (145): 1-4.
Du, X. and Graedel, T.E., 2013. Uncovering the end uses of the rare earth elements. Science of the
Total Environment, 461, 781-784.
European Commission. 2014. “Report on Critical Raw Materials for the EU, Report of the Ad hoc
Working Group on Defining Critical Raw Materials.” Brussels.
Frankfurt School-UNEP Centre, 2013. Global Trends in Renewable Energy Investment 2013.
Frankfurt School-UNEP Centre & Bloomberg New Energy Finance.
Golev, A., Scott, M., Erskine, P.D., Ali, S.H. and Ballantyne, G.R., 2014. Rare earths supply chains:
Current status, constraints and opportunities. Resources Policy. 41: 52-59.
Goonan, T.G., 2011. Rare earth elements: End use and recyclability (No. 2011-5094). US Geological
Survey.
Graedel, T.E., Allwood, J., Birat, J.P., Buchert, M., Hagelüken, C., Reck, B.K., Sibley, S.F. and
Sonnemann, G., 2011. What do we know about metal recycling rates?. Journal of Industrial Ecology.
15 (3): 355-366.
Guanming, Q., Xikum, L., Tai, Q., Haitao, Z., Honghao, Y. and Ruiting, M., 2007. Application of rare
earths in advanced ceramic materials. Journal of Rare Earths. 25: 281-286.
Habib, K. and Wenzel, H., 2014. Exploring rare earths supply constraints for the emerging clean
energy technologies and the role of recycling. Journal of Cleaner Production. 84: 348-359.
Haque, N., Hughes, A., Lim, S. and Vernon, C., 2014. Rare earth elements: Overview of mining,
mineralogy, uses, sustainability and environmental impact. Resources. 3 (4): 614-635.
Pg. Marítim de la Barceloneta, 37-49 08003 Barcelona www.medeas.eu [email protected] T +34 93 230 95 00 F +34 93 230 95 55
This project has received funding from the European Union’s Horizon 2020 research and innovation programme under grant agreement No 691287
114
Haxel, G.B., Hedrick, J.B., Orris, G.J., Stauffer, P.H. and Hendley II, J.W., 2002. Rare earth elements:
critical resources for high technology (No. 087-02).
Henderson, P., Gluyas, J., Gunn, G., Wall, F. and Woolley, A., 2013. Rare earth elements briefing
note. The Geological Society of London.
Hubbert, M.K., 1962. Energy resources: a report to the Committee on Natural Resources of the
National Academy of Sciences--National Research Council. National Academy of Sciences-National
Research Council, Washington, DC (USA).
Humphries, M., 2012. Rare earth elements: the global supply chain. Congressional Research Service,
2011, https://fas.org/sgp/crs/natsec/R41347.pdf
IAEA, 2001. Analysis of Uranium Supply to 2050, International Atomic Energy Agency, Vienna.
IEA, 2009. World Energy Outlook 2009. International Energy Agency.
Kanazawa, Y. and Kamitani, M., 2006. Rare earth minerals and resources in the world. Journal of
Alloys and Compounds. 408, 1339-1343.
Kara, H., Chapman, A., Crichton, T., Willis, P. and Morley, W., 2010. Lanthanide resources and
alternatives: a report for Department for Transport and Department for Business, Innovation and
Skills. Aylesbury, UK, Oakdene Hollins.
Kingsnorth, D.J., 2010, February. Rare earths: facing new challenges in the new decade. In SME
Annual Meeting (Vol. 8).
Krishnamurthy, N. and Gupta, C.K., 2004. Extractive metallurgy of rare earths. CRC press, London,
UK.
Linnenluecke, M.K., Smith, T., McKnight, B., 2016. Environmental finance: a research agenda for
interdisciplinary finance research. Economic Modelling. 59: 124-130.
Lusty, P. and Walters, A., 2010. Rare earth elements., British Geological Society, London, UK,
https://www.bgs.ac.uk/downloads/start.cfm?id=1638
Lynas Corporation Ltd: Rare Earths. J.P. Morgan. Australia Corporate Access Days. New York 27-28
September 2010, accessed June 15,
athttp://www.asx.com.au/asxpdf/20100927/pdf/31sqqzmv0ng1tb.pdf
Massari, S. and Ruberti, M., 2013. Rare earth elements as critical raw materials: Focus on
international markets and future strategies. Resources Policy. 38 (1): 36-43.
Pg. Marítim de la Barceloneta, 37-49 08003 Barcelona www.medeas.eu [email protected] T +34 93 230 95 00 F +34 93 230 95 55
This project has received funding from the European Union’s Horizon 2020 research and innovation programme under grant agreement No 691287
115
Monson, T.C., Zheng, B., Zhou, Y., Lavernia, E.J., Pearce, C.J. and Atcitty, S., 2015. Fabrication of iron
nitride based soft magnets for transformer cores. Sandia National Laboratories (SNL-NM),
Albuquerque, NM (United States); Sandia National Laboratories, Livermore, CA.
Moss, R.L., Tzimas, E., Kara, H., Willis, P. and Kooroshy, J., 2011. Critical metals in strategic energy
technologies. Assessing rare metals as supply-chain bottlenecks in low-carbon energy technologies
(No. EUR--24884-EN-2011). Institute for Energy and Transport IET.
Moss, R. L., Willis, P., Tercero, E.L., Tzimas, E., Arendorf, J., Thompson, P., Chapman, A., et al., 2013.
Critical Metals in the Path towards the Decarbonisation of the EU Energy Sector: Assessing Rare
Metals as Supply-Chain Bottlenecks in Low-Carbon Energy Technologies. Petten, Netherlands:
European Commission Joint Research Centre: Institute for Energy and Transport.
Ober, J.A., 2017. Mineral commodity summaries 2017. US Geological Survey.
Outsider Club, 2019, Special Report: 2019 Nuclear and Uranium Stocks: 6 High-Powered
Investments, Outsider Club, Baltimore, USA, https://www.outsiderclub.com/report/2019-nuclear-
and-uranium-stocks-6-high-powered-investments/957
Pillot, C., 2009, September. Present and future market situation for batteries. In 14th International
Congress for Battery Recycling, Geneva.
Reisch M. 2011. Rhodia, Umicore to recycle Rare Earths. Chemical and Engineering News. 89(26):
16.
Roskill, 2017, Market Reports, Roskill Information Services, London, UK. https://roskill.com/market-
reports/
Schüler, D., Buchert, M., Liu, R., Dittrich, S. and Merz, C., 2011. Study on rare earths and their
recycling. Öko-Institut eV Darmstadt.
Speirs, J., Houari, Y., Contestabile, M., Gross, R. and Gross, B., 2013. Materials availability: Potential
constraints to the future low‐carbon economy—Working Paper II: Batteries, magnets and materials.
UK Energy Research Centre.
Taylor, P., 2010. Energy technology perspectives 2010–scenarios and strategies to 2050.
International Energy Agency, Paris, 74.
Vikström, H., Davidsson, S. and Höök, M., 2013. Lithium availability and future production outlooks.
Applied Energy. 110: 252-266.
Vivid Economics, 2014, Financing Green Growth, June, 2014, Vivid Economics, London, UK.
Pg. Marítim de la Barceloneta, 37-49 08003 Barcelona www.medeas.eu [email protected] T +34 93 230 95 00 F +34 93 230 95 55
This project has received funding from the European Union’s Horizon 2020 research and innovation programme under grant agreement No 691287
116
Weber, R.J. and Reisman, D.J., 2012. Rare earth elements: A review of production, processing,
recycling, and associated environmental issues. US EPA Region.
WEF, 2011, The Green Investing 2011: Reducing the Cost of Financing. World Economic Forum.
World Bank Group, 2017. The Growing Role of Minerals and Metals for a Low Carbon Future. World
Bank Group, Washington DC.
World Nuclear Association, 2011, World Uranium Mining (December 2011)
Wübbeke, J., 2013. Rare earth elements in China: Policies and narratives of reinventing an industry.
Resources Policy. 38 (3): 384-394.
Zhang, L., Qing, G.U.O., Zhang, J., Huang, Y. and Xiong, T., 2015. Did China׳ s rare earth export policies
work?—Empirical evidence from USA and Japan. Resources Policy. 43: 82-90.
Zhanheng, C.H.E.N., 2011. Global rare earth resources and scenarios of future rare earth industry.
Journal of Rare Earths. 29 (1): 1-6.
Pg. Marítim de la Barceloneta, 37-49 08003 Barcelona www.medeas.eu [email protected] T +34 93 230 95 00 F +34 93 230 95 55
This project has received funding from the European Union’s Horizon 2020 research and innovation programme under grant agreement No 691287
117
4. Financing cross-border electricity infra-
structure required for RES transition
List of abbreviations and acronyms
ACER Agency for the Cooperation of Energy Regulators
BEMIP Baltic Energy Market Interconnection Plan
BRELL Belarus Russia Estonia Lithuania Latvia
BRUA Bulgaria-Romania-Hungary-Austria
CACM Capacity Allocation and Congestion Management
CAPEX capital expenditure
CBA Cost Benefit Allocation
CBCA Cross-Border Cost Allocation
CCGT Combined-Cycle Gas Turbines
CEEP Central Europe Energy Partners
CEER Council of European Energy Regulators
CEF Connecting Europe Facility
CFD Contract for Difference
COBRA Copenhagen-Brussels-Amsterdam subsea cable
CRM Capacity Remuneration Mechanism
DSO Distribution System Operators
EC European Commission
ECJ European Court of Justice
Pg. Marítim de la Barceloneta, 37-49 08003 Barcelona www.medeas.eu [email protected] T +34 93 230 95 00 F +34 93 230 95 55
This project has received funding from the European Union’s Horizon 2020 research and innovation programme under grant agreement No 691287
118
EI Equity Instrument
EIB European Investment Bank
EPC Engineering, Procurement and Construction
EROI Energy Return on Investment
EUCO European Council energy scenarios
EEPR European Energy Programme for Recovery
EFSI European Fund for Strategic Investments
ENTSO-E European Network of Transmission System Operators for Electricity
FiT Feed-in Tariff
FTR Financial Transmission Rights
HVAC High-Voltage Alternating Current
HVDC High-Voltage Direct Current
IEA International Energy Agency
INEA EU Innovation & Networks Executive Agency
ITRE European Parliament’s Committee on Industry, Research and Energy
ITC Inter-TSO Compensation
LCC Line-Commuted Convertors
LRIC Long Run Incremental Cost
MFF Multiannual Financial Framework
MOG meshed offshore grid
OHL Overhead Lines
OPEX operating expenditure
Pg. Marítim de la Barceloneta, 37-49 08003 Barcelona www.medeas.eu [email protected] T +34 93 230 95 00 F +34 93 230 95 55
This project has received funding from the European Union’s Horizon 2020 research and innovation programme under grant agreement No 691287
119
OfTO Offshore Transmission Owner
PBCE Project Bond Credit Enhancement
PCI Project of Common Interest
PCR Price Coupling of Regions (day-ahead market)
PFI public financial institutions
PRIMES European energy and climate model
PX Power Exchange
RAB Regulated Asset Base
RSC ENTSO-E Regional Security Coordinators
SWD European Commission Staff Working Document
SWF Sovereign Wealth Fund
TCFD Taskforce on Climate-related Financial Disclosures
TOTEX total expenditure
TYNDP Ten Year Network Development Plan
VSC Voltage Source Convertor
WACC Weighted Average Cost of Capital
XBID Cross-border IntraDay Market
Pg. Marítim de la Barceloneta, 37-49 08003 Barcelona www.medeas.eu [email protected] T +34 93 230 95 00 F +34 93 230 95 55
This project has received funding from the European Union’s Horizon 2020 research and innovation programme under grant agreement No 691287
120
4.1. Introduction
A largescale expansion of renewable energy, as envisioned by the MEDEAS model OLT, will require
additional cross-border electricity infrastructure due to the day/night/seasonal intermittency of
wind and solar energy and the geographic constraints for tidal, hydro and storage technologies, as
well as the geographic dispersion of population centres, large cities and industry. For example, some
countries will produce a surplus of wind or solar energy at certain times, which could usefully be
exported to other countries, in order to limit curtailment and balance out the grid supply and
demand. This needed infrastructure includes inter alia grid reinforcement, storage and
interconnectors.
Several reports and studies have calculated the amount of additional infrastructure needed. There
is additionally a rich literature identifying a gap in this infrastructure investment. The investment
gap here is defined as the difference between BAU calculations/scenarios based on previous funding
patterns and the finance required to build the infrastructure for largescale renewable energy
expansion (E3G, 2014), in our case MEDEAS OLT. This is made even more urgent by predicted wind
and solar energy change patterns due to climate change, which are detailed in Chapter 2.
This chapter is based on a state of the art literature review and a workshop with practitioners that
was held in London. The full description of the workshop discussions, which informed some of the
following subchapters, are in the Appendix. Infrastructure finance and crossborder legislations cost-
benefit discussions among member states are not represented in the MEDEAS model. The MEDEAS
model lacks the regional and temporal resolution to adequately represent RES intermittency.
Pg. Marítim de la Barceloneta, 37-49 08003 Barcelona www.medeas.eu [email protected] T +34 93 230 95 00 F +34 93 230 95 55
This project has received funding from the European Union’s Horizon 2020 research and innovation programme under grant agreement No 691287
121
4.2. Projects of Common Interest (PCIs)
Since 2013, the European Commission publishes a list every two years of Projects of Common
Interest (PCI). Energy infrastructure projects must lead to an energy market integration in at least
two EU member countries to qualify. Since 2015, an additional “special PCI” status has existed – the
“e-highways” (van Renssen, 2015).
Qualifying as a PCI, an infrastructure project can ask for financing from several EU pots, such as the
Connecting Europe Facility (CEF). A designated PCI project is supposed to benefit from fast-tracked
environmental impact assessment and overall permitting procedures, which in theory are supposed
to be granted a maximum of 3.5 years after the application. Overall, the average time to get a permit
to build a new high voltage line was 7 years, with one quarter of all permits taking more than 15
years to be granted.
Additionally, the PCI status conferment provides a signal boost to investors. EU funding available to
PCIs is however “increasingly shifting to repayable financial instruments rather than grants.”
(Ammermann, H. et al., 2016, p. 8)
Member states are required since 2014 to inform the European Commission of any planned
infrastructure for the next five years. Based on this, the European Commission composes a report
every two years on the European energy systems and any gaps in infrastructure that may arise.
However, in the past the member state data provided has been of poor quality (van Nuffel,
Rademaekers and Yearwood et al., European Energy Investments, 2017, p. 55). As a 2017 report to
the European Parliament’s Committee on Industry, Research and Energy (ITRE) notes, “EU
legislation regarding investment plans is rather limited. […] for investments in ‘national’ grid assets,
there is no EU level legal provision which obliges grid operators or national authorities to establish
investment plans. This issue is dealt with at national level.” (van Nuffel, Rademaekers and Yearwood
et al., European Energy Investments, 2017, p. 86)
In its 2015 progress report on the state of PCIs, the Agency for the Cooperation of Energy Regulators
(ACER) identified significant delays in many PCIs. A key reason for these delays in project completion
and delivery were issues relating to financing. The Ten-Year Network Development Plan 2018
reported that of 329 projects, 120 projects were “delayed” or “rescheduled” investments. In
addition to funding and issues of public opposition, authorisation for cross-border projects is
another hurdle. As aforementioned, according to EU rules all PCI should receive all necessary
authorisations within 3.5 years, but this is still not always being met (ENTSO-E, 2018c, p. 47). One of
the more extreme delays were experienced by an interconnector between Lithuania and Poland
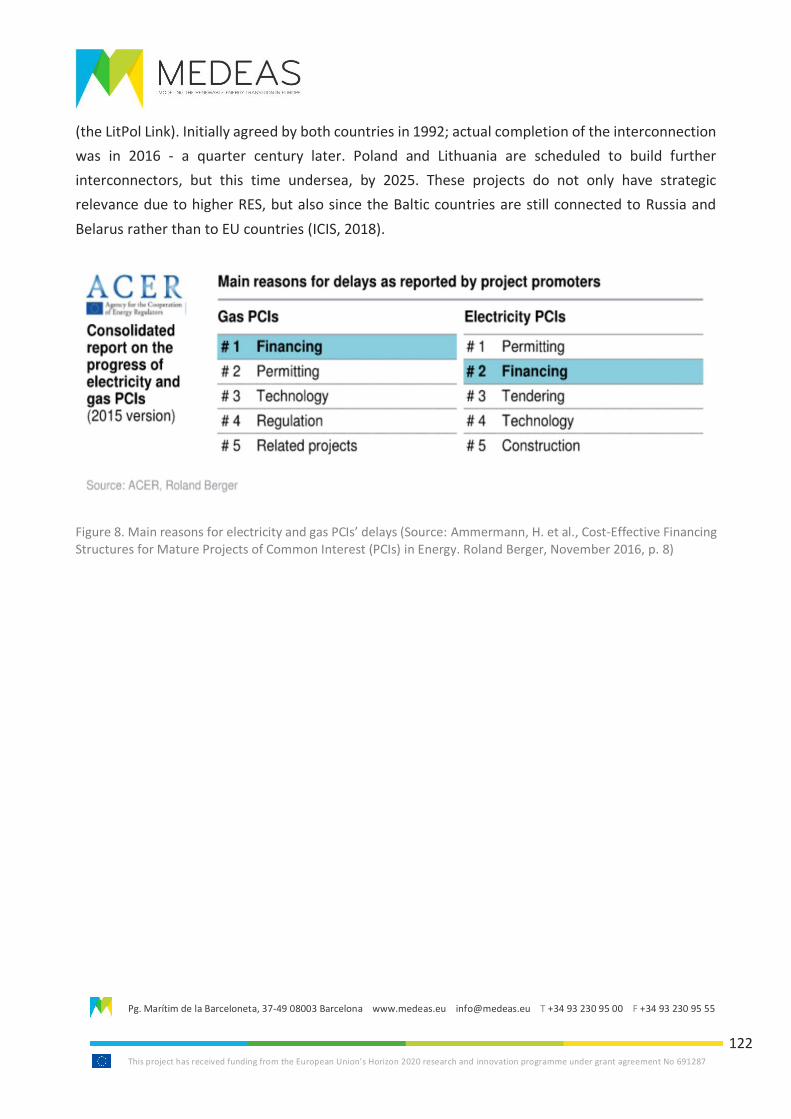
Pg. Marítim de la Barceloneta, 37-49 08003 Barcelona www.medeas.eu [email protected] T +34 93 230 95 00 F +34 93 230 95 55
This project has received funding from the European Union’s Horizon 2020 research and innovation programme under grant agreement No 691287
122
(the LitPol Link). Initially agreed by both countries in 1992; actual completion of the interconnection
was in 2016 - a quarter century later. Poland and Lithuania are scheduled to build further
interconnectors, but this time undersea, by 2025. These projects do not only have strategic
relevance due to higher RES, but also since the Baltic countries are still connected to Russia and
Belarus rather than to EU countries (ICIS, 2018).
Figure 8. Main reasons for electricity and gas PCIs’ delays (Source: Ammermann, H. et al., Cost-Effective Financing Structures for Mature Projects of Common Interest (PCIs) in Energy. Roland Berger, November 2016, p. 8)
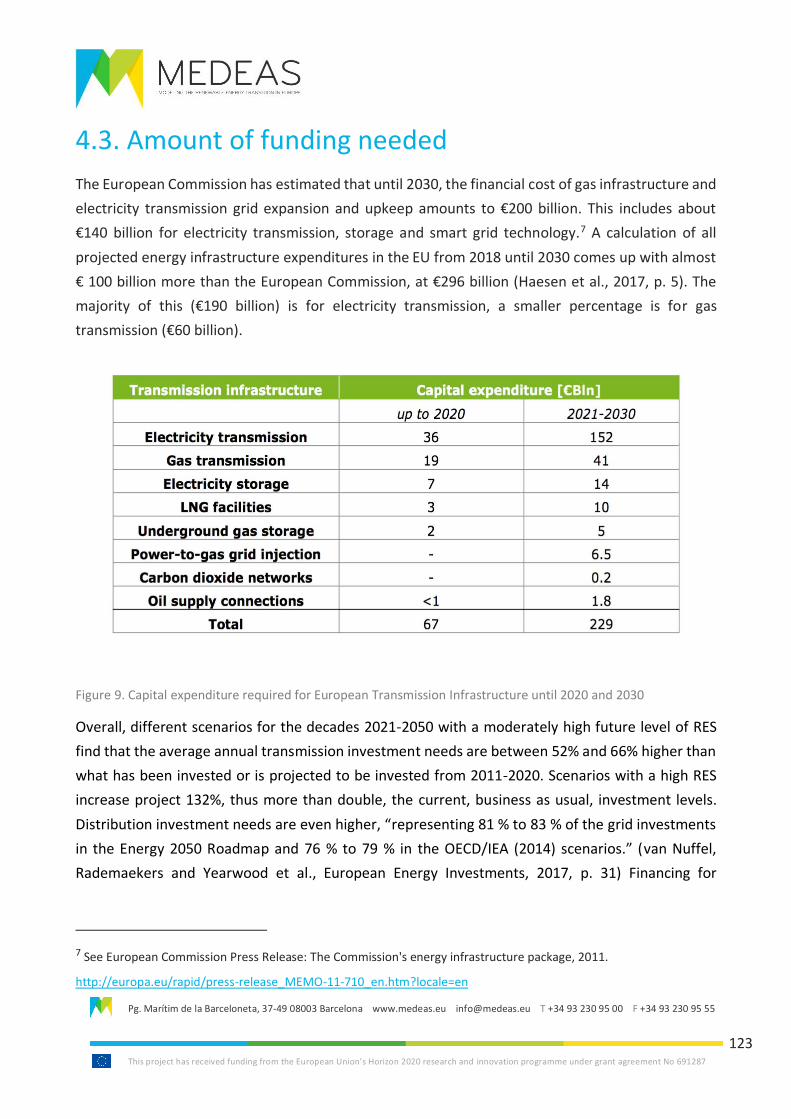
Pg. Marítim de la Barceloneta, 37-49 08003 Barcelona www.medeas.eu [email protected] T +34 93 230 95 00 F +34 93 230 95 55
This project has received funding from the European Union’s Horizon 2020 research and innovation programme under grant agreement No 691287
123
4.3. Amount of funding needed
The European Commission has estimated that until 2030, the financial cost of gas infrastructure and
electricity transmission grid expansion and upkeep amounts to €200 billion. This includes about
€140 billion for electricity transmission, storage and smart grid technology.7 A calculation of all
projected energy infrastructure expenditures in the EU from 2018 until 2030 comes up with almost
€ 100 billion more than the European Commission, at €296 billion (Haesen et al., 2017, p. 5). The
majority of this (€190 billion) is for electricity transmission, a smaller percentage is for gas
transmission (€60 billion).
Figure 9. Capital expenditure required for European Transmission Infrastructure until 2020 and 2030
Overall, different scenarios for the decades 2021-2050 with a moderately high future level of RES
find that the average annual transmission investment needs are between 52% and 66% higher than
what has been invested or is projected to be invested from 2011-2020. Scenarios with a high RES
increase project 132%, thus more than double, the current, business as usual, investment levels.
Distribution investment needs are even higher, “representing 81 % to 83 % of the grid investments
in the Energy 2050 Roadmap and 76 % to 79 % in the OECD/IEA (2014) scenarios.” (van Nuffel,
Rademaekers and Yearwood et al., European Energy Investments, 2017, p. 31) Financing for
7 See European Commission Press Release: The Commission's energy infrastructure package, 2011.
http://europa.eu/rapid/press-release_MEMO-11-710_en.htm?locale=en
Pg. Marítim de la Barceloneta, 37-49 08003 Barcelona www.medeas.eu [email protected] T +34 93 230 95 00 F +34 93 230 95 55
This project has received funding from the European Union’s Horizon 2020 research and innovation programme under grant agreement No 691287
124
interconnectors would need to go up by a factor of between 4 or 2 from currently about between
0.9 to 1.5 billion € annually to 3.6 billion € per year.
In their 2012 analysis of annual investment needs from 2012-2020, E3G concluded that each year
€14 billion should be invested in electric grids in the EU and between €37 billion and €45 billion in
other renewable energy infrastructure (Holmes et al. 2012, p. 19). A 2018 ITRE study came to the
figures of €34 billion annually for grids until 2030 and another €2 billion annually (thus €36 billion)
each year until 2030 for grid infrastructure “if the EU’s 2030 climate and energy targets are to be
achieved. […] The investment needs for distribution are generally much higher than for
transmission. The largest share of the costs is related to the upgrade and extension of the
distribution networks and the development of smart grids. Investment needs in interconnectors are
expected to rise steeply given the high renewables share under the EUCO30 scenario.” (Williams et
al., ITRE, 2018, p. 22) (These figures include both transmission and distribution costs.)
The investment needs in grid capacity are of course lower for more ambitious energy efficiency
targets as less energy would need to be transmitted. For the EUCO40 scenario (E3MLab and IIASA,
Technical Report on EUCO scenarios, 2016), thus 40% GHG emissions reduction by 2030 compared
to the 2005 baseline GHG emissions level and an improvement of energy efficiency through e.g.
strong housing insulation and similar policies, would according to one analysis require €26 billion
grid infrastructure investments per year from 2021-2030 (Amending Directive 2012/27/EU on
Energy Efficiency, SWD (2016) 405, p. 66).
In the 2012 Ten-Year Network Development Plan, a total of € 104 billion expected investments for
electricity infrastructure projects of pan-European significance for the decade 2012-2022 were
delignated. About one fourth of this, € 23 billion, were for subsea cables. The agreed investments
for the decade until 2022 were thus only about one third of the sum needed for the near future.
One third of all expected investments were by Germany alone (€ 30 billion). Next in magnitude of
investment were the UK (€19 billion), France (about €9 billion), Italy (€7 billion), Norway (€6.5
million) and Spain (about €5 billion). Thus over two thirds of all expected investments were for six
of the 28 countries (Connecting Europe Facility, p. 8). In the 2014 Ten Year Network Development
Plan (TYNDP), Germany and the UK represented half of all planned investments – most of this due
to an increase of intermittent RES in these two states’ energy mixes (van Nuffel, Rademaekers and
Yearwood et al., European Energy Investments, 2017, p. 88). The TYNPD 2014 and TYNPD 2016
identified about €150 billion in grid investments until 2030 for about 200 projects.
Regarding specific priority projects, the following investment shortfalls until 2030 were calculated
in 2012 by the European Commission using the forecasting tool PRIMES:
Pg. Marítim de la Barceloneta, 37-49 08003 Barcelona www.medeas.eu [email protected] T +34 93 230 95 00 F +34 93 230 95 55
This project has received funding from the European Union’s Horizon 2020 research and innovation programme under grant agreement No 691287
125
1. Northern Sea offshore grid: €8 billion finance gap (about one third of the overall €30 billion
needed)
2. North-South electricity interconnections in Western Europe: €5 billion lacking (€30 billion
needed overall)
3. North-South electricity interconnections in Central Eastern and South Eastern Europe: €12
billion shortfall (of €40 billion needed overall)
4. Baltic Energy Market Interconnection Plan: €3 billion more needed (more than half, €5 billion
needed overall).8
PRIMES estimates overall that between €125 billion and €148 billion will be needed until 2030 and
between €300 billion and €420 billion until 2050. This would add about 1% to the electricity bill over
15 years – which at first glance does not seem that dramatic. On the other hand, this would mean
more than doubling of investments for many TSOs (Expert Group, 2017).
A study of Chalmers University assessed EU interconnection required for four scenarios until 2030,
2040 and 2050. The scenarios are
1. Reference (BAU, existing policies)
2. Regional, based on EC Roadmap scenario “Energy efficiency”
3. Climate, focus on CO2 emissions reduction and not on RES or efficiency, based on EC scenario
“Diversified supply technologies” (EC, 2011) and “Powerchoices Reloaded” scenario analysis
initiated by Eurelectric (2013)
4. Green, high RES (p. 12).
The consortium finds that Climate requires about 220 GW by 2050 (REFscenario predicted is about
110 GW – thus this also predicts a shortfall of half the capacity) and Green would require 300 GW
by 2050 (Odenberger, Unger and Johnsson, 2015, p. 20).
8 See European Commission, Connecting Europe- Infrastructure of Tomorrow, undated, p. 8.
https://hub.globalccsinstitute.com/sites/default/files/publications/138028/connecting-europe-energy-infrastrucutre-tomorrow.pdf
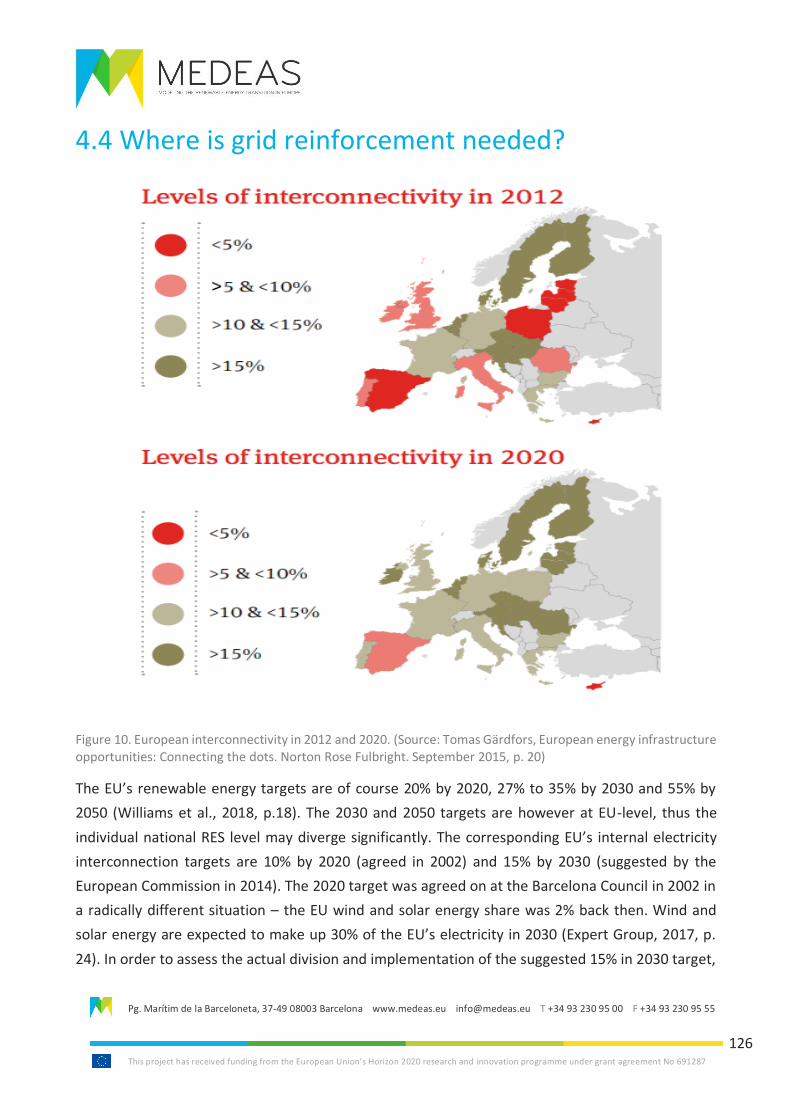
Pg. Marítim de la Barceloneta, 37-49 08003 Barcelona www.medeas.eu [email protected] T +34 93 230 95 00 F +34 93 230 95 55
This project has received funding from the European Union’s Horizon 2020 research and innovation programme under grant agreement No 691287
126
4.4 Where is grid reinforcement needed?
Figure 10. European interconnectivity in 2012 and 2020. (Source: Tomas Gärdfors, European energy infrastructure opportunities: Connecting the dots. Norton Rose Fulbright. September 2015, p. 20)
The EU’s renewable energy targets are of course 20% by 2020, 27% to 35% by 2030 and 55% by
2050 (Williams et al., 2018, p.18). The 2030 and 2050 targets are however at EU-level, thus the
individual national RES level may diverge significantly. The corresponding EU’s internal electricity
interconnection targets are 10% by 2020 (agreed in 2002) and 15% by 2030 (suggested by the
European Commission in 2014). The 2020 target was agreed on at the Barcelona Council in 2002 in
a radically different situation – the EU wind and solar energy share was 2% back then. Wind and
solar energy are expected to make up 30% of the EU’s electricity in 2030 (Expert Group, 2017, p.
24). In order to assess the actual division and implementation of the suggested 15% in 2030 target,
Pg. Marítim de la Barceloneta, 37-49 08003 Barcelona www.medeas.eu [email protected] T +34 93 230 95 00 F +34 93 230 95 55
This project has received funding from the European Union’s Horizon 2020 research and innovation programme under grant agreement No 691287
127
the European Commission set up the Expert Group on Electricity Interconnection Targets in 2016.9
The Expert Group suggested in their 2017 report to replace the 15% target with these three
principles:
1. “Additional interconnections should be prioritized if the price difference between relevant
bidding zones, countries or regions exceeds 2€/MWh.”
2. “In case the nominal transmission capacity of interconnectors is below 30% of their peak
load, Member States should investigate options for additional interconnectors.” (TYNDP
2018 Executive Report Connecting Europe: Electricity, p. 34)
3. “In countries where the nominal transmission capacity of interconnectors is below 30% of
their renewable installed generation capacity options for further interconnectors should
urgently be investigated.” (Expert Group, 2017, p. 7)
In their deliberations, the Expert Group highlighted the difference between net transfer capacity
(what the 2020 target agreed in 2002 was based on) and nominal transmission capacity. Net transfer
capacity concerns the physical transmission capacity of a meshed network, which can be best
calculated at the borders of bidding zones, where price differentials exist. This means that it is
influenced by market design and RES subsidies etc. The nominal transmission capacity instead
regards the physical capacity of a cross-border interconnector. This can be measured anywhere in
the grid. The Expert Group concludes that 2030 calculations for interconnectivity targets should take
into account the ratio of the nominal transmission capacity to the peak load (Expert Group, 2017, p.
27).
While the absolute, overall interconnection capacity has steadily been augmented in some member
states, due to the aforementioned increase in installed RES capacity, the relative levels of
interconnection have actually deteriorated in most EU countries; in Belgium, Bulgaria, Croatia,
Estonia, Finland, France, Germany, Greece, Ireland, Italy, Luxemburg, Latvia, Slovakia, Sweden and
the UK. Assuming PCIs agreed by 2017 are implemented on time (unrealistic, as many are delayed),
the interconnection capacity target of 10% in 2020 which was agreed in 2002, will be missed by
Cyprus, Malta, Spain and Poland. Bulgaria, France, Germany, Ireland, Italy and the UK are expected
9 See Composition of the Expert Group:
https://ec.europa.eu/energy/sites/ener/files/documents/composition_of_the_expert_group.pdf
Pg. Marítim de la Barceloneta, 37-49 08003 Barcelona www.medeas.eu [email protected] T +34 93 230 95 00 F +34 93 230 95 55
This project has received funding from the European Union’s Horizon 2020 research and innovation programme under grant agreement No 691287
128
to reach the 2020 target, but not by a very large margin (van Nuffel, Rademaekers and Yearwood et
al., European Energy Investments, 2017, p. 24).
Malta had no interconnection whatsoever until 2015, when the subsea cable to Ragusa, Sicily, was
completed after a delay of four years (Puka, Szulecki, 2014, p. 126 and Micallef, 2011). The last EU
member state to be isolated from an electricity standpoint is Cyprus, which still has no connection
whatsoever. Both Cyprus and Crete, which also has no interconnection, have high wind and solar
power potential, yet rely almost exclusively on oil to produce power (and thus have some of
Europe’s highest electricity prices). Islands, such as Great Britain, Ireland, Crete, Cyprus, Malta and
Sicily, require more expensive underwater HDVC cables to be connected to other countries (Dutton,
Lookwood, 2017, p. 377).
The PCI EuroAsia Interconnector is supposed to change Cyprus’ and Crete’s isolation by building an
interconnection between Crete, Cyprus and Israel by 2023 (Hu et al. 2017). Discussions between
Cyprus and Greece however broke down in November 2018 (Michapopoulos, 2018). In January
2019, a tender for €3.5 billion related to the EuroAsia Interconnector was published (Hazou, 2019).
Using the Expert Group’s three suggested principles instead of a blanket percentage interconnection
target, the situation still requires large-scale grid augmentation:
“large marginal cost difference (>2€/MWh) appears for all European borders in ST [susta inable
transition- least ambitious of the scenarios, close to BAU, reduction through EU-ETS] and DG
[distributed generation- decentralised RES] scenarios and in most of European borders in EUCO
scenario [30% energy efficiency scenario], […] [We] highlight the need for additional interconnection
development apart from the existing interconnection grid (projects commissioned by 2020).
Regarding security of supply and RES integration criteria, existing interconnection grid shows
additional needs for interconnection development to be most urgent in Spain, Great Britain, Ireland,
Italy, Greece and Finland in all scenarios and in France, Romania and Poland in DG scenario.” (TYPND
2018, p. 34)
If one takes into account all agreed projects up until 2027, Spain, UK, Poland and Italy require urgent
further interconnection. This need for further interconnection continues through 2040. The Expert
Group itself found further (or in the case of Cyprus any) interconnection for Spain, Greece, the UK,
Ireland, Italy and Cyprus most critical (ExpertGroup, 2016, p. 39). Generally, these most critical areas
are referred to as “electric peninsulas” (a term also employed by ENTSO-E): “1. the Baltic States, 2.
the Iberian Peninsula, 3. Italy, and 4. The British isles, Great Britain and Ireland. These ‘electric
peninsulas’ have a high renewable generation development potential, which will be constrained in
Pg. Marítim de la Barceloneta, 37-49 08003 Barcelona www.medeas.eu [email protected] T +34 93 230 95 00 F +34 93 230 95 55
This project has received funding from the European Union’s Horizon 2020 research and innovation programme under grant agreement No 691287
129
the long-term if interconnection capacity is not increased up to 10 times, in the case of the Iberian
Peninsula’s connection to mainland Europe, or at least doubled, in the other regions.”(Loureiro,
Claro and Fischbeck, 2019, p.194)
In addition, there is the “offshore triangle”, with the corner points being the UK, northern Germany
and southern Norway: “we see a North-South corridor going through France to link electric
peninsulas and share wind in the north and solar in the south, as well as a triangle around the North
Sea to bring back the offshore wind to the continent.” (Silva et al., 2017, p. 172)
The TEN-E (Trans-European Networks for Energy) have designated four priority electricity infrastructure corridors. These each meet in a Regional Group to assess potential PCIs:
1. North Seas offshore grid
2. North-South Interconnections in Western Europe (Iberian peninsula)
3. North-South Interconnections in Eastern Europe
4. Baltic Energy Market Interconnection Plan (BEMIP).10
In 2015, the E-Highways research project (which includes ENTSO-E, many TSOs and dena)
considered several future decarbonisation scenarios for the EU in 2050:
1. fossil & nuclear - almost all decarbonisation achieved through nuclear energy and CCS, wind
and solar energy together 22%. Fossil-derived energy: 33%
2. big & market – largescale centralised electricity projects dominate, wind and solar together
32%. Fossil-derived energy: 18%
3. large-scale RES – high electricity demand, low energy efficiency, largescale RES projects,
wind and solar: 54%. Fossil-derived energy: 5%
4. small & local RES – low electricity demand, low GDP, lower electricity demand, high energy
efficiency, wind and solar: 51%. Fossil-derived energy: 4%
5. 100% RES – No nuclear or fossil-derived energy. Wind and solar: 76%. Biomass: 9% (Sanchis,
2015, p. 13).
All scenarios require North-to-South corridor grid reinforcements (connecting the North Sea,
Scandinavia, the British Isles with Spain and Italy) as well as to northern Germany, Poland, the
10 See European Commission> Energy > Topics > Infrastructure > Projects of Common Interest > Regional Groups and their role in the PCI process > Electricity PCI Regional Groups
https://ec.europa.eu/energy/en/topics/infrastructure/projects-common-interest/regional-groups-and-their-role-pci-process/electricity-pci-regional-groups
Pg. Marítim de la Barceloneta, 37-49 08003 Barcelona www.medeas.eu [email protected] T +34 93 230 95 00 F +34 93 230 95 55
This project has received funding from the European Union’s Horizon 2020 research and innovation programme under grant agreement No 691287
130
Netherlands, Belgium and France. The 100% RES and large-scale RES scenarios require much greater
transmission investments than the other scenarios. The 100% RES scenario also in addition to the
common North South corridors requires a central, continental grid reinforcement (Sanchis, 2015, p.
24). The scenarios with larger RES percentages focus on increased solar energy production in
Greece, Italy, Portugal and Spain and increased wind energy in Greece and in the North Sea including
Scandinavia and the UK (Sanchis, 2015, p. 32). A comparison between the 2013 installed physical
interconnection capacities and the projected 2050 needs show that for the small and local scenario
interconnection capacity would need to double to 300 GW (from 150 GW in 2013) and for the 100%
RES scenario it would need to increase to about 240 GW (Sanchis, 2015, p. 34). Installed generation
would also need to double in the 100% RES scenario.
The E-Highway project also assessed the funds needed for several scenarios, coming to between
€120 billion needed until 2050 if the population can be convinced to accept overhead lines and €250
billion if more expensive DC underground cables have to be employed, for the big & market, fossil
& nuclear and small & local scenarios. For the large-scale RES and 100% RES scenarios, the electricity
infrastructure required would cost almost double that, with €250 billion for overhead lines and €390
billion for DC cables (Sanchis, 2015, p. 35).
Pg. Marítim de la Barceloneta, 37-49 08003 Barcelona www.medeas.eu [email protected] T +34 93 230 95 00 F +34 93 230 95 55
This project has received funding from the European Union’s Horizon 2020 research and innovation programme under grant agreement No 691287
131
4.5. Causes of investment gap
The ITRE report concluded that “the financing gap to achieve the targets and goals associated with
the European energy transition is substantial (ca. 1% of EU-wide GDP on an annual basis between
2021-2030)” and that “Currently, the vast majority of energy expenditure comes from private
investors, as well as (non-EU) public sources in Member States. The volume of EU finance (i.e. from
the EU Budget) is too small to close the financing gap alone; and there appears to be no prospect of
an increase of the order of magnitude likely to change this.” (van Nuffel, Rademaekers and
Yearwood et al., 2017, p.55) Puka and Szulecki (2014) call the investment gap, the difference
between BAU finance and what is needed for a renewable energy transition, the “grid-lock”, while
Cepeda speaks of the “sub-optimality of interconnection investments” (Cepeda, 2018, p. 31).
This under-investment occurs because while interconnection is beneficial from a societal
perspective, there are economic reasons that speak against further funding – there are “winners
and losers” from further cross-border interconnection (Dutton, Lockwood, 2017, p. 376). Usually, a
new interconnector will only be built if there is an electricity price difference between the two
countries. The new interconnection and additional capacity will lower the electricity price in the
importing country.
The entities most often in charge of building additional interconnection are the TSOs. The TSOs
however gain financially from auctioning off the scarce resource transmission capacity at the
borders in times of grid congestion (Puka, Szulecki, 2014, p. 129). The additional capacity creates
competition for existing power companies not involved in the interconnection. It is possible that the
investment undertaken by the firm building the interconnection may be added to the bill of the
country of origin. Cross-border interconnection by its very nature has to traverse different national
and local legal and permit regimes. The EU has been working to streamline this, to create
coordination governance architecture and to disincentivise banking on congestion through a 2003
regulation that stipulates that congestion auction income needs to be re-invested into new
transmission capacity or to lower the grid tariff (Puka, Szulecki, 2014, p. 129). As Lilliestam and
Battaglini (2010) report “In practice, most TSOs choose not to build new interconnectors but to
lower the gridtariffs” (p. 4). Companies are allowed to get a return on investment for their capital
expenditures, since they have to get CAPEX investments signed off by the regulator, but they cannot
receive a return on investment from their opex. “This arrangement can result in ‘CAPEX bias’ where
the regulated infrastructure manager prefers a capital expenditure solution to an operating
expenditure one.” (Makovšek and Veryard, 2016, p. 14) To remedy this CAPEX bias, the UK has
installed a TOTEX return, which combines CAPEX and OPEX into a single category.
Pg. Marítim de la Barceloneta, 37-49 08003 Barcelona www.medeas.eu [email protected] T +34 93 230 95 00 F +34 93 230 95 55
This project has received funding from the European Union’s Horizon 2020 research and innovation programme under grant agreement No 691287
132
Another issue is the fact that some TSOs are not unbundled yet: the Council of European Energy
Regulators (CEER) in 2016 found about 70% of electricity TSOs had been unbundled (CEER, 2016,
p.7). Meaning some TSOs are actually still part of a vertically integrated energy corporation that
owns both electricity plants and transmission infrastructure. In case of unbundling, a company
would thus bet against itself – the additional cross-border transmission capacity would represent
competition to the companies’ own powerplants: “As the power generation and sales sections
generally create higher turnovers and profits than the transmission section, the [company] may be
inclined to accept lower profits in transmission in order to keep competitors out of their electricity
market, securing the concern’s market power.” (Battaglini, Lilliestam, 2010, p. 4) With the
exceptions of Dutch TenneT, which operates heavily in Germany and Belgium’s Elia, which in 2010
with financial backing of Australia’s Industry Funds Management infrastructure fund, bought parts
of the German grid from Swedish Vattenfall, all TSOs are national (de Clercq, G., Jewkes, S. and
Davies, 2013). Nonetheless, TenneT placed capacity restrictions on cross-border electricity flows
from Germany to Denmark. This was ruled illegal by the European Commission (an antitrust breach)
in December 2018 -TenneT needs to comply by 2020 (Eckert, 2018). Many EU countries used to
have a single monopoly energy company or a small number of energy giants and still do. Most EU
member states have an ‘almost monopoly’ – with the market share of the largest company being at
over 50% in Belgium, Croatia (80%), the Czech Republic, Cyprus (full monopoly), Estonia (85%),
France (87%), Greece, Hungary, Ireland, Latvia, Luxembourg (full monopoly), Malta (full monopoly),
Slovakia (82%) and Slovenia, followed closely by Portugal with 47% and Sweden with 43%,
respectively (van Nuffel, Rademaekers and Yearwood European Energy Investments, 2017, p. 43).
These still have a large lobbying chest (for the revolving door between Europe’s biggest energy
companies and politicians, see Huter, Polfliet and Cummins-Tripodi et al., 2018) and thus have in
the past been able to convince their national governments to thwart efforts by the European
Commission for greater unbundling, to have power companies sell their transmission infrastructure
(Battaglini, Lilliestam, 2010, p.4).
Perhaps the biggest issue is that of cost-benefit sharing: countries which are not benefitting from
the interconnection being built, but are merely transit countries, need to be remunerated for this
(this will be explored subsequently).
Predicting the future energy market overall has furthermore become more difficult and complex
since the amount of future transmission that is economically viable also depends on the electricity
spot market and capacity reserves markets (which will be explored in a later section; see also Hogan,
Rosellón and Vogelsang, 2010). This is further complicated by loop flows – which means that
additional transmission capacity can deteriorate other transmission links and cause congestion
Pg. Marítim de la Barceloneta, 37-49 08003 Barcelona www.medeas.eu [email protected] T +34 93 230 95 00 F +34 93 230 95 55
This project has received funding from the European Union’s Horizon 2020 research and innovation programme under grant agreement No 691287
133
there. Due to the loop flows and associated congestion, in the Central Western Europe regional
market, only about 30% of the physical electricity infrastructure is used for energy trade.
Nonetheless, in March 2019 new rules have been adopted regarding this capacity (see 4.8). Loop
flows are unintended electricity transmissions related to trade in one bidding zone impacting the
electricity flows in another bidding zone. Loop flows cause congestion and can lead to free-riding
(thus using up transmission infrastructure without paying for it).
Pg. Marítim de la Barceloneta, 37-49 08003 Barcelona www.medeas.eu [email protected] T +34 93 230 95 00 F +34 93 230 95 55
This project has received funding from the European Union’s Horizon 2020 research and innovation programme under grant agreement No 691287
134
4.6. Funding models
4.6.1. Regulated Asset Base (RAB)
A traditional way of funding infrastructure is one of complete government ownership – the
infrastructure that is deemed necessary is built by the government either through government
funds or through government borrowing (Makovšek and Veryard, 2016, p.11). One way of
introducing some level of private sector involvement in this is the Regulated Asset Base (RAB) model.
Electricity transmission is generally seen as monopoly – the TSO both operates the existing
transmission infrastructure, but also is in charge of upgrading it. A regulatory authority usually has
to countersign the TSO’s investment plans. The costs for the new infrastructure are then added to
the TSO’s regulated asset base and supposed “to be recovered through the regulated network tariff”
(Poudineh, Rubino, 2016, p. 11). The network tariff is usually determined ex ante – meaning based
on forecasts rather than actual transmission.
The usual model is that TSOs suggest new cross border transmission infrastructure to the regulators
if there is a price difference between two countries, get approval and then builds it. The capital cost
of building the new infrastructure will then be recovered through grid access tariffs over the decades
in which the infrastructure is to last and be operational. The financial risk of doing this used to be
deemed low – all European countries need electricity, the regulators approved it and the return of
investment was also low since it was relatively clear that the funders would recuperate their
investments slowly but surely.
Price caps, revenue caps or rate of return caps attempt to soften the impact of the monopoly of the
TSO on the consumer. “With the price and revenue caps, the regulator must estimate the efficient
cost of providing a service for the next regulatory period (price review period) and allow the
regulated company to recover that cost through user charges, if it meets the efficiency target.
Similarly, rate of return regulation allows the infrastructure manager to collect revenues that allow
it to earn a return on its assets up to a designated cap.” (Makovšek and Veryard, 2016, p.12) This
can happen through either a RAB model or Long Run Incremental Cost (LRIC) model. In the RAB
model, the governmentally agreed income for the grid operator is made up of the cost of operating
and maintaining the assets, the cost of debt and equity, and a fixed return on the assets, taking the
depreciation of existing assets into account. The agreed return to investors in the RAB model is
calculated on the regulated asset base and the weighted average cost of capital (WACC), “while the
operating costs are recouped on a pay-as-you-go basis.” (Makovšek and Veryard, 2016, p.13)
Pg. Marítim de la Barceloneta, 37-49 08003 Barcelona www.medeas.eu [email protected] T +34 93 230 95 00 F +34 93 230 95 55
This project has received funding from the European Union’s Horizon 2020 research and innovation programme under grant agreement No 691287
135
The grid tariff that the electricity company is allowed to charge can be either be a) “Cost plus” or
“cost of service” tariff or b) “Incentive-based”, “performance-based” or “output-based” tariff. In the
EU Lithuania e.g. employs “cost plus”. In this remuneration system, the company is entitled to OPEX
and additionally the regulator defines an ‘allowed’ profit margin, which however critics argue means
that a way for the company to make more money is to artificially increase ‘costs’. The second type
can be one of “three variants: rate cap regulation, incentive-based regulation and revenue cap
regulation.
1. Rate cap regulation ties the allowed growth in revenue to changes in sales volume and
typically to inflation rates.
2. Incentive-based regulation ties regulation to some kind of performance incentive.
3. Revenue cap regulation sets a formula for the total allowed revenue. […] the DSO
[distribution systems operator] receives the residual of the ex-ante approved revenue and
ex-post realized cost.” (Matschoss et al., 2019, p.728)
Sometimes, the company’s debt-to-equity gearing ratio is taken into account. The remuneration can
furthermore depend on whether it is calculated based on the grid congestion level (congestion rent)
or based on physical capacity transmitted - this is referred to as “postage stamp” (van Nuffel et al.,
2017, p. 50). In the EU, “postage stamp” is the predominant grid tariff type - only the UK, Sweden
and Italy apply locational tariffs (Mekonnen, Huang and de Vos, 2016, p. 207. See also ENTSO-E,
2018a).
The investment volumes in infrastructure for a future with high RES levels often exceed the TSOs’
financial capacity. Henriot (2013) in his assessment of required investment for European electricity
transmission infrastructure until 2030 finds that “in their current financial situation, and under
historical trends in transmission tariffs, TSOs will not be able to achieve more than half of the
investment plans. Higher capital expenditures would result in financial degradation of TSOs and a
rapid loss of their investment grade. Tariffs will have to increase significantly if the totality of the
investment plans is to be met.” (Henriot, 2013, p. 822) This credit issue is due to the “political
sensitivity associated with raising tariffs high enough to incentivise necessary investments.” (Blyth,
McCarthy, Gross, 2015, p. 617) This is at times exacerbated by what has been referred to as the
“utility death spiral” - grid defection and intermittent energy sources lead to negative prices at
certain points in time and fewer periods with high prices, coal assets become stranded (see also
Johannesson Linden et al., 2014.) Five companies provide 60% of the EU energy – Enel, RWE, EDF,
E.On and GDF-Suez. All have had their credit ratings downgraded by Moody’s (Crisp, 2015b). The
additional capacity from wind and solar power has overall led to lower wholesale electricity prices.
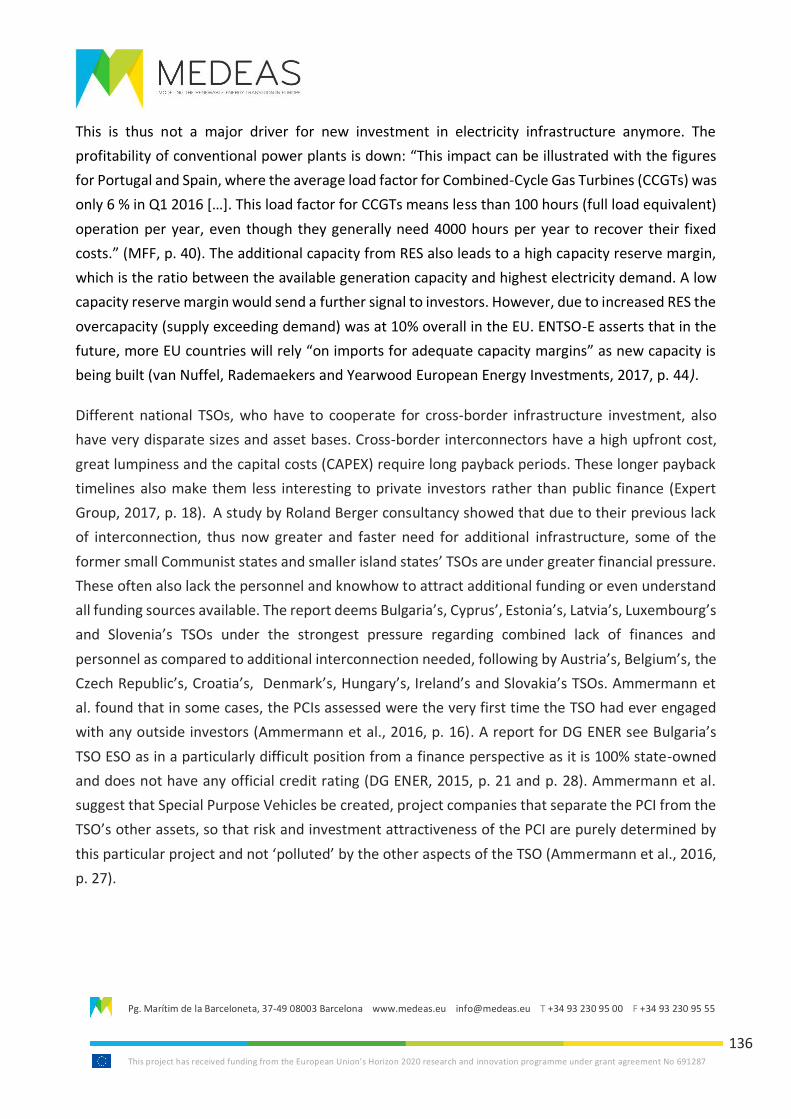
Pg. Marítim de la Barceloneta, 37-49 08003 Barcelona www.medeas.eu [email protected] T +34 93 230 95 00 F +34 93 230 95 55
This project has received funding from the European Union’s Horizon 2020 research and innovation programme under grant agreement No 691287
136
This is thus not a major driver for new investment in electricity infrastructure anymore. The
profitability of conventional power plants is down: “This impact can be illustrated with the figures
for Portugal and Spain, where the average load factor for Combined-Cycle Gas Turbines (CCGTs) was
only 6 % in Q1 2016 […]. This load factor for CCGTs means less than 100 hours (full load equivalent)
operation per year, even though they generally need 4000 hours per year to recover their fixed
costs.” (MFF, p. 40). The additional capacity from RES also leads to a high capacity reserve margin,
which is the ratio between the available generation capacity and highest electricity demand. A low
capacity reserve margin would send a further signal to investors. However, due to increased RES the
overcapacity (supply exceeding demand) was at 10% overall in the EU. ENTSO-E asserts that in the
future, more EU countries will rely “on imports for adequate capacity margins” as new capacity is
being built (van Nuffel, Rademaekers and Yearwood European Energy Investments, 2017, p. 44).
Different national TSOs, who have to cooperate for cross-border infrastructure investment, also
have very disparate sizes and asset bases. Cross-border interconnectors have a high upfront cost,
great lumpiness and the capital costs (CAPEX) require long payback periods. These longer payback
timelines also make them less interesting to private investors rather than public finance (Expert
Group, 2017, p. 18). A study by Roland Berger consultancy showed that due to their previous lack
of interconnection, thus now greater and faster need for additional infrastructure, some of the
former small Communist states and smaller island states’ TSOs are under greater financial pressure.
These often also lack the personnel and knowhow to attract additional funding or even understand
all funding sources available. The report deems Bulgaria’s, Cyprus’, Estonia’s, Latvia’s, Luxembourg’s
and Slovenia’s TSOs under the strongest pressure regarding combined lack of finances and
personnel as compared to additional interconnection needed, following by Austria’s, Belgium’s, the
Czech Republic’s, Croatia’s, Denmark’s, Hungary’s, Ireland’s and Slovakia’s TSOs. Ammermann et
al. found that in some cases, the PCIs assessed were the very first time the TSO had ever engaged
with any outside investors (Ammermann et al., 2016, p. 16). A report for DG ENER see Bulgaria’s
TSO ESO as in a particularly difficult position from a finance perspective as it is 100% state-owned
and does not have any official credit rating (DG ENER, 2015, p. 21 and p. 28). Ammermann et al.
suggest that Special Purpose Vehicles be created, project companies that separate the PCI from the
TSO’s other assets, so that risk and investment attractiveness of the PCI are purely determined by
this particular project and not ‘polluted’ by the other aspects of the TSO (Ammermann et al., 2016,
p. 27).
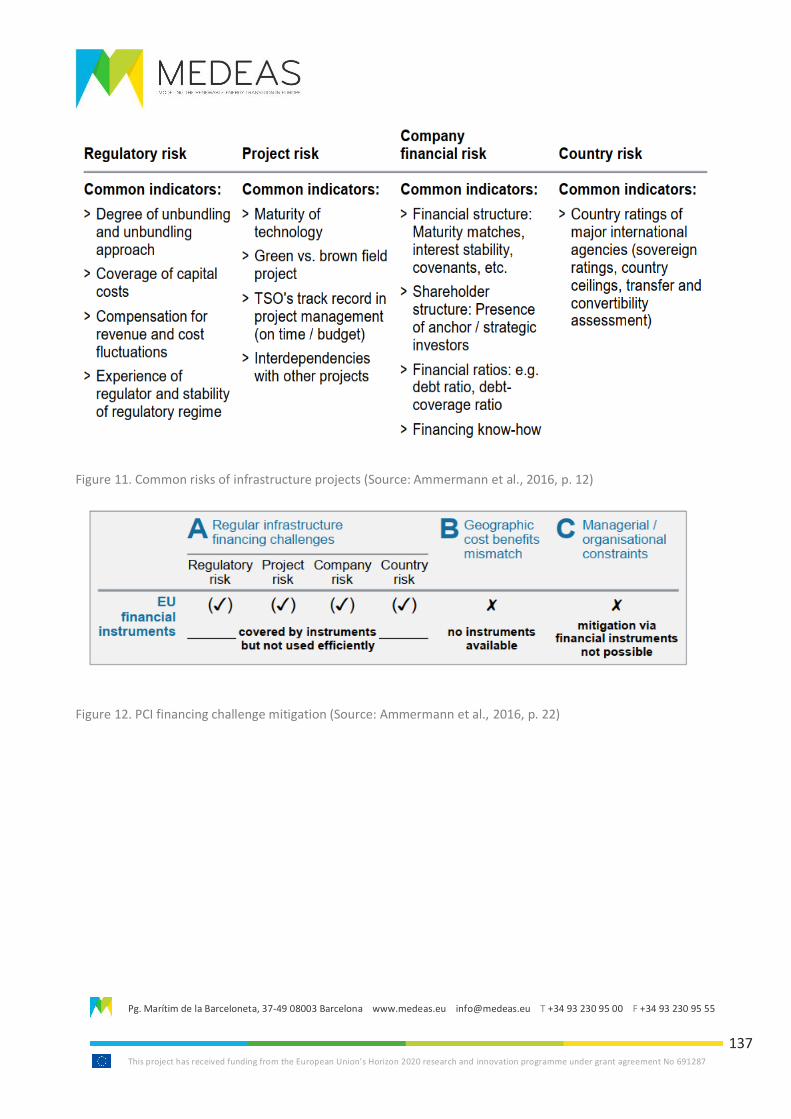
Pg. Marítim de la Barceloneta, 37-49 08003 Barcelona www.medeas.eu [email protected] T +34 93 230 95 00 F +34 93 230 95 55
This project has received funding from the European Union’s Horizon 2020 research and innovation programme under grant agreement No 691287
137
Figure 11. Common risks of infrastructure projects (Source: Ammermann et al., 2016, p. 12)
Figure 12. PCI financing challenge mitigation (Source: Ammermann et al., 2016, p. 22)
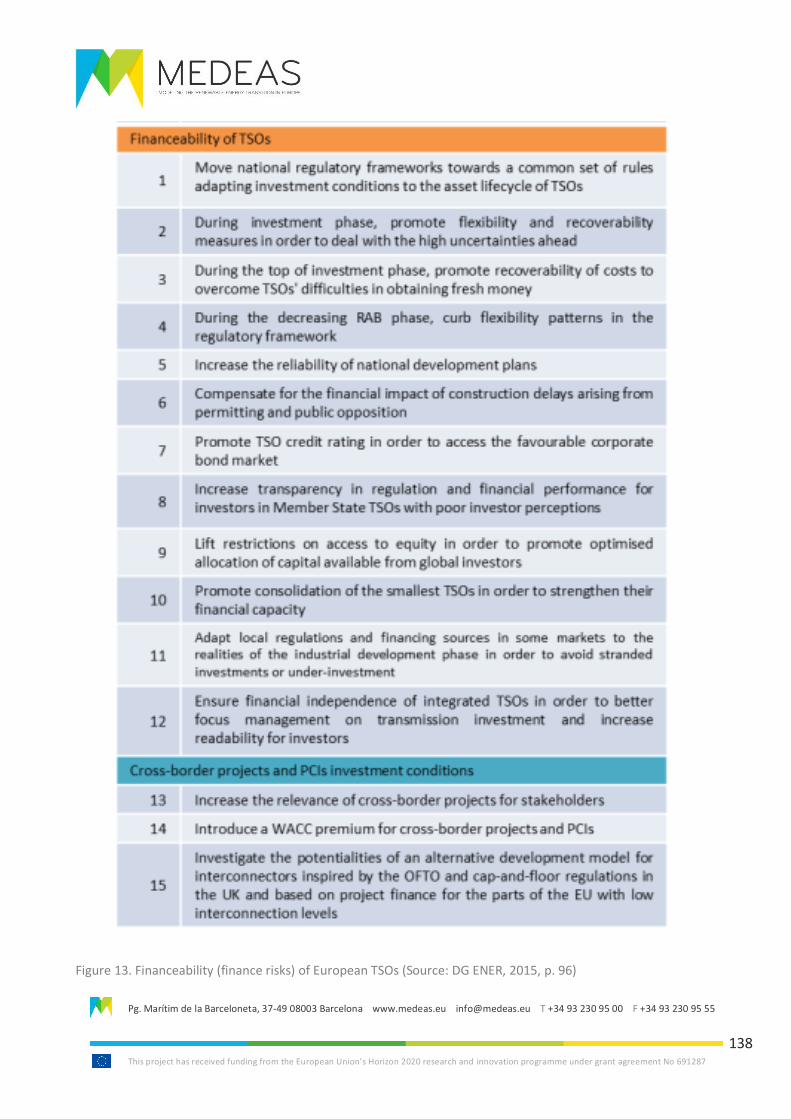
Pg. Marítim de la Barceloneta, 37-49 08003 Barcelona www.medeas.eu [email protected] T +34 93 230 95 00 F +34 93 230 95 55
This project has received funding from the European Union’s Horizon 2020 research and innovation programme under grant agreement No 691287
138
Figure 13. Financeability (finance risks) of European TSOs (Source: DG ENER, 2015, p. 96)
Pg. Marítim de la Barceloneta, 37-49 08003 Barcelona www.medeas.eu [email protected] T +34 93 230 95 00 F +34 93 230 95 55
This project has received funding from the European Union’s Horizon 2020 research and innovation programme under grant agreement No 691287
139
4.6.2. Merchant Investment model
Other than a) a traditional model of pure government ownership (no congestion) and b) the RAB
model (which is the dominant model in Europe), there is also the merchant model. A merchant
investment is privatised to a greater extent – private investors can recover the costs of their
transmission investments
“either through the congestion rents or the sale of financial (or physical) transmission rights (FTRs).
FTRs, which are usually allocated in a market-based fashion (for example [an] auction), entitle the
holder to the price difference between two nodes. In other words, rather than receiving the price
difference at both ends of interconnection, the merchant investor sells the FTR and allows the
purchaser to hedge against locational price differences. In a similar manner, physical transmission
rights provide the holder with access to the physical interconnection capacity.” (Poudineh, Rubino,
2016, p. 12)
The underlying theoretical assumption here is that under the merchant model, the incentive to
investment is greater and more efficient: “an efficient investment is profitable and an inefficient
investment is unprofitable.” (Poudineh, Rubino, 2016, p. 12) In practice, however some scholars and
practitioners have criticised this viewpoint as unrealistic since this assumed efficiency and
investment attractiveness is being hampered through e.g. information asymmetry and the
aforementioned long lead times for investments.
Under EU law (directive 2009/72/EC), since the 3rd energy package, the RAB is the generally
accepted model and the merchant model requires an exceptional permission. Exceptions are
granted if six conditions are fulfilled and the merchant investor can prove this. The member state’s
regulatory agency will first agree and then the European Commission will make a final ruling – if
exceptions are granted there are often additional conditions attached to this. Merchant connectors
are required under the same EU legislation to sell capacity in non-discriminatory auctions. This was
problematic for the BritNed interconnector, as the legislation was applied retroactively (Dutton,
Lockwood, 2017, p. 378).
Interconnection projects can be granted exemptions from
• Regulated third party access
• Congestion charges
• Unbundling
• Charging methods.
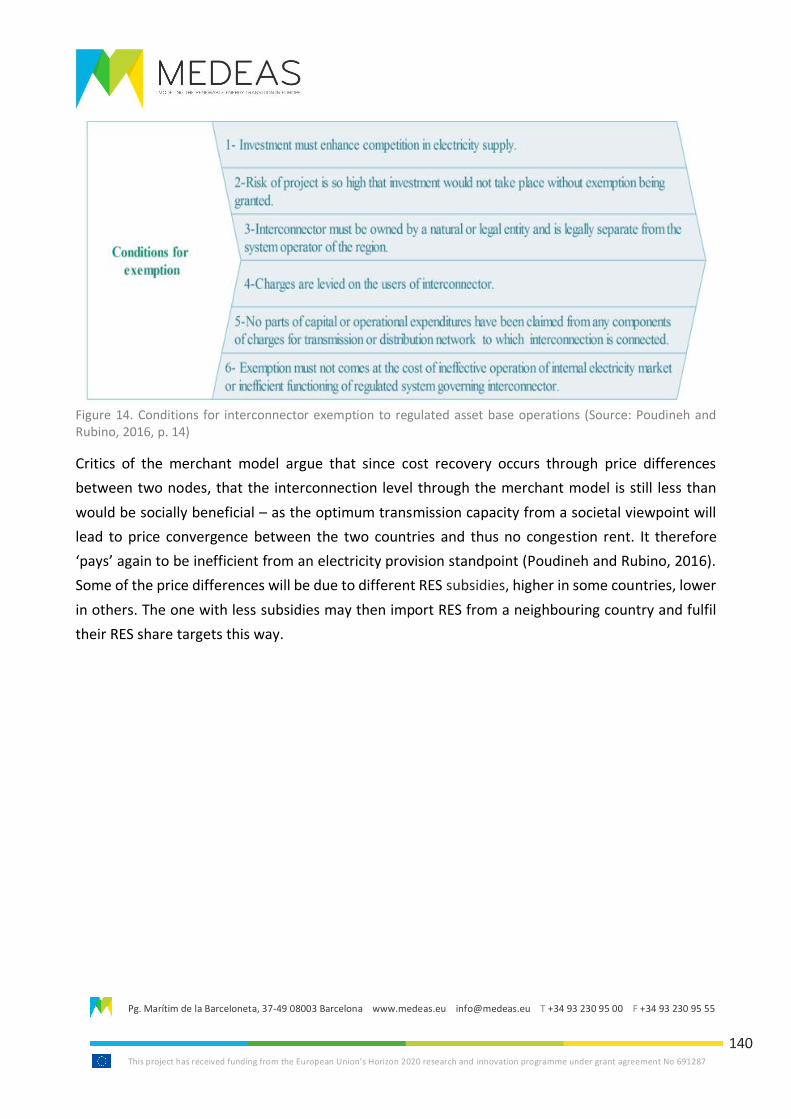
Pg. Marítim de la Barceloneta, 37-49 08003 Barcelona www.medeas.eu [email protected] T +34 93 230 95 00 F +34 93 230 95 55
This project has received funding from the European Union’s Horizon 2020 research and innovation programme under grant agreement No 691287
140
Figure 14. Conditions for interconnector exemption to regulated asset base operations (Source: Poudineh and Rubino, 2016, p. 14)
Critics of the merchant model argue that since cost recovery occurs through price differences
between two nodes, that the interconnection level through the merchant model is still less than
would be socially beneficial – as the optimum transmission capacity from a societal viewpoint will
lead to price convergence between the two countries and thus no congestion rent. It therefore
‘pays’ again to be inefficient from an electricity provision standpoint (Poudineh and Rubino, 2016).
Some of the price differences will be due to different RES subsidies, higher in some countries, lower
in others. The one with less subsidies may then import RES from a neighbouring country and fulfil
their RES share targets this way.
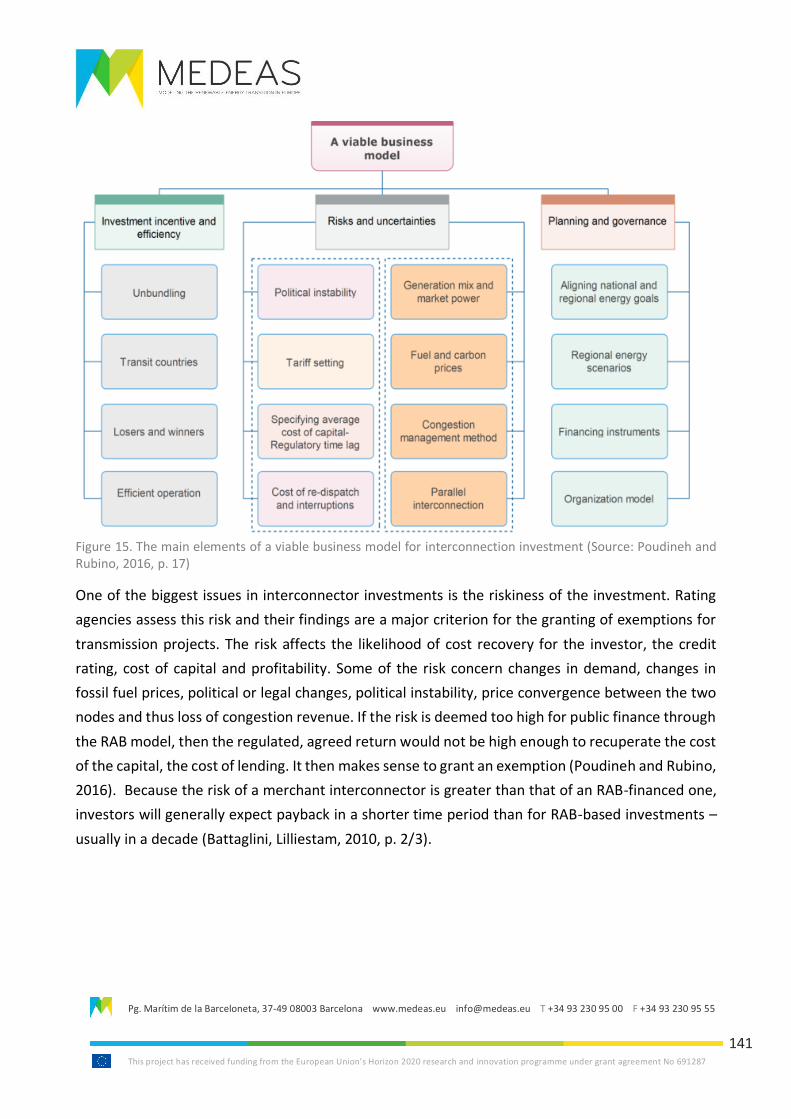
Pg. Marítim de la Barceloneta, 37-49 08003 Barcelona www.medeas.eu [email protected] T +34 93 230 95 00 F +34 93 230 95 55
This project has received funding from the European Union’s Horizon 2020 research and innovation programme under grant agreement No 691287
141
Figure 15. The main elements of a viable business model for interconnection investment (Source: Poudineh and Rubino, 2016, p. 17)
One of the biggest issues in interconnector investments is the riskiness of the investment. Rating
agencies assess this risk and their findings are a major criterion for the granting of exemptions for
transmission projects. The risk affects the likelihood of cost recovery for the investor, the credit
rating, cost of capital and profitability. Some of the risk concern changes in demand, changes in
fossil fuel prices, political or legal changes, political instability, price convergence between the two
nodes and thus loss of congestion revenue. If the risk is deemed too high for public finance through
the RAB model, then the regulated, agreed return would not be high enough to recuperate the cost
of the capital, the cost of lending. It then makes sense to grant an exemption (Poudineh and Rubino,
2016). Because the risk of a merchant interconnector is greater than that of an RAB-financed one,
investors will generally expect payback in a shorter time period than for RAB-based investments –
usually in a decade (Battaglini, Lilliestam, 2010, p. 2/3).
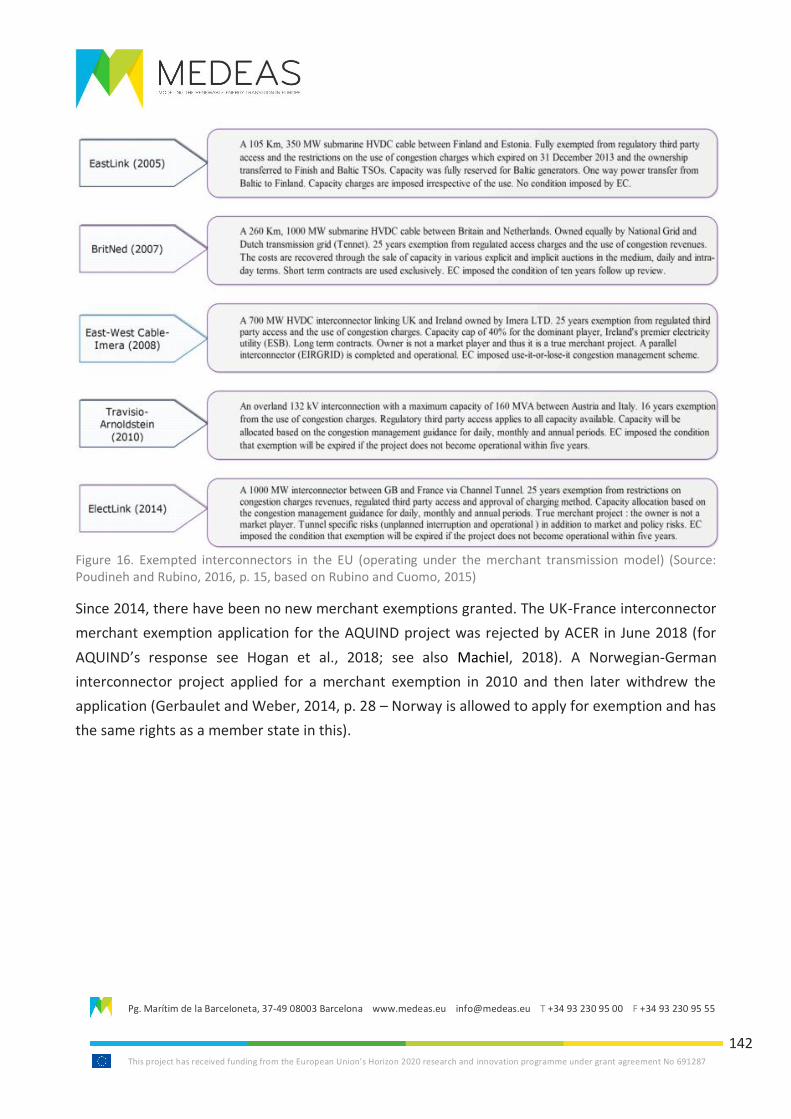
Pg. Marítim de la Barceloneta, 37-49 08003 Barcelona www.medeas.eu [email protected] T +34 93 230 95 00 F +34 93 230 95 55
This project has received funding from the European Union’s Horizon 2020 research and innovation programme under grant agreement No 691287
142
Figure 16. Exempted interconnectors in the EU (operating under the merchant transmission model) (Source: Poudineh and Rubino, 2016, p. 15, based on Rubino and Cuomo, 2015)
Since 2014, there have been no new merchant exemptions granted. The UK-France interconnector
merchant exemption application for the AQUIND project was rejected by ACER in June 2018 (for
AQUIND’s response see Hogan et al., 2018; see also Machiel, 2018). A Norwegian-German
interconnector project applied for a merchant exemption in 2010 and then later withdrew the
application (Gerbaulet and Weber, 2014, p. 28 – Norway is allowed to apply for exemption and has
the same rights as a member state in this).
Pg. Marítim de la Barceloneta, 37-49 08003 Barcelona www.medeas.eu [email protected] T +34 93 230 95 00 F +34 93 230 95 55
This project has received funding from the European Union’s Horizon 2020 research and innovation programme under grant agreement No 691287
143
4.6.3. Hybrid investment models
It is at times argued that neither RAB nor merchant investment models produce optimal investment
from a societal perspective, since revenues from financial transmission rights (FTRs) only recuperate
25% of the costs of a grid. The remaining three quarters are fixed costs. Some economists have thus
argued for an additional charge, a fixed part of a tariff (Hogan, Rosellón and Vogelsang, 2010). For
such a hybrid approach see Schill, Egerer and Rosellón (2015), who show that a hybrid model with
a cap leads to better outcome with high levels of wind power. The other various combined models
usually involve auctions of transmission rights. Ofgem, the UK electricity and gas market regulator,
e.g. introduced both a decades-long cap and a floor on revenue from interconnection capacity
investment. If the revenues dip below the floor, the users of the interconnection have to pay the
difference to the floor (Poudineh, Rubino, 2016).
Pg. Marítim de la Barceloneta, 37-49 08003 Barcelona www.medeas.eu [email protected] T +34 93 230 95 00 F +34 93 230 95 55
This project has received funding from the European Union’s Horizon 2020 research and innovation programme under grant agreement No 691287
144
4.7. Investors and funding sources
4.7.1. EU funding
European Energy Programme for Recovery (EEPR)
The European Energy Programme for Recovery (EEPR) was started at the height of the recession in
2009 and had a €4 billion budget. The fund was closed in 2018. It has funded electricity
interconnectors, gas pipelines, offshore wind projects including undersea cables and a single CCS
pilot project. The project list includes an Austria-Hungary interconnector, the Malta-Sicily PCI
interconnection, KriegersFlak, EstLink, the COBRA cable and the cancelled Scottish HVDC hub.11
Connecting Europe Facility (CEF)
The Connecting Europe Facility (CEF) funds cross-border infrastructure PCI in energy, transport and
ICT. Its 2014-2020 energy-related budget is €5.35 billion, of which €4.5 billion are grants managed
by the EU Innovation & Networks Executive Agency (INEA). According to its statute, CEF would
usually not provide more than 50% of the financing required for a cross-border infrastructure or in
exceptional circumstances 75%. About two thirds (64%) of CEF’s energy funding, in 2014-2017, was
for gas projects and 33% for electricity interconnection. A single smart grid and a single storage
project were also selected – with the storage project later cancelled. Only about 30% of electricity
PCI applied for any CEF funding in the past – thus this does either not appear a priority for many PCI
or is deemed unattractive or too cumbersome (European Energy Industry Investments, p. 59). 75%
of all PCI do not receive EU funding other than from the CEF – by 2016, 22 PCIs had received €419
million overall (European Energy Industry Investments, p. 59). The remaining (non-CEF) EU funding
was mostly related to the EEPR, followed by a much smaller contribution from the EIB. Of 74 PCI
receiving funding from the CEF until its midterm review, 37 were gas PCIs and 35 were electricity
line interconnections. 40 of these 74 PCIs were literally crossing borders and the other 34 were
located in a single EU member state, but had a “significant cross-border impact” (European
Commission Staff Working Document, Mid Term Evaluation CEF, 2018, p. 24). From a geographical
perspective, the Baltic Energy Market Interconnection Plan (BEMIP, both gas and electricity) and
North Sea Offshore grid and the North-South Interconnections East (again both gas and electricity)
11 Full list available here: http://ec.europa.eu/energy/eepr/projects/#!/
Pg. Marítim de la Barceloneta, 37-49 08003 Barcelona www.medeas.eu [email protected] T +34 93 230 95 00 F +34 93 230 95 55
This project has received funding from the European Union’s Horizon 2020 research and innovation programme under grant agreement No 691287
145
featured prominently (European Commission Staff Working Document, Mid Term Evaluation CEF,
2018, p. 24).
The CEF is made up of a) the aforementioned grants disbursed by the INEA, b) the Debt Instrument
and the Equity Instrument, both handled by the EIB, and c) small amount of public procurement
funding (less than 1% of the CEF). The February 2018 CEF mid-term evaluation by the European
Commission found that the CEF Debt Instrument had not been used much by energy companies –
only a single project, a legacy project taken over from the Europe 2020 Project Bond programme,
had used it, the Bulgaria-Romania-Hungary-Austria (BRUA) gas project. This project was then
transferred to the EFSI (SWD, p.66). No PCI had yet used the Equity Instrument (European
Commission Staff Working Document [SWD], Mid Term Evaluation CEF, p. 19). As potential reason,
the lack of necessity was cited: “There is also a competitive range of debt and equity options already
available to project promoters due to their sound Regulated Asset Base model for project finance.”
(European Commission report to European Parliament, the Council, the European Economic and
Social Committee and the Committee of the Regions, “Mid-Term Evaluation CEF”, 14 Feb 2018, p.
9) For this reason, the European Commission decided to close the Debt & Equity Instruments for the
energy sector (SWD, p. 37). “A CEF energy EI [Equity Instrument] is not relevant to the needs of the
sector at this time. […] The order of preference [for stakeholders interviewed for the review] […] is
retained earnings, loans from banks and IFIs and only then the bond markets. Equity is only used by
a minority of TSOs as many are restricted in their access to equity by the country's regulatory
framework. Even when it is permitted by the framework, there is often not a need for equity within
TSOs.” (SWD, p. 38) In the midterm review, it was found that 30 of the 87 EU TSOs had received
funding from the CEF (SWD, p. 72).
A previous 2016 review by the European Parliament had concluded that it was too early to say
whether the CEF was successful in attracting private financing from insurance companies and banks
(European Energy Investments, p. 59). Co-financing was deemed to have improved in the midterm
evaluation.
The CEF mid-term evaluation highlighted inter alia two projects for its cross-border electricity
infrastructure support: Sincro.Grid connecting Slovenia and Croatia and the Black Sea Corridor
connecting Bulgaria and Romania. CEF provided €40 million for new electricity interconnections
between Slovenia and Croatia including storage and “a virtual cross-border control centre for energy
system operators”. The project was praised as best practice by the World Energy Council in its
Trilemma Index 2016 report (SWD, p. 54). CEF also contributed about €30 million (50% of the cost)
to the construction of an electricity transmission line connecting Northern Dobrudja (Romania) and
Pg. Marítim de la Barceloneta, 37-49 08003 Barcelona www.medeas.eu [email protected] T +34 93 230 95 00 F +34 93 230 95 55
This project has received funding from the European Union’s Horizon 2020 research and innovation programme under grant agreement No 691287
146
Southern Dobrudja (Bulgaria) with the city of Burgas (Bulgarian coast). The underlying rationale for
this expansion is the better integration of solar energy from South Bulgaria and wind energy from
Greece. The project was severely delayed, by five years, due to issues relating to unbundling and
financial difficulties of the Bulgarian grid from the National Electricity Company. The Bulgarian TSO
could not afford the construction, especially due to the political sensitivity of raising electricity prices
enough to recoup the investment in a normal timeframe (half of all Bulgarian electricity prices are
still regulated). Without the CEF support, the lines would thus not have been built (SWP, p. 55, based
on Haesen et al, 2017. Study on electricity infrastructure developments in Central and South Eastern
Europe, 2016).
For the 2021-2027 CEF continuation, energy-related funding available will be €8.7 billion (thus 83%
more than was available for 2014-2020). 10% of this would be reserved for cross-border RE projects
(including 3rd country projects) and 90% for EU internal energy market integration (Pape, 2019, p.8).
The European Commission is planning to perhaps reallocate congestion income at borders to the
CEF budget, to increase funding available (European Energy Industry Investments, p. 59).
Following a 2010 suggestion by then European Commission president Barroso, the European
Investment Bank and the European Commission established the Europe2020 Project Bond Initiative
which gives infrastructure projects a Project Bond Credit Enhancement (PBCE) loan. This shores up
senior bond credit ratings by lowering the financial risk affiliated with the project. The key rationale
for this is that this will help make the projects more attractive for sovereign wealth funding and
pension fund investments. A successful example of this was e.g. the Greater Gabbard offshore wind
farm in the UK for which the EIB provided a PBCE. Because of the PCBE, Moody’s upgraded the credit
rating of the project (OECD, p. 95/96).
European Fund for Strategic Investments (EFSI)
The European Investment Bank (EIB) together with the European Commission runs the European
Fund for Strategic Investments (EFSI), founded in 2015, and is solely in charge of its Infrastructure
and Innovation Window. In the first year of its operation, 2015-2016, 21% of its €25 billion approved
for projects (total goal: €315 billion) were for energy-related projects. This includes funding for
retrofitting of buildings, smart meters, gas pipelines, hydropower, CHP projects, refineries, but also
various offshore and onshore wind energy projects and e.g. €681 million for an Italy-France
Interconnector as well as support for the Nordlink HVDC Project. Germany’s KfW, Spain’s ICO,
French Caisse des depots and BPI, Italian Cassa de Depositi e Prestiti, Luxemburg’s SNCI, Poland’s
GBK, Slovakia’s Slovenský Investičný Holding and Slovenská Záručná a Rozvojová Banka, Bulgaria’s
Bulgarian Development Bank and the UK all contribute to the EFSI (CEEP, 2015, p. 26).
Pg. Marítim de la Barceloneta, 37-49 08003 Barcelona www.medeas.eu [email protected] T +34 93 230 95 00 F +34 93 230 95 55
This project has received funding from the European Union’s Horizon 2020 research and innovation programme under grant agreement No 691287
147
InvestEU
In June 2018, it was decided that for the period 2021-2027, the EFSI and CEF will be combined
together with other non-infrastructure funds under the InvestEU umbrella, an extension of the
Juncker plan. InvestEU will have four pillars: 1) sustainable infrastructure, 2) research, innovation
and digitisation, 3) SMEs, 4) social investment and skills (the latter study loans etc). “Another novelty
of the proposed new fund is that it will feature a Member State compartment for each policy area,
which means that each Member State may complement the EU guarantee by voluntarily redirecting
up to 5% of its Cohesion Policy Funds to these compartments.“ (Bernard Energy, 2018)
European Regional Development Fund (ERDF)
The European Regional Development Fund (ERDF) provides funding for gas and electricity storage
and transmission lines in underdeveloped regions in the EU. For the 2014-2020 Multiannual
Financial Framework, €2.3 billion were dedicated to this overall. €105 million were dedicated to
TEN-E transmission and electricity storage and €468 million for gas projects. Bulgaria, the Czech
Republic, Greece, Lithuania, Poland and Romania all use ERDF funding for large electricity
infrastructure projects (SWD, CEF, p. 41)
Currently, if one presumes an annual grid investment need of € 40 to € 62 billion a year, all EU funds
for all energy projects, amount to only about 10% to 15% of this need (European Energy Investments, p.
65)
Pg. Marítim de la Barceloneta, 37-49 08003 Barcelona www.medeas.eu [email protected] T +34 93 230 95 00 F +34 93 230 95 55
This project has received funding from the European Union’s Horizon 2020 research and innovation programme under grant agreement No 691287
148
4.7.2. Public financial institutions
Marguerite Fund
In 2010, the Marguerite Fund (2020 European Fund for Energy, Climate Change and Infrastructure)
was launched on the initiative of the 2008 French European Council presidency. The Marguerite
Fund provides minority investment participation (50% or less in shareholding) in transport and
energy infrastructure projects, with a (non-exclusive) focus on greenfield projects. Its core members
are the European Investment Bank, French Caisse des dépôts et consignations (CDC), the Italian
Cassa Depositi e Prestiti (CDP), German KfW (Kreditanstalt für Wiederaufbau), the Polish Bank
Gospodarstwa Krajowego (BGK) and Spanish Instituto de Crédito Oficial (ICO). Other investors are
the Polish Bank Polski (PKO), the Bank of Valletta (Malta), the Portuguese Caixa Geral de Depósitos
(CGD) and the European Commission. The first four year round of Marguerite Fund investments was
supposed to be made up of €1.5 billion in equity and €5 billion in debt financing.12 The Marguerite
Fund however fell short of raising this - getting about half-way to €710 million in equity. The reason
for this was “notably due to its inability to attract other co-sponsors, particularly from the private
sector […] [This] can be explained on the one hand by the Fund’s less common design and set up,
and on the other hand by the limited available pipeline and the challenging market conditions in
which the Fund has had to operate. The peculiarity of the Fund’s governance structure, notably the
weight of public investors, limited its capacity to attract private sector investment.” (PWC, 2014,
p.3) Usual funding dispensed for a PCI by the Marguerite Fund is about €30-€75 million. Repayment
is usually over a 20 year period. The Marguerite Fund invests pre-construction, during construction,
in already operating assets as well as in quasi-equity financing, such as mezzanine debt (unsecured,
flexible loans). The largest investments have been made to the Butendiek (Germany) and C-Power
(Belgium) offshore wind projects (Rivron, 2016). The offshore wind projects were co-funded
together with two pension funds. The fund was rather selective: “out of the 503 investment
opportunities screened by the Fund only 9 deals have been closed until December 31st 2013.” (PWC,
2014, p.4)
12 See European Investment Bank – Marguerite Fund FAQ, 16 March 2010.
https://www.eib.org/en/infocentre/press/news/all/2020-european-fund-for-energy-climate-change-and-infrastructure-marguerite-fund.htm
http://www.marguerite.com/
Pg. Marítim de la Barceloneta, 37-49 08003 Barcelona www.medeas.eu [email protected] T +34 93 230 95 00 F +34 93 230 95 55
This project has received funding from the European Union’s Horizon 2020 research and innovation programme under grant agreement No 691287
149
KfW
All aforementioned investors are public financial institutions (PFIs) – governmental financial
institutions. Public financial institutions provide financing with low returns (due to the low risk). PFIs
can often benefit from governmental guarantees and strong credit ratings. Public funding of course
“de-risks” transmission projects (Battaglini and Liliestam, 2010, p. 6). The most important public
financial institution is Germany’s KfW, which in the year 2010 alone invested €37 billion into low
carbon projects, €16.5 billion of this was concessional debt (See also Geddes, Schmidt and Steffen,
2018). One KfW project e.g. is the NordLink interconnector (HVDC subsea cable) connecting
Schleswig-Holstein to Norway. Belgium’s PFI in comparison in 2013 invested €6.4 billion in low
carbon projects, of which €0.2 billion were funded through concessional debt (European Energy
Industry Investments, p. 79)
Pg. Marítim de la Barceloneta, 37-49 08003 Barcelona www.medeas.eu [email protected] T +34 93 230 95 00 F +34 93 230 95 55
This project has received funding from the European Union’s Horizon 2020 research and innovation programme under grant agreement No 691287
150
4.7.3. Pension funds, insurance companies, SWFs
The long timescale of infrastructure projects and low rates of return make them better suited to
more risk-averse investors - usually pension funds and insurance companies are named in this
context. “However, what is not in dispute is that Europe’s regulations limiting profits on
interconnectors discourages private sector investment whilst national governments favour
domestic generation capacity over power imports via interconnectors."(Newman, N., 2015) It has
to be noted that pension funds are, within the EU, a very regionally specific occurrence. Additionally
the UK accounts for 40% of all wealth managed by European pension funds, the Netherlands for
20% and Switzerland for a further 12%. Nonetheless, the Dutch pension fund is of greater
importance for renewable energy infrastructure as it is centrally managed by the Dutch Central
Bank, whereas the UK pension funds are smaller entities without central management (Nelson,
Pierpont, 2013, p. 25/26) Other countries with significant pension funds are Denmark, Sweden and
Germany. Pension funds have predominantly invested domestically (OECD, p. 80) – in their own
region or related to their country of origin (within the EU again, mostly Germany, Netherlands,
Scandinavia and UK). Large insurance companies in the EEA exist in the UK, France, Germany (Allianz
and MunichRe are especially active in this field), the Netherlands, Switzerland and Italy (Nelson,
Pierpont, 2013, p. 26).
PensionDanmark, through infrastructure fund manager Copenhagen Infrastructure Partners,
invested €384 million (57% stake) into the DolWin North Sea offshore grid interconnection from the
waters of Borkum island (Germany) to the Dutch-German borderlands (TenneT), as well as a further
€900 million (50% stake) in the Danish Anholt offshore wind farm (The European Renewable Energy
Investor Landscape, p. 15). ElecLink in its application for merchant exemption wrote that its funders
(part of STAR Capital) included pension funds and insurance companies.
Pension funds and insurance companies are still strongly biased towards “high carbon” investments
such as oil or coal in their portfolio. While the majority of investments are not classified as high or
low carbon, 20%-25% of pension funds’ and insurance companies’ overall investments were
reported as high carbon and only about 1% to 2% were related to renewable or sustainable
investments (European Energy Industry Investments, p. 80). David Russell, Co-Head of Responsible
Investment, Universities Superannuation Scheme Investment Management, gave evidence to the
House of Commons in June 2013 and disclosed that the universities pension fund that he is in charge
of, had about 7% of oil and gas assets, a further 3% mining assets, 0.5% utilities and a figure of less
than 1% that he did not divulge further in lower carbon investment – although even some of this
was also gas (and some may be woodland for paper production). This situation is exacerbated by
Pg. Marítim de la Barceloneta, 37-49 08003 Barcelona www.medeas.eu [email protected] T +34 93 230 95 00 F +34 93 230 95 55
This project has received funding from the European Union’s Horizon 2020 research and innovation programme under grant agreement No 691287
151
fossil fuel subsidies and the lack of a suitable price on carbon, and several other general cross-border
financial risks as well as issues which already exist at the domestic level but get exacerbated for
cross-border investments (see Jones, 2015). A particular issue as any new market grows is one of
liquidity (Jones, 2015) where there are limited projects and pipeline for investments available and
therefore institutional investors in particular cannot diversify risks over a portfolio of similar assets.
At the time of his testimony, Russell noted that the pension fund that he manages was looking into
financing offshore wind farm interconnections to the shore (House of Commons, p. 60). Portfolios
do not generally have to disclose their carbon content (OECD, p. 37), although this is changing
especially through the Taskforce on Climate-related Financial Disclosures (TCFD)13. On the other
hand, the lobby group Positive Money finds a “bias in favour of fossil fuels and energy-intensive
industry” (Positive Money, “A Green Bank of England”, p. 35).
Pension funds and insurance companies are more likely to invest in already operating assets, and
only invest in construction in case of Engineering, Procurement and Construction (EPC, i.e. turnkey)
contracts, since this is less risky. The entrance of the RE market of insurance companies and pension
funds
“is a direct result of the low yield bond environment and highly volatile equity markets. In this
context, renewable energy infrastructure assets, which offer long-term predictable and stable cash
flows with a low correlation to traditional debt and equity markets, are quite compelling. […] pension
funds have favoured investments through intermediaries such as funds and pooled investments. […]
One of the first examples of direct investment was Ampere Equity Fund and Dutch Pension Fund
PGGM’s acquisition of a substantial minority stake in the Walney offshore wind farm from DONG
Energy in 2010” (The European Renewable Energy Landscape, p. 14)
The preference for turnkey projects could indicate a need for new financial structures – such as
public-private investment funds or infrastructure investment companies such as YieldCo, closed-
ended infrastructure investment companies which presently within the EU only exist in the UK (for
YieldCo see e.g. OECD, p. 82 and from p. 45 onwards. European Renewable Energy Investor
Landscape, p. 16).
13 See https://www.fsb-tcfd.org/
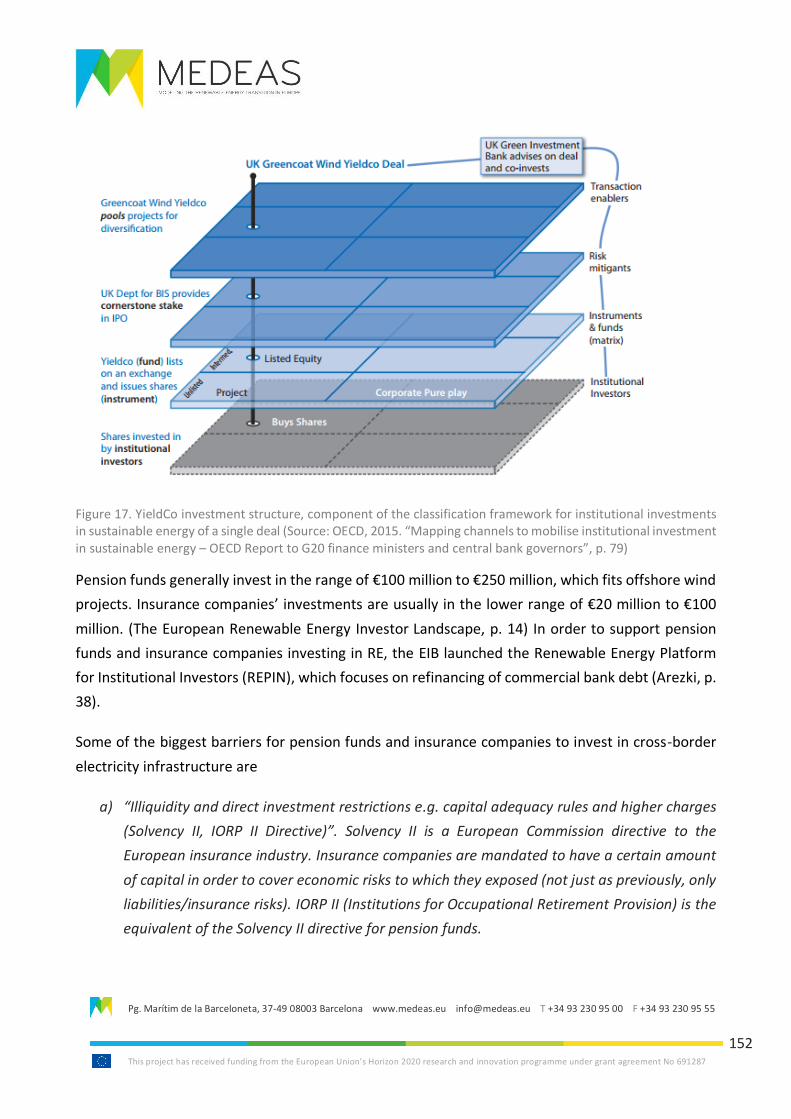
Pg. Marítim de la Barceloneta, 37-49 08003 Barcelona www.medeas.eu [email protected] T +34 93 230 95 00 F +34 93 230 95 55
This project has received funding from the European Union’s Horizon 2020 research and innovation programme under grant agreement No 691287
152
Figure 17. YieldCo investment structure, component of the classification framework for institutional investments in sustainable energy of a single deal (Source: OECD, 2015. “Mapping channels to mobilise institutional investment in sustainable energy – OECD Report to G20 finance ministers and central bank governors”, p. 79)
Pension funds generally invest in the range of €100 million to €250 million, which fits offshore wind
projects. Insurance companies’ investments are usually in the lower range of €20 million to €100
million. (The European Renewable Energy Investor Landscape, p. 14) In order to support pension
funds and insurance companies investing in RE, the EIB launched the Renewable Energy Platform
for Institutional Investors (REPIN), which focuses on refinancing of commercial bank debt (Arezki, p.
38).
Some of the biggest barriers for pension funds and insurance companies to invest in cross-border
electricity infrastructure are
a) “Illiquidity and direct investment restrictions e.g. capital adequacy rules and higher charges
(Solvency II, IORP II Directive)”. Solvency II is a European Commission directive to the
European insurance industry. Insurance companies are mandated to have a certain amount
of capital in order to cover economic risks to which they exposed (not just as previously, only
liabilities/insurance risks). IORP II (Institutions for Occupational Retirement Provision) is the
equivalent of the Solvency II directive for pension funds.
Pg. Marítim de la Barceloneta, 37-49 08003 Barcelona www.medeas.eu [email protected] T +34 93 230 95 00 F +34 93 230 95 55
This project has received funding from the European Union’s Horizon 2020 research and innovation programme under grant agreement No 691287
153
b) “Accounting rules e.g. mark to market for illiquid assets” (mark to market refers to re-
evaluation of an asset or liability for its current market value rather than its initial, previous
cost)
c) “Decreased participation of project finance banks (due to Basel III, deleveraging, structural
factors) creates interruptions in project development and construction”. Basel III refers to the
3rd Basel Accords (international banking regulations) adopted in September 2010, to be
implemented by 2019. Basel III redefined assets that qualify as capital and the minimum
amount of equity a bank needs to hold increase from 2% to 7%. It has however been argued
by some experts that “green” assets enjoy a higher financial risk than “brown” assets and
that requiring higher equity for banks thus will increase their “carbon bias” – their propensity
to invest in brown assets.
d) “No liquid market to exchange financial stakes in projects” (OECD, 2015, p. 37)
Unbundling legislation has made investments by pension funds into electricity inter-connections
more complicated and was cited by Russell as a disincentive (House of Commons, 2014, p. 60).
Green bonds
Just over half of all assets that pension funds and insurance companies hold are in bond form.
Therefore, one tactic employed to get their interest into renewable energy infrastructure has been
the introduction of designated “green bonds”. Most of these “green bonds” have been issued by
multilateral development banks. (OECD, 2015, p. 42/43) However, in the past there has been a
major issue of greenwashing in this area. The European Commission put in place first a High-Level
Expert Group on Sustainable Finance, which delivered its final report in January 2018, and
subsequently a Technical Expert Group to i.a. develop an EU-wide green bond standard. The draft
EU Green Bonds Standard was published in March 2019.14 The Technical Expert Group (TEG) will
work until at least July 2019 (with a possible extension until the end of the year). The EU High-Level
Sustainable Finance Group had previously highlighted the need to divest and recommended
penalising high carbon investments instead of purely creating stronger standardisation of the green
bonds definition. The International Capital Markets Association additionally publishes the Green
14 European Commission Draft Green Bond Standard, 6 March 2019, https://ec.europa.eu/info/publications/190306-
sustainable-finance-interim-teg-report-green-bond-standard_en
Pg. Marítim de la Barceloneta, 37-49 08003 Barcelona www.medeas.eu [email protected] T +34 93 230 95 00 F +34 93 230 95 55
This project has received funding from the European Union’s Horizon 2020 research and innovation programme under grant agreement No 691287
154
Bonds Principles (last version: June 2018)15. The European Investment Bank was a pioneer in this
area when it issued the first climate bond in 2007.
In addition to the aforementioned pension funds and insurance companies, sovereign wealth funds
(SWFs) also play a role – especially the SWFs of Norway, France and China. Norway’s SWF has
invested in NordLink, a Germany-Norway interconnection (Wettengel, 2018). China in 2016
launched the idea of building an HVDC connector all the way from China to Germany. This would
cost between €15 and €28 billion (see Ardelean, Minnebo, 2017). China owns large parts of
Portugal’s grid (and attempted to acquire it outright in summer 2018), the Italian grid and Greece’s
grid operator (Morgan and Michalopolous, 2018 and Kynge and Hornby, 2018). Similarly, Kuwait’s
SWF bought E.On’s grid assets in Spain (Steitz, Schütze and Thomasson, 2014).
Japan’s sōgō shōshas have also played an increasing role in RES investment in Europe, including in
several offshore wind farms in the Netherlands, Belgium and the UK, with investments varying e.g.
from €100 million to €600 million (European Renewable Energy Investor Landscape, 2014, p. 10).
The Mitsubishi sōgō shōsha e.g. invested €576 million in TenneT’s offshore grid connection cables
in Germany in 2013 (RenewablesNow, 2013).
Reuters reported already in 2013, that there had been for years “a battle between cash-strapped
energy grid operators and deep-pocketed infrastructure funds to buy European grid assets from
utilities [due to unbundling] […]. Grid operators […] are keen to link with peers, but many grids have
ended up in the hands of infrastructure funds, who buy them for the steady returns they provide.
These same financial investors are likely to play a key role in the eventual formation of major
European network firms. They could do that by selling their stakes, or by combining them into larger,
cross-border grids. […] The most likely catalyst for the creation of a major EU grid player would be
the emergence of a secondary market in grid operators, if and when funds start offloading their
networks in the quest for a quick profit.” (De Clercq, Jewskes and Davies, 2013) Reuters suggested
that the key future intra-EU struggle here will be between Germany, a staunch proponent of further
unbundling, and neighbouring France, an opponent.
15 See International Capital Markets Association Green Bonds Principles: https://www.icmagroup.org/green-social-and-
sustainability-bonds/green-bond-principles-gbp/
Pg. Marítim de la Barceloneta, 37-49 08003 Barcelona www.medeas.eu [email protected] T +34 93 230 95 00 F +34 93 230 95 55
This project has received funding from the European Union’s Horizon 2020 research and innovation programme under grant agreement No 691287
155
4.7.4. Commercial banks
Although commercial banks are of prime importance for cross-border electricity infrastructure
finance, there is scant specific literature about them. As an example, the largest offshore wind park,
Gemini in the Dutch North Sea received one third of its funding from commercial banks: “ABN
AMRO, BNP Paribas, BTMU, Deutsche Bank, EDC, Natixis and SMBC are in tier one, with a €92.4m
ticket each. The banks in the second group are Bank of Montreal and CIBC, with a €82.1m ticket
each. The other three arrangers are BNG (€79.4m), Santander (€59m) and Caixa (€38m).” (Project
Finance International May 21, 2014, Thomson Reuters) DG ENER notes “More than 50% of TSOs will
enter into a bank loan, be it bilateral or syndicated. Bank loans are priced off the cost of capital to
the bank. Three-month Euribor is the generally agreed reference rate (based on a panel of 24
European banks). This reference rate is the basis for banks offering a nominal interest rate to
corporations. The TSO will pay a premium over the reference rate according to the tenor, amount
and drawdown conditions of the loan and an assessment of the creditworthiness of the TSO.” (DG
ENER, 2015, p. 59)
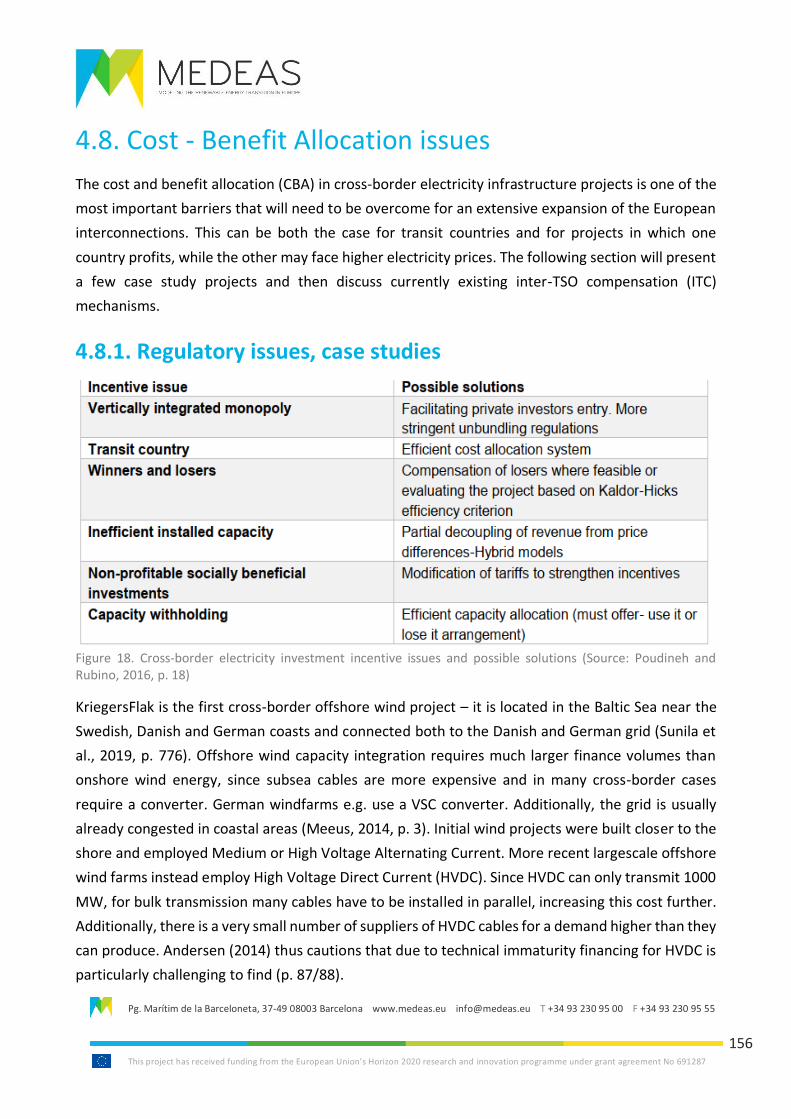
Pg. Marítim de la Barceloneta, 37-49 08003 Barcelona www.medeas.eu [email protected] T +34 93 230 95 00 F +34 93 230 95 55
This project has received funding from the European Union’s Horizon 2020 research and innovation programme under grant agreement No 691287
156
4.8. Cost - Benefit Allocation issues
The cost and benefit allocation (CBA) in cross-border electricity infrastructure projects is one of the
most important barriers that will need to be overcome for an extensive expansion of the European
interconnections. This can be both the case for transit countries and for projects in which one
country profits, while the other may face higher electricity prices. The following section will present
a few case study projects and then discuss currently existing inter-TSO compensation (ITC)
mechanisms.
4.8.1. Regulatory issues, case studies
Figure 18. Cross-border electricity investment incentive issues and possible solutions (Source: Poudineh and Rubino, 2016, p. 18)
KriegersFlak is the first cross-border offshore wind project – it is located in the Baltic Sea near the
Swedish, Danish and German coasts and connected both to the Danish and German grid (Sunila et
al., 2019, p. 776). Offshore wind capacity integration requires much larger finance volumes than
onshore wind energy, since subsea cables are more expensive and in many cross-border cases
require a converter. German windfarms e.g. use a VSC converter. Additionally, the grid is usually
already congested in coastal areas (Meeus, 2014, p. 3). Initial wind projects were built closer to the
shore and employed Medium or High Voltage Alternating Current. More recent largescale offshore
wind farms instead employ High Voltage Direct Current (HVDC). Since HVDC can only transmit 1000
MW, for bulk transmission many cables have to be installed in parallel, increasing this cost further.
Additionally, there is a very small number of suppliers of HVDC cables for a demand higher than they
can produce. Andersen (2014) thus cautions that due to technical immaturity financing for HVDC is
particularly challenging to find (p. 87/88).
Pg. Marítim de la Barceloneta, 37-49 08003 Barcelona www.medeas.eu [email protected] T +34 93 230 95 00 F +34 93 230 95 55
This project has received funding from the European Union’s Horizon 2020 research and innovation programme under grant agreement No 691287
157
Meeus writes: “these additional cost and technology uncertainties offshore imply that there
is more information asymmetry between the regulatory authority approving the investments and
the company implementing the investments. […] economies of scale are stronger for farm to shore
investments than for typical onshore connections. Onshore, it is less likely that several generators
are asking to be connected in the same area, located far from the existing grid, and around the same
time, while this is typically the case offshore. Therefore, there are more opportunities offshore to
coordinate these connections to capture economies of scale. In the case of Borwin [Germany], three
offshore wind farms have been developed in a period of 3 years in the same area.” (Meeus, 2014,
p. 3) Similarly, KriegersFlak is right next to (and will be interconnected to) the German EnBW wind
farm.
From a technical viewpoint, KriegersFlak is more complex, since it is a so-called “hybrid project”,
thus feeding energy into more than one market, Denmark and Germany: “In contrast to
conventional point-to-point interconnectors, the extension creates a meshed submarine grid (MSG)
which includes an interconnector and wind farm collectors to the countries using the same
equipment. Denmark East as part of the Nordic system and 50 Hertz as part of the synchronous
Continental European grid are asynchronous to each other, which makes a frequency
transformation necessary. The interconnection will be realised by a high-voltage direct current
(HVDC) back-to-back (BtB) converter in voltage source converter technology located at the German
end of the interconnector.” (Marten et al., 2018, p. 1493)
In the case of KriegersFlak, the Danish TSO Energinet.dk, the German TSO 50Hertz and the Swedish
TSO Svenska Kraftnät did a cost-benefit analysis regarding a trinational project. However, regulatory
differences meant investment by Sweden would not make sense and the Swedish TSO withdrew
from KriegersFlak in 2010. The issue here was that EU member states do not have unified regulations
regarding what the grid operator has to be paid for. Instead, there are three competing régimes
which make cross-border cooperation complex. Countries either apply deep connection, shallow
connection or supershallow connection charging policies. In the case of a deep connection charging
policy: the wind farm developers are responsible for the costs of connecting the windfarm to the
main grid and any reinforcement requirement. This is i.a. the case for Sweden, Finland, Poland, the
Czech Republic and Luxembourg. A shallow connection charging policy means that the generators
are only only responsible for the costs of the wind farm connection to the main grid. Finally, in a
supershallow connection charging system, applied by Germany, the TSOs are instead responsible
for the costs of the connection to the main grid. Denmark applies supershallow charging for offshore
wind projects with a high distance to shore and a shallow charging policy for offshore wind projects
that are closer to shore (Sunila et al., 2019, p. 778). The regulatory differences in the case of
Pg. Marítim de la Barceloneta, 37-49 08003 Barcelona www.medeas.eu [email protected] T +34 93 230 95 00 F +34 93 230 95 55
This project has received funding from the European Union’s Horizon 2020 research and innovation programme under grant agreement No 691287
158
KriegersFlak distorted investment decisions and the difficulties in sharing costs and benefits in such
an uncoordinated situation led to the Swedish TSO’s withdrawal from the project in 2010 (Meeus,
2014, p. 4 and Mekonnen, Huang and de Vos, 2016, p. 205). The UK allows Offshore Electricity
Transmission Owners (OFTOs), which uses “tendering for farm-to-shore investments so that third
parties can enter to invest in the grid” (Meeus, 2014, p. 5).
Similar issues of uncoordinated regimes were also one of the factors that led to the demise of the
Greenwire/Greenlink project which was supposed to interconnected Irish windfarms (located in the
Republic of Ireland) with Great Britain. In the case of Greenwire/Greenlink, the American private
equity fund Hudson Clean Energy wanted to build an interconnector for its wind energy assets in
Ireland to Great Britain, with a merchant exemption (Dutton, Lockwood, 2017, p. 379). UK Ofgem
agreed to the project with a cap-and-floor hybrid model, but only under the condition that 50% of
the costs and revenues should be undertaken by Ireland. Due to this and the fact that Ireland does
not use cap-and-floor hybrid remunerations and at least four other regulatory and competition
incompatibilities (see below), the project then failed.
a) “DECC insisted that the Ireland-based windfarms would have to compete ‘like-for-like’ with
those located onshore in GB, despite the additional costs of transferring electricity across an
interconnector. [Irish counterpart] DCENR, meanwhile, wanted the generating costs from
the Irish windfarms to be compared with more expensive UK offshore wind, and it was not
acceptable to them that DECC was prepared to pay more for UK offshore wind than Irish
onshore wind.
b) Matters were further complicated by the fact that the British renewable support schemes
(i.e. the Renewables Obligation and Contract for Difference (CfD) auctions) were not
designed for the inclusion of a foreign generator alongside GB market participants. […]
c) Unlike National Grid, the Irish SEM TSO, EirGrid, is state-owned […]. Under the terms of
EirGrid's licence it is specifically required to explore and develop opportunities to develop
interconnectors to other systems, which is done through its wholly-owned subsidiary,
EirGrid Interconnector Limited, which owns and operates EWIC [East-West Interconnector].
However, EirGrid is not allowed to benefit financially from EWIC beyond its regulated rate of
equity. […]
Pg. Marítim de la Barceloneta, 37-49 08003 Barcelona www.medeas.eu [email protected] T +34 93 230 95 00 F +34 93 230 95 55
This project has received funding from the European Union’s Horizon 2020 research and innovation programme under grant agreement No 691287
159
d) Engie, RWE, and Scottish Power argued that additional interconnection could ‘destroy value’
in the GB market, and lead to reductions of up to 10% in revenue for domestic electricity
generators. […] EDF stated in its response to Ofgem's proposed cap-and-floor regimes for
the FAB Link, IFA2, Viking Link and Greenlink interconnectors that it supports only
incremental increases in interconnector capacity. Similarly, Scottish Power had concerns
about an apparent lack of level playing field between GB and non-GB generators, and the
risk that significant growth in interconnector capacity would exacerbate competitive
distortions.” (Dutton, Lockwood, 2017, p. 380/381).
Meshed offshore grids (MOGs) are “integrated offshore infrastructure where offshore wind power
hubs are interconnected to several countries as opposed to radial connection linking the wind farm
to one single country and market” (Sunila et al., 2019, p. 775).16 However, the majority of undersea
trading cables are line-commuted convertors (LCC), which cannot be cheaply upgraded to meshed
offshore (thus transnational) wind-farms. Voltage source convertors (VSCs) needed for this are
costly and lead to a lower Energy Return on Investment (EROI). There is additionally to the
immaturity of VSCs, the technical issue of breakers for HVDC – these currently do not exist. This
means that if there is an outage in one windfarm, the entire meshed offshore grid is taken out. This
leads to energy companies and TSOs being very reluctant to invest in MOGs. German windfarms use
HVDC which lends itself to easier meshing and enable transmission of longer distances, but UK,
Danish and Dutch offshore windparks mainly use the cheaper HVAC transmission systems, which
cannot be connected. The reason that this approach was taken is that the windturbines themselves
use alternating current (AC) and German windfarms thus require expensive AC-DC converters at sea.
These are also prone to outage. KriegersFlak uses HVAC rather than HVDC due to investor concern
about this cost factor. Because of this systemic incongruence, Gorenstein-Dedecca et al. (2018) and
Sunila et al. (2019) urgently suggest the introduction of a European supranational TSO responsible
for all offshore windfarms jointly.
Explicitly so as to prevent this lack of harmonisation, the COBRA cable (Copenhagen-BRussels-
Amsterdam) by Dutch-German TenneT and Danish Energinet and going through German North Sea
waters, but not interconnecting Germany, is using the costlier HVDC so that it could be connected
16 See also the H2020 meshed offshore grid project “PROMOTION” (January 2016-December 2019)
https://www.promotion-offshore.net/
Pg. Marítim de la Barceloneta, 37-49 08003 Barcelona www.medeas.eu [email protected] T +34 93 230 95 00 F +34 93 230 95 55
This project has received funding from the European Union’s Horizon 2020 research and innovation programme under grant agreement No 691287
160
to a future meshed offshore wind grid. COBRA is a designated PCI and due to be opened in late
summer/early autumn 2019 with a delay of six months.17 Building the future VSC for COBRA on land
would cost €150 million and building this VSC convertor at sea would be many times over this.
However, this still does not end the regulation woes, as a German windfarm wishing to join the
COBRA cable that expressly was built so that it can be connected to Germany, “would have to be
promised a share of Danish taxpayer funded subsidies for offshore wind capacity, or vice versa.
German law expressly prohibited such until recent legislation.” (Flynn, 2016, p. 44/45) Germany
itself is however setting aside 5% of all subsidies for renewable energy auctions to non-German
European actors. British wind energy investors, as aforementioned in relation to GreenLink, are not
interested in further interconnection with other countries since “their core business model is selling
wind electricity into the UK and gaining premiums for that via CFD auctions” (Flynn, p. 45). This
problem was cemented by the July 2014 ECJ ruling “Ålands Vindkraft vs. Swedish Energy Agency”.
In the case at hand, the Finnish windfarm Ålands Vindkraft located in the Swedish-speaking
autonomous region of Åland in Finland, wished to access Swedish energy subsidies through a green
electricity certificate. The Swedish Energy Agency refused, arguing that in order to benefit from
Swedish green electricity certificates, it had to be physically located in Sweden. The court ruled for
the Swedish Energy Agency and repeated this strengthening of the national policies in its ruling in
(Dutch) Essent vs (Belgian) Flemish DSO weeks later (see Durand, Keay, 2014 and Szydło, 2015).18
Norway’s TSO Statkraft announced in 2015 that it would end offshore wind energy investments
precisely due to the high costs involved. The Belgian “Design Grid” is in competition to the meshed
offshore grid vision – it suggests the interconnection of trading cables for greater cross-border
electricity export with no further interconnection of offshore windfarms (Flynn, 2016, p. 43).
In their analysis of innovative financing for cross-border interconnection projects, Coxe and Meeus
(2010) highlight the EstLink project and BritNed, both merchant interconnections. EstLink, which
links Estonia to Finland, made their list since none of the five partners were TSOs and BritNed, which
links the UK and the Netherlands, because it involves short term auctions. For BritNed TenneT and
National Grid formed separate joint ventures. The European Commission introduced a cap on profits
while the project was already underway. The resulting obstacles and financing issues led to Ofgem
developing their floor and cap model (Goldberg, 2018).
17 “Cable delay snags COBRA”, ReNews, 7 September 2018. https://renews.biz/47579/cable-snag-delays-cobra/
18 ECJ ruling Ålands Vindkraft available here: http://curia.europa.eu/juris/liste.jsf?num=C-573/12, the ruling concerning
Essent available here: http://curia.europa.eu/juris/liste.jsf?language=en&num=C-204/12
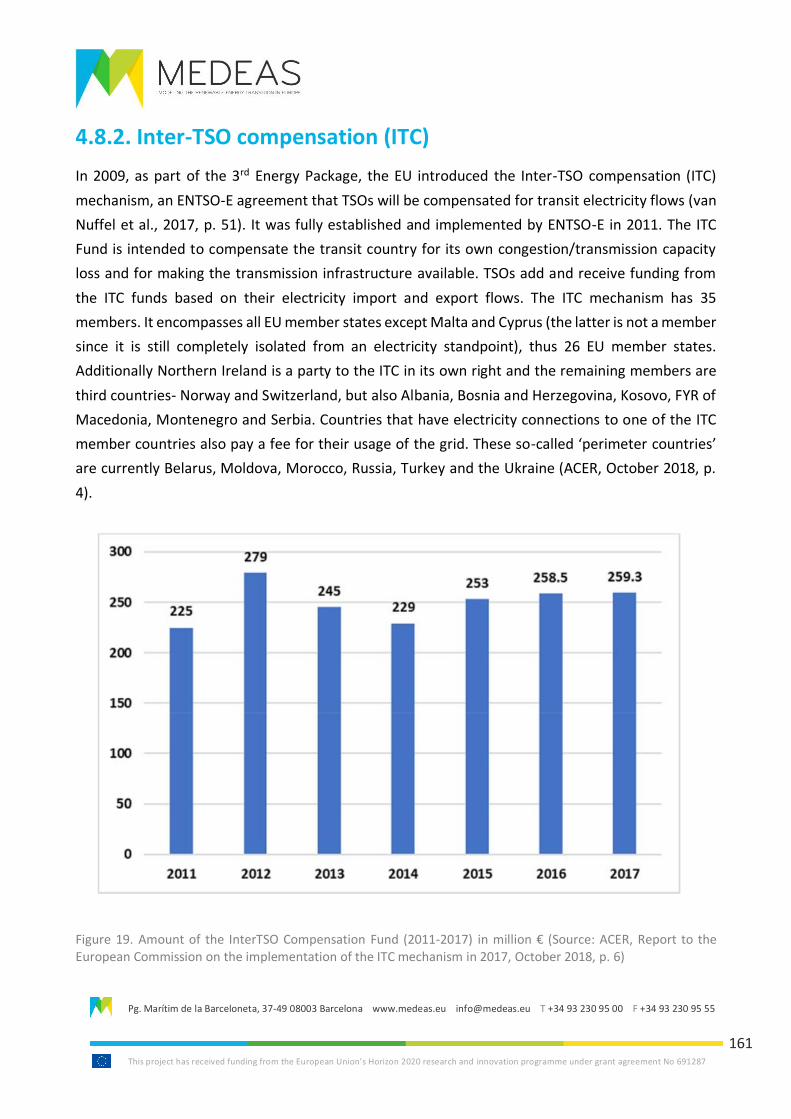
Pg. Marítim de la Barceloneta, 37-49 08003 Barcelona www.medeas.eu [email protected] T +34 93 230 95 00 F +34 93 230 95 55
This project has received funding from the European Union’s Horizon 2020 research and innovation programme under grant agreement No 691287
161
4.8.2. Inter-TSO compensation (ITC)
In 2009, as part of the 3rd Energy Package, the EU introduced the Inter-TSO compensation (ITC)
mechanism, an ENTSO-E agreement that TSOs will be compensated for transit electricity flows (van
Nuffel et al., 2017, p. 51). It was fully established and implemented by ENTSO-E in 2011. The ITC
Fund is intended to compensate the transit country for its own congestion/transmission capacity
loss and for making the transmission infrastructure available. TSOs add and receive funding from
the ITC funds based on their electricity import and export flows. The ITC mechanism has 35
members. It encompasses all EU member states except Malta and Cyprus (the latter is not a member
since it is still completely isolated from an electricity standpoint), thus 26 EU member states.
Additionally Northern Ireland is a party to the ITC in its own right and the remaining members are
third countries- Norway and Switzerland, but also Albania, Bosnia and Herzegovina, Kosovo, FYR of
Macedonia, Montenegro and Serbia. Countries that have electricity connections to one of the ITC
member countries also pay a fee for their usage of the grid. These so-called ‘perimeter countries’
are currently Belarus, Moldova, Morocco, Russia, Turkey and the Ukraine (ACER, October 2018, p.
4).
Figure 19. Amount of the InterTSO Compensation Fund (2011-2017) in million € (Source: ACER, Report to the European Commission on the implementation of the ITC mechanism in 2017, October 2018, p. 6)
Pg. Marítim de la Barceloneta, 37-49 08003 Barcelona www.medeas.eu [email protected] T +34 93 230 95 00 F +34 93 230 95 55
This project has received funding from the European Union’s Horizon 2020 research and innovation programme under grant agreement No 691287
162
The compensation that ITC members can receive for providing cross-border electricity infrastructure
is set at €100 million per year by the European Commission. These €100 million annually are then
distributed among ITC member states (and Northern Ireland) by the Transit and Load Factor
calculation: “The Transit Factor refers to the amount of transits carried by an ITC Party as a
proportion of the total transits carried by all ITC Parties. The Load Factor refers to the relative
amount of transits measured by the square of transits divided by the level of the load plus transits
in proportion to the relative amount of transits for all ITC Parties. In apportioning the infrastructure
compensation amount for an ITC Party, the Transit Factor has a weighting of 75% and the Load
Factor of 25%.” (ACER, October 2018, p. 11)
The ITC is in need of reform, as while TSOs receive cross-border infrastructure compensation
payments of about €100 million, TSO congestion revenues already in 2010 had been €1,300 million!
The Climate Policy Initiative and the Florence School of Regulation noted already in 2012:
“the current methodology was initially introduced as a temporary solution until a methodology with
sufficient precision was established and agreed upon. Several such attempts to replace the
‘temporary’ solution have failed over the last decade. This can be attributed to the decision that
existing and new lines are treated equivalently. As more lines exist than are built, the existing lines
primarily determine how the pot is allocated. Therefore discussions are dominated by attempts of
all parties to capture a larger share of the pot, rather than by finding a precise methodology to
appropriately reward benefits of new lines. Hence the only change that was possible was a
downsizing of the pot so as to limit the rent transfer between countries. The result is an imprecise
mechanism of insufficient scale.” (Neuhoff, Boyd and Glachant, 2012, p. 8)
Additionally, the ITC should be reconfigured to ensure that interconnection does not lead to cheaper
coal energy being exported (Zafirakis, Chalvatzis, and Baiocchi, 2015). Hadush, de Jonghe and
Belmans (2015) in their assessment find no strong correlation between actual transit amounts and
ITC charges. They argue for a reform and argue that while the ITC was originally not designed to
entice cross-border infrastructure investment, that “the volume and pattern of cross-border
investment is sensitive to the ITC fund size. […] Furthermore, it can be observed that trying to
increase the ITC fund is risky as it might further discourage TSOs to cooperate for investment in
cross-border transmission capacity.” (Hadush, de Jonghe and Belmans, 2015, p. 681)
There are furthermore issues of cost-sharing when it comes to redispatching and loop flows.
Currently, TSOs usually shut off cross-border trade in case of congestion and loop flows. The Expert
Group on Interconnection suggests instead that “the costs of remedial actions should be shared
based on the ‘polluter-pays principle’, where the unscheduled flows over the overloaded network
Pg. Marítim de la Barceloneta, 37-49 08003 Barcelona www.medeas.eu [email protected] T +34 93 230 95 00 F +34 93 230 95 55
This project has received funding from the European Union’s Horizon 2020 research and innovation programme under grant agreement No 691287
163
elements should be identified as ‘polluters’ and they should contribute to the costs in proportion to
their contribution to the overload.” (Expert Group, 2017, p. 16)
Cepeda proposes that TSOs can reserve interconnection capacity through buying forward
transmission rights:
“This reservation of capacity might thus ensure the availability of cross-border transmission capacity
for foreign capacity providers to meet capacity commitments. […] If an agreement is reached, RTE
will auction the so-called ‘interconnection tickets’ which foreign capacity providers might bid for
once they have pre-certified their available generation capacity. The number of interconnection
tickets are equal to the overall statistical explicit contribution. The foreign capacity providers will be
certified based on the number of interconnection tickets they can procure in the auction. Then, their
certificates can be traded in the French capacity market as per any certificate from a local
generator.” (Cepeda, 2018, p. 30)
Cepeda furthermore cautions that there will need to also be a compensation for the CO2 effects of
interconnection. He illustrates his case with the example of UK-French interconnection: “In the GB
market, cross-border participation in capacity markets reduce CO2 emissions as: first, French excess
generation adequacy contributes to ensure GB generation adequacy which reduces the need for
more carbon intensive technologies; and second, coal generation is phased out from 2025 and
replaced by gas-fired and nuclear generation. In contrast, CO2 emissions in France increase due to
two reasons. One the one hand, the excess of carbon intensive peak-load generation in France is
used to contribute to supply GB consumers; and on the other hand, the share of electricity from
nuclear is significant reduced over time and replaced by gas-fired and RES generation.” (Cepeda,
2018, p. 36). This has important implications for country level carbon budgets that are included in
the MEDEAS scenarios.
PCIs can apply cross-border cost allocation (CBCA) from the Connecting Europe Facility (CEF) and
rulings on CBCA from ACER, if the participating member states’ TSOs cannot reach an agreement
within six months. The CEF does not however, automatically grant this. In the first two years of its
existence (2013-2015), four electricity projects and nine gas PCIs had applied. In only one gas project
could the two partners, Poland and Lithuania, not agree on the cost allocation within the six months
time period (see Meeus, L. and Keyaerts, N., 2015).
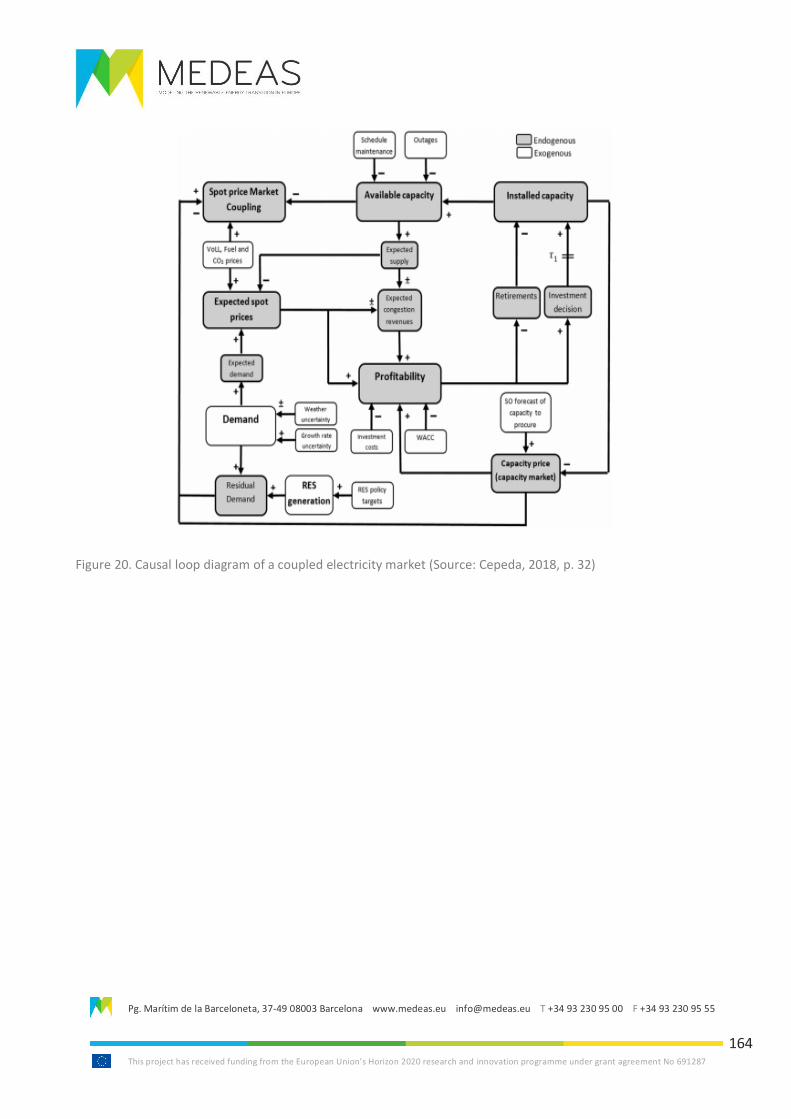
Pg. Marítim de la Barceloneta, 37-49 08003 Barcelona www.medeas.eu [email protected] T +34 93 230 95 00 F +34 93 230 95 55
This project has received funding from the European Union’s Horizon 2020 research and innovation programme under grant agreement No 691287
164
Figure 20. Causal loop diagram of a coupled electricity market (Source: Cepeda, 2018, p. 32)
Pg. Marítim de la Barceloneta, 37-49 08003 Barcelona www.medeas.eu [email protected] T +34 93 230 95 00 F +34 93 230 95 55
This project has received funding from the European Union’s Horizon 2020 research and innovation programme under grant agreement No 691287
165
4.8.3. Capacity Remuneration Mechanisms (CRMs)
Due to the aforementioned “utility death spiral”, which in the case of largescale grid defection due
to e.g. rooftop solar power, may lead to a loss of profitability for utility companies, some member
states have introduced capacity remuneration mechanisms (CRMs) – funding to ensure at least the
capacity needed at peak demand and to avert blackouts. In theory, CRMs could be designed to act
as investment driver, such as auctions, but this has not been the dominant approach (van Nuffel,
Rademaekers and Yearwood et al., European Energy Investments, 2017, p. 46). Overall, these CRMs
need to be harmonised, which they currently are not.
Cepeda argues for the inclusion of foreign generators and interconnectors in these CRMs to trigger
further investment (Cepeda, 2018, p. 38). Possible methodologies here would be
I. “the statistically likely contribution from interconnectors (i.e. implicit cross-border
participation with no trade of capacity rights);
II. the explicit participation of the interconnectors in capacity mechanisms;
III. the actual cross-border participation of foreign generation capacity under heterogeneous
capacity mechanism;
IV. the actual cross-border participation of foreign generation capacity under harmonised
capacity mechanisms and;
V. the implementation of pan-European capacity mechanism.” (Cepeda, 2018, p. 29)
The UK capacity mechanism allows interconnectors to bid for capacity auctions from 2019/2020
onwards (Cepeda, 2018). Price caps in the day-ahead and intraday markets are already unified in
the Capacity Allocation and Congestion Management Regulation (Cepeda, 2018).
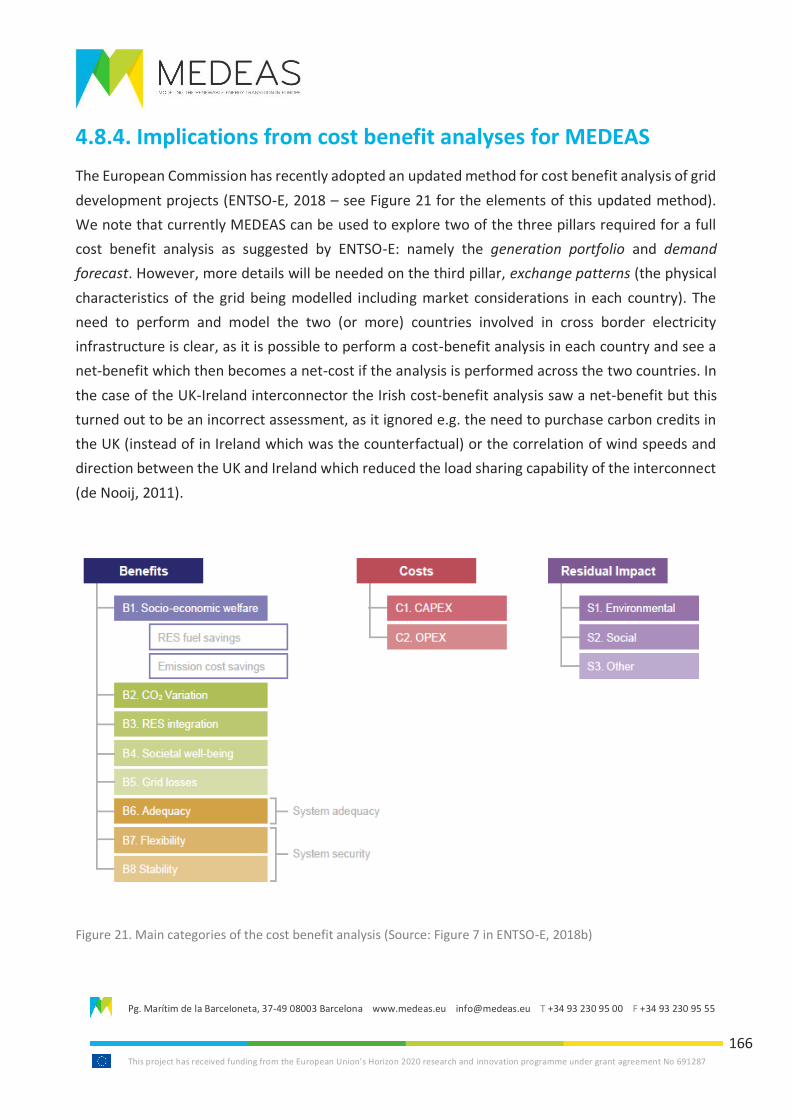
Pg. Marítim de la Barceloneta, 37-49 08003 Barcelona www.medeas.eu [email protected] T +34 93 230 95 00 F +34 93 230 95 55
This project has received funding from the European Union’s Horizon 2020 research and innovation programme under grant agreement No 691287
166
4.8.4. Implications from cost benefit analyses for MEDEAS
The European Commission has recently adopted an updated method for cost benefit analysis of grid
development projects (ENTSO-E, 2018 – see Figure 21 for the elements of this updated method).
We note that currently MEDEAS can be used to explore two of the three pillars required for a full
cost benefit analysis as suggested by ENTSO-E: namely the generation portfolio and demand
forecast. However, more details will be needed on the third pillar, exchange patterns (the physical
characteristics of the grid being modelled including market considerations in each country). The
need to perform and model the two (or more) countries involved in cross border electricity
infrastructure is clear, as it is possible to perform a cost-benefit analysis in each country and see a
net-benefit which then becomes a net-cost if the analysis is performed across the two countries. In
the case of the UK-Ireland interconnector the Irish cost-benefit analysis saw a net-benefit but this
turned out to be an incorrect assessment, as it ignored e.g. the need to purchase carbon credits in
the UK (instead of in Ireland which was the counterfactual) or the correlation of wind speeds and
direction between the UK and Ireland which reduced the load sharing capability of the interconnect
(de Nooij, 2011).
Figure 21. Main categories of the cost benefit analysis (Source: Figure 7 in ENTSO-E, 2018b)
Pg. Marítim de la Barceloneta, 37-49 08003 Barcelona www.medeas.eu [email protected] T +34 93 230 95 00 F +34 93 230 95 55
This project has received funding from the European Union’s Horizon 2020 research and innovation programme under grant agreement No 691287
167
This methodology should be applied to future MEDEAS scenarios as multiple countries are run
alongside each other to allow a more detailed assessment of the assumptions made and costs (and
benefits) involved. However, it is also noted that there are many assumptions involved on both costs
(capital costs, currency exchanges, interest rates) and benefits (carbon price, value of security of
supply) which can make the range of net benefits from these types of infrastructure very large (and
indeed ranging from negative to positive). Some of these assumptions are based on future
uncertainties associated with particular technology developments of market behaviours. However
some can be influenced by value-judgements linked to the standpoint of the analyst (Schmidt &
Lilliestam, 2015). Therefore, the sensitivity analysis of MEDEAS is key and any assumptions made
for key parameters should be as transparent as possible (see for example the use of expert
elicitation in MEDEAS Deliverable 5.2).
A full cost-benefit analysis (Figure 21) of the various scenarios developed by MEDEAS is only possible
when model outputs are combined with (or a future MEDEAS model includes) specific geographic
deployment of particular technologies, as well as the national and European politics associated with
this geographic diversity (Scheibe, 2018), investment and pricing, and how infrastructure is
connected through the grid (see Figure 22). In addition, the cost benefit of any MEDEAS scenario
needs to be compared to a counterfactual - that is a future baseline scenario which needs to be
considered as a fair comparison. This is particularly important as it is not necessarily the case that
the benefits of any scenarios need to outweigh the costs – just that the cost-benefit calculation for
one scenario needs to be better than the counterfactual. However, defining the counterfactual is
very difficult – should it be business as usual (BaU), a scenario where no additional action on climate
change is taken, a scenario where modest technological improvement increases over time or
something else. We propose that the current formulation of BaU within MEDEAS would be an
appropriate counterfactual for any cost-benefit analysis.
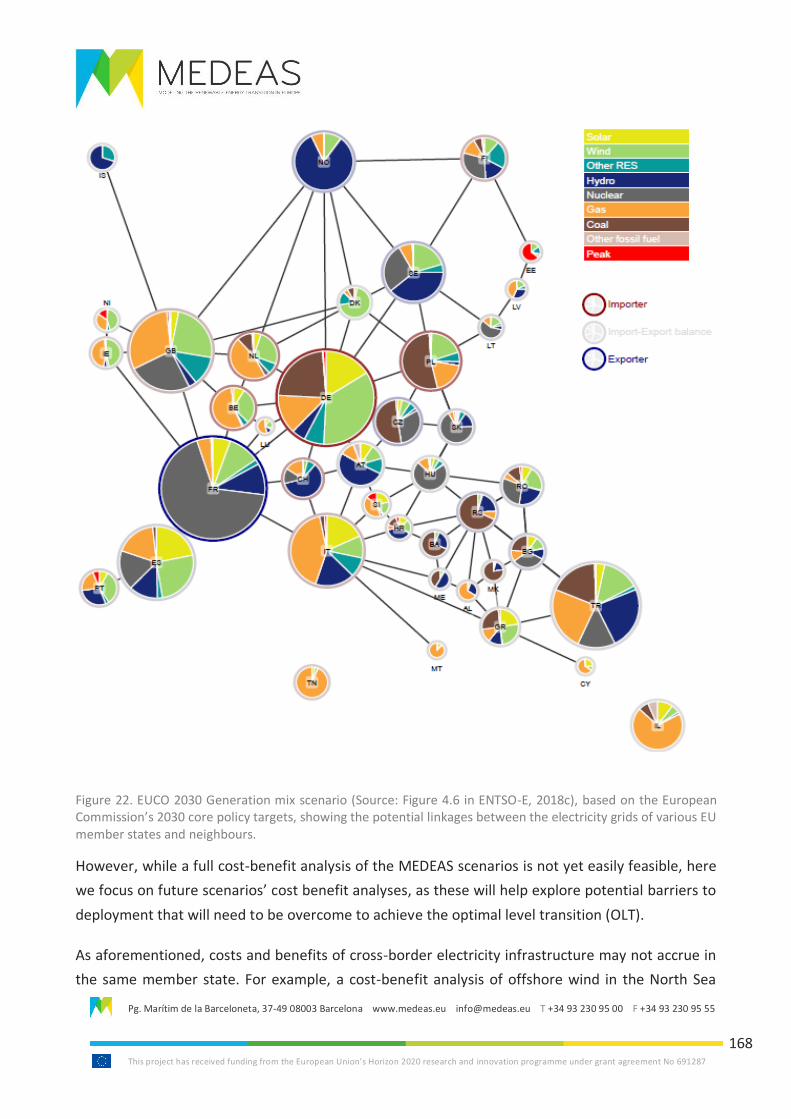
Pg. Marítim de la Barceloneta, 37-49 08003 Barcelona www.medeas.eu [email protected] T +34 93 230 95 00 F +34 93 230 95 55
This project has received funding from the European Union’s Horizon 2020 research and innovation programme under grant agreement No 691287
168
Figure 22. EUCO 2030 Generation mix scenario (Source: Figure 4.6 in ENTSO-E, 2018c), based on the European Commission’s 2030 core policy targets, showing the potential linkages between the electricity grids of various EU member states and neighbours.
However, while a full cost-benefit analysis of the MEDEAS scenarios is not yet easily feasible, here
we focus on future scenarios’ cost benefit analyses, as these will help explore potential barriers to
deployment that will need to be overcome to achieve the optimal level transition (OLT).
As aforementioned, costs and benefits of cross-border electricity infrastructure may not accrue in
the same member state. For example, a cost-benefit analysis of offshore wind in the North Sea
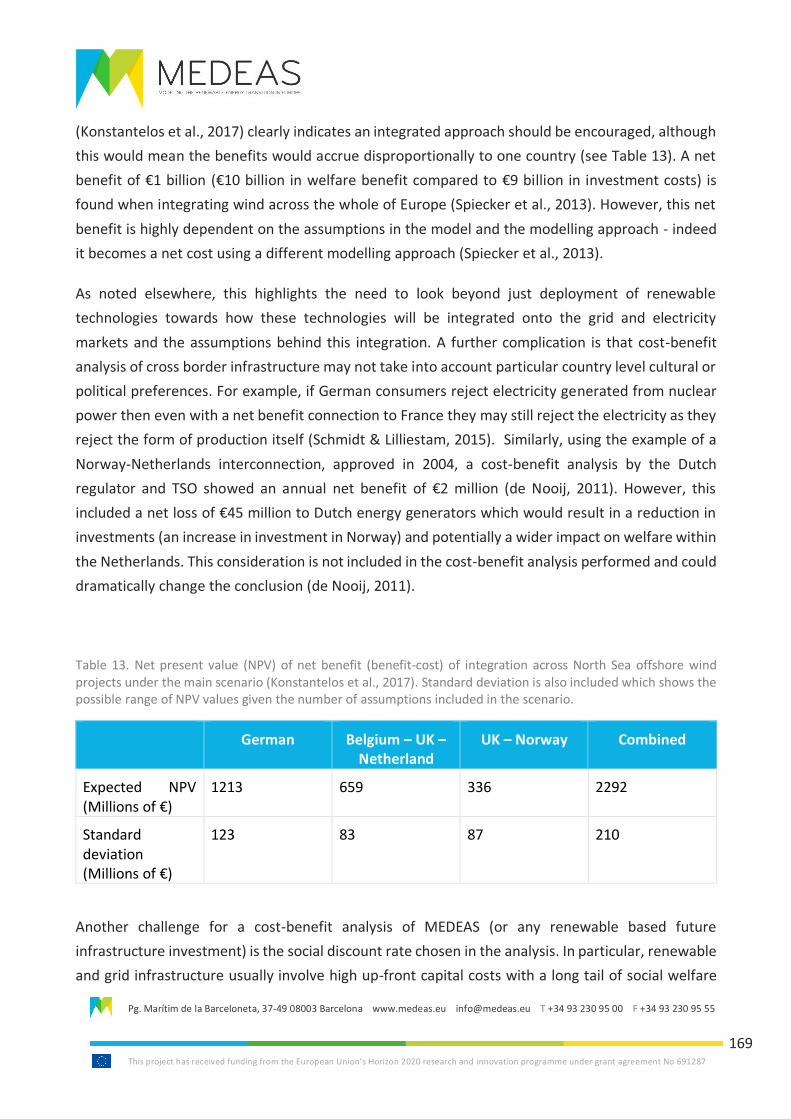
Pg. Marítim de la Barceloneta, 37-49 08003 Barcelona www.medeas.eu [email protected] T +34 93 230 95 00 F +34 93 230 95 55
This project has received funding from the European Union’s Horizon 2020 research and innovation programme under grant agreement No 691287
169
(Konstantelos et al., 2017) clearly indicates an integrated approach should be encouraged, although
this would mean the benefits would accrue disproportionally to one country (see Table 13). A net
benefit of €1 billion (€10 billion in welfare benefit compared to €9 billion in investment costs) is
found when integrating wind across the whole of Europe (Spiecker et al., 2013). However, this net
benefit is highly dependent on the assumptions in the model and the modelling approach - indeed
it becomes a net cost using a different modelling approach (Spiecker et al., 2013).
As noted elsewhere, this highlights the need to look beyond just deployment of renewable
technologies towards how these technologies will be integrated onto the grid and electricity
markets and the assumptions behind this integration. A further complication is that cost-benefit
analysis of cross border infrastructure may not take into account particular country level cultural or
political preferences. For example, if German consumers reject electricity generated from nuclear
power then even with a net benefit connection to France they may still reject the electricity as they
reject the form of production itself (Schmidt & Lilliestam, 2015). Similarly, using the example of a
Norway-Netherlands interconnection, approved in 2004, a cost-benefit analysis by the Dutch
regulator and TSO showed an annual net benefit of €2 million (de Nooij, 2011). However, this
included a net loss of €45 million to Dutch energy generators which would result in a reduction in
investments (an increase in investment in Norway) and potentially a wider impact on welfare within
the Netherlands. This consideration is not included in the cost-benefit analysis performed and could
dramatically change the conclusion (de Nooij, 2011).
Table 13. Net present value (NPV) of net benefit (benefit-cost) of integration across North Sea offshore wind projects under the main scenario (Konstantelos et al., 2017). Standard deviation is also included which shows the possible range of NPV values given the number of assumptions included in the scenario.
German Belgium – UK – Netherland
UK – Norway Combined
Expected NPV (Millions of €)
1213 659 336 2292
Standard deviation (Millions of €)
123 83 87 210
Another challenge for a cost-benefit analysis of MEDEAS (or any renewable based future
infrastructure investment) is the social discount rate chosen in the analysis. In particular, renewable
and grid infrastructure usually involve high up-front capital costs with a long tail of social welfare

Pg. Marítim de la Barceloneta, 37-49 08003 Barcelona www.medeas.eu [email protected] T +34 93 230 95 00 F +34 93 230 95 55
This project has received funding from the European Union’s Horizon 2020 research and innovation programme under grant agreement No 691287
170
and income returns – any social discount rate used in the calculations has a value judgement that is
inherently biased against climate change solutions (Schmidt & Lilliestam, 2015). For MEDEAS we
therefore propose a social discount rate of zero, or very low, as an appropriate choice.
Pg. Marítim de la Barceloneta, 37-49 08003 Barcelona www.medeas.eu [email protected] T +34 93 230 95 00 F +34 93 230 95 55
This project has received funding from the European Union’s Horizon 2020 research and innovation programme under grant agreement No 691287
171
4.9. Current and future Governance
Currently, the internal European coordination governance architecture in this area consists mainly
of ACER (operational in 2011) and ENTSO-E (created in 2008 to combine five pre-existing regional
TSO bodies – the oldest of which dated from 1951). ACER’s role focuses on cross-border electricity
infrastructure and wholesale market supervision. Nonetheless, some of the regulatory and technical
issues detailed in previous sections indicate that there are still large efficiency losses and thus
greater investment risks linked to fragmentation. This includes the fact that only two TSOs operate
crossnationally and that only the Nordic countries have a fully integrated electricity market
(Nordpool). Under the adoption of the 3rd energy package from 2009, the EU should have had a fully
integrated electricity market by 2014, which was not implemented. The EU Energy Union was
adopted in 2014.
European TSOs furthermore operate at different voltage levels, which means that costly
transformers are needed to connect e.g. Scandinavia to the rest of continental Europe (Newman,
2015; for a list of European TSOs’ voltages see ENTSO-E, Overview of Transmission Tariffs in Europe,
June 2017, p. 37)
The creation of the TYNDP by ENTSO-E is still primarily “a bottom-up process” listing national
initiatives, based on national interests. A report for the European Parliament’s ITRE Committee
argues that “[t]his might be a major reason why the interconnection level is still rather low in some
MSs (and well below the overall economically optimal level). A top down methodology to identify
and select transmission grid investment projects that offer the highest overall added value at EU
level, might be more efficient than the current approach” (van Nuffel, Rademaekers and Yearwood
et al., European Energy Investments, 2017, p. 86).
Already in 2010, Battaglini and Lilliestam argued for a replacement of national grid-access tariffs by
European tariffs and TSOs building grid infrastructure and submitting their costs and recovery plans
to a European rather than national regulator (Battaglini and Lilliestam, 2010, p. 5).
From 2015 till 2018, ENTSO-E has been setting up five Regional Security Coordinators (RSCs). These
are separate companies with control centres monitoring the quantity of renewable energy in the
system and the grid in order to ascertain supply security and system stability. The RSCs report to
TSOs with guidance, but do not actually then implement these findings - that is still the role of TSOs
(see ENTSO-E, RSCIS Factsheet).
Pg. Marítim de la Barceloneta, 37-49 08003 Barcelona www.medeas.eu [email protected] T +34 93 230 95 00 F +34 93 230 95 55
This project has received funding from the European Union’s Horizon 2020 research and innovation programme under grant agreement No 691287
172
In the EU, electricity market prices are implicitly set through market-coupling through seven regional
European Power Exchanges (PX). These are joined into one under the day-ahead Price Coupling of
Regions (PCR) initiative, which represent 85% of all EU electricity consumption (Zakeri et al., 2016,
p. 1640).19 This was initiated in 2014 and combines the TSOs and Power Exchanges of Austria,
Belgium, the Czech Republic, Denmark, Estonia, Finland, France, Germany, Great Britain (not
Northern Ireland), Latvia, Lithuania, Luxembourg, the Netherlands, Norway, Poland, Portugal, Spain
and Sweden (Loureiro, Claro and Fischbeck, 2019, p. 194). In June 2018 the European cross-border
intraday electricity trading platform XBID was launched. It involves mostly the same TSOs as the PCR
initiative and in the future these two governance systems (for cross-border day-ahead market PCR
and for cross-border intraday market XBID) will need to be merged.20
Other recent European electricity developments include the implementation of the Capacity
Allocation and Congestion Management (CACM) Regulation in 2015 and the Capacity Calculation
Regions in 2016. The CACM is a code regulating intraday trading, redispatching and countertrading
in the EU. Capacity calculation regions are transnational areas of cross-border electricity flow
coordination and capacity allocation. Both monitoring of the CACM and capacity calculation regions
are under the remit of ACER.
In late March 2019, several important legal updates in this regard were adopted by European
Parliament. The new rules mandate that countries have to ensure that 70% of capacity is made
available for cross-border trading – the remaining 30% may be used for loop flows (European
Parliament, March 2019). There had previously be internal disagreements between the
Scandinavian countries and Germany – Germany wished not only for a minimum capacity, but
additionally a 75% maximum. Currently, only 30% of cross-border capacity is used (Simon, 2018b).
Furthermore, ACER’s role has been upgraded to become EU Energy Union regulator, following the
same pathway as previous upgradings of financial pan-European committees (the European Banking
Authority, the European Securities and Markets Authority and the European Insurance and
Occupational Pensions Authority) (Crisp, 2015a) Under its greater powers, ACER will monitor and
assess regional TSO cooperation in the gas and electricity sectors and will help settle cross-border
disputes (Simon, 2018a). ACER will now give instructions to ENTSO-E in cases in which ACER deems
ENTSO-E to not have complied “with their obligations […] If a case of non-compliance is identified,
19 https://www.epexspot.com/en/market-coupling/pcr
20 “Cross-Border Intraday: Questions & Answers”, 4 December 2018.
https://www.nordpoolspot.com/globalassets/download-center/xbid/xbid-qa_final.pdf

Pg. Marítim de la Barceloneta, 37-49 08003 Barcelona www.medeas.eu [email protected] T +34 93 230 95 00 F +34 93 230 95 55
This project has received funding from the European Union’s Horizon 2020 research and innovation programme under grant agreement No 691287
173
the national regulatory authorities concerned must decide on measures to be taken. If no such
decision is taken within 4 months, ACER should take the decision instead.” (European Parliament,
2018) Additionally, ACER will now accept third country TSO members.
Pg. Marítim de la Barceloneta, 37-49 08003 Barcelona www.medeas.eu [email protected] T +34 93 230 95 00 F +34 93 230 95 55
This project has received funding from the European Union’s Horizon 2020 research and innovation programme under grant agreement No 691287
174
4.10. Interconnections with 3rd countries
While previous sections have addressed the infrastructure needed to transport renewable energy
from EU regions with high wind, hydro and/or solar potential to areas within the EU of high energy
consumption, some of the most ambitious renewable energy expansion plans focus on
interconnection of the EU to other regions. This includes e.g. interconnections of the EU in the
Mediterranean to Northern Africa. One vision of such interconnection in the past included the
Desertec, Medgrid and Supergrid projects. These are interlinked – Desertec and Medgrid signed a
Memorandum of Understanding in November 2011 and Desertec, Medgrid and Friends of the
Supergrid signed a second MoU in March 2012. Deserted and Medgrid were intended as the
foundations of the European Supergrid. Often the European SuperGrid vision is pitted against a
decentralised smartgrid. Additionally, the idea of a SuperSmartGrid to integrate these two often
seen as contrasting blueprints has been developed (see e.g. Child, Kemfert, Bogdanov and Breyer,
2019 or Arcia-Garibaldi, Cruz-Romero, and Gómez-Expósito, 2018 or Hojčková, Sandén and Ahlborg,
2017 or Blarke and Jenkins, 2013).
Desertec was an initiative supported i.a. by the Club of Rome and large German companies like
Siemens and RWE. North African governments on board included Jordan, Algeria, Tunisia, Syria and
Morocco. Funding for Desertec was provided by insurance company Munich RE, Deutsche Bank,
KfW and Nordbank. Munich RE actually played a key role in moving the project from academic and
NGO niche to largescale commercial and corporate vision (Schmitt, 2018, p. 756). The Desertec
consortium was created in January 2009 and the Medgrid consortium in July 2010. While the
Desertec consortium was dominated by German companies, Medgrid was a French partner initiative
launched under the umbrella of the Union for the Mediterranean. Siemens was part of both
Desertec and Medgrid. The basic idea was to create largescale solar and wind farms in the Sahara
Desert and the Arabian peninsula. The renewable energy created was then to be exported to the
European continent via i.a. subsea HVDC cables to Ceuta, Sicily, Cyprus and Corsica. Siemens’ own
cost estimates for Desertec and the grid infrastructure required came to €400 billion. Friends of the
Supergrid is a lobby group which includes e.g. AQUIND, Tideway and Phillippe & Partners lawyers.
By December 2012, the Tunisian government had toppled, investors were uneasy about the general
political instability in the region, some of the solar companies involved had gone bankrupt due to
Chinese competition and Siemens pulled out and abandoned its concentrated solar power (CSP)
branch. By summer 2013, the project had failed (Hall, 2013 and Calderbank, 2013). Factors in the
failure of the Desertec project as backbone for the European supergrid included the recession,
internal changes in key partner countries and project-internal disputes concerning neocolonialism,
thus the question how much of the infrastructure would be used to provided electricity to North
Pg. Marítim de la Barceloneta, 37-49 08003 Barcelona www.medeas.eu [email protected] T +34 93 230 95 00 F +34 93 230 95 55
This project has received funding from the European Union’s Horizon 2020 research and innovation programme under grant agreement No 691287
175
Africa itself and how much was purely for export to Europe. On the flip side, some German analysts
and politicians claimed that German utilities giants like E.On and RWE joined Desertec as a diversion,
in order to stunt internal German solar and wind industry – akin to coal companies arguing for CCS
in order to be able to continue to claim that coal mining and burning is a viable sustainable practice.
After the 2009 financial crisis, Spain stopped its feed in tariffs, which made the financial
remuneration of future import to Spain (one of the key interconnection links) less attractive
(Schmitt, 2018, p. 765).
A Euro-Mediterranean project of note is the aforementioned EuroAsia Interconnector PCI, which
aims to link continental Greece, the islands of Crete and Cyprus with Israel by 2023. Since China
State Grid owns a 24% stake in Greece’s grid operator ADMIE, China has been seeking to invest in
the EuroAsia Interconnector as well (Koutantou and Maltezou, 2017).
Poudineh and Rubino (2016, p. 16) argue that the clash between North African lack of bundling and
European unbundling as well as the extremely disparate financial capabilities combined with high
financial risk due to political risk in the region, requires a new business model focused more on
public-private partnerships (PPP). So far, the EBRD and the Facility for Euro-Mediterranean
Investment and Partnership (FEMIP) of the European Investment Bank, which provides loans,
guarantees, private equity and technical assistance, have been dominant in funding (Tagliapietra,
2017, p. 182/183).
In 2006, the MedReg (Association of Mediterranean Energy Regulators) was founded, followed by
the creation in 2012 of the MedTSO (Association of Mediterranean TSOs) (see Tagliapietra, 2017, p.
179). MedTSO publishes the Mediterranean Master Plan for Infrastructure Investment, a
Mediterranean equivalent to the TYNDP. It furthermore works towards harmonisation and
coordination of grid investments, interconnections and grid codes. In 2018, MedTSO’s
Mediterranean Master Plan of Interconnections 2030 was published, which includes CBAs and
project statutes of Mediterranean interconnections. The funding need for three corridors of
Mediterranean interconnections identified by MedTSO lies at €16 billion (Engerati, 2018). MedReg
Electricity Working Group has e.g. compiled reports on “Regulatory options for the stimulation of
infrastructure investments” (2018) and “Interconnection infrastructures in the Mediterranean: a
challenging environment for investments” (2015).
In the future, the UK will after Brexit also have the status of a third country. The UK imported about
9% of its electricity in 2015 and 6% in 2018 (Dutton, 2019, p. 2). Due to Brexit, several planned
interconnector projects have been delayed or cancelled, including interconnections to Iceland
(Kelly, Adomaitis, 2016) and France (Dutton, Lockwood, 2017, p. 383). Further interconnections are
Pg. Marítim de la Barceloneta, 37-49 08003 Barcelona www.medeas.eu [email protected] T +34 93 230 95 00 F +34 93 230 95 55
This project has received funding from the European Union’s Horizon 2020 research and innovation programme under grant agreement No 691287
176
planned with Denmark, Ireland, Norway (Dutton, 2019, p. 11) and Germany (Rickson, 2019). In case
of a No Deal Brexit, the UK will be excluded from the Internal Energy Market (IEM) and the European
cross-border intraday electricity trading platform XBID. The UK would thus be excluded from implicit
trading (Dutton, 2019, p.9). The European Commission has furthermore announced that in this case,
the EU would charge an “interconnector usage fee” to the UK (Geske, Green, Staffell, 2018, p.3) A
simulation of additional costs due to a No Deal Brexit and electricity market uncoupling came to €
560m per year, which amounts to 1.5% of the common market value (Geske, Green, Staffell, 2018,
p. 20). In case of a No Deal Brexit, a further issue is that the Republic of Ireland and Northern Ireland
since 2007 form the Single Electricity Market – thus operate as one national entity from an electricity
market standpoint. This would become impossible for various reasons after a No Deal Brexit and an
uncoupling of the Northern Irish and RoI electricity market would thus become necessary (BEIS;
2019). Even in the case of a negotiated Brexit, a market conflict resolution mechanism to replace
the ECJ would need to be implemented (Cormacain, 2018). The UK will lose access to CEF and other
EIB funding and will leave ACER and ENTSO-E (for Brexit and EIB funding for UK energy projects see
House of Lords, European Union Committee, Brexit: the European Investment Bank, 2019, p. 5).
Pg. Marítim de la Barceloneta, 37-49 08003 Barcelona www.medeas.eu [email protected] T +34 93 230 95 00 F +34 93 230 95 55
This project has received funding from the European Union’s Horizon 2020 research and innovation programme under grant agreement No 691287
177
4.11. Implications for MEDEAS
For MEDEAS the implications are clear. A lack of regulatory certainty, the complexity of cross-
jurisdiction investment both across the EU and to third party countries as well as other governance
issues means that without a strategic EU approach to cross border infrastructure development
delays in project delivery are to be expected. Additionally, governments need to acknowledge the
scale of the required investment so as to allow tariff recovery (i.e. electricity prices might need to
increase in some countries), and to align policy instruments to underpin investment (including
removing fossil fuel subsidies) so as to avoid downgrading the credit ratings of TSOs or energy
companies that proactively engage in renewable and cross border infrastructure assets.
Given that in the MEDEAS OLT investment in infrastructure is needed from 2020, with a shift to a
renewable based energy system across the whole of the EU by 2050, any delays due to investment
difficulties will have a significant impact on the feasibility of the delivery of OLT. Therefore, alongside
the modelling of technology requirements under an OLT scenario it is important to include
consideration for a more dynamic engagement at a pan-European regulatory level.
We have not currently performed a cost-benefit analysis on the MEDEAS scenarios but instead have
highlighted the need for clarity and transparency around the assumptions used within the MEDEAS
model which would inform a cost-benefit analysis using the ENTSO-E (2018) method. In particular,
each country involved in any cross-border infrastructure needs to be modelled and linked within the
MEDEAS framework to ensure assumptions across countries are consistent.
Pg. Marítim de la Barceloneta, 37-49 08003 Barcelona www.medeas.eu [email protected] T +34 93 230 95 00 F +34 93 230 95 55
This project has received funding from the European Union’s Horizon 2020 research and innovation programme under grant agreement No 691287
178
References
Abrell, J., and Rausch, S., 2016. Cross-country electricity trade, renewable energy and European
transmission infrastructure policy. Journal of Environmental Economics and Management. 79 (1):
87-113.
ACER, October 2018. Report to the European Commission on the implementation of the ITC
mechanism in 2017.
Ammermann, H., Diederich, H. Anke Janousch, Matthias Krebs, Yvonne Ruf, November 2016. Cost-
Effective Financing Structures for Mature Projects of Common Interest (PCIs) in Energy. Roland
Berger. https://publications.europa.eu/en/publication-detail/-/publication/4bcfb6f3-e13c-11e6-
ad7c-01aa75ed71a1
Andersen, A., 2014. No transition without transmission: HVDC electricity infrastructure as an
enabler for renewable energy? Environmental Innovation and Societal Transitions. 13:75-95.
Arcia-Garibaldi, Guadalupe, Pedro Cruz-Romero, and Antonio Gómez-Expósito, 2018. "Future power
transmission: Visions, technologies and challenges." Renewable and Sustainable Energy Reviews.
94: 285-301.
Ardelean, M. and Minnebo, P., 2017. A China-EU electricity transmission link. Assessment of
potential connecting countries and routes. Luxembourg: Joint Research Centre, Publications Office
of the European Union.
Arezki, R., Bolton, P., Peters, S., Samama, F. and Stiglitz, J., February 2016. From Global Savings Glut
to Financing Infrastructure. IMF Working Paper.
Battaglini, A. and Lilliestam, J., 2010. On Transmission Grid Governance. Berlin: Heinrich Böll
Foundation.
BEIS (UK Department for Business, Energy and Industrial Strategy), 25 March 2019. Trading
electricity if there’s no Brexit deal.
Bernard Energy, 8 June 2018. EC proposes restructuring of energy funds and increased funding
under new EU budget. http://bernardenergy.com/lastestdevelopments/ec-proposes-restructuring-
energy-funds-increased-funding-new-eu-budget/
Pg. Marítim de la Barceloneta, 37-49 08003 Barcelona www.medeas.eu [email protected] T +34 93 230 95 00 F +34 93 230 95 55
This project has received funding from the European Union’s Horizon 2020 research and innovation programme under grant agreement No 691287
179
Bhagwat, P., Schittekatte, T., Keyaerts, N. and Meeus, L., October 2017. Assessment of Cost-Benefit
Analysis for Offshore Electricity Infrastructure Development. Florence: Robert Schuman Centre for
Advanced Studies, Florence School of Regulation Research Paper No. 53.
Blarke, M.B. and Jenkins, B.M., 2013. SuperGrid or SmartGrid: Competing strategies for large-scale
integration of intermittent renewables? Energy Policy. 58: 381-390.
Blyth, W., McCarthy, R. and Gross, R., 2015. Financing the UK power sector: Is the money available?
Energy Policy. 87: 607-622.
Bürer, M.J. and Wüstenhagen, R., 2009. Which renewable energy policy is a venture capitalist's best
friend? Empirical evidence from a survey of international cleantech investors. Energy Policy, 37 (12):
4997-5006.
Calderbank, S. 31 May 2013. Desertec abandons Sahara solar power export dream. EurActiv.
https://www.euractiv.com/section/trade-society/news/desertec-abandons-sahara-solar-power-
export-dream/
Castaneda, M., Jimenez, M., Zapata, S., Franco, C. and Isaac Dyner, I., 2017. Myths and facts of the
utility death spiral. Energy Policy. 110: 105-116.
Cepeda, M., 2018. Assessing cross-border integration of capacity mechanisms in coupled electricity
markets. Energy Policy, 119, 28-40.
CEEP (Central Europe Energy Partners), Roland Berger, “Making it happen – Paving the way for the
Central European North-South Infrastructure Corridor”, Sept 2015
Child, M., Kemfert, C., Bogdanov, D. and Breyer, C., 2019. Flexible electricity generation, grid
exchange and storage for the transition to a 100% renewable energy system in Europe. Renewable
Energy. 139: 80-101.
de Clercq, G., Jewkes, S. and Davies, A. “EU grid champion stuck in tangle of wires and pipes”,
Reuters, April 10, 2013, https://uk.reuters.com/article/uk-europe-grids-consolidation-eu/eu-grid-
champion-stuck-in-tangle-of-wires-and-pipes-idUKBRE9390N520130410
Crisp, J. 20 February 2015a. Leak names ACER as Energy Union supervisor. EurActiv.
https://www.euractiv.com/section/energy/news/leak-names-acer-as-energy-union-supervisor/
Crisp, J. 5 June 2015b. EU utilities trapped in ‘coal death spiral’. EurActiv.
Pg. Marítim de la Barceloneta, 37-49 08003 Barcelona www.medeas.eu [email protected] T +34 93 230 95 00 F +34 93 230 95 55
This project has received funding from the European Union’s Horizon 2020 research and innovation programme under grant agreement No 691287
180
https://www.euractiv.com/section/energy/news/eu-utilities-trapped-in-coal-death-spiral/
Cormacain, M., 7 September 2018. The future of the Single Electricity Market on the island of Ireland
after Brexit is yet to be agreed on. London School of Economics (LSE) Brexit Blog.
https://blogs.lse.ac.uk/brexit/2018/09/07/assessing-the-impact-of-brexit-on-the-single-electricity-
market-on-the-island-of-ireland
Council of European Energy Regulators (CEER). Status Review on the Implementation of
Transmission System Operators’ Unbundling Provisions of the 3rd Energy Package. Brussels: April
2016.
Coxe, R. and Meeus, L., 2010. Survey of non-traditional transmission development. Paper presented
at Institute of Electrical and Electronics Engineers (IEEE) Power & Energy Society (PES) General
Meeting in Minneapolis.
Durand, É. and Keay, M., August 2014. National support for renewable electricity and the single
market in Europe: the Ålands Vindkraft case. Oxford Energy Comment. Oxford Institute for Energy
Studies.
Dutton, J. and Lockwood, M., 2017. Ideas, institutions and interests in the politics of cross-border
electricity interconnection: Greenlink, Britain and Ireland. Energy Policy. 105: 375-385.
Eckert, V., 7 December 2018. EU tells German grid operator TenneT to raise access for Nordic power.
Reuters. https://uk.reuters.com/article/uk-eu-antitrust-tennet/eu-tells-german-grid-operator-
tennet-to-raise-access-for-nordic-power-idUKKBN1O619E
Engerati, 14 May 2018. Mediterranean Project – interconnecting Europe’s transmission network.
https://www.engerati.com/transmission-and-distribution/article/energy-security/mediterranean-
project-%E2%80%93-interconnecting-europe
ENTSO-E, 2018a, Overview of Transmission Tariffs in Europe: Synthesis 2018, May 2018.
ENTSO-E, 2018b, 2nd ENTSO-E Guideline for Cost Benefit Analysis of grid Development, European
Network of Transmission System Operators for Electricity.
https://tyndp.entsoe.eu/Documents/TYNDP%20documents/Cost%20Benefit%20Analysis/2018-10-
11-tyndp-cba-20.pdf (Accessed 18 March 2019)
ENTSO-E, 2018c, TYNDP 2018 Executive Report: Connecting Europe: Electricity: 2025-2030-2040,
European Network of Transmission System Operators for Electricity.
Pg. Marítim de la Barceloneta, 37-49 08003 Barcelona www.medeas.eu [email protected] T +34 93 230 95 00 F +34 93 230 95 55
This project has received funding from the European Union’s Horizon 2020 research and innovation programme under grant agreement No 691287
181
European Commission Staff Working Document, Mid Term Evaluation CEF, 2018.
European Commission DG ENER (2015), Study on comparative review of investment conditions for
electricity and gas Transmission System Operators (TSOs) in the EU.
European Commission DG ENER Expert Group on electricity interconnection targets, November
2017. Towards a sustainable and integrated Europe.
https://ec.europa.eu/energy/sites/ener/files/documents/report_of_the_commission_expert_grou
p_on_electricity_interconnection_targets.pdf
European Court of Justice (ECJ), 26 November 2014. C-66/13. Green Network SpA v Autorità per
l’energia elettrica e il gas.
European Parliament legislative resolution of 26 March 2019 on the proposal for a regulation of the
European Parliament and of the Council on the internal market for electricity (recast)
(COM(2016)0861 – C8-0492/2016 – 2016/0379(COD))
European Parliament press release, 12 December 2018. ACER: Agreement reached to open up and
better regulate the electricity market. http://www.europarl.europa.eu/news/sv/press-
room/20181212IPR21623/acer-agreement-reached-to-open-up-and-better-regulate-the-
electricity-market
Gärdfors, T. European energy infrastructure opportunities: Connecting the dots. Norton Rose
Fulbright. September 2015.
Geddes, A., Schmidt, T.S. and Steffen, B., 2018. The multiple roles of state investment banks in low-
carbon energy finance: An analysis of Australia, the UK and Germany. Energy Policy, 115, pp.158-
170.
Gerbaulet, C. and Weber, A. (2014). Is there still a case for merchant interconnectors? Insights from
an analysis of welfare and distributional aspects of options for network expansion in the Baltic Sea
region. DIW Discussion Papers, No. 1404, Berlin: Deutsches Institut für Wirtschaftsforschung (DIW
– German Institute for Economic Research).
Geske, J., Green, R. and Staffell, I. Elecxit: The Cost of Bilaterally Uncoupling British-EU Electricity
Trade. https://www.repository.cam.ac.uk/handle/1810/294124
Pg. Marítim de la Barceloneta, 37-49 08003 Barcelona www.medeas.eu [email protected] T +34 93 230 95 00 F +34 93 230 95 55
This project has received funding from the European Union’s Horizon 2020 research and innovation programme under grant agreement No 691287
182
Glachant, J.M., Rossetto, N. and Vasconcelos, J., 2017. Moving the electricity transmission system
towards a decarbonised and integrated Europe: missing pillars and roadblocks (Florence: European
University Institute Florence School of Regulation).
Goldberg, S., 2018. “The future’s bright and interconnected”. Infrastructure Investor Annual Review.
19-21.
Gorenstein-Dedecca, J., Lumbreras, S., Ramos, A., Hakvoort, R. and Herder, P., 2018. Expansion
planning of the North Sea offshore grid: Simulation of integrated governance constraints. Energy
Economics. 72: 376-392.
Hadush, S., de Jonghe, C. and Belmans, R., 2015. The implication of the European inter-TSO
compensation mechanism for cross-border electricity transmission investments. International
Journal of Electrical Power & Energy Systems. 73: 674-683.
Hall, M. 2 July 2013. Desertec pulls out of consortium it founded. PV Magazine.
Hall, S., Roelich, K., Davis, M. and Holstenkamp, L. "Finance and justice in low-carbon energy
transitions." Applied Energy 222 (2018): 772-780.
Hall, S., Foxon, T. and Bolton, R., 2017. Investing in low-carbon transitions: energy finance as an
adaptive market." Climate Policy. 17 (3): 280-298.
Haesen, E., Pieter Vingerhoets, Michèle Koper, Ivo Georgiev, Carsten Glenting, Minke Goes,
Charlotte Hussy (Ecofys). July 2017. Investment needs in Trans-European Energy Infrastructure up
to 2030 and beyond. Report to the European Commission.
Hawker, G., Bell, K. and Gill, S., 2017. Electricity security in the European Union—The conflict
between national Capacity Mechanisms and the Single Market. Energy Research & Social Science
24: 51-58.
Hazou, E., 10 January 2019. Tender documents for design and build of EuroAsia Interconnector
published. Cyprus Mail. https://cyprus-mail.com/2019/01/10/tender-documents-for-design-and-
build-of-euroasia-interconnector-published/
Henriot, A, 2013. Financing investment in the European electricity transmission network:
Consequences on long-term sustainability of the TSOs financial structure. Energy Policy. 62: 821-
829.
Pg. Marítim de la Barceloneta, 37-49 08003 Barcelona www.medeas.eu [email protected] T +34 93 230 95 00 F +34 93 230 95 55
This project has received funding from the European Union’s Horizon 2020 research and innovation programme under grant agreement No 691287
183
Hirtenstein, A. Central Banks Emerge as Threat to Debt-Funded Green Energy Boom, Bloomberg. 7
March 2018, https://www.bloomberg.com/news/articles/2018-03-07/central-banks-emerge-as-
threat-to-debt-funded-green-energy-boom
Hogan, W., Lindovska, M., Mann, J. and Pope, S., Embracing Merchant Transmission Investment.
October 15, 2018. Available at
https://sites.hks.harvard.edu/fs/whogan/Hogan_Lindovska_Mann_Pope_101518.pdf
Hogan, W., Rosellón, J. and Vogelsang, I. "Toward a combined merchant-regulatory mechanism for
electricity transmission expansion." Journal of Regulatory Economics 38, no. 2 (2010): 113-143.
Hojčková, K., Sandén, B. and H. Ahlborg. "Three electricity futures: Monitoring the emergence of
alternative system architectures." Futures (2017).
Holmes, I., Gaventa, J., Mabey, N. and Tomlinson, S., February 2012. Financing the Decarbonisation
of European Infrastructure. E3G.
Höschle, H., Le Cadre, H. and Belmans, R., 2018. Inefficiencies caused by non-harmonized capacity
mechanisms in an interconnected electricity market. Sustainable Energy, Grids and Networks. 13:
29-41.
Hu, H., Shi, X., Wei, T. and Rong, J., 2017, November. Hellenic transnational interconnection:
Integrated scenario-based social-economic analysis. In 2017 IEEE Conference on Energy Internet and
Energy System Integration (EI2) (pp. 1-5). IEEE.
Huang, D., and van Hertem, D., 2018. Cross-Border Electricity Transmission Network Investment:
Perspective and Risk Framework of Third Party Investors. Energies. 11 (9): 1-13.
Huang, D., de Vos, K., van Hertem, D., Olmos, L., Rivier, M., van der Welle, A. and Sijm, J., 2016. Mind
the gap: Challenges and policy options for cross-border transmission network investments. Paper
presented at 13th International Conference on the European Energy Market (EEM), Institute of
Electrical and Electronics Engineers (IEEE).
Huter, M., Polfliet, A., Cummins-Tripodi, P. et al., May 2018. Revolving door and the fossil fuel
industry. Report for the Greens group in the European Parliament.
ICIS (Chemical Industry News and Market Intelligence), 24 December 2018. Poland and Lithuania
agree on subsea power cable for 2020s.
Pg. Marítim de la Barceloneta, 37-49 08003 Barcelona www.medeas.eu [email protected] T +34 93 230 95 00 F +34 93 230 95 55
This project has received funding from the European Union’s Horizon 2020 research and innovation programme under grant agreement No 691287
184
https://www.icis.com/explore/resources/news/2018/12/24/10299273/poland-lithuania-agree-on-
subsea-power-cable-for-2020s/
Johannesson Linden, A., Kalantzis, F., Maincent, E. and Pienkowski, J., 2014 Electricity Tariff Deficit:
Temporary or Permanent Problem in the EU?. Economic Papers 534
Jones, A., 2015. Perceived barriers and policy solutions in clean energy infrastructure investment.
Journal of Cleaner Production. 104: 297-304.
Kapff, L. and Pelkmans, J., 2010. Interconnector Investment for a Well-functioning Internal Market:
What EU regime of regulatory incentives? Bruges: College of Europe Department of European
Economic Studies, Bruges European Economic Research (BEER) Papers, n° 18
Kelly, J. and Adomaitis, N., 21 October 2016. Giant Iceland-UK power cable plan seen facing Brexit
delay. Reuters. https://uk.reuters.com/article/uk-britain-iceland-power-idUKKCN12L1O5
Konstantelos, I., Pudjianto, D., Strbac, G., De Decker, J., Joseph, P., Flament, A., Kreutzkamp, P.,
Genoese, F., Rehfeldt, L., Wallasch, A., Gerdes, G., Jafar, M., Yang Y., Tidemand, N., Jansen, J.,
Nieuwenhout, F., van der Welle, A., Veum, K., 2017, Integrated North Sea grids: The costs, the
benefits and their distribution between countries. Energy Policy. 101: 28-41.
Koutantou, A. and Maltezou, R. 12 May 2017. Greece's Copelouzos teams up with China's Shenhua
in green energy. Reuters. https://www.reuters.com/article/us-greece-shenhua-group-copelouzos-
idUSKBN1881W6
Kynge, J. and Hornby, L., 7 June 2018. China eyes role as world’s power supplier. Financial Times.
https://www.ft.com/content/bdc31f94-68aa-11e8-b6eb-4acfcfb08c11
Laws, Nicholas D., Brenden P. Epps, Steven O. Peterson, Mark S. Laser, and G. Kamau Wanjiru. "On
the utility death spiral and the impact of utility rate structures on the adoption of residential solar
photovoltaics and energy storage." Applied Energy. 185 (2017): 627-641.
Loureiro, M., Claro, J. and Fischbeck, P. "Coordinating cross-border electricity interconnection
investments and trade in market coupled regions." International Journal of Electrical Power &
Energy Systems 104 (2019): pp.194-204
Makovšek, D. and Veryard, D., February 2016. The Regulatory Asset Base and Project Finance
Models: An Analysis of Incentives for Efficiency. Paris: OECD International Transport Forum
Discussion Paper 1.
Pg. Marítim de la Barceloneta, 37-49 08003 Barcelona www.medeas.eu [email protected] T +34 93 230 95 00 F +34 93 230 95 55
This project has received funding from the European Union’s Horizon 2020 research and innovation programme under grant agreement No 691287
185
Marten, A.-K., Akmatov, V., Bentzon Sørensen, T., Stornowski, R., Westermann, D. and Brosinsky, C.,
October 2018. KriegersFlak-combined grid solution: coordinated cross-border control of a meshed
HVAC/HVDC offshore wind power grid. Institution of Engineering and Technology Power
Generation. 12 (13): 1493 – 1499.
Mastropietro, P., Rodilla, P. and Batlle, C., 2015. National capacity mechanisms in the European
internal energy market: Opening the doors to neighbours. Energy Policy. 82: 38-47.
Matschoss, P., Benjamin Bayer, Heiko Thomas, and Adela Marian, 2019. "The German incentive
regulation and its practical impact on the grid integration of renewable energy systems." Renewable
Energy. 134: 727-738.
Mazzucato, M. and G. Semieniuk, G., 2017. Financing renewable energy: who is financing what and
why it matters. Technological Forecast and Societal Change. 127: 8-22.
Mekonnen, M., Huang, D. and de Vos, K., 2016. “Governance Models for Future Grids”. In van
Hertem, D., Gomis-Bellmunt, O. and Liang, J. (eds), HVDC Grids: For Offshore and Supergrid of the
Future. Hoboken, NJ: Wiley: 193-213.
Meeus, L., 2014. Offshore grids for renewables: do we need a particular regulatory framework?
Florence: European University Institute Robert Schuman Centre for Advanced Studies. Florence
School of Regulation Working Paper, No. 24.
Meeus, L. and Keyaerts, N., February 2015. First series of cross-border cost allocation decisions for
projects of common interest: main lessons learned. Florence: European University Institute Robert
Schuman Centre for Advanced Studies Florence School of Regulation, Policy Brief.
Meyer, R. and Gore, O., 2015. Cross-border effects of capacity mechanisms: Do uncoordinated
market design changes contradict the goals of the European market integration? Energy Economics,
51: 9-20.
Micallef, M., 20 November 2011. Power setback as energy link to Sicily is delayed. Times of Malta.
https://www.timesofmalta.com/articles/view/20111120/local/Power-setback-as-energy-link-to-
Sicily-is-delayed.394695
Michalopoulos, S. 8 November 2018. Row threatens to delay end to energy isolation of Crete,
Cyprus. EurActiv.
Pg. Marítim de la Barceloneta, 37-49 08003 Barcelona www.medeas.eu [email protected] T +34 93 230 95 00 F +34 93 230 95 55
This project has received funding from the European Union’s Horizon 2020 research and innovation programme under grant agreement No 691287
186
https://www.euractiv.com/section/electricity/news/row-threatens-to-delay-end-to-energy-
isolation-of-crete-attica/
Morgan, S. and Michalopoulos, S., 16 July 2018. China set to fully control Portugal’s power grid amid
Europe’s inertia. EurActiv. https://www.euractiv.com/section/eu-china/news/china-set-to-fully-
control-portugals-power-grid-amid-europes-inertia/
Mulder, M., 2018. Merchant investments in interconnections in the European electricity market:
the AQUIND case. (CEER Policy Paper; No. 4). Groningen: Centre for Energy Economics Research
(CEER), University of Groningen.
Nelson, D. and Pierpont, B., March 2013. The Challenge of Institutional Investment in Renewable
Energy, Climate Policy Initiative Report.
Neuhoff, K., Boyd, R. and Glachant, J.-M., 2012. European Electricity Infrastructure: Planning,
Regulation, and Financing. Workshop report, Berlin: Climate Policy Initiative & Florence: European
University Institute School of Regulation.
Newman, N. August 5, 2015. “The Challenges of Connecting up Europe”. Elektor Magazine.
https://www.elektormagazine.com/news/the-challenges-of-connecting-up-europe
de Nooij, M., 2011, Social cost-benefit analysis of electricity interconnector investment: A critical
appraisal. Energy Policy. 39: 3096-3105.
van Nuffel, L., Rademaekers, K., Yearwood, J., Graichen, V., López, M., Martin, J., Ludig, S. and
Marias, F. European Energy Industry Investments. Study for the European Parliament’s Industry,
Research and Energy (ITRE) Committee. Brussels: February 2017.
Odenberger, M., Unger, T. and Johnsson, F., May 08, 2015. Investment Requirements in the EU
electricity sector up to 2050. Division of Energy Technology. Chalmers University of Technology,
Göteborg.
OECD, 2015. Mapping channels to mobilise institutional investment in sustainable energy. OECD
Report to G20 finance ministers and central bank governors. Pape, M., January 2019. European
Parliament Briefing “EU Legislation in Progress - 2021-2027 MFF. Connecting Europe Facility 2021-
2027- Financing key EU infrastructure network”, European Parliamentary Research Service.
Pierri, E., Binder, O., Hemdan, N., and Kurrat, K., 2017. Challenges and opportunities for a European
HVDC grid. Renewable and Sustainable Energy Reviews 70: 427-456.
Pg. Marítim de la Barceloneta, 37-49 08003 Barcelona www.medeas.eu [email protected] T +34 93 230 95 00 F +34 93 230 95 55
This project has received funding from the European Union’s Horizon 2020 research and innovation programme under grant agreement No 691287
187
Poudineh, R. and Rubino, A., 2016. Business model for cross-border interconnections in the
Mediterranean basin. Oxford Institute for Energy Studies Working Paper, vol. 19.
Puka, L., and Szulecki, K., 2014. The politics and economics of cross-border electricity infrastructure:
A framework for analysis. Energy Research & Social Science 4: 124-134.
PriceWaterhouseCooper, Future utility business models. Undated.
https://www.pwc.com/gx/en/utilities/publications/assets/pwc-future-utility-business-models.pdf
PriceWaterhouseCooper, Ad-hoc audit of the Marguerite Fund, 2014.
RenewablesNow, 16 January 2013. TenneT, Mitsubishi to pour billions in four German offshore grid
connections. https://renewablesnow.com/news/tennet-mitsubishi-to-pour-billions-in-four-
german-offshore-grid-connections-328281/
van Renssen, S. 17 November 2015. Europe needs more grids, more power plants – say grid
operators and generators. Energy Post. https://energypost.eu/security-alert-europe-needs-grids-
power-plants-say-grid-operators-generators/
Rickson, G., 31 January 2019. UK electricity links to Europe multiply, even as Brexit looms. Standard
& Poor Platts – The Barrel Global Resource Blog. https://blogs.platts.com/2019/01/31/uk-
electricity-links-europe-multiply-even-brexit-looms/
Rivron, G., 7 April 2016. Financing energy infrastructure with the Marguerite Fund. Presentation at
the 2016 CEF Energy Info Day.
Rubino, A. and Cuomo, M., 2015. A regulatory assessment of the Electricity Merchant Transmission
Investment in EU. Energy Policy. 85: 464-474.
Sanchis, G., November 2015. Europe’s future secure and sustainable electricity infrastructure: e-
Highway2050 project results.
Schill, W.-P., Egerer, J. and Rosellón, J., 2015. Testing regulatory regimes for power transmission
expansion with fluctuating demand and wind generation. Journal of Regulatory Economics. 47 (1):
1-28.
Schmidt, P. and Lilliestam, J., 2015. Reducing or fostering public opposition? A critical reflection on
the neutrality of pan-European cost–benefit analysis in electricity transmission planning. Energy
Research & Social Science. 10: 114-122.
Pg. Marítim de la Barceloneta, 37-49 08003 Barcelona www.medeas.eu [email protected] T +34 93 230 95 00 F +34 93 230 95 55
This project has received funding from the European Union’s Horizon 2020 research and innovation programme under grant agreement No 691287
188
Schmitt, T., 2018. (Why) did Desertec fail? An interim analysis of a large-scale renewable energy
infrastructure project from a Social Studies of Technology perspective. Local Environment, 23(7):
747-776.
Scheibe, A., 2018. Utilization of Scenarios in European Electricity Policy: The Ten-Year Network
Development Plan. Oxford Institute for Energy Studies Paper: EL 32, University of Oxford, Oxford.
Silva, V., Zulueta, M.L.B., Wang, Y., Fourment, P., Hinchliffe, T., Burtin, A. and Gatti-Bono, C., June
2017. Anticipating Some of the Challenges and Solutions for 60% Renewable Energy Sources in the
European Electricity System. In Forecasting and Risk Management for Renewable Energy (pp. 169-
184).
Simon, F., 12 June 2018a. Sovereignty row holds back EU’s new energy regulator. EurActiv.
https://www.euractiv.com/section/energy/news/sovereignty-row-holds-back-eus-new-energy-
regulator/
Simon, F., 4 December 2018b. Nordics balk at EU plan to limit cross-border electricity trade.
EurActiv. https://www.euractiv.com/section/electricity/news/nordics-balk-at-eu-plan-to-limit-
cross-border-electricity-trade/1296194/
Sovacool, B., Gilbert, A., and Nugent, D., 2014. An international comparative assessment of
construction cost overruns for electricity infrastructure. Energy Research & Social Science. 3: 152-
160.
Spiecker, S., Vogel, P., Weber, C., 2013. Evaluating interconnector investments in the north
European electricity system considering fluctuating wind power penetration. Energy Economics. 37:
114-127
Steitz, C., Schütze, A. and Thomasson, E., 28 November 2014. E.ON to sell Spanish business to
Macquarie, Kuwait. Reuters. https://uk.reuters.com/article/uk-e-on-spain-macquarie-group-
idUKKCN0JC1EC20141128
Sunila, K., Bergaentzlé, C., Martin, B. and Ekroos, A., 2019. A supra-national TSO to enhance offshore
wind power development in the Baltic Sea? A legal and regulatory analysis. Energy Policy, 128: 775-
782.
Pg. Marítim de la Barceloneta, 37-49 08003 Barcelona www.medeas.eu [email protected] T +34 93 230 95 00 F +34 93 230 95 55
This project has received funding from the European Union’s Horizon 2020 research and innovation programme under grant agreement No 691287
189
Szydło, M., 2015. How to reconcile national support for renewable energy with internal market
obligations? The task for the EU legislature after Ålands Vindkraft and Essent. Common Market Law
Review. 52 (2): pp.489-510.
Tagliapietra, S., 2017. Energy Relations in the Euro-Mediterranean. Palgrave McMillan.
Tennbakk, B., Pantelis Capros, Hanspeter Höschle, Åsmund Jenssen, Justin Wolst, Marilena
Zampara, Framework for cross-border participation in capacity mechanisms. Report to the
European Commission, December 2016.
UK House of Commons Environmental Audit Committee, Green Finance, Twelfth Report of Session
2013-14
Vasilakos, N. and Sikow-Magny, C., June 2018. Enhancing the public acceptance of cross-border
electricity interconnection projects: a crucial step in the EU energy transition process. Florence:
Florence School of Regulation Robert Schuman Centre for Advanced Studies Policy Brief.
Wettengel, J., 2018. Norway bets on gas and CCS to complement Europe’s energy transition. Clean
Energy Wire. https://www.cleanenergywire.org/news/norway-bets-gas-and-ccs-complement-
europes-energy-transition
Williams, R., Eichler, L., Gottmann, N., Förster, H. and Siemons, A. Energy and the Multiannual
Financial Framework. Report for the European Parliament’s ITRE Committee, February 2018.
Zakeri, B., Virasjoki, V., Syri, S., Connolly, D., Mathiesen, B.V. and Welsch, M., 2016. Impact of
Germany's energy transition on the Nordic power market–a market-based multi-region energy
system model. Energy. 115: 1640-1662.
Zafirakis, D., Chalvatzis, K.J. and Baiocchi, G., 2015. Embodied CO2 emissions and cross-border
electricity trade in Europe: Rebalancing burden sharing with energy storage. Applied Energy. 143:
283-300.
Pg. Marítim de la Barceloneta, 37-49 08003 Barcelona www.medeas.eu [email protected] T +34 93 230 95 00 F +34 93 230 95 55
This project has received funding from the European Union’s Horizon 2020 research and innovation programme under grant agreement No 691287
190
5. Grid flexibility
List of abbreviations and acronyms
BAU Business as Usual scenario
CRE controllable renewable energy
CCGT combined cycle gas turbine
CHP combined heat and power
DRP demand response potential
DSM demand side management
DSO distribution system operator
FCC fault current controller
FCL fault current limiter
OLT Optimal Level Transition scenario
PtX Power to X
PSH Pumped-Storage Hydroelectricity
PtG Power to Gas technologies
PtH Power to Heat technologies
PST Power system transformation
RES Renewable Energy Sources
ROCOF Rate of change of frequency
TSO transmission system operator
TWh Terawatt hour

Pg. Marítim de la Barceloneta, 37-49 08003 Barcelona www.medeas.eu [email protected] T +34 93 230 95 00 F +34 93 230 95 55
This project has received funding from the European Union’s Horizon 2020 research and innovation programme under grant agreement No 691287
191
VRE variable renewable energy
Pg. Marítim de la Barceloneta, 37-49 08003 Barcelona www.medeas.eu [email protected] T +34 93 230 95 00 F +34 93 230 95 55
This project has received funding from the European Union’s Horizon 2020 research and innovation programme under grant agreement No 691287
192
5.1. Introduction
The massive deployment of RES will have, and has, technical and technological issues that need to
be carefully addressed and thus analysed to propose plans and strategies to overcome them. Grid
issues are one such major difficulty a renewable transition will face. Here we will examine two of
these issues: a) the necessary grid flexibility to deal with a high share of RES and b) electric grid
congestion management.
Zophel et al. (2018), within the framework of the REFLEX EU project (REFLEX, 2019), propose
different definitions of grid flexibility, whose common core are the concept of dealing with
intermittency, uncertainty, and volatility in a system that relies on a stable and demand-based
supply. Besides the work of REFLEX, IEA has defined that a power system is flexible if it can (IEA,
2009) “respond rapidly to large fluctuations in demand and supply, both scheduled and unforeseen
variations and events, ramping down production when demand decreases, and upwards when it
increases”. Flexibility accounts for the ability of the grid to match supply and demand under
uncertain and variable conditions (Kondziella and Brucker, 2016; Min, 2019). In particular we are
interested in the uncertainty and variability related to high shares of renewable energy in the overall
energy mix. Keeping in mind these definitions the main challenges of RES penetration are related to
two main axes: time and amount of energy produced from RES.
Based on the previous definitions grid flexibility is required to address the variability of the RES
supply, which is critical in the cases of solar and wind. Compared to solar, wind presents more
variability in long-term (inter-annual) periods. The impacts of this variability affect mainly energy
planning for grid design, expansion capacity and storage. With short-term variability, the time span
of high variability goes from one hour to eight-hourly power variations. Thus, this short-time
variability affects the capability to ramp-up and down the power generators (this variability is
currently managed with hydroelectric and natural gas power plants) when energy needs to be
dispatched at the request of power grid operators (Huber et al. 2014). The main challenges for high
shares of RES integration are low capacity credit21, reduced full-load hours and overproduction of
electricity (Ueckerdt et al. 2015).
21 Capacity credit: The capacity of conventional power plants replaced by renewable energy sources while maintaining the same amount of grid security.
Pg. Marítim de la Barceloneta, 37-49 08003 Barcelona www.medeas.eu [email protected] T +34 93 230 95 00 F +34 93 230 95 55
This project has received funding from the European Union’s Horizon 2020 research and innovation programme under grant agreement No 691287
193
Grid flexibility could address such challenges by smoothing the residual load22 needs by addressing
the intermittency of RES. This could be possible using three existing strategies (Zophel et al., 2018):
1. storage,
2. demand side management (DSM),
3. power to X technologies (PtX) and curtailment.
Power system decarbonisation and the resulting effects on the electric grid depend on RES
penetration (Mararakanye and Bekker, 2019), as well as the generator characteristics. Local and
regional VRE (Variable Renewable Energy) issues can affect the power system at any penetration
level, while variability and uncertainty affect the balancing operation when (instantaneous)
penetration23 level is 20%, and transient and frequency stability issues affect the system when the
instantaneous penetration level is more than 50%.
The MEDEAS model (MEDEAS_eu, v1.2) does not have detailed variables to analyse grid
characteristics. Furthermore, the infrastructures module of MEDEAS accounts for an integrated
annual behaviour and in this manner it filters/smooth daily and weekly behaviours. The MEDEAS
model only considers storage technologies and, only one aspect of the DSM through a lowering of
economic growth. Future versions of the MEDEAS model should thus be enhanced to include more
specific demand side management, power to X and the possibility of RES curtailment as well as
better modelling for energy storage technology evolution. Although such limitations of the model,
it is still useful to project the technical feasibility of the decarbonisation using current technologies,
which is analysed using TRANS scenario. In this way we can bound our understanding of what may
be feasible under this scenario under the worst case scenario of grid management.
22 Residual load: The difference between fixed generators (“must run”) and actual energy demand. 23 Instantaneous penetration: Ratio of renewable energy to the system load at a certain instant in time, as opposed to
(overall annual) energy penetration.
Pg. Marítim de la Barceloneta, 37-49 08003 Barcelona www.medeas.eu [email protected] T +34 93 230 95 00 F +34 93 230 95 55
This project has received funding from the European Union’s Horizon 2020 research and innovation programme under grant agreement No 691287
194
5.2. Grid management for large-scale RES deployment
As previously introduced, grid flexibility will help address supply side variability and uncertainty.
Following Mararakanye and Bekker (2019), the main corresponding grid issues, depending on the
level of RES penetration, are:
1. Fault level: The combined effect of changes in voltage pre- and post- fault current (any
abnormal electric current occurring due to a fault) is considered the fault level. The fault
level is only limited by the impedance24 in the path between the source and the fault
location. Some methods to control fault currents are inverters (Neuman and Erlich, 2012)
and power system protection (i.e. disconnection, see Turcote and Katiraei, 2009).
2. Harmonics25 and flicker: This is caused by voltage fluctuations in time. These are related to
the flow of harmonic currents through the source of impedance. Flicker is generated by load
changes and can be reduced by making less frequent or smaller load changes. If the load is
changed gradually (for example, by the help of power electronics) instead of step fashion,
this also makes flicker less perceptible (Shafiullah et al. 2013).
3. Sub-synchronous interactions: This issue is related to the distance of the supply source with
the load centres and thus with long distance transmission lines. For long transmission lines
capacitors26 are deployed to compensate for inductance27. Capacitors however may increase
fault levels and thus impact system stability (Adams et al. 2012).
4. Voltage stability: This relates to the grid’s ability to keep voltage at required levels during
steady state and following disturbances (Heetun et al., 2016). There is a need for VRE having
reactive/voltage control capability in their terminals.
5. VRE power curtailments: Curtailments occur mainly due to the transmission congestion
(local network) or challenges of balancing in case of high VRE generation and low load
conditions. Two example countries with curtailment of more than 10% with only 5% of VRE
penetration are China and Italy. In response, China is working to improve transmission grids
as well as planning and forecasting (Fan et al. 2015) and Italy with improvements in the
transmission network.
6. Reserves: Reserve requirements to deal with variability and uncertainty increase with wind
and solar penetration and the analysis of time scale. Uncertainty is not a serious issue for
penetration levels up to 20% (with a minimum interconnected grid) (Quanta, 2009).
24 Impedance: the resistance of an electric circuit to alternating current, stemming from ohmic resistance and reactance. 25 Harmonics: a voltage at a much higher frequency than normal. 26 Capacitors: small component that stores electrical energy. 27 Inductance: the property of the circuit to oppose changes in current through the circuit, due to its magnetic field.
Pg. Marítim de la Barceloneta, 37-49 08003 Barcelona www.medeas.eu [email protected] T +34 93 230 95 00 F +34 93 230 95 55
This project has received funding from the European Union’s Horizon 2020 research and innovation programme under grant agreement No 691287
195
7. Transient stability: The capability of the system to operate in a stable manner again after
experiencing severe disturbances. (Dudurych et al. 2017).
8. Frequency stability: The capability of the power system to keep a steady frequency when a
significant imbalance between demand and supply occurs. This will depend on the size of
the system and penetration of VRE. The ROCOF (rate of change of frequency) has small
changes for penetrations up to 50% (Miller et al. 2014) and even can be kept for penetrations
up to 79% (Fernandez et al. 2015).
The degree to which such issues affect the grid will depend on the grid’s main characteristics
(Cochran et al. 2014):
• Strength of transmission network. Highly connected uniform distribution is strong, while
sparse low-connected grids are weak (Etxegarai et al. 2015). Capacity and reducing
bottlenecks, together with the access to a broad range of balancing resources (grid
interconnections with neighbouring power systems), are essential for high RES deployment.
Grids with low impedance lack the characteristics of dense transmission lines and
interconnectivity.
• Power system flexibility. This concerns the power system’s capability to adapt to demand
requirements (Denholm and Hand, 2011). Grid flexibility can be analysed from an electricity
supply or a demand angle. From a demand perspective, key factors are base load and peak
demand and the change of consumer behaviour to better match variable RES production.
On the supply side, the main options are increasing the pumped storage capacity to match
peak load, CCGT, hydro, CHP as well as interconnection to export or divert (Mararakanye
and Bekker, 2019).
• System inertia: Current systems inertia is due to the rotating masses of large synchronous
machines, thus it will affect ROCOF and frequency nadir (ENTSO-E, 2017). The ROCOF
frequency affects the change of system frequency, specially when parts of the system
generators are disconnected (curtailment). It is particularly important when the current
system with thermal power plants has generators that have the capacity of keeping the
system frequency (inertia). Nadir has to do with bottom point of the frequency deviation
(Doherthy et al. 2010). The increase of RES in the energy mix reduces the system inertia by
reducing the number of synchronous generators in the power system. However, minimum
system inertia is necessary for operating the grid in its current state (Ahmadyar et al. 2017).
Special attention should be paid to the strategies to enhance grid stability and flexibility (Zöphel et
al. 2018). These include aforementioned demand side management, also previously mentioned

Pg. Marítim de la Barceloneta, 37-49 08003 Barcelona www.medeas.eu [email protected] T +34 93 230 95 00 F +34 93 230 95 55
This project has received funding from the European Union’s Horizon 2020 research and innovation programme under grant agreement No 691287
196
interconnection to export electricity, transferring technology to another energy carrier (Power to
X), storage or RES curtailment.
Pg. Marítim de la Barceloneta, 37-49 08003 Barcelona www.medeas.eu [email protected] T +34 93 230 95 00 F +34 93 230 95 55
This project has received funding from the European Union’s Horizon 2020 research and innovation programme under grant agreement No 691287
197
5.3. MEDEAS and electric grids
Due to the previously detailed limitations of the MEDEAS model we will focus on RES storage
technologies and total final energy consumption as a result of lowered GDP. We are aware that the
reduction of the GDP does not represent a single policy but a set of different factors. Moreover,
GDP shown in the simulations is affected by supply limitations and also by the desired GDP
introduced exogenously. Thus, when we are modelling the impact of lowering GDP exogenously we
are introducing a change in the system behaviour to limit the excessive demand of resources. We
use the MEDEAS scenarios, including the new TRANS scenario introduced elsewhere in this
deliverable, for the analysis in the section of model outputs (section 4).
In this section we will show some of the variables for the three scenarios simulations at EU level. To
frame the results, we will introduce first the general behaviour of the three scenarios considered.
The results for three scenarios will be presented: transition scenario (TRANS from now on, SCEN3 in
the legends), OLT scenario (SCEN2 in the legends) and those of the BAU (BAU in the legends).
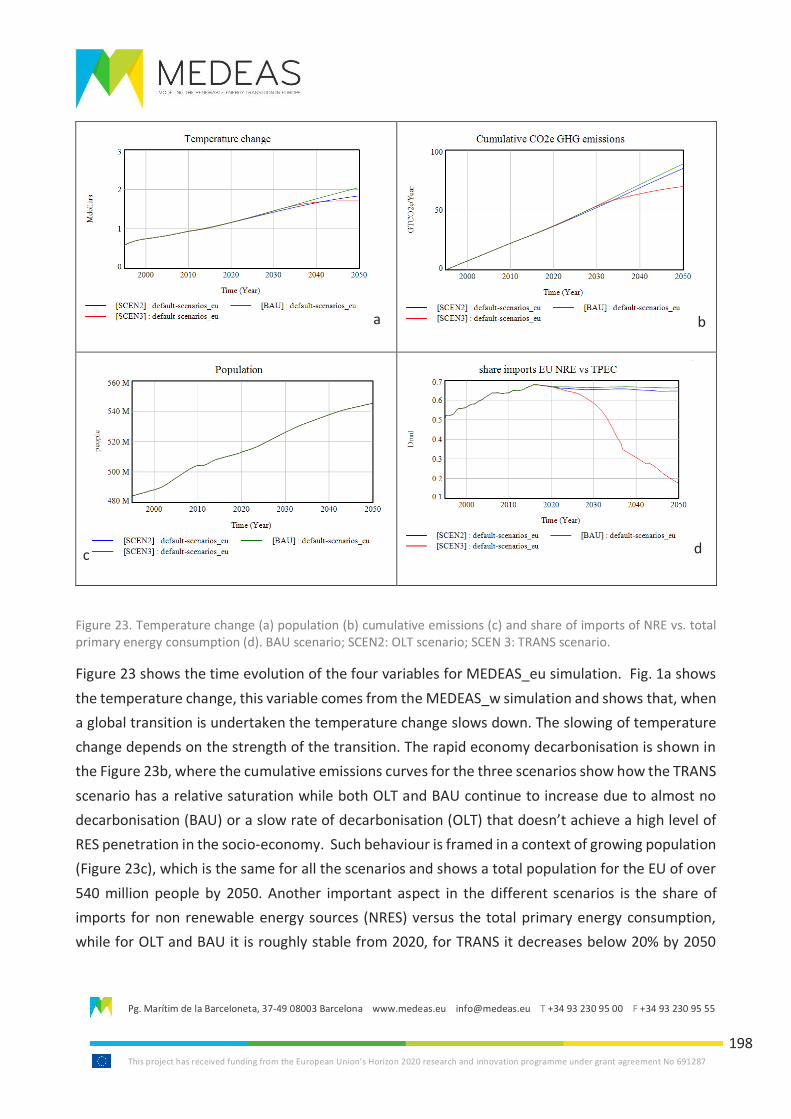
Pg. Marítim de la Barceloneta, 37-49 08003 Barcelona www.medeas.eu [email protected] T +34 93 230 95 00 F +34 93 230 95 55
This project has received funding from the European Union’s Horizon 2020 research and innovation programme under grant agreement No 691287
198
a b
c d
Figure 23. Temperature change (a) population (b) cumulative emissions (c) and share of imports of NRE vs. total primary energy consumption (d). BAU scenario; SCEN2: OLT scenario; SCEN 3: TRANS scenario.
Figure 23 shows the time evolution of the four variables for MEDEAS_eu simulation. Fig. 1a shows
the temperature change, this variable comes from the MEDEAS_w simulation and shows that, when
a global transition is undertaken the temperature change slows down. The slowing of temperature
change depends on the strength of the transition. The rapid economy decarbonisation is shown in
the Figure 23b, where the cumulative emissions curves for the three scenarios show how the TRANS
scenario has a relative saturation while both OLT and BAU continue to increase due to almost no
decarbonisation (BAU) or a slow rate of decarbonisation (OLT) that doesn’t achieve a high level of
RES penetration in the socio-economy. Such behaviour is framed in a context of growing population
(Figure 23c), which is the same for all the scenarios and shows a total population for the EU of over
540 million people by 2050. Another important aspect in the different scenarios is the share of
imports for non renewable energy sources (NRES) versus the total primary energy consumption,
while for OLT and BAU it is roughly stable from 2020, for TRANS it decreases below 20% by 2050
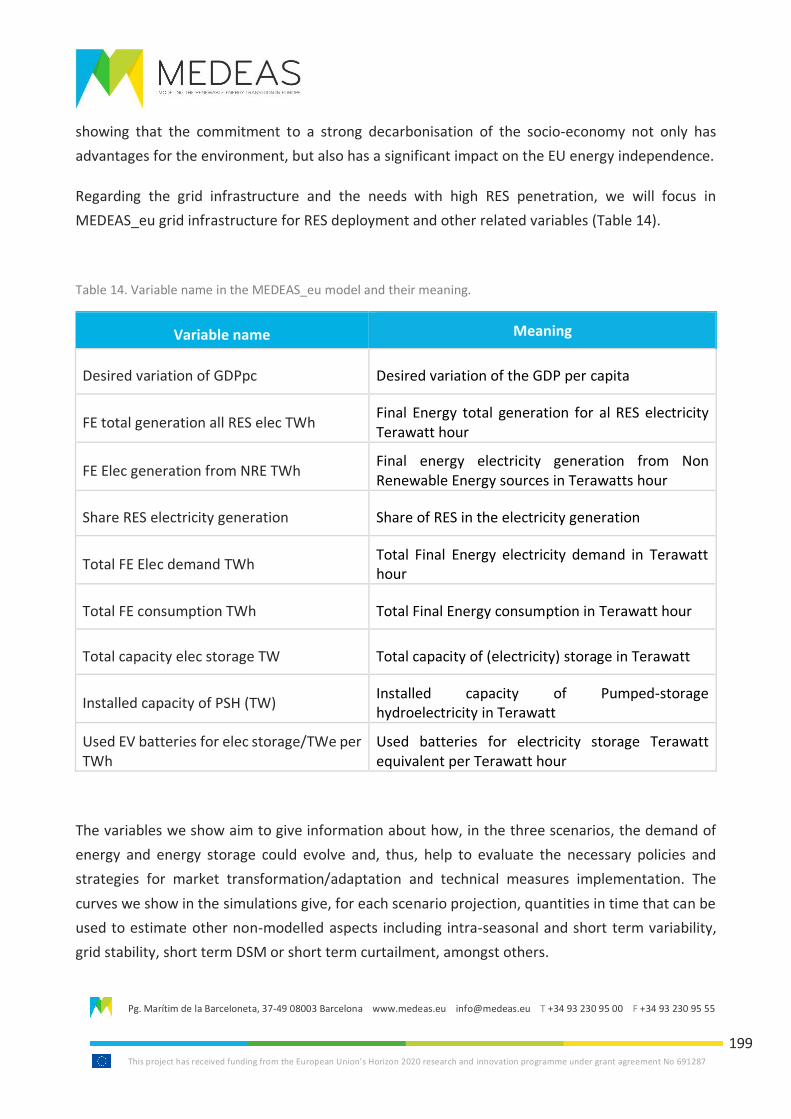
Pg. Marítim de la Barceloneta, 37-49 08003 Barcelona www.medeas.eu [email protected] T +34 93 230 95 00 F +34 93 230 95 55
This project has received funding from the European Union’s Horizon 2020 research and innovation programme under grant agreement No 691287
199
showing that the commitment to a strong decarbonisation of the socio-economy not only has
advantages for the environment, but also has a significant impact on the EU energy independence.
Regarding the grid infrastructure and the needs with high RES penetration, we will focus in
MEDEAS_eu grid infrastructure for RES deployment and other related variables (Table 14).
Table 14. Variable name in the MEDEAS_eu model and their meaning.
Variable name Meaning
Desired variation of GDPpc Desired variation of the GDP per capita
FE total generation all RES elec TWh Final Energy total generation for al RES electricity Terawatt hour
FE Elec generation from NRE TWh Final energy electricity generation from Non Renewable Energy sources in Terawatts hour
Share RES electricity generation Share of RES in the electricity generation
Total FE Elec demand TWh Total Final Energy electricity demand in Terawatt hour
Total FE consumption TWh Total Final Energy consumption in Terawatt hour
Total capacity elec storage TW Total capacity of (electricity) storage in Terawatt
Installed capacity of PSH (TW) Installed capacity of Pumped-storage hydroelectricity in Terawatt
Used EV batteries for elec storage/TWe per TWh
Used batteries for electricity storage Terawatt equivalent per Terawatt hour
The variables we show aim to give information about how, in the three scenarios, the demand of
energy and energy storage could evolve and, thus, help to evaluate the necessary policies and
strategies for market transformation/adaptation and technical measures implementation. The
curves we show in the simulations give, for each scenario projection, quantities in time that can be
used to estimate other non-modelled aspects including intra-seasonal and short term variability,
grid stability, short term DSM or short term curtailment, amongst others.
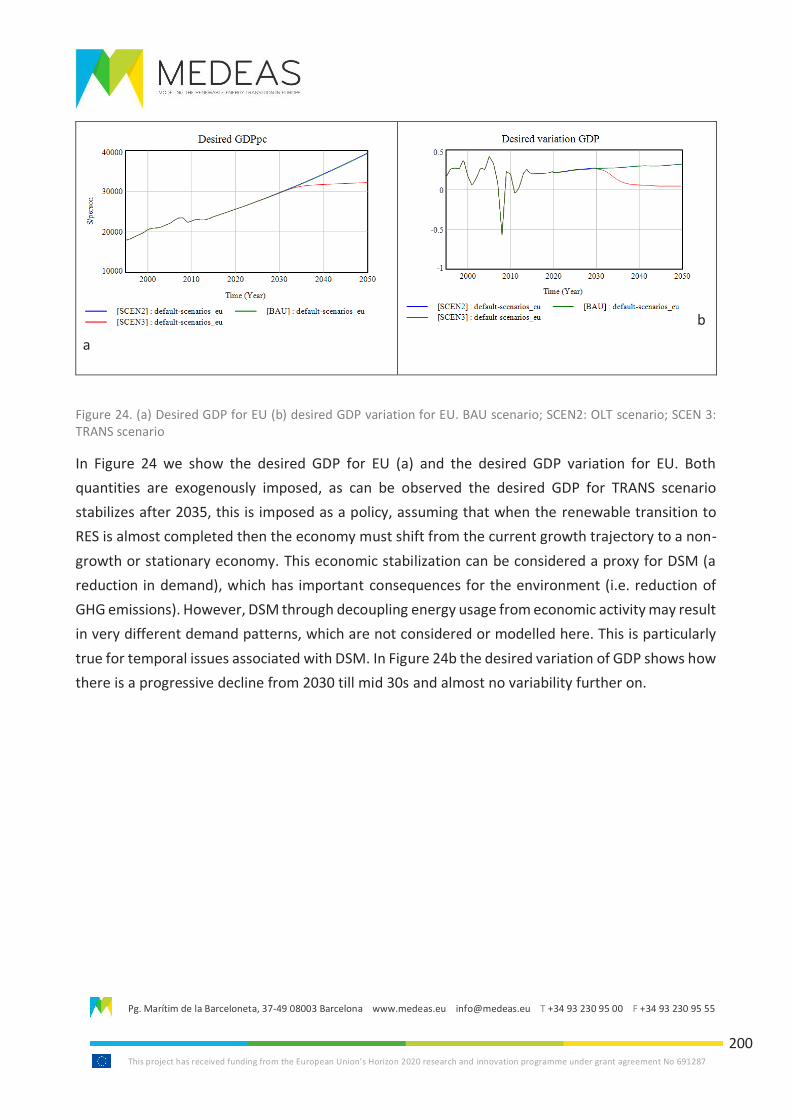
Pg. Marítim de la Barceloneta, 37-49 08003 Barcelona www.medeas.eu [email protected] T +34 93 230 95 00 F +34 93 230 95 55
This project has received funding from the European Union’s Horizon 2020 research and innovation programme under grant agreement No 691287
200
a
b
Figure 24. (a) Desired GDP for EU (b) desired GDP variation for EU. BAU scenario; SCEN2: OLT scenario; SCEN 3: TRANS scenario
In Figure 24 we show the desired GDP for EU (a) and the desired GDP variation for EU. Both
quantities are exogenously imposed, as can be observed the desired GDP for TRANS scenario
stabilizes after 2035, this is imposed as a policy, assuming that when the renewable transition to
RES is almost completed then the economy must shift from the current growth trajectory to a non-
growth or stationary economy. This economic stabilization can be considered a proxy for DSM (a
reduction in demand), which has important consequences for the environment (i.e. reduction of
GHG emissions). However, DSM through decoupling energy usage from economic activity may result
in very different demand patterns, which are not considered or modelled here. This is particularly
true for temporal issues associated with DSM. In Figure 24b the desired variation of GDP shows how
there is a progressive decline from 2030 till mid 30s and almost no variability further on.
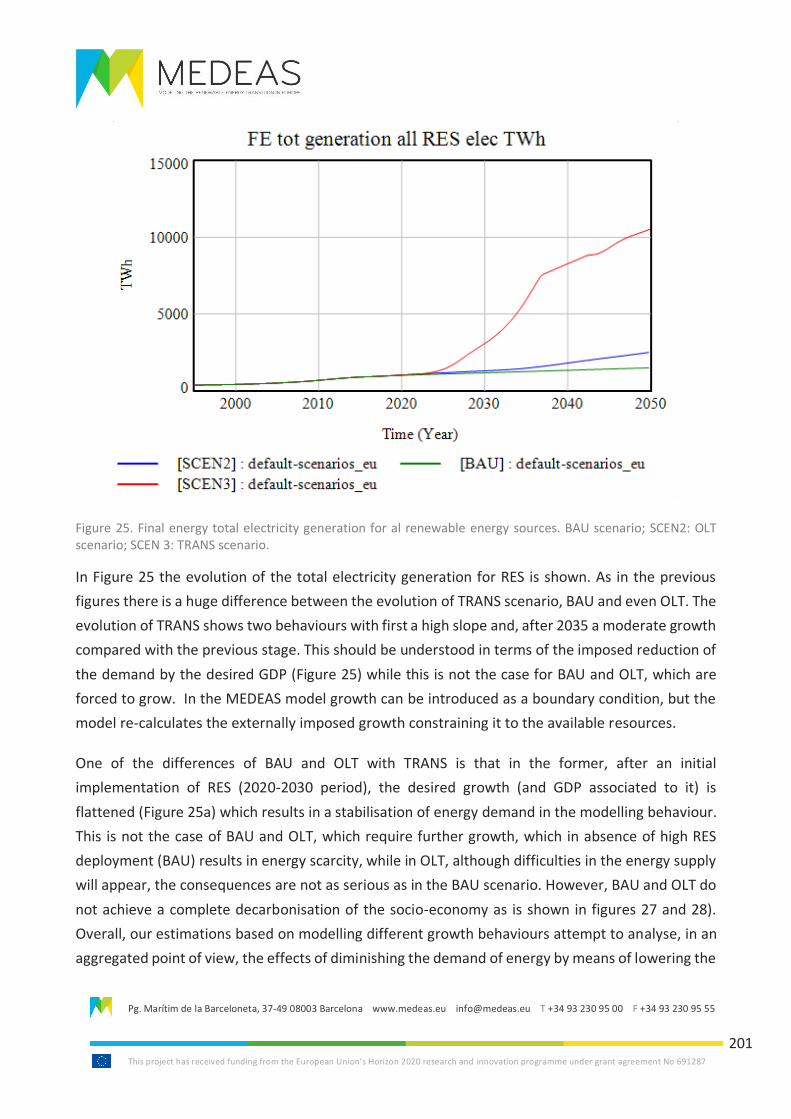
Pg. Marítim de la Barceloneta, 37-49 08003 Barcelona www.medeas.eu [email protected] T +34 93 230 95 00 F +34 93 230 95 55
This project has received funding from the European Union’s Horizon 2020 research and innovation programme under grant agreement No 691287
201
Figure 25. Final energy total electricity generation for al renewable energy sources. BAU scenario; SCEN2: OLT scenario; SCEN 3: TRANS scenario.
In Figure 25 the evolution of the total electricity generation for RES is shown. As in the previous
figures there is a huge difference between the evolution of TRANS scenario, BAU and even OLT. The
evolution of TRANS shows two behaviours with first a high slope and, after 2035 a moderate growth
compared with the previous stage. This should be understood in terms of the imposed reduction of
the demand by the desired GDP (Figure 25) while this is not the case for BAU and OLT, which are
forced to grow. In the MEDEAS model growth can be introduced as a boundary condition, but the
model re-calculates the externally imposed growth constraining it to the available resources.
One of the differences of BAU and OLT with TRANS is that in the former, after an initial
implementation of RES (2020-2030 period), the desired growth (and GDP associated to it) is
flattened (Figure 25a) which results in a stabilisation of energy demand in the modelling behaviour.
This is not the case of BAU and OLT, which require further growth, which in absence of high RES
deployment (BAU) results in energy scarcity, while in OLT, although difficulties in the energy supply
will appear, the consequences are not as serious as in the BAU scenario. However, BAU and OLT do
not achieve a complete decarbonisation of the socio-economy as is shown in figures 27 and 28).
Overall, our estimations based on modelling different growth behaviours attempt to analyse, in an
aggregated point of view, the effects of diminishing the demand of energy by means of lowering the
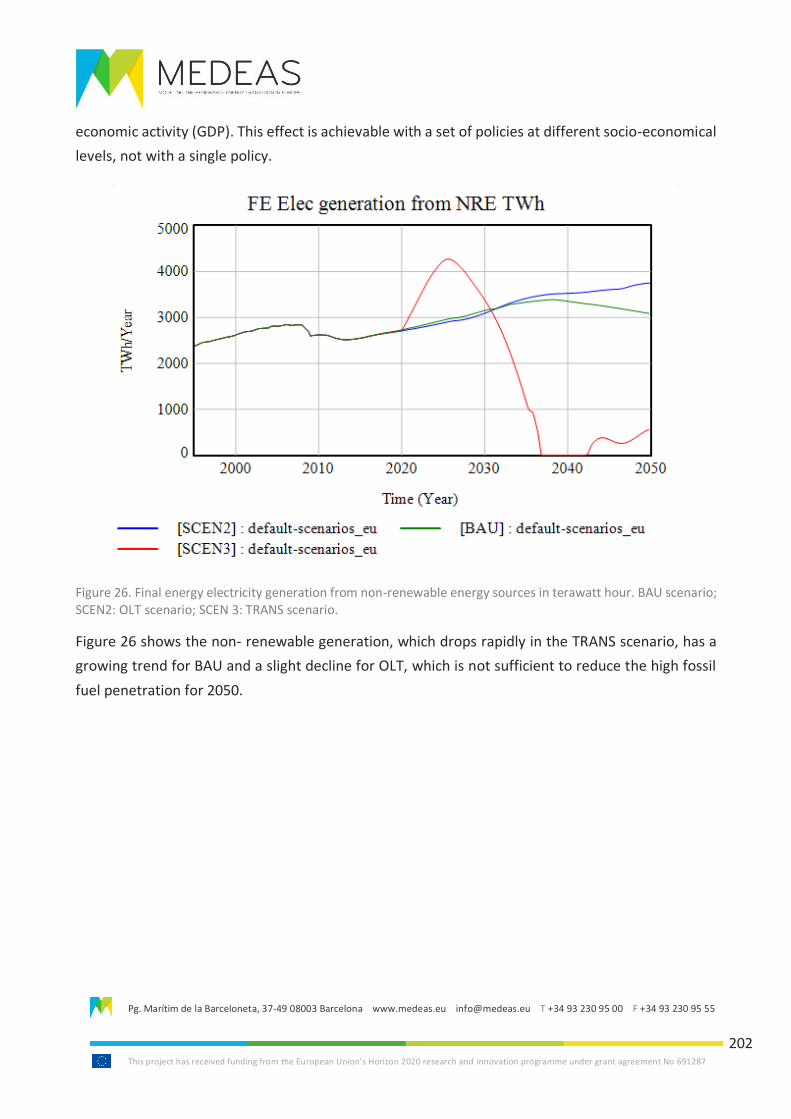
Pg. Marítim de la Barceloneta, 37-49 08003 Barcelona www.medeas.eu [email protected] T +34 93 230 95 00 F +34 93 230 95 55
This project has received funding from the European Union’s Horizon 2020 research and innovation programme under grant agreement No 691287
202
economic activity (GDP). This effect is achievable with a set of policies at different socio-economical
levels, not with a single policy.
Figure 26. Final energy electricity generation from non-renewable energy sources in terawatt hour. BAU scenario; SCEN2: OLT scenario; SCEN 3: TRANS scenario.
Figure 26 shows the non- renewable generation, which drops rapidly in the TRANS scenario, has a
growing trend for BAU and a slight decline for OLT, which is not sufficient to reduce the high fossil
fuel penetration for 2050.
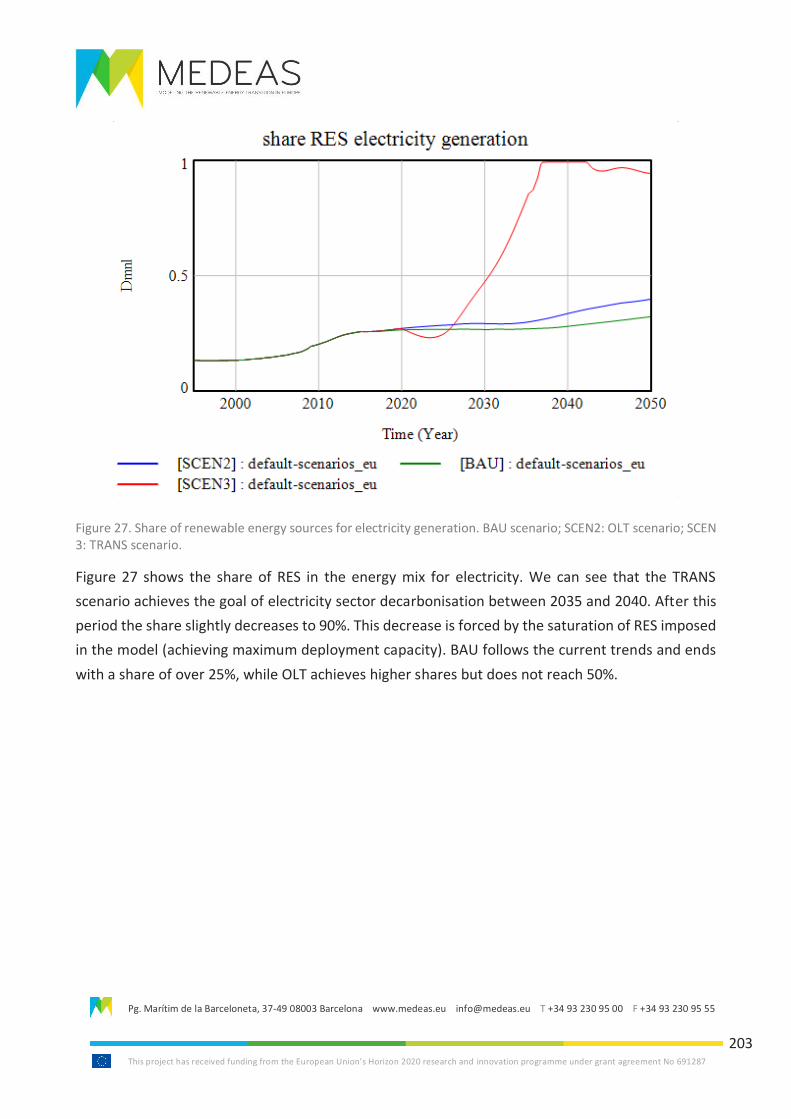
Pg. Marítim de la Barceloneta, 37-49 08003 Barcelona www.medeas.eu [email protected] T +34 93 230 95 00 F +34 93 230 95 55
This project has received funding from the European Union’s Horizon 2020 research and innovation programme under grant agreement No 691287
203
Figure 27. Share of renewable energy sources for electricity generation. BAU scenario; SCEN2: OLT scenario; SCEN 3: TRANS scenario.
Figure 27 shows the share of RES in the energy mix for electricity. We can see that the TRANS
scenario achieves the goal of electricity sector decarbonisation between 2035 and 2040. After this
period the share slightly decreases to 90%. This decrease is forced by the saturation of RES imposed
in the model (achieving maximum deployment capacity). BAU follows the current trends and ends
with a share of over 25%, while OLT achieves higher shares but does not reach 50%.
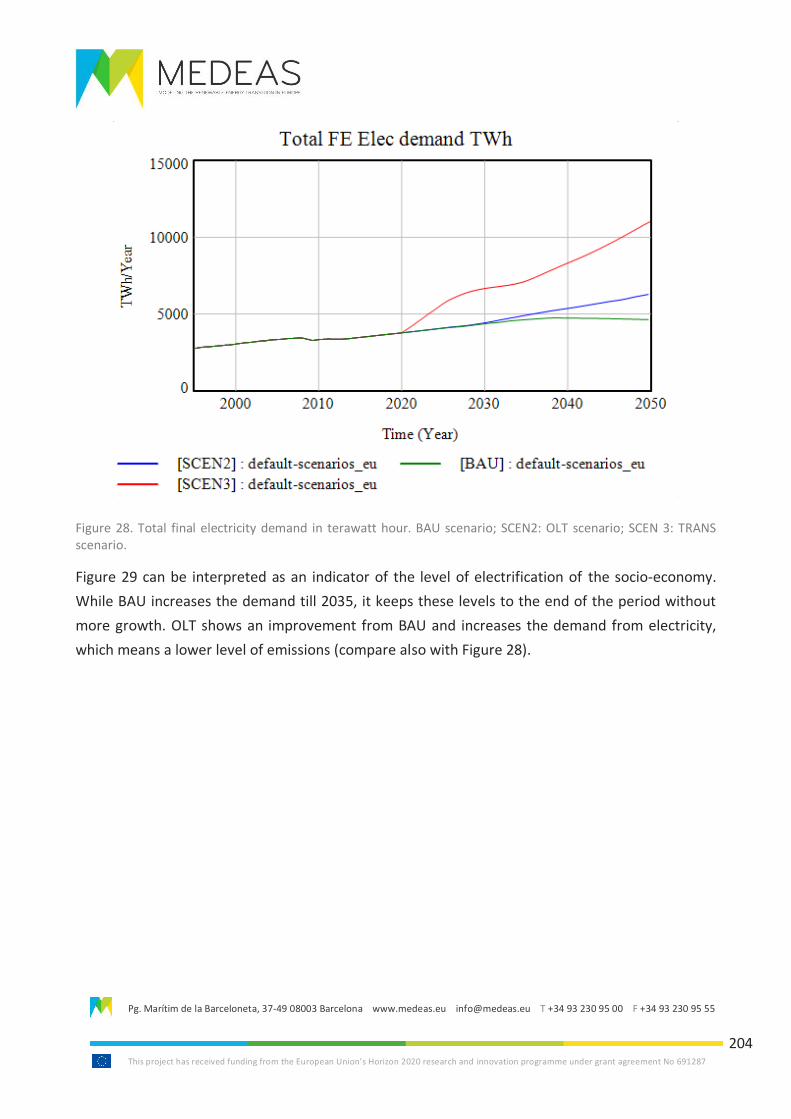
Pg. Marítim de la Barceloneta, 37-49 08003 Barcelona www.medeas.eu [email protected] T +34 93 230 95 00 F +34 93 230 95 55
This project has received funding from the European Union’s Horizon 2020 research and innovation programme under grant agreement No 691287
204
Figure 28. Total final electricity demand in terawatt hour. BAU scenario; SCEN2: OLT scenario; SCEN 3: TRANS scenario.
Figure 29 can be interpreted as an indicator of the level of electrification of the socio-economy.
While BAU increases the demand till 2035, it keeps these levels to the end of the period without
more growth. OLT shows an improvement from BAU and increases the demand from electricity,
which means a lower level of emissions (compare also with Figure 28).
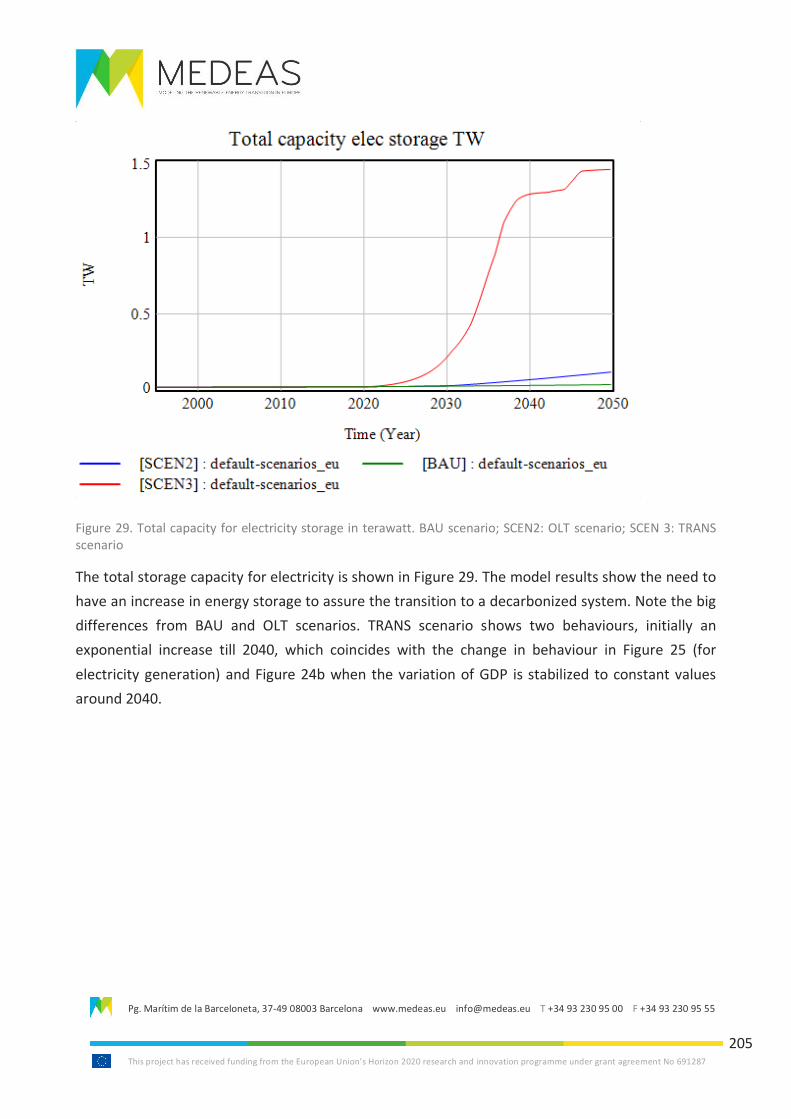
Pg. Marítim de la Barceloneta, 37-49 08003 Barcelona www.medeas.eu [email protected] T +34 93 230 95 00 F +34 93 230 95 55
This project has received funding from the European Union’s Horizon 2020 research and innovation programme under grant agreement No 691287
205
Figure 29. Total capacity for electricity storage in terawatt. BAU scenario; SCEN2: OLT scenario; SCEN 3: TRANS scenario
The total storage capacity for electricity is shown in Figure 29. The model results show the need to
have an increase in energy storage to assure the transition to a decarbonized system. Note the big
differences from BAU and OLT scenarios. TRANS scenario shows two behaviours, initially an
exponential increase till 2040, which coincides with the change in behaviour in Figure 25 (for
electricity generation) and Figure 24b when the variation of GDP is stabilized to constant values
around 2040.
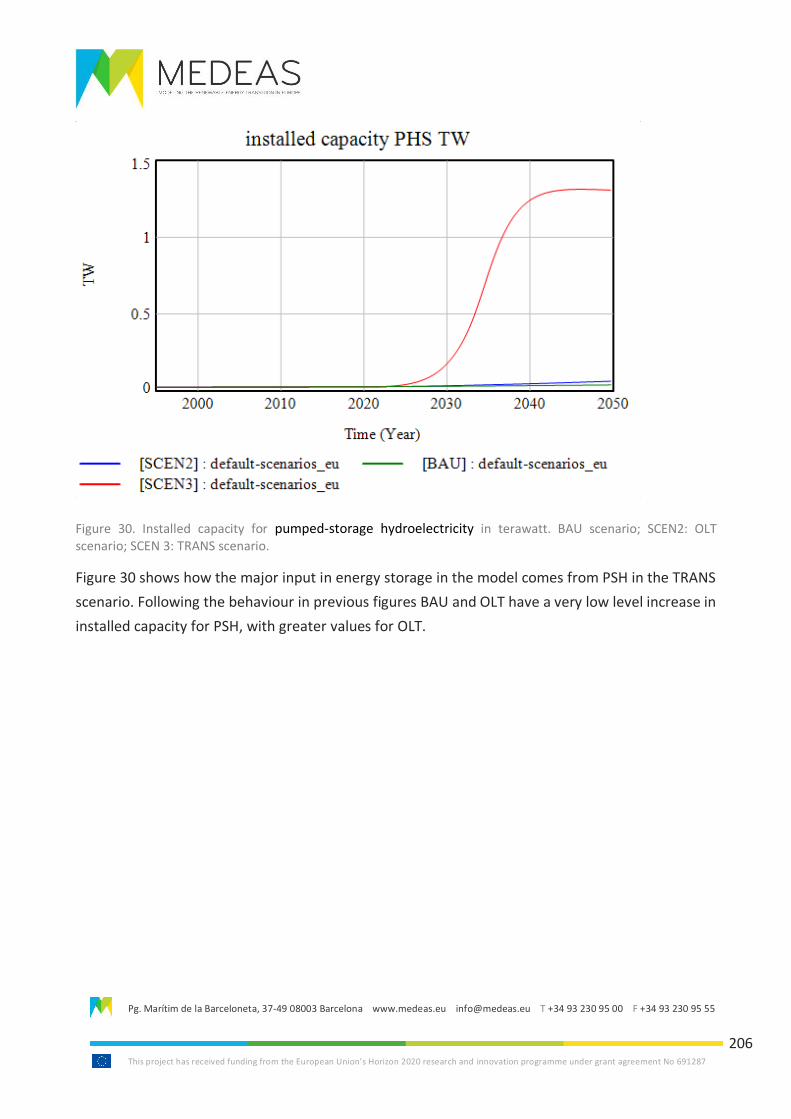
Pg. Marítim de la Barceloneta, 37-49 08003 Barcelona www.medeas.eu [email protected] T +34 93 230 95 00 F +34 93 230 95 55
This project has received funding from the European Union’s Horizon 2020 research and innovation programme under grant agreement No 691287
206
Figure 30. Installed capacity for pumped-storage hydroelectricity in terawatt. BAU scenario; SCEN2: OLT scenario; SCEN 3: TRANS scenario.
Figure 30 shows how the major input in energy storage in the model comes from PSH in the TRANS
scenario. Following the behaviour in previous figures BAU and OLT have a very low level increase in
installed capacity for PSH, with greater values for OLT.
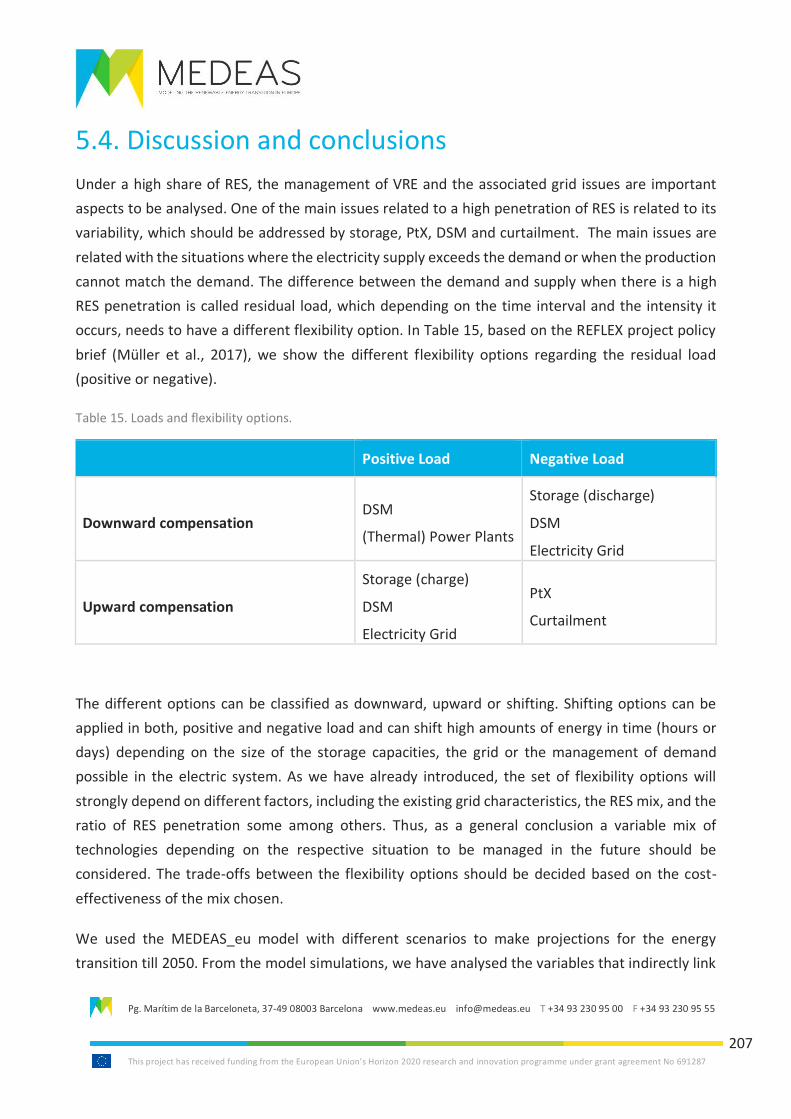
Pg. Marítim de la Barceloneta, 37-49 08003 Barcelona www.medeas.eu [email protected] T +34 93 230 95 00 F +34 93 230 95 55
This project has received funding from the European Union’s Horizon 2020 research and innovation programme under grant agreement No 691287
207
5.4. Discussion and conclusions
Under a high share of RES, the management of VRE and the associated grid issues are important
aspects to be analysed. One of the main issues related to a high penetration of RES is related to its
variability, which should be addressed by storage, PtX, DSM and curtailment. The main issues are
related with the situations where the electricity supply exceeds the demand or when the production
cannot match the demand. The difference between the demand and supply when there is a high
RES penetration is called residual load, which depending on the time interval and the intensity it
occurs, needs to have a different flexibility option. In Table 15, based on the REFLEX project policy
brief (Müller et al., 2017), we show the different flexibility options regarding the residual load
(positive or negative).
Table 15. Loads and flexibility options.
Positive Load Negative Load
Downward compensation DSM
(Thermal) Power Plants
Storage (discharge)
DSM
Electricity Grid
Upward compensation
Storage (charge)
DSM
Electricity Grid
PtX
Curtailment
The different options can be classified as downward, upward or shifting. Shifting options can be
applied in both, positive and negative load and can shift high amounts of energy in time (hours or
days) depending on the size of the storage capacities, the grid or the management of demand
possible in the electric system. As we have already introduced, the set of flexibility options will
strongly depend on different factors, including the existing grid characteristics, the RES mix, and the
ratio of RES penetration some among others. Thus, as a general conclusion a variable mix of
technologies depending on the respective situation to be managed in the future should be
considered. The trade-offs between the flexibility options should be decided based on the cost-
effectiveness of the mix chosen.
We used the MEDEAS_eu model with different scenarios to make projections for the energy
transition till 2050. From the model simulations, we have analysed the variables that indirectly link
Pg. Marítim de la Barceloneta, 37-49 08003 Barcelona www.medeas.eu [email protected] T +34 93 230 95 00 F +34 93 230 95 55
This project has received funding from the European Union’s Horizon 2020 research and innovation programme under grant agreement No 691287
208
more closely to issues associated with the grid management challenges of VRE. Although there are
other important aspects that could affect the grid congestion management under high share or RES
and its need for more flexibility, we only focus on two main aspects due to the model limitations:
Demand Side Management and Storage. However, we also note that DSM is modelled in a limited
way through reduced economic growth and the evolution of storage technology is not modelled in
any detail.
STORAGE: In future model developments it will be very important to consider a better
representation of storage technologies (with some that currently are in development) and also PtX
and curtailment. This is important, because, as the work of Müller et al. (2013) and Müller and Most
(2018) point out, depending on the grid, a combination of curtailment and DMS could reduce the
need for storage. Thus, the results shown here could be sensibly modified (reducing the need for
storage) if such combinations could be analysed in the model scenarios.
DEMAND-SIDE MANAGEMENT: An important result to be noted is the role of DSM, which is
modelled by slowing down the economic activity by means of changing the desired GDP and GDP
variation, externally. The stabilisation of the GDP and then this effect on demand has important
effects for integrating the VRE in the energy mix, particularly when there is already a high RES
penetration. Here, the combined effect of fuel shift (by changing the energy intensities in the model)
and GDP reduction/stabilisation at the end of the period has the double effect of slowing the
demand growth and then alleviating the stress on the storage capacities growth. However, we do
note that other forms of DSM, or indeed slowing GDP growth, can have very different impacts on
the exact patterns of demand – especially as it relates to usage by different demographics (e.g. those
classed as energy poor) and temporal effects – which are not modelled in MEDEAS. Therefore, the
impact from DSM should not be taken as a firm output of the model here for policy recommendation
purposes.
The results of the simulations show a total installed capacity for storage of 1661 TWh at the end of
simulation period (year 2050), while studies using hourly models and different storage technologies
accounting for different kinds of storage show much less capacity needed: for example, 320 TWh
(Rasmussen et al. 2012). This difference is explained by Solomon et al. (2019), who classify storage
in two kinds, diurnal and seasonal. For penetrations of 90% RES, storage is required for one daily
average demand. Moreover, allowing curtailment will have important improvements in the results.
Although storage and DSM must play an essential role in the development and penetration of VRE
the limitations of the model when considering different storage technologies do not allow this to be
modelled properly. The storage options in the model are restricted to PHS and electric cars batteries,
Pg. Marítim de la Barceloneta, 37-49 08003 Barcelona www.medeas.eu [email protected] T +34 93 230 95 00 F +34 93 230 95 55
This project has received funding from the European Union’s Horizon 2020 research and innovation programme under grant agreement No 691287
209
however, currently, there are more available options reported in the literature. The scenarios
selected and the quantities reported using the model are then very restricted compared to the
flexibility options reported in the literature. Such limitation makes the calculations of the model
very conservative. Particularly, regarding the RES capacity needed for fulfilling the positive load and
RES variability is overestimated. Considering such limitations, the results presented here for the
TRANS scenario, which implies a near 100% RES penetration, should be taken with caution and as a
very conservative projection, not only for the amount of RES required (overcapacity) to fulfil the
demand but also the level of demand reduction (GDP) projected. With more flexible options in the
mix, the projections of TRANS scenario could be substantially different from the ones shown here.
Finally, the results on the energy mix at the end of the period for TRANS scenario show a slight
increase in fossil fuel based plants (2045 onwards). This is mainly due to the growing demand and
the limit achieved for all the RES, this requires a small increase in (thermal) power plants to fulfil the
demand at the end of this period. Again, with more storage options and capacity and also with more
grid flexibility (shifting options) this result could change substantially and possibly the required
increased demand that forces the re-introduction of thermal plants could be removed. A transition
to 100% renewables is technically feasible. However, policies must be put into action to support the
RES penetration including the necessary changes in the European grid and storage needs.
Pg. Marítim de la Barceloneta, 37-49 08003 Barcelona www.medeas.eu [email protected] T +34 93 230 95 00 F +34 93 230 95 55
This project has received funding from the European Union’s Horizon 2020 research and innovation programme under grant agreement No 691287
210
5.5. References
MEDEAS Deliverable D4.1, available at: https://medeas.eu/deliverables
MEDEAS Deliverable D6.1, available at: https://medeas.eu/deliverables
MEDEAS Deliverable D6.2, available at: https://medeas.eu/deliverables
Adams, J., C. Carter and S. Huang, 2012. ERCOT [Electric Reliability Council of Texas] experience with
Sub-synchronous Control Interaction and proposed remediation. Paper presented at Institute of
Electrical and Electronics Engineers Power & Energy Society Transmission & Distribution (IEEE PES
T&D) Conference. Orlando, FL.
Ahmadyar AS, Riaz S, Verbic G, Chapman A, Hill DJ, 2017. A framework for assessing renewable
integration limits with respect to frequency performance. IEEE Transactions on Power Systems.
8950: 1–10.
Cochran J, Miller M, Zinaman O, Milligan M, Arent D, Palmintier B, et al, 2014. Flexibility in 21st
century power systems. Golden, Colorado, USA: National Renewable Energy Laboratory.
Daly, H. Beyond uneconomic growth, Vol 2. A Festschrift in honor of Herman Daly.
http://www.uvm.edu/~jfarley/BUG/Herman%20Daly%20Festschrift.pdf
Denholm P, Hand M., 2011. Grid flexibility and storage required to achieve very high penetration of
variable renewable electricity. Energy Policy. 39: 1817–30.
Doherty, R., Nolan, G., Burke, D.J., Bryson, A., O’Malley, M. An Assessment of the Impact of Wind
Generation on System Frequency Control. IEEE Transactions on Power Systems, Vol. 25, No 1.,
February 2010.
Dudurych I, Burke M, Fisher L, Eager M, Kelly K., 2017. Operational security challenges and tools for
a synchronous power system with high penetration of non-conventional sources. CIGRE
(International Council on Large Electric Systems) Science & Engineering Journal. 91–101.
ENTSO-E, 2017. Rate of Change of Frequency (ROCOF) withstand capability. ENTSO-E guidance
document for national implementation for network codes on grid connection.
Pg. Marítim de la Barceloneta, 37-49 08003 Barcelona www.medeas.eu [email protected] T +34 93 230 95 00 F +34 93 230 95 55
This project has received funding from the European Union’s Horizon 2020 research and innovation programme under grant agreement No 691287
211
Etxegarai A, Eguia P, Torres E, Iturregi A, Valverde V., 2015. Review of grid connection requirements
for generation assets in weak power grids. Renewable and Sustainable Energy Review. 41: 1501–
1504.
Fernandez-Bernal F, Egido I, Lobato E., 2015. Maximum wind power generation in a power system
imposed by system inertia and primary reserve requirements. Wind Energy. 18: 1501–1514.
Fan X, Wang W, Shi R, Li F., 2015. Analysis and countermeasures of wind power curtailment in China.
Renewable and Sustainable Energy Review. 52: 1429–1436.
Heetun, K. Z., Shady H. E. Abdel Aleem & Ahmed F. Zobaa, 2016). Voltage stability analysis of grid-
connected wind farms with FACTS: Static and dynamic analysis. Energy and Policy Research. 3:1: 1-
12.
Huber, M., Dimkova, D. and Hamacher, T., 2014. Integration of wind and solar power in Europe:
Assessment of flexibility requirements. Energy. 69: 236-246.
IEA, 2009. Empowering variable renewables: options for Flexible Electricity Systems. Paris:
International Energy Agency.
IEA, 2019. Status of Power System Transformation. Paris.
www.iea.org/publications/reports/StatusofPowerSystemTransformation2019/.
IRENA, 2016. Data and statistics of capacity and generation.
IRENA, 2017. Renewable capacity statistics 2017. Abu Dhabi: International Renewable Energy
Agency.
Kondziella H, Bruckner T., 2016. Flexibility requirements of renewable energy based electricity
systems - a review of research results and methodologies. Renewable and Sustainable Energy
Reviews. 53: 10–22.
Mararakanye, N. and Bekker, B., 2019. Renewable energy integration impacts within the context of
generator type, penetration level and grid characteristics. Renewable and Sustainable Energy
Reviews. 108: 441-451.
Pg. Marítim de la Barceloneta, 37-49 08003 Barcelona www.medeas.eu [email protected] T +34 93 230 95 00 F +34 93 230 95 55
This project has received funding from the European Union’s Horizon 2020 research and innovation programme under grant agreement No 691287
212
Miller, N. W., Shao, M., Pajic, S., and D'Aquila, R., 2014. Western Wind and Solar Integration Study
Phase 3 – Frequency Response and Transient Stability. United States National Renewable Energy
Laboratory (NREL) https://www.nrel.gov/docs/fy15osti/62906.pdf
Müller, T., Gunkel, D. and Most, D. How does renewable curtailment influence the need of
transmission and storage capacities in Europe?, 13th European IAEE Conference, 2013.
Müller, T., Möst, D., 2018. Demand Response Potential: Available when Needed? Energy Policy. 115:
181-198.
Müller, T., Herbst, A., Klingler, A., Wyrwa, A., Fermi, F., Reiter U., 2017. How to balance intermittent
feed-in from renewable energies?- A techno-economic comparison of flexibility options. REFLEX
Analysis of the European energy system. http://reflex-project.eu/wp-
content/uploads/2017/12/REFLEX_policy_brief_flexibility-options_final_14_12_2017.pdf
Min, C.-G., 2019. Analyzing the Impact of Variability and Uncertainty on Power System Flexibility.
Applied Sciences. 9 (3): 561-574.
Neumann, T., Erlich, I., 2012. Short Circuit Current Contribution of a Photovoltaic Power Plant. IFAC
(International Federation of Automatic Control) Proceedings. 45 (21): 343-348.
Quanta Technology, 2009. Grid impacts and solutions of renewables at high penetration levels.
Westchase (USA).
Ram M., Bogdanov D., Aghahosseini A., Gulagi A., Oyewo A.S., Child M., Caldera U., Sadovskaia K.,
Farfan J., Barbosa LSNS., Fasihi M., Khalili S., Fell H.-J., Breyer C., 2018. Global Energy System based
on 100% Renewable Energy – Energy Transition in Europe Across Power, Heat, Transport and
Desalination Sectors. Study by Lappeenranta University of Technology University (Lappeenranta,
Finland) and Energy Watch Group (Berlin).
Rasmussen, M. G., Andresen, G. B., Greiner, M., 2012. Storage and balancing synergies in a fully or
highly renewable pan-European power system. Energy Policy. 51: 642-651.
REFLEX, EU H2020 project. http://reflex-project.eu
Riahi, K., Van Vuuren, D.P., Kriegler, E., Edmonds, J., O ’neill, B.C., Fujimori, S., Bauer, N., Calvin, K.,
Dellink, R., Fricko, O., Lutz, W., Popp, A., Cuaresma, J.C., Kc, S., Leimbach, M., Jiang, L., Kram, T., Rao,
S., Emmerling, J., Ebi, K., Hasegawa, T., Havlik, P., Humpenöder, F., Aleluia, L., Silva, D., Smith, S.,
Stehfest, E., Bosetti, V., Eom, J., Gernaat, D., Masui, T., Rogelj, J., Strefler, J., Drouet, L., Krey, V.,
Pg. Marítim de la Barceloneta, 37-49 08003 Barcelona www.medeas.eu [email protected] T +34 93 230 95 00 F +34 93 230 95 55
This project has received funding from the European Union’s Horizon 2020 research and innovation programme under grant agreement No 691287
213
Luderer, G., Harmsen, M., Takahashi, K., Baumstark, L., Doelman, J.C., Kainuma, M., Klimont, Z.,
Marangoni, G., Lotze-Campen, H., Obersteiner, M., Tabeau, A., Tavoni, M., 2017. The Shared
Socioeconomic Pathways and their energy, land use, and greenhouse gas emissions implications: An
overview. Global Environmental Change. 42: 153–168.
Shafiullah, G. M., Amanullah M. T. Oo, A. B. M. Shawkat Ali, and Alex Stojcevski, 2013. Influences of
Wind Energy Integration into the Distribution Network. Journal of Wind Energy.
Solomon, A.A., D. Bogdanov, C. Breyer., 2019. Curtailment-storage-penetration nexus in the energy
transition. Applied Energy. 235: 1351-1368.
Turcotte D. and Katiraei, F., 2009. Fault contribution of grid-connected inverters. 2009 IEEE Electrical
Power & Energy Conference (EPEC), Montreal, QC. 1-5.
Zipp, A., 2017. The marketability of variable renewable energy in liberalized electricity markets – An
empirical analysis. Renewable Energy. 113: 1111-1121.
Zöphel, C., Schreiber, S., Müller, T. and Möst, D., 2018. Which Flexibility Options Facilitate the
Integration of Intermittent Renewable Energy Sources in Electricity Systems?. Current
Sustainable/Renewable Energy Reports. 5 (1): 37-44.
Pg. Marítim de la Barceloneta, 37-49 08003 Barcelona www.medeas.eu [email protected] T +34 93 230 95 00 F +34 93 230 95 55
This project has received funding from the European Union’s Horizon 2020 research and innovation programme under grant agreement No 691287
214
6. Electricity pricing as a tool for RES transition
List of abbreviations and acronyms
BAU Business as Usual scenario
CRE controllable renewable energy
DSO distribution system operator
DUoS distribution use of system
FIT Feed in Tariff
LCOE Levelised Cost of Energy
MOE Merit Order Effect
OLT Optimal Level Transition scenario
PtG Power to Gas technologies
RESC Renewable Energy Support Costs
TNUoS transmission network use of system
TSO transmission system operator
VRE variable renewable energy
Pg. Marítim de la Barceloneta, 37-49 08003 Barcelona www.medeas.eu [email protected] T +34 93 230 95 00 F +34 93 230 95 55
This project has received funding from the European Union’s Horizon 2020 research and innovation programme under grant agreement No 691287
215
6.1. Introduction
To achieve the aim of a highly decarbonised socio-economy the energy sector must undertake an
extensive shift from fossil fuel to a Renewable Energy Sources (RES) power generation. Following
the European Commission legislative plans, in 2030, half of the EU’s electricity demand will be met
by renewables, and in 2050 the power sector will have to be completely carbon-free (Genoese et al.
2016). Besides the technical issues of the grid transformation to support a high contribution of RES
in energy supply, massive implementation of Renewable Energy Sources (RES) requires specific and
targeted investments, which should be addressed from both public and private sectors.
Between the different tools to favour RES deployment, one of them is acting in the market by
influencing electricity prices, differentiating by energy production source (RES or non-RES). In this
regard, price regulation has been used in Germany to implement what has been called
Energiewende (Joas et al. 2016, Kreuz and Musgens, 2017).
From a supply point of view, we must distinguish between two types of renewable energy sources
(Zipp, 2017):
• Variable Renewable Energy (VRE). This refers to Wind, PV, CSP and other RES, which depend
of the availability of the natural resource used for electricity generation. This kind of
generation often has low marginal costs and large fixed costs (Heal, 2009).
• Controllable Renewable Energy (CRE). These include sources as tidal, hydro, bioenergy and
biofuels and often have large marginal costs and low fixed costs compared with VRE.
Added to these sources, and to deal with the VRE intermittence, there is the need for energy
storage, which considering the current technologies, rely mainly on Pumped Hydro Stations and
batteries. If we consider existing, but not yet developed, technologies we should include the power-
to-gas (PtG, with hydrogen and synthetic methane) and other technologies such as compressed air
or thermal storage (Solomon et al. 2019). PtG technologies have the advantage that they could use
the current infrastructure of gas so no high extra investments in pipelines and transport
infrastructures are needed to implement it. Such necessary investments to achieve RES deployment
could be addressed by using the electricity prices in a liberalized energy market in EU. Besides the
relationship between energy and investments, energy prices in the market could have other main
impacts:
1. they can incentivise energy savings from consumer side. The energy consumption and
particularly electricity cost have been related to households consumption (He et al. 2015)
Pg. Marítim de la Barceloneta, 37-49 08003 Barcelona www.medeas.eu [email protected] T +34 93 230 95 00 F +34 93 230 95 55
This project has received funding from the European Union’s Horizon 2020 research and innovation programme under grant agreement No 691287
216
2. they can progressively transform the energy market by including a high penetration of RES
by attracting the necessary investments in RES. Prices could play a role, with the proper
economic instruments to redirect the monetary fluxes to the necessary initial investments
for RES (fixed costs).
3. they could provide the necessary investments for electric grid adaptation and the necessary
storage technologies for RES massive deployment. Again prices regulated prices or taxation
could be used to support the necessary grid interconnection investments.
4. they could incentivise the small producers in the so-called prosumer paradigm. This will need
also a grid transformation (from centralised to decentralised grids).
Here we will focus only on the aspect of price regulation to favour the RES penetration.
One of the main mechanisms on which electricity prices have been based is the merit-order-effect
(MOE), and thus in the past a Feed-in Tariff (FIT) has often been implemented in energy markets.
The most cited case study for its implementation has been the German Energiewende (Kreuz and
Musgens, 2017). There are two aspects to be considered that could be extrapolated to the European
case: the economic costs to society and the electricity price effects. It is important to note that new
RES deployment (in particular onshore wind) is now grid comparable with non-RES (and in some
cases cheaper) and therefore future deployments do not necessarily need further subsidy on the
RES technology itself.
One issue with the pricing of electricity in a free market is the trade-off between the above mention
aspects: prices and costs. In particular, there is the need for revenues that compensate the initial
investments and operational costs, fulfil the investors’ expectations and allow the TSO and DSO to
obtain benefits. However, the current energy market has developed around a thermal power system
(low fixed cost and higher marginal cost). Therefore, traditionally RES (having high fixed cost and
low marginal cost) has had trouble competing in a totally free market with no taxes and levies to
favour it (EC, 2019). Indeed some taxes favour non-RES technologies. This has often been
compensated for through the introduction of Feed-in-tariffs (based on MOE criteria) or Renewable
Energy Support Costs (RESC) (RESA, 2014) to favour RES. However, the price of the wholesale
electricity can go down when RES, or non-RES, enters the market and significantly increases energy
capacity in a short space of time without the commensurate increase in energy demand (Kreuz and
Musgens, 2017). For instance, in Germany the gross costs of RES amounted to € 27.5 billion in 2015
and the revenues from wholesale market are € 4.7 billion. Hence, the 2015 RESC should pay around
€ 22 billion (Kost et al. 2013, Kreuz and Musgens, 2017).

Pg. Marítim de la Barceloneta, 37-49 08003 Barcelona www.medeas.eu [email protected] T +34 93 230 95 00 F +34 93 230 95 55
This project has received funding from the European Union’s Horizon 2020 research and innovation programme under grant agreement No 691287
217
Here due to the limitations of the current MEDEAS set of models, how pricing can be used as a tool
either to induce investment, to reduce demand or incentive efficiency in supply and demand sides,
cannot be analysed directly. Instead, we will use an inverse methodology in this analysis, first we
overview some of the issues related to the electricity marked concerning the pricing as a tool.
Afterwards we will explore what are the needs in terms of investments and electricity grid
transformation using the model outputs under different scenarios. Finally, we will give estimations
about the costs of such RES development based on investment needs and how this can be translated
in terms of electricity prices. To this aim, we will introduce an additional scenario, which has a more
intensive decarbonisation, so we can analyse a more demanding situation for resources, investment
and rate of implementation. The new scenario has the pros of approaching the policies for
decarbonisation that OLT (and BAU) does not fulfil.
In the next section, we will explore the main current issues concerning the costs for RES massive
deployment and how can these affect the electricity pricing strategies (section 2). Based on such
analysis we will analyse current MEDEAS model scenarios runs (section 3) and will propose future
model improvements to address more accurately the evaluation of investments and the LCOE.
Finally we will draw some conclusions based in the simulations (section 4) and give some estimation
about prices evolution under high decarbonisation scenario.
Pg. Marítim de la Barceloneta, 37-49 08003 Barcelona www.medeas.eu [email protected] T +34 93 230 95 00 F +34 93 230 95 55
This project has received funding from the European Union’s Horizon 2020 research and innovation programme under grant agreement No 691287
218
6.2. Costs of significant RES expansion
In a recent European Commission report to the European Parliament (EC, 2019) the need to evaluate
energy costs to protect vulnerable households against energy poverty (Dubois and Meier, 2016; See
also chapter 7 of this report) and ensure the correct functioning of the industry under new market
situations is emphasised. The report also points out the ongoing volatility of energy prices,
particularly when relying on fossil fuels and the impact of this on the EU economy.
Focusing on the wholesale electricity market, the increase in RES penetration generally lowers prices
in spot markets but price trends are dominated by coal and gas prices, which set the marginal prices
(Dillig et al. 2016). This is also pointed out by Johnson and Olivier (2018). These authors propose
two countervailing forces: the penetration of RES should reduce wholesale short-variance prices
due to stochastic MOE, however increasing the RES capacity will act to increase variability of prices,
due to the intermittency effect which could, under high RES penetration (and no energy storage)
override the MOE and their role in diminishing the variance. Thus it is necessary to reduce RES
intermittency and invest in storage capacities. An accurate analysis of RES costs that can help to
improve the evaluation of LCOE is necessary to help provide long-term price signals for EU (Genoese
et al. 2016).
Other energy costs (Felder 2011), some of which depend in part on the wholesale price of energy,
include renewable energy credits (RECs), installed capacity payments, transmission expansion and
congestion costs, emission allowances for sulphur dioxides, nitrogen oxides, and carbon dioxide,
ancillary services, and generation bid-production guarantees. The main costs of RES, besides the
before mentioned, could be listed as:
• Installation, operation and maintenance costs (O&M). In 2018 the global weighted average
cost for all RES technologies were at the lower-end of the fuel cost range (IRENA, 2019). For
instance for wind in EU the costs are estimated to be between $109/kW/year and
$140/kW/year (IRENA, 2018).
• Intermittency and dispatchability associated costs. (Joskow, 2011), RES are not dispatchable
in the traditional sense (cannot be dispatched regarding economic criteria). Operators must
currently respond to what energy comes from RES and complement it with CRE or thermic
power plants, balancing supply and demand continuously.
• Storage technologies costs. Storage could provide in this present state ancillary services to
the electricity networks for reducing peak loads. The fast implementation of storage
capacities strongly depends on the investments costs and who will pay them. For instance in
Pg. Marítim de la Barceloneta, 37-49 08003 Barcelona www.medeas.eu [email protected] T +34 93 230 95 00 F +34 93 230 95 55
This project has received funding from the European Union’s Horizon 2020 research and innovation programme under grant agreement No 691287
219
UK, storage providers must pay double TNUoS tariffs for being generators and consumers.
High storage and flexible demand will help to harmonize the prices and to avoid the current
trade-off between marginal and fixed costs in fossil versus RES. Storage will act as a
consumer when there is an abundant supply of variable renewables, thus counterbalancing
the downward effect on prices that occurs in the periods when for MOE the renewables are
the drivers in the market.
• Grid adaptation costs. The costs of adapting the electric grid with interconnections across
EU and to allow a decentralized energy supply it is a key issue to be carefully planned and so
their investment costs and the policies harmonization for the TSO well developed. The grid
adaptation will also account for more grid flexibility.
Analysis of the RES costs are aimed at improving the market economic efficiency in the sense that
revenues should cover the major part of the fixed costs of RES. However, as we have commented
previously, in the current electricity market RES deployment at scale can lower wholesale prices and
therefore some RESC needs to be implemented and so the EU countries use taxation to obtain the
necessary capital. However, the role of taxation besides the RESC, could have interesting effects on
the market and the sector (EC, 2019). Using general taxation as a source of revenue is often
considered to be more progressive than increases in electricity prices. However, a high share of
energy taxes can diminish the short-term variability (volatility) of prices coming from fossil fuels,
thus mitigating the impact of unexpected price swing which in turn benefits consumers and industry
(this is seen in current oil prices for transportation). Energy taxes could also amplify price signals to
discourage excessive energy consumption. Energy taxes of course directly increase the cost of
energy for consumers and therefore can increase fuel poverty dramatically whereas there is more
scope for general taxation to be implemented in such a way as to reduce inequality in member
states (although of course this is not always the case). Therefore, any such route to change energy
taxation, or general taxation, needs to be carefully considered and subsequent impacts monitored
to ensure negative impacts are minimised.
Regardless of whether through energy or general taxation, the revenue can support subsidies of
desirable developments not adequately addressed by the energy market. Additionally, energy taxes
- in particular excise duties on petroleum products - continue to be an important and stable source
of revenue for the EU countries (on average nearly 5% of their total tax revenue).
Consumers can also play a significant role in the transition, if they are provided with the information,
opportunities and rewards to actively participate in such transition. However, the appropriate
regulatory framework accompanying the digital transformation and technological development to
Pg. Marítim de la Barceloneta, 37-49 08003 Barcelona www.medeas.eu [email protected] T +34 93 230 95 00 F +34 93 230 95 55
This project has received funding from the European Union’s Horizon 2020 research and innovation programme under grant agreement No 691287
220
empower consumers is still missing. Thus empowering consumers and allowing them to play in what
is called a prosumer role is a key issue in an already very complex transition (EC, 2016). However, in
this present work we won’t consider the prosumer or the consumer behaviour, a concrete study of
this would require modelling tools such as Agent Based Models that are beyond the scope of the
current tools in MEDEAS. Finally, the EU has called for the removal of fossil fuel subsidies because
they hamper the energy transition.
Pg. Marítim de la Barceloneta, 37-49 08003 Barcelona www.medeas.eu [email protected] T +34 93 230 95 00 F +34 93 230 95 55
This project has received funding from the European Union’s Horizon 2020 research and innovation programme under grant agreement No 691287
221
6.3. MEDEAS model and scenarios
The MEDEAS model, which is based on energy units, is not able to produce projections and to
analyse prices. Thus, the role of prices in the energy market, and also the energy sector per se, in
their economic part is difficult to study based only on the simulations of the MEDEAS model. Taking
into account this problem the work we have done here is to select a set of variables that could relate
to the evolution of the prices and costs, based on an implementation of high shares of RES. The main
aim is to provide information that helps to analyse the gross cost of RES and so can give inputs on
the LCOE calculations (Kost et al. 2013). This implies the (fixed) cost of the investment on
construction operation and maintenance of the power plants and so it will give indications on the
cost of the installations and how this should impact the energy prices. With these assumptions,
alongside the physical installations from the MEDEAS model, we can estimate the investment cost
and the cost of Operation and Maintenance, so we can provide a different indicator that can be
compared with the LCOE. We will also estimate the energy cost of operation and maintenance of
RES. We note of course that this represents only a small part of the consideration when developing
policy associated with energy pricing as a tool for enabling the energy transition and in particular it
does not include the full impacts on society from such a policy (or set of policies).
We will suggest possible future model functionalities to improve the analysis on prices using the
MEDEAS model.
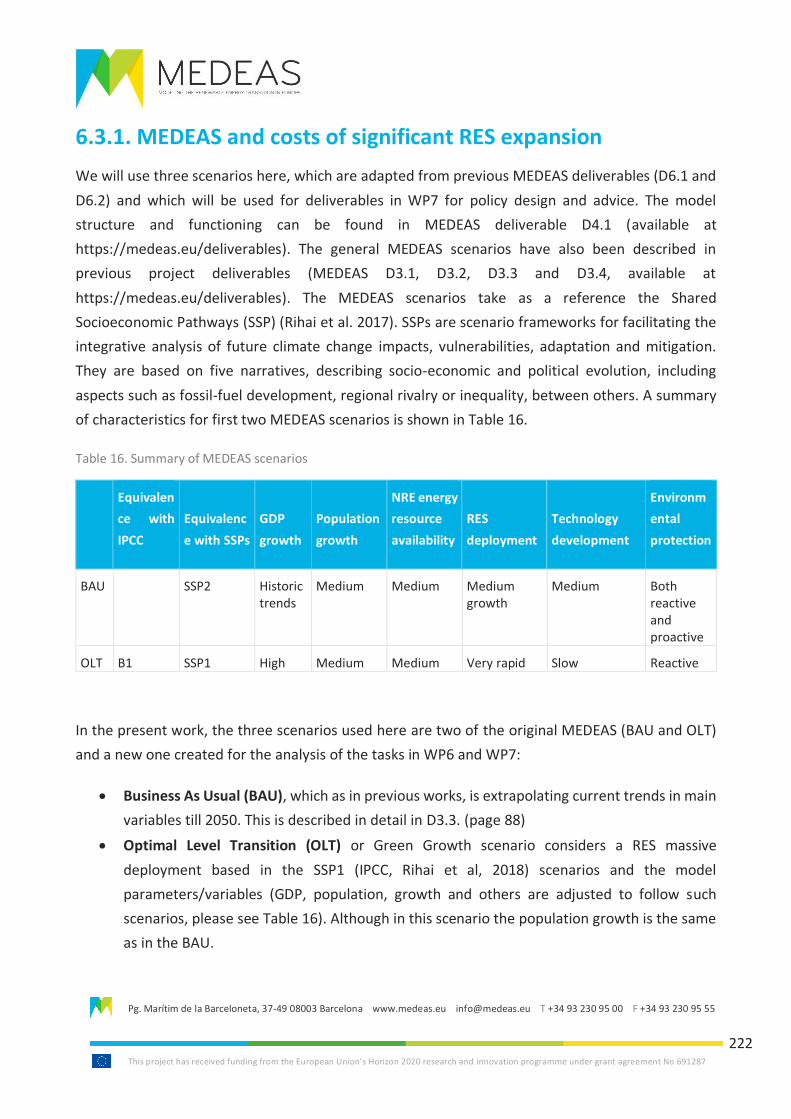
Pg. Marítim de la Barceloneta, 37-49 08003 Barcelona www.medeas.eu [email protected] T +34 93 230 95 00 F +34 93 230 95 55
This project has received funding from the European Union’s Horizon 2020 research and innovation programme under grant agreement No 691287
222
6.3.1. MEDEAS and costs of significant RES expansion
We will use three scenarios here, which are adapted from previous MEDEAS deliverables (D6.1 and
D6.2) and which will be used for deliverables in WP7 for policy design and advice. The model
structure and functioning can be found in MEDEAS deliverable D4.1 (available at
https://medeas.eu/deliverables). The general MEDEAS scenarios have also been described in
previous project deliverables (MEDEAS D3.1, D3.2, D3.3 and D3.4, available at
https://medeas.eu/deliverables). The MEDEAS scenarios take as a reference the Shared
Socioeconomic Pathways (SSP) (Rihai et al. 2017). SSPs are scenario frameworks for facilitating the
integrative analysis of future climate change impacts, vulnerabilities, adaptation and mitigation.
They are based on five narratives, describing socio-economic and political evolution, including
aspects such as fossil-fuel development, regional rivalry or inequality, between others. A summary
of characteristics for first two MEDEAS scenarios is shown in Table 16.
Table 16. Summary of MEDEAS scenarios
Equivalen
ce with
IPCC
Equivalenc
e with SSPs
GDP
growth
Population
growth
NRE energy
resource
availability
RES
deployment
Technology
development
Environm
ental
protection
BAU SSP2 Historic trends
Medium Medium Medium growth
Medium Both reactive and proactive
OLT B1 SSP1 High Medium Medium Very rapid Slow Reactive
In the present work, the three scenarios used here are two of the original MEDEAS (BAU and OLT)
and a new one created for the analysis of the tasks in WP6 and WP7:
• Business As Usual (BAU), which as in previous works, is extrapolating current trends in main
variables till 2050. This is described in detail in D3.3. (page 88)
• Optimal Level Transition (OLT) or Green Growth scenario considers a RES massive
deployment based in the SSP1 (IPCC, Rihai et al, 2018) scenarios and the model
parameters/variables (GDP, population, growth and others are adjusted to follow such
scenarios, please see Table 16). Although in this scenario the population growth is the same
as in the BAU.
Pg. Marítim de la Barceloneta, 37-49 08003 Barcelona www.medeas.eu [email protected] T +34 93 230 95 00 F +34 93 230 95 55
This project has received funding from the European Union’s Horizon 2020 research and innovation programme under grant agreement No 691287
223
• TRANS scenario (see Appendix 1), which considers the general framework of the OLT (with
the main parameters from SSP1) but with some changes to achieve two aims: stationary
economy (imposed low GDP growth) at the end of the period and full societal and economic
sector electrification. The second aim is aligned with the European Commission directives
requiring a total decarbonisation of the power sector by 2050. Here we also suppose that
not only the power sector but all the economic activities are experiencing a high
decarbonisation process to adapt to the Commission requirements to reduce the emissions
to 80-90% from 1995 levels.
In this scenario we changed the following from OLT: techno-ecological potentials and deployment
rates, desired GDPpc, energy intensities, inland and household transport, EROI feedback on the
economy (switch off), fuel shift (energy scarcity and forgetting factor), afforestation program,
phasing out fossil fuels for electricity and heat production, NRE underground, GLT and CTL set to
zero and recycling rates.
All the scenarios introduced are run in two geographical levels (and models): World and EU in a
nested approach. This nesting is one way: the results from World are used to run EU but changes in
EU then do not affect the World simulation.
In the following section, we will show the simulations of the three scenarios using the variables of
interest here: RES costs and related investment for deployment, operation and maintenance. To
frame the results we will introduce first the general behaviour of the three scenarios considered.
The main variables for these scenarios to show are the GDP per capita (GDPpc), total final energy
consumption per capita (TFECpc), share of RES vs. TFEC and total CO2 emissions (in GtCO2). More
information about the TRANS scenario could be found in the D7.1, section of energy costs. The
results for three scenarios will be presented: transition scenario (TRANS from now on, SCEN3 in the
legends), OLT scenario (SCEN2 in the legends) and those of the BAU (BAU in the legends).
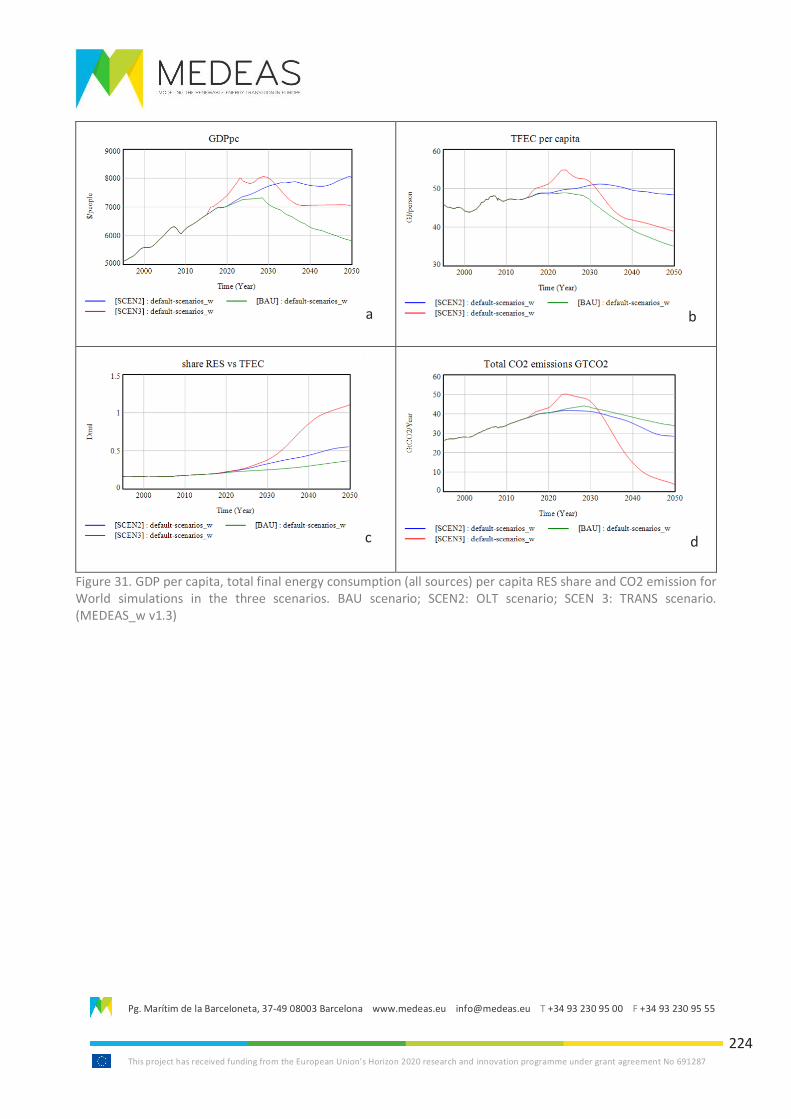
Pg. Marítim de la Barceloneta, 37-49 08003 Barcelona www.medeas.eu [email protected] T +34 93 230 95 00 F +34 93 230 95 55
This project has received funding from the European Union’s Horizon 2020 research and innovation programme under grant agreement No 691287
224
a b
c d
Figure 31. GDP per capita, total final energy consumption (all sources) per capita RES share and CO2 emission for World simulations in the three scenarios. BAU scenario; SCEN2: OLT scenario; SCEN 3: TRANS scenario. (MEDEAS_w v1.3)
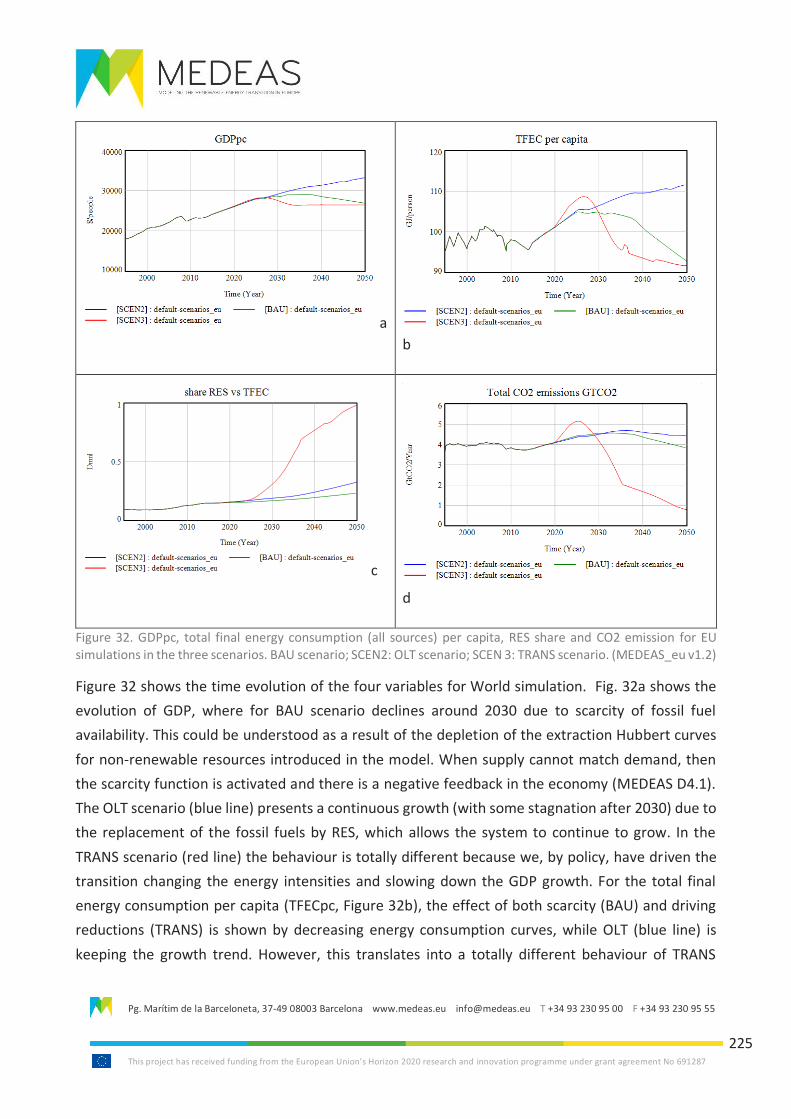
Pg. Marítim de la Barceloneta, 37-49 08003 Barcelona www.medeas.eu [email protected] T +34 93 230 95 00 F +34 93 230 95 55
This project has received funding from the European Union’s Horizon 2020 research and innovation programme under grant agreement No 691287
225
a
b
c
d
Figure 32. GDPpc, total final energy consumption (all sources) per capita, RES share and CO2 emission for EU simulations in the three scenarios. BAU scenario; SCEN2: OLT scenario; SCEN 3: TRANS scenario. (MEDEAS_eu v1.2)
Figure 32 shows the time evolution of the four variables for World simulation. Fig. 32a shows the
evolution of GDP, where for BAU scenario declines around 2030 due to scarcity of fossil fuel
availability. This could be understood as a result of the depletion of the extraction Hubbert curves
for non-renewable resources introduced in the model. When supply cannot match demand, then
the scarcity function is activated and there is a negative feedback in the economy (MEDEAS D4.1).
The OLT scenario (blue line) presents a continuous growth (with some stagnation after 2030) due to
the replacement of the fossil fuels by RES, which allows the system to continue to grow. In the
TRANS scenario (red line) the behaviour is totally different because we, by policy, have driven the
transition changing the energy intensities and slowing down the GDP growth. For the total final
energy consumption per capita (TFECpc, Figure 32b), the effect of both scarcity (BAU) and driving
reductions (TRANS) is shown by decreasing energy consumption curves, while OLT (blue line) is
keeping the growth trend. However, this translates into a totally different behaviour of TRANS
Pg. Marítim de la Barceloneta, 37-49 08003 Barcelona www.medeas.eu [email protected] T +34 93 230 95 00 F +34 93 230 95 55
This project has received funding from the European Union’s Horizon 2020 research and innovation programme under grant agreement No 691287
226
compared with OLT and BAU in the case of fossil fuel share in the energy mix (Figure 32c) and,
consequently in the total CO2 emissions (Figure 32d) for each scenario.
We can see that the TRANS scenario has a huge reduction in emissions due to the high share of RES.
Table 17 shows the same variables but in the EU case. The behaviour of all the variables is similar to
the World simulations but in the case of TRANS scenario (red line) the curves show lower GDPpc
and, consequently lower consumption than the other two scenarios, differently than in World case
where TRANS was between the two other. However, in the case of Share or RES (Figure 32c) and
CO2 emissions (Figure 32d) the results are similar to the World simulations, showing that TRANS
scenario is the only one to achieve the goal of fully decarbonized energy sector in both World and
EU.
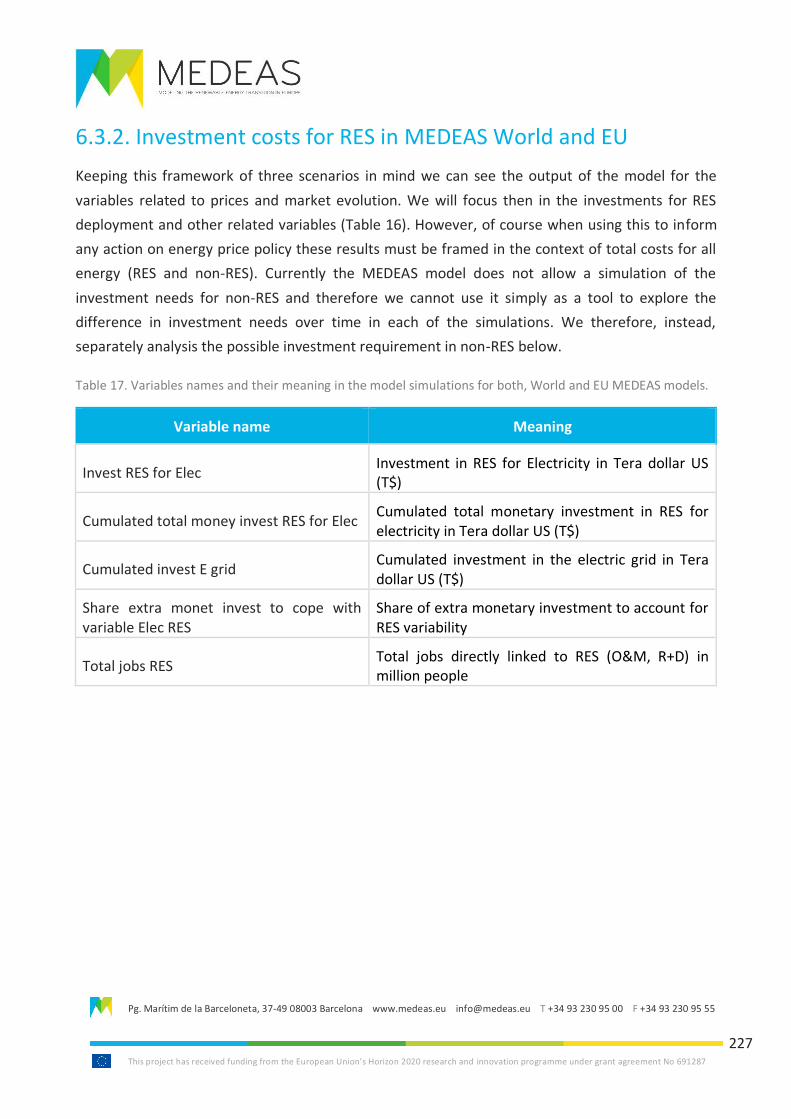
Pg. Marítim de la Barceloneta, 37-49 08003 Barcelona www.medeas.eu [email protected] T +34 93 230 95 00 F +34 93 230 95 55
This project has received funding from the European Union’s Horizon 2020 research and innovation programme under grant agreement No 691287
227
6.3.2. Investment costs for RES in MEDEAS World and EU
Keeping this framework of three scenarios in mind we can see the output of the model for the
variables related to prices and market evolution. We will focus then in the investments for RES
deployment and other related variables (Table 16). However, of course when using this to inform
any action on energy price policy these results must be framed in the context of total costs for all
energy (RES and non-RES). Currently the MEDEAS model does not allow a simulation of the
investment needs for non-RES and therefore we cannot use it simply as a tool to explore the
difference in investment needs over time in each of the simulations. We therefore, instead,
separately analysis the possible investment requirement in non-RES below.
Table 17. Variables names and their meaning in the model simulations for both, World and EU MEDEAS models.
Variable name Meaning
Invest RES for Elec Investment in RES for Electricity in Tera dollar US (T$)
Cumulated total money invest RES for Elec Cumulated total monetary investment in RES for electricity in Tera dollar US (T$)
Cumulated invest E grid Cumulated investment in the electric grid in Tera dollar US (T$)
Share extra monet invest to cope with variable Elec RES
Share of extra monetary investment to account for RES variability
Total jobs RES Total jobs directly linked to RES (O&M, R+D) in million people
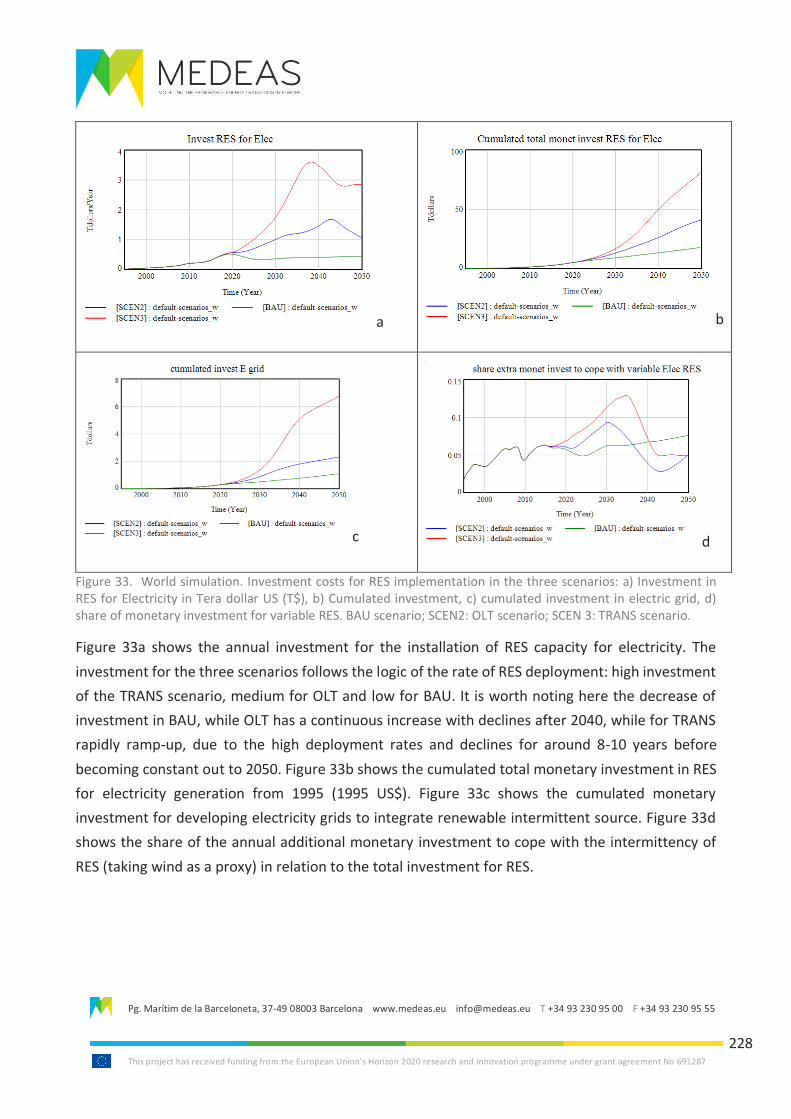
Pg. Marítim de la Barceloneta, 37-49 08003 Barcelona www.medeas.eu [email protected] T +34 93 230 95 00 F +34 93 230 95 55
This project has received funding from the European Union’s Horizon 2020 research and innovation programme under grant agreement No 691287
228
a b
c d
Figure 33. World simulation. Investment costs for RES implementation in the three scenarios: a) Investment in RES for Electricity in Tera dollar US (T$), b) Cumulated investment, c) cumulated investment in electric grid, d) share of monetary investment for variable RES. BAU scenario; SCEN2: OLT scenario; SCEN 3: TRANS scenario.
Figure 33a shows the annual investment for the installation of RES capacity for electricity. The
investment for the three scenarios follows the logic of the rate of RES deployment: high investment
of the TRANS scenario, medium for OLT and low for BAU. It is worth noting here the decrease of
investment in BAU, while OLT has a continuous increase with declines after 2040, while for TRANS
rapidly ramp-up, due to the high deployment rates and declines for around 8-10 years before
becoming constant out to 2050. Figure 33b shows the cumulated total monetary investment in RES
for electricity generation from 1995 (1995 US$). Figure 33c shows the cumulated monetary
investment for developing electricity grids to integrate renewable intermittent source. Figure 33d
shows the share of the annual additional monetary investment to cope with the intermittency of
RES (taking wind as a proxy) in relation to the total investment for RES.
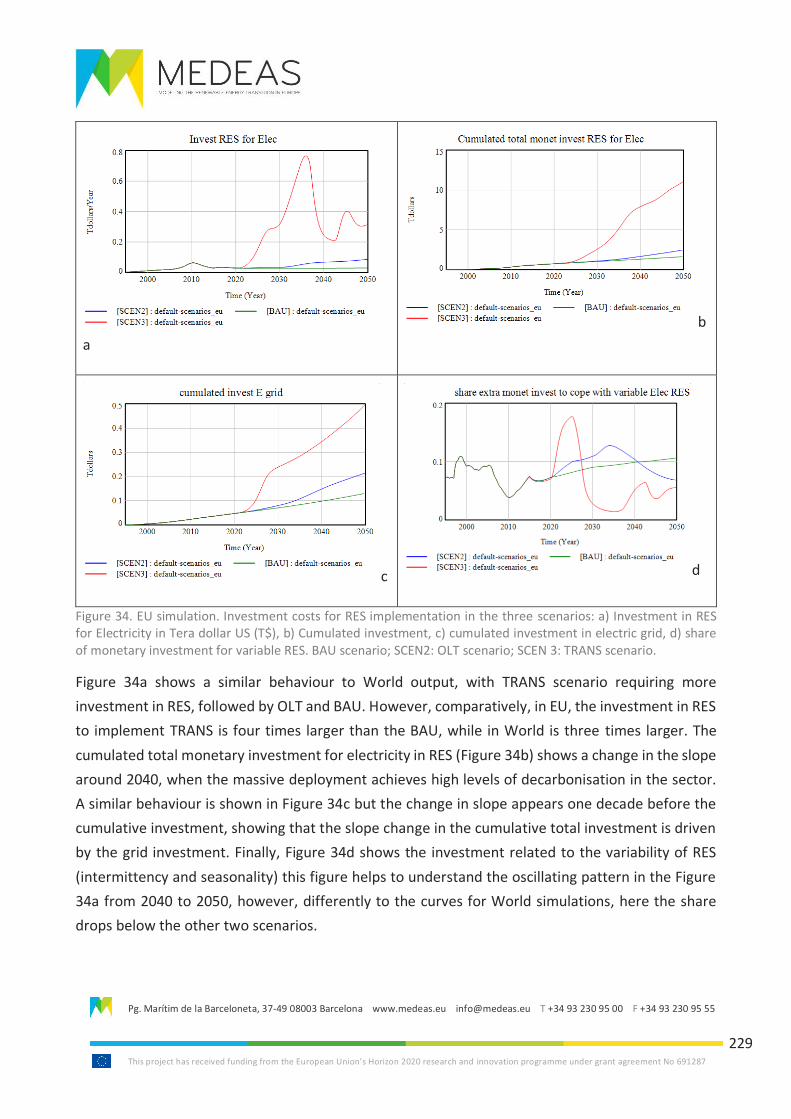
Pg. Marítim de la Barceloneta, 37-49 08003 Barcelona www.medeas.eu [email protected] T +34 93 230 95 00 F +34 93 230 95 55
This project has received funding from the European Union’s Horizon 2020 research and innovation programme under grant agreement No 691287
229
a
b
c d
Figure 34. EU simulation. Investment costs for RES implementation in the three scenarios: a) Investment in RES for Electricity in Tera dollar US (T$), b) Cumulated investment, c) cumulated investment in electric grid, d) share of monetary investment for variable RES. BAU scenario; SCEN2: OLT scenario; SCEN 3: TRANS scenario.
Figure 34a shows a similar behaviour to World output, with TRANS scenario requiring more
investment in RES, followed by OLT and BAU. However, comparatively, in EU, the investment in RES
to implement TRANS is four times larger than the BAU, while in World is three times larger. The
cumulated total monetary investment for electricity in RES (Figure 34b) shows a change in the slope
around 2040, when the massive deployment achieves high levels of decarbonisation in the sector.
A similar behaviour is shown in Figure 34c but the change in slope appears one decade before the
cumulative investment, showing that the slope change in the cumulative total investment is driven
by the grid investment. Finally, Figure 34d shows the investment related to the variability of RES
(intermittency and seasonality) this figure helps to understand the oscillating pattern in the Figure
34a from 2040 to 2050, however, differently to the curves for World simulations, here the share
drops below the other two scenarios.
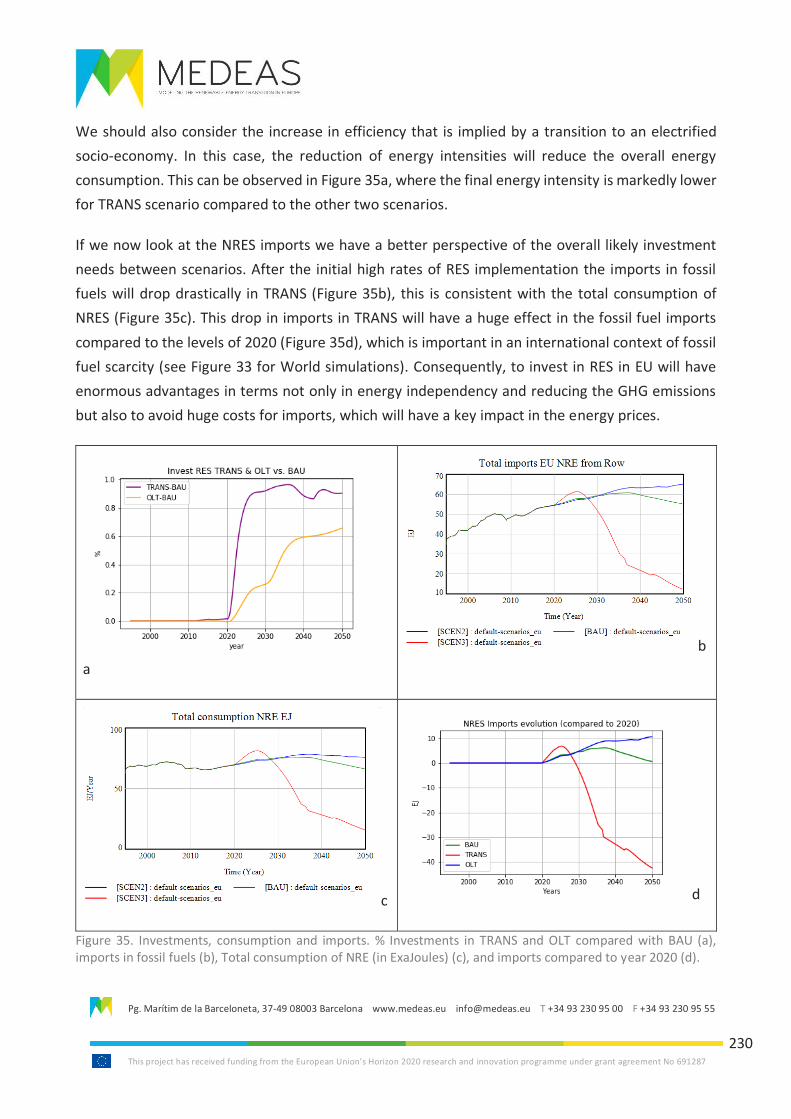
Pg. Marítim de la Barceloneta, 37-49 08003 Barcelona www.medeas.eu [email protected] T +34 93 230 95 00 F +34 93 230 95 55
This project has received funding from the European Union’s Horizon 2020 research and innovation programme under grant agreement No 691287
230
We should also consider the increase in efficiency that is implied by a transition to an electrified
socio-economy. In this case, the reduction of energy intensities will reduce the overall energy
consumption. This can be observed in Figure 35a, where the final energy intensity is markedly lower
for TRANS scenario compared to the other two scenarios.
If we now look at the NRES imports we have a better perspective of the overall likely investment
needs between scenarios. After the initial high rates of RES implementation the imports in fossil
fuels will drop drastically in TRANS (Figure 35b), this is consistent with the total consumption of
NRES (Figure 35c). This drop in imports in TRANS will have a huge effect in the fossil fuel imports
compared to the levels of 2020 (Figure 35d), which is important in an international context of fossil
fuel scarcity (see Figure 33 for World simulations). Consequently, to invest in RES in EU will have
enormous advantages in terms not only in energy independency and reducing the GHG emissions
but also to avoid huge costs for imports, which will have a key impact in the energy prices.
a
b
c d
Figure 35. Investments, consumption and imports. % Investments in TRANS and OLT compared with BAU (a), imports in fossil fuels (b), Total consumption of NRE (in ExaJoules) (c), and imports compared to year 2020 (d).
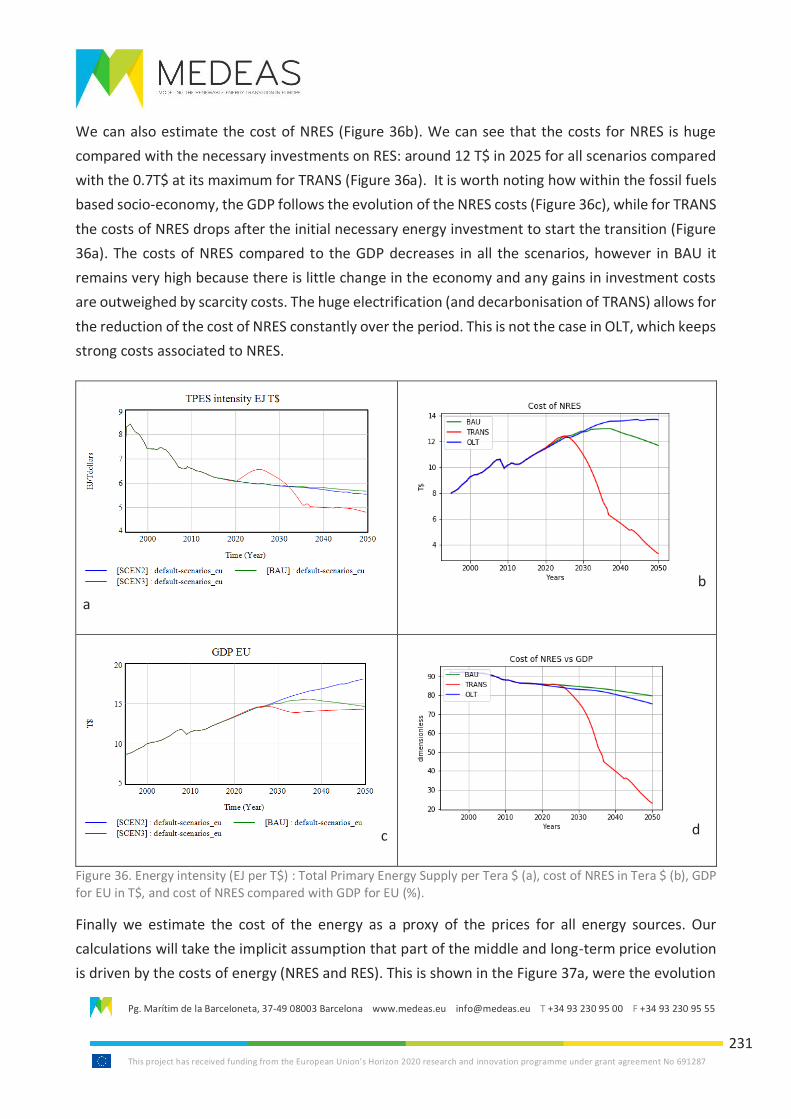
Pg. Marítim de la Barceloneta, 37-49 08003 Barcelona www.medeas.eu [email protected] T +34 93 230 95 00 F +34 93 230 95 55
This project has received funding from the European Union’s Horizon 2020 research and innovation programme under grant agreement No 691287
231
We can also estimate the cost of NRES (Figure 36b). We can see that the costs for NRES is huge
compared with the necessary investments on RES: around 12 T$ in 2025 for all scenarios compared
with the 0.7T$ at its maximum for TRANS (Figure 36a). It is worth noting how within the fossil fuels
based socio-economy, the GDP follows the evolution of the NRES costs (Figure 36c), while for TRANS
the costs of NRES drops after the initial necessary energy investment to start the transition (Figure
36a). The costs of NRES compared to the GDP decreases in all the scenarios, however in BAU it
remains very high because there is little change in the economy and any gains in investment costs
are outweighed by scarcity costs. The huge electrification (and decarbonisation of TRANS) allows for
the reduction of the cost of NRES constantly over the period. This is not the case in OLT, which keeps
strong costs associated to NRES.
a
b
c d
Figure 36. Energy intensity (EJ per T$) : Total Primary Energy Supply per Tera $ (a), cost of NRES in Tera $ (b), GDP for EU in T$, and cost of NRES compared with GDP for EU (%).
Finally we estimate the cost of the energy as a proxy of the prices for all energy sources. Our
calculations will take the implicit assumption that part of the middle and long-term price evolution
is driven by the costs of energy (NRES and RES). This is shown in the Figure 37a, were the evolution
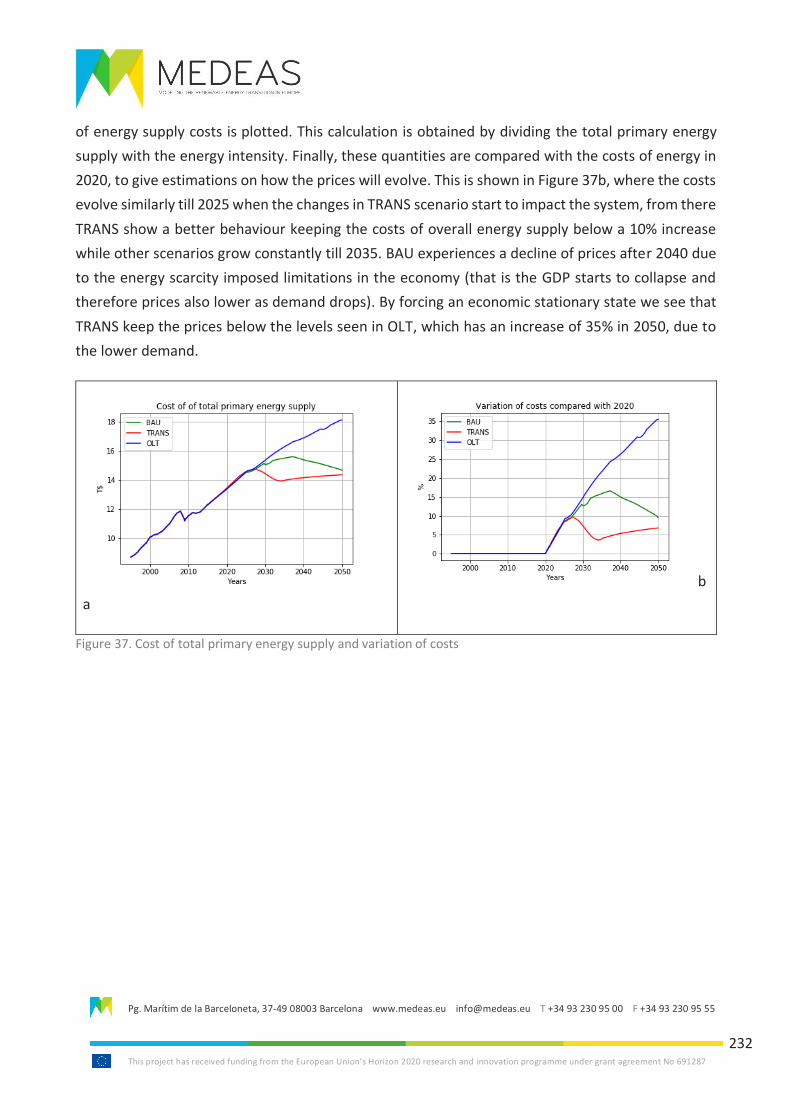
Pg. Marítim de la Barceloneta, 37-49 08003 Barcelona www.medeas.eu [email protected] T +34 93 230 95 00 F +34 93 230 95 55
This project has received funding from the European Union’s Horizon 2020 research and innovation programme under grant agreement No 691287
232
of energy supply costs is plotted. This calculation is obtained by dividing the total primary energy
supply with the energy intensity. Finally, these quantities are compared with the costs of energy in
2020, to give estimations on how the prices will evolve. This is shown in Figure 37b, where the costs
evolve similarly till 2025 when the changes in TRANS scenario start to impact the system, from there
TRANS show a better behaviour keeping the costs of overall energy supply below a 10% increase
while other scenarios grow constantly till 2035. BAU experiences a decline of prices after 2040 due
to the energy scarcity imposed limitations in the economy (that is the GDP starts to collapse and
therefore prices also lower as demand drops). By forcing an economic stationary state we see that
TRANS keep the prices below the levels seen in OLT, which has an increase of 35% in 2050, due to
the lower demand.
a
b
Figure 37. Cost of total primary energy supply and variation of costs
Pg. Marítim de la Barceloneta, 37-49 08003 Barcelona www.medeas.eu [email protected] T +34 93 230 95 00 F +34 93 230 95 55
This project has received funding from the European Union’s Horizon 2020 research and innovation programme under grant agreement No 691287
233
6.4. Discussion and conclusions
Prices are a key aspect in assessing how the renewable transition should be implemented in the
coming years. Experiences form EU countries such as Germany, which has used the price of the
electricity in a liberalized market (FIT) to enhance the RES penetration in the energy mix offer a
useful case study that allow the exploration of the main issues and problems for the RES massive
implementation in order to achieve a high decarbonized energy sector.
However, regardless of the current experiences and policy and political efforts to reduce the GHG
emissions in a highly fossil fuel based energy sector, the current trends associated with RES
deployment are insufficient. The reasons for such underdevelopment of RES in the EU are diverse,
but could be summarized in two main aspects: economic and technical. These aspects in our present
analysis are highly intertwined. Currently economic growth needs a growing supply of energy and
materials, which for instance in the energy supply are linked to the technical advancements in
efficiency and reducing costs. So this makes the analysis, planning, and policy design more difficult.
The role of the RES fixed costs is a major issue in dealing with a high penetration of RES deployment
in the energy mix. The high fixed cost has two main impacts. Firstly depending on the exact time of
deployment (and therefore relative technology costs as RES technology is likely to become cheaper
with time) and lifetime of the RES power stations, the requirement for, and level of, subsidies or
other support for RES deployment will change. This usually is addressed through the evaluation of
LCOE. Secondly, the intermittency of RES imposes a requirement for mechanisms to assure
electricity supply when RES output is low. Such mechanisms can be: CRE, fossil fuel based or/and
storage. If it is aimed at decarbonizing the energy sector then fossil fuel power plants need to be
phased out, which shifts this investments to the (currently) more costly storage technologies
increasing the total amount of investments.
We have simulated RES and non-RES energy sector investment costs with different shares of RES in
the electricity mix. Such analysis will help to evaluate LCOE and additional investments in grid and
storage technologies necessary.
The simulations shown here introduce a new scenario in MEDEAS to produce a 100% RES economy
in 2050 within a framework of a stationary (not growing) economy. The results show that this is
technically feasible, in the sense that the implementation rates and the strategies suggested,
although ambitious, are feasible following the more optimistic parameters in the literature (see
appendix). We also analyse the investment needed for such a transition. At World level the
investment must grow to achieve a maximum before 2040 to around 3.6 T$/year, which means 5.3
Pg. Marítim de la Barceloneta, 37-49 08003 Barcelona www.medeas.eu [email protected] T +34 93 230 95 00 F +34 93 230 95 55
This project has received funding from the European Union’s Horizon 2020 research and innovation programme under grant agreement No 691287
234
% of the global GDP (from the model output) for this period (in a non-expanding economy). For the
EU case the maximum investment needed is 0.7T$/year, which is roughly 5% of the EU GDP (model
projected) for this year in TRANS scenario. If these full costs were passed on through energy prices,
then energy prices would need to increase in 2030 by 5% in TRANS, 16 % in BAU and 25% in OLT. In
this report we have estimated the variability of the price driven from the energy costs, however
price can be regulated in medium term by taxes or other measures.
All the calculations and results show that to achieve a complete decarbonisation of the economy by
2050 a huge effort must be undertaken (scenario TRANS). However, the cost of not making this
investment is much higher (representing a more than 15% reduction in GDPpc as seen in Figure 37a).
All in all, the TRANS scenario proposes ambitious rates of RES implementation but is technically
feasible if major pushes from the political arena and political will are there.
Pg. Marítim de la Barceloneta, 37-49 08003 Barcelona www.medeas.eu [email protected] T +34 93 230 95 00 F +34 93 230 95 55
This project has received funding from the European Union’s Horizon 2020 research and innovation programme under grant agreement No 691287
235
6.5. References
MEDEAS Deliverable D4.1, available at: https://medeas.eu/deliverables
MEDEAS Deliverable D6.1, available at: https://medeas.eu/deliverables
MEDEAS Deliverable D6.2, available at: https://medeas.eu/deliverables
Dillig, M., Jung, M. and Karl, J., 2016. The impact of renewables on electricity prices in Germany—
an estimation based on historic spot prices in the years 2011–2013. Renewable and Sustainable
Energy Reviews. 57: 7–15.
Dubois, U. and H. Meier, 2016. Energy affordability and energy inequality in Europe: Implications for
policymaking. Energy Research & Social Science. 18 : 21-35.
European Commission Report, 2019. Energy prices and costs in Europe.
https://ec.europa.eu/energy/en/data-analysis/energy-prices-and-costs
European Commission Report, 2016. Commission Staff Working Document Impact Assessment.
Rules for the internal market in electricity. 30.11.2016 SWD (2016) 410 final. PART 1/5 and 2/5 (Main
text).
Felder, F., 2011. Examining Electricity Price Suppression due to Renewable Resources and other Grid
Investments. Electricity Journal. 24 (4): 34-46.
IRENA, 2019. Renewable Power Generation Costs in 2018. International Renewable Energy Agency,
Abu Dhabi.
IRENA, 2018. Renewable Power Generation Costs in 2017. International Renewable Energy Agency,
Abu Dhabi.
IRENA, 2016. Data and statistics of capacity and generation. http://resourceirena. irena.org
García-Olivares, A., 2015. Substitutability of Electricity and Renewable Materials for Fossil Fuels in a
Post-Carbon Economy. Energies. 8: 13308-13343.
García-Olivares, A., J. Solé, O. Osychenko, 2018. Transportation in a 100% renewable energy system,
Energy Conversion and Management. 158: 266-285.
Pg. Marítim de la Barceloneta, 37-49 08003 Barcelona www.medeas.eu [email protected] T +34 93 230 95 00 F +34 93 230 95 55
This project has received funding from the European Union’s Horizon 2020 research and innovation programme under grant agreement No 691287
236
Genoese, F., Drabik, E., Egenhofer, C., April 2016. The EU power sector needs long-term price signals.
CEPS special report No. 135. https://papers.ssrn.com/sol3/papers.cfm?abstract_id=2782355
He, W., Zhang C., Hao, R., January 2015. Analysis of Electricity Price Policy and Economic Growth.
Journal of Scientific & Industrial Research. 74: 11-18.
Joas, F., Pahle, M., Flachsland, C., Joas, A., 2016. Which goals are driving the Energiewende? Making
sense of the German Energy Transformation. Energy Policy. 95: 42–51.
Joskow, P. L., 2010. Comparing the costs of intermittent and dispatchable electricity generating
technologies. American Economic Review. 101 (3):238–241.
Kreuz, S. & Müsgens, F., 2017. The German Energiewende and its roll-out of renewable energies: An
economic perspective. Frontiers in Energy. 11: 126-134.
Kost, C., Mayer, J. N., Thomsen, J., Hartmann, N., Senkpiel, C., Philipps, S., Nold, S., Lude, S., Saad,
N., Schlegl, T., November 2013. Levelized cost of electricity renewable energy technologies.
Fraunhofer Konzeptpapier. Fraunhofer Institute for Solar Energy Systems (ISE), Freiburg.
https://www.ise.fraunhofer.de/content/dam/ise/en/documents/publications/studies/Fraunhofer-
ISE_LCOE_Renewable_Energy_technologies.pdf
Renewable Energy Sources Act (Renewable Energy Sources Act—RES Act 2014). German Ministry
for Economic Affairs and Energy. http://www.bmwi.de/English/Redaktion/Pdf/renewable-energy-
sources-act-eeg-2014
Riahi, K., Van Vuuren, D.P., Kriegler, E., Edmonds, J., O ’neill, B.C., Fujimori, S., Bauer, N., Calvin, K.,
Dellink, R., Fricko, O., Lutz, W., Popp, A., Cuaresma, J.C., Kc, S., Leimbach, M., Jiang, L., Kram, T., Rao,
S., Emmerling, J., Ebi, K., Hasegawa, T., Havlik, P., Humpenöder, F., Aleluia, L., Silva, D., Smith, S.,
Stehfest, E., Bosetti, V., Eom, J., Gernaat, D., Masui, T., Rogelj, J., Strefler, J., Drouet, L., Krey, V.,
Luderer, G., Harmsen, M., Takahashi, K., Baumstark, L., Doelman, J.C., Kainuma, M., Klimont, Z.,
Marangoni, G., Lotze-Campen, H., Obersteiner, M., Tabeau, A., Tavoni, M., 2017. The Shared
Socioeconomic Pathways and their energy, land use, and greenhouse gas emissions implications: An
overview. Global Environmental Change. 42: 153–168.
Solomon, A.A., D. Bogdanov, C. Breyer, 2019. Curtailment-storage-penetration nexus in the energy
transition. Applied Energy. 235: 1351-1368.

Pg. Marítim de la Barceloneta, 37-49 08003 Barcelona www.medeas.eu [email protected] T +34 93 230 95 00 F +34 93 230 95 55
This project has received funding from the European Union’s Horizon 2020 research and innovation programme under grant agreement No 691287
237
Zipp, A., 2017. The marketability of variable renewable energy in liberalized electricity markets – An
empirical analysis. Renewable Energy. 113: 1111-1121.
Pg. Marítim de la Barceloneta, 37-49 08003 Barcelona www.medeas.eu [email protected] T +34 93 230 95 00 F +34 93 230 95 55
This project has received funding from the European Union’s Horizon 2020 research and innovation programme under grant agreement No 691287
238
7. Energy Poverty effects of RES transition
List of abbreviations and acronyms
ECO UK Energy Company Obligation
EEG German Renewable Energy Sources Act (Erneuerbare Energien Gesetz)
EEPI European Energy Poverty Index
ETEPI European Transport Energy Poverty sub-index
EurEESC European Economic and Social Committee
EU-SILC EU Statistics on Income and Living Conditions
FiTs Feed-in tariffs
GDP Gross Domestic Product
HILDA Household, Income and Labour Dynamics in Australia survey
LCOE Levelised Cost of Electricity
MWh Megawatt/hour
NEK Bulgarian Electricity Company
PPS Power Purchasing Units
PV Photovoltaics
RES Renewable Energy Sources
Pg. Marítim de la Barceloneta, 37-49 08003 Barcelona www.medeas.eu [email protected] T +34 93 230 95 00 F +34 93 230 95 55
This project has received funding from the European Union’s Horizon 2020 research and innovation programme under grant agreement No 691287
239
7.1. Introduction
Consumer electricity prices have been increasing at a larger rate than inflation in the EU since the
mid-1990s (Bouzarovski et al. 2017, p.76). When prices are expressed in Purchasing Power Units
(PPS), high electricity prices in the period 2007-2013 were especially found in countries of Eastern
and Southern Europe (especially Poland, Bulgaria, Lithuania, Romania, Croatia, Spain, Italy,
Portugal), mostly coinciding with above-average poverty rates between 2007 and 2013 (Bouzarovski
et al. 2017, p.77). Nonetheless, in this period European natural gas prices rose faster (avg. 20%) than
electricity prices (12%) (Bouzarovski et al. 2017).
An argument often employed by climate change deniers and fossil fuel companies is that RES
expansion leads to an increase in household energy prices - that RES expansion is responsible for
parts of this price increase. In 2009 e.g. the Koch brothers’ Americans for Prosperity group and the
Institute for Energy Research (funding includes ExxonMobil and Koch brothers - the institute argues
that climate science is unsettled) paid for three heavily flawed studies arguing that the effects of a
RES expansion on the Spanish, German and Danish household energy price were negative (price
increase) and that the expansion of RES led to a job decrease (Buchmann, forthcoming)
Energy poverty and the effects of a renewable energy expansion on vulnerable, poorer segments of
the European population are not modelled by the current MEDEAS models. Figure 32 in this
deliverable shows GDP per capita effects and total final energy consumption for the three scenarios
BaU, OLT and TRANS. Since GDP per capita or most data point derived by averages is however
inadequate for a phenomenon that only affects the poorest, in this chapter, we will detail existing
studies of electricity price increases due to renewable energy expansion as well as provide a state
of the art literature review of energy poverty in the European Union. We point to the fact that
energy poverty is strongly regional in Europe – it is prevalent especially in Southern and Eastern
Europe. Housing stock, especially its inability to stay cool in the hotter expected summers or staying
warm in winter, are a key factor in energy poverty in these areas. Ownership of housing (whether it
is a rented accommodation or owned) also plays an important role here. These questions of
ownership also resurface in a discussion on effects of largescale renewable energy expansion and
community energy participation through i.a. rooftop solar.
Pg. Marítim de la Barceloneta, 37-49 08003 Barcelona www.medeas.eu [email protected] T +34 93 230 95 00 F +34 93 230 95 55
This project has received funding from the European Union’s Horizon 2020 research and innovation programme under grant agreement No 691287
240
7.2. Electricity price effects of RES expansion
It has even also in genuine research been theorised that renewable energy could contribute to
consumer energy price increases due to their capital costs being often financed through subsidies,
which then is being retrieved through levies or taxes (Moreno, López, García-Álvarez, 2012). Of
course fossil fuel energy also receives high subsidies (Coady, Paddy, Sears et al., 2017). The costs of
solar panels itself and wind turbines has dramatically crashed due to Chinese governmental
subsidies and price-dumping for their technologies. This has had both the effects of making RES
cheaper than previously to install and of crashing the European RES company sector. Grid defection
through solar panels may lead to higher prices for the other consumers without solar panels (as grid
costs will be distributed to a smaller number of consumers) (Kantamneni, Winkler, Gauchia et al.,
2016). Cai, Adlakha, Low et al. (2013) show this to be the case with the example of California. They
furthermore theorise that the resulting higher electricity prices make the installation of PV roof
panels even more attractive for customers wealthy enough to own a house and to afford this. This
was also confirmed by Techert, Niehues, Bardt et al. (2012) for Germany: 20% of all rooftop PV
belonged to the 10% wealthiest households, who hence also profit from the EEG. At the same time,
in 2011, the EEG-surcharge accounted for 1% of household income in the lowest income decile,
while it accounted for only 0.17% of household income in the highest decile (Techert et al., 2012, p.
510).
Generally, power sources incur costs at three levels: namely the cost of the generation facility
(capital costs for land, equipment, construction, ongoing operating and maintenance), cost of
connection to the grid and distribution of the energy (capital and operating costs), and cost of
infrastructure maintaining grid stability and reliability. The cost of electricity/MWh increases with
higher intermittent electricity due to costs associated with re-balancing (Stram, 2016, p. 731). While
the costs of PV and onshore wind have declined, offshore wind energy e.g. still requires very large
upfront expenditures. Additionally, the intermittent and regional nature of RES necessitates large-
scale infrastructure in the form of transmission cables and storage. These are costly (see Chapter 4
“Cross-border electricity infrastructure finance”).
Moreno, López, García-Álvarez (2012) in their analysis find a small household electricity price
increase from RES: variable RE generation led to a 0.018% household price increase for 1% increase
in renewable energy production (Moreno, López, García-Álvarez, 2012, p. 312). They do not
however use LCOE (levelised cost of electricity). Trujillo-Baute, del Río, and Mir-Artigues (2018)
assessed both industrial and household electricity price developments due to RES increase in 22 of
28 EU member states (not part of their study: Bulgaria, Cyprus, Ireland, Latvia, Malta and Slovakia)
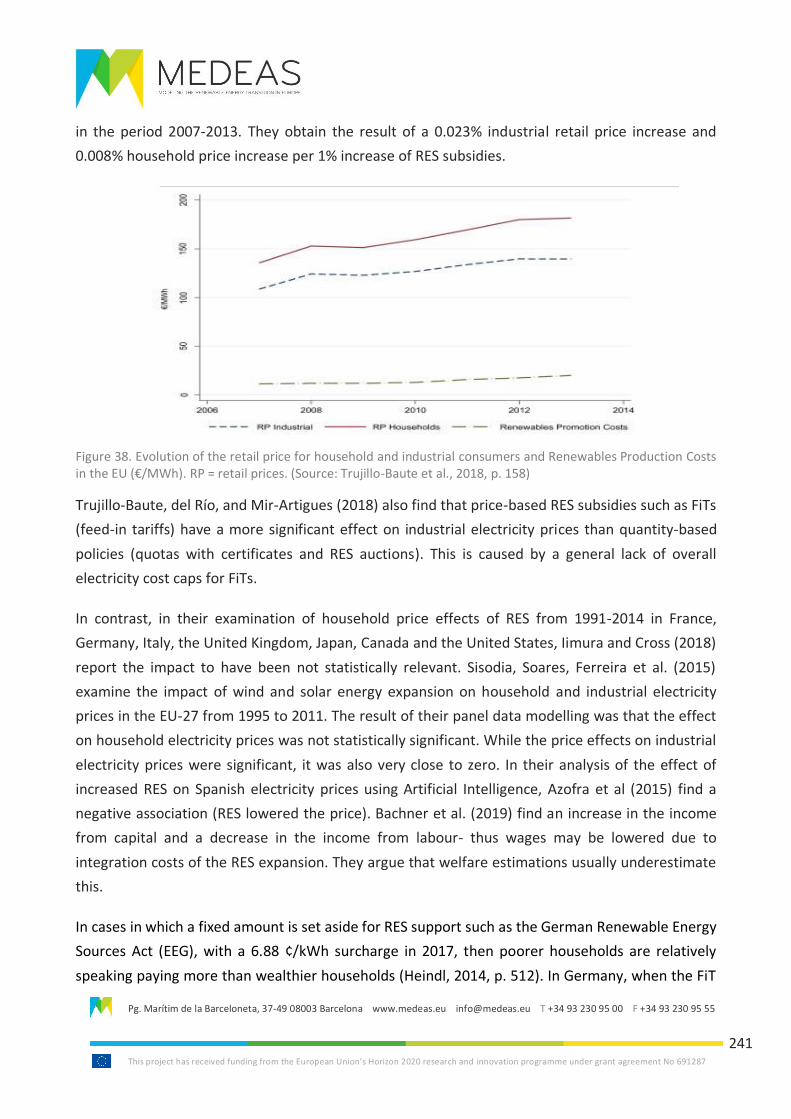
Pg. Marítim de la Barceloneta, 37-49 08003 Barcelona www.medeas.eu [email protected] T +34 93 230 95 00 F +34 93 230 95 55
This project has received funding from the European Union’s Horizon 2020 research and innovation programme under grant agreement No 691287
241
in the period 2007-2013. They obtain the result of a 0.023% industrial retail price increase and
0.008% household price increase per 1% increase of RES subsidies.
Figure 38. Evolution of the retail price for household and industrial consumers and Renewables Production Costs in the EU (€/MWh). RP = retail prices. (Source: Trujillo-Baute et al., 2018, p. 158)
Trujillo-Baute, del Río, and Mir-Artigues (2018) also find that price-based RES subsidies such as FiTs
(feed-in tariffs) have a more significant effect on industrial electricity prices than quantity-based
policies (quotas with certificates and RES auctions). This is caused by a general lack of overall
electricity cost caps for FiTs.
In contrast, in their examination of household price effects of RES from 1991-2014 in France,
Germany, Italy, the United Kingdom, Japan, Canada and the United States, Iimura and Cross (2018)
report the impact to have been not statistically relevant. Sisodia, Soares, Ferreira et al. (2015)
examine the impact of wind and solar energy expansion on household and industrial electricity
prices in the EU-27 from 1995 to 2011. The result of their panel data modelling was that the effect
on household electricity prices was not statistically significant. While the price effects on industrial
electricity prices were significant, it was also very close to zero. In their analysis of the effect of
increased RES on Spanish electricity prices using Artificial Intelligence, Azofra et al (2015) find a
negative association (RES lowered the price). Bachner et al. (2019) find an increase in the income
from capital and a decrease in the income from labour- thus wages may be lowered due to
integration costs of the RES expansion. They argue that welfare estimations usually underestimate
this.
In cases in which a fixed amount is set aside for RES support such as the German Renewable Energy
Sources Act (EEG), with a 6.88 ¢/kWh surcharge in 2017, then poorer households are relatively
speaking paying more than wealthier households (Heindl, 2014, p. 512). In Germany, when the FiT
Pg. Marítim de la Barceloneta, 37-49 08003 Barcelona www.medeas.eu [email protected] T +34 93 230 95 00 F +34 93 230 95 55
This project has received funding from the European Union’s Horizon 2020 research and innovation programme under grant agreement No 691287
242
remuneration exceeds wholesale prices, electricity consumers have to pay for the difference in
every kWh of electricity they purchase (Neuhoff et al., 2013, p. 41). This aforementioned surcharge
has caused household energy prices to increase (in real terms) by 12% from 2008 to 2013 (Neuhoff,
Bach, Diekmann et al., 2013, p. 43). Neuhoff, Bach, Diekmann et al. (2013) spell out the dilemma
thus: “Expenditures for electricity increase with rising net incomes, but to a disproportionately
lesser degree. Accordingly, electricity’s share of total consumer spending drops significantly with
rising income” (p. 47). Electricity is additionally a good that cannot easily be substituted and that is
relatively essential both for welfare and to participate in society. Poorer households thus cannot
compensate electricity price increases by reducing their electricity consumption significantly. This
situation is exacerbated by the fact that poorer people’s homes are worst insulated and hugely
energy inefficient. In this manner, Neuhoff, Bach, Diekmann et al. (2013) consider “EEG, electricity
tax emissions trading, support for cogeneration” as “regressive” (p. 47. see also Techert et al., 2012;
p. 510). Under the EEG, exemptions were made for energy-heavy industries to guarantee them
energy affordability, which meant that individual consumers and SMEs have to bear their share of
the cost. (Heindl et al. 2014, p.508). Energy-intensive industries contribute to 18% of energy
consumption in Germany, yet pay only 0.3% of the EEG RES surcharge.28
Neuhoff et al. (2013) present three possibilities that could help address “the potential hardship for
low-income households in a more targeted manner” (p. 49):
1. Adjusting social transfers : To cover increased electricity prices and an increase in the EEG
surcharge, 154 million € per year would be needed to be spent by the German government
in social transfer payments (p. 51).
2. Introducing a basic tax-free allowance for electricity :The authors suggest an allowance of
500 or 1000 kWh/year per household taxed at 0.1 ct/kWh, before the current tax rate of
2.05 ct/ kWh sets in, which would keep up the incentive of using less energy. “the basic tax-
free allowance includes a larger proportion of the electricity consumption of low-income
households than of high-income ones” (p. 51).This allowance would lead to a 792 million €
loss of tax money, of which 20% would benefit the lowest income quintile.
3. Supporting households in using electricity efficiently:The German government runs various
programmes in order to improve user behaviour in terms of energy consumption as well as
28 https://www.photovoltaik.org/wissen/eeg-umlage-ausnahmen-fuer-energieintensive-betriebe
Pg. Marítim de la Barceloneta, 37-49 08003 Barcelona www.medeas.eu [email protected] T +34 93 230 95 00 F +34 93 230 95 55
This project has received funding from the European Union’s Horizon 2020 research and innovation programme under grant agreement No 691287
243
replacing old appliances with high energy consumption with newer, more efficient ones
(p.52).
Overall, spending on energy has been rather low in Germany. While the German Federal Statistical
Office unfortunately combines the categories “rent/mortgage, car fuel and energy”, Neuhoff et al.
(2013) calculate disaggregated figures for 2011: the average German household spending on
electricity was 2.34% and on gas and other fuels 2.41% of the total household income, while the
average German spent 3.45% of their income on fuels and lubricants in transportation. This adds up
to 8.30% of household income (Neuhoff et al., 2013; p. 43). In 2012, the bottom 30% earners spent
about 11% of their income on energy, while the top 70% only spent about 6% on average. From
1998 to 2012, that number rose 2.3% for top 70% income earners, but about 4.4% for the bottom
30% (Heindl 2014, p. 512). Fuel poverty groups often advocate recovering the costs through
progressive taxation (Frerk and MacLean 2017, p.6). Many countries accept the ability-to-pay
principle for taxation, taxing the high-income earners more than people with a low income,
contributing more to the financing of public goods and services; this is not given in the case of the
EEG-surcharge [or any other levies on energy bills] (Heindl 2014).
Pg. Marítim de la Barceloneta, 37-49 08003 Barcelona www.medeas.eu [email protected] T +34 93 230 95 00 F +34 93 230 95 55
This project has received funding from the European Union’s Horizon 2020 research and innovation programme under grant agreement No 691287
244
7.3. Defining and measuring energy poverty
As we have seen, increased energy prices can jeopardise the access to energy for some social groups.
The current modus operandi consists too often of passing the costs for the integration of renewable
energy sources on to domestic consumers (while at the same time heavily subsidising fossil fuels)
and thus pushing up energy prices.
A variety of names is used to refer to the phenomenon best known as energy poverty, including fuel
poverty, energy precariousness and domestic energy deprivation. While Li et al. (2013) make a clear
distinction between energy poverty-which they deem to be the lack of access to modern energy
services, mainly in developing countries- and fuel poverty- which is described as the “inability to
afford adequate warmth in the home” (p. 477), as seen in developed countries- we will follow the
lead of one of the expert researchers in the field, Stefan Bouzarovski, and use the term energy
poverty synonymously in this report as it captures the widest scope of the matter, capturing not
only the lack of adequate warmth in homes, but including cooling as well as other ‘energy services’.
The range of definitions for energy poverty is wide, although all of them include the aspect of an
insufficient level of energy consumption to “meet certain basic needs” (Gonzalez-Eguino et al. 2015,
p. 379). Bouzarovski defines energy poverty as “[t]he inability of a household to access socially and
materially necessitated levels of energy services in the home” (Bouzarovski 2014, p. 277). These
‘needs’ or ‘energy services’ most often mainly encompass heating and cooling of a home, but can
also refer to lighting, hot water, or operating electric appliances of any kind and sometimes even go
as far as to extend these terms to a household’s need for petrol or alternative means of
transportation.
Although income-poor households are more susceptible to energy poverty compared to households
with more disposable income it is important to note that not all income-poor households will
automatically be fuel poor, as other factors (mainly house insulation and energy prices) weigh into
energy poverty (e.g. Bouzarovski et al. 2014, Thomson and Bouzarovski 2018) and the social
concepts of poverty, deprivation, and energy poverty need to be clearly distinguished. There is
nonetheless still a strong cultural factor in this – as what is seen as acceptable for indoor
temperature e.g. is very culturally specific and even in the same country has strongly changed in the
last few decades.
Although “the European Economic and Social Committee (EESC) proposed the adoption of an EU-
wide definition of energy poverty and the harmonization of existing statistics in order to rigorously
assess ‘the energy poverty situation in Europe’”(Bouzarovski 2014, p. 279), there is no official
Pg. Marítim de la Barceloneta, 37-49 08003 Barcelona www.medeas.eu [email protected] T +34 93 230 95 00 F +34 93 230 95 55
This project has received funding from the European Union’s Horizon 2020 research and innovation programme under grant agreement No 691287
245
common European definition of energy poverty as of yet. Even though the EU does not currently
endorse a European definition of energy poverty, different bodies like the EESC, the European
Parliament and the EU Committee of the Regions have been calling for a common general definition
of energy poverty/ fuel poverty since 2008, as this definition has the potential to bring about
“increased political recognition [of the issue], policy synergies and policy transfer” (Thomson et al.
2016, p. 24-26) and it could help avoiding misunderstandings.
Energy poverty has been recognized as a problem by the EU for the first time in March 2011, in the
Gas and Electricity Directives 2009/73/EC and 2009/72/EC (Hiteva 2013, p. 487). On a member state
basis, while the number of countries recognizing energy poverty related issues is on the rise, only
five EU member states have adopted official definitions of the phenomenon so far: France, Cyprus,
the UK (separate definitions for England and Wales, Northern Ireland & Scotland), Ireland and more
recently Slovakia. The definitions are listed in Table 18.
Table 18. Official EU member definitions of energy poverty (Synthesized and adapted from Thomson and Snell (2016) and Thomson and Bouzarovski (2018)
Country Definition
France
A person is considered fuel poor “if he/she encounters particular difficulties in his/her accommodation in terms of energy supply related to the satisfaction of elementary needs, this being due to the inadequacy of financial resources or housing conditions.”
England
“A household is said to be in fuel poverty if it:
1. has required fuel costs that are above average (national median level)
2. were they to spend that amount, they would be left with a residual income below the official poverty line” (60% median income).
Scotland, Wales and Northern Ireland
“A household is said to be in fuel poverty if it needs to spend more than 10% of its income on fuel to maintain an adequate level of warmth.”
Cyprus
“The situation of customers who may be in a difficult position because of their low income as indicated by their tax statements in conjunction with their professional status, marital status and specific health conditions and therefore, are unable to respond to the costs for the reasonable needs of the supply of electricity, as these costs represent a significant proportion of their disposable income.”
Pg. Marítim de la Barceloneta, 37-49 08003 Barcelona www.medeas.eu [email protected] T +34 93 230 95 00 F +34 93 230 95 55
This project has received funding from the European Union’s Horizon 2020 research and innovation programme under grant agreement No 691287
246
Country Definition
Slovakia
“Energy poverty under the law No. 250/2012 Coll. Of Laws is a status when average monthly expenditures of household on consumption of electricity, gas, heating and hot water production represent a substantial share of average monthly income of the household” (Strakova 2014, p. 3).
Ireland “...a household that spends more than 10% of their income on energy is considered to be in energy poverty”.
The three causal key factors associated with energy poverty are low household income, high energy
prices and a poor energy efficiency of one’s home. Connections between the transition to renewable
energy and each one of these factors can be drawn. These factors can be directly and indirectly
measured through various variables, which have been combined into different indices attempting
to quantify energy poverty employing a multi-dimensional approach.
The availability of raw data is limited and most published studies rely on a handful of data sources:
Panel data for different variables relating to the quantification on energy poverty have been
compiled by Eurostat yearly since 2003 for all EU countries (except Croatia, of course) in the EU
Statistics on Income and Living Conditions (EU-SILC) dataset, which is freely available to access and
download from the Eurostat online database. An overview of major relevant variables provided by
the EU-SILC dataset is given in Table 19. Eurostat also provide extensive datasets on renewable and
fossil energy carriers and their employment in EU member countries, as statistics on energy prices
and other variables related to the sector. The recently created Energy Poverty Observatory (part of
a H2020 project led by the University of Manchester) processes some subsets of these data to
deliver selected indicators as well as chosen variables that are connected to energy poverty. Data
on the energy efficiency of dwellings is provided by the EU Building Stock Observatory. Another data
source available are the household budget surveys of individual EU member countries, available
through Eurostat.
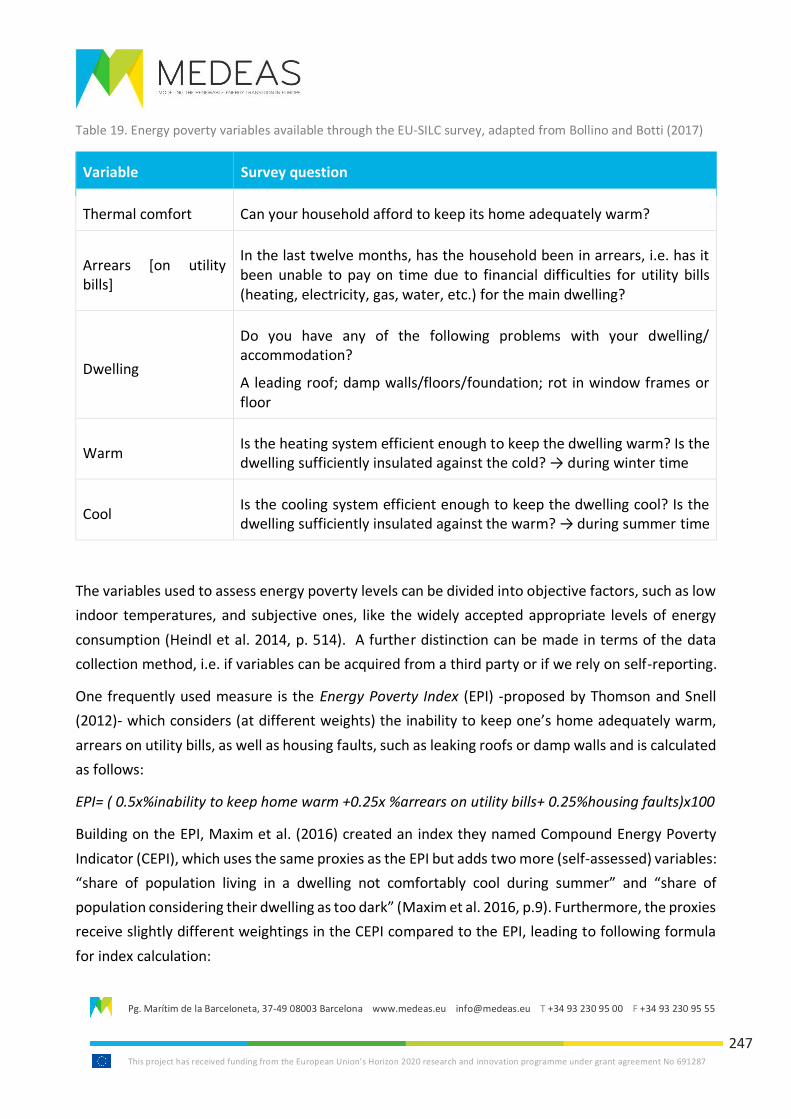
Pg. Marítim de la Barceloneta, 37-49 08003 Barcelona www.medeas.eu [email protected] T +34 93 230 95 00 F +34 93 230 95 55
This project has received funding from the European Union’s Horizon 2020 research and innovation programme under grant agreement No 691287
247
Table 19. Energy poverty variables available through the EU-SILC survey, adapted from Bollino and Botti (2017)
Variable Survey question
Thermal comfort Can your household afford to keep its home adequately warm?
Arrears [on utility bills]
In the last twelve months, has the household been in arrears, i.e. has it been unable to pay on time due to financial difficulties for utility bills (heating, electricity, gas, water, etc.) for the main dwelling?
Dwelling
Do you have any of the following problems with your dwelling/ accommodation?
A leading roof; damp walls/floors/foundation; rot in window frames or floor
Warm Is the heating system efficient enough to keep the dwelling warm? Is the dwelling sufficiently insulated against the cold? → during winter time
Cool Is the cooling system efficient enough to keep the dwelling cool? Is the dwelling sufficiently insulated against the warm? → during summer time
The variables used to assess energy poverty levels can be divided into objective factors, such as low
indoor temperatures, and subjective ones, like the widely accepted appropriate levels of energy
consumption (Heindl et al. 2014, p. 514). A further distinction can be made in terms of the data
collection method, i.e. if variables can be acquired from a third party or if we rely on self-reporting.
One frequently used measure is the Energy Poverty Index (EPI) -proposed by Thomson and Snell
(2012)- which considers (at different weights) the inability to keep one’s home adequately warm,
arrears on utility bills, as well as housing faults, such as leaking roofs or damp walls and is calculated
as follows:
EPI= ( 0.5x%inability to keep home warm +0.25x %arrears on utility bills+ 0.25%housing faults)x100
Building on the EPI, Maxim et al. (2016) created an index they named Compound Energy Poverty
Indicator (CEPI), which uses the same proxies as the EPI but adds two more (self-assessed) variables:
“share of population living in a dwelling not comfortably cool during summer” and “share of
population considering their dwelling as too dark” (Maxim et al. 2016, p.9). Furthermore, the proxies
receive slightly different weightings in the CEPI compared to the EPI, leading to following formula
for index calculation:
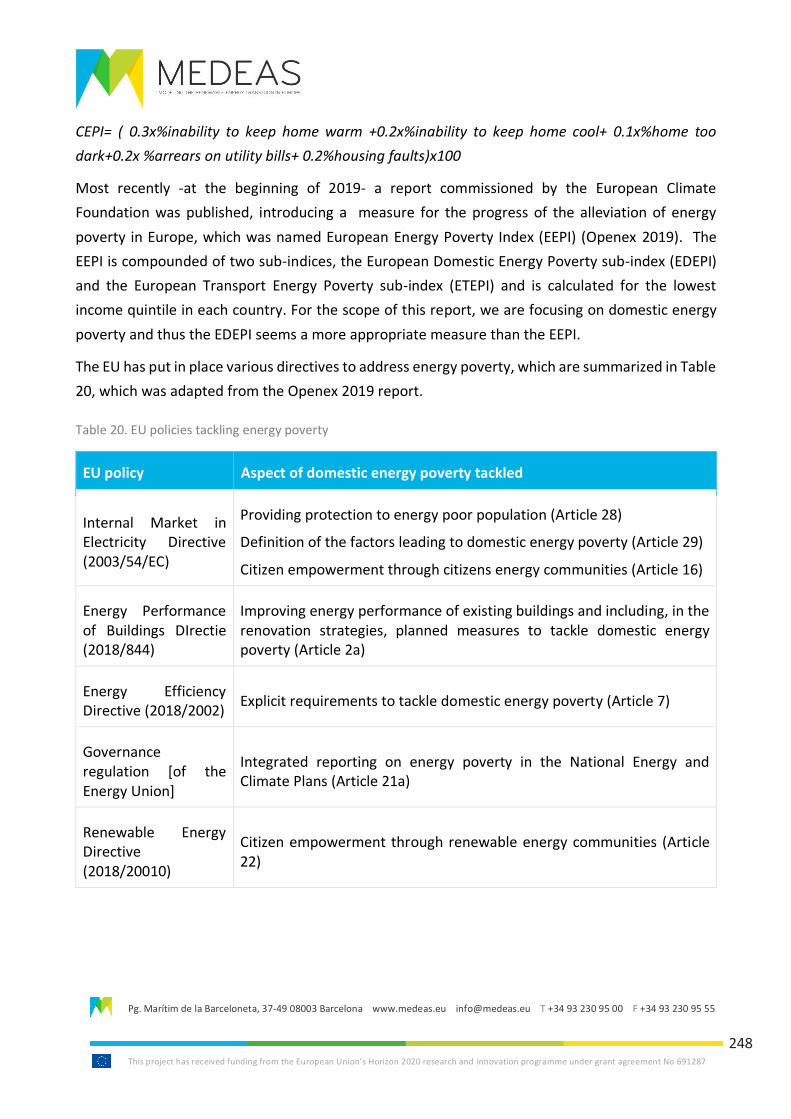
Pg. Marítim de la Barceloneta, 37-49 08003 Barcelona www.medeas.eu [email protected] T +34 93 230 95 00 F +34 93 230 95 55
This project has received funding from the European Union’s Horizon 2020 research and innovation programme under grant agreement No 691287
248
CEPI= ( 0.3x%inability to keep home warm +0.2x%inability to keep home cool+ 0.1x%home too
dark+0.2x %arrears on utility bills+ 0.2%housing faults)x100
Most recently -at the beginning of 2019- a report commissioned by the European Climate
Foundation was published, introducing a measure for the progress of the alleviation of energy
poverty in Europe, which was named European Energy Poverty Index (EEPI) (Openex 2019). The
EEPI is compounded of two sub-indices, the European Domestic Energy Poverty sub-index (EDEPI)
and the European Transport Energy Poverty sub-index (ETEPI) and is calculated for the lowest
income quintile in each country. For the scope of this report, we are focusing on domestic energy
poverty and thus the EDEPI seems a more appropriate measure than the EEPI.
The EU has put in place various directives to address energy poverty, which are summarized in Table
20, which was adapted from the Openex 2019 report.
Table 20. EU policies tackling energy poverty
EU policy Aspect of domestic energy poverty tackled
Internal Market in Electricity Directive (2003/54/EC)
Providing protection to energy poor population (Article 28)
Definition of the factors leading to domestic energy poverty (Article 29)
Citizen empowerment through citizens energy communities (Article 16)
Energy Performance of Buildings DIrectie (2018/844)
Improving energy performance of existing buildings and including, in the renovation strategies, planned measures to tackle domestic energy poverty (Article 2a)
Energy Efficiency Directive (2018/2002)
Explicit requirements to tackle domestic energy poverty (Article 7)
Governance regulation [of the Energy Union]
Integrated reporting on energy poverty in the National Energy and Climate Plans (Article 21a)
Renewable Energy Directive (2018/20010)
Citizen empowerment through renewable energy communities (Article 22)
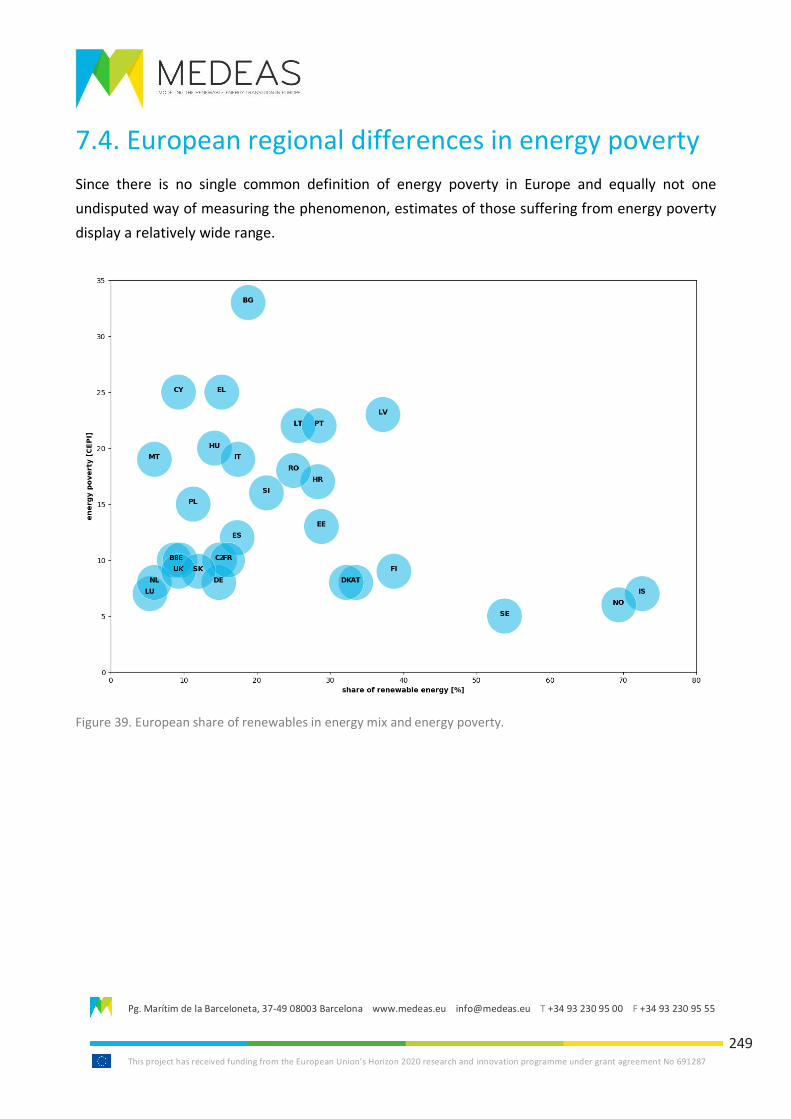
Pg. Marítim de la Barceloneta, 37-49 08003 Barcelona www.medeas.eu [email protected] T +34 93 230 95 00 F +34 93 230 95 55
This project has received funding from the European Union’s Horizon 2020 research and innovation programme under grant agreement No 691287
249
7.4. European regional differences in energy poverty
Since there is no single common definition of energy poverty in Europe and equally not one
undisputed way of measuring the phenomenon, estimates of those suffering from energy poverty
display a relatively wide range.
Figure 39. European share of renewables in energy mix and energy poverty.
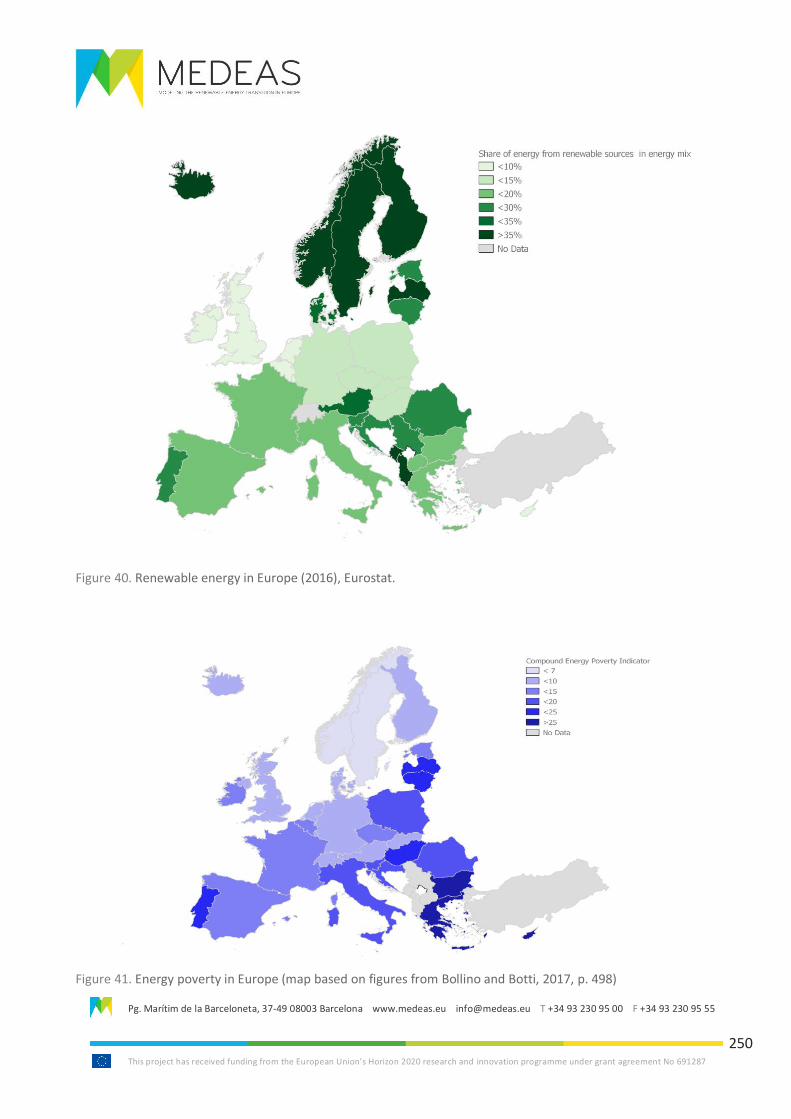
Pg. Marítim de la Barceloneta, 37-49 08003 Barcelona www.medeas.eu [email protected] T +34 93 230 95 00 F +34 93 230 95 55
This project has received funding from the European Union’s Horizon 2020 research and innovation programme under grant agreement No 691287
250
Figure 40. Renewable energy in Europe (2016), Eurostat.
Figure 41. Energy poverty in Europe (map based on figures from Bollino and Botti, 2017, p. 498)
Pg. Marítim de la Barceloneta, 37-49 08003 Barcelona www.medeas.eu [email protected] T +34 93 230 95 00 F +34 93 230 95 55
This project has received funding from the European Union’s Horizon 2020 research and innovation programme under grant agreement No 691287
251
Brunner et al. (2012) estimate that about 100 million people are affected by energy poverty in
Europe, while Thomson and Bouzarovski (2018) give a number of 44 million affected people,
corresponding to 8.7% of households EU-wide. Maxim et al. (2016) emphasise that there is a risk of
underestimating this number, if actual energy expenditure is considered as opposed to the needed
expenditure, as some households might cut back on their energy usage to avoid going into debt.
Although energy poverty is present in all European countries to some extent, there are distinct
patterns of regional prevalence, depending on political, economic and geographic factors. While low
energy poverty can be observed in north-western Europe, high numbers of households experiencing
energy poverty are found in southern Europe as well as in central and eastern European countries,
which is visualised in Figure 41. Even though the UK’s energy poverty level has consistently been
below the EU-average, it was the first country to recognise and officially define the phenomenon.
When examining energy poverty in light of the transition to renewable energy and decarbonisation,
we have to take into account that there is not one energy transition, but different European states
have their own approaches to achieving the integration of more renewable energy technologies and
the reduction of carbon emissions. The main focus in the former socialist countries of Central and
Eastern Europe lays on the liberalisation and privatisation of the energy market (Bouzarovski and
Tirado-Herrero, 2017, p.72).
While most northern and western European countries show CEPIs results below 10, indicating low
energy poverty, this should not mean that the phenomenon can be dismissed in those countries.
Extensive literature from the UK shows that although the country’s energy poverty level is relatively
low compared to other European countries, absolute numbers are significant. A report published in
2017, the UK’s Department of Business, Energy and Industrial Strategy (BEIS) estimated the number
of households in the country affected by fuel poverty to be around 2.55 million.
Austria, with a high amount of 33.5% share of renewable energy (2016, Eurostat) has a rather low
level of energy poverty: According to EU-SILC data from 2011, only 2.6% of people stated their
household could not afford to keep the whole home adequately warm; interestingly, only 43% of
these people were classified as ‘at risk of poverty’ (Energie-Control 2013).
The states of Central and Eastern Europe (CEE) show above-average levels of energy poverty,
resulting from a combination of cold climates, energy-inefficient housing stock, insufficient
infrastructure, income disparities and “systemic issues in the management of energy, social welfare,
and housing operations” (Bouzarovski et al. 2014, p. 283). Some of these factors can be linked to
the transition of these former socialist countries from heavily subsidised and government-owned
energy supply to privatisation and liberalisation of the energy market with most governments
“unable to provide adequate social assistance and energy efficiency investment to protect
Pg. Marítim de la Barceloneta, 37-49 08003 Barcelona www.medeas.eu [email protected] T +34 93 230 95 00 F +34 93 230 95 55
This project has received funding from the European Union’s Horizon 2020 research and innovation programme under grant agreement No 691287
252
vulnerable households from energy price increases” (Bouzarovski, 2014, p. 284). Gas prices have
seen steep increases until 2014 in all countries with dependencies on Russian imports (Lenz and
Grgurev, 2017, p. 3). Together with the falling away of government subsidies leading to increased
electricity prices combined with cold climates and energy-inefficient socialist legacy housing stock
are the underlying causes for the high energy poverty in CEE countries.
As a MEDEAS case study, Bulgaria is a typical example of a post-communist country with a legacy
that has pushed it into a state of nationwide energy poverty, with more than 38.1% of people in
2007 and 42.3% of the population in 2012- compared to the EU-average of around 14% in both
survey years- indicating an inability to keep their dwelling comfortably warm during winter time
(EU-SILC), while Peneva (2014) cites Eurostat data according to which an even more extensive “67%
of (...) people [limit] their heat comfort in the winter due to lack of money.” (p. 39). This stands
against an EU-average of 8% and a mean of 16% among the post-socialist European countries. When
looking at the first income quintile, 64% of the population are unable to keep their home adequately
warm in the winter, and 71% of these low-income-earners are not able to keep their homes
comfortably cool in the summer (Openex 2019). This ranks Bulgaria as most deprived across the EU
in both factors. In a nominal comparison of EU electricity prices, Bulgaria is among the countries
with the lowest consumer prices per kWh of electricity, but “on purchasing power parity basis,
electricity prices in Bulgaria are among the highest in the EU” (Hiteva, 2013, p. 499). Furthermore,
Bulgarian industry exhibits less energy efficiency than other European countries, “consuming
between two and eight times more primary energy for the production of a GDP unit” (Hiteva, 2013,
p. 498). High electricity prices and steep price increases of between 5% and 10% twice a year
(Peneva, 2014) since the end of communism in 1989 -while income increased at a much lower rate-
are a main cause of energy poverty and have been so present on the Bulgarian population’s mind
that several ten thousand Bulgarians joined energy-price-protests in over 20 cities nationwide in
February of 2013 (Krasimirov, 2013).
Furthermore, while in most EU countries residential buildings are heated with (cheaper) natural gas,
Bulgarian gas prices are among the highest in the EU, having faced a 50% price increase between
2007 and 2012 (Lenz and Grgurev, 2017), and only 1-2% of household heat with gas, leading to
electricity comprising over 55% of the total energy usage (Peneva, 2014). While during the
communist regime most residential blocks were connected to a district heating network, now that
the residents have a choice, many choose not to use central district heating as it is expensive, which
drives the price up even more. The high prices of electricity, gas and central district heating have
left many people with no option but to revert to traditional heating sources, so that firewood now
provides 23% of the heat for residential buildings (Lenz and Grgurev, 2017). This creates a whole
new problem set around gender justice and health risks. Use of biomass for cooking indoors or
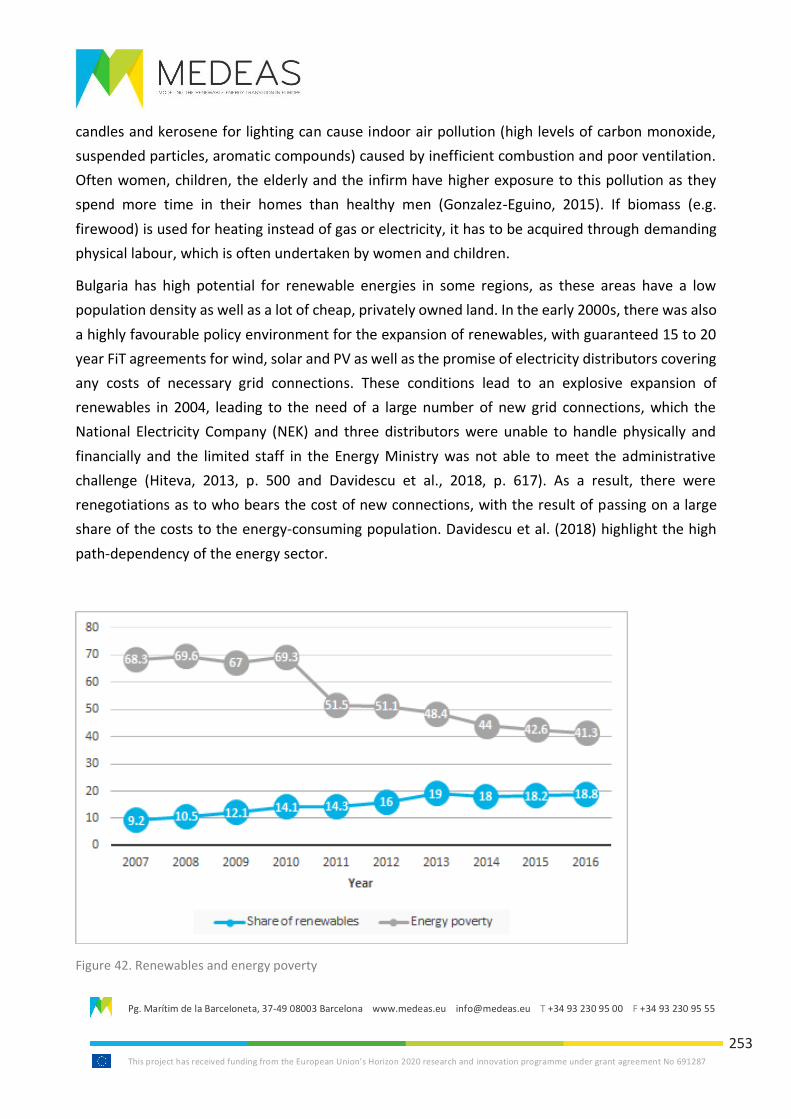
Pg. Marítim de la Barceloneta, 37-49 08003 Barcelona www.medeas.eu [email protected] T +34 93 230 95 00 F +34 93 230 95 55
This project has received funding from the European Union’s Horizon 2020 research and innovation programme under grant agreement No 691287
253
candles and kerosene for lighting can cause indoor air pollution (high levels of carbon monoxide,
suspended particles, aromatic compounds) caused by inefficient combustion and poor ventilation.
Often women, children, the elderly and the infirm have higher exposure to this pollution as they
spend more time in their homes than healthy men (Gonzalez-Eguino, 2015). If biomass (e.g.
firewood) is used for heating instead of gas or electricity, it has to be acquired through demanding
physical labour, which is often undertaken by women and children.
Bulgaria has high potential for renewable energies in some regions, as these areas have a low
population density as well as a lot of cheap, privately owned land. In the early 2000s, there was also
a highly favourable policy environment for the expansion of renewables, with guaranteed 15 to 20
year FiT agreements for wind, solar and PV as well as the promise of electricity distributors covering
any costs of necessary grid connections. These conditions lead to an explosive expansion of
renewables in 2004, leading to the need of a large number of new grid connections, which the
National Electricity Company (NEK) and three distributors were unable to handle physically and
financially and the limited staff in the Energy Ministry was not able to meet the administrative
challenge (Hiteva, 2013, p. 500 and Davidescu et al., 2018, p. 617). As a result, there were
renegotiations as to who bears the cost of new connections, with the result of passing on a large
share of the costs to the energy-consuming population. Davidescu et al. (2018) highlight the high
path-dependency of the energy sector.
Figure 42. Renewables and energy poverty
Pg. Marítim de la Barceloneta, 37-49 08003 Barcelona www.medeas.eu [email protected] T +34 93 230 95 00 F +34 93 230 95 55
This project has received funding from the European Union’s Horizon 2020 research and innovation programme under grant agreement No 691287
254
While energy poverty is often mainly associated with inappropriate levels of heating, certain
European regions (predominantly Mediterranean countries) have warm climates and thus an
increased need for cooling in the summer, which can also leave them energy deprived (Bouzarovski
et al. 2014, p. 285). Climatic changes are likely to continue amplifying this effect in the future and
extend the affected areas. In addition to any long-term effects caused by a household’s inability to
adequately cool their home, there can be severe acute effects, such as fatalities due to overheating
during extreme heat waves (see e.g. the 2003 heat wave which was especially damaging/lethal in
France).
Pg. Marítim de la Barceloneta, 37-49 08003 Barcelona www.medeas.eu [email protected] T +34 93 230 95 00 F +34 93 230 95 55
This project has received funding from the European Union’s Horizon 2020 research and innovation programme under grant agreement No 691287
255
7.5. Housing and community energy participation
Together with low household income and high energy prices, poor energy efficiency- referring to
appliances and housing stock efficiency- is the third main contributory factor of energy poverty.
More than the other factors, energy efficiency has a direct link to the amount of energy used in a
home and is thus closely related to greenhouse gas emissions. Hence, investing in the energy
efficiency of residential buildings to reduce carbon emissions to meet climate change goals at the
same time holds the potential for households to save energy, which means they face lower energy
bills, contributing to the alleviation of energy poverty (Thomson 2016 and Tirado Herrero et al.
2013). In fact, Tirado Herrero et al. (2013, p. 1605) cite the 2007 IPCC report claiming that “energy
efficiency in the building sector (...) is estimated to have the largest [climate change] mitigation
potential at a global level”. The authors further claim that a considerable part of this potential “can
be achieved at net negative cost”, which gives way to several co-benefits for society from reduced
energy consumption and emissions, energy poverty being one of them.
Openex in their in January 2019 published report deem it necessary to make “each single building
or cluster of buildings positive energy to ensure buildings produce more energy than they consume
annually”, which would bring yearly energy bills to zero and thus guarantee adequate access to
energy services for all (p. 5). In fact, the Energy Performance of Buildings Directive (2018/844)
demands that by 2021 all new buildings are nearly Zero Energy Buildings and it emphasizes the need
for all EU member states to “develop renovation strategies aiming at decarbonising the building
stock by 2050” (Openex 2019, p. 14). However, the authors of the Openex report stress that the lack
of a specific “energy performance target for renovated buildings” will prevent the majority of
renovated buildings from reaching positive energy status and might thus fail to bring about energy
poverty alleviation (p. 14).
Grosche and Schroder (2013) argue that since “ownership of photovoltaic facilities is positively
related to income and because energy is a necessity good, this key element of Germany’s climate
change policy therefore threatens to redistribute income, at least in relative terms, from the bottom
to the top of the income distribution. […] Moreover, the argument goes, the climate protection
effect of this policy is negligible, because the carbon dioxide emissions in Europe are capped by the
European emission trading system, and the subsidized greening of the electricity generation mix
simply relieves emission permits that are now used elsewhere.” (p. 1340)
Schaffrin (2013) refers to the “landlord tenant problem” – landlords have little incentive to improve
the insulation as a house since they do not live in it, thus neither pay the heating or cooling bills nor
suffer the discomfort. For both solar rooftop PV and due to inadequate housing stock being a key
Pg. Marítim de la Barceloneta, 37-49 08003 Barcelona www.medeas.eu [email protected] T +34 93 230 95 00 F +34 93 230 95 55
This project has received funding from the European Union’s Horizon 2020 research and innovation programme under grant agreement No 691287
256
part in energy poverty and in too warm or too cold housing, it is important to increase tenant rights
and decrease landlord rights. Housing is of course also for most people a much larger expenditure
per month than electricity.
Haan and Simmler (2018) assess how FiTs changed land prices in Germany in areas with high wind
potential – they find that “around 18% of expected wind turbine profits are capitalized into land
prices.” and argue that this is of particular relevance for social justice in states in which land
ownership is concentrated in the hands of the very few. As an example, “half of England is owned
by less than 1% of the population”.29 To remedy this injustice Haan and Simmler (2018) suggest
levying “land taxes (related to the market value of land) to finance the subsidies.” It has however
been argued, that in reality this is not so different as the wealthy have always owned energy
company shares and benefitted from this wealth (Gawel, Korte and Tews, 2015).
The question of social justice is also important for the decision-making process for the siting of
onshore wind power generation plants and overhead power lines. One danger is that people with
less access and influence on key political influencers or access to legal representation will lose out
in this. Another social justice issue commonly suggested for a renewable energy shift is the
argument that jobs in polluting sectors will not be replaced to the same extent with jobs in the
renewables sector. While we can expect certain low-skilled job losses either way due to increasing
automation in the future and fossil fuel phase out is simply necessary, this argument is worth a look
at. Cirstea (2015) reports for wind energy generation, that while this generates new jobs, about 80%
of the new jobs created due to an increase in wind energy require highly skilled workers. This
historically was not the same for coal or oil. Jobs that result from the deployment of renewable
technologies can be
• direct (“core activities, such as manufacturing/construction, site development, installation,
and operation and maintenance (O&M)”),
• indirect (“extraction and processing of raw materials (...) marketing and selling,
administration at ministries, or the work performed by regulatory bodies, consultancy firms
and research organisations”), or
• induced (“arise from the economic activities of direct and indirect employees, shareholders
and governments”), as defined by the International Renewable Energy Agency (IRENA)
(Cameron and van der Zwaan 2015, p. 162) Induced job effects are hard to isolate and thus
hard to quantify.
29 https://www.theguardian.com/money/2019/apr/17/who-owns-england-thousand-secret-landowners-author
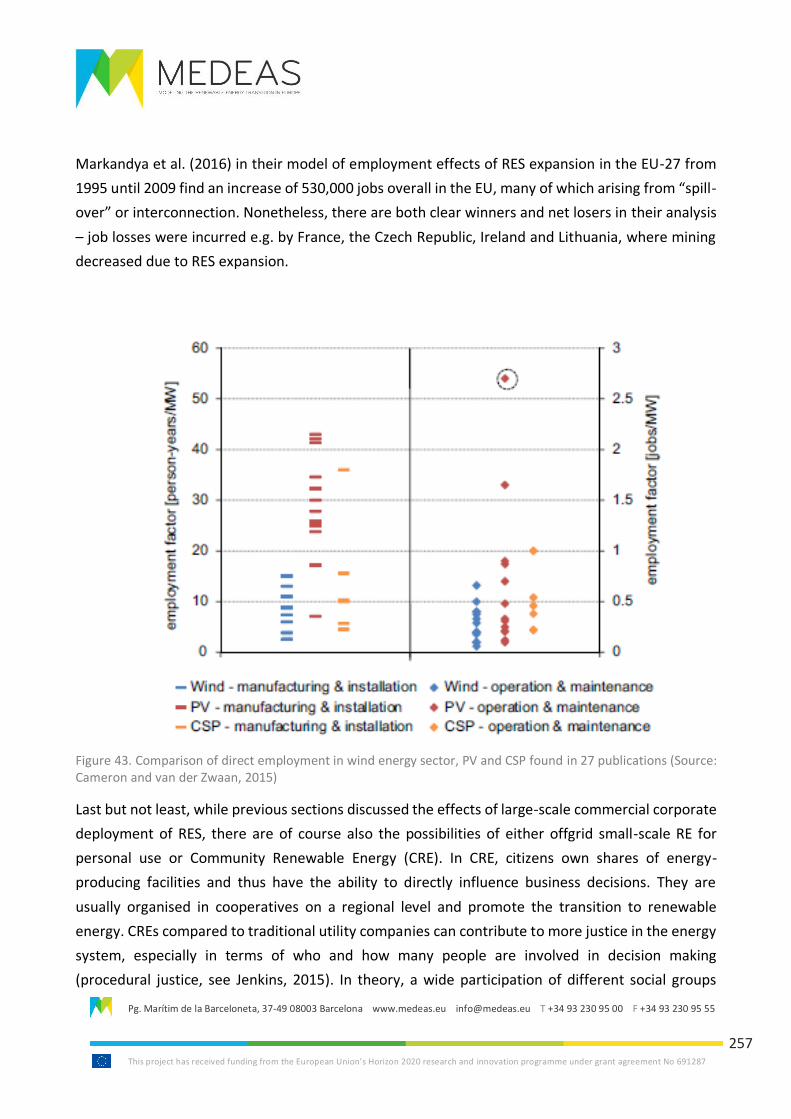
Pg. Marítim de la Barceloneta, 37-49 08003 Barcelona www.medeas.eu [email protected] T +34 93 230 95 00 F +34 93 230 95 55
This project has received funding from the European Union’s Horizon 2020 research and innovation programme under grant agreement No 691287
257
Markandya et al. (2016) in their model of employment effects of RES expansion in the EU-27 from
1995 until 2009 find an increase of 530,000 jobs overall in the EU, many of which arising from “spill-
over” or interconnection. Nonetheless, there are both clear winners and net losers in their analysis
– job losses were incurred e.g. by France, the Czech Republic, Ireland and Lithuania, where mining
decreased due to RES expansion.
Figure 43. Comparison of direct employment in wind energy sector, PV and CSP found in 27 publications (Source: Cameron and van der Zwaan, 2015)
Last but not least, while previous sections discussed the effects of large-scale commercial corporate
deployment of RES, there are of course also the possibilities of either offgrid small-scale RE for
personal use or Community Renewable Energy (CRE). In CRE, citizens own shares of energy-
producing facilities and thus have the ability to directly influence business decisions. They are
usually organised in cooperatives on a regional level and promote the transition to renewable
energy. CREs compared to traditional utility companies can contribute to more justice in the energy
system, especially in terms of who and how many people are involved in decision making
(procedural justice, see Jenkins, 2015). In theory, a wide participation of different social groups

Pg. Marítim de la Barceloneta, 37-49 08003 Barcelona www.medeas.eu [email protected] T +34 93 230 95 00 F +34 93 230 95 55
This project has received funding from the European Union’s Horizon 2020 research and innovation programme under grant agreement No 691287
258
would be desirable in order to ascertain a strong support for RES and the energy transition (Rommel
et al. 2018, p. 1749), but currently, the participation in CRE is dominated by middle-aged, highly
educated males who earn an above-average income. Nonetheless, no matter who invests in
renewable technologies and thus pockets the financial returns, the benefits for the common good
have to be considered as well, such as reduced greenhouse gas emissions or a greater energy
autonomy of the respective state (Gawel and Korte 2012, p.513).
Pg. Marítim de la Barceloneta, 37-49 08003 Barcelona www.medeas.eu [email protected] T +34 93 230 95 00 F +34 93 230 95 55
This project has received funding from the European Union’s Horizon 2020 research and innovation programme under grant agreement No 691287
259
7.6. Implications for MEDEAS
MEDEAS envisions the large-scale expansion of RES. Such a transition to RES therefore needs to
consider the presented evidence regarding possible electricity price effects. As Chapter 4 of this
Deliverable has shown, the RES transition will require large infrastructure increases with the
relevant financial price tag attached to it. Different financing options have been discussed there.
Most options include shifting some of the cost of the additional infrastructure to the consumer.
European governments thus need to ensure that any resulting electricity increases do not burden
already poor households and lead to energy poverty – as we have argued energy is not a good that
can be easily consumed less of for the poorest segments of society without a loss of quality of life.
Since many people use electricity for heating and cooling, also with negative health effects.
We have shown in this chapter that possible ways to ensure that poor households are not unduly
burdened by electricity price increases stemming from RES expansion include social transfer
payments or further regressive taxes (carbon taxation is also regressive), having a base level
‘essential’ energy usage free of charge, shifting payments from the consumer to energy-intensive
industries to entice them to greater innovation and increasing the insulation or natural cooling
abilities of housing and subsidise a shift to more energy-efficient appliances.
We cautioned nonetheless that energy prices from all energy sources have been rising, but that the
public debate focuses predominantly on electricity. We showed how regionally specific energy
poverty is and how steeped in the countries’ energy and housing history. Unfortunately the same
countries who will need the most funds for additional interaction will also require the most funding
to install heating or cooling and which are struggling the most under energy poverty. Transfer
payments may be necessary from countries experiencing lower levels of energy poverty to countries
with higher energy poverty.
There are several social justice issues related to the energy transition – one is that the poorer
segments of society may be renters and thus not be able to e.g. improve the insulation of their
house or install solar panels, another is the fact that the poorer segments of society usually are not
part of CRE.
Pg. Marítim de la Barceloneta, 37-49 08003 Barcelona www.medeas.eu [email protected] T +34 93 230 95 00 F +34 93 230 95 55
This project has received funding from the European Union’s Horizon 2020 research and innovation programme under grant agreement No 691287
260
7.7. References
Antonelli, M., Desideri, U., & Franco, A., 2018. Effects of large-scale penetration of renewables: The
Italian case in the years 2008–2015. Renewable and Sustainable Energy Reviews. 81: 3090–3100.
Association for the Conservation of Energy & Energy Action Grants Agency ('EAGA' energy company)
Charitable Trust, 2011. Costs of the ECO [UK Energy Company Obligation]: The impact on low income
households.
https://www.eagacharitabletrust.org/app/uploads/2016/03/costsoftheecofull-report.pdf
Azarova, V., Engel, D., Ferner, C., Kollmann, A., & Reichl, J., 2018. Exploring the impact of network
tariffs on household electricity expenditures using load profiles and socio-economic characteristics.
Nature Energy. 3: 317–325.
Azofra, D., Martínez, E., Jiménez, E., Blanco, J., Azofra, F. and Saenz-Díez, J.C., 2015. Comparison of
the influence of photovoltaic and wind power on the Spanish electricity prices by means of artificial
intelligence techniques. Renewable and Sustainable Energy Reviews. 42: 532-542.
Azpitarte, F., 2015. Fuel Poverty, Household Income and Energy Spending: An Empirical Analysis for
Australia Using HILDA Data [HILDA - Household, Income and Labour Dynamics in Australia Survey].
Fitzroy, Victoria: Brotherhood of St Laurence.
Bachner, G., Steininger, K. W., Williges, K., & Tuerk, A., 2019. The economy-wide effects of large-
scale renewable electricity expansion in Europe: The role of integration costs. Renewable Energy.
134: 1369–1380.
Bartiaux, F., Gosselain, V., Vassileva, D., Stamova, G., Ozoliņa, L., & Gara, E. (2011). Knowledge on
Climate Change and Energy Saving Renovations by Apartment Owners in Bulgaria and Latvia. A
Qualitative Study. International Review of Social Research. 1: 133–154.
Bollino, C.A. and Botti, F., 2017. Energy poverty in Europe: A multidimensional approach. PSL [Paolo
Sylos Labini – Italian economist, 1920-2005] Quarterly Review, 70 (283): 473-507.
Bouzarovski, S., 2014. Energy poverty in the European Union: Landscapes of vulnerability. Wiley
Interdisciplinary Reviews: Energy and Environment. 3: 276–289.
Bouzarovski, S., & Petrova, S., 2015. A global perspective on domestic energy deprivation:
Overcoming the energy poverty–fuel poverty binary. Energy Research & Social Science, 10, 31–40.
Pg. Marítim de la Barceloneta, 37-49 08003 Barcelona www.medeas.eu [email protected] T +34 93 230 95 00 F +34 93 230 95 55
This project has received funding from the European Union’s Horizon 2020 research and innovation programme under grant agreement No 691287
261
Bouzarovski, S., Petrova, S., & Sarlamanov, R., 2012. Energy poverty policies in the EU: A critical
perspective. Energy Policy. 49: 76–82.
Bouzarovski, S., & Tirado Herrero, S., 2017. The energy divide: Integrating energy transitions,
regional inequalities and poverty trends in the European Union. European urban and regional
studies. 24: 69–86.
Burke, M. J., & Stephens, J. C., 2018. Political power and renewable energy futures: A critical review.
Energy Research & Social Science. 35: 78–93.
Cai, D. W., Adlakha, S., Low, S. H., Martini, P. de, & Mani Chandy, K., 2013. Impact of residential PV
adoption on Retail Electricity Rates. Energy Policy. 62: 830–843.
Cai, M., Cusumano, N., Lorenzoni, A., & Pontoni, F., 2017. A comprehensive ex-post assessment of
RES deployment in Italy: Jobs, value added and import leakages. Energy Policy. 110: 234–245.
Cameron, L., & van der Zwaan, B. (2015). Employment factors for wind and solar energy
technologies: A literature review. Renewable and Sustainable Energy Reviews. 45: 160–172.
Coady, D., Parry, I., Sears, L. and Shang, B., 2017. How large are global fossil fuel subsidies?. World
development. 91: 11-27.
Chakravarty, S., & Tavoni, M., 2013. Energy poverty alleviation and climate change mitigation: Is
there a trade off? Energy Economics. 40: S67-S73.
Cirstea, S., 2015. Socio-economic impact of wind turbines implementation. Annals of the Constantin
Brâncuşi University Economy Series. Târgu Jiu (Romania), 6/2015.
Davidescu, S., Hiteva, R., & Maltby, T., 2018. Two steps forward, one step back: Renewable energy
transitions in Bulgaria and Romania. Public Administration. 96: 611–625.
de Jager, D., Klessmann, C., Stricker, E., Winkel, T., de Visser, E., Koper, M., Ragwitz, M., Held, A.,
Resch, G., Busch, S., Panzer, C., Gazzo, A., Roulleau, T., Gousseland, P., Henriet, M., Bouille, A., 2011.
Financing Renewable Energy in the European Energy Market. De Jager, D., Klessmann, C., Stricker,
E., Winkel, T., de Visser, E., Koper, M., Ragwitz, M., Held, A., Resch, G., Busch, S. and Panzer, C.,
2011. Financing renewable energy in the European energy market. Report for the European
Commission, Directorate-General for Energy.
Pg. Marítim de la Barceloneta, 37-49 08003 Barcelona www.medeas.eu [email protected] T +34 93 230 95 00 F +34 93 230 95 55
This project has received funding from the European Union’s Horizon 2020 research and innovation programme under grant agreement No 691287
262
Dobbins, A., Fuso Nerini, F., Deane, P., & Pye, S., 2019. Strengthening the EU response to energy
poverty. Nature Energy. 4: 2–5.
Druckman, A., and Jackson, T., 2008. Household energy consumption in the UK: A highly
geographically and socio-economically disaggregated model. Energy Policy, 36, 3177–3192.
Dvořák, P., Martinat, S., van der Horst, D., Frantál, B. and Tureckova, K., 2017. Renewable energy
investment and job creation; a cross-sectoral assessment for the Czech Republic with reference to
EU benchmarks. Renewable and Sustainable Energy Reviews. 69: 360-368.
Fouquet, R., and Pearson, P. J., 2012. Past and prospective energy transitions: Insights from history.
Energy Policy. 50: 1–7.
Fragkos, P., and Paroussos, L., 2018. Employment creation in EU related to renewables expansion.
Applied Energy. 230: 935–945.
Frerk, M., MacLean, K., 2017. Heat Decarbonisation: Potential impacts on social equity and fuel
poverty. National Energy Action (NEA). http://www.nea.org.uk/wp-
content/uploads/2017/09/Heat-Decarbonisation-Report-2017.pdf
Gil, H. A., Gomez-Quiles, C., & Riquelme, J., 2012. Large-scale wind power integration and wholesale
electricity trading benefits: Estimation via an ex post approach. Energy Policy. 41: 849–859.
González-Eguino, M., 2015. Energy poverty: An overview. Renewable and Sustainable Energy
Reviews. 47: 377–385.
Grosche, P., & Schroder, C. (2014). On the redistributive effects of Germany’s feed-in tariff. Empirical
Economics. 46: 1339–1383.
Guertler, P., 2012. Can the Green Deal be fair too?: Exploring new possibilities for alleviating fuel
poverty. Energy Policy. 49: 91–97.
Heffron, R. J., McCauley, D., & Sovacool, B. K., 2015. Resolving society's energy trilemma through
the Energy Justice Metric. Energy Policy. 87: 168–176.
Heindl, P., Schüßler, R., & Löschel, A., 2014. Ist die Energiewende sozial gerecht? Wirtschaftsdienst.
94: 508–514.
Pg. Marítim de la Barceloneta, 37-49 08003 Barcelona www.medeas.eu [email protected] T +34 93 230 95 00 F +34 93 230 95 55
This project has received funding from the European Union’s Horizon 2020 research and innovation programme under grant agreement No 691287
263
Hills, J., 2011. Fuel poverty: the problem and its measurement. CASE report. London, UK. London
School of Economics and Political Science (LSE) Centre for Analysis of Social Exclusion. Report
commissioned for UK DECC (Department for Energy and Climate Change).
Hirsch, D.B., Preston, I. and White, V., 2011. Understanding fuel expenditure: fuel poverty and
spending on fuel. Bristol: Centre for Sustainable Energy.
Hirth, L., 2013. The market value of variable renewables. Energy Economics. 38: 218–236.
Hiteva, R. P., 2013. Fuel poverty and vulnerability in the EU low-carbon transition: The case of
renewable electricity. Local Environment. 18: 487–505.
Iimura, A., & Cross, J. S., 2018. The impact of renewable energy on household electricity prices in
liberalized electricity markets: A cross-national panel data analysis. Utilities Policy. 54: 96–106.
Jenkins, K., McCauley, D., Heffron, R., Stephan, H., & Rehner, R., 2016. Energy justice: A conceptual
review. Energy Research & Social Science. 11: 174–182.
Kantamneni, A., Winkler, R., Gauchia, L. and Pearce, J.M., 2016. Emerging economic viability of grid
defection in a northern climate using solar hybrid systems. Energy Policy. 95: 378-389.
Li, K., Lloyd, B., Liang, X.-J., & Wei, Y.-M. (2014). Energy poor or fuel poor: What are the differences?
Energy Policy, 68, 476–481.
Markandya, A., Arto, I., González-Eguino, M., & Román, M. V., 2016. Towards a green energy
economy?: Tracking the employment effects of low-carbon technologies in the European Union.
Applied Energy. 179: 1342–1350.
Maxim, A., Mihai, C., Apostoaie, C.-M., Popescu, C., Istrate, C., & Bostan, I., 2016. Implications and
Measurement of Energy Poverty across the European Union. Sustainability. 8: 483.
McLeod, Z., Ward, J., Frerk, M., 2018. Energy for all- Innovate for all. London: Sustainability First.
http://www.sustainabilityfirst.org.uk/images/publications/inspire/Energy%20for%20All-
%20Innovate%20for%20All%20(full).pdf
Meyer, I., & Sommer, M. W., 2016. Employment effects of renewable energy deployment - a review.
International Journal of Sustainable Development. 19: 217–245.
Pg. Marítim de la Barceloneta, 37-49 08003 Barcelona www.medeas.eu [email protected] T +34 93 230 95 00 F +34 93 230 95 55
This project has received funding from the European Union’s Horizon 2020 research and innovation programme under grant agreement No 691287
264
Miller, C. A., Iles, A., & Jones, C. F., 2013. The Social Dimensions of Energy Transitions. Science as
Culture. 22: 135–148.
Mirasgedis, S., Tourkolias, C., Pavlakis, E., & Diakoulaki, D., 2014. A methodological framework for
assessing the employment effects associated with energy efficiency interventions in buildings.
Energy and Buildings. 82: 275–286.
Moore, S., 2013. Envisioning the Social and Political Dynamics of Energy Transitions: Sustainable
Energy for the Mediterranean Region. Science as Culture. 22: 181–188.
Moreno, B., López, A. J., & García-Álvarez, M. T., 2012. The electricity prices in the European Union.
The role of renewable energies and regulatory electric market reforms. Energy. 48: 307–313.
Mould, R., & Baker, K. J., 2017. Uncovering hidden geographies and socio-economic influences on
fuel poverty using household fuel spend data: A meso-scale study in Scotland. Indoor and Built
Environment. 26: 914–936.
Mulvaney, D., 2013. Opening the Black Box of Solar Energy Technologies: Exploring Tensions
between Innovation and Environmental Justice. Science as Culture. 22: 230–237.
Neuhoff, K., Bach, S., Diekmann, J., Beznoska, M., & El-Laboudy, T., 2013. Distributional Effects of
Energy Transition: Impacts of Renewable Electricity Support in Germany. Economics of Energy &
Environmental Policy. 2: 41-54.
Newell, P., and Mulvaney, D., 2013. The political economy of the ‘just transition’. The Geographical
Journal. 179: 132–140.
Nussbaumer, P., Bazilian, M., and Modi, V., 2012. Measuring energy poverty: Focusing on what
matters. Renewable and Sustainable Energy Reviews. 16: 231–243.
Pociovălișteanu, D., Novo-Corti, I., Aceleanu, M., Șerban, A., & Grecu, E., 2015. Employment Policies
for a Green Economy at the European Union Level. Sustainability. 7: 9231–9250.
Rademakers, K., Yearwood, J., Ferreira, A., Pye, S., Hamilton, I., Agnolucci, P., Grover, D., Karasek, J.,
Anisimova, N., 2016. Selecting Indicators to Measure Energy Poverty. Rotterdam. Trinomics,
University College London (UCL) and Seven report for European Commission DG
ENER.https://ec.europa.eu/energy/sites/ener/files/documents/Selecting%20Indicators%20to%20
Measure%20Energy%20Poverty.pdf
Pg. Marítim de la Barceloneta, 37-49 08003 Barcelona www.medeas.eu [email protected] T +34 93 230 95 00 F +34 93 230 95 55
This project has received funding from the European Union’s Horizon 2020 research and innovation programme under grant agreement No 691287
265
Rommel, J., Radtke, J., Jorck, G. von, Mey, F., & Yildiz, Ö., 2018. Community renewable energy at a
crossroads: A think piece on degrowth, technology, and the democratization of the German energy
system. Journal of Cleaner Production. 197: 1746–1753.
Schaffrin, Andre, 2013. Who pays for climate mitigation? An empirical investigation on the
distributional effects of climate policy in the housing sector. Energy and Buildings. 59: 265-272.
Sisodia, G. S., Soares, I., Ferreira, P., Banerji, S., van den Poel, D., & Kumar, M., 2015. Does the Use
of Solar and Wind Energy Increase Retail Prices in Europe?: Evidence from EU-27. Energy Procedia.
79: 506–512.
Sovacool, B. K., Lipson, M. M., & Chard, R., 2019. Temporality, vulnerability, and energy justice in
household low carbon innovations. Energy Policy. 128: 495–504.
Stockton, H. and Campbell, R., 2011. Time to reconsider UK energy and fuel poverty policies? Joseph
Rowntree Foundation. https://www.jrf.org.uk/report/time-reconsider-uk-energy-and-fuel-
poverty-policies
Stram, B. N., 2016. Key challenges to expanding renewable energy. Energy Policy: 96, 728–734.
Techert, H., Niehues, J., Bardt, H., Gawel, E., Korte, K., & Löschel, A., et al. (2012).
Verteilungswirkungen des Erneuerbare-Energien-Gesetzes. Wirtschaftsdienst. 92: 507–519.
Tews, K., 2013. Energiearmut definieren, identifizieren und bekämpfen- Eine Herausforderung der
sozialverträglichen Gestaltung der Energiewende: Vorschlag für eine Problemdefinition und
Diskussion des Maßnahmenportfolios. FTU-Report.
Thomson, H., Bouzarovski, S., & Snell, C., 2017. Rethinking the measurement of energy poverty in
Europe: A critical analysis of indicators and data. Indoor + built environment - Journal of the
International Society of the Built Environment. 26: 879–901.
Thomson, H., & Snell, C., 2013. Quantifying the prevalence of fuel poverty across the European
Union. Energy Policy. 52: 563–572.
Thomson, H., Snell, C., & Liddell, C., 2016. Fuel poverty in the European Union: A concept in need of
definition? People Place and Policy Online. 10: 5–24.
Pg. Marítim de la Barceloneta, 37-49 08003 Barcelona www.medeas.eu [email protected] T +34 93 230 95 00 F +34 93 230 95 55
This project has received funding from the European Union’s Horizon 2020 research and innovation programme under grant agreement No 691287
266
Thomson, H. and Bouzarovski, S., 2018. Addressing Energy Poverty in the European Union: State of
Play and Action.https://www.energypoverty.eu/sites/default/files/downloads/publications/19-
05/paneureport2018_updated2019.pdf
Tirado-Herrero, S., Ürge-Vorsatz, D. and Petrichenko, K., 2013. Fuel poverty alleviation as a co-
benefit of climate investments: evidence from Hungary. In European Council for an Energy Efficient
Economy Summer Study (ECEEE) Summer Study Proceedings (pp. 1605-1616).
Trujillo-Baute, E., del Río, P., & Mir-Artigues, P., 2018. Analysing the impact of renewable energy
regulation on retail electricity prices. Energy Policy. 114: 153–164.
Ürge-Vorsatz, D., & Tirado-Herrero, S., 2012. Building synergies between climate change mitigation
and energy poverty alleviation. Energy Policy. 49: 83–90.
Würzburg, K., Labandeira, X., & Linares, P., 2013. Renewable generation and electricity prices:
Taking stock and new evidence for Germany and Austria. Energy Economics. 40: S159-S171.
Pg. Marítim de la Barceloneta, 37-49 08003 Barcelona www.medeas.eu [email protected] T +34 93 230 95 00 F +34 93 230 95 55
This project has received funding from the European Union’s Horizon 2020 research and innovation programme under grant agreement No 691287
267
8. Environmental Impacts of RES transition
List of abbreviations and acronyms
ACAES Adiabatic CAES
ALCA Attributional Lifecycle Assessment
BAU Business As Usual
BES Battery Energy Storage
CAES Compressed Air Energy Storage
CHP Combined Heat & Power
CCS Carbon Capture and Storage
CPV Concentrator Photovoltaics
CSP Concentrated Solar Power
EES Electrical Energy Storage
EGS Enhanced Geothermal Systems
EMF Electromagnetic fields
EoL End-of-Life
EV Electric vehicles
FBES Flow Battery Energy Storage
FES Flywheels Energy Storage
GHG Greenhouse gas
HP Hydropower
HVAC High-Voltage Alternating Current
Pg. Marítim de la Barceloneta, 37-49 08003 Barcelona www.medeas.eu [email protected] T +34 93 230 95 00 F +34 93 230 95 55
This project has received funding from the European Union’s Horizon 2020 research and innovation programme under grant agreement No 691287
268
LHTES Latent Heat Thermal Energy Storage
LCA Lifecycle Assessment
MH Metal hydride
OLT Optimal-level transition
OTEC Ocean Thermal Energy Conversion
O&M Operation and Maintenance
PRO Pressure Retarded Osmosis
PSH/PHS Pumped-storage hydroelectricity
PV solar Photovoltaic
RCP Representative Concentration Pathways
RE Renewable energy
RED Reversed Electro Dialysis
RES Renewable energy sources
RoR Run-of-River
RoW Right of Way
SCES Super Capacitor Energy Storage
SHP Small-scale Hydropower
SMES Superconductive Magnetic Energy Storage
SNG Syngas
SOC Soil Organic Carbon
TRANS Transition scenario
T & D Transmission and Distributio
Pg. Marítim de la Barceloneta, 37-49 08003 Barcelona www.medeas.eu [email protected] T +34 93 230 95 00 F +34 93 230 95 55
This project has received funding from the European Union’s Horizon 2020 research and innovation programme under grant agreement No 691287
269
8.1. Introduction
The currently most widely accepted way to tackle the climate and energetic crises we are currently
facing is transitioning from an energy system based on fossil fuels to one based mostly on electricity
produced with RE technologies (including biomass and other biofuels). Indeed, lifecycle analysis
(LCA) studies have demonstrated that producing 1kWh of electricity with RES reduces overall GHG
emissions compared to fossil fuel-based energy (Goel et al., 2009). Nonetheless, RE technologies,
and especially at the penetration rates that will be required to make the global transition without
demand side changes, also feature several environmental impacts.
Environmental impacts occur at all stages from energy generation to end use (Jorge et al., 2012). In
this work we focus mostly on impacts of renewable energy supply (i.e. generation, transmission,
distribution and storage). On the supply side, there are studies focusing on the environmental
impacts of hydropower (Barros et al., 2011; Kelly-Richards et al., 2017; Winemiller et al., 2016),
wind offshore and onshore (Dai et al., 2015b; Lovich and Ennen, 2013; Saidur et al., 2011; Abbassi
et al., 2014; van Deurs et al., 2012; S. S. S. Wang and Wang, 2015), solar (Fthenakis, 2009; Gibson et
al., 2017; Hernandez et al., 2014; Union of Concerned Scientists, 2013; Tsoutsos et al., 2005; Varho,
2002), geothermal (Axtmann, 1975; DiPippo, 2008; Ganjehsarabi et al., 2013; Yousefi et al., 2010),
oceanic (Boehlert and Gill, 2011; Baring-Gould et al., 2015; Inger et al., 2009), biomass (Abbasi and
Abbasi, 2010; Demirbaş, 2005; Jeswani and Azapagic, 2016; Specht et al., 2015) and biofuels (Borras
et al., 2010; Demirbas, 2009; Galan-del-Castillo and Velazquez, 2010; Mohr and Raman, 2015;
Morales et al., 2015; Searchinger et al., 2008). There are also a few studies focusing on the impacts
of transmission grids (Bernardino et al., 2018; Biasotto and Kindel, 2018a; Liu et al., 2018;
McPherson and Tahseen, 2018; Taormina et al., 2018a) and on storage technologies (Balakrishnan
et al., 2018; Dehghani-Sanij et al., 2019; Florin and Dominish, 2017; McKenna et al., 2017; Mostert
et al., 2018; Oliveira et al., 2015; Tschiggerl et al., 2018).
We start with a review of existing literature studies to identify the main environmental impacts
associated with the technologies required to make the transition. This also serves as an inventory
of available technologies and to get an updated perspective on their maturity.
When analysing the available literature, it becomes clear that although the environmental impacts
of each individual transition technology are generally well identified, they are not so well quantified.
Indeed, the combined environmental impact of all those technologies has not been thoroughly
investigated. Moreover, the magnitude and significance of those impacts will, of course, depend on
Pg. Marítim de la Barceloneta, 37-49 08003 Barcelona www.medeas.eu [email protected] T +34 93 230 95 00 F +34 93 230 95 55
This project has received funding from the European Union’s Horizon 2020 research and innovation programme under grant agreement No 691287
270
the degree of the increase of energy demand during the transition in order to build the renewable
energy infrastructure and to electrify our societies.
In this work we perform a simulation experiment in order to put numbers to some of the main
environmental impacts described in literature, namely on land use changes, water utilisation and
GHG emissions, based on a scenario that was designed in previous tasks to achieve the transition
(TRANS scenario). The raw materials and risks associated with this were the subject of Task 6.2b, so
in this task we evaluate the materials costs associated exclusively with the storage, and more
precisely the materials costs of EV batteries. Less attention is put on the impacts of the adaptations
required on the demand side, which from a modelling perspective can only be evaluated in terms
of the variation of the electricity demand. The impacts caused by the demand side adaptations are
only briefly discussed at the end of the document.
The final section of this work discusses the results as well as the limitations of the current analysis
and potential improvements of the MEDEAS models to make it more suitable for the study of the
environmental impacts of the energy transition.
Pg. Marítim de la Barceloneta, 37-49 08003 Barcelona www.medeas.eu [email protected] T +34 93 230 95 00 F +34 93 230 95 55
This project has received funding from the European Union’s Horizon 2020 research and innovation programme under grant agreement No 691287
271
8.2. Methodology
The literature review is made on the impacts of the following technologies:
• energy generation: solar (PV and CSP), wind, geothermal, oceanic, hydropower, bioenergy
• energy transmission and distribution (T & D)
• energy storage
Then the model is used to quantify the overall water demand, land occupation and GHG emissions.
When possible the culprits of such impacts are identified among the different technologies involved
in the transition.
Since the direct impacts of storage technologies cannot be quantified using the model, they are
inferred based on the storage capacity requirements, which is a model output. Similarly, the
reduction on the use of non-renewable energy sources is also quantified in order to extract potential
environmental benefits.
For the simulations, MEDEAS_eu (v1.2) is used, and the results for the BAU, OLT and TRANS
scenarios are compared.
The TRANS scenario, was developed with the premise that at least a 90% share of RES should be
reached by 2050, based on the application of policies to stabilise the economy and a rapid
deployment of RES that allows for a complete electrification of all economic sectors. This scenario
is described in the appendix II of this document and will beused in Task 7.3a and b in order to derive
policy recommendations to minimise the energy and raw materials costs identified in Tasks 6.2a and
6.2b, respectively.
Pg. Marítim de la Barceloneta, 37-49 08003 Barcelona www.medeas.eu [email protected] T +34 93 230 95 00 F +34 93 230 95 55
This project has received funding from the European Union’s Horizon 2020 research and innovation programme under grant agreement No 691287
272
8.3 Literature review on environmental impacts
In this section we present a literature review on the main environmental impacts associated with
renewable energy supply, transmission and storage technologies.
8.3.1 Power supply
8.3.1.1 Hydropower
The major concerns for the implementation of hydropower projects are the associated
environmental and social impacts during construction and operation (Kaunda et al., 2012).
The design of hydropower plants is site-specific, and so is their associated efficiency, output and
environmental impacts. Hydropower plants can be classified according to their size (small-scale vs
large-scale), the water head (e.g. high, medium, low, ultralow and zero-head) and the degree of
impoundment (run-of-river, reservoir and pumped storage)(Kaunda et al., 2012).
When focusing on size, small-scale hydropower (SHP) projects, which according to most
international agencies include those with power capacities up to 10 MW (IRENA, 2016), tend to be
regarded as more environmentally friendly than large-scale ones and they benefit from a greater
social acceptance (Kaunda et al., 2012). However, according to Kelly-Richards et al., 2017 the fact
that they have smaller environmental impacts is based on little scientific evidence, especially when
compared to the electricity generated.
In industrialised countries new SHP developments tend to have smaller environmental impacts than
in developing countries, since in the former the new sites are built by refurbishing previously
developed dam sites and retrofitting irrigation canals and urban water supply systems. In contrast,
in developing countries the new sites require building new infrastructure, and generally are located
in mountainous regions (high head), which tend to be more sensitive to climate change and richer
in biodiversity and cultural importance (Kelly-Richards et al., 2017). In addition, in mountainous
landscapes with less infrastructural development, the impacts of hydropower construction,
particularly through habitat fragmentation, are more significant than in river basins with existing
infrastructure such as dams and roads (Kelly-Richards et al., 2017).
When focusing on the impoundment degree, run-of-river (RoR) hydropower (HP) projects do not
require a lot of construction activities, and because of this they account for lower environmental
impacts than other similar capacity hydropower plants (Kaunda et al., 2012). Pumped storage power
Pg. Marítim de la Barceloneta, 37-49 08003 Barcelona www.medeas.eu [email protected] T +34 93 230 95 00 F +34 93 230 95 55
This project has received funding from the European Union’s Horizon 2020 research and innovation programme under grant agreement No 691287
273
plants are not considered energy sources, but rather storage systems, although they are mostly built
in previously existing storage hydropower plants. In storage hydropower plants, the reservoir
regulates the flow, hence they have more power reliability than RoR HP plants, and can be used for
supplying both base load and peak load.
It is the combination of “large-scale” and “storage” hydropower plants that have the biggest
environmental impacts. Globally, hydroelectric reservoirs cover an area of 340.000 km2, replacing
important lowland and riverine forest and grassland habitats used by countless species and
fragmenting ecosystems (Gibson et al., 2017). In addition, dams act as artificial barriers hindering
the upstream or downstream migration of animals and the displacement of endemic species due to
changes in the natural flow regimes (fast-flowing to still) (Gibson et al., 2017; Winemiller et al.,
2016). Moreover, dams behave as heat sinks, making the water hotter than the normal river water,
which can also affect animal life (Baerwald et al., 2008). In addition, they retain sediments, leading
to shallower deltas that are more prone to suffer salinization of river mouths and aquifers due to
marine water intrusion (World Commission on Dams, 2000).
Large-scale storage hydropower plants also account for the highest water usage of all hydropower
plants, which can lose up to 17.000 l/MWhe due to evaporation from reservoirs (McCombie and
Jefferson, 2016).
Compared to other electricity generation technologies (including RES and non-RES), GHG emissions
from hydropower are relatively low. Even so, hydropower produces emissions of GHG (CO2, CH4 and
N2O) both in the construction process (deforestation, machinery) and during exploitation
(vegetation decomposition in anaerobic conditions). It is estimated that hydroelectric reservoirs
emit as much as 48-82 Tg of CO2 and 3-14 Tg of CH4 annually (Barros et al., 2011; Gibson et al.,
2017). Referred to the energy produced, hydropower technologies emit 15–25 g CO2equivalent per
kWhel, which is much lower than the emissions of fossil-fuel power generation technologies (600–
1200 g CO2 equivalent per kWhel) (Kaunda et al., 2012)
The environmental degradation caused by transmission lines and access roads to and from
hydropower plants are the second main impact of this technology on biodiversity, after water
impoundment (Gibson et al., 2017).
On the other hand, storage hydropower sites have also been reported to produce positive
environmental impacts, such as the creation of new ecosystems and habitats (World Commission
on Dams, 2000).
Pg. Marítim de la Barceloneta, 37-49 08003 Barcelona www.medeas.eu [email protected] T +34 93 230 95 00 F +34 93 230 95 55
This project has received funding from the European Union’s Horizon 2020 research and innovation programme under grant agreement No 691287
274
Since each hydropower project will have specific impacts depending on the type, scale and location,
it is essential to perform environmental impact assessment before construction. If the identified
environmental impacts are not sufficiently large to call off the specific project, mitigation strategies
need to be drawn to minimize and/or compensate for the expected environmental degradation.
8.3.1.2 Solar (PV and CSP)
Land use change and habitat loss, water use and the use of hazardous materials and energy in
manufacturing are the main environmental impacts associated with solar energy. The severity of
the impacts depends on the technology (solar photovoltaic panels, PV, or concentrating solar plants,
CSP), the scale (from distributed installations in rooftops to large utility-scale CSP or solar PV). The
tracking method (fixed-tilt, 1-axis, 2-axis flat panel, 2-axis Concentrator Photovoltaics, CPV) and the
cell efficiency for photovoltaic technologies and the different configurations (tower, parabolic
trough, linear Fresnel and parabolic dish) and the presence or not of thermal storage and the type
of cooling system in CSP may also result in different types of impacts. The impacts also depend on
specific factors such as the area and the topography of land that would be covered, sensitive
ecosystems, and biodiversity (Kaygusuz, 2009).
What makes solar technologies attractive is that, overall, they all generate far less life-cycle air
emissions per GWh than conventional fossil-fuel-based electricity generation technologies
(Fthenakis et al., 2008; Turney and Fthenakis, 2011).
Lifespan of solar power plants is between 25 and 40 years (Gasparatos et al., 2017; Hernandez et
al., 2014), and most emissions associated to this technology are concentrated before their
installation, as a result of burning fossil fuels to extract and transport the materials required for the
manufacture of solar cells, modules, and systems, as well as directly from smelting, production, and
manufacturing facilities (Fthenakis et al., 2008).
Based on data from 2004 to 2006, Fthenakis et al. (2008) compared the GHG emissions of four
commercial PV systems (ribbon-silicon, multicrystalline silicon, monocrystalline silicon and thin-film
cadmium telluride), and found thin-film cadmium telluride PV to release the least amount of harmful
air emissions (not only CO2). The authors of such study argue that this fact is due to their lower
energy requirements during the module production (Fthenakis et al., 2008). Similar results were
obtained by Kommalapati et al., 2017 by reviewing literature LCA on PV, who reported the mean
life cycle GHG emissions from sc-Si, mc-Si, a-Si, µc-Si, CdTe, CIS, CIGS, and DSSC PV systems to be
85.33 gCO2e/kWh, 73.68 gCO2e/kWh, 57.49 gCO2e/kWh, 39.2 gCO2e/kWh, 23.22 gCO2e/kWh,
50.5 gCO2e/kWh, 39.2 gCO2e/kWh, and 33 gCO2e/kWh, respectively. For CSP, they found the
Pg. Marítim de la Barceloneta, 37-49 08003 Barcelona www.medeas.eu [email protected] T +34 93 230 95 00 F +34 93 230 95 55
This project has received funding from the European Union’s Horizon 2020 research and innovation programme under grant agreement No 691287
275
emissions to be 79.8 gCO2e/kWh, 85.67 gCO2e/kWh, 41 gCO2e/kWh, 35.67 gCO2e/kWh, and 5.5
gCO2e/kWh for parabolic trough, central receiver, paraboloidal dish, solar chimney, and solar pond
CSP electricity generation systems, respectively.
Although solar power plants do not directly emit GHGs, the land-use changes and occupation can
reduce, on a local scale, the natural capacity of soil and vegetation to sequester CO2 (Turney and
Fthenakis, 2011).
Ong et al., 2013 analysed the utility-scale PV and CSP land-use requirements in the US, and found
average direct-area requirements of 3.1 acres/GWh/yr (12.5 Ha/GWh/yr) for PV and 2.7
acres/GWh/yr (10.9 Ha/GWh/yr) for CSP. The sites included in their analysis represented 72% of
installed and under-construction utility-scale PV and CSP capacity in the US at that time. Other
studies cited in the same report obtained similar results: 3.8 acres/GWh/yr (15.4 Ha/GWh/yr) for
PV and 2.5 acres/GWh/yr (10.1 Ha/GWh/yr) for CSP (Horner and Clark, 2013). These results imply
that, at utility-scale, PV is more land intensive than CSP. However, one important distinction
between the two is that PV installations can be distributed making them ideal for integration into
the urban environment or man-made structures (e.g. rooftops), while CSP installations cannot
(Gasparatos et al., 2017).
Similar to other semiconductors, the manufacturing of solar cells uses hazardous chemicals, both
for humans and the environment, such as hydrochloric acid, sulphuric acid, nitric acid, acetone,
1,1,1-trichloroethane, and hydrogen fluoride. Thin film photovoltaic cells also contain toxic
materials, including copper-indium-gallium-di-selenide, cadmium telluride, and gallium arsenide.
Some solar thermal systems use potentially hazardous fluids to transfer heat, which could be
harmful to the environment in case of leakages. In addition, recent reports may indicate that
material requirements for central solar thermal systems are larger than for fossil fuel plants per unit
energy (Abbasi and Abbasi, 2000).
Very little is known about the impacts of solar energy installations on ecosystems and wildlife, and
so far most of them are hypothesized with little peer-reviewed evidence (Gasparatos et al., 2017).
Most literature coincide that the main impact on biodiversity results from the clearing and grading
of the lands occupied by solar infrastructures posing a risk of soil erosion and compaction, which
may degrade and fragment the habitats of native plants and animals. Of course, solar installations
(distributed and utility-scale) integrated into the existing built environment (e.g., roof-top PVs) tend
to have negligible impacts in comparison to installations in previously undisturbed environments
(Hernandez et al., 2014).
Pg. Marítim de la Barceloneta, 37-49 08003 Barcelona www.medeas.eu [email protected] T +34 93 230 95 00 F +34 93 230 95 55
This project has received funding from the European Union’s Horizon 2020 research and innovation programme under grant agreement No 691287
276
The aforementioned soil disturbances and the development of roads around installations can
further increase mortality rates of organisms or serve as conduits for exotic invasions, which can
outcompete native species (Hernandez et al., 2014).
Recent studies have suggested that utility-scale solar installations may represent a source of
mortality for birds. Two known types of direct solar energy-related bird mortality have been
reported (Walston et al., 2016):
• mortality resulting from the direct contact of the bird with a solar project structure
• mortality from interference with the concentrated solar flux in CSP systems
The deaths of birds are amplified in CSP installations since their numbers increase due to the
increase of insects attracted by the glare of mirrors (Gasparatos et al., 2017).
Changes in temperature caused by solar panels through physical shading and alteration of air-flows
around the structures, could also alter sex ratios in those animal species whose sex is determined
by incubation temperatures (Gibson et al., 2017; Lovich and Ennen, 2011).
Plants are also affected by solar installation, since apart from the initial vegetation clearing during
the construction phase, dust emissions can impair gas exchange, photosynthesis and water usage
of plants.
Solar power plants require large amounts of water, particularly to cool the steam turbine in CSP
installations and clean solar panels and reflective surfaces (Gibson et al., 2017). Solar PV cells do not
use water for generating electricity but some water is used to manufacture solar PV components
facility (Klugmann-Radziemska, 2014). Using large volumes of ground or surface water may affect
the ecosystems that depend on these water resources. In addition, the use of chemicals, such as
dust suppressants, herbicides and dielectric fluids, may cause surface contamination or degradation
of groundwater (Gasparatos et al., 2017). Chemicals used in PV cells could be released to surface
water and groundwater in the manufacturing facility, the installation site, and the disposal or
recycling facility (Klugmann-Radziemska, 2014).
Recycling of solar infrastructure is expected to become an issue in the coming decades with the
aging of the aging of current installations. Currently the recycling process is not economically viable
and there are not enough specialised recycling facilities that can recycle PV panels.
In order to reduce the impacts of solar energy on ecosystems and biodiversity, mitigation measures
include locating solar energy installations in areas with little biodiversity and developing
biodiversity-friendly operational procedures for solar energy installations (Gasparatos et al., 2017).
Pg. Marítim de la Barceloneta, 37-49 08003 Barcelona www.medeas.eu [email protected] T +34 93 230 95 00 F +34 93 230 95 55
This project has received funding from the European Union’s Horizon 2020 research and innovation programme under grant agreement No 691287
277
8.3.1.3 Wind energy
The main impacts of wind power developments depend on factors such as whether they are
installed onshore or offshore, the sensitivity of the environment (altered vs unaltered ecosystems,
nearshore vs far from shore) their scale (distributed vs utility-scale) and the size of the windmills
(radius of the blades and the height of the towers).
The primary environmental issues associated to wind energy include wildlife safety, bio-system
disturbance, noise and visual pollution, electro-magnetic interference, local climate change and
increased risk of wildfires (Dai et al., 2015a).
The construction of wind turbines may require the use of rare earth minerals, the mining of which
can have negative effects on the environment (see MEDEAS deliverable WP6.3b). In addition, during
construction of a wind farm, foundation excavation and road construction may affect the local bio-
system and, if surface plants are removed, soil erosion might occur (Dai et al., 2015a). Indeed, any
wind energy installation will result in a loss of habitat area, either directly through the occupation
of land by the towers, or indirectly due to species avoiding the areas around wind power facilities
(Gasparatos et al., 2017).
The energy consumed to manufacture and transport the materials used to build wind power plants
may be compensated by the energy produced by the plant within a few months of operation, and
the combined CO2 emissions of the construction and the maintenance of wind power plants is much
lower than other fossil-fuel based power plants (Saidur et al., 2011). The emissions during the
construction phase arise from the production of concrete and steel for wind turbine foundations (S.
Wang and Wang, 2015).
Different studies have shown that wind turbines can impact local weather and regional climate,
producing moderate temperature increases and changing wind speeds, creating turbulence and
changing and the global distribution of rainfall and clouds (Dai et al., 2015a; S. Wang and Wang,
2015).
Mortality rates of birds and bats are influenced by parameters such as turbine types, the
topographic feature of a wind farm, bird and bat species and climatic conditions, among other
variables.
Despite there are studies that indicate a higher mortality of birds and bats around wind turbines,
the mortality rates are much lower in comparison to deaths by power line electrocution, automobile
and building collisions, and predation by cats (Loss et al., 2015). Wind farms are also responsible for
Pg. Marítim de la Barceloneta, 37-49 08003 Barcelona www.medeas.eu [email protected] T +34 93 230 95 00 F +34 93 230 95 55
This project has received funding from the European Union’s Horizon 2020 research and innovation programme under grant agreement No 691287
278
changes of migration patterns and structure of bird communities (changes in the counts of different
species). Some species, such as bats, face additional risks from the rapid reduction in air pressure
near turbine blades, which can cause internal haemorrhaging (Baerwald et al., 2008).
Although it is not clear how significantly offshore windfarms affect the marine environment (Dai et
al., 2015b) they can pose similar collision risks to birds as onshore wind farms. Some studies have
identified that while some bird species avoided offshore wind farms, others were attracted,
increasing the risk of collision. However, the proximity of offshore wind farms to the coast can also
affect migratory patterns of species that use the coastline for navigation (Gasparatos et al., 2017).
Thomsen et al. (2008) studied the effects of offshore windfarm noise on marine mammals and fish.
In their study, they provided further evidence that wind farm related noise has the potential to
affect the physiology and behaviour of harbour porpoises and harbour seals at considerable
distances. In addition, they also describe the likelihood of behavioural (avoidance and flight
reactions, alarm response, and changes of shoaling behaviour) and physical (internal or external
injuries or deafness up to cases of mortality) effects, due to piling on species like cod, herring, dab
and salmon.
On the other hand, some evidence suggests that offshore wind farm foundation scour protection
have sheltering effects that encourage the increase of benthic species and fish (Gasparatos et al.,
2017).
Noise is one of the environmental hindrances for the development of the wind power industry. Wind
turbines generate two types of noise: mechanical and aerodynamic. Apart from the impacts on
humans, noise produced by wind farms may attract certain species of bats, with the consequent
increased risk of collision fatalities (S. Wang and Wang, 2015). In addition, the noise generated by
windfarms may reduce the ability of births to deter rivals and hence their breeding success (Zwart
et al., 2016).
Compared to other renewable energy sources, such as solar energy, onshore wind turbines have
higher visual impact, due to the ever-increasing heights and blade diameters of windmills, which
can be seen from kilometres away. On the other hand, being far away from human settlements,
both the noise and visual impacts of offshore wind on humans are negligible (Leung and Yang, 2012).
Shadow flicker is another known impact associated with wind turbines, commonly categorised as
visual impact, which may affect nearby human settlements (Dai et al., 2015a). Shadow flickering is
not considered a serious issue because the turbines are relatively small and therefore do not result
Pg. Marítim de la Barceloneta, 37-49 08003 Barcelona www.medeas.eu [email protected] T +34 93 230 95 00 F +34 93 230 95 55
This project has received funding from the European Union’s Horizon 2020 research and innovation programme under grant agreement No 691287
279
in long shadows, but can lead to a pulsating light level especially in naturally lit spaces (Saidur et al.,
2011).
Other impacts of wind farms include the distraction of radar or television reception due to magnetic
fields they generate, and an increase on the probability of being struck by lightning (Dai et al.,
2015a).
Despite the operation lifetime of wind turbines lies between 20-25 years, their decommissioning is
relatively simple, and in Europe many older wind farms are being re-powered with new turbines
(Klugmann-Radziemska, 2014).
8.3.1.4 Geothermal
Environmental impacts of geothermal power plants depend on factors such as the type of project
(traditional vs enhanced geothermal systems), the technology used to convert the resource to
electricity (direct steam, flash, or binary) and the type of cooling technology used (water cooling vs
air cooling). Another important factor that affects the pollution of air and water is whether the
installations use open or closed-loop systems. The geology and structure of the underground as well
as the type of reservoir will also influence the types of environmental impacts of this technology
(site specific) (Kristmannsdóttir and Ármannsson, 2003).
The main environmental effects of geothermal power plants, which may be temporary or
irreversible, are related to land use changes and surface disturbances, the physical effects of fluid
withdrawal (e.g. land subsidence, induced seismicity), heat effects and discharge of chemicals to air
and water bodies, noise, and solid waste (Kristmannsdóttir and Ármannsson, 2003; Yilmaz and
Kaptan, 2017). Geothermal energy generation has also been associated with habitat change and
loss, often in highly biodiverse and/or fragile ecosystems (Gasparatos et al., 2017).
Impacts on biodiversity occur even before operation starts. Indeed, the disturbances caused by site
clearing, road construction, well drilling and seismic surveys may affect the breeding, foraging and
migration patterns of certain species (Gasparatos et al., 2017).
Geothermal power plants consist of boreholes, pipelines, silencers, separators, turbines/generators
and cooling towers, each producing specific environmental impacts (Gasparatos et al., 2017).
However, those impacts are generally confined to the immediate vicinity of the power plant.
Pg. Marítim de la Barceloneta, 37-49 08003 Barcelona www.medeas.eu [email protected] T +34 93 230 95 00 F +34 93 230 95 55
This project has received funding from the European Union’s Horizon 2020 research and innovation programme under grant agreement No 691287
280
Surface disturbances caused by excavation, construction and the creation of new roads will
accompany most new activities, but the area involved for geothermal power plants is relatively
small (Kristmannsdóttir and Ármannsson, 2003).
The land required by geothermal plants will depend on the power capacity of the plant, the
characteristics and accessibility of the source, the technology used to recover and cool the
discharges, the arrangement of wells and piping, the substation and auxiliary building needs and the
access roads.
Geothermal power plants use large quantities of water as the working liquid to extract energy from
hot dry rocks, from molten magma, or from the normal temperature-differences under-ground
(Abbasi and Abbasi, 2000). Although geothermal energy is considered to be a clean and renewable
energy source, its development will inevitably result in some emission of gases and effluent water
that require disposal (Kristmannsdóttir and Ármannsson, 2003).
The main chemicals present in the liquid fraction are hydrogen sulphide, arsenic, boron, mercury,
lead, cadmium, iron, zinc and manganese. Other chemical elements including lithium, ammonia and
aluminium, may also be present in harmful concentrations (Kristmannsdóttir and Ármannsson,
2003). These elements, which may be contained in the liquid streams generated during all phases
of geothermal projects may pollute surface or groundwater and harm local vegetation (Yilmaz and
Kaptan, 2017). Elevated arsenic concentration in water and soil resulting from geothermal activity
may be subsequently absorbed by plants and fish (Gasparatos et al., 2017).
Excess heat emitted in the form of steam may affect cloud formation and change the weather
locally, and waste water discharged into water bodies may seriously affect the ecological system
(Kristmannsdóttir and Ármannsson, 2003). In systems using water cooling the discharges also
increase heat pollution in the receiving bodies. Dry cooling systems such as air-cooled condensers,
on the other hand, eliminate the need for water, but require more land and are more energy
intensive.
Surface water and air discharges are minimized when steam and water are re-injected back into the
earth (closed-loop systems).
Indeed, the distinction between open- and closed-loop systems is important with respect to air
emissions. In closed-loop systems, gases removed from the well are injected back into the ground
after giving up their heat, decreasing air emissions. In contrast, open-loop systems may emit GHGs
(mostly CO2, but also methane), air pollutants (NH3, H2S) and other gases (H2, O2, N2) and elements
Pg. Marítim de la Barceloneta, 37-49 08003 Barcelona www.medeas.eu [email protected] T +34 93 230 95 00 F +34 93 230 95 55
This project has received funding from the European Union’s Horizon 2020 research and innovation programme under grant agreement No 691287
281
(Rn, He, As, Hg, B) (Gasparatos et al., 2017; Kristmannsdóttir and Ármannsson, 2003). While GHG
emissions are considered negligible compared to conventional electricity generation, and of the
same order of magnitude as most other renewable energy sources (Kristmannsdóttir &
Ármannsson, 2003), the emission of toxic pollutants such as H2S and boric acid can have a more
substantial effect on surrounding vegetation (Gasparatos et al., 2017). Geothermal power plants
use scrubbers to remove hydrogen, although they produce sludge composed of the captured
materials, which is toxic and must often be disposed of at hazardous waste sites.
In general, emissions from geothermal plants typically fall below the thresholds enforced by national
and local environmental standards and regulations (Klugmann-Radziemska, 2014). With regards to
GHGs, several studies have pointed that the natural discharge of CO2 from geothermal fields is
probably higher than that of CO2 emissions from energy use in the same field and that geothermal
plants are balanced by a reduction in natural release of CO2 from geothermal fields (Bravi and Basosi,
2014).
Noise pollution from geothermal facilities can also possibly have some ecological impact
(Gasparatos et al., 2017). The noise brought on by geothermal utilization consists firstly of drilling
noise and noise from discharging boreholes. This noise pollution rarely exceeds 120 dB, and once
the plant has started operations a noise muffler can keep the environmental noise below regulation
thresholds (Kristmannsdóttir and Ármannsson, 2003).
Despite there are many examples of the beneficial effects of utilization to tourism, geothermal fields
are often situated in places of outstanding natural beauty and may also be of historic interest
(Kristmannsdóttir and Ármannsson, 2003). Although visual impacts are generally subjective, the
main visual impact during the construction phase is the presence of a drilling rig, but once a project
is in the production phase the rig is not required and the energy centre footprint is relatively small
(Klugmann-Radziemska, 2014).
In almost all geothermal sites land subsidence following a decrease in the groundwater table caused
by the withdrawal of hot water or steam from an underground, has been reported, although the
magnitude of this phenomenon varies greatly from one site to the other (Abbasi and Abbasi, 2000;
Kristmannsdóttir and Ármannsson, 2003). Most geothermal facilities reduce this risk by re-injecting
the water back into geothermal reservoirs after utilisation. However, re-injection may also induce
micro seismicity (Kristmannsdóttir and Ármannsson, 2003). This effect is particularly relevant in
Enhanced Geothermal Systems (EGS) projects (hot dry rock), which require de injection of high
pressure fluids to increase the permeability of natural geothermal systems (Majer et al., 2007).
Pg. Marítim de la Barceloneta, 37-49 08003 Barcelona www.medeas.eu [email protected] T +34 93 230 95 00 F +34 93 230 95 55
This project has received funding from the European Union’s Horizon 2020 research and innovation programme under grant agreement No 691287
282
Landslides with devastating consequences have also been reported in geothermal sites (e.g. Zunil
field in Guatemala in 1991), and may set constraints on the sites chosen for construction
(Kristmannsdóttir and Ármannsson, 2003).
8.3.1.5 Oceanic
Oceanic or marine energy technologies are those that allow harvesting the energy carried by ocean
waves, tides (tidal potential energy and tidal current energy), and salinity and temperature
gradients. Although offshore wind is not oceanic energy, it is usually included in the list of marine
technologies (Boehlert and Gill, 2011; Inger et al., 2009; Mendoza et al., 2019) since it is located in
the same type of environment, and potentially many synergies can be found between the two
(Esteban and Leary, 2012). In this work the offshore wind energy impacts were described together
with those of onshore wind. Although in this review the first classification will be used, other
classifications of oceanic technologies exist, based on their location in the water table. According to
this classification, all oceanic technologies can be divided in the following categories: floating,
submerged, fixed to ocean floor, onshore (Mendoza et al., 2019).
Three types of technologies exist to harness the energy of tides (IRENA, 2014a):
• Tidal range technologies: barrages or dams are used to harvest the potential energy
originated from the height difference between high and low tides, using turbines.
• Tidal current/stream technologies: use the tidal current/stream for power generation using
energy converting devices/turbines (Melikoglu, 2018).
• hybrid applications, in the form of multipurpose platforms where both tidal current and tidal
range technologies are used for electricity generation (IRENA, 2014a).
Wave energy can be extracted directly from surface waves or from pressure fluctuations below the
surface and transformed into electricity using the following types of conversion systems (IRENA,
2014b; Melikoglu, 2018):
• attenuators: floating devices which operate parallel to the wave direction capture energy
from the relative motion of the two arms as the wave passes them,
• oscillating water columns: use trapped air pockets in a water column to drive a turbine,
• over-topping systems: use reservoirs to create a head to drive turbines.
• point absorbers: floating structures that absorb energy from all directions through its
movements at or near the water surface.
Pg. Marítim de la Barceloneta, 37-49 08003 Barcelona www.medeas.eu [email protected] T +34 93 230 95 00 F +34 93 230 95 55
This project has received funding from the European Union’s Horizon 2020 research and innovation programme under grant agreement No 691287
283
Other wave technologies exist (e.g. oscillating wave surge converters, bulge wave, etc.) but they are
still under development.
Ocean Thermal Energy Conversion (OTEC) technologies exploit the temperature gradient between
warm sea/ocean surface water and cold deep water to produce electricity using different conversion
processes. Three kinds of OTEC systems exist depending on the working fluids used (IRENA, 2014c):
• closed-cycle: uses mostly ammonia as the working fluid.
• open-cycle: uses seawater as the working fluid,
• hybrid or Kalina Cycle: uses a mixture of both fluids
The platform in which OTEC technologies are anchored can be land-based, moored to the sea floor,
or floating.
Salinity gradient power, also referred to as osmotic power, is the energy obtained from salt
concentration gradients within a fluid (when a river flows into the sea). The two main technologies
used to harness the energy from salinity gradients are Pressure Retarded Osmosis (PRO) and
Reversed Electro Dialysis (RED) (IRENA, 2014d).
It must be noted that, at present, only barrage tidal energy is considered a mature technology
(Gasparatos et al., 2017), while the rest are still under development and suffer from economic,
technical and environmental issues (Melikoglu, 2018). As a result, little research has been done into
their environmental impacts because many of the devices being used have not yet been deployed
or tested (Greaves et al., 2016; Zangiabadi et al., 2017). Moreover, the growing number of oceanic
energy technologies (either deployed or under development) and vast marine areas and ecosystems
where they could be implemented, makes it particularly difficult to describe all potential impacts of
these technologies. Furthermore, baseline data of biodiversity in seawaters is limited, making it
complicated to evaluate the impacts after installation (IRENA, 2014a)
Adding to the existing complexity, a common framework to evaluate the environmental impacts of
oceanic technologies is yet to be developed (Greaves et al., 2016; Mendoza et al., 2019).
The possible environmental impacts of oceanic technologies will depend on characteristics such as
the energy source, the construction materials and the operation principle of the device (Mendoza
et al., 2019). Impacts will also evolve during their lifetime, with the greatest impacts expected during
construction and decommissioning (sediments mobilisation, noise, marine traffic, etc.) (Inger et al.,
2009).
Pg. Marítim de la Barceloneta, 37-49 08003 Barcelona www.medeas.eu [email protected] T +34 93 230 95 00 F +34 93 230 95 55
This project has received funding from the European Union’s Horizon 2020 research and innovation programme under grant agreement No 691287
284
Reviewing 22 peer-reviewed articles on oceanic energy published between 1986 to 2018, which
included 15 different technologies, (Mendoza et al., 2019) proposed a categorisation of the
environmental impacts of oceanic energy devices based on the technology used and the device
location. In their review study, they found that the most common environmental impacts addressed
were: “the loss of habitat integrity and connectivity; changes in nutrient availability and ecological
interactions; modification of coastline dynamics and water column physico-chemical properties; an
increase of noise and vibrations; loss of recreational activities, fishing opportunities, scenic value
and mental health issues arising from conflicts with local communities”. (Inger et al., 2009) also
describes collision/entanglement of both avian species and marine vertebrates with above and
under water sections of marine technologies, and the impact on aquatic species of the
electromagnetic fields generated around the cables required to transfer the power generated with
these technologies.
Gasparatos et al. (2017) found the following impacts described in literature, some of them
associated with the specific oceanic technologies described above: loss/change of habitat from the
permanent inundation of the upstream portions of estuaries from tidal barrages; changes in salinity,
water turbidity and exchange between flushing of oxygenated water in tidal barrages; species
entrapment at tidal barrages; habitat change due to the alteration of hydrodynamic and
sedimentation processes; avoidance of underwater areas close to ocean energy installations by
some species; Interference with navigation and feeding patterns of local and migratory species;
increased mortality of tropical fish due to temperature shocks from upwelled cold water at OTEC
projects; and Increased turbidity at water column due to disturbances in the seabed (adapted from
Table 3 in (Gasparatos et al., 2017).
(Abbasi and Abbasi, 2000) also describes the potential negative effects of OTEC technologies of
enriching near-surface waters with the nutrient-rich cold water brought up from deep water. The
reduced stratification and mixing of water from different depths, cause primarily by OTEC and tidal
power, also alter the physiochemical characteristics of benthic and pelagic ecosystems (i.e. salinity
and pH) (Hammar et al., 2017). In (Abbasi and Abbasi, 2000), concerns are also raised on the
potential consequences on marine ecosystems of the accidental leakage of the working fluids used
by closed-cycle OTEC (mostly ammonia).
Potential positive impacts of these technologies, such as the creation of artificial reef ecosystems,
their behaviour as fish aggregation, and their protection against fisheries pressure, have also been
reported by (Inger et al., 2009).
Pg. Marítim de la Barceloneta, 37-49 08003 Barcelona www.medeas.eu [email protected] T +34 93 230 95 00 F +34 93 230 95 55
This project has received funding from the European Union’s Horizon 2020 research and innovation programme under grant agreement No 691287
285
As a final conclusion, although the belief is that ocean energy sources have lower environmental
impact than other renewable technologies, this statement should be re-evaluated when commercial
utilisation increases (Hammar et al., 2017).
8.3.1.6 Bioenergy
Gathered under the term “bioenergy”, a great diversity of fuels obtained from biomass, including
solid, liquid or gaseous fuels, exist. Traditional bioenergy forms include the energy obtained from
the combustion of wood, charcoal and animal waste, among others, and is used in developing
countries for cooking and heating. Modern bioenergy, on the other hand, are those fuels intended
as a sustainable replacement for fossil fuels, and are used especially as liquid fuels in the transport
sector, but also to generate electricity and for heat (IEA, 2017).
Modern biofuels used for transport are usually classified in three generations, depending on the
feedstock and the conversion process: the first generation of biofuels is obtained from the
processing of oil or carbohydrates-rich agricultural products, essentially food crops grown on arable
land (grains, sugar cane and vegetable oils); the second generation of biofuels is characterised by
using feedstock other than food crops, including lignocellulosic biomass (non-edible) and municipal
solid wastes, while the third-generation biofuels are those produced from algal biomass (Lee and
Lavoie, 2013). Most literature on biofuels focuses on those of first and second generation, while
fewer studies focus on third generation biofuels since they have yet to be deployed beyond
laboratory conditions (Gasparatos et al., 2017)
The most commonly used biofuels, especially as transport fuels, are bioethanol and biodiesel. Other
modern biofuels include biogas, syngas, bioalcohols other than ethanol (methanol, propanol,
butanol), green diesel, vegetal oil, bioethers, solid biofuels (wood, manure, bagasse, seeds, etc.),
algae-based biofuels and biohydrogen, among others.
Bioenergies are considered attractive energy sources for the potential GHG emissions savings in
comparison to conventional fossil fuels. Indeed, use of bioenergy as a replacement of fossil fuels
can reduce net carbon emissions (IEA, 2017).
The wide range of feedstocks, biofuel types and production and conversion technologies makes it
difficult to make a complete review of the environmental impacts associated to all of them. In this
work we focus exclusively on modern liquid biofuels, which are the more widely used at global scale.
The environmental impacts of other widely used biofuels such as biogas have recently been
reviewed by (Paolini et al., 2018), and with a special focus on replacing conventional fuels for
Pg. Marítim de la Barceloneta, 37-49 08003 Barcelona www.medeas.eu [email protected] T +34 93 230 95 00 F +34 93 230 95 55
This project has received funding from the European Union’s Horizon 2020 research and innovation programme under grant agreement No 691287
286
transport by (Lyng and Brekke, 2019). Similar studies exist for the impacts of biomass combustion
for heating and electricity generation (Kar and Keles, 2016; Specht et al., 2015).
Indicators for assessing the environmental impacts of biofuel plantation can be classified into the
following categories: soil quality, water quality and quantity, air quality and greenhouse emissions,
net primary productivity, and biodiversity (Liu et al., 2014).
Specific impacts will depend on the biofuel type, conversion technology, land use changes,
agricultural practices and others (Liu et al., 2014). This complexity has made that most studies focus
exclusively on GHG emissions using LCA, while much fewer works address the other potential
environmental impacts (Wu et al., 2018).
Theoretically, net CO2 emissions resulting from the direct use of biofuels are significantly smaller
than those produced by burning fossil fuels (Dunn et al., 2013; Wu et al., 2018). However, given the
impacts on land use changes, it is still not clear whether the combined emissions from the
production of biofuel plantation and utilisation are inferior to those emitted from fossil fuels
combustion (IEA, 2017; Liu et al., 2014; Wu et al., 2018). Indeed, when land-use changes are
included, in some combinations of biofuel feedstocks and production systems, greenhouse gas
emissions may be even higher than those for fossil fuels (FAO, 2009).
Apart from land use changes, GHG balances differ widely among crops and locations, depending on
feedstock production methods and conversion technologies (FAO, 2009; Mohr and Raman, 2015).
In addition, if fossil energy is used in the processes to produce (including fertilisers), convert,
transport and use bioenergy (supply chain emissions), these reduce the emission savings generated
(IEA, 2017).
As for CO2 emissions, land transitions are the major factors influencing N2O emissions, which is
another GHG with a warming potential around 300 times greater than that of CO2. This GHG is also
released from a biological process called denitrification, using nitrogen from fertilizers (Wu et al.,
2018).
Apart from GHG, air quality also can be affected by increased particulate matter emissions,
especially during the harvesting season, and with higher concentrations of tropospheric ozone
(Gasparatos et al., 2017).
Biomass energy production program requires large amounts of water resources and land (Abbasi
and Abbasi, 2010).
Pg. Marítim de la Barceloneta, 37-49 08003 Barcelona www.medeas.eu [email protected] T +34 93 230 95 00 F +34 93 230 95 55
This project has received funding from the European Union’s Horizon 2020 research and innovation programme under grant agreement No 691287
287
Biofuel crops will increase the demand for water, especially when grown on marginal lands (Liu et
al., 2018). Most of the water used in the production of biofuels is used for irrigation, although the
processing of feedstocks into biofuels is also very water intensive (FAO, 2009).
The land use conversion can also alter the hydrological cycle, through changes in
evapotranspiration, surface run-off, water yield, and soil water storage at regional scale (Wu et al.,
2018).
Herbicides, pesticides and fertilisers used to grow crops may result into water and soil pollution.
Moreover, and although biodiesel and ethanol are biodegradable, their production results in
organically contaminated wastewater. If untreated, such polluted effluents could increase
eutrophication of waterbodies and influence aquatic biodiversity (FAO, 2009; Liu et al., 2014).
As mentioned earlier, soil quality is also affected by land changes, agricultural practices and the use
of chemicals to grow crops. Soil organic carbon (SOC) is the most widely used index of soil quality,
and high content of SOC improves soil water retention, soil biodiversity, and crop productivity. To
this regard, inappropriate cultivation practices (e.g. residue removal, tillage practices) may reduce
SOC and increase soil erosion by removing permanent soil cover (FAO, 2009; Wu et al., 2018). In
addition, land use conversion might result in soil erosion, which diminishes soil quality reducing
natural and agricultural ecosystems productivity (Wu et al., 2018). The high carbon debts generated
by such land use changes may take several decades to be repaid (Gasparatos et al., 2017).
Impacts of Biofuel production on biodiversity depend on land use change, type of feedstock,
community structure, management practices, and the energy conversion process (Liu et al., 2014).
Among them, land use conversion is the most important factor affecting biological abundance
through the direct change of land use condition and production system (Wu et al., 2018).
The production of biomass energy drives agricultural expansion at the expense of natural habitat
loss and homogenisation (loss of agrobiodiversity), and promotes invasion of alien species.
Moreover, many of the crops and the enzymes needed for the conversion processes of second
generation biofuels are genetically modified and need to be carefully managed to prevent gene
contamination of the surrounding natural ecosystem (FAO, 2009; Liu et al., 2014). For third-
generation biofuel, the potential invasion of algal species to coastal shallow ecosystems, can bring
significant risk to the coastal biodiversity (Liu et al., 2014).

Pg. Marítim de la Barceloneta, 37-49 08003 Barcelona www.medeas.eu [email protected] T +34 93 230 95 00 F +34 93 230 95 55
This project has received funding from the European Union’s Horizon 2020 research and innovation programme under grant agreement No 691287
288
The different types of biofuel crops also affect the diversity of birds. Some of them may encourage
the presence of migratory birds by providing them with food, while large-scale monocultures may
negatively affect them (Liu et al., 2014).
Finally, certain feedstocks, especially perennial grasses such as miscanthus and switchgrass, might
be invasive and displace autochthonous species (Gasparatos et al., 2017).
Pg. Marítim de la Barceloneta, 37-49 08003 Barcelona www.medeas.eu [email protected] T +34 93 230 95 00 F +34 93 230 95 55
This project has received funding from the European Union’s Horizon 2020 research and innovation programme under grant agreement No 691287
289
8.3.2 Energy transmission and distribution
Power supply involves generation, transmission, and distribution, all of which with their respective
environmental impact (Jorge et al., 2012).
Power plants are usually far away from the energy consumers. In order to connect production sites
to final consumers, both transmission and distribution lines are required. Transmission lines support
higher voltages (from 69 kV to 800 kV) and usually extend for longer distances than distribution lines
(200V to 35kV) (Biasotto and Kindel, 2018a; Gargiulo et al., 2017; Richardson et al., 2017).
Transformer substations are used to connect different voltage levels within the transmission grid or
from transmission grid to distribution grid (D’Amico et al., 2018; Gargiulo et al., 2017).
Both transmission and distribution lines can be installed overhead and underground. Submarine
power cables are laid on top or buried in the seafloor while dynamic cables are deployed through
the water column between the surface and the seafloor (Taormina et al., 2018b).
As for any other linear infrastructure (e.g. roads, railroads, pipelines) power lines are ubiquitous and
responsible for a series of impacts on the surrounding environment (Richardson et al., 2017).
Acknowledging that results may vary depending on the energy mix, using LCA technique, Jorge et
al. (2012) found that overall, T&D represented 10% of impacts for the complete power generation
and supply. Accordingly, they argue that T&D should be taken into account to estimate the total
impacts from the electricity sector.
The extent of the impacts of power grids will depend on the distance between power plants and
consumption sites (Jorge et al., 2012), the transmission/distribution type (terrestrial vs submarine),
their disposition (overhead vs underground –for terrestrial- and dynamic vs laid-down vs buried –
for submarine-), the machinery used during construction, the building materials for the different
components (i.e. pylons, conductors, insulators, etc.) and the sensitivity of the receiving
environment. These impacts will also vary during installation, maintenance and decommissioning
phases (Bagli et al.,2011). Indeed, the installation and decommissioning phases of any infrastructure
are known to generate significant impacts, but a large fraction of the impacts associated to
transmission lines occur during the operation phase (Biasotto and Kindel, 2018b; Richardson et al.,
2017).
Marine ecosystems are affected differently than terrestrial ones by power transmission and
distribution lines; hence, in this document their impacts have been analysed separately.

Pg. Marítim de la Barceloneta, 37-49 08003 Barcelona www.medeas.eu [email protected] T +34 93 230 95 00 F +34 93 230 95 55
This project has received funding from the European Union’s Horizon 2020 research and innovation programme under grant agreement No 691287
290
Reviewing the results of 16 LCA studies on transmission lines, Gargiulo et al. (2017) reported that:
1) “recycling of materials, in particular metals (steel and aluminium for towers and conductors)
determines a reduction of impacts, which in some cases can compensate for the total impact of the
end-of-life stage” and 2) power losses play a determining role in the overall impacts of transmission
lines.
In this review, we focus mainly on the overall in-situ effects or impacts, using the work of Biasotto
and Kindel (2018b) as a reference for terrestrial power lines, and that of (Taormina et al., 2018b) for
impacts of submarine power lines.
Pg. Marítim de la Barceloneta, 37-49 08003 Barcelona www.medeas.eu [email protected] T +34 93 230 95 00 F +34 93 230 95 55
This project has received funding from the European Union’s Horizon 2020 research and innovation programme under grant agreement No 691287
291
8.3.1 Terrestrial power cables
Known in-situ impacts of terrestrial power lines include: habitat conversion, loss, degradation or
fragmentation, disturbance of patterns and increased risk of death of animal species (collision and
electrocution risk, barrier effects, corridor effects), electromagnetic fields, noise, increased fire risk,
air pollution and soil degradation and hydrological alterations.
Power lines are responsible for loss, fragmentation, and alteration of habitat across diverse
ecosystems (Richardson et al., 2017). Indeed, the right of way (RoW) claimed by power lines require
the clearance of land and the removal of surface vegetation, resulting in alteration, damage and
fragmentation or destruction of existing habitats (EC, 2018).
Vegetation clearance may result in the creation of new habitat habitats for uncommon plants and
organisms (potentially invasive) and increase the home range area and habitat for some others
(Biasotto and Kindel, 2018b).
In contrast, these new clearings may result in the fragmentation of habitats, producing changes in
the movement patterns in mammals and birds, which may use the RoW as a wildlife corridor
(Biasotto and Kindel, 2018b; Girardi, P., Maran, S. and Brambilla, 2013).
Infrastructure required by transmission lines becomes a physical obstacle for some organisms,
forcing them to bypass the area altogether, both during migration and, more locally, during regular
foraging activities. These created barriers may result in increased collisions of birds and bats and on
deaths by electrocution (EC, 2018; Girardi, P., Maran, S. and Brambilla, 2013) which may, in turn,
increase the risk of wildfires (Biasotto and Kindel, 2018b).
The presence of high voltage current creates electromagnetic fields, the impacts of which are still
uncertain on organisms, although they are suspected to generate behavioural changes and impact
reproductive success and individual survival (Biasotto and Kindel, 2018b). Similarly, the real
influence of permanent noise in organisms' behaviour is still uncertain but may result in wildlife
avoidance, especially during the construction phase (Biasotto and Kindel, 2018b). Disturbance of
species in their habitual breeding, feeding or resting sites, as well as along migration routes, can
lead to displacement and exclusion, and hence loss of habitat use (EC, 2018)
Pg. Marítim de la Barceloneta, 37-49 08003 Barcelona www.medeas.eu [email protected] T +34 93 230 95 00 F +34 93 230 95 55
This project has received funding from the European Union’s Horizon 2020 research and innovation programme under grant agreement No 691287
292
8.3.2 Submarine power cables
Known in-situ impacts of terrestrial power lines include: damage, disturbance or loss of benthic
habitats, invasion of alien species, behavioural changes, disturbance and displacement of
organisms, sediment resuspension and changes in turbidity, chemical pollution, reef and reserve
effect, increased entanglement risks, electromagnetic fields, and heat and noise emissions.
During installation, the worst habitat damage may occur if trenches need to be cut into the rock (EC,
2018). Unburied cables may also cause habitat loss, but to a lesser extent than buried cables
(Taormina et al., 2018a).
Substratum alterations created by transmission lines may affect benthic communities by direct
impacts such as displacement, damage or crushing of organisms. The significance of such changes
depend on the sensitivity of the affected species (Taormina et al., 2018a) and the affected space
depends on the techniques and machinery used (EC, 2018).
Changes in turbidity, seabed currents and topography may affect benthic communities in the vicinity
of cables and pipelines, while changes in feeding behaviour, disturbance, and displacement during
installation works may have an impact on marine mammals and seabirds (EC, 2018).
Electromagnetic fields (EMF) characteristics depend on the type of cable, power and type of current
and whether it is buried or not (Taormina et al., 2018b). Little is known about the effects of the EMF
around cables, but it may have effects on marine species able to detect these types of fields
(elasmobranchs, fishes, mammals, turtles, molluscs and crustaceans) (EC, 2018; Taormina et al.,
2018b).
The Joule effect is responsible for a temperature increase on the cable surface the warming of the
immediate surrounding environment. Heat emissions may impact some species sensitive to slight
increases in the ambient temperature but the type and significance of any effects on benthic
communities are unknown (EC, 2018; Taormina et al., 2018b). For instance, Ardelean and Minnebo
(2015) argue that the temperature rise due to cable operation cause the displacement of
thermophile species.
Chemical pollution can occur by the potential release of sediment-buried pollutants (e.g., heavy
metals and hydrocarbons) during cable burial, decommissioning or repair works (Taormina et al.,
2018a). Chlorine and bromine can be released from sea electrodes during operation and impact the
immediate water quality (Ardelean and Minnebo, 2015; Taormina et al., 2018b).
Pg. Marítim de la Barceloneta, 37-49 08003 Barcelona www.medeas.eu [email protected] T +34 93 230 95 00 F +34 93 230 95 55
This project has received funding from the European Union’s Horizon 2020 research and innovation programme under grant agreement No 691287
293
Noise can be produced during installation and maintenance by the vessels and tools used during
these operations. High-Voltage Alternating Current (HVAC) cable vibrations due to the Coulomb
force occurring between conductors can also produce noise during the operation phase. However,
there is no clear evidence that underwater noises emitted affect marine mammals or any other
marine animal (Taormina et al., 2018b).
Immersed anthropogenic objects with hard surfaces (e.g. cables, pipelines and associated
protection/stabilisation materials) can create artificial reefs, inducing the so-called reef effect
(Ardelean and Minnebo, 2015; Taormina et al., 2018b). There is also an increased risk of colonisation
of such structures by invasive alien species (EC, 2018).
Dynamic submarine power cables may cause entanglements of marine species, although this issue
is minimised by the inflexible nature of the cables being used (Taormina et al., 2018b).
Finally, the limitation/interdiction of human activities around the cable route results in the
protection of the ecosystems around it, which is a phenomenon known as reserve effect (Taormina
et al., 2018b).
Pg. Marítim de la Barceloneta, 37-49 08003 Barcelona www.medeas.eu [email protected] T +34 93 230 95 00 F +34 93 230 95 55
This project has received funding from the European Union’s Horizon 2020 research and innovation programme under grant agreement No 691287
294
8.3.3 Electrical Energy Storage (EES)
EES refers to the process in which electrical energy is stored in another form, and then converted
back to electrical energy when needed (Akinyele and Rayudu, 2014).
Storage technologies can be classified in the following types, according to the energy form stored in
the system (Achkari and Fadar, 2018; IEC, 2011):
Mechanical energy
• Compressed Air Energy Storage (CAES)
• Pumped Hydro Energy Storage (PHS)
• Flywheels Energy Storage (FES)
Electro-chemical:
• Battery Energy Storage (BES)
o Lead-acid batteries
o Nickle-based batteries
o Sodium-sulphur batteries
o Lithium-ion batteries
o Metal-Air batteries
• Flow Battery Energy Storage (FBES)
Electrical energy storage:
• Superconductive Magnetic Energy Storage (SMES)
• Super Capacitor Energy Storage (SCES)
Chemical Energy Storage
• Hydrogen energy Storage
• Synthesis natural gas (Methanation)
Thermal Energy Storage
• Sensible heat storage systems
• Latent Heat Thermal Energy Storage (LHTES)
• Thermochemical energy storage
Pg. Marítim de la Barceloneta, 37-49 08003 Barcelona www.medeas.eu [email protected] T +34 93 230 95 00 F +34 93 230 95 55
This project has received funding from the European Union’s Horizon 2020 research and innovation programme under grant agreement No 691287
295
While still an emerging technology, grid-level ESS, has the potential to provide multiple benefits to
the energy system, and is expected to play an essential role in the future Smart Grid (IEC, 2011).
Among those benefits, EES acts as a regulator that manages the fluctuations of electricity from
renewable sources (Akinyele and Rayudu, 2014; Mahlia et al., 2014) allowing the integration in the
grid (Arciniegas and Hittinger, 2018).
Precisely for their potential to integrate renewable energy in the grid, the use of ESS is expected to
rise in the near future (Mahlia et al., 2014).
However, according to the specific characteristics of each of them (output and storage capacity,
lifetime, cycle efficiency, discharge efficiency, response time, etc.), they cannot be used
interchangeably for the many different applications they have (time shifting, peak shaving, load
balancing, managing grid fluctuations, seasonal storage, transportation, etc.).
Although it is believed that EES will help decarbonise the grid, some studies have pointed that their
low efficiency might increase grid emissions due to the extra energy required to compensate for the
losses (Hittinger and Azevedo, 2015; Lueken and Apt, 2014).
The specific environmental issues of each of the above EES technologies are summarized in the
following lines.
8.3.3.1 Electro-chemical energy storage
LCA studies have been made to evaluate the environmental impacts of a wide set of stationary
battery technologies (Lastoskie and Dai, 2015; Troy et al., 2016; Vandepaer et al., 2019), all revealing
that significant negative environmental impacts occur during the manufacturing and material
extraction steps.
In general, battery storage technologies have a higher material intensity compared to the other
technologies, hence they have the most significant impacts, which vary depending on the location
of mining, processing, and end-of-life (Florin and Dominish, 2017).
Using ALCA to analyse the impacts of the integration of batteries in the Swiss electricity supply
system, Vandepaer et al. (2019) also found that, in some scenarios, the use (operation phase) of
batteries generates environmental benefits. Nevertheless, those benefits were observed to
diminish when batteries were integrated into the grid in a low-carbon scenario, since the marginal
electricity production displaced using batteries, already has a low environmental impact.
Pg. Marítim de la Barceloneta, 37-49 08003 Barcelona www.medeas.eu [email protected] T +34 93 230 95 00 F +34 93 230 95 55
This project has received funding from the European Union’s Horizon 2020 research and innovation programme under grant agreement No 691287
296
In addition, all batteries contain hazardous and toxic materials such as lead, cadmium, sodium,
sulphur and bromine, hence they must be treated as hazardous wastes (Raza et al., 2014).
The main environmental issues of lead-acid batteries are associated with lead and sulphuric acid
during production and disposal (Evans et al., 2012; Mahlia et al., 2014; Raza et al., 2014). In fact,
lead is a hazardous material prohibited or restricted in various jurisdictions (IEC, 2011). Moreover,
toxic fumes are released into the atmosphere during the melting of lead to form plates (Raza et al.,
2014). Lead-Acid batteries are highly recyclable.
Cadmium used in Ni-Cd batteries, although highly recyclable, is highly toxic and can harm the
environment if not treated properly (Akinyele and Rayudu, 2014; Evans et al., 2012; Mahlia et al.,
2014). Because of the toxicity of Cd, these batteries are presently used only for stationary
applications in Europe and since 2006 they have been prohibited for consumer use (IEC, 2011). Ni–
MH (metal hydride) are considered more friendly to the environment (Mahlia et al., 2014), and most
hybrid vehicles available on the market operate almost exclusively with sealed NiMH batteries (IEC,
2011).
The materials used in the construction of Na-S batteries are relatively inert, hence their
environmental impact is relatively low. A small risk arises from the high temperature at which the
battery must be operated to maintain the sulphur in molten form (ITRE, 2008; Mahlia et al., 2014).
In addition, the system must be protected from reacting with atmosphere as pure sodium explodes
instantly in contact with air (Mahlia et al., 2014).
Li batteries have a limited environmental impact since they use a non-toxic cathode material and
the lithium oxides and salts can be recycled (Mahlia et al., 2014). The main impact is the resource
depletion, human toxicity and Eco toxicity mainly associated with copper, cobalt, nickel, thallium
and silver) (Evans et al., 2012; ITRE, 2008). However, their relatively high energy density makes them
less material intense than other battery technologies (Florin and Dominish, 2017).
Environmentally, metal-air batteries are relatively inert since no toxic materials are involved in their
construction (Chen et al., 2009). Like other battery types, metals such as zinc or aluminium used
within the battery should be recycled (ITRE, 2008).
A major advantage of the flow battery technology is its ability to perform discharge cycles
indefinitely so there are no significant waste products associated with operation (ITRE, 2008). Only
Zn–Br type flow batteries have the added complications dealing with corrosive and toxic materials
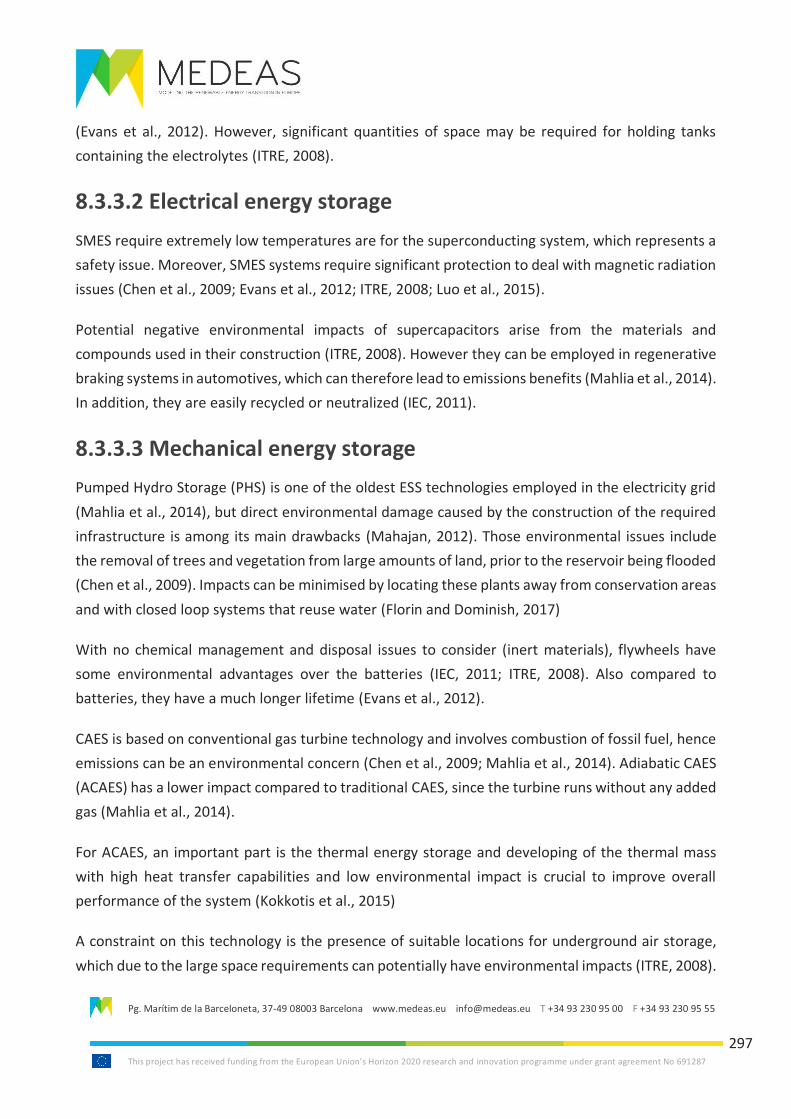
Pg. Marítim de la Barceloneta, 37-49 08003 Barcelona www.medeas.eu [email protected] T +34 93 230 95 00 F +34 93 230 95 55
This project has received funding from the European Union’s Horizon 2020 research and innovation programme under grant agreement No 691287
297
(Evans et al., 2012). However, significant quantities of space may be required for holding tanks
containing the electrolytes (ITRE, 2008).
8.3.3.2 Electrical energy storage
SMES require extremely low temperatures are for the superconducting system, which represents a
safety issue. Moreover, SMES systems require significant protection to deal with magnetic radiation
issues (Chen et al., 2009; Evans et al., 2012; ITRE, 2008; Luo et al., 2015).
Potential negative environmental impacts of supercapacitors arise from the materials and
compounds used in their construction (ITRE, 2008). However they can be employed in regenerative
braking systems in automotives, which can therefore lead to emissions benefits (Mahlia et al., 2014).
In addition, they are easily recycled or neutralized (IEC, 2011).
8.3.3.3 Mechanical energy storage
Pumped Hydro Storage (PHS) is one of the oldest ESS technologies employed in the electricity grid
(Mahlia et al., 2014), but direct environmental damage caused by the construction of the required
infrastructure is among its main drawbacks (Mahajan, 2012). Those environmental issues include
the removal of trees and vegetation from large amounts of land, prior to the reservoir being flooded
(Chen et al., 2009). Impacts can be minimised by locating these plants away from conservation areas
and with closed loop systems that reuse water (Florin and Dominish, 2017)
With no chemical management and disposal issues to consider (inert materials), flywheels have
some environmental advantages over the batteries (IEC, 2011; ITRE, 2008). Also compared to
batteries, they have a much longer lifetime (Evans et al., 2012).
CAES is based on conventional gas turbine technology and involves combustion of fossil fuel, hence
emissions can be an environmental concern (Chen et al., 2009; Mahlia et al., 2014). Adiabatic CAES
(ACAES) has a lower impact compared to traditional CAES, since the turbine runs without any added
gas (Mahlia et al., 2014).
For ACAES, an important part is the thermal energy storage and developing of the thermal mass
with high heat transfer capabilities and low environmental impact is crucial to improve overall
performance of the system (Kokkotis et al., 2015)
A constraint on this technology is the presence of suitable locations for underground air storage,
which due to the large space requirements can potentially have environmental impacts (ITRE, 2008).
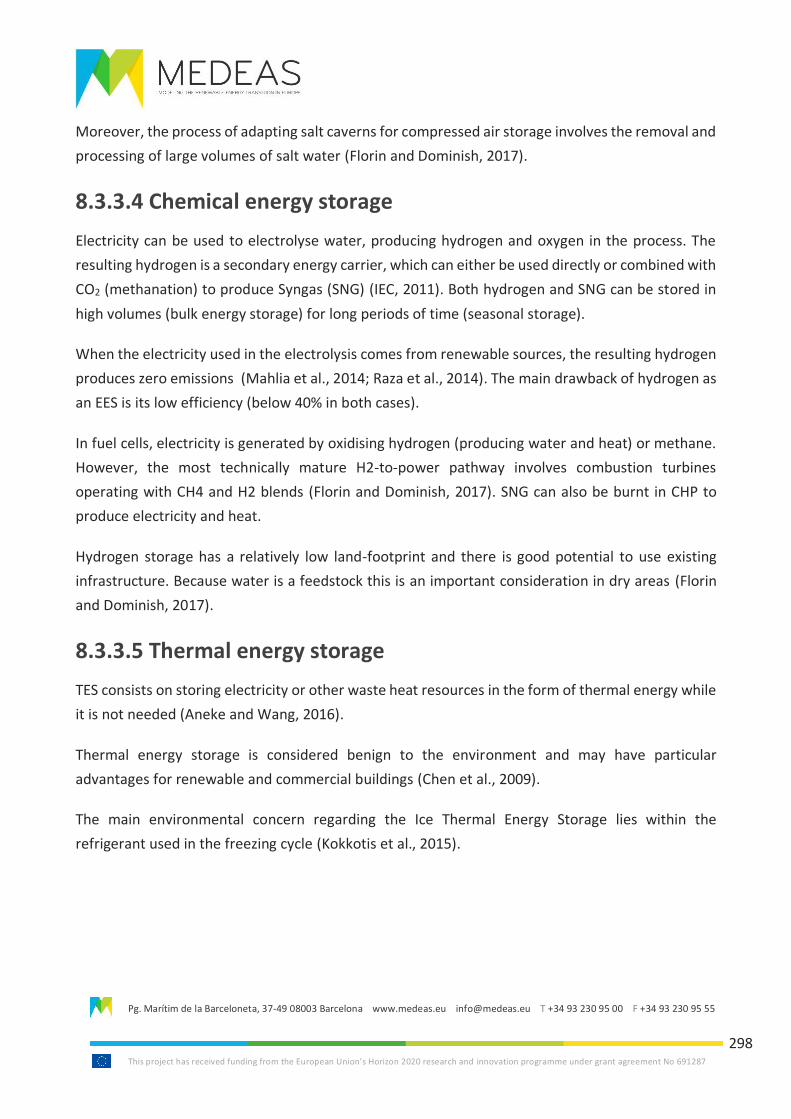
Pg. Marítim de la Barceloneta, 37-49 08003 Barcelona www.medeas.eu [email protected] T +34 93 230 95 00 F +34 93 230 95 55
This project has received funding from the European Union’s Horizon 2020 research and innovation programme under grant agreement No 691287
298
Moreover, the process of adapting salt caverns for compressed air storage involves the removal and
processing of large volumes of salt water (Florin and Dominish, 2017).
8.3.3.4 Chemical energy storage
Electricity can be used to electrolyse water, producing hydrogen and oxygen in the process. The
resulting hydrogen is a secondary energy carrier, which can either be used directly or combined with
CO2 (methanation) to produce Syngas (SNG) (IEC, 2011). Both hydrogen and SNG can be stored in
high volumes (bulk energy storage) for long periods of time (seasonal storage).
When the electricity used in the electrolysis comes from renewable sources, the resulting hydrogen
produces zero emissions (Mahlia et al., 2014; Raza et al., 2014). The main drawback of hydrogen as
an EES is its low efficiency (below 40% in both cases).
In fuel cells, electricity is generated by oxidising hydrogen (producing water and heat) or methane.
However, the most technically mature H2-to-power pathway involves combustion turbines
operating with CH4 and H2 blends (Florin and Dominish, 2017). SNG can also be burnt in CHP to
produce electricity and heat.
Hydrogen storage has a relatively low land-footprint and there is good potential to use existing
infrastructure. Because water is a feedstock this is an important consideration in dry areas (Florin
and Dominish, 2017).
8.3.3.5 Thermal energy storage
TES consists on storing electricity or other waste heat resources in the form of thermal energy while
it is not needed (Aneke and Wang, 2016).
Thermal energy storage is considered benign to the environment and may have particular
advantages for renewable and commercial buildings (Chen et al., 2009).
The main environmental concern regarding the Ice Thermal Energy Storage lies within the
refrigerant used in the freezing cycle (Kokkotis et al., 2015).
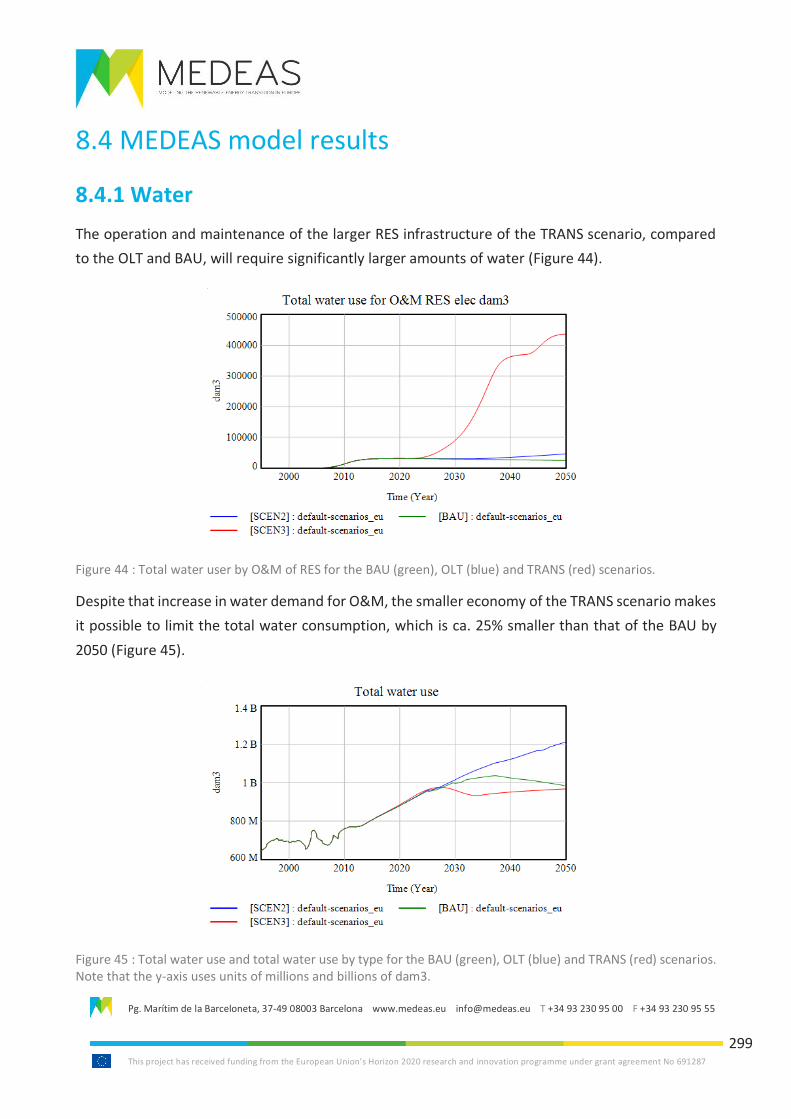
Pg. Marítim de la Barceloneta, 37-49 08003 Barcelona www.medeas.eu [email protected] T +34 93 230 95 00 F +34 93 230 95 55
This project has received funding from the European Union’s Horizon 2020 research and innovation programme under grant agreement No 691287
299
8.4 MEDEAS model results
8.4.1 Water
The operation and maintenance of the larger RES infrastructure of the TRANS scenario, compared
to the OLT and BAU, will require significantly larger amounts of water (Figure 44).
Figure 44 : Total water user by O&M of RES for the BAU (green), OLT (blue) and TRANS (red) scenarios.
Despite that increase in water demand for O&M, the smaller economy of the TRANS scenario makes
it possible to limit the total water consumption, which is ca. 25% smaller than that of the BAU by
2050 (Figure 45).
Figure 45 : Total water use and total water use by type for the BAU (green), OLT (blue) and TRANS (red) scenarios. Note that the y-axis uses units of millions and billions of dam3.
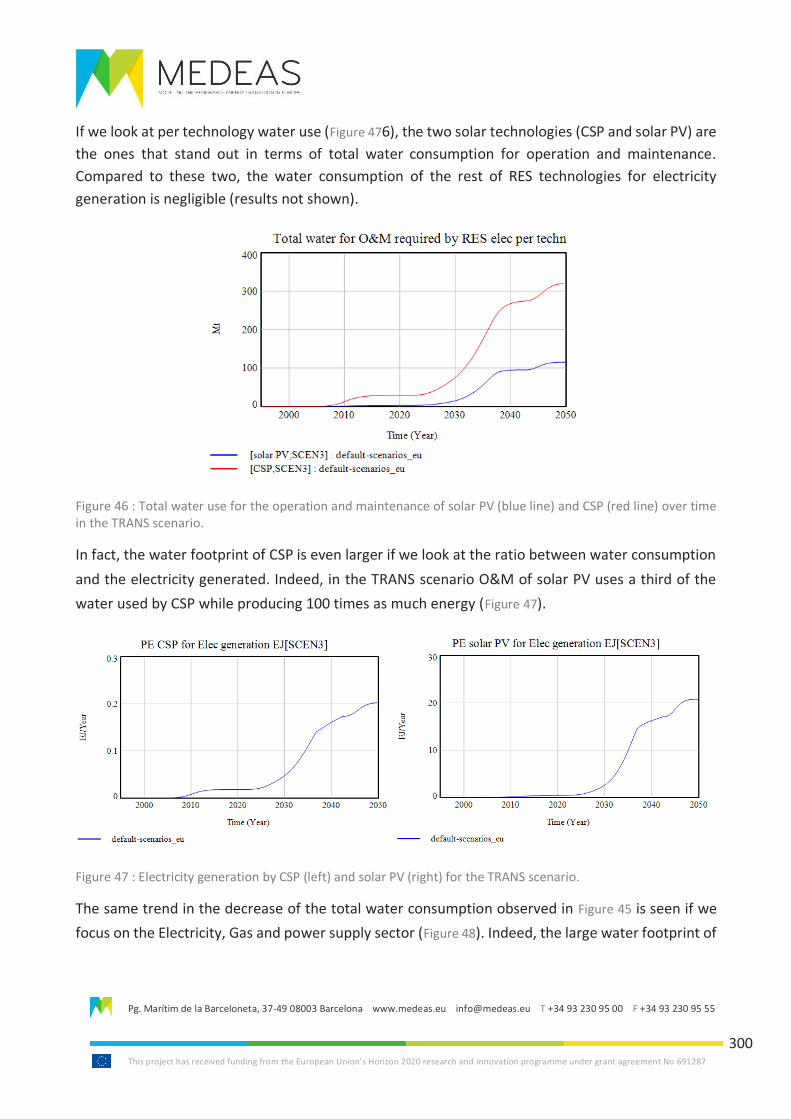
Pg. Marítim de la Barceloneta, 37-49 08003 Barcelona www.medeas.eu [email protected] T +34 93 230 95 00 F +34 93 230 95 55
This project has received funding from the European Union’s Horizon 2020 research and innovation programme under grant agreement No 691287
300
If we look at per technology water use (Figure 476), the two solar technologies (CSP and solar PV) are
the ones that stand out in terms of total water consumption for operation and maintenance.
Compared to these two, the water consumption of the rest of RES technologies for electricity
generation is negligible (results not shown).
Figure 46 : Total water use for the operation and maintenance of solar PV (blue line) and CSP (red line) over time in the TRANS scenario.
In fact, the water footprint of CSP is even larger if we look at the ratio between water consumption
and the electricity generated. Indeed, in the TRANS scenario O&M of solar PV uses a third of the
water used by CSP while producing 100 times as much energy (Figure 47).
Figure 47 : Electricity generation by CSP (left) and solar PV (right) for the TRANS scenario.
The same trend in the decrease of the total water consumption observed in Figure 45 is seen if we
focus on the Electricity, Gas and power supply sector (Figure 48). Indeed, the large water footprint of
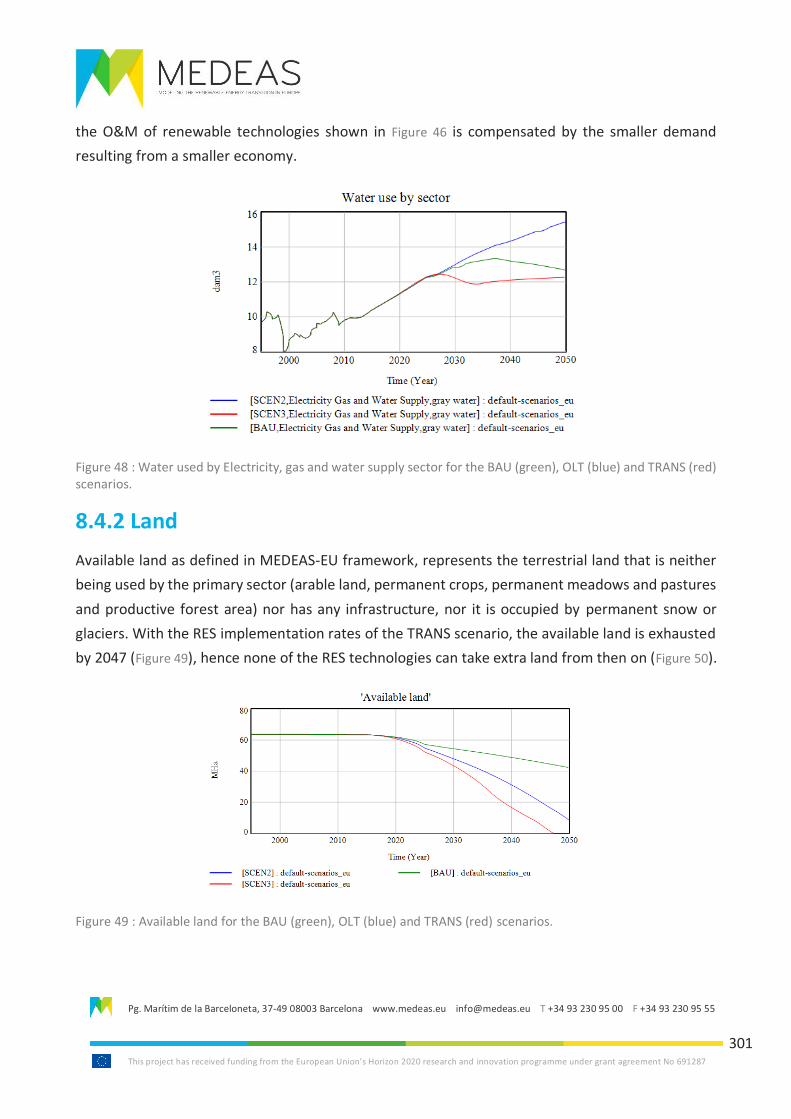
Pg. Marítim de la Barceloneta, 37-49 08003 Barcelona www.medeas.eu [email protected] T +34 93 230 95 00 F +34 93 230 95 55
This project has received funding from the European Union’s Horizon 2020 research and innovation programme under grant agreement No 691287
301
the O&M of renewable technologies shown in Figure 46 is compensated by the smaller demand
resulting from a smaller economy.
Figure 48 : Water used by Electricity, gas and water supply sector for the BAU (green), OLT (blue) and TRANS (red) scenarios.
8.4.2 Land
Available land as defined in MEDEAS-EU framework, represents the terrestrial land that is neither
being used by the primary sector (arable land, permanent crops, permanent meadows and pastures
and productive forest area) nor has any infrastructure, nor it is occupied by permanent snow or
glaciers. With the RES implementation rates of the TRANS scenario, the available land is exhausted
by 2047 (Figure 49), hence none of the RES technologies can take extra land from then on (Figure 50).
Figure 49 : Available land for the BAU (green), OLT (blue) and TRANS (red) scenarios.
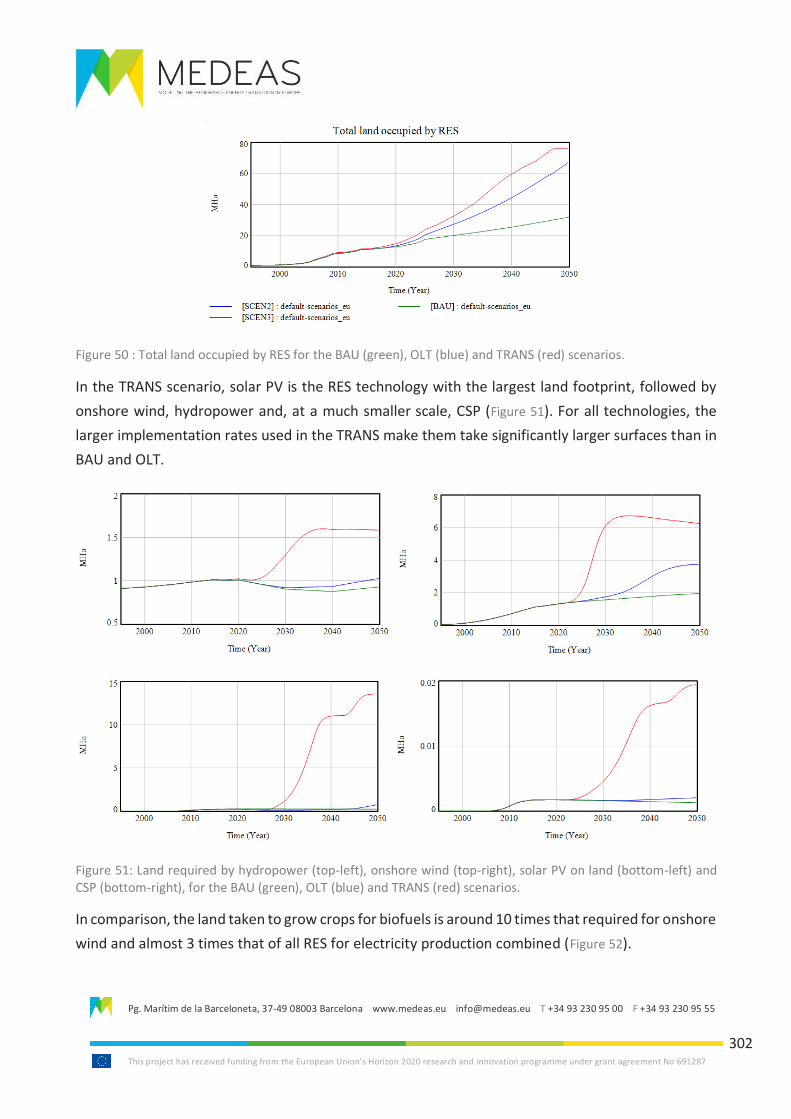
Pg. Marítim de la Barceloneta, 37-49 08003 Barcelona www.medeas.eu [email protected] T +34 93 230 95 00 F +34 93 230 95 55
This project has received funding from the European Union’s Horizon 2020 research and innovation programme under grant agreement No 691287
302
Figure 50 : Total land occupied by RES for the BAU (green), OLT (blue) and TRANS (red) scenarios.
In the TRANS scenario, solar PV is the RES technology with the largest land footprint, followed by
onshore wind, hydropower and, at a much smaller scale, CSP (Figure 51). For all technologies, the
larger implementation rates used in the TRANS make them take significantly larger surfaces than in
BAU and OLT.
Figure 51: Land required by hydropower (top-left), onshore wind (top-right), solar PV on land (bottom-left) and CSP (bottom-right), for the BAU (green), OLT (blue) and TRANS (red) scenarios.
In comparison, the land taken to grow crops for biofuels is around 10 times that required for onshore
wind and almost 3 times that of all RES for electricity production combined (Figure 52).
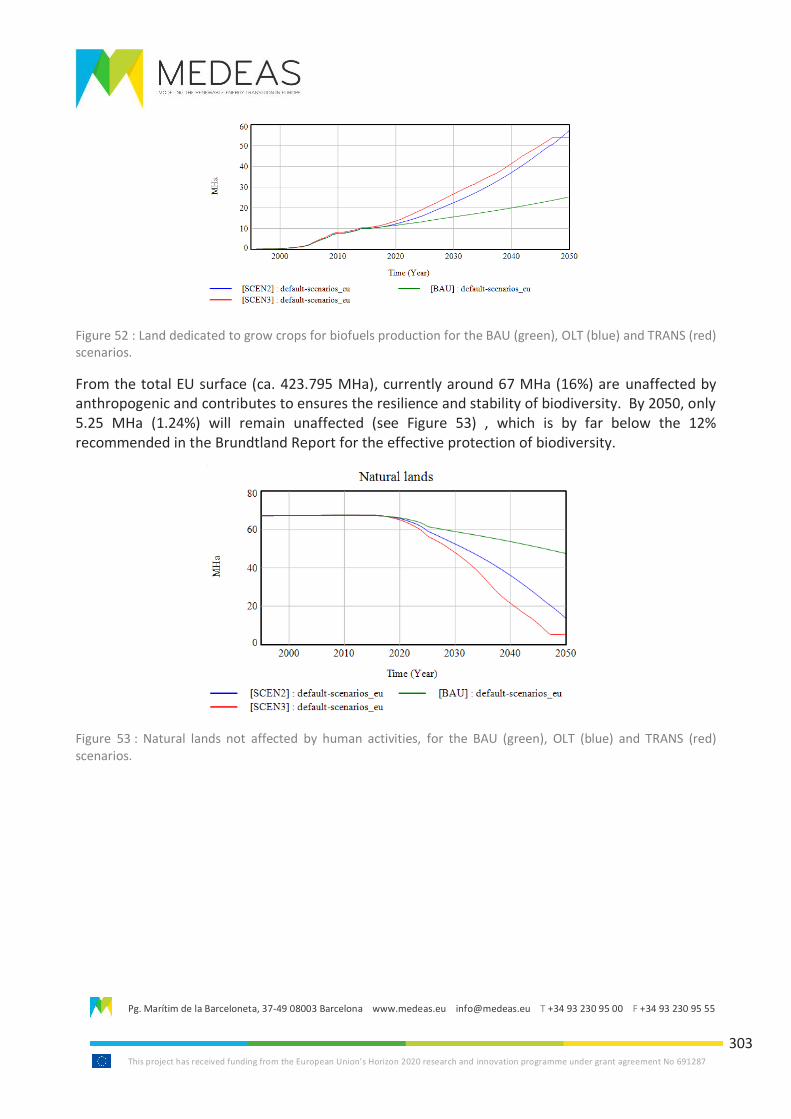
Pg. Marítim de la Barceloneta, 37-49 08003 Barcelona www.medeas.eu [email protected] T +34 93 230 95 00 F +34 93 230 95 55
This project has received funding from the European Union’s Horizon 2020 research and innovation programme under grant agreement No 691287
303
Figure 52 : Land dedicated to grow crops for biofuels production for the BAU (green), OLT (blue) and TRANS (red) scenarios.
From the total EU surface (ca. 423.795 MHa), currently around 67 MHa (16%) are unaffected by anthropogenic and contributes to ensures the resilience and stability of biodiversity. By 2050, only 5.25 MHa (1.24%) will remain unaffected (see Figure 53) , which is by far below the 12% recommended in the Brundtland Report for the effective protection of biodiversity.
Figure 53 : Natural lands not affected by human activities, for the BAU (green), OLT (blue) and TRANS (red) scenarios.
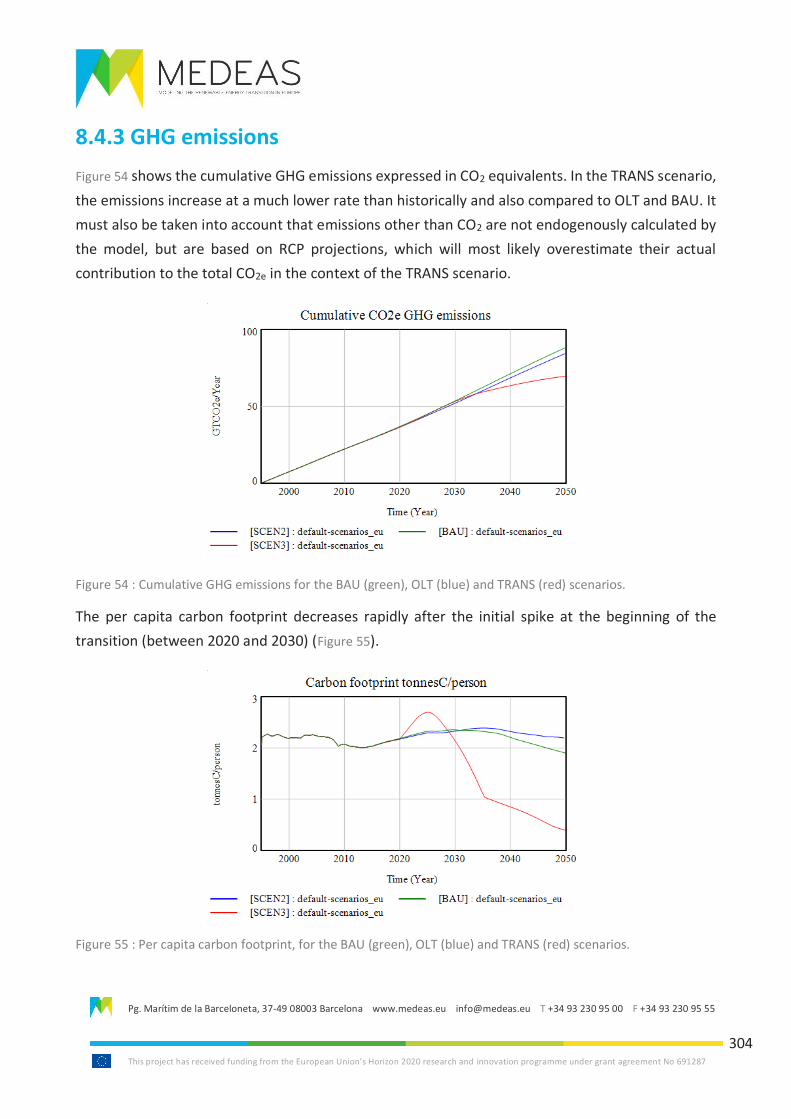
Pg. Marítim de la Barceloneta, 37-49 08003 Barcelona www.medeas.eu [email protected] T +34 93 230 95 00 F +34 93 230 95 55
This project has received funding from the European Union’s Horizon 2020 research and innovation programme under grant agreement No 691287
304
8.4.3 GHG emissions
Figure 54 shows the cumulative GHG emissions expressed in CO2 equivalents. In the TRANS scenario,
the emissions increase at a much lower rate than historically and also compared to OLT and BAU. It
must also be taken into account that emissions other than CO2 are not endogenously calculated by
the model, but are based on RCP projections, which will most likely overestimate their actual
contribution to the total CO2e in the context of the TRANS scenario.
Figure 54 : Cumulative GHG emissions for the BAU (green), OLT (blue) and TRANS (red) scenarios.
The per capita carbon footprint decreases rapidly after the initial spike at the beginning of the
transition (between 2020 and 2030) (Figure 55).
Figure 55 : Per capita carbon footprint, for the BAU (green), OLT (blue) and TRANS (red) scenarios.
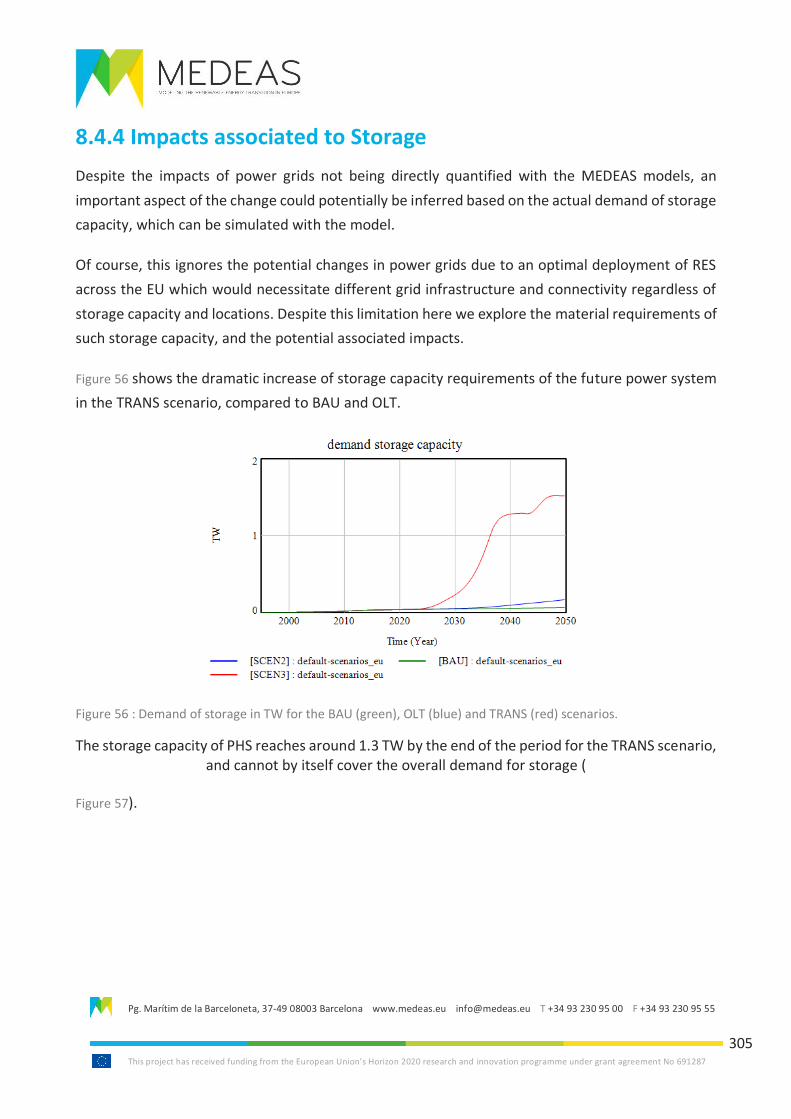
Pg. Marítim de la Barceloneta, 37-49 08003 Barcelona www.medeas.eu [email protected] T +34 93 230 95 00 F +34 93 230 95 55
This project has received funding from the European Union’s Horizon 2020 research and innovation programme under grant agreement No 691287
305
8.4.4 Impacts associated to Storage
Despite the impacts of power grids not being directly quantified with the MEDEAS models, an
important aspect of the change could potentially be inferred based on the actual demand of storage
capacity, which can be simulated with the model.
Of course, this ignores the potential changes in power grids due to an optimal deployment of RES
across the EU which would necessitate different grid infrastructure and connectivity regardless of
storage capacity and locations. Despite this limitation here we explore the material requirements of
such storage capacity, and the potential associated impacts.
Figure 56 shows the dramatic increase of storage capacity requirements of the future power system
in the TRANS scenario, compared to BAU and OLT.
Figure 56 : Demand of storage in TW for the BAU (green), OLT (blue) and TRANS (red) scenarios.
The storage capacity of PHS reaches around 1.3 TW by the end of the period for the TRANS scenario, and cannot by itself cover the overall demand for storage (
Figure 57).
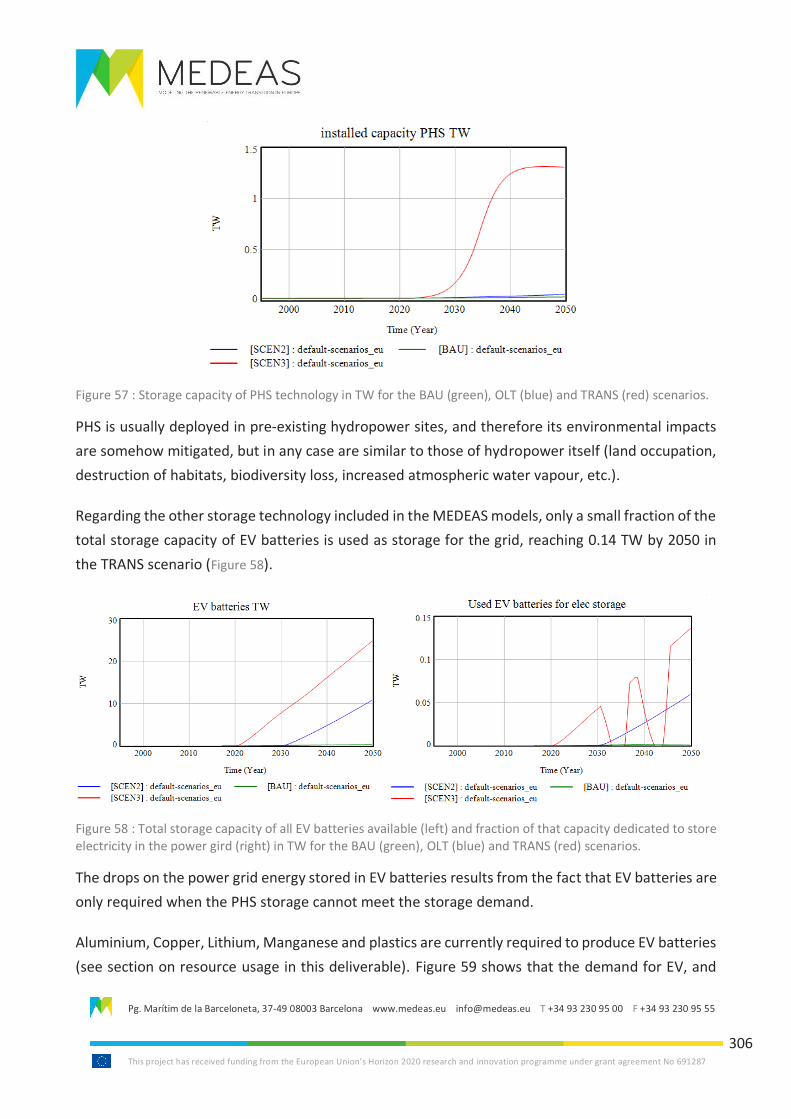
Pg. Marítim de la Barceloneta, 37-49 08003 Barcelona www.medeas.eu [email protected] T +34 93 230 95 00 F +34 93 230 95 55
This project has received funding from the European Union’s Horizon 2020 research and innovation programme under grant agreement No 691287
306
Figure 57 : Storage capacity of PHS technology in TW for the BAU (green), OLT (blue) and TRANS (red) scenarios.
PHS is usually deployed in pre-existing hydropower sites, and therefore its environmental impacts
are somehow mitigated, but in any case are similar to those of hydropower itself (land occupation,
destruction of habitats, biodiversity loss, increased atmospheric water vapour, etc.).
Regarding the other storage technology included in the MEDEAS models, only a small fraction of the
total storage capacity of EV batteries is used as storage for the grid, reaching 0.14 TW by 2050 in
the TRANS scenario (Figure 58).
Figure 58 : Total storage capacity of all EV batteries available (left) and fraction of that capacity dedicated to store electricity in the power gird (right) in TW for the BAU (green), OLT (blue) and TRANS (red) scenarios.
The drops on the power grid energy stored in EV batteries results from the fact that EV batteries are
only required when the PHS storage cannot meet the storage demand.
Aluminium, Copper, Lithium, Manganese and plastics are currently required to produce EV batteries
(see section on resource usage in this deliverable). Figure 59 shows that the demand for EV, and
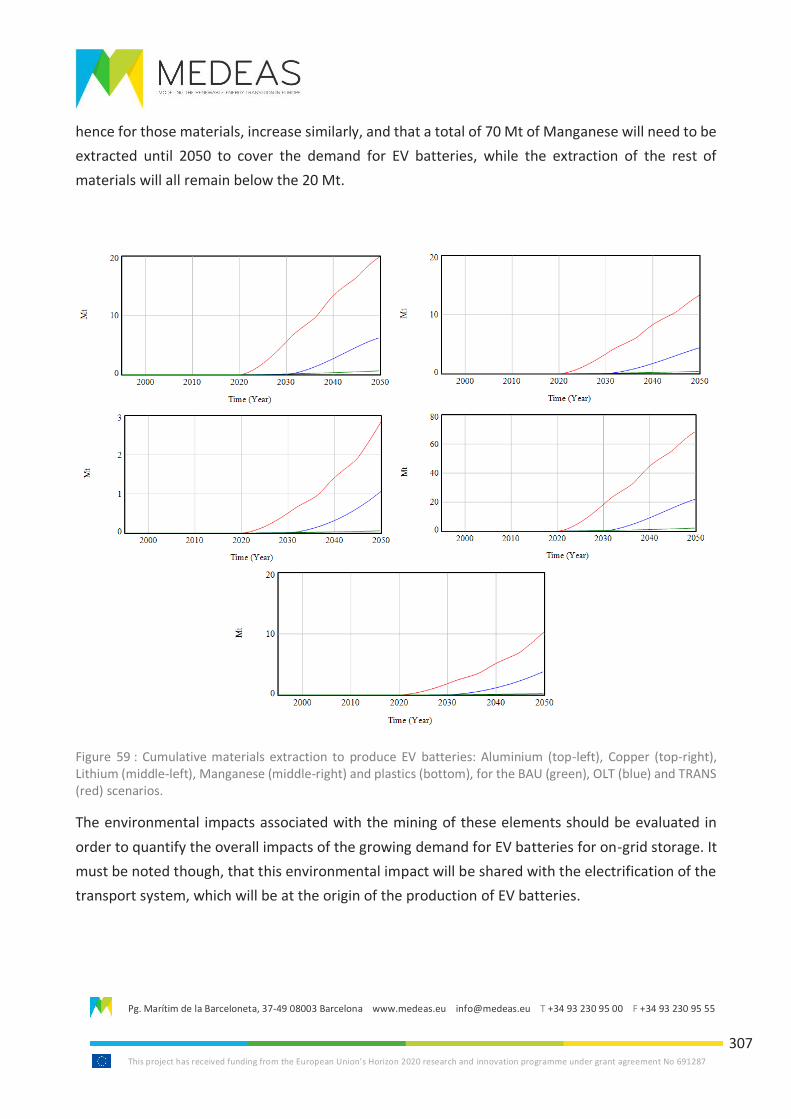
Pg. Marítim de la Barceloneta, 37-49 08003 Barcelona www.medeas.eu [email protected] T +34 93 230 95 00 F +34 93 230 95 55
This project has received funding from the European Union’s Horizon 2020 research and innovation programme under grant agreement No 691287
307
hence for those materials, increase similarly, and that a total of 70 Mt of Manganese will need to be
extracted until 2050 to cover the demand for EV batteries, while the extraction of the rest of
materials will all remain below the 20 Mt.
Figure 59 : Cumulative materials extraction to produce EV batteries: Aluminium (top-left), Copper (top-right), Lithium (middle-left), Manganese (middle-right) and plastics (bottom), for the BAU (green), OLT (blue) and TRANS (red) scenarios.
The environmental impacts associated with the mining of these elements should be evaluated in
order to quantify the overall impacts of the growing demand for EV batteries for on-grid storage. It
must be noted though, that this environmental impact will be shared with the electrification of the
transport system, which will be at the origin of the production of EV batteries.
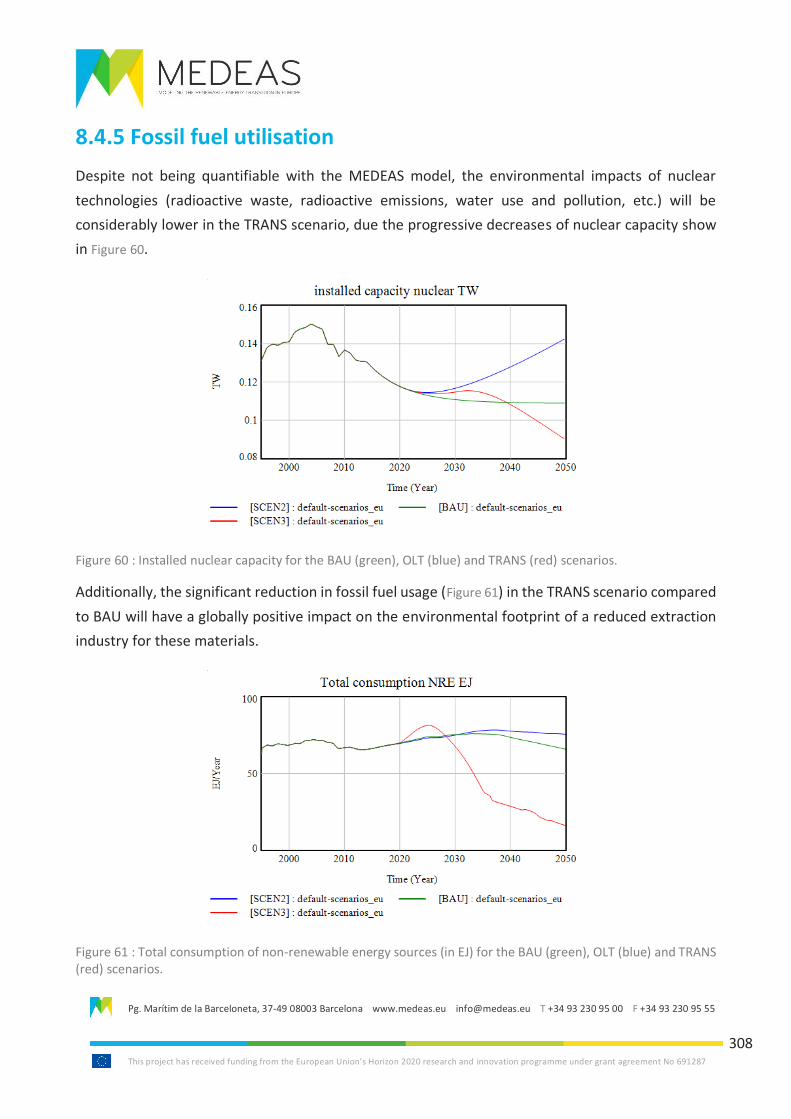
Pg. Marítim de la Barceloneta, 37-49 08003 Barcelona www.medeas.eu [email protected] T +34 93 230 95 00 F +34 93 230 95 55
This project has received funding from the European Union’s Horizon 2020 research and innovation programme under grant agreement No 691287
308
8.4.5 Fossil fuel utilisation
Despite not being quantifiable with the MEDEAS model, the environmental impacts of nuclear
technologies (radioactive waste, radioactive emissions, water use and pollution, etc.) will be
considerably lower in the TRANS scenario, due the progressive decreases of nuclear capacity show
in Figure 60.
Figure 60 : Installed nuclear capacity for the BAU (green), OLT (blue) and TRANS (red) scenarios.
Additionally, the significant reduction in fossil fuel usage (Figure 61) in the TRANS scenario compared
to BAU will have a globally positive impact on the environmental footprint of a reduced extraction
industry for these materials.
Figure 61 : Total consumption of non-renewable energy sources (in EJ) for the BAU (green), OLT (blue) and TRANS (red) scenarios.

Pg. Marítim de la Barceloneta, 37-49 08003 Barcelona www.medeas.eu [email protected] T +34 93 230 95 00 F +34 93 230 95 55
This project has received funding from the European Union’s Horizon 2020 research and innovation programme under grant agreement No 691287
309
In addition, the transport infrastructure that would be required for a fossil fuel power sector
including gas and oil pipelines and shipping for oil and coal will be significantly reduced.
Pg. Marítim de la Barceloneta, 37-49 08003 Barcelona www.medeas.eu [email protected] T +34 93 230 95 00 F +34 93 230 95 55
This project has received funding from the European Union’s Horizon 2020 research and innovation programme under grant agreement No 691287
310
8.5 Discussion
8.5.1 Identification of impacts from the literature
As for most new infrastructures, the construction phase of RE infrastructure is generally where most
impacts occur due mostly to habitat degradation/loss (e.g. land occupation, land grading, vegetation
clearing, soil compaction), noise, dust and GHG emissions and sediment resuspension and chemical
pollution in marine environments. Hydropower, especially large-scale high-head storage projects in
pristine environments have the highest impact on land and biodiversity as a result of the large
impoundments. The installation of transmission and distribution lines alter ecosystems in a
generally narrow but long linear area below (for overhead cables) or above (for underground cables)
the cable and along their path (RoW), both in marine and terrestrial environments. Buried cables
tend to generate more impacts than overhead cables or laid out cables in marine environments. In
contrast to CSP, solar panels installations can be distributed and installed on roof-tops, reducing the
land requirements.
The manufacturing of solar panels and batteries requires the extraction of materials that may be
scarce, hazardous and/or toxic. The construction of infrastructure in marine environments, including
offshore wind farms, produce degradation of benthic ecosystems and different types of underwater
noises. Vegetation clearing and land use changes are responsible for most part of the GHG emissions
of all technologies, but more especially for the production of crops for biofuels.
The operation phase has effects on biodiversity, mostly negative (behavioural changes, increased
mortality by collision, by burns from concentrated light beams and by electrocution, increased risk
of entanglement, noise emissions, electromagnetic fields, barrier effect, corridor effect, etc.), but
also positive (e.g. reserve effect, reef effect, increase of number of prays for predators, etc.).
Except for hydropower reservoirs, geothermal plants and biofuels, the rest produce negligible GHG
emissions during operation, if any. Changes in air temperature and humidity have been observed
around all the considered infrastructures, but hydropower reservoirs have the biggest impact on
both parameters. Shadowing effect and flickering are known effects of solar and wind turbines,
respectively, generally causing minor issues.
Despite all infrastructures account for deaths of birds and bats by collision, most studies on birth
deaths resulting from the interaction with RES technologies have been made for wind energy
(mostly onshore, but also offshore). Results of those studies generally indicate an increase of birth
and bat deaths around wind power plants, but tend to reduce the incidence in comparison to deaths
Pg. Marítim de la Barceloneta, 37-49 08003 Barcelona www.medeas.eu [email protected] T +34 93 230 95 00 F +34 93 230 95 55
This project has received funding from the European Union’s Horizon 2020 research and innovation programme under grant agreement No 691287
311
related by other anthropogenic factors (e.g. collisions with cars, predation by cats, etc.). Some
studies also claim that offshore wind farms, as well as other marine infrastructures (especially those
installed near the coasts), may affect migratory patterns of certain species of birds. Judging by the
widespread geographical distribution, power lines would seem to be responsible for more deaths
of birds and bats (by electrocution) than wind turbines. The concentrated beam of light in CSP
installations has also been made responsible for some bird deaths.
The irrigation of crops for biofuels corresponds to the largest water consumption along the lifecycle
of this technology, although some water is used also in the processing of crops to produce the liquid
fuels. Large volumes of water are also lost by evaporation from hydropower reservoirs. CSP also
uses a lot of water to clear reflective surfaces. Pollution of water in solar power plants may result
from the use of herbicides, dust suppressants and dielectric fluids.
Geothermal power plants also use water (both as the working fluid and for cooling), but water is
generally re-injected. Geothermal power plants, especially those not using closed-loops may emit
air and water pollutants, including H2S and Hg. Land subsidence is present in almost all geothermal
plants and landslides and induced seismicity due to re-injection have also been reported.
Certain agricultural practices used in the production of crops for biofuels also produce degradation
of the soil (during plowing, harvesting and through removal of SOC) and the pollution and
eutrophication of water bodies (pesticides, fertilisers, herbicides). Closed or hybrid-cycle OTEC
technologies may pollute marine water through potential leakages of the working fluid (generally
ammonia), and increase the nutrients concentrations on shallow waters (which are usually in higher
concentrations in cold deep waters), with unknown consequences. Salinity gradient power may a
have similar homogenising effects. Toxic leakages may also occur during the operation of batteries.
During operation, especially T & D and solar power plants require the clearing of vegetation (either
manually, with machinery or using herbicides) to avoid interference with the cables and reflective
surfaces, respectively.
Hydropower is the only renewable energy source that produces environmental impacts away from
the production site, since the presence of dams reduces the input of sediments to deltaic
environments. The dams used for hydropower and in tidal barrages produce similar negative effects
on biodiversity.
EMF and noises during the operation phase are produced especially by HVDC cables (both terrestrial
and submarine) and also by wind turbines, and their effects on biodiversity are still quite unknown.
Pg. Marítim de la Barceloneta, 37-49 08003 Barcelona www.medeas.eu [email protected] T +34 93 230 95 00 F +34 93 230 95 55
This project has received funding from the European Union’s Horizon 2020 research and innovation programme under grant agreement No 691287
312
The decommissioning of any infrastructure will result in negative impacts (similar but less intense
than those of the installation phase). Impacts will be minimised by the recycling of building materials
and by the restoration of the affected environments.
8.5.2 Simulation results
8.5.2.1 Model limitations
For the modelling study, we did not distinguish the impacts between the different stages of the life
cycle of RES technologies (construction, operation and decommission phases) but the impacts along
their life cycle were analysed altogether. The impacts of the electrification of all sectors, except for
a partial evaluation in the case of the inland transport sector, were not estimated.
The module on Energy and infrastructures of the MEDEAS models takes into account the technology
to generate (RES power plants) and store (PHS and EV batteries) electricity, while the transmission
lines are not simulated. Therefore, the environmental impacts associated with power grid
development cannot be simulated.
The categories of environmental impacts evaluated in the simulation study include land use
changes, water consumption and GHG emissions. The volume of activities that result in indirect
environmental impacts are also quantified. However, impacts such as land degradation, biodiversity
loss, noise and visual impacts, pollution of water and air cannot be evaluated with the current
version of the MEDEAS models.
In the MEDEAS models the land requirements of the different RE technologies are evaluated in four
groups: 1) marginal land required for biofuels, 2) land dedicated to grow crops for biofuels, 3) land
required by RES not allowing multiple land uses (CSP, PV on land and hydropower) and 4) land
required by onshore wind. Apart from the direct land occupation from power plants, the remaining
natural land, which corresponds to the remaining land not impacted by anthropogenic action, can
also be quantified. Although in the current work no further discussion is made around the remaining
natural land, it could be used to explore the impacts of RES on biodiversity and habitat
fragmentation in future versions of the model. However, it would be important to consider RES
deployment strategies that are commensurate with increasing biodiversity.
The consumption of three types of water is endogenously calculated by the model: rainfall/soil
moisture (green), surface/groundwater (blue), and fresh water required for assimilation of
pollutants (grey). In the model, water is consumed by Households, by the Agriculture, Hunting,
Pg. Marítim de la Barceloneta, 37-49 08003 Barcelona www.medeas.eu [email protected] T +34 93 230 95 00 F +34 93 230 95 55
This project has received funding from the European Union’s Horizon 2020 research and innovation programme under grant agreement No 691287
313
Forestry and Fishing sector and by O&M of supply technologies, and their specific demand is
estimated through previously defined water intensities for each of them. However, only solar PV,
CSP, wind onshore and wind offshore are included, while the water consumption by hydropower
and that of growing crops for biofuels production is not considered in the model.
The only two storage technologies included in the MEDEAS models are EV batteries and PHS.
Although in the TRANS scenario the techno-ecological potential of PHS was increased to tackle this
limitation and increase the overall storage capacity, future versions of the MEDEAS models should
consider the inclusion of other storage technologies, such as: power to gas, compressed air storage,
thermal energy storage, hydrogen production from electrolysis, and others.
The water consumed by energy crops, despite being the main contributor to the water-energy nexus
(Galan-del-Castillo and Velazquez, 2010; Rio Carrillo and Frei, 2009), cannot be estimated with the
model. Rio Carrillo and Frei, (2009) estimated the water footprint of different energy types, and
found that growing biomass for biofuels has a water footprint of 6.63 m3/MWh, while those of the
production process of bioethanol and biodiesel are 608 and 816 m3/ktoe, respectively. Similarly,
the MEDEAS models do not allow the estimation of the water used by hydropower, and in the study
cited before, the water withdrawal by hydropower was estimated to be of 792 m3/MWh, and
despite the consumption for electricity generation being relatively low (20 m3/MWh). The authors
argue that the large amounts of water evaporated from the surface of the reservoirs where it is
stored should be added to compute the total water footprint of this technology.
According to the previous discussion, we can conclude that at the current state of development the
MEDEAS models are still not able to provide deep insights in the water-energy-food nexus, which is
a subject of intense debate in literature (Endo et al., 2017).
The direct environmental impacts of storage technologies could not be evaluated with the current
version of the model either. Indeed, the environmental impacts of PHS are intrinsically related to
those of hydropower and could not be evaluated individually, and the main impacts associated with
EV batteries come from the mining of the required materials, which cannot be simulated either.
Indeed, the impact of mining from fossil fuels is also beyond the scope of the MEDEAS model and is
required to examine the counterfactual of a business as usual (BAU) scenario. Nevertheless, the
model allowed the quantification of both the required storage capacity for the future power system
(ca 1.4 TW by 2050) and the amount of materials needed to build the EV batteries to electrify the
entire inland transport sector of the future (if the material footprint of EV battery technology does
not change over time). The first result could potentially be used to quantify the associated impacts
of the future storage capacity system, considering different combinations of storage technologies.
Pg. Marítim de la Barceloneta, 37-49 08003 Barcelona www.medeas.eu [email protected] T +34 93 230 95 00 F +34 93 230 95 55
This project has received funding from the European Union’s Horizon 2020 research and innovation programme under grant agreement No 691287
314
The total amount of materials required to build EV batteries, could also be used to evaluate the
environmental impacts of the extraction process, including air and water pollution, GHG emissions,
noise, destruction of habitats and loss of biodiversity and visual impacts. In the current simulation,
PHS was the major source of storage capacity, while EV batteries represented only a small fraction
of the total.
8.5.2.2 Quantification of impacts
The emissions of N2O, PFC HFC, SF6 and CH4 are not endogenously calculated by the model but are
obtained from RCP projections, and therefore such results are not interpreted in this work. CO2
emissions in the MEDEAS models are considered to originate from the following sources: land use
changes and forestry, biomass, peat and from burning fossil fuels.
Results of the simulation indicate that the available land for RES installation was exhausted by 2047
in the TRANS scenario, halting any further development of RES technologies. By the end of the
simulated period, the land not affected by human activity accounted for less than 2% of the total
surface of the EU. The RES technology with the highest land footprint were the biofuels produced
from crops, which took as much as 3 times the land of all RES technologies for electricity generation
combined. Among those technologies, solar PV and wind onshore were the two with the highest
land footprint.
Simulation results also show that the overall water consumption decreases in the TRANS scenario,
mainly due to the stabilisation of the economy, that decreases overall demand. Solar PV and CSP
were found to be the most water-intensive RES technologies for electricity generation, and the
water demand for O&M of CSP was found to be much larger than that of solar PV, especially when
referring to the amount of energy produced by each.
In the TRANS scenario the rate of the emissions almost reached zero by the end of the simulated
period. As mentioned earlier, emissions other than CO2 are obtained from projections (RCP) and are
certainly overestimating the actual emissions of a scenario such as TRANS. Results of the simulation
indicate that the transition would cause a spike in CO2 emissions at the beginning (between 2020
and 2030), but once that initial phase would be overcome, emissions would become progressively
lower for the TRANS scenario with respect to those of the BAU and OLT scenarios.
Although the impacts of nuclear power generation could not be directly evaluated with the model,
the progressively smaller installed capacity was shown to exemplify the reduction of the impacts

Pg. Marítim de la Barceloneta, 37-49 08003 Barcelona www.medeas.eu [email protected] T +34 93 230 95 00 F +34 93 230 95 55
This project has received funding from the European Union’s Horizon 2020 research and innovation programme under grant agreement No 691287
315
associated to nuclear energy: those linked to the extraction of uranium, water withdrawal and
consumption, radioactive waste and emissions, as well as GHG emissions.
Pg. Marítim de la Barceloneta, 37-49 08003 Barcelona www.medeas.eu [email protected] T +34 93 230 95 00 F +34 93 230 95 55
This project has received funding from the European Union’s Horizon 2020 research and innovation programme under grant agreement No 691287
316
8.6 Conclusions
Some of the technologies described (third generation biofuels, storage technologies most marine
energy except for tidal barrages and offshore wind) are still in the development phase and
commercially available. Their impacts are therefore quite unknown.
For all new infrastructures, impacts will be decreased if the new infrastructure is built in already
degraded landscapes or close to urban areas. The same is true for the plantation of crops for
biofuels, which will be less damaging for the environment when produced in marginal lands
(although the yields will also decrease).
The frameworks to evaluate environmental impacts of these new technologies are also being
developed. For instance, it is difficult to quantify the impacts of marine technologies on biodiversity
since baseline data of biodiversity in seawater is scarce.
Among all reviewed technologies, hydropower and biofuels (especially the first generation) account
for the highest environmental externalities.
Although it escapes from the scope of the current work, it is worth noting that in order for all
economic sectors to shift from non-renewable energies to renewable electricity (and other fuels
produced from it), a process of electrification (termed RE-electrification by IRENA and State Grid
Corporation of China, 2019) is required. Despite some early works (Mills, 1991), the main literature
on this topic started to become available in very recent years, but so far most studies are focused
on identifying approaches, potential costs and barriers and less often on evaluating the associated
environmental impacts (Deason et al., 2018; European Commission, 2017; García-Olivares, 2015;
García-Olivares et al., 2018; IRENA and State Grid Corporation of China, 2019; Jadun et al., 2017;
McMillan, 2018; Philibert, 2019; Singh and Strømman, 2013). Many focus on the electrification of
the overall industrial sector, households and buildings, the power sector, but the electrification of
the transport sector has been the preferred subject so far.
Pg. Marítim de la Barceloneta, 37-49 08003 Barcelona www.medeas.eu [email protected] T +34 93 230 95 00 F +34 93 230 95 55
This project has received funding from the European Union’s Horizon 2020 research and innovation programme under grant agreement No 691287
317
8.7 References
Abbasi, S.A. and Abbasi, N., 2000. The likely adverse environmental impacts of renewable energy
sources. Applied Energy. 65 (1-4): 121-144.
Abbasi, T. (Tasneem), and Abbasi, S. A., 2010. Biomass energy and the environmental impacts
associated with its production and utilization. Renewable and Sustainable Energy Reviews. 14 (3):
919-937.
Abbasi, T. (Tabassum); Premalatha, M., Abbasi, T. (Tasneem) and Abbasi, S.A., 2014. Wind energy:
Increasing deployment, rising environmental concerns. Renewable and Sustainable Energy Reviews.
31: 270-288.
Achkari, O. and Fadar, A., 2018. Renewable Energy Storage Technologies- A Review. Paper presented
at 6ème Conférence Internationale en Automatique & Traitement de Signal (ATS-2018). Proceedings
of Engineering & Technology Journal. 35: 69–79.
Akinyele, D.O. and Rayudu, R.K., 2014. Review of energy storage technologies for sustainable power
networks. Sustainable Energy Technologies and Assessments. 8: 74-91.
Aneke, M. and Wang, M., 2016. Energy storage technologies and real life applications–A state of the
art review. Applied Energy. 179: 350-377.
Arciniegas, L.M. and Hittinger, E., 2018. Tradeoffs between revenue and emissions in energy storage
operation. Energy. 143: 1–11.
Ardelean, M. and Minnebo, P., 2015. HVDC Submarine Power Cables in the World. European
Commission Joint Research Centre. Joint Research Centre Technical Reports. Luxembourg:
Publications Office of the European Union.
Axtmann, R.C., 1975. Environmental impact of a geothermal power plant. Science. 187 (4179): 795-
803.
Baerwald, E.F., D’Amours, G.H., Klug, B.J., Barclay, R.M.R., 2008. Barotrauma is a significant cause of
bat fatalities at wind turbines. Current Biology. 18: R695–R696.
Balakrishnan, A., Brutsch, E., Jamis, A., Reyes, W., Strutner, M., Reyes, W., 2018. The Environmental
Impacts of Utility-Scale Battery Storage in California. Group Project of Masters students in the MA
Environmental Science & Management course at University of California - Santa Barbara.
Baring-Gould, E., Christol, C., LiVecchi, A., Kramer, S., West, A., 2015. A Review of the Environmental
Impacts for Marine and Hydrokinetic Projects to Inform Regulatory Permitting. Summary Findings
Pg. Marítim de la Barceloneta, 37-49 08003 Barcelona www.medeas.eu [email protected] T +34 93 230 95 00 F +34 93 230 95 55
This project has received funding from the European Union’s Horizon 2020 research and innovation programme under grant agreement No 691287
318
from the 2015 Workshop on Marine and Hydrokinetic Technologies. US Department of Energy, Office
of Scientific and Technical Information. Washington, D.C.
Barros, N., Cole, J.J., Tranvik, L.J., Prairie, Y.T., Bastviken, D., Huszar, V.L.M., del Giorgio, P., Roland,
F., 2011. Carbon emission from hydroelectric reservoirs linked to reservoir age and latitude. Nature:
Geoscience. 4 (9): 593–596.
Bernardino, J., Bevanger, K., Barrientos, R., Dwyer, J.F., Marques, A.T., Martins, R.C., Shaw, J.M.,
Silva, J.P., Moreira, F., 2018. Bird collisions with power lines: State of the art and priority areas for
research. Biological Conservation. 222: 1–13.
Biasotto, L.D. and Kindel, A., 2018. Power lines and impacts on biodiversity: A systematic review.
Environmental Impact Assessment Review. 71: 110–119.
Boehlert, G. W. and Gill, A. B., 2010. Environmental and ecological effects of ocean renewable
energy development: a current synthesis. Oceanography. 23 (2): 68-81.
Borras, S.M., McMichael, P., Scoones, I., 2010. The politics of biofuels, land and agrarian change:
editors’ introduction. Journal of Peasant Studies. 37: 575–592.
Bravi, M. and Basosi, R., 2014. Environmental impact of electricity from selected geothermal power
plants in Italy. Journal of Cleaner Production. 66: 301–308.
Chen, H., Cong, T.N., Yang, W., Tan, C., Li, Y., Ding, Y., 2009. Progress in electrical energy storage
system: A critical review. Progress in Natural Science. 19: 291–312.
D’Amico, M., Catry, I., Martins, R.C., Ascensão, F., Barrientos, R., Moreira, F., 2018. Bird on the wire:
Landscape planning considering costs and benefits for bird populations coexisting with power lines.
Ambio. 47: 650–656.
Dai, K., Bergot, A., Liang, C., Xiang, W.-N., Huang, Z., 2015. Environmental issues associated with
wind energy – A review. Renewable Energy. 75: 911–921.
Deason, J., Wei, M., Leventis, G., Smith, S., Schwartz, L., March 2018. Electrification of buildings and
industry in the United States. Lawrence Berkeley National Laboratory.
https://escholarship.org/content/qt8qz0n90q/qt8qz0n90q.pdf
Dehghani-Sanij, A.R., Tharumalingam, E., Dusseault, M.B., Fraser, R., 2019. Study of energy storage
systems and environmental challenges of batteries. Renewable and Sustainable Energy Reviews.
104: 192–208.
Demirbas, A., 2009. Political, economic and environmental impacts of biofuels: A review. Applied
Energy. 86: S108-S117.
Pg. Marítim de la Barceloneta, 37-49 08003 Barcelona www.medeas.eu [email protected] T +34 93 230 95 00 F +34 93 230 95 55
This project has received funding from the European Union’s Horizon 2020 research and innovation programme under grant agreement No 691287
319
Demirbaş, A., 2005. Biomass co-firing for boilers associated with environmental impacts. Energy
Sources. 27: 1385–1396.
DiPippo, R., 2008. Environmental Impact of Geothermal Power Plants, in: DiPippo, R. Geothermal
Power Plants. Elsevier. 385–410.
Dunn, J.B., Mueller, S., Kwon, H.Y., Wang, M.Q., 2013. Land-use change and greenhouse gas
emissions from corn and cellulosic ethanol. Biotechnology for Biofuels. 51: 281–307.
European Commission, 2018. Guidance on Energy Transmission Infrastructure and EU nature
legislation.https://ec.europa.eu/environment/nature/natura2000/management/docs/Energy%20
guidance%20and%20EU%20Nature%20legislation.pdf
Endo, A., Tsurita, I., Burnett, K., Orencio, P.M., 2017. A review of the current state of research on
the water, energy, and food nexus. Journal of Hydrology: Regional Studies. 11: 20–30.
Esteban, M. and Leary, D., 2012. Current developments and future prospects of offshore wind and
ocean energy. Applied Energy. 90: 128–136.
European Commission, DG Research & Innovation - Transport: Surface Transport. Expert Group
Report. 2017. Electrification of the Transport System: Studies and Reports 1–49.
https://ec.europa.eu/programmes/horizon2020/en/news/electrification-transport-system-expert-
group-report-0
Evans, A., Strezov, V., Evans, T.J., 2012. Assessment of utility energy storage options for increased
renewable energy penetration. Renewable and Sustainable Energy Review. 16: 4141–4147.
FAO. 2008. The State of Food and Agriculture 2008: Biofuels: Prospects, Risks and Opportunities.
Food and Agriculture Organization of the United Nations. Rome. 128 pp. [Available at:
http://www.fao.org/3/i0100e/i0100e00.htm]
Florin, N., Dominish, E., 2017. Sustainability evaluation of energy storage technologies. Report
prepared by the Institute for Sustainable Futures for the Australian Council of Learned Academies.
Institute for Sustainable Futures, University of Sidney.
Fthenakis, V., 2009. Sustainability of photovoltaics: The case for thin-film solar cells. Renewable and
Sustainable Energy Reviews. 13 (9): 2746-2750.
Fthenakis, V, Hyung, C.K., Alsema, E., 2008. Emissions from photovoltaic life cycles. Environmental
Science & Technology. 42 (6): 2168–2174.
Galan-del-Castillo, E., Velazquez, E., 2010. From water to energy: The virtual water content and
water footprint of biofuel consumption in Spain. Energy Policy. 38: 1345–1352.
Pg. Marítim de la Barceloneta, 37-49 08003 Barcelona www.medeas.eu [email protected] T +34 93 230 95 00 F +34 93 230 95 55
This project has received funding from the European Union’s Horizon 2020 research and innovation programme under grant agreement No 691287
320
Ganjehsarabi, H., Dincer, I., Gungor, A., 2013. Exergy analysis and environmental impact assessment
of a geothermal power plant, in: Dincer, I., Colpan, C.O. and Kadioglu, F. (eds). Causes, Impacts and
Solutions to Global Warming. Springer: New York, pp. 825–837.
García-Olivares, A., 2015. Substitutability of electricity and renewable materials for fossil fuels in a
post-carbon economy. Energies. 8: 13308–13343.
García-Olivares, A., Solé, J., Osychenko, O., 2018. Transportation in a 100% renewable energy
system. Energy Conversion and Management. 158: 266–285.
Gargiulo, A., Girardi, P., Temporelli, A., 2017. LCA of electricity networks: a review. International
Journal of Life Cycle Assessment. 22: 1502–1513.
Gasparatos, A., Doll, C.N.H., Esteban, M., Ahmed, A., Olang, T.A., 2017. Renewable energy and
biodiversity: Implications for transitioning to a Green Economy. Renewable and Sustainable Energy
Review. 70: 161–184.
Gibson, L., Wilman, E.N., Laurance, W.F., 2017. How Green is ‘Green’ Energy? Trends in Ecology and
Evolution. 32 (12): 922–935.
Girardi, P., Maran, S. and Brambilla, C., 2012. The external costs evaluation for power transmission
lines: Focus of overhead lines. Water and Energy International. 69 (7): 62-63.
Goel, V., Bhat, I.K. and Prakash, R., 2009. LCA of renewable energy for electricity generation
systems—a review. Renewable and Sustainable Energy Reviews, 13 (5): 1067-1073
Greaves, D., Conley, D., Magagna, D., Aires, E., Chambel Leitão, J., Witt, M., Embling, C.B., Godley,
B.J., Bicknell, A.W.J., Saulnier, J.B., Simas, T., O’Hagan, A.M., O’Callaghan, J., Holmes, B., Sundberg,
J., Torre-Enciso, Y., Marina, D., 2016. Environmental Impact Assessment: Gathering experiences
from wave energy test centres in Europe. International Journal of Marine Energy. 14: 68–79.
Guney, M.S., Tepe, Y., 2017. Classification and assessment of energy storage systems. Renewable
and Sustainable Energy Reviews. 75: 1187–1197.
Hammar, L., Gullström, M., Dahlgren, T.G., Asplund, M.E., Goncalves, I.B., Molander, S., 2017.
Introducing ocean energy industries to a busy marine environment. Renewable and Sustainable
Energy Reviews. 74: 178–185.
Hernandez, R.R.R., Easter, S.B.B., Murphy-Mariscal, M.L.L., Maestre, F.T.T., Tavassoli, M., Allen,
E.B.B., Barrows, C.W.W., Belnap, J., Ochoa-Hueso, R., Ravi, S., Allen, M.F.F., 2014. Environmental
impacts of utility-scale solar energy, Renewable and Sustainable Energy Reviews. 29: 766-779.
Pg. Marítim de la Barceloneta, 37-49 08003 Barcelona www.medeas.eu [email protected] T +34 93 230 95 00 F +34 93 230 95 55
This project has received funding from the European Union’s Horizon 2020 research and innovation programme under grant agreement No 691287
321
Hittinger, E.S., Azevedo, I.M.L., 2015. Bulk Energy Storage Increases United States Electricity System
Emissions. Environmental Science & Technology. 49: 3203–3210.
Horner, R.M., Clark, C.E., 2013. Characterizing variability and reducing uncertainty in estimates of
solar land use energy intensity. Renewable and Sustainable Energy Reviews. 23: 129–137.
IEA (International Energy Agency), 2017. Technology Roadmap: Delivering Sustainable Bioenergy.
IEA Publ. 94. https://www.ieabioenergy.com/wp-
content/uploads/2017/11/Technology_Roadmap_Delivering_Sustainable_Bioenergy.pdf
IEC (International Electrical Commission), 2011. Electrical Energy Storage, White Paper.
https://www.iec.ch/whitepaper/energystorage/
Inger, R., Attrill, M.J., Bearhop, S., Broderick, A.C., James Grecian, W., Hodgson, D.J., Mills, C.,
Sheehan, E., Votier, S.C., Witt, M.J., Godley, B.J., 2009. Marine renewable energy: Potential benefits
to biodiversity? An urgent call for research. Journal of Applied Ecology. 46 (6): 1145-1153.
IRENA, 2016. Roadmap for a renewable energy future.
https://www.irena.org/publications/2016/Mar/REmap-Roadmap-for-A-Renewable-Energy-
Future-2016-Edition
IRENA, 2014a. Tidal energy: technology brief.
https://www.irena.org/documentdownloads/publications/tidal_energy_v4_web.pdf
IRENA, 2014b. Wave energy: technology brief.
https://www.irena.org/documentdownloads/publications/wave-energy_v4_web.pdf
IRENA, 2014c. Ocean Thermal Energy Conversion: technology brief.
https://www.irena.org/publications/2014/Jun/Ocean-Thermal-Energy-Conversion
IRENA, 2014d. Salinity Gradient Energy Conversion: technology brief.
https://www.irena.org/documentdownloads/publications/salinity_energy_v4_web.pdf
IRENA, State Grid Corporation of China, 2019. Electrification with Renewables: Driving the
transformation of energy services. https://www.irena.org/-
/media/Files/IRENA/Agency/Publication/2019/Jan/IRENA_RE-
Electrification_SGCC_2019_preview.pdf
ITRE (European Parliament's committee on Industry, Research and Energy), 2008. Outlook for
Energy Storage Technologies. Authors: Naish, C., McCubbin, I., Edberg, O. and Harfoot, M. (AEA
Group).
Pg. Marítim de la Barceloneta, 37-49 08003 Barcelona www.medeas.eu [email protected] T +34 93 230 95 00 F +34 93 230 95 55
This project has received funding from the European Union’s Horizon 2020 research and innovation programme under grant agreement No 691287
322
http://www.europarl.europa.eu/document/activities/cont/201109/20110906ATT26009/2011090
6ATT26009EN.pdf
Jadun, P., McMillan, C., Steinberg, D., Muratori, M., Vimmerstedt, L., Mai, T., 2017. Electrification
Futures Study : End-Use Electric Technology Cost and Performance Projections through 2050. Golden
(Colorado). US National Renewable Energy Laboratory.
Jeswani, H.K., Azapagic, A., 2016. Assessing the environmental sustainability of energy recovery
from municipal solid waste in the UK. Waste Management. 50: 346–363.
Jorge, R.S., Hawkins, T.R., Hertwich, E.G., 2012. Life cycle assessment of electricity transmission and
distribution-part 1: Power lines and cables. International Journal of Life Cycle Assessments. 17: 9–
15.
Kar, T. and Keles, S., 2016. Environmental impacts of biomass combustion for heating and electricity
generation. Journal of Engineering Research and Applied Science. 5 (2): 458-465.
Kaunda, C.S., Kimambo, C.Z., Nielsen, T.K., 2012. Hydropower in the Context of Sustainable Energy
Supply: A Review of Technologies and Challenges. International Scholarly Research Network
Renewable Energy. 1–15.
Kaygusuz, K., 2009. Environmental impacts of the solar energy systems. Energy Sources, Part A. 31
(15): 1376-1386.
Kelly-Richards, S., Silber-Coats, N., Crootof, A., Tecklin, D. and Bauer, C., 2017. Governing the
transition to renewable energy: A review of impacts and policy issues in the small hydropower
boom. Energy Policy. 101: 251-264.
Kokkotis, P.I., Psomopoulos, C.S., Ioannidis, G.C. and Kaminaris, S.D., 2015. Environmental Aspects
of Small Scale Energy Storage Systems. In Proceedings of the Fifth International Conference on
Environmental Management, Engineering, Planning & Economics ISBN. 978-960.
Kommalapati, R., Kadiyala, A., Shahriar, M.T., Huque, Z., 2017. Review of the life cycle greenhouse
gas emissions from different photovoltaic and concentrating solar power electricity generation
systems. Energies. 10 (3): 350.
Kristmannsdóttir, H. and Ármannsson, H., 2003. Environmental aspects of geothermal energy
utilization. Geothermics. 32: 451–461.
Lastoskie, C.M. and Dai, Q., 2015. Comparative life cycle assessment of laminated and vacuum
vapor-deposited thin film solid-state batteries. Journal of Cleaner Production. 91: 158–169.
Pg. Marítim de la Barceloneta, 37-49 08003 Barcelona www.medeas.eu [email protected] T +34 93 230 95 00 F +34 93 230 95 55
This project has received funding from the European Union’s Horizon 2020 research and innovation programme under grant agreement No 691287
323
Lee, R.A., Lavoie, J.-M., 2013. From first- to third-generation biofuels: Challenges of producing a
commodity from a biomass of increasing complexity. Animal Frontiers. 3 (2): 6–11.
Leung, D.Y.C. and Yang, Y., 2012. Wind energy development and its environmental impact: A review.
Renewable and Sustainable Energy Reviews, 16 (1): 1031-1039.
Liu, Y., Li, F.Y., Wang, Yi, Yu, X., Yuan, J., Wang, Yuwei, 2018. Assessing the environmental impact
caused by power grid projects in high altitude areas based on BWM [Best and Worst Method] and
Vague sets techniques. Sustainability. 10 (6): 1768.
Liu, Y., Xu, Y., Zhang, F., Yun, J., Shen, Z., 2014. The impact of biofuel plantation on biodiversity: a
review. Chinese Science Bulletin. 59: 4639–4651.
Loss, S.R., Will, T., Marra, P.P., 2015. Direct Mortality of Birds from Anthropogenic Causes. Annual
Review of Ecology, Evolution and Systematics. 46: 99–120.
Lovich, J.E., Ennen, J.R., 2013. Assessing the state of knowledge of utility-scale wind energy
development and operation on non-volant terrestrial and marine wildlife. Applied Energy. 103: 52–
60.
Lovich, J.E., Ennen, J.R., 2011. Wildlife Conservation and Solar Energy Development in the Desert
Southwest, United States. Bioscience. 61: 982–992.
Lueken, R. and Apt, J., 2014. The effects of bulk electricity storage on the PJM [Pennsylvania Jersey
Maryland] market. Energy Systems. 5: 677–704.
Luo, X., Wang, J., Dooner, M., Clarke, J., 2015. Overview of current development in electrical energy
storage technologies and the application potential in power system operation. Applied Energy. 137:
511–536.
Lyng, K.A. and Brekke, A., 2019. Environmental life cycle assessment of biogas as a fuel for transport
compared with alternative fuels. Energies. 12 (3): 532.
Mahajan, B., 2012. Negative environment impact of Solar Energy. Student essay submitted to
Environmental Science & Policy BA course at CEPT University (Ahmedabad, India).
Mahlia, T.M.I., Saktisahdan, T.J., Jannifar, A., Hasan, M.H., Matseelar, H.S.C., 2014. A review of
available methods and development on energy storage; Technology update. Renewable and
Sustainable Energy Reviews. 33: 532–545.
Majer, E.L., Baria, R., Stark, M., Oates, S., Bommer, J., Smith, B., Asanuma, H., 2007. Induced
seismicity associated with Enhanced Geothermal Systems. Geothermics. 36: 185–222.
Pg. Marítim de la Barceloneta, 37-49 08003 Barcelona www.medeas.eu [email protected] T +34 93 230 95 00 F +34 93 230 95 55
This project has received funding from the European Union’s Horizon 2020 research and innovation programme under grant agreement No 691287
324
McCombie, C., and Jefferson, M., 2016. Renewable and nuclear electricity: Comparison of
environmental impacts. Energy Policy. 96: 758-769.
McKenna, E., Barton, J. and Thomson, M., 2017. Short-run impact of electricity storage on CO2
emissions in power systems with high penetrations of wind power: A case-study of Ireland.
Proceedings of the Institution of Mechanical Engineers, Part A: Journal of Power and Energy. 231 (6):
590-603.
McMillan, C., 2018. Electrification of Industry: Summary of Electrification Futures Study Industrial
Sector Analysis. US National Renewable Energy Laboratory.
https://www.nrel.gov/docs/fy18osti/72311.pdf
McPherson, M., Tahseen, S., 2018. Deploying storage assets to facilitate variable renewable energy
integration: The impacts of grid flexibility, renewable penetration, and market structure. Energy.
145: 856–870.
Melikoglu, M., 2018. Current status and future of ocean energy sources: A global review. Ocean
Engineering. 148: 563–573.
Mendoza, E., Lithgow, D., Flores, P., Felix, A., Simas, T., Silva, R., 2019. A framework to evaluate the
environmental impact of OCEAN energy devices. Renewable and Sustainable Energy Reviews. 112:
440–449.
Mills, M.P., 1991. “Ecowatts”. Energy and environmental impacts of electrification. International
Atomic Energy Agency Bulletin. 33: 25–29.
Mohr, A. and Raman, S., 2013. Lessons from first generation biofuels and implications for the
sustainability appraisal of second generation biofuels. Energy Policy. 63: 114-122.
Morales, M., Quintero, J., Conejeros, R., Aroca, G., 2015. Life cycle assessment of lignocellulosic
bioethanol: Environmental impacts and energy balance. Renewable and Sustainable Energy
Reviews. 42: 1349-1361.
Mostert, C., Ostrander, B., Bringezu, S., Kneiske, T.M., 2018. Comparing electrical energy storage
technologies regarding their material and carbon footprint. Energies. 11 (12): 3386.
Oliveira, L., Messagie, M., Mertens, J., Laget, H., Coosemans, T., Van Mierlo, J., 2015. Environmental
performance of electricity storage systems for grid applications, a life cycle approach. Energy
Conversion and Management. 101: 326–335.
Ong, S., Campbell, C., Denholm, P., Margolis, R., Heath, G., 2013. Land-use requirements for solar
power plants in the United States. US National Renewable Energy Laboratory Report.
Pg. Marítim de la Barceloneta, 37-49 08003 Barcelona www.medeas.eu [email protected] T +34 93 230 95 00 F +34 93 230 95 55
This project has received funding from the European Union’s Horizon 2020 research and innovation programme under grant agreement No 691287
325
Paolini, V., Petracchini, F., Segreto, M., Tomassetti, L., Naja, N., Cecinato, A., 2018. Environmental
impact of biogas: A short review of current knowledge. Journal of Environmental Science and Health
- Part A Toxic/Hazardous Substances and Environmental Engineering. 53: 899–906.
Philibert, C., 2019. Direct and indirect electrification of industry and beyond. Oxford Review of
Economic Policy. 35 (2): 197–217.
Raza, S.S., Janajreh, I., Ghenai, C., 2014. Sustainability index approach as a selection criteria for
energy storage system of an intermittent renewable energy source. Applied Energy. 136: 909–920.
Richardson, M.L., Wilson, B.A., Aiuto, D.A., Crosby, J.E., Alonso, A., Dallmeier, F. and Golinski, G.K.,
2017. A review of the impact of pipelines and power lines on biodiversity and strategies for
mitigation. Biodiversity and Conservation. 26 (8): 1801-1815.
Rio Carrillo, A.M., Frei, C., 2009. Water: A key resource in energy production. Energy Policy. 37:
4303–4312.
Saidur, R., Rahim, N.A.A., Islam, M.R.R., Solangi, K.H.H., 2011. Environmental impact of wind energy.
Renewable and Sustainable Energy Reviews. 15 (5): 2423-2430.
Searchinger, T., Heimlich, R., Houghton, R.A., Dong, F., Elobeid, A., Fabiosa, J., Tokgoz, S., Hayes, D.
and Yu, T.H., 2008. Use of US croplands for biofuels increases greenhouse gases through emissions
from land-use change. Science. 319 (5867): 1238-1240.
Singh, B. and Strømman, A.H., 2013. Environmental assessment of electrification of road transport
in Norway: Scenarios and impacts. Transportation Research Part D: Transport and Environment. 25:
106-111.
Specht, M.J., Pinto, S.R.R., Albuqueque, U.P., Tabarelli, M., Melo, F.P.L., 2015. Burning biodiversity:
Fuelwood harvesting causes forest degradation in human-dominated tropical landscapes. Global
Ecology and Conservation. 3: 200–209.
Taormina, B., Bald, J., Want, A., Thouzeau, G., Lejart, M., Desroy, N., Carlier, A., 2018a. A review of
potential impacts of submarine power cables on the marine environment: Knowledge gaps,
recommendations and future directions. Renewable and Sustainable Energy Reviews. 96: 380–391.
Thomsen, F., Luedemann, K., Piper, W., Judd, A., Kafemann, R., 2008. Potential effects of offshore
wind farm noise on fish. Bioacoustics. 17: 221–223.
Troy, S., Schreiber, A., Reppert, T., Gehrke, H.G., Finsterbusch, M., Uhlenbruck, S., Stenzel, P., 2016.
Life Cycle Assessment and resource analysis of all-solid-state batteries. Applied Energy. 169: 757–
767.
Pg. Marítim de la Barceloneta, 37-49 08003 Barcelona www.medeas.eu [email protected] T +34 93 230 95 00 F +34 93 230 95 55
This project has received funding from the European Union’s Horizon 2020 research and innovation programme under grant agreement No 691287
326
Tschiggerl, K., Sledz, C., Topic, M., 2018. Considering environmental impacts of energy storage
technologies: A life cycle assessment of power-to-gas business models. Energy. 160: 1091–1100.
Tsoutsos, T., Frantzeskaki, N. and Gekas, V., 2005. Environmental impacts from the solar energy
technologies. Energy Policy, 33 (3): 289-296.
Turney, D. and Fthenakis, V., 2011. Environmental impacts from the installation and operation of
large-scale solar power plants. Renewable and Sustainable Energy Reviews. 15 (6): 3261-3270.
Union of Concerned Scientists, 2013. Environmental Impacts of Solar
Power.https://www.ucsusa.org/clean_energy/our-energy-choices/renewable-
energy/environmental-impacts-solar-power.html
van Deurs, M., Grome, T.M., Kaspersen, M., Jensen, H., Stenberg, C., Sørensen, T.K., Støttrup, J.,
Warnar, T. and Mosegaard, H., 2012. Short-and long-term effects of an offshore wind farm on three
species of sandeel and their sand habitat. Marine Ecology Progress Series. 458: 169-180.
Vandepaer, L., Cloutier, J., Bauer, C., Amor, B., 2019. Integrating Batteries in the Future Swiss
Electricity Supply System: A Consequential Environmental Assessment. Journal of Industrial Ecology.
23: 709–725.
Varho, V., 2002. Environmental Impact of Photovoltaic Electrification in Rural Areas. Energy &
Environment. 13: 81–104.
Walston, L.J., Rollins, K.E., LaGory, K.E., Smith, K.P., Meyers, S.A., 2016. A preliminary assessment of
avian mortality at utility-scale solar energy facilities in the United States. Renewable Energy. 92:
405–414.
Wang, S. (Shifeng) and Wang, S. (Sicong), 2015. Impacts of wind energy on environment: A review.
Renewable and Sustainable Energy Reviews. 49: 437-443.
Winemiller, K.O., Mcintyre, P.B., Castello, L., Fluet-Chouinard, E., Giarrizzo, T., Nam, S., Baird, I.G.,
Darwall, W., Lujan, N.K., Harrison, I. and Stiassny, M.L.J., 2016. Balancing hydropower and
biodiversity in the Amazon, Congo, and Mekong. Science. 351 (6269): 128-129.
World Commission on Dams, 2000. Dams and development a new framework for decision-making,
Report.
https://www.internationalrivers.org/resources/dams-and-development-a-new-framework-for-
decision-making-3939
Wu, Y., Zhao, F., Liu, S., Wang, L., Qiu, L., Alexandrov, G. and Jothiprakash, V., 2018. Bioenergy
production and environmental impacts. Geoscience Letters. 5 (1): 14.
Pg. Marítim de la Barceloneta, 37-49 08003 Barcelona www.medeas.eu [email protected] T +34 93 230 95 00 F +34 93 230 95 55
This project has received funding from the European Union’s Horizon 2020 research and innovation programme under grant agreement No 691287
327
Yilmaz, E. and Kaptan, M. A., 2017. Environmental impact of geothermal power plants in Aydln,
Turkey. International Conference on Energy, Environment and Material Systems (EEMS 2017)
Yousefi, H., Ehara, S., Yousefi, A., Seiedi, F., 2010. Rapid Environmental Impact Assessment of
Sabalan Geothermal Power Plant, NW Iran, Proceedings World Geothermal Congress.
https://www.geothermal-energy.org/pdf/IGAstandard/WGC/2010/0217.pdf
Zangiabadi, E., Masters, I., Williams, A.J., Croft, T.N., Malki, R., Edmunds, M., Mason-Jones, A. and
Horsfall, I., 2017. Computational prediction of pressure change in the vicinity of tidal stream turbines
and the consequences for fish survival rate. Renewable Energy. 101: 1141-1156.
Zwart, M.C., Dunn, J.C., McGowan, P.J.K., Whittingham, M.J., 2016. Wind farm noise suppresses
territorial defense behavior in a songbird. Behavioral Ecology. 27: 101–108.
Pg. Marítim de la Barceloneta, 37-49 08003 Barcelona www.medeas.eu [email protected] T +34 93 230 95 00 F +34 93 230 95 55
This project has received funding from the European Union’s Horizon 2020 research and innovation programme under grant agreement No 691287
328
9. Conclusions – challenges & recommendations In conclusion, we can already note that a largescale renewable energy transition as envisioned by
the MEDEAS project would have various environmental impacts and that we will encounter resource
scarcity issues especially concerning certain rare earths elements. Additional infrastructure will
require an increase in finance of several magnitudes. This can however not easily be placed on
consumers without safeguarding European citizens already experiencing energy poverty or even
energy degradation. In order to add more RES to the grid, we will require additional grid flexibility
and storage technologies. Carbon and energy pricing may be used as a tool here. Additionally and
importantly, while we predict and increased energy demand, some energy supplies in Europe are
close to depletion and renewable energy patterns will themselves be affected by climate change.
The strength of the resource sun and wind are likely to shift geographically.
Having discussed what we perceive to be the biggest barriers to and accompanying a future
renewable energy transition, the following chapter will provide an overview of the challenges we
found. Out of this we synthesised a list of prioritised challenges, and a list of 5 key recommendations
per chapter.
Pg. Marítim de la Barceloneta, 37-49 08003 Barcelona www.medeas.eu [email protected] T +34 93 230 95 00 F +34 93 230 95 55
This project has received funding from the European Union’s Horizon 2020 research and innovation programme under grant agreement No 691287
329
9.1. Challenges
9.1.1. Climate Change Adaptation
The challenges of climate adaptation in the energy sector itself include a strong increase in energy
demand due to an increased need for cooling in many European countries.
Regarding some of the different energy sources (thus changes in energy supply),
1. SOLAR: Increased clouds and winds in Northern Europe is projected in some scenarios to
lead to an overall reduction of PV potential across Europe by 10%,
2. WIND: Reduction of wind power output in the Mediterranean (offshore and onshore) and
more difficult conditions due to greater storminess for offshore wind power in the Nordic
and Baltic Sea.
3. HYDRO: Runoff (ice melt water) needed for several types of hydropower storage will occur
earlier in the year due to warmer springs. Riverbeds and lakes will dry up in the summer
months. This means that the regions in Europe with the highest hydropower capacity and
potential, such as the Alps, will see this potential decrease.
4. BIOFUELS: Biofuel potential will decrease in Southern Europe due to drought. There may be
some crops that can be grown in Northern locations with warmer temperatures, where they
previously have not thrived.
5. OIL and GAS: Just like with offshore wind, offshore gas and oil infrastructure will come under
strong pressures due to higher waves and more intense storms.
6. COAL: There will be more hazardous earth movements in mining areas as well as greater
potential for flooding of the mines. Toxic heavy metal release may increase, leading to
greater contamination of water and soil as well as more dust overall.
Pg. Marítim de la Barceloneta, 37-49 08003 Barcelona www.medeas.eu [email protected] T +34 93 230 95 00 F +34 93 230 95 55
This project has received funding from the European Union’s Horizon 2020 research and innovation programme under grant agreement No 691287
330
9.1.2. Resource Scarcity
1. OIL, COAL and URANIUM: The EU has low oil reserves itself. However, both coal and oil
should not be a great part of the future European energy mix due to climate considerations.
The member states of the European Union have very different viewpoints concerning the
role nuclear power should play in our future energy mix. Nonetheless, uranium needs to be
acquired from limited secondary sources.
2. RARE EARTHS: Natural resources needed for a renewable energy transition include especially
rare earths. We depend for many modern appliances on rare earths and since the number
of e.g. appliances with screens (from smartphones to smart fridges) is expected to increase,
so will our dependence. A strong increase in recycling and reuse of rare earths elements and
related appliances will be needed to satisfy our demand. Proven rare earth deposits are in
very few geographic locations worldwide, which will likely increase their price and creates a
political risk. Since rare earths cannot easily be replaced, legislation to decrease demand will
be required since consumer choice and environmental regulations will not be enough to
regulate this problem. Rare earth mining itself is often both unsafe and damaging to the
environment due to mining waste products.
Pg. Marítim de la Barceloneta, 37-49 08003 Barcelona www.medeas.eu [email protected] T +34 93 230 95 00 F +34 93 230 95 55
This project has received funding from the European Union’s Horizon 2020 research and innovation programme under grant agreement No 691287
331
9.1.3. Financing cross-border energy infrastructure
The expansion of renewables will require grid reinforcement, more storage and cross-border
infrastructure to account for day/night/seasonal intermittency of solar/wind power and geographic
incongruence between energy demand and supply.
1. The amount of funding needed is further increased by inter alia the poor public acceptance
of cheaper overhead lines and the fact that offshore wind and European islands require more
expensive HVDC cables. Various technical difficulties and immaturities make securing
finance difficult. This includes loop flows, HVDC, meshed offshore grid, converters, costly
transformers are needed to equalize voltage between different TSOs. Technical systemic
incongruences between national networks creates a need for additional technology at the
interfaces to make different parts of infrastructure compatible.
2. Passing on costs for cross-border electricity infrastructure to consumers through significantly
increased tariffs in order for TSOs to meet their investment plans could further intensify
socio-economic imbalances in individual member states. Former communist and smaller
island states’ TSOs are often under greater financial pressure as due to previous lack of
interconnection they have a greater and faster need for additional infrastructure while often
lacking understanding or knowledge of how to attract funding sources.
3. Cost-benefit mechanisms, such as the ITC, are in urgent need of reform and increase of
funding.
4. Cross border interconnectors have high upfront costs, great lumpiness, high risk due to
different permitting regimes and the capital costs require long pay back periods, making
them less interesting to private investors and thus relying disproportionately on public
financial instruments.
5. Private sector investments are also discouraged through European or national regulations
limiting profits on interconnectors and TSOs preferring to decrease price instead of investing
in further infrastructure, or subsidies being reserved for domestic companies, as well as
investment ‘inertia’ given their existing portfolio of investments are heavily skewed towards
fossil fuel infrastructure.
Pg. Marítim de la Barceloneta, 37-49 08003 Barcelona www.medeas.eu [email protected] T +34 93 230 95 00 F +34 93 230 95 55
This project has received funding from the European Union’s Horizon 2020 research and innovation programme under grant agreement No 691287
332
9.1.4. Grid Flexibility
The main challenges to increase grid flexibility are:
1. The main issue affecting grid flexibility are the difficulties of dealing with intermittency,
uncertainty (unpredictability), and volatility of energy supply with a power grid designed for
a stable and demand-based supply. The impacts of the variability of the energy supply affect
mainly in the energy planning for grid design, expansion capacity and storage.
2. Shifting electric grid from centralised to decentralised energy supply requires a redesign of
the grid and new economic and energetic investments.
3. Overcapacity can damage installations and may also result in marginal energy losses.
4. The variability of supply of RES will require increasing the grid storage capacity. Currently,
the only reliable storage technologies are PHS and batteries which are difficult to scale-up.
PHS has environmental issues and competes with electricity generation and other water uses
(e.g. irrigation), while using EV-batteries as grid-storage may impact the average mileage of
EV.
5. Short-time supply variability (1 to 8 hours) affects the capability to ramp-up and down power
generators when energy needs to be dispatched at the request of power grid operators. This
is currently managed with hydroelectric and natural gas power plants. With the uncertainty
of renewables this supply management is not possible.
Pg. Marítim de la Barceloneta, 37-49 08003 Barcelona www.medeas.eu [email protected] T +34 93 230 95 00 F +34 93 230 95 55
This project has received funding from the European Union’s Horizon 2020 research and innovation programme under grant agreement No 691287
333
9.1.5. Electricity pricing as a tool for RES expansion
The main challenges in using pricing as a tool to regulate energy demand are:
1. Reducing energy demand not merely energy shift or transition will be necessary to guarantee
energy security.
2. Merit order effect is not sufficient to ensure VRE penetration. Thus, the transformation of
the energy market requires new financial tools to promote the investment in RES.
3. Adding extra grid storage capacity and interconnectivity requires significant monetary
investments, which is holding back its development.
4. Prosumers can have a key role in the transition, but they require a legal framework to
guarantee their investments and its future profitability.
Pg. Marítim de la Barceloneta, 37-49 08003 Barcelona www.medeas.eu [email protected] T +34 93 230 95 00 F +34 93 230 95 55
This project has received funding from the European Union’s Horizon 2020 research and innovation programme under grant agreement No 691287
334
9.1.6. Energy Poverty
The main challenges in energy poverty in Europe are:
1. A renewable energy transition provides additional infrastructure which needs to be
financed. This can under certain circumstances lead to higher energy prices or the costs can
be shifted from heavy industry to the consumer.
2. Electricity is not a good that humans can easily use less of as it is needed for cooking and
heating.
3. Renters, who are usually already less wealthy than property owners, often cannot install
solar panels on roof and their landlord has little incentive to make the property more energy
efficient.
4. Energy inefficient housing stock exacerbates energy poverty. While historical housing stock
may be draftier, modern housing are often heat traps made of glass and concrete. Higher
floors of multi-floor buildings are very hard to cool compared to e.g. villas. Southern
European housing often does not feature any heating and most Northern European housing
does not currently feature any cooling.
5. There is no uniform European definition of energy poverty.
Pg. Marítim de la Barceloneta, 37-49 08003 Barcelona www.medeas.eu [email protected] T +34 93 230 95 00 F +34 93 230 95 55
This project has received funding from the European Union’s Horizon 2020 research and innovation programme under grant agreement No 691287
335
9.1.7. Environmental impacts
The main environmental challenges for the renewable energy supply in Europe are:
1. Environmental impacts are associated to all stages of the energy system, including
generation, transmission, distribution and storage.
2. The manufacturing and construction phase is usually where most impacts occur (land use
changes, habitat degradation/destruction, noise, dust and GHG emissions, pollution etc.)
and should be carefully monitored. An environmental impact assessment, including most
impacts, should be elaborated for the construction of any new infrastructure. Although less
severe, impacts also occur during the operation phase (losses in T & D and batteries, impacts
on biodiversity, etc.) and during decommission.
3. Biofuel production has significant impacts on land use, soil degradation, water consumption
and pollution, biodiversity and GHG emission. Although to date most of the environmental
impacts of biofuel production used within the EU is externalised to other world regions
(biofuel import), alternative and more environmental friendly energy sources must be
considered. A potential greener replacement for biofuels in the transport sector would be
hydrogen produced from renewable energy. There is not enough land available within the
EU for a strong push towards EU grown crops.
4. The construction of new large-scale high-head storage hydropower plants should be
discouraged due to their large environmental impacts cause by water impoundments and by
dams. The same is true for PHS systems, which should be envisaged only in previously built
hydropower sites. The impacts of small-scale hydropower projects are not always smaller to
those of large-scale projects when referred to the energy generated.
5. Concentrating solar power accounts for a large consumption of water (to clean reflective
surfaces), compared to solar PV for similar energy generation. Solar PV panel production is
very material intensive, and is responsible for most of the negative impacts over the lifespan
of this technology. The distributed installation of solar PV panels in roof-tops has the
potential to reduce all impacts associated to this technology, other than those related to its
material requirements.
6. Despite some technical difficulties associated with the technology (land subsidence, induced
seismicity, increased risk landslides) and the risk of pollution of water bodies and air, with
the appropriate technology (closed loop cycles, waste treatment, etc.) geothermal energy
can be a relatively clean technology. However, the exploitation of this resource is restricted
to areas with the required geological characteristics.
Pg. Marítim de la Barceloneta, 37-49 08003 Barcelona www.medeas.eu [email protected] T +34 93 230 95 00 F +34 93 230 95 55
This project has received funding from the European Union’s Horizon 2020 research and innovation programme under grant agreement No 691287
336
7. The main drawback of onshore wind energy is the increased mortality of birds and bats
around wind turbines, although the mortality rates are inferior to those of other
anthropogenic factors (e.g. collisions with cars, cat predation, etc.). Other impacts of this
technology are associated to the land use changes. Offshore wind also has impacts on
migratory birds, fish and marine mammals, and the submarine cables may cause degradation
of benthic ecosystems.
8. Although plagued with similar impacts than hydropower, the only mature marine technology
are tidal barrages. The main known impacts of the rest of oceanic technologies are related
to the construction phase (destruction of habitats, noise emissions, resuspension of
sediments, water pollution). During operation, the above-surface infrastructure may cause
interference with avian species (e.g. collisions, altering migration patterns, etc.), while the
below-surface devices may increase the risk of collisions and entanglement of marine
mammals and fish.
9. The Joule effect results in energy losses during T & D. If the energy is produced from
renewable sources, the extra energy required to compensate for the losses does not cause
further impacts. Other negative impacts of T & D are the degradation, fragmentation and
destruction of habitats and the increased risks of death by electrocution of birds.
10. Although currently PHS is the only bulk storage system available in the market, it has similar
impacts to hydropower, and new developments should be limited to already degraded
environments. Besides PHS, batteries have the highest environmental impacts, most of
which originate from the material requirements of this technology. The other possible
storage technologies, although still in development phase, could have a lower environmental
impact. The other known drawback of storage technologies is their low efficiency, which
results in energy losses during operation that need to be compensated with extra energy
production.
11. The new infrastructure to be built and the needed adaptations will require a significant
energy investment that will result in an increase of GHG emissions. Emissions will start to
decline with the progressive decarbonisation of the power system.
Pg. Marítim de la Barceloneta, 37-49 08003 Barcelona www.medeas.eu [email protected] T +34 93 230 95 00 F +34 93 230 95 55
This project has received funding from the European Union’s Horizon 2020 research and innovation programme under grant agreement No 691287
337
9.2. Five key recommendations
9.2.1. Climate Change Adaptation
1. A reduction in energy demand is necessary since our capacity to generate energy will be
potentially negatively affected by climate change. This could include an improvement in
housing to reduce needs of cooling or heating (see section 9.2.6.).
2. While we note that further interconnection requires finance that is currently not being
redirected to this area (see section 9.2.3), the increase in cloud cover and reduction in solar
capacity in some areas as well as e.g. wind speed changes and higher waves impacting
offshore wind capacities, will require such increased interconnection.
3. 75% of the people living in permafrost regions in Europe, many of them indigenous peoples,
will see the vast majority of the infrastructure they live with being destabilised through
permafrost thawing, even if Paris Agreement targets are being adhered to. This area will
require large-scale psychological and financial attention. We recommend increased
discussions regarding this at European level.
4. Coal mining will potentially have even more hazardous effects due to climate change than it
currently does. It therefore needs to be abandoned.
5. Future changes in renewable energy resources (wind speed changes, cloud cover changes,
increased icing of wind turbines) need to be systematically taken into account in current PCI
decisions and risk assessments.
Pg. Marítim de la Barceloneta, 37-49 08003 Barcelona www.medeas.eu [email protected] T +34 93 230 95 00 F +34 93 230 95 55
This project has received funding from the European Union’s Horizon 2020 research and innovation programme under grant agreement No 691287
338
9.2.2. Resource scarcity
1. We point out the need to fund further research in new product designs which do not rely on
neodymium, praseodymium and dysprosium is urgently needed.
2. Although we note that this will be financially costly, we suggest making increased recycling
of appliances that feature rare earth elements mandatory.
3. We equally recommend to mandate products to have lower obsolescence, especially
artificially or software enabled obsolescence, to extend product life, for example and in
particular with mobile phones.
4. In this regard the creation of an EU wide inventory of resources to track their use, re-use and
disposal, is also beneficial.
5. We urge the development of an energy transition plan that includes the management of
fossil fuel reserves within Europe as well as a detailed plan for import reductions over time
with aligned strategies for managing relationships with trade partners who may rely on
resource exports.
Pg. Marítim de la Barceloneta, 37-49 08003 Barcelona www.medeas.eu [email protected] T +34 93 230 95 00 F +34 93 230 95 55
This project has received funding from the European Union’s Horizon 2020 research and innovation programme under grant agreement No 691287
339
9.2.3. Financing cross-border electricity
1. We recommend the reform of the InterTSO compensation mechanism to better reflect cost
and benefits accrued from further interconnection.
2. Capacity Remuneration Mechanisms (CRM), electricity charging as well as offshore
interconnection regimes need to be harmonised. Similarly, subsidies need to be made
available also for imported RE, with transmission infrastructure emissions taken into
account/subtracted.
3. Perverse incentives of energy companies to not interconnect in order to not create
competition to their own electricity production need to be tackled. Furthermore,
transnational offshore wind increase will require a European transnational TSO.
4. We urge divestment support so that e.g. pension funds have to decrease their investments
in fossil fuel intensive assets. This will free up capital for further interconnection.
5. We recommend the consideration of a Europe-wide adaptation of YieldCo or other
innovative de-risking packages. Smaller TSOs will require capacity building to handle outside
funding.
Pg. Marítim de la Barceloneta, 37-49 08003 Barcelona www.medeas.eu [email protected] T +34 93 230 95 00 F +34 93 230 95 55
This project has received funding from the European Union’s Horizon 2020 research and innovation programme under grant agreement No 691287
340
9.2.4. Grid flexibility
1. Additional storage capacities should be built to help integrate renewable energy, balancing
supply and demand. Therefore, more R & D in storage technologies is needed, and should
be combined with measures to reduce overall energy demand (i.e. degrowth, efficiency
gains).
2. Although there are challenges in securing the required orders of funding (see 9.2.3), further
grid interconnection is recommended and needed for the variability at high-capacity
production sites. Grid redesign (from centralised to decentralised grid) will allow the
integration of prosumers’ energy production in the grid.
3. We recommend curtailment as a measure to manage overcapacity, combined with demand
side management.
4. The storage scale-up can be solved with the implementation of PtX technologies, which are
currently being used and under development. We recommend power to gas for that
purpose.
5. Demand Side Management (DSM) will help overcome the grid management issues related
to the variability of energy demand which cannot be handled with RES. We urge further
balancing of the current peak demand between households and industry to ease grid
management issues.
Pg. Marítim de la Barceloneta, 37-49 08003 Barcelona www.medeas.eu [email protected] T +34 93 230 95 00 F +34 93 230 95 55
This project has received funding from the European Union’s Horizon 2020 research and innovation programme under grant agreement No 691287
341
9.2.5. Electricity pricing as a tool for RES deployment
1. Price regulation should be deployed to incentivise energy savings from the consumer side.
Energy consumption and particularly electricity costs are correlated to households’
consumption. Therefore, taxation and price regulation should be used as an instrument to
enhance energy savings through energy efficiency (i.e. improving households isolation and
passive methods of energy saving).
2. Prices could play a role, with the proper economic instruments, to redirect the monetary
fluxes to the necessary initial investments for RES (fixed costs). Based on simulations, prices
must account for the actual cost of primary energy supply.
3. Regulated prices or taxation could be used to support necessary grid interconnection and
storage investments. We note (see chapter 4) that currently perverse incentives exist for
TSOs and electricity companies to not do so. This will require political will to tackle.
4. Although price can incentivise small producers in the so-called prosumer paradigm, this will
need also a grid transformation (from centralised to decentralised grids). Moreover, we
recommend the design and implementation of the long-term policy required to protect small
producers and guarantee their role in the future energy market.
5. Simulations with the TRANS scenario have shown that the maximum yearly investment
needed until 2050 for the EU to complete the transition to a 100% renewable energy system
is ca. 5% of its GDP. If these full costs were passed on through energy prices, then energy
prices would need to increase by 5% by 2030 in the TRANS scenario, as compared to the 16
% in BAU and 25% in OLT. From an energy poverty viewpoint, the TRANS scenario is therefore
preferable.
Pg. Marítim de la Barceloneta, 37-49 08003 Barcelona www.medeas.eu [email protected] T +34 93 230 95 00 F +34 93 230 95 55
This project has received funding from the European Union’s Horizon 2020 research and innovation programme under grant agreement No 691287
342
9.2.6. Energy poverty
1. We recommend a largescale expansion of rooftop solar energy (see further benefits in
section 9.2.7, but with the caveat of grid issues that such an integration will cause, see
section 9.2.4), including on public buildings, and a European-wide programme to retrofit
buildings to require less heating and less cooling to curb energy poverty.
2. As a measure of climate adaptation, to limit the amount of electricity required for cooling
and to save lives with less people dying in heat waves (like the 50,000 to 70,000 people that
died in France in four weeks in 2003), we recommend a European development programme
to change building standards – instead of increase air conditions. This could include in older
housing stock in the Mediterranean adding basements to sleep in at night, planting trees for
further shadow and add window shutters to buildings. Glass and concrete buildings, while
currently the architectural norm, for so-called ‘modern buildings’, are much harder to cool
and we therefore urge architecture guidelines.
3. Since exemptions for energy intensive industries in RES transition shift this cost to
consumers, we recommend a slow phasing out of such an exemption.
4. Incentives for landlords to retrofit buildings, they will not personally live in, to much lower
heating and cooling needs have to strongly increase. They are currently too low. The same
applies to incentives for landlords to add solar panels to the roofs of buildings they rent out.
5. Since energy poverty is a very much geographically specific issue for Mediterranean and
former communist Eastern European countries, support payments from much less affected
European regions may be necessary. We also note here that these same regions already
shoulder a much larger interconnection cost due to lower interconnection.
Pg. Marítim de la Barceloneta, 37-49 08003 Barcelona www.medeas.eu [email protected] T +34 93 230 95 00 F +34 93 230 95 55
This project has received funding from the European Union’s Horizon 2020 research and innovation programme under grant agreement No 691287
343
9.2.7. Environmental impacts
1. Minimise environmental impacts by predominantly building in already degraded
environments (e.g. solar PV on roof-tops).
2. Power generation plants should be moved closer to more densely populated areas which
will reduce the impacts associated with transmission lines.
3. Better end-of-life management and recycling is crucial to reduce the environmental footprint
of all technologies, especially those with high material intensities (e.g. solar PV and
batteries).
4. A slowdown of economic activity (degrowth) is recommended to help reduce the pressure
on natural resources and on the overall impacts of our societies on the planet.
5. Environmental impact assessment frameworks currently being used should be revised to
include impacts associated with the renewable technologies that are currently in the
development phase.
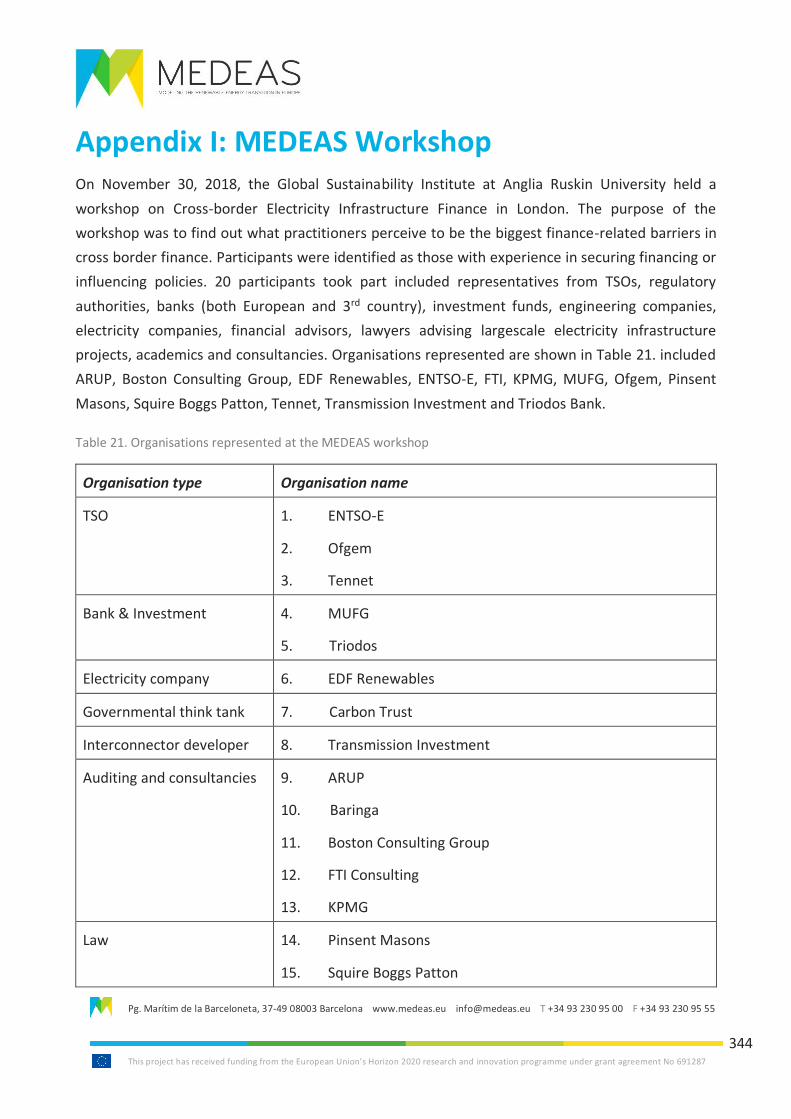
Pg. Marítim de la Barceloneta, 37-49 08003 Barcelona www.medeas.eu [email protected] T +34 93 230 95 00 F +34 93 230 95 55
This project has received funding from the European Union’s Horizon 2020 research and innovation programme under grant agreement No 691287
344
Appendix I: MEDEAS Workshop On November 30, 2018, the Global Sustainability Institute at Anglia Ruskin University held a
workshop on Cross-border Electricity Infrastructure Finance in London. The purpose of the
workshop was to find out what practitioners perceive to be the biggest finance-related barriers in
cross border finance. Participants were identified as those with experience in securing financing or
influencing policies. 20 participants took part included representatives from TSOs, regulatory
authorities, banks (both European and 3rd country), investment funds, engineering companies,
electricity companies, financial advisors, lawyers advising largescale electricity infrastructure
projects, academics and consultancies. Organisations represented are shown in Table 21. included
ARUP, Boston Consulting Group, EDF Renewables, ENTSO-E, FTI, KPMG, MUFG, Ofgem, Pinsent
Masons, Squire Boggs Patton, Tennet, Transmission Investment and Triodos Bank.
Table 21. Organisations represented at the MEDEAS workshop
Organisation type Organisation name
TSO 1. ENTSO-E
2. Ofgem
3. Tennet
Bank & Investment 4. MUFG
5. Triodos
Electricity company 6. EDF Renewables
Governmental think tank 7. Carbon Trust
Interconnector developer 8. Transmission Investment
Auditing and consultancies 9. ARUP
10. Baringa
11. Boston Consulting Group
12. FTI Consulting
13. KPMG
Law 14. Pinsent Masons
15. Squire Boggs Patton
Pg. Marítim de la Barceloneta, 37-49 08003 Barcelona www.medeas.eu [email protected] T +34 93 230 95 00 F +34 93 230 95 55
This project has received funding from the European Union’s Horizon 2020 research and innovation programme under grant agreement No 691287
345
Academics 16. Diplomatic Academy Vienna
17. University of Cambridge
The workshop consisted of presentations on the electricity infrastructure finance gap, the inter-TSO
compensation mechanism, green bonds, different cross-border infrastructure projects and their
financing and regulatory issues. After the presentations, the participants split into smaller groups
and discussed interconnection finance in the case of 3rd countries (including the UK after Brexit and
North Africa), governance as well as cost-benefit allocation issues. The workshop was held under
the Chatham House rule.
Large group general discussion
Initially, participants highlighted the fact that of course the funding structure of an interconnection
project follows the revenue structure gained through the operational phase of the project. This
revenue structure and what is permitted or not will differ from member state to member state.
Many issues impacting the financing for a cross-border project pertain however in exactly the same
way to a national project. Only about 25% of the financing risks and challenges stem from its
international nature. It is therefore important to specify whether an issue is inherent irrespective of
whether it is cross-border or not or whether it is specifically to do with the fact that it is crossing
two regimes. An example for such an aspect that is an issue no matter whether it is a largescale
national or cross-border infrastructure project is construction risk.
A lawyer advising interconnection projects asserted that the major factor in cross-border projects is
political and regulatory uncertainty. This includes e.g. sudden political changes in Romania or
Bulgaria. For this reason, it is “nearly impossible to get financing externally for such projects”, since
investments are perceived to be too high risk.
An engineer emphasized that the amount of internal capacity was considerably higher in most
countries than external capacity and then often interconnection has to be HVDC purely from a
technical standpoint. There are then issues pertaining to which law applies to the external and
internal interconnector and who to sue in which forum in case of an issue. Another workshop
participant pointed out that there was a cultural difference in inspection regarding the UK and
continental Europe. In the UK, it is quite common (as has been pointed out elsewhere in this
chapter) to have a 3rd party building an interconnector. That situation is not the norm at all on the
continent. This adds another layer of complexity when it comes to cross-jurisdictional issues in
Pg. Marítim de la Barceloneta, 37-49 08003 Barcelona www.medeas.eu [email protected] T +34 93 230 95 00 F +34 93 230 95 55
This project has received funding from the European Union’s Horizon 2020 research and innovation programme under grant agreement No 691287
346
interconnection. In a project, in which there are more UK investors, the technological structure
becomes a crucial element of the project because it is possible to get European revenues in a tax-
optimised way. The question is then “what do you structure as equity or as dead financing so that
you have deductible interest payments which are taxed more in a country where you invest.”
One reason why some transmission line projects are predominantly financed by banks is that these
already possess certain environmental and social compliance principles needed.
In cross-border infrastructure projects, the cost benefit allocation and how that is decided in the EU
is an issue. Hereby one of the difficulties is to communicate e.g. the ACER mechanisms in place for
this to investors can be quite complex.
The long lifespan of the project versus the regulatory uncertainty, especially given the lifespan of
regulation can be short, is a mismatch. Political changes in Bulgaria, capacity market remuneration
in the UK, and German renewable energy regimes changes (each of these changes have not been
successfully challenged in the ECJ) have all contributed to a perception of considerable regulatory
risk. The more investments are being made, the more costs are generated and with that also comes
higher political pressure of actually managing those costs. The regulatory authority, as independent
as it can be, faces public and political pressure and it cannot be ruled out that adjustments are made
which then conflict with the viability of the investment. However, it is of course possible to insure
against political risk and the risk can be shared between project partners. Other attendees did not
rank regulatory risk as highly. An investor would either like a regulator past track record of in time
delivery of projects or see that there has been delay in previous interconnections or projects due to
regulatory issues and would then not invest in that member state in the first place.
A representative from a commercial bank explained three different finance sources – utilities and
TSOs on the RAB model, and some of these balance sheet financers using credit facilities to take
some of that debt off their own balance sheets. There is thirdly project finance, which on the
transmission side is mainly limited to the OFTO regime in the UK. The strong contractual
arrangement is very attractive to equity participants and to debt participants. This was thus deemed
a great way to inject private financing into the regime. In general, other interconnector revenue
flow regimes are less clear and less attractive for banks. The regulator also put in place an extensive
information campaign and “Investor bridge” on the OFTO regime.
One attendee pointed out the issuance of bonds for financing the construction as well as grid
acquisition.
Pg. Marítim de la Barceloneta, 37-49 08003 Barcelona www.medeas.eu [email protected] T +34 93 230 95 00 F +34 93 230 95 55
This project has received funding from the European Union’s Horizon 2020 research and innovation programme under grant agreement No 691287
347
Another participant recalled their work on a merchant interconnector and the advantage of
arbitrage – whether regarding a price differential or a time differential price. The slow elimination
of these differentials and thus the self-eliminating nature and usage of an interconnector are
difficult to forecast. It also cannot be easily comparable to OFTO, where the revenue stream is more
straightforward to forecast. A bank representative highlighted the attractiveness of OFTO for
investors as an “availability payment” and advocated the expansion of the regime to areas other
than offshore wind. A regulatory agency participant stated that in the OFTO and its revenue stream
– if it is seen as a fixed revenue stream, then it is quite clear to investors what their revenue from
the interconnector is. The cost of debt on the asset is paid by the regulator and the regulatory asset
base that is paid not just from the gearing portion, but the whole RAB. This means that equity still
gets a return in a worst-case scenario.
A representative from a bank emphasised the issue of temporality. The revenue stream timeframe,
which was definitely not “regularly (every) six months” was not as attractive for banks. While the
cost of debt and the return to equity may be clear, it is still not on a deep level of project finance
asset by asset basis. This granularity is however needed to review every six months. As a large utility
with a very big portfolio this is easier to hedge against. Another participant agreed and stated that
for some financing needs funding may need to be for five years or one year.
An attendee from a utility noted that price differentials, arbitrage, were becoming less important
for interconnection than in the past. This was now not as relevant anymore as future
interconnection would need to be much more about transmitting RES from the wind and solar
power houses of Europe to the urban centres of consumption and industry. One participant wished
to highlight the distinction between an interconnector between two large grids allowing electricity
to flow in time of arbitrage and an HVDC cable which connects a windfarm and is instead a
unidirectional flow of one connection asset. Often this is a regulated asset with a regulated rate of
return and thus different legally to an interconnector – those are two different types of assets.
For capital subsidies, especially in the case of the project cost that EU financial pots will be willing
to pay for a PCI, one participant felt that in order to qualify the project needed to basically be
“uneconomic” by default –“you need to be in the broader social interest of the EU, but you can't
really be particularly profitable or economic. […] but the difficulty is, in order for you to proceed as
a project you need regulatory approval on both sides of the link, which essentially provides for the
revenue model, be it exempt or capital flaw or tariff […] and that approval will very rarely be
forthcoming if you're not economic […]. So, there is a little bit of a mismatch from the national
Pg. Marítim de la Barceloneta, 37-49 08003 Barcelona www.medeas.eu [email protected] T +34 93 230 95 00 F +34 93 230 95 55
This project has received funding from the European Union’s Horizon 2020 research and innovation programme under grant agreement No 691287
348
perspectives for the regulatory approvals and how the support coming from the European level is
forthcoming.”
Attendees also discussed German FiTs and how they created arbitrage requiring interconnections.
Most attendees favoured auctions to FiTs. Of greater urgency, since auctions had “won”, were long-
term and day ahead ability for system operators to interrupt the pre-prescribed plan of the
interconnector owner and what level of compensations could be applied by whom. This issue, of
the day ahead markets and the utility death spiral was seen as a potential real risk to investors. It
could potentially require redesigning the electricity markets in member countries. Market design is
key to ease congestion and interconnectors could even worsen this. The example of NorthConnect
connecting Scotland to Norway was given as an interconnector that could just as easily worsen or
ease congestion.
Issues around the cap and floor regime as well as environmental consenting were also discussed.
Small group discussion on third countries
Since third countries are not covered by EU legislation, there are obvious jurisdictional issues and
the investors have to deal with national laws first. The European Commission in such a case would
be required to put in place a renewables recognition agreement, as ruled by the November 2014
ECJ case “Green Network v Autorità per l’energia elettrica e il gas” (ECJ, 2014). In the case in
question, the ECJ was asked to rule about the Free Trade Agreement with Switzerland and
renewable energy certificates in Italy. The Italian Electricity and Gas Authority had fined the Italian
Green Network company for failing to purchase “green certificates in an amount corresponding to
the quantity of electricity which that company had imported into Italy from Switzerland. Green
Network argued that they had supplied guarantees of origin proving the renewable energy
characteristics of such electricity and thus considered their obligation under Italian law to have a
certain amount of renewable energy in their energy supply mix to be met. Italian law provided that
guarantees of origin from third countries, i.e. outside the European Union [like Switzerland], would
be eligible for meeting this obligation subject to the existence of an international agreement to that
end” and Italy had such an agreement with Switzerland (Fouquet, D. and Nysten, J. 2014). The
European Court of Justice ruled that the EU enjoyed “exclusive external competence relating to the
promotion of electricity from renewable energy sources through guarantees of origin in the Internal
Market” – therefore Italy’s bilateral agreement with Switzerland had been in conflict with European
law. The ECJ also ruled that the European Commission in case of 3rd countries needs to put in place
a renewables recognition agreement and a report on the different national statutes. All of this would
of course affect investment decisions. Nonetheless, workshop participants agreed that all potential
Pg. Marítim de la Barceloneta, 37-49 08003 Barcelona www.medeas.eu [email protected] T +34 93 230 95 00 F +34 93 230 95 55
This project has received funding from the European Union’s Horizon 2020 research and innovation programme under grant agreement No 691287
349
low carbon electricity generators would be very likely to accept EU law as there are no nearby other
markets for e.g. solar energy from Morocco or geothermal energy from Iceland – and thus they
would like to inject their renewable electricity into the EU market.
Remaining in the area of legal issues, shareholder rights might change as the interconnector crosses
from the third party to the EU country. This would mean that it may be necessary to have a single
buyer to circumvent third party access issues. Nonetheless, some participants reasoned that
arbitrage, thus electricity price differences between the two countries, may give the third country a
lower incentive to adopt the EU norms.
Regarding actual construction of infrastructure, while engineering standards drive for conformity of
equipment, there could be various construction contract issues e.g. delay damages, enforceability
of claims. Similarly, there is a large political risk for third countries, both for North Africa as well as
interconnections to get solar energy from Turkey. These concerns would make investment riskier
and thus potentially less attractive – especially for pension funds etc.
When the small group discussion turned to Brexit and infrastructure finance with the UK as a future
3rd country, participants expressed concerns about major investment delays and strong cost of
capital for electricity infrastructure and interconnections involving the UK. Construction costs
themselves would go up regardless, especially in a No Deal Brexit, due to British pound exchange
rate issues and necessary import of materials. In case of a No Deal Brexit, there would be major
uncertainty and the EU Renewable Energy Directive (2009) would no longer apply. The UK would
have to put in place a statutory instrument. The UK will also fall out of EU trade agreements with
(other) 3rd countries and would be hit with the GATT 97 tariff wall. Even trading electricity with
Ireland without an EU deal would be an issue. The UK would leave both ACER and ENTSO-E (but
would still be a perimeter country in the ITC mechanism).
Small group discussion on cost - benefit allocation
Interconnector projects are assessed regarding the benefits of connecting to producers, consumers,
markets. The ENTSO-E methodology here is to use information from all member states, TSOs and
projections to understand if a project would be in the best interest of the EU28 as a whole and then
additionally, each member state will assess the impact on their own country. If a project is beneficial
for one country, but not for the other a framework has to be put in place to allow the projects to
proceed if there is a benefit compared to the capital need to build the project. There is thus a net
benefit analysis.
Pg. Marítim de la Barceloneta, 37-49 08003 Barcelona www.medeas.eu [email protected] T +34 93 230 95 00 F +34 93 230 95 55
This project has received funding from the European Union’s Horizon 2020 research and innovation programme under grant agreement No 691287
350
There are certain differences between member states regarding the producer benefits and costs.
For example, countries in Northern Europe with large hydro potential and a large industry that relies
on cheap electricity, they focus more on the potential financial impact of projects and tariffs on
producers. Countries with fuel poverty instead focus more on the consumer side and raising tariffs
to finance an interconnection is more sensitive here. These different considerations and
poverty/industry levels need to be taken into account and need to be brought together for a
coherent structure so that approvals will be given by the different states in the development phase.
Another participant cautioned that in the future, these cost - benefit allocations would become
much more complex due to the intermediate category of prosumer. Cost – benefit allocation
processes of interconnection or storage projects in the future will thus require the theorisation of
an expansion of this intermediate category in a context where it doesn’t exist yet. While it is clear
that this category will expand in the future, it is by no means clear to what extent or in which ways
or where geographically to which degree. All of this makes designing or improving cost benefit
allocation mechanisms more complex. Large consumers or producers may have interests
diametrically opposed to those of future prosumers.
An expert from a regulatory agency agreed, both regarding prosumers and interconnector CBA and
concerning different member states’ preferences on whose interests to emphasise. If an
interconnector can benefit both consumers and producers in a given country – great. Price inflation
benefitting producers is a more difficult sell. However, the key issue is how this impacts financing
and how it effects the developers' ability to raise finance. For this, it is important how the different
countries then structure the revenue returns and that this distribution has to take into account
these different priorities in different countries. If there is sufficient polarity between them, the
process to finding a solution might be onerous. In that interim period, it creates a disincentive for
developers. It could be that a project is identified as being beneficial to the EU as a whole, and then
getting PCI status, but at member state level the view could be different.
An academic argued that uncertainty of revenue streams and regulatory risk are what really kills a
project – and the consumer or producer focus is less relevant, as long as the revenue arrangements
are crystal clear and not likely to change.
A developer stated that this clarity, or lack thereof, of course determined the revenue stream.
Another major factor in financing is the timeframe of any approvals necessary. They pointed out
that the TYNDP only being published every two years was problematic, as partially two year old data
was not particularly useful. However it was being used by financiers as a key metric to determine
whether a project will proceed or not - although this had never been the TYNDP’s intended purpose.
Pg. Marítim de la Barceloneta, 37-49 08003 Barcelona www.medeas.eu [email protected] T +34 93 230 95 00 F +34 93 230 95 55
This project has received funding from the European Union’s Horizon 2020 research and innovation programme under grant agreement No 691287
351
It would be beneficial from a developer’s perspective for a project to get all approvals necessary
already in the early PCI stage. While there are reasons why this may be difficult including lack of
certainty regarding the overall costs of a project, for a developer it would be a major improvement.
Another attendee reasoned that cost-benefit allocations would play a major role in the future in 3rd
country connections – since many of the countries wishing to export renewable energy to the EU
are less wealthy than the EU, e.g. Northern African states, it was important that a transmission line
does not mean that the social or environmental cost of energy is exported. This needed to be taken
into account in future CBAs.
Another participant added that this is not only an issue for 3rd countries, especially those with a
lower purchasing power, but also a dilemma even for UK-France interconnectors as the nuclear risk
is borne predominantly by France. Additionally, they highlighted that the alternative was often
instead of North African RES, Polish coal or German lignite. Thus being against an interconnection
due to social issues being exported was myopic to what may replace the interconnection.
Developers generally supported the EU moving away from a 50:50 allocation of revenue and costs
for cross-border infrastructure and that this would also help a project to get funding from the
market. Nonetheless, in cases in which one state believed it should be 50:50, it was still complex
and the decision reached needed to also work for regulators, developers and other stakeholders.
Equally, there is the risk of member states not being prepared to accept less than 50%, be it
ownership costs or revenues, from a territorial sovereignty perspective or simply a perceived
governance of project perspective, which can cause some difficulties.
A representative of a regulating agency explained ACER’s cost benefit allocation rulings in cases in
which PCI project partners cannot agree within six months. Nonetheless, they emphasised that
there was not yet a structure in place to address issues of practicality in terms of how finance prices
future risk, e.g. how a force majeure would be defined. Many states have different perceptions on
what risks should be covered. These differences again create greater risk and make the project less
attractive for investors. There are furthermore unaddressed issues surrounding reaching an
acceptable income or what will happen if a fixed revenue stream falls away. If all of these issues
cannot be solved in ways that provide sufficient clarity for lenders/investors, then the projects will
fail to attract the investments needed. One partner in an interconnector explained that the issue
was the proof or definition of force majeure and what was outside of the other partners’ hands. In
which case the partner would still pay the floor. However, how this would be defined in a different
jurisdiction and who would bear that risk was more complex.
Pg. Marítim de la Barceloneta, 37-49 08003 Barcelona www.medeas.eu [email protected] T +34 93 230 95 00 F +34 93 230 95 55
This project has received funding from the European Union’s Horizon 2020 research and innovation programme under grant agreement No 691287
352
A developer underlined that there was also an issue of temporality creating difficulties and
increased risk for cross-border projects – if the countries involved had different timeframe
preferences or a differing sense of urgency and this could not be aligned, then investors would
perceive this risk again as too high. There are additionally differences in who is perceived to be a
suitable, acceptable investor in cross-border interconnection projects. On the European continent,
project partners for critical national infrastructure in this sector are almost exclusively the national
monopoly TSOs who know each other very well and frequently cooperate. Such trust will be more
complex if the party providing the funding, the equity participant or the project partners are, like is
the case in the UK, not from that country.
Small group discussion on governance issues
Coordination of different regimes is key. There is a need for cross-jurisdictional authority. On one
hand, in projects with two jurisdictions, that also means that project investors understand that it
will be more difficult to effect a change – positively or negatively. Countries will be less likely to
fundamentally change the income factors of an electricity project in this case, which makes it less
risky from a finance perspective.
One key issue that the group discussed was the lack of regulatory certainty and how this makes
actually investing quite difficult, because since investors may not know what their return is going to
be in five years, ten years, fifteen years’ time and infrastructure investments require much larger
sums invested in single assets.
Ultimately too many countries focus a lot on security of energy supply, but not on the positive role
interconnectors could play in this.
Arbitrage risks were another key point in discussion and that while this de-risks the project for the
investor, it moves it onto the consumer. Several attendees highlighted that regulators imposing
certain regulations on interconnector projects did not seem to fully understand how this meant that
the risk was moved from developer to consumer. There needs to be arbitrage coordination, but the
group could not agree on the parameters for that. The general lack of understanding for the
European Commission and regulators of certain project risks was highlighted. Another key point
that was made concerned the EU’s opposition to merchant investments or the EU not allowing using
transmission revenue for anything other than to lower prices or to re-invest. This in and of itself
deterred a lot of private capital, especially from abroad.
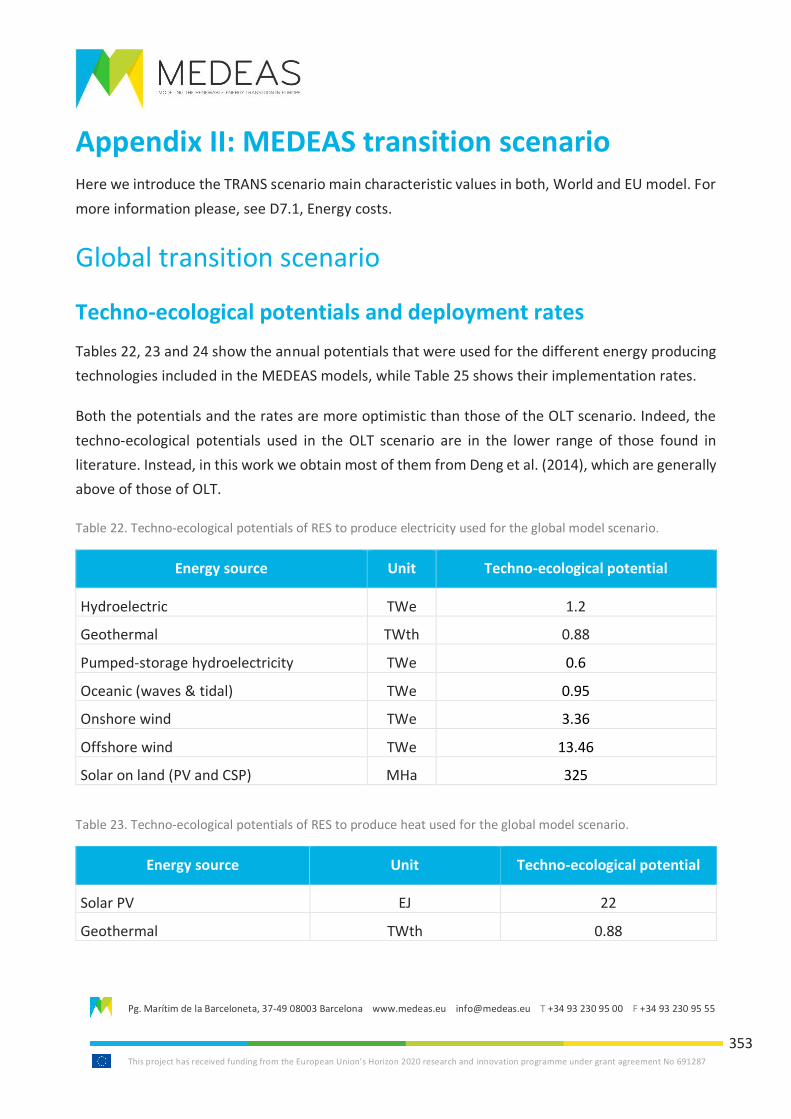
Pg. Marítim de la Barceloneta, 37-49 08003 Barcelona www.medeas.eu [email protected] T +34 93 230 95 00 F +34 93 230 95 55
This project has received funding from the European Union’s Horizon 2020 research and innovation programme under grant agreement No 691287
353
Appendix II: MEDEAS transition scenario Here we introduce the TRANS scenario main characteristic values in both, World and EU model. For
more information please, see D7.1, Energy costs.
Global transition scenario
Techno-ecological potentials and deployment rates
Tables 22, 23 and 24 show the annual potentials that were used for the different energy producing
technologies included in the MEDEAS models, while Table 25 shows their implementation rates.
Both the potentials and the rates are more optimistic than those of the OLT scenario. Indeed, the
techno-ecological potentials used in the OLT scenario are in the lower range of those found in
literature. Instead, in this work we obtain most of them from Deng et al. (2014), which are generally
above of those of OLT.
Table 22. Techno-ecological potentials of RES to produce electricity used for the global model scenario.
Energy source Unit Techno-ecological potential
Hydroelectric TWe 1.2
Geothermal TWth 0.88
Pumped-storage hydroelectricity TWe 0.6
Oceanic (waves & tidal) TWe 0.95
Onshore wind TWe 3.36
Offshore wind TWe 13.46
Solar on land (PV and CSP) MHa 325
Table 23. Techno-ecological potentials of RES to produce heat used for the global model scenario.
Energy source Unit Techno-ecological potential
Solar PV EJ 22
Geothermal TWth 0.88
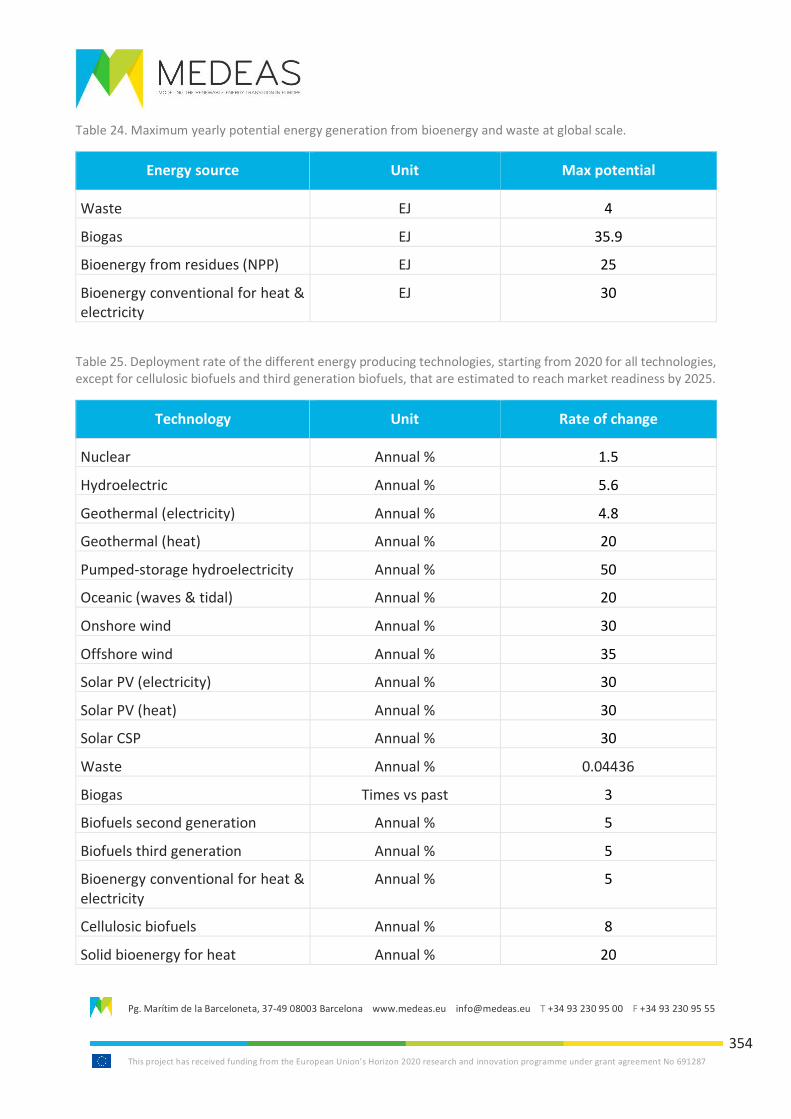
Pg. Marítim de la Barceloneta, 37-49 08003 Barcelona www.medeas.eu [email protected] T +34 93 230 95 00 F +34 93 230 95 55
This project has received funding from the European Union’s Horizon 2020 research and innovation programme under grant agreement No 691287
354
Table 24. Maximum yearly potential energy generation from bioenergy and waste at global scale.
Energy source Unit Max potential
Waste EJ 4
Biogas EJ 35.9
Bioenergy from residues (NPP) EJ 25
Bioenergy conventional for heat & electricity
EJ 30
Table 25. Deployment rate of the different energy producing technologies, starting from 2020 for all technologies, except for cellulosic biofuels and third generation biofuels, that are estimated to reach market readiness by 2025.
Technology Unit Rate of change
Nuclear Annual % 1.5
Hydroelectric Annual % 5.6
Geothermal (electricity) Annual % 4.8
Geothermal (heat) Annual % 20
Pumped-storage hydroelectricity Annual % 50
Oceanic (waves & tidal) Annual % 20
Onshore wind Annual % 30
Offshore wind Annual % 35
Solar PV (electricity) Annual % 30
Solar PV (heat) Annual % 30
Solar CSP Annual % 30
Waste Annual % 0.04436
Biogas Times vs past 3
Biofuels second generation Annual % 5
Biofuels third generation Annual % 5
Bioenergy conventional for heat & electricity
Annual % 5
Cellulosic biofuels Annual % 8
Solid bioenergy for heat Annual % 20
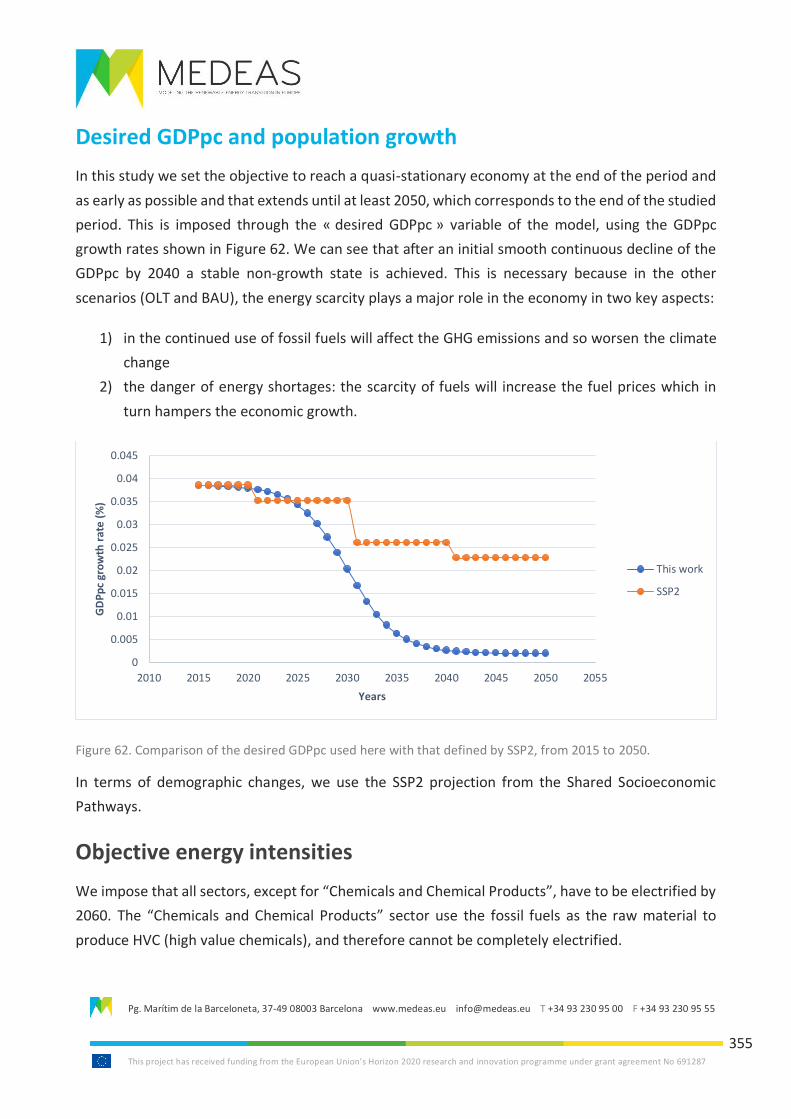
Pg. Marítim de la Barceloneta, 37-49 08003 Barcelona www.medeas.eu [email protected] T +34 93 230 95 00 F +34 93 230 95 55
This project has received funding from the European Union’s Horizon 2020 research and innovation programme under grant agreement No 691287
355
Desired GDPpc and population growth
In this study we set the objective to reach a quasi-stationary economy at the end of the period and
as early as possible and that extends until at least 2050, which corresponds to the end of the studied
period. This is imposed through the « desired GDPpc » variable of the model, using the GDPpc
growth rates shown in Figure 62. We can see that after an initial smooth continuous decline of the
GDPpc by 2040 a stable non-growth state is achieved. This is necessary because in the other
scenarios (OLT and BAU), the energy scarcity plays a major role in the economy in two key aspects:
1) in the continued use of fossil fuels will affect the GHG emissions and so worsen the climate
change
2) the danger of energy shortages: the scarcity of fuels will increase the fuel prices which in
turn hampers the economic growth.
Figure 62. Comparison of the desired GDPpc used here with that defined by SSP2, from 2015 to 2050.
In terms of demographic changes, we use the SSP2 projection from the Shared Socioeconomic
Pathways.
Objective energy intensities
We impose that all sectors, except for “Chemicals and Chemical Products”, have to be electrified by
2060. The “Chemicals and Chemical Products” sector use the fossil fuels as the raw material to
produce HVC (high value chemicals), and therefore cannot be completely electrified.
0
0.005
0.01
0.015
0.02
0.025
0.03
0.035
0.04
0.045
2010 2015 2020 2025 2030 2035 2040 2045 2050 2055
GD
Pp
c gr
ow
th r
ate
(%)
Years
This work
SSP2
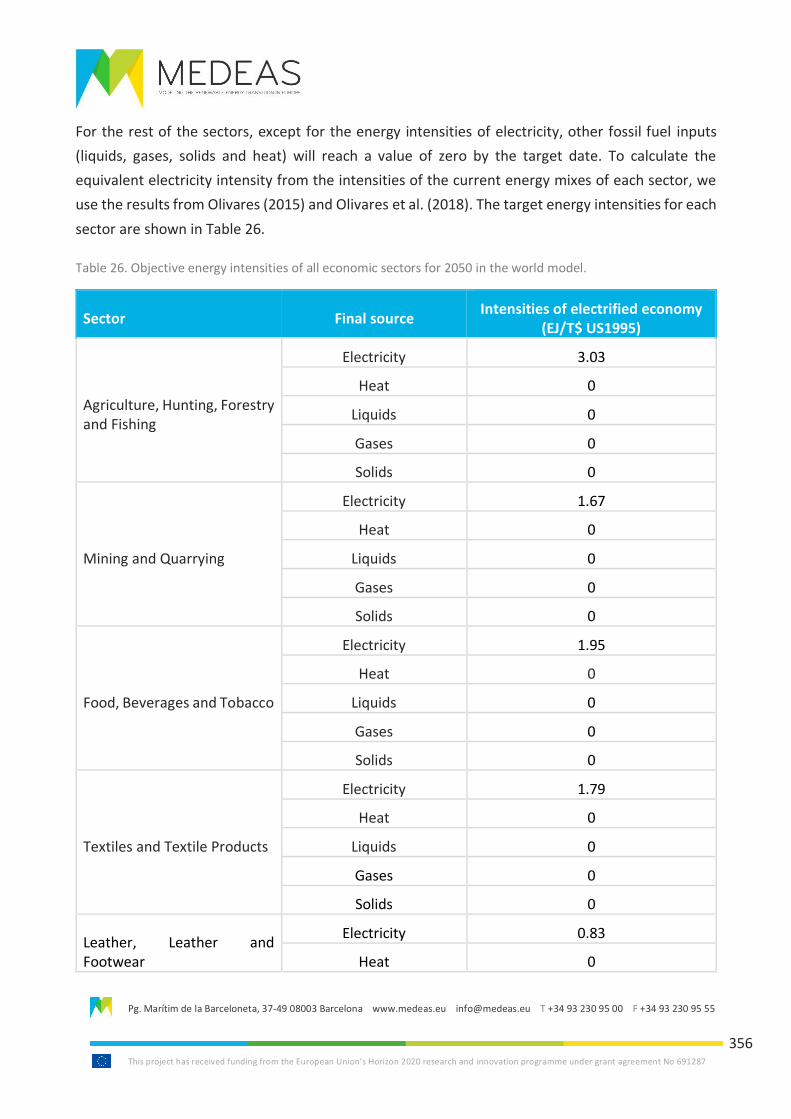
Pg. Marítim de la Barceloneta, 37-49 08003 Barcelona www.medeas.eu [email protected] T +34 93 230 95 00 F +34 93 230 95 55
This project has received funding from the European Union’s Horizon 2020 research and innovation programme under grant agreement No 691287
356
For the rest of the sectors, except for the energy intensities of electricity, other fossil fuel inputs
(liquids, gases, solids and heat) will reach a value of zero by the target date. To calculate the
equivalent electricity intensity from the intensities of the current energy mixes of each sector, we
use the results from Olivares (2015) and Olivares et al. (2018). The target energy intensities for each
sector are shown in Table 26.
Table 26. Objective energy intensities of all economic sectors for 2050 in the world model.
Sector Final source Intensities of electrified economy
(EJ/T$ US1995)
Agriculture, Hunting, Forestry and Fishing
Electricity 3.03
Heat 0
Liquids 0
Gases 0
Solids 0
Mining and Quarrying
Electricity 1.67
Heat 0
Liquids 0
Gases 0
Solids 0
Food, Beverages and Tobacco
Electricity 1.95
Heat 0
Liquids 0
Gases 0
Solids 0
Textiles and Textile Products
Electricity 1.79
Heat 0
Liquids 0
Gases 0
Solids 0
Leather, Leather and Footwear
Electricity 0.83
Heat 0
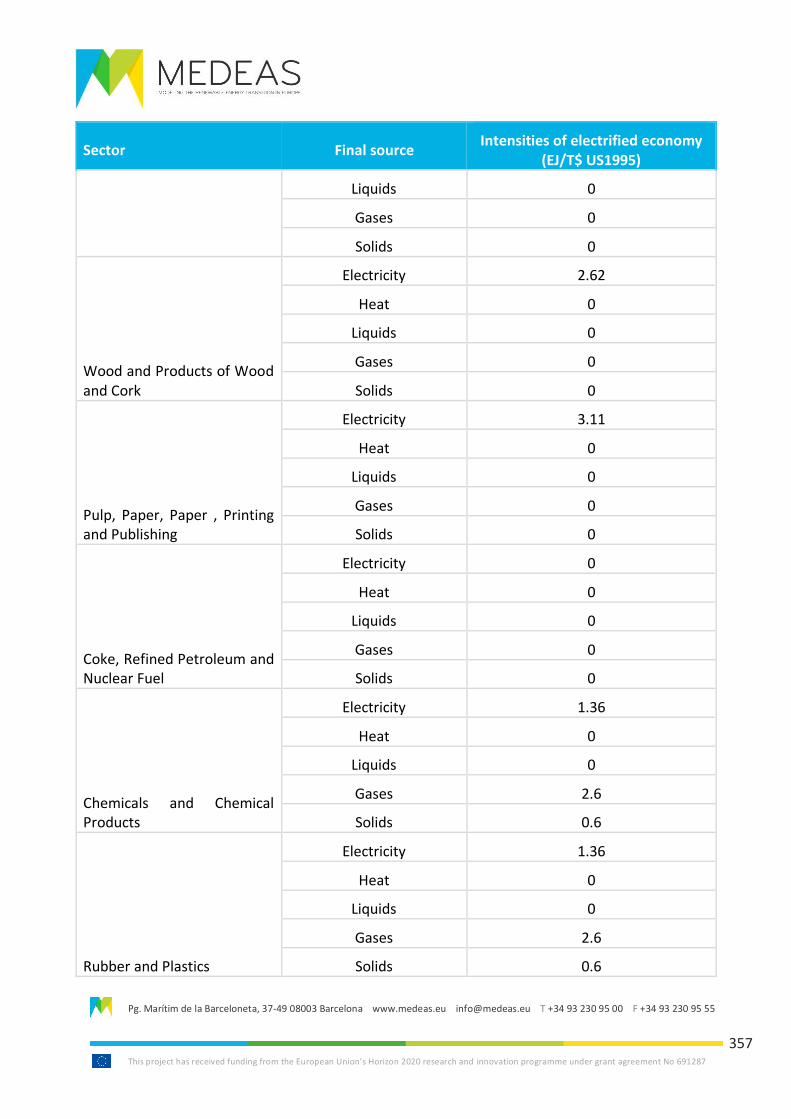
Pg. Marítim de la Barceloneta, 37-49 08003 Barcelona www.medeas.eu [email protected] T +34 93 230 95 00 F +34 93 230 95 55
This project has received funding from the European Union’s Horizon 2020 research and innovation programme under grant agreement No 691287
357
Sector Final source Intensities of electrified economy
(EJ/T$ US1995)
Liquids 0
Gases 0
Solids 0
Wood and Products of Wood and Cork
Electricity 2.62
Heat 0
Liquids 0
Gases 0
Solids 0
Pulp, Paper, Paper , Printing and Publishing
Electricity 3.11
Heat 0
Liquids 0
Gases 0
Solids 0
Coke, Refined Petroleum and Nuclear Fuel
Electricity 0
Heat 0
Liquids 0
Gases 0
Solids 0
Chemicals and Chemical Products
Electricity 1.36
Heat 0
Liquids 0
Gases 2.6
Solids 0.6
Rubber and Plastics
Electricity 1.36
Heat 0
Liquids 0
Gases 2.6
Solids 0.6
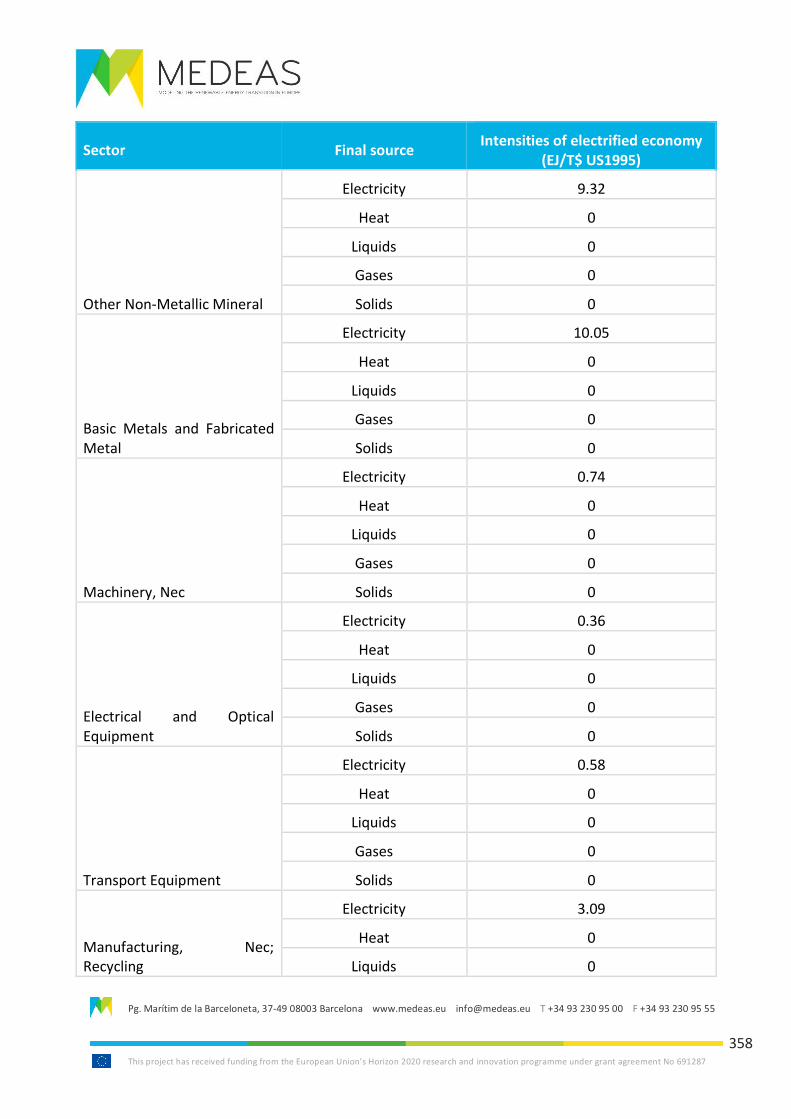
Pg. Marítim de la Barceloneta, 37-49 08003 Barcelona www.medeas.eu [email protected] T +34 93 230 95 00 F +34 93 230 95 55
This project has received funding from the European Union’s Horizon 2020 research and innovation programme under grant agreement No 691287
358
Sector Final source Intensities of electrified economy
(EJ/T$ US1995)
Other Non-Metallic Mineral
Electricity 9.32
Heat 0
Liquids 0
Gases 0
Solids 0
Basic Metals and Fabricated Metal
Electricity 10.05
Heat 0
Liquids 0
Gases 0
Solids 0
Machinery, Nec
Electricity 0.74
Heat 0
Liquids 0
Gases 0
Solids 0
Electrical and Optical Equipment
Electricity 0.36
Heat 0
Liquids 0
Gases 0
Solids 0
Transport Equipment
Electricity 0.58
Heat 0
Liquids 0
Gases 0
Solids 0
Manufacturing, Nec; Recycling
Electricity 3.09
Heat 0
Liquids 0
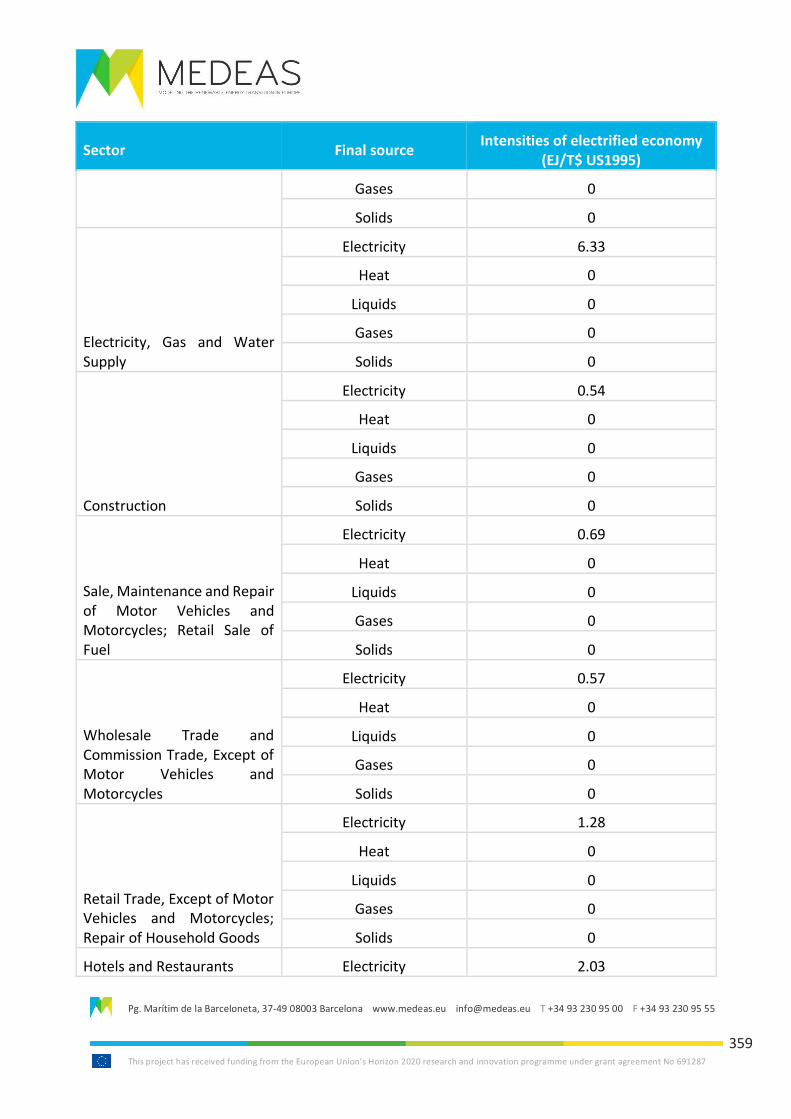
Pg. Marítim de la Barceloneta, 37-49 08003 Barcelona www.medeas.eu [email protected] T +34 93 230 95 00 F +34 93 230 95 55
This project has received funding from the European Union’s Horizon 2020 research and innovation programme under grant agreement No 691287
359
Sector Final source Intensities of electrified economy
(EJ/T$ US1995)
Gases 0
Solids 0
Electricity, Gas and Water Supply
Electricity 6.33
Heat 0
Liquids 0
Gases 0
Solids 0
Construction
Electricity 0.54
Heat 0
Liquids 0
Gases 0
Solids 0
Sale, Maintenance and Repair of Motor Vehicles and Motorcycles; Retail Sale of Fuel
Electricity 0.69
Heat 0
Liquids 0
Gases 0
Solids 0
Wholesale Trade and Commission Trade, Except of Motor Vehicles and Motorcycles
Electricity 0.57
Heat 0
Liquids 0
Gases 0
Solids 0
Retail Trade, Except of Motor Vehicles and Motorcycles; Repair of Household Goods
Electricity 1.28
Heat 0
Liquids 0
Gases 0
Solids 0
Hotels and Restaurants Electricity 2.03
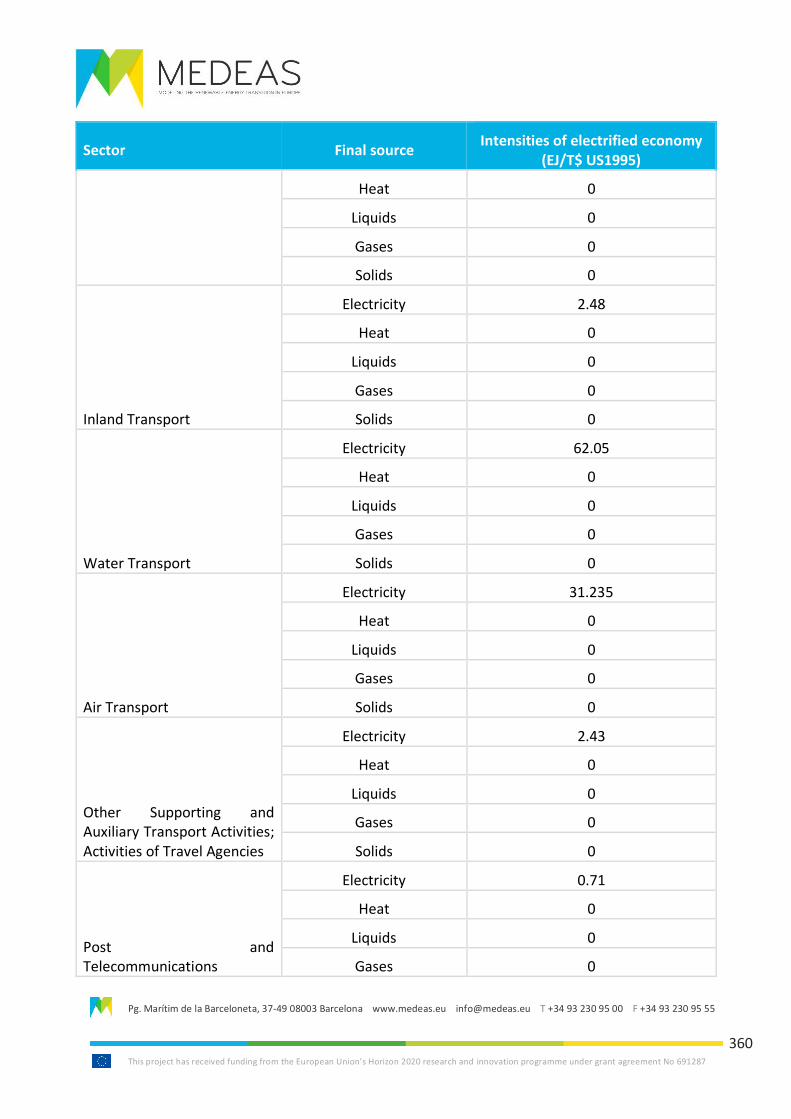
Pg. Marítim de la Barceloneta, 37-49 08003 Barcelona www.medeas.eu [email protected] T +34 93 230 95 00 F +34 93 230 95 55
This project has received funding from the European Union’s Horizon 2020 research and innovation programme under grant agreement No 691287
360
Sector Final source Intensities of electrified economy
(EJ/T$ US1995)
Heat 0
Liquids 0
Gases 0
Solids 0
Inland Transport
Electricity 2.48
Heat 0
Liquids 0
Gases 0
Solids 0
Water Transport
Electricity 62.05
Heat 0
Liquids 0
Gases 0
Solids 0
Air Transport
Electricity 31.235
Heat 0
Liquids 0
Gases 0
Solids 0
Other Supporting and Auxiliary Transport Activities; Activities of Travel Agencies
Electricity 2.43
Heat 0
Liquids 0
Gases 0
Solids 0
Post and Telecommunications
Electricity 0.71
Heat 0
Liquids 0
Gases 0
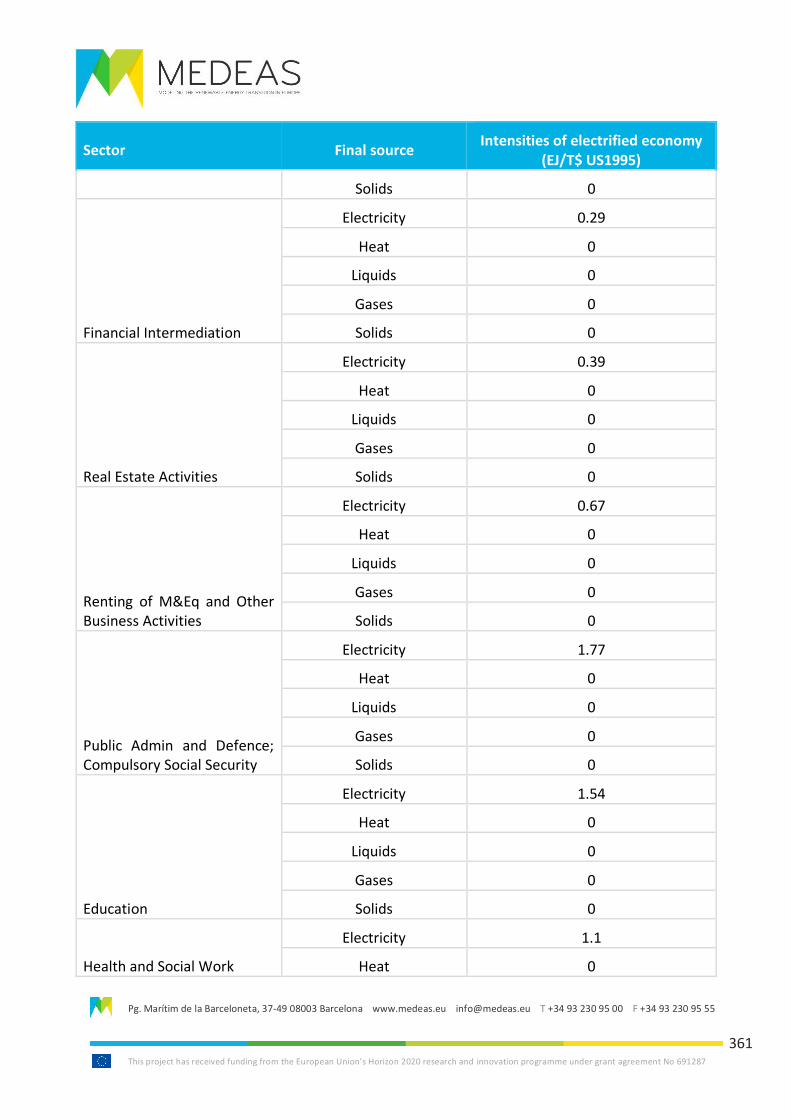
Pg. Marítim de la Barceloneta, 37-49 08003 Barcelona www.medeas.eu [email protected] T +34 93 230 95 00 F +34 93 230 95 55
This project has received funding from the European Union’s Horizon 2020 research and innovation programme under grant agreement No 691287
361
Sector Final source Intensities of electrified economy
(EJ/T$ US1995)
Solids 0
Financial Intermediation
Electricity 0.29
Heat 0
Liquids 0
Gases 0
Solids 0
Real Estate Activities
Electricity 0.39
Heat 0
Liquids 0
Gases 0
Solids 0
Renting of M&Eq and Other Business Activities
Electricity 0.67
Heat 0
Liquids 0
Gases 0
Solids 0
Public Admin and Defence; Compulsory Social Security
Electricity 1.77
Heat 0
Liquids 0
Gases 0
Solids 0
Education
Electricity 1.54
Heat 0
Liquids 0
Gases 0
Solids 0
Health and Social Work
Electricity 1.1
Heat 0
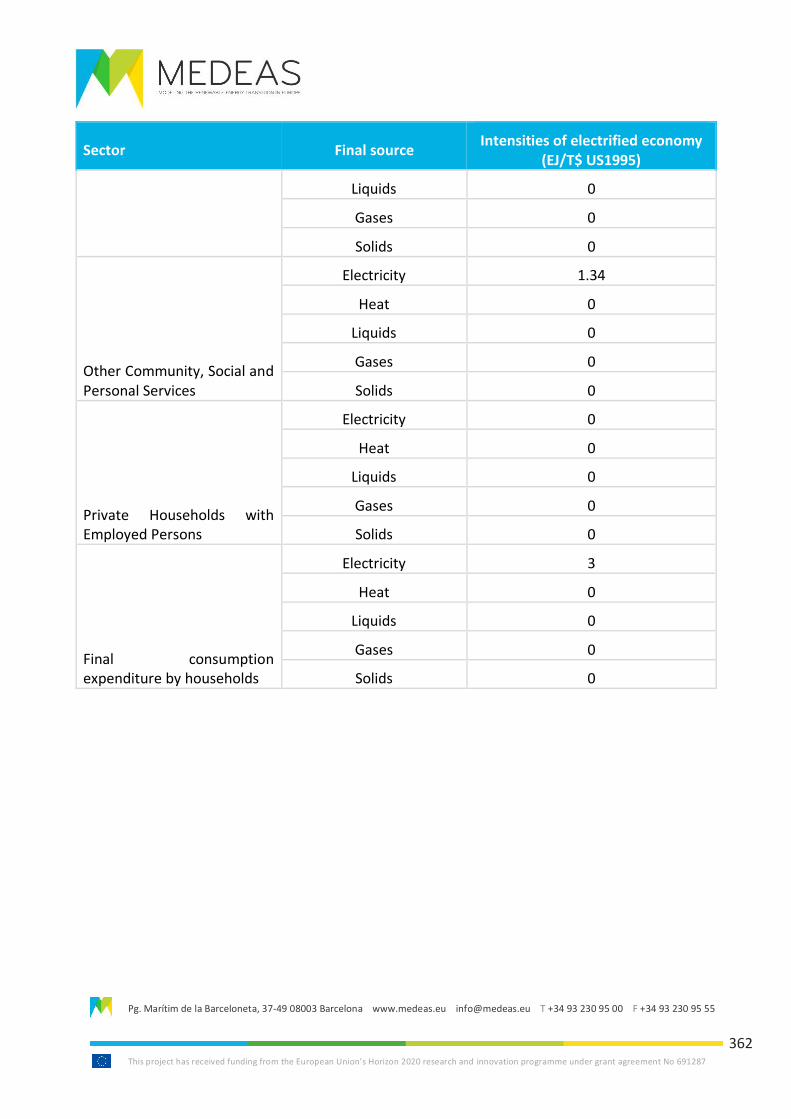
Pg. Marítim de la Barceloneta, 37-49 08003 Barcelona www.medeas.eu [email protected] T +34 93 230 95 00 F +34 93 230 95 55
This project has received funding from the European Union’s Horizon 2020 research and innovation programme under grant agreement No 691287
362
Sector Final source Intensities of electrified economy
(EJ/T$ US1995)
Liquids 0
Gases 0
Solids 0
Other Community, Social and Personal Services
Electricity 1.34
Heat 0
Liquids 0
Gases 0
Solids 0
Private Households with Employed Persons
Electricity 0
Heat 0
Liquids 0
Gases 0
Solids 0
Final consumption expenditure by households
Electricity 3
Heat 0
Liquids 0
Gases 0
Solids 0
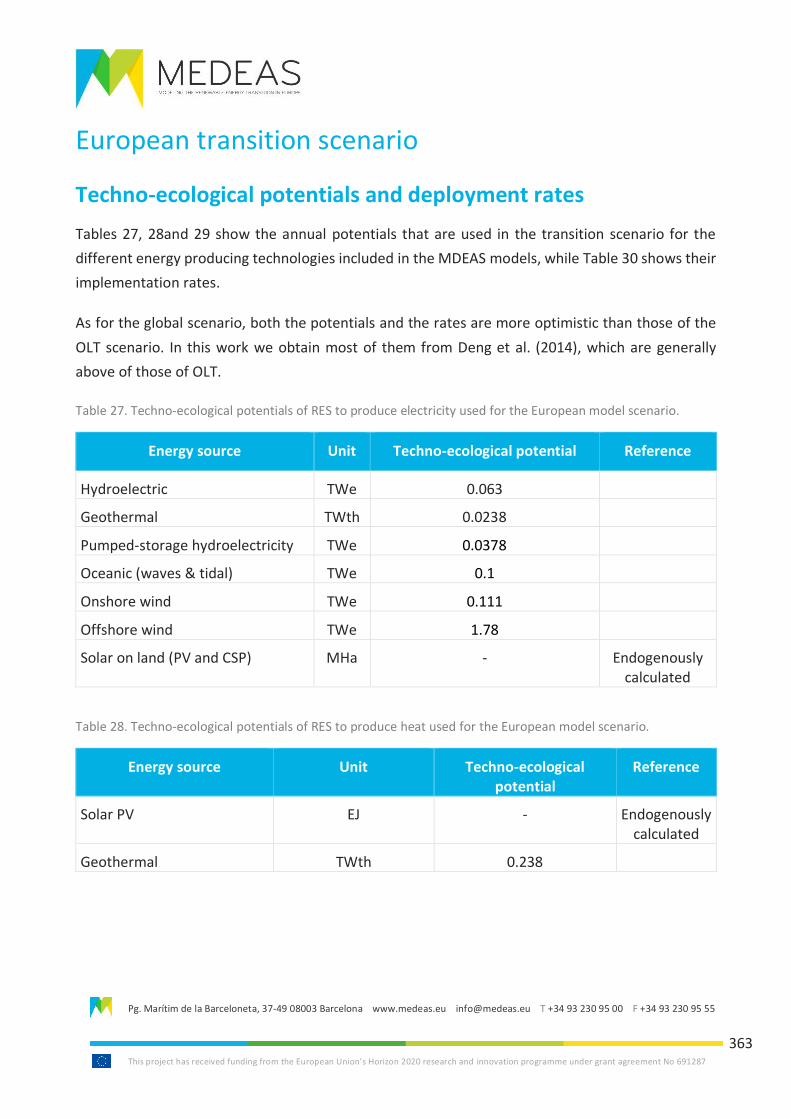
Pg. Marítim de la Barceloneta, 37-49 08003 Barcelona www.medeas.eu [email protected] T +34 93 230 95 00 F +34 93 230 95 55
This project has received funding from the European Union’s Horizon 2020 research and innovation programme under grant agreement No 691287
363
European transition scenario
Techno-ecological potentials and deployment rates
Tables 27, 28and 29 show the annual potentials that are used in the transition scenario for the
different energy producing technologies included in the MDEAS models, while Table 30 shows their
implementation rates.
As for the global scenario, both the potentials and the rates are more optimistic than those of the
OLT scenario. In this work we obtain most of them from Deng et al. (2014), which are generally
above of those of OLT.
Table 27. Techno-ecological potentials of RES to produce electricity used for the European model scenario.
Energy source Unit Techno-ecological potential Reference
Hydroelectric TWe 0.063
Geothermal TWth 0.0238
Pumped-storage hydroelectricity TWe 0.0378
Oceanic (waves & tidal) TWe 0.1
Onshore wind TWe 0.111
Offshore wind TWe 1.78
Solar on land (PV and CSP) MHa - Endogenously calculated
Table 28. Techno-ecological potentials of RES to produce heat used for the European model scenario.
Energy source Unit Techno-ecological potential
Reference
Solar PV EJ - Endogenously calculated
Geothermal TWth 0.238
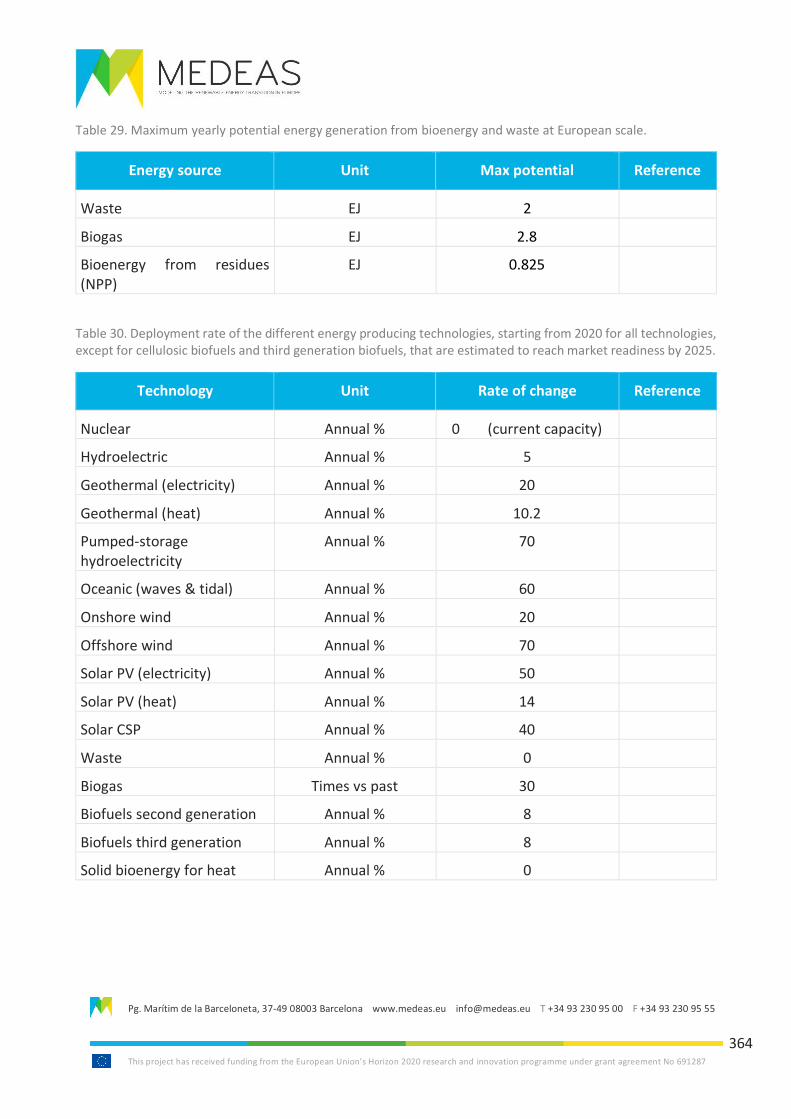
Pg. Marítim de la Barceloneta, 37-49 08003 Barcelona www.medeas.eu [email protected] T +34 93 230 95 00 F +34 93 230 95 55
This project has received funding from the European Union’s Horizon 2020 research and innovation programme under grant agreement No 691287
364
Table 29. Maximum yearly potential energy generation from bioenergy and waste at European scale.
Energy source Unit Max potential Reference
Waste EJ 2
Biogas EJ 2.8
Bioenergy from residues (NPP)
EJ 0.825
Table 30. Deployment rate of the different energy producing technologies, starting from 2020 for all technologies, except for cellulosic biofuels and third generation biofuels, that are estimated to reach market readiness by 2025.
Technology Unit Rate of change Reference
Nuclear Annual % 0 (current capacity)
Hydroelectric Annual % 5
Geothermal (electricity) Annual % 20
Geothermal (heat) Annual % 10.2
Pumped-storage hydroelectricity
Annual % 70
Oceanic (waves & tidal) Annual % 60
Onshore wind Annual % 20
Offshore wind Annual % 70
Solar PV (electricity) Annual % 50
Solar PV (heat) Annual % 14
Solar CSP Annual % 40
Waste Annual % 0
Biogas Times vs past 30
Biofuels second generation Annual % 8
Biofuels third generation Annual % 8
Solid bioenergy for heat Annual % 0
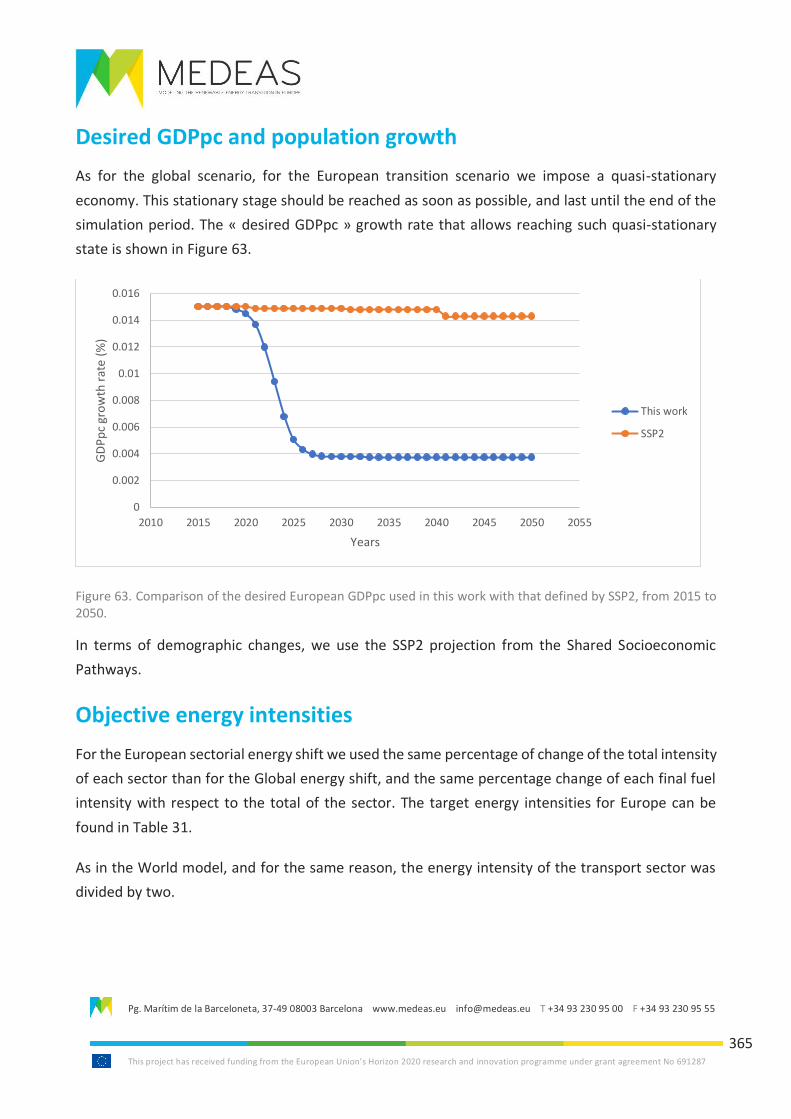
Pg. Marítim de la Barceloneta, 37-49 08003 Barcelona www.medeas.eu [email protected] T +34 93 230 95 00 F +34 93 230 95 55
This project has received funding from the European Union’s Horizon 2020 research and innovation programme under grant agreement No 691287
365
Desired GDPpc and population growth
As for the global scenario, for the European transition scenario we impose a quasi-stationary
economy. This stationary stage should be reached as soon as possible, and last until the end of the
simulation period. The « desired GDPpc » growth rate that allows reaching such quasi-stationary
state is shown in Figure 63.
Figure 63. Comparison of the desired European GDPpc used in this work with that defined by SSP2, from 2015 to 2050.
In terms of demographic changes, we use the SSP2 projection from the Shared Socioeconomic
Pathways.
Objective energy intensities
For the European sectorial energy shift we used the same percentage of change of the total intensity
of each sector than for the Global energy shift, and the same percentage change of each final fuel
intensity with respect to the total of the sector. The target energy intensities for Europe can be
found in Table 31.
As in the World model, and for the same reason, the energy intensity of the transport sector was
divided by two.
0
0.002
0.004
0.006
0.008
0.01
0.012
0.014
0.016
2010 2015 2020 2025 2030 2035 2040 2045 2050 2055
GD
Pp
c gr
ow
th r
ate
(%)
Years
This work
SSP2
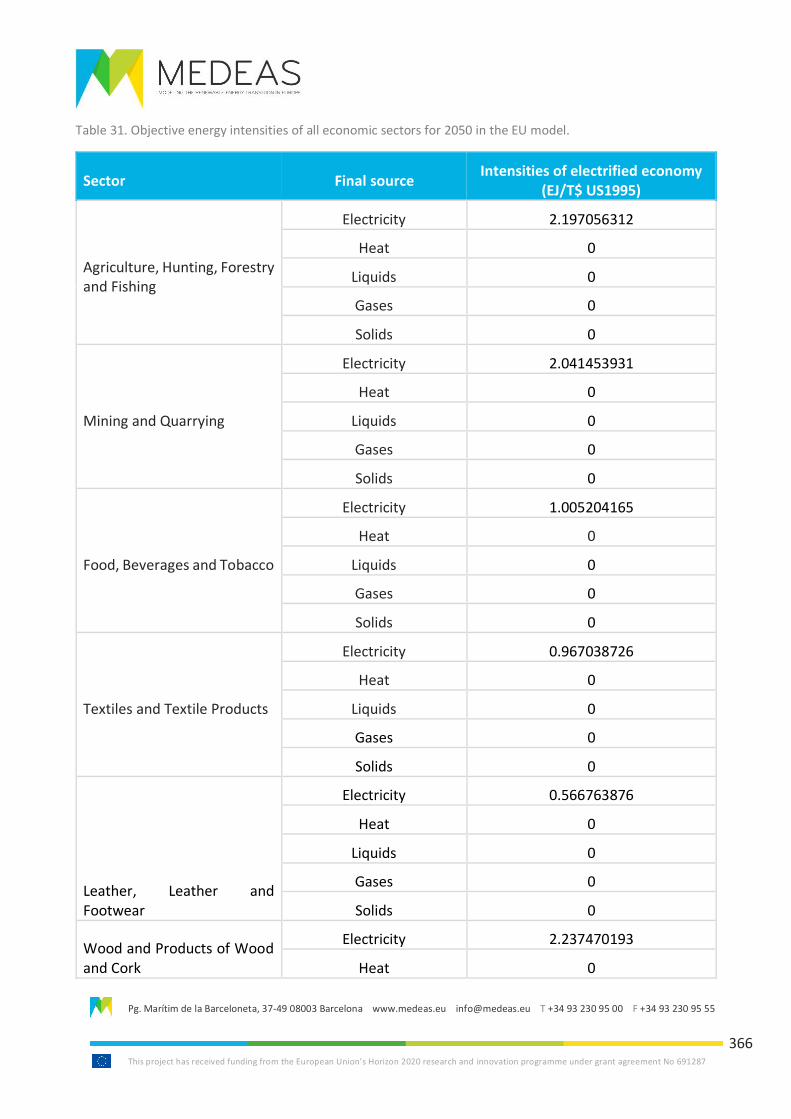
Pg. Marítim de la Barceloneta, 37-49 08003 Barcelona www.medeas.eu [email protected] T +34 93 230 95 00 F +34 93 230 95 55
This project has received funding from the European Union’s Horizon 2020 research and innovation programme under grant agreement No 691287
366
Table 31. Objective energy intensities of all economic sectors for 2050 in the EU model.
Sector Final source Intensities of electrified economy
(EJ/T$ US1995)
Agriculture, Hunting, Forestry and Fishing
Electricity 2.197056312
Heat 0
Liquids 0
Gases 0
Solids 0
Mining and Quarrying
Electricity 2.041453931
Heat 0
Liquids 0
Gases 0
Solids 0
Food, Beverages and Tobacco
Electricity 1.005204165
Heat 0
Liquids 0
Gases 0
Solids 0
Textiles and Textile Products
Electricity 0.967038726
Heat 0
Liquids 0
Gases 0
Solids 0
Leather, Leather and Footwear
Electricity 0.566763876
Heat 0
Liquids 0
Gases 0
Solids 0
Wood and Products of Wood and Cork
Electricity 2.237470193
Heat 0
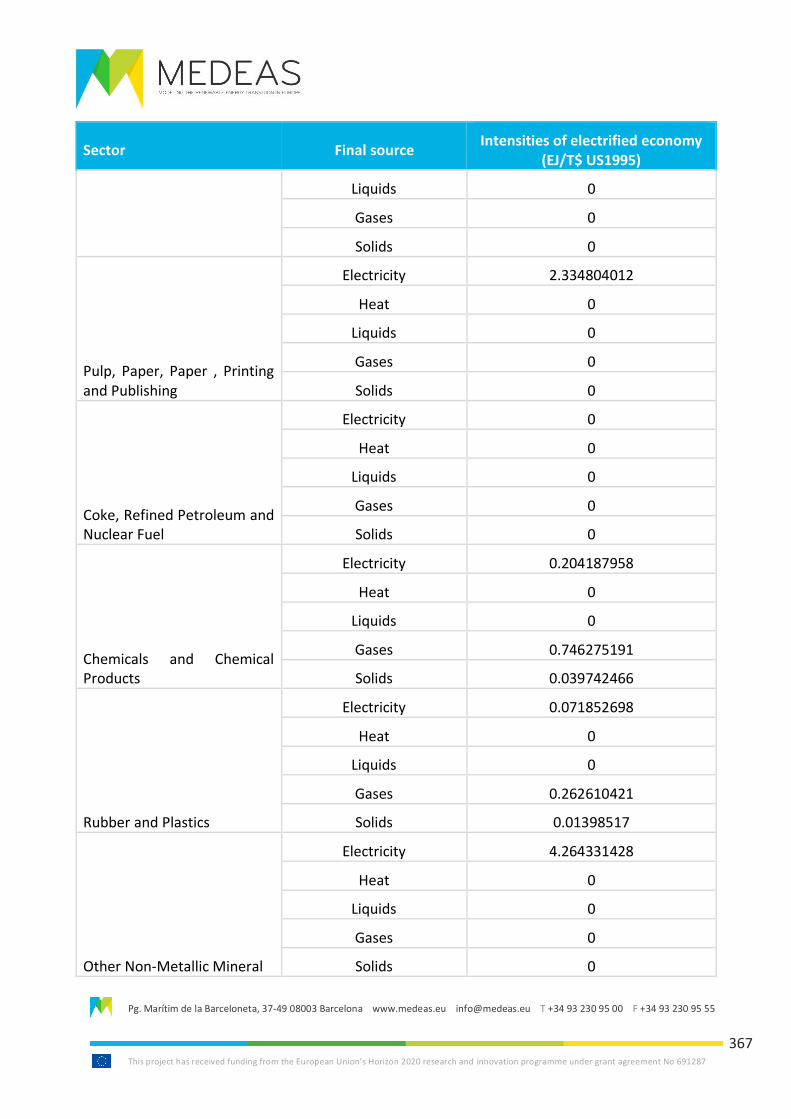
Pg. Marítim de la Barceloneta, 37-49 08003 Barcelona www.medeas.eu [email protected] T +34 93 230 95 00 F +34 93 230 95 55
This project has received funding from the European Union’s Horizon 2020 research and innovation programme under grant agreement No 691287
367
Sector Final source Intensities of electrified economy
(EJ/T$ US1995)
Liquids 0
Gases 0
Solids 0
Pulp, Paper, Paper , Printing and Publishing
Electricity 2.334804012
Heat 0
Liquids 0
Gases 0
Solids 0
Coke, Refined Petroleum and Nuclear Fuel
Electricity 0
Heat 0
Liquids 0
Gases 0
Solids 0
Chemicals and Chemical Products
Electricity 0.204187958
Heat 0
Liquids 0
Gases 0.746275191
Solids 0.039742466
Rubber and Plastics
Electricity 0.071852698
Heat 0
Liquids 0
Gases 0.262610421
Solids 0.01398517
Other Non-Metallic Mineral
Electricity 4.264331428
Heat 0
Liquids 0
Gases 0
Solids 0
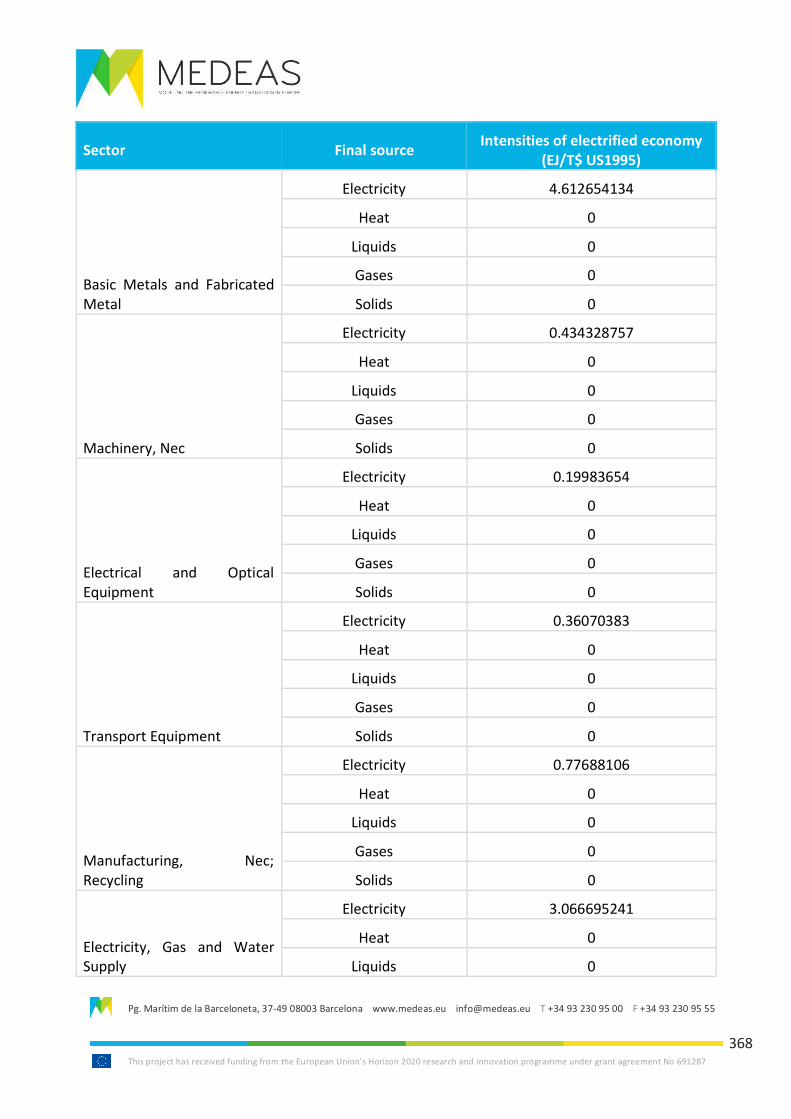
Pg. Marítim de la Barceloneta, 37-49 08003 Barcelona www.medeas.eu [email protected] T +34 93 230 95 00 F +34 93 230 95 55
This project has received funding from the European Union’s Horizon 2020 research and innovation programme under grant agreement No 691287
368
Sector Final source Intensities of electrified economy
(EJ/T$ US1995)
Basic Metals and Fabricated Metal
Electricity 4.612654134
Heat 0
Liquids 0
Gases 0
Solids 0
Machinery, Nec
Electricity 0.434328757
Heat 0
Liquids 0
Gases 0
Solids 0
Electrical and Optical Equipment
Electricity 0.19983654
Heat 0
Liquids 0
Gases 0
Solids 0
Transport Equipment
Electricity 0.36070383
Heat 0
Liquids 0
Gases 0
Solids 0
Manufacturing, Nec; Recycling
Electricity 0.77688106
Heat 0
Liquids 0
Gases 0
Solids 0
Electricity, Gas and Water Supply
Electricity 3.066695241
Heat 0
Liquids 0
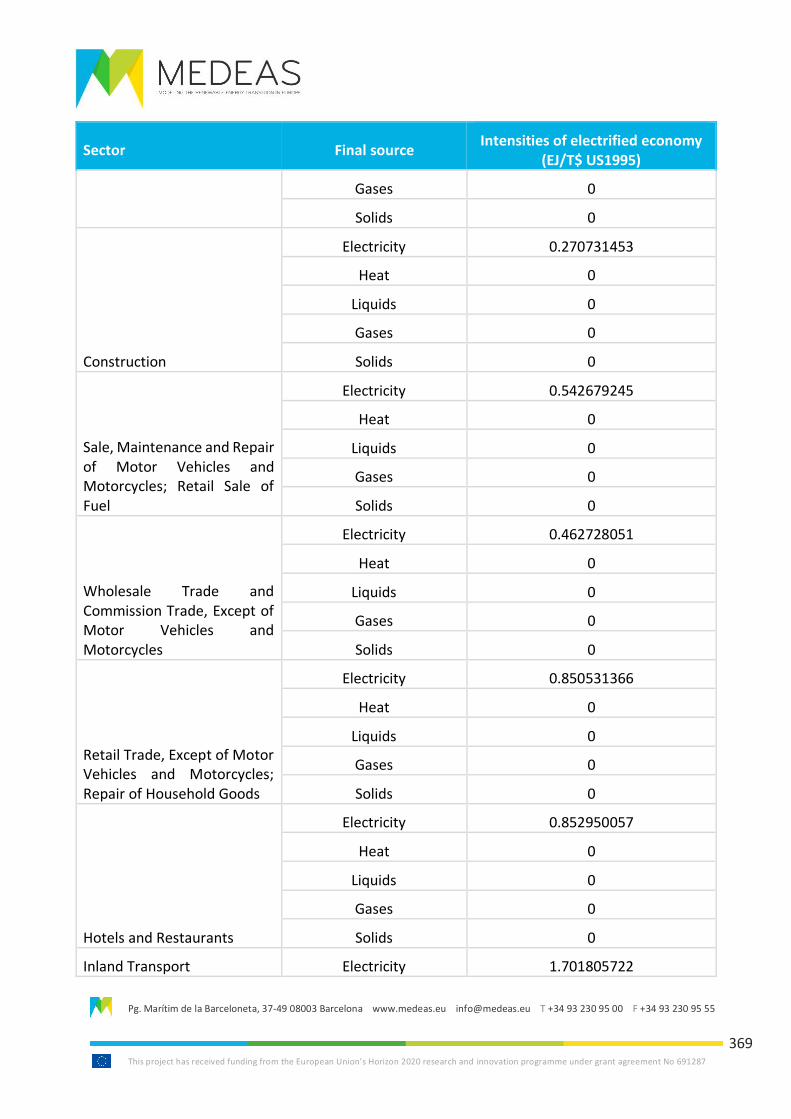
Pg. Marítim de la Barceloneta, 37-49 08003 Barcelona www.medeas.eu [email protected] T +34 93 230 95 00 F +34 93 230 95 55
This project has received funding from the European Union’s Horizon 2020 research and innovation programme under grant agreement No 691287
369
Sector Final source Intensities of electrified economy
(EJ/T$ US1995)
Gases 0
Solids 0
Construction
Electricity 0.270731453
Heat 0
Liquids 0
Gases 0
Solids 0
Sale, Maintenance and Repair of Motor Vehicles and Motorcycles; Retail Sale of Fuel
Electricity 0.542679245
Heat 0
Liquids 0
Gases 0
Solids 0
Wholesale Trade and Commission Trade, Except of Motor Vehicles and Motorcycles
Electricity 0.462728051
Heat 0
Liquids 0
Gases 0
Solids 0
Retail Trade, Except of Motor Vehicles and Motorcycles; Repair of Household Goods
Electricity 0.850531366
Heat 0
Liquids 0
Gases 0
Solids 0
Hotels and Restaurants
Electricity 0.852950057
Heat 0
Liquids 0
Gases 0
Solids 0
Inland Transport Electricity 1.701805722
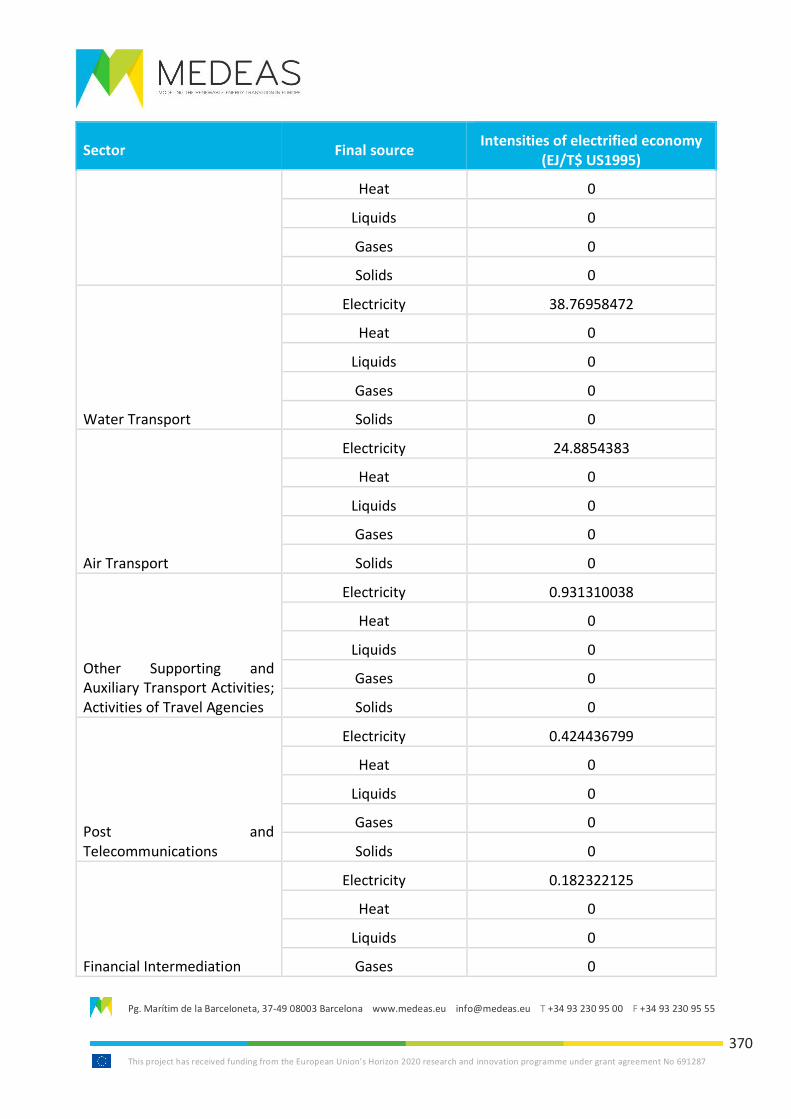
Pg. Marítim de la Barceloneta, 37-49 08003 Barcelona www.medeas.eu [email protected] T +34 93 230 95 00 F +34 93 230 95 55
This project has received funding from the European Union’s Horizon 2020 research and innovation programme under grant agreement No 691287
370
Sector Final source Intensities of electrified economy
(EJ/T$ US1995)
Heat 0
Liquids 0
Gases 0
Solids 0
Water Transport
Electricity 38.76958472
Heat 0
Liquids 0
Gases 0
Solids 0
Air Transport
Electricity 24.8854383
Heat 0
Liquids 0
Gases 0
Solids 0
Other Supporting and Auxiliary Transport Activities; Activities of Travel Agencies
Electricity 0.931310038
Heat 0
Liquids 0
Gases 0
Solids 0
Post and Telecommunications
Electricity 0.424436799
Heat 0
Liquids 0
Gases 0
Solids 0
Financial Intermediation
Electricity 0.182322125
Heat 0
Liquids 0
Gases 0
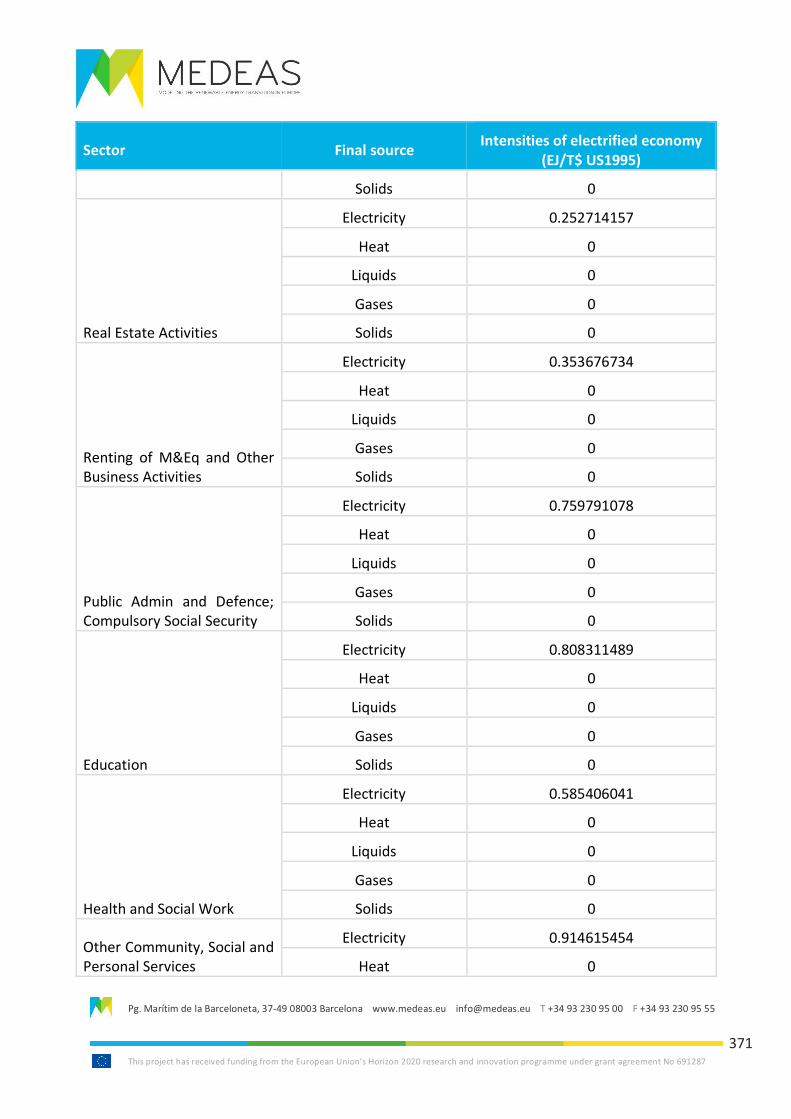
Pg. Marítim de la Barceloneta, 37-49 08003 Barcelona www.medeas.eu [email protected] T +34 93 230 95 00 F +34 93 230 95 55
This project has received funding from the European Union’s Horizon 2020 research and innovation programme under grant agreement No 691287
371
Sector Final source Intensities of electrified economy
(EJ/T$ US1995)
Solids 0
Real Estate Activities
Electricity 0.252714157
Heat 0
Liquids 0
Gases 0
Solids 0
Renting of M&Eq and Other Business Activities
Electricity 0.353676734
Heat 0
Liquids 0
Gases 0
Solids 0
Public Admin and Defence; Compulsory Social Security
Electricity 0.759791078
Heat 0
Liquids 0
Gases 0
Solids 0
Education
Electricity 0.808311489
Heat 0
Liquids 0
Gases 0
Solids 0
Health and Social Work
Electricity 0.585406041
Heat 0
Liquids 0
Gases 0
Solids 0
Other Community, Social and Personal Services
Electricity 0.914615454
Heat 0
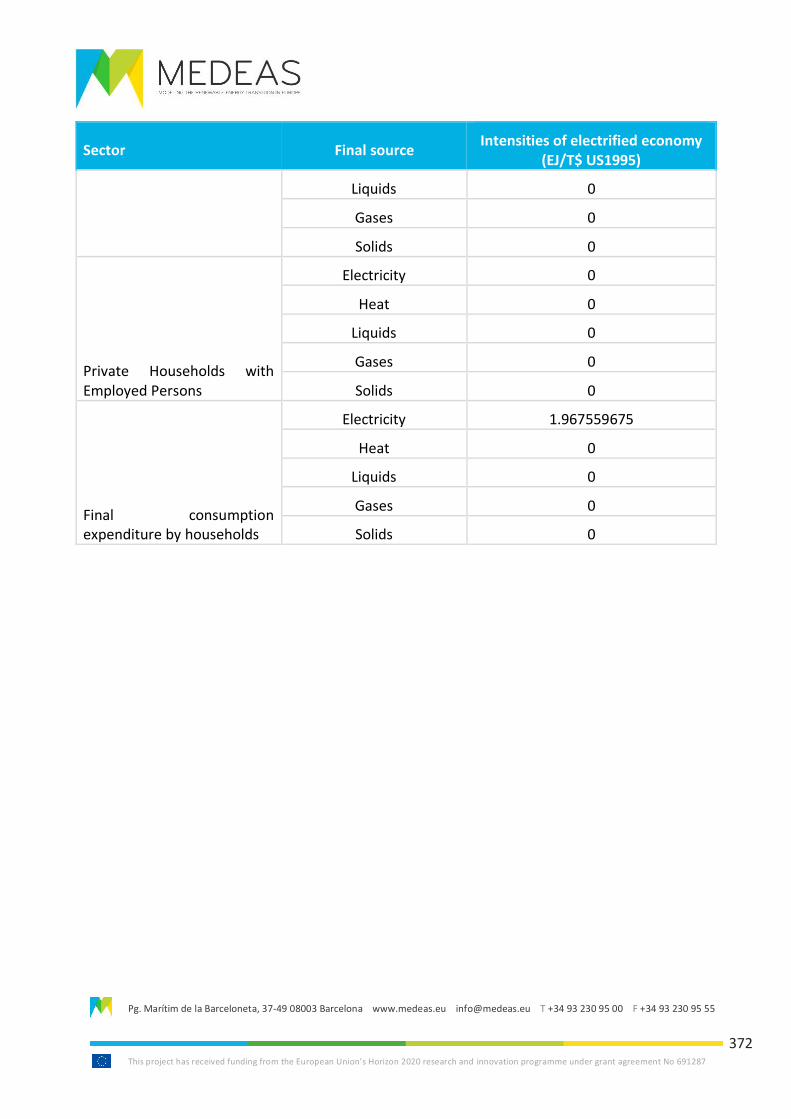
Pg. Marítim de la Barceloneta, 37-49 08003 Barcelona www.medeas.eu [email protected] T +34 93 230 95 00 F +34 93 230 95 55
This project has received funding from the European Union’s Horizon 2020 research and innovation programme under grant agreement No 691287
372
Sector Final source Intensities of electrified economy
(EJ/T$ US1995)
Liquids 0
Gases 0
Solids 0
Private Households with Employed Persons
Electricity 0
Heat 0
Liquids 0
Gases 0
Solids 0
Final consumption expenditure by households
Electricity 1.967559675
Heat 0
Liquids 0
Gases 0
Solids 0
Pg. Marítim de la Barceloneta, 37-49 08003 Barcelona www.medeas.eu [email protected] T +34 93 230 95 00 F +34 93 230 95 55
This project has received funding from the European Union’s Horizon 2020 research and innovation programme under grant agreement No 691287
373
List of Tables Table 1. Change in energy demand for heating and cooling using a central climate projection in a
business as usual scenario over a no climate impact scenario. ......................................................... 23
Table 2. Annual maximum growth rate of renewable technologies under each scenario
(MEDEAS_eu, Deliverable 6.1). .......................................................................................................... 85
Table 3. The main product groups with their share of the traded volume in 2008 (Goonan, 2011) and
their specific applications (Henderson et al., 2013; Lusty et al., 2010). ............................................ 89
Table 4. The five highest demand forecasts of Rare Earth oxides (REOs) in metric tons (Alonso et al.,
2012; Kingsnorth, 2010; Goonan, 2011). ........................................................................................... 92
Table 5. Annual growth rate of metal production (Moss et al., 2013). ............................................. 94
Table 6. Solar PV: metals requirement per MW (Moss et al., 2011). ................................................ 96
Table 7. Wind power: metals requirement per MW (Moss et al., 2011). ......................................... 96
Table 8. Biofuel power: metals requirement per MW (Moss et al., 2013)........................................ 96
Table 9. The production of REE ores in tonnes and the estimated reserves in tonnes per country.
(Data from Ober, 2017). ................................................................................................................... 100
Table 10. The major deposits, their estimated reserves of REEs in tonnes and the distribution of REEs
in %. (Kanazawa et al., 2006; Ober, 2017; Zhanheng, 2011). .......................................................... 102
Table 11. The production peak yielded by applying Hubbert’s approach (CIRCE, 2016). ............... 103
Table 12. MEDEAS_w results (as reported in Deliverable 4.1). Material availability by 2050 for each
scenario. Comparison of the cumulative extraction by 2050 with the level of reserves and resources.
“x” indicates that cumulated extraction > reserves/resources. ...................................................... 111
Table 13. Net present value (NPV) of net benefit (benefit-cost) of integration across North Sea
offshore wind projects under the main scenario (Konstantelos et al., 2017). Standard deviation is
also included which shows the possible range of NPV values given the number of assumptions
included in the scenario. .................................................................................................................. 169
Pg. Marítim de la Barceloneta, 37-49 08003 Barcelona www.medeas.eu [email protected] T +34 93 230 95 00 F +34 93 230 95 55
This project has received funding from the European Union’s Horizon 2020 research and innovation programme under grant agreement No 691287
374
Table 14. Variable name in the MEDEAS_eu model and their meaning. ........................................ 199
Table 15. Loads and flexibility options. ............................................................................................ 207
Table 16. Summary of MEDEAS scenarios ....................................................................................... 222
Table 17. Variables names and their meaning in the model simulations for both, World and EU
MEDEAS models. .............................................................................................................................. 227
Table 18. Official EU member definitions of energy poverty (Synthesized and adapted from Thomson
and Snell (2016) and Thomson and Bouzarovski (2018) ................................................................. 245
Table 19. Energy poverty variables available through the EU-SILC survey, adapted from Bollino and
Botti (2017) ...................................................................................................................................... 247
Table 20. EU policies tackling energy poverty ................................................................................. 248
Table 21. Organisations represented at the MEDEAS workshop .................................................... 344
Table 22. Techno-ecological potentials of RES to produce electricity used for the global model
scenario. ........................................................................................................................................... 353
Table 23. Techno-ecological potentials of RES to produce heat used for the global model scenario.
.......................................................................................................................................................... 353
Table 24. Maximum yearly potential energy generation from bioenergy and waste at global scale.
.......................................................................................................................................................... 354
Table 25. Deployment rate of the different energy producing technologies, starting from 2020 for
all technologies, except for cellulosic biofuels and third generation biofuels, that are estimated to
reach market readiness by 2025. ..................................................................................................... 354
Table 26. Objective energy intensities of all economic sectors for 2050 in the world model. ....... 356
Table 27. Techno-ecological potentials of RES to produce electricity used for the European model
scenario. ........................................................................................................................................... 363
Table 28. Techno-ecological potentials of RES to produce heat used for the European model
scenario. ........................................................................................................................................... 363
Pg. Marítim de la Barceloneta, 37-49 08003 Barcelona www.medeas.eu [email protected] T +34 93 230 95 00 F +34 93 230 95 55
This project has received funding from the European Union’s Horizon 2020 research and innovation programme under grant agreement No 691287
375
Table 29. Maximum yearly potential energy generation from bioenergy and waste at European
scale.................................................................................................................................................. 364
Table 30. Deployment rate of the different energy producing technologies, starting from 2020 for
all technologies, except for cellulosic biofuels and third generation biofuels, that are estimated to
reach market readiness by 2025. ..................................................................................................... 364
Table 31. Objective energy intensities of all economic sectors for 2050 in the EU model. ............ 366
Pg. Marítim de la Barceloneta, 37-49 08003 Barcelona www.medeas.eu [email protected] T +34 93 230 95 00 F +34 93 230 95 55
This project has received funding from the European Union’s Horizon 2020 research and innovation programme under grant agreement No 691287
376
List of Figures Figure 1. Years left of oil for each country in Europe calculated as domestic proved reserves divided
by annual domestic consumption. ..................................................................................................... 78
Figure 2. Years left of gas for each country in Europe calculated as domestic proved reserves divided
by annual domestic consumption. ..................................................................................................... 79
Figure 3. Years left of coal for each country in Europe calculated as domestic proved reserves divided
by annual domestic consumption. ..................................................................................................... 80
Figure 4. Investment in renewable energy between 2004 and 2016 (Bloomberg New Energy Finance,
2017) .................................................................................................................................................. 83
Figure 5. Production capacities for the different technology types under a Business as Usual scenario
(Deliverable 6.1, MEDEAS_eu 2018) .................................................................................................. 86
Figure 6. Demand growth curves for five REEs between 2008 and 2050. ........................................ 93
Figure 7. Price dynamics for selected Rare Earth Oxides between 2007 and 2013 in US$/kg (Golev et
al., 2014)............................................................................................................................................. 99
Figure 8. Main reasons for electricity and gas PCIs’ delays (Source: Ammermann, H. et al., Cost-
Effective Financing Structures for Mature Projects of Common Interest (PCIs) in Energy. Roland
Berger, November 2016, p. 8).......................................................................................................... 122
Figure 9. Capital expenditure required for European Transmission Infrastructure until 2020 and 2030
.......................................................................................................................................................... 123
Figure 10. European interconnectivity in 2012 and 2020. (Source: Tomas Gärdfors, European energy
infrastructure opportunities: Connecting the dots. Norton Rose Fulbright. September 2015, p. 20)
.......................................................................................................................................................... 126
Figure 11. Common risks of infrastructure projects (Source: Ammermann et al., 2016, p. 12) ..... 137
Figure 12. PCI financing challenge mitigation (Source: Ammermann et al., 2016, p. 22) ............... 137
Figure 13. Financeability (finance risks) of European TSOs (Source: DG ENER, 2015, p. 96) .......... 138
Pg. Marítim de la Barceloneta, 37-49 08003 Barcelona www.medeas.eu [email protected] T +34 93 230 95 00 F +34 93 230 95 55
This project has received funding from the European Union’s Horizon 2020 research and innovation programme under grant agreement No 691287
377
Figure 14. Conditions for interconnector exemption to regulated asset base operations (Source:
Poudineh and Rubino, 2016, p. 14).................................................................................................. 140
Figure 15. The main elements of a viable business model for interconnection investment (Source:
Poudineh and Rubino, 2016, p. 17).................................................................................................. 141
Figure 16. Exempted interconnectors in the EU (operating under the merchant transmission model)
(Source: Poudineh and Rubino, 2016, p. 15, based on Rubino and Cuomo, 2015) ........................ 142
Figure 17. YieldCo investment structure, component of the classification framework for institutional
investments in sustainable energy of a single deal (Source: OECD, 2015. “Mapping channels to
mobilise institutional investment in sustainable energy – OECD Report to G20 finance ministers and
central bank governors”, p. 79) ....................................................................................................... 152
Figure 18. Cross-border electricity investment incentive issues and possible solutions (Source:
Poudineh and Rubino, 2016, p. 18).................................................................................................. 156
Figure 19. Amount of the InterTSO Compensation Fund (2011-2017) in million € (Source: ACER,
Report to the European Commission on the implementation of the ITC mechanism in 2017, October
2018, p. 6) ........................................................................................................................................ 161
Figure 20. Causal loop diagram of a coupled electricity market (Source: Cepeda, 2018, p. 32) ..... 164
Figure 21. Main categories of the cost benefit analysis (Source: Figure 7 in ENTSO-E, 2018b) ...... 166
Figure 22. EUCO 2030 Generation mix scenario (Source: Figure 4.6 in ENTSO-E, 2018c), based on the
European Commission’s 2030 core policy targets, showing the potential linkages between the
electricity grids of various EU member states and neighbours. ...................................................... 168
Figure 23. Temperature change (a) population (b) cumulative emissions (c) and share of imports of
NRE vs. total primary energy consumption (d). BAU scenario; SCEN2: OLT scenario; SCEN 3: TRANS
scenario. ........................................................................................................................................... 198
Figure 24. (a) Desired GDP for EU (b) desired GDP variation for EU. BAU scenario; SCEN2: OLT
scenario; SCEN 3: TRANS scenario ................................................................................................... 200
Figure 25. Final energy total electricity generation for al renewable energy sources. BAU scenario;
SCEN2: OLT scenario; SCEN 3: TRANS scenario. .............................................................................. 201
Pg. Marítim de la Barceloneta, 37-49 08003 Barcelona www.medeas.eu [email protected] T +34 93 230 95 00 F +34 93 230 95 55
This project has received funding from the European Union’s Horizon 2020 research and innovation programme under grant agreement No 691287
378
Figure 26. Final energy electricity generation from non-renewable energy sources in terawatt hour.
BAU scenario; SCEN2: OLT scenario; SCEN 3: TRANS scenario. ....................................................... 202
Figure 27. Share of renewable energy sources for electricity generation. BAU scenario; SCEN2: OLT
scenario; SCEN 3: TRANS scenario. .................................................................................................. 203
Figure 29. Total final electricity demand in terawatt hour. BAU scenario; SCEN2: OLT scenario; SCEN
3: TRANS scenario. ........................................................................................................................... 204
Figure 29. Total capacity for electricity storage in terawatt. BAU scenario; SCEN2: OLT scenario; SCEN
3: TRANS scenario ............................................................................................................................ 205
Figure 30. Installed capacity for pumped-storage hydroelectricity in terawatt. BAU scenario; SCEN2:
OLT scenario; SCEN 3: TRANS scenario. ........................................................................................... 206
Figure 31. GDP per capita, total final energy consumption (all sources) per capita RES share and CO2
emission for World simulations in the three scenarios. BAU scenario; SCEN2: OLT scenario; SCEN 3:
TRANS scenario. (MEDEAS_w v1.3) ................................................................................................. 224
Figure 32. GDPpc, total final energy consumption (all sources) per capita, RES share and CO2
emission for EU simulations in the three scenarios. BAU scenario; SCEN2: OLT scenario; SCEN 3:
TRANS scenario. (MEDEAS_eu v1.2) ................................................................................................ 225
Figure 33. World simulation. Investment costs for RES implementation in the three scenarios: a)
Investment in RES for Electricity in Tera dollar US (T$), b) Cumulated investment, c) cumulated
investment in electric grid, d) share of monetary investment for variable RES. BAU scenario; SCEN2:
OLT scenario; SCEN 3: TRANS scenario. ........................................................................................... 228
Figure 34. EU simulation. Investment costs for RES implementation in the three scenarios: a)
Investment in RES for Electricity in Tera dollar US (T$), b) Cumulated investment, c) cumulated
investment in electric grid, d) share of monetary investment for variable RES. BAU scenario; SCEN2:
OLT scenario; SCEN 3: TRANS scenario. ........................................................................................... 229
Figure 35. Investments, consumption and imports. % Investments in TRANS and OLT compared with
BAU (a), imports in fossil fuels (b), Total consumption of NRE (in ExaJoules) (c), and imports
compared to year 2020 (d). ............................................................................................................. 230
Pg. Marítim de la Barceloneta, 37-49 08003 Barcelona www.medeas.eu [email protected] T +34 93 230 95 00 F +34 93 230 95 55
This project has received funding from the European Union’s Horizon 2020 research and innovation programme under grant agreement No 691287
379
Figure 36. Energy intensity (EJ per T$) : Total Primary Energy Supply per Tera $ (a), cost of NRES in
Tera $ (b), GDP for EU in T$, and cost of NRES compared with GDP for EU (%). ............................ 231
Figure 37. Cost of total primary energy supply and variation of costs ............................................ 232
Figure 38. Evolution of the retail price for household and industrial consumers and Renewables
Production Costs in the EU (€/MWh). RP = retail prices. (Source: Trujillo-Baute et al., 2018, p. 158)
.......................................................................................................................................................... 241
Figure 39. European share of renewables in energy mix and energy poverty. ............................... 249
Figure 40. Renewable energy in Europe (2016), Eurostat. .............................................................. 250
Figure 41. Energy poverty in Europe (map based on figures from Bollino and Botti, 2017, p. 498)
.......................................................................................................................................................... 250
Figure 42. Renewables and energy poverty .................................................................................... 253
Figure 43. Comparison of direct employment in wind energy sector, PV and CSP found in 27
publications (Source: Cameron and van der Zwaan, 2015) ............................................................. 257
Figure 44 : Total water user by O&M of RES for the BAU (green), OLT (blue) and TRANS (red)
scenarios. ......................................................................................................................................... 299
Figure 45 : Total water use and total water use by type for the BAU (green), OLT (blue) and TRANS
(red) scenarios. Note that the y-axis uses units of millions and billions of dam3. .......................... 299
Figure 46 : Total water use for the operation and maintenance of solar PV (blue line) and CSP (red
line) over time in the TRANS scenario. ............................................................................................ 300
Figure 47 : Electricity generation by CSP (left) and solar PV (right) for the TRANS scenario. ......... 300
Figure 48 : Water used by Electricity, gas and water supply sector for the BAU (green), OLT (blue)
and TRANS (red) scenarios. .............................................................................................................. 301
Figure 49 : Available land for the BAU (green), OLT (blue) and TRANS (red) scenarios. ................. 301
Figure 50 : Total land occupied by RES for the BAU (green), OLT (blue) and TRANS (red) scenarios.
.......................................................................................................................................................... 302
Pg. Marítim de la Barceloneta, 37-49 08003 Barcelona www.medeas.eu [email protected] T +34 93 230 95 00 F +34 93 230 95 55
This project has received funding from the European Union’s Horizon 2020 research and innovation programme under grant agreement No 691287
380
Figure 51: Land required by hydropower (top-left), onshore wind (top-right), solar PV on land
(bottom-left) and CSP (bottom-right), for the BAU (green), OLT (blue) and TRANS (red) scenarios.
.......................................................................................................................................................... 302
Figure 52 : Land dedicated to grow crops for biofuels production for the BAU (green), OLT (blue) and
TRANS (red) scenarios. ..................................................................................................................... 303
Figure 53 : Natural lands not affected by human activities, for the BAU (green), OLT (blue) and TRANS
(red) scenarios.................................................................................................................................. 303
Figure 54 : Cumulative GHG emissions for the BAU (green), OLT (blue) and TRANS (red) scenarios.
.......................................................................................................................................................... 304
Figure 55 : Per capita carbon footprint, for the BAU (green), OLT (blue) and TRANS (red) scenarios.
.......................................................................................................................................................... 304
Figure 56 : Demand of storage in TW for the BAU (green), OLT (blue) and TRANS (red) scenarios.
.......................................................................................................................................................... 305
Figure 57 : Storage capacity of PHS technology in TW for the BAU (green), OLT (blue) and TRANS
(red) scenarios.................................................................................................................................. 306
Figure 58 : Total storage capacity of all EV batteries available (left) and fraction of that capacity
dedicated to store electricity in the power gird (right) in TW for the BAU (green), OLT (blue) and
TRANS (red) scenarios. ..................................................................................................................... 306
Figure 59 : Cumulative materials extraction to produce EV batteries: Aluminium (top-left), Copper
(top-right), Lithium (middle-left), Manganese (middle-right) and plastics (bottom), for the BAU
(green), OLT (blue) and TRANS (red) scenarios. .............................................................................. 307
Figure 60 : Installed nuclear capacity for the BAU (green), OLT (blue) and TRANS (red) scenarios.
.......................................................................................................................................................... 308
Figure 61 : Total consumption of non-renewable energy sources (in EJ) for the BAU (green), OLT
(blue) and TRANS (red) scenarios. ................................................................................................... 308
Figure 62. Comparison of the desired GDPpc used here with that defined by SSP2, from 2015 to
2050.................................................................................................................................................. 355

Pg. Marítim de la Barceloneta, 37-49 08003 Barcelona www.medeas.eu [email protected] T +34 93 230 95 00 F +34 93 230 95 55
This project has received funding from the European Union’s Horizon 2020 research and innovation programme under grant agreement No 691287
381
Figure 63. Comparison of the desired European GDPpc used in this work with that defined by SSP2,
from 2015 to 2050. .......................................................................................................................... 365