energy transition - Archivo Digital UPM
164
Universidad Politécnica de Madrid Escuela Técnica Superior de Ingenieros Industriales TRABAJO DE FIN DE GRADO EN INGENIERÍA EN TECNOLOGÍAS INDUSTRIALES ENERGY TRANSITION: ENABLING TECHNOLOGIES FOR DEMAND FLEXIBILITY, REGULATION & BUSINESS MODELS Alumno: Jesús Santiago Silvestre Bengoa Tutor: Isabel Ortiz Noviembre 2018 Madrid
-
Upload
khangminh22 -
Category
Documents
-
view
7 -
download
0
Transcript of energy transition - Archivo Digital UPM

Universidad Politécnica de Madrid
Escuela Técnica Superior de Ingenieros Industriales
TRABAJO DE FIN DE GRADO
EN INGENIERÍA EN TECNOLOGÍAS INDUSTRIALES
ENERGY TRANSITION:
ENABLING TECHNOLOGIES FOR
DEMAND FLEXIBILITY, REGULATION &
BUSINESS MODELS
Alumno:
Jesús Santiago Silvestre Bengoa
Tutor:
Isabel Ortiz
Noviembre 2018
Madrid

2 Escuela Técnica Superior de Ingenieros Industriales UPM

Jesús Santiago Silvestre Bengoa 3
“It is not the strongest of the species that survives, nor the most
intelligent that survives. It is the one that is most adaptable to
change.”
Charles Darwin

4 Escuela Técnica Superior de Ingenieros Industriales UPM

Jesús Santiago Silvestre Bengoa 5
Acknowledgments
This Project is dedicated to:
My Everis workmates, due to their help.
My Project tutors, at Everis and at the University.
My family and friends, due to their support during this year.

6 Escuela Técnica Superior de Ingenieros Industriales UPM

Jesús Santiago Silvestre Bengoa 7
CONTENTS INDEX
1. RESUMEN EN ESPAÑOL ................................................................................ 11
1.1. RESUMEN EJECUTIVO............................................................................. 11
1.2. INTRODUCCIÓN Y MOTIVACIÓN ............................................................. 13
1.3. OBJETIVOS ............................................................................................... 14
1.4. CONTEXTO ............................................................................................... 15
1.5. Tecnologías habilitadoras de la flexibilidad de la demanda ........................ 19
1.5.1. Energy Storage.............................................................................................. 19
1.5.2. Electric Vehicle (EV) ...................................................................................... 21
1.5.3. Smart Loads .................................................................................................. 22
1.5.4. Distributed Generation ................................................................................... 24
1.5.5. Grid Scale Generation ................................................................................... 25
1.5.6. Energy Management System (EMS) .............................................................. 25
1.5.7. Virtual Power Plant (VPP) .............................................................................. 26
1.6. MARCO REGULATORIO ........................................................................... 26
1.6.1. Estados Unidos ............................................................................................. 26
1.6.2. Europa .......................................................................................................... 28
1.7. CASOS DE NEGOCIO ............................................................................... 29
1.7.1. Optimización de contratos ............................................................................. 29
1.7.2. Comercio en el mercado mayorista ................................................................ 30
1.8. CONCLUSIONES ....................................................................................... 30
2. EXECUTIVE SUMMARY ................................................................................... 33
3. INTRODUCTION, OBJETIVES AND STRUCTURE .......................................... 35
3.1. INTRODUCTION ........................................................................................ 35
3.2. OBJECTIVES ............................................................................................. 36
3.3. STRUCTURE ............................................................................................. 37
4. CONTEXT ......................................................................................................... 39
4.1. FUNDAMENTAL KNOWLEDGE ................................................................. 39
4.2. SYSTEM CONTROL .................................................................................. 41
4.3. POWER SECTOR TRANSITION ................................................................ 47
4.3.1. DERs............................................................................................................. 47
4.3.2. ICTs / price-responsible demand ................................................................... 48
4.3.3. Interconnectedness ....................................................................................... 48
4.3.4. Renewable energy resources ........................................................................ 49
4.3.5. Global climate change mitigation efforts ......................................................... 51
5. ENABLING TECHNOLOGIES FOR DEMAND FLEXIBILITY ........................... 53
5.1. INTRODUCTION ........................................................................................ 53
5.2. ENERGY STORAGE .................................................................................. 57

8 Escuela Técnica Superior de Ingenieros Industriales UPM
5.2.1. Lead acid batteries ........................................................................................ 57
5.2.2. High temperature batteries............................................................................. 59
5.2.3. Flow batteries ................................................................................................ 60
5.2.4. Lithium ion ..................................................................................................... 64
5.2.5. Conclusion .................................................................................................... 67
5.3. ELECTRIC VEHICLE (EV) ......................................................................... 68
5.3.1. Conclusion .................................................................................................... 71
5.4. SMART LOADS .......................................................................................... 72
5.4.1. Conclusion .................................................................................................... 76
5.5. Distributed Generation ................................................................................ 76
5.5.1. Solar PV ........................................................................................................ 77
5.5.2. Conclusion .................................................................................................... 80
5.6. GRID SCALE GENERATION ..................................................................... 81
5.6.1. Wind Power ................................................................................................... 81
5.6.2. Non-conventional wind power ........................................................................ 89
5.6.3. Solar PV ........................................................................................................ 89
5.6.4. Conclusion .................................................................................................... 90
5.7. ENERGY MANAGEMENT SYSTEM (EMS) ............................................... 90
5.7.1. Home Energy Management System (HEMS) ................................................. 90
5.7.2. Building Energy Management System (BEMS) .............................................. 91
5.7.3. Conclusion .................................................................................................... 94
5.8. VIRTUAL POWER PLANT (VPP) ............................................................... 94
6. REGULATORY FRAMEWORK......................................................................... 97
6.1. UNITED STATES ....................................................................................... 97
6.1.1. Introduction ................................................................................................... 97
6.1.2. Natural monopolies and competition .............................................................. 98
6.1.3. Wholesale Markets in the U.S. ....................................................................... 99
6.1.4. Retail Electricity Markets in the US .............................................................. 100
6.1.5. Flexibility in the U.S. market ......................................................................... 101
6.1.6. NYISO ......................................................................................................... 104
6.1.7. CAISO ......................................................................................................... 105
6.1.8. Summary and Conclusions .......................................................................... 106
6.2. EUROPE .................................................................................................. 108
6.2.1. Introduction ................................................................................................. 108
6.2.2. Winter Package ........................................................................................... 109
6.2.3. Germany ..................................................................................................... 115
6.2.4. United Kingdom ........................................................................................... 116
6.2.5. France ......................................................................................................... 118
6.2.6. Summary and conclusions ........................................................................... 120

Jesús Santiago Silvestre Bengoa 9
6.3. CONCLUSION ......................................................................................... 121
7. BUSINESS CASES AND CASE STUDIES ..................................................... 123
7.1. THEORETICAL CASES ........................................................................... 123
7.1.1. Contract optimization ................................................................................... 123
7.1.2. Trade on the wholesale market .................................................................... 123
7.1.3. Balancing group settlement.......................................................................... 123
7.1.4. Offer reserve capacity .................................................................................. 124
7.1.5. Local system management .......................................................................... 124
7.1.6. Large scale grid stabilization services .......................................................... 124
7.2. REAL CASES ........................................................................................... 124
7.2.1. Case 1: Real-Time Pricing ........................................................................... 124
7.2.2. Case 2: Residential Demand Charges ......................................................... 127
7.2.3. Case 3: Non-Exporting Rooftop Solar PV Rate ............................................ 130
7.2.4. Case 4: Avoided Cost Compensation for Exported PV ................................. 133
8. CONCLUSIONS .............................................................................................. 137
8.1. CONCLUSIONS ....................................................................................... 137
8.2. FUTURE INVESTIGATION LINES ........................................................... 139
9. IMPACT VALUATION. SOCIAL AND PROFESSIONAL RESPONSIBILITY .. 141
9.1. SOCIO-ECONOMIC IMPACT ................................................................... 141
9.2. ENVIRONMENTAL IMPACT .................................................................... 141
9.3. SOCIAL AND PROFESSIONAL RESPONSIBILITY ................................. 143
10. PLANNING AND BUDGET ......................................................................... 145
10.1. PLANNING ........................................................................................... 145
10.2. BUDGET ............................................................................................... 149
10.2.1. Costs of human resources ........................................................................... 149
10.2.2. Costs of material resources ......................................................................... 149
10.2.3. Project final cost .......................................................................................... 150
10. BIBLIOGRAPHY .............................................................................................. 151
11. FIGURES INDEX .............................................................................................. 159
12. TABLES INDEX ............................................................................................... 163

10 Escuela Técnica Superior de Ingenieros Industriales UPM

Jesús Santiago Silvestre Bengoa 11
1. RESUMEN EN ESPAÑOL
Este resumen en español del TFG “Energy Transition: Enabling Technologies for
Demand Flexibility, Regulation & Business Models” trata de explicar las nociones
y temáticas básicas que se presentan en el proyecto. Se comienza con un resumen
ejecutivo para después exponer la motivación y objetivos y posteriormente analizar los
tres puntos principales de manera más detallada.
En el presente resumen no se incluyen referencias ni datos bibliográficos, de la misma
manera que tampoco se añaden gráficos, tablas ni figuras al estar todo ello en el
proyecto como tal. Solo se incluyen reseñas dirigidas al trabajo principal en inglés
cuando los conceptos explicados necesiten de mayor profundización para ser
entendidos.
1.1. RESUMEN EJECUTIVO
Hoy en día, la energía eléctrica se considera esencial, ya que es un producto
consumible básico. La forma en que evoluciona la sociedad la hace cada vez más
dependiente de la tecnología, lo que implica una dependencia también de la energía
eléctrica. La eficiencia del sistema eléctrico no solo tiene repercusiones económicas,
sino que también influye en el entorno social y ambiental.
De esta manera, en los últimos años, las compañías más grandes y los países más
avanzados han estado pensando en un nuevo modelo y mercado de energía eléctrica,
en el que se prioricen la eficiencia, la seguridad, el autoconsumo y la flexibilidad de la
demanda (Demand Flexibility). Esto se conoce como la transición energética que
consiste básicamente en un nuevo mercado de energía que evita el mercado
tradicional y vertical donde la electricidad va de los generadores a los consumidores a
través de los Transmission System Operators (TSO) y de los Distributed System
Operators (DSO). En este nuevo mercado, los clientes se convierten en jugadores
activos en la generación e intercambio de energía y se benefician de ello.
Este cambio se convierte en una posibilidad real a través de las tecnologías
habilitadoras que se analizan en este informe. Estas tecnologías principalmente son la
energía solar fotovoltaica, energía eólica, cargas inteligentes, vehículos eléctricos y
baterías de almacenamiento de energía; y deben examinarse para determinar cuáles
son las mejores opciones para integrarse en el sistema y qué tipo de ventajas ofrecen.
Además, todas las investigaciones de estas innovaciones tienen un impacto directo en
otras condiciones sociales y ambientales debido a que estas tecnologías que pueden
aplicarse en otros campos.
En este sentido, en este informe, se estudia el State-of-the-art de cada activo y se
determina la mejor opción de cada tecnología; la importancia del activo se evalúa para
analizar si su impacto es realmente perjudicial para la flexibilidad de la demanda; los
tipos de servicios que el activo puede ofrecer; y finalmente, cuál es la manera de
integrar la tecnología para lograr el mayor beneficio. Hasta ahora, estas tecnologías
se están volviendo económicamente atractivas y actualmente se están integrando,
pero, en un futuro próximo, llegarán a ser más baratas y mucho más rentables.

12 Escuela Técnica Superior de Ingenieros Industriales UPM
Esa es la razón por la que muchos países diferentes, principalmente los Estados
Unidos de América (EEUU) y la Unión Europea (UE), están adaptando sus
regulaciones para adaptarse a la transición energética. De hecho, están imponiendo
leyes obligatorias a sus estados miembros para abrir el mercado eléctrico a los clientes
a través de compañías y “agregadores” (se explica en “Introducción y motivación).
En el informe “Energy Transition: Enabling Technologies for Demand Flexibility,
Regulation & Business Models”, la regulación de los EEUU y la UE es uno de los
principales temas tratados. Aquí, las legislaciones anteriores y más recientes se
exponen y analizan en detalle, y se presentan conclusiones y recomendaciones para
aprovechar la transición energética. Además, se muestra un estudio profundo de los
diferentes mercados de EEUU (NYISO y CAISO) y de la UE (Alemania, Reino Unido y
Francia) y sus programas principales, teniendo en cuenta las características
principales de cada uno y su grado de eficacia.
Sin embargo, estas conclusiones y recomendaciones sobre mercados y regulaciones
deben probarse con datos reales que demuestren la rentabilidad de esas medidas, por
lo que en el informe se exponen cuatro casos de negocio. En ellos se estudian
diferentes estados de EEUU tomando datos reales de población y de programas
particulares que se han establecido en la zona; luego se muestran los resultados y las
comparaciones para demostrar la rentabilidad o no de estas inversiones. Y, por
supuesto, este informe proporciona algunas recomendaciones de modificación al
reglamento que se estableció en esos casos, a veces positivos y otras no tanto.
Resumiendo:
Esta investigación se enfoca en comprender cómo la mayor penetración del
autoconsumo afectará a la regulación y los modelos de negocio actuales en el
sector eléctrico.
Hoy en día se están produciendo cambios importantes en la forma de
generación y consumo de electricidad, fundamentalmente debido a la
confluencia de diversos factores que afectan a los sistemas de distribución
eléctrica. Las nuevas tecnologías o servicios, como la flexibilidad de la
demanda, el autoconsumo, el almacenamiento de energía y los avances en
dispositivos electrónicos de control, están generando nuevas oportunidades en
el suministro y consumo de electricidad. Al mismo tiempo, el rápido
abaratamiento de las tecnologías de la información y la comunicación (TIC)
permite un consumo más eficiente, una mejor visión del uso de la red y un mejor
control de los sistemas eléctricos.
Este informe presenta un marco para la proactividad reguladora y la reforma
del mercado, a fin de lograr una evolución eficiente del sistema eléctrico en las
próximas décadas. El objetivo es facilitar y lograr la integración de todos los
recursos, independientemente de si están centralizados o distribuidos, todo lo
cual puede contribuir a un suministro eléctrico eficiente para los consumidores.

Jesús Santiago Silvestre Bengoa 13
1.2. INTRODUCCIÓN Y MOTIVACIÓN
Este proyecto está pensado para dar una visión sobre la transición energética y sobre
cómo esta es impulsada por la tecnología. Hoy en día, con innovaciones como las
cargas inteligentes (Smart loads), la energía solar fotovoltaica (Solar PV), la energía
eólica (Wind power), el almacenamiento de energía (Energy Storage) y los vehículos
eléctricos y su integración en la red (Vehicle-to-grid), cada vez más desarrolladas y
menos costosas, se puede llegar a conseguir un mercado energético más eficiente y
seguro.
Este proyecto analizará el mercado de la energía a través de tres bloques principales:
desarrollo de tecnologías habilitadoras de la transición energética, cómo está
cambiando la regulación y cómo debe cambiar para aprovechar estas innovaciones y,
finalmente, los modelos de negocios que se pueden lograr a través de la combinación
de tecnologías y regulación.
La transición energética está cambiando el mercado de energía tradicional y está
generando muchas oportunidades de negocio en el presente y generará aún más en
el futuro cercano. Es un tema de tremenda relevancia en el panorama tecnológico,
eléctrico y económico actual. Además, tendrá un impacto en la vida de toda la
población debido a que cada consumidor individual podrá convertirse en proveedor de
energía para el sistema por medio de agregadores.
Los agregadores representan un papel clave en esta transición energética. Permitirán
que los consumidores (con baterías, cargas inteligentes o energía solar fotovoltaica en
los hogares) se involucren en el mercado logrando una gestión eficiente de sus
tecnologías y obtengan un valor económico.
Hoy en día, existen problemas regulatorios en algunos países que deben modificarse
para garantizar un mercado de energía de libre comercio y la integración de las nuevas
tecnologías. Las primeras soluciones ya se han implementado en los EE.UU. y el Reino
Unido con el desarrollo de la respuesta a la demanda teniendo en cuenta el papel de
los agregadores y los consumidores.
Además, la UE ha implementado el Winter Package, regulación por la cual los estados
miembros de la UE regularán el mercado de la energía y alentarán a los consumidores
finales a participar junto con los generadores de manera no discriminatoria. Este es el
comienzo de la transición en Europa, pero este informe no solo evaluará los beneficios
de estas medidas, sino que dará recomendaciones para lograr una transición
energética con suministro seguro, eficiente y de libre mercado.
La transición energética también es la manera de detener la emisión de gases de
efecto invernadero y el cambio climático, priorizando las fuentes renovables e
integrando nuevas tecnologías no contaminantes. Este objetivo está declarado en el
European commitment 20/20/20 y en el Winter Package.
Con respecto a la motivación para realizar este proyecto, de Febrero a Julio de 2018,
el autor de este TFG ha estado trabajando en i-deals (Everis) y la transición energética
ha sido uno de los temas principales tratados durante este período. El autor ha
comprendido la relevancia de la misma y cómo cambiará la facturación eléctrica y
forma de consumir de cada consumidor. Cada persona podrá participar en un mercado

14 Escuela Técnica Superior de Ingenieros Industriales UPM
que tradicionalmente ha sido administrado por muy pocas empresas y, en muchos
casos, que ha funcionado como un monopolio.
1.3. OBJETIVOS
El primer objetivo de este proyecto es analizar los principales componentes de la
transición energética, comprender por qué todos los integrantes del mercado deben
sumarse a esta oportunidad, dar recomendaciones sobre las tecnologías presentes y
futuras que deberían integrarse y cómo debería cambiar la regulación para permitir un
mercado energético más eficiente y seguro.
Este proyecto es una gran fuente de conocimiento y está destinado a abordarse como
una profunda investigación, análisis y guía del mercado energético actual y futuro.
A continuación, se enumeran los pasos para lograr el objetivo final:
Se debe realizar una investigación de las principales tecnologías para
comprender por qué esta transición es posible y la forma en la que está
impulsada por la tecnología. El almacenamiento de energía, las cargas
inteligentes, la generación descentralizada (Distributed generation) con energía
solar fotovoltaica, la generación a escala (Grid scale generation) con energía
eólica y las tecnologías de Vehicle-to-grid deben investigarse y analizarse,
concluir la mejor opción de cada una de ellas y obtener recomendaciones para
los reguladores del sistema.
La regulación tradicional y actual debe ser modificada, por lo que se analizarán
sus ventajas y desventajas. Se evaluarán los cambios en la legislación que ya
se han hecho y se expondrán las recomendaciones pertinentes. Este proyecto
podrá dar conclusiones a los reguladores debido al análisis tecnológico previo.
Finalmente, con todos los conocimientos anteriores, se podrá realizar el
estudio de modelos de negocio reales y actuales. Estos casos de negocio
brindarán una visión práctica de cómo esta transición es posible y mucho más
rentable para todos los participantes del sistema (TSO, DSO, agregadores y
consumidores). Aún más, estos modelos demostrarán que la tecnología
estudiada anteriormente encaja con los casos reales y justificará toda la
inversión necesaria para su desarrollo.
Para concluir, se mostrarán las conclusiones finales sobre el futuro mercado
energético: Recomendaciones de las tecnologías que deben utilizarse para obtener el
mayor rendimiento al mejor coste; análisis de las mejores regulaciones y legislación
para asegurar un mercado de competencia justa, seguro y la eficiente; y finalmente,
sugerencias de negocios para obtener las inversiones más valiosas.

Jesús Santiago Silvestre Bengoa 15
1.4. CONTEXTO
En esta sección se introducen las nociones del mercado eléctrico poniendo el ejemplo
de su funcionamiento en España y las funciones de Red Eléctrica de España (REE).
Los principales componentes del sistema son:
Los centros y plantas de generación.
Las líneas de transporte de alta tensión.
Las estaciones de trasformación.
Las líneas de transporte de media y baja tensión.
Los centros de control.
El centro de control eléctrico nacional.
A su vez, se describen también los actores principales del mercado:
Generadores.
Transportistas.
Operadores del sistema.
Distribuidores.
Comercializadores.
Consumidores.
Por otra parte se presentan también los principales tipos de generación de energía
eléctrica:
Centrales térmicas.
Centrales nucleares o atómicas.
Centrales “atmosféricas” (utilizan recursos como el agua embalsamada o el
viento)
Centrales fotovoltaicas.
A raíz de este análisis surge un tema central como es la generación por medio de
energías renovables no contaminantes.
La prioridad de las energías renovables se debe al calentamiento global. Europa ha
propuesto el compromiso europeo 20/20/20, lo que significa la necesidad de reducir
los gases de efecto invernadero en un 20%, mejorar la eficiencia energética en un 20%
y lograr el 20% de la generación de energía con recursos renovables; y esos tres
objetivos deben alcanzarse para 2020. Más aún, recientemente se ha lanzado otra
norma, el Winter Package, que determina que un 27% de la generación de energía
debe ser producida con recursos renovables para 2030.
Otro tema importante que debe tenerse en cuenta es la interconexión entre diferentes
sistemas, la razón principal es que si un sistema está aislado y sufre la parada
inesperada de un generador, la consecuencia lógica e inmediata es que el equilibrio
que debe existir entre producción y demanda de energía eléctrica puede
descompensarse. De este modo la interconexión entre sistemas ofrece la posibilidad
de compensar estas diferencias entre producción y demanda recogiendo energía de
sistemas conectados.

16 Escuela Técnica Superior de Ingenieros Industriales UPM
Pero esta no es la única ventaja de la interconexión internacional. Otra no menos
interesante es que permite evacuar la electricidad generada a partir de fuentes
renovables (la energía de las renovables suele ser intermitente y difícilmente
controlada debido a que dependen del viento, el sol, etc., es decir, las fuentes
naturales) en un momento en que esta generación no puede ser absorbida por el
sistema eléctrico de la zona y, en consecuencia, no se aprovecha, lo que obliga, por
ejemplo, a desconectar parques eólicos.
En este sentido, la interconexión cobra gran importancia no solo entre sistemas
eléctricos entre países sino dentro de los sistemas entre todos los elementos de la red.
Esta es la manera de conseguir la transición energética y el nuevo modelo de mercado
energético en el que las nuevas tecnologías habilitadoras de la demanda exigen una
conexión total y continua entre distintos sistemas y con los operadores de la red.
Profundizando en el mercado eléctrico y centrándose en la economía se puede
analizar la siguiente situación:
En un entorno liberalizado, en el que la actividad de generación tiene lugar en un marco
de mercado libre, los diferentes diseños posibles se pueden resumir básicamente en
dos: un modelo de "solo energía", en el que el precio de mercado es el único ingreso
de los generadores y un modelo de "precio de mercado + pago por capacidad", en el
que los generadores reciben el precio de mercado y un pago adicional como incentivo
a la inversión y la disponibilidad. Abajo se explica cada modelo:
Modelo de "Energy only": para que el modelo de "solo energía" funcione
correctamente, el precio de mercado debe ser lo suficientemente alto en momentos de
máxima demanda para que una planta de energía de vanguardia (que solo se genera
en esos momentos) recupere sus costes fijos.
Modelo de " Market price + payment for capacity": el modelo de "solo energía" es
actualmente inviable en muchos países, principalmente porque los precios
particularmente altos, incluso solo unas pocas horas al año, resultan muy
controvertidos desde el punto de vista político. De hecho, las regulaciones españolas
no permiten ofertas en el mercado diario por encima de € 180 / MWh. Dada esta
restricción, para que las plantas tengan la oportunidad de recuperar sus costes fijos,
debe diseñarse un sistema de pagos regulados, adicional al precio de mercado, que
tiene que ver con el valor de la ENS (Energía no suministrada) y con el límite que se
impondrá al precio (cuanto mayor sea la diferencia entre el valor de la ENS y este
límite, mayor será el pago de capacidad para un nivel de calidad de suministro
determinado). Con este esquema se busca que haya suficiente inversión para
satisfacer los puntos de demanda, incentivar la inversión y que las plantas estén
disponibles en momentos de alta demanda.
Otro sistema de pagos de capacidad, desarrollado principalmente en algunos estados
de la costa este de los EE.UU., es el derivado de imponer a los proveedores la
obligación de cubrir su demanda anual máxima con "tickets de capacidad". Estos
boletos deben comprarse a los generadores, que reciben un ingreso complementario
a cambio de estar disponibles. A diferencia del sistema de pagos regulados, en el que
es la Administración la que establece el precio de los pagos por capacidad, y es la

Jesús Santiago Silvestre Bengoa 17
interacción de la oferta y la demanda lo que determina la cantidad de capacidad
demandada; con los "tickets de capacidad" es la Administración la que define la
cantidad de capacidad demandada, y es la interacción entre la oferta y la demanda de
los "tickets de capacidad" la que establece su precio.
En conclusión, el diseño actual del mercado ofrece, en teoría, a los generadores una
garantía de recuperación de los costos de inversión y los costes vinculados a la
disponibilidad a través de pagos regulados que complementan los ingresos en el
mercado. Sin embargo, las recientes decisiones regulatorias, motivadas por la presión
del regulador para reducir la tarifa, introducen incertidumbres que pueden afectar las
decisiones de operación y mantenimiento de activos existentes con altos costes fijos,
por un lado, y decisiones de inversión en nueva capacidad. Estos tipos de decisiones
regulatorias son un ejemplo de un "círculo vicioso regulatorio".
Por lo tanto, para crear las condiciones adecuadas para que los inversionistas
respondan a las necesidades de inversión en el sistema y para que las compañías
mantengan sus activos operativos, para que los consumidores se beneficien de una
mayor seguridad de suministro, la Administración debe ofrecer una garantía de
estabilidad en la regulación de las compañías generadoras.
Este es uno de los problemas que se resolverán con la flexibilidad en la demanda
eléctrica, ahora se expondrán algunos otros problemas del sistema y se presentarán
algunas soluciones posibles, todas ellas dentro del modelo de transición energética
que se discute en esta investigación.
Después de haber analizado los temas económicos del mercado eléctrico, otras
dificultades principales del modelo actual se exponen:
En general, un modelo energético sostenible se caracterizaría por patrones de
producción y consumo que concilian el desarrollo económico, social y ambiental,
satisfaciendo las necesidades energéticas de las generaciones actuales sin
comprometer las posibilidades de las generaciones futuras. Para que esto sea posible,
el modelo energético debe tener en cuenta tres elementos básicos:
Seguridad energética: debe garantizar la continuidad del suministro a precios
razonables para los consumidores.
Competitividad: no debe representar un peligro para la competitividad de la
economía y su crecimiento.
Sostenibilidad ambiental: la producción y el consumo de energía no deben
tener un impacto inasequible en el medio ambiente. Dentro de esta área, el
sector energético, como responsable del 80% de las emisiones de gases de
efecto invernadero, debe desempeñar un papel muy importante en la lucha
contra el cambio climático.
El modelo energético actual se caracteriza por un crecimiento constante del consumo
de energía, basado en recursos finitos, principalmente combustibles fósiles.
Según las previsiones de la Agencia Internacional de Energía (AIE), la demanda
mundial de energía primaria crecerá en el escenario de referencia a una tasa anual del
1,5% hasta 2030, con un peso predominante de combustibles fósiles que permanecerá

18 Escuela Técnica Superior de Ingenieros Industriales UPM
por encima del consumo total, por lo que el carbón, el gas natural y el petróleo
representarán el 80% de la energía consumida en 2030 como se puede ver en la Figure
3 (Ver en el Documento).
La insostenibilidad económica, ambiental y social del modelo energético global se
revela por sus propios elementos característicos.
En términos de insostenibilidad económica, cabe destacar que una economía basada
en el consumo de recursos energéticos fósiles finitos (gas, carbón y petróleo) se verá
comprometida en su competitividad frente al crecimiento previsible de la tendencia
experimentado por los precios de las materias primas energéticas. Por otro lado, como
se muestra en la Figure 4 (Ver en el Documento), el crecimiento de los precios del
petróleo puede ser mitigado por la aplicación de políticas ambientales dirigidas a
alcanzar el escenario de 450 ppm (que incluye importantes medidas adicionales para
limitar el aumento de temperatura a 2 grados Celsius).
Por otro lado, en el caso de las economías que dependen en gran medida de las
fuentes extranjeras para cubrir sus necesidades energéticas, existe el riesgo de altos
precios derivados de la evolución de los mismos en el extranjero por las interrupciones
del suministro. Un ejemplo de esto fue la interrupción del suministro de gas ruso en
enero de 2008, que afectó a varios países de la Unión Europea, causada por un
conflicto entre Rusia y Ucrania.
En términos de sostenibilidad ambiental, como se ha mencionado anteriormente, la
evolución del consumo de energía en el escenario de referencia implica un aumento
en las emisiones de gases de efecto invernadero (GHG: Greenhouse Gas) que es
mucho mayor que el requerido para limitar el aumento de la temperatura global a 2
grados centígrados. En este sentido, existe un consenso generalizado a nivel
internacional, basado en el análisis del IPCC (Intergovernmental Panel on Climate
Change) sobre la necesidad de reducir las emisiones globales en al menos un 50% en
2050 en comparación con los niveles de 1990 para evitar un aumento de temperatura
superior al mencionado.
Desde el punto de vista social, el modelo energético actual no permite el acceso a
formas avanzadas de energía (principalmente electricidad) a 2 mil millones de
personas, con las implicaciones negativas que esto tiene en términos de desarrollo
humano y potencial de crecimiento económico futuro.
En general, estas dificultades existen debido al modelo eléctrico actual; sin embargo,
en esta revisión, se expone un nuevo modelo de sector eléctrico que corrige los
problemas de dicho modelo. Se basa principalmente en el estado de la técnica de las
diferentes tecnologías y el desarrollo en el futuro de las mismas, por lo que la
innovación debe ir de la mano con esta transición.
De este modo, en la actualidad, los sistemas de energía eléctrica en Europa, los
Estados Unidos y otras partes del mundo están experimentando varios cambios
guiados por las tendencias:
Incremento de la descentralización de los sistemas de energía debido a la
penetración de los DER (Distributed Energy Resources): Solar PV, Wind power,

Jesús Santiago Silvestre Bengoa 19
CHP (Combined Heat and Power), Energy storage y HVAC (Heating,
Ventilation and Air-Conditioning).
Proliferación de las TIC (Tecnologías de la Información y las Comunicaciones).
Consumidores de energía activos y responsables con el precio.
Aumento de la interconexión de la electricidad con otras infraestructuras
críticas.
Crecimiento de recursos energéticos renovables variables.
Esfuerzos de mitigación del cambio climático global.
A continuación, se van a analizar de manera breve lo expuesto en las tres secciones
más importantes de este proyecto (Enabling Technologies for Demand Flexibility,
Regulatory Framework y Business Cases and Case Studies).
1.5. Tecnologías habilitadoras de la flexibilidad de la
demanda
Como se ha visto en el “Contexto”, existen nuevas tecnologías que han llegado al
sector energético y que pueden transformar los activos y la infraestructura de
operación y comercio del mercado. Estas tecnologías van desde la digitalización, las
TIC, Big Data, IoT y las Smart loads, que pueden configurar una administración de
sistemas más autónoma y precisa, hasta tecnologías más específicas, que desafían al
sector energético, como los DER que permiten la flexibilidad de la demanda.
En esta sección el objetivo es mostrar cómo se integran los DER y las nuevas
tecnologías en el nuevo modelo energético y analizar las bondades y defectos de cada
una de ellas y sacar conclusiones a raíz del análisis.
De este modo, se presentan los apartados principales en los que se explican dichas
tecnologías y las conclusiones a las que se ha llegado, dejando los datos específicos
fuera de este resumen. (Para mayor análisis acudir al Documento).
1.5.1. Energy Storage
El Energy Storage permite al cliente final mejorar sus necesidades de energía al mover
el consumo de las horas pico a las más baratas o combinando este almacenamiento
con tecnologías de energía solar fotovoltaica principalmente. Además, es un
componente importante para dar adaptabilidad al sistema en general y permite la
administración dinámica de los irregulares RES (Renewable Energy Resources).
En los últimos años ha habido muchas innovaciones en el almacenamiento de energía,
por lo que, hasta ahora, existen cuatro tecnologías principales de almacenamiento
que pueden aplicarse al sistema de energía.
Lead acid batteries: aunque representan las soluciones con el coste más bajo,
su eficiencia, rendimiento y vida útil más corta representan problemas muy
importantes para incorporar estas baterías al sistema de energía en
comparación con las siguientes tecnologías que se muestran a continuación.

20 Escuela Técnica Superior de Ingenieros Industriales UPM
High temperature batteries: no pueden operar para aplicaciones residenciales
o comerciales debido a sus altas temperaturas durante el funcionamiento y sus
altos costos cuando se producen en pequeñas escalas. Por lo tanto, están
situados para operaciones de mayor escala, como las industriales, las micro
redes y combinadas con RES.
Flow batteries: tienen aplicaciones similares a las baterías de altas
temperaturas, son especialmente adecuadas para operaciones a gran escala
en industrias y micro redes grandes con tiempos de descarga de hasta unas
pocas horas. Sin embargo, las diferentes características necesarias en estas
baterías, como los espacios grandes, los ruidos fuertes y los altos costes,
hacen que no sean realmente adecuadas para sistemas pequeños como los
comerciales y residenciales.
Lithium ion batteries: estas baterías hasta ahora, y en el futuro cercano,
representan la mejor tecnología de almacenamiento de energía para sistemas
comerciales y residenciales, principalmente debido a su alta densidad de
energía y su bajo coste en pequeñas instalaciones. Con respecto a las redes
industriales y de gran escala, se debe realizar un estudio específico en cada
caso para determinar la mejor tecnología habilitadora teniendo en cuenta los
requisitos de energía, vida útil del sistema y costes máximos de instalación.
A continuación se detallan las conclusiones a las que se ha llegado tras analizar cada
tipo de batería (Para mayores detalles acudir al Documento):
El Energy storage ofrece un equilibrio razonable de energía, potencia, ciclo de
vida, seguridad y coste, así como de restricciones de espacio, lo que las hace
adecuadas para la mayoría de las aplicaciones de almacenamiento distribuido
previstas para la transición energética. De esta manera, estas tecnologías de
almacenamiento deben garantizar tres aspectos clave: coste, confiabilidad y
seguridad, y facilidad de implementación y estandarización. Otros indicadores
de desempeño pueden analizarse como características adicionales, pero no
deben comprometer ninguno de los tres aspectos anteriores.
La batería de iones de litio es la innovación elegida para uso residencial y
comercial y puede satisfacer la mayoría de los requisitos en aplicaciones de
microcréditos y clientes industriales. Estas aplicaciones pueden servirse
utilizando células EV más baratas producidas en masa en lugar de células
personalizadas de bajo volumen. Además, en la actualidad, los sistemas de
módulos de iones de litio ya están en el mercado de múltiples proveedores y
ya se pueden utilizar para lanzar y ampliar una oferta comercial para la
transición energética.
La lithium-ion batterie puede considerarse una tecnología madura que seguirá
un camino de desarrollo evolutivo con avances principales en cátodos de alta
capacidad y voltaje y ánodos de mayor capacidad. Además, se espera que los
costos proyectados de la batería de ion de litio disminuyan debido a las
economías de escala y los avances en la curva de aprendizaje.

Jesús Santiago Silvestre Bengoa 21
1.5.2. Electric Vehicle (EV)
En primera instancia, la generalización de los vehículos eléctricos en la sociedad
infiere un enorme incremento en la demanda de energía en las zonas urbanas. Sin
embargo, los EV pueden convertirse en un operador que utiliza instalaciones de carga
bidireccionales para habilitar el vehículo a las necesidades de la red. Se podría utilizar
como un elemento importante del sistema público o como una característica para las
redes de casas inteligentes que se basan en el uso de la estación de carga.
Estas estrategias de carga se conocen como Grid relief strategies y pueden ser
beneficiosas no solo para los administradores de la red al poder distribuir
temporalmente la carga a un momento de menor demanda sino también para los
usuarios de los vehículos eléctricos al reducir los costes de carga por el uso de energía
más barata.
Las principales estrategias de carga de vehículos se enuncian a continuación (Para
mayores detalles acudir al Documento):
Opportunity charging: es el uso común, la carga del vehículo eléctrico comienza
cuando se enchufa. Los costos de electricidad son generalmente un 11% más
altos que el precio promedio anual de la electricidad debido a los picos de
demanda que se producen.
Delayed charging: el tiempo de carga se retrasa a propósito según el uso de la
demanda evaluado por el operador de la red (tasas de tiempo de uso) y el
horario del conductor o propietario. Con este método, los costos de energía
bajan al 85%-93% del precio promedio de la electricidad.
Smart charging (V1G): al utilizar tecnología e innovaciones habilitadas, este
método obtiene una administración del estado de carga similar al Delayed
Charging excepto que la carga de energía se ajusta según los presuntos
requisitos de energía de futuros. Con este método, los costos de energía se
reducen al 75% del precio promedio de la electricidad.
Vehicle to Grid (V2G): Smart charging (V1G) administrada por un Energy
management system (EMS), basada en señales de precios, puede reducir los
costos de energía para el usuario final al tiempo que facilita la generación,
transmisión, distribución y restricciones al eliminar la demanda máxima
inducida por el uso simultáneo de carga del EV no gestionada. Esta integración
del cambio inteligente con un sistema de gestión de energía forma el método
de Vehicle to Grid (V2G).
A continuación se detallan las conclusiones a las que se ha llegado tras analizar los
EV (Para mayores detalles acudir al Documento):
La carga de EV no ha tenido un impacto significativo en la red debido a la baja
penetración en el mercado automotriz. Sin embargo, varios estudios destacan
el potencial de perturbar la red debido al aumento de la carga máxima si la
carga no se gestiona adecuadamente.
Smart charging, que modula la velocidad de carga en función de las
restricciones de la red (impulsada por los precios) ofrece la posibilidad de
aplanar la curva de demanda.

22 Escuela Técnica Superior de Ingenieros Industriales UPM
Estándares (OCPP, IEC 62196, ISO 15118 y OpenADR) que permiten la buena
incorporación de EV, funciones modernas como V1G y V2G con la red y sus
utilidades están en desarrollo y deben definirse para desarrollar más los
modelos de negocios. Además, las investigaciones sobre el impacto del V2G
en la degradación de la batería deben completarse para poder negociar buenas
garantías entre los proveedores de EV y los usuarios finales.
Se debe desarrollar una estrategia de monetización de cobro de EV final, que
debe basarse primero en considerar los EV como una carga controlable y
predecible para la optimización de los costes de energía para el usuario final
(precios en tiempo real y cargas máximos) así como un activo de generación
de ingresos para ser incorporado en los mercados de flexibilidad.
Finalmente, aunque el potencial de V1G y V2G es enorme, no deben
considerarse fuentes de generación de ingresos relevantes en el corto plazo
debido a la complejidad de su aplicación final.
1.5.3. Smart Loads
Las Smart Loads están relacionadas con la administración, el control y la conectividad
de la energía, lo que permite a los clientes ofrecer la energía del sistema desde el lado
de la demanda a cambio de tarifas económicas. Es decir, la informatización de estos
procedimientos se considera un factor de gran relevancia para dar adaptabilidad a la
red.
Más aún, permite una de las funciones principales del EMS (Energy Management
System) y la función del "agregador". Sin embargo, el potencial de ahorro y la
complejidad de su implementación en algunos casos limitan su integración en la vida
real.
Así, se analizan los 3 segmentos diferentes donde se pueden integrar cargas
inteligentes:
Segmento industrial: la mayoría de las cargas industriales se administran
mediante sistemas legales o de control de Supervisory Control and Data
Acquisition (SCADA) a los que no se puede acceder fácilmente. Sin embargo,
en un futuro próximo, los SCADA abiertos y los Sistemas de gestión de edificios
y la implementación de IoT permitirán una conexión directa de carga. Además,
el acceso de terceros a los SCADA a través de las interfaces de programación
de aplicaciones (API) permitirá a los expertos de la industria desarrollar
algoritmos de soluciones de software para definir la mejor manera de ofertar
cargas manejables en los diferentes mercados y optimizar el despacho de
energía.
Segmento comercial: calefacción, ventilación y aire acondicionado (HVAC), el
calentamiento de agua y la iluminación son las cargas más grandes en los
edificios comerciales y residenciales grandes y normalmente están controlados
por humanos sin tener en cuenta la eficiencia energética y la comodidad del
usuario. En promedio, en la UE-27, el calentamiento de agua y espacio
representa el 19% de la demanda eléctrica total en el sector terciario: la
iluminación representa el 20%, la ventilación 12.4% y el aire acondicionado casi

Jesús Santiago Silvestre Bengoa 23
el 3%. En España, el aire acondicionado y las bombas de calor en el sector
terciario representan 25,6 GW de potencia instalada. Por lo tanto, las unidades
más grandes y el control centralizado de las HVAC brindan oportunidades
significativas para cargas controlables en el sector terciario.
Segmento residencial: en la actualidad, el HVAC y el calentamiento de agua
son las cargas manejables más importantes (en el futuro se espera que los EV
también lo sean), pero ambos normalmente requieren acceso a un panel de
control fijo y operación remota. Sin embargo, el desarrollo de sistemas de
hogares inteligentes (Figure 17) ofrece una amplia gama de soluciones para la
gestión de cargas conectadas. Los centros de información permiten centralizar
varias unidades conectadas y su administración a través de una única interfaz.
De esta manera, los termostatos conectados están desempeñando un papel
principal como dispositivos conectados, ya que administran la carga conectada
más importante en términos de potencia, capacidad de regulación y tiempos de
operación, como el aire acondicionado, pero también pueden administrar otras
cargas importantes que estarán presentes en todo momento.
A continuación se detallan las conclusiones a las que se ha llegado tras analizar las
Smart Loads (Para mayores detalles acudir al Documento):
Las Smart Loads permiten administrar las cargas conectadas con el fin de
reducir los costos de la energía adquirida de acuerdo con los precios de la
energía por hora, reducir el consumo de energía al hacer un uso más eficiente
de la energía y evitar los aumentos de precio por energía pico. Sin embargo, la
mayor parte de la administración de carga no se realiza automáticamente y
requiere la intervención de un EMS, lo que aumenta la complejidad de su
implementación y limita su implementación en tiempo real.
A nivel industrial, los sistemas SCADA gestionan los sistemas más intensivos
en energía en grandes empresas industriales y comerciales. Ya hay miles de
edificios comerciales con sistemas SCADA en España y la mayoría de ellos
nunca han cambiado sus puntos de ajuste predeterminados. El acceso a los
SCADA ya desplegados desbloquea la posibilidad de administrar de manera
eficiente cada una de las cargas conectadas, lo que proporciona un ahorro de
energía al cliente.
A nivel residencial, los sistemas HVAC son clave en la demanda de potencia
máxima. Por lo tanto, el mayor impacto puede obtenerse sustituyendo los
termostatos existentes por los conectados inteligentes que pueden no solo
optimizar el ahorro de energía al mismo tiempo que mantienen la comodidad
utilizando múltiples fuentes de datos (detección de presencia, proximidad,
histéresis, pronóstico del tiempo, etc.) y algoritmos con autoaprendizaje.
La relación entre el almacenamiento de energía y las cargas inteligentes debe
analizarse en cada caso, tanto a nivel industrial como a nivel comercial y
residencial, para no obtener una solución en la que una tecnología tenga un
impacto negativo en la otra.

24 Escuela Técnica Superior de Ingenieros Industriales UPM
1.5.4. Distributed Generation
Esta sección básicamente trata del nuevo papel de los consumidores tradicionales,
que ahora se convierten en generadores a pequeña escala.
Los precios más bajos que están alcanzando las nuevas tecnologías, principalmente
en relación con el almacenamiento de energía y la energía solar fotovoltaica, están
permitiendo nuevas oportunidades comerciales, como la gestión y la generación de
energía de los propios clientes.
Por lo tanto, se analizarán tres grupos de tecnologías en la generación distribuida:
Energía solar fotovoltaica (Solar PV): representa la opción más asequible de
las tres. Al aprovechar las economías de escala generadas en la fotovoltaica a
gran escala, obtiene el menor costo de energía (costo / kW), con valores desde
1400 hasta 2900 $ / kW. Además, esta tecnología tiene un mantenimiento bajo
o nulo, no produce ruido y puede dimensionarse adecuadamente para todos
los segmentos de clientes.
Energía eólica (Wind power): con respecto al costo de la energía, el viento a
pequeña escala es mucho más costoso que el viento a gran escala con costos
de 5000 a 10000 $ / kW para sistemas con una capacidad de potencia inferior
a 10 kW y costos de 4000 a 8000 $ / kW para sistemas entre 10 y 100 kW.
Además, el ruido y el impacto visual hacen que los lugares donde se pueda
instalar esta tecnología tengan que ser muy específicos. En consecuencia, las
micro redes son la aplicación más adecuada donde las escalas más grandes
permiten precios de energía más competitivos.
Combined Heat and Power (CHP): se ha utilizado ampliamente en el sector
industrial, pero reducirlo a los sectores comercial y residencial es difícil para las
tecnologías disponibles.
A continuación se detallan las conclusiones a las que se ha llegado tras analizar la
Distributed Generation (Para mayores detalles acudir al Documento):
Aunque se considera que tres tecnologías principales se ajustan a la
generación distribuida, la generación de energía solar fotovoltaica es, con
diferencia, la tecnología más rentable. La energía eólica no es asequible debido
a sus mayores costos por kW en pequeña escala, ruido e impactos visuales.
CHP no es asequible debido a que es difícil de escalar a los sectores comercial
y residencial.
Dentro de la energía solar (Para comprender las tecnologías de paneles
solares que se van a comentar acudir al Documento): Actualmente los módulos
de c-Si son la solución viable más eficiente y económica. Han experimentado
reducciones de costes rápidas debido a la mejora de la tecnología y la
incertidumbre del mercado debido a la capacidad de sobreproducción y las
distintas proyecciones de demanda que han reducido los márgenes de los
módulos. Se espera que el desarrollo evolutivo de la tecnología debido a la
producción en masa y los avances en la curva de aprendizaje se proyecten
para reducir aún más los costos.
Perovskites es el único competidor potencial que, en caso de tener éxito,
significaría que se eliminaría toda la cadena de valor de c-Si, lo que refuerza la

Jesús Santiago Silvestre Bengoa 25
última afirmación (c-Si parece ser la mejor opción en el presente y en el futuro
cercano).
1.5.5. Grid Scale Generation
El establecimiento de plantas de recursos de energía renovable cerca de lugares
donde se consume electricidad, como ciudades y comunidades, elimina aspectos del
desperdicio del sistema y permite una mejor administración de la red, especialmente
cuando se combinan con innovaciones de almacenamiento de energía.
De este modo, dos soluciones RES parecen ser las más asequibles, son la energía
eólica y la energía solar fotovoltaica. (En este apartado se muestra más importancia
en la energía eólica en el Documento, para mayor información acudir a él).
A continuación se detallan las conclusiones a las que se ha llegado tras analizar las
tecnologías habilitadoras de la Grid scale generation:
Grid Scale Generation participa en el Nuevo Mercado de Energía que implica
Recursos de Energía Renovable, por lo tanto, todas las tecnologías analizadas
en esta sección no son contaminantes. Las RES son la manera de lograr una
administración superior de la red, flexibilidad y minimizar pérdidas y accidentes.
La generación de energía eólica es actualmente la mejor tecnología para Grid
Scale Generation y se espera que reduzca sus costos de LCOE, CAPEX y
OPEX debido a investigaciones recientes para mejorar la eficiencia y las
economías de escala de las instalaciones, logística y materiales.
1.5.6. Energy Management System (EMS)
Este futuro sistema de gestión se relaciona con la mezcla de Energy storage, sistemas
de generación y Smart loads para trabajar sincronizados y contenidos, en unidades
individuales por medio de un EMS, y en un grupo de estas unidades por medio de
agregadores, y en asociación con el sistema principal.
En resumen, un EMS es un sistema de software que monitoriza, controla o analiza la
energía en un edificio. Incluye servicios de automatización de viviendas y edificios,
gestión personal de energía, análisis y visualización de datos, auditoría y servicios de
seguridad relacionados.
Para comprender mejor las implicaciones del EMS en diferentes situaciones, se
explican dos casos, cuando se usa en una vivienda común y en edificios más grandes.
Para detalles de la diferencia entre el Home Energy Management System (HEMS) y el
Building Energy Management System (BEMS) acudir al documento.
A continuación se detallan las conclusiones a las que se ha llegado tras analizar los
EMS:
La mayoría de los EMS en el mercado se limitan a la visualización de
información y algoritmos básicos. La maximización del uso de datos para
optimizar la utilización de activos y permitir fuentes alternativas de generación

26 Escuela Técnica Superior de Ingenieros Industriales UPM
de ingresos para el usuario final brinda la oportunidad de crear casos de
negocios más atractivos.
La generalización de los diferentes DER, como las cargas inteligentes, está
aumentando la implementación de EMS en casas y edificios.
El desarrollo de los medidores inteligentes está permitiendo la recopilación de
información que permite continuar desarrollando análisis y nuevos algoritmos.
El crecimiento del EMS se basa en la posibilidad de demostrar ahorros
potenciales de energía con los activos implementados, la optimización
operativa de esos activos y el sistema en su conjunto es clave para maximizar
el retorno de la inversión realizada por el cliente.
El EMS es un factor clave para obtener el Nuevo Mercado de Energía, ya que
representa una de las herramientas más importantes para Respuesta a la
Demanda (Demand Response).
Los grupos de BEMS y HEMS serán gestionados por un agregador que
intercambiará información con el VPP y con el operador del sistema. Aunque
esto se explica en la sección: “Virtual Power Plant”.
1.5.7. Virtual Power Plant (VPP)
Las VPP son controladas por agregadores y juntas conforman el New Management
System, que significa un centro de control central e interconectado que analiza y utiliza
los avances de Big Data, TIC, los dispositivos de IoT (Internet de las Cosas) y los DER,
con el objetivo final del comercio de energía en los mercados mayoristas, la prestación
de servicios auxiliares a los operadores de red y controlar el libre mercado energético
entre los usuarios y los distribuidores.
En resumen, una VPP es un sistema que combina información de los EMS y de los
agregadores con la información del operador del sistema. Se basa en un software que
obtiene un uso óptimo de la red que controla la demanda y el suministro de energía y
la interacción entre ambos. La figura 31 del Documento representa muy bien el
concepto de VPP.
En conclusión, las VPP representan el último paso para conseguir el New Energy
System, que es más eficiente, económico y que permite un libre mercado de energía.
(Para datos concretos sobre funcionamiento y desarrollo acudir al Documento).
1.6. MARCO REGULATORIO
1.6.1. Estados Unidos
Este este resumen en español se van a mostrar únicamente las conclusiones a las
que se han llegado tras analizar la legislación eléctrica y energética en distintos
mercados en Estados Unidos.
El sistema de energía en los EEUU es un sistema complicado en el que colaboran
innovaciones, autoridades y marcos regulatorios distintivos. En la actualidad, dos

Jesús Santiago Silvestre Bengoa 27
modelos notables para la comercialización de energía funcionan en los Estados
Unidos:
Modelo de monopolio regulado: en este modelo, las comisiones estatales
controlan los proveedores de energía coordinados verticalmente.
Modelo competitivo: en este modelo, los generadores de electricidad pueden
acceder directamente al marco de transmisión y participar en los mercados de
energía con descuento. Los reguladores del sistema presentaron rivalidad en
los mercados de energía con el objetivo de mejorar la efectividad, reducir el
coste para el cliente y disminuir las obstrucciones para participar como
proveedor.
Los mercados competitivos sirven al 66% de los clientes en los Estados Unidos. El
objetivo de los dos modelos es proporcionar energía de manera segura y fiable a los
clientes finales.
Las “utilities” sin participación económica en el resultado de los intercambios de
energía operan en los mercados mayoristas. Para participar en el mercado, los
generadores de electricidad presentan sus ofertas para cada período de programación,
que generalmente se utiliza en los Estados Unidos. La programación de cinco minutos
se usa en la mayor parte del mercado energético. Las ofertas incorporan el costo de
solicitud, que se calcula según el OPEX de la planta y la capacidad ofrecida. En
general, como se explica en el bloque “Context”, los operadores del sistema envían las
ofertas de costo mínimo primero hasta que se responda completamente a la demanda;
entonces, la última oferta con el precio más caro establece el precio del mercado. Los
LMP (Locational Marginal Pricing) incorporan tres partes diferentes: valor energético
del mercado, gastos de bloqueo y pérdidas de transmisión.
Los mercados competitivos no se limitan al intercambio de energía, por ejemplo, las
plantas de generación pueden proporcionar diferentes servicios para ayudar al sistema
de transmisión. Estos son conocidos como servicios auxiliares y son: “black start”,
soporte de voltaje y reservas de operación. Los operadores de la red también
organizan el intercambio de derechos de transmisión presupuestarios, lo que permite
al propietario pagar por adelantado los costos de obstrucción de la transmisión y puede
utilizarse como un tipo de apoyo contra la imprevisibilidad de los costos. Además, se
han insertado cuotas de capacidad para aumentar la confiabilidad de la red al
proporcionar un ingreso adicional para los generadores en relación con su factor de
capacidad.
El desarrollo continuo de Demand Response y REG (Renewable Energy generation)
ha planteado nuevos desafíos para los operadores de marcos competitivos. Los
dispositivos DR instan a los compradores a cambiar su utilización en el futuro cercano,
principalmente a través de programas de obligaciones e incentivos porque el DR puede
desarraigar los activos más costosos, expandir la productividad financiera del marco y
puede brindar servicios complementarios y de fiabilidad de manera adecuada.
Finalmente, con respecto a DR, la Orden 745 de FERC pedía a los administradores de
la red que pagaran a los activos de DR el coste total de mercado de la energía,
además, como se explica en el Documento, recientemente el Tribunal Supremo ha
mantenido esta orden.

28 Escuela Técnica Superior de Ingenieros Industriales UPM
La energía solar fotovoltaica y la eólica incrementan la imprevisibilidad y la volatilidad
de la red, lo que puede aumentar el costo y la sofisticación de ajustar la carga de
energía de la red. Las medidas que pueden aliviar con éxito los costos de la integración
de REG son, entre otras: demanda y flexibilidad de la oferta, estructura de transmisión
más descentralizada, variedad geográfica, mejor programación y previsión.
Además, la energía solar fotovoltaica y la energía eólica, y REG en general, tienen un
costo variable cercano a cero, lo que disminuye el valor de compensación del mercado
en relación con la medida de los activos de REG disponibles en un momento dado.
Esto puede crear la vulnerabilidad de ingresos y la insuficiencia de otros generadores
presentes y futuros. A largo plazo, la vulnerabilidad de los ingresos puede disminuir la
calidad del sistema debido a que los miembros actuales pueden renunciar y los
miembros inminentes pueden elegir no participar. El objetivo de los mercados de
capacidad es aumentar la confiabilidad de los ingresos para los generadores y, por lo
tanto, incrementar la confiabilidad del sistema.
La participación en mercados competitivos en los EEUU Podría ofrecer experiencia a
otros sistemas eléctricos en el mundo, como Europa y Asia. La estructura de los
mercados de los EEUU y sus partes son las consecuencias de un largo desarrollo y la
consolidación de las experiencias obtenidas de los aspectos de desperdicio y errores
del mercado.
1.6.2. Europa
Como en el apartado anterior, en este resumen se muestran únicamente las
conclusiones a las que se han llegado tras analizar el mercado eléctrico y energético
en Europa y más concretamente en Alemania, Reino Unido y Francia.
El Winter Package determina el camino para alcanzar el nuevo mercado de
energía que implica la flexibilidad de la demanda del sistema. El Winter
Package es un camino al cambio de regulación que se necesita realizar (se
explica con detalle en el Documento) para lograr un mercado de energía
basado en fuentes de energía renovables, eficiencia energética y centrado en
el cliente que se convertiría en parte activa del sistema.
La European Commission con directivas anteriores y con el nuevo Winter
Package exige que los estados de la UE garanticen que los reguladores
nacionales habiliten los activos del lado de la demanda, como DR y REG, para
participar en el suministro en los mercados minoristas y de gran escala. Cuanto
más notable es la coordinación entre los países europeos, más notables son
las economías de escala y los servicios de DR. Con esta coordinación y
economías de escala, se reducirá el costo de la generación distribuida, se
mejorará la efectividad de la red, se reducirá el costo de otras tecnologías,
como el almacenamiento, lo que permitirá reducir el costo de las reservas de
energía. Además, el desarrollo de los servicios de DR supondrá una nueva
fuente vital de ingresos para las organizaciones locales y los hogares.
Con respecto a las ventajas potenciales de la DR y las obstrucciones
administrativas, se requiere un desglose del plan estratégico de la DR en cada
estado miembro para garantizar un avance real y práctico. Estos planes deben

Jesús Santiago Silvestre Bengoa 29
incorporar objetivos reales para el desarrollo de la actividad del cliente y deben
incorporar indicadores clave de rendimiento (Key Performance Indicator: KPI)
que verifiquen el correcto cumplimiento de los objetivos establecidos. Solo un
esfuerzo organizado y compuesto puede romper las barreras existentes
debidas al sistema de red tradicional y verticalmente integrado.
Ha llegado el momento de alinear los mercados energéticos con los objetivos
energéticos de Europa. La Market Design Initiative (MDI) abre las puertas a la
unificación y estandarización de la flexibilidad en el lado de la demanda,
incluidos los roles, programas y obligaciones explicados en los países de la UE.
Actualmente, es cierto que el potencial máximo del mercado de vitalidad interior
europeo solo se aprovechará si los clientes, como industrias, empresas y
hogares, pueden participar en la transición energética de la UE. Este debe ser
uno de los objetivos del esquema del mercado y requerirá un cambio clave en
la demanda.
1.7. CASOS DE NEGOCIO
En este bloque se exponen algunos casos que integran Demand Response y las
tecnologías habilitadoras, el objetivo es analizar situaciones prácticas y realizar y medir
el impacto tecnológico y económico de la transición energética. De este modo, en este
resumen se van a exponer los dos principales casos teóricos a los que se debe dar
más importancia en el mercado, y en el Documento se presentan los casos prácticos,
con datos concretos, que reflejan la bondad o no de su implementación real.
1.7.1. Optimización de contratos
Una opción para generar ahorros es reducir los costos de utilización de la red. Los
grandes clientes eléctricos tienen que pagar impuestos por usar la red en función de
la carga y el consumo máximos; por lo tanto, si se reducen los picos de carga, los
costos de utilización disminuirán. Además, algunos países compensan a los clientes
que demandan energía de manera atípica, lo que significa que su mayor consumo
coincide con los períodos de menor actividad.
En segundo lugar, otra opción es obtener tarifas flexibles para obtener ganancias de
ella. Como se ha visto anteriormenteLos precios del mercado de la energía varían
durante el día, por lo que los períodos pico son más caros que los de poca actividad,
por lo que si un cliente puede transferir sus cargas de energía a los períodos más
económicos a través de las tecnologías de DF (Demand Flexibility), este cliente
reducirá sus costos. Además, en algunos países hay tarifas que compensan la
producción de energía producida en la red en horas pico, por lo que aquí hay otra
opción para obtener ganancias. Sin embargo, los diferentes contratos y tarifas deben
ser monitorizados profundamente para asegurar ganancias tanto para la red y las TSO,
como para el cliente en cuestión.

30 Escuela Técnica Superior de Ingenieros Industriales UPM
1.7.2. Comercio en el mercado mayorista
Los mercados de energía abiertos y competitivos son uno de los temas más
importantes de todo este proyecto. Los mercados tradicionales tal como están
implementados no permiten que la demanda participe en el mercado, sin embargo,
todo ello está cambiando a medida que la regulación cambia a su vez.
En general, los participantes en los mercados tienen que pagar una tarifa por la energía
comercial, por lo que el rol del agregador es realmente importante: este reúne a
algunos clientes para lograr suficiente energía como para comerciar con ellos y con
los operadores y obtener ganancias para ambos
1.8. CONCLUSIONES
Se muestran 6 recomendaciones principales derivadas de los análisis realizados
mediante el reconocimiento de un papel más activo del distribuidor y el consumidor, la
integración de las nuevas tecnologías en la red y la correcta asignación de incentivos
para garantizar el funcionamiento eficiente de la misma.
1. Mejorar precios y tarifas reguladas por servicios de electricidad.
La única forma de poner en juego todos los recursos, tanto distribuidos como
centralizados, para lograr una operación y planificación eficientes del sistema eléctrico,
consiste en mejorar tanto los precios asociados con los servicios de electricidad
ofrecidos como los cargos regulados asociados con ellos.
Las medidas que permitirían cubrir estos objetivos serían las siguientes:
Minimizar las distorsiones debidas a los cargos diseñados para la recaudación
de impuestos y la recuperación de los costos de las políticas energéticas. Estos
costos deben salir de la tarifa y ser recuperados por otros mecanismos.
Las tarifas y los cargos no pueden ser variables, ni se deben aplicar soluciones
de balance de red.
No distorsionar la señal de precio de la electricidad. Las ayudas para ciertos
tipos de clientes, tales como clientes vulnerables o industriales, deben
realizarse sin alterar los precios o cargos que sean aplicables. Los subsidios
fuera de la tarifa deben realizarse a través de los mecanismos apropiados.
Implementar de forma masiva medidores inteligentes, con el objetivo de que
las inyecciones y extracciones de electricidad reales de la red determinen el
pago que deben realizar los usuarios, es decir, el uso real de la red.
2. Mejorar la regulación de la actividad de distribución.
El marco regulatorio en el que las empresas distribuidoras realizan su actividad debe
mejorarse, permitiendo la implementación de nuevos modelos de negocio más
eficientes e innovadores.

Jesús Santiago Silvestre Bengoa 31
Las medidas que se pretenden llevar a cabo serían las siguientes:
Asignación de incentivos que dependen de los servicios prestados por los
servicios públicos, destinados a recompensar las mejoras en la calidad, la
reducción de las pérdidas en la red, la mejora de los tiempos de interconexión
y el ahorro de costos en las operaciones de inversión.
Implementación de incentivos para la innovación a largo plazo para acelerar
las inversiones en I + D, así como para fomentar el aprendizaje sobre las
nuevas tecnologías que pueden conllevar, a priori, mayores riesgos para la red.
3. Minimizar la aparición de conflictos de intereses.
Se debe realizar una reevaluación exhaustiva de la estructura de la industria eléctrica
para minimizar la aparición de posibles conflictos de intereses.
Para ello, se necesita:
Realizar una asignación correcta de las funciones principales que se
encuentran en el centro de los mercados energéticos: proveedores de servicios
de red, operadores de sistemas y plataformas de mercado, asegurando así el
correcto funcionamiento del sector eléctrico.
Independencia financiera entre actividades abiertas a la competencia y
reguladas. Se acepta una supervisión reguladora suficiente para situaciones
en las que la separación total de actividades no es posible o ineficiente.
4. Mejora del diseño del mercado eléctrico mayorista.
Para integrar mejor el autoconsumo y compensar la flexibilidad creando un campo de
juego equilibrado para todas las tecnologías es necesario proponer una mejora en el
diseño del mercado mayorista.
Para alcanzar estos objetivos, es necesario:
Que los mercados permitan la realización de transacciones lo más cerca
posible al tiempo real, para recompensar, entre otras cosas, la flexibilidad de
los recursos.
Actualizar el formato de las ofertas en el mercado, con el objetivo de reflejar las
necesidades de los nuevos agentes.
5. Incrementar la importancia de la ciberseguridad.
La conexión de los sistemas de autoconsumo, las nuevas aplicaciones inteligentes y
la mayor complejidad en los mercados eléctricos refuerzan la importancia de contar
con sistemas adecuados de ciberseguridad.
Para esto:
Se necesitarán estándares sólidos en términos de ciberseguridad para todos
los dispositivos interconectados a la red eléctrica.

32 Escuela Técnica Superior de Ingenieros Industriales UPM
Además, la rápida evolución de posibles amenazas subraya la importancia de
que las soluciones se desarrollen e implementen de manera rápida y eficiente.
6. Ahorro de costes a través de un mejor uso del autoconsumo.
El valor del autoconsumo como generación de origen fotovoltaico y baterías, depende
enormemente de la ubicación geográfica de las instalaciones.
Es por eso que:
No se puede establecer un valor estándar para todos los recursos distribuidos.
Cada ubicación donde alguien quiera implementar los recursos distribuidos
debe analizarse individualmente.
Las instalaciones fotovoltaicas y de baterías son más eficientes si se
desarrollan a gran escala. La pequeña escala no siempre es la mejor opción.

Jesús Santiago Silvestre Bengoa 33
2. EXECUTIVE SUMMARY
Nowadays, electric power is considered essential, since it is a staple expendable
commodity. The way in which society evolves makes it increasingly dependent on
technology, thus implying a dependence also on electrical energy. The efficiency of the
electrical system not only has economic repercussions, but also influences the social
and environmental environment.
In this way, in the last years, biggest companies and most advanced countries have
been thinking about a new electric energy model and market, in which efficiency,
security, self-consumption and Demand Flexibility (DF) are prioritised. This is called the
energy transition that basically consist in a new energy market that eschews the
traditional and vertical market were the electricity goes from generators to consumers
through transmission system operators (TSOs) and distribution system operators
(DSOs). In this new market customers become active players in generation and energy
exchange and get profit of it.
This change becomes a real possibility through enabling technologies that are
analysed in this report. These main technologies are Solar PV, Wind Power, Smart
Loads, Electric Vehicles and Energy Storage Batteries; and they need to be examined
in order to determine which ones are the best options to be integrated in the system
and what kinds of advantages do they offer. Furthermore, all the investigations of this
innovations directly impact in other social and environmental conditions due to these
technologies can be applied in other fields.
In this sense, in this report, the sate-of-the-art of each asset is studied, and the best
option of each technology determined; the importance of the asset is evaluated to
analyse if its impact is really disruptive for Demand Flexibility; the kinds of services the
asset can offer; and finally, which is the way to integrate the technology in order to
achieve the best benefit. Up until now, these technologies are becoming economically
attractive and they are currently being integrated, but, in the near future, they will come
to be cheaper and much more profitable.
That is the reason why many different countries, mainly the United States of America
(USA) and the European Union (EU) are adapting their regulations to adjust to the
energy transition. In fact, they are imposing mandatory laws to their member states to
open the electric market to customers through companies and aggretators (it is
explained in the “Introduction”).
In “Energy Transition: Enabling Technologies for Demand Flexibility, Regulation &
Business Models” report, regulation of USA and EU is one of the main topics covered.
Here, previous and latest legislations are exposed and analysed in detail, and
conclusions and recommendations to them are presented in order to take advantage
of the energy transition. Furthermore, a deep study of the different markets of USA
(NYISO and CAISO) and EU (Germany, United Kingdom and France) and its principal
programs is shown taking into account the main characteristics of each one and how
good they are.
However, these conclusions and recommendations about markets and regulations
must be proven with real data that test the profitability of those measures, thus in the

34 Escuela Técnica Superior de Ingenieros Industriales UPM
report four business case drivers are exposed. They study different states of USA
taking real data of population and of particular programs that have been settled there;
then results and comparisons are shown to prove the profitability or not of these
investments. And, of course, this report gives some amendments to the regulation that
was set in those cases, sometimes positive and other not that much.
Summarizing:
This research focuses on understanding how the greater penetration of self-
consumption will affect regulation and current business models in the electricity
sector.
Nowadays important changes are taking place in the form of generation and
consumption of electricity, fundamentally due to a confluence of factors that
affect the electrical distribution systems. New technologies or services, such as
demand flexibility, self-consumption, energy storage, and advances in power
and control electronics devices, are generating new opportunities in the supply
and consumption of electricity. At the same time, the rapid cheapening of
information and communication technologies (ICTs) are allowing a more
efficient consumption of electricity, a better vision of the use of the network as
well as better control of electrical systems.
This report presents a framework for regulatory proactivity and market reform,
in order to achieve an efficient evolution of the electricity system over the
coming decades. The objective is to facilitate and achieve the integration of all
resources, regardless of whether they are centralized or distributed, all of which
can contribute to an efficient electricity supply for consumers.

Jesús Santiago Silvestre Bengoa 35
3. INTRODUCTION, OBJETIVES AND
STRUCTURE
3.1. INTRODUCTION
This project is thought to give a vision on the energy transition, and how it is driven
by technology. Nowadays technologies such as Smart loads, Solar PV, Wind Power,
Energy storage and Vehicle to grid that are raising through maturity and lower costs,
could make a more efficient and secure energy market.
This project is going to analyse the energy market through three main blocks:
Technologies that enable the energy transition, how the regulation is changing and
must change in order to take advantage of these innovations, and finally, the business
models that can be achieved through the mix of technologies and regulation.
The energy transition is changing the traditional energy market and is generating many
business opportunities even more in the near future. It is a topic of tremendous
relevance in the present technological, electric and economic outlook. Furthermore, it
will impact in the life of all the population due to every single consumer will be able to
become provider of energy to the system by means of aggregators.
Aggregators represents a key role in this energy transition, they will enable the
consumers (with batteries, smart loads or solar PV in households) to engage the market
by achieving an efficient management of their technologies and getting economic value
of it.
Nowadays there are some regulatory issues in some countries that need to be
amended in order to ensure a free trade energy market and integrate novel
technologies. The main solutions have already been mainly implemented in USA and
UK with the development of the demand response taking into account the role of
aggregators and consumers.
In addition, EU have deployed the Winter Package due to which member states of the
EU are going to regulate the energy market and encourage final consumers to
participate alongside generators in a non-discriminatory manner. This is the beginning
to the transition in Europe but this report will not just assess the bounties of these
measures, but it will give recommendations to achieve an energy transition with security
supply, efficiency and free trade.
Energy transition is also the way to stop the emission of Green House Gases (GHG)
and the climate change by prioritising renewable sources and by integrating non-
polluting novel technologies. This objective is yet declared in the European
commitment 20/20/20 and the Winter Package.
Regarding the motivation for making this project, last four months (in the time when
this report is written) the author of this TFG has been working in i-deals (Everis) and
the energy transition has been one of the main topics addressed during this period.
The author has understood the relevance of it and how it is going to change every
electric billing of each consumer. Every single person will be able to participate in a

36 Escuela Técnica Superior de Ingenieros Industriales UPM
market that traditionally has been managed by very few enterprises and in some
cases that has operated like a monopoly.
3.2. OBJECTIVES
The very first objective of this project is to analyse the main facts of the energy
transition, understand with everyone must join this opportunity, give recommendations
of the present and future technologies that should be integrated and how regulation
should change to enable a more efficient and secure energy market.
This project is a huge source of knowledge and it is intended to be addressed as a
deep research, analysis and guide of the actual and future energy market.
The following graph represents how the steps to achieve the final objective:
Figure 1: Objectives. [Source: Own.]
A research of the main technologies must be done in order to understand why
this transition is possible because it is driven by technology. Energy storage,
smart loads, decentralised generation with solar PV, grid scale generation with
wind power and vehicle to grid technologies must be researched and analysed
and, then concluding the best option of each technology in order to obtain good
recommendations for the regulators of the system.
Traditional and present regulation needs to be amended that is why it will be
analysed with its advantages and disadvantages. The changes in the legislation
that have already been done will be assessed and recommendations will be
exposed. This project will be able to give conclusions to the regulators due to
the previous technological analysis.
Finally, with all earlier knowledge the study of real and present business models
will be able to be made. Furthermore, these business cases will provide a
practical vision of how this transition is possible and much more profitable for
all players (TSOs, DSOs, aggregators and consumers). Even more, these
models will prove that the technology previously studied fit with real cases and
will justify all the investment in its development.
TECHNOLOGY
REGULATION
BUSINESS MODEL

Jesús Santiago Silvestre Bengoa 37
To conclude the project final conclusions of the future energy market will be indicated:
recommendations of the technologies that should be used to tap into the best potential
ones; analysis of the best regulations and legislation to ensure a fair competition
market, the security and the efficiency; and finally, business suggestions to get the most
worthwhile investments.
3.3. STRUCTURE
In the report there are four main chapters: Context, Enabling technologies, Regulation
and Business models.
First of all, the first block introduces the reader in the energy market, how does it work
and who are the main players. It will try to make readers aware of the importance of the
energy transition and how the flexibility of electric demand impact on it. This chapter
especially focus on Red Eléctrica de España (REE) the transmission system operator
(TSO) in Spain, it is explained its role in the energy market and how it has to control
the security in the supply and the efficiency in the system.
Secondly, it is analysed the state-of-the-art of the enabling technologies of the energy
transition in order to conclude the benefits that each asset could provide to the flexibility
of the demand. This chapter focus mainly on the maturity of each technology and how
their production costs and selling prices are going down as market begin integrating
them. The technologies assessed are mainly energy storage (Batteries), distributed
generation (Solar PV), grid scale generation (Wind power), controllable loads, V2G
(Vehicle-to-grid), energy management system (EMS) and the role of the aggregator.
Thirdly, the regulatory framework will be assessed, focusing on different markets in
United States (CAISO, NYISO), the future and present framework in Europe (UK,
Germany, Spain), and on few markets in Asia. But the most important block here is the
recommendations and amendments that will be exposed to obtain the new energy
market ensuring security supply, efficiency and free trade.
Fourthly, all previous information will let to test some business models and determine
how profitable and legal they are and how will they develop in the future. This real
business cases will be able to conclude which are the best profitable inversions in the
electric sector and which are the technologies that should be used.
Finally, last conclusions of the TFG are shown, after having discussed all the energy
situation, the author will be able to give recommendation to get the best energy
transition to the new electric market.

38 Escuela Técnica Superior de Ingenieros Industriales UPM

Jesús Santiago Silvestre Bengoa 39
4. CONTEXT
In other to introduce you in the electric sector and how is the Operation of the Electrical
System, Spain is going to be taken as an example.
4.1. FUNDAMENTAL KNOWLEDGE
In Spain, REE (Red Eléctrica de España) is a titular company and manages the
transmission system and is the responsible of the operation of the electrical system in
Spain, in other words, REE is a TSO (Transmission System Operator) and the System
Operator in Spain. This will be explained more deeply hereafter.
An electrical system is the set of elements that operate in a coordinated manner in a
given territory to meet the demand for energy electric, in Spain there are seven basic
components1:
The centres or generation plants, where electricity is produced, and tension
rises to transport it.
Electricity transport lines high voltage, which manages, develops and
maintains REE.
Transformer stations (substations of transport or distribution) that reduce the
voltage of the line.
The medium and low voltage distribution lines that carry electricity to the
consumers.
The facilities of customers or consumers of electric power.
The control centres of the generating companies, distributors and marketers.
A national electric control centre from which is managed, coordinated and
operated electrical system, and that is also managed by REE.
However, there are still some principal actors that need to be presented in order to
better understand the system2:
Generators: They are the agents that produce electric power, regardless of
type of technology they use for it. The Generation is a liberalized activity.
Carrier: It is the company that transports electricity from the power stations
where produces up to the consumption centres where it is delivered to the
distributors. In Spain, by law, there is a single transporter, as it has been
explained, who is REE (Red Eléctrica de España).
System operator: It is the company, in this case also REE, which is responsible
that the whole process of the operation of the electrical system works smoothly.
The key is to achieve the balance between generation and energy consumption.
It is done through the Electric Control Centre (Cecoel) and its activity is really
important due to electricity cannot be stored on a large scale, so it mostly must
be produced in the same moment that it is been consumed.

40 Escuela Técnica Superior de Ingenieros Industriales UPM
Distributors: These are the companies that carry electricity to final customers:
the streets, homes, businesses, etc., when they receive it from the carrier in the
substations annexed to the major centres of consumption. Although there are
numerous companies who exercise this activity, in each area of Spain can only
be one distributor. Or, what is the same, until our house only the cables of one
single company can arrive.
Marketers: As its own name indicates, they are the agents that trade with the
energy. They buy it in the electric market and sell it to consumers. They are
those who pass us the receipt of light. It is also a liberalized activity.
Consumers: That is, you and any other person or company that in a moment
given consumes electricity.
After examining the principal actors and components of the system, an overall look of
the energy generation will be exposed. Basically, there are 4 ways of generation, the
first two of them are pollutant and the last two of them use renewable energies3:
Thermal power plants: There are different types, depending on the material
they are fed: fossil fuels (coal, fuel and natural gas), urban waste or biomass,
without forgetting those of combined cycle. Its burning produces also a pressure
steam that moves a turbine connected to a generator.
Nuclear or atomic power plants: Operate through the fission of a nuclear fuel
(uranium or plutonium, for example) that, when generated pressure steam,
starts a turbine connected to a generator that is the one that produces the
electricity that then passes to the network.
"Atmospheric" Centrals: They are those that use resources like dammed
water or the wind. In this case, the pallets of the Hydraulic turbine or wind turbine
propellers move the turbine directly which feeds the generator. Electricity thus
produced then passes to the network.
Photovoltaic power stations: The contained energy in photons the sunlight
becomes directly in electricity and passes well to the network.
The priority of renewable energies is due to the global warming. Europe have proposed
the European commitment 20/20/20, what means the need to reduce greenhouse
gases by 20%, to improve energy efficiency by 20% and to achieve 20% of energy
generation with renewable resources; and those three objectives have to be achieved
by 20204. Even more, recently another standard has been released, the Winter
Package, which determines a 27% of energy generation with renewable resources by
20305.
For that matter, REE is highly concerned with sustainable development and the fight
against climate change. So, it has developed different actions6:
The integration of renewable energies: The European and national
commitment to these energies (hydro, wind, solar and biomass), that generate
electricity without emission greenhouse gases and use resources indigenous
peoples, will reduce our external energy dependence.

Jesús Santiago Silvestre Bengoa 41
Energy efficiency: The impulse of demand management initiatives pursue
achieve greater efficiency, both in the operation of the electrical system as in
the own energy consumption.
Reducing emissions: In 2012, the rate of emissions associated with
equipment of substations, mainly of SF6, it was reduced to 0.99%, which it
practically means reaching the goal of 1% marked for 2015.
Tree protection: Compensation of emissions is carried out through of the REE
Forest, a project of reforestation with which they have compensated more than
60,000 tons of CO2 in its five years of operation.
Adaptation to climate change: REE constantly assesses the risks potential
that climate change could have about your activity as a carrier and operator of
the electrical system, while prepares performances to do against the risks
already identified.
The extension of the company's commitment to the stakeholders: Or what
is it same, a communication policy of the carbon footprint of REE, collaboration
in initiatives to fight against climate change, action development of awareness.
Other important subject that needs to be considered is the interconnection between
different systems, the main reason is that if a system is isolated and suffers the
unexpected stop of a generator, the logical and immediate consequence is that the
balance that must exist between the production and demand of electric power can be
decompensated.
However, in a system interconnected with many other systems, the unexpected stop of
a generator also causes an alteration of the electric parameters. But this time, as all
the systems are united in the same network, everyone will contribute their bit to replace
the lost production of the damaged generator. That is, there will be so many generators
that will bring the shoulder that the parameters of the system will hardly be affected.
There lies the need for interconnection. Therefore, the Spanish peninsular system is
connected with our European neighbours, Portugal and France, through it, to the
European network; and with Morocco and, through it, to the North African network.
But this is not the only advantage of international interconnection. Another no less
interesting is that allows to evacuate electricity generated from renewable sources
(energy from renewable is usually intermittent and difficultly controlled due to they
depend on the wind, the sun, etc., that is to say, natural sources) at a time when this
generation does not can be absorbed by the Spanish electrical system and,
consequently, it does not take advantage, what it forces, for example, to disconnect
wind farms.
4.2. SYSTEM CONTROL
REE objective as system operator is to cover all the energy demand that the
customers do. And to achieve it, it puts into play a tactic that pursues above all the
coordination among the group of participants. Because only of the correct and balanced
strategy among the energy producing centres, the network of transport in high voltage,

42 Escuela Técnica Superior de Ingenieros Industriales UPM
the substations that they reduce that tension and the distribution network to each home,
business and street, electricity will get there where it is necessary at the precise
moment.
To achieve this objectives, different three parts are going to be explain: the preparation
of the system, the operation and the analysis.
Electric system needs a preparation that consists of three indispensable stages:
The forecast of future electricity consumption: It is an essential aspect to
calculate the generation and network needs to long term. Then, in the day to
day and hour to hour readjustments will be made depending on the capricious
reality.
The determination of the generation power what to install: That is, what will
be the production needs required by a society that every day presents itself
more dependent on electricity.
Transportation network planning: Related to the previous point, here what is
involved is to keep in mind how will carry that energy that will be needed in the
future from the centres where it is generated even the consumers.
The secret of success is to foresee the evolution of energy demand (Figure 2), because
foreseeing it allows the operator of system identify generation needs of energy and plan
accordingly the network of transport, so that there is no lack of power to cover
consumption, or build generators moreover, neither the lines collapse and provoke a
lack of supply coverage.
But how does the system operator know the electric power consumption throughout the
system electric in real time? Well, thanks to a very advanced technology and to the
collaboration of agents of the electrical system, the operator of the system is able to
capture the precise data to know in real time the instant consumption of electric power.
And it represents it in some special graphics, the demand curve.

Jesús Santiago Silvestre Bengoa 43
Figure 2: Electric demand curve. [Source: REE.]
As seen, the prevision plays a very important role, but in real time there is a new player:
The electric market. In the Península Ibérica it is called MIBEL (Mercado Ibérico de la
Electricidad) and their main players are:
The generators, which present offers of sale of all the energy they have
available at the price they consider convenient.
Marketer companies (those that pass the receipt for the electricity that it is
consumed), which present their offers of purchase of the energy that, according
to their forecasts, they will need, also at the price that they estimate convenient.
The users of the international interconnections, who come to buy or sell
energy, with authorization to establish international exchanges.
Direct consumers, large customers who come to buy energy directly to the
market.
Conversely, this market requires to be managed by an institution, in this case is the
OMIE (Operador del Mercado Ibérico de Energía) that establishes production programs
and consumption for each hour of the next day. Those groups that have offered the
best price will start, and those with more elevated offers will kept stopped. The daily
market price is established having in consideration the last offer married in each hour.
All programmed generators are remunerated at the marginal price of each hour,
independently of the offers submitted, and with him also the settlements are calculated.
The established programs are added to the delivery and energy intake programs
established in the daily electricity market through bilateral contracting with physical
delivery between sellers and buyers of energy, giving rise to the so-called daily base
program of operation for the next day7.
After the daily market, the operator of the system carries out an analysis to determine
if the electrical system is safe or if, on the contrary, there is a risk situation in which they

44 Escuela Técnica Superior de Ingenieros Industriales UPM
could occur blackouts. If the program is not technically feasible, the operator of the
system will modify it.
Deepening the electric market, and focusing on the economy: In a liberalized
environment, in which the generation activity takes place in a free market framework,
the different possible designs can be summarized basically in two: a "energy only"
model, in which the market price is the only income of the generators, and a "market
price + payment for capacity" model, in which the generators receive the market price
and an additional payment as an incentive to investment and availability. Down below
each model is explained:
“Energy only” model: In order for the "energy only" model to work properly, the market
price must be high enough at times of maximum demand so that a state-of-the-art
power plant (which only generates at those times) recovers its fixed costs.
"Market price + payment for capacity" model: The "energy only" model is currently
unviable in many countries, mainly because particularly high prices, even only a few
hours a year, result very controversial from the political point of view. In fact, Spanish
regulations do not allow offers in the daily market above € 180 / MWh8. Given this
restriction, in order to give the plants an opportunity to recover their fixed costs, a
system of regulated payments, additional to the market price, must be designed and
that has to do with the value of the ENS (Energy not supplied) and with the limit to be
imposed on the price (the greater the difference between the value of the ENS and this
limit, the higher the capacity payments must be for a given quality level of supply). With
this scheme it is pursued that there is sufficient investment to meet the demand points,
incentivize investment, and that the plants are available at times of high demand.
Another system of capacity payments, developed mainly in some states of the east
coast of the USA, is the derivative of imposing on suppliers the obligation to cover their
maximum annual demand with "capacity tickets". These tickets must be purchased
from the generators, who receive a complementary income in exchange for being
available. Unlike the system of regulated payments, in which it is the Administration
that establishes the price of capacity payments, and it is the interaction of supply and
demand that determines the quantity of capacity demanded; with the "capacity tickets"
it is the Administration that defines the quantity of capacity demanded, and it is the
interaction between offer and demand of "capacity tickets" that establishes its price.
In conclusion, the current design of the market offers, in theory, to generators a
guarantee of recovery of investment costs and costs linked to availability through
regulated payments that complement the revenues in the market. However, recent
regulatory decisions, motivated by the pressure of the regulator to reduce the tariff,
introduce uncertainty that may affect the decisions of operation and maintenance of
existing assets with high fixed costs, on the one hand, and investment decisions in new
capacity. These types of regulatory decisions are an example of a "regulatory vicious
circle".
Therefore, to create the right conditions for investors to respond to the investment
needs in the system and for companies to maintain their operating assets, so that
consumers benefit from greater security of supply, the Administration should offer a
guarantee of stability in the regulation of generation companies.

Jesús Santiago Silvestre Bengoa 45
This is one of the problems that will be resolved with the flexibility in the electric
demand, now some other problems of the system will be exposed, and some possible
solution will be introduced, all of them are inside the future electricity model that is
discussed in this report.
After having analysed, economic topics of the electric market, other main difficulties of
the actual model are going to be exposed:
In general, a sustainable energy model would be one characterized by production and
consumption patterns that reconcile economic, social and environmental development,
meeting the energy needs of present generations without compromising the
possibilities of future generations to meet their own needs. For this to be possible, the
energy model must take into account three basic elements:
Energy security: must guarantee the continuity of supply at reasonable prices
for consumers.
Competitiveness: should not pose a danger to the competitiveness of the
economy, and its growth.
Environmental sustainability: the production and consumption of energy
must not have an unaffordable impact on the environment. Within this area, the
energy sector, as responsible for 80% of greenhouse gas emissions, must play
a very important role in the fight against climate change.
The current energy model is characterized by a constant growth of energy
consumption, based on finite resources, mainly fossil fuels.
According to the forecasts of the International Energy Agency (AIE), the global primary
energy demand will grow in the reference scenario at an annual rate of 1.5% until 2030,
with a predominant weight of fossil fuels remaining above the total consumption, so that
coal, natural gas and oil will represent 80% of the energy consumed in 2030 as can be
seen in Figure 3.
Figure 3: Evolution of global primary energy consumption. [Source: World Energy Outlook 2012.]

46 Escuela Técnica Superior de Ingenieros Industriales UPM
The economic, environmental and social unsustainability of the global energy model is
revealed by its own characteristic elements.
In terms of economic unsustainability, it is noteworthy that an economy based on the
consumption of finite fossil energy resources (gas, coal and oil) will be compromised
its competitiveness against the foreseeable trend growth experienced by the prices of
energy raw materials. In addition, as shown in Figure 4, the growth of oil prices may be
mitigated by the application of environmental policies aimed at reaching the 450 ppm
scenario (which includes important additional measures to limit the increase in
temperature to 2 Celsius degrees).
Figure 4: Projected evolution of oil demand in thousands of barrels per day and oil prices in dollars per barrel. [Source: World Energy Outlook 2012.]
On the other hand, in the case of economies that are heavily dependent on foreign
sources to cover their energy needs, the price risk derived from the evolution of energy
prices is compounded by the interruption of supply in the face of possible situations of
various kinds. An example of this was the interruption of Russian gas supply in January
2008, which affected several countries of the European Union, caused by a conf lict
between Russia and Ukraine.
In terms of environmental sustainability, the evolution of energy consumption in the
reference scenario implies an increase in Greenhouse Gas (GHG) emissions that is
much higher than that required to limit the increase in global temperature to 2 Celsius
degrees. In this sense, there is a generalized consensus at the international level -
based on the IPCC analysis on the need to reduce global emissions by at least 50% in
2050 compared to 1990 levels to avoid an increase in temperature above that
mentioned.
From the social point of view, the current energy model does not allow access to
advanced forms of energy (mainly electricity) to 2 billion people, with the negative
implications that this has in terms of human development and future economic growth
potential9.
All in all, these difficulties exist due to the actual electric model and market, however in
this review, a new power sector model is exposed which amends the problems of the

Jesús Santiago Silvestre Bengoa 47
actual one. It is mainly based on the state-of-the-art of the different technologies and
the future development of them, so innovation must go together with this transition.
4.3. POWER SECTOR TRANSITION
Already today electric power systems in Europe, the United States and other parts of
the world are experiencing several changes guided by the trends:
Increasing decentralization of power systems due to the penetration of DERs
(Distributed Energy Resources).
Proliferation of ICTs (Information and Communications Technologies).
Active and price-responsible energy consumers.
Increased interconnectedness of electricity with other critical infrastructure.
Growth of variable renewable energy resources.
Global climate change mitigation efforts.
4.3.1. DERs
In the new power model DERs are going to be treated as main players, more
specifically they are defined as any resource capable of providing services that is
located in the distribution system. In most power systems they remain minor players,
however their deployment and smart energy consumption are generally on the rise.
Some DERs examples that are running in several markets at present are listed below:
Solar PV: Nearly one in five customers in Hawaii and one in 10 single-family homes in
California has already a rooftop solar PV system10; and in Germany 98% of all solar PV
is connected to low and medium voltage distribution grids11.
Energy storage: Energy storage resources such as thermal energy storage and
lithium-ion batteries are becoming more competitive. Furthermore, battery energy
storage projects are currently located in the United States within distribution systems12.
CHP (Combined Heat and Power): Already in 2015, these units and fuel cells
accounted for 8% of all generation capacity in the United States13; besides, 75 percent
of reinforcement age capacity in the United States is filled by diesel or natural gas14.
Wind farms: Onshore wind farms connected at distribution voltage are becoming
increasingly widespread and they currently have reached significant capacity in many
power systems15.
HVAC (Heating, Ventilation and Air-Conditioning) systems, water heaters: They
collectively represent over 80% of the demand resources for PJM16 (TSO in the United
States).

48 Escuela Técnica Superior de Ingenieros Industriales UPM
4.3.2. ICTs / price-responsible demand
The digitization makes it less demanding to ascertain and convey the estimation of
power services with better transient and spatial granularity. Digitization in blend with
the new energy assets displayed above is enabling systems to be overseen all the
more effectively, possibly finishing the worldview of inactive system administration, in
which the systems are measured to take care of the total peak demand of detached
purchasers. Indeed, this digitization is empowering energy demand to take an interest
effectively in their arrangement.
In the PJM market in the eastern United States, almost 11 GW of demand side assets
cleared in the limit advertise for conveyance in 2019 and 2020. Furthermore, request
side assets offer a normal of about 1.5 GW of limit day by day in the synchronized hold
advertise17. Altogether, adaptable demand side assets in PJM earned generally $825
million in incomes from taking an interest in PJM's different markets in 201518. While
PJM has turned out to be a pioneer in actuating request in vitality and limit markets, it
isn't the only one. Request assets give in excess of 1 GW of limit in the NYISO
advertise.
The expanding digitalization of the power division through the organization of ICTs is
additionally encapsulated in the rollout of cutting edge metering foundation and other
network sensing foundation in the United States and Europe. In the United States,
around 59 million shrewd meters have been conveyed, covering more than 40% of
metered locales19. In the European Union, progressed meter organizations are relied
upon to reach 72% of consumers by 202020.
As ICTs multiply all through power systems, administrative organizations, utilities, and
aggregators are progressively using new duty structures — undoubtedly, in the second
quarter of 2016, 42 of 50 US states made a move to change levies or on the other hand
address DERs in some way21.
. These new tax structures run from innovation particular request accuses connected
to those of dispersed assets to time-of-utilization rates and three-section levies with
continuous energy costs, request charges, and settled charges.
In any case, the expanded digitalization of the power framework has made new
vulnerabilities. Ensuring a country's power framework from digital assaults is a basic
national security issue and an imperative need for electric utilities. As the digital assault
on the Ukrainian power grid illustrated on December 201522, electric utilities are
defenceless against assault and will turn out to be all the more so in the one decade
from now as utility frameworks utilize more advanced controls and as activities and
metering and resource management frameworks turn out to be more interconnected.
4.3.3. Interconnectedness
Natural gas: It is picking up conspicuousness in the energy mix of numerous nations.
Some view gaseous petrol as a change fuel to decrease CO2 emanations and help
incorporate discontinuous renewables. The introduced limit of flammable gas joined
cycle control plants has developed drastically in late decades in both the United States
and Europe, furthermore, the power segment has turned into a more considerable

Jesús Santiago Silvestre Bengoa 49
shopper of petroleum gas. Gas utilization for power generation in the United States has
developed from 4% to 33% of aggregate power utilization amid the most recent 25
years23. To be sure, without precedent for US history, natural gas created more power
than coal in 2016. In addition, gas-based DERs, including fuel cells, have turned out to
be promising innovations to give both power and warmth toward the end-customer
level. As indicated by the US Department of Energy, nearly 25 percent of Fortune 100
organizations presently utilize fuel cells to produce spotless, proficient, and dependable
power to control server farms, phone towers, corporate structures, retail offices, or
forklifts24.
The electricity and natural gas divisions of numerous nations are in this way
interdependent, furthermore, they will turn out to be considerably more so after some
time.
EVs (Electric Vehicles): Electric vehicles speak to an essential new class of power
clients, a developing section of power request that is portable on timescales not already
observed in the electric power sector. This fragment can go about as both a critical,
adaptable, or schedulable request and conceivably even an adaptable and
appropriated supply asset. EV entrance is low today yet ascending in the lion's share
of markets. Internationally, 2015 EV request expanded by additional than 80% more
than 2014. EVs could achieve 20% of new vehicle deals worldwide by 2030 and 35%
by 204025. Extrapolating that normal selection rate to the US market, about 16 million
EVs could be voyaging US streets by 2030, with on the request of 1,000 GWh of battery
stockpiling limit. While gauges fluctuate generally, about all point toward an expanding
infiltration of electric vehicles.
4.3.4. Renewable energy resources
The development of dispersed assets is occurring against the setting of a progress to
a more renewable and intermittent energy mix. Around the world, the power asset blend
is being changed by the development of sustainable power source assets, for example,
inland and seaward breeze, sunlight based PV and concentrated sun based power,
biomass, little and expansive hydro, geothermal, and marine vitality26.
All around, sustainable power source assets included 213 TWh in 2015, a sum
generally equivalent to add up to 2015 power request development. Additionally, 2015
was a record year for interest in sustainable vitality: In absolute, almost $286 billion
was contributed internationally to send around 134 GW of sustainable power source
assets, barring extensive hydro, speaking to almost 54 % of all new power limit27.
Looking forward, the world's biggest power markets, including the US, EU, China, India,
Brazil, and Mexico are for the most part intending to grow sustainable power source
age fundamentally in the coming decade.

50 Escuela Técnica Superior de Ingenieros Industriales UPM
Figure 5: Green Powerhouse. [Source: REN21.]
This worldwide move to inexhaustible assets isn't without unintended outcomes and
developing agonies. Altogether, Western European utilities have lost many billions of
dollars of market value in the previous decade. For example, three of the largest utilities
in Germany (EnBW, RWE and E.ON) collapsed by 45% to 66% over the previous 6
years28. Difficulties stay in incorporating more prominent offers of sustainable power
source, yet the incline is clear: Renewable vitality assets are not any more a specialty
asset in numerous worldwide power frameworks, yet rather one of the biggest
wellsprings of new producing limit.
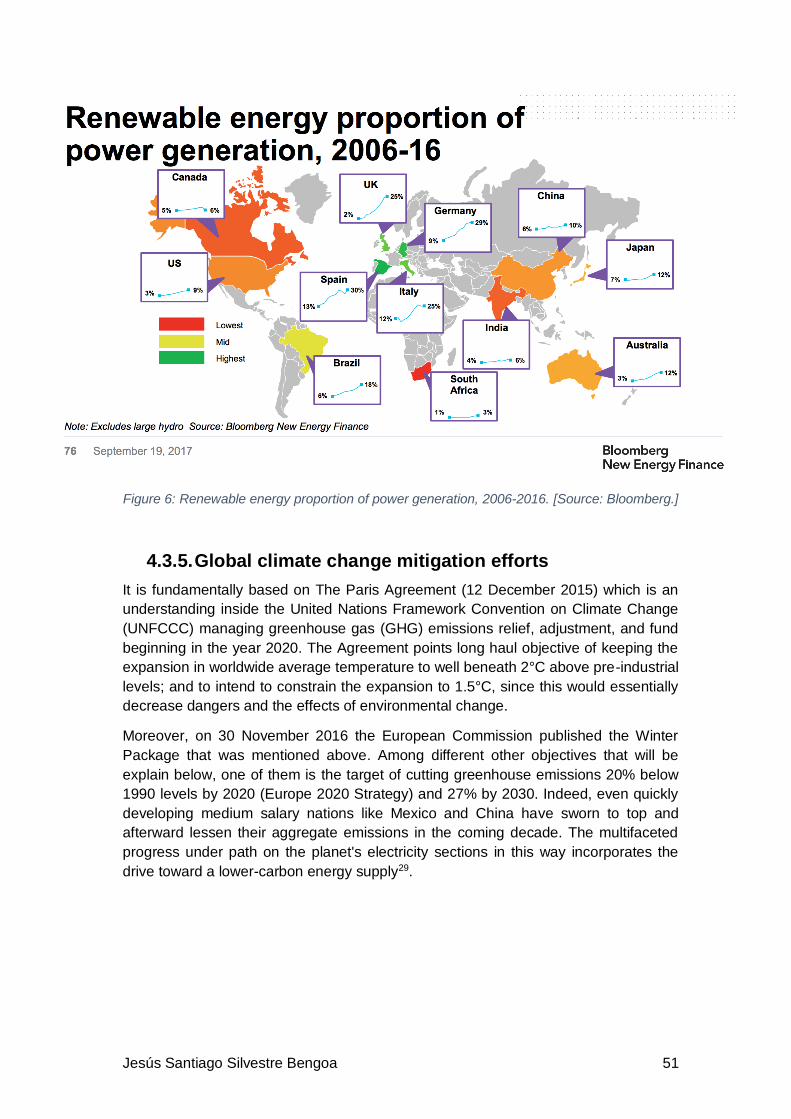
Jesús Santiago Silvestre Bengoa 51
Figure 6: Renewable energy proportion of power generation, 2006-2016. [Source: Bloomberg.]
4.3.5. Global climate change mitigation efforts
It is fundamentally based on The Paris Agreement (12 December 2015) which is an
understanding inside the United Nations Framework Convention on Climate Change
(UNFCCC) managing greenhouse gas (GHG) emissions relief, adjustment, and fund
beginning in the year 2020. The Agreement points long haul objective of keeping the
expansion in worldwide average temperature to well beneath 2°C above pre-industrial
levels; and to intend to constrain the expansion to 1.5°C, since this would essentially
decrease dangers and the effects of environmental change.
Moreover, on 30 November 2016 the European Commission published the Winter
Package that was mentioned above. Among different other objectives that will be
explain below, one of them is the target of cutting greenhouse emissions 20% below
1990 levels by 2020 (Europe 2020 Strategy) and 27% by 2030. Indeed, even quickly
developing medium salary nations like Mexico and China have sworn to top and
afterward lessen their aggregate emissions in the coming decade. The multifaceted
progress under path on the planet's electricity sections in this way incorporates the
drive toward a lower-carbon energy supply29.

52 Escuela Técnica Superior de Ingenieros Industriales UPM

Jesús Santiago Silvestre Bengoa 53
5. ENABLING TECHNOLOGIES FOR DEMAND
FLEXIBILITY
5.1. INTRODUCTION
As it has been seen in the “Context”, there are some new technologies that have arrived
to the energy sector that are able to transform it from the assets and infrastructure to
the market operation and trading. These technologies goes from digitalization, ICTs,
Big Data, IoT and smart loads that are able to set a more autonomous and precise
system administration to specific technologies that are challenging the energy sector
like DERs (Solar PV, wind farms, CHP, Energy Storage and HVAC) which enable the
flexibility in the demand side.
But before deepening in the analysis of each technology it is crucial to understand a
little bit more about DERs and the new ways of providing electricity services. DERs are
any resources capable of providing electricity services and located in the distribution
system. They can be partitioned into two unmistakable classes: DERs introduced
particularly to give electricity services, for example: energy storage devices, solar
PV frameworks with keen inverters, control hardware, or disseminated fossil
generation; and assets that exist essentially for reasons other than to give power
benefits however that can be tackled for this reason, for example: flexible demand
and electric vehicles30.
Cost-reflective prices and charges for electricity services can make the conditions to
boost DERs of the top notch to be introduced just when DERs will include esteem.
Besides, these cost-reflective prices and charges empower existing demand and DERs
to make esteem by presenting the proprietor to the potential advantage of locks in in
the market.
It is vital to note of that demand is both a consumer of electricity services and a potential
provider of services, so demand have to be considered as a potential resource.
Notwithstanding, it is essential here to recognize demand providing a service and the
more productive utilization of electricity services. Here is going to be explain this
difference:
The demonstration of choosing to devour or on the other hand not devour electrical
power service in view of the cost of such services does not itself give a power benefit.
Reacting to high power costs by abridging consumption is just a statement of the
degree to which a given operator esteems the utilization of electrical energy. This
adaptable demand can be an imperative wellspring of enhanced proficiency in control
frameworks however constitutes the monetarily productive utilization of a service, not
the arrangement of a service. In this report the more efficient consumption of electricity
services is called as price-responsive demand.
Then again, an operator with flexible demand might have the capacity to make a
forward responsibility to provide a future response, where the responsibility itself has a
value past the last energy consumption. A flexible demand specialist may confer in
progress to remain by and be prepared to modify utilization with a specific end goal to
convey an extra administration, for example, working saves, firm limit, or system limit

54 Escuela Técnica Superior de Ingenieros Industriales UPM
edge. This dedication itself conveys esteem unmistakable from the final consumption
of energy, and may bring about extra backup or duty costs, and may require instalment
of extra pay past abstaining from paying for energy that was not expended. In this report
the demand providing a service is called as demand response.
It is critical likewise to take note of that the specialized and financial qualities of
DERs are as changed as the DERs themselves, and there is noteworthy variety in
cost what's more, execution among even really similar DERs. This is basic, as it
features the uselessness of endeavouring to characterize a solitary value for all DERs.
To start with, there are cost and execution contrasts between advancements inside a
given class of DERs. For instance, in the electrochemical battery class, lithium-ion
batteries furthermore, lead acid batteries have altogether different execution qualities.
Thus, inside the class of solar PV, thin film and c-SI (crystalline silicon) frameworks
have diverse characteristics. All in all, these will be shown in the next section when
energy storage and decentralized generation is concerned.
Secondly, there are cost and execution contrasts between innovations of a given kind.
For instance a c-Si PV module with 15 percent effectiveness may in like manner cost
altogether not as much as a c-Si module with 20 percent module effectiveness. The
figure below additionally shows the execution variety inside the c-Si PV innovation type.
Two identically sized 10 KW PV c-Si PV systems and identically found in Arizona can
create drastically different energy results relying upon orientation and regardless of
whether they utilize tracking systems. PV systems conveying double hub tracking
systems delivered up to 33 percent more energy in a given month than PV systems
without tracking31.
Figure 7: c-Si PV systems in Phoenix, Arizona. [Source: NREL.]
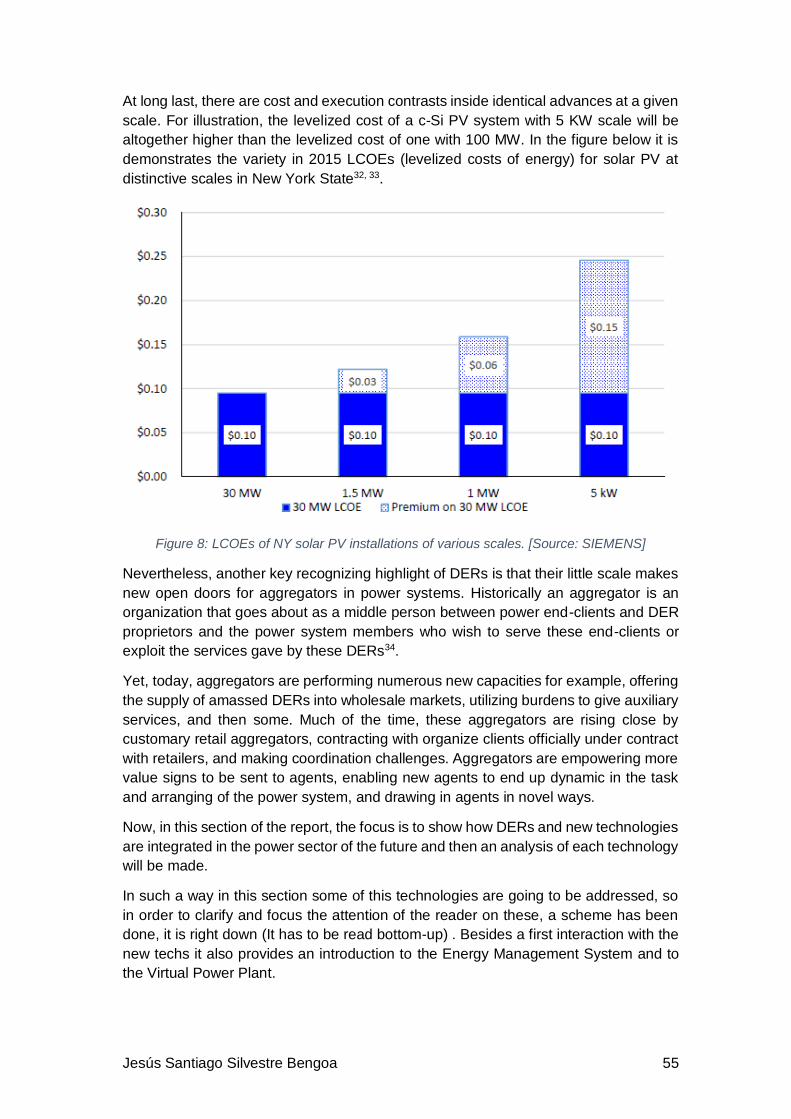
Jesús Santiago Silvestre Bengoa 55
At long last, there are cost and execution contrasts inside identical advances at a given
scale. For illustration, the levelized cost of a c-Si PV system with 5 KW scale will be
altogether higher than the levelized cost of one with 100 MW. In the figure below it is
demonstrates the variety in 2015 LCOEs (levelized costs of energy) for solar PV at
distinctive scales in New York State32, 33.
Figure 8: LCOEs of NY solar PV installations of various scales. [Source: SIEMENS]
Nevertheless, another key recognizing highlight of DERs is that their little scale makes
new open doors for aggregators in power systems. Historically an aggregator is an
organization that goes about as a middle person between power end-clients and DER
proprietors and the power system members who wish to serve these end-clients or
exploit the services gave by these DERs34.
Yet, today, aggregators are performing numerous new capacities for example, offering
the supply of amassed DERs into wholesale markets, utilizing burdens to give auxiliary
services, and then some. Much of the time, these aggregators are rising close by
customary retail aggregators, contracting with organize clients officially under contract
with retailers, and making coordination challenges. Aggregators are empowering more
value signs to be sent to agents, enabling new agents to end up dynamic in the task
and arranging of the power system, and drawing in agents in novel ways.
Now, in this section of the report, the focus is to show how DERs and new technologies
are integrated in the power sector of the future and then an analysis of each technology
will be made.
In such a way in this section some of this technologies are going to be addressed, so
in order to clarify and focus the attention of the reader on these, a scheme has been
done, it is right down (It has to be read bottom-up) . Besides a first interaction with the
new techs it also provides an introduction to the Energy Management System and to
the Virtual Power Plant.

56 Escuela Técnica Superior de Ingenieros Industriales UPM
E l e c t r i c V e h i c l e E n e r g y S t o r a g e
D i s t r i b u t e d
G e n e r a t i o n
G r i d S c a l e
G e n e r a t i o n
S m a r t L o a d s
E n e r g y M a n a g e m e n t S y s t e m
V i r t u a l
P o w e r P l a n t
In the first instance the generalization of electric vehicles in the society infers a huge increment in power demand in urban zones. However, EVs may turn into an applicable operator utilizing bidirectional charging facilities to empower vehicle to grid administrations. It could be utilized as a major aspect of the public system or as a feature for smart house frameworks relying upon the charging station usage.
Stationary storage empowers the final client to improve their vitality needs by moving consumption from peak hours to cheaper ones or joining this storage with Solar PV technologies. Furthermore it is a major component in giving adaptability to the system in general and permits dynamic administration of irregular RES.
This section basically means that Consumers are becoming small-scale generators. The lower prices that new technologies are reaching mainly regarding energy storage and Solar PV are enabling new business opportunities such as management and generation of own customers energy.
Smart loads are related to administration, control and connectivity of the energy which allow customers to offer the system energy from the demand side in return for economic tariffs. That is to say, the computerization of these procedures empowers a noteworthy open door in giving adaptability to the grid.
The establishment of renewable
energy resources plants close
to places where electricity is
consumed, such as, cities and
communities, disposes of
framework wasteful aspects,
such as misfortunes, and
empowers a superior
administration of the framework,
particularly when they are
combined with energy storage
innovations.
This future management system is related to mix the storage systems, generation frameworks and smart loads to work synchronized and self-contained, in individual units by means of an EMS, and in a group of these units by means of an aggregators, and in association with the main system.
Virtual power plants are controlled by aggregators and together they conform the New
Management System which means a central and interconnected control center that exploits data
and correspondence advancements, IoT (Internet of Things) gadgets and DERs (Distributed
Energy Resources) including all the new systems that have been shown below, such as
Distributed Generation, Grid Scale Generation, Energy Storage, Smart Loads and Electric
Vehicles, with the end goal of trading energy in wholesale markets and giving ancillary services
to grid operators as well as controlling the free energy market between users and distributors.
Table 1: Enabling Technologies for Flexibility of Electricity Demand. [Source: Own.]

Jesús Santiago Silvestre Bengoa 57
At this point the different technologies are going to be analysed, the state-of-the-art of
each one and how suitable they are. To begin, they are segmented in five sections:
Stationary storage, Distributed generation, Grid scale generation, Smart Loads and
Vehicle to grid; finally the Energy management system and the Virtual management
system will be examined.
5.2. ENERGY STORAGE
In the last years there have been a lot of innovations in energy storage, thus, up until
now, there are four main storage technologies that can be applied to energy system.
Here below it is analysed each innovation indifferent market situations.
Lead acid batteries: Although they mean solution with the lowest cost their
efficiency, performance and shorter lifespan represent very important issues in
order to incorporate this batteries to the energy system in comparison with the
following technologies that are shown below.
High temperature batteries: They are not able to operate for residential or
commercial applications due to their high temperatures when operating and
their high costs when produced in small scales. Thus, they are situated for larger
scale operations such as industrial ones, micro grids and combined with RES.
Flow batteries: They have similar applications to high temperatures batteries,
they are especially suited for large scale operations in industries and large micro
grids with discharge times of up to quite a few hours. However, different
characteristics needed in these batteries such as big spaces, loud noises and
high costs make then not really proper for small systems like commercial and
residential ones.
Lithium ion: These batteries up until now, and in the expected future, represent
the best energy storage technology for commercial and residential systems,
mainly because of their high energy density and their cost in small installations.
Regarding industrial and larger scale grids, a specific study in each case must
be done in order to determine the best enabling technology taking into account
energy requirements, lifespan of the system and maximum installation costs.
As it will be analysed in the next paragraphs, lithium-ion and flow batteries seem to be
the most fitting technologies for residential and commercial systems and industrial and
large scale grids respectively. In this way, in order to better analyse these technologies
a technology overview have been done from the least suitable to the most:
5.2.1. Lead acid batteries
These batteries are the most developed electrochemical distributed storage innovation
with many set up providers in the market. The utilization of cheap materials because of

58 Escuela Técnica Superior de Ingenieros Industriales UPM
reusing chains and bottomless crude materials defeat the vast majority of the worries
related with the utilization of lead as the fundamental dynamic component. Be that as
it may, their execution is poor contrasted with different advances regarding energy and
cycle life35(IRENA, 2015b). Here there are shown the two main types of these batteries:
Flooded lead acid batteries: Their main advantage is their cost, there are no other
electrochemical storage technology as cheap as them. However, they have a lot of
disadvantages such as poor energy and cyclability, in addition, they need well-
ventilated spaces and permanent maintenance to replace water. All these weak points
mean that they cannot be used in residential zones36. Their main characteristics are
summarized in the following chart.
Table 2: Advantages and disadvantages of flooded batteries. [Source: International Energy Agency.]
Valve Regulated Lead Acid batteries (VRLA): Valve regulated batteries improve the
ventilation in comparison with flooded ones, they have an inner valve framework that
avoids gas venting consequently making them maintenance free and sensibly useful
for indoor use without particular ventilation. In any case, they keep up the poor cycling,
short lifespan and low energy efficiency and they have higher expenses that flooded
ones. Their main characteristics are summarized in the following chart.

Jesús Santiago Silvestre Bengoa 59
Table 3: Advantages and disadvantages of valve regulated batteries. [Source: International Renewable Energy Agency.]
In order to embody this characteristics in a numerical way it is presented a table with
the main properties of both types:
Figure 9: Lead acid batteries. Cost and markets to 2030. [Source: IRENA.]
In conclusion, as it has been outlined Lead acid batteries are the cheapest option for
electrochemical energy storage. While flooded batteries can be used for mass storage
with RES, valve regulated batteries may be utilized in many other distributed storage
systems although they imply higher costs.
5.2.2. High temperature batteries
These batteries use use both ceramic electrolytes and liquid active materials (the types
of the liquid materials determine the kind of battery. They need high temperatures in
order to operate, between 250ºC and 350ºC. There are two main types of these
batteries37, 38:
NaS batteries: Sodium-Sulphur (NaS) batteries have really good energy density that
why they have been generally utilized for large scale storage, mainly in Japan. They
basically operate as it is shown in the figure below, active materials needs to be kept
in liquid state, which is the reason why they require an external heating unit to keep the
system in the correct temperature window when idle (300-350ºC). High temperature
reactive elements pose corrosion and fire risks39.

60 Escuela Técnica Superior de Ingenieros Industriales UPM
Figure 10: NaS battery. [Source: ISEA.]
NaNiCl (ZEBRA): These batteries operate similarly to NaS ones, however Na and Ni
electrodes are used and NaAlCl and NaNiCl2 as electrolytes, which permits and
operation with lower temperatures (250ºC-300ºC) and lower maintenance and they use
less corrosive substances which provide a safer alternative40.
The table below shows the main properties of both batteries:
Figure 11: High temperature batteries. [Source: IRENA.]
In conclusion, high temperature batteries are a good solution to supply large scale
electricity storage at a reasonable price, particularly, the NaS batteries has been more
popular because of their cheaper active materials. As it will be shown in the next
paragraph, they can compete with the flow batteries in large scale micro grids for mass
storage. However, at present, their feasibility is in doubt due to their cost, performance
and safety all in all.
5.2.3. Flow batteries
Flow batteries have more or less the same applications that high temperature batteries,
the main difference with other batteries is that the electro active materials are stored in
tanks separated from the electrodes, which implies certain advantages such as huge
storage capacity (several hours, even days) because electrolyte volume can be

Jesús Santiago Silvestre Bengoa 61
increased. Furthermore, this batteries can operate at ambient temperatures.
Nevertheless, the electrolytes have to be pumped into the cells which implies
disadvantages such as the complex equipment and the decrease in efficiency due to
the pumping loses. There are two main types of these batteries that are exposed below:
Vanadium Redox Flow Batteries (VRFB): Vanadium Redox batteries as its name
indicates use redox reactions in the cell with vanadium in different oxidation states
(which eliminates contamination risks in the electrolyte41. The redox reaction is:
V4+ V5+ + e- (+)
V3+ +e- V2+ (--)
This flow battery category is determine as “pure flow” which means that all active
material are out of the cell. Their operation and main characteristics are exposed in the
figure and the table below:
Figure 12: VRFB operation mechanism. [Source: Research Gate.]

62 Escuela Técnica Superior de Ingenieros Industriales UPM
Table 4: VRFB advantages and disadvantages. [Source: National Science Review.]
Zinc Bromine Flow Battery (ZBFB): Unlike VRFB, ZRFB are included in hybrid flow
batteries which means that one of the active materials is inside the power conversion
unit. The main difference between these two batteries, despite the pure and hybrid flow,
is that ZBFB use cheap electrolytes, such as Bromine and Zinc, in contrast, they have
lower efficiency and higher corrosion risk. They have a complex operation mechanism
divided in charging and discharging, and their lifespan is lower. Here a table with the
main characteristics is exposed42:

Jesús Santiago Silvestre Bengoa 63
Table 5: ZRFB advantages and disadvantages. [Source: National Science Review.]
In order to embody this characteristics in a numerical way it is presented a table with
the main properties of both types:
Figure 13: Flow batteries. [Source: IRENA.]
In conclusion, flow batteries are not suitable for small systems like commercial and
residential places due to their low energy density. As it has been seen, they potential
markets are the large grids, due to their power storage capacity, and integrated with
renewable power resources in grid scale generation and in industrial systems. Different
studies ensure the potential of these batteries of reduce their costs due to the
increasing enabling electro active materials, such as organic molecules as a more
inexpensive and safer alternative43.

64 Escuela Técnica Superior de Ingenieros Industriales UPM
5.2.4. Lithium ion
Regarding the operation mechanism of the Lithium ion batteries, they exchange Li+
between and anode and a cathode with an electrolyte which is usually a liquid organic
solvent; the cathode is generally made from lithium intercalation compounds as it will
be shown44. The figure below represents the operating principle.
Figure 14: Operating principle of a lithium ion battery. [Source ISEA.]
There is a huge kind of lithium-based battery systems but here just 4 lithium-ion
batteries are going to be analysed due to they have the best and most suitable
properties. They have balanced and high energy and power density, even high cycle
life and safety. Although, as it was said, there are many type of combinations with these
batteries just the main four types are exposed in this research:
Lithium Nickel Cobalt Aluminium (NCA): They have has good energy and power
capabilities but concerns about its safety at moderate temperatures reduces its
applicability in stationary applications. Nevertheless, they have good cycle life and long
storage calendar45.
ADVANTAGES DISADVANTAGES
Very good energy and good power capability
Moderate charged state thermal stability which can reduce safety
Good cycle life newer systems Capacity can fade between 40ºC
and 70ºC
Long storage calendar life
Table 6: NCA advantages and disadvantages. [Source: Navigant Research.]

Jesús Santiago Silvestre Bengoa 65
Lithium Nickel Manganese Cobalt (NMC): There have been many researches about
these combinations in order to reduce costs. All in all, this type of batteries get a good
balance between energy, power and safety and achieve the highest energy density of
all lithium ion batteries. Thus, they have been usually implemented in electric vehicles
and small systems46.
ADVANTAGES DISADVANTAGES
Good combination of properties Problems with patents in some
countries
They can be adapted for power or high energy
They can operate at high voltages
Table 7: NMC advantages and disadvantages. [Source: Navigant Research.]
Lithium Iron Phosphate (LFP): With these materials there is an improvement of many
properties including safety and with low costs. However, due to the lower-rated cell
voltage they only get a discrete energy density47.
ADVANTAGES DISADVANTAGES
Very good thermal stability Lower energy density
Very good cyclability
Very good power capability
Low costs
Table 8: LFP advantages and disadvantages. [Source: Navigant Research.]
Lithium Titanate (LTO): LTO cells have some advantages for stationary applications
that require good cyclability due to their power and chemical stability, thus, they are
normally used in microgrids, RES and ancillary services. Furthermore, their low energy
density and high costs make them suitable for these power intensive applications48.
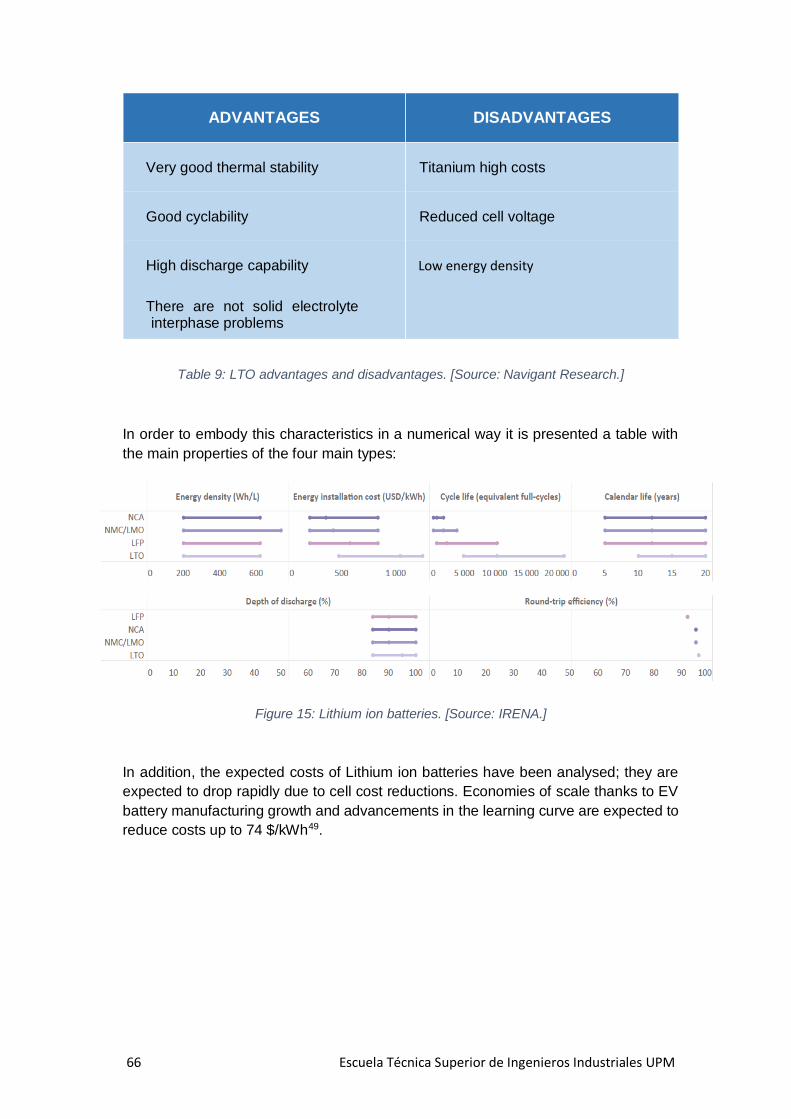
66 Escuela Técnica Superior de Ingenieros Industriales UPM
ADVANTAGES DISADVANTAGES
Very good thermal stability Titanium high costs
Good cyclability Reduced cell voltage
High discharge capability Low energy density
There are not solid electrolyte interphase problems
Table 9: LTO advantages and disadvantages. [Source: Navigant Research.]
In order to embody this characteristics in a numerical way it is presented a table with
the main properties of the four main types:
Figure 15: Lithium ion batteries. [Source: IRENA.]
In addition, the expected costs of Lithium ion batteries have been analysed; they are
expected to drop rapidly due to cell cost reductions. Economies of scale thanks to EV
battery manufacturing growth and advancements in the learning curve are expected to
reduce costs up to 74 $/kWh49.

Jesús Santiago Silvestre Bengoa 67
Figure 16: Lithium-ion Battery Costs and Market. July 2017. [Source: Bloomberg New Energy Finance.]
In conclusion, Lithium ion batteries are the most balanced innovation between
technology and cost for residential and commercial operation, mainly due to their high
energy density, cyclability, safety. Regarding industrial and bigger grids their
performance is correct enough although other possibilities can be studied in each
case.
5.2.5. Conclusion
After analysing energy storage technologies three main statements are exposed:
Electrochemical storage offers a reasonable balance of energy, power, cycle
life, safety and cost as well as no site restrictions which makes them adequate
for most distributed storage applications envisaged for the New Downstream.
In this way this storage technologies must ensure three key aspects: Cost,
Reliability and Safety and Ease of deployment and standardization. Other
performance indicators can be analysed as extra characteristics but must not
compromise any of the three aspects above.
Lithium ion batteriy is the innovation of choice for residential and commercial
and may well serve most requirements in industrial customers and microgrids
applications. These applications can be served using cheaper mass produced
EV cells rather than custom low volume cells. Furthermore, at present modular
li-ion systems are already in the market from multiple vendors and can be
already used to launch and scale-up a commercial New Downstream offering.
Li-ion can be considered a maturing technology that will follow an evolutionary
development path with main advancements in high capacity and voltage
cathodes and higher capacity anodes. In addition, projected Li-ion battery costs
are expected to drop due to economies of scale and advancements in the
learning curve.

68 Escuela Técnica Superior de Ingenieros Industriales UPM
5.3. ELECTRIC VEHICLE (EV)
Electric Vehicle global penetration is still modest, although there many hybrid models,
and lately two-place cars have been developed, the global percent of electric vehicles
just goes up to 1%. However, it is estimated that EVs will reach 54% of new car sales
and 33% of the global car fleet by 204050.
Here it is a BNEF research that has been studied in order to determinate different
patterns to verify the viability of Vehicle-to-grid. Thus, BNEF51 estimates that EVs
electricity consumption will reach 1800 TWh in 2040 from 6 TWh in 2016 but it will just
represent 5% of global consumption. However, EV charging patterns could concentrate
power demand in short periods which could negatively affect the grid, as an example,
just imagine that all the electric vehicles from certain places are connected to the net
charging their batteries, this will impinge on the net as a demand peak.
Nevertheless, the objective of vehicle-to-grid is to implement the smart changing and
other methods (Grid relief strategies) that will turn this negative impact in a positive
one, because this required energy will be delivered as appropriate. In other to clarify
this issue an EIA research has been studied. EIA estimated smart-charging of 150
million EVs would reduce capacity requirements by 65 GW while in the case of 500
million EVs would reduce capacity 110 GW. Smart charging flexibility could avoid
respectively, USD 100 billion and USD 280 billion of investment in electricity
infrastructure52.
Grid relief strategies can also be beneficial, not only for utilities but for EV users, that
want to reduce the costs of charging their vehicles. The different charging strategies
are analysed and the cost for the end user in the following paragraphs53:
• Opportunity charging: It is the common usage, the electric vehicle charging
begins when it is plugged. Electricity costs are usually 11% higher than the
annual average electricity price due to the demand peaks that are made.
• Delayed charging: the timing of charging is delayed on purpose according to
demand usage assessed by the grid operator (Time of Use rates) and driver's
schedule. With this method energy costs fall to 85%–93% of the average
electricity price.
• Smart charging (V1G): Using enabling technology and innovations this method
gets a state-of-charge management similar to delayed charging, except that the
charge of energy is adjusted based on the presumed energy requirements of
future trips. With this method energy costs fall to 75% of the average electricity
price.
Table 10: Impacts of three charging methods (per charge event). [Source: NREL, WEVA.]

Jesús Santiago Silvestre Bengoa 69
Smart-charging (V1G) enabled by connected charger or governed by an Energy
management system (EMS), based on pricing signals, can reduce energy costs for the
end user while easing generation, transmission, distribution and constraints by
eliminating peak demand induced by simultaneous non-managed EV charging. This
integration of Smart-changing with an Energy Management System forms the Vehicle
to Grid (V2G) method.
Thus, as it was exposed, EVs have the potential of serving the electric grid as
independent distributed energy source. Most vehicles are parked almost 95% of their
time and, if they remain connected to grid, they can be used to support the grid. There
are two options, Smart charging (V1G) in which EV adjust their charging speed to the
grid requirements and minimizes energy costs or Vehicle to Grid (V2G) in which the EV
is also able to backfeed power to the grid. Both alternatives can accomplish benefits in
order to provide flexibility to the grid54:
Peak shaving: As it was indicated above, smart charging may flatten power
demand while V2G can supplement the available generation.
Reserves: load shedding and energy injection available in case of failure of a
generation unit.
Voltage regulation: reactive power management can compensate local voltage
variations.
Frequency regulation: Electric vehicles may adjust their charging speed or inject
energy back into the grid to keep frequency between the limits set by the grid
operator.
Renewable energy integration: EVs may charge in periods of abundant cheap
renewable generation in order to prevent renewable curtailment.
Transmission and Distribution (T&D) deferral: scheduling EV charging or
discharging of stored energy into valley hours can prevent transmission and
distribution infrastructure upgrades.
However, there are some main differences between these two methods that are shown
in the following table:

70 Escuela Técnica Superior de Ingenieros Industriales UPM
Smart Charging (V1G) Vehicle-to-Grid (V2G)
Charging power reduction is
equivalent to injecting energy to the
grid and viceversa: Frequency
regulation up and down and Load
shedding for reserves or peak
management.
These aids to the net are only
available during charging periods.
Smart charging method has no impact
on battery degradation.
The technology for V1G is already
available, charging units can be
controlled by EMS responding to price
signals or directly controlled by the
utilities and operators.
Energy can be backfeed to the grid
providing multiple ancillary services.
Manageable power doubles compared
with the case of using EV as a
controllable load.
Max power output, load shedding and
discharge, is available only during
charging. However power from
discharge, half of the maximum power,
is available if the EV is connected with
a power station.
Battery discharging may impact battery
degradation. The EV degradation will
be dependent on the number of events
in which the EV participates.
The technologies needed for V2G
(communication or metering) are
already available but limited
deployment makes them still
expensive.
Table 11: V1G & V2G. [Source: University of Warwick.]
Key to the development of either V1G or V2G is the standardization of communication
between utilities and EV industry. Standards such as OpenADR or OCPP will allow
utilities to create a smart charging ecosystem that can improve grid management,
enhance energy efficiency and lower the costs of deployment.
At present, there are several pilot projects of V2G and also Vehicle to home (V2H)
although no relevant real-life deployment has occurred yet. There are several
challenges that need to be solved before any meaningful deployment of V2G takes
place55:

Jesús Santiago Silvestre Bengoa 71
Vehicle charger restrictions: Currently most of the EVs in the market are built
with unidirectional power electronics that prevents any energy flow from the
battery to the grid.
Charging station restrictions: Although new charging stations are capable of
handling bidirectional energy flows, there are still unidirectional units which are
not suitable for V2G usage.
EV manufacturer restrictions: In addition to unidirectional chargers, EV
manufacturers can restrict V2G in the battery’s guaranty terms due to the
failures that V2G can cause on it. Battery is the most expensive part of the EV
and has a long warranty period.
User’s concerns: Furthermore, last point may influence owners too, they may
be reluctant to engage in V2G programs due to battery degradation concerns
and their potential impact on battery’s warranty.
Lack of defined business models: Battery degradation in V2G use depends on
multiple parameters which makes difficult to create revenue sharing models for
the EV owner.
Thus, main barriers came from the lack of generalization of the modern technology in
EVs, the lack of knowledge about the implications and consequences of this
innovation and the lack of business models in order to compensate the EV owner for
participating in any flexibility program. A potential way to solve these issues is the
involvement of the utilities and the operators of the system in the production and
generalization of this technology between the electric vehicles suppliers and the final
users.
5.3.1. Conclusion
In conclusion, after analysing V1G and V2G technologies five main statements are
exposed:
• EV charging has not make a significant impact on the grid due to the still low
penetration in the car market. However, several studies highlight the potential
to disturb the grid due to the increase of peak load if charging is not adequately
managed.
• Smart charging, which modulates charging speed based on grid constraints
(driven by prices) provide the possibility to flatten the demand curve.
• Standards (OCPP, IEC 62196, ISO 15118 and OpenADR) that enable the good
incorporation of EV and the modern functions like V1G and V2G with the grid
and the utilities are under development and need to be defined to further
develop business models. Furthermore, researches about the impact of the
V2G on the battery degradation must be completed in order to negotiate good
guaranties between EV suppliers and final users.
• A final EV charging monetization strategy must be developed, which should be
based first on considering EVs as a predictable controllable load for the
optimization of energy costs for the end user (real time prices and peak charges)
as well as a revenue generation asset to be bid on flexibility markets.

72 Escuela Técnica Superior de Ingenieros Industriales UPM
• Finally, although the potential of V1G and V2G is huge, they must not be
considered as relevant revenue generation sources in the short term due to the
complexity of their final application.
5.4. SMART LOADS
Smart and controlling loads are enabling load management, which is an important
economic issue for final client and to provide efficiency to the grid. Load management
has the potential to reduce the costs of the energy procured from the grid according
to hourly energy prices and avoid any peak power penalties. Even more, it enables
one of the main functions of the EMS and the role of the “aggregator” providing extra
capacity to grid from the demand side. However, savings potential and the complexity
of its implementation in some cases limits its real-life deployment.
Thus, the 3 different segments where smart loads can be integrated are analysed:
Industrial segment: Most industrial loads are managed by legacy or
proprietary Supervisory Control and Data Acquisition (SCADA) systems which
cannot be easily accessed. Nevertheless, in the near future open SCADAs and
Building Management Systems and the deployment of IoT will enable
straightforward direct load connection. Furthermore, third party access to
SCADAs via Application Programming Interfaces (APIs) will enable industry
experts to develop software solutions algorithms to define the best way to bid
manageable loads in the different markets and optimize energy dispatching.
Commercial segment: Heating, Ventilation and Air-Conditioning (HVAC),
water heating and lighting are the biggest loads in commercial and large
residential buildings and are normally human controlled without considering
energy efficiency and user’s comfort. On average in the EU-27 space and
water heating represented 19% of the total electricity demand in the tertiary
sector: lighting accounted for 20%, ventilation 12.4% and air conditioning
nearly 3%. In Spain air conditioning and heat pumps in the tertiary sector
account for 25.6 GW of installed power. Thus, larger units and centralized
control HVAC provide significant opportunities for controllable loads in the
tertiary sector56.
Residential segment: Nowadays, HVAC and water heating are the most
important manageable loads (in the future it is expected that EVs will be as well)
but both normally require accessing a fixed control panel and remote operation.
However, the development of smart-home (Figure 17) systems offer a wide
range of solutions for the management of connected loads. Information hubs
allow to centralize multiple connected units and their management though a
single interface. In this way, connected thermostats are taking a preeminent role
as connected devices as they manage the most important connected load in
terms of power, regulation capabilities and operation times such as air
conditioning but can also manage other major loads that will be present in an
ever electrified home such as water heating and heat pump heating. HVAC and
water heaters represented 17.2% of electricity consumption in Spain in 2015.
However, their predictable use patterns, relevance in peak use periods (34.6

Jesús Santiago Silvestre Bengoa 73
GW of installed power), fine adjustment and potential long responses make
them the most suitable controllable loads. Increased electrification will enlarge
the air conditioning and heat pumps installed base and new units will already
provide built in connected capabilities57.
Figure 17: Example of a Smart Home with several DERs and Data Management. [Source: MIT.]
Buildings account for nearly one-third of global final energy consumption and 55% of
the global electricity demand. Specifically, buiding energy consumption was 11 PWh in
2014 and is expected to reach 20 PWh in 2040. Thus, load management is an enabler
for creating Demand Side Management programs such as Energy Efficiency or
Demand Response. It is estimated 10% cumulative energy efficiency savings (65 PWh)
in buildings from their central scenario between 2017 and 2040 by using real-time
data58. (Figure 18)

74 Escuela Técnica Superior de Ingenieros Industriales UPM
Figure 18: Cumulative energy savings in the Building sector from digitalization to 2040. [Source: IEA.]
Regarding the relation between Energy Storage and Flexible Demand, it is important
to stress that sometimes they clash, that is to say, energy storage and demand flexibility
(supported by smart loads) are approximately inversely proportional. This can sound a
little strange but below it is shown a case study that explain it.
In this Case Study59 there is a stimulation of the adoption of DERs in reaction to power
taxes, atmosphere conditions, innovation cost, and execution parameters, in the
instance of a family household both in New York and in Texas. The key contributions
for this re-enactment are the forthright cost of batteries and the degree of demand
response.
Flexibility in the demand is expanded at the point when the temperature setting of
cooling and warming loads is figured out how to tweak energy utilization specifically
periods by extending the temperature of comfort dead-band. What's more, flexibility in
the demand is amplified by connecting more energy end-utilizes, such as water heaters
and air conditioners. In this way, in the Figure 21 and Figure 22 there are 5 states
regarding to adaptability: no flexibility demand (No Flex), dead-band temperatures of
1°C in air conditioning (AC 1°C), dead-band temperatures of 2°C in air conditioning (AC
2°C), dead-band temperatures of 1°C and 2°C in water heating and air conditioning
(AC & WH) and dead-band temperatures of 2°C or more in water heating and air
conditioning (AC & WH 2°C).
In both cases, demand flexibility has a noteworthy negative effect on the benefit of
batteries. As the measure of adaptability expands, the cost of batteries should
essentially decay for batteries to be gainful. These re-enactments demonstrate that
flexibility in the demand has the potential to decrease battery income streams.

Jesús Santiago Silvestre Bengoa 75
Figure 19: The Impact of Flexible Demand and Battery Cost on Battery Profitability in NY. [Source: MIT.]
Figure 20: The Impact of Flexible Demand and Battery Cost on Battery Profitability in Texas. [Source: MIT.]
As annotation it is remarkable to say that a critical contrast between the cases is the
accessibility of the warm asset. The warmer atmosphere in Texas prompts more
prominent utilization of air conditioning, which thus implies more prominent potential for
smart loads to decrease client bills. Without flexibility, batteries are productive at a
higher initial cost in Texas be that as it may, as in New York, any measure of adaptability
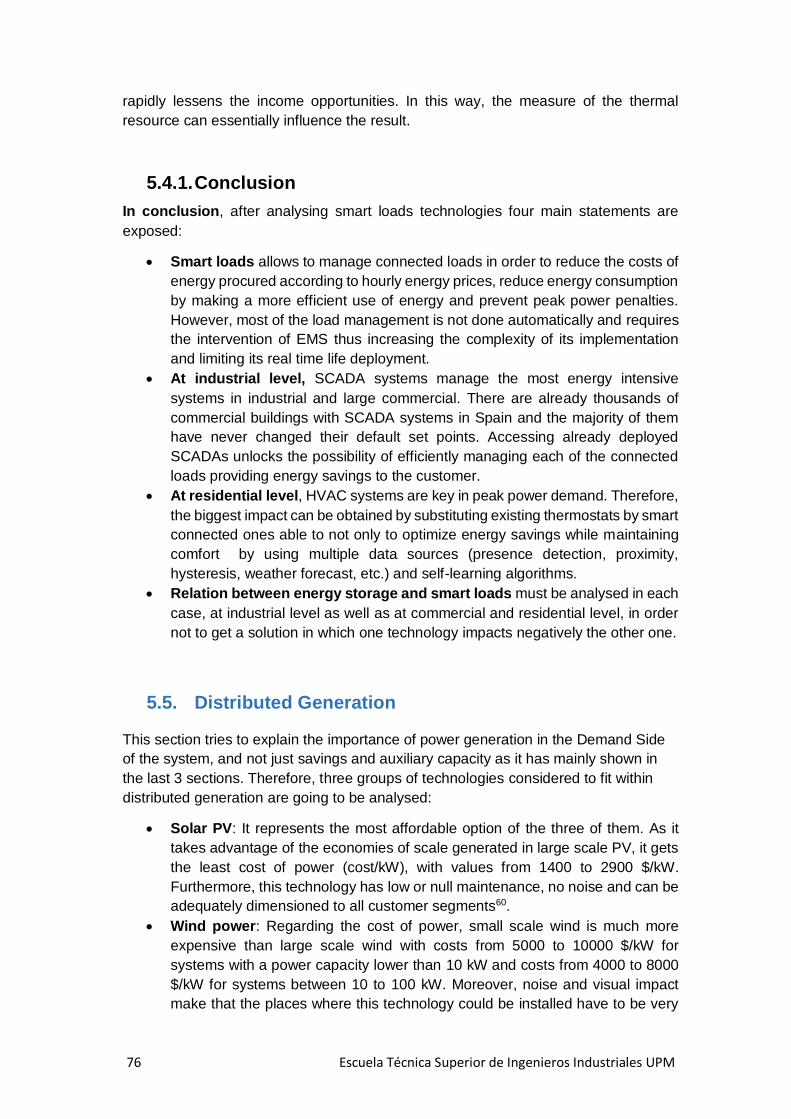
76 Escuela Técnica Superior de Ingenieros Industriales UPM
rapidly lessens the income opportunities. In this way, the measure of the thermal
resource can essentially influence the result.
5.4.1. Conclusion
In conclusion, after analysing smart loads technologies four main statements are
exposed:
Smart loads allows to manage connected loads in order to reduce the costs of
energy procured according to hourly energy prices, reduce energy consumption
by making a more efficient use of energy and prevent peak power penalties.
However, most of the load management is not done automatically and requires
the intervention of EMS thus increasing the complexity of its implementation
and limiting its real time life deployment.
At industrial level, SCADA systems manage the most energy intensive
systems in industrial and large commercial. There are already thousands of
commercial buildings with SCADA systems in Spain and the majority of them
have never changed their default set points. Accessing already deployed
SCADAs unlocks the possibility of efficiently managing each of the connected
loads providing energy savings to the customer.
At residential level, HVAC systems are key in peak power demand. Therefore,
the biggest impact can be obtained by substituting existing thermostats by smart
connected ones able to not only to optimize energy savings while maintaining
comfort by using multiple data sources (presence detection, proximity,
hysteresis, weather forecast, etc.) and self-learning algorithms.
Relation between energy storage and smart loads must be analysed in each
case, at industrial level as well as at commercial and residential level, in order
not to get a solution in which one technology impacts negatively the other one.
5.5. Distributed Generation
This section tries to explain the importance of power generation in the Demand Side
of the system, and not just savings and auxiliary capacity as it has mainly shown in
the last 3 sections. Therefore, three groups of technologies considered to fit within
distributed generation are going to be analysed:
Solar PV: It represents the most affordable option of the three of them. As it
takes advantage of the economies of scale generated in large scale PV, it gets
the least cost of power (cost/kW), with values from 1400 to 2900 $/kW.
Furthermore, this technology has low or null maintenance, no noise and can be
adequately dimensioned to all customer segments60.
Wind power: Regarding the cost of power, small scale wind is much more
expensive than large scale wind with costs from 5000 to 10000 $/kW for
systems with a power capacity lower than 10 kW and costs from 4000 to 8000
$/kW for systems between 10 to 100 kW. Moreover, noise and visual impact
make that the places where this technology could be installed have to be very

Jesús Santiago Silvestre Bengoa 77
specific. Consequently, microgrids are the most suitable application where
larger scales allow for more competitive energy prices61.
Combined Heat and Power (CHP): It has been widely used in the industrial
sector but scaling it down to the commercial and residential sectors is difficult
for the available technologies. Main four CHP technologies are analysed62:
o Stirling engines: They are waste heat recovery units attached to
conventional boilers with limited electrical output and operating only
when the boiler is on which means extra costs from 3000 to 5000 $/kW.
Therefore, payback times of 10-20 years, even with subsidies, what
make them not feasible.
o Combustion engines: They are only viable in large residential or
commercial segments due to their huge power output. Furthermore, high
noise, low thermal and electric efficiency, fuel and maintenance costs
and not being suited for continuous operation limit their applicability.
o Microturbines-CHP: This technology has some issues, such as CHP
turbine sizing (25-1000 kW), high costs, and electricity and heat ratio
that reduce the adaptability of CHP to large residential, commercial,
industrial and certain microgrid applications. They could be a good
technology match for a combined electricity and gas offering.
o Fuel Cells-CHP: Fuel cells are the most efficient option with the highest
electric output of all the alternatives. However, they are designed for
constant operation which limits their applicability to certain residential
and commercial energy with non-stable consumption profiles. Moreover,
their upfront costs (4000-10000 $/kW), fuel costs and maintenance do
not allow to build a sustainable business case at the moment63.
In such a way the best option by far for distributed generation is Solar PV, this
technology is deepened below.
5.5.1. Solar PV
Solar PV added 71 GW of capacity in 2016 worldwide versus 51 GW of Wind Power
due to the ongoing decarbonisation of the energy sector and the growing
competitiveness of solar PV in all markets. Solar module costs with the current
technologies are projected to further drop due to incremental advances in the
technology, moreover, new technologies under development could accelerate this
process due to they will intense the competition for the best innovation64.
Nowadays, Solar PV market share is split between two types of technology:
Crystalline silicon c-Si: Crystalline silicon can be classified into poly-
crystalline (poly-Si or multi-Si) and mono-crystalline (mono-Si). Poly-Si is less
efficient that mono-Si but cheaper. Crystalline silicon rapid production growth
and the development of a competitive supply chain has allowed c-PV
technology to have a 94% market share (70% p-Si and 30% mono-Si)65. (Figure
13)
Thin-film PV: Thin-film technologies accounted approximately for 6% of the PV
market in 2016. The three main thin-film technologies are CdTe (3.7% share),

78 Escuela Técnica Superior de Ingenieros Industriales UPM
CIGS (1.6%) and a-Si (0.6%). Thin-film traditionally had an advantage over c-
Si in terms of lower module costs but lower efficiency which came at the
expense of higher balance of system. Today c-Si cost per Wp1 is more
advantageous so the least efficient thin-film technologies (a-Si) may soon
disappear66.
Figure 21: Solar PV percentage of global annual production. [Source: Fraunhofer ISE.]
As it is said before novel technologies under development may compete with c-Si Solar
PV, they are exposed below67:
Perovskites (Technology Readiness Level2 (TRL) 4): This innovation is still in
laboratories but have already achieved cell efficiencies comparable to those of
best thin-film technologies. Moreover, further efficiency gains reaching those of
c-Si are expected, because of this and low cost materials and manufacturing
process could make this technology disrupt the PV market in the near future.
Other alternatives not as affordable as perovskites are also exposed:
Organic cells (TRL 9): Organic cells are expected to have low cost materials
with tunable band gaps and flexible substrate deployment and lightweight cells.
Quantum-dot photovoltaics (TRL 3-4): Quantum dots cells use nanocrystals
made of semiconductor materials that exhibit quantum mechanical properties
as the absorbing PV materials in which band gaps can be tuned by modifying
particle size.
Multi-junction (MJ) solar cells (TRL 9 standard semiconductors, TRL 4 new
semiconductors): MJ cells stack several semiconductors with different band
gaps able to absorb a bigger share of the solar spectrum and achieve higher
efficiencies. New lower cost semiconducting materials could reduce the
technology cost over standard semiconductors.
1 Watt-peak: In a Solar PV installation one Wp means one W of peak power, that is to say, the
measure of a solar PV power is in terms of the maximum power it can obtain. 2 TRL is a method adopted by the NASA of estimating technology maturity that examines
program concepts, technology requirements, and demonstrated technology capabilities.

Jesús Santiago Silvestre Bengoa 79
Given the cost rapid cost reduction experienced by current commercial technologies,
especially c-Si, any new technology shall demonstrate relevant cost and performance
advantages over established technologies to gain market share. So far only
Perovskites seem to have potential to compete but by the time their stability is
addressed their potential cost advantage may be eroded by c-Si. Current efficiencies
are shown in the following picture.
Figure 22: Efficiency comparison of solar PV technologies 2018. [Source: Fraunhofer ISE.]
In order to contrast different technologies and how they may be assembled in the Power
system a Case Study68 has been made: The advantages of Energy Storage and the
influence of Solar PV on the network costs.
This case study delineates how high entrances of housetop Solar PV increment
distribution network extension expenses and how energy storage may offer answers
for relieve these incremental expenses in the future. This case considers a network in
which the introduced limit of rooftop PV is required to increment over a specific period.
For setting, it is supposed that this development is driven by endowments, for example,
a feed-in tariff or net metering.
A DSO could react to expanding PV entrance by expanding the limit of the wires,
introducing extra voltage controllers, and putting resources into other system hardware,
with ensuing increments in complete system cost.
As it show bellow in Figure 23, now and again the financial effect of meeting a huge
(more noteworthy than 20 percent) part of load with solar PV generation can be vast,
in fact, in the most outrageous case, doubling the cost of the system. This brings up
essential issues: How should these expenses be allotted? Are there "non-wires"
arrangements that can bring down network costs? On the off chance that the system
clients that produce the expenses are required to pay for them, would they despite
everything choose to put resources into PV generators?

80 Escuela Técnica Superior de Ingenieros Industriales UPM
Figure 23: Impact of Distributed Solar PV on Network Cost with Different Levels of Energy Storage. [Source: MIT.]
In Figure 23 it is also shown that the establishment of BTH3 energy storage mitigates
the effect of Solar PV and empowers vast amounts of PV ability to be associated with
the network without altogether expanding arrange costs. In Figure 23, the level of
entrance of energy storage is demonstrated utilizing SF (Storage factor) as a
parameter, which is relative to the diminishment in maximum net PV infusion to the
network acquired by including energy storage.
In spite of this cost-relieving impact, getting storage is not really the most cost-effective
way to deal with the system effects of distributed generation, for two reasons:
In the first place, it isn't clear whether storage is less expensive than traditional
system arrangements. At current battery prices, storage is in all likelihood not
less expensive than ordinary system arrangements in the greater part of cases.
Second, there could be other, more financially savvy arrangements, for
example, PV reduction or smart loads and demand response. In this case study
it is proposed: a cost-reflective arrangement of prices and charges would
uncover the minimum cost solutions for addressing grid difficulties.
5.5.2. Conclusion
In conclusion, after analysing distributed generation technologies two main
statements are exposed:
Although there are three main technologies considered to fit within distributed
generation Solar PV generation is the most cost efficient technology by far in
3 Behind-the-meter: It is a sustainable power source creating facility, for this situation, a Solar
PV system, that produces power proposed for on location use in a home, business offices or commercial buildings.52

Jesús Santiago Silvestre Bengoa 81
the three segments regarded. Wind power is not affordable due to its higher
costs per kW in small scale, noise and visual impacts. CHP is not affordable
due to being difficult to scale down to the commercial and residential sectors.
Currently c-Si modules are the most efficient and economic viable solution.
They have experienced fast cost reductions due to technology improvement
and market uncertainty due to overproduction capacity and varying demand
projections that has reduced module margins. Evolutionary development of the
technology due to mass production and advancements in the learning curve are
expected projected to further reduce costs.
Perovskites are the only potential challenger, that, in case of succeeding,
would mean that the whole c-Si value chain would be scrapped which reinforces
the last statement (c-Si seems to be the best option at present and in the near
future).
5.6. GRID SCALE GENERATION
Grid Scale Generation includes mainly RES near to consumption sites such as cities
and towns, the principal objective is to obtain a superior administration of the network,
flexibility, and minimize loses and misfortunes.
Therefore, two RES solutions seems to be the most affordable, they are wind power,
and solar PV, which are analysed in the following paragraphs:
5.6.1. Wind Power
Wind Power is a huge resource nowadays, global wind resources are estimated to be
487GW in 2016 (Figure 24). The main inconvenient with this technology is disability of
producing electricity when it is needed, it is produced when wind blows, that is the
reason why the wind energy market in 2016 was 54.6 GW while the installed capacity
is near to 487 GW as it was said before69. Almost all installed wind power capacity used
Horizontal Axis Wind Turbines (HAWT), they are installed either onshore or offshore,
the second ones take advantage of stronger winds but require a higher initial
investment and also have higher operation and maintenance costs.

82 Escuela Técnica Superior de Ingenieros Industriales UPM
Figure 24: Global cumulative installed wind capacity 2001-2016. [Source: GWEC.]
Although most HAWT is the most common turbine due to its greater efficiency and
power output, two turbine types (HAWT & VAWT) are investigated in this research,
taking into account their main advantages and disadvantages70.
Generally the main parts of a large scale wind turbine are the followings although
depending on the turbine type some parts will not be included:
Rotor: It includes blades, hub and pitch system.
Nacelle: It includes rotor shaft, bearings, gearbox and generator, mechanical
brake and yaw system.
Tower and foundation.
Electrical system: It includes power feed cables, lightning protection, power
converter and transformer.
Control system: It includes sensors, and actuators71.
Figure 16 shows a scheme of the main components of both configurations:
Figure 25: Wind turbine configurations. [Source: ResearchGate.]

Jesús Santiago Silvestre Bengoa 83
Horizontal Axis Wind Turbines (HAWT)
These turbines have the principle rotor shaft and electrical generator at the highest
point of the tower, and it must be pointed into the breeze. Regarding the size of the
turbine: little turbines are pointed by a straightforward breeze vane set square with the
rotor, while large turbines by and large utilize a breeze sensor combined with a servo
engine to transform the turbine into the breeze. Most large breeze turbines have a
gearbox, which transforms the moderate turn of the rotor into a quicker revolution that
is more appropriate to drive an electrical generator72.
Main Advantages Main Disadvantages
HAWT turbines have high
effectiveness due to the perpendicular
move to the breeze of the blades,
thus, they get energy through the
entire turning region. On the other
hand, all vertical axis wind turbines,
include different kinds of responding
activities, requiring air thwart surfaces
to backtrack against the breeze, which
brings down efficiency.
The tall tower base enables access to
more grounded breeze in places with
wind shear. As an example, in some
wind shear locations, each ten meters
up wind speed is incremented by 20%
so the power output by 34%.
Huge infrastructure must be done to
help the overwhelming generator,
blades and gearbox. This implies an
enormous construction project where
the different components must be lifted
into position. This means important
investment costs.
Their stature makes them prominently
visible crosswise over huge territories,
upsetting the landscape, causing big
visual impact and creating local
opposition. This can be a problem for
selecting the installation places.
Mechanisms to face the wind must be
used which drive up the installation.
This is needed due to the failures that
are caused by turbulence and wind
variations. Therefore, due to high
winds mechanisms to stop the blades’
turn are required in order to prevent the
structure to crumble away.
Table 12: Horizontal Axis Wind Turbines Advantages and Disadvantages. [Source: GWEC.]
Vertical axis wind turbines (VAWT)
The most characteristic feature is the vertical orientation of the rotor shaft which
enables that the turbine does not need to be facing the wind. That is the reason why
this configuration is preferential on locations where the breeze heading is exceedingly
84 Escuela Técnica Superior de Ingenieros Industriales UPM
variable or where there are violent breezes. Furthermore, this configuration permits
many components, such as the gearbox and the generator, to be placed on the ground,
which facilitate the installation and the maintenance. However, the principle
disadvantage of a VAWT is that it makes drag while pivoting into the breeze. As an
annotation, there are two primary VAWT subtypes: Darrieus and Savonius73.
Main Advantages Main Disadvantages
VAWT system can be placed closer
the ground, Which requires less and
easier maintenance.
They are submitted to lower and more
regular wind speeds which implies that
no yaw systems is required.
They can work at areas where taller
structures are disallowed so they can
exploit areas where housetops,
peaks, ridgelines, and passes funnel
the breeze and increment wind speed.
These turbines generally have lower
efficiencies than HAWTs due to the
extra drag that they have as their
blades pivot into the breeze. However,
modern turbines that decrease drag
are under development.
Rotors are placed near the ground
where wind speeds are lower and do
not exploit higher breeze speeds
above.
They seem as a novel technology to
those not familiar with the wind
business due to VAWTs are not
ordinarily developed. This has
regularly made them the subject of wild
cases and speculation tricks in the
course of the most recent 50 years.
Table 13: Vertical Axis Wind Turbines Advantages and Disadvantages. [Source: GWEC.]
After having analyzed the two main types of turbine configurations, the main ways to
draw on this technologies are shown. Two main option are currently developed, Wind
turbines located onshore and offshore.
On-Shore Wind Power
As it is shown the development of wind power technologies has been significant during
the last year, and different turbines have been researched although only two of them
are enough efficient and affordable. Even more, most of On-shore wind power plants
use HAWTs which can be considered the standard ones due to their better efficiency
and power output.

Jesús Santiago Silvestre Bengoa 85
Therefore HAWT investigations are focused on optimizing and reducing the costs of
each component in order to reduce the Levelized Cost of Energy4 (LCOE). Thus, the
Capital Expenditure5 (CAPEX) is a crucial issue, mainly because it is LCOE’s main
component for on-shore wind power. As annotation, NREL calculations show CAPEX
weight in LCOE is 76% of the weight while the Operation and Maintenance
Expenditure6 (OPEX) accounts for the remaining 24%. In order to better analyze the
costs of the initial investment, the CAPEX breakdown is shown in the figure below54.
The weight of each segment is an indicator of which are the areas that attract most part
of the innovations and R&D efforts from the industry.
Figure 26: On-shore wind Power CAPEX breakdown. [Source: NREL.]
Reducing both CAPEX and OPEX costs while augmenting the produced energy
(capacity factor) are the key levers to improve cost competitiveness of wind power.
Thus the main innovations related to on-shore wind power have been oriented to74:
Innovations carried out in the turbine itself (design, size, materials,
manufacturing process, etc.).
The optimization of the operation and the reduction of the necessary
maintenance to ensure the reliability of the system.
4 LCOE: It calculates the lifetime costs of building and operating a power plant divided by energy production. 5 CAPEX: In this context, it refers to the investment that is needed to build a power plant, from the initial design to the beginning of the normal operation of the plant. 6 OPEX: In this context, it refers to the ongoing costs for running a power plant during its lifetime.
86 Escuela Técnica Superior de Ingenieros Industriales UPM
Improving the system balance and the way the turbines interact with their
environment (i.e. grid) and installation costs (e.g. civil works).
Increasing the Annual Energy Production (AEP).
In conclusion, after analysing on-shore wind power technologies three main
statements are exposed:
With the current technology, onshore wind has almost reached grid parity in
several markets in sites with good wind resources. LCOE is projected to
further reduce up to 18% in 2025.
Onshore wind power is a mature technology in which LCOE reductions have
been obtained by increases in the capacity factor. Projected LCOE reductions
attributable to technology development in 2025 range between 4.5 and 7%.
Main innovations are aimed at maximizing energy capture wind by optimizing
rotor sizing and increasing hub heights.
Repowering of old sites with higher average wind speeds is one of the best
alternatives to develop cost competitive installations as part of the
development and construction costs are already incurred.
Off-Shore Wind Power:
This kind of Wind Power plants are situated in the oceans and seas where wind
speed reaches higher values. This industry is moving fast from a niche technology to
a mainstream supplier of low-carbon electricity. In fact, recent government auction
results show that the industry has achieved unprecedented levels of competitiveness
through rapid progress in technology, industrial growth and a reduction in the cost of
capital75.
Nowadays there are 12.6 GW of offshore wind operating in Europe and it is expected
to produce 7% to 11% of the EU’s electricity demand by 2030, although this is only a
fraction of the resource potential available in the European sea basins. Some
forecasts shows that offshore wind could in theory generate between 2,600 TWh and
6,000 TWh per year at a competitive cost76.
Additionally, off-shore wind power can be divided in two section, plants near the shore
(fixed-bottom offshore) and plants far away the shore (floating offshore). In this
analysis just main characteristics and LCOE differences are going to be considered.
Differences between Off-Shore wind technology and On-Shore wind technology
The environmental and operational conditions determine factors such as hub
height or rotor diameter. Similarly, the situation of the plant make that offshore
has much higher complexity because of heavier equipment and more difficult
installation.
On the other hand, vessel transport reduces some of the restrictions
associated with the logistics of large nacelles and blades compared with road

Jesús Santiago Silvestre Bengoa 87
transport of onshore components. This allows to use higher nameplate
turbines which further simplifies installation and maintenance as a lower
number of turbines need to be installed. Nevertheless, the lower number of
vessels hinders the transport of the materials compared to the number of
trucks available to onshore generation.
These differences are reflected in the CAPEX of both kinds of power generation.
Figure 27: On-shore vs Off-Shore CAPEX. [Source: ETSII UPM.]
Wind power technologies LCOE
LCOE is a main factor in order to determinate the value of a technology, therefore an
analysis of the main types of wind power generation is shown. As annotation, these
LCOEs have been calculated differentiating technology impacts from impacts factoring
not only technology but scale effects and efficiencies across the value chain77.
70%
11%
5%
9%5%
On-Shore
Turbine
Installation
Civil and auxiliary work
Internal wiring
Substation and evacuation line
Project development and management
40%
14%
25%
7%
10%4%
Off-Shore
Turbine
Installation
Civil and auxiliary work
Internal wiring
Substation and evacuation line
Project development and management

88 Escuela Técnica Superior de Ingenieros Industriales UPM
Figure 28: Wind Power LCOE’s prediction. [Source: Berkeley Lab.]

Jesús Santiago Silvestre Bengoa 89
Taking into account On-shore wind power, it can be considered a mature technology in
which no technology breakthroughs are expected but an evolutionary approach. LCOE
reductions range are expected to be between 10-12% to 2020 and mainly come from
optimized rotor dimensions and rotor materials followed by drive train enhancements
are more sizable for low speed turbines. On the other hand, offshore wind power is
nowadays a technology under development, which confers it a greater room for
improvement (30% for fixed-bottom and 25% of floating are expected to 2030).
Regarding other way of grid scale generation non-conventional wind power and solar
PV are superficially studied:
5.6.2. Non-conventional wind power
There are three main other options for wind power, here they are just going to be
superficially described:
Airbone Wind Energy (AWE): At present, conventional onshore wind
turbines cannot access wind resources available at 200 meters high, where
the wind blows constantly at a higher speeds. Alternative technologies such
as AWE can capture part of these high altitude wind resource by suspending
at high altitude an energy capturing system such as tethered kites or airfoils.
These allows increasing the capacity factor from 30-35% to 60%. However,
the short lifespan of the suspended element due to the crash risk and the
barriers to operate at certain altitudes due to the coincidence with commercial
aviation routes78.
Piezoelectric Wind Turbines (PWC): These turbines use magnetic attractive
and repulsive force to create mechanical oscillation in piezoelectric bimorphs
which is then converted into electric charge through direct piezoelectric effect.
This technology have not generally used due to its little development79.
5.6.3. Solar PV
• Solar PV technology is projected to reduce its LCOE at a faster pace than
offshore wind. However, there is not a winning technology as high quality wind
sites with the adequate turbines will provide LCOEs below the ones of most
solar PV sites.
• In general terms, solar PV and wind on-shore have complementary
generation profiles which minimizes pool price volatility risks induced by
variable penetration rates of non-manageable renewable resources.

90 Escuela Técnica Superior de Ingenieros Industriales UPM
5.6.4. Conclusion
In conclusion, some notes about grid scale generation are exposed:
• Grid Scale Generation takes part in the New Energy Market which implies
Renewable Energy Resources, thus every technology analysed in this
section is non-polluting. RES are the way to achieve a superior administration
of the network, flexibility, and minimize loses and misfortunes.
• Wind Power generation is currently the best technology for grid scale
generation and is expected to reduce its LCOE, CAPEX and OPEX costs due
to recent investigations to improve efficiencies and economies of scale of
installations, logistics and materials that are required.
5.7. ENERGY MANAGEMENT SYSTEM (EMS)
An EMS is a software system that monitors, controls, or analyses energy in a building.
It includes home and building automation services, personal energy management, data
analysis and visualization, auditing, and related security services.
In order to better understand the implications of the EMS in different situations two
cases are explained, when it is used in a common house and in bigger buildings. Thus,
Home Energy Management System (HEMS) and Building Energy Management System
(BEMS) are differentiated:
5.7.1. Home Energy Management System (HEMS)
The concept of HEMS has changed in the last few years. In the recent past the
House energy system was considered as a system deployed by utilities of the energy
system while, at present, the HEMS is considered as the thinking and controller
gadget of the smart home. This shift has been necessary due to the technology
development of smart loads and DERs in general, the control of the different devices
of a house in order to get a more efficient and economic administration of the energy
is currently a key issue.
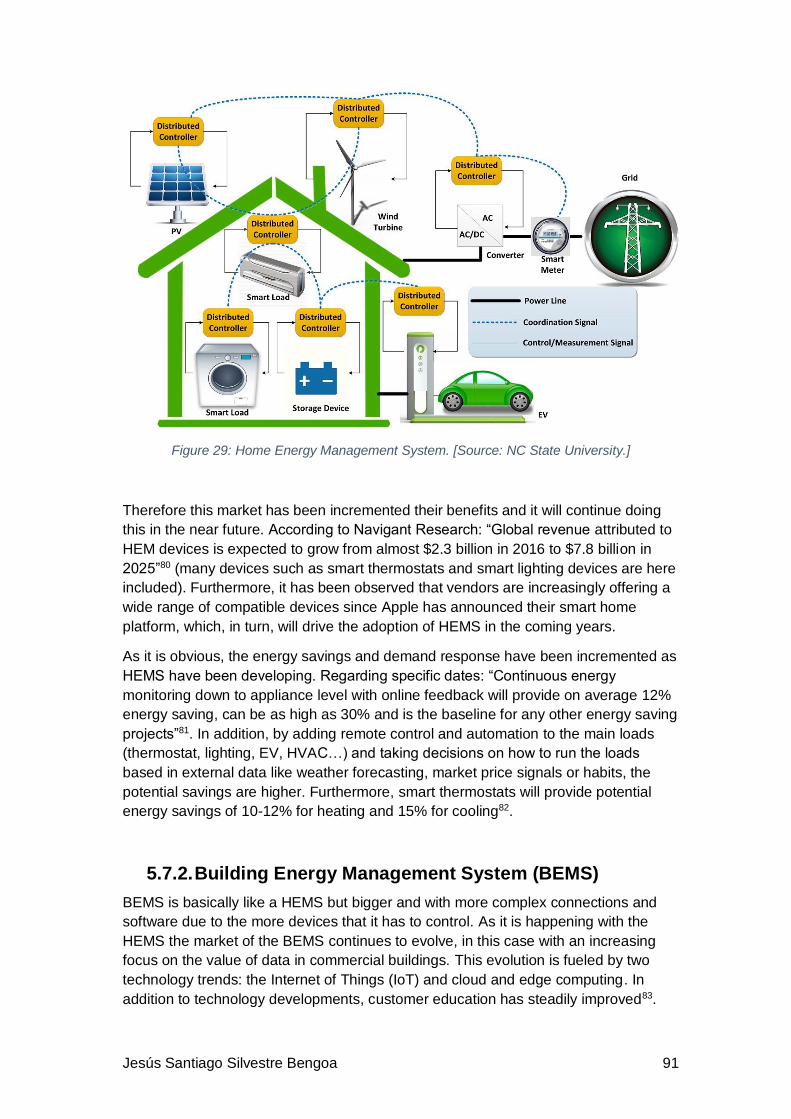
Jesús Santiago Silvestre Bengoa 91
Figure 29: Home Energy Management System. [Source: NC State University.]
Therefore this market has been incremented their benefits and it will continue doing
this in the near future. According to Navigant Research: “Global revenue attributed to
HEM devices is expected to grow from almost $2.3 billion in 2016 to $7.8 billion in
2025”80 (many devices such as smart thermostats and smart lighting devices are here
included). Furthermore, it has been observed that vendors are increasingly offering a
wide range of compatible devices since Apple has announced their smart home
platform, which, in turn, will drive the adoption of HEMS in the coming years.
As it is obvious, the energy savings and demand response have been incremented as
HEMS have been developing. Regarding specific dates: “Continuous energy
monitoring down to appliance level with online feedback will provide on average 12%
energy saving, can be as high as 30% and is the baseline for any other energy saving
projects”81. In addition, by adding remote control and automation to the main loads
(thermostat, lighting, EV, HVAC…) and taking decisions on how to run the loads
based in external data like weather forecasting, market price signals or habits, the
potential savings are higher. Furthermore, smart thermostats will provide potential
energy savings of 10-12% for heating and 15% for cooling82.
5.7.2. Building Energy Management System (BEMS)
BEMS is basically like a HEMS but bigger and with more complex connections and
software due to the more devices that it has to control. As it is happening with the
HEMS the market of the BEMS continues to evolve, in this case with an increasing
focus on the value of data in commercial buildings. This evolution is fueled by two
technology trends: the Internet of Things (IoT) and cloud and edge computing. In
addition to technology developments, customer education has steadily improved83.
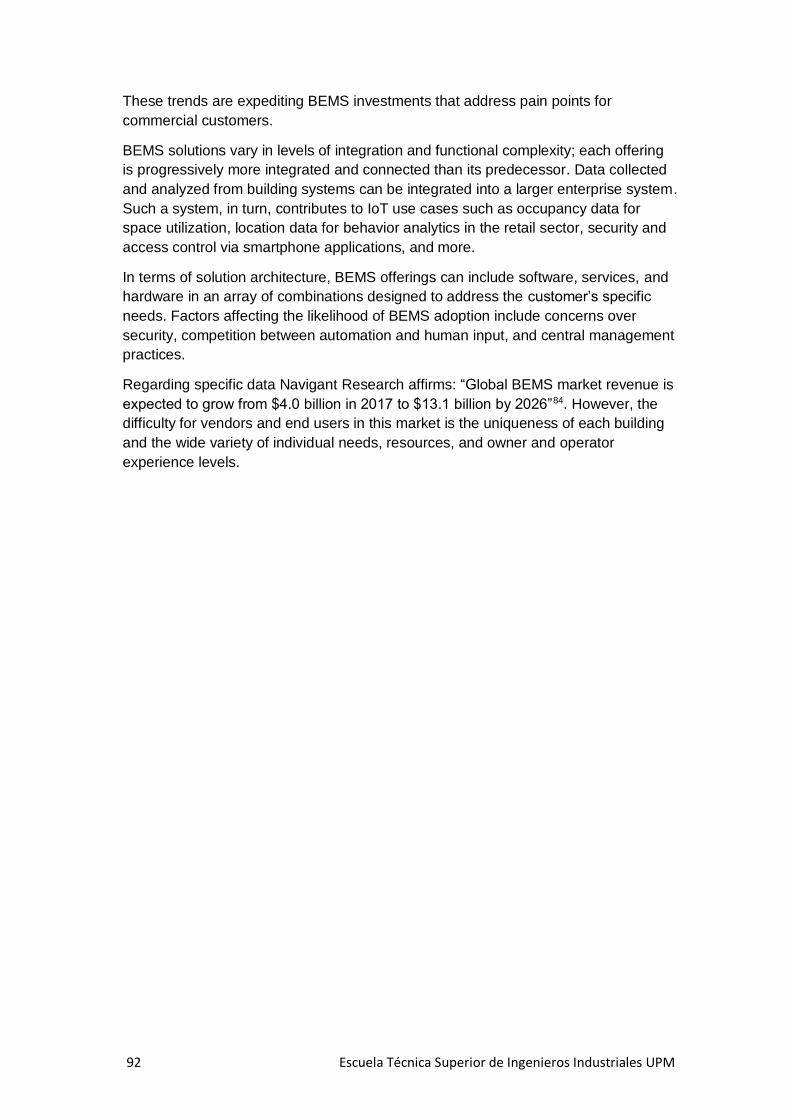
92 Escuela Técnica Superior de Ingenieros Industriales UPM
These trends are expediting BEMS investments that address pain points for
commercial customers.
BEMS solutions vary in levels of integration and functional complexity; each offering
is progressively more integrated and connected than its predecessor. Data collected
and analyzed from building systems can be integrated into a larger enterprise system.
Such a system, in turn, contributes to IoT use cases such as occupancy data for
space utilization, location data for behavior analytics in the retail sector, security and
access control via smartphone applications, and more.
In terms of solution architecture, BEMS offerings can include software, services, and
hardware in an array of combinations designed to address the customer’s specific
needs. Factors affecting the likelihood of BEMS adoption include concerns over
security, competition between automation and human input, and central management
practices.
Regarding specific data Navigant Research affirms: “Global BEMS market revenue is
expected to grow from $4.0 billion in 2017 to $13.1 billion by 2026”84. However, the
difficulty for vendors and end users in this market is the uniqueness of each building
and the wide variety of individual needs, resources, and owner and operator
experience levels.
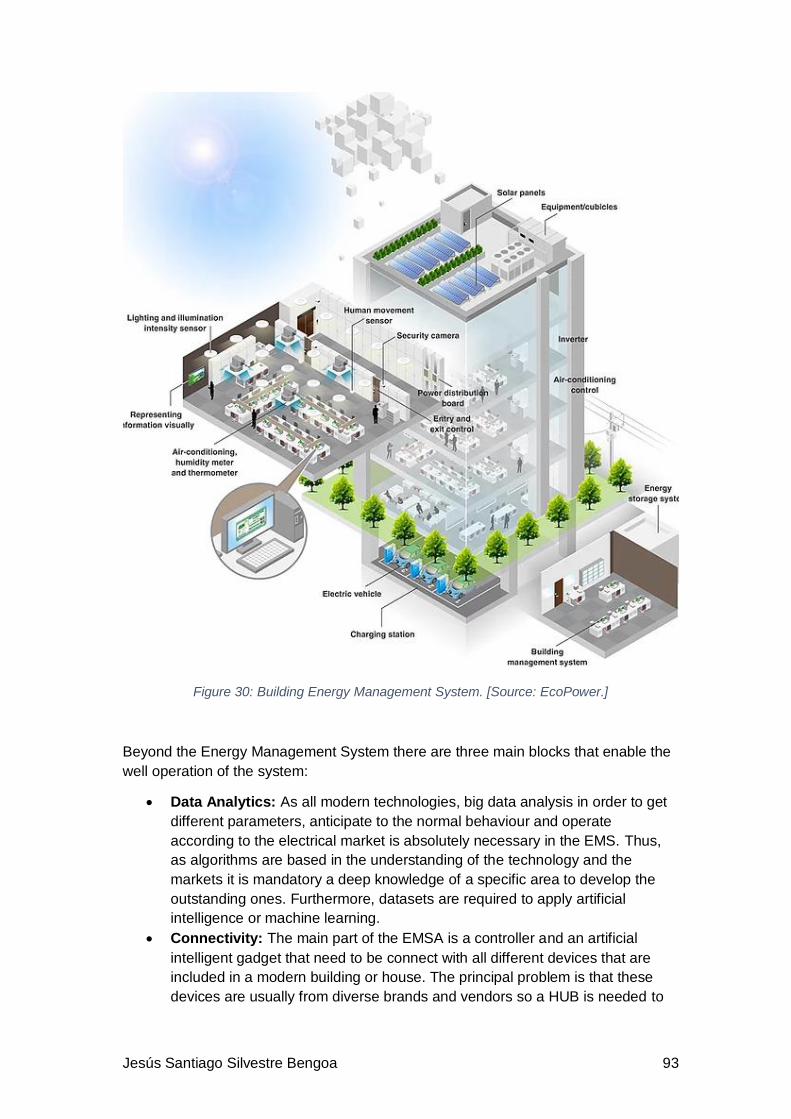
Jesús Santiago Silvestre Bengoa 93
Figure 30: Building Energy Management System. [Source: EcoPower.]
Beyond the Energy Management System there are three main blocks that enable the
well operation of the system:
Data Analytics: As all modern technologies, big data analysis in order to get
different parameters, anticipate to the normal behaviour and operate
according to the electrical market is absolutely necessary in the EMS. Thus,
as algorithms are based in the understanding of the technology and the
markets it is mandatory a deep knowledge of a specific area to develop the
outstanding ones. Furthermore, datasets are required to apply artificial
intelligence or machine learning.
Connectivity: The main part of the EMSA is a controller and an artificial
intelligent gadget that need to be connect with all different devices that are
included in a modern building or house. The principal problem is that these
devices are usually from diverse brands and vendors so a HUB is needed to

94 Escuela Técnica Superior de Ingenieros Industriales UPM
centralize the access to every asset. The big challenge is to integrate open
standards so communications won´t be an issue with the different devices.
Customer interaction: The usability of the different applications has a
starring role in the EMS. Selecting the proper channels and the best moment
to address the customer with the optimal message involves more of a
sociologic approach than a technical one. Although in order to get the
optimum solution human interaction has to be reduced to the minimum, so in
many cases it is better not to interact and control everything remotely.
5.7.3. Conclusion
In conclusion, after analysing the EMS six main statements are exposed:
Most EMS in the market are limited to the display of information and basic
dispatching algorithms. Maximization on data use to optimize asset
utilization and enable alternative revenue generation sources for the end user
provides an opportunity to build more attractive business cases.
The generalization of the different DERs such as smart loads is increasing the
implementation of EMS in house and buildings.
The development of the Smart meters is letting the collection of many
information which enables to continue developing analysis and new
algorithms.
The EMS growth will be based on being able to demonstrate potential energy
savings with the deployed assets, the operational optimization of those assets
and the system as a whole is key to maximize return on investment made by
the client.
The EMS is a key factor to get the New Energy Market, because they
represent one of the most important tools for Demand Response.
Groups of BEMSs and HEMSs will be managed by an aggregator that will
exchange information with the VPP and with the system operator. Although
this will be explained in the following section: “Virtual Power Plant”.
5.8. VIRTUAL POWER PLANT (VPP)
A VPP is a system that combines information from the energy management systems
and aggregators with the information from the system operator. It is based on a
software that obtain optimum usage of the network controlling the energy demand
and supply and the interaction between both of them. Figure 31 represents really well
the VPP concept.

Jesús Santiago Silvestre Bengoa 95
Figure 31: Virtual Power Plant. [Source: Natural Resources Canada.]
VPP systems can help transform classic passive consumers into active “prosumers”
(producers and consumers). This can be achieved through the integration and remote
control of a fleet of EMS in charge of the aggregators that have to monitor, optimize
and control DER technologies such as distributed generation with wind power and
solar PV, energy storage, EVs, and smart loads. Prosumers will be active participants
in delivering services tailored to their own needs and preferences but that also serve
the larger grid.
VPP devices amplify the esteem for end clients, DSOs and TSOs. The system
provides value for the final user in terms of lower energy costs by obtaining the
electricity in cheaper periods and revenue streams (those obtained when energy is
transferred from the final user to the grid). In addition, the system provides value to
the distribution utility in terms of lower capital investments in grid infrastructure or
peaking power plants. Even more, VPP offers value to Transmission grid operators in
terms of regulation of ancillary services such as spinning reserves.
Basically, the operation mechanism of a Virtual Power Plant is the following:
The VPP receives the system energy needs from the operator and transmit
this information to the aggregators though specific participation requests. They
check their numerous EMSs in order to correspond the anticipated system
needs. The VPP determines which are the best positioned EMSs to respond
to the necessities of the system and communicates it the involved aggregator.
On the other side, EMSs connected to the same VPP are always collecting
information from their DERs with smart meters and optimizing their usage with
the information received from the VPP in order to reach the best comfort and
economic benefit for their owner. Furthermore, EMSs respond to the
participation requests from the VPP in the way they are able to in that
moment, for example: Feeding energy to the grid, providing voltage regulation
or reducing the power consumption of the air conditioning system.
Regarding capital needs to assemble VPP instruments, the capital costs appended to
the development of new power plants is noteworthy ($900/MW for Gas plant in the
USA). In examination, the expense per megawatt for a VPP that exploits the assorted
arrangement of existing resources is more or less $80/MW85. Moreover, the
investment in the software that makes the VPP does not convey either ecological

96 Escuela Técnica Superior de Ingenieros Industriales UPM
obligation or the danger of stranded investment. The VPP worth can only be
incremented as time passes as new markets rise for network services. On the other
hand, an interest in traditional resources conveys the danger of long haul degrading.
As indicated by Navigant Research: "Global VAM implementation spending is
expected to reach $2.1 billion annually by 2025". By then, programming spending will
represent 90% of aggregate VAM implementation spending86.
In conclusion, Virtual Power Plants represent the last step to afford the New Energy
System which is more efficient, economic, and that enables an open energy market.

Jesús Santiago Silvestre Bengoa 97
6. REGULATORY FRAMEWORK
6.1. UNITED STATES
6.1.1. Introduction
The electric framework that serves the United States is partitioned into three
interconnections, which likewise cover parts of Canada and Mexico. The
interconnections overhauling the adjacent United States are the Electric Reliability
Council of Texas (ERCOT) Interconnection, the Eastern Interconnection and the
Western Interconnection as it is shown in Figure 32.
While all the power generation plants inside every interconnection are synchronized
and electrically interconnected, the three interconnections are not synchronized, and
direct current control must be changed over to direct current capacity to be exchanged
between interconnections. In this manner, there is little power stream or framework
coordination between the interconnections, and power markets don't cross the limits.
The working frequency for all interconnections in North America is 60 Hertz (Hz).
Figure 32: North American power grid´s interconnections. [Source: NERC.]
There are two main institutions that govern this electric system: the North American
Electric Reliability Corporation (NERC) whose fundamental objective is to guarantee
the reliability of the system; and the Federal Energy Regulatory Commission (FERC)

98 Escuela Técnica Superior de Ingenieros Industriales UPM
that regulates the power transmission between states and the large-scale commerce
of electricity. They play really important roles in this system and as the explanation of
the United States power system continues they are go into be appearing.
NERC coordinates eight regional entities that are in charge of maintaining the reliability
standard in their territories. In addition, inside these territories the electricity supply and
demand is controlled by balancing authorities (BAs).
6.1.2. Natural monopolies and competition
Rivalry in certain economic exercises, for example, supply of electricity or water, may
convert into higher expenses because of the duplication of foundation. In these
situations, a monopoly may benefit the market all the more effectively. Power
generation, transmission, and distribution have extensive capital expenditure (CAPEX)
and low operational expenditure (OPEX); having two power suppliers in a single
administration region could increase the cost. In this way, electric utilities were worked
and directed at the state level as monopolies all through the United States during the
twentieth century87.
In these traditionally controlled markets, vertically integrated utilities deal with the
majority of the fragments of the power esteem chain inside their administration domain,
including generation, transmission, and distribution.
However, in 1978, Congress ordered the Public Utilities Regulatory Policies Act
(PURPA), expecting utilities to buy electricity from little power plants. Thus, PURPA
opened the monopolistic power market to independent power producers (IPPs)88.
Furthermore, in 1996, FERC issued Orders 888 and 889, which expected utilities to
distribute distinct rates for electrical administrations and ordered proprietors of
transmission frameworks to offer power generators access to their system89.
Accordingly, Order 888 recommended the development of ISOs which are free
associations that have operational control and offer open transmission connection.
In 1999, FERC found that there were as yet noteworthy obstructions to guaranteeing
that the United States had a plentiful supply of power at best price. This provoked FERC
to start a procedure taking into account the following topics:
The apparent absence of even-handed access to transmission framework.
The economic building wasteful aspects in the activity of the system90.
The procedure finished in the issuance of Order 2000, which built up the idea of the
regional transmission organization (RTO) and sketched out its capacities and qualities
which are fundamentally the same as the ones for ISOs. Nowadays ISOs and RTOs
serve around 66% of power buyers in the United States, with customary BAs serving
the rest91.
Finally, FERC Order 890 was issued in 2007 to require receptiveness,
straightforwardness, coordination, and fairness in transmission arranging forms, and
FERC Order 1000, issued in 2011 with the objective of expanding coordinated effort in
the arranging and development of territorial and between provincial transmissions,
empowers impartial and prudent cost allotments for new transmission lines92.

Jesús Santiago Silvestre Bengoa 99
6.1.3. Wholesale Markets in the U.S.
United States power markets have both large-scale and retail parts. Large-scale
markets include the offers of power among electric utilities and distributed system
operators (DSOs) before it is sold to customers. Retail advertises include the offers of
power to customers. Both large-scale and retail markets can be traditionally controlled
or free trade markets.
Figure 33: Wholesale Electric Power Markets. [Source: Federal Energy Regulatory Commission.]
As the Figure 33 shows a few sections (grey) of the United States wholesale power
market are traditionally managed, implying that vertically-incorporated utilities are in
charge of the whole stream of power to buyers. That is to say, they possess the
generation, transmission and distribution frameworks used to serve power
consumers93.
However, different parts of the large-scale market such as Northeast, Midwest, Texas,
and California are rebuilt fair competition markets (CAISO, NYISO and PJM are the
most relevant). These business sectors are controlled by independent system
operators (ISOs) or regional transmission operators (RTOs). ISOs and RTOs utilize
free trade market instruments that permit autonomous power generators and non-utility
generators to exchange control. In rebuilt fair competition markets, TSOs and utilities
are regularly in charge of retail power administration to clients and are less inclined to
possess generation and transmission assets.

100 Escuela Técnica Superior de Ingenieros Industriales UPM
6.1.4. Retail Electricity Markets in the US
Retail markets are define at the state-level and can be traditionally managed or fair
competitive. As it can be seen in the Figure 34 in grey, consumers cannot pick who
produces their energy and are required to buy from the utility around their zone in a
traditional retail power market such as Northwest, Southeast and nearly all the west
except California. In these states, most renewable power source activities are owned
by utilities. Subsequently, growing substantial green power projects in a traditionally
managed state and asserting renewable power source utilize can frequently be difficult.
Free trade retail power markets (blue) enable power customers to pick between
different retail providers. These power markets have opened generation for rivalry from
autonomous power generators in 24 states, in the Figure 34 they appear in blue, some
of them are California, Texas and most of the Northeast. Washington D.C. and 18 of
these states have likewise presented retail decision, which permits private and
additionally industrial purchasers to pick their own particular power supplier and
generation choices, including sustainable power source.
In these fair competition markets, municipally-possessed utilities may not offer their
clients retail decision. Note that the market isn't generally isolated plainly between
traditionally managed markets and competitive markets. A few states, similar to
California, are halfway rebuilt markets and just allow certain purchasers to take part in
retail decision.
Figure 34: Retail Electric Power Markets. [Source: Federal Energy Regulatory Commission.]

Jesús Santiago Silvestre Bengoa 101
6.1.5. Flexibility in the U.S. market
As it is explained, the objective of the section: “Regulatory Framework”, it is to analyse
the progress of the different markets (mainly U.S. and Europe) in order to value if they
are going in the best way to the development of the energy transition. That is why, in
this section demand response (DR) and renewable energy generation (REG) in the
United States must be examined.
Demand Response utilizes tariffs or projects to empower here and now changes in
energy use by final customers. Economic programs to encourage demand response
pay taking part clients to diminish their consumption amid lack occasions or when the
cost of producing power is higher94. DR can give financial advantages by dislodging the
most costly assets in a market with competition; in other words, assets in the far-right
half of the generation load as it is shown in Figure 35. In 2013, the potential pinnacle
decrease in ISOs/RTO zones from interest reaction program was 29 GW95.
Figure 35: Hypothetical Generation Load. [Source: NREL.]
In energy markets, diminishing stack, amid times in which the demand is high, can
keep away from the requirement for the most costly generation assets. Normally, DR
suppliers submit offers to shorten stack in day-ahead and intraday markets96. The
economic return that suppliers get can be the market clearing price or a small amount
of it. However in 2011, FERC promulgated Order 745, setting up rules for the
investment of DR in power markets and called for ISOs/RTOs to pay DR assets the full
market price of energy97. Order 745 was tested in court under the contention that DR
is a retail exchange and consequently outside the purview of FERC. Be that as it may,
the Supreme Court as of late maintained Order 745, reaffirming FERC's ward to control
the demand side of large-scale markets98.
DR is utilized to guarantee asset sufficiency in capacity markets. At present, in some
markets demand response means a big percentage of the capacity that is available, for
instance, in PJM, DR represents just about 10% of accessible framework capacity99.
Experience demonstrates that DR can provide resource sufficiency cost-viably.
Furthermore, instalments to PJM capacity market members were $11.8 billion lower
than what they would have been if no DR assets had been offered into the bartering100.
Regarding Renewable Energy Generation remarkable characteristics that
differentiate from other energy sources are indicate below:

102 Escuela Técnica Superior de Ingenieros Industriales UPM
REG has very little OPEX.
REG increase grid stack variability.
REG has limited capacity value.
These characteristics challenge the traditional operation of the electric market:
The variability of wind power and solar PV generation requires a higher measure of
adaptability to keep up safe levels of here and now framework unwavering quality.
Moreover, working traditional assets on a more flexible way could spread their OPEX,
and if there are large amounts of operating REG, capacity resources may likewise be
much more required, which could bring about higher clearing prices in capacity
markets.
Low OPEX empower REG to offer at zero or negative prices (due to the near-zero
OPEX together with federal incentives), and this way, lessening the clearing value paid
to all energy markets members. In addition, REG inconstancy can rise the Locational
Marginal Pricing (LMP) unpredictability. On balance, REG integration could negatively
influence the future reliability of the energy system101.
However, the recent changes that has been made in the U.S. electric sector can help
the integration of REG, nevertheless, the recommendations that this report is giving are
going to increase moreover the cost-effectively integration of all these new technologies
and ways of energy generation. In this report seven manners to enable the integration
of REG are exposed:
System flexibility: This is a very general topic that is explained above, it allows
the integration of REG due to the net load variability that renewable sources
imply, system flexibility is needed to reduce the this variability and get a
continuous electric stack.
Cycling conventional resources: This topic is related the previous one, it
rises the flexibility in the system. However cycling fossil-fuel plants could
increase wear and tear and thus rise their OPEX, it is demonstrated that this
rise is not really significant (2% of the savings in fuel costs)102.
Demand Response: The aggregators and the technologies explained in the
previous block that enables the demand response play a very important role for
the integration of REG. Fast and automated response is needed to get a secure
energy system.
Storage systems: Batteries greatly increase the energy supplies that are
required when there is a decompensation between generation and demand.
Scheduling: If the market is managed with an hourly dispatch it will be really
difficult to deal with variability, thus in the United States five-minute scheduling
is used in most of the energy market103.
Transmission: Extra transmission foundation can empower REG integration
from different places in the U.S. because interconnecting REG in remote areas
enables to match supply and demand. Geographic decent variety in the area
of renewable sources helps the changeability of wind and solar PV assets.
Figure 36 demonstrates the impact of aggregating numerous plants in Southern
California.

Jesús Santiago Silvestre Bengoa 103
Figure 36: Aggregation of Solar PV plants. [Source: NREL.]
Forecasting: Wind and solar forecasting is a really interesting option to
facilitate REG integration. Shorter forecasts and faster scheduling frequency
enable system operators to lessen the measure of energy reserves at a given
time (Figure 37). In fact, in a 2014 in the Western Interconnection, almost all
grid administrators revealed utilizing wind forecasts for day-ahead schedule104.
There are three main activities to get a forecast: wind and solar energy
prediction based on weather forecasts, re-enactment of generation and local
power forecast105.
Figure 37: Effects of forecast lead time and dispatch schedule on reserve requirements. [Source: NREL.]
At this point a review of two of the main markets in the U.S. is presented. Are they
integrating REG in an appropriate way? Are they using the proper technologies? Are
they taking action to get the energy transition?

104 Escuela Técnica Superior de Ingenieros Industriales UPM
6.1.6. NYISO
NYISO manages the transmission network of the state of New York, which in 2013 had
a maximum generation capacity of 39,704 MW. The historical maximum of
consumption occurred in the summer of 2006 with 33,035 MW, resulting in a capacity
margin of 17%. The NYISO manages two types of Demand Response programs:
Reliability and economic programs106.
Reliability programs: Its mission is to provide load reductions in the system when the
operator considers that operational reserves will be insufficient. The programs
managed by the NYISO are the following:
Emergency Demand Response Program (EDRP): It is a program for LSE (Load
Serving Entities), final clients and aggregators that wish to offer their demand
reductions in the market. The conditions to participate in this market are:
Need for installation of measuring equipment by intervals and its corresponding
verification by the NYISO of its correct operation.
Minimum contribution capacity to the program is 100 kW per zone and with a
response capacity of no more than 2 hours for participants of the program
without intermediaries such as aggregators or LSE.
Generation systems located behind the meter can participate in the program.
Minimum capacity of 0.5 MW for aggregators of distributed load groups.
It is a voluntary program in which there is no penalty for not delivering the
agreed load.
Payments are made for reduced energy with respect to the consumption
baseline.
It is a program compatible with the DADRP (It is later explained). If bids have
been submitted in both, the DADRP offer will be first marketed and, if the
reduction is greater than that offered in the DADRP, it will be paid according to
the price of the EDRP program.
ICAP-Special Case Resources (ICAP SCR): Mandatory program in which LSEs,
aggregators and end customers that, through a Responsible Interface Party (RIP), can
offer power reductions in case of shortage of operational reserves.
The communication of an event is made at least two hours in advance.
The minimum demand reduction capacity is 100 kW.
Aggregators with a maximum limit of 100 MW are allowed.
Participants will receive payments for capacity and, in case of being dispatched,
payments for energy cut off on their consumption baseline.
Non-compliance with the contracted power reductions implies incurring
penalties.
Participants in the ICAP-SCR program cannot participate simultaneously in the
EDRP program.
Economic programs: DR programs based on economic incentives are characterized
by the fact that suppliers participate in the markets as a conventional generation unit.
The two programs are the Day-Ahead Demand Response Program (DADRP) in which

Jesús Santiago Silvestre Bengoa 105
they participate in the energy market and the Demand-Side Ancillary Service Program
(DSASP) for the auxiliary services market.
Day Ahead Demand Response Program (DADRP): It is a program in which LSEs,
aggregators and end users offer demand reductions in the daily energy market as an
asset equivalent to a generation unit receiving in exchange the Locational Market Price
(LMP). The requirements to participate are the following:
Demand response providers must have devices for measuring consumption by
intervals, users will be responsible for the cost of installing the hardware and
administrative costs.
NYISO does not allow the participation of distributed generation systems behind
the meter. However, it has been ordered by the FERC to eliminate this
restriction.
The offered capacity must be at least 2.0 MW.
The formation of the price of the offers has two components: a payment for the
energy in ($ / kWh) not less than $ 75 / kWh; and a payment for start of operation
($) which is finally combined in a single price ($ / kWh) that is introduced in the
system.
Day Ahead Ancillary Service Program (DSASP): It is a program in which LSEs,
aggregators and end users offer demand reductions in the daily market and in real-time
auxiliary services. The services available for DR are frequency regulation and
operational reserves. Operational reserves are categorized according to whether they
are synchronized with the network (spinning and non-spinning reserves) and their
response time (10 minutes and 30 minutes). The requirements to participate are the
following:
The minimum capacity to participate is 1 MW.
Participating charges can simultaneously make offers for frequency regulation
services and spinning reserves together with one of the two reliability programs
(ICAP SCR or EDRP) but not both.
For the frequency regulation service, the supplier will be able to participate in
the daily and real-time market as long as it can respond to the orders given
through the Automated Generation Control (AGC) system in less than 6
seconds. In the case of operational reserve providers, the response time to the
network operator's orders must be less than 5 minutes.
Offers for the frequency regulation service are divided into a price per capacity
($ / kW) and a price per kW of variation ($ / kW). Likewise, the response rates
in (kW / min) and (kW / sec) must be indicated to establish the order of dispatch.
6.1.7. CAISO
The electricity market in California has certain peculiarities since, although it faced
market deregulation and has a network operator (CAISO) that manages the
transmission network and the electricity markets, its large utilities are vertically
integrated because they still conserve a part of its generation infrastructure after
deregulation.

106 Escuela Técnica Superior de Ingenieros Industriales UPM
The installed capacity in California in 2013 was 78,133 MW, and its maximum historic
consumption is 61,162 MW107. However, the withdrawal of the San Onofre nuclear
power plant or the increase in distributed generation due to the boom in residential and
commercial solar PV installations are creating management problems for distribution
networks to utilities and the network operator.
California has defined three demand response programs in which it is able to participate
in both the energy and reserve markets:
Participating Loads: This is a program reserved for LSEs that offer to cut the
consumption of individual loads (including pumping units) or aggregate loads in the
market in real time or in the market of auxiliary services such as non-spinning reserves.
Proxy Demand Response (PDR): It is a program in which consumers have the
possibility to participate through LSEs and aggregators. The markets in which it is
possible to participate are the daily energy market, the Residual Unit Commitment
(RUC), the real-time energy market and the auxiliary services market such as Non-
Spinning Reserve. Participation in the markets is carried out through a Scheduling
Coordinator who will send the economic offers and will also be responsible for
communicating the instructions of the network operator to the participants.
Reliability Demand Response Product (RDRP): This is a new product in force since
the spring of 2014 created to maintain the reliability of the system. The RDRP is
compatible with emergency programs managed by utilities and their aggregators and
allows them to be integrated into the wholesale market managed by CAISO. This
product can be introduced in the daily market of energy and in the market in real time
but only in emergency situations of the network.
The conditions of participation in these programs are the following:
The minimum load to participate in the PDR program is 100 kW.
In the RDRP program, the minimum load to participate as Reliability Demand
Response Resource (RDRR) will be 0.5 MW and charges may be added up to
reach the set limit. The participating loads must reach the committed reduction
level in 40 minutes and keep it for 4 hours.
The time margins of the notices before the effective reduction of the load
depends on the market in which it participates. In the day-ahead market it will
be 24 hours in advance while in the real-time market it will be 5 minutes and 15
minutes in the auxiliary services market.
The charges that provide auxiliary services of non-spinning reserves should
receive notifications in a maximum of 1 minute, reach the capacity dispatched
by the operator in 10 minutes and maintain it for at least 30 minutes.
6.1.8. Summary and Conclusions
The energy system in the U.S. is a complicated device where distinctive advances,
authorities, and regulatory frameworks collaborate. At present, two noteworthy models
for power commercialization work in the United States:

Jesús Santiago Silvestre Bengoa 107
Regulated monopoly model: In this model state commissions control vertically
coordinated energy suppliers.
Competitive model: In this model electricity generators can straightforwardly
get to transmission framework and take part in discount power markets.
Regulators of the system presented rivalry in power markets with the objective
of enhancing effectiveness, bringing down customer cost, and diminishing the
obstructions to partake as a supplier.
As it is said before, competitive markets serve 66% of the clients in the United States.
The objective of the two models is to furnish energy securely and dependably to end
customers.
Autonomous institutions with no economic stake on the result of energy exchanges
work wholesale markets. In order to take part in the market, electricity generators
present their offers for each scheduling period, which is regularly in the U.S. five-minute
scheduling is used in most of the energy market. Offers incorporate asking cost, which
it is calculated depending on the plant´s OPEX, and capacity offered. All in all, as it was
explained in the Context block, system operators dispatch the minimum cost offers first
until the demand is completely responded; then the last offer with the most expensive
price sets the price of the market. LMPs incorporate three different parts: Market's
energy value, blockage expenses, and transmission losses.
Competitive markets are not restricted to power exchanging, for example, generation
plants can furnish different services to help the transmission system. These are known
as auxiliary or ancillary services and they are black start, voltage support and operating
reserves. Grid operators additionally arrange the exchanging of budgetary transmission
rights, which enable the owner to pay ahead for transmission clog costs and can be
utilized as a type of supporting against cost unpredictability. Furthermore, capacity
instalments have been inserted to increment grid reliability by giving an extra income
for generators relatively to their capacity factor.
The ongoing development of Demand Response and REG has postured new
challenges to competitive framework operators. DR devices urge buyers to change
their utilization in the near future, mostly through duties and incentive programs
because DR can uproot the most costly assets, expanding the financial productivity of
the framework, and can give dependability and ancillary services cost-adequately.
Finally, regarding DR, FERC's Order 745 called for network managers to pay DR assets
the full market cost of energy, what is more, as it has been explained, recently the
Supreme Court has maintained this order.
Solar PV and wind power increment grid stack unpredictability and volatility which can
raise the cost and sophistication of adjusting the network energy load. Measures that
can cost-successfully alleviate the expenses of integrating REG are mainly among
others: demand and offer flexibility, more decentralized transmission structure,
geographic variety, better scheduling and forecasting.
In addition, Solar PV and wind power, and REG in general, have close to zero variable
cost, which lessens the market clearing value relatively to the measure of REG assets
available at a given time. This can make income vulnerability and inadequacy for other
present and planned generators. In the long haul, income vulnerability can diminish the

108 Escuela Técnica Superior de Ingenieros Industriales UPM
unwavering quality of the power framework on the grounds that current members may
resign and imminent members may pick not to participate. The objective of capacity
markets is to raise income reliability for generators and, thus, increment framework
dependability.
The involvement with competitive markets in the U.S. could offer experience to other
electric systems in the world such as Europe and Asia. The structure of the U.S.
markets and their parts are the consequences of a long development and the
consolidation of experiences gained from market wasteful aspects and mistakes.
6.2. EUROPE
6.2.1. Introduction
The European electricity market is hierarchically constituted (Figure 38 represents
this organization). The most minimal level of the system includes private consumers,
industrial customers, energy providers and those entities that both consume and
provide energy, the “prosumers”. They all are organized in Balance Responsible
Parties (BRP), this expression refers to entities such as DSOs and utilities. They are
accountable for adjusting the electric demand and supply of their consumers and
suppliers. Furthermore, BRPs purchase needed energy or offer it, if it is excessed,
from outside their group in case they are not able to balance the supply and the
demand inside the group. Ultimately, BRPs stand for the second level of the market
structure.
Different BRPs are gathered into Market Balance Areas (MBA), they are managed by
market operators such as TSOs that have to control the security in the network and
the correct transmission of the electricity and they, as it is explained in the Context,
are able to take active measures to ensure the stability in the area where they have
jurisdiction.
Finally, last level of this organization is the Integrated European Market that organize
the different TSOs of the European countries. Nowadays, the European Network of
Transmission System Operators for Electricity (ENTSO-E) manages 43 TSOs from 36
different European countries108.
However, this hierarchical structure corresponds to the traditional energy market that
is lately changing with the incorporation of flexibility in the electric demand, and the
renewable energy sources. The power transition in the European electricity market is
deeply explained in the Winter Package.

Jesús Santiago Silvestre Bengoa 109
Figure 38: Organization of the European electricity market. [Source: Springer.]
6.2.2. Winter Package
The Winter Package determinates many characteristics of the future power sector
transition in Europe, all in all, it determinates the regulatory measures that every
member of the power system is going to compulsorily fulfil. There are three main
categories in this package:
Proposals amending existing energy market legislation: This category of
measures is intended to achieving another market plan, the market design
initiative (MDI) and incorporates a mandate altering and cancelling Directive
2009/72 (E-Directive), another control on the inside power market, changing
and revoking Regulation 714/2009 (E-Regulation), and in addition another
control cancelling Regulation 713/2009 on the ACER Regulation (third package
of electricity market liberalisation measures)109.
Proposals amending existing climate change: This classification of
measures means to better adjust and incorporate environmental change
objectives into this new market plan. This class incorporates a completely
changed Renewables Directive 2009/28 (RED) and a completely amended
Energy Efficiency Directive 2012/27 (EED), both to go into constrain on 1
January 2021110.
Proposals for new measures: Ultimately, a proposed direction on Governance
of the Energy Union, the Governance Regulation, and the proposition for
another control on chance readiness in the power sector, the Risk Regulation,
are altogether new measures111.

110 Escuela Técnica Superior de Ingenieros Industriales UPM
These three categories are going to be explained in five different sections, but they are
going to be mixed in order to better understand what the objective of this really
important package is and why it is the key to the power sector transition in Europe but
also in the rest of the world. The figure below shows the different sections that are going
to be explained.
Figure 39: Winter Package. Energy value chain. [Source: Allen & Overy LLC.]
New market design
The Commission, upheld by the Council, has grasped a goal-oriented arrangement for
the European Union's power market, it will be a noteworthy instrument in understanding
the progress to a low carbon economy by 2050. This implies EU residents and also
industrial clients ought to continuously change to power not just as a wellspring of light,
warming and cooling yet in addition transportation.
The quickly expanding offer of RES (Renewable Energy Resources) in electricity
generation, together with more decentralized generation and self-consumption, has
additionally raised doubt about traditional electricity market models. A decentralized
market has more players and makes new parts, for example, aggregators and
'prosumers' (entities that consume and produce energy at the same time). In the
meantime Europe's electricity market is presently better interlinked through
interconnecting systems. This has the both advantages and disadvantages.
More prominent irregularity in provisions has made a requirement for greater
adaptability and responsiveness both on the supply and the request side, as an
example if the sun does not shine or the wind does not blow. The market needs to value
the costs associated with giving that adaptability and reflect them in the general cost of
electricity and its services.
These purported capacity remuneration mechanisms, if not legitimately outlined, can
have major unfriendly outcomes on the working of the inward power market. Indeed,

Jesús Santiago Silvestre Bengoa 111
even where markets and frameworks work well, be that as it may, the danger of a power
crisis can't be avoided and the outcomes of such crises are probably going to be felt
past national fringes, particularly in interlinked markets. That is why emergency
counteractive action and administration can't be viewed as a purely national duty.
Generation
As it has been shown above Member States are required by the present RED to help
the offer of RES by 2020 to 20% of definite energy utilization due to the Europe 2020
strategy, and the Winter Package adds another broad focus of 27% has been set for
2030. Albeit frequently scrutinized for its absence of aspiration, it is for the most part
perceived that proceeding with state money related help will in any case be required to
meet this objective.
One of the main objectives of the European Union, taking into account electricity
generation, is to ensure stability for investors because of obvious reasons. That is the
reason why the draft RED supplements the MDI by presenting diverse measures went
for pulling in investments in the medium and long haul and by decreasing regulatory
barriers on RES producers. As it has been said, this is a crucial objective of this
package, nevertheless, investment levels in RES have dropped a 60% from 2011 to
the present112.
In order to fulfil that objective two main articles were published113:
Article 15: “Member States shall ensure that investors have sufficient
predictability of the planned support for energy from renewable sources. To this
aim, Member States shall define and publish a long-term schedule in relation to
expected allocation for support, covering at least the following 3 years and
including for each scheme the indicative timing, the capacity, the budget
expected to be allocated, as well as a consultation of stakeholders on the design
of the support.”114
Article 6: “Without prejudice to adaptations necessary to comply with State aid
rules, Member States shall ensure that the level of, and conditions attached to,
the support granted to renewable energy projects are not revised in a way that
negatively impacts the rights conferred thereunder and the economics of
supported projects.”115
Winter package does not just assumed that all this targets are going to be fulfil,
nevertheless it integrates a regulation that determines what to do if all these targets are
missed. Concretely, on the off chance that, having evaluated these mind boggling
plans, the Commission builds up that the Union direction isn't met all things considered
or that national baselines are not regarded, at that point Article 27 might apply. This
arrangement sets out a few alternatives for Member States to expand their
commitments to the RES target116. One such choice, which is probably going to
demonstrate dubious, is a prerequisite to make a budgetary commitment to a financing
stage to be set up at Union level to add to sustainable power source ventures, oversaw
specifically or in a roundabout way by the Commission.

112 Escuela Técnica Superior de Ingenieros Industriales UPM
Furthermore, Article 5 presents the obligatory opening of national help plans to RES
establishments situated in other Member States regardless of whether this is just on a
progressive premise. No less than 10% of recently upheld capacity must be opened up
every year in the vicinity of 2021 and 2025, and no less than 15% between 2026 and
2030117.
On the other hand, the legislation bears in mind capacity market mechanisms in order
to remunerate electricity generators and demand providers in response to threatened
shortages of electricity that some Member States have. In spite of the fact that the EU
all in all is at present in a circumstance of overcapacity, a several nations may well face
certifiable security of supply challenges, thus, substantial quantities of existing power
plants will be eliminated soon, as they can't meet EU emanation and natural gauges.
The Sector Inquiry intended to check whether well working markets can trigger
adequate interest in ability to take care of future demand and to distinguish the market
and administrative disappointments that block speculation. The Sector Inquiry for sure
distinguished various market disappointments some of which are relied upon to be
managed by the MDI. Meanwhile if markets do not provide the correct flags and don't
convey high costs now and again of shortage, venture won't happen. Without
satisfactory apparatuses to animate cost responsive request by conclusive purchasers,
national experts regularly top retail costs. National guidelines for overseeing adjusting
markets may by and by top the cost in forward business sectors. Different types of
value bending caused from an inability to portray offering zones in a proper way
undermine cross-outskirt exchange and lessen motivations to put resources into new
interconnector limit.
Finally, the Final Report concludes: “capacity mechanisms must be open to explicit
cross-border participation in order to minimise distortions to cross-border competition
and trade, ensure incentives for continued investment in interconnection and reduce
the long-term costs of European security of supply.”118
Wholesale markets
The Commission keeps up that a goal-oriented new energy market design is required
not exclusively to mirror the changing specialized highlights of power generation and
frameworks yet additionally to live up to purchasers' desires, convey genuine
advantages from new innovation, encourage speculations, strikingly in renewables and
low carbon generation, and perceive the relationship of European Member States with
regards to energy security.
Here a really important role is played by the ROCs (Regional Operational Centres),
they are created due to the Commission that aims to ensure a more coordinated
regional approach to TSOs (Transmission System Operators). According to the E-
Regulation: “all transmission system operators shall establish regional operational
centres […]. Regional operational centres shall be established in the territory of one of
the Member States of the region where it will operate. […]Regional operational centres
shall complement the role of transmission system operators by performing functions of
regional relevance. They shall establish operational arrangements in order to ensure
the efficient, secure and reliable operation of the interconnected transmission

Jesús Santiago Silvestre Bengoa 113
system.”119 ROCs, thus, get empowered to adopt decisions above TSO: “Transmission
system operators shall implement the binding decisions issued by the regional
operational centres except in cases when the safety of the system will be negatively
affected.”120
At this point, an important question should be answer: Who is the institution that
coordinates regulatory decisions? Well, ROCs report to ACER as well as to NRAs
(National Regulatory Authorities). However, The Winter Package shies away from
unifying administrative powers in the hands of ACER, it foresees ACER as a
coordinator. Thus, the chief role of ACER as an organizer of the activities of national
regulatory authorities is protected yet constrained new skills are to be allocated to
ACER when divided national basic leadership on issues of cross-outskirt pertinence
could prompt issues or irregularities for the inner market.
Finally, The Commission asserts that there is a great deal to be done on the demand
side of power markets to guarantee that they work for the full advantage of business
and family buyers, and additionally for "prosumers" and aggregators who deliver energy
through self-generation or offer surplus power back to the grid. Demand response
grasps something other than effective utilization of electricity, it is an imperative
wellspring of adaptability in the power framework. Dynamic consumers ought to have
the capacity to move their demand progressively, decreasing peak load121.
Distribution
The European Commission proposes to fortify the legislative structure for collaboration
between DSOs (Distribution System Operators) and TSOs to guarantee that all data
and information is shared and that the utilization of conveyed assets is facilitated. The
point is to guarantee cost-productivity and secure and solid operation of the systems
regarding the daily operation and long-term planning.
Regulators need to ensure that the DSOs have sufficient financial incentives to
enhance and update their systems, to secure and associate distributed generation and
to contract with other specialist co-ops, and in addition to manage nearby clog
administration. On the other hand, the Commission clarifies different networks services
of DSOs: data management, storage, integration of electrical vehicles recharging points
and to ensure demand flexibility122.
Another important issue to be addressed is the LECs (Local Energy Communities),
which are associations that are value rather than profit driven. The Commission
requires that Member States receive a lawful system that guarantees the LECs to claim,
set up or rent network arranges and to self-ruling oversee them, and that these
networks can get to every single sorted out market either specifically or through
aggregators or providers123. This way, the distribution system is going to be the key to
flexibility with the new role of the DSOs and the new LECs.

114 Escuela Técnica Superior de Ingenieros Industriales UPM
Retail markets
The Commission considers that retail power markets have did not have a competition
that would enable customers to partake in the advantages from rivalry upstream. In this
way, dynamic customers, known as “prosumers”, are to be urged to produce, store,
devour and offer self-generated power on every single sorted out market, separately or
through aggregators.
However, here appear two main issues: Price and data management. To what involves
price, the Commission determines that power providers might be allowed to decide the
cost at which they supply to clients; Member States may, be that as it may, guarantee
the assurance of the energy poor or helpless clients124.
Regarding data management, the Commission proposes to build up regular
guidelines. Member States are obliged to indicate who may approach the information
of the last client with the client's unequivocal assent. Information in this setting
incorporates metering, consumption information and data required for exchanging. The
qualified gatherings conceivably accessing these information are clients, providers,
TSOs, DSOs, aggregators and different gatherings providing electricity or different
services to clients. Finally, the Article 24 makes clear that “regulated entities which give
information services should not benefit from that activity”125.
Last but not least, two really important articles need to be mentioned regarding
“prosumers” and aggregators, both major elements in this report, because there are
the key to get flexibility in the demand side. Article 17 of the E-Regulation expects NRAs
to support last purchasers, including those offering demand response through
aggregators and dynamic customers to take part close by generators in a non-biased
way in all organised markets126. And Article 13 of the E-Regulation gives final clients
the privilege to contract with an aggregator straightforwardly, and without the earlier
assent of the energy provider127.
Conclusion
In conclusion, the Winter Package determines the path to reach the new energy
market that involves the flexibility of the demand side of the system. The Winter
Package is a begging to the regulation change that is needed to be done and that will
be explain in this report in order to achieve an energy market based on renewables
power sources, energy efficiency and focused on the customer that would become
active part of the system.
At this point a review of two of the main markets in Europe is presented. Are they
integrating REG in an appropriate way? Are they using the proper technologies? Are
they taking action to get the energy transition?
The general situation of many European countries have been analysed but in this report
just the three main markets are exposed:

Jesús Santiago Silvestre Bengoa 115
6.2.3. Germany
The German electricity system is the largest in the European Union with an installed
capacity of 171,566 GW and according to the Boston Consulting Group estimates,
Germany's installed capacity can exceed 250 GW in 2030, driven mainly by an increase
in electricity generation investments in Solar PV and wind power.
The Federal Network Agency (FNA) and the four TSOs (TransnetBW, TenneT DE,
Amprion, 50Hertz) operating in Germany have created the GCC initiative (Grid Control
Cooperation) where they publish the needs of the system to participate in the capacity
reserve market. Participant s in the market offer through the platform “regelleistung”
and the GCC resolves the process later.
The loads contributed within the DR programs by the users must be verified by the TSO
to ensure that the minimum technical requirements regarding the level of reliability and
automation capacity of the installation for the control of electrical consumption are met.
The programs open to the DR are primary, secondary and tertiary reserves and they
were established and regulated by the FNA in June 2010. With the same purpose of
maintaining generation reserve capacity in the system, but with contribution of greater
capacities, is created by the Energy Industry Act (EnWG) in December 2012 the
“Verordnung über Vereinbarungen zu abschaltbaren Lasten" (AbLaV) (Ordinance
on the agreements for interruption of charges) and the program "Interruptible Loads"
to which the large industries connected to medium and high voltage networks can
participate.
The requirements to participate in these programs are:
Primary Control Reserve (PCR):
Minimum capacity of 1 MW.
Response time less than 30 seconds to reach the capacity offered.
Automatic notification and activation.
Availability up to 15 minutes and to participate several times per day.
Secondary Control Reserve (SCR):
Minimum capacity of 5 MW with increments of 1 MW.
Response time less than 5 minutes to reach the capacity offered.
Automatic notification of the TSO.
Availability: from 15 minutes to 12 hours and several times a day.
Activation Remote-controlled.
Minute reserve (MR) or Tertiary control reserve (TCR):
Minimum capacity of 5 MW.
Response time less than 15 minutes to reach the capacity offered.
Telephone notification of the TSO.
Availability from 15 minutes to 4 hours and several times per day.
Activation: Automatic activation by Merit Order List Server.

116 Escuela Técnica Superior de Ingenieros Industriales UPM
Interruptible Loads, AbLaV: There are currently 1,136 MW under management in
these programs, with 3,000 MW being the total offered by the TSO's. There are two
types of programs that differ by the form of activation: Immediately Interruptible
Loads (SOL), Controlled by frequency variations; and Quickly Interruptible Loads
(SNL), direct Control by the TSO.
The requirements of the programs are the following:
1,500 MW offered in each modality every month.
Minimum capacity of 50 MW and maximum of 200 MW.
Minimum availability of between 15 min and 1 h at any time, several times a day
a minimum of 4 times per week.
Availability of demand reduction continuously in time intervals of a minimum of
4h every 7 days, and 8h every 14 days.
Response time of less than 1 second in SOL, and of less than 15 minutes in
SNL.
Payments for availability are 2,500 €/MW per month.
Payments for activations are 100-400 €/MWh.
Table 14: Electricity balancing market products in Germany. [Source: SEDC.]
6.2.4. United Kingdom
The United Kingdom has been the first market to open DR programs in Europe. The
regulatory entity in the country, National Grid, allows the participation of the DR in all
balancing markets in the UK. However, in the last years there have been some
problems between stakeholders and providers and, as a result, many operational
requirements have not been appropriate for DR. If these problems are not amended in
the near future UK will not be anymore an appropriate country to enable DR.
National Grid has the Frequency Control by Demand Management (FCDM) and the
Firm Frequency Response (FFR) programs for frequency regulation and for the
operational reserve the program of Fast Reserve Firm Service (FRFS) and Short Term
Operating Reserve (STOR) which covers the majority of the shares in terms of DR in

Jesús Santiago Silvestre Bengoa 117
the British market. Nevertheless, UK just has one dedicated programme for Demand
Response: Demand-Side Balancing Reserve (DSBR).
The characteristics to participate in each program are:
Short Term Operating Reserve (STOR): Operational reserve program open to offers
by suppliers 3 times a year. The characteristics that must meet to participate in the
market are:
Minimum capacity of 3 MW.
Maximum response time after operator instructions of 240 minutes although
response times of 20 minutes are normally required.
Ability to maintain daily weekday participation with a window of 11-13 hours a
day.
The time of return to the conditions prior to the event should not exceed 1,200
minutes.
Activation: Manual.
Firm Frequency Response (FFR): It is programme for frequency regulation that is
open to DR providers in both profiles: dynamic and non-dynamic. The requirements to
participate are as follows:
Minimum capacity of 10 MW.
There is not a maximum response time specified.
Ability to maintain participation several times per day.
Activation: Automatic.
Fast Reserve Firm Service (FRFS): It is an operational reservation service similar to
the STOR but with more demanding requirements in terms of response time and
capacities, what isn’t attractive for DR services.
Minimum capacity of 50 MW offered.
The response time must be less than 2 minutes and the capacity reduction must
be maintained at least 15 minutes.
The response speed must be at least 25 MW / min.
Ability to maintain response between 10 and 15 times a day.
Activation: Automatic.
Demand Side Balancing Reserve (DSBR): It is the only programme that is fully
dedicated to DR and was introduced in 2015. It facilitate companies to reduce their
energy consumption in period of high demand. The characteristics are as follows:
Minimum power of 0.1 MW.
The response time must be less than 2 hours.
Activation: Manual.
Frequency Control by Demand Management (FCDM): It is a program of frequency
regulation in which the participating loads must meet the following requirements:
Minimum capacity of 3 MW.
It is triggered at a 49.7 HZ static set point.
Constant availability except for the periods indicated by the supplier of the load.

118 Escuela Técnica Superior de Ingenieros Industriales UPM
The reduction in demand must be made within a maximum period of 2 minutes
and must be maintained for 30 minutes.
Activation: Automatic.
Table 15: Electricity balancing market products in United Kingdom. [Source: SEDC.]
6.2.5. France
In 2003, industrial customers began taking part of the DR mechanism, later, in 2007,
residential loads began to enter the system through aggregators. Finally in 2014, the
first programme that allow DR participation was constituted: the FCR, and in the same
year, the FRRa.
Nowadays France is becoming one of the best countries in Europe in relation with DR
integration, getting a very active electricity market due to new legislations that enables
the energy transition. In fact, last years, Réseau de Transport d'Electricité (RTE), the
French regulator and TSO, has tried to open ancillary service markets to DR.
This are the programmes created in France in order to enable the participation of DR
in electricity markets:
Réglage Primaire de Fréquence (Primary Control, FCR): Both FCR and FRRa were
issued same year, they enables DR participation to the transmission grid and both are
based on bilateral contracts. French TSO is analysing the possibility of spread these
programmes to distribution and aggregators. The requirements to participate in FCR
are:
Minimum power of 1 MW.
The response time must be less than 30 seconds.
Ability to maintain triggered continuously.
Activation: Automatic.
Réglage Secondaire de Fréquence (Secondary Control, FRRa): The requirements to
participate in FRRa are:

Jesús Santiago Silvestre Bengoa 119
Minimum power of 1 MW.
The response time must be less than 15 minutes.
Ability to maintain triggered continuously.
Activation: Automatic.
Réserves rapides (Fast Reserve, FRRm): The requirements to participate in FRRm
are:
Minimum power of 10 MW. Although it is planned to be reduce to 1-5 MW.
Response times of 13 minutes are normally required.
Ability to maintain triggered continuously. Although it is planned to participate
only during certain days instead of 24/7.
Activation: Manual.
Réserves complémentaires (Complementary Reserve, RR): The requirements to
participate in RR are:
Minimum power 10MW. Although it is planned to be reduce to 1-5 MW.
Response times of 30 minutes are normally required.
Ability to maintain triggered continuously. Although it is planned to participate
only during certain days instead of 24/7.
Activation: Manual.
Appel d’Offres d’Effacement (Demand Response Call for Tender, DSR-RR): The
requirements to participate in DSR-RR are:
Minimum power 10MW.
Response times of 2 hours are normally required.
Ability to maintain triggered up to 60 days/year.
Activation: Manual. Although it is planned to be automatic in the near future.
Table 16: Electricity balancing market products in France. [Source: SEDC.]
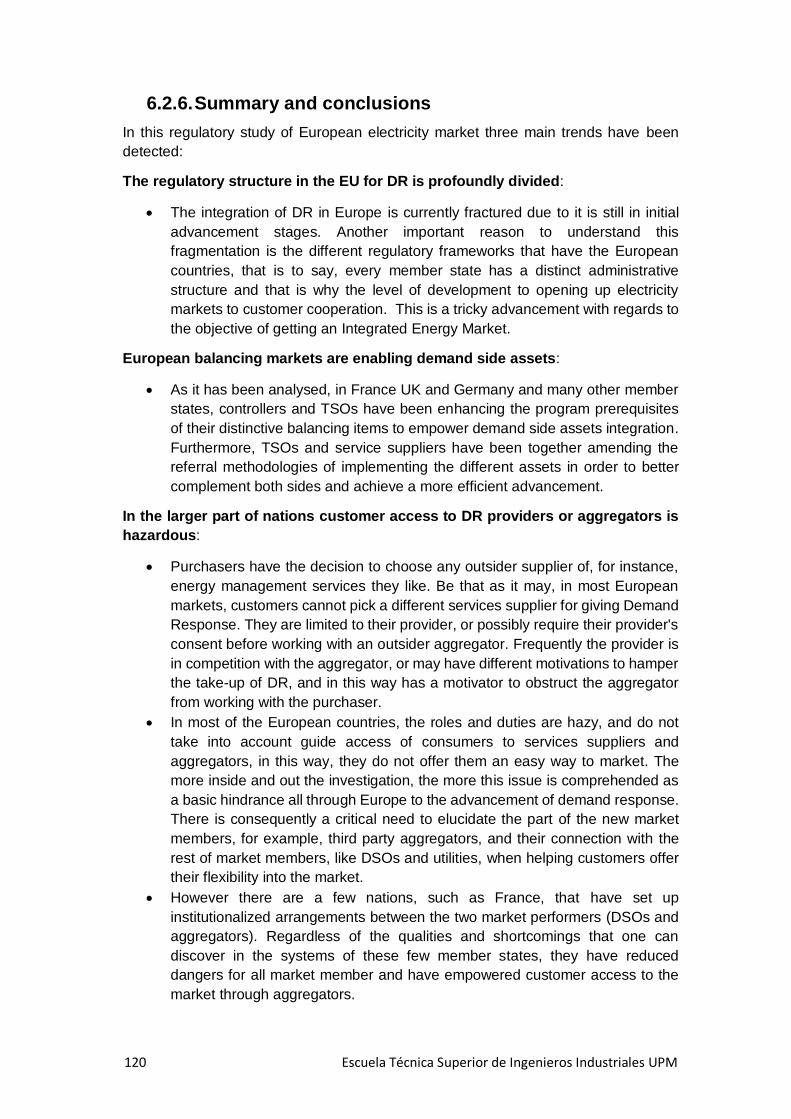
120 Escuela Técnica Superior de Ingenieros Industriales UPM
6.2.6. Summary and conclusions
In this regulatory study of European electricity market three main trends have been
detected:
The regulatory structure in the EU for DR is profoundly divided:
The integration of DR in Europe is currently fractured due to it is still in initial
advancement stages. Another important reason to understand this
fragmentation is the different regulatory frameworks that have the European
countries, that is to say, every member state has a distinct administrative
structure and that is why the level of development to opening up electricity
markets to customer cooperation. This is a tricky advancement with regards to
the objective of getting an Integrated Energy Market.
European balancing markets are enabling demand side assets:
As it has been analysed, in France UK and Germany and many other member
states, controllers and TSOs have been enhancing the program prerequisites
of their distinctive balancing items to empower demand side assets integration.
Furthermore, TSOs and service suppliers have been together amending the
referral methodologies of implementing the different assets in order to better
complement both sides and achieve a more efficient advancement.
In the larger part of nations customer access to DR providers or aggregators is
hazardous:
Purchasers have the decision to choose any outsider supplier of, for instance,
energy management services they like. Be that as it may, in most European
markets, customers cannot pick a different services supplier for giving Demand
Response. They are limited to their provider, or possibly require their provider's
consent before working with an outsider aggregator. Frequently the provider is
in competition with the aggregator, or may have different motivations to hamper
the take-up of DR, and in this way has a motivator to obstruct the aggregator
from working with the purchaser.
In most of the European countries, the roles and duties are hazy, and do not
take into account guide access of consumers to services suppliers and
aggregators, in this way, they do not offer them an easy way to market. The
more inside and out the investigation, the more this issue is comprehended as
a basic hindrance all through Europe to the advancement of demand response.
There is consequently a critical need to elucidate the part of the new market
members, for example, third party aggregators, and their connection with the
rest of market members, like DSOs and utilities, when helping customers offer
their flexibility into the market.
However there are a few nations, such as France, that have set up
institutionalized arrangements between the two market performers (DSOs and
aggregators). Regardless of the qualities and shortcomings that one can
discover in the systems of these few member states, they have reduced
dangers for all market member and have empowered customer access to the
market through aggregators.

Jesús Santiago Silvestre Bengoa 121
The power markets were deregulated particularly to enhance customer benefits
through market rivalry. However today, member state control keeps on
obstructing these customer benefits, breaking the guarantee made to European
residents when deregulation occurred.
6.3. CONCLUSION
In conclusion, after having analysed the European electricity market, the Winter
Package, and the current situation of the countries in general and Germany, UK and
France particularly, some recommendations are exposed:
As it has been exposed, Commission with previous directives and with the
Winter Package mandates that EU states must guarantee that national
regulators empower demand side assets, such as DR and REG, to partake
supply in large-scale and retail markets. The more noteworthy the coordination
between European countries, the more noteworthy the economies of scale and
the heartier DR services become. With this coordination and economies of scale
the cost of distributed generation will be lowered, the effectiveness of the
network will be improved, the cost of other technologies such as storage will
also be lowered enabling lower the cost of energy reserves. Moreover the
development of DR services will involve a vital new source of income for local
organizations and households.
Regarding the potential advantages of DR and the administrative obstructions,
DR strategic plan disaggregated is required in each member state to guarantee
real and practical advancement. These plans ought to incorporate real
objectives for customer demand side development, and should incorporate Key
Performance Indicators (KPIs) that verified the correct compliance of the targets
set. Just an arranged and composed exertion can break the existing barriers
due to the traditional and vertically-integrated grid system.
The time has come to carry our energy markets into line with Europe's energy
targets. The market design initiative (MDI) make an open door for unification
and standardisation of the flexibility in the demand side, including elucidated
roles, programmes and obligations over EU countries. It is presently certain that
the maximum potential of the European inside vitality market will only exploit if
the customers, such as industries, companies and households, are enabled to
engage the energy transition of the EU. This must be one of the objectives of
the market outline and will require a key change in the demand side of the power
market.

122 Escuela Técnica Superior de Ingenieros Industriales UPM

Jesús Santiago Silvestre Bengoa 123
7. BUSINESS CASES AND CASE STUDIES
In this block some cases that integrates Demand Response and the enable
technologies are exposed. They are both, real cases that have been already developed
and hypothetical cases that are thought to be profitable or not. The objective is to
analyse practical situations and to realise and measure the technological and economic
impact of the energy transition.
7.1. THEORETICAL CASES
First of all, theoretical cases are exposed. They will show if everything in this report
have a meaning, a present and future application and where are the main opportunities
to invest profitably. Here six universal business cases are suggested128:
7.1.1. Contract optimization
One option to generate savings is reducing grid utilization costs. As it is known, big
clients have to pay taxes for using the net based on maximum load and consumption;
thus, if load peaks are reduced the utilization costs will decrease. Moreover some
countries compensate customers that demand energy in an atypical way, this means
that their highest consumption matches with off-peak periods.
Secondly, another option is to get flexible tariffs in order to get profit from it. As it is
known, energy market prices vary during the day so peak periods are more expensive
that off-peak ones, so if one customer is able to shift their energy loads to the cheapest
periods through DF technologies this client will reduce its costs. Furthermore, in some
countries there are tariffs that compensate the own produced energy delivering to the
grid at peak hours so here there is another option to get profit. Nevertheless, different
contracts and tariffs needs to be deeply monitored in order to ensure gain for both, the
grid and TSO, and the customer at issue.
7.1.2. Trade on the wholesale market
Open and competitive energy markets are one of the most important subjects of this
whole project. Traditional markets as it was exposed did not let demand size to
participate in the market, nevertheless it is changing as regulation does the same.
Generally, participants in the markets have to pay a fee for trading energy that is why
the role of the aggregator is really important, it brings together some customers in order
to achieve enough energy to trade with it and get profit.
7.1.3. Balancing group settlement
As it was presented in “Regulatory Framework”, the BRPs help system operators to
balance the energy between both sides of the market, the producers and the

124 Escuela Técnica Superior de Ingenieros Industriales UPM
consumers. They have to keep their region stable so there are not decompensations
that may involve additional costs.
7.1.4. Offer reserve capacity
In order to keep the energy flowing and the frequency in the same value (depending on
the country: Europe 50 HZ, USA 60 Hz) there must some producers and consumers
that have to offer reserve capacity when consumption exceed production. In this way,
TSOs compensate providers and customers that offer this capacity, for example, an oil
plant that is able to quickly start its production when energy is needed is going to be
compensated by doing so.
7.1.5. Local system management
Another way of helping the system to be always balanced is that the aggregator or a
group of customers not also trade with the rest of the grid but stabilize their loads. This
more or less the same work of the BRP but in a more locational environment. This helps
to reduce costs so reserve capacity is not so needed, and plants that are not working
do not need to be connected.
7.1.6. Large scale grid stabilization services
Finally, stabilization of the system have to be monitor in a greater level too, different
countries grids should cooperate to exchange loads between them. The more
connection the more stable the net will be, this will drive to a reduction of grid costs that
impact in energy rates.
7.2. REAL CASES
Secondly, real cases are analysed to see in practise if the theoretical cases have a real
application and if they are profitable or not. In “Real Cases” the focus is put in the first
two theoretical business cases (Contract optimization and Trade on the wholesale
market). Four main real cases are exposed in this report, the data is taken from a tough
study done by Rocky Mountain129 regarding the USA market; here main results and
conclusions are shown so it is clarified the economic impact of Demand Flexibility.
7.2.1. Case 1: Real-Time Pricing
This case talks about the program called Real-Time Pricing (RTP) presented by
Commonwealth Edison (ComEd) in 2007. Taking part clients in the program are given
day-ahead evaluations of hourly vitality costs, and can adjust the timing of their
utilization in like manner. The vitality price really paid by clients changes each hour to
mirror the market-clearing price in the large-scale market. In this case it is investigated

Jesús Santiago Silvestre Bengoa 125
the cost savings that flexibility in the demand side gives for both a client participant of
the real-time pricing rate and a common client who could select to enter the program.
There are some initial facts that have been taken into account in order to calculate the
final results, these facts are presented in the following table.
Variable Case Detail
Utility Commonwealth Edison (ComEd)
Program Name/Rate Design Residential Real-Time Pricing (RTP)
Geography/Location Chicago, USA
Customers Participating Approximately 10,000
Fixed Charges $11.35 / month
Demand Charges $4.05 / kW-month (Previous year’s
peak)
Energy Charges Varies hourly; 2014 average
$0.042/kWh
Customer PV Array Size Analysed None, no impact on results
Table 17: Case 1 facts. [Source: Rocky Mountain.]
Main results:
Default
Rate RTP +AC +EV +DHW +Dryer +Battery
Energy Charge $1,840 $1,588 $1,568 $1,493 $1,441 $1,427 $1,332
Customer
Charge $183 $189 $189 $189 $189 $189 $189
Demand
Charge $358 $313 $241 $233 $233 $233
Total DF Costs -$21 -$8 $18 $83 $601
Total Costs $2,024 $2,135 $2,049 $1,915 $1,881 $1,931 $2,354
Table 18: Case 1 results. [Source: Rocky Mountain.]
Demand Charges are other type of charges paid by clients, they are based on the peak electricity usage of a customer during a billing period, and these peaks are generally sized on 15-minute intervals. Utilities will observe the maximum demand of a customer during different time intervals in a day, and will charge a different $/kW rate for the different intervals130.

126 Escuela Técnica Superior de Ingenieros Industriales UPM
Figure 40: Case 1 Results: Annual Supply Costs. [Source: Rocky Mountain.]
Main conclusions:
Load shifting potential: Demand Flexibility (DF) can transfer 20% of annual
kWh from peak hours with high prices to hours with lower costs. Specifically, a
client participant of the RTP with DF buy energy at an average price of $0.036
/ kWh, on the other side, a standard customer buy at an average of $0.044 /
kWh.
Figure 41: Case 1 Results: Shifting Loads to Lower-Cost Hours. [Source: Rocky Mountain.]
Cost-effective DF strategies: In this situation, three of the five innovations
broke down make up the most financial item package for clients. Smart loads
to control air conditioning (AC) are the slightest cost DF alternative because of
their negative cost of shifted energy due to the considerably lower warming
expense. EV charging is the following most cost-effective choice at $0.01 per
kWh, and in addition the biggest move opportunity, because of the minimal
effort of empowering controls in EV charging gear and the huge adaptability of
vehicle battery capacity. Domestic hot water (DHW) is the other alternative,
moving the greater part its vitality request into bring down cost hours. DF dryers
(smart cycle delay switch) and energy storage, at current costs, do not show up
practical for continuous cost arbitrage under this particular rate.
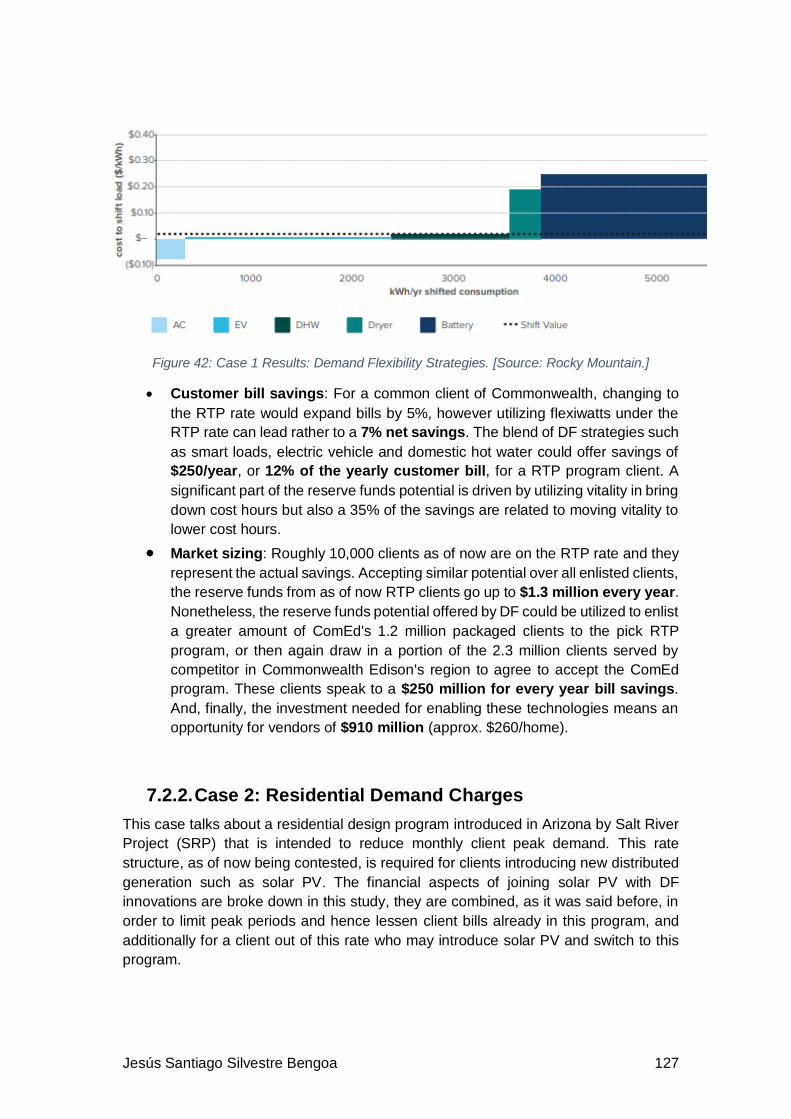
Jesús Santiago Silvestre Bengoa 127
Figure 42: Case 1 Results: Demand Flexibility Strategies. [Source: Rocky Mountain.]
Customer bill savings: For a common client of Commonwealth, changing to
the RTP rate would expand bills by 5%, however utilizing flexiwatts under the
RTP rate can lead rather to a 7% net savings. The blend of DF strategies such
as smart loads, electric vehicle and domestic hot water could offer savings of
$250/year, or 12% of the yearly customer bill, for a RTP program client. A
significant part of the reserve funds potential is driven by utilizing vitality in bring
down cost hours but also a 35% of the savings are related to moving vitality to
lower cost hours.
Market sizing: Roughly 10,000 clients as of now are on the RTP rate and they
represent the actual savings. Accepting similar potential over all enlisted clients,
the reserve funds from as of now RTP clients go up to $1.3 million every year.
Nonetheless, the reserve funds potential offered by DF could be utilized to enlist
a greater amount of ComEd's 1.2 million packaged clients to the pick RTP
program, or then again draw in a portion of the 2.3 million clients served by
competitor in Commonwealth Edison's region to agree to accept the ComEd
program. These clients speak to a $250 million for every year bill savings.
And, finally, the investment needed for enabling these technologies means an
opportunity for vendors of $910 million (approx. $260/home).
7.2.2. Case 2: Residential Demand Charges
This case talks about a residential design program introduced in Arizona by Salt River
Project (SRP) that is intended to reduce monthly client peak demand. This rate
structure, as of now being contested, is required for clients introducing new distributed
generation such as solar PV. The financial aspects of joining solar PV with DF
innovations are broke down in this study, they are combined, as it was said before, in
order to limit peak periods and hence lessen client bills already in this program, and
additionally for a client out of this rate who may introduce solar PV and switch to this
program.

128 Escuela Técnica Superior de Ingenieros Industriales UPM
Variable Case Detail
Utility Salt River Project (SRP)
Program Name/Rate Design E-27 Customer Generation Price Plan
Geography/Location Phoenix, USA
Customers Participating Fewer than 100 in 2015
Fixed Charges $20/customers & $32.44/new
customers
Demand Charges From $3.55/kW to $34.19/kW-month
Energy Charges From $0.039/kWh to $0.063/kWh
Customer PV Array Size Analysed 6 kW (50% of annual customer
demand)
Table 19: Case 2 Facts. [Source: Rocky Mountain.]
Main results:
Default
Rate E-27 +AC +EV +DHW +Dryer +Battery
Energy Charge $2,640 $528 $511 $541 $537 $538 $537
Customer
Charge $240 $389 $389 $389 $389 $389 $389
Demand
Charge $1,917 $1,232 $746 $705 $594 $433
Total DF Costs $13 $26 $52 $332 $397
Total PV Costs $1,255 $1,255 $1,255 $1,255 $1,255 $1,255
Total Costs $2,880 $4,089 $3,399 $2,956 $2,938 $3,109 $3,011
Table 20: Case 2 Results. [Source: Rocky Mountain.]

Jesús Santiago Silvestre Bengoa 129
Figure 43: Case 2 Results: Annual Supply Costs. [Source: Rocky Mountain.]
Main conclusions:
Peak demand reduction: By planning the task of significant burdens to keep
away from high pinnacle amid the 1– 8 pm, the DF strategies and the solar PV
combined are capable to cost-successfully decrease peak demand by 48%
every month.
Figure 44: Case 2 Results: Monthly Peak Reductions. [Source: Rocky Mountain.]
Cost-effective DF strategies: As in the previous case, EV charging and AC
smart thermostats are the least expensive DF choices. In third place, DHW is
additionally a very cheap option, however the aggregate decrease
accomplished is bring down in light of the fact that DHW demand isn't very crest
incidental in SRP's domain. Dryers and batteries, at up-to-date costs for DF
advances, don't seem cost-effective for this particular rate, to some degree in
light of the fact that the lower-cost adaptability from AC, EV charging, and DHW
can relieve the most elevated level demand charges.

130 Escuela Técnica Superior de Ingenieros Industriales UPM
Figure 45: Case 2 Results: Demand Flexibility Strategies. [Source: Rocky Mountain.]
Customer bill savings: If clients without solar PV that are on the default rate
want to introduce solar PV they are going to be included on the E-27 rate. This
installation would mean an increment add up to costs by over 40% due to PV
financing costs. Be that as it may, our examination finds that DF can decrease
net bills under the E-27 rate by up to $1,100/year which means a reduction of
an average of 41%. This means that the investment done by the customer would
be recovered in more or less a year.
Market sizing: When E-27 Customer Generation Price Plan was introduced
fewer than 100 clients joined in, nevertheless the potential of this program is so
huge that it clients are incorporating this rate continuously. As DF technologies
are becoming cheaper more customers are joining the program due to the
investment is recovered in less than a year so there is no cost penalty. If all
SRP common customers pursued DF and join in the program there is a bill
saving chance of $240 million every year and a peak reduction of 673MW.
Furthermore, the investment needed for enabling these technologies means an
opportunity for vendors of $110 million (approx. $300/home) taking into
account DF technologies, and regarding solar PV, this investment means a new
energy market of 1.8 GW, that is to say, a $6.3 billion of investment.
7.2.3. Case 3: Non-Exporting Rooftop Solar PV Rate
This case studies the economic repercussions of offering a non-export scenario to solar
PV customers. This program was made by the Hawaiian Electric Company (HECO)
due to the suggestion of the Hawaii Public Service Commission131.
In the situation described in this case, solar PV proprietors get no remuneration or bill
credit for PV energy they fare to the network, as to say, household generation has
esteem to the proprietor just if utilized by itself. In this study, an analysis of the financial
matters of DF advances for a full-service client considering including a solar PV
framework under the non-send out rate. It is shown a big 10 kW PV framework since
for this situation, the financial matters bolster huge cluster sizes. This size is likewise
appropriate for the generally high-use client incorporated into this investigation.

Jesús Santiago Silvestre Bengoa 131
Variable Case Detail
Utility Hawaiian Electric Company (HECO)
Program Name/Rate Design DG 2.0 Non-Export Proposal
Geography/Location Honolulu, USA
Customers Participating 270,000 utility & 51,000 NEM clients
Fixed Charges $9.00/month
Demand Charges None, no impact on results
Energy Charges From $0.34/kW to $0.37/kWh
Customer PV Array Size Analysed 10 kW (80% of household demand)
Table 21: Case 3 Facts. [Source: Rocky Mountain.]
Main results:
Default
Rate
PV
Non-
Export
+AC +EV +DHW +Dryer +Battery
Energy Charge $8,572 $4,882 $4,550 $4,224 $3,667 $3,538 $2,882
Customer
Charge $108 $108 $108 $108 $108 $108 $108
Demand
Charge
Total DF Costs $29 $42 $68 $133 $373
Total PV Costs $1,291 $1,291 $1,291 $1,291 $1,291 $1,291
Total Costs $8,680 $6,281 $5,978 $5,665 $5,134 $5,070 $4,655
Table 22: Case 3 Results. [Source: Rocky Mountain.]
Figure 46: Case 3 Results: Annual Supply Costs. [Source: Rocky Mountain.]
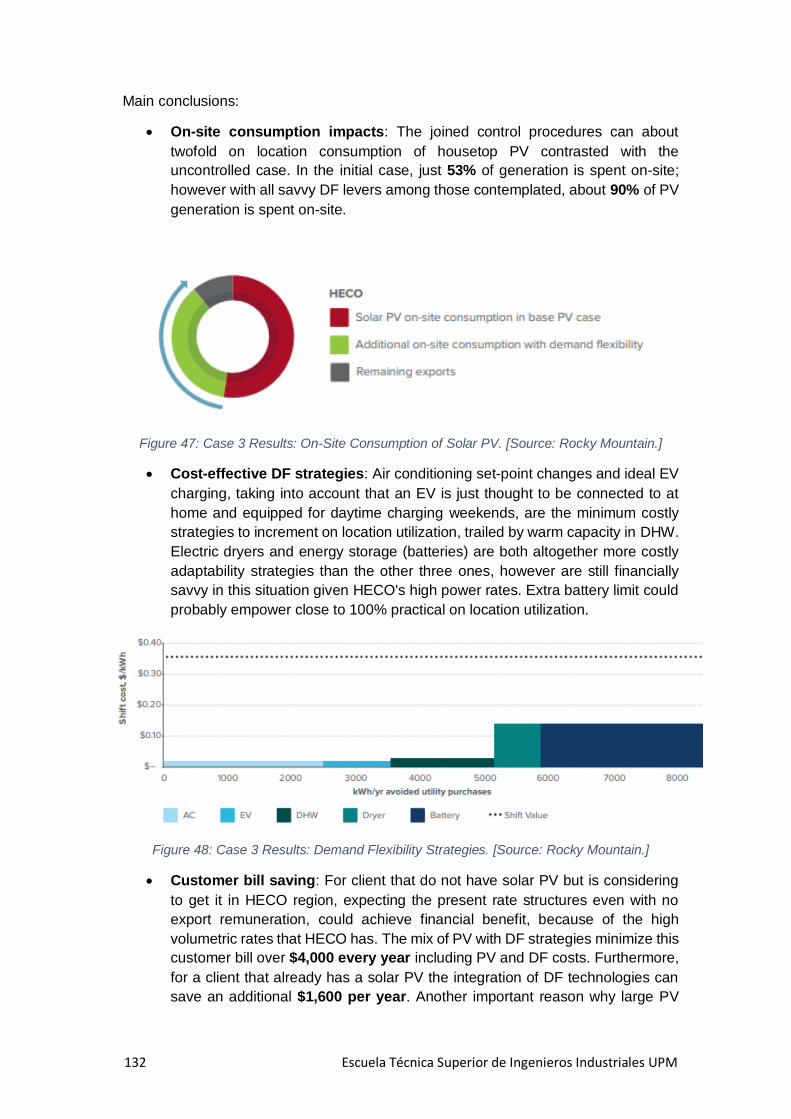
132 Escuela Técnica Superior de Ingenieros Industriales UPM
Main conclusions:
On-site consumption impacts: The joined control procedures can about
twofold on location consumption of housetop PV contrasted with the
uncontrolled case. In the initial case, just 53% of generation is spent on-site;
however with all savvy DF levers among those contemplated, about 90% of PV
generation is spent on-site.
Figure 47: Case 3 Results: On-Site Consumption of Solar PV. [Source: Rocky Mountain.]
Cost-effective DF strategies: Air conditioning set-point changes and ideal EV
charging, taking into account that an EV is just thought to be connected to at
home and equipped for daytime charging weekends, are the minimum costly
strategies to increment on location utilization, trailed by warm capacity in DHW.
Electric dryers and energy storage (batteries) are both altogether more costly
adaptability strategies than the other three ones, however are still financially
savvy in this situation given HECO's high power rates. Extra battery limit could
probably empower close to 100% practical on location utilization.
Figure 48: Case 3 Results: Demand Flexibility Strategies. [Source: Rocky Mountain.]
Customer bill saving: For client that do not have solar PV but is considering
to get it in HECO region, expecting the present rate structures even with no
export remuneration, could achieve financial benefit, because of the high
volumetric rates that HECO has. The mix of PV with DF strategies minimize this
customer bill over $4,000 every year including PV and DF costs. Furthermore,
for a client that already has a solar PV the integration of DF technologies can
save an additional $1,600 per year. Another important reason why large PV

Jesús Santiago Silvestre Bengoa 133
system (10 kW) should be used in HECO´s region is that they return many more
savings. Last issue to be explained is the fact that DF strategies must be
utilized, for example, if a PV system is integrated without DF strategies it will
reduce the customer bill in $1,400 per year, while if DF technologies are
integrated the saving will be $4,000, as it was said before.
Market sizing: In spite of the fact that HECO as of now serves about 50,000
net energy metering (NEM) clients and will keep on offering a rate choice that
remunerates clients for exporting energy beside its non-send out alternative,
Demand Flexibility may keep on expanding the market for new clients,
contingent upon definite changes to Net Energy Metering (NEM) terms.
Furthermore, HECO takes note of that non-send out frameworks won't be liable
to an interconnection survey study, generously decreasing the time from a
marked client contract to a working solar PV system. In this study, it is shown
that yearly client bill savings from DF go up to $110 million every year if all
clients in HECO region introduce solar PV under the mentioned non-export
program. Moreover, there is business opportunity of up to $81 million for
vendors to provide customers with the enabling technology. Finally, the
potential rooftop PV market goes up to 380 MW, or $1.3 billion of investment
at the present costs.
7.2.4. Case 4: Avoided Cost Compensation for Exported PV
This case examines how good are the measures taken by Alabama Power. This utility
has initiated a program that includes avoided cost compensation for the energy
exported by rooftop PV and limited capacity charges to $5/kW-month. The financial
matters are here examined for both kind of clients, those with common rate that are
thinking about getting a solar PV and moving to PAE rate, and for those that already
have a PV system. Due to these measures it will be shown that results are not as profit
as the previous case.
Avoided cost is the marginal cost for a similar measure of vitality gained through another methods, for example, development of another facility or buy from a substitute provider. It is regularly used to calculate a reasonable cost for energy originated by cogenerators or other energy makers that meet with the public regulation. The utilization of avoided cost rates is expected to counteract wastage and enhance proficiency by protecting fair prices from RES and small cogenerators132.

134 Escuela Técnica Superior de Ingenieros Industriales UPM
Variable Case Detail
Utility Alabama Power
Program Name/Rate Design
Alabama Power Family Dwelling
Residential Service & and Purchase
of Alternative Energy (PAE)
Geography/Location Birmingham, USA
Customers Participating Less than 100 at the present, 1.2
million utility residential customers
Fixed Charges
$14.50/month, additional $5/kW-
month of PV capacity for customers
on rate PAE
Demand Charges None, no impact on results
Energy Charges
$0.111/kWh & exports earn
$0.0316/kWh (June–Sept),
$0.0288/kWh (October–May)
Customer PV Array Size Analysed 4 kW (35% of household demand)
Table 23: Case 4 Facts. [Source: Rocky Mountain.]
Main results:
Default
Rate
PV
Rate +AC +EV +DHW +Dryer
+Batter
y
Energy Charge $2,087 $1,559 $1,555 $1,413 $1,395 $1,395 $1,366
Customer
Charge $174 $424 $424 $424 $424 $424 $424
Demand
Charge
Total DF Costs -$58 -$58 -$45 $20 $408
Total PV Costs $914 $914 $914 $914 $914 $914
Total Costs $2,261 $2,897 $2,834 $2,693 $2,688 $2,753 $3,112
Table 24: Case 4 Results. [Source: Rocky Mountain.]

Jesús Santiago Silvestre Bengoa 135
Figure 49: Case 4 Results: Annual Supply Costs. [Source: Rocky Mountain.]
Main conclusions:
On-site consumption impacts: Just little PV frameworks approach cost-
adequacy under the Alabama Power’s PV rate structure on account of the solar
PV particular limit charge. DF can increment on location utilization from little
frameworks from 64% without smart loads to more than 93%. That is to say, it
practically does not export any energy.
Figure 50: Case 4 Results: On-Site Consumption of Solar PV. [Source: Rocky Mountain.]
Cost-effective DF strategies: DF from AC and DHW controllers are most cost-
effective. EV charging is likewise financially savvy yet speaks to a littler load-
shifting potential given the little PV volume. Dryers and energy storage batteries
are not profitable, mainly because of the little PV system and the subsequent
constrained potential for load-shifting in the wake of applying other adaptability
levers.

136 Escuela Técnica Superior de Ingenieros Industriales UPM
Figure 51: Case 4 Results: Demand Flexibility Strategies. [Source: Rocky Mountain.]
Customer bill saving: Because of low retail rates, small array size (4 kW) and
a moderate capacity factor (18.4%) for solar PV in Alabama, housetop
photovoltaic system is scarcely profitable at present installation costs, indeed,
even under rate structures that would be beneficial for PV, for example, no fixed
charges for solar PV or net energy metering (NEM). Thus, regarding PAE
program of Alabama Power with its avoided costs compensations and the
generally high solar PV quotas, a customer without photovoltaic system and in
the default rate will not get profitability of this investment nowadays. For
example, the cost penalty of integrating a solar PV system is $636/year in the
customer bill, however if DF strategies are implemented this penalty diminishes
to $427/year, this bad results are also because of the non-bypassable capacity
charge. Be that as it may, for a client with a current PV framework, DF
innovations can decrease net service charges by $209/year which means an
11% of total bill.
Market sizing: As it is exposed in the analysis this new rate with solar PV is not
profitable nevertheless both photovoltaic systems and the rest of demand
flexibility technologies continue going cheaper, that is why supposing that PV
systems costs are diminishing a 10% each year and the service rates are
increasing annually a 3% it is possible to estimate that household PV will
achieve the parity in 2023, and solar PV plus DF technologies will get it in 2020.
Furthermore, if the system becomes self-consuming so the PV charge eluded
the parity will be achieve in 2018. Thus if in 2020 all Alabama Power customers
integrate solar PV the net bill savings can be $210 million per year, which
implies an investment for vendors of $230 million ($400/home), and a rooftop
PV market of up to 2.9 GW, which means $10 billion of investment.

Jesús Santiago Silvestre Bengoa 137
8. CONCLUSIONS
8.1. CONCLUSIONS
6 main recommendations are raised derived from the analyzes carried out by the
recognition of a more active role of the distributor and consumer, the integration of new
technologies in the distribution network or the correct allocation of incentives in order
to ensure efficient operation of the net.
1. Improve prices and regulated charges for electricity services.
The only way to bring into play all resources, both distributed and centralized, achieving
an efficient operation and planning of the electricity system, involves improving both
the prices associated with the electricity services offered and the regulated charges
associated with them.
The measures that would allow to cover these objectives would be the following:
Minimize the distortions due to those charges designed for the collection of
taxes and the recovery of the costs of energy policies. These costs must come
out of the tariff and be recovered by other mechanisms.
Rates and charges cannot be variable, nor should solutions of “net balance”
type be applied.
Do not distort the price signal of electricity. The aids for certain types of clients,
such as vulnerable or industrial clients, must be made without altering the prices
or charges that are applicable. Subsidies outside the tariff would be the
appropriate mechanisms.
Massively deploy smart meters, with the aim of real electricity injections and
extractions from the network determine the payment to be made by users, that
is to say, the real use of the grid.
2. Improve the regulation of distribution activity.
The regulatory framework in which the distributing companies carry out their activity
must be improved, allowing the implementation of new, more efficient and innovative
business models.
The measures that are intended to be carried out would be the following:
Allocation of incentives that depend on the services provided by the utilities,
aimed at rewarding improvements in quality, reduction of losses in the network,
improvement of interconnection times as well as cost savings in investment
operations.
Implementation of incentives for long-term innovation to accelerate investments
in R&D, as well as to encourage learning about new technologies that may
entail, a priori, greater risks for the network.
138 Escuela Técnica Superior de Ingenieros Industriales UPM
3. Minimize the appearance of conflicts of interests.
A thorough re-evaluation of the structure of the electricity industry must be carried out
in order to minimize the appearance of potential conflicts of interests.
To do this, it is needed:
To make a correct assignment of the main functions that are at the center of the
energy markets: network service providers, system operators and market
platforms, thus ensuring the correct functioning of the electricity sector.
Financial independence between activities open to competition and those that
are regulated. Sufficient regulatory oversight is acceptable for situations in
which the total separation of activities is not possible or inefficient.
4. Improvement of wholesale electricity market design.
In order to better integrate self-consumption and to compensate for flexibility by
creating a balanced playing field for all technologies, it is necessary to propose an
improvement in wholesale market design.
In order to achieve these objectives, it is necessary:
That the markets allow the realization of transactions as close as possible to
real time, in order to reward, among other things, the flexibility of resources.
To update the format of the offers in the market, with the aim of reflecting the
needs of new agents.
5. Increase the importance of cybersecurity.
The connection of self-consumption systems, the new intelligent applications and the
greater complexity in the electricity markets reinforce the importance of having
adequate cybersecurity systems.
For this:
Solid standards in terms of cybersecurity will be needed for all the devices
interconnected to the electricity network.
In addition, the rapid evolution of possible threats underscores the importance
of solutions being developed and implemented quickly and efficiently.
6. Cost savings through better use of self-consumption.
The value of self-consumption as a generation of photovoltaic origin and batteries,
enormously depends on the geographical location of the facilities.
That is why:
A standard value cannot be established for all distributed resources. Regulatory
initiatives of the "Value of solar" style are erroneous.
Each location where someone wants to deploy the distributed resources must
be analyzed individually.

Jesús Santiago Silvestre Bengoa 139
Photovoltaic and battery installations are more efficient if they are developed on
large scale. The small scale is not always the best option.
8.2. FUTURE INVESTIGATION LINES
“Energy Transition: Enabling Technologies for Demand Flexibility, Regulation &
Business Models” is a research that can be amplified in different terms:
The study of the enabling technologies for demand flexibility must be updated
as time goes by, regarding current prices, how do they fit into the electricity
market, and their impact on the market.
It would be needed to supervise the current regulation of different countries,
such as Asia (China and Japan mainly, and their impact on the market and give
recommendations to these measures. In addition, other future investigations
lines would be updating EU and USA’s regulation and verifying if they are doing
well in order to get maximum benefit of energy transition.
Finally, it would be a good option to complete the report with more business
cases that prove the cost saving that can be obtain with this market model. In
addition, up-to-date business cases would be analyzed to test the current
profitability of the investments in the market.

140 Escuela Técnica Superior de Ingenieros Industriales UPM

Jesús Santiago Silvestre Bengoa 141
9. IMPACT VALUATION. SOCIAL AND
PROFESSIONAL RESPONSIBILITY
9.1. SOCIO-ECONOMIC IMPACT
The energy transition that is analysed in this report directly impact in social and
economic issues because it covers the assembling of a new energy market through the
development of novel technologies with the objective of reaching a more stable, secure
and interconnected energy system.
The social and economic impacts can be segmented in four different issues:
First of all, the new market design will finish with the traditional vision of a
vertical system where suppliers generate the energy and the customers
consume it. With this new design demand size, it is every person that needs
energy, becomes active participant in the market. Now clients can generate
energy for self-consumption with rooftop PV, and can export energy to the
market when it is required.
Secondly, the technology innovations needed to develop the energy transition
are leading to a huge technologic growth that not just enables the new energy
market but enables many other areas of the society. Furthermore, as it was
exposed in the business cases, the vendors of these technologies can take
advantage of this situation which means a very profitable investment for them.
Thirdly, as it has been seen in the business cases savings to the grid are
ensured, this new model greatly reduce the costs of transmission due to the
decreasing in peak loads.
Finally, blackouts in the grid are greatly reduced due to the interconnection of
the network, the importance of demand flexibility that improves the parity
between generation and consumption. This follows to a more secure and
reliable electric grid.
9.2. ENVIRONMENTAL IMPACT
The generation of electrical energy involves the emission of different pollutants
depending on the type of power plant used, with the highest levels of pollutants being
the coal and combined cycle power plants.
In this type of power plants the generation of pollutants is mainly due to two causes:
On the one hand, the burning of fossil fuels causes gases such as: SOx, NOx,
CO2 and ashes. SOx and NOx that combined with water and oxygen give rise to
HNO3 and H2SO4, which are responsible for the nutrient impoverishment of the
soil and the change of the pH of the water due to its deposition of ions. This
effect has the name of acid rain. CO2 that cause the elevation of the average
temperature of the planet, the effect called greenhouse effect.

142 Escuela Técnica Superior de Ingenieros Industriales UPM
They also raise the temperature of the seas or reservoirs where they empty and
produce thermal changes in the liquids used in cooling systems.
Nevertheless, the new energy market is looking for a more eco-friendly generation
betting hard on renewable energy sources, even more, regulation, both in USA and EU,
is promoting this these generation with public subsidies and imposing taxes to certain
levels of pollution.
Currently electricity generation sources are distributed like it is shown in the following
graphs:
Figure 52: Electricity Generation Sources in USA 2017. [Source: U.S. Department of Energy.]
34%
30%
20%
6%
6% 1% 3%
Electricity Generation Sources in USA
Natural Gas Coal Nuclear Hydro Wind Biomass Other

Jesús Santiago Silvestre Bengoa 143
Figure 53: Electricity Generation Sources in EU 2016. [Source: European Commission.]
9.3. SOCIAL AND PROFESSIONAL RESPONSIBILITY
Taking as reference the Deontological Code of Industrial Engineers collected on its
official website, this work seeks to meet each of the ethical standards described in the
Code:
Independence: Manifesting objectivity and security in decision making.
Integrity and honesty: Behaving with honesty and diligence during the
performance of services.
Protection of society and the environment: Giving absolute priority to the safety,
health and well-being of society and customers, while seeking to achieve good
results while respecting sustainable development.
Responsibility: Showing a commitment to the actions and opinions given.
Truthfulness: Contrasting ideas and opinions.
Advertising: Showing a reliable image of the capabilities.
Knowledge dissemination: Providing new knowledge for the benefit of society.
Remuneration and fees: Being fair in terms of hours, work and quality.
47%
26%
12%
10%
3% 1% 1%
Electricity Generation Sources in EU
Combustible fuels Nuclear Hydro Wind Solar Geothermal Other

144 Escuela Técnica Superior de Ingenieros Industriales UPM

Jesús Santiago Silvestre Bengoa 145
10. PLANNING AND BUDGET
10.1. PLANNING
In a very first interaction with the tutor of this final grade project, Isabel Ortiz, the topic
was going to be an oil station construction project. The time schedule and first
information research was done, nevertheless, the author of this TFG began working in
Everis as a fellow focusing on different kinds of project with a common topic: Energy
business. That is the reason why this became a really interesting subject and with a lot
of potential in the near future, so the topic of the final grade project changed to “Energy
transition: Enabling Technologies for Demand Flexibility, Regulation &
Business Models”.
After that change, the author and the tutor got the ball rolling and the time schedule
was assembled in different stages:
1. Familiarization:
This stage can be considered as the one with the greatest time dedicated, since the
topic to be developed in this work requires a deep knowledge of it. This stage
represents the very first interaction with the topic, the main concepts of the energy
system were studied and understood.
This level is structured in the following way:
A general information research about the energy business and the energy
transition.
Selection of the most important information.
Reading and comprehension of the articles selected.
Structuration of the final degree project after having more knowledge about the
energy business and the energy transition.
Redaction of “Context”.
After that, a deeper research was done, to get general information about
enabling technologies and regulation.
2. Deeper research:
This stage continues the work done in the previous one but adds deepening to the
research, analysis of the actual energy system and first recommendation approach to
achieve the energy transition.
This stage is structured as follows:
Getting really interesting and important files from substantiated sources that
enable to achieve conclusions about the best technological options of each
case.
Analysing the official articles from USA and EU to understand the actual
regulation and offer recommendations that would allow the market to be more
secure, efficient and competitive.

146 Escuela Técnica Superior de Ingenieros Industriales UPM
Redaction of “Enabling technologies of Demand Flexibility” and “Regulatory
Framework”.
Finally, raising some interesting business cases that would prove the economic
profit of the energy transition.
3. Results and conclusions.
After having studied the previous stages, there is the enough preparation to provide
proper results, recommendations and conclusions.
Thus, this level is organized as follows:
Providing results to the raised business cases and giving recommendations and
conclusions about which is the best investment and why.
Redaction of “Business Cases”,
Analysing the whole project on balance and offering conclusions on this
investigation work.
4. Final report redaction.
After having developed the previous steps the different sections of the present report
are carried out. These chapters are those corresponding to the planning and budget,
evaluation of the social and environmental impact, etc.
Prior to the delivery of the report, a complete review of this work is made.
5. Trabajo Fin de Grado defence.
Prior to the TFG's own defence, a preparation of the same is required.
In the following table activities that have been done are shown:

Jesús Santiago Silvestre Bengoa 147
Activities Start date End date
Familiarisation 25/01/2018 31/03/2018
Everis proposal 25/01/2018 25/01/2018
Reunion with the tutor 27/01/2018 27/01/2018
Studying general knowledge about the energy
market 27/01/2018 15/02/2018
Structuring the project 10/02/2018 15/02/2018
Researching information 8/02/2018 20/03/2018
Selecting information 20/03/2018 25/03/2018
Redaction of “Context” 25/03/2018 31/03/2018
Deeper research 01/04/2018 19/06/2018
Analysing enabling technologies 01/04/2018 01/05/2018
Results and conclusions of enabling
technologies 01/05/2018 07/05/2018
Redaction of “Enabling technologies of
Demand Flexibility” 07/05/2018 17/05/2018
Analysing regulations 05/05/2018 05/06/2018
Results and conclusions of regulations 05/06/2018 12/06/2018
Redaction of “Regulatory Framework” 12/06/2018 19/06/2018
Results and Conclusions 01/07/2018 15/09/2018
Studying and reflecting on the researches 01/07/2018 25/07/2018
Researching and calculating business cases 15/07/2018 31/07/2018
Redaction of “Business cases” 31/07/2018 07/08/2018
Results and conclusions of the whole project 01/09/2018 15/09/2018
Final report redaction 15/09/2018 28/10/2018
Redaction of the rest of the sections 15/09/2018 25/09/2018
Revision 25/09/2018 31/10/2018
Summary in Spanish 20/09/2018 28/10/2018
TFG defence 15/11/2018 05/12/2018
TFG defence preparation 15/11/2018 04/12/2018
TFG defence 05/12/2018 05/12/2018
Table 25: TFG planning. [Source: Own.]

148 Escuela Técnica Superior de Ingenieros Industriales UPM
Figure 54: Gantt diagram. [Source: Own.]

Jesús Santiago Silvestre Bengoa 149
10.2. BUDGET
In order to estimate the costs incurred in carrying out the TFG, only the resources used
for their own development will be considered. The economic analysis will be divided
into two parts: costs of human resources and costs of material resources.
10.2.1. Costs of human resources
The cost estimate associated with the project's human resources is based on the tasks
specified and their duration in the temporal planning of the activities. An average salary
of 12€/h has been set for the student equivalent to the remuneration of a fellow at
Everis, 35€/h to the university tutor as a teacher and 35€/h to the Everis tutor as a
consultant.
Human Resources Hours Price(€)/Hour Total
Information research 136 12 1.632 €
Information analysis 176 12 2.112 €
Study, Results and Conclusions 176 12 2.112 €
Report redaction 216 12 2.592 €
Student costs 704 8.448 €
Research help 50 35 1.750 €
Guide in analysis 30 35 1.050 €
Revision 30 35 1.050 €
Everis tutor costs 110 3.850 €
Project help 10 35 350 €
Revision 30 35 1.050 €
University tutor costs 40 1.400 €
Human Resources Total Costs 13.698 €
Table 26: Human resources costs. [Source: Own.]
10.2.2. Costs of material resources
This section includes the price of research file licenses, the price of registration for 12
ECTS and the costs associated with printing and binding. It has been ruled out to
include costs that are difficult to quantify, such as electricity consumption, transport
costs or air conditioning in the workplace.

150 Escuela Técnica Superior de Ingenieros Industriales UPM
Material Resources Price(€) Amortization(€) Total
Software license (Office 2016) 149 50 50 €
Researches licenses 2000 500 500 €
Personal computer 1150 230 230 €
TFG registration 156 156 €
Printing and binding 70 70 €
Human Resources Total Costs 1.006 €
Table 27: Material resources costs. [Source: Own.]
10.2.3. Project final cost
Final cost of the TFG is calculated as the addition of the human resources and material
resources costs and the addition of a 21% of the IVA.
Budget Total
Human Resources 13.698 €
Material Resources 1.006 €
Cost without IVA 14.704 €
IVA (21%) 3.087,84 €
Total budget 17.791,84 €
Table 28: Project final costs. [Source: Own.]
Therefore, Final budget for the development of this Trabajo Fin de Grado is: 17.791,84 €.

Jesús Santiago Silvestre Bengoa 151
10. BIBLIOGRAPHY
1. 2013. La Operación del Sistema Eléctrico, Part 1. For Dummies.
2. 2013. La Operación del Sistema Eléctrico, Part 1. For Dummies.
3. 2013. La Operación del Sistema Eléctrico, Part 2. For Dummies.
4. 2014.2015. Europe 2020 strategy. European Commission.
5. Hancher, L, & Winters, B, M. 2017. The EU Winter Package. Allen & Overy LLC.
6. 2013. La Operación del Sistema Eléctrico, Part 1. For Dummies.
7. 2013. La Operación del Sistema Eléctrico, Part 2. For Dummies.
8. 2017. Manual de la Energía: Modelos regulatorios para garantizar la seguridad de
suministro eléctrico en españa. Energía y Sociedad.
9. 2017. Manual de la Energía: Insostenibilidad del sistema energético y vías de
solución. Energía y Sociedad.
10. 2016. California Solar Satatistics. CSI (California Solar Initiative).
11. 2016. Recent Facts about Photovoltaics in Germany. Fraunhofer ISE. Germany.
12. 2016. Global Energy Storage Database. DOE (Department of Energy).
13. Munsell, M. 2016. US CHP and Fuel Cell Capacity Set to Grow 11GW by 2026.
Greentech Media.
14. 2011. Assessing the Role of Distributed Power Systems in the U.S. Power Sector.
The Brookings Institution.
15. 2016. Global Wind Report: Annual Market Update 2015. Global Wind Energy
Council.
16. McAnany, J. 2016. 2015 Demand Response Operations markets Activity Report.
PJM.
17. 2016. 2015 State of the Market Report for PJM. Monitoring Analytics LLC.
18. McAnany, J. 2016. 2015 Demand Response Operations markets Activity Report.
PJM.
19. 2016. How many smart meters are installed in the United States?. EIA.
20. 2016. Smart metering deployment in the European Union. European Commission.
21. 2016. 50 States of Solar. North Carolina Clean Energy Technology Center.
22. 2016. Analysis of the Cyber Attack on the Ukrainian Power Grid. Electricity-ISAC
and SANS Industrial Control Systems.
23. 2016. Wind adds the most electric generation capacity in 2015, followed by natural
gas and solar. EIA.
24. 2016. The future arrives for five clean energy technologies. US DOE.
25. 2017. New energy outlook 2016 .BNEF.
26. 2016. Renewables Global Status Report. REN21.

152 Escuela Técnica Superior de Ingenieros Industriales UPM
27. 2016. Global Trends in Renewable Energy investment. Frankfurt School.
28. 2014. Why Europe’s big energy companies fear change. Greenpeace.
29. 2014.2015. Europe 2020 strategy. European Commission.
30. Ackermann, T. & Andersson, G. & Söder, L. 2001. Distributed Generation. Electric
Power System Research.
31. 2017. Photovoltaics report. Fraunhofer ISE.
32. Feldman, D. & Hoskins, J. & Margolis, R. 2018. Solar Industry Update. NREL.
33. 2017. Lithium-ion Battery Costs and Market. BNEF.
34. Ikäheimo, Evens & Kärkkäinen. 2010. Definition of aggregator.
35. 2015. Battery Storage for Renewables: Market Status and Technology Outlook.
International Renewable Energy Agency.
36. Linden, D. and Reddy, T. B. 2002. Handbook of Batteries. McGraw-Hill.
37. Lu, X., Lemmon, J. P., Sprenkle, V. and Yang, Z. 2010. Sodium-beta alumina
batteries: Status and challenges. DOI: 10.1007/s11837-010-0132-5. The Journal
of The Minerals, Metals & Materials Society (TMS).
38. Lu, X., Xia, G., Lemmon, J. P. and Yang, Z. 2010. Advanced materials for sodium-
beta alumina batteries: Status, challenges and perspectives. DOI:
10.1016/j.jpowsour.2009.11.120. Journal of Power Sources.
39. Díaz-González, F., Sumper, A., Gomis-Bellmunt, O. and Villafáfila-Robles, R.
2012. A review of energy storage technologies for wind power applications. DOI:
10.1016/j.rser.2012.01.029. Renewable and Sustainable Energy Reviews.
40. Benato, R., Cosciani, N., Crugnola, G., Dambone Sessa, S., Lodi, G.,
Parmeggiani, C. and Todeschini, M. 2015. Sodium nickel chloride battery
technology for large-scale stationary storage in the high voltage network. DOI:
10.1016/j.jpowsour.2015.05.037. Journal of Power Sources.
41. Weber, A. Z., Mench, M. M., Meyers, J. P., Ross, P. N., Gostick, J. T. and Liu, Q.
2011. Redox flow batteries: a review. DOI: 10.1007/s10800-011-0348-2. Journal
of Applied Electrochemistry.
42. Li, B. and Liu, J. 2017. Progress and directions in low-cost redox flow batteries for
large-scale energy storage. DOI: 10.1093/nsr/nww098. National Science Review.
43. 2017. German redox flow battery - a game changer for energy storage?. Engerati.
44. Scrosati, B. and Garche, J. 2010. Lithium batteries: status, prospects and future.
DOI: 10.1016/j.jpowsour.2009.11.048. Journal of Power Sources.
45. Krause, L. J., Jensen, L. D. and Chevrier, V. L. 2017. Measurement of Li-Ion
Battery Electrolyte Stability by Electrochemical Calorimetry. DOI:
10.1149/2.1651704jes. Journal of The Electrochemical Society.

Jesús Santiago Silvestre Bengoa 153
46. i-deals. 2017. Technological and technical opportunities approach in the new
downstream.
47. Su, W., Xu, K., Zhong, G., Wei, Z., Wang, C. and Meng, Y. 2017. Enhanced
Electrochemical Performance of LiFePO4 as Cathode for Lithium Ion Battery by
Codoping with Titanium and Nitrogen. DOI: 10.20964/2017.08.13. International
Journal of Electrochemical Science.
48. Soto, F. A., Ma, Y., Martinez de la Hoz, J. M., Seminario, J. M. and Balbuena, P.
B. 2015. Formation and Growth Mechanisms of Solid-Electrolyte Interphase
Layers in Rechargeable Batteries. DOI: 10.1021/acs.chemmater.5b03358.
Chemistry of Materials.
49. BNEF. 2017. Lithium-ion battery costs & market.
50. 2017. Electric Vehicle Outlook 2017. BNEF.
51. 2017. Electric Vehicle Outlook 2017. BNEF.
52. 2017. Digitalisation and energy. EIA.
53. Zhang, J. & Markel, T. 2016. Charge Management Optimization for Future TOU
Rates. NREL.
54. Uddin, K. & Al. 2017. On the possibility of extending the lifetime of lithium-ion
batteries through optimal V2G facilitated by an integrated vehicle and smart-grid
system. The University of Warwick.
55. Wang & Al. 2016. Journal of Power Sources: Quantifying electric vehicle battery
degradation from driving vs. vehicle-to-grid services. Harvard.
56. 2017. Digitalisation and energy. EIA.
57. 2017. Digitalisation and energy. EIA.
58. 2016. Utility of the Future. MIT.
59. 2016. Utility of the Future. MIT.
60. Sachin Thakur* and Sunny Vig. 2017. Distributed Generation Technologies, Cost
Analysis and Power Quality Issues. Chandigarh University.
61. Lucian Ioan Dulău, Mihail Abrudean, Dorin Bică. 2013. Distributed generation
technologies and optimization. ScienceDirect.
62. 2018. Technological and technical opportunities approach in the new downstream.
i-deals.
63. 2018. Technological and technical opportunities approach in the new downstream.
i-deals.
64. 2017. Renewable Capacity Statistics. Irena.
65. 2017. Renewable Capacity Statistics. Irena.
66. 2017. Renewable Capacity Statistics. Irena.
67. 2017. Photovoltaics report. Fraunhofer. ISE.

154 Escuela Técnica Superior de Ingenieros Industriales UPM
68. 2016. Utility of the Future. MIT
69. 2017. Wind turbines: current status, obstacles, trends and technologies, 20th
Innovative Manufacturing Engineering and Energy Conference 2017. Global Wind
Energy Council (GWEC).
70. 2017. Wind turbines: current status, obstacles, trends and technologies, 20th
Innovative Manufacturing Engineering and Energy Conference 2017. IOP.
71. 2017. Wind turbine configurations. ResearchGate.
72. 2017. Horizontal Axis Wind Turbines Advantages and Disadvantages. GWEC.
73. 2017. Horizontal Axis Wind Turbines Advantages and Disadvantages. GWEC.
74. 2017. Cost of Wind Energy Review: Enabling the SMART Wind Power Plant of the
Future through Science-Based Innovation. NREL.
75. 2014. Technology impact estimation for 2025. KIC Innoenergy.
76. 2018. Cost projections for onshore wind power for 2025. IRENA.
77. 2017. Wind Power LCOE’s prediction. Berkeley Lab.
78. 2017. A brief guide to the Airborne Wind Turbine market. Green Tech Media.
79. 2015. Piezoelectric Wind Turbine. Research Gate.
80. Wang & Al. 2016. Journal of Power Sources: Quantifying electric vehicle battery
degradation from driving vs. vehicle-to-grid services. Harvard.
81. Leuschner, P. & Stroher, N. 2016. Market Data: Home Energy Management.
Navigant Research.
82. Ehrhardt-Martinez, K. & Donnelly, A. 2010. Advanced Metering Initiatives and
Residential Feedback Programs: A Meta-Review for Household Electricity-Saving
Opportunities. Smart Grid.
83. 2015. Energy Savings from the Nest Learning Thermostat: Energy Bill Analysis
Results. Nest.
84. Sookyung, C. & Talon, C. 2017. Market Data: Building Energy Management
Systems. Navigant Research.
85. Funicello-Paul, L. 2017. Virtual Power Plant Implementation Spending Expected to
Reach $2.1 Billion Annually by 2025. Navigant Research.
86. Funicello-Paul, L. 2017. Virtual Power Plant Implementation Spending Expected to
Reach $2.1 Billion Annually by 2025. Navigant Research.
87. Ran Kim, S. & Horn, A. 1999. Regulation Policies Concerning Natural Monopolies
in Developing and Transition Economies. DESA.
88. 2012. Energy Primer: A handbook of Energy Market Basics. FERC.
89. Lamoureux & Marcel A. 2011. FERC´s Impact on Electric Utilities. IEEE.
90. Merrill, Hyde, M. 2000. The RTO Debate. IEEE.
91. 2016. ISO/RTO Council. NYISO.

Jesús Santiago Silvestre Bengoa 155
92. 2016. FERC Order 1000 Implementation. PJM.
93. 2018. U.S. Electricity Grid & Markets. Green Power Partnership.
94. 2006. Benefits of Demand Response in Electricity Markets and Recommendations
for Achieving Them: A Report to the United States Congress Pursuant to Section
1252 of the Energy Policy Act of 2005. DOE. Washington DC, United States.
95. Assessment of Demand Response & Advanced Metering. FERC. Washington DC,
United States.
96. 2016. Demand Response. PJM
97. Hurley, Doug & Al. Demand Response as a Power System Resource. Regulatory
Assistance Project.
98. Dyson, Mark & Kelly I. 2016. Demand Response Wins: U.S. Supreme Court
Upholds FERC Order 745. RMI Outlet Blog.
99. Paulos & Bentham. 2014. FERC Order 745 and the Epic Battle between Electricity
Supply and Demand. POWER Magazine.
100. 2010. Analysis of the 2013/2014 RPM Base Residual Auction Revised and
Updated. Monitoring Analytics.
101. Ela, E. & Milligan, M. & Al. 2014. Evolution of the Wholesale Electricity Market
Design with Increasing Levels of Renewable Generation. NREL.
102. Lew, D. & Brinkman, G. 2013. The Western Wind and Solar Integration Study
Phase 2. NREL.
103. 2011. The Role of Electricity Markets and Market Design in Integrating Solar
Generation. DOE.
104. 2015. Renewable Energy on the Grid: Redefining what´s Possible. NREL.
105. Richts & Al. 2015. India Green Energy Corridors: Report on Forecasting, Concept
of Renewable Energy Management Centres and Grid Balancing. GIZ. Bonn,
Germany.
106. 2014. Technical and Commercial Due Intelligence: Estudio de mercados
potenciales. i-deals.
107. 2014. Technical and Commercial Due Intelligence: Estudio de mercados
potenciales. i-deals.
108. Pedraza, M. 2015. Electrical Energy Generation in Europe. Springer. ISBN 978-
3-319-16083-2.
109. 2016. Winter Package, Part 1, v8 & v9. Cordis. Bruselas. Bélgica.
110. 2016. Winter Package, Part 1, v7 & v16. Cordis. Bruselas. Bélgica.
111. 2016. Winter Package, Part 1, v7 & v9. Cordis. Bruselas. Bélgica.
112. Cristian Reche. 2018. España da la espalda al sol en pleno auge de las
renovables. Economía digital.

156 Escuela Técnica Superior de Ingenieros Industriales UPM
113. 2017. Directive of the European parliament and of the council. European
Commission.
114. 2016. Proposal for a DIRECTIVE OF THE EUROPEAN PARLIAMENT AND OF
THE COUNCIL on the promotion of the use of energy from renewable sources
(recast), doc 1, Article 15. EUR-LEX.
115. 2016. Proposal for a DIRECTIVE OF THE EUROPEAN PARLIAMENT AND OF
THE COUNCIL on the promotion of the use of energy from renewable sources
(recast), doc 1, Article 6. EUR-LEX.
116. 2016. Proposal for a DIRECTIVE OF THE EUROPEAN PARLIAMENT AND OF
THE COUNCIL on the promotion of the use of energy from renewable sources
(recast), doc 1, Article 27. EUR-LEX.
117. 2016. Proposal for a DIRECTIVE OF THE EUROPEAN PARLIAMENT AND OF
THE COUNCIL on the promotion of the use of energy from renewable sources
(recast), doc 1, Article 5. EUR-LEX.
118. 2016. REPORT FROM THE COMMISSION Final Report of the Sector Inquiry on
Capacity Mechanisms. European Commission. Brussels, Belgium.
119. 2016. Proposal for a Regulation of the European Parliament and of the Council
on the internal market for electricity (recast), Article 32. European Commission.
Brussels, Belgium.
120. 2016. Proposal for a Regulation of the European Parliament and of the Council
on the internal market for electricity (recast), Article 38. European Commission.
Brussels, Belgium.
121. 2017. COMMISSION REGULATION (EU) 2017/2195 establishing a guideline on
electricity balancing. European Commission.
122. 2016. Proposal for a Regulation of the European Parliament and of the Council
on the internal market for electricity (recast), Article 36. European Commission.
Brussels, Belgium.
123. 2016. Proposal for a Regulation of the European Parliament and of the Council
on the internal market for electricity (recast), Article 16. European Commission.
Brussels, Belgium.
124. 2016. Proposal for a Regulation of the European Parliament and of the Council
on the internal market for electricity (recast), Article 5. European Commission.
Brussels, Belgium.
125. 2016. Proposal for a Regulation of the European Parliament and of the Council
on the internal market for electricity (recast), Article 24. European Commission.
Brussels, Belgium.

Jesús Santiago Silvestre Bengoa 157
126. 2016. Proposal for a Regulation of the European Parliament and of the Council
on the internal market for electricity (recast), Article 17. European Commission.
Brussels, Belgium.
127. 2016. Proposal for a Regulation of the European Parliament and of the Council
on the internal market for electricity (recast), Article 13. European Commission.
Brussels, Belgium.
128. Mack, A. & Martén, I. 2013. The European Power Sector. BCG.
129. Bronki, P & Dyson, M. 2015. The Economics of Demand Flexibility. Rocky
Mountain.
130. 2015. Customer Generation Price Plan for Residential Service. Salt River Project
E-27.
131. Docket 2011-0206, Order 32053, 46–47 and 54. Hawaii Public Service
Commission.
132. Jaffe, M. 2015. Cost of solar power vexing to Colorado system owners, electric
co-ops. The Denver Post.

158 Escuela Técnica Superior de Ingenieros Industriales UPM

Jesús Santiago Silvestre Bengoa 159
11. FIGURES INDEX
Figure 1: Objectives. [Source: Own.] ........................................................................ 36
Figure 2: Electric demand curve. [Source: REE.] ...................................................... 43
Figure 3: Evolution of global primary energy consumption. [Source: World Energy
Outlook 2012.] .......................................................................................................... 45
Figure 4: Projected evolution of oil demand in thousands of barrels per day and oil
prices in dollars per barrel. [Source: World Energy Outlook 2012.] ........................... 46
Figure 5: Green Powerhouse. [Source: REN21.] ...................................................... 50
Figure 6: Renewable energy proportion of power generation, 2006-2016. [Source:
Bloomberg.] .............................................................................................................. 51
Figure 7: c-Si PV systems in Phoenix, Arizona. [Source: NREL.] .............................. 54
Figure 8: LCOEs of NY solar PV installations of various scales. [Source: SIEMENS]55
Figure 9: Lead acid batteries. Cost and markets to 2030. [Source: IRENA.] ............. 59
Figure 10: NaS battery. [Source: ISEA.] ................................................................... 60
Figure 11: High temperature batteries. [Source: IRENA.] .......................................... 60
Figure 12: VRFB operation mechanism. [Source: Research Gate.] .......................... 61
Figure 13: Flow batteries. [Source: IRENA.] ............................................................. 63
Figure 14: Operating principle of a lithium ion battery. [Source ISEA.] ...................... 64
Figure 15: Lithium ion batteries. [Source: IRENA.] .................................................... 66
Figure 16: Lithium-ion Battery Costs and Market. July 2017. [Source: Bloomberg New
Energy Finance.] ...................................................................................................... 67
Figure 17: Example of a Smart Home with several DERs and Data Management.
[Source: MIT.] ........................................................................................................... 73
Figure 18: Cumulative energy savings in the Building sector from digitalization to
2040. [Source: IEA.] ................................................................................................. 74
Figure 19: The Impact of Flexible Demand and Battery Cost on Battery Profitability in
NY. [Source: MIT.] .................................................................................................... 75
Figure 20: The Impact of Flexible Demand and Battery Cost on Battery Profitability in
Texas. [Source: MIT.] ............................................................................................... 75
Figure 21: Solar PV percentage of global annual production. [Source: Fraunhofer
ISE.] ......................................................................................................................... 78
Figure 22: Efficiency comparison of solar PV technologies 2018. [Source: Fraunhofer
ISE.] ......................................................................................................................... 79
Figure 23: Impact of Distributed Solar PV on Network Cost with Different Levels of
Energy Storage. [Source: MIT.] ................................................................................ 80
Figure 24: Global cumulative installed wind capacity 2001-2016. [Source: GWEC.] . 82

160 Escuela Técnica Superior de Ingenieros Industriales UPM
Figure 25: Wind turbine configurations. [Source: ResearchGate.] ............................. 82
Figure 26: On-shore wind Power CAPEX breakdown. [Source: NREL.] .................... 85
Figure 27: On-shore vs Off-Shore CAPEX. [Source: ETSII UPM.] ............................ 87
Figure 28: Wind Power LCOE’s prediction. [Source: Berkeley Lab.] ......................... 88
Figure 29: Home Energy Management System. [Source: NC State University.]........ 91
Figure 30: Building Energy Management System. [Source: EcoPower.] ................... 93
Figure 31: Virtual Power Plant. [Source: Natural Resources Canada.] ...................... 95
Figure 32: North American power grid´s interconnections. [Source: NERC.] ............. 97
Figure 33: Wholesale Electric Power Markets. [Source: Federal Energy Regulatory
Commission.] ............................................................................................................ 99
Figure 34: Retail Electric Power Markets. [Source: Federal Energy Regulatory
Commission.] .......................................................................................................... 100
Figure 35: Hypothetical Generation Load. [Source: NREL.] .................................... 101
Figure 36: Aggregation of Solar PV plants. [Source: NREL.] .................................. 103
Figure 37: Effects of forecast lead time and dispatch schedule on reserve
requirements. [Source: NREL.] ............................................................................... 103
Figure 38: Organization of the European electricity market. [Source: Springer.] ..... 109
Figure 39: Winter Package. Energy value chain. [Source: Allen & Overy LLC.] ...... 110
Figure 40: Case 1 Results: Annual Supply Costs. [Source: Rocky Mountain.] ........ 126
Figure 41: Case 1 Results: Shifting Loads to Lower-Cost Hours. [Source: Rocky
Mountain.]............................................................................................................... 126
Figure 42: Case 1 Results: Demand Flexibility Strategies. [Source: Rocky Mountain.]
............................................................................................................................... 127
Figure 43: Case 2 Results: Annual Supply Costs. [Source: Rocky Mountain.] ........ 129
Figure 44: Case 2 Results: Monthly Peak Reductions. [Source: Rocky Mountain.] . 129
Figure 45: Case 2 Results: Demand Flexibility Strategies. [Source: Rocky Mountain.]
............................................................................................................................... 130
Figure 46: Case 3 Results: Annual Supply Costs. [Source: Rocky Mountain.] ........ 131
Figure 47: Case 3 Results: On-Site Consumption of Solar PV. [Source: Rocky
Mountain.]............................................................................................................... 132
Figure 48: Case 3 Results: Demand Flexibility Strategies. [Source: Rocky Mountain.]
............................................................................................................................... 132
Figure 49: Case 4 Results: Annual Supply Costs. [Source: Rocky Mountain.] ........ 135
Figure 50: Case 4 Results: On-Site Consumption of Solar PV. [Source: Rocky
Mountain.]............................................................................................................... 135
Figure 51: Case 4 Results: Demand Flexibility Strategies. [Source: Rocky Mountain.]
............................................................................................................................... 136

Jesús Santiago Silvestre Bengoa 161
Figure 52: Electricity Generation Sources in USA 2017. [Source: U.S. Department of
Energy.] .................................................................................................................. 142
Figure 53: Electricity Generation Sources in EU 2016. [Source: European
Commission.] .......................................................................................................... 143
Figure 54: Gantt diagram. [Source: Own.]............................................................... 148

162 Escuela Técnica Superior de Ingenieros Industriales UPM

Jesús Santiago Silvestre Bengoa 163
12. TABLES INDEX
Table 1: Enabling Technologies for Flexibility of Electricity Demand. [Source: Own.] 56
Table 2: Advantages and disadvantages of flooded batteries. [Source: International
Energy Agency.] ....................................................................................................... 58
Table 3: Advantages and disadvantages of valve regulated batteries. [Source:
International Renewable Energy Agency.] ................................................................ 59
Table 4: VRFB advantages and disadvantages. [Source: National Science Review.] 62
Table 5: ZRFB advantages and disadvantages. [Source: National Science Review.] 63
Table 6: NCA advantages and disadvantages. [Source: Navigant Research.] .......... 64
Table 7: NMC advantages and disadvantages. [Source: Navigant Research.] ......... 65
Table 8: LFP advantages and disadvantages. [Source: Navigant Research.] ........... 65
Table 9: LTO advantages and disadvantages. [Source: Navigant Research.] ........... 66
Table 10: Impacts of three charging methods (per charge event). [Source: NREL,
WEVA.] ..................................................................................................................... 68
Table 11: V1G & V2G. [Source: University of Warwick.] ........................................... 70
Table 12: Horizontal Axis Wind Turbines Advantages and Disadvantages. [Source:
GWEC.] .................................................................................................................... 83
Table 13: Vertical Axis Wind Turbines Advantages and Disadvantages. [Source:
GWEC.] .................................................................................................................... 84
Table 14: Electricity balancing market products in Germany. [Source: SEDC.] ....... 116
Table 15: Electricity balancing market products in United Kingdom. [Source: SEDC.]
............................................................................................................................... 118
Table 16: Electricity balancing market products in France. [Source: SEDC.] .......... 119
Table 17: Case 1 facts. [Source: Rocky Mountain.] ................................................ 125
Table 18: Case 1 results. [Source: Rocky Mountain.] ............................................. 125
Table 19: Case 2 Facts. [Source: Rocky Mountain.] ............................................... 128
Table 20: Case 2 Results. [Source: Rocky Mountain.] ............................................ 128
Table 21: Case 3 Facts. [Source: Rocky Mountain.] ............................................... 131
Table 22: Case 3 Results. [Source: Rocky Mountain.] ............................................ 131
Table 23: Case 4 Facts. [Source: Rocky Mountain.] ............................................... 134
Table 24: Case 4 Results. [Source: Rocky Mountain.] ............................................ 134
Table 25: TFG planning. [Source: Own.] ................................................................. 147
Table 26: Human resources costs. [Source: Own.] ................................................. 149
Table 27: Material resources costs. [Source: Own.] ................................................ 150
Table 28: Project final costs. [Source: Own.] .......................................................... 150

164 Escuela Técnica Superior de Ingenieros Industriales UPM