Dashboard of Energy Transition - ENGIE
132
Dashboard of Energy Transition Group Strategy Department Published in november 2021 2021 Edition
-
Upload
khangminh22 -
Category
Documents
-
view
2 -
download
0
Transcript of Dashboard of Energy Transition - ENGIE

Dashboard of Energy Transition
Group Strategy DepartmentPublished in november 2021
2021 Edition


3
Foreword
The Energy Transition Dashboard replaces “A World of Energy”
The energy transition is an imperative for ENGIE, placed at the heart of its strategy, with a commitment to carbon neutrality for all of its activities by 2045.
The climate challenges dictating this strategy extend far beyond the company’s scope and are a matter for the whole of humanity. With this report we offer a detailed update on energy transition and a description of what still needs to be done to meet global environmental requirements.
After an unprecedented economic crisis in 2020, year 2021 saw mounting pressure on the energy market in a context of strong economic recovery and increasingly urgent climate obligations. Although the COP26 commitments were the most ambitious ever made and renewable energy economics are falling into place, CO2 emissions hit new records as a conse-quence of renewed fossil fuel consumption, notably of coal. Massive though they are, most of the pandemic-related recovery plans earmark only modest sums for green investment, des-pite its proven resilience during the crisis. The European Union was a conspicuous exception with its ‘Fit for 55’ package’, an exemplary environmental policy. But this has created issues of its own, both for external partners and for domestic consumers unhappy with higher energy bills.
The headwinds hampering energy transition reflect the inertia of the existing energy model and the difficulty of changing it. The fact is that current investment is far from sufficient to reach carbon neutrality by the middle of the century, a target that an increasing number of states and companies have adopted in the face of the evidence of climate emergency provided in the 6th IPPC report.
The priorities are more investment in decarbonised energy and energy efficiency, a rapid phase-out of coal, developing and making economically viable new renewable sectors such as biogas and hydrogen or last resort alternatives such as CCUS, resolving the shortcomings of a higher proportion of intermittent energy and integrating energy systems, and dealing with public reticence around local renewables installations. These are the challenges for businesses in this sector, and they will be unable to overcome them without tough environ-mental policies and profound changes in individual and social behaviour.
Based on our expertise on energy and climate trends, and with the support of leading insti-tutions such as the International Energy Agency and Enerdata that offer their views on current developments, we share here our analysis of the many dimensions of energy transition and compare them with environmental objectives.
I hope this report contributes to a better understanding of the scale of our energy challenges and proves useful to you and your work.
Charlotte Roule
Director of Group Strategy, ENGIE

4
ENGIE in brief
4
Our group is a global reference in low-carbon energy and services. Together with our 170,000 employees, our customers, partners and stakehol-ders, we are committed to accelerate the transition towards a carbon-neutral world, through reduced energy consump-tion and more environmentally-friendly solutions. Inspired by our purpose (“rai-son d’être”), we reconcile economic per-formance with a positive impact on people and the planet, building on our key businesses (gas, renewable energy, services) to offer competitive solutions to our customers.
Turnover in 2020: 55.8 billion Euros. The Group is listed on the Paris and Brussels stock exchanges (ENGI) and is represented in the main financial indices (CAC 40, DJ Euro Stoxx 50, Euronext≈100, FTSE Eurotop 100, MSCI Europe) and non-financial indices (DJSI World, DJSI Europe and Euronext Vigeo Eiris - World 120, Eurozone 120, Europe 120, France 20, CAC 40 Governance).
IN 2020
170,000employees
€55.8billion revenue
101 GW GW installed power generation capacity
13 GW installed wind and solar capacity (at 100%)
€190million spent on R&D
€4 billion growth investment
€12billion green bonds issued since 2014

55
TARGETS FOR 2030
58 % of renewables in our energy mix
52 %reduction in CO2 emissions per kWh of electricity
produced compared to 2017
34 %reduction in CO2 emissions from the use of
products sold by the Group compared to 2017
35 % reduction in water consumption by industrial
activities (compared with 2019)
50 %of women in Group management
100 % of employees trained
+10 % apprentices in Europe
TARGET FOR 2045
Net zero on all 3 scopes

66
RENEWABLE ENERGY
€3 bn of revenues
1st produceur of onshore wind and solar power in France
+3 to 4 GW additional renewable capacity targeted per year
between 2022-25
GAS
Historical leader in gas marketing in France
1st operator of gas infrastructure in Europe with a portfolio including transmission
networks, distribution networks, storage and LNG terminals
Among the leading sellers and importers of gas in Europe
1st operator of gas infrastructure in Europe with a portfolio comprising transport
networks, distribution networks, storage and LNG terminals
1st green hydrogen injection demonstrator in the gas distribution network in France
Target of 10% green gas injected into the networks by 2030
2020 2023 2025 2030
40
2012
4
Biomethane to reach (in TWh)
10 % of gas mix in France by 2030Capacities connected to ENGIE Networks in France
In 2020
Hydro 21.2 GW
61 %
Other RES 0.4 GW
1%Solar 3.1 GW
9%
Wind 10.1 GW
29 %35 GW
of renewable installed capacity
(@100%)

7
Contents
9
Post-Covid context
27
CO2 & Climate
45
Decarbonization
63
Electricity & Electrical renewables
83
Natural gas & Renewable gases
99
Oil
107
Coal
119
Appendix Conversions . . . . . . . . . . . . . . p.120
Glossary . . . . . . . . . . . . . . . . . p.122
Data sources & Methodology . . . . . . . . . . . p.126
Geographical scope of the sources . . . . . . . . . . . . p.127
Contacts . . . . . . . . . . . . . . . . . p.130


9
POST-COVID CONTEXT
World economy . . . . . . . . . . . . . . . . . . . . . . . . 10
Green recovery plans . . . . . . . . . . . . . . . . . . . . 14
Investment in the energy sector . . . . . . . . . . 18
Energy balance . . . . . . . . . . . . . . . . . . . . . . . . . 21
9
ECONOMY
Recovery plans, a missed opportunity for most world economies to invest in green growth
ENERGY
The Covid-19 crisis galvanised the development of renewable energy but did not reduce the importance of coal in power generation
Post-Covid context2020 review and 2021 outlook

10
POST-COVID CONTEXT
The Covid-19 pandemic sent the world economy into severe recession in 2020. GDP contracted 3.8%, which was the worst decline since the Great Depression in the 1930s. Nearly all countries reported lower output, although there were regional differences: Latin America was particularly badly affected and Asia relatively unscathed. Major differences in geographic and sector performances have been a notable feature of this crisis. The worst-af-fected economies have been those that imposed the most drastic and lengthy lockdowns and are heavily reliant on services, particularly tourism. Other factors include the degree of openness and vaccine efficiency. Government support for productive capacity – furlough, direct payments, household tax credits, deferral of social security contributions, guaranteed loans for businesses, etc. – only comes into play when recovery is under way.
After an unprecedented dip during the first half of 2020, the world economy quickly resumed growth in the third quarter. Spectacular though it was, this rebound was not enough to offset the loss of activity recorded at the beginning of the year. Fuelled by consu-mer spending when many businesses reopened during the summer, it soon faded when the second wave of the pandemic struck in the autumn. At the end of 2020, household consump-tion was still 4.5% lower than it had been before the pandemic.
A multi-speed recovery. China renewed with pre-Covid activity levels even before the end of 2020. GDP rose 2.3% over the year as a whole, boosted by aggressive fiscal measures, an upturn in manufacturing and construction and looser restrictions. For many Asia-Pacific coun-tries, such as South Korea (-1%), the drop in output was limited by efficient containment mea-sures, government assistance and a rebound in manufacturing at regional level. In the USA, vigorous budgetary stimulus (13% of GDP) and financial assistance quickly bolstered activity, although momentum faded into year-end. In contrast, recovery was slower in the major European economies, where successive waves of the pandemic caused massive disruption and reduced working hours in the service sector.
The economic outlook brightened considerably in 2021, thanks to the deployment of efficient vaccines, the announcement of additional stimulus measures in some countries and economies adapting to anti-Covid measures, which themselves were better targeted. The Delta variant is spreading fast but does not pose a major risk, and the world’s engines of growth remain very robust.
World GDP growth forecasts converge around 6% in 2021 and 4.5% in 2022, with a recovery in services taking over from a manufacturing sector that has stopped accelerating but is still in good shape. These expectations are also bolstering financial and commodity markets: long-term government bond yields and oil prices have resumed their pre-pandemic levels.
Fiscal and monetary policies remain very accommodating and risks associated with the fourth wave of the pandemic will encourage central banks to adopt a wait-and-see approach to normalisation.
World economyThe world economy reacted very promptly to the Covid-19 shock, but has emerged with deeper divisions and renewed questions over its growth model
WORLD ECONOMIC OUTLOOK IN JULY 2021GROWTH PROJECTION BY REGION (IN %)
World United-States
Emerging countries and developing countries in Asia
2020 2021 2022
Zone Euro
Latin America and the Caribbean
Middle-East and Central Asia
Sub-Saharan Africa
2020 2021 2022 2020 2021 2022 2020 2021 2022
2020 2021 2022 2020 2021 2022 2020 2021 2022
-0.9
7.5 6.4
-2.64 3.7
-6.5 4.6 4.3-3.5
74.9
-75.8
3.2 -1.83.4 4.1
-3.26 4.9
Source: IMF, july 2021
11
POST-COVID CONTEXT
World economyAlthough exceptional, the world economic recovery in 2021 has been neither robust nor homogeneous. Access to vaccines has been the key factor
Growth is threatened by significant uncertainty, starting with a high level of conta-mination in mid-2021 and fears of the virus mutating into vaccine-resistant forms. The pace of vaccination is key to containing the pandemic and therefore economic activity. It has varied across the world: by August, the share of the fully vaccinated in the total population was 60% in Israel, France, the EU and Canada, 50% in the USA, 20% in Brazil and Russia, 15% in China, 9% in India, close to nil in Africa and 15% worldwide.
Risks related to inflationary pressures and both private and public debt Inflation has been accelerating since the spring in some economies (emerging countries, USA), as a result of a strong rise in commodity and freight prices, supply chain pressures and prices returning to normal in sectors that had been severely hit by the crisis.The high corporate debt level, equivalent to that of the 2008 financial crisis, is a matter of concern for all economies. Public debt has soared (+17% worldwide in 2020), particularly in emerging countries, where it could translate into in higher borrowing costs, tighter credit conditions and depreciating currencies. In advanced economies, debt looks sustainable as its cost remains low.
Uncertainty related to the use of household savings. Government support for household disposable income in 2020 led to a strong build-up in savings in advanced economies. Additional savings, excluding precautionary savings, are set to reach 9% of disposable income in Germany, nearly 15% in the UK and 16% in the USA by end-2021. The outlook for the world economy will depend heavily on the use of these accumulated ‘Covid savings’. Using or not using only a fifth of it would represent a 2% of GDP differential in 2022 for these countries (source: OFCE, Policy Brief 84, April 2021).
Significant disparities in the recovery process is widening income gaps between countries. According to the World Bank, nine rich countries out of ten will have resumed their pre-pandemic level of activity by 2022, while two thirds of poor and developing countries will labour under slower and longer recoveries. Penalised by a lack of vaccines, inflation and insufficient fiscal stimulus, Africa is expected to record a mere 2.8% growth in 2021, the Middle East and North Africa 2.4% and low-income countries none at all.
In the USA, GDP growth* will be close to 7% in 2021 before easing to 3.6% in 2022. Economic activity and the labour market are both strong as a result of exceptionally large fiscal stimulus (15% of GDP) and vaccination campaigns. Investment, notably in housing, is supported by an accommodating monetary policy, and private consumption is benefiting from falling savings rates.
In the eurozone, manufacturing activity is benefiting from vigorous external demand and furlough measures that protected jobs. Although new restrictions weighed on recovery over the first quarter of 2021, activity picked up over the second quarter and should continue to do so until year-end as vaccination rates rise. GDP growth is expected to reach 5.5% in 2021 and 5.2% in 2022. These favourable forecasts rely on household consumption, continued easy financial conditions, the release of EU funds from the Next Generation EU plan and the end of Covid restrictions.
China will remain on its fast growth track at 8.5% in 2021 and 6% in 2022 according to the IMF. This will stem from exports, real estate and an accommodating monetary policy, and even though some elements of budgetary stimulus will be scaled down. Progress to rebalance the Chinese economy towards services and private consumption was interrupted by the pan-demic and should resume.
* Sources: OECD, May 2021; SOCOFI “Les cahiers verts de l’économie”, august 2021

12
POST-COVID CONTEXT
WORLD: NEW CASES OF COVID-19, IN THOUSANDS
COMMODITY PRICES (ANNUAL VARIATION IN %)
CORRELATION BETWEEN ECONOMIC GROWTH AND SEVERITY OF CLOSUREGDP GROWTH IN THE FIRST QUARTER OF 2020, IN %
HOUSEHOLDS SAVING RATE IN 2020-2021IN % OF GROSS DISPOSABLE INCOME
Source: Refinitiv Datastream, les cahiers vert de l'économie
Source: Refinitiv Datastream, les cahiers vert de l'économie
Source: Calcul OFCE
World Asia Pacific Middle East /North Africa Sub-Saharan Africa Latin America North America Europe
Energy Raw materials Industrial metals Precious metals Agriculture Livestock
World economy
Source: Oxford & Blavatnik School of Government, Covid-19 Government Response Tracker; Calculs OFCE
Strictness of the closures
Sweden FinlandJapanNorway Netherlands
Spain
Germany
United StatesUnited Kingdom
Belgium
France
DenmarkAustria
Italy
China
Portugal
0 10 20 30 40 50 60-10
-8
-6
-4
-2
0
0
5
10
15
20
25
DEU FRA ITA ESP GBR USA2020 2021 2020 2021 2020 2021 2020 2021 2020 2021 2020 2021
5.8 3.3
7.64.7
8.33.4 8.8 5.8
7.2 8.53.95
As of 2019 For precautionary reasons Linked to Covid savings
0
50
-50
-100
100
150
200
0
50
-50
-100
100
150
200
2017 2018 2019 2020 2021
200
400
600
800
1,000
0
200
400
600
800
1,000
02020 2021

13
POST-COVID CONTEXT
DISTRIBUTION OF WORLD POPULATION IN 2020TOTAL: 7.75 BILLION
GDP & Population Real GDP growth rate*
GDP growth forecasts*
GDP (in billion $ constant 2015) Population (in million)
2019 2020 2021 2022 2010 2019 2020 2010 2019 2020
Europe 1.6% -6.1% 5.3% 4.7% 17,217 20,106 18,779 608 630 633EU-28 1.7% -6.4% 4.8% 4.5% 12,881 14,726 13,779 442 448 448
France 1.5% -8.2% 6.4% 4.5% 2,317 2,603 2,389 65 67 67
North America 2.1% -3.7% 6.1% 4.7% 17,742 21,564 20,778 343 366 369Canada 1.7% -5.4% 6.7% 3.9% 1,396 1,675 1,584 34 38 38
United States 2.2% -3.5% 6.1% 4.8% 16,346 19,890 19,193 309 329 331Latin America 3.3% -7.1% 6.5% 2.8% 5,211 5,518 5,091 586 644 651
Brazil 1.1% -4.4% 5.7% 2.1% 1,703 1,810 1,730 196 211 213Asia 4.5% -1.6% 6.6% 5.4% 17,647 27,751 27,459 3,808 4,136 4,173
China 6.1% 2.3% 8.4% 5.8% 7,541 14,194 14,520 1,338 1,400 1,407South Korea 2.0% -1.0% 4.2% 3.5% 1,193 1,537 1,521 50 52 52
India 4.2% -7.4% 8.8% 7.1% 1,567 2,769 2,564 1,234 1,367 1,382Japan 0.7% -4.8% 2.3% 2.9% 4,178 4,567 4,348 128 126 126
Pacific 1.9% -3.5% 4% 3.4% 1,243 1,578 1,525 36 41 42Australia 1.8% -2.5% 3.8% 3.5% 1,066 1,346 1,312 22 25 26
CIS 2.2% -3.6% 4.4% 3.9% 1,725 2,070 2,000 280 292 293Russia 1.3% -3.6% 4.5% 2.8% 1,259 1,441 1,389 143 145 145
Middle East -0.5% -5.2% 2.5% 4.3% 2,053 2,563 2,417 213 252 257Saudi Arabia 0.3% -4.0% 2.2% 4.7% 509 679 651 27 34 35
Iran -6.5% -1.5% 2.9% 2.5% 402 409 403 74 83 84Qatar 0.8% -4.5% 2.5% 3.7% 121 172 164 2 3 3
Africa 3.2% -3.3% 4.4% 3.8% 2,016 2,577 2,483 1,026 1,292 1,325South Africa 0.2% -7.2% 3.8% 2.5% 285 326 303 51 59 59
World 2.7% -3.6% 5.9% 4.8% 64,854 83,728 80,532 6,899 7,654 7,742OECD 1.6% -4.9% 5.3% 4.4% 42,598 50,637 48,122 1,237 1,306 1,314
Non OECD 3.7% -2.5% 6.6% 5.2% 22,255 33,092 32,410 5,662 6,348 6,428
* Oxford Economics forecast, August 2021. Source: Enerdata, Global Energy and CO2 Data, August 2021
World economy2019-2020 economic growth and 2021-2022 forecasts
DISTRIBUTION OF WORLD GDP IN 2020 TOTAL – 80,5 MDS $ (CONSTANT 2015)
Source: Enerdata, Global Energy and CO2 Data, 2019
Rest of the world 14%
Rest of the world 6%
Africa 3%
Russia 2%
Africa 17%
Russia 2%
Other Asia 7%
Other Asia 16%
Japan 5%
Japan 2%
India 3%
India 18%
European Union 17%
European Union 8%
United States 24%
United States 4%
Other Latin America 4%
Other Latin America 6%
Brazil 2%
Brazil 3%
China 18%
China 18%

14
POST-COVID CONTEXT
Green recovery plansAn insufficiently green recovery
Compared with the unprecedented efforts made to support world economies, funds dedicated to energy transition appear pathetic: barely 2%, according to the IMF.
Governments have so far mobilised $16,000 bn in public spending, mostly in the form of ‘rescue’ packages - health expenditure and emergency assistance for businesses and households (June 2021 IMF assessment). Of this total, the sums earmarked purely for econo-mic recovery amounted to around $2,300 bn, of which only $380 bn went to sustainable energy projects.
This meagre total contrasts with numerous government statements since the beginning of the crisis about the importance of rebuilding better, for a sounder future. As the IEA executive director Fatih Birol pointed out, many governments have yet to act on their promises.
Most expenditures dedicated to green recovery have gone to pre-existing pro-grammes, such as energy efficiency subsidies, public procurement and services and electric mobility incentives. ‘Green’ assistance was made up of subsidies and loans (37%), tax cuts (17% and tax breaks (11%). They focused primarily on the energy sector (20%) and land trans-port (16%), while other support measures towards air transport and the industrial sector perpetuated an existing, highly polluting model (source: UN, Global Recovery Observatory, 2021).
Commitments and new policies that have been implemented since last year should generate additional private investment in clean energy and power infrastructure worth about $350 bn per year from 2021 to 2023. This represents a 30% increase from previous years. But it remains far below what is required to place the world economy on its Paris Agreement track – 1,000$ per year over the next years, according to the July 2021 IEA’s Sustainable Recovery Tracker.
WORLD COVID-19 FISCAL SUPPORT (IN JULY 2021)
ADDITIONAL INVESTMENT BY SECTOR COMPARED WITH LEVELS IN THE SUSTAINABLE RECOVERY PLAN, ANNUAL AVERAGE 2021-2023
Of which directed toward clean energy:
0.38 T$
Economic recovery spending: 2.3 T$
Total fiscal support: 16 T$
Government spending Mobilised investment Remaining spending requirementSource: IEA, Sustainable Recovery Tracker, july 2021
Energy-ef�cient buildings& industry
Low-carbon& ef�cient transport
Electricity networks
Low-carbon electricity
Billio
n US
D /
year
(ave
rage
)
Fuels& technology innovation
0 25 50 75 100 125 150 175 200 225 250 275 300 325 350 375

15
POST-COVID CONTEXT
Green recovery plansDespite evidence that ‘green’ stimulus packages are more efficient than traditional efforts, most countries missed that opportunity. Europe is a notable exception
Green recovery plans have major multiplier effects on the economy, by creating jobs in the short term and by their capacity to attract private investment and develop resilient systems. They should also be assessed in light of the higher cost of inaction.
More precisely, investments in energy efficiency, such as thermal renovation, RES and trans-port infrastructure, not only save energy but are easy to implement and offer considerable potential to revive the economy, innovate and create jobs.
These benefits were demonstrated in an Oxford University study* published on 4 May 2020, edited by Nicholas Stern and Nobel prize-winner Joseph Stiglitz. With the participation of a vast number of experts worldwide and the analysis of 700 pre-Covid stimulus policies, the authors measured the economic and climate impact of green recovery packages. Compared to traditional fiscal stimulus, green projects create more jobs, offer better short-term returns on every dollar spent and generate savings in the long term.
The analysis has continued in 2020 and 2021 within the Global Recovery Observatory** and shows major geographic disparities among current energy transition packages. Most of this spending is in G20 economies, and more specifically among a small group of high-income countries with relatively low borrowing costs. They are also responsible for the heaviest stimulus spending to date: Denmark, Finland, Germany, Norway, France, Poland, Spain and South Korea.
High interest rates and existing borrowing constraints impeded efforts towards recovery in many emerging and developing countries.
Even though the share of public spending dedicated to energy transition was minimal in 2020, it initiated major private investment projects in a wide range of fields from energy to trans-port and energy efficiency (see previous page).
* “Will Covid-19 fiscal recovery packages accelerate or retard progress on climate change?”, University of Oxford – SSEE, 4th May 2020.
** Global Recovery Observatory, Oxford University – SSEE & UN, 2021.
SHARE OF GREEN SPENDING IN NATIONAL RECOVERY PLANS
~21% OF RECOVERY SPENDING
Turkey
Bangladesh
Brazil
Colombia
Switzerland
Sweden
Canada
Norway
FinlandDenmark
Germany
Poland
Israel
Austria
Chile
Ireland
FranceSouth Korea
Spain
Australia
Japan
PeruSingapore
Gree
n re
cove
ry sp
endi
ng a
s % o
f tot
al re
cove
ry sp
endi
ng
RussiaUAE
ThailandBelgium
Recovery spending as % of GDP
Total spending$16.71 trillion
Recovery spending$2.25 trillion
Green spending21% of recovery spending,
$0.46 Trillion
United States
100%
80%
60%
40%
20%
0%
0.10% 1% 10% 100%
Mor
e gr
een
Less
gre
en
Less spending More spending
Sources: https://data.undp.org/content/global-recovery-observatory/ "Global Recovery Observatory, UNDP"
Emerging & Developing Economies Advanced economies

16
POST-COVID CONTEXT
Green recovery plans
The European Union is now in a position to implement the €750 bn recovery package it agreed in July 2020. Aimed at righting the economic and social damage caused by the pandemic, this ‘Next Generation EU’ plan is also a unique opportunity for Europe to transform its economy and make it “greener, more digital and more resilient”.
Ratified on 27th May 2021, the agreement allows the EU to issue a common bond on financial markets through a temporary instrument, the Recovery and Resilience Facility (RRF), which will allocate €312.5 bn in grants and €360 bn in loans to the most affected member states.
Combined with the long term €20181,074.3 bn EU budget for the2021-2027 period, the overall envelope amounts to €2018 1,800 bn.
The EU has also adapted its monetary policy to deal with the Covid crisis, with the ECB launching a quantitative easing programme (the Pandemic Emergency Purchase Programme) to buy back €1,850 bn worth of financial assets. Moreover, the central bank has promised to keep its key rates low, increase banks’ borrowing capacity, extend the list of collaterals for loans, and lower capital requirements in order to facilitate access to credit for businesses and households.
Climate change accounts for over a third of EU recovery funds: 33% of the long term budget is dedicated to climate and 37% of the RRF-related grants must go to transition invest-ments. This is a strict condition. Lastly, €17.5 bn of the Next Generation EU package will be directly allocated to natural resources conservation. In total, the EU will assign over €600 bn to its green transition.
In France, the recovery package presented in September 2020 amounts to €100 bn, of which €40 bn is funded by Europe. This ‘France Relance’ plan has three priorities: ecology, with the double objective of becoming the first decarbonised country among the major European economies and reaching carbon neutrality by 2050; competitiveness, notably through modernising and relocating industrial projects, and improving business financing; and social cohesion, with help for young people to find jobs and support for town-centre shops.
The green component of the French recovery plan is relatively large, as €30 bn of the total is aimed at ecological transition. The four priority sectors defined in the plan are buildings’ thermal renovation (€6.7 bn), transport (€11 bn, of which €1.9 bn for clean vehicles and electric charging points), agricultural transition (€1.2 bn) and energy (€9 bn, of which €2 bn for the development of green hydrogen and €1.2 bn for the decarbonization of industry).
REACT-EU50.6
JUST TRANSITION FUND10.9
RURAL DEVELOPMENT8.1
INVESTEU6.1
HORIZON EUROPE5.4
RESCEU2
Recovery & resilience facility€723.8 billion
NextGenerationEU Contribution to other programmes€83.1 billion
338in grants
NEXTGENERATIONEU€806.9billion
385.8 in loans Source: European Commission
"NEXTGENERATION-EU" THE EU RECOVERY PLAN
POWER UPClean technologies & renewables
RENOVATEEnergy efficiency of buildings
RECHARGE & REFUELSustainable transport & charging stations
CONNECTRoll-out of rapid broadband services
MODERNISEDigitalisation of public administration
SCALE UPData cloud & sustainable processors
RESKILL & UPSKILLEducation and training to support digital skills

17
POST-COVID CONTEXT
Green recovery plans
In March 2021, Joe Biden launched the third US recovery package, the American Rescue Plan Act, totalling $1,000 bn. It follows the Coronavirus Aid, Relief, and Economic Security Act ($2,200 bn) of March 2020, and the Consolidated Action Act of December 2020 (of which $900 bn dedicated to post-Covid recovery). The main feature of the latest plan is a direct payments to US households ($1,400/person earning less than $75,000/year or $150,000 for a couple). Other measures include extra unemployment benefits, tax credits for child care and support for schools and higher education.
The US Federal Reserve is also supporting the economy through its monetary policy. It is committed to maintaining interest rates near zero (interest rates to banks are down from 2.25% to 0.25%), by buying back $2.7 bn worth of assets in order to support financial markets (quantitative easing), and by reinjecting liquidity.
Green provisions are virtually absent from the various US recovery packages. According to the National Conference of State Legislatures, environment-related measures amount to only $195 m within the American Rescue Plan Act and merely $3 m in the Coronavirus Aid, Relief, and Economic Security Act. In both cases it is much less than 1% of the funds being committed to support the economy.
The new US president is keen to make environmental issues part of his policy, however. At the April 2021 climate summit he told around 40 heads of state that he wanted to halve US GHG emissions by 2030. The infrastructure plans amounting to a colossal $1,200 bn and that were voted in early August 2021 are a step in this direction, with $86 bn directly allocated to climate. Upgrading roads ($110 bn) and rail transport ($106 bn) are part of investments towards mitigating climate change too. Regarding energy infrastructure, $73 bn has been allocated to the development of the power grid, $18 bn to CCUS, $15 bn to electric vehicles and $8 bn to hydrogen.
In March 2021, the Chinese National People’s Congress approved the 14th Five-Year Plan guidelines, the country’s economic and social roadmap for the 2021-2025 period. Accelerating the process towards a greener economy is an important component of this strategy, notably since Xi Jinping’s promise to the UN General Assembly in September 2020 to reach a CO2 emission peak before 2030 and carbon neutrality by 2060. China also aims at technological autonomy, particularly regarding semi-conductors; these are currently imported massively and are fuelling Sino-American rivalry. Another major ambition is to reduce the country’s dependence on exports by relying increasingly on domestic consumption through an improved welfare system and urbanisation.
Climate objectives have not been revised since the 13th plan, however. 2021-2025 targets are more or less identical to that of the 2016-2020 plan, themselves already consi-dered moderate: energy intensity to be reduced 15% and carbon intensity by 18%, the share of non-fossil fuels to be raised from 15% in 2020 to 20% in 2025, and forest cover from 23% to 24%.
The 14th Five-Year Plan merely refers to China’s longer term climate objectives and introduces the idea of a CO2 emission cap, without setting any absolute value (reducing CO2 emissions per GDP unit by 65% compared to 2005). In other words, the peak will depend on Chinese economic growth, for which the only given target is 6% in 2021 because of macroe-conomic uncertainty.
Environmental objectives play a greater part in this roadmap than in its predecessors: out of the 20 key indicators for the period, 8 are binding, of which 6 apply to environment, climate and energy. The Plan is considered ambiguous by many experts however: “it sends a undecided signal regarding climate” and shows “no significant change in China’s posture concerning coal and clean energy: it promotes both” (Climate Action Tracker).

18
POST-COVID CONTEXT
Investment in the energy sectorThe rebound of energy investment in 2021 reflects a brighter economic situation, but also a shift of capital flows towards clean technologies
Investments in the energy sector are expected to rebound about 10% in 2021 to $1,900 bn*, offsetting a contraction in 2020. This performance contrasts with several years of stagnation between the end of the oil and gas industry’s rapid development in the early 2010s and the point at which clean technologies started to take off.
Energy companies are still fragile financially but are seeking to take advantage of accommo-dating monetary policies and government support. A growing number favour the power sector and downstream business (energy efficiency, batteries, electrification) over traditional fossil energy production.
Driven by the sector’s outperformance on stock markets in 2020, investment in clean tech-nologies (RES, energy efficiency, CCUS, batteries) is expected to grow another 7% in 2021 to $750 bn, or to 40% of total investments.
A combination of multiple commitments by governments, companies and financial institutions to reach zero emissions by 2050 and a boom in sustainable finance ($600 bn of sustainable debt was issued in 2020) underpins this move. Recovery packages also bolstered projects in new segments, such as green hydrogen and CCUS.
Even so, green investment is still hampered by the scarcity of quality projects, the inefficient channelling of available funds and a lack of competent intermediaries. It also remains confined to countries with large budgetary reserves, low interest rates and clear support policies.
Lastly, sums invested in clean technologies are well below climate scenarios’ requirements: they ought to double over the decade to keep the global temperature rise to below 2°C and to triple for it to stabilise at 1.5°C.
GLOBAL ENERGY INVESTMENT, 2017-2021
Buildings Transport Industry Energy infrastructure Power generation Fuel production
GLOBAL ENERGY SUPPLY INVESTMENT BY SECTOR
Source: IEA World Energy Investment 2021, may 2021
2017 2018 2019 2020 2021E
500
1,000
1,500
2,000
2,500
0
USD
billio
n (2
019)
2019 2020 2021E 2019 2020 2021E 2019 2020 2021E 2019 2020 2021E 2019 2020 2021E 2019 2020 2021E 2019 2020 2021E 2019 2020 2021E
UpstreamOil & Gas
Mid/douwnstreamOil & Gas
Coalsupply
Renewablepower
Low carbon fuels
Fossil fuel power
Nuclear Electricity network& battery storage
USD
billio
n (2
019)
0
100
200
300
400
500

19
POST-COVID CONTEXT
Battery storage Electricity networks Nuclear Fossil fuel power Renewable power
EMDEs (Emerging Market and Developing Economies, excluding China – Share, right axis)
Investment in the energy sector
The power sector accounts for a growing share of investment in the shape of renewable energy. Stable in 2020 while all other types of investment were plunging, it is set to increase 5% in 2021 to over $820 bn, according to the IEA. Most will be allocated to production capacity (investments estimated at $530 bn in 2021), of which 70% will focus on renewable energy and the rest on grids and storage.
The development of power RES reflects a spectacular cost reduction and technology impro-vement (one dollar spent in wind or solar PV generates four times more electricity today than ten years ago). Solar energy has become very competitive. Given calls for tenders, auctions and corporate PPA, it should beat wind power in 2021. China, India, the USA and Europe are expected to increase their solar investment by over 10% in 2021.
In 2021, power RES investment showed exceptional resilience (up 7% on 2019, 45% of all power investment). But it was still restricted to a handful of markets: China, with massive wind investment, the USA and Europe. Electrification has also been driving investment, with continued sales of electrical cars boosted by the multiplication of new models.
Investment in nuclear power weathered the crisis well in 2020 and should hold up thanks to Chinese, Indian and Russian expansion plans. It represents 5% of power investment.
Conversely, investment in fossil power capacity dropped significantly in 2020 (-10%), albeit with geographical differences. It slumped in India, declined less steeply in China and increased in the USA. It is expected to have rebounded somewhat in 2021.
GLOBAL INVESTMENT IN CLEAN ENERGY AND ENERGY EFFICIENCY, 2017-2021*
GLOBAL INVESTMENT IN THE POWER SECTOR BY TECHNOLOGY, 2011-2021E*
*Sources: IEA, World Energy Investment 2021, may 2021.
CCUS Low carbon fuel Renewables for end-use Energy efficiency & electrification Battery storage Nuclear Renewable power
% clean energy in total (right axis)200
400
600
800 45%
40%
35%
30%
25%
20%0
USD
billio
n (2
019)
2017 2018 2019 2020 2021E
100%
80%
60%
40%
20%
0%
400
200
600
800
1,000
0
USD
billio
n (2
019)
2011-15 2016 2017 2018 2019 2020 2021E
*Sources: IEA, World Energy Investment 2021, may 2021.

20
POST-COVID CONTEXT
Investment in the energy sector
Despite the Covid-19 crisis, investment in batteries rose 40% in 2020 to $5.5 bn, and by as much as 60% in grid batteries. This performance stemmed from cost reductions (-20% on average) and a growing number of combined auctions including storage. This trend should continue in 2021.
Investments in power grids had been falling for three years and dipped another 6% to $255 bn in 2020 as grid operators lost revenues. Major projects in China, Europe and the USA should revert the trend, however. Europe committed to a power grid extension programme from 2021 to 2030, supported by the recovery plan. The USA passed an infrastructure reno-vation plan presented by Joe Biden, allocating $73 bn to power grids.
Investment in fossil energy will be much lower in 2021 than it was before the pan-demic. After a staggering 25% plunge in 2020, it is expected to rebound 14% in 2021, from $620 bn to $720 bn. Most 2020 spending went towards oil and gas (84%), compared with 14% on coal and less than 2% on decarbonized fuels. The latter are becoming important to a growing number of businesses, however, both inside and outside the oil and gas sector, inves-ting in low carbon fuels (hydrogen, biofuels) or in CCUS. It is expected to have a tangible effect on future trends.
The crisis will not have accelerated the end of coal. After a sharp 9% contraction in 2020, investment resumed in 2021 on the back of power requirements in Asia. In fact, India and China did not reduce their investment at all in 2020, while the rest of the world cut its investment by a quarter. Down 80% worldwide since 2015, investment in coal-fired plants regained ground in 2020 and 2021 because of easier authorisation in China and projects across Asia.
Rest of the world MENA (Middle East & North Africa United States Southeast Asia India China
CLEAN ENERGY INVESTMENTS MADE BY SELECTED OIL AND GAS COMPANIES, INCLUDING DATA THROUGH MAY FOR 2021
FIDS FOR COAL, 2015-2020
Source: IEA World Energy Investment 2021, may 2021
Other Biofuels CCUS Offshore wind Onshore wind Solar PV
% Total Capex
Source: IEA, World Energy Investment 2021, may 2021.
5%
4%
3%
2%
1%
0%
2
1
3
4
5
0
USD
billio
n (2
019)
20172015 2016 2018 2019 2020 2021
40
20
60
80
100
0GW
2015 2016 2017 2018 2019 2020

21
POST-COVID CONTEXT
Energy balanceThe pandemic had a dramatic effect on the energy market but also proved a valuable learning opportunity around clean technologies
In 2020, primary energy demand contracted by more (4%) than at any time since the Second World War. Lockdowns and other restrictions resulted in declines in energy consumption in line with economic activity. This meant a sharper drop in developed countries (-6%) than in emerging ones (-3.4% in India, -3% in South East Asia, -2% in the Middle East and -1.5% in Africa). Only China reported an increase in energy consumption in 2020 (+2%).The transport sector was worst hit with an 11% contraction in energy demand, reflecting mobility restrictions. This was especially true of international air transport (-45%).
The recession badly dented the oil market, down 9 mbd, while sustainable techno-logies proved resilient. They continued to make progress, especially solar energy. Oil demand was by far the most affected, down 8.9% in 2020, bearing the brunt of road and air travel restrictions. Fuel consumption in transport, representing 52% of oil consumption, plunged 14% in 2020.
Coal consumption declined 4%. Half of that is attributable to the power sector, hit by the combined effect of lower electricity demand, a significant RES share and low gas prices. This was particularly the case in developed countries, notably the USA, the EU and Russia (coal-fired plants saw demand fall 15%), but also in Brazil. The other half of the decline in coal consumption stemmed from energy-intensive sectors, such as the steel and cement industries.
Natural gas resisted better than the other fossil sources (-1% in 2020), as its low price boosted coal substitution in power generation during the crisis, especially in OECD countries. In non-OECD countries, demand faced mixed situations, with a cold winter in China (+8%) but mild temperatures and low power demand in Russia (-5%). All in all, it held up fairly well.
Renewable energy is the winner of the crisis, maintaining a +3% rise in 2020. First in the order of merit thanks to zero marginal costs, power RES grew +7% in 2020, despite a depressed power context (-1% total decline). The power sector generated two thirds of the 2020 RES growth, and the industrial use of biomass the other third (+3%).
Renewable capacities recorded a rather exceptional year even. The wind sector gained +12% (+111 GW installed, twice more than in 2019) thanks to an acceleration in China (+72 GW), and vast infrastructures installed in the US, Australia and the EU. The solar sector recorded an even stronger performance, with a +20% rise in installed capacity (+127 GW), notably in China (+49 GW), in the EU and the USA.
COMPARATIVE TRENDS IN GDP, ENERGY DEMAND AND CO2 EMISSIONS COMPARED TO 2019 - WORLD
Source: IEA World Energy Investment 2021, may 2021 GDP Energy demand CO2 Emissions
4%
2%
0%
-2%
-4%
-6%
Base
(20
19 =
0%)
20202019 2021

22
POST-COVID CONTEXT
Energy balanceThe decline in energy demand is expected to be completely erased in 2021, with renewables standing out again but coal clouding the outlook by rebounding sharply
Picking up strongly, 2021 energy demand is expected to exceed the 2019 level, even if recent outbreaks of the pandemic hold some sectors back*.
This year again, energy consumption levels will evidently depend on the pandemic. That said, economic growth recovery and the almost complete removal of restrictions mid-year point to a 4.6% increase in world energy consumption in 2021 (+0.5% from 2019), according to the IEA and Enerdata.
The EIA attributes near 70% of the swing to emerging markets, for which energy consumption could exceed its 2019 level by 3.4%. Key drivers of the rise would be China (6% in 2021, up 8% from 2019) and India (7%, up 2% from 2019).
For developed countries, a return to pre-crisis levels is out of the question in 2021. US energy consumption will remain 3% lower than in 2019, despite a 5% surge in 2021. Weaker expan-sions are expected in the EU and Japan (3.5% and 0.9%, respectively, according to Enerdata).
The recovery in primary energy demand will depend largely on transport. The IEA anticipates demand from this sector to be much lower in 2021 than in 2019, as international mobility remains restricted. Conversely, if the sector were to resume consumption up to pre-crisis levels as soon as this year, primary energy demand could exceed its 2019 level by 2%.
The crisis galvanised renewable energy development, but the recovery generated an exceptional call for coal. This reversed 5 years of decline, with serious consequences for CO2 emissions.
Oil demand is gaining some ground in 2021 (+6.2%), but will remain 3% lower than in 2019, since road transport was limited over an large part of the year and air traffic was much lighter than in 2019. Only Asia will exceed its 2019 level, driven by China (+7.2%) and India (+6.9%).
Boosted by Asia, coal demand will hit a growth record in 2021 at 4.5% (up 0.5% from 2019), and nearly reach its 2014 peak. This rebound will account for 80% of Asian power demand, reminding us of the central role of coal in most developing countries. China forecasts speak for themselves: coal consumption will rise 4% to its highest ever level in 2021. Conversely, coal demand USA and Europe will recoup only a quarter of the ground lost in 2020, signalling their firm desire to accelerate their exit from this energy source.
Expected up 3.2% in 2021, natural gas will record the strongest expansion amongst fossil fuels over the 2019-2021 period (1.3% from 2019), boosted by rapid economic recovery in Asia and, to a lesser extent, the Middle East and Russia. Three quarters of the rise will come from the industrial and the construction sectors, while gas-fired power production will remain lower than in 2019 amid higher prices.
Renewable energy is on track to cross new thresholds. RES power production is expected to climb 8%, its fastest pace since the 1970s, and reach 8,300 TWh. Wind and solar energy would generate two thirds of the move (respectively +17% and +18%), together with biomass and hydroelectricity (+8.3%). These two years of rapid growth will bring the RES share in power production up to 30%, another three-point gain from 2019.
* 2021 projections presented here are taken from the IEA (Global Energy Review 2021, April 2021 ). They are based on 1st quarter 2021 statistics. These forecasts carry a high degree of uncertainty due to exogenous elements such as new variants, the removal of Covid restrictions, vaccinations and the economic consequences of lockdowns.
Enerdata forecasts (Global Energy Trends – June 2021) are matching them. They rely on macroeconomic projections from international organisations and on Enerdata’s continuous data gathering across all countries and sectors.

23
POST-COVID CONTEXT
Energy balance
CHANGE OF PRIMARY ENERGY DEMAND BY REGION AND BY FUEL IN 2021 RELATIVE TO 2019
EVOLUTION OF PRIMARY ENERGY DEMAND BY REGION (%/YEAR)
RATE OF CHANGE OF ENERGY DEMAND IN 2020, AND IN 2021, RELATIVE TO 2019 LEVELS, BY REGION
SHARE OF LOW-CARBON SOURCES AND COAL IN WORLD ELECTRICITY GENERATION, 1971-2021
Source: IEA World Energy Investment 2021, may 2021
Source: AIE, Global Energy Review 2021, april 2021 Source: Enerdata, Global Energy Trends – 2021 Edition
Source: AIE, Global Energy Review 2021, april 2021
Oil Coal Gas Renewables Nuclear
Total
2019 2020 2021 Total 2010-2019
Bubble size is relative to regional primary energy demand in 2021.
Source: IEA Global Energy Review 2021, April 2021 Assessing the effects of economic recoveries on global energy demand and CO2 emissions in 2021
World OECD Non OECD IndiaChina Russia Brazil USA JapanEuropeanUnion
In %
-2
-4
-6
-8
0
2
4
6
8
IndiaChina United States WorldEuropean Union-5%
0%
5%
10%
1971 1980 1990 2000 2010 20210%
50%
40%
30%
10%
20%
Low-carbonCoal
Nuclear
Other renewables
Wind
Solar PV
India
China
United States
World
European Union
-5%
0%
5%
-10%-6% -4% -2% 0% 2% 4% 6% 8% 10%
Brazil
Japan
2020
/201
9
Russia
Middle eastAfrica
Southeast Asia
< Partial recovery | Full recovery >

24
POST-COVID CONTEXT
Primary energy production in 2020 in Mtoe
Fossils Biomass Primary electricity Heat Total
Coal & Lignite Crude oil & NGL Natural gas Biomass & Wastes Primary electricity Geothermal & Solar
Volume Change 2019-20
Share in the world
Volume Change 2019-20
Share in the world
Volume Change 2019-20
Share in the world
Volume Change 2019-20
Share in the world
Volume Change 2019-20
Share in the world
Volume Change 2019-20
Share in the world
Volume Change 2019-20
Share in the world
Europe 113 -17% 3% 180 8% 4% 176 -7% 5% 167 1% 13% 328 -5% 24% 3 0% 10% 971 -4% 7%EU-27 88 -16% 2% 75 -4% 2% 77 -14% 2% 157 1% 12% 279 -6% 20% 3 3% 8% 679 -7% 5%
North America 284 -24% 8% 1,002 -4% 24% 938 0% 28% 113 -7% 8% 354 0% 26% 3 17% 10% 2,695 -5% 19%Canada 23 -22% 1% 261 -5% 6% 145 -2% 4% 13 -5% 1% 63 0.0% 5% 0 2% 0% 505 -4.3% 4%
United States 261 -24% 7% 741 -4% 17% 793 0% 24% 100 -7% 8% 291 1% 21% 3 17% 10% 2,190 -5% 16%Latin America 48 -24% 1% 408 -5% 10% 152 -8.6% 5% 153 2% 12% 88 -1% 6% 1 5% 4% 851 -6% 6%
Brazil 2 3% 0.1% 160 7% 4% 21 -8% 1% 97 3% 7% 43 -1% 3% 1 6% 3% 324 4% 2%Asia 2,636 0% 69% 346 -2% 8% 399 0% 12% 506 0% 38% 458 5% 33% 25 1% 72% 4,382 1% 31%
China 1,961 1% 52% 201 2% 5% 163 10% 5% 114 -1% 9% 274 7% 20% 23 0% 68% 2,749 2% 19%India 294 4% 8% 36 -5.9% 1% 23 -12% 1% 199 4% 15% 38 2% 3% 1 8% 4% 590 2% 4%
Indonesia 288 -9% 8% 37 -5% 1% 56 -7% 2% 31 -4% 2% 27 3% 2% 0 NA 0% 438 -8% 3%Pacific 283 -6% 8% 20 16% 0.5% 148 8% 4% 8 -4% 1% 12 4% 1% 1 6% 1% 472 -1% 3%
Australia 282 -6% 7% 19 18% 0.5% 133 8% 4% 5 -5% 0.4% 5 15% 0.3% 0 6% 1% 443 -1% 3%CIS 286 -7.8% 8% 655 -8% 15% 753 -7% 23% 18 3.3% 1% 103 2% 8% 0 -100% 0% 1,814 -7% 13%
Russia 221 -9% 6% 515 -9% 12% 579 -6% 17% 11 4% 1% 76 5% 6% 0 NA 0% 1,402 -7% 10%Middle East 1 4% 0% 1,291 -9% 30% 569 1% 17% 1 -1% 0.1% 5 -12% 0.4% 1 0% 2% 1,867 -6% 13%
Qatar 0 NA 0% 73 -2% 2% 149 0% 5% 0 NA 0% 0 NA 0% 0 NA 0% 222 -1% 2%United Arab Emirates 0 NA 0% 168 -9% 4% 51 -7% 2% 0 NA 0% 1 29% 0.0% 0 NA 0% 219 -9% 2%
Saudi Arabia 0 NA 0% 520 -7% 12% 80 1% 2% 0 NA 0% 0 0% 0% 0 NA 0% 599 -6% 4%Iran 1 4% 0% 135 -9% 3% 198 1% 6% 1 -1% 0% 4 -17% 0.3% 0 NA 0% 339 -4% 2%
Africa 147 -5% 4% 366 -11% 9% 196 -6% 6% 373 1% 28% 22 -2% 2% 0 1% 0.6% 1,104 -6% 8%Nigeria 0 -7% 0% 89 -14% 2% 39 2% 1% 124 1% 9% 1 0% 0% 0 NA 0% 253 -5% 2%
World 3,798 -4% 100% 4,267 -6% 100% 3,331 -3% 100% 1,338 0% 100% 1,371 0% 100% 34 2% 100% 14,157 -4% 100%OECD 668 -16% 18% 1,296 -2% 30% 1,278 0% 38% 326 -2% 24% 771 -2% 56% 8 7% 24% 4,351 -4% 31%no-OECD 3,130 -1% 82% 2,972 -8% 70% 2,053 -4% 62% 1,012 1% 76% 599 3% 44% 26 1% 76% 9,806 -4% 69%
Source: Enerdata, Global Energy & CO2 Data, august 2021
Primary energy production

25
POST-COVID CONTEXT
Primary energy consumption
Primary energy consumption in 2020 in Mtoe
Fossils Biomass Primary electricity Heat Total
Coal & Lignite Crude oil & NGL Natural gas Biomass & Wastes Primary electricity Geothermal & Solar
Volume Change 2019-20
Share in the world
Volume Change 2019-20
Share in the world
Volume Change 2019-20
Share in the world
Volume Change 2019-20
Share in the world
Volume Change 2019-20
Share in the world
Volume Change 2019-20
Share in the world
Volume Change 2019-20
Share in the world
Europe 193 -18% 5% 537 -9.2% 14% 441 -2% 13% 177 1% 13% 330 -5% 24% 9 1% 15% 1,687 -7% 13%EU-28 143 -20% 4% 470 -10.3% 12% 390 -3% 12% 167 1% 12% 284 -5% 21% 5 2% 8% 1,458 -7% 11%
Germany 44 -18% 1% 93 -7% 2% 74 -2% 2% 31 0% 2% 33 -3% 2% 1 3% 2% 276 -6% 2%
France 5 -28% 0.1% 60 -16.0% 2% 35 -8% 1% 17 -5.6% 1% 99 -9% 7% 0.4 6% 1% 216 -11% 2%
North America 227 -21% 6% 805 -12% 21% 825 -2% 25% 110 -7% 8% 353 0% 26% 4 12% 8% 2,325 -8% 17%Canada 12 -22% 0% 95 -12% 3% 102 -5% 3% 13 -5% 1% 58 -2% 4% 0 2% 0% 279 -7% 2%
United States 216 -21% 6.0% 711 -12% 19% 722 -1% 22% 97 -8% 7% 296 1% 22% 4 12% 7.7% 2,046 -8% 15%Latin America 36 -17% 1% 285 -14% 7% 196 -1% 6% 153 2% 11% 84 -5% 6% 2 4% 3% 756 -7% 6%
Brazil 14 -12% 0.4% 100 -5% 3% 29 -6.6% 1% 97 3% 7% 46 0% 3% 1 5% 2% 286 -2.2% 2%Asia 2,833 -0.6% 78% 1,456 -3% 38% 667 1% 20% 506 0% 38% 458 5% 34% 39 3% 70% 5,958 0% 44%
China 2,011 1% 56% 680 4% 18% 268 7% 8% 114 -1% 9% 272 7% 20% 37 3% 66% 3,381 2% 25%India 400 -4% 11% 218 -10% 6% 53 -1% 2% 199 4% 15% 38 3% 3% 1 8% 2% 908 -3% 7%
Indonesia 64 -4% 2% 67 -9.8% 2% 37 -5% 1% 30 -4% 2% 27 3% 2% 0 NA 0.0% 225 -5% 2%Japan 104 -8% 3% 144 -10% 4% 90 -3% 3% 17 5% 1% 31 -10% 2% 0.4 5% 1% 386 -7% 3%
South Korea 67 -12% 2% 103 -6% 3% 47 1% 1% 21 3% 2% 45 12% 3% 0.3 2% 1% 283 -3% 2%Pacific 42 -4% 1% 52 -3% 1% 38 0% 1% 8 -4% 1% 12 4% 1% 1 4% 1% 153 -2% 1%
Australia 40 -4% 1% 42 -4% 1% 34 1% 1% 5 -5% 0.4% 5 15% 0.3% 0.4 6% 1% 126 -2% 1%CIS 174 -8% 5% 202 -5% 5% 525 -6% 16% 17 4.3% 1% 101 3% 7% 1 -1% 1% 1,019 -5% 8%
Russia 108 -11% 3% 144 -4% 4% 395 -5% 12% 11 4% 1% 74 6% 5% 0 NA 0% 731 -5% 5%Middle East 8 -4% 0.2% 318 -8% 8% 471 4% 14% 1 -1% 0.1% 5 -15% 0.4% 1 0% 1% 804 -1% 6%
Iran 1 3% 0% 74 -9% 2% 189 4% 6% 1 -1% 0% 3 -21% 0.2% 0 NA 0% 268 -1% 2%Saudi Arabia 0 NA 0% 130 -5% 3% 80 1% 2% 0 0% 0% 0.1 0% 0% 0 NA 0% 209 -3% 2%
Africa 99 -10% 3% 172 -9.7% 5% 134 -2% 4% 373 1% 28% 22 -1% 2% 0.3 1% 1% 801 -4% 6%World 3,612 -4% 100% 3,826 -7.4% 100% 3,296 -1% 100% 1,345 0% 100% 1,367 0% 100% 55 4% 100% 13,502 -4% 100%
OECD 630 -17% 17% 1,694 -11% 44% 1,490 -2% 45% 336 -2% 25% 770 -2% 56% 14 4% 26% 4,934 -7% 37%no-OECD 2,982 -1.1% 83% 2,133 -5% 56% 1,806 0% 55% 1,009 1% 75% 597 3% 44% 41 3% 74% 8,568 -1% 64%
Source: Enerdata, Global Energy & CO2 Data, august 2021
26
POST-COVID CONTEXT
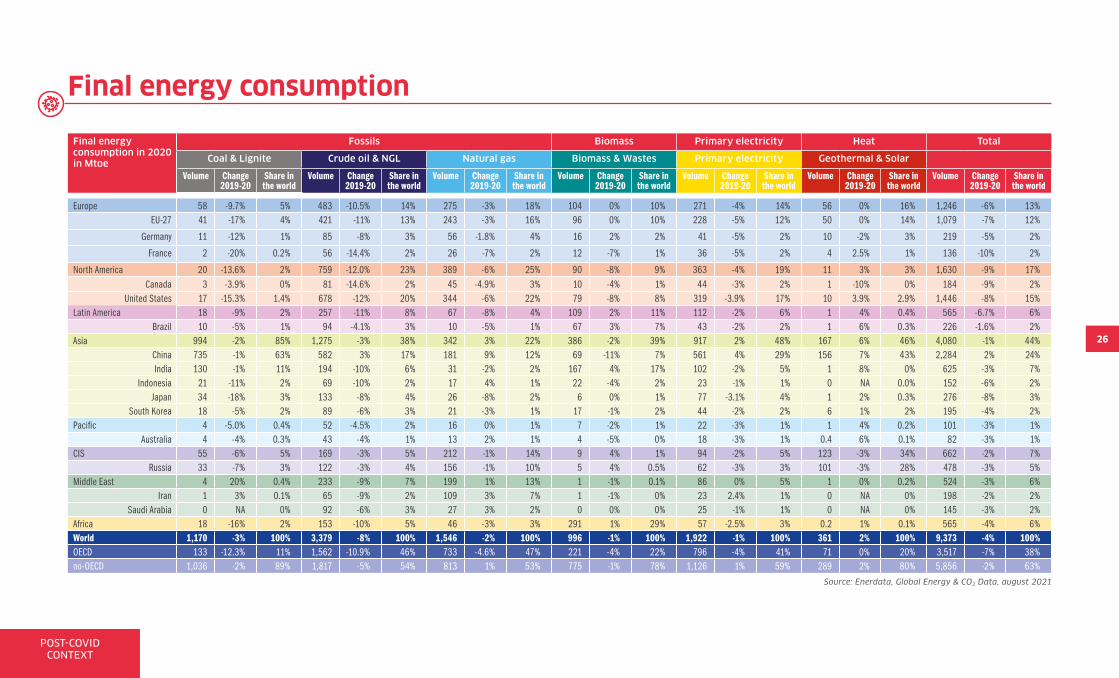
Final energy consumption
Final energy consumption in 2020 in Mtoe
Fossils Biomass Primary electricity Heat Total
Coal & Lignite Crude oil & NGL Natural gas Biomass & Wastes Primary electricity Geothermal & Solar
Volume Change 2019-20
Share in the world
Volume Change 2019-20
Share in the world
Volume Change 2019-20
Share in the world
Volume Change 2019-20
Share in the world
Volume Change 2019-20
Share in the world
Volume Change 2019-20
Share in the world
Volume Change 2019-20
Share in the world
Europe 58 -9.7% 5% 483 -10.5% 14% 275 -3% 18% 104 0% 10% 271 -4% 14% 56 0% 16% 1,246 -6% 13%EU-27 41 -17% 4% 421 -11% 13% 243 -3% 16% 96 0% 10% 228 -5% 12% 50 0% 14% 1,079 -7% 12%
Germany 11 -12% 1% 85 -8% 3% 56 -1.8% 4% 16 2% 2% 41 -5% 2% 10 -2% 3% 219 -5% 2%
France 2 -20% 0.2% 56 -14.4% 2% 26 -7% 2% 12 -7% 1% 36 -5% 2% 4 2.5% 1% 136 -10% 2%
North America 20 -13.6% 2% 759 -12.0% 23% 389 -6% 25% 90 -8% 9% 363 -4% 19% 11 3% 3% 1,630 -9% 17%Canada 3 -3.9% 0% 81 -14.6% 2% 45 -4.9% 3% 10 -4% 1% 44 -3% 2% 1 -10% 0% 184 -9% 2%
United States 17 -15.3% 1.4% 678 -12% 20% 344 -6% 22% 79 -8% 8% 319 -3.9% 17% 10 3.9% 2.9% 1,446 -8% 15%Latin America 18 -9% 2% 257 -11% 8% 67 -8% 4% 109 2% 11% 112 -2% 6% 1 4% 0.4% 565 -6.7% 6%
Brazil 10 -5% 1% 94 -4.1% 3% 10 -5% 1% 67 3% 7% 43 -2% 2% 1 6% 0.3% 226 -1.6% 2%Asia 994 -2% 85% 1,275 -3% 38% 342 3% 22% 386 -2% 39% 917 2% 48% 167 6% 46% 4,080 -1% 44%
China 735 -1% 63% 582 3% 17% 181 9% 12% 69 -11% 7% 561 4% 29% 156 7% 43% 2,284 2% 24%India 130 -1% 11% 194 -10% 6% 31 -2% 2% 167 4% 17% 102 -2% 5% 1 8% 0% 625 -3% 7%
Indonesia 21 -11% 2% 69 -10% 2% 17 4% 1% 22 -4% 2% 23 -1% 1% 0 NA 0.0% 152 -6% 2%Japan 34 -18% 3% 133 -8% 4% 26 -8% 2% 6 0% 1% 77 -3.1% 4% 1 2% 0.3% 276 -8% 3%
South Korea 18 -5% 2% 89 -6% 3% 21 -3% 1% 17 -1% 2% 44 -2% 2% 6 1% 2% 195 -4% 2%Pacific 4 -5.0% 0.4% 52 -4.5% 2% 16 0% 1% 7 -2% 1% 22 -3% 1% 1 4% 0.2% 101 -3% 1%
Australia 4 -4% 0.3% 43 -4% 1% 13 2% 1% 4 -5% 0% 18 -3% 1% 0.4 6% 0.1% 82 -3% 1%CIS 55 -6% 5% 169 -3% 5% 212 -1% 14% 9 4% 1% 94 -2% 5% 123 -3% 34% 662 -2% 7%
Russia 33 -7% 3% 122 -3% 4% 156 -1% 10% 5 4% 0.5% 62 -3% 3% 101 -3% 28% 478 -3% 5%Middle East 4 20% 0.4% 233 -9% 7% 199 1% 13% 1 -1% 0.1% 86 0% 5% 1 0% 0.2% 524 -3% 6%
Iran 1 3% 0.1% 65 -9% 2% 109 3% 7% 1 -1% 0% 23 2.4% 1% 0 NA 0% 198 -2% 2%Saudi Arabia 0 NA 0% 92 -6% 3% 27 3% 2% 0 0% 0% 25 -1% 1% 0 NA 0% 145 -3% 2%
Africa 18 -16% 2% 153 -10% 5% 46 -3% 3% 291 1% 29% 57 -2.5% 3% 0.2 1% 0.1% 565 -4% 6%World 1,170 -3% 100% 3,379 -8% 100% 1,546 -2% 100% 996 -1% 100% 1,922 -1% 100% 361 2% 100% 9,373 -4% 100%OECD 133 -12.3% 11% 1,562 -10.9% 46% 733 -4.6% 47% 221 -4% 22% 796 -4% 41% 71 0% 20% 3,517 -7% 38%no-OECD 1,036 -2% 89% 1,817 -5% 54% 813 1% 53% 775 -1% 78% 1,126 1% 59% 289 2% 80% 5,856 -2% 63%
Source: Enerdata, Global Energy & CO2 Data, august 2021

CO2 & CLIMATE
27
IPCC’S 6TH REPORT ON CLIMATE CHANGE
Global warming now has “irreversible consequences for centuries or millennia”, especially regarding oceans, ice caps and sea level
CO2 EMISSIONS
2021 wiped out most of the decrease in emissions observed in 2020 but structural changes are taking place linked to energy policies and developing technologies
CO2 & Climate
Climate change . . . . . . . . . . . . . . . . . . . . . . . . . 28
The 6th IPCC report on climate change. . . . . . 30
CO2 emissions . . . . . . . . . . . . . . . . . . . . . . . . . . 32
CO2 emissions by sector . . . . . . . . . . . . . . . . . 35
Sources and emission factors of CO2
and other GHG . . . . . . . . . . . . . . . . . . . . . . . . . 36
Carbon pricing: carbon markets and taxes . . 38
European carbon market prices . . . . . . . . . . 40
The Green Deal . . . . . . . . . . . . . . . . . . . . . . . . . 43

28
CO2 & CLIMATE
Climate changeRising temperatures in Europe breached the Paris Agreement red line in 2020
The constant rise in temperatures is the first indicator of the extent to which climate is changing. Global temperatures continued to rise in 2020. It was the third warmest year ever recorded after 2016 and 2019, and showed some notable accelerations. This was espe-cially true of Europe, where the average temperature hit an all-time high (up 0.4°C from 2019 according to Copernicus). France was not spared: the annual average temperature was a record 14°C, beating the 13.9% posted in 2018 (13.9°C).
New heat records were set (Cuba, Australia, Japan). The 54.4°C recorded in August in Death Valley is considered the highest temperature ever observed; Verkhoïansk in Eastern Siberia reported a peak temperature of 38.8°C. This was unprecedented for a weather station regarded as the coldest in the Northern Hemisphere.
These records extend a global trend initiated in the 1980s. Since that time every decade has been 0.3°C warmer than its predecessor. All in all, temperatures have risen by 2.2°C in Europe and 1.25°C worldwide since the preindustrial era. The last six years were the warmest ever recorded.
Oceanic warming and acidification are limiting their ability to regulate climate.On the front line of global warming – they absorb 90% of the heat accumulated in the atmos-phere – oceans have been heating up to an abnormal degree since the 1970s. This phenome-non was particularly marked in 2020 and has disrupted the planet in a number of ways.
One of the most visible is a rise in sea level that has accelerated over the past few decades (+3.3 mm/year on average since 1993, or 9 cm in total, against +1.7 mm/year over 1901-2020). A third of it is due to water dilatation and the rest to melting ice.
Its corollary is an alarming deterioration in the cryosphere. The Arctic ice sheet was smaller in 2020 than ever recorded (3.74 Mkm² after the summer melt), and the 12 seasonal lows have all been observed in the past 12 years. Antarctica loses part of its ice sheet every year (175 to 225 Gt). This phenomenon started in the late 1980s and has been accelerating since 2005.
Oceans are also a formidable carbon sink; dissolution and photosynthesis capture nearly 25% of CO2 emissions. Excess CO2 makes them more acidic, which combined with higher tempera-ture reduces their ability to capture gases. Quite apart from the consequences for biodiversity, it is the ocean’s capacity to restrain climate change that is being called into question.
Increasingly intense and more common, extreme climate events are a warning of climate emergency.
Floods: abnormally heavy rainfall in 2020 in India, China, Korea and Japan; severe flooding in vast regions of Africa resulted in invasions of desert locusts in the Sahel. Droughts: extreme heat waves in inland regions of South America ($3 bn agricultural losses in Brazil) and the USA (unprecedented fires). Storms: storm record beaten in North Atlantic, with 30 storms named in 2020. Cyclone Amphan, hitting India and Bangladesh, was the costliest ever recorded ($14 bn confirmed damage).
TEMPERATURE CHANGES SINCE 1850
HadCRUT5 analysis NOAAGlobalTemp GISTEMP ERA-5 JRA-55
Source: Met Office – WMO, State of the Global Climate
2020
0
0.2
0.4
0.6
0.8
1
1.2
-0.4
-0.2
1850 1875 1900 1925 1950 1975 2000 2025
°C

29
CO2 & CLIMATE
Climate changeIn the longer run, consequences for people and economies that will be hard to sustain
Ecosystems will be profoundly altered by higher temperatures.IPCC’s projections suggest the possibility of the ice packs vanishing in summer within a few decades, leading to an average 21 cm to 81 cm sea level rise by the end of the century. Air masses and ocean currents will be affected, while greater water evaporation will modify pluviometry (more rainfall in the high temperate latitudes and less in the Northern Hemisphere’s tropical areas). According to the WMO*, most of Africa will suffer a minimum of 30 extra days of heatwave per year by 2050; drought and fire risks will increase in relation with higher interannual rainfall variability; cyclones will grow in intensity and frequency (+8% in Northern America).
Biodiversity will be profoundly affected by these changes, as they will severely affect eco-systems: nearly a fifth of wild species are threatened with extinction via habitat degradation (in a +1.5°C rise scenario, 6% of insects, 8% of plants and 4% of vertebrates will see a large part of their habitat destroyed; 99% of barrier reefs will disappear beyond a 2°C rise).
Decades of progress in public health and in poverty reduction are at risk.Food insecurity has worsened since 2014 after decades of improvement, partly because of the impact of climate disruption on crops such as wheat, corn and soybeans. Yields are stea-dily declining or becoming volatile, affecting prices and supply security; ocean acidification also leads to lower fishery resources.
The FAO** expects increased food and drinking water shortages over the next decades and predicts that 1.5 billion people will be suffering from malnutrition by 2080.
Climate change undeniably affects public health, whether indirectly (famines, displacement, diseases carried by birds and mosquitoes), or directly, with heatwave-related mortality (up 54% over the last twenty years, reaching 300,000 dead in 2018 according to The Lancet).
Climate change is forcing more and more human migration, either because of extreme weather events or because of the rising sea levels that threaten 600 to 700 million people (IPCC); one person out of ten lives in a risk area. 2020 saw record displacement as a result of natural catastrophes: 31 million people, against 23 over recent years (IDMC***): 14.6 million people fled cyclones and hurricanes in South East Asia, the Horn of Africa, the Caribbean and South America (30 named storms), 14 million people fled floods in Sahel, China, the Philippines, Bangladesh and India and intense rainfall in the Middle East, and 1.2 million people fled fires.
Beyond social consequences, climate change has an economic cost: from 0.2% to 2% of world GDP by 2100 for a 2°C rise (IPCC). According to the a study called “Investing for Resilience” published in 2016 by Cambridge University (Climate Wise), within 20 years a $200 bn yearly investment will be necessary to compensate losses from climate change impacts.
In 2019, economic damage from flooding alone was estimated at $82 bn, of which $13 bn only had been insured against (“Policy opportunities on the road to net zero underwriting. Highlighting three key areas of influence for the insurance industry”, 2021)
According to the World Bank and the International Bank for Reconstruction and Development, annual average losses will total $314 bn and could rise to $415 bn by 2030 given investment required in infrastructure (“Investing in Urban Resilience”, 2015).
* WMO: World Meteorological Organisation.** FAO: UN’s Food and Agriculture Organisation.***IDMC: Internal Displacement Monitoring Center, 20 may 2021.

30
CO2 & CLIMATE
2,560 GtCO2
+/-220 GtCO2
(Gt = billion tons)
Historical budgetGtCO2 already emitted between 1750-2019
This remaining carbon budgetcan increase or decrease depending on how deeply we reduce greenhouse gases other than CO2
Remaining carbon budgetGtCO2 in line with keeping global warming to 1.5°C or 2°C
(500) GtCO24001.5°C
(1,350) GtCO21,1502°C
67%Probability 50%
The 6th IPCC report on climate change
“AR6 Climate Change” is the IPCC’s sixth assessment report on the current state of climate, explaining how it is changing and the role of human influence. It includes knowledge about possible climate futures and limiting human-induced climate change.
The report shows very pessimistic forecasts and overwhelming evidence of human activity influence, just three months ahead of COP26 in Glasgow, the most important climate negotia-tions since the Paris Agreement where countries are being asked to increase ambitions in their NDCs.
IPCC launches a call to commit to net-zero CO2 emissions targets and to tackle methane emis-sions from fossil fuel production, but phasing out unabated coal power remains the top priority.
The current state of the climate: According to the report, the temperature of the planet is expected to increase by 1.5°C by 2030, ten years earlier than the previous forecast by the IPCC, and within a 2°C rise in the mid-2040s. The current trend is a global warming of about 4°C by 2100.
Global warming now has “irreversible consequences for centuries or millennia”, especially regar-ding oceans, ice caps and sea level: the 50°C heatwave suffered by Canada in June 2021 would have been "almost impossible" without climate change according to IPCC scientists. Ocean levels have risen by 20 cm over the past century, the rate of this rise has accelerated over the past decade with the melting of the ice caps. The sea is forecast to gain one meter by 2100, with a possibility up to two metres. The melting ice caps constitute a “breaking point”. It will have devastating, radical and even irreversible consequences for the planet and humanity.
The magnitude of recent changes and the current state of many aspects of the climate system are unprecedented for centuries or millennia. The whole planet is heating up, and some regions more than others. IPCC demonstrates that human activity is “unequivocally” res-ponsible for global warming, which causes rapid and large-scale change of various compo-nents of the climate system (atmosphere, oceans, cryosphere and biosphere), which modify extreme climatic phenomena.
CARBON BUDGET
What “Limiting future climate change” means. Net zero CO2: “From a physical science perspective, limiting human-induced global warming requires limiting cumulative CO2 emissions, reaching at least net zero CO2 emissions, along with strong reductions in other GHG.” Each 1,000 Gt of cumulative CO2 emissions is assessed to likely cause a 0.27°C to 0.63°C increase in global surface temperature with a best estimate of 0.45°C (1,000 Gt CO2 is the volume emits since the 1st IPCC report in 1990, that's almost half of our emissions since the start of the entire industrial age). Carbon budget: If we want to give ourselves an 83% chance of staying below the 1.5°C mark we must not emit more than 300 Gt of additional CO2 (or 500 Gt with a 50% probability), knowing that humanity has emitted 2,560 Gt CO2 since 1750 (35 Gt CO2 emitted in 2020). The budget is less than 10 years of emissions. So, there is still some leeway, although the challenge seems colossal. Methane: “Strong, rapid and sustained reductions in CH4 emissions would also limit the warming effect resulting from declining aerosol pollution and would improve air quality.”
Source: IPCC, AR6, Climate Change 2021

31
CO2 & CLIMATE
The 6th IPCC report on climate change
AR6 Climate Change 2021 provides a new set of 5 scenarios, describing 5 possible futures according to the degree of severity to fight global warming.
SSP1-1.9: +1,4°C in 2100 - net zero CO2 emissions around 2050, net negative CO2 emissions afterwards. SSP1- 2.6: +1.8 °C - CO2 emissions declining to net zero around or after 2050. SSP2-4.5: +2.7°C - CO2 emissions stay around current level until 2050. SSP3-7.0x: +3.6°C - CO2 emissions multiplied by 2 in 2100. SP5-8.5: +4.4°C - CO2 emissions multiplied by 2 in 2050.
But under all emissions scenarios considered, global surface temperature will conti-nue to increase until at least mid-century. Global warming of 1.5°C and 2°C will be excee-ded during the 21st century unless deep reductions in CO2 and other GHG emissions occur in the coming decades.
The increase in emissions is subject to an acceleration phenomenon because the more CO2 is in the atmosphere, the less ocean (which currently absorb a large part of the CO₂) and land carbon sinks will be effective at slowing the accumulation of CO2 in the atmosphere.
IPCC REPORTS
Since its creation in 1988 by the WMO* and UNEP**, IPCC (Intergovernmental Panel on Climate Change) has produced 5 assessment reports (AR) and several special, as well as methodological reports. IPCC has been running its 6th assessment cycle since 2017. It is based on three Working Group (WG) studies submitted as follows:
9th August 2021: Scientific elements of the climate change (AR6 Climate Change) publi-shed 9th august; WG 1 September 2021: Mitigation of climate change (WG 3) October 2021: Impacts, adaptation and vulnerability (WG 2) September 2022: Synthesis Report – to be present for the first global UNFCCC stockta-king – should “synthesize and integrate materials contained within the Assessment Reports and Special Reports” and “should be written in a non-technical style suitable for policymakers and address a broad range of policy-neutral questions approved by the Panel”. It is composed of two parts, a Summary for Policymakers (SPM) of 5 to 10 pages and a Longer Report of 30 to 50 pages.
AR6 (Assessment Report 6) Climate Change is the first part of its sixth report, eight years after the previous similar report. It was written by “Working Group 1”, 234 scientists from 66 countries and based on more than 14,000 scientific studies. It is highly scientific, difficult to read for non climate experts.It is composed of 4 chapters:
Current State of the Climate Possible Climate Futures Climate Information for Risk Assessment and Regional Adaptation Limiting Future Climate change.
This 4,000 pages report focuses on the physical science basis of climate change and incorporates the most recent and comprehensive scientific knowledge of the climate system and climate change to date. It reflects the latest advances in climate science to offer a much clearer picture of past, present and future climate change.
GLOBAL TEMPERATURE CHANGE RELATIVE TO 1850-1900
Very low GES emissions (SSP1–1.9)
Low GES emissions (SSP 2.6)
Intermediate (SSP2–2.6)
High GES emissions (SSP3-7)
Very high GES emissions (SSP5-8.5)
Source: GIEC, AR6 Climate Change, 9th august 2021
SSP5-8.5
SSP3-7.0
SSP2-4.5
SSP1-2.6SSP1-1.9
0
1
2
3
4
5
-11950 2000 2015 2050 2100
°C
* WMO: World Meteorological Organization — ** UNEP: United Nations Environment Programme.

32
CO2 & CLIMATE
The pandemic led to a historical reduction in CO2 emissions in 2020. CO2 emissions declined 5.8% (2 Gt) in 2020, the most ever recorded. The drop was five times bigger than during the 2009 financial crisis (source: IEA).
The economic recession cannot explain the move all on its own, as energy demand contracted less (by 4%) than CO2 emissions. The point is that renewables played a major role in the elec-tricity mix and they proved resilient, whereas lower electricity consumption mainly affected adjustable electricity production, notably the coal-fired thermal sector.
Although CO2 emissions fell back in 2020 to 2012 levels (31.5 Gt), the annual concentration in the atmosphere remained at the peak of our era (413 ppm).
The rebound in CO2 emissions in 2021 has been partial so far, reflecting persistent crisis effects. The increase in coal and oil demand resulting from economic recovery is expected to generate a 4.8% increase in CO2 emissions this year according to the IEA (+1,500 Mt CO2 from 2020). That level would be 1.2% lower than in 2019. This partial rebound stems from restrictive measures still in place, notably regarding trans-port, for which emissions remain a third lower than in 2019. A return to pre-crisis levels is possible in the event of case of a full recovery in transport (+1.5% impact).
The economic stimulus and its impact on coal-fired stations is exacerbating national disparities. A structural decline in emissions is evident in developed countries (-18% since 2000). Today they represent less than a third of world emissions. The EU is leading the way (-30%), followed by the USA (-24%) and Japan (-14%).
In contrast, emissions are still rising by nearly 2% per year in developing countries (although that rate is half of what it was 20 years ago). China is the biggest contributor, followed by India, Russia and Indonesia.
The post-crisis recovery is aggravating variations between countries: total emissions are expected to rise 5% compared to 2019 in China (+600 Mt) and 1.4% (+200 Mt) in India, largely because of coal-fired power stations. Emissions in the USA will be 6% lower than in 2019 despite a substantial 200 Mt surge, and in the EU the rise is expected to cover only a third of the 2020 decline (+80 Mt).
Source: IEA Global Energy Review 2021, april 2021 –
Assessing the effects of economic recoveries on global
energy demand and CO2 emissions in 2021
CO2 emissionsA record decline in CO2 emissions in 2020 failed to initiate a radical shift towards decarbonization
GLOBAL CO2 EMISSIONS (GT), 1990-2021
Gas Oil Coal
0
10
20
30
40
1990 1995 2000 2005 2010 2015 2021
1990 1995 2000 2005 2010 2015 2021
GtCO
2
-2
-1
0
1
2
GtCO
2

33
CO2 & CLIMATE
The recent improvement in the planet’s carbon factor is insufficient to meet the 2°C objective. The carbon factor, also called carbon intensity (CO2 emissions/energy consump-tion), declined by a record amount in 2020 (-1.7%), reflecting the impact of the crisis on the electricity mix (see previous page) and transport. Nevertheless, the rise expected in 2021 (+0.3%) will offset some of this progress.
The carbon factor is set to resume its trend dating back to the Paris Agreement, i.e. a 0.8% decline per year. This is far from sufficient to even draw near to the 2°C target. According to Enerdata, this would require a pace closer to -3.2% per year.
Recovery plans are doing nothing to stimulate decarbonization. Presented by the UN as a unique opportunity to invest in decarbonization, most recovery packages missed it. They lack of ecological ambition and grant major support to carbon-intensive sectors such as trans-port. The American Rescue Plan Act is a good example (see Recovery plans in Chapter 1); the $1,900 billion plan includes just $195 million for the environment. France stands out as one of the only G20 countries to adopt significant measures: its recovery plan assigns a third of the funds (€30 bn) to energy transition, of which €2 bn to green hydrogen.
One hopes that the health crisis has strengthened awareness of environmental issues. This could have a substantial impact: individual behaviour alone (such as not travelling by plane) could contribute to reduce CO2 emissions by 8% (IEA’s NZE scenario).
Meeting environmental objectives requires a radical and rapid change in trajectory. Despite the Paris Agreement’s ratification by 184 countries on 1st June 2019, NDCs (illustrated in the IEA’s STEPS scenario) remain insufficient to limit climate change to 1.8-2°C by 2100 (SDS scenario), and even more so to 1.5°C (NZE scenario).
Even the revised 2030 objectives (-3 to -4 GtCO2) are incompatible with the longer term ambition. COP26 will prove decisive in ensuring abiliy of States to commit on the road to global decarbonisation in 2050.
Although more countries (China, Japan, South Korea, South Africa) have recently committed to climate neutrality by 2050-2060, they have not engaged so far in any short-term policy or action that would have tangible results by 2030. And that is the only way to respect the IPCC red line of +1.5°C.
We recall that a 2°C trajectory required cutting CO2 emissions by three-quarters by 2050 (down to 10 Gt CO2), equivalent to a 4.5% decline per year from now on. A 1.5°C trajectory requires carbon neutrality by 2050, meaning an annual 5% reduction by 2030 and 8% by 2040. That would require a radical transformation of energy generation (decarbonization of pro-duction sources, electrification of uses), as well as a switch in the energy consumption trend to a significant decline.
CO2 emissionsCOP26 will have to address a trajectory shortfall
TOTAL CO2 EMISSIONS, WORLD
Sources: IEA, World Energy Outlook 2021 ; Enerdata 2021
Extension 2010-2020 (0%/year) IEA STEPS (0% / year) IEA APS (-1.7%/year) IEA SDS (-4.7%/year) IEA NET ZERO (n.a.) Extension 2020 (-4.9%/year) Historical (Enerdata)
2010 2015 2020 2025 2030 2035 2040 2045 2050
40,000
35,000
30,000
25,000
20,000
15,000
10,000
5,000
0CO
2 Em
issio
n (M
t)
IEA SDS(-4.7%/year)
IEA APS(-1.7%/year)
IEA NET ZERO (n.a.)
IEA STEPS (0%/year)Historical
(Enerdata)
Extension 2020 (-4.9%/year)
Extension 2010-2020 (0%/year)

34
CO2 & CLIMATE
CO2 Emissions in Mt
1990 2000 2010 2019 2020 Change1990-2020
AAGR1990-2019
Change2019-2020
Share in the world
2020
Europe 4,401 4,245 4,184 3,668 3,282 -25% -1% -11% 11%EU-27 3,542 3,360 3,247 2,778 2,473 -30% -1% -11% 8%EU-28 4,098 3,892 3,732 3,125 2,774 -32% -1% -11% 9%
Germany 953 830 781 678 617 -35% -1% -9% 2%France 365 386 356 311 272 -26% -1% -13% 1%
North America 5,296 6,347 5,991 5,512 4,915 -7% 0% -11% 16%United States 4,866 5,817 5,445 4,933 4,405 -9% 0% -11% 14%
Canada 430 530 546 580 510 19% 1% -12% 2%Latin America 852 1,202 1,523 1,567 1,394 64% 2% -11% 5%
Mexico 265 369 446 436 364 37% 2% -17% 1%Asia 4,798 6,824 12,761 15,865 15,691 227% 4% -1% 51%
China 2,255 3,140 7,798 9,562 9,717 331% 5% 2% 31%India 523 912 1,570 2,319 2,191 319% 5% -6% 7%
Korea 243 447 594 608 570 134% 3% -6% 2%Japan 1,055 1,138 1,115 1,044 979 -7% 0% -6% 3%
Indonesia 145 272 410 596 558 285% 5% -6% 2%Pacific 286 371 428 433 414 45% 2% -4% 1%CIS 3,556 2,212 2,391 2,419 2,303 -35% -1% -5% 7%
Russia 2,189 1,522 1,610 1,719 1,619 -26% -1% -6% 5%Middle East 589 963 1,609 1,935 1,866 217% 4% -4% 6%
Saudi Arabia 156 244 435 508 492 216% 4% -3% 2%Iran 181 320 515 620 619 242% 4% 0% 2%
Africa 538 680 1,043 1,266 1,179 119% 3% -7% 4%South Africa 252 296 430 422 396 57% 2% -6% 1%
World 20,316 22,844 29,930 32,664 31,044 53% 2% -5,0% 100%OECD 11,195 12,772 12,630 11,590 10,430 -7% 0% -10% 34%
no-OECD 9,121 10,072 17,299 21,075 20,614 126% 3% -2% 66%BRICS 5,413 6,169 11,785 14,435 14,309 164% 4% -1% 46%
Source: Global Energy Scenarios through 2050, Enerdata, april 2021
Source: Net Zero by 2050, a Roadmap for the Global Energy Sector, IEA, 2021
REDUCTION OF CO2 EMISSIONS BY REGION TO ACHIEVE CARBON NEUTRALITY IN 2050
TOTAL ENERGY SUPPLY TO ACHIEVE NET ZERO EMISSIONS BY 2050
NB: The CO2 emissions presented here are those related to energy combustion, or 90% of CO2 emissions (see following pages “Sources of CO2 emissions and different GHGs ”)
Source: Enerdata Global Energy & CO2 Data, august 2021
USA UE 28 Rest OECD China India Rest non-OECD
Other Other renewables Wind Solar Hydro Traditional use of Biomass Modern gaseous bioenergy Modern liquid bioenergy Modern solid bioenergy Nuclear Natural gas Oil Coal
2010 2020 2030 2050
OCDE24%
NONOCDE76%
2040
50
4045
3530252015100
Gt C
O 2 e
2010 2020 2030 20502040
600
400
500
300
200
100
0
Exaj
oules
(EJ)
CO2 emissions
EnerBlue EnerGreen

35
CO2 & CLIMATE
CO2 emissions by sector
CO2 emissions by sector in Mt
Energy Services, Residential & Agriculture Industry Transport Total
1990 2020 GR 1990-2020
GR 2019-2020
1990 2020 GR 1990-2020
GR 2019-2020
1990 2020 GR 1990-2020
GR 2019-2020
1990 2020 GR 1990-2020
GR 2019-2020
1990 2020 GR 1990-2020
GR 2019-2020
Europe 1,670 1,018 -39% -15% 870 642 -26% -4% 1,039 687 -34% -6% 821 935 14% -13% 4,401 3,282 -25% -11%EU-27 1,327 764 -43% -15% 694 466 -33% -5% 875 520 -41% -8% 645 724 12% -12% 3,542 2,473 -30% -11%EU-28 1,567 835 -47% -15% 805 555 -31% -4% 966 566 -41% -8% 760 817 8% -14% 4,098 2,774 -32% -11%
Germany 349 192 -45% -16% 213 128 -40% -2% 232 135 -42% -9% 159 162 2% -6% 953 617 -35% -9%France 60 45 -26% -13% 97 66 -32% -9% 95 54 -43% -11% 113 107 -6% -15% 365 272 -26% -13%
North America 2,299 1,967 -15% -11% 664 616 -7% -10% 807 685 -15% -5% 1,525 1,647 8% -14% 5,296 4,915 -7% -11%United States 145 180 24% -13% 80 85 6% -8% 86 88 3% -4% 118 157 33% -17% 430 510 19% -12%
Canada 2,154 1,787 -17% -11% 584 530 -9% -10% 721 597 -17% -5% 1,407 1,490 6% -13% 4,866 4,405 -10% -11%Latin America 235 403 71% -13% 105 151 44% -2% 222 337 52% -7% 289 504 74% -15% 852 1,394 64% -11%
Mexico 96 128 33% -19% 26 29 12% -2% 59 95 62% -8% 84 111 33% -24% 265 364 37% -17%Asia 1,625 8,118 400% 0% 904 1,268 40% -1% 1,702 4,342 155% -1% 567 1,962 246% -8% 4,798 15,691 227% -1%
China 724 5,389 645% 2% 524 760 45% 2% 912 2,666 192% 4% 95 902 847% -6% 2,255 9,717 331% 2%India 207 986 376% -6% 85 198 134% -2% 167 735 340% -3% 64 272 323% -14% 523 2,191 319% -6%
Korea 48 231 384% -3% 23 28 18% -9% 42 151 264% -10% 32 148 360% -7% 145 558 285% -6%Japan 387 457 18% -2% 138 113 -18% -6% 317 225 -29% -12% 213 184 -14% -9% 1,055 979 -7% -6%
Indonesia 50 266 434% -8% 73 54 -27% 0% 77 150 96% -6% 44 100 128% -5% 243 570 134% -6%Pacific 144 208 45% -4% 15 26 74% 1% 54 69 26% -5% 72 111 53% -6% 286 414 45% -4%CIS 1,986 1,160 -42% -7% 623 381 -39% -1% 601 499 -17% -2% 347 263 -24% -7% 3,556 2,303 -35% -5%
Russia 1,276 822 -36% -8% 382 234 -39% -1% 310 390 26% -3% 221 173 -22% -8% 2,189 1,619 -26% -6%Middle East 193 709 267% -3% 77 187 144% 1% 167 591 254% 1% 152 379 149% -13% 589 1,866 217% -4%
Saudi Arabia 40 208 424% 4% 53 144 172% 2% 49 141 187% -1% 40 127 220% -8% 181 619 242% 0%Iran 53 136 156% -3% 3 5 92% -5% 51 232 360% 3% 49 118 139% -14% 156 492 216% -3%
Africa 242 562 132% -4% 50 110 120% -4% 132 182 37% -11% 114 325 187% -10% 538 1,179 119% -7%South Africa 143 277 93% -5% 14 26 80% -4% 65 46 -29% -2.4% 30 47 61% -17% 252 396 57% -6%
World 8,394 14,145 69% -4% 3,309 3,382 2% -3% 4,725 7,390 56% -2.2% 3,888 6,126 58% -11% 20,316 31,044 53% -5%OECD 2,379 7,537 217% -1% 1,033 1,258 22% 0% 1,509 3,938 161% 1.7% 493 1,576 220% -8% 5,413 14,309 164% -1%
no-OECD 4,465 4,008 -10% -11% 1,738 1,465 -16% -6% 2,258 1,890 -16% -6.4% 2,734 3,066 12% -13% 11,195 10,430 -7% -10%BRICS 3,929 10,137 158% -1% 1,571 1,917 22% 0% 2,467 5,500 123% -0.7% 1,153 3,059 165% -9% 9,121 20,614 126% -2%
Source: Enerdata Global Energy & CO2 Data, 2021

36
CO2 & CLIMATE
Sources of CO2 emissions and different GHGs
GHG EMISSIONS OF ANNEX 1* COUNTRIES (EXCLUDING LULUCF)TOTAL: 16,571 MTEQ CO2 IN 2018
Source: Enerdata Global Energy & CO2 Data (2020), UNFCCC Greenhouse GasInventory Data – 2018 figures are the latest available
CO2 83%
13,622 Mt CO2
SF6 0,1% 17 Mteq CO2
Fugitive emissions 1%
380 Mt CO2
Waste 0,1% 58 Mt CO2
HFC 2% 379 Mteq CO2
Industrial processes 10%
3,570 Mt CO2
N2O 5% 976 Mteq CO2
CH4 10%
1,577 Mteq CO2
The Kyoto protocol identifies 6 major green house gases:
CO2 (carbon dioxide) mostly comes from the combustion of fossil fuels. It represents 83% of GHG emissions. As a reference gas, its global warming potential, or GWP, is set to 1. CO2’s estimated lifespan nears 100 years.
CH4 (methane), is mainly associated with agriculture, but it is also found in fugitive and landfill emissions. It accounts for 10% of GHG emissions, but for 20% to 30% of the increase in tem-peratures, due to a GWP 28 times that of CO2.
N2O (nitrous oxide) ranks third in GHG emissions. It comes from the decay of nitrogen com-pounds, such as fertilizers, as well as the combustion of aviation fuels and savannah fires, amongst others. With a GWP of 265 and a lifespan of 120 years, nitrous oxide is a particularly harmful to the ozone layer.
HFC (hydrofluorocarbons) have a GWP 13,000 times that of CO2. Made of carbon, fluor and hydrogen, there are mainly used in air-conditioners and refrigerators. An amendment to the Montreal protocol signed in 2016 in Kigali, provides for their gradual phase-out, yet millions of tonnes are still illegally placed on the market every year.
PFC (perfluorocarbons) are present in some cookware such as non stick pans. Their GWP is 7,600 times is that of CO2. Being very volatile, they contaminate removed natural areas such as the North pole or some Himalayan lakes. Within the human body, they are powerful endo-crine disrupters, affecting fertility in particular. They cause neurological adverse effects too, such as attention deficit and hyperactivity.
SF6 (sulphur hexafluoride) represents a mere 0.1% of CO2 equivalent GHG emissions, but remain 3,200 years in the atmosphere. Used in medium and high voltage electric equipment for stability and resistance reasons, this artificial gas has a “greenhouse” potential 22,800 times that of CO2.
Sources of CO2 emissions:
Fossil fuel combustion represents 89% of world CO2 emissions.
Industrial processes, including among others chemicals, steel and cement, account for 10% of CO2 emissions. In countries where heavy industry is developing, this source of emissions is growing rapidly. This is the case in India, with a 45% rise since 2010.
Fugitive emissions or gas flaring remain very important in oil and gas producing countries. They represent just 1% of CO2 emissions worldwide, but reach 20% of Russia’s CO2 balance. Russia, together with Iran and Iraq make up 40% of this source of emissions.
Waste treatment weighs relatively little in CO2 emissions (even though in France waste inci-neration is the CO2 equivalent to 2.3 million cars). Conversely, they weigh heavily on methane emissions (organic waste decomposition represents 16% of methane emissions every year in France). Waste recycling or recovery are among these practices that offer a major lever to emission reduction and even energy saving.
GLOBAL CO2 EMISSIONS (EXCLUDING LULUCF)
TOTAL: 36,785 MT CO2 IN 2018
Fuel combustion89%
32,776 Mt CO2
*Annex 1: see Glossary.

37
CO2 & CLIMATE
CO2 & climate: emission factors
FUEL EMISSION FACTORS (KG CO2 / TEP)
CO2 EMISSIONS FROM POWER GENERATION (IN GRAMS OF CO2 EQUIVALENT PER KWH OF ELECTRICITY PRODUCED)
Values for France
Coal-fired Oil-fired steam
Gas- fired*
Nuclear Gascogeneration
HWIP** Onshore wind
Offshore wind
Solar PV
Hydro with
reservoir
Hydro run-of-
the-river
Excluding life cycle analysis
915 676 404 230 to 380 860 to 1,548
0 0 0 0 0
Including lifecycle analysis
1,058 730 418 6 _ _ 14 16 55 10 13
* Gas-fired: CCGT – ** HWIP: Household Waste Generation Plant.Values calculated in 2015, updated in 2021.
Source: ADEME, Carbon Data Base
CO2 emissions are evaluated according to two conventions: Direct emissions: only emissions resulting from the use of energy by the consumer are considered. Life Cycle Assessment (LCA): take into account all emissions from extraction to end use (extraction, production, transport, distribution, use, even waste management).
GHG reporting answers the GHG Protocol, an international initiative, bringing together businesses, NGO, governments and universities. It is carried out by the World Resources Institute (WRI). Launched in 1998, its mission is to provide standards, as well as GHG accoun-ting and reporting tools that are accepted worldwide. Adopting these standards is a key ele-ment in promoting a world low-carbon economy.The standards developed within the GHG Protocol are the most widely used accounting tools for measuring, managing and reporting GHG emissions.The IPCC also designed a methodology aimed at measuring GHG emissions by sector.Emission factors produced by these two institutions are considered as reference worldwide and ENGIE adopted them for its regulatory environmental reporting.
CARBON FOOTPRINT* OF A FRENCH RESIDENT: 11.2 TCO2E PER YEAR, OF WHICH 8 T OF CO2 (2018, TCO2E)
* Carbon footprint: direct and indirect GHG emissionsSource: ADEME, French Ministry of Ecological Transition
Fuel Direct emissions LCA emissions
Coal 345 377Heavy fuel oil 283 324Domestic heating oil 272 324Diesel 254 219Unleaded gasoline 254 311LPG 233 272Natural gas 205 244Fuelwood 18.8 29.5
Source: ADEME, Carbon base, update 2021
Public & Health services 1.5 t – 12%
Transport 3.8 t – ~30%of which car 2 t – 17%
Housing 3.5 t – ~30%of which housing energy (heating, lighting, cooking ..)1.7 t – 14%
Food 2 t – 15%
of which meat and fish 1.15 t – 10%
Purchase & Uses of new technologies
1.2 t – 10%
CO2 & climate: emission factors

38
CO2 & CLIMATE
The volume of CO2 emissions covered by an explicit carbon pricing system expanded significantly in 2020. As of 1 April 2021, 64 carbon tax or market initiatives were operating across the world, at a national or sub-national level. Carbon pricing instruments now cover 21.5% of world GHG emissions (11.65 Gt CO2e), against 12% at the time of the Paris Agreement or 15% early 2020 (World Bank).
This acceleration stems from the development of carbon markets. They now cover 17% of GHG emissions, against 10% in 2020, following the introduction of major ETS (China for the major part, slight extension of the ETS created on the 01/01/2021 in the UK and creation of a German ETS for emissions not covered by the EU ETS). The 35 active carbon taxes represent 5% of world emissions, a stable rate despite the addition of four jurisdictions this year. (World Bank, "State and Trends of Carbon Pricing 2021")
Presented as the cornerstone of the country’s low-carbon strategy, the national ETS launched by China on 1 February 2021 is the world’s largest carbon market (7.4%). It will initially focus on CO2 emissions from the power sector (4 Gt CO2), and later expand to other sectors (alumi-nium, steel, etc.). It should at first cover 30 to 40% of China’s total emissions.
Carbon pricing instruments generated $53 bn worth of revenues in 2020 (+ $5 bn from 2019), mainly due to higher EU-ETS prices (see EU-ETS prices), collecting $22.5 bn. The French and the Canadian carbon tax (respectively $9.6 bn and $3.4 bn) also generated substantial reve-nues. In 2019, nearly half of the revenues drawn from carbon pricing were used to finance low-carbon transition projects.
Carbon markets proved their strength during the pandemic. After an initial adjustment to lower prices and volumes in traded quotas, carbon markets rapidly stabilised before resu-ming pre-crisis levels (both in prices and volumes). This demonstrated their resilience to external shocks. In recent years carbon markets have developed numerous and particularly innovating mechanisms to stabilise and regulate themselves, improving their robustness, transparency and predictability.
Carbon prices remain overall too low and too limited to allow a drastic reduction in GHG emissions, however. First of all, the share of covered emissions has increased over recent years but remains limited (4/5 are still not priced). For a target of 50% of covered emissions by 2030, new pricing initiatives must be launched and existing schemes must expand to additional sectors.
Secondly, carbon prices remain too low overall ($3/t CO2 on average) to support energy tran-sition efficiently: according to the international scientific consensus, optimal carbon prices range from $40 to $80/t CO2e today and will be from $50 to 100$ by 2030 (Stern-Stiglitz). Despite episodes of particularly high levels ($137/t CO2 in Sweden) and a major increase recorded on the EU-ETS (exceeding €60 in September), only 4% of emissions are covered by a carbon price over $40/t CO2.
Carbon prices must be appropriate too. This is why there is no pricing on the worldwide scale. Some sectors and countries show much greater sensitivity to high carbon prices. For instance, a tonne of CO2 at $100 would have a $0.25 impact on a litre of gasoline but $200 on a tonne of steel (40% of the sale price). And at $50/t CO2 the price of cement would double in India, for example. In short, the issue of extending ETSs remains extremely complex.
To rectify the pricing instruments’ lack of efficiency, the IMF suggests the creation of an international mechanism that would set a carbon price floor. To be socially acceptable, it would have to be equitable and flexible, would have to take into account each country’s spe-cific responsibility and would need to result from a collective initiative by the major emitting countries.
Carbon pricing: carbon markets and taxesDespite the pandemic, carbon pricing still stands out as a prime instrument in reducing CO2 emissions. But its impact remains limited

39
CO2 & CLIMATE
Carbon pricing: carbon markets and taxes
CARBON PRICING INITIATIVES AROUND THE WORLD AS OF APRIL 1, 2021
Source: Carbon Pricing Dashboard, World Bank, april 2021
ETS implemented or schedulded for implementation
ETS implemented or schedulded, ETS or carbon tax under consideration
Carbon tax implemented or schedulded for implementation
Carbon tax implemented or schedulded, ETS under consideration
ETS or carbon tax under consideration
ETS & Carbon tax implemented or schedulded

40
CO2 & CLIMATE
CO2 per tonne exceeded $60 on the European carbon market in September, an unpre-cedented level and a spectacular increase since the beginning of the year (+€30/t). Carbon emission allowances rose in a few months from €202033/t on average in January, to €202038/t mid-February, over €202050/t in May and up to €64 end-September.
This surge resulted from a combination of factors:
The EU reinforced its climate ambitions by setting in December 2020 an emission reduction target of 55% by 2030 from 1990 level. This triggered speculation amongst mutual funds and insurance companies. Attracted by the potential for higher prices, numerous financial players joined the market.
The financial markets’ rally over the first quarter of 2021 was a sign of renewed optimism in the wake of vaccination campaigns and economic recovery plan announcements across the world. It also supported carbon allowance prices, with which they are correlated.
Abnormally low temperatures in February, April and May played a role by boosting thermal power production from gas and coal. This triggered a boom in gas prices, which in turn reduced gas-fired plants’ competitiveness relative to coal-fired, worse emitters. By boosting demand for allowances, these factors bolstered prices.
European carbon market prices Ending a long period of low and stable levels, the upsurge observed on the European market raises questions about CO2 prices in the future
EVOLUTION OF EUROPEAN CO2 ALLOWANCE MARKET
Source: ICE – ECX front-month futures
Sep. 15 Sep. 16 Sep. 17 Sep. 18 Sep. 19 Sep. 20 Sep. 21
64
49
34
19
4
July 2020: Recovery European plan
April 2021: EU lawmakers legislate net 55%emission reduction by 2030; april compliance
deadline squeezes prices up
Q4 2020:Prices driven by gas, Covid-19
vaccine optimism
Q1 2021:Speculation,
start of phase 4
May 2021: EUAs hit record high prices drivenby high gas prices, speculative demand
and upcoming reforms
June 2020:Beginning of recovery
after the drop linked to Covid-19
EUR/
t Q2 2021: technical trading, rising gas
prices
EUA

41
CO2 & CLIMATE
Source: ENGIE, october 2021
Long term carbon price forecasts remain bullish, suggesting a structural change in the market.A certain consensus is emerging around €60/t CO2 by 2030 on the EU ETS, a perpetuation of current levels in other words. Beyond this timeframe, the forecast of €100/t by 2050 is gene-rally accepted, but price ranges can be very wide to all horizons.
As an example, Bloomberg foresees a rapid rise up to €202074/t by 2025 and €202094/t by 2030, as allowances are being withdrawn from the stability reserve and substitution possibilities between fuels become saturated. IHS Markit presents two scenarios: the first one gives the EU ETS* as the only emission reduction tool and forecasts €202046/t by 2030 and €2020102/t by 2050; the latter relies more heavily on national measures and predicts €202045/t by 2030 and €202056/t by 2050. The IEA’s SDS scenario is based on €100/t in 2030, but the Quinet report sets the shadow price of carbon much higher for this timeframe, at €250/t.
European carbon market prices
*EU ETS: the EU Emissions Trading System covers emissions from about 11,000 installations in the power plants and industrial facilities, as well as airlines connecting participating countries. This represents about 40% of EU GHG.
COMPARING 2030 CARBON PRICE FORECASTS ACROSS SEVERAL SCENARIOS (OCTOBER 2021)
109
112
63
65
100
54
83
63
48
36
254
IEA – NZE_50
BNEF – NEO
IHS – MTM
IHS – ACCS
IEA – APS
IEA – STEPS
IEA – SDS
IHS – Green Rules
IHS – In�ections
IHS – Discords
2019 Quinet Report
Achieve the EU's target of -55% by 2030 & reach carbon neutrality in Europe by 2050(IHS MTM 1.6°C & IHS ACCS 1.5°C)
Achieve the EU's target of -55% by 2030
Achieve neither the EU’s target of -55% by 2030 nor carbon neutrality in Europe by 2050
0 50 100 150 200 250 300
CO2 PRICE IN 2030 (€2020/t) – EUA
Shadow carbon price

42
CO2 & CLIMATE
Recent years have highlighted the EU ETS’s resilience and the operational quality of its mechanisms. Despite the deep economic crisis caused by the Covid-19 pandemic, the market bounced back rapidly, Stable indicators such as increasing traded volumes since 2017 suggest decent liquidity and sustained auction participation. However, the arrival of financial inves-tors increased volatility compared to 2020.
Several reforms were necessary to establish efficiency. Designed by the EU in 1997 to implement its Kyoto Protocol commitments, the EU ETS was launched in 2005. Two major flaws appeared in the first two years. First, the system proved vulnerable to external shocks, such as the 2008 economic crisis. Second, member states and the European Commission showed an insufficient ability to readjust allowance supply on the short run. This maintained carbon prices at very low levels for a long time (<€10/t CO2 from 2010 to 2018).
In 2018, the European Commission set a target of 40% emission reduction by 2030 from 1990 levels and reformed the ETS. The annual decrease of allowances (intended to reduce surpluses) accelerated and carbon prices strengthened. The Stability Reserve launched in 2019 was another lever. Allowances are now transferred to this reserve in case of market surplus or reintroduced onto the market in case of shortfall.
In the most recent step to date, in December 2020, the EU agreed a more ambitious target of 55% emission reduction by 2030 from 1990 levels effective April 2021, and announced in July 2021 legislative proposals for an EU ETS revision (see Green Deal below).
A positive signal with regards to the acceleration of energy transition, this carbon price surge is not without consequences for the economy.European industrial competitiveness may deteriorate as a result of reduced investment capa-city in the industrial sector and carbon leakage may worsen (carbon intensive manufacturers relocating outside the EU). In response to this competitive threat, the EU suggested the imple-mentation of a Carbon Boarder Adjustment Mechanism, which would apply identical carbon pricing to imported goods.
For consumers, this would impact energy bills. Without compensatory measures, higher car-bon prices deepen inequalities. The consequences are not the same for high- and low-income households. The redistribution of carbon tax receipts towards lower-revenue households would limit this phenomenon. To this end, the European Commission announced in July 2021 the creation of a Social Climate Fund, aiming at reducing the economic impact of extending the EU ETS to road transport and building sectors on lower-income households and most vulnerable small companies.
Higher carbon prices have other effects that are still difficult to quantify. Since the introduction of the EU ETS in 2005, covered emissions dropped 35% in 2019 and 42% in 2020 (European Environment Agency), which is more than Phase 3’s target of 21% by 2020 from 2005 levels. But it is difficult to distinguish what is attributable to the EU ETS rather than to economic activity and other policies aiming at reducing carbon emissions in Europe. According to the Institute for Climate Economics (I4CE) and the European Roundtable on Climate Change and Sustainable Transition (ERCST), carbon emission reduction stems first and foremost from renewable energies and environmental policies. The European carbon market would have particularly favoured gas-fired over coal-fired power production and would not have been particularly supportive of investments towards new low-carbon technologies.
European carbon market pricesRising carbon prices will test the European economy’s resilience in meeting climate objectives

43
CO2 & CLIMATE
The Green Deal is a holistic strategy aimed at a radical transformation of the European economy. The European Climate Law adopted in April 2021 sets ambitious objectives for the Green Deal: “at least 55%” GHG emission reduction by 2030 against 40% previously, and net zero emissions by 2050.
With this green pact, altogether €550 bn is to be invested in energy transition by 2027, notably in the widespread development of buildings’ energy efficiency (€175 bn), support to the hydrogen sector and acceleration of RES power projects. The Farm to Fork Strategy and the expansion of circular economy show a will to build an economy that is sustainable and efficient in its use of resources through a radical change in consumption and production modes.
By 2030, energy consumption is to drop by at least 36% (of which -25% for gas, -30% for oil and -70% for coal), while the share of RES in the energy mix is to reach 40%. Energy efficiency objectives, revised up to 36% for final energy consumption and up to 39% for primary energy, will be binding. Emission reduction will target power production and buildings (-60% GHG emission reduction), the industry (-25%) and transport (-20%).
The fair transition mechanism worth €75 bn will allow to make these changes economically and socially acceptable by helping the regions and sectors worst affected by the green transition.
The Green Deal will be financed with public as well as private resources: the EU is to raise €1,000 bn over 10 years (of which €503 bn from the budget, €279 bn from InvestEU, €114 bn from national funds for structural co-financing).
This heightened ambition raises many issues and operational difficulties. The Green Deal will lead the EU to review most of its public policies in order to align them with the sustainable growth strategy. For instance, an INRAE/AgroParisTech study presented to the European Parliament shows that negotiations towards the future CAP (2021-2027) so far diverge from the Green Deal’s ambitions and objectives.
EU industrial and foreign policies will also be affected by new strategic dependencies that are inherent to a green economy (notably rare earth metals from China).
Beyond these necessary adaptations, the Green Deal has little to say about sectors such as hot/cold networks, biomethane or funds allocated to transnational energy transport infrastructure.
Above all, the Green Deal poses a real competitiveness problem for European companies as a result of higher carbon prices (see CO2 prices) and more drastic environmental standards. For the Green Deal to be efficient, the EU must impose compliance with strict environmental regulations as a condition of access the common market. That would encourage its trading partners to go green as well.
The Green DealWith this environmental pact, the EU is profoundly reinventing its growth model

44
CO2 & CLIMATE
In 2021, Green Deal political commitments become legislative proposals. The Climate Law voted in April will be followed over the next 18 months by the revision of about fifty European laws to make them consistent with the new objectives.
The first legislative package, “Fit for 55”, presented on 14th July, comprises emblematic mea-sures, such as the creation of the Carbon Border Adjustment Mechanism (CBAM) meant to fight environmental dumping by taxing imported goods in relation with their GHG emission level. Targeted sectors are electricity, steel, metal, cement and fertilisers. The other major change is the addition of buildings (heating) and transport into the EU ETS. From 2026, road transport will be part of the carbon market, as will maritime transport. So far largely exemp-ted thanks to free emission allowances, aviation will progressively be submitted to carbon pricing. To prevent the carbon market extension to buildings and road transport worsening inequalities, the European Commission has launched a Social Climate Fund. It will be financed by the forecasted new carbon market receipts and will bring to the most vulnerable citizens financial support towards the thermal renovation of their homes and the use of cleaner trans-port modes.
The Commission has put forward another interesting component in favour of alternative fuels in aviation (the ReFuel Aviation initiative) and maritime transport (FuelEU Maritime), inclu-ding carbon-free hydrogen. Another proposal bans from 2035 the sale of new cars and vans emitting carbon, in other words having a thermal engine (gasoline or diesel). As a conse-quence, the Commission shall also require member states to expand charging points for elec-tric cars and refuelling stations for hydrogen cars. Lastly, it proposes to revise the Energy Taxation Directive so that energy products are taxed in accordance with EU climate and energy ambitions.
A second wave of legislation is due in December 2021. It will concern the gas sector’s decarbonization, methane emissions and above all energy performance in buildings (EPBD directive).
This reforms will be supported by a “green taxonomy” that will steer private investors’ deci-sions through an official classification system of activities that contribute to curtail or adapt to climate change. This proposal is still very much under discussion. The various EU positions on natural gas and nuclear power will be made clearer by year-end.
Despite some inconsistencies with current EU policies, uncertainty and shortcomings, they are being addressed as negotiations take place and the Green Deal seems to be a funda-mental turning point in EU policy. Such efforts will not have their expected impact without international cooperation in energy transition, however, as the EU is by no means the biggest player in global emissions (10%). The Green Deal’s objective is therefore to set an example for partner countries in supporting new environmental standards and stepping up their own decarbonization.
The Green Deal

DECARBONIZATION
45
PERSPECTIVE
Carbon neutrality by 2050 gains a foothold in prospective exercises and with decision-making bodies; many Governments have already approved it and COP26 has made it its target
SCENARIOS
However, the commitments given by states in Glasgow, while never before so ambitious, will not be enough to stabilise temperatures as demonstrated by the IEA's Announced Pledges scenario
Decarbonization
Messages from IEA and Enerdata . . . . . . . . 46
Decarbonize: how? . . . . . . . . . . . . . . . . . . . . . 49
IEA energy scenarios . . . . . . . . . . . . . . . . . . . . 50
Energy efficiency . . . . . . . . . . . . . . . . . . . . . . 54
Energy sobriety . . . . . . . . . . . . . . . . . . . . . . . 56
Sustainable finance . . . . . . . . . . . . . . . . . . . . 58
CCUS . . . . . . . . . . . . . . . . . . . . . . . . . . . . . . . . . 60
Renewables energies, a key element of decarbonization, are covered in the chapters “Electricity & Renewables” and “Natural gas & Renewable gases”.

46
DECARBONIZATION
Decarbonization: message from Tim Gould, IEA, october 2021
A new global energy economy is emerging. The new energy economy will be more elec-trified, efficient, interconnected and clean. Its emergence is the product of a virtuous circle of policy action and technology innovation, and its momentum is now sustained by lower costs. Even while economies bent under the weight of Covid-19 lockdowns, renewable sources of energy such as wind and solar PV continued to grow rapidly, and electric vehicles set new sales records.
The opportunities are huge for those that make the leap to the new energy economy. In a scenario that reaches net zero emissions in 2050, we estimate that the annual market opportunity for manufacturers of wind turbines, solar panels, lithium-ion batteries, electroly-sers and fuel cells reaches well above USD 1 trillion by mid-century.
This is comparable in size to the current global oil market. This creates enormous prospects for companies that are well positioned along an expanding set of global supply chains. Even in a much more electrified energy system, there are major openings for fuel suppliers: com-panies producing and delivering low-carbon gases in 2050 are handling the equivalent of almost half of today’s global natural gas market.
However the transformation still has a long way to go. For the moment, every data point showing the speed of change in energy can be countered by another showing the stub-bornness of the status quo. The rapid but uneven economic recovery from last year’s Covid-induced recession is putting major strains on parts of today’s energy system, sparking sharp price rises in natural gas, coal and electricity markets. For all the advances being made by renewables and electric mobility, 2021 is seeing a large rebound in coal and oil use.
Largely for this reason, it is also seeing the second-largest annual increase in CO2 emissions in history. Public spending on sustainable energy in economic recovery packages has only mobilised around one-third of the investment required to jolt the energy system onto a new set of rails, with the largest shortfall in developing economies that continue to face a pressing public health crisis. Progress towards universal energy access has stalled, especially in sub-Saharan Africa.
Commitments made at COP26, if implemented on time and in full, will have strong implications for emissions. If all announced pledges are realised, this would lead to a tem-perature rise of around 1.8°C in 2100 (with a 50% probability). This is the first time that governments have come forward with targets of sufficient ambition to hold global warming to below 2°C.
This is undoubtedly significant, but our assessment needs to be accompanied by two impor-tant elements of context. First, it cannot be taken for granted that governments will implement their pledges on time and in full. In many cases, pledges have not yet been backed up by the strong and credible near-term policies needed to make them a reality.
A scenario based only on today’s policy settings (a sector-by-sector analysis of policies in place and those under development, as in our Stated Polices Scenario in the WEO-2021) leads to a plateau in global energy-related emissions, rather than a rapid reduction. Second, the pledges themselves — even if implemented in full — do not yet put the world on track for a 1.5°C stabilisation in global average temperatures.

47
DECARBONIZATION
Tim Gould is the IEA Chief EconomistThe International Energy Agency (IEA) is an international organization whose mission is to work with governments and industry to shape a secure and sustainable energy future for all. It is recognized worldwide, in particular for its prospective report World Energy Outlook.
Announced pledges would also have strong implications for energy markets. In a scenario where all pledges are implemented, over the period to 2030, low emissions sources of power generation account for the vast majority of capacity additions in this scenario, with annual additions of solar PV and wind approaching 500 gigawatts (GW) by 2030. As a result, coal consumption in the power sector in 2030 is 20% below recent highs. Rapid growth in electric vehicle sales and continued improvements in fuel efficiency lead to a peak in oil demand around 2025. Global gas demand also levels off and start to fall back before 2030, although the trends vary widely by region. Efficiency gains mean that global energy demand plateaus post-2030.
Getting the world on track for 1.5°C requires a surge in annual investment in clean energy projects and infrastructure. Over the coming decade, this will need to more than triple from today’s levels of around USD 1 trillion. An international catalyst is essential to accelerate flows of capital in support of energy transitions and allow developing economies, in particular, to chart a new lower emissions path for development. Most transition-related energy investment will need to be carried out by private developers, consumers and finan-ciers responding to market signals and policies set by governments. Alongside the necessary policy and regulatory reforms, public financial institutions — led by international development banks and larger climate finance commitments from advanced economies — play crucial roles to bring forward investment in areas where private players do not yet see the right balance of risk and reward.
Decarbonization: message from Tim Gould, IEA, october 2021

48
DECARBONIZATION
Decarbonization: message from Morgan Crénès, Enerdata, september 2021
Although the Covid-19 crisis is far from over, it is not to soon to say that the unprecedented drop in CO2 emissions observed in 2020 can be almost entirely explained by conjunctural factors rather than fundamental – decarbonisation related – changes.
With energy consumption and CO2 emissions back to pre-crisis levels, there is an urgent need for breakthroughs at different levels rather than “transitions”.
Limiting the long-term increase in temperature to less than 2°C would require an annual 5% drop in CO2 emissions *. Over the past decade, global CO2 emissions have been increasing by 1% per year on average and the Covid-19 crisis has not changed the trend: 2021 CO2 emissions estimates ** are projected to be only 1% below 2019 pre-crisis level.
By the end of the year most energy efficiency and decarbonisation indicators will have returned to pre-Covid levels, far from being sufficient to meet the Paris Agreement targets.
There is one notable positive trend though, namely the significant growth of new renewables capacities (wind, solar PV), which is not due to halt any time soon.
The main lesson learned from the Covid-19 crisis might be that the huge 2020 impact on economic activity had the same order of magnitude on CO2 emissions than the annual reduc-tion required by a <2°C objective. This clearly shows that drastic changes in energy systems are required to be in line with decarbonisation objectives.
Required breakthroughs have been identified and a rich, comprehensive literature covers the main pillars of energy system decarbonisation: end-use efficiency, electrification, behaviours (“energy sufficiency”), energy supply decarbonization… In theory, we have the recipe, but the current momentum is not strong enough.
On the negative side, 2030 and NDCs *** targets remain insufficient and new decisions addres-sing the short term do not seem to be headed in the right direction. Covid-19 recovery plans are a good illustration of how inadequate current policies are: it is a unique opportunity to trigger fundamental changes toward decarbonisation, and so far, in most countries, it embo-dies the lack of political willingness to change from Business as Usual. As spotted by recent studies, only a small fraction of stimulus packages is dedicated to decarbonisation investments…
On the positive side, one could say that many national and local policies or corporate strate-gies have defined ambitious long-term objectives. Those long-term objectives are getting closer which should trigger, at some point, some concrete measures. And finance could pro-vide a key support with ongoing developments around decarbonisation alignment, transition risks and taxonomy for sustainable activities.
* Energy related CO2 emissions.** https://www.enerdata.net/publications/reports-presentations/world-energy-trends.html*** National Determined Contributions.
Morgan Crénès Head of Data & Research – EnerdataEnerdata is an independent research and consulting firm specialising in the analysis and modelling of the global energy markets and its drivers. Created in 1991, Enerdata now has over 25 years of experience on past and present issues shaping the energy industry.

49
DECARBONIZATION
Decarbonize: how?
Why decarbonize ?The 6th IPCC report published in August 2021 states that global warming now has irreversible consequences for the coming centuries, especially regarding oceans, ice caps and sea level. The 1.5°C rise in temperature — the red line beyond which ecosystems and organisms will be unable to adapt — will be crossed by 2030; this is 10 years earlier than predicted in the pre-vious edition and highlights the acceleration of this phenomenon. For this rise to stabilise, world CO2 emissions would have to decline 40% by 2030 and carbon neutrality must be reached by 2050. This is the target shared by the UN, most countries (led by the EU), and a growing number of economic agents.
Consisting of producers, suppliers and consumers, the energy sector has serious responsibilities in the matter: 75% of GHG emissions result from energy combustion. That said, the absolute necessity to decarbonate energy is not the end of it. Humanity as a whole has to become more respectful of the environment in order to preserve resources and ecosystems. This will undoub-tedly come at a considerable cost, especially given continuing population growth and industria-lisation. But as recent history shows, the cost is tiny compared with that of inaction, with all that means for the damage associated with global warming and natural habitat destruction.
Decarbonization toolsIt will take all the various means of decarbonization to deliver results and strengthen the system’s overall resilience. This chapter presents the main decarbonization tools available to the energy sector, assessing their scope and current stage of development. The list is by no means exhaustive, as it does not include related areas such as reforestation, recycling and digitalisation.
Improving energy efficiency is the number one lever: it applies to the whole chain and still offers real room for improvement in a context of persistent obstacles (know-how, costs, limited profitability when energy is cheap).
RES development, whether electricity or gas (biomethane, green hydrogen), ought to result in nearly complete decarbonization in power generation. It should also tackle specific pockets of resistance, such as transport and intensive industry, while favouring short distribution channels (decentralised production, agricultural waste reuse, unavoidable renewable energy use). RES are discussed in the “Electricity and electricity RES” and “Natural gas and renewable gases” chapters.
TECHNOLOGIES AND POLICY STEPS TOWARDS CARBON NEUTRALITY BY 2050IEA NET ZERO EMISSIONS SCENARIO (NZE 2021)
Source: IEA, Net Zero Emissions 2021
Energy sobriety, largely absent from policies and projects, is probably the most efficient lever, if not the fastest and the cheapest to implement. It is seen as restrictive, however, a feature that is hindering deployment. Covid-19 has changed mentalities on the subject.
Green finance is proving a necessity for the materialisation of energy transition projects that otherwise fall foul of short-termism in loan policies and the excessively demanding returns required in traditional finance.
Lastly, CO2 capture, utilisation and storage may not have the support of environmental diehards but it is capable of decarbonating the final core of CO2 emissions, i.e. the most expensive or most difficult emissions to eliminate.
Activity CO2 emissions
Mitigation measures
Behaviour & avoided demand Energy efficency Hydrogen-based Electrification Bioenergy Wind & solar Other fuel shifts CCUS-100%
+24%
-50%
+51%
2020 20300
45
30
15
GtCO
2
2050

50
DECARBONIZATION
International Energy Agency scenarios (october 2021)
The scenarios* presented by the IEA ahead of the COP26 have several intentions: on the one hand, to measure the impact on climate of the policies in progress (STEPS scenario) and of the pledges given (APS scenario), and on the other hand, to assess the gap that separates them from a carbon neutral trajectory (NZE scenario); the only one capable of keeping the rise in temperatures below +1.5°C.
The underlying objective of the Glasgow conference is carbon neutrality by 2050, a target claimed by the IPCC in its 6th report of August 2021 and which many governments have made their own. However, the commitments given by states, while never before so ambitious, will not be enough to stabilise temperatures, as the comparison with the radical "Net Zero Emission" scenario shows.
Why COP26 pledges are insufficient?
Clean energy investments: their doubling in over the next decade is not sufficient to over-come the energy system inertia.
Sharp divergences between the countries’ pledges concerning the rapidity of implementing their energy transitions.
The major difficulty is the crucial period to 2030, the actions in APS fall well short that would be required to keep the door open to a Net Zero Emissions by 2050 trajectory (covers only 20% of the needed reduction in 2030). All countries need to do more to align and strengthen their 2030 goals.
International crispation: the current pledges contain the seeds of new divisions and ten-sions, in the areas of trade in energy-intensive goods or in international investment and finance. Net Zero achievement depends on collaborative global transition in which no one is left behind.
WEO 2021 highlights four key measures to close the gap between today’s pledges and 1.5°C trajectory over the next ten years — and to underpin further emissions reductions after.
Additional push for clean electrification: doubling APS solar PV and wind deployment. Accelerating decarbonization of the electricity mix fills 1/3 of CO2 gap between APS and NZE.
Focus on energy efficiency (+4%/year in NZE).
A broad drive to cut methane emissions from fossil fuel operations: key tool to limit near-term global warming and 15% of the gap between APS and NZE.
Boost clean energy innovation, particularly for energy-intensive sector (cement, steel, long distance transport). CCS and hydrogen are critical for producers and both faces technological and commercial obstacles that must be overcome.
* Source: IEA, World Energy Outlook 2021.

51
DECARBONIZATION
CO2 EMISSIONS IN THE WEO 2021 SCENARIOS OVER TIME
OIL, NATURAL GAS, COAL AND LOW EMISSIONS FUEL USE TO 2050
Historical STEPS APS NZE Source: IEA, World Energy Outlook 2021
Existing scenarios Stated Policies Scenario (STEPS): reflects measures actually put in place by govern-
ments, as well as policy initiatives under development. It holds a mirror to current plans and illustrate their consequences: Global average temperatures are still rising when they hit 2.6 °C above pre-industrial levels in 2100.
Sustainable Development Scenario (SDS) was designed to achieve Paris Agreement; the rise in climate ambitions leads IEA to move to zero carbon scenarios but SDS is still shown as a landmark. Global CO2 emissions fall to 8 Mt in 2050 and towards net zero by 2070.Temperature should peak in 2100 at around 1.7°C pre-industrial levels.
New scenarios Announced Pledges Scenario (APS): implementation of all climate commitments made
by Governments around the world, net zero pledges and NDCs, in time and full.Over the period to 2030, low emissions sources of power generation account for the vast majority of capacity additions and CO2 curve down; coal consumption in the power sector is 20% below recent highs; rapid growth in electric vehicle sales and continued improve-ments in fuel efficiency lead to a peak in oil demand around 2025. Efficiency gains mean that global energy demand plateaus post-2030.Over the period to 2050, considering that all announced pledges are pursued successfully, then global energy-related CO2 emissions fall by 40% — all sectors see a decline, with the electricity sector delivering by far the largest.Temperature rises in 2100 around +2.1°C; this scenario does not hit net zero emissions, so temperature not stabilized.
Net Zero Emission (NZE): temperature stabilized at +1.5°C.
Narrow but achievable pathway for the global energy sector to achieve net zero CO2 emissions by 2050.Total CO2 emissions would need to fall around 40% by 2030 (to 21 Gt, 7 Gt lower than SDS). Requires an unprecedented mobilisation of resources worldwide and all members of society, and not only the energy sector.
International Energy Agency scenarios (october 2021)
GtCO
2
30
40
10
20
02040 20502000 2010 2020 2030
APS
STEPS
Historical
NZE
SDS
20502000 20502000 20502000 20502000Gt
CO2
150
200
50
100
0
Oil Natural gas Coal Low emissions

52
DECARBONIZATION
International Energy Agency scenarios (october 2021)
ENERGY DEMAND AND CO2 EMISSIONS BY SCENARIO (IEA)
Energy demand in Mtoe
World Stated Policies Scenario Announced Pledges Scenario Sustainable Development Net Zero Emissions by 2050
2010 2020 Share 2020 (%)
2030 2050 Share 2050 (%)
AAGR (%) 2020-2050
2030 2050 Share 2050 (%)
AAGR (%) 2020-2050
2030 2050 Share 2050 (%)
AAGR (%) 2020-2050
2030 2050 Share 2050 (%)
AAGR (%) 2020-2050
Total primary demand 13,017 14,068 100% 16,027 17,768 100% 0.8% 15,551 16,108 100% 0.5% 14,312 13,803 100% -0.1% 13,067 12,969 100% -0.3%
Coal 3,654 3,721 26% 3,587 2,790 16% -1.0% 3,380 1,870 12% -2.3% 2,651 831 6% -4.9% 1,717 411 3% -7.1%
Oil 4,111 4,094 29% 4,741 4,736 27% 0.5% 4,421 3,525 22% -0.5% 4,020 2,135 15% -2.1% 3,282 1,008 8% -4.6%
Natural gas 2,749 3,313 24% 3,724 4,156 23% 0.8% 3,499 3,181 20% -0.1% 3,327 2,035 15% -1.6% 3,091 1,450 11% -2.7%
Nuclear 719 702 5% 812 967 5% 1.1% 855 1,158 7% 1.7% 884 1,228 9% 1.9% 989 1,447 11% 2.4%
Total renewables 1,139 1,636 12% 2,603 4,598 26% 3.5% 2,880 5,933 37% 4.4% 3,408 7,557 55% 5.2% 3,979 8,649 67% 5.7%
Solar 19 112 1% 380 1,039 6% 7.7% 456 1,533 10% 9.1% 568 2,061 15% 10.2% 764 2,606 20% 11.1%
Wind 29 136 1% 344 748 4% 5.8% 430 1,228 8% 7.6% 516 1,502 11% 8.3% 681 2,123 16% 9.6%
Hydro 296 373 3% 437 580 3% 1.5% 437 590 4% 1.5% 463 681 5% 2.0% 504 728 6% 2.3%
Modern Bioenergy 733 903 6% 1,254 1,815 10% 2.4% 1,354 2,119 13% 2.9% 1,576 2,546 18% 3.5% 1,713 2,431 19% 3.4%
Other renewables 62 112 1% 189 420 2% 4.5% 203 466 3% 4.9% 287 767 6% 6.6% 315 760 6% 6.6%
Solid Biomass 626 576 4% 502 411 2% -1.1% 494 408 3% -1.1% – – – – – – – –
World CO2 emissions in Mt
2010 2020 Share 2020 (%)
2030 2050 Share 2050 (%)
AAGR (%) 2020-2050
2030 2050 Share 2050 (%)
AAGR (%) 2020-2050
2030 2050 Share 2050 (%)
AAGR (%) 2020-2050
2030 2050 Share 2050 (%)
AAGR (%) 2020-2050
Total CO2 32,345 34,156 100% 36,267 33,903 100% -0.0 33,640 20,726 100% -1.7 28,487 8,170 100% -4.7 21,147 0 – –
Coal 13,828 14,240 42% 13,487 10,277 30% -1.1 12,614 5,713 28% -3.0 9,493 1,395 17% -7.5 5,915 195 – -13.3
Oil 10,530 10,123 30% 11,693 11,468 34% 0.4 10,754 7,988 39% -0.8 9,571 3,986 49% -3.1 7,426 928 – -7.7
Natural gas 6,040 7,165 21% 8,091 9,123 27% 0.8 7,415 6,087 29% -0.5 6,931 2,799 34% -3.1 5,960 566 – -8.1
Power sector 12,380 13,530 40% 12,425 9,915 29% -1.0 11,375 5,506 27% -3.0 8,891 887 11% -8.7 5,816 -369 – -
Coal 8,933 9,832 29% 8,791 6,100 18% -1.6 8,056 3,045 15% -3.8 5,741 179 2% -12.5 2,950 69 – -15.2
Oil 826 601 2% 412 256 1% -2.8 374 238 1% -3.0 290 121 1% -5.2 173 6 – -14.1
Natural gas 2,621 3,097 9% 3,222 3,559 10% 0.5 2,976 2,524 12% -0.7 2,888 990 12% -3.7 2,781 128 – -10.1
Source: IEA, World Energy Outlook 2021

53
DECARBONIZATION
GLOBAL MEDIUM SURFACE TEMPERATURE RISE OVER TIME IN THE WEO 2021 SCENARIOS
Source: IEA, World Energy Outlook 2021
°C
0.5
0
1
1.5
2
2.5
3
2080 21002000 2020 2040 2060
APS
STEPS
NZESDS
International Energy Agency scenarios (october 2021)The temperatures rise by 2100: +2.6°C in STEPS, +2.1° in APS, +1.7° in SDS and +1.5° in NZE

54
DECARBONIZATION
Energy efficiencyThe potential for energy efficiency remains largely untapped; the problem is not the technology, but systems and habits that need a fundamental rethink
Energy efficiency is one of the main weapons in the fight against global warming and a critical part of energy transition. It shall reduce CO2 emissions by nearly 40% and faci-litate decarbonisation in other sectors by making it cheaper and easier.
This effort has to focus on several areas: extensive renovation of the world’s housing stock, not only in terms of the buildings themselves but also in terms of their equipment; imposing new standards and supporting them with public funds; the digitalisation and management of demand applied to networks, heating and cooling of buildings and in transport; changing behaviour, notably in respect of transport and smart meters; and, in the industrial sector, introducing objectives, regulations, incentives and tools (energy audits, digital management systems, financing).
Energy intensity — energy demand per unit of GDP — is the usual way we measure changes in energy efficiency. It is sensitive to other factors, however, notably structural changes in the economy, exchange rates and outliers such as the Covid pandemic. Measuring energy efficiency on its own typically involves using constant currency rates and purchasing power parities.
Energy efficiency has improved so much worldwide over the past two decades that it is already the main component of energy services and one of the largest energy ‘resources’ in many countries. It has enabled energy consumption to contract nearly 20% over the period in the world’s major economies (IEA members, Argentina, Brazil, Indonesia, Russia, South Africa). This is the equivalent of a 12% reduction in final demand and has avoided an additio-nal 12% in GHG emissions.
The trend represents an almost 2% annual average decline in energy intensity, although the fall has been slower in recent years (-1.5% in 2018, -1.6% in 2019). The lesser decline recorded in 2020 (-0.8%) is not very meaningful, as the economic recession prevented the correct measurement of energy use.
TRENDS IN ENERGY INTENSITY IN G20 COUNTRIES (%/YEAR)
* Energy intensity: energy consumption / GDP. Source: Enerdata
ENERGY INTENSITY PROJECTION – WORLD
IEA STEPS (-2%/year) IEA APS (-2.1%/year) IEA NET ZERO (-3.7%/year) Extension year 2010-2020 (-2.2%/year)
Sources: IEA, World Energy Outlook 2021; Enerdata, Global, Energy
and CO2 data, 2021
Transition not initiatedNB : Energy intensity: number of tonnes of oil equivalent per $1000 of GDP at purchasing power parity.
G20 OECD Non OECD IndiaChina Russia Brazil USA JapanEUIn
%
-2
-4
-6
0
2
4
6
2019 2020 2021 Total 2005-2018
Teo/
1,00
0$ P
PA
0.140.13
0.10
0.08
0.120.11
0.09
0.060.07
0.030.040.05 (-2.1%/an)
(-2.2%/an)
(-3.7%/an)
(-2%/an)
2050204520402010 2015 2020 2025 2030 2035

55
DECARBONIZATION
Energy efficiency
The downtrend in world energy intensity does not appear to have accelerated during the current decade. Set to remain close to -2% per year (STEPS scenario), it would need to nearly double (to -3.7%) to meet the carbon neutral trajectory (NZE scenario). If imple-mented, current national commitments will mean only a very slight improvement (-2.1%). But this global picture masks major regional differences; current efforts in developed countries will allow energy consumption growth to be cut by two thirds, while this contribution falls to a quarter in developing countries.
Improving efficiency depends largely on investment, and this was relatively low in 2021 at almost $300 bn. The energy transition requires a great deal more: according to the IEA’s SDS scenario, investment has to double by 2030 (to $577 bn/year) and near $900 bn by 2050. Because of its efficiency/cost ratio, energy efficiency is the main mission reduction factor in this scenario. The recent increase in energy efficiency investment dedicated to buildings in Europe (from $70 bn in 2019 to $100 bn in 2021) demonstrates the importance of support policies ($30 bn in Germany, $7 bn in France, “Superbonus” of 110% of renovation expenses in Italy, etc.).The USA and China also obtained results in this area.
Substantial untapped energy efficiency potential remains. The drive towards more energy efficiency particularly concerns transport and buildings.
Buildings are a key source of improvements in energy efficiency. They represent a third of final energy demand, of which 80% is heating. Efficiency gains can be made in housing and household equipment energy performance, primarily through the renovation of existing buil-dings. Substantial renovation efforts are required: currently, only 1% of the housing stock is renovated each year, and tangible reductions in heating consumption would require at least 4%. Full implementation would reduce building consumption by 40% per square metre.
Transport also offers significant potential: it represents 25% of final energy demand and nearly 40% of CO2 emissions (final demand). According to the IEA, unit consumption (per km) could be cut by 30% through improved combustion engine efficiency, extended hybridisation, reduced car size and tyre friction and vehicle electrification, this technology having become much more efficient.
In the European Union, energy efficiency policies gain momentumWith buildings representing nearly 40% of final energy consumption and 30% of CO2 emissions, the EU agreed in November 2018 — within the Clean Energy Package — on a non-legally binding commitment to improve energy efficiency by 32.5% by 2030. At the same time, the directive on buildings energy performance was revised to include ambi-tious thermal renovation objectives such as near-zero energy buildings by 2050. It plans heavy investment in new technologies, such as smart grids, to lower energy consumption in buildings.
The April 2021 European Green Deal raised the energy efficiency objectives to 36-39% by 2030 for primary and final energy consumption. It intends to at least double the ave-rage thermal renovation rates of housing stocks in Member States (currently between 0.4% and 1.2%). This represents 35 million renovated buildings and 160,000 jobs created by 2030, and €175 bn financing by 2027.
At the same time, the European recovery plan includes €57 bn for energy efficiency, of which 40% in buildings renovation, 30% in electrical cars, 20% in urban infrastructure and less than 1% in industry.
GLOBAL INVESTMENT IN ENERGY EFFICIENCY BY SECTOR
Transports Industry Buildings
Sources: IEA, World Energy Investments, juin 2021
Billio
n US
D (2
019)
350
300
250
200
150
100
50
02014 2015 2016 2017 2018 2019 2020 2021E

56
DECARBONIZATION
Energy sobrietyNo longer confined to local initiatives, energy sobriety is now under the spotlight and has made its way into carbon neutrality scenarios
Energy efficiency has long been overlooked but is now emerging as a crucial lever in the fight against global warming. Reducing energy consumption through changes in behaviour, lifestyle and social organisation extends the logic of the 1987 Bruntland report*, which highlights the necessity of compromising between social needs and the ecosystem’s environmental limits.
Based on societal shifts rather than technical progress, energy sobriety does not hinge on financing capacity and resource availability. It can therefore reduce emissions in a definite and efficient manner. But it has to complement energy efficiency if it is to avoid a potential rebound as efficiency improves.
A society committed to energy sobriety would alter its social norms, perceptions of individual needs and collective organisation to obtain a voluntary and orderly reduction in energy consumption. This collective effort would both limit the negative externalities associated with consumption and production (pollution, noise, health problems, etc.) and, more broadly, improve quality of life. It entails measures such as limiting room temperature at home, redu-cing the number of electronic devices, promoting cycling and working more from home, in other words “doing less to use less” (see table). In the context of climate emergency, more radical measures have also been suggested, notably by young people. Sweden’s flygskam (‘flight shame’) initiative is a good example.
Current energy sobriety strategies mainly consist of incentives to reduce energy consumption, usually at local level. The effectiveness of individual schemes has been measured and a great many practical examples have been collated. The Energise** consortium lists 1,067 sustainable energy consumption initiatives in the EU, covering a wide variety of local projects. For example, France’s Familles à énergie positive (‘positive energy families’) initiative promoted energy savings in 30,000 households, resulting in a average 12% reduc-tion in consumption. Similarly, the ‘2,000-watt society’*** campaign in Zurich reduced primary energy consumption from 5,000 W to 4,200 W per inhabitant in ten years. In the USA, car sharing has lowered household fuel consumption by 5% by saving duplicated mileage and via parking infrastructure savings.
That said, energy sobriety does not yet feature on a large scale in any transition programme. It is marginalised in most energy policies and scenarios, mainly because of its persistent image as a constraint. In political and economic terms it is mainly regarded as incompatible with the growth model that continues to drive public policy, although a few timid attempts are being made to challenge this orthodoxy. At the level of the individual, the notion of energy temperance that it promotes contradicts perceptions of comfort and predo-minant social norms that are still based largely on material abundance and consumerism. And in a more general sense it raises the question of how reducing consumption can be achieved equitably when many households are still threatened by energy poverty.
* The so-called Brundtland report, officially entitled “Our common future” was written in 1987 by the United Nations’ World Commission on Environment and Development. It is in this report, which served as a basis to the 1992 Earth Summit, that the expression “sustainable development” first appeared.** Energise: Network for research, good practice and innovation for sustainable energy.*** The 2,000-watt society concept aims at reducing primary energy consumption down to 2,000 watts and GHG emissions down to 1 t CO2 equivalent per person and per year. These two sets of data are calculated from final consumption by applying primary energy factors or GHG emission coefficients.
DIFFERENT TYPES OF ENERGY SOBRIETY MEASURES
INDIVIDUAL LEVEL COLLECTIVE LEVEL
USE
USAGE SUFFICIENCYLimitation of the level and duration of equipment use.
e.g., speed reduction, repairing, eco-design…
COLLABORATIVE SUFFICIENCYCollective organizations and pooling of goods.
e.g., carpooling, house share, third places…
DE
SIG
N SIZING SUFFICIENCYAdaptation of equipment sizing to needs.
e.g.,room temperature, car size, reduced diet…
SPACIAL ORGANIZATION SUFFICIENCYCollective incentive organization (land use planning).
e.g., urban design, circular economy, local distribution…
Source: NégaWat

57
DECARBONIZATION
Energy sobriety
The Covid pandemic changed the game not only by imposing “sober” behaviours through lock down and prevention measures, but it also highlighted ecosystem and supply chain vulnerability.
Among the major shifts brought on by the pandemic, some will last:
Increased teleworking and digitalisation: a third of the world’s workforce is expected to keep working from home at least part of the time post-crisis (source: Global Workplace Analytics, 2020)
Reduced air traffic: airlines expect a permanent change in travel patterns, with less business travel (source: Sorensen, 2020; Boone et al., 2020).
Other attitudes could change, notably in areas such as consumption, prudential savings, health and food security, less concentration and relocation, local and circular economy, and reduced mobility.
Recent studies * in France show a distinct move towards sobriety: for 57% of French people (against 27% in 2017) consuming less is a factor in their savings, while 76% of consumers pay regard to whether the goods they buy are produced locally or not. They desire to eat better and ‘bio’ in particular, and have added vegetables to their diet. More and more consumers are opting for second-hand goods, and 76% of respondents said they consider the use of a good to be more important than possessing (up from 65% in 2010). Flying for leisure travel is becoming less popular, with 43% of respondents claiming to have already stopped (7% more than in 2018). Materialistic values appear to be waning in favour of of self-realisation and new forms of living; pioneering sobriety initiatives are emerging among individuals and small groups, with some development on a larger, regional scale.
At the same time, a substantial proportion of the population is not following this trend. Frugality remains a choice made by the wealthiest classes; among the poorer people it is something to be endured rather than embraced. Most French people remain attached to consumption. As with other issues, Covid-19 has widened the ‘sobriety gap’ between different parts of the population.
Sobriety is featuring more in net zero targets
Energy sobriety has scarcely been been mentioned in long term trajectories so far. One excep-tion is “NégaWatt 2050”, a scenario in which sobriety could reduce energy demand 28% by 2050 (in this France-based study, a total reduction of 50% would require the remaining 22% to stem from energy efficiency). Although several sobriety measures are mentioned in the the IEA’s SDS, Greenpeace’s Energy [R] and BP’s Rapid Transition 2°C scenarios – the circular economy and modal transfers, for example – the concept of sobriety is not identified as such and these scenarios offer no proactive global approach to it.
More onerous climate ambitions have had a definite impact, as the Net-Zero scenario publi-shed by the IEA in April 2021 shows: active citizen participation is now considered indispen-sable to meet the carbon neutrality objective by 2050. Changing behaviour could reduce world energy demand by 10% and cumulative emissions by 10% as well by 2050; transport is the most sensitive sector. Three economic areas are prioritised: excessive or wasteful energy consumption, alternative transport modes, material efficiency gains. To reach the same emission level by 2030, no change in behaviour means a much larger burden on low emission technologies.
Out of the 35 Gt CO2 emission reduction by 2050, 8% relies entirely on behavioural and mate-rial efficiency gains (e.g. fly less) and 55% on a combination of low-carbon technologies and citizen-level commitments (e.g. purchasing electric vehicle, installing solar heaters).
* CREDOC: “Consommation et modes de vie”, February 2021; GreenFlex/ADEME: ”Baromètre de la consommation responsible”, April 2021; Obsoco/ADEME: “Les perspectives utopiques des Français au temps du Covid-19”, June 2021.

58
DECARBONIZATION
Sustainable financeThe sustainability issue is attracting attention from the financial markets
Sustainable finance seeks to reconcile economic efficiency, client protection and general interest by including social, societal and environmental criteria. Within that concept, green finance covers all financial transactions aimed at supporting sustainable deve-lopment, including fighting global warming. It also comprises initiatives from the financial regulation and supervision authorities that contribute to these objectives. It is a fundamental lever of energy transition. French President Emmanuel Macron described finance as a key weapon war at the Climate Summit in April 2021.
The main tools of sustainable finance are debt instruments, bonds or loans that foster envi-ronmental and social progress (so-called sustainable debt). There are two categories. In the first, the issuer or borrower commits to use the funds to finance or refinance environmental and/or environmental projects. This includes green bonds (46% of the sustainable debt mar-ket), green loans (17%), social bonds (11%) and sustainability bonds (8%), aimed at both envi-ronmental and social projects. In the second category, the use of funds is not constrained and it is the issuer or borrower’s performance in relation to sustainable development indicators that matters. This includes sustainability-linked loans (17% of the sustainable debt market) and sustainability-linked bonds (2%). Transition bonds have also been introduced to the mar-ket. They are not strictly ‘green’, but they play a part in energy transition as they are issued by polluting industries to finance their conversion to cleaner operations.
Despite the Covid-19 pandemic, the sustainable finance market set issuance records in 2020: a total $732 bn, up 29% from 2019. The increase was not as significant as the 83% rise obser-ved between 2018 and 2019, but left cumulative issuance at $2,300 bn at end-2020. Sustainability bonds and green bonds issuance increased by 74% and 13%, respectively, and the cumulative total for the latter now exceeds $1,000 bn. Social bond issuance jumped by a spectacular 720% - it is used to maintain or revive the economy after the pandemic. Issuers include the EU, Unédic (French unemployment insurance) and the African Development Bank. Sustainability-linked loans and green loans issuance dropped 15%, but this decline is consi-dered moderate in view of crisis-related economic difficulties. Bloomberg foresees a market worth more than $3,000 bn in 2021.
SUSTAINABLE DEBT ANNUAL ISSUANCE, WORLD
More broadly, sustainable finance growth fits in with a growing interest for ESG-related investments (environmental, social, governance). ESG fund outstandings have expanded signi-ficantly over the past two years. According to Bloomberg, by 2025 ESG assets could represent a third of world assets under management, or $53,000 bn. Commitments from many compa-nies to reach carbon neutrality by 2050 (2045 for Engie’s Scopes 1, 2 and 3) are reinforcing this trend. Lastly, investors have become more and more conscious of the risks associated with climate change (1) and their negative effects on investments. They are more demanding about companies and issuers with regards to ESG information. Many share indexes have been introduced to identify and follow these “sustainable” companies.
*The Task-Force on Climate-Related Financial Disclosures divides climate-related risks into two categories: physical risks, linked to damages that are induced directly by weather and climate phenomenon; and transition risks, related to the implementation of a low carbon economic model.
Sustainability linked bond Sustainability bond Green loan Sustainability linked loan Social bond Green bond
Source: Bloomberg NEF2012 2013 2014 2015 2016 2017 2018 2019 2020
800
700
600
400
500
300
200
100
0
Issua
nce
($ b
illion
)
31.4 26.664.5 85.1
145.8
237.9309.3
565.5
732.1

59
DECARBONIZATION
Sustainable financeSustainable finance regulation and its limits
The development of sustainable finance was promoted by the creation of standards and their harmonisation on a global scale. The International Capital Market Association is the guardian and issuer of sustainable finance principles and guidelines. Its latest updates contributed to increase transparency and strengthen reliability, notably on the use of funds raised and the disclosure of information. States also work at regulating sustainable finance, in particular the UK, Hong Kong and within the EU.
Climate risks could therefore have a substantial impact on financial stability as well as price stability. They could also affect the value and the risk profile of assets on central bank balance sheets. For this reason, the ECB came up with a roadmap for the 2021-2024 period in early July 2021 that integrates climate change in its monetary policy. Climate issues are to be taken into consideration in macroeconomic analysis, monetary policy frameworks, risk assessment and collateral and asset purchase mechanisms.
Despite clarification and normalisation efforts, the ability of sustainable finance to support ecological transition remains precarious.Some sustainable finance criteria lack clarity or show little connection to sustainable projects. This the case of transition bonds, which some players may be tempted to use for greenwas-hing purposes. Sustainability-linked bonds do not finance sustainable projects directly but are linked to self-assessed performance indicators, for example. Thus Total was able to commit in January 2021 to issued only this type of debt although it continues to fund fossil fuel exploration projects.
Banks are still massive investors in fossil fuels. “Banking on Climate Chaos 2021”, an annual publication written by six NGOs, revealed that the 60 world largest banks have lent $3,800 bn to companies working in the oil, gas and coal sectors since the Paris Agreement, with France ranking fourth in the world and Europe first. This is more than the entire sustainable finance market (about $3,000 bn).
This situation demands more drastic regulation that promotes green over brown yields. For some analysts *, the limits to green finance stem from the very way the financial system works: it is ill-adapted to favour a transition towards a low carbon economy. As a lever, finance has a fundamental and undisputed role in curtailing climate change, but at the same time it is incapable to treat the problem by itself without more constraining regulations.
Shifting funds towards transition requires a change in green risk-reward profiles relative to brown investments. This means biasing market prices so that players are prompted to turn to green assets. There are three possibilities: increasing green yields through subsidies, ero-ding brown yields through tax, or lowering green risks through state guarantees. The NGOs Les Amis de la Terre and Oxfam France suggest a legal obligation for large companies – backed by financial penalties – to stick to a downward trajectory on their carbon footprint and pol-luting activities.
* “L’illusion de la Finance verte”, May 2021, Alain Grandjean and Julien Lefournier, Éditions de l’Atelier.
VARIETIES OF SUSTAINABILITY-THEMED DEBT
GREEN BOND: proceeds used for elegible
environmental activities
SOCIAL BONDS: proceeds used for elegible social
activities
SUSTAINABLE DEBT: bonds and loans
SUSTAINABILITY-LINKED BOND: Issuer commits to green and/or social target
GREEN LOAN: proceeds used for elegible
environmental activities
SUSTAINABILITY BOND: proceeds used
for activities with environmental and social
benefits
SUSTAINABILITY-LINKED LOAN: Issuer commits to
green and/or social target
BEHAVIOR-BASED: No Proceeds requirements, debt linked to company green/social performance
ACTIVITY-BASED: Proceeds earmarked for eligible activities
Source: BloombergNEF

60
DECARBONIZATION
Carbon Capture, Utilisation and Storage (CCUS)Under the pressure of net zero commitments, and thanks to some countries’ support, interest in CCUS rebounded in 2021 with numerous new projects
CO2 capture and storage projects have multiplied since early 2021, driven by increa-sing environmental pressure, lower costs, stronger commercial interests and finan-cial commitments in certain countries. By the end of September 2021, CCUS projects worldwide reached a total capacity of 111 million tonnes per annum (Mtpa), a 52% rise from their end-2020 level (73 Mtpa) according to the Global CCS Institute.
Because of CCS tax credits, most projects are in North America. Over 40 projects were announced this year, including the Houston Ship Channel, a huge Exxon Mobile concept. In Europe, encouraged by stricter emission targets and high carbon prices, 35 projects are under way, 17 of which were introduced this year in the UK, Belgium, Norway and the Netherlands. In the Asia-Pacific region, projects related to gas development have been recently approved in Indonesia and Malaysia.
Altogether, would increase CCS capacity from the current 44 Mtpa to nearly 190 Mtpa by 2030. Underpinned by growing decarbonization expectations within companies and states, lower costs (see cost range on next slide) and heightened commercial interest are also driving this boom.
In the early 2000s CCS was considered as a key technology towards decarbonization, in par-ticular for coal-fired power plants. This failed to happen and large-scale commercial develop-ment is rare. This reflects a lack of regulation and incentives, severe competition from alternative technologies, lukewarm public approval and excessively low carbon prices. In addition, major issues remain unsettled, such as the long term reliability of underground storage. CCUS projects started to re-emerge in 2017. To date there are 63 CCUS commercial installations in the world: 26 in operation, 3 under construction, 13 in FEED study stage and 21 in initial development
The major players in the deployment of CCS technology are essentially oil and gas companies, industrial gas players, and gas transport infrastructure operators preparing diversification. Most interested clients are large industrials willing to reduce their footprint in carbon intensive sec-tors, such as steel, cement or hydrogen production, as well as thermal power production.
Carbon utilisation is mainly driven by the oil industry’s need to ‘cushion’ its gas and Enhanced Oil Recovery (EOR)* (22 out of the 26 operating facilities).
But new utilisation opportunities have emerged. As a raw material, carbon can be used in combination with renewable hydrogen in the manufacture of low carbon products, such as synthetic fuels (e-methane, e-kerosene, e-methanol, other e-fuels); it can also be used in construction materials and in some industrial chemical applications.
Subject to an amendment of the regulatory framework, this would allow decarbonization in sectors that are impossible to electrify while developing CO2 circular economy. This would imply to use at first CO2 that has been emitted in the atmosphere, and in the longer term biogenic CO2, or even CO2 directly captured in the environment, for a carbon neutral cycle. Air and maritime transport sectors have an interest in these products as they are obliged to decarbonise and incorporate decarbonised fuels.
*Enhanced Oil Recovery, or EOR, is a technic allowing to extract more oil from the oil fields by injecting CO2 and water.

61
DECARBONIZATION
Carbon Capture, Utilisation and Storage (CCUS)With almost 190 MtCO2/year, CCUS increases but remains modest by 2030 compared to the volume of CO2 emitted into the atmosphere
COST ESTIMATES FOR CO2 CAPTURE
REPORTED GLOBAL CAPTURE CAPACITY BY EMISSION SOURCE
High uncertainties for low concentration sources due to few installations in operation.Soon, the growth of CCUS will be driven by electricity production and hydrogen production. In 2030, announced gas-fired power plant projects will account for 18 Mt of captured CO2.
CO2 Sources CO2 capture cost indications
CO
2 c
on
cen
trat
ion
Ethanol 15-25 $/t
Natural gas processingVery low to low
25-35 $/t
Blue H2 (chemical reaction) 25-70 $/t
Ammonia 15-25 $/t
Iron & Steel 50-80 $/t
CementLow to medium
40-120 $/t
Coal 60-80 $/t
Gas Lack of experience, dependance on load factor
50-100 $/t
Atmoshere Very high 135-330 $/t
Source: ENGIE Impact 2021
Other, various in evaluation
Fossil Fuels Processing
Hydrogen production
Power generation (Gas)
Power generation (Others)
Chemicals
Cement, Iron & Steel
Air (DAC)
Source: BNEF 2021
2021 2022 2023 2024 2025 2026 2027 2028 2029 2030
200
0
20
40
60
80
100
120
140
160
180
MtC
O 2
The future of CCUS still depends on political will and public support. Currently opera-ting CCUS installations can capture and store on an ongoing basis 40 Mt CO2/year (against 28 Mt CO2/year in 2015), representing 0.1 % of world annual fossil fuel-related emissions. Opponents say that such a small volume means that CCUS is a waste of money that promotes the continued use of polluting fossil fuels, especially coal.
Nevertheless, several organisations, including the IEA, consider CCUS as an essential tool to reach carbon neutrality by 2050. The coming COP26 will discuss the economics of CCUS pro-jects and the introduction by governments of regulatory frameworks that acknowledge and promote CCUS as an alternative means of reducing emissions.
To comply with the Paris Agreement trajectory, CCUS capacity would have to rise by 350 Mt every year until 2030 and reach 5 Gt by 2050, according to the IEA’s SDS scenario. The more ambitious IEA Net Zero scenario would need the capture of 20% of current emissions (7.6 Gt) by 2050 to reach carbon neutrality. This implies processing half of fossil fuels in CCUS facilities by that time. According to the IEA’s sensitivity analysis, not developing CCUS is by far the most expensive option.


ELECTRICITY & ELECTRICAL RENEWABLES
Electricity and energy transition . . . . . . . . . 64
Production capacity . . . . . . . . . . . . . . . . . . . . 69
Consumption . . . . . . . . . . . . . . . . . . . . . . . . . . 74
Production . . . . . . . . . . . . . . . . . . . . . . . . . . . . 76
Prices . . . . . . . . . . . . . . . . . . . . . . . . . . . . . . . . 81
CAPACITY
Renewables capacity is expanding rapidly in advanced economies but funding remains a major challenge for developing countries
PRODUCTION
Coal-powered plants are operating flat out to meet soaring demand for electricity
Electricity & Electrical renewables
63

64
ELECTRICITY & ELECTRICAL RENEWABLES
Electricity and energy transitionDecarbonising the electricity sector is the primary lever in fast action to meet climate objectives
At the forefront of energy transition, the power sector has seen the rapid develop-ment of renewables and growing electrification of uses. Improved competitiveness, stronger policies and the tangible influence of environmental criteria have contributed to substantial progress in RES deployment without adverse impact from the Covid crisis. The transformation of power production remains a major challenge, however: electricity repre-sents only 20% of final demand but generates 45% of total energy combustion-related CO2 emissions. Reaching IEA targets as set out in the carbon neutral scenario (NZE) still requires a colossal effort.
Accelerating decarbonization is imperative. Even though RES production has doubled over the past 20 years, the share of low carbon technologies is stuck at 36% of the world electricity mix. Carbon neutrality infers that clean technologies, essentially RES, meet almost all electricity demand, which itself is increasing by 3% per year. The limited improvement in carbon intensity* is another sign of how slow progress is. Apart from 2020 (-3%), which was an exceptional year because of lower demand and reduced thermal generation, carbon inten-sity has been dropping by 1% per year; the climate emergency requires a 6% drop per year out to 2030. The continuing use of coal - 35% of electricity generation - is the main culprit.
The current decade is crucial for electricity. The sector must exit coal (80% of coal is used to produce electricity), double production capacity to cope with increasing electrification and reduce its emissions by 8% per year out to 2030.
* Electricity carbon intensity: 435 gr CO2/kWh in 2020.
The growing use of electricity and the increasing share of RES raise questions around the resilience and security of electricity supply systems. The intermittency of renewable production, notably in solar and wind power, makes the balancing of electricity supply with demand a critical issue. Flexibility is a prominent concern. Major power cuts in several regions (Texas, Japan, China) in 2021 as a result of extreme temperatures and droughts are a case in point. The large-scale deployment of renewable technologies remain controversial, however. Key questions include the extraction of the rare metals needed to produce PV panels and batteries, the unpopularity of windfarm development in many areas and the release of methane from some hydroelectric dams.

65
ELECTRICITY & ELECTRICAL RENEWABLES
Electricity and energy transition
RENEWABLE ELECTRICITY GENERATION FORECASTS – WORLD COAL-FIRED POWER GENERATION FORECASTS – WORLD
IEA NET ZERO (+0%/year) IEA SDS (+7.7%/year) IEA APS (+6.8%/year) IEA STEPS (+5.3%/year) Extension years 2010-2020 (+5.8%/year) Extension year 2020 (+6.1%/year) Historical (Enerdata)
Source: IEA, World Energy Outlook 2021; Enerdata, Global Energy & CO2 Data, 2021
IEA STEPS (-1.3%/year) IEA APS (-2.5%/year) IEA SDS (-8.4%/year) IEA NET ZERO (+0%/year) Extension years 2010-2020 (+0.8%/year) Extension year 2020 (-4.4%/year) Historical (Enerdata)
Source: IEA, World Energy Outlook 2021; Enerdata, Global Energy & CO2 Data, 2021
Transition not initiated Transition started but dynamic too slow
Historical (Enerdata)
(+6.8%/year)
(0%/year)
(+7.7%/year)
(+5.3%/year)
(+6.1%/year)(+5.8%/year)
Elect
ricity
gen
erat
ion
(TW
h)
80,000
60,000
40,000
20,000
020402010 2015 2020 2025 2030 2035 20502045
(-2.5%/year)
(-8.4%/year)
(+5.3%/year)
(0.8%/year)
(+5.8%/year)
12,500
7,500
10,000
5,000
2,500
0
Historical (Enerdata)
(0%/year)
Elect
ricity
gen
erat
ion
(TW
h)
20402010 2015 2020 2025 2030 2035 20502045

66
ELECTRICITY & ELECTRICAL RENEWABLES
Electricity and energy transition: production capacity forecasts
ELECTRICITY CAPACITY FORECASTS BY SCENARIO (GW)
Electricity capacity forecasts, in GW
2020
Stated Policies Scenario Announced pledges Scenario Sustainable Development Scenario Net Zero Emissions by 2050 Scenario
2030 2050Share
in 2050AAGR
2020-2050 2030 2050Share
in 2050AAGR
2020-2050 2030 2050Share
in 2050AAGR
2020-2050 2030 2050Share
in 2050AAGR
2020-2050Renewables 2,989 5,998 11,692 66% +4.7% 6,912 16,514 72% +5.9% 8,017 20,304 78% +6.6% 10,293 26,568 80% +7.6%
Solar PV 739 2,550 6,163 35% +7.3% 3,063 9,095 40% +8.7% 3,582 10,865 42% +9.4% 4,956 14,458 43% +10.4%Wind 737 1,603 2,995 17% +4.8% 1,943 4,633 20% +6.3% 2,378 5,881 23% +7.2% 3,101 8,265 25% +8.4%
Hydro 1,327 1,564 1,995 11% +1.4% 1,584 2,050 9% +1.5% 1,679 2,360 9% +1.9% 1,804 2,599 8% +2.3%Bioenergy 163 234 347 2% +2.5% 257 444 2% +3.4% 281 599 2% +4.4% 297 640 2% +4.7%
CSP 6 17 92 1% +9.3% 28 173 1% +11.6% 46 424 2% +15.0% 73 426 1% +15.0%Geothermal 16 27 61 0% +4.7% 30 73 0% +5.3% 44 124 0% +7.2% 52 126 0% +7.2%
Marine 1 4 37 0% +13.8% 7 46 0% +14.5% 7 51 0% +15.0% 11 55 0% +15.3%Nuclear 415 447 525 3% +0.8% 465 641 3% +1.5% 475 669 3% +1.6% 515 812 2% +2.3%Coal 2,109 2,035 1,618 9% -0.9% 1,963 1,265 6% -1.7% 1,564 283 1% -6.5% 1,192 158 0% -8.3%Natural gas 1,822 2,211 2,752 15% +1.4% 2,071 1,786 8% -0.1% 2,023 1,548 6% -0.5% 1,950 495 1% -4.3%Oil 430 290 185 1% -2.8% 261 156 1% -3.3% 256 157 1% -3.3% 178 25 0% -9.0%Battery storage 17 159 1,046 6% +14.8% 302 1,613 7% +16.4% 341 2,123 8% +17.5% 585 3,097 9% +19.0%Total capacity 7,782 11,143 17,844 100% +2.8% 11,996 22,795 100% +3.6% 12,728 25,996 100% +4.1% 14,933 33,415 100% +5.0%
Source: IEA, World Energy Outlook 2021
ELECTRICITY CAPACITY FORECASTS BY SCENARIO (IN GW)
Battery storages Oil Natural gas Coal Nuclear Renewables
Source: IEA, World Energy Outlook 2021
Marine Geothermal CSP Bioenergy Hydro Wind Solar PV
Source: IEA, World Energy Outlook 2021
RENEWABLE ELECTRICITY CAPACITY FORECASTS BY SCENARIO (IN GW)
-
2020 STEPS 2050 ASP 2050 SDS 2050 NZS 20500
35,000
30,000
25,000
20,000
15,000
10,000
5,000
GW
-
2020 STEPS 2050 ASP 2050 SDS 2050 NZS 20500
30,000
25,000
20,000
15,000
10,000
5,000GW

67
ELECTRICITY & ELECTRICAL RENEWABLES
Electricity and energy transition: production forecasts
ELECTRICITY GENERATION FORECASTS BY SCENARIO (TWH)
ELECTRICITY GENERATION FORECASTS BY REGION (TWH)
Electricity generation forecasts in TWh 2020
Stated Policies Scenario Announced pledges Scenario
Sustainable Development Scenario
2030 2050AAGR
2020-2050 2030 2050AAGR
2020-2050 2030 2050AAGR
2020-2050Europe 3,952 4,601 5,594 1.2% 4,911 7,091 2.0% 4,926 7,267 2.1%North America 5,221 5,618 6,726 0.8% 6,066 9,063 1.9% 6,048 9,155 1.9%Latin America 1,277 1,616 2,435 2.2% 1,584 2,637 2.4% 1,575 2,987 2.9%Pacific Asia 12,961 17,292 24,743 2.2% 17,320 28,195 2.6% 17,360 29,215 2.7%Africa 827 1,215 2,384 3.6% 1,239 2,542 3.8% 1,400 3,488 4.9%Middle East 1,189 1,616 2,764 2.9% 1,625 3,130 3.3% 1,485 3,724 3.9%Eurasia 1,335 1,617 2,057 1.5% 1,617 2,057 1.5% 1,630 2,114 1.5%Total production 26,762 33,575 46,703 1.9% 34,362 54,716 2.4% 34,424 57,950 2.6%
Source: IEA, World Energy Outlook 2021
A faire
Electricity generation forecasts in TWh
2020
Stated Policies Scenario Announced pledges Scenario Sustainable Development Scenario Net Zero Emissions by 2050 Scenario
2030 2050Share
in 2050AAGR
2020-2050 2030 2050Share
in 2050AAGR
2020-2050 2030 2050Share
in 2050AAGR
2020-2050 2030 2050Share
in 2050AAGR
2020-2050Renewables 7,593 14,056 27,883 60% +4.4% 15,917 38,959 71% +5.6% 18,283 48,436 84% +6.4% 22,817 62,333 88% +7.3%
Solar PV 833 3,492 9,667 21% +8.5% 4,190 14,194 26% +9.9% 4,989 17,433 30% +10.7% 6,970 23,469 33% +11.8%Wind 1,596 4,102 8,805 19% +5.9% 5,115 14,384 26% +7.6% 6,115 17,577 30% +8.3% 8,008 24,785 35% +9.6%
Hydro 4,347 5,087 6,739 14% +1.5% 5,080 6,852 13% +1.5% 5,387 7,921 14% +2.0% 5,870 8,461 12% +2.2%Bioenergy 709 1,145 1,852 4% +3.3% 1,249 2,375 4% +4.1% 1,362 3,199 6% +5.2% 1,407 3,279 5% +5.2%
CSP 13 46 302 1% +11.0% 78 589 1% +13.5% 129 1,377 2% +16.8% 204 1,386 2% +16.8%Geothermal 94 176 423 1% +5.1% 190 449 1% +5.3% 284 801 1% +7.4% 330 821 1% +7.5%
Marine 1 9 95 0% +15.0% 15 115 0% +15.8% 16 129 0% +16.2% 27 132 0% +16.3%Nuclear 2,692 3,115 3,711 8% +1.1% 3,282 4,449 8% +1.7% 3,395 4,714 8% +1.9% 3,777 5,497 8% +2.4%Coal 9,467 8,733 6,189 13% -1.4% 7,926 3,047 6% -3.7% 5,618 42 0% -16.5% 2,947 - 0% -40.0%Natural gas 6,257 7,112 8,418 18% +1.0% 6,522 5,691 10% -0.3% 6,345 2,011 3% -3.7% 6,222 253 0% -10.1%Oil 716 500 308 1% -2.8% 450 291 1% -3.0% 327 119 0% -5.8% 189 6 0% -14.6%Total production 26,762 33,575 46,703 100% +1.9% 34,362 54,716 100% +2.4% 34,424 57,950 100% +2.6% 37,316 71,164 100% +3.3%Capacités totales 7,782 11,143 17,844 100% +2.8% 11,996 22,795 100% +3.6% 12,728 25,996 100% +4.1% 14,933 33,415 100% +5.0%
Source: IEA, World Energy Outlook 2021
Eurasia Middle East Africa Asia Pacific Latin America North America Europe
Source: IEA, World Energy Outlook 2021
ELECTRICITY GENERATION FORECASTS BY SCENARIO (TWH)
2020 STEPS 2050 ASP 2050 SDS 20500
70,000
60,000
50,000
40,000
30,000
20,000
10,000TW
h

68
ELECTRICITY & ELECTRICAL RENEWABLES
Electricity and energy transition: RES investment
GLOBAL INVESTMENT IN RENEWABLE POWER AND FUELS, BY COUNTRY AND REGION, 2010-2020
Source: REN21, Renewables 2021 Global Status Report
0102030
5040
7060
2010 2011 2012 2013 2014 2015 2016 2017 2018 2019 2020
2010 2011 2012 2013 2014 2015 2016 2017 2018 2019 2020
2010 2011 2012 2013 2014 2015 2016 2017 2018 2019 2020
2010 2011 2012 2013 2014 2015 2016 2017 2018 2019 2020 2010 2011 2012 2013 2014 2015 2016 2017 2018 2019 2020 2010 2011 2012 2013 2014 2015 2016 2017 2018 2019 2020
2010 2011 2012 2013 2014 2015 2016 2017 2018 2019 2020
2010 2011 2012 2013 2014 2015 2016 2017 2018 2019 2020
0
30
60
90
120
150
0
30
90
60
120
150
05
1015
05
101520
United StatesBillion USD
Asia & Oceania (excl. China & India) Billion USD
Asia & Oceania
(excl. China & India)
China Billion USD
China
Europe Billion USD
Europe
0
105
15
India
North Africa & Middle EastBillion USD
Americas (excl. United States & Brazil)Billion USD
2
6.4 9.
7
7.6
11.1
26.1
44.2
35 29.1
31.6 37
.6 40.8 45
.7
42.8
61.7
49.3
9.1
10 12 14.6
11.5
6.6 13
.1
9.8 13
.5
9.1
3.4 5.4 6.7
5.1 6 3.
9 7.1 8.7
2.2
2.1 3.3
2.2 5.
6 6 5.2 8.
3 10 8.9 10
.9
05
1015
2010 2011 2012 2013 2014 2015 2016 2017 2018 2019 202005
1015
IndiaBillion USD
6.3 11
.2
6.4
4.7 6.1 7.5 12
.9 13.5
10.7
9.7
6.2
1.3 6.
6
5 3.2 5.
4
2.6
2.4 6.
9
3.3
2.8 15
34.8
106.
7 127.
6
89
52.2 63
.6
58.5 64
.946
.3 59.3
54
81.8
39.5 53
.9
60.6
86.2
115.
8
100.
7
140.
9
94.4
148.
4
9583
.6
20.2 27
.1
41.1 50
.8
48
38.2
37.2 45
.4
45.3 51
.2
Americas (excl. United States
& Brazil)
Brazil
Sub-SaharanAfrica
North Africa& Middle EastUnited
States
BrazilBillion USD
0
10
20
30
50
40
60
Subs-Saharan Africa Billion USD
Note: Figures include utility-scale renewable energy and small-scale solar projects and exclude large hydropower projects of more than 50 MW. The regions in this chapter follow those presented in the BNEF Energy Transition Investment 2021 report and differ from the regional definitions included elsewhere in the GSR.

69
ELECTRICITY & ELECTRICAL RENEWABLES
Asia Paci�c2018 2019 2020 2021 2022 2018 2019 2020 2021 2022 2018 2019 2020 2021 2022 2018 2019 2020 2021 2022
Americas Europe Other
0204060
100120140160180200
80
Net c
apac
ity a
dditi
ons (
GW)
Rather than slowing down – as it was feared - the development of renewable capa-city, the pandemic prompted an acceleration in investment. According to BNEF, $501 bn were invested in energy transition low emission assets in 2020, up 9% from 2019. Put another way, renewables captured 60% of new power capacity investment in 2020. This enthusiasm stemmed from a combination of factors: improvements to technologies and a considerable drop in their costs, the attractiveness of the sector to investors, and commitments to decar-bonization on the part of governments and and businesses.
Electricity capacity continued to grow in 2020 (+335 GW), driven by the exceptional development of renewables (+260 GW, i.e. +10% increase). Most of this capacity (90%) is solar (+127 GW) and wind (+111 GW), while fossil fuels are losing ground (60 GW installed against 64 GW in 2019) – Sources IRENA and Enerdata.
Consolidating its leadership role, China contributed half of this exceptional expansion. The country increased its RES capacity by 136 GW (72 GW wind and 49 GW solar) and does not intend to stop there. Its objective is +90 GW in wind and solar in 2021, according to the Chinese National Energy Administration.
However, the other major markets are not left out. US renewable capacity increased 29 GW in 2020 (15 GW in solar and 14 GW in wind), almost double the gain in 2019. The trend is to continue, with an extra 20 GW expected in solar in 2021, while the development of wind power is due to slow down. Europe also recorded a hefty 40 GW expansion, to be continued in 2021 and 2022 with projects in Germany. The Green Deal has also given the European Union a new impetus by providing €2 billion to the solar and wind sectors. In the wake of this, a European Solar Initiative was launched in March 2021 to accelerate the deployment of PV and bring about the production of solar panels in Europe. Finally, India, despite the shortages linked to Covid, has not lowered the level of its ambitions in terms of solar and wind power and announced a 30 GW hybrid project, wind, solar and batteries, at the end of 2020.
These positive results remain confined to a limited number of markets, however. The key challenge is to fund RES development in emerging countries.
Electricity: production capacityThe pandemic did not affect momentum behind renewables in the developed world but it exacerbated financing difficulties in emerging countries
SHARE OF GENERATING CAPACITY BY ENERGY IN 2020 TOTAL: 7,805 GW
Biomass & Waste 2%
Geothermal 0.2%
Solar 9%
Coal & lignite 30% Wind 9%
Oil 5% Hydro 17%
Gas 23% Nuclear 5%
NET ANNUAL RENEWABLE CAPACITY ADDITIONS BY REGION AND TECHNOLOGY
Source: Enerdata Global Energy
& CO2 Data, 2021
Source: IEA, Electricity Market Report, 2021
Other renewlables Bioenergy Solar PV Wind Hydro

70
ELECTRICITY & ELECTRICAL RENEWABLES
Electricity: production capacityThe renewal of coal capacity in Asia highlights emerging countries’ difficulties in matching ecology with economics
Although more and more coal-fired plants are being shut, world coal capacity increased by 15 GW on the back of China’s economic recovery. On the one hand, the rate at which coal-fired stations are being closed down is accelerating: -38 GW worth in 2020, of which -10 GW in the USA and -7 GW in the EU27. Similarly, Spain closed half of its capacity (-4 GW), Germany trimmed 1 GW in another step towards its full exit from coal by 2035, Austria and Sweden closed their last coal plants in 2020, and Portugal is to follow suit in 2021.
On the other hand, China, which is experiencing a real energy crisis due to an explosion in electricity demand, has no choice but to open new coal-fired power stations (+55 GW in 2020, i.e., ¾ of the world's additional capacity, and 90 GW are under construction).
There are currently 400 GW of projects and 140 GW under construction worldwide, mainly in Asia (China, India, Vietnam, Indonesia and Japan for 80%). This development runs counter to decarboni-zation trajectories, which require an immediate halt to new construction and combinations of CCUS or decarbonised fuels such as biomass or ammoniac in existing facilities (or their closure). Complete decarbonization by 2050 involves closing 100 GW every year out to 2030 (IEA’s NZE scenario).
Gas capacity increased only moderately for the second year in a row: +1.7%, or +30 GW in 2020. The rise in gas-fired plants was mainly the result of closures of coal and oil-fuelled plants. 80% of ongoing projects (approx. 85 GW) are located in Asia-Pacific, North America and the Middle East.
Nuclear power is also subject to mixed trends, which overall have left world capacity more or less unchanged since Fukushima. The current pace of commissioning almost balances that of decommissioning (+8.7 GW and -9.2 GW respectively in 2021, according to the IEA). Capacity declined slightly in 2020 and 2021. The outlook is more positive, with expansion expected in 2022 (+10.5 GW versus -6.8 GW) and the construction of 54 reactors in 19 countries, for a total capacity of 60 GW. The rhythm of closures is more uncertain, as extending the life of old plants in the USA, Europe and Japan is subject to tough rules on safety as well as social acceptance and market conditions. Revived by the need for carbon-neutral energy and projects of smaller and more flexible units (Small modular reactor or SMR), the debate over nuclear power remains lively. In the meantime, this energy source is a important lever of energy transition.
GAS-FIRED POWER GENERATION CAPACITY ADDITIONS BY REGION, 2020-2022
SHARE OF GENERATING CAPACITY BY GEOGRAPHIC REGION IN 2020TOTAL: 7,805 GW
Source: Enerdata Global Energy & CO2 Data, 2021
Africa 3%
Moyen-Orient 5%
Pacific 1%
CEI 5%
Asia 46%
Latin America 6%
North America 18%
Europe 16%
Source: EA, Electricity Market Report, 2021
OtherAsia Paci�c
China NorthAmerica
Middle East Africa South America
Europe& Eurasia
2.5%
0%
5%
0
15
30
45
60
75
90
Net
Capa
city a
dditi
ons (
GW)
Chan
ge in
glo
bal c
apac
ity

71
ELECTRICITY & ELECTRICAL RENEWABLES
Electricity: production capacity by power station type
Installed electricitygenerationcapacity in GW
Total capacity Thermal capacity Nuclear capacity Renewable capacity
2000 2020 Change 2019-2020
2000 2020 Change 2019-2020
Share in area total 2020
2000 2020 Change 2019-2020
Share in area total 2020
2000 2020 Change 2019-2020
Share in area total 2020
Europe 803 1,264 2.1% 445 515 -1.8% 41% 141 119 -2% 9% 217 630 6.3% 50%EU-27 633 979 2.0% 357 405 -1.9% 41% 126 107 -2.0% 11% 150 467 6.6% 48%EU-28 711 1,082 1.7% 419 455 -2.0% 42% 138 116 -1.8% 11% 154 511 6.2% 47%
Germany 119 238 2.7% 81 102 0.1% 43% 22 10 0% 4% 16 127 5.1% 53%France 115 136 0.5% 26 21 2.2% 15% 63 61 -3% 45% 25 54 3.8% 40%
North America 992 1,393 1.6% 699 874 -0.7% 63% 119 115 -1.7% 8% 175 405 7.9% 29%Canada 111 148 0.9% 33 37 3.0% 25% 10 14 0% 9% 68 98 0.2% 66%
United States 881 1,246 1.7% 665 838 -0.9% 67% 109 101 -1.9% 8% 107 307 10.6% 25%Latin America 223 477 5.0% 94 218 5.6% 46% 4 5 0% 1% 125 254 4.7% 53%
Brazil 74 179 4.1% 10 43 4.5% 24% 2 2 0% 1% 61 134 4.0% 75%Asia 932 3,569 7.0% 673 2,152 3.1% 60% 69 118 1% 3% 190 1,299 14.6% 36%
China 336 2,244 9.3% 254 1,289 4.5% 57% 2 50 2.4% 2% 80 905 17.3% 40%South Korea 49 126 2.3% 32 79 -1.7% 63% 14 23 0% 18% 3 24 21.5% 19%
India 114 412 1.6% 87 278 0.4% 68% 3 7 0% 2% 25 127 4.4% 31%Japan 259 349 2.9% 167 194 2.2% 56% 45 33 0% 9% 47 122 5.1% 35%
CIS 329 413 0.3% 234 280 -0.7% 68% 32 44 -2.2% 11% 64 90 5.1% 22%Russia 211 271 -0.4% 147 188 -0.7% 69% 20 29 -3.2% 11% 44 53 2.4% 20%
Middle East 118 351 4.2% 111 325 3.7% 92% 0 2 147% 1% 7 24 6.5% 7%Saudi Arabia 31 101 18.8% 31 101 18.9% 100% 0 0 – 0% 0 0 0% 0%
Iran 33 83 2.8% 31 69 3.3% 84% 0 1 0% 1% 2 13 0.5% 15%Africa 103 243 4.2% 79 185 4.0% 76% 2 2 0% 1% 22 56 5.3% 23%
Egypt 15 61 2.0% 12 55 2.2% 90% 0 0 – 0% 3 6 0.5% 10%South Africa 42 52 2.9% 38 38 -0.4% 73% 2 2 0% 4% 2 12 15.4% 23%
Pacific 55 94 8.3% 40 50 0.6% 54% 0 0 – 0% 15 44 18.7% 46%Australia 46 83 8.9% 37 47 0.2% 57% 0 0 – 0% 9 36 23.2% 43%
World 3,553 7,805 4.5% 2,373 4,600 1.7% 59% 367 405 -0.6% 5% 813 2,801 10.2% 36%OECD 2,154 3,297 2.3% 1,390 1,778 -0.4% 54% 314 288 -1.4% 9% 451 1,231 7.6% 37%
No OECD 1,399 4,508 6.1% 983 2,822 3.1% 63% 53 117 1.3% 3% 363 1,569 12.4% 35%
Source: Enerdata Global Energy & CO2 Data, 2021

72
ELECTRICITY & ELECTRICAL RENEWABLES
Detail of installed thermal capacity in GW
Total Thermal capacity
Coal & Lignite capacity Oil capacity Gas capacity Biomass & Waste capacity
2000 2020 Change 2019-2020
2000 2020 Change 2019-2020
Share in area thermal total
2020
2000 2020 Change 2019-2020
Share in area thermal total
2020
2000 2020 Change 2019-2020
Share in area thermal total
2020
2000 2020 Change 2019-2020
Share in area thermal total
2020
Europe 445 515 -1.8% 209 174 -4.5% 34% 87 37 -3% 7% 139 256 -0.3% 50% 10.2 49.1 1.6% 9.5%EU-27 357 405 -1.9% 160 137 -4.7% 34% 79 32 -2% 8% 110 196 -0.2% 48% 9.0 39.1 0.7% 9.7%EU-28 419 455 -2.0% 193 145 -5.4% 32% 84 36 -3% 8% 132 228 -0.2% 50% 9.8 47.1 0.9% 10.3%
Germany 81 102 0.1% 52 46 -2% 46% 7 3 0% 3% 20 40 2.6% 40% 1.9 12.0 0.0% 11.8%France 26 21 2.2% 3 3 0% 14% 17 3 0.7% 16% 6 13 3.0% 60% 0.5 2.2 3.1% 10.4%
North America 699 874 -0.7% 337 248 -3.9% 28% 61 41 -3.2% 5% 286 567 1.0% 65% 14.4 18.1 -0.3% 2.1%Canada 33 37 3.0% 18 11 0% 31% 8 6 0% 16% 7 16 7.2% 44% 1.1 3.2 0% 8.8%
United States 665 838 -0.9% 320 237 -4.1% 28% 53 35 -3.7% 4% 279 551 0.8% 66% 13.3 14.8 -0.4% 1.8%Latin America 94 218 5.6% 11 21 0.7% 9% 43 62 4.4% 28% 36 114 8.0% 52% 3.3 21.6 2.0% 9.9%
Brazil 10 43 4.5% 2 5 -0.3% 12% 5 8 0.7% 19% 1 15 11.6% 34% 1.8 15.3 1.8% 35.4%Asia 673 2,152 3.1% 411 1,713 3.8% 80% 135 94 -6.5% 4% 123 313 3.0% 15% 4.3 32.4 1.9% 1.5%
China 254 1,289 4.5% 225 1,217 4.7% 94% 20 15 0% 1% 8 49 1.0% 4% 0.5 8.5 0% 0.7%South Korea 32 79 -1.7% 14 36 -3.0% 45% 5 3 0% 3% 13 40 0.0% 50% 0.6 1.3 -16.2% 1.6%
India 87 278 0.4% 71 236 0.4% 85% 5 4 0.0% 1% 10 29 0% 10% 0.0 10.3 3.1% 3.7%Japan 167 194 2.2% 61 95 2.2% 49% 61 33 0.2% 17% 42 59 3.2% 30% 2.0 7.9 3% 4.1%
CIS 234 280 -0.7% 79 75 0.7% 27% 24 26 -1.3% 9% 130 178 -1.3% 64% 0.6 1.4 4% 0.5%Russia 147 188 -0.7% 42 43 1.0% 23% 16 16 0% 9% 88 128 -1.4% 68% 0.6 0.6 0% 0.3%
Middle East 111 325 3.7% 4 5 0% 1% 50 94 3.2% 29% 58 226 3.9% 70% 0.0 0.0 0% 0.0%Saudi Arabia 31 101 18.9% 0 0 – 0% 18 48 5.7% 48% 13 53 34% 52% 0.0 0.0 – 0.0%
Iran 31 69 3.3% 0 0 – 0% 9 15 0% 21% 23 54 4.2% 79% 0.0 0.0 0% 0.0%Africa 79 185 4.0% 41 42 -0.3% 23% 13 30 3.0% 16% 24 113 6.0% 61% 0.2 1.2 0% 0.6%
Egypt 12 55 2.2% 0 0 – 0% 2 5 0% 10% 10 50 2% 90% 0.0 0.0 – 0.0%South Africa 38 38 -0.4% 38 35 -0.4% 91% 0.3 3 0% 8% 0 0 – 0% 0.1 0.2 0% 0.5%
Pacific 40 50 0.6% 28 25 0% 50% 4 3 4.2% 6% 8 21 1% 41% 0.5 1.3 0% 2.6%Australia 37 47 0.2% 27 25 0% 53% 4 2 0% 4% 6 19 0% 41% 0.4 1.0 0% 2.1%
World 2,373 4,600 1.7% 1,120 2,303 2.0% 50% 417 385 -0.7% 8% 804 1,787 2% 39% 33.5 125.1 1.5% 2.7%OECD 1,390 1,778 -0.4% 641 577 -3.0% 32% 227 132 -1.6% 7% 494 990 1% 56% 28.3 79.0 0.3% 4.4%
No OECD 983 2,822 3.1% 478 1,725 3.7% 61% 190 253 -0.2% 9% 310 798 3% 28% 5.2 46.1 3.6% 1.6%
Source: Enerdata Global Energy & CO2 Data, 2021
Electricity: detailed thermal capacity

73
ELECTRICITY & ELECTRICAL RENEWABLES
Electricity: detailed renewable capacity
Detail of installedrenewable capacityin GW
Total Renewable capacity Hydro capacity Wind capacity Solar capacity Geothermal capacity
2000 2020 Change 2019-2020
2000 2020 Change 2019-2020
Share in area renewable total 2020
2000 2020 Change 2019-2020
Share in area renewable total 2020
2000 2020 Change 2019-2020
Share in area renewable total
2020
2000 2020 Change 2019-2020
Share in area renewable total
2020
Europe 217 630 6.3% 203 249 1.4% 39% 13 218 7.1% 35% 0.2 160 13.9% 25% 1 3 4.0% 1%EU-27 150 467 6.6% 136 152 0.4% 32% 13 178 6% 38% 0.2 137 15.2% 29% 1 1 3.3% 0%EU-28 154 511 6.2% 141 156 0.4% 31% 13 204 6% 40% 0.2 150 13.8% 29% 1 1 3.3% 0%
Germany 16 127 5.1% 10 11 -0.1% 8% 6 62 2.4% 49% 0.1 54 9.7% 42% 0 0 0% 0%France 25 54 3.8% 25 26 0.1% 48% 0 18 7% 33% 0 10 8.6% 19% 0 0 0% 0%
North America 175 405 7.9% 168 183 0% 45% 3 132 12.4% 33% 0.8 86 21.0% 21% 3 4 1.2% 1%Canada 68 98 0.2% 67 81 0% 83% 0.1 14 1.2% 14% 0 3 0.4% 3% 0 0 – 0%
United States 107 307 10.6% 101 102 0.1% 33% 2 119 13.9% 39% 0.8 83 22.0% 27% 3 4 1.2% 1%Latin America 125 254 4.7% 123 198 1% 78% 0.1 34 16.2% 14% 0 20 36.4% 8% 1 2 -1.7% 1%
Brazil 61 134 4.0% 61 109 0.2% 82% 0 17 11.4% 13% 0 8 72.3% 6% 0 0 – 0%Asia 190 1,299 14.6% 185 559 2.7% 43% 2 331 29.0% 26% 0.4 404 23.5% 31% 3 5 0% 0%
China 80 905 17.3% 79 370 3.4% 41% 0.3 282 35% 31% 0.1 253 24.1% 28% 0 0 0% 0%South Korea 3 24 21.5% 3 7 0% 27% 0 2 8.1% 7% 0 16 35.4% 66% 0 0 – 0%
India 25 127 4.4% 24 51 1.0% 40% 1 39 3.0% 30% 0 38 11.1% 30% 0 0 – 0%Japan 47 122 5.1% 46 50 0% 41% 0 4 11% 3% 0.3 67 8.9% 55% 1 1 0% 0%
CIS 64 90 5.1% 64 78 0.4% 86% 0 3 61.0% 4% 0 9 44.2% 10% 0 0 0% 0%Russia 44 53 2.4% 44 51 0.1% 95% 0 1 458.7% 2% 0 2 26.7% 3% 0 0 0% 0%
Middle East 7 24 6.5% 7 17 2% 68% 0 1 20.3% 4% 0 7 18% 28% 0 0 – 0%Saudi Arabia 0 0.4 0% 0 0 – 0% 0 0 0% 0% 0 0.4 0% 100% 0 0 – 0%
Iran 2 13 0.5% 2 12 0.1% 94% 0 0 0.3% 2% 0 0.4 12.8% 3% 0 0 – 0%Africa 22 56 5.3% 22 38 2.1% 68% 0.1 7 12.6% 12% 0 10 13.9% 19% 0 0.8 0% 1%
Egypt 3 6 0.5% 3 3 0% 49% 0 1 0% 24% 0 2 1.9% 29% 0 0 – 0%South Africa 2 12 15.4% 2 4 0% 29% 0 3 26% 21% 0 6 22.1% 49% 0 0 – 0%
Pacific 15 44 18.7% 15 14 0% 33% 0.1 10 30.9% 24% 0 18 32.8% 41% 0.4 1.1 3.1% 3%Australia 9 36 23.2% 9 9 0% 24% 0 10 33% 27% 0 18 33.0% 49% 0 0 – 0%
World 813 2,801 10.2% 786 1,335 1.6% 48% 17 737 18.1% 26% 2 713 21% 25% 9 16 1.2% 1%OECD 451 1,231 7.6% 428 498 0.8% 40% 16 370 9.7% 30% 1 353 16.3% 29% 6 10 2% 1%
No OECD 363 1,569 12.4% 358 837 2.0% 53% 2 367 28.0% 23% 0.1 360 26.9% 23% 3 6 0% 0%
Source: Enerdata Global Energy & CO2 Data, 2021

74
ELECTRICITY & ELECTRICAL RENEWABLES
Electricity: consumptionAfter a setback in 2020 due to the Covid crisis, growth in electricity demand returns to a steady pace
Electricity demand declined relatively little in 2020 (-1% worldwide), as household consumption partly offset reduced activity in the industrial and service sectors. The electri-fication of uses continued, with record sales of electrical vehicles.
The economic recovery is expected to generate a rebound in world electricity demand worth around 5% in 2021, according to the EIA. The main drivers are China and India, which are both expected to post an 8% increase in demand this year.
The impact will be more moderate in developed countries. Hit by intense cold spells at the beginning of the year, the USA should renew with its demand levels of 2019. The major European markets — Germany, France, Italy and Spain — will rebound by an average 4% but this will not completely make up for the drop in demand in 2020 (-4% to -6%). Japan is lagging behind, with an expected 1% increase nowhere near enough to make up for a 4% drop last year.
Power demand will remain vigorous over the next decade, driven by economic expansion in developing countries and the electrification of uses required for the integration of renewables. IEA power demand forecasts out to 2030 vary from +2.3% per year under current development conditions (STEPS), to +2.5% per year if COP26 commitments are implemented (APS), and up to 3.4% per year under the academic hypothesis of a carbon neutral trajectory (NZE). The differences reflect efforts made to electrify road transport, building heating and industrial processes. Hydrogen production is another important variable, as it will require a fair amount of electricity (500 TWh in the APS and up to 3,850 TWh in the NZE by 2030). To counteract this trend, better energy efficiency — notably in buildings — is imperative to avoid excessive pressure on both infrastructure and costs. Developing countries (and Asian economies in particular) account for 80% of the increase. It is only under the NZE objective that demand shifts slightly towards mature economies, boosted by electrolysers and a faster electrification of vehicles.
CHANGE IN ELECTRICITY DEMAND IN 2020 AND 2021 BY REGION
SHARE OF ELECTRICITY IN USEFUL AND FINAL ENERGY DEMAND ACCORDING TO THE IEA SCENARIOS
2019-2020 2020-2021 2019-2021Source: IEA, Global Energy Review, 2021
Share of electricity: 2020 – Additional in: STEPS 2030 APS 2030Source: IEA, World Energy Outlook, 2021
100%0% 50%
All uses
Buildings
Industry
Useful energy
55%
25%
30%
4% 1%
Final consumption Electricity demand APS 2030
EnergyBuildings
Lightning & appliances
Heating & cooling
LigntIntensive
RoadRailTransport
100%0% 50% 100%0% 50%
33%
22%
20%
IndiaChina North America Africa Europe WorldRest of world-6-4-202468
101214
%

75
ELECTRICITY & ELECTRICAL RENEWABLES
Electricity consumptionin TWh
Total electricity consumption Residential consumption 2020
Services consumption 2020
Industry consumption 2020
Transport consumption 2020
2000 2010 2019 2020 Change 2019-2020
AAGR 2010-2020
Share in thetotal World
TWh Share in regional total
TWh Share in regional total
TWh Share in regional total
TWh Share in regional total
Europe 2,837 3,253 3,278 3,150 -3.9% -0.3% 14% 965 31% 880 28% 1,169 37% 68 2%EU-27 2,197 2,508 2,481 2,370 -4.5% -1% 11% 711 30% 673 28% 878 37% 57 2%
France 385 444 434 412 -5.1% -0.7% 2% 155 38% 126 31% 113 27% 9 2%Germany 484 532 500 477 -4.5% -1.1% 2% 128 27% 127 27% 203 43% 13 3%
Italy 273 299 291 275 -5.4% -0.8% 1% 66 24% 86 31% 105 38% 13 5%United Kingdom 330 329 295 281 -4.7% -1.6% 1% 108 38% 80 29% 83 29% 5 2%
North America 3,988 4,271 4,361 4,198 -3.7% -0.2% 19% 1,637 39% 1,598 38% 938 22% 13 0.3%Canada 488 482 531 513 -3.3% 0.6% 2% 179 35% 140 27% 182 36% 1 0.2%
United States 3,500 3,789 3,831 3,685 -3.8% -0.3% 16% 1,458 40% 1,458 40% 756 21% 12 0.3%Latin America 773 1,097 1,333 1,303 -2.2% 1.7% 6% 391 30% 311 24% 541 42% 5 0.4%
Brazil 321 438 513 504 -1.8% 1.4% 2% 148 29% 128 25% 193 38% 2 0.4%Mexico 145 216 280 272 -2.8% 2.3% 1% 66 24% 52 19% 141 52% 1 0.4%
Asia 3,245 6,674 10,720 10,860 1.3% 5.0% 48% 2,284 21% 2,209 20% 5,750 53% 212 2%China 1,037 3,451 6,524 6,726 3.1% 6.9% 30% 1,137 17% 1,263 19% 4,016 60% 171 3%India 369 721 1,213 1,186 -2.3% 5% 5% 317 27% 168 14% 472 40% 17 1%
Japan 973 1,036 919 891 -3.1% -2% 4% 260 29% 290 33% 322 36% 16 2%South Korea 263 449 526 514 -2.2% 1.4% 2% 71 14% 160 31% 264 51% 3 1%
Middle East 379 721 1,003 1,003 0.0% 3.4% 5% 413 41% 318 32% 220 22% 0.5 0.0%Iran 95 186 260 266 2.4% 3.7% 1% 90 34% 47 18% 90 34% 0.5 0%
Saudi Arabia 99 203 297 294 -1.0% 3.8% 1% 131 45% 116 39% 43 15% 0.0 0.0%CIS 847 1,020 1,110 1,092 -1.5% 0.7% 5% 279 26% 211 19% 482 44% 70 6%
Russia 586 701 741 723 -2.5% 0.3% 3% 170 24% 146 20% 330 46% 57 8%Africa 360 537 684 666 -2.5% 2.2% 3% 242 36% 134 20% 247 37% 5 1%
Egypt 64 124 155 153 -1.0% 2.2% 1% 63 41% 30 20% 42 28% 1 0.3%South Africa 174 203 204 194 -4.6% -0.4% 1% 50 26% 35 18% 100 51% 3 1%
Pacific 210 254 263 257 -2.5% 0.1% 1% 73 28% 78 30% 93 36% 6 2%Australia 173 210 216 211 -2.5% 0.0% 1% 60 28% 68 32% 75 35% 6 3%
World 12,640 17,827 22,751 22,529 -1.0% 2.4% 100% 6,283 28% 5,740 25% 9,439 42% 380 2%
Source: Enerdata Global Energy & CO2 Data, 2021
Electricity: consumption
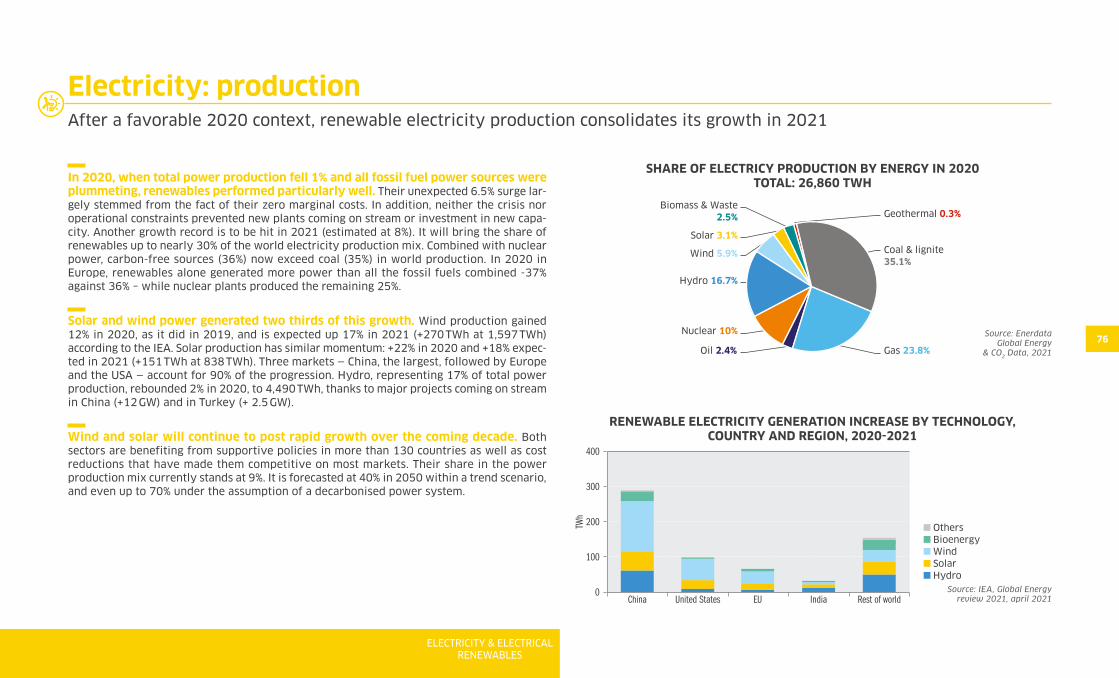
76
ELECTRICITY & ELECTRICAL RENEWABLES
Electricity: productionAfter a favorable 2020 context, renewable electricity production consolidates its growth in 2021
In 2020, when total power production fell 1% and all fossil fuel power sources were plummeting, renewables performed particularly well. Their unexpected 6.5% surge lar-gely stemmed from the fact of their zero marginal costs. In addition, neither the crisis nor operational constraints prevented new plants coming on stream or investment in new capa-city. Another growth record is to be hit in 2021 (estimated at 8%). It will bring the share of renewables up to nearly 30% of the world electricity production mix. Combined with nuclear power, carbon-free sources (36%) now exceed coal (35%) in world production. In 2020 in Europe, renewables alone generated more power than all the fossil fuels combined -37% against 36% – while nuclear plants produced the remaining 25%.
Solar and wind power generated two thirds of this growth. Wind production gained 12% in 2020, as it did in 2019, and is expected up 17% in 2021 (+270 TWh at 1,597 TWh) according to the IEA. Solar production has similar momentum: +22% in 2020 and +18% expec-ted in 2021 (+151 TWh at 838 TWh). Three markets — China, the largest, followed by Europe and the USA — account for 90% of the progression. Hydro, representing 17% of total power production, rebounded 2% in 2020, to 4,490 TWh, thanks to major projects coming on stream in China (+12 GW) and in Turkey (+ 2.5 GW).
Wind and solar will continue to post rapid growth over the coming decade. Both sectors are benefiting from supportive policies in more than 130 countries as well as cost reductions that have made them competitive on most markets. Their share in the power production mix currently stands at 9%. It is forecasted at 40% in 2050 within a trend scenario, and even up to 70% under the assumption of a decarbonised power system.
RENEWABLE ELECTRICITY GENERATION INCREASE BY TECHNOLOGY, COUNTRY AND REGION, 2020-2021
Source: Enerdata Global Energy
& CO2 Data, 2021
SHARE OF ELECTRICY PRODUCTION BY ENERGY IN 2020TOTAL: 26,860 TWH
Biomass & Waste 2.5% Geothermal 0.3%
Solar 3.1%
Coal & lignite 35.1%
Wind 5.9%
Oil 2.4%
Hydro 16.7%
Gas 23.8%
Nuclear 10%
Others Bioenergy Wind Solar Hydro
Source: IEA, Global Energy review 2021, april 2021
-
China United States EU India Rest of world0
400
300
200
100
TWh

77
ELECTRICITY & ELECTRICAL RENEWABLES
Electricity: production The progression of renewables has not been enough to meet the surge in power demand in 2021, which leads to a strong recovery in coal-fired generation
The context changed radically in 2021, as the rebound in electricity demand (+5%) proved much stronger than the rise in renewables production. Fossil production regained lost ground rapidly and bridged this substantial gap — in excess of 500 TWh. This situation generated extreme pressure in China and India, impacting the whole energy market.
Coal-fuelled production shall increase by 5% in 2021 (+480 TWh), topping its 2019 level and hitting a historical record. Half of the increase will have been in China, where coal stations are contributing more than ever. Their production is expected to increase 340 TWh in 2021, up 7% from 2019. Also under enormous power demand pressure, India mobilised its coal capacity too: in mid-May, the country was generating 80% of its electricity from coal. This year’s coal-fuelled production is expected to be 10% greater than in 2019. In Europe and in the USA, the share of coal in power production resumed pre-Covid levels as early as this summer, as higher gas prices favoured coal over CCGT, and despite rising CO2 prices in Europe.
Although it emits less CO2, generation from gas remains steady due to its lack of competitiveness relative to coal. Less used in the Asia-Pacific region, where demand is huge, it also faces increasing competition from renewables in the USA and in Europe. This explains why a mere 1% growth is expected in 2021, after a slight decline in 2020 (-0,4%).
CHANGE IN ELECTRICITY GENERATION IN 2020 AND 2021
2019-2020 2020-2021 2019-2021
Source: IEA, Global Energy review 2021, april 2021
WindSolar PV Bio energy Hydro Coal OilNuclearGas
25%
0%
-25%
50%
-50%-500
-250
0
250
500
TWh

78
ELECTRICITY & ELECTRICAL RENEWABLES
Electricity: production
Electricity generation in TWh
Total generation Thermal generation Nuclear generation Renewable generation
2000 2020 Change 2019-2020
2000 2020 Change 2019-2020
Share in area total 2020
2000 2020 Change 2019-2020
Share in area total 2020
2000 2020 Change 2019-2020
Share in area total 2020
Europe 3,433 3,708 -3.5% 1,807 1,564 -8.8% 42% 971 758 -10.7% 20% 655 1,386 8.5% 37%EU-27 2,655 2,775 -4.6% 1,390 1,167 -10.2% 42% 860 684 -10.8% 25% 405 923 9.6% 33%EU-28 3,032 3,088 -4.5% 1,673 1,334 -10.1% 43% 945 734 -10.8% 24% 414 1,020 10.0% 33%
Germany 577 571 -6.5% 372 300 -11.3% 52% 170 64 -14.4% 11% 35 207 4.8% 36%France 539 532 -7% 53 57 -8.8% 11% 415 354 -11.3% 67% 71 121 11.3% 23%
North America 4,658 4,906 -2.8% 3,128 2,768 -6.5% 56% 871 926 -2.0% 19% 660 1,212 6.0% 25%Canada 606 648 -0.7% 174 121 -8% 19% 73 98 -3.0% 15% 359 429 2.1% 66%
United States 4,053 4,257 -3.1% 2,954 2,647 -6.4% 62% 798 828 -1.8% 19% 301 782 8.3% 18%Latin America 982 1,614 -2.0% 370 724 -4.2% 45% 20 36 0.4% 2% 592 854 -0.1% 53%
Brazil 349 614 -2.0% 38 139 -6.8% 23% 6 14 -13.2% 2% 304 461 0.0% 75%Asia 3,965 12,667 1.7% 2,943 9,062 -0.1% 72% 505 664 1.9% 5% 517 2,941 7.5% 23%
China 1,356 7,798 3.7% 1,116 5,327 1.8% 68% 17 367 5.1% 5% 223 2,104 8.5% 27%South Korea 290 563 -2.9% 176 374 -9.1% 66% 109 160 9.8% 28% 6 29 30% 5%
India 562 1,557 -2.5% 469 1,208 -4% 78% 17 43 -1.9% 3% 76 306 4.1% 20%Japan 1,048 993 0% 625 764 0% 77% 322 51 -26.2% 5% 101 178 10.4% 18%
Pacific 253 310 -2.6% 207 217 -6.2% 70% 0 0 – 0% 46 93 6.9% 30%CIS 1,250 1,557 -2.6% 816 958 -6.7% 62% 210 294 0.0% 19% 224 304 9.5% 20%
Russia 878 1,092 -3.0% 582 654 -8% 60% 131 216 3.3% 20% 165 222 9.8% 20%Middle East 472 1,250 0.2% 464 1,204 0.9% 96% 0 7 0.0% 1% 8 39 -15.8% 3%
Saudi Arabia 126 363 -1.1% 126 362 -1.1% 100% 0 0 – 0% 0 1 0% 0%Iran 121 322 2.6% 118 293 6.0% 91% 0 7 0.0% 2% 4 22 -28% 7%
Africa 445 849 -2.5% 354 659 -3.7% 78% 13 13 -7.9% 1% 78 177 2.7% 21%Egypt 78 193 -1.0% 64 174 -2% 90% 0 0 – 0% 14 20 12.2% 10%
South Africa 211 240 -5.0% 194 209 -6% 87% 13 13 -7.9% 5% 4 18 5.0% 7%World 15,459 26,860 -1% 10,089 17,156 -2.7% 64% 2,591 2,698 -3.5% 10% 2,779 7,006 6.3% 26%
OECD 9,784 10,746 -2.7% 6,062 5,946 -6% 55% 2,249 1,879 -5.7% 17% 1,474 2,921 7.9% 27%No-OECD 5,675 16,114 0.9% 4,027 11,211 -0.7% 70% 342 819 2% 5% 1,306 4,084 5.1% 25%
Source: Enerdata Global Energy & CO2 Data, 2021

79
ELECTRICITY & ELECTRICAL RENEWABLES
Electricity: detail of thermal production
Detail of thermalelectricity productionin TWh
Total Thermal generation Thermal generation – Coal & Lignite Thermal generation – Oil Thermal generation – Gas Thermal generation – Biomass & Waste
2000 2020 Change 2019-2020
2000 2020 Change 2019-2020
Share in area thermal total
2020
2000 2020 Change 2019-2020
Share in area thermal total
2020
2000 2020 Change 2019-2020
Share in area thermal total
2020
2000 2020 Change 2019-2020
Share in area thermal total
2020
Europe 1,807 1,564 -8.8% 1,039 540 -17.8% 35% 192 36 -36% 2% 527 756 -2.4% 48% 48 232 2% 15%EU-27 1,390 1,167 -10.2% 844 385 -20.9% 33% 173 36 -34% 3% 332 568 -2.2% 49% 42 178 0% 15%EU-28 1,673 1,334 -10.1% 966 392 -20.9% 29% 181 38 -30.6% 3% 480 680 -4.6% 51% 46 224 2% 17%
Germany 372 300 -11.3% 304 142 -22% 47% 5 4 -13.8% 1% 53 99 4.6% 33% 10 55 -4.6% 18%France 53 57 -8.8% 31 5 -16% 9% 7 6 4% 11% 12 35 -11.5% 61% 4 11 -2.3% 19%
North America 3,128 2,768 -6.5% 2,247 864 -22.7% 31% 133 35 -7.1% 1% 668 1,789 3.8% 65% 80 80 -3.4% 3%Canada 174 121 -8% 118 38 -21.9% 32% 15 6 -8% 5% 34 67 2% 56% 8 10 -8% 8%
United States 2,954 2,647 -6.4% 2,130 826 -23% 31% 119 29 -6.9% 1% 634 1,722 3.9% 65% 72 70 -3% 3%Latin America 370 724 -4.2% 43 85 -15.9% 12% 173 121 -2.8% 17% 140 440 -3.3% 61% 13 79 3.0% 11%
Brazil 38 139 -6.8% 11 19 -21.6% 14% 15 9 -17.3% 6% 4 56 -7.5% 40% 8 56 2.6% 40%Asia 2,943 9,062 -0.1% 1,983 7,250 -0.1% 80% 375 118 -8.8% 1% 569 1,420 -0.9% 16% 16 273 11% 3%
China 1,116 5,327 1.8% 1,060 4,925 1.5% 92% 47 12 1.8% 0% 6 263 1.8% 5% 2 127 19.4% 2%South Korea 176 374 -9.1% 111 207 -15.6% 55% 35 7 -31% 2% 30 148 0.4% 40% 0.1 13 29.5% 3%
India 469 1,208 -4% 390 1,083 -4.8% 90% 21.6 6.5 -14.30% 1% 56 74 4.0% 6% 1 45 3.4% 4%Japan 625 764 0% 223 322 -2.0% 42% 134.3 29.1 -30.00% 4% 258 363 4.0% 47% 10 50 7.3% 7%
Pacific 207 217 -6.2% 176 151 -3.6% 69% 3 7 -14.8% 3% 26 55 -11% 25% 2 4 -8.1% 2%CIS 816 958 -6.7% 266 277 -8.6% 29% 57 8 -27.2% 1% 491 670 -5.7% 70% 3 4 4.0% 0%
Russia 582 654 -8.4% 176 155 -13.7% 24% 33 8 -3.4% 1% 370 488 -6.8% 75% 3 3 4.0% 0%Middle East 464 1,204 0.9% 30 21 -8% 2% 189 262 -6.9% 22% 246 922 3.6% 77% 0 0.2 0.0% 0%
Saudi Arabia 126 362 -1.1% 0 0 – 0% 68 150 -1% 41% 58 213 -1.0% 59% 0 0 – 0%Iran 118 293 6.0% 1 1 3% 0% 25 25 -11% 8% 92 267 8.0% 91% 0 0 0% 0%
Africa 354 659 -3.7% 208 244 -6% 37% 37 60 -13.3% 9% 109 353 -0.5% 54% 1 2 0% 0%Egypt 64 174 -2.3% 0 0 – 0% 8 20 -11.1% 12% 57 154 -1.0% 88% 0 0 – 0%
South Africa 194 209 -6% 193 209 -6% 100% 0 0.2 0% 0% 0 0 – 0% 0.3 0.4 0% 0%World 10,089 17,156 -2.7% 5,991 9,431 -4.5% 55% 1,159 647 -9.8% 4% 2,775 6,405 0% 37% 164 674 5% 4%
OECD 6,062 5,946 -6% 3,780 2,083 -16.8% 35% 591 137 -23.9% 2% 1,548 3,343 1.5% 56% 143 383 2.0% 6%No-OECD 4,027 11,211 -0.7% 2,211 7,348 -0.3% 66% 567 510 -5.1% 5% 1,228 3,062 -1.6% 27% 21 291 8.9% 3%
Source: Enerdata Global Energy & CO2 Data, 2021

80
ELECTRICITY & ELECTRICAL RENEWABLES
Electricity: detail of renewable generation
Detail of renewableelectricity generationin TWh
Total Renewable generation Renewable generation Hydro Renewable generation Wind Renewable generation Solar Renewable generation Geothermal
2000 2020 Change 2019-2020
2000 2020 Change 2019-2020
Share in total RES zone
2020
2000 2020 Change 2019-2020
Share in total RES zone
2020
2000 2020 Change 2019-2020
Share in total RES zone
2020
2000 2020 Change 2019-2020
Share in total RES zone
2020
Europe 655 1,386 8.5% 626 683 5.4% 49% 22 507 10.9% 37% 0.1 174 16.2% 13% 6 21 -0.7% 2%EU-27 405 923 9.6% 379 374 8.0% 40% 21 395 8.5% 43% 0.1 148 17.9% 16% 5 7 -0.5% 1%EU-28 414 1,020 10.0% 387 382 8.0% 37% 22 471 9.8% 46% 0.1 161 15.9% 16% 5 7 -0.5% 1%
Germany 35 207 4.8% 26 25 -8.4% 12% 9 130 5.0% 63% 0.1 53 11.8% 25% 0 0.2 3.1% 0%France 71 121 11.3% 71 67 8.5% 55% 0 40 16.3% 33% 0 13 11.3% 11% 0 0.1 -2.3% 0%
North America 660 1,212 6.0% 639 699 1.0% 58% 6 376 13.1% 31% 1 118 17.4% 10% 15 19 5.6% 2%Canada 359 429 2.1% 359 387 1% 90% 0 38 11% 9% 0 4 4.9% 1% 0 0 – –
United States 301 782 8.3% 280 312 0.5% 40% 6 338 13.4% 43% 1 113 18.0% 14% 15 19 5.6% 2%Latin America 592 854 -0.1% 584 709 -2.4% 83% 0.2 103 9.1% 12% 0 34 36% 4% 8 9 -9.1% 1%
Brazil 304 461 0.0% 304 395 -0.6% 86% 0 57 1.9% 12% 0 8 21.2% 2% 0 0 -Asia 517 2,941 7.5% 494 1,896 3.4% 64% 2 556 12.7% 19% 0.4 461 21.2% 16% 20 28 1.1% 1%
China 223 2,104 8.5% 222 1,356 3.9% 64% 1 466 16% 22% 0 282 21% 13% 0.1 0.1 0% 0%South Korea 6 29 30% 6 7 14.4% 25% 0 3 18.1% 11% 0 18 39.7% 64% 0 0 – –
India 76 306 4.1% 75 178 0.9% 58% 2 64 -4.6% 21% 0 64 26.8% 21% 0 0 – –Japan 101 178 10.4% 97 88 9.3% 50% 0.1 8 3.2% 5% 0.4 79 12.9% 45% 3 2 -3.4% 1%
Pacific 46 93 6.9% 43 42 -1.6% 46% 0.2 23 15.7% 25% 0 19 23.5% 20% 3 9 0.3% 9%CIS 224 304 9.5% 224 292 8.1% 96% 0 5 80.6% 2% 0 6 55.9% 2% 0.1 0.4 -1.9% 0%
Russia 165 222 9.8% 165 218 9.0% 98% 0 1.5 331.8% 1% 0 2 54.3% 1% 0.1 0.4 -1.9% 0%Middle East 8 39 -15.8% 8 25 -26.9% 65% 0 2 8.6% 4% 0 12 17.7% 31% 0 0 – –
Saudi Arabia 0 1 0% 0 0 – 0% 0 0 – 0% 0 1 0.0% 100% 0 0 – –Iran 4 22 -28.0% 4 22 -29.0% 97% 0 0 12.9% 2% 0 0.3 35.0% 1% 0 0 – –
Africa 78 177 2.7% 78 140 0.0% 79% 0.2 19 7.4% 11% 0 13 35.0% 7% 0 5 0% 3%Egypt 14 20 12.2% 14 13 -1.0% 65% 0.1 4 22.2% 20% 0 3 116.3% 15% 0 0 – 0%
South Africa 4 18 5.0% 4 6 2% 33% 0 7 0.0% 37% 0 5 16.3% 30% 0 0 – 0%World 2,779 7,006 6.3% 2,695 4,486 2.2% 64% 31 1,591 12% 23% 1 837 21% 12% 52 92 0.3% 1%
OECD 1,474 2,921 7.9% 1,411 1,510 3.4% 52% 29 930 12.0% 32% 1 425 18.0% 15% 33 56 0.5% 2%No-OECD 1,306 4,084 5.1% 1,284 2,975 2% 73% 3 661 12.2% 16% 0 413 23.2% 10% 19 35 -0.1% 1%
Source: Enerdata Global Energy & CO2 Data, 2021

81
ELECTRICITY & ELECTRICAL RENEWABLES
Electricity: pricesElectricity prices bounced back in 2021 in line with higher fuel and CO2 prices and stronger demand
Wholesale electricity prices fell sharply in 2020, in the wake of contracting power demand and lower fossil fuel prices (between 20% and 50%); the share of low marginal cost renewable capacity in the power production mix also played a part. Particularly favourable weather conditions for solar and wind production even led to episodes of negative prices. Prices dived 25% on average in 2020.
Economic recovery and the rapid rebound in power consumption triggered an upturn in prices which return to their pre-Covid level by the middle of the year. The second half of 2021 has seen prices skyrocketing on all markets across the world.
In Europe, electricity prices have tripked since the beginning of the year (from €53 to €150/MWh on the German contract) driven by the increase in fuel prices — between 1st January and 1st November the API2 Rotterdam coal contract rose from €70 to €150/t and the TTF gas contract from €18 to €90/MWh — as well as in European CO2 allowances (from €32 to €57/t).
As a result of exceptional weather events in early 2021, prices hit record levels in Japan and the USA,. Extreme cold in Texas derailed the balance between supply and demand, driving wholesale prices up to $9,000/MWh (against approx. $150/MWh end 2020) for just over three days. Japan also experienced particularly intense cold in January. Increased heating demand, combined with limited gas supply, drove power prices to critical levels (over ¥200/kWh against approx. ¥30/kWh end 2020), prompting the Economy Minister to intro-duce price cap measures (source: IEA, Electricity Market Report).
ELECTRICITY PRICES IN FRANCE, GERMANY AND THE US ($/MWH)
FUELS AND CO2 PRICES COMPARED TO ELECTRICITY PRICE IN GERMANY
FR DA USD/MWh DE DA USD/MWh PJM Eastern Hub USD/MWh
ENGIE, Global Energy Market, novembre 2021
Gas Coal
Average market price Carbon price
Source: IEA, Electricity Market Report, july 2021
Jan.2019
Apr.2019
July2019
Oct.2019
Jan.2020
Apr.2020
July2020
Oct. 2020
Jan.2021
Apr.2021
July2021
Oct. 2021
0
250
200
150
100
50
$/M
Wh
Jan.
2016
May
Sep.
Jan.
2017
May
Sep.
Jan.
2018
May
Sep.
Jan.
2019
May
Sep.
Jan.
2020
May
Sep.
Jan.
2021
May
Sep.
Jan.
2022
May
sep.
€ M
Wh,
€ t/
CO2
10
20
30
40
50
60
80
70
0


NATURAL GAS & RENEWABLE GASES
Natural gas and energy transition . . . . . . . . 84
Consumption . . . . . . . . . . . . . . . . . . . . . . . . . . 87
Production . . . . . . . . . . . . . . . . . . . . . . . . . . . . 90
Prices . . . . . . . . . . . . . . . . . . . . . . . . . . . . . . . . 92
Renewable gases: biogas and hydrogen . . . 93
SUPPLY
Heightened pressure on gas supply following successive incidents and renewed demand is a reminder of the importance of flexible alternatives
In an increasingly integrated system with significant interdependence between power and gas markets and a growing contribution from renewables, supply security is a priority and has to be tackled in a comprehensive manner
HYDROGEN
The falling costs of electrolysers and renewable electricity will alter this market fundamentally in the coming years
Natural gas & Renewable gases
83

84
NATURAL GAS & RENEWABLE GASES
Natural gas and energy transitionThe distinctive role of natural gas in both the energy mix and the development of renewable gases creates options for the future
Under the spotlight in 2021 because of soaring prices, natural gas faces new ques-tions about its sustainability in a decarbonized world. The future of natural gas is now at a crossroads, with its fate depending mostly on an exit from fossil fuels and support for renewable energy: substitutions in favour of gas allow for a rapid reduction in emissions; it is also a renewable energy when it is produced from agricultural waste (biomethane), or from renewable electricity by electrolysis of water (green hydrogen), or by combining green hydrogen and carbon dioxide emitted by industry (synthetic methane). The role it plays in balancing the electricity system and controlling costs is also crucial to energy transition.
One of the main drivers of the evolution of gas demand in the coming years is the substitution for coal in power production. According to the IEA, this is a major factor in reducing emissions (1,060 g/KWh against 418 g/kWh) which wiped out 750 Mt of CO2 between 2010 and 2020, mainly in European and US power generation, but also in Chinese building and manufacture. National commitments given ahead of COP26 (APS scenario) involve inten-sive coal-to-gas conversion that would reduce CO2 emissions by 180 Mt, and in turn increase gas demand in excess of 100 Bcm in 2030. The carbon neutral scenario requires even more substitution for coal — implying over 185 Bcm of extra gas consumption in 2030 — as well as oil-to-gas substitution in both Middle East power production and Asian manufacturing.
As natural gas emits fewer fine particles than oil and coal, it helps to improve air quality, especially in energy-intensive economies.
Energy requirements in developing countries are the second source of growth in gas demand. First and foremost this concerns the manufacturing sector, where gas can be used in a wide variety of installations, rather than coal, oil or biomass. That said, its deployment will depend on both its availability and the building of new infrastructure.
The limitations of an energy mix based solely on renewable electricity argue for the preservation of gas to reduce supply risks and to control costs. It would be impossible to build a big enough system entirely based on electricity, for many reasons: costs, raw mate-rials, land availability, public acceptability and networks. The use of gas considerably reduces the oversizing of power infrastructures required to cope with peak demand (mainly due to electric heating), RES intermittency and physical distances between production and consump-tion. Climate emergency requires speedy decarbonization; given its existing infrastructure, its efficient plants and a cost-efficiency ratio better than many power RES alternatives, gas offers valuable solutions.
Conversely, competition from renewables, improved energy efficiency and electri-fication will weigh on demand, and particularly so in buildings in countries where gas is used for heating. This will depend on the pace of renovation and improvements in energy efficiency.
Lastly, demand for methane will depend on the development of the renewable gases, biogas, hydrogen-based fuels and synthesised gas that will gradually replace fossil gas. The main challenges of biogas expansion are building facilities on a large enough scale to reduce costs and that of a supply chain. With support from public policy and economies of scale, hydrogen could become the number one low-carbon fuel.

85
NATURAL GAS & RENEWABLE GASES
Natural gas and energy transition
Transition started but dynamic too slowIn the EU – the most ambitious region – natural gas contributes to power production decarbonization through coal substitution. Green gas development must accelerate from 2030 if gas solutions are to be retained within the decarbonization process. The global reduction of energy consumption is a critical point.
Transition started but dynamic too slowThe current natural gas progression mainly reflects coal-to-gas substitution in power production, contributing to lower CO2 emissions. But insufficient efforts towards energy efficiency prevent a decisive decrease in global energy.
GAS PRIMARY DEMAND FORECASTS – WORLD
GAS PRIMARY DEMAND FORECASTS – EUROPEAN UNION (EU27)
Outlook for natural gas demand in EIA scenarios (WEO 2021). Natural gas demand holds up until 2030, thanks to substitution and emerging countries. But trajectories diverge subs-tantially thereafter as a function of environmental policies. In a carbon neutral scenario, fossil gas is reined in strongly but renewable gases play a bigger role.
Demand in natural gas increases over the five coming years across all scenarios, notably in emerging countries’ industrial sectors and advanced economies’ gas-fired power production.
In the STEPS scenario, which takes INDCs into account, fossil gas demand continues to grow up to 2050 (+1,000 Bcm), driven by developing countries, and their light industry in particular (40%).
In the APS scenario, which integrates commitments made ahead of COP26, natural gas world demand peaks around 2025, as increased electrification requires new CCGTs. It declines very slightly thereafter, as declining demand in advanced economies would offset additional demand in the industrial and electricity sectors of developing markets. Countries committed to zero carbon objectives offer radically different prospects, with some still using coal and rapidly decarbonizing their economy thanks to gas China, South Korea) and others about to phase out coal entirely (EU, USA, Japan, Canada, Brazil). Countries that did not set any zero carbon objec-tives all will report an increase in gas consumption. Within this APS scenario, renewable gas (approx. 3,650 TWh PCS of biogas) and fossil gas with CCUS each represent 9% of the gas total by 2050. Hydrogen plays an important role as soon as 2030 onwards in countries committed to carbon neutrality (3% of the global mix in 2050).
In the NZE scenario, by contrast, fossil gas demand falls rapidly: halved by 2030 and cut by three quarters by 2050, with the remaining volumes covered at 70% by CCUS installations. This performance is achieved through the deployment of carbon neutral power production facilities, as well as the gradual suppression of fossil gas in buildings. The decline in fossil gas is partly offset by the expansion of green gases, however (4,200 TWh of biogas in 2050), of which low carbon hydrogen produced from natural gas combined with CCUS. By 2030, about 250 Bcm will be used in steam methane reformers equipped with CCUS. All in all, primary demand for gas, all types combined, increases nearly 5% by 2030 and contracts by just 20% by 2050, to 3,000 Bcm. Hydrogen represents 13% of the mix in 2050 (22,000 TWh, of which 70% through electrolysis).
See EIA scenario definitions in the Decarbonization chapter.
IEA STEPS (+0.8%/year) IEA APS (-0.4%/year) IEA SDS (-1.9%/year) IEA NET ZERO (-5.4%/year) Extension years 2010-2020 (+1.8%/year)
Extension year 2020 (-1%/year) Historical (Enerdata)
Sources: IEA, World Energy Outlook 2021; Enerdata, Global Energy
& CO2 Data, 2021
IEA STEPS (-0.5%/year) IEA APS (-5.1%/year) IEA SDS (-5.2%/year) IEA NET ZERO (0%/year) Extension years 2010-2020 (-0.9%/year)
Extension year 2020 (-2%/year) Historical (Enerdata)
Sources: IEA, World Energy Outlook 2021; Enerdata, Global Energy
& CO2 Data, 2021
Prim
ary d
emye
ard
(Mto
e)
6,000
5,000
4,000
2,000
0
1,000
3,000
2050204520402010 2015 2020 2025 2030 2035
Historical (Enerdata)
(-0.4%/year)
(-1.9%/year)
(+0.8%/year)
(+1.8%/year)
(-1%/year)
(-5.4%/year)
Prim
ary d
emye
ard
(Mto
e)
400
300
0
100
200
2050204520402010 2015 2020 2025 2030 2035
Historical (Enerdata)
(-5.1%/year)
(-5.2%/year)
(-0.5%/year)
(-2%/year)
(-0.9%/year)

86
NATURAL GAS & RENEWABLE GASES
Natural gas and energy transition
WORLD NATURAL GAS CONSUMPTION FORECASTS IN IEA STEPS, APS AND SDS SCENARIOS IN BCM
WORLD NATURAL GAS PRODUCTION FORECASTS IN IEA STEPS, APS AND SDS SCENARIOS IN BCM
Natural gas demand forecast in Bcm
2020
Stated Policies Scenario Announced Pledges Scenario Sustainable Development Scenario
2030 2050AAGR
2020-2050Share 2050 2030 2050
AAGR 2020-2050
Share 2050 2030 2050
AAGR 2020-2050
Share 2050
Europe 596 587 497 -0.6% 10% 504 234 -3.1% 6% 483 118 -5.3% 5%North America 1,096 1,154 1,073 -0.1% 21% 933 418 -3.2% 11% 900 328 -3.9% 13%Central and South America 148 154 191 0.9% 4% 152 154 0.1% 4% 134 98 -1.4% 4%Asia Pacific 839 1,114 1,442 1.8% 28% 1,105 1,164 1.1% 30% 1,146 880 0.2% 36%Eurasia 597 663 711 0.6% 14% 668 712 0.6% 18% 634 419 -1.2% 17%Middle East 559 658 839 1.4% 16% 665 841 1.4% 22% 541 435 -0.8% 18%Africa 164 208 319 2.3% 6% 210 308 2.1% 8% 193 170 0.1% 7%International bunkers 1 16 40 12.1% 1% 12 21 9.8% 1% 8 5 4.4% 0%World 3,999 4,554 5,113 0.8% 1 4,249 3,852 -0.1% 100% 4,038 2452 -1.6% 100%
Source: World Energy Outlook 2021 © OECD/IEA, october 2021
Natural gas production forecast in Bcm
2020
Stated Policies Scenario Announced Pledges Scenario Sustainable Development Scenario
2030 2050AAGR
2020-2050Share 2050 2030 2050
AAGR 2020-2050
Share 2050 2030 2050
AAGR 2020-2050
Share 2050
Europe 241 200 181 –0.9% 4% 179 96 –3.0% 2% 172 41 5.1% 2%North America 1,165 1,305 1,188 0.1% 23% 1,071 549 –2.5% 14% 1,006 433 3.4% 18%Latin America 151 154 209 1.1% 4% 150 162 0.2% 4% 133 98 2.6% 4%Asia Pacific 643 702 782 0.7% 15% 701 639 0.0% 17% 700 450 1.9% 18%Eurasia 926 1,088 1,183 0.8% 23% 1,038 990 0.2% 26% 1,006 601 2.3% 25%Middle East 645 800 1,124 1.9% 22% 805 1,018 1.5% 26% 742 577 2.2% 24%Africa 244 305 446 2.0% 9% 305 399 1.7% 10% 278 252 1.9% 10%World 4,014 4,554 5,113 0.8% 100% 4,249 3,852 –0.1% 100% 4,038 2,452 2.5% 100%Conventional gas 2,899 3,177 3,634 0.8% 71% 3,084 3,047 0.2% 79% 2,975 1,899 2.2% 77%Tight gas 290 279 223 –0.9% 4% 229 71 –4.6% 2% 277 113 2.3% 5%Shale gas 742 1,013 1,136 1.4% 22% 853 650 –0.4% 17% 705 373 3.8% 15%Coalbed methane 80 62 94 0.5% 2% 59 84 0.2% 2% 57 68 1.1% 3%Other production 3 24 25 7.3% 0% 24 – – – 24 – – -
Source: World Energy Outlook 2021 © OECD/IEA, october 2021

87
NATURAL GAS & RENEWABLE GASES
Natural gas: consumptionStrong recovery in gas demand in 2021, hampered by supply problems
Natural gas demand contracted 1.6% in 2020, with the first half of the year (-4% year-on-year) affected by the pandemic and unusually warm weather that mitigated heating needs. The decline was less marked than for other fossil energy sources, however, as gas is less dependent on power generation than coal and less important to transport than oil. The second half of the year saw the beginning of a recovery, when a combination of attractive gas prices and rising CO2 prices in Europe conferred a competitive advantage to gas over coal in the power sector.
The situation improved further in 2021 but remains fragile. Gas demand rebounded at end-2020 and in early 2021 as a result of three positive factors: lower than average tempe-ratures in the spring that extended the heating season, rising gas consumption in the power sector and strong economic recovery. This is particularly the case in Asia, and especially in China, which has become the largest LNG import market ahead of Japan. Demand from the industrial sector remained solid throughout the year, however, particularly in Asia and in the Middle East and in Europe.
Demand spiked at the beginning of the year on temperature-sensitive markets such as France, Japan, Korea, North China, and spectacularly so in the USA, where an extreme cold snap unbalanced supply and demand and jacked up prices.
In addition, gas-fired plants benefited from weaker production in the wind, solar and hydro with droughts in key markets (China, California, Brazil, Turkey), nuclear sectors (maintenance delays as a result of Covid) and also in coal, where several plants had been decommissioned amid poor market conditions in the preceding months.
From the middle of the year, pressure on gas supply chains triggered an exceptional surge in European and Asian prices that wiped out what had been favourable arbitrage in the power sector. Even high CO2 prices in Europe failed to safeguard its advantage.
All in all, gas demand is expected to increase 3% in 2021, according to the IEA. That would incorporate a 1% rise for power generation and a 5% gain in the industrial and residential/services sectors.
2021 is a perfect illustration of the challenges that energy systems will face as extreme weather conditions worsen. It showed the importance of gas plants in preserving flexible contingency capacity that can ensure continued power supply when major weather events occur.
DEMAND BY REGION AND BY SECTOR FROM 2019 TO 2021 IN BCM
Bcm
100
150
50
0
-50
-100
Regions Sectors
2019-20 2020-21 2019-21 2019-20 2020-21 2019-21
Sectors Other Transport Energy own use Buildings Industry Energy
Regions
Rest of world Middle East North America Europe Eurasia Asia Pacific World
Source: IEA, Global Energy Review, april 2021

88
NATURAL GAS & RENEWABLE GASES
Natural gas: primary consumption
Natural gas primary consumption in Bcm
2000 2005 2010 2015 2019 2020 Change2019-2020
AAGR 2010-2020
Share in the world 2020
Europe 505 575 600 500 547 532 -2.8% -1.2% 14%EU-27 379 436 449 366 411 398 -3.2% -1.2% 10%EU-28 481 536 549 439 489 471 -3.7% -1.5% 12%
France 40 47 48 39 42 39 -7.3% -2.2% 1%Germany 88 91 95 81 95 93 -2.4% -0.2% 2%
Italy 71 86 83 68 74 71 -4.4% -1.6% 2%Netherlands 49 50 56 41 44 44 -1.9% -2.5% 1%
United Kingdom 102 100 99 73 78 73 -6.2% -3.0% 2%North America 753 722 781 882 1,007 985 -2.3% 2.3% 25%
United States 661 623 683 767 884 867 -1.9% 2.4% 22%Canada 92 99 97 115 123 117 -4.6% 1.9% 3%
Latin America 136 182 215 245 242 223 -7.9% 0.4% 6%Argentina 37 44 45 51 52 49 -5.9% 0.9% 1%
Mexico 40 55 70 78 83 75 -9.5% 0.7% 2%Asia 290 393 558 658 794 802 1.0% 4% 20%
China 25 47 125 192 303 325 7.2% 10.0% 8%India 29 38 53 55 64 63 -1.4% 1.7% 2%
Japan 88 91 111 114 103 100 -3.1% -1.1% 3%Pacific 29 30 37 42 47 46 -3.0% 2% 1%CIS 570 624 663 602 665 645 -3.1% -0.3% 16%
Russia 391 426 466 445 501 485 -3.3% 0.4% 12%Middle East 174 255 374 481 537 551 2.6% 3.9% 14%
Saudi Arabia 38 56 73 87 97 97 0.6% 2.9% 3%Iran 62 99 144 184 212 221 4.2% 4.3% 6%
United Arab Emirates 30 42 61 74 78 75 -3.9% 2.1% 2%Africa 57 90 108 134 164 158 -3.4% 4% 4%World 2,515 2,870 3,335 3,543 4,004 3,941 -1.6% 1.7% 100%
OECD 1,411 1,482 1,625 1,649 1,831 1,781 -2.7% 0.9% 45%Non OECD 1,103 1,389 1,711 1,894 2,173 2,160 -0.6% 2.4% 55%
Source: Enerdata, Global Energy and CO2 Data, 2021

89
NATURAL GAS & RENEWABLE GASES
Natural gas: consumption by sector
Gas consumption by sectorin Bcm
Energy Industry Transport Services, Residential & Agriculture
Non energy uses Total
2020 Change2019-2020
2020 Change 2019-2020
2020 Change 2019-2020
2020 Change 2019-2020
2020 Change 2019-2020
20 2020 19 Change 2019-2020
Europe 199 -4% 109 -4% 2 -5% 202 -1% 20 -5% 532 -3%EU-27 147 -4% 87 -4% 2 -5% 145 -2% 18 -4% 398 -3%EU-28 176 -5% 95 -5% 2 -5% 179 -2% 18 -4% 471 -4%
France 9 -8% 10 -7% 0 -6% 19 -7% 1 -7% 39 -7%Germany 26 -4% 23 -4% 0 0% 41 0% 3 -6% 93 -2%
Italy 32 -5% 10 -8% 1 -8% 28 -2% 1 -8% 71 -4%Netherlands 18 3% 7 -7% 0 -5% 15 -3% 3 -9% 44 -2%
United Kingdom 30 -11% 9 -7% 0 NA 35 -1% 0.4 0% 73 -6%North America 520 1% 174 -2.0% 2 15% 255 -8% 34 4% 985 -2%
United States 456 1% 157 -2.0% 2 16% 222 -8.6% 30 5% 867 -2%Canada 64 -4% 17 -2.6% 0.1 1% 32 -7% 4 -2.6% 117 -5%
Latin America 144 -8% 42 -11% 6 -19% 19 -1% 12 -6% 223 -7.9%Argentina 27 -7% 8 -7% 2 -24% 12 0% 1 -7% 49 -6%
Mexico 59 -8% 15 -16% 0.1 -15% 1 6% 0.4 -16% 75 -10%Asia 379 -2% 196 4% 42 5% 125 4% 59 -1% 802 1%
China 93 4% 118 8% 32 9% 70 8% 11 9% 325 7%India 27 -1% 7 -2% 3 -4% 4 -2% 22 -2% 63 -1%
Japan 71 -1% 11 -10% 0.0 -9% 18 -8% 0.2 -10% 100 -3%Pacific 27 -5% 10 -1% 0.1 2% 7 2% 3 -6% 46 -3%CIS 387 -4% 62 -2% 6 -2% 133 -1% 57 -1% 645 -3%
Russia 295 -5% 47 -1% 2.0 -1% 87 -1% 53 -1% 485 -3%Middle East 312 4% 132 0% 8 2% 69 3% 31 2% 551 3%
Saudi Arabia 64 -1% 27 3% 0 NA 0 NA 7 3% 97 1%Iran 92 7% 43 1% 8 2% 61 4% 16 1% 221 4%
United Arab Emirates 37 -2% 38 -6% 0 NA 0 NA 0.4 -6% 75 -4%Africa 103 -4% 24 -4% 0.4 -5% 15 -1% 15 -4% 158 -3%World 2,071 -2% 748 -1% 67 1% 824 -2% 231 -1% 3,941 -2%
OECD 906 -1% 323 -3.8% 5 0% 491 -5.3% 56 0% 1,781 -3%Non OECD 1,165 -2% 425 1% 61 1% 334 2% 176 -1% 2,160 -1%
Source: Enerdata, Global Energy and CO2 Data, 2021
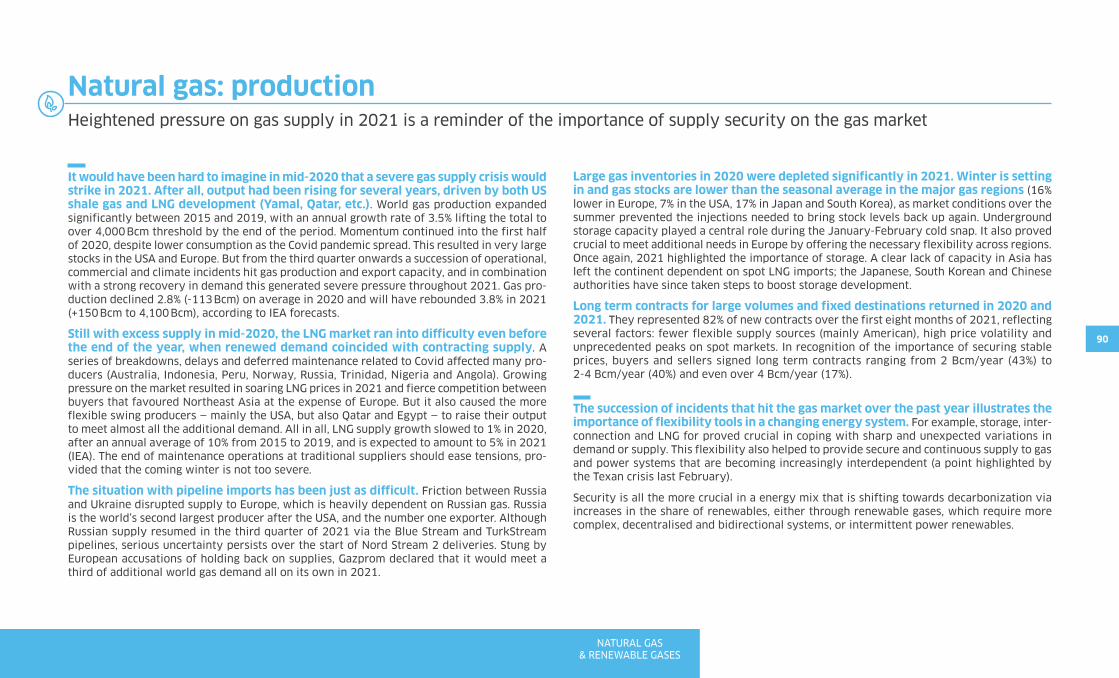
90
NATURAL GAS & RENEWABLE GASES
Natural gas: productionHeightened pressure on gas supply in 2021 is a reminder of the importance of supply security on the gas market
It would have been hard to imagine in mid-2020 that a severe gas supply crisis would strike in 2021. After all, output had been rising for several years, driven by both US shale gas and LNG development (Yamal, Qatar, etc.). World gas production expanded significantly between 2015 and 2019, with an annual growth rate of 3.5% lifting the total to over 4,000 Bcm threshold by the end of the period. Momentum continued into the first half of 2020, despite lower consumption as the Covid pandemic spread. This resulted in very large stocks in the USA and Europe. But from the third quarter onwards a succession of operational, commercial and climate incidents hit gas production and export capacity, and in combination with a strong recovery in demand this generated severe pressure throughout 2021. Gas pro-duction declined 2.8% (-113 Bcm) on average in 2020 and will have rebounded 3.8% in 2021 (+150 Bcm to 4,100 Bcm), according to IEA forecasts.
Still with excess supply in mid-2020, the LNG market ran into difficulty even before the end of the year, when renewed demand coincided with contracting supply. A series of breakdowns, delays and deferred maintenance related to Covid affected many pro-ducers (Australia, Indonesia, Peru, Norway, Russia, Trinidad, Nigeria and Angola). Growing pressure on the market resulted in soaring LNG prices in 2021 and fierce competition between buyers that favoured Northeast Asia at the expense of Europe. But it also caused the more flexible swing producers — mainly the USA, but also Qatar and Egypt — to raise their output to meet almost all the additional demand. All in all, LNG supply growth slowed to 1% in 2020, after an annual average of 10% from 2015 to 2019, and is expected to amount to 5% in 2021 (IEA). The end of maintenance operations at traditional suppliers should ease tensions, pro-vided that the coming winter is not too severe.
The situation with pipeline imports has been just as difficult. Friction between Russia and Ukraine disrupted supply to Europe, which is heavily dependent on Russian gas. Russia is the world’s second largest producer after the USA, and the number one exporter. Although Russian supply resumed in the third quarter of 2021 via the Blue Stream and TurkStream pipelines, serious uncertainty persists over the start of Nord Stream 2 deliveries. Stung by European accusations of holding back on supplies, Gazprom declared that it would meet a third of additional world gas demand all on its own in 2021.
Large gas inventories in 2020 were depleted significantly in 2021. Winter is setting in and gas stocks are lower than the seasonal average in the major gas regions (16% lower in Europe, 7% in the USA, 17% in Japan and South Korea), as market conditions over the summer prevented the injections needed to bring stock levels back up again. Underground storage capacity played a central role during the January-February cold snap. It also proved crucial to meet additional needs in Europe by offering the necessary flexibility across regions. Once again, 2021 highlighted the importance of storage. A clear lack of capacity in Asia has left the continent dependent on spot LNG imports; the Japanese, South Korean and Chinese authorities have since taken steps to boost storage development.
Long term contracts for large volumes and fixed destinations returned in 2020 and 2021. They represented 82% of new contracts over the first eight months of 2021, reflecting several factors: fewer flexible supply sources (mainly American), high price volatility and unprecedented peaks on spot markets. In recognition of the importance of securing stable prices, buyers and sellers signed long term contracts ranging from 2 Bcm/year (43%) to 2-4 Bcm/year (40%) and even over 4 Bcm/year (17%).
The succession of incidents that hit the gas market over the past year illustrates the importance of flexibility tools in a changing energy system. For example, storage, inter-connection and LNG for proved crucial in coping with sharp and unexpected variations in demand or supply. This flexibility also helped to provide secure and continuous supply to gas and power systems that are becoming increasingly interdependent (a point highlighted by the Texan crisis last February).
Security is all the more crucial in a energy mix that is shifting towards decarbonization via increases in the share of renewables, either through renewable gases, which require more complex, decentralised and bidirectional systems, or intermittent power renewables.

91
NATURAL GAS & RENEWABLE GASES
Natural gas: production
NATURAL GAS PRODUCTION FROM 1990 TO 2020 IN BCM
DISTRIBUTION OF WORLD NATURAL GAS PRODUCTION IN 2020TOTAL: 3,995 IN BCM
Pacific Africa Latin America Middle East Asia Europe North America CIS Source: Enerdata, Global Energy and CO2 Data, 2021
Latin America 5%
Europe 5%
Africa 6%
Asia 12%
Middle East 17%
North America 28%
CIS 23%
Natural gas production in Bcm
2000 2005 2010 2015 2019 2020 Change2019-2020
AAGR 2010-2020
Share in the World
2020
Europe 320 329 317 261 230 214 -7.0% -3.9% 5%EU-27 150 148 148 98 71 56 -21.3% -9.3% 1%EU-28 265 241 206 138 111 95 -13.7% -7.4% 2%
Norway 53 87 110 121 119 116 -2.4% 0.5% 3%Netherlands 74 78 90 55 34 24 -28% -12.4% 1%
United Kingdom 115 93 58 41 40 40 -0.2% -3.7% 1%North America 726 700 760 932 1,138 1,125 -1.1% 4.0% 28%
United States 544 512 604 767 962 953 -0.9% 4.7% 24%Canada 182 188 156 165 176 172 -2.3% 1.0% 4%
Latin America 138 179 211 219 199 181 -8.7% -1.5% 5%Asi 251 335 426 449 479 478 -0.2% 1.2% 12%
China 27 49 96 135 176 193 10% 7.3% 5%Indonesia 70 75 86 75 69 64 -6.6% -2.9% 2%Malaysia 50 66 61 69 71 66 -7.7% 1% 2%
Pacific 39 40 58 83 159 171 7.6% 11.5% 4%Australia 33 36 53 68 142 154 7.9% 11.3% 4%
CEI 709 797 834 844 982 915 -6.8% 0.9% 23%Russia 573 628 657 638 751 705 -6.1% 0.7% 18%
Turkmenistan 47 63 45 84 87 NA NA NA NAMoyen-Orient 196 302 467 585 669 674 0.7% 3.7% 17%
Saudi Arabia 38 56 73 87 97 97 0.6% 2.9% 2%Iran 59 99 144 184 232 234 1.1% 5.0% 6%
Qatar 25 45 121 165 168 167 -0.1% 3.3% 4%Africa 124 189 209 202 251 236 -6.1% 1.2% 6%
Algeria 82 89 85 84 90 84 -6.8% -0.1% 2%World 2,504 2,870 3,281 3,574 4,108 3,995 -3% 2.0% 100%
OECD 1,110 1,104 1,181 1,304 1,545 1,530 -0.9% 3% 38%Non OECD 1,394 1,766 2,100 2,269 2,563 2,464 -3.8% 1.6% 62%
Source: Enerdata, Global Energy and CO2 Data, 2021
Pacific 4%
Source: Enerdata, Global Energy and CO2 Data, 2021
0
500
1,000
1,500
2,000
2,500
3,000
3,500
4,500
4,000
1992 1994 1996 1998 2000 2002 2004 2006 2008 2010 2012 2014 2016 202020181990

92
NATURAL GAS & RENEWABLE GASES
Natural gas: pricesIn a very tight market situation, natural gas prices reacted violently
The economic recovery generated an exceptional rally in European and Asian gas prices in 2021. Wholesale gas prices in Europe (TTF) and LNG spot prices in Asia climbed steeply in 2021, with an acceleration as the market tightened. From around €17/MWh ($6/MBtu) on European markets in January 2021, prices soared to over €110/MWh in the autumn as the heating season started. This was the highest level ever seen since trading on European gas hubs was introduced. The rally came at a very particular time, when strong economic recovery coincided with supply tensions and a general rise in oil and coal prices as well as in CO2 (see the Price section in other chapters). It has also featured historically high volatility. This reflects uncer-tainty over the length of time the market will remain undersupplied and unusually low inven-tories after an atypically cold spring (European stocks were 10 Bcm lower at the start of the autumn than their average of the past five years).
An extreme cold have been experienced during the first months of 2021, first in North-East Asia and then in North America, particularly in Texas. This led to an episode of great tension and price peaks in the Henry Hub at $24/Mbtu (highest peak at $1,250/Mbtu in the OGT hub, Oklahoma).
In September, international spot gas prices went stratospheric, with fresh European concern over Russia’s ability to increase exports through pipelines and continued competition for cargoes coming from Asia (which are subject to liquefaction restrictions and strong local demand). The simultaneous rally in TTF and Asian LNG spot prices underlines competition between the two markets.
The US market also came under pressure, but to a lesser degree. Henry Hub prices rose above $6/MBtu in October in response to European demand dependent on US LNG deliveries.
By way of comparison, we recall that European TTF prices averaged €13.5/MWh ($4.5/MBtu) in 2019, €9.4/MWh ($3.2/MBtu) in 2020, and surged to €43/MWh ($14.8/MBtu) in early November 2021. Northeast Asian spot prices averaged $5/MBtu in 2019, $2/MBtu in 2020, and $5.8/MBtu in early November 2021.
In the USA, Henry Hub prices averaged $2.8/MBtu in 2019, $2/MBtu in 2020, and hit $4.1/Mbtu in early November this year.
NATURAL GAS PRICES EVOLUTION – DAILY SPOT IN $/MBTU
Henry Hub TTF Spot LNG Northeast Asia
Source: Q3 2021 – International natural gas prices (CEDIGAZ)
Short term prospects are still subject to significant uncertainty, especially around Russian gas supplies. Forecasts tend to assume reduced tensions and softer prices towards the end of the year, however. This will depend not only on Russian supply but also winter temperatures in Europe, supply from other producers, such as Norway, and the availability of LNG shipments. Given inelastic demand and no scope for switching to coal to produce electricity, volatility should remain high.
$/M
Btu
01/0
1/19
01/0
4/19
01/0
7/19
01/1
0/19
01/0
1/20
01/0
4/20
01/0
7/20
01/1
0/20
01/0
1/21
01/0
4/21
01/0
7/21
01/1
0/21
0
5
10
15
20
25
30
35

93
NATURAL GAS & RENEWABLE GASES
Waste
Direct useOrganic matter
Anaerobicdigestion
Upgrading
Gas network
Consumption
Digestate
Biomassgasi�cation
& methanation
Renewable gases: biogasGreen gases, alongside renewable electricity, will be essential for the energy transition
Green gases: what are they? Biogas is produced from either landfill gas, sewage sludge, agricultural or agri-food residues
through an anaerobic digestion process (also called methanisation). It can be used directly to generate electricity and heat (cogeneration). Anaerobic digestion or methanisation is a biological process using microorganisms to decom-pose organic matter in the absence of oxygen. This process produces Biogas (methane, CO2 and other gases) and a digestate that can be used as fertiliser.
Syngas is produced by either pyrogasification or reformation of green hydrogen and carbon dioxide (methanation).Pyrogasification or gasification is a thermo-chemical process that produces a gaseous fuel, called syngas, from lignocellulosic material (wood, straw, etc.). Syngas mainly consists of methane, hydrogen, carbon monoxide and carbon dioxide. It can be used directly in cogene-ration or purified to produce biomethane.
Biomethane is Biogas or purified synthesis gas that can be injected into the natural gas grid as a substitute to natural gas for any type of client and use, including mobility (NGV).
Green hydrogen is produced from renewable electricity through electrolysis (power-to-gas) or through biomass (steam reforming or pyro-gasification). Mainly used as an industrial raw material today, hydrogen can be injected directly into the natural gas grid directly or in the form of methane after reformation with carbon dioxide (see following section).
Biomethane, synthesis methane or hydrogen can either be injected in the natural gas grid (up to a certain percentage for hydrogen) or used directly, off the grid, for specific purposes, such as transport.
Most of today’s green gases are Biogases from methanisation, with heat and electricity produced through cogeneration engines. The production of biomethane for injection into the natural gas grid is developing, however, thanks to regulatory incentives in several European countries. Pyrogasification and power-to-gas have not yet reached the technological maturity of metha-nisation, and their share of production remains limited compared to methanisation.
HOW BIOGAS AND BIOMETHANE ARE PRODUCED
Source: European Biogas Association, Statistical Report, 2019
Biogas Biomethane

94
NATURAL GAS & RENEWABLE GASES
Renewable: biogas
Biogas has thrived over recent years because of two major factors: the availability of raw material and the political support. This explains its uneven development across the world. Europe, China and the USA together made up 90% of world production in 2018, for an estimated 35 Mtoe (approx. 410 TWh). This represents a tiny fraction of world potential however, estimated near 600 Mtoe (approx. 7,000 TWh).
European biogas production has stagnated in recent years. It experienced exponential growth until 2014, and more attenuated since, mainly as a result of changes in the EEG law* in Germany. In 2019 European Biogas production reached 167 TWh. It remains concentrated at 80% in 3 coun-tries: Germany (82 TWh), UK (20 TWh), Italy (23 TWh).
Biomethane expansion continues in Europe.In 2019, European biomethane production totalled 26 TWh, up 15 % from 2018. The three main producers were Germany (10 TWh), Denmark (2.6 TWh) and France (2.2 TWh). France reported the fastest growth in terms of both new facilities coming on stream and production.
A rapid expansion in biomethane capacity continued with a 16% increase in the number of facilities between 2018 and 2019. Production rose 15% per year on average between 2017 and 2019.
The potential for biomethane is estimated at approximately 400 TWh by 2030 (10% of natural gas consumption) and over 1,000 TWh by 2050.
* EEG: Erneuerbare Energien Gesetz, which is German legislation that favours renewables via regulated purchase prices.
.
BIOGAS AND BIOMETHANE POTENTIAL IN EUROPE BY 2030, 2040 AND 2050 ACCORDING TO VARIOUS
STUDIES (BCM AND TWH)
BIOGAS PRODUCTION IN EUROPE, 2011-19 (TWH)
BIOMETHANE PRODUCTION IN EUROPE, 2011-19 (TWH)
Source: European Biogas Associations « Statistical Report 2021 »
Source: European Biogas Associations « Statistical Report 2021 »
2017 2018 20192011 2012 2013 2014 2015 2016
+11%+77%
+17%+5% +5% +0% +0% +1%
66 66
51
1322
78
117130 153
160 168 166 166TWh
180
150
120
90
60
30
0
2017 2018 20192011 2012 2013 2014 2015 2016
+308%
+203%
+24% +9%
+37%+15%
+14%
+15%
1.5
7
2.31.2
4.7
2.32.4
3.5
2.3
9.3 11.6 12.817.5
19.822.2
TWh
30
25
20
15
10
5
0
Existing production New production
18 bcm / 193 TWhCurrent production (2019)
44 bcm / 467 TWhEuropean Commission (2030)
35 bcm / 375 TWhEurogas (2030)35 bcm / 375 TWhGas for Climate (2030)
95 bcm /1.008 TWhEurogas (2050)
95 bcm /1.008 TWhEurogas (2050)
125 bcm / 1.326 TWhIEA (2040)
124 bcm /1.316 TWh
Cerre (no timeframe
given)

95
NATURAL GAS & RENEWABLE GASES
USE OF GREEN GAS BY SECTOR IN THE EU TO 2050
GREEN GAS PRODUCTION FORECASTS TO 2050 IN THE EUROPEAN UNION
Source: Navigant, 2019
Source: Gas for Climate, 2020
Renewable gases within the energy transition
Green gases meet energy transition requirements on several counts. As they can be injected into natural gas grids, green gases offer specific advantages over other renewable sources: low transport costs, massive and competitive storability, and high inter-seasonal flexibility. In Europe in particular, green gases can benefit from existing and well-amortised infrastructures. For these reasons, green gases are an indispensable vehicle of energy transition and an integral part of decarbonization roadmaps, in which they are complementary to other renewables for electricity generation (see the Scenarios section in the Decarbonization chapter).
Because it is produced locally, biogas is an opportunity for decentralised solutions and non-reloca table job creation (about 3-4 direct jobs per facility). It helps address the community challenge of waste treatment, favours sustainable agriculture, helps to improve air quality and opens access to ‘modern’ energy for communities deprived of it.
Market design is essential to take advantage of biogas and biomethane potential.Biogas and biomethane development is very capital-intensive. Production costs largely depend on input prices, facility size and national support mechanisms. They range from €40 to €120 per MWh for production based on anaerobic digestion.
For biomethane and biogas to compete with fossil fuels, carbon prices must reflect their environmental benefit. Until then, support such as injection tariffs, support mechanisms as green certificates, or fiscal incentives will be needed for the market to develop.
The establishment of support policies, as was the case for electric renewables, should improve the productivity of anaerobic digestion units, professionalize the sector by massifying ope-rations and standardizing them. The objective is to reduce biomethane production costs by a third by 2030.
At last, the cost of these mechanisms must be balanced with the positive externalities gene-rated by biogas and biomethane.
Buildings 230 TWh
Industry700 TWh
Power1,105 TWh
Heavytransport845 TWh
Biomethane1 170 TWh
Hydrogen1 710 TWh
Gas c
onsu
mpt
ion
2020 2030 2040 2050
Biomethane
Hydrogen
Natural gas

96
NATURAL GAS & RENEWABLE GASES
Renewable gases: hydrogenGreen hydrogen is about to become the keystone of the energy revolution
Hydrogen (H2) is the most widespread chemical element on earth. It is found in water (H2O), for example, and in hydrocarbons such as oil and natural gas. The molecule has a par-ticularly high energy content and it can be transported and stored: 1kg of hydrogen generates roughly three times more energy than 1kg of gasoline.
Today, mainly carbon hydrogen is produced. This so-called “grey hydrogen” is extracted from fossil fuels, notably through natural gas
steam reforming (76% of hydrogen is produced from natural gas and the rest from coal, accor-ding to the IEA). In other words, about 96% of the world’s hydrogen production is grey hydrogen.Grey hydrogen is currently the cheapest solution available at around $2/kg H2, depending on gas and CO2 local prices. But it is also highly carbon-intensive: 1kg of H2 produced generates about 10 to 20 kg of CO2, depending on the production process. The sector emits 830 million tonnes of CO2 each year, according to the IEA. By comparison, Germany’s total emissions are smaller than that.
“Blue” hydrogen is derived from grey hydrogen, complemented with carbon capture and storage (CCS). Up to 90% of the CO2 emitted during the production process is captured and stored underground, which raises technical challenges.
“Green” hydrogen is the only fully decarbonized solution. It produces hydrogen via the electrolysis of water, using renewable electricity (hydro, solar or wind) without CO2 emissions or polluting particles. Renewable hydrogen remains about twice as expensive as grey hydrogen, and today only 4% of world hydrogen production uses electrolysis.
Hydrogen is used mainly as an industrial raw material.Most of the 70 million tonnes of hydrogen produced each year in dedicated facilities is used to manufacture ammonia and fertilizers, methanol and to refine oil. As it is produced in such large volumes, it is grey hydrogen.
Cheaper electrolysis and renewable energy will extensively reshape the hydrogen market in the years ahead. Converging private initiatives and public support have helped the electrolysis sector to start scaling up. In combination with process industrialisation, electrolysers’ production costs are coming down.Taken together, planned electrolysis projects represent 65 GW in installed capacity by 2030 according to IHS. The EU has a 2030 target of 40 GW all on its own.The cost of producing renewable hydrogen is nearly equally divided between the costs of the electrolyser and that of green electricity. The downtrend in renewable power and electrolysis costs reduced renewable hydrogen production costs by 45% on average between 2015 and 2020, according to IHS

97
NATURAL GAS & RENEWABLE GASES
Renewable gases: hydrogen
According to the Hydrogen Council, among 359 large-scale hydrogen production projects announced world-wide in mid-2021, 28 are giant projects of a scale larger than 1 GW.
Europe is leading the way, with Australia, Japan, Korea, China and the USA also emerging as future hydrogen hubs.
There is now a consensus among scientists that renewable hydrogen will soon be a competitive alternative.
The continuing decline in renewable electricity and elec-trolysers’ costs is expected to halve production costs by 2030.
Most analysts consider that green hydrogen will be chea-per than grey hydrogen before 2030 in the most favorable locations (i.e. where wind and solar power is the most competitive).
At the same time, establishing a high CO2 price should acce-lerate the trend, as it would weigh on grey hydrogen produc-tion costs.
GLOBAL HYDROGEN PROJECTS ACROSS THE VALUE CHAIN
Source: Hydrogen Insights, An updated perspective on hydrogen investment, july 2021
359 Announced large-scale projects
~USD 500 bn investment by 2030, of which USD 150 bn is associated with mature projects
28Giga-scale production: Renewable hydrogen projects> 1 GW and low-carbon hydrogen projects >200 ktpa.
141Large-scale industrial usage: Refinery, ammonia, methanol, steel, and industry feedstock.
96Transport: Trains, ships, trucks, cars, and other hydrogen mobility applications.
56Integrated hydrogen economy: Cross-industry and projects with different types of end uses.
38Infrastructure projects: Hydrogen distribution, transportation, conversion, and storage.

98
NATURAL GAS & RENEWABLE GASES
Renewable gases: hydrogen
In most energy transition scenarios, green hydrogen is a key element in unlocking the full potential of electricity renewables. It can be stored to cope with intermittent renewable energy and to meet seasonal demand (heating uses). It can also contribute to decarbonise uses that are impossible to electrify.
Green hydrogen benefits from strong political support. By the end of 2020, over 50 countries had implemented policies aimed at its development or were in the process of doing so, according to BNEF. In July 2020, for example, the European Commission published a hydrogen deployment strategy as part of carbon neutrality. The objective is 40 GW elec-trolysis installed capacity by 2030, producing 10 Mt of green hydrogen. Many non-EU European countries have followed suit by publishing their own ambitions.
Large scale industrial processes
90%Feedstock for industry24%
Power generation 12%
Other 3%
Transportation 27%
67 Mt/y= 2,642 TWh
PCS
550 Mt/y= 21,692 TWh
PCS
2050 HYDROGEN MARKET ESTIMATES (ALL TYPES OF HYDROGEN)
Energy for industry 20%
Heat & power for buildings
14%
Other 10%
H2 market in 2050H2 market in 2017
X10
Greener hydrogen production will go together with new uses. Decarbonising current hydrogen uses (refining, chemicals and steel production) is a first step in market development. Beyond that, most experts consider that green hydrogen will expand as a low carbon solution in sectors where direct electrification is difficult: ‘heavy’ mobility (road, rail, synthetic fuel for maritime and air transport), power storage and production, heat generation and the pro-duction of decarbonized synthetic molecules.The Hydrogen Council forecasts that the global market for hydrogen will increase tenfold by 2050, driven by renewable hydrogen and its new uses, and that hydrogen will account for about 20% of final energy demand by then (see opposite).
Source: Hydrogen Council
Estimate made in 2019 of the costs of green hydrogen (average location) Average location (2020 estimate) Optimal location (2020 estimate)
HYDROGEN PRODUCTION COSTS BY PRODUCTION PATHWAY
Renewable hydrogenConditions for lower costs:- Dedicated renewable/electrolyser
system- Fully flexible production- Scale up of renewable hydrogen
production- Additional costs to reach end
suplly price
Low-carbon hydrogenConditions for lower costs: - Development of CO2
- Scale up of low-carbon hydrogen production
- Scale up of CCS outside of hydrogen production
Source: Hydrogen Insights: a perspective on hydrogen investment, market development and cost competitiveness, Hydrogen Council&McKinsey, 2021
Prod
uctio
n co
st of
hyd
roge
n U
SD/k
g
6
5
4
3
2
1
0
Renewable
2020
2019 average location
Low-carbonGrey
2020 2030 2040 2050
Breakdown between grey and renewable requires…
~65 GW of electrolyzer capacity
~50 bn gap to be bridged
-62%
Key assomptions: Gas price 2.6-6.8 USD/Mmbtu – LCOE USD/MWh 25-73 (2020), 13-37 (2030), 7-25 (2050).

OIL
Oil and energy transition . . . . . . . . . . . . . . . 100
Consumption . . . . . . . . . . . . . . . . . . . . . . . . . . 102
Production . . . . . . . . . . . . . . . . . . . . . . . . . . . . 104
Prices . . . . . . . . . . . . . . . . . . . . . . . . . . . . . . . . 106
OIL DEMAND
OPEC+ is the only player capable of responding to rebounds in oil demand. It has opted to maintain a canny imbalance on the market via a tight rein on supply
PRODUCTION
In a context of heightened pressure on energy prices, oil markets renewed with highs at $ 80 per barrel
Oil
99

100
OIL
Oil and energy transition
Comparing the current trajectory with decarbonization roadmaps: the exceptional 9% shortfall in oil consumption caused by the Covid-19 pandemic in 2020 should be entirely bridged by 2022, with world production expected to be around 100 mb/d. Under existing regulations and current technology (IEA STEP scenario), demand will keep rising 1.5% every year over the decade and peak at 103 mb/d in 2030 before levelling off.
This represents a massive difference from the carbon neutral scenario (NZE) target of 31 mb/d in 2030. The latter requires consumption to drop by 2 mb/d (or by 4.6%) per year out to 2050. By that time it would be down to 22 mb/d, of which two thirds in petrochemicals. Investments in new oil fields after 2021 cannot therefore be justified.
If implemented, national COP26 commitments (APS scenario) would bring the oil peak forward to 2025 and reduce demand by about 1 mb/d per year until 2050, to 77 mb/d. But the overshoot relative to the NZE scenario would amount to 24 mb/d in 2030 and 55 mb/d in 2050.
World oil demand will depend on modal shifts, technological progress, consumer choices and political ambition regarding transport. Road transport will play a key role as it is best placed to use substitutes; on the other hand, oil demand for petrochemicals is unlikely to decline. Indeed, the latter actually increases in each scenario in recognition of economic development in the Middle East, China and India. Plastics recycling rates improve in all scenarios.
Biofuels will remain the most important low emission fuel. Their volume increases rapidly under each of the scenarios, and triples in the NZE from 2030. Hydrogen-based fuels only really develop in the NZE and after 2030 to supply 45% of maritime transport and 30% of aviation in 2050. This assumes supportive public policy and large-scale investment in research and production. This scenario also assumes 300 million electrical vehicles in 2030, saving 3.5 mb/d of oil.
PRIMARY OIL DEMAND FORECASTS – WORLD
CHANGES IN OIL DEMAND UNDER DIFFERENT IEA SCENARIOS, 2020-30
Sectors Other Power Buildings Other industries Petrochemicals Other transport Road transport
Regions Advanced economies Emerging market and developing economies
Net change
Source: World Energy Outlook 2021 © OECD/IEA, october 2021
mb/
d
20
10
0
-10
-20
Sectors Regions
STEPS APS NZE STEPS APS NZE
IEA STEPS (0.2%/year) IEA APS (-0.6%/year) IEA SDS (-1.9%/year) IEA NET ZERO (-4%/year) Extension years 2010-2020 (0.1%/year)
Extension year 2020 (-7.3%/year) Historical (Enerdata)
Prim
ary d
eman
d(M
toe)
6,000
1,000
2,000
3,000
4,000
5,000
020402010 2015 2020 2025 2030 2035 20502045
(-7.3%/year)
(-.6%/year)
(-4%/year)
(0.1%/year)
(-1.97%/year)
(0.2%/year)
Historical(Enerdata)
Transition not initiated

101
OIL
Oil: IEA consumption and production forecasts
WORLD OIL PRODUCTION IN IEA SCENARIOS (MB/D, WEO 2021)
WORLD OIL CONSUMPTION IN IEA SCENARIOS (MB/D, WEO 2021)
Oil demand forecast in mb/d
2020
Stated Policies Scenario Announced Pledges Sustainable Development Scenario
2030 2050AAGR
2020-2050 2030 2050AAGR
2020-2050 2030 2050AAGR
2020-2050Europa 11.9 10.4 6.4 -2.0% 9.0 3.6 -3.9% 8.7 2.2 -5.5%North America 20.1 21.3 16.7 -0.6% 18.0 7.7 -3.1% 17.7 6.8 -3.5%Central and South America 5.0 5.4 6.0 0.6% 4.8 4.0 -0.7% 4.5 2.4 -2.4%Asia Pacific 30.8 38.5 38.8 0.8% 37.8 30.1 -0.1% 33.0 17.2 -1.9%Eurasia 3.7 4.4 4.5 0.7% 4.4 4.5 0.7% 4.0 2.6 -1.2%Middle East 6.7 8.2 10.2 1.4% 8.2 10.2 1.4% 7.2 6.1 -0.3%Africa 3.6 5.1 8.4 2.9% 5.0 7.9 2.7% 4.6 4.3 0.6%International bunkers 6.1 9.6 11.9 2.3% 8.9 8.8 1.2% 7.9 5.4 -0.4%World 87.9 103 103 0.5% 96.1 76.7 -0.5% 87.6 47.0 -2.1%
Source: World Energy Outlook 2021 © OECD/IEA, October 2021
Oil production forecasts in mb/d
2020
Stated Policies Scenario Announced Pledges Sustainable Development Scenario
2030 2050AAGR
2020-2050 2030 2050AAGR
2020-2050 2030 2050AAGR
2020-2050Europa 3.80 3.20 1.60 -2.8% 2.90 0.70 -5.5% 2.60 0.70 -5.5%North America 23.8 27.7 23.2 -0.1% 25.2 15.6 -1.4% 23.7 13.3 -1.9%Central and South America 5.9 7.9 10.9 2.1% 7.5 6.2 0.2% 6.7 3.4 -1.8%Asia Pacific 7.5 6.2 4.7 -1.5% 5.6 3.2 -2.8% 5.1 1.9 -4.5%Eurasia 13.4 14.4 12.5 -0.2% 13.9 10.2 -0.9% 11.9 5.1 -3.2%Middle East 27.7 34.0 39.7 1.2% 32.1 34.3 0.7% 29.3 17.9 -1.4%Africa 7.0 6.9 7.3 0.1% 6.5 4.1 -1.8% 6.0 3.4 -2.4%OPEC 30.9 36.6 43.7 1.2% 34.6 35.4 0.5% 31.7 19.6 -1.5%non OPEC 58.3 63.8 56.2 -0.1% 59.1 39.1 -1.3% 53.6 25.9 -2.7%World production 89.2 100.4 99.9 0.4% 93.7 74.4 -0.6% 85.4 45.6 -2.2%Conventional crude oil 59.6 64.1 61.2 0.1% 59.9 46.6 -0.8% 53.6 25.1 -2.8%Tight oil 7.3 10.6 10.9 1.3% 9.8 7.8 0.2% 8.7 6.4 -0.4%Natural gas liquids 18.1 20.4 21.4 0.6% 19.3 17.2 -0.2% 18.6 11.7 -1.4%Extra-heavy oil & bitumen 3.3 4.1 5.0 1.4% 3.8 2.3 -1.2% 3.5 2.2 -1.3%Other 0.9 1.2 1.4 1.5% 0.9 0.5 -1.9% 1.0 0.2 -4.9%
Source: World Energy Outlook 2021 © OECD/IEA, October 2021
Europe North America Latin America Asia Pacific Eurasia Middle East Africa International bunkers
Source: World Energy Outlook 2021 © OECD/IEA, october 2021
Europe North America Latin America Asia Pacific Eurasia Middle East Africa
Source: World Energy Outlook 2021 © OECD/IEA, october 2021
2020 STEPS 2050 APS 2050 SDS 2050
20
0
40
60
80
100
120
2020 STEPS 2050 APS 2050 SDS 2050
20
0
40
60
80
100
120

102
OIL
Oil: consumptionOil was the energy source worst affected by Covid-related restrictions. Consumption resumed rapid expansion in 2021 amid strong pressure on the whole energy market in the second half of the year
The Covid-19 pandemic and the economic crisis had an unprecedented impact on world oil demand in 2020 (down 9%, or by 8.7 mb/d). Oil was the most severely hit of all energy sources because of reduced travel: transport represents 60% of today’s oil consump-tion. In 2020, kerosene demand dropped 41% and air traffic by 69%; overall fuel demand declined 12%. Only petrochemical-related demand rose, reflecting heightened demand for Covid-related plastic packaging and personal protective equipment.
Among the major economies, and thanks to the easing of restrictions and an early economic recovery, China is so far alone in having rebounded to pre-crisis consumption levels. By 2021, consumption was 9% above its 2019 figure.
The Covid-related drop in consumption will not be entirely made up in 2021 because air transport has recovered only slowly. International aviation is still expected 20% below pre-Covid levels by the end of 2021. In contrast, and in line with other segments, world gaso-line demand is almost back to pre-Covid levels (just 2% short). Lastly, the rally in gas prices has encouraged power producers to move out of gas and into oil. This arbitrage meant an extra 500 kb/d in oil product consumption over the second half of the year.
According to the IEA, world oil demand will increase 6% (or by 5.5 mb/d) in 2021, to 96.3 mb/d. This would be 3.2% less than pre-Covid. In 2022, demand is expected to rise 3.4% (by 3.3 mb/d) to 99.6 mb/d, matching its 2019 level (IEA, October 2021). These projections depend on economic activity, which is showing signs of faltering in all regions.
QUARTERLY OIL DEMAND IN 2020 AND 2021 AGAINST 2019
OIL DEMAND IN 2021 ET 2022 (MB/D) IEA, EIA, OPEC
Autre Europe China India USA Net change
Source: IEA, Global Energy Review 2021
AIE EIA OPEP
Source: IFP Énergies Nouvelles, october 2021
2020 Q1 2020 Q2 2020 Q3 2020 Q4 2021 Q1 2021 Q2 2021 Q3 2021 Q4
0
4
-4
-8
-12
-16
-20
Mb/
dm
b/d
1
2
3
4
5
6
7
02021
5.56
5.2
4.23.53.3
2022

103
OIL
Oil: consumption
GLOBAL OIL DEMAND (WITHOUT AIR AND SEA BUNKERS) BY GEOGRAPHIC REGION IN 2020
TOTAL: 3,516 MT
GLOBAL OIL DEMAND BY SECTOR IN 2020 TOTAL: 3,854 MT
Total oil consumption in Mt
2000 2005 2010 2015 2019 2020 Change2019-2020
Share of world 2020
Europe 692 704 637 593 600 485 -19.3% 14%Germany 130 121 109 105 103 94 -8.9% 3%
France 91 91 80 78 74 63 -14.5% 2%United Kingdom 68 68 59 57 57 48 -15.5% 1%
North America 974 1,013 906 880 917 816 -11.0% 23%Canada 89 98 98 100 101 87 -14.0% 2%
United States 886 914 808 780 815 729 -10.6% 21%Latin America 283 289 330 340 320 277 -13.5% 8%
Brazil 91 88 104 114 105 100 -4.4% 3%Mexico 85 83 86 80 76 65 -14.6% 2%
Venezuela 20 25 30 27 19 - - -Asia 952 1,097 1,193 1,406 1,541 1,270 -17.6% 36%
China 249 349 416 543 640 677 5.8% 19%South Korea 107 111 118 135 139 130 -6.7% 4%
India 116 126 154 198 233 210 -9.9% 6%Indonesia 54 63 67 73 80 72 -10.2% 2%
Japan 263 255 216 205 180 165 -8.1% 5%Pacific 43 46 48 53 57 54 -5.0% 2%CIS 152 156 177 177 194 169 -12.8% 5%
Russia 110 111 134 131 144 140 -2.9% 4%Middle East 210 256 319 362 350 282 -19.5% 8%
Saudi Arabia 70 87 122 156 136 128 -5.5% 4%United Arab States 8 10 14 17 20 16 -18.6% 0%
Iraq 20 22 29 35 38 33 -13.6% 1%Iran 64 75 81 85 87 79 -8.8% 2%
Kuwait 9 15 20 19 19 18 -4.0% 1%Africa 98 118 151 178 184 164 -10.8% 5%
South Africa 15 18 22 25 27 23 -13.4% 1%World without bunkers 3,403 3,677 3,760 3,989 4,163 3,516 16% 100%
Air and sea bunkers 271 316 356 378 399 338 15% 9%World Total 3,674 3,993 4,116 4,367 4,562 3,854 -15.5% 100%
Source: Enerdata, Global Energy and CO2 Data, 2021
Source: Enerdata, Global Energy and CO2 Data, 2021
Source: Enerdata, Global Energy and CO2 Data, 2021
Residential, Services & Agriculture 10%
Chemical 11%
Electricity 4%
Industry 7%
Transport 50%
Non-energetic uses 18%
Latin America 8%
North America
23%
Europe 14%
India 6%
Africa 4%
Japan 5%
Indonesia2%
Other Asia & Pacific 2%
CIS 5%South Korea 4%
Middle East 8%
AsiaPacific
38% China19%

104
OIL
Oil: productionOPEC+ is the only player capable of responding to rebounds in oil demand. It has opted to maintain a canny imbalance on the market via a tight rein on supply
In the face of a slump in demand, oil producers were forced to reduce supply drasti-cally in 2020 (by 7%, or 6.7 mb/d on average over the year, to 93.9 mb/d – source: IEA). As oil inventories became completely saturated and prices plummeted, OPEC+ (+ referring to Russia) agreed a 10 mb/d cut in production as early as May. This was not enough to rebalance the oil market, however. On average, 3 mb/d in oversupply persisted over the year. This cri-tical situation led the industry to cut investment and development projects by approximately a third.
Economic recovery revitalized production in 2021. Oil supply remained essentially an OPEC+ matter, and its combined excess capacity amounted to almost 8 mb/d during the year. The cartel has raised production since January, but in July it decided on a steady 400 kb/d increase each month starting in August, to be continued until pre-Covid levels are reached, probably in September 2022. Lower US production following Hurricane Ida in early September in the Gulf of Mexico (-1.5 mb/d), combined with increasing demand (+6 mb/d) and high oil prices meant a favourable context for the agreement.
World production should rise by 1.4 mb/d in 2021, of which 1 mb/d from OPEC+, to 95.3 mb/d (source: IEA). That would represent a negative balance of 1 mb/d. The small rise in US produc-tion marked a radical change from previous years, when the US dominated world supply growth.
For 2022, the IEA expects an over 6 mb/d rise in oil production, with two thirds of it coming from OPEC+ assuming that the cartel lifts its production restrictions (6 mb/d supply gap rela-tive to pre-Covid). But oil prices are currently above breakeven for most oilfields and this situation offers no real incentive for producers to increase supply.
Weak and only slowly recovering investment in 2021 will weigh on world production capacity in the coming years. Apart from short-term economic circumstances, investment in the oil sector has been in structural slowdown for the past 5 years.
OPEC PRODUCTION 2016-22 (MB/D)
OPEC EXCESS CAPACITY (IN MB/D AND SHARE OF WORLD CONSUMPTION)
realised
projection including a 400 Kb per month
Source: Energy Information Administration (EIA), july 2021
In mb/d % of world
consumption
Source: Catallaxis, Les Cahiers Verts de l’Économie, August 2021
mb/
d
40,000
35,000
30,000
25,000
20,000
15,000
10,000
5,000
02016 2017 2018 2019 2020 2021 2022
mb/
d
10,000
8,000
6,000
4,000
2,000
0
14,000
12,000
10,000
8,000
6,000
4,000
2,000
094 96 98 00 02 04 06 08 10 12 14 16 18 20

105
OIL
Oil: production
Rest of the world Europe Canada United States Other Latin America Venezuela Other Asia China Other CIS Russia Africa Other Middle East Saudi Arabia
OIL PRODUCTION EVOLUTION BETWEEN 1990 AND 2020 (MT)
GLOBAL OIL PRODUCTION BY GEOGRAPHIC REGION IN 2020 TOTAL: 4,183 MT
Other Middle East 3%Kuwait 3%
Iran 3%Iraq 5%
United Arab States 4%
Saudi Arabia 12%
Other Africa 7%
Other Asia Pacific 3%
Other Latin America 4%
Nigeria 2%
Europe 4%
Russia 12%
Other CIS 3%
Canada 6%
United States 17%
Brazil 4%Mexico 2%
China 5%
Source: Enerdata, Global Energy and CO2 Data, 2021
Source: Enerdata, Global Energy and CO2 Data, 2021
Crude Oil, NGL production, LNG in Mt
2000 2005 2010 2015 2019 2020 Change2019-2020
Share of world 2020
European union 336 268 202 169 163 176 8.3% 4%
Norway 161 133 100 88 80 95 18.8% 2%
United Kingdom 126 85 63 45 52 48 -7.0% 1%
North America 478 450 498 789 1,015 977 -3.7% 23%
Canada 125 140 164 222 267 255 -5% 6%
United States 353 310 334 567 748 722 -3% 17%
Latin America 530 569 539 532 418 397 -5.0% 10%
Brazil 64 85 107 127 146 156 7.1% 4%
Mexico 169 188 145 127 95 95 0% 2%
Venezuela 179 182 165 147 57 - - -
Asia 340 357 375 383 349 342 -2% 8%
China 163 181 204 217 198 201 1.6% 5%
India 36 37 42 41 38 35 -5.9% 1%
Indonesia 70 52 48 40 37 35 -5% 1%
Pacific 38 28 27 19 17 19 15.5% 1%
CIS 392 573 656 677 709 650 -8.2% 16%
Russia 322 466 504 534 561 512 -8.6% 12%
Kazakhstan 35 62 81 81 92 87 -5.4% 2%
Middle East 1,135 1,234 1,207 1,371 1,386 1,263 -8.9% 30%
Saudi Arabia 436 514 461 565 547 508 -7.0% 12%
United Arab Emirates 121 133 137 178 182 165 -9% 4%
Iraq 129 94 117 173 235 206 -12.3% 5%
Iran 199 220 214 161 147 133 -9.3% 3%
Kuwait 105 135 123 152 145 131 -9.2% 3%
Africa 387 477 498 394 403 358 -11.1% 9%
Nigeria 115 129 127 106 101 87 -14.3% 2%
World 3,636 3,956 4,002 4,333 4,458 4,183 -6.2% 100%
Source: Enerdata, Global Energy and CO2 Data, 20210
500
1,000
1,500
2,000
2,500
3,000
3,500
4,000
4,500
19921994
19961998
20002002
20042006
20082010
20122014
20162020
20192018
1990

106
OIL
Oil: pricesA long way back from their slump in 2020, oil prices surged in 2021. This both highlights our continued reliance on this energy source and the difficulties of replacing it
Oil prices plummeted during the worst of the lockdowns in 2020, and consumption contracted by over a quarter. Dropping 70% in four months, they bottomed out at $ 18 in April 2020. OPEC+ responded rapidly and cut its production by 10 mb/d in May. Subsequent announcements of recovery plans and the gradual easing of restrictions allowed oil prices to rebound to $ 29 in May and $ 40 in June. The arrival of vaccines and their promise for renewed consumption underpinned bullish sentiment in the autumn, and oil prices were up to $ 50 by the end of the year. The 2020 average price was $ 42, down 35% from its pre-Covid level ($ 64 in 2019).
Prices continued to rise in 2021, eventually imparting a new twist to the situation. An improving economic environment took oil prices to $ 60 in April, and speculation helped lift them to $ 70 in June. In September, OPEC+ decided to limit increases in supply to what it had already agreed and this caused prices to soar. In this context of tight supply, worsened by production disruptions in the Gulf of Mexico after Hurricane Ida and depleted stocks, arbitrage by power producers in favour of oil boosted the rally further. Oil prices hit $ 85 late October, a level unseen since 2014.
The world energy market was in crisis over the second half of the year, exacerbated by rising gas and coal prices that forced power producers to turn to oil products.
Crude oil is set to remain expensive until year-end. The negative balance on the oil market (1 mb/d over 2021) will not be closed until 2022.
The surge in prices is a significant shock to economic actors, consumers and businesses, made worse by the fact that no substitutes are available in the short term. It raises issues such as purchasing power and inflation risks, highlighting how difficult it is to introduce a carbon tax and how complex redistribution issues are.
CRUDE OIL (BRENT) AND PETROLEUM PRODUCTS PRICES ($/B)
BRENT PRICE FORECASTS OUT TO 2025 BLOOMBERG CONSENSUS ($/B)
Essence (Ebob)
Diesel
Jet
Brent
Naphtha
Fuel 1%
Source: IFP Énergies Nouvelles, october 2021
Brent
Forward
Max
Consensus 1/10/2021 Brent
Min
Source: IFP Énergies Nouvelles, october 2021
US$/
b
105
95
85
75
65
55
45
35Oct. 20 Jan. 21 Apr. 21 July 21 Oct. 21
US$/
b
90
30
40
50
60
70
80
2016 2017 2018 2019 2020 2021 2022 2023 2024 2025
45.1
54.7
71.7
64.2
43.2
68.8 68.3 6670.5 69

COAL
107
Coal
Coal and energy transition . . . . . . . . . . . . . . 108
Consumption . . . . . . . . . . . . . . . . . . . . . . . . . . 111
Production . . . . . . . . . . . . . . . . . . . . . . . . . . . . 114
World trade flows . . . . . . . . . . . . . . . . . . . . . . 116
International prices . . . . . . . . . . . . . . . . . . . . 117
COAL AND ENERGY TRANSITION
China faces a dilemma between carbon emission reduction and strong economic growth
CONSUMPTION
Heightened pressure on demand in 2021 is a reminder of coal’s central role in Asian economies

108
COAL
Coal and energy transitionAn end to coal-fired power projects is the key to significantly limiting the rise in temperatures. There are signs of hope, but there is a massive gap yet to be bridged
Coal is the energy source that generates the most CO2 emissions (1,060 gCO2/KWh for coal-fired power stations). Two thirds of the coal production is used in power generation. Coal has become one of the major headaches in energy transition. It generated 42% of world CO2 emissions in 2020 and represented 35% of the world energy mix.
The coal sector was severely hit by the Covid-19 crisis, and world consumption drop-ped 4% in 2020. The subsequent economic recovery rapidly corrected the dip, however. Reinvigorated consumption peaked in 2021, largely because of booming coal-fired power generation in Asia. The brutal contraction in 2020 has highlighted the effort required to decarbonize the world economy, as the IEA carbon neutral scenario (NZE) stipulates that coal demand has to decline 8% per year out to 2030.
In several countries, the economic recovery reinforced the use of coal, which unde-niably remains an important source of energy supply. Coal station projects took shape in China, India, Indonesia, Japan and Vietnam. These countries account for 80% of new plants. This represents over 600 new power stations, together generating approximately 540 GW (China: 368 GW). These projects very clearly threaten the +1.5°C target.
On a global scale, there are two distinct trends at work. In advanced economies (OECD countries plus Bulgaria, Croatia, Cyprus, Malta and Romania), notably within the EU and in the USA, the use of coal has sharply declined in recent years as a result of accelerated plant clo-sures, expanding renewables, the greater competitiveness of gas (the current crisis aside) and higher CO2 prices. Conversely, coal demand continues to grow in developing countries. The IEA trend scenario (STEPS) take account of these discrepancies by forecasting coal consump-tion down 3.5% on average per year out to 2050 in advanced economies, against a very limited inflexion (-0.6%) in developing countries.
There is still a massive gap between the current trend, and even that implied by national COP26 commitments, and the carbon neutral trajectory. The IEA suggests 3 ways to speed up the exit from coal: halting the construction of new plants, reducing emis-sions from existing stations (2,300 GW) by coupling them with CCUS installations or by using decarbonized fuels, and lastly, closing units at an annual rate of 100 GW out to 2030. This implies investing in renewables in order to transfer a third of all coal-fired production.
The future of coal is therefore intrinsically linked with the scope and content of government environment policies. Measures favouring renewable energies or restricting coal project financing could have a decisive impact. In May 2021, G7 countries committed to halt public aid for coal-fired plants. Banks, insurance companies and investment funds are also disengaging from coal assets. Xi Jinping’s pledge at the UN General Assembly last September to stop building coal-fired plants abroad could have a significant impact. The end of Chinese financing would facilitate the cancellation of over planned 40 GW in about 20 coun-tries (equivalent to German capacity) and should lead to the cancellation of 55% of coal station projects.

109
COAL
ANNUAL AVERAGE COAL POWER PLANT RETIREMENTS IN THE ANNOUNCED PLEDGES AND NET ZERO EMISSIONS BY 2050 SCENARIOS
Coal and energy transition
Advanced economies Emerging market and developing economiesSource: IEA, World Energy Outlook, 2021
75
100
2001-10 2011-20
Historical
2021-30 2031-40 2041-50
APS
2021-30 2031-40 2041-50
NZE
50
25
0
GW
COAL PRIMARY DEMAND PROJECTION — WORLD
COAL PRIMARY DEMAND PROJECTION — EUROPEAN UNION ( EU 27)
Transition started
Prim
ary d
eman
d (M
toe)
5,000
4,000
2,000
0
1,000
3,000
2050204520402010 2015 2020 2025 2030 2035
Historical (Enerdata)
(-1.6%/year)
(-4.5%/year)
(-0.9%/year)
(0%/year)
(-4.3%/year)
(-7.4%/year)
Prim
ary d
eman
d (M
toe)
300
250
200
100
0
50
150
2050204520402010 2015 2020 2025 2030 2035
Historical(Enerdata)
(-9.6%/year)(-9.6%/year)
(-6.2%/year)
(-5.8%/year)
(-20.6%/year)
IEA STEPS (-0.9%/year) IEA APS (-1.6%/year) IEA SDS (-4.5%/year) IEA NET ZERO (-7.4%/year) Extension years 2010-2020 (0%/year)
Extension year 2010-2020 (-4.3%/year)
Historical (Enerdata)
Sources: IEA, World Energy Outlook 2021; Enerdata, Global Energy
& CO2 Data, 2021
IEA STEPS (-6.2%/year) IEA APS (-9.6%/year) IEA SDS (-9.6%/year) IEA NET ZERO (0%/year) Extension years 2010-2020 (-5.8%/year)
Extension year 2020 (-20.6%/year) Historical (Enerdata)
Sources: IEA, World Energy Outlook 2021; Enerdata, Global Energy
& CO2 Data, 2021
Transition not initiated

110
COAL
Mt
2020 STEPS 2050 APS 2050 SDS 20500
1,000
2,000
3,000
4,000
5,000
6,000
Mt
2020 STEPS 2050 APS 2050 SDS 20500
1,000
2,000
3,000
4,000
5,000
6,000
Coal: IEA consumption and production forecasts
WORLD COAL PRODUCTION FORECASTS WITHIN IEA’S STEPS, APS AND SDS SCENARIOS (IN MTCE*)
WORLD COAL CONSUMPTION FORECASTS WITHIN IEA’S STEPS, APS AND SDS SCENARIOS (IN MTCE*)
Coal demand forecasts in Mtce
2020
Stated Policies Scenario Announced Pledges Scenario
Sustainable Development Scenario
2030 2050AAGR
2020-2050 2030 2050AAGR
2020-2050 2030 2050AAGR
2020-2050North America 346 192 59 -5.7% 84 35 -7.4% 79 28 -8.1%Central and South America 44 42 49 0.3% 27 25 -1.9% 23 16 -3.4%Europe 330 197 151 -2.6% 157 124 -3.2% 116 54 -5.9%Africa 156 168 159 0.1% 139 72 -2.5% 118 29 -5.5%Middle East 4 11 15 4.2% 11 15 4.2% 5 3 -1.2%Eurasia 221 221 211 -0.2% 221 211 -0.2% 137 46 -5.1%Asia Pacific 4,216 4,301 3,375 -0.7% 4,189 2,191 -2.2% 3,310 1,014 -4.6%China 2,986 2,847 1,980 -1.4% 2,814 879 -4.0% 2,389 614 -5.1%India 557 729 691 0.7% 728 688 0.7% 468 215 -3.1%Japan 153 116 72 -2.5% 107 46 -4.0% 107 46 -4.0%Southeast Asia 257 338 393 1.4% 338 388 1.4% 214 79 -3.8%World 5,317 5,132 4,020 -0.9% 4,828 2,672 -2.3% 3,786 1,189 -4.9%
Source: World Energy Outlook 2021 © OECD/IEA, october 2021 Source: World Energy Outlook 2021 © OECD/IEA, october 2021
Source: World Energy Outlook 2021 © OECD/IEA, october 2021* 1 Mtce: million tons of coal equivalent – Appendix.
Coal production forecasts in Mtce
2020
Stated Policies Scenario Announced Pledges Scenario
Sustainable Development Scenario
2030 2050AAGR
2020-2050 2030 2050AAGR
2020-2050 2030 2050AAGR
2020-2050North America 410 262 110 -4.3% 153 58 -6.3% 138 34 -8%Central and South America 63 48 34 -2.0% 35 0 -100% 35 0 -100%Europe 178 88 41 -4.8% 65 29 -5.9% 51 8 -10%
European Union 124 53 13 -7.2% 34 5 -10.0% 34 5 -10%Africa 213 199 170 -0.7% 151 67 -3.8% 149 46 -5%Middle East 1 1 2 0.2% 1 0 -100% 1 0 -100%Eurasia 394 411 417 0.2% 391 428 0.3% 249 131 -3.6%Asia Pacific 4,203 4,123 3,245 -0.9% 4,034 2,091 -2.3% 3,164 972 -4.8%Southeast Asia 484 479 443 -0.3% 457 458 -0.2% 325 148 -3.9%World 5,462 5,132 4,020 -1.0% 4,828 2,672 -2.4% 3,786 1,189 -5%Steam coal 4,296 3,944 3,057 -1.1% 3,703 1,982 -2.5% 2,839 771 -5.6%Coking coal 940 1,005 843 -0.4% 971 605 -1.5% 850 406 -2.8%Lignite and peat 226 182 119 -2.1% 154 86 -3.2% 97 13 -9.1%
Source: World Energy Outlook 2021 © OECD/IEA, october 2021
Asia Pacific Eurasia Africa Middle East Europe Latin America North America
Asia Pacific Eurasia Africa Middle East Europe Latin America North America

111
COAL
Coal: consumptionThe present crisis in the Asian coal market is a reminder of the central role of this fuel in regional economies and underlines the difficulties Asia will have in implementing a low-carbon trajectory
World coal demand fell 4% in 2020, its largest drop since World War II. This mainly stemmed from coal-fired power plants losing ground during the crisis (see our Electricity chapter), as they make up two thirds of coal consumption. In the USA and in Europe, stalling coal demand also reflected the increased competitiveness of gas-fired plants. Weaker activity in heavy industry, cement and steel works – representing a quarter of coal consumption – contributed to the move as well.
The situation reversed abruptly in 2021. The IEA forecasts that world coal consumption will rebound 4.5% and exceed its 2019 level. Boosted by accelerating economic growth, the Asian power sector represents 80% of consumption. Soaring gas prices prompted a return to coal, notably in the USA and in the EU. Runaway coal consumption has a heavy environmental cost: approximately 600 Mt CO2 in additional emissions, equivalent to 2% of total emissions.
Problems in China question its ability to phase out coal. China consumes over half of world coal production and faces a severe energy crisis. It is reporting power cuts, entire cities plunged into darkness, companies reducing activity and power rationing. The country is sim-ply short of coal. The world economic recovery was faster than expected and generated strong demand for Chinese manufactured goods (up 28% year-on-year in September). It also put pressure on raw materials, whose prices soared. Caught between the tripling of coal prices in the space of a year and electricity prices that are fixed and controlled by the state, several power stations chose to reduce supply rather than produce at a loss. Traditionally enjoying coal surpluses, the country now has to import cheaper coal from abroad (Chinese coal costs $310/tonne, against $240/tonne for imported coal).
In 2020, coal consumption had slightly expanded in China (+0.6%), while it had been receding in almost every other country in the world. In 2021, it is set to gain about 6%.
Xi Jinping has made strong commitments to reduce CO2 emissions before 2030 and to reach carbon neutrality by 2060. During COP26, he specified that coal consumption by power plants will come down 1.8% per year on average out to 2035. These commitments plunge China into a dilemma, as combining lower carbon emissions with rapid economic growth is turning out to be more challenging than expected.
India is the world’s second largest coal consumer and also experienced difficulties in 2021. After a 3.7% drop in 2020, coal demand felt the pressure from the power sector this year. With a 69% share in power generation, coal remains the key energy source for the country’s economic growth. The IEA expects demand to increase 9% this year. India has not reduced its climate ambitions, however, and during COP26 it committed to carbon neutrality by 2070. This means that 500 GW of renewables capacity is to meet half of the country’s power needs by 2030 (against 144 GW currently). Moreover, CO2 emissions are to be reduced by 1 Gt and carbon intensity by 45% by 2030.

112
COAL
Coal: consumption
Although in structural decline, US coal consumption surged in 2021. The USA is the third-largest market and has halved its coal consumption over the past decade (-8% per year on average from 2010 to 2020). This was mainly a result of a loss of competitiveness against unconventional gas and renewables in power generation. In 2020, the sharp fall in electricity demand (-4%) caused coal consumption to collapse 19%, or by 105 Mt; the power sector accounts for 90% of it. In 2021, the economic recovery and the doubling of gas prices since the beginning of the year caused power stations to return to coal on a surprisingly large scale. The IEA expects production to bounce back 22% and total coal demand to jump 12% in 2021. Given that the construction of new coal-fired plants stopped in 2013, these tensions should not persist in 2022.
Europe has seen similar developments, despite being the most ambitious region in terms of climate protection. After a 17% drop in 2020, a combination of recovering activity, harsh weather and very low gas inventories (25% lower than average) drove coal demand up 10% in 2021, according to the IEA. But the trend in Europe is to eventually exit coal because of higher carbon prices and because a growing number of countries have adopted moratoria on coal (Austria, Sweden, Portugal, France, Greece). The last European countries running coal power stations are Germany, Poland and the Czech Republic (2/3 of consumption), although here too there is phasing-out process. The share of coal in the European energy mix declined from 25% in 2015 to 11% in 2020.

113
COAL
Coal: consumption
In Mt Coal and lignite domestic consumption CHANGE 2019-2020
AAGR 2010-2020
Share ofworld 2020
2000 2005 2010 2015 2019 2020
Europe 973 972 914 880 707 587 -17.0% 8% 7%UE-27 772 770 699 679 502 408 -18.7% 6% 5%UE-28 832 833 750 718 511 417 -18.4% 6% 5%
Germany 244 244 232 239 168 138 -17.8% 2% 2%Poland 141 137 134 129 113 100 -11.5% 1% 1%Turkey 81 77 95 93 125 109 -12.6% 2% 1%
North America 1,046 1,078 1,004 761 563 444 -21.1% 6% 9%United States 983 1,018 954 722 533 419 -21.3% 6% 8%
Latin America 47 56 65 80 72 61 -15.2% 1% 1%Brazil 22 21 23 30 26 23 -11.6% 0% 1%
Asia 2,059 3,296 4,617 5,323 5,615 5,568 -0.8% 76% 66%China 1,304 2,345 3,350 3,770 3,807 3,830 0.6% 52% 47%
South Korea 72 83 120 135 131 115 -12.4% 2% 9%India 376 466 684 885 1,013 976 -3.7% 13% 7%
Indonesia 25 41 67 87 144 139 -3.7% 2% 7%Japan 149 177 184 195 186 171 -8.0% 2% 7%
Pacific 130 142 136 119 106 102 -3.8% 1% 6%Australia 128 138 133 116 103 99 -3.7% 1% 6%
CIS 356 349 368 350 364 337 -7.3% 5% 7%Kazakhstan 50 65 83 65 75 76 1.8% 1% 2%
Russia 232 214 212 222 229 205 -10.6% 3% 5%Middle East 13 16 16 17 15 15 1.1% 0% 0%Africa 170 192 204 204 204 190 -6.6% 3% 4%
South Africa 157 179 193 186 176 169 -4.4% 2% 3%World 4,794 6,101 7,325 7,734 7,644 7,304 -4.5% 100% 100%
Source: Enerdata, Global Energy and CO2 Data, 2021
COAL CONSUMPTION EVOLUTION BETWEEN 1990 AND 2020 (MT)
COAL CONSUMPTION BY REGION, 2000 TO 2021
Rest of the world South Africa Other CIS Russiae Other Asia India China United-States Other Europe Germany
Source: Enerdata, Global Energy and CO2 Data, 2021
China Other Advanced economiesSource: IEA, Global Energy Review, april 2021
0
500
1,000
1,500
2,000
2,500
2000 2005 2010 2015 2021
Mto
e
0
1,000
2,000
3,000
4,000
5,000
6,000
7,000
8,000
1992 1994 1996 1998 2000 2002 2004 2006 2008 2010 2012 2014 2016 2020201920181990

114
COAL
Coal: productionThe major coal producers reactivated output and opened new mines in 2021
Interrupted by the Covid crisis, coal production renewed in 2021 with an uptrend dating back to 2017. It has gradually recovered to its highs. Intense pressure on coal demand since the economic upturn caused most production sites — notably China, India, Indonesia and Australia — to reactivate production. This will have completely cancelled out the 4.6% drop posted in 2020.Most coal producing countries drastically reduced their output in 2020: -5.9% in Australia, -9% in Indonesia, -4.5% in South Africa. Committed to closing its mines, the EU had stopped sub-sidising coal-fired plants in 2018, accelerating its exit from coal. Its production fell 18% in 2019 and 17% in 2020. Output declined the most in the USA in 2020 (-24%), in the wake of weak power demand and the lack of profitability of coal compared with gas and renewables.
Even when COP26 was in full swing, China announced an steep increase in its coal production. Faced with substantial power shortages, China will add 1 Mt to its daily produc-tion, which already exceeds 11.5 Mt/day. Even though the number of mines had decreased from 10,800 in 2015 to 5,300 by end-2019, approval has been given to new mining projects. In addition, 53 existing mines (15 in North province and 38 in Inner Mongolia) resumed ope-rations for a combined capacity of 110 Mt (Bloomberg). In the meantime, the Chinese govern-ment is continuing with its efforts to improve local players’ competitiveness and profitability through mergers and via the launch of a new national Coal Trading Center.The world’s largest producer with a 50% share of the total, China is one of the rare countries to have maintained production levels in 2020 (+1.4%). Growth is expected to amount to 6% in 2021.
India is the world’s second largest producer and also stepped up production in 2021. In order to reduce the country’s dependency on imports, the Indian government authorized private commercial mining in June 2020. This brought to an end the nearly 50 years’ mono-poly of Coal India Limited, a 90% state-owned concern. Designed to stimulate national pro-duction, this measure also aims to help revive an economy weakened by the pandemic. The government hopes that the opening of coal mines to the private sector will generate $950 m in revenues and create 69,000 jobs.Indian coal production expanded in 2020 (+1.2%) and is expected to accelerate further in 2021 (+3.7%), according to the IEA.
WESTERN EUROPE COAL-FIRED POWER GENERATION
CHINA THERMAL POWER GENERATION
Range 2012-2019 2019 2020 2021Source: IEA, Global Energy Review, april 2021
Source: NBS China, ENTSOE, august 2021
600
550
500
450
400
350
300
250Jan. Fev. Mar. Apr. May June July Aug. Sept. Oct. Nov. Dec.
TWh
Jan. 2020 Apr. 2020 July 2020 Oct. 2020 Jan. 2021 Apr. 2021 July 2021
8
10
6
4
2
0TW
h

115
COAL
Charbon: production
SHARE OF COAL PRODUCTION BY GEOGRAPHIC REGIONTOTAL: 7,575 MT
United States 6.4%
Europe 6%
India 10.3%
Rest of the world 23%
China 49.4%
In Mt Coal and lignite production Change2019-2020
Share of world 2020
2000 2005 2010 2015 2019 2020
Europe 778 758 706 654 549 454 -17.3% 6%
EU27 626 619 546 520 392 327 -16.5% 4%EU28 657 639 564 528 394 328 -16.7% 4%
Germany 205 206 184 185 127 105 -17.7% 1%Poland 163 160 133 136 112 101 -10.4% 1%Turkey 63 58 73 58 87 70 -19.2% 1%
North America 1,041 1,109 1,064 876 698 533 -23.6% 7%United States 972 1,039 996 814 641 489 -23.8% 6%
Latin America 65 87 99 109 102 78 -23.6% 1%Colombia 38 59 74 86 84 64 -24% 1%
Asia 1,851 3,036 4,344 4,829 5,246 5,251 0.1% 69%China 1,355 2,317 3,316 3,563 3,691 3,743 1% 49%India 336 437 570 683 769 779 1.2% 10%
Indonesia 79 171 325 452 606 551 -9% 7%Pacific 310 376 441 516 506 476 -6.0% 6%
Australia 307 371 436 512 503 473 -5.9% 6%CIS 388 439 476 488 566 524 -7.4% 7%
Kazakhstan 77 87 111 93 104 104 -1% 1%Russia 242 285 300 353 425 386 -9% 5%
Middle East 2 2 2 2 2 2 2.6% 0%Africa 231 250 259 270 268 256 -4.5% 3%
South Africa 224 245 255 256 254 242 -4.5% 3%World 4,665 6,056 7,390 7,744 7,938 7,575 -4.6% 100%
Source: Enerdata, Global Energy and CO2 Data, 2021
Russia 5.1%
Source: Enerdata, Global Energy and CO2 Data, 2021
COAL PRODUCTION EVOLUTION BETWEEN 1990 AND 2020 (MT)
Rest of the world Australia South Africa Russia Indonesia India China United States Europe
Source: Enerdata, Global Energy and CO2 Data, 2021
0
1,000
2,000
3,000
4,000
5,000
6,000
7,000
8,000
1992 1994 1996 1998 2000 2002 2004 2006 2008 2010 2012 2014 2016 2020201920181990

116
COAL
Coal: world trade flows
Exports
Coal and ligniteexports in Mt
2010 2019 2020 Share of world
2020
Change 2019-2020
AAGR2010-2020
Europe 36 22 23 2% 4.8% -4.4%EU27 32 20 20 2% 0.8% -4.4%EU28 33 21 22 2% 3.7% -4.2%
Poland 17 11 11 1% 1% -4.0%North America 109 122 91 7% -25.4% -1.8%
Canada 34 37 28 2% -23.1% -1.7%United States 76 86 63 5% -26.3% -1.8%
Latin America 73 79 58 4% -26.5% -2%Colombia 70 78 57 4% -26.5% -2%
Asia 337 546 485 36% -11.2% 3.7%China 23 9 5 0% -46.8% -14.5%
Indonesia 265 469 418 31% -10.9% 4.7%Pacific 295 397 372 28% -6.2% 2.3%
Australia 293 396 371 28% -6.2% 2%CIS 175 243 235 17% -3.6% 3.0%
Kazakhstan 31 26 26 2% 0.5% -2.0%Russia 135 213 204 15% -4% 4.2%
Middle East 0 0 0 0% -1% 10.4%Africa 68 87 82 6% -5.8% 2.0%
South Africa 67 81 76 6% -5.8% 1.2%World 1,093 1,497 1,347 100% -10.1% 2.1%
Source: Enerdata, Global Energy and CO2 Data, 2020
Imports
Coal and ligniteimports in Mt
2010 2019 2020 Share of world
2020
Change 2019-2020
AAGR2010-2020
Europe 234 187 149 12% -20.5% -4.4%EU27 181 137 96 7% -30% -6.1%EU28 207 144 102 8% -29% -6.9%
Germany 51 43 32 3% -26.0% -4.5%Netherlands 12 11 6 1% -41.5% -6.8%
North America 32 16 12 1% -24.1% -9.5%United States 19 6 5 0% -23.9% -12.8%
Latin America 38 49 37 3% -25.3% -0.3%Brazil 18 20 17 1% -15% -0.4%
Asia 744 1,100 1,024 79% -6.9% 3.2%China 185 299 303 23% 1.5% 5.1%
South Korea 119 136 118 9% -12.7% -0.1%India 123 245 198 15% -19.3% 4.9%
Japan 186 183 171 13% -6.7% -0.9%Taïwan 64 68 63 5% -6.2% -0.1%
Pacific 0.30 2 2 0% 16.6% 20.4%CIS 41 58 54 4% -7.4% 2.8%
Russia 26 28 27 2% -2.0% 0.6%Middle East 15 13 12 1% -7% -2.5%Africa 9 23 11 1% -54.1% 1.1%World 1,114 1,447 1,299 100% -10.2% 1.6%
Source: Enerdata, Global Energy and CO2 Data, 2020

117
COAL
Coal: pricesCoal prices did not rally to the extent of European gas prices, but enough to generate serious problems in China
The tripling of coal prices in 2021 reflects an overheating world economy and conti-nued raw material shortages. From $80/t at the beginning of the year, international coal prices broke through $200/t at the end of October, a level unseen since 2008, before falling back to $150/t early November.
The shock was even more brutal for the fact that coal prices had fallen sharply since 2019 amid abundant supply. In 2020, the pandemic precipitated a dip to $50/t by mid-May; the easing of lockdown measures allowed some ground to be recovered subsequently.
It is Asia that pressure is the strongest, for reasons we mentioned earlier: a return to normal industrial activity, accelerating power demand and a shortage of coal. The situation is particularly critical in China, especially after several mines were flooded in October. This explains the peak at $225/t. The consequences for the economy are already estimated at approximately one point of GDP. In mid-October the government authorized power companies to sell 20% over the fixed price in order to pass on some of the increase in supply costs to their customers. Factory gate inflation has already reached 11%. One sign that the surge in prices is critical is the government — through the NDRC — contemplating intervention to bring coal prices down to a “reasonable range”.
In Europe, coal remains competitive against gas in power generation, despite recent trends and record prices on carbon allowances. This situation is likely to persist over the winter, as rising heating demand will maintain pressure on natural gas prices.
GERMAN CLEAN SPARK AND DARK SPREADS FOR MONTH-AHEAD MATURITIES
COAL PRICES (IN $/T) (MONTH-AHEAD – API, CIF ARA)
DE Clean dark spread MA DE Clean spark spread MA
Source: ICE, ENGIE EnergyScan
Prices from january 2009 to november 2021 Price of 10 november 2021
Source: Trading Economics, november 2021
0
50
75
100
125
150
175
200
225
$/t
2010 2012 2014 2016 2018 2020 2022
162
-30
-20
-10
0
10
20
€/M
Wh
Nov. 2020 Jan. 2021 Mar. 2021 May 2021 July 2021 Sept. 2021
Gas ef�ciency: 50%Coal ef�ciency: 38%


APPENDIX
Appendix
119
Conversions . . . . . . . . . . . . . . . . . . . . . . . . . . . 120
Glossary . . . . . . . . . . . . . . . . . . . . . . . . . . . . . . 122
Data sources & Methodology . . . . . . . . . . . . 126
Geographical scope of the sources . . . . . . . 127
Contacts . . . . . . . . . . . . . . . . . . . . . . . . . . . . . . 130

120
APPENDIX
Conversions
Denominations in the American system
10 0 unit10 1 tens10 2 hundreds10 3 thousands10 6 millions10 9 billions10 12 trillions
The French billion is 1012
Weight kilograms
1 pound 0.4531 American ton (short ton) 9071 British ton (long ton) 1,016
Volume unit
From Tom3 liters ft3 US gallon barrel
Multiply bym3 1 1,000 35.32 264 6.28liters 0.001 1 0.0353 0.264 0.00629ft3 0.0283 28.3 1 7.47 0.178US gallon 0.00379 3.79 0.134 1 0.0238Barrel 0.159 159 5.62 42 1
Energy unit
From ToMWh toe GJ MMBtu Therm
Multiply byMWh 1 0.0860 3.6 3.412 34.12toe 11.63 1 41.9 39.68 396.8GJ 0.2778 0.0239 1 0.948 9.48MMBtu 0.293 0.0252 1.055 1 10Therm 0.0293 0.00252 0.105 0.1 1
Multiples and decimal sub-multiples of the units of measurement
Abbreviation Name Value PowerP peta 1,000,000,000,000,000 1015
T tera 1,000,000,000,000 1012
G giga 1,000,000,000 109
M mega 1,000,000 106
k kilo 1,000 103
h hecto 100 102
da deca 10 101
unit unit 1 100
da decu 0.1 10-1
c centi 0.01 10-2
m milli 0.001 10-3
µ micro 0.000 001 10-6
Other energies
Heavy fuel Super fuel Dry wood Household waste Paper waste Natural uraniumPhysical unit 1 ton 1,000 liters 1 ton 1 ton 1 ton 1 tonTons of oil equivalent 0.95 0.79 0.33 0.18 0.33 12,000MWh 11 9.1 3.9 2.1 3.9 140,280GJ 40 33 14 7,6 14 505,000
Source: Joint report by the OECD Nuclear Energy Agency and the International Atomic Energy Agency – Uranium 2005: Resources, Production and Demand

121
APPENDIX
Conversions
Crude oil
From ToTons 1,000 liters Barrels US Gallons MWh GJ
Multiply byTons (Metric) 1 1.212 7.6 320 12.1 43.51,000 liters 0.825 1 6.290 264.17 10.0 35.9Barrels 0.132 0.159 1 42 1.587 5.710US Gallons 0.00313 0.0038 0.0238 1 0.0378 0.136MWh 0.0827 0.100 0.630 0.630 1 3.60GJ 0.0230 0.028 0.028 7.35 0.278 1
Coal
From ToShort ton Metric ton Ton of oil equivalent MWh GJ
Multiply byShort ton 1 0.9071847 0.6248 7.560 27.22Metric ton 1.102 1 0.6887 8.333 30Ton of oilequivalent 1.601 1.452 1 12.1 43.5
MWh 0.1323 0.1200 0.08264 1 3.6GJ 0.03674 0.03333 0.02299 0.278 1
The change from cubic meters to kWh and more generally from volume units toenergy units depends on the quality of the gas. We speak of HHV and LHV depending on whether we use the lower or higher estimate of the heating value of the gas. The HHV estimate includes heat recoverable from steam (including energy recoverable from condensation). In a gas context, we generally speak of HHV. We speak of LHV in domestic inter-energy reports, for example.1 kWh LHV . . . . . . . . . . . . . . . . = 0.9 kWh HHV1,000 m3 of HHV Natural Gas = 0,9 toe1,000 m3 of LHV Natural Gas = 0,81 toe1 toe (HHV context) . . . . . . . . = 1,111 m3 of Natural Gas1 toe (LHV context) . . . . . . . . = 1,234 m3 of Natural Gas1 m3 of HHV Natural Gas . . . . = standard of 42 MJ (HHV) (between 38 and 42 MJ). . . . . . . . . . . . . . . . . . . . . . . . . . standard of 11.7 kWh (HHV) (between 9 and 12 kWh). . . . . . . . . . . . . . . . . . . . . . . . . . European conversion: 39 MJ (HHV). . . . . . . . . . . . . . . . . . . . . . . . . . European conversion: 10.8 kWh (HHV). . . . . . . . . . . . . . . . . . . . . . . . . . conversion in France: 11.5 kWh (HHV)1 Tcf PCS . . . . . . . . . . . . . . . . . = 25.48 Mtoe1 ton of LNG . . . . . . . . . . . . . . = 1,320 – 1,380 m3 of gas
Natural gas (GN) & liquefied natural gas (LNG)
From ToBcm Gft3 Mtoe Million
tons ofLNG
Millionsof m3 of
LNG
TBtu Millionbarrels of oilequivalent
TWh PJ
Multiply by1 billion cubic meter NG (1 Bcm) 1 35.3 0.93 0.739 1.63 37.0 6.37 10.8 39.01 billion cubic feet NG 0.0283 1 0.026 0.0209 0.0460 1.05 0.18 0.307 1.101 million tons of oil equivalent 1.07 37.9 1 0.794 1.74 39.69 6.84 11.6 41.91 million tons of LNG 1.35 47.7 1.26 1 2.20 50.0 8.62 14.7 52.71 million cubic meter of LNG 0.615 21.7 0.573 0.455 1 22.8 3.92 6.67 24.01 trillion British thermal units 0.0270 0.955 0.0252 0.0200 0.0440 1 0.17 0.293 1.051 million barils of oil equivalent 0.157 5.54 0.146 0.116 0.255 5.8 1 1.70 6.12TWh 0.0923 3.258 0.0860 0.0683 0.150 3.41 0.588 1 3.6PJ 0.0256 0.905 0.0239 0.0190 0.0417 0.948 0.163 0.278 1
1 m3 NG: 0.9 of crude oil – 1 m3 NG: 10,000 kcal – 1 m3 NG: 41.860 kJ.
NB: These conversions are based on eight assumptions identified by the figures in bold.

122
APPENDIX
Glossary
Added value: Usual method for measuring the net production of a branch or a sector in monetary units; added value is equal to the difference between the gross produc-tion and intermediate consumption; added value can be measured at the cost of the factor or at the market price. Added value of agriculture measures the activity of far-ming, fishing and for-estry. Added value of industry measures mining, manufacturing and construction activities, and electricity, gas and water. Added value of services or of the tertiary sector measures the acti-vity of all services, both public and pri-vate: retail and wholesale commerce, banking, and public administration.
Annex 1: UN Convention on Climate Change Annex 1 countries: Germany, Australia, Austria, Belarus, Belgium, Bulgaria, Canada, Croatia, Denmark, Spain, Estonia, United States of America, Finland, France, Greece, Hungary, Iceland, Ireland, Italy, Japan, Latvia, Liechtenstein, Lithuania, Luxembourg, Malta, Monaco, New Zealand, Norway, Netherlands, Poland, Portugal, Romania, Russia, Slovakia, Slovenia, Switzerland, Czech Republic, Turkey, Ukraine, United Kingdom.
ATEE: Association Technique Énergie Environnement, a French association of energy and environmental operators (ins-titutional, private, etc.).
Aviation and marine bunker oils: Marine bunker oils are the duty-free fuels for ocean vessels and aviation bunker oils are the aircraft fuels consumed for internatio-nal transport. At coun-try level, they are excluded from primary consumption and are considered to be exports. At global level, they are included in primary consumption.
Biogas: a gas resulting from the fermenta-tion, also called methanisation, of organic matter (animal or plant) in the absence of oxygen. It consists primarily of methane (from 50% to 70%), but usually also carbon dioxide, water vapour, hydrogen sulphide, etc. The energy pro-duced by Biogas solely comes from methane.
Biomethane: a Biogas whose undesired components have been removed (carbon dioxide, water vapour, hydrogen sulphide, etc.), so that methane only remains. Methane’s properties are similar to those of natural gas. Biomethane can be handled in natural gas distribution and transport networks.
Bituminous coal: Type of coal transformed into coke.
CAPEX-OPEX: Operating expense (often abbreviated as OPEX) is the ongoing cost for running a product, business, or system. Its counterpart, capital expenditure (CAPEX), is the cost of developing or
providing non-consumable parts for the product or system.
CEA: Commissariat à l’énergie anomique (French Atomic Energy Commission)
CediGas: International association of manu-facturers for gas (GDF SUEZ is a member).
CERA: Cambridge Energy Research Associates.
CH4: Methane, a hydrocarbon with a global warming potential 25 times greater than that of CO2.
Change in inventories: In principle, these are the changes in inventory levels between two identical dates one year apart. The inventories are those of the energy producers and gene-rally exclude consumer inventories. However, depending on the measurement methods adopted by each country, these changes in inventories represent real data or may include statisti-cal deviations or non-metering between the primary supply and the inputs trans-formed or consumed. The + sign indi-cates a decrease in inventories during the year; the - sign indicates an increase in inventories during the year. Changes in inventories that syste-matically have the same sign are an indication of accounting distortions or poor allocation.
CI: Cost Insurance Freight. CIF price, in contrast to FOB price, includes shipping costs, and the various taxes and insurance; the seller is responsible for the merchan-dise up to the port of arrival.
CIS: Community of Indiapendent States, composed of 11 of the 15 former Soviet Republics: Armenia, Azerbaijan, Belarus, Georgia, Kyrgyzstan, Kazakhstan, Moldavia, Russia, Federation of Tajikistan, Turkmenistan (Associate State), Ukraine, Uzbekistan - Mongolia as an observer.
Coke: Transformed coal used primarily in making steel.
Coking plants and blast furnaces: The inputs of coking plants are the coking coal consumed by coking plants. The inputs of blast furnaces are the coke consumed.
Coking plants, briquette plants: The inputs of coking plants are the coking coal consu-med by coking plants. The inputs of blast furnaces are the coke consumed. The out-puts of coking plants are coke and coking gas. The outputs of the blast furnaces are the blast furnace gases.
DEP: Department of Exploration Production.
DGEMP: Department of Energy and Raw Materials (Direction Générale de l’Énergie et des Matières Premières).
DFO: Domestic fuel oil (home heating oil).

123
APPENDIX
Glossary
Domestic consumption: Domestic consumption, for each energy product, is the balance of the total production, foreign trade, air and marine bunker oils (for oil) and changes in inventories.
EIA-DOE: Energy Information Agency - Department of Energy (USA).
Electric power plants: The inputs of elec-tric power plants correspond (for thermal plants) to the consumption of fuels by the power plants. The production of the elec-tric power plants corresponds to the gross production.
Electric power plants (thermal): The inputs of electricity power plants are the fuels consumed by public plants and by self-pro-ducers (including co-generation).
Electricity production: Gross electricity production including public production (private and public power companies) and the self-producers, by any type of power plant (including co-generation).
Electricity production from co-generation: Gross production of electricity by power plants that produce electricity and heat (power companies and self-producers).
Energy sector self-consumption: Consump tion to run energy transforma-tion units (power plants, refineries).
ENTSO-E: European Network of Transmission System Operators for Electricity.
EU: The European Union has 27 states members since the withdrawal of the United Kingdom January 1, 2020: Germany, Austria, Belgium, Bulgaria, Cyprus, Denmark, Spain, Estonia, Finland, France, Greece, Hungary, Ireland, Italy, Latvia, Lithuania, Luxembourg, Malta, Netherlands, Poland, Portugal, Czech Republic, Romania, Slovakia, Slovenia, Sweden. Croatia's membership is effective July 1, 2013, in the enlargement process in the Balkans started nine years earlier. The EU matters in total 515 million inhabitants and covers an area of 3,930,000 km2.
Exploration and development cost: The average cost of exploration and develop-ment represents the dollar cost per barrel equivalent of additional reserves of a country coming from exploration activi-ties, discoveries, improved recovery or update assessments. This cost does not include the licensing of proven reserves.
Exports: Exports are the volumes of energy product exported from the natio-nal territory to another country, minus simple transit volumes and volumes “cus-tom” processed on behalf of a third party country. In the case of geographic or geo-political regions, exports are the aggre-gates of national exports, including those that are part of flows within the region. For accounting consistency, exports appear with a negative sign.
Final consumption: Final consumption is the balance between the interior consump-tion and consumption from the energy transformations and various losses. It measures the needs of the end consumers in the country. They are broken down by category as follows: industry, transport, residential, services, agriculture and non-energy uses. Final consumption of industry is broken down by business line or sector: steel, chemical, non metallic minerals (construction materials), and so on.
Final consumption for non-energy uses: This is the consumption of the products intended for petrochemicals (naphtha), the fabrication of ammonia (natural gas), use in electrode (carbon) form and the use of all products used for their physical-chemi-cal properties (bitumen, paraffins, motor oils, etc.). They are divided into chemicals and other.
FOB: Free On Board. FOB price, in contrast to CIF price, does not include any transport cost, tax or insurance.
Forward price: Forward = forward price - given for different expirations.
Fugitive emissions: Intentional and non-intentional greenhouse gas emissions, from the extraction of a fossil fuel up to the point of use.
GDP: Gross Domestic Product: Measu-rement of the economic activity of a country; it is currently measured at mar-ket prices. GDP at market price is the sum of the value added to the cost of factors, plus indirect taxes, minus subsidies.
GHG: Greenhouse Gases.
Henry Hub: Point of determination of the prices of the gas traded on the NYMEX (New York Mercantile Exchange).
HFC: Hydrofluorocarbon (a category of fluorinated gases that actively contri-bute to the deterioration of the ozone layer, with a global warming potential 3,000 times greater than that of CO2).
IEA: International Energy Agency.
IIASA: International Institute for Applied Systems Analysis.
Imports: Imports are the volumes of energy product imported from another country into the national territory, minus the volumes that are transiting to a third party country and the quantities intended to be “custom” processed on behalf of a third party country. In the case of geogra-phic or geopolitical regions, imports are the aggregates of the national imports, including those that are flows within the region.
124
APPENDIX
Glossary
Industry final consumption: Industry final consumption includes the consumption of the mining, manufacturing and construc-tion sectors. They exclude the consump-tion of fuel for transport activities, even when the means of transport belong to the industrial companies, and the consump-tion of fuels for the self-production of electricity. The energy products used as raw materials or maintenance products are in general separate, or at least identi-fied under the name “non-energy uses.”
LNG: Liquefied Natural Gas.
Light Tight Oil (Tight Oil): Light tight oil or tight oil is a type of oil present in rela-tively impermeable, non-porous layers and requires extraction techniques similar to those of shale gas. Tight oil primarily differs from shale oil in its degree of vis-cosity and is found in particular in the Niobrara and Eagle Ford formations in the United States.
Lignite: A type of low-carbon coal with a low calorific value.
Liquefaction (of gas): The inputs of gas liquefaction plants are natural gas consumptions. The production of liquid gas is the output.
LPG: Liquefied Petroleum Gas.
ULUCF: Land Use, Land Use Change and Forestry, with implications for CO2, CH4
and N2O emissions and capture. The notion covers tree felling and planting, woodland conversion (clearing) and prairies as well as soils whose carbon content is sensitive to the use to which it is put (forest, prairie, cultivated).
Marginality: In the production of electri-city, the duration of marginality repre-sents the time when the production method used is the one with the lowest marginal cost (cost of an additional unit).
Mbl: Million barrels.
MMBtu: 1,000,000 Btu (1 million Btus).
NBP: National Balancing Point is a virtual trading location for the sale and purchase and exchange of UK. It serves as a refe-rence for forward contracts.
Net production (electricity): The net pro-duction of electricity is the balance between gross production and the auto-consumption of electric power plants.
Nitrogen oxide: NO, nitrogen oxide.
NO2: Nitrogen dioxide.
N2O: Nitrogen protoxide (also known as nitrous oxide) with the chemical formula N2O is a powerful greenhouse gas that remains in the atmosphere for a long time (about 120 years). It is partially res-ponsible for the destruction of the ozone. The soil and oceans are the principal
natural sources of this gas, but it is also produced by the use of nitrogen fertilizers, the combustion of organic matter and fos-sil fuels, the production of nylon, etc. In France, farming contributes to the 3/4 of N2O emissions that essentially come from the transformation of nitrogen products (fertilizer, manure, liquid manure, crop residues) in farm land. N2O is a colorless and non-flammable gas, stable in the lower levels of the atmosphere, but it decomposes in the higher levels (stratos-phere) through chemical reactions invol-ving sunlight.
Non-conventional gases: Like the gas known as “conventional”, “non-conventio-nal gases” are essentially composed of methane, but are trapped in relatively impermeable rock, which until recently had limited their development. In fact, extraction requires production technolo-gies that are much more complex than for traditional reservoirs.
Non-conventional oils: Oil extracted by methods other than from a well (in oil sands, for example).
OECD: Organization of Economic Cooperation and Development. Member countries: Australia, Austria, Belgium, Canada, Chile, Czech Republic, Denmark, Germany, Finland, France, Greece, Hungary, Ireland, Iceland, Israel, Italy, Japan, Luxembourg, Mexico, Netherlands, New Zealand, Norway, Poland, Portugal, Slovak Republic, Slovenia, South Korea, Spain, Sweden, Switzerland, Turkey, United Kingdom, United States.
Particulate Matter: Particles in suspension (PM 2.5 corresponds to the fine particles that can enter the pulmonary alveoli).
PFC: Perfluorocarbon (category of fluori-nated gases, with a global warming power on average 7500 times greater than that of CO2).
Primary consumption: Primary consump-tion is the balance from primary produc-tion, foreign trade, bunker oils, and changes in inventories. Primary consump-tion aggregated over all products mea-sures the country’s total energy consumption, including all losses and self-consumption during transformations. For primary energies, primary consump-tion = domestic consumption.

125
APPENDIX
Glossary
Primary production: Primary production measures the quantity of natural energy resource extracted and produced for the purpose of consumption as is, on the pro-duction site or elsewhere, or for subse-quent transformations. It excludes the quantities not use for energy or transfor-mation purposes, particularly for natural gas, the quantities flared, reinjected into wells or discharged as is. On the other hand, it includes auto-consumption on the production sites (electricity generation, auxiliary motors, for example). The pro-duction of hydraulic, geothermal, wind and nuclear electricity is considered to be primary production.
Private consumption: Total consumption of goods and services in monetary units by households.
Production: Energy production corres-ponds to gross domestic production. It measures the volume of energy product produced directly or resulting from a transformation process, including the volume reused in the transformation pro-cess itself (hence the concept of gross production).
Production cost: The average production cost is the average lifting cost of oil and gas from the reservoir to the shipping interface towards the processing center.
Power generation from cogeneration: Gross production of electricity by power plants that produce electricity and heat (power companies and self-producers).
Public production (electricity): The public production of electricity is the gross pro-duction of electricity production compa-nies, whatever their status (public or private).
Pumping: Pumping station inputs are their electricity consumption. The output is the gross production of hydroelectricity.
RES: Renewable energy sources.

126
APPENDIX
Primary energy data comes from the International Energy Agency (IEA). It is completed with data from regio-nal organizations (EUROSTAT, OLADE, ADB, OPEC) or specia-lized institutions (CediGas), as well as by data from national sources (national statistics or data specially prepared by local correspondents with more than 100 partners in around 60 countries). This complementary data is used for the assessment and correction of primary data, and for the quick update of our own data.
The methodology and definitions used by Enerdata are the same as that of IEA and Eurostat.
Energy statistics in physical units are converted into energy units (ktoe or Mtoe) on the basis of the fol-lowing coefficients:Crude oil: fixed coefficient for most countries: 1.02 toe / ton. Oil products: fixed coefficient for all countries – same as EUROSTAT or IEA.Natural gas: national coefficients for key countries and fixed coefficients for the other countries (0.82 toe / 1000 m3);the national coefficients are indicated in the database.
Coal, Lignite: fixed coefficient for coke; national coefficient for production, imports and exports for key producers or importers; the national coefficients are indicated in the database. Electricity:• nuclear: 1 TWh = 0.26 Mtoe • hydroelectricity: 1 TWh = 0.086 Mtoe • geothermal: 1 TWh = 0.86 Mtoe • total production: 1 TWh = 0.086 Mtoe • imports, exports: 1 TWh = 0.086 Mtoe• consumption: 1 TWh = 0.086 Mtoe
Enerdata methodology
POST–COVID CONTEXTEnerdata 2021IEA, Global Energy Review 2021IEA, World Energy Investment 2021IEA, WEO 2021Stimulus packages: OECD Economic outlook 2021, European Comission, Iddri, NCSL
CO2 & CLIMATEEnerdata 2021IEA, Global Energy Review 2021IEA, WEO 2021
IEA, Net Zero by 2050World Meteorological Organization 2021World Bank, “State and Trends of Carbon Pricing”, 2021
DECARBONIZATIONIEA, WEO 2021Enerdata – EnerFuture 2021
ELECTRICITY & ELECTRICAL RENEWABLES
IEA, WEO 2021Enerdata 2021IEA, Electricity Market report, july 2021
IEA, Global Energy Review 2021Boom and Blust 2021 “Tracking the global coal plant pipeline”, april 2021
NATURAL GAS & RENEWABLE GASES
IEA-WEO 2021IEA, Global Energy Review 2021Enerdata 2021IEA, Gas Market Report Q4 2021, october 2021IHS Markit, LNG Market Briefing: Third quarter 2021 review, october 2021
OIL IEA-WEO 2021IEA, Global Energy Review 2021BP Statistical Review, june 2021Enerdata 2021IFP, Énergies Nouvelles, october 2021Catallaxis, les Cahiers Verts de l'Économie, august 2021EIA, Energy Information Administration, july 2021
COALCarbon TrackerIEA, Electricity Market Report, july 2021
Think tank européen E3G, No new coal by 2021, The collapse in the global coal pipeline, septembre 2021
IEA, World Energy Outlook 2021
Enerdata 2021
US Energy Information Administration
Sources

127
APPENDIX
Enerdata
Europe region
Europe European Union (27), Albania, Bosnia-Herzegovina, Croatia, Iceland, Macedonia, Norway, Serbia and Montenegro, Switzerland, Turkey.
EU 27 and EU 28 European Union 27 (without United Kingdom); EU 28 (with UK).
America region
America North America, Mexico, Central America, South America, Caribbeanv
Latin America Central America, Mexico, South America, Caribbean.
North America Canada, USA.
Central America and Mexico
Belize, Costa Rica, El Salvador, Guatemala, Honduras, Nicaragua, Panama.
South America Argentina, Bolivia, Brazil, Chile, Colombia, Ecuador, Guyana, Paraguay, Peru, Suriname, Uruguay, Venezuela.
Caribbean Bahamas, Barbados, Bermuda, Cuba, Dominica, Dominican Republic, Grenada, Haiti, Jamaica, Netherlands Antilles and Aruba, Saint Vincent and the Grenadines, Saint Lucia, Trinidad and Tobago.
Asia region
Asia ASEAN, Afghanistan, China, Hong Kong, Japan, Macao, Mongolia, North Korea, South Asia (Bangladesh, Bhutan, India, Maldives, Nepal, Pakistan, Sri Lanka), Soth Korea, Taiwan.
ASEAN Association of Southeast Asian Nations (Brunei, Cambodia, Indonesia, Laos, Malaysia, Myanmar, Philippines, Singapore, Thailand, Vietnam).
Pacific region
Pacific Australia, Pacific Islands, New Zealand.
Enerdata
Africa region
Africa North Africa, Sub-Saharan Africa.
North Africa Algeria, Egype, Libya, Morocco, Tunisia.
Sub-Saharan Africa Angola, Benin, Botswana, Burkina Faso, Burundi, Cameroon, Cape Verde, Central African Republic, Chad, Comoros, Congo, DR Congo, Ivory Coast, Djibouti, Eritrea, Ethiopia, Gabon, Gambia, Ghana, Guinea, Equatorial Guinea, Guinea-Bissau, Kenya, Lesotho, Liberia, Madagascar, Malawi, Mali, Mauritania, Mauritius, Mozambique, Namibia, Niger, Nigeria, Rwanda, Sao Tome and Principe, Senegal, Seychelles, Sierra Leone, Somalia, South Africa, Sudan, Swaziland, Tanzania, Togo, Uganda, Zambia, Zimbabwe.
Middle East region
GCC Gulf Cooperation Council (Bahrain, Kuwait, Oman, Qatar, Saudi Arabia, United Arab Emirates).
OPEC Middle East Iran, Iraq, Kuwait, Qatar, Saudi Arabia, UAE.
OAPEC Organization of Arab Petroleum Exporting Countries (Algeria, Bahrain, Egypt, Iraq, Kuwait, Libya, Qatar, Saudi Arabia, Syria, Tunisia, UAE).
CIS region
CIS Commonwealth of Indiapendent States (former USSR, excluding Baltic countries).
Soviet Union (former) Armenia, Azerbaijan, Belarus, Estonia, Georgia, Kazakhstan, Kyrgyzstan, Latvia, Lithuania, Moldova, Russia, Tajikistan, Turkmenistan, Ukraine, Uzbekistan.
Source: Enerdata
Geographical scope of the sources

128
APPENDIX
International Energy Agency
Europe region
European Union EU27
Eastern Europe / Eurasia
Albania, Armenia, Azerbaijan, Belarus, Bosnia and Herzegovina, Bulgaria, Croatia, Estonia, Georgia, Kazakhstan, Kyrgyzstan, Latvia, Lithuania, the former Yugoslav, Republic of Macedonia, the Republic of Moldova, Romania, Russian Federation, Serbia (incl Montenegro until 2004 and Kosovo until 1999, Slovenia, Tajikistan, Turkmenistan, Ukraine, and Uzbekistan. For statistical reasons, this region also includes Cyprus, Gibraltar and Malta.
OECD Europe Austria, Belgium, the Czech Republic, Denmark, Estonia, Finland, France, Germany, Greece, Hungary, Iceland, Ireland, Israel, Italy, Luxembourg, the Netherlands, Norway, Poland, Portugal, the Slovak Republic, Slovenia, Spain, Sweden, Switzerland, Turkey and the United Kingdom.
America region
OECD North America Canada, Mexico and the United States.
OECD Latin America Chile.
Latin America Antigua and Barbuda, Aruba, Argentina, Bahamas, Barbados, Belize, Bermuda, Bolivia, Brazil, the British Virgin Islands, the Cayman Islands, Chile, Colombia, Costa Rica, Cuba, Dominica, the Dominican Republic, Ecuador, El Salvador, the Falkland Islands, French Guyana, Grenada, Guadeloupe, Guatemala, Guyana, Haiti, Honduras, Jamaica, Martinique, Montserrat, Netherlands Antilles, Nicaragua, Panama, Paraguay, Peru, St. Kitts and Nevis, Saint Lucia, Saint Pierre et Miquelon, St. Vincent and the Grenadines, Suriname, Trinidad and Tobago, the Turks and Caicos Islands, Uruguay and Venezuela.
Asia-Pacific region
China Refers to the People’s Republic of China, including Hong Kong.
ASEAN Brunei Darussalam, Cambodia, Indonesia, Laos, Malaysia, Myanmar, Philippines, Singapore, Thailand and Vietnam.
OECD Asia Japan and Korea.
Non-OECD Asia Afghanistan, Bangladesh, Bhutan, Brunei Darussalam, Cambodia, China, Chinase Taipei, the Cook Islands, East Timor, Fiji, French Polynesia, India, Indonesia, Kiribati, the Democratic People’s Republic of Korea, Laos, Macau, Malaysia, Maldives, Mongolia, Myanmar, Nepal, New Caledonia, Pakistan, Papua New Guinea, the Philippines, Samoa, Singapore, Solomon Islands, Sri Lanka, Thailand, Tonga, Vietnam and Vanuatu.
Other Asia Non-OECD Asia regional grouping excluding China and India.
OECD Oceania Australia and New Zealand.
OECD Pacific Includes OECD Asia and Oceania.
International Energy Agency
Zone Africa
Africa Algeria, Angola, Benin, Botswana, Burkina Faso, Burundi, Cameroon, Cape Verde, Central African Republic, Chad, Comoros, Congo, Democratic Republic of Congo, Côte d’Ivoire, Djibouti, Egypt, Equatorial Guinea, Eritrea, Ethiopia, Gabon, Gambia, Ghana, Guinea, Guinea-Bissau, Kenya, Lesotho, Liberia, Libya, Madagascar, Malawi, Mali, Mauritania, Mauritius, Morocco, Mozambique, Namibia, Niger, Nigeria, Reunion, Rwanda, Sao Tome and Principe, Senegal, Seychelles, Sierra Leone, Somalia, South Africa, Sudan, Swaziland, United Republic of Tanzania, Togo, Tunisia, Uganda, Zambia and Zimbabwe.
North Africa Algeria, Egypt, Libyan Arab Jamahiriya, Morocco and Tunisia.
Sub-Saharan Africa Africa regional grouping excluding South Africa and North Africa regional grouping.
Zone Moyen-Orient
Middle East Bahrain, the Islamic Republic of Iran, Iraq, Israel, Jordan, Kuwait, Lebanon, Oman, Qatar, Saudi Arabia, Syrian Arab Republic, the United Arab Émirates and Yemen. It includes the neutral zone between Saudi Arabia and Iraq.
Autres zones spécifiques
OECD Includes OECD Europe, OECD Latin and North America and OECD Pacific regional groupings.
OECD+ OECD regional grouping and those countries that are members of the European Union but not of the OECD.
Other Major Economies
Comprises all countries not included in OECD+ and Other Major Economies regional groupings, including India, Indonesia, the African countries (excluding South Africa), the countries of Latin America (excluding Brazil), and the countries of non-OECD Asia, (excluding China) and the countries of Eastern Europe/Eurasia (excluding Russia).
Other Countries Algeria, Angola, Ecuador, the Islamic Republic of Iran, Iraq, Kuwait, Libya, Nigeria, Qatar, Saudi Arabia, the United Arab Émirates and Venezuela.
Source: Enerdata
Geographical scope of the sources

129
APPENDIX
BP Statistical Review
North America US (excluding Puerto Rico), Canada, Mexico.
South and Central America
Caribbean (including Puerto Rico), Central and South America.
Europe European members of the OECD plus Albania, Bosnia-Herzegovina, Bulgaria, Croatia, Cyprus, Former Yugoslav Republic of Macedonia, Gibraltar, Malta, Romania, Serbia and Montenegro, Slovenia.
Former Soviet Union Armenia, Azerbaijan, Belarus, Estonia, Georgia, Kazakhstan, Kyrgyzstan, Latvia, Lithuania, Moldova, Russian Federation, Tajikistan, Turkmenistan, Ukraine, Uzbekistan.
Europe and Eurasia All countries listed above under the headings Europe and Former Soviet Union.
Middle East Arabian Peninsula, Iran, Iraq, Israel, Jordan, Lebanon, Syria.
North Africa Territories on the north coast of Africa from Egypt to western Sahara.
West Africa Territories on the west coast of Africa from Mauritania to Angola, including Cape Verde, Chad.
East and Southern Africa
Territories on the east coast of Africa from Sudan to Republic of South Africa. Also Botswana, Madagascar, Malawi, Namibia, Uganda, Zambia, Zimbabwe.
Asia Pacific Brunei, Cambodia, China, China Hong Kong SAR *, Indonesia, Japan, Laos, Malaysia, Mongolia, North Korea, Philippines, Singapore, South Asia (Afghanistan, Bangladesh, India, Myanmar, Nepal, Pakistan, Sri Lanka), South Korea, Taïwan, Thailand, Vietnam, Australia, New Zealand, Papua New Guinea, Oceania.* Special Administrative Region.
Australasia Australia, New Zealand.
OECD members Europe: Austria, Belgium, Czech Republic, Denmark, Estonia, Finland, France, Germany, Greece, Hungary, Iceland, Republic of Ireland, Italy, Luxembourg, Netherlands, Norway, Poland, Portugal, Slovakia, Slovenia, Spain, Sweden, Switzerland, Turkey, UK.Other member countries: Australia, Canada, Israel, Japan, Mexico, New Zealand, South Korea, US.
OPEC members Middle East: Iran, Iraq, Kuwait, Qatar, Saudi Arabia, United Arab Émirates. North Africa: Algeria, Libya.West Africa: Angola, Nigeria.South America: Ecuador, Venezuela.
BP Statistical Review
European Union members
Austria, Belgium, Bulgaria, Cyprus, Croatia, Czech Republic, Denmark, Estonia, Finland, France, Germany, Greece, Hungary, Republic of Ireland, Italy, Latvia, Lithuania, Luxembourg, Malta, Netherlands, Poland, Portugal, Romania, Slovakia, Slovenia, Spain, Sweden.
Other EMEs (Emerging Market Economies)
South and Central America, Africa, Middle East, non-OECD Asia, non-OECD Europe.
Methodology The primary energy values of both nuclear and hydroelectric power generation have been derived by calculating the equivalent amount of fossil fuel required to generate the same volume of electricity in a thermal power station, assuming a conversion efficiency of 38% (the average for OECD thermal power generation).
Percentages Calculated before rounding of actuals. All annual changes and shares of totals are on a weight basis except on pages 6, 14, 18, 20 and 22.
Rounding differences Because of rounding, some totals may not agree exactly with the sum of their component parts.
Tonnes Metric equivalent of tons.
Disclosure Statistics published in this Review are taken from government sources and published data. No use is made of confidential information obtained by BP in the course of its business.
Country groupings are made purely for statistical purposes and are not intended to imply any judgement about political or economic standings.
Geographical scope of the sources

130
APPENDIX
Contacts
COORDINATION & DATA MANAGEMENT: Group Strategy – Economics, Markets & Scenarios: Hortense Lelouey
CONTEXTE POST-COVIDGroup Strategy – Economics, Market & Scenarios: Camille Duphil, Brigitte Cottet
CO2 & CLIMATEGroup Strategy – Economics, Market & Scenarios: Mathis Morand
DECARBONIZATIONGroup Strategy – Economics, Market & Scenarios:Energy scenarios: Brigitte CottetEnergy efficiency: Camille DuphilEnergy sufficiency: Camille DuphilGreen finance: Camille DuphilCCUS: Alda Engoian, Rémy Carbonnier
ELECTRICITY & ELECTRICAL RENEWABLESGroup Strategy – Economics, Market & Scenarios: Hortense Lelouey, Brigitte Cottet, Sébastien Chirié
NATURAL GAS & GREEN GASGroup Strategy – Economics, Market & Scenarios: Brigitte CottetGreen gas: Marta Kamola-MartinesHydrogen: Hoel Le Gallo
OILGroup Strategy – Economics, Market & Scenarios: Hortense Lelouey, Brigitte Cottet
COALGroup Strategy – Economics, Market & Scenarios: Camille Duphil, Brigitte Cottet
Do not hesitate to send your comments and questions to: Brigitte Cottet – ENGIE – [email protected] Department – Economics Markets & Scenarios – 1, Place Samuel de Champlain, Faubourg de l’Arche 92930 Paris La Défense Cedex – France
PRODUCTION: GROUP STRATEGY DEPARTMENT
Pierre-Laurent Lucille, Economics, Markets & Scenarios, Director
Brigitte Cottet, Editor in Chief, Economics, Markets & Scenarios, Senior Analyst
THIS DOCUMENT IS ACCESSIBLE ON THE ENGIE.COM WEBSITE AND FOR ENGIE COLLABORATORS ON THE ENERGY ESSENTIAL HUB PORTAL (https://engie.sharepoint.com/sites/dshub/Documents%20partages/index.aspx)
Conception & realization of the website: Engie Impact – Sustainability Solutions EMEAI
Dimitri Tomanos, Senior Analyst [email protected]
Sébastien Chaumont, Senior Analyst [email protected]
Bastien Hagenbach, Junior Development Engineer [email protected]
Design & LayoutGaya Graphisme et communication109 rue Duhesme – 75018 Paris01 42 58 40 18 18 – 06 62 37 23 66
[email protected] – www.gayacom.fr
TRANSLATIONVirginie CollinsLes Chavonnes 73270 Villard-sur-Doron
[email protected] – 06 14 46 49 20


132
Group Strategy Department – Economics, Market & Scenarios1 Place Samuel de Champlain – Faubourg de l'Arche – BP 2956 – 92 930 Paris La Défense Cedex – France
Dashboard of Energy Transition
Published in november 2021 on the website www.engie.com
It was made by a responsible eco-printer on paper certified origin. This document is available on the website www.engie.com, where all Group publications can be accessed, downloaded or ordered. ©ENGIE
ENGIE, SA with capital of 2,435,285,011 euros – RCS Paris 542 107 651 Head office: 1, Place Samuel de Champlain, Faubourg de l’Arche, 92930 Paris La Défense Cedex
Any reproduction, full or partial, prohibited.
Publishing director: Brigitte Cottet – Group Strategy Department – Email: [email protected]
2021 Edition
This
docu
men
t has
bee
n pr
epar
ed a
nd e
dite
d by
ENG
IE fo
r a n
on c
omm
ercia
l use
onl
y. EN
GIE d
oes n
ot g
rant
any
war
rant
y, ex
pres
sly o
r tac
itly,
as to
the a
ccur
acy,
the r
elia
bilit
y, th
e upd
ate,
the s
uffic
ienc
y or t
he
lega
lity o
f the
info
rmat
ion
and
data
inclu
ded
in th
e pre
sent
doc
umen
t.EN
GIE i
s not
requ
ired
to u
pdat
e the
info
rmat
ion
or d
ata
of th
e pre
sent
doc
umen
t afte
r its
pub
licat
ion.
ENG
IE w
ill no
t be r
espo
nsib
le fo
r the
use
, the
repr
oduc
tion
or th
e rep
rese
ntat
ion,
who
lly o
r in
parts
, of t
he
info
rmat
ion
or d
ata
by a
ny th
ird p
arty.
ENG
IE w
ill no
t be r
espo
nsib
le as
to a
ny d
irect
, ind
irect
, inc
iden
tal,
imm
ater
ial o
r spe
cial d
amag
es o
r as t
o an
y dam
ages
, miss
ed o
ppor
tuni
ty, lo
ss p
rofit
or a
ny lo
sses
or
dam
ages
wha
tsoe
ver,
alle
gedl
y cau
sed
by th
e ela
bora
tion,
the l
ayou
t and
the p
ublic
atio
n of
the p
rese
nt d
ocum
ent.