User Centered Approach for Learning Analytics Dashboard ...
8
User Centered Approach for Learning Analytics Dashboard Generation Dabbebi Ines 1,2 , Gilliot Jean-Marie 2 and Iksal Sebastien 1 1 UBL, Le Mans University, LIUM Laboratory, Laval-LeMans, France 2 UBL, IMT Atlantique, Lab-STICC Laboratory, Brest, France Keywords: Learning Analytics, Dashboard, Generation Process, Decision Making, Business Intelligence. Abstract: The use of learning dashboards with analytics might help users to gain insight into their learning process and then to make decision. However, designing meaningful Learning Analytics dashboard (LAD) is still a complex process that requires an explicit understanding of the user needs. For this reason, we carried out a user-centered design (UCD) approach with the aim to provide users with adapted LADs to support their decision-making. Hence, we develop a UCD process composed of 4 steps: (i) we propose a participatory-based design tool for capturing contextualized needs (ii) these identified needs will be described using an independent formalism and LAD models in order to capitalize on them (iii) to automate these models, we propose a LAD generation process (iv) finally, we carried out an evaluation phase with the aim to review and refine our models. During our process development, an iterative user needs refinement confirmed that decision is considered as a centered element for LAD generations. 1 INTRODUCTION In recent years, Learning Analytics (LA) has emerged as a research domain. LA is defined as the measure- ment, collection, analysis and reporting of data about learners and their contexts(Siemens and Long, 2011). It aims to propose the means to collect and model digital traces of e-learning, and implement learning indicators and visualizations. Nevertheless, LA is confronted with heterogeneity problems(Chatti et al., 2012). Therefore, analysis processes must be re- defined when their implementation context changes: they cannot be reused, shared or easily improved (Lebis et al., 2016). Since data visualization is part of the analysis process, the definition of Learning An- alytics Dashboard (LAD) models is necessary as a means toward the capitalization of LAD’s structure. Actually, LAD is defined as a single display that ag- gregates different indicators about learner (s), learn- ing process(es) and/or learning context(s) into one or multiple visualizations(Schwendimann et al., 2017). In this paper, we aim to propose an independent formalism and models to describe LAD. We propose also an automatic process for generating LADs. Our aim is therefore to capture needs in the most exhaus- tive way possible, to capitalize on this capture through explicit models, and to propose a generation of learn- ing dashboards based on these models. LAD has been studied by various researchers. Some existing works proposed LADs to help teachers during their learning activities(Xhakaj et al., 2017) or to study the effect of LA on student performance (Arnold and Pistilli, 2012). All these works occur in predefined contexts while presenting specific indicators with the aim to lead users to visualize what they want. Hence, we work on generating LAD in a dynamic way with re- spect to users contexts. The main idea is to support users identifying which and when the decision should be made. Therefore, we decided to follow a user- centered design (UCD) approach. We present there- fore our works dedicated to answer these following research questions that focuses on: How to capture user needs and contexts? We assume that users can make decision using LAD. Thus, LAD content should meet user requirements and answer their visualization objectives. How to generate an adapted LAD? Our works aim to design LAD generation process in a dynamic and contextual way. The generation process should take into account a generic LAD model while highlight- ing the links between different key elements: learning indicators, visual displays and user contexts. 260 Ines, D., Jean-Marie, G. and Sebastien, I. User Centered Approach for Learning Analytics Dashboard Generation. DOI: 10.5220/0007693102600267 In Proceedings of the 11th International Conference on Computer Supported Education (CSEDU 2019), pages 260-267 ISBN: 978-989-758-367-4 Copyright c 2019 by SCITEPRESS – Science and Technology Publications, Lda. All rights reserved
-
Upload
khangminh22 -
Category
Documents
-
view
4 -
download
0
Transcript of User Centered Approach for Learning Analytics Dashboard ...

User Centered Approach for Learning Analytics Dashboard Generation
Dabbebi Ines1,2, Gilliot Jean-Marie2 and Iksal Sebastien1
1UBL, Le Mans University, LIUM Laboratory, Laval-LeMans, France2UBL, IMT Atlantique, Lab-STICC Laboratory, Brest, France
Keywords: Learning Analytics, Dashboard, Generation Process, Decision Making, Business Intelligence.
Abstract: The use of learning dashboards with analytics might help users to gain insight into their learning process andthen to make decision. However, designing meaningful Learning Analytics dashboard (LAD) is still a complexprocess that requires an explicit understanding of the user needs. For this reason, we carried out a user-centereddesign (UCD) approach with the aim to provide users with adapted LADs to support their decision-making.Hence, we develop a UCD process composed of 4 steps: (i) we propose a participatory-based design tool forcapturing contextualized needs (ii) these identified needs will be described using an independent formalismand LAD models in order to capitalize on them (iii) to automate these models, we propose a LAD generationprocess (iv) finally, we carried out an evaluation phase with the aim to review and refine our models. Duringour process development, an iterative user needs refinement confirmed that decision is considered as a centeredelement for LAD generations.
1 INTRODUCTION
In recent years, Learning Analytics (LA) has emergedas a research domain. LA is defined as the measure-ment, collection, analysis and reporting of data aboutlearners and their contexts(Siemens and Long, 2011).It aims to propose the means to collect and modeldigital traces of e-learning, and implement learningindicators and visualizations. Nevertheless, LA isconfronted with heterogeneity problems(Chatti et al.,2012). Therefore, analysis processes must be re-defined when their implementation context changes:they cannot be reused, shared or easily improved(Lebis et al., 2016). Since data visualization is part ofthe analysis process, the definition of Learning An-alytics Dashboard (LAD) models is necessary as ameans toward the capitalization of LAD’s structure.Actually, LAD is defined as a single display that ag-gregates different indicators about learner (s), learn-ing process(es) and/or learning context(s) into one ormultiple visualizations(Schwendimann et al., 2017).
In this paper, we aim to propose an independentformalism and models to describe LAD. We proposealso an automatic process for generating LADs. Ouraim is therefore to capture needs in the most exhaus-tive way possible, to capitalize on this capture throughexplicit models, and to propose a generation of learn-ing dashboards based on these models. LAD has been
studied by various researchers. Some existing worksproposed LADs to help teachers during their learningactivities(Xhakaj et al., 2017) or to study the effectof LA on student performance (Arnold and Pistilli,2012). All these works occur in predefined contextswhile presenting specific indicators with the aim tolead users to visualize what they want. Hence, wework on generating LAD in a dynamic way with re-spect to users contexts. The main idea is to supportusers identifying which and when the decision shouldbe made. Therefore, we decided to follow a user-centered design (UCD) approach. We present there-fore our works dedicated to answer these followingresearch questions that focuses on:How to capture user needs and contexts? We assumethat users can make decision using LAD. Thus, LADcontent should meet user requirements and answertheir visualization objectives.
How to generate an adapted LAD? Our works aimto design LAD generation process in a dynamic andcontextual way. The generation process should takeinto account a generic LAD model while highlight-ing the links between different key elements: learningindicators, visual displays and user contexts.
260Ines, D., Jean-Marie, G. and Sebastien, I.User Centered Approach for Learning Analytics Dashboard Generation.DOI: 10.5220/0007693102600267In Proceedings of the 11th International Conference on Computer Supported Education (CSEDU 2019), pages 260-267ISBN: 978-989-758-367-4Copyright c© 2019 by SCITEPRESS – Science and Technology Publications, Lda. All rights reserved

2 USER-CENTERED DESIGNAPPROACH
LAD design requires a well-understanding of userneeds and their contexts so that we can help themmake a decision. We conducted a User-Centered De-sign (UCD) approach. It is a well-known design ap-proach that aims to develop, in an iterative way, anexplicit comprehension of users(Jokela et al., 2003).UCD can help a designer to establish user needs, pref-erences and limitations, to discover design opportu-nities throughout the design process where user sat-isfaction becomes a key measure of design success(Lanter and Essinger, 2016), which helps to evalu-ate both the effectiveness and relevance of the tools(Miksch and Aigner, 2014), leading to a final valida-tion by the user (Doroftei et al., 2017). UCD havefour main phases:Phase 1: Understand Users and their Context. Theobjective is to identify relevant method for captur-ing contextualized needs. As a result, we proposeda participatory-based tool.Phase 2: Specify User Requirements. Capturinguser needs is a means to create and refine our LAD’smodels mutually. This phase is considered as a directinterpretation of user needs.Phase 3: Produce Design Solutions. We have car-ried out an automatic LAD generation from thesemodels. In fact, we automate this phase with a LADgeneration process (DGP).Phase 4: Evaluate design proposal against require-ments The evaluation aims, firstly, to review and re-fine our LAD’s models and secondly, to capture newusers’ needs in order to provide adapted LADs.
3 PHASE 1: UNDERSTANDUSERS AND THEIR CONTEXTS
We detail in this section, three iterations used to un-derstand and to refine user needs: (i) We conducteda needs assessment study that demonstrated the diffi-culty to capture user needs (ii) We carried out partic-ipatory meetings with teachers and proposed sketchactivities to enhance the user needs expression and fi-nally (iii), we proposed a participatory-based tool.
3.1 First Iteration: Needs AssessmentStudy
The focus of this iteration was to develop an explicitcomprehension of users contexts. This study includessurvey and semi-structured interviews(Dabbebi et al.,
2017). We organized the study around five ques-tions based on the Five W’s and How methods. Eachquestion refers to a contextual dimension:”Who, Why,What, How, When”.”Who” dimension is used to specify users and theirroles.”Why” dimension relates to the identification ofusers’ objectives. In other words, it aims at under-standing why it is important for the user to use LAD.”What” dimension is dedicated to identifying LADcontent especially indicators.”How” dimension refers to the description of LADstructure.”When” dimension is used to specify the way inwhich the dashboard is used.
Following this iteration, we noted that users founddifficulties in expressing their needs clearly througha simple questioning. Actually, users couldn’t eas-ily project themselves into use of LAD or imagin-ing the possibilities especially when asking teachersabout the use of digital data and indicators. For thisreason for the second iteration, we organized partic-ipatory workshops with the aim of stimulating theirimagination and leading a brainstorming.
3.2 Second Iteration: ParticipatoryWorkshops
We organized participatory workshops with 8 elemen-tary and high school teachers. This group of teachersuse the same learning platforms called the TactileoMap application (Sanchez et al., 2015). The work-shop was organized around two main activities:1) The sketch activity is making teachers, through asimple sketch, express their ideas, visualize what theyimagine, share and discuss with others. This activityaims to gather additional information around the fivecontextual dimensions. During this activity, teachersstart by identifying their main objective which wasmonitoring. The choice of this objective was logical.Indeed, (Schwendimann et al., 2017) did identify twomain LAD objectives: self-monitoring or monitoringother. During this workshop, we noted that teachersdid discuss this objective according to different levelsof analysis. Actually, (Siemens and Long, 2011) dididentify three levels of analysis: individual, class anddepartmental level. Teachers choose to work togetheron a single LAD description. The chosen LAD is ded-icated to help teachers monitor their student activitiesaccording to class level.2) Wireframe activity is a visual guide that representsan abstract LAD structure including content organi-zation. During this activity, we extract two informa-tion: a) indicators related one to another are grouped
User Centered Approach for Learning Analytics Dashboard Generation
261

into the same section, b) indicators placed regardingtheir importance. During this iteration, we noticedthat users project more easily in their decision to bemade rather than their objective. Like (Xhakaj et al.,2017), we consider that the expression of decision-making related to LAD might influence its design. Infact, the dashboard, as a key concept in Business In-telligence (BI), is defined as a support that improvesdecision-making and user performance (Rasmussenet al., 2009). Our focus on BI is related mainly tothe fact that LA at the beginning was emerged fromBI (Siemens and Long, 2011).
We also noted the diversity of the user’s needsthat is difficult to capture. To go further, an adaptedtool was therefore necessary and a participatory de-sign method needs to be instrumented (Sanders et al.,2010).
3.3 Third Iteration: AParticipatory-based Design Tool
Inspired by the conduct of our participatory work-shops, we propose therefore this time a tool-basedmethod. Despite its low use in LA (Abel and Evans,2013), participatory tools allow a better expression ofuser needs and the exploration of design alternativesand it helps tools appropriation (Knibbe, 2016). Wepropose a design space (Shaw, 2012) through a toolto support the participatory LAD design. We havedesigned our design space around the same contex-tual dimensions (Gilliot et al., 2018). We representsthis design space with cards and boards. As resultsof previous iterations, we decided to represent the de-cision to be taken as a centered element. The choiceof decision must be explained and then characterized.Then, we represent the context of use. This is aboutcharacterizing elements around the specified decisionto be taken. We propose to participants the opportu-nity to define the data needed to be visualized and toassociate it with visual displays. Finally, to organizeand define a LAD structure, we propose to partici-pants a second board represent a paper prototypingsteps. This participatory-based design tool was testedin two different contexts. A first test workshop was setup with teachers in computer science, and the otherone was proposed to national education supervisorystaff. The workshop process was observed and filmed,with the agreement of the participants. A satisfactionquestionnaire was also used to gather the participants’opinions. We proposed seven questions requiring alevel of agreement on a 5-level Lickert scale. Overall,the level of satisfaction we consider to be high (allanswer was higher than 3). The first feedback froma test workshop is encouraging, and shows that this
form of workshop effectively facilitates cooperationand further exploration of alternatives.
3.4 Findings
During these iterations, we identify four points:First, the context in which LAD is used influences
its organization. It is therefore necessary to be able toformalize this context, both to help users reflect and tocapitalize on these uses for reuse. Even if each LADdepends on a particular user’s objective, we noted itcan be related to the user’s contexts. In our exam-ple, we noticed that teachers are more interested inmonitoring their students activities while administra-tive staff aims to monitor courses popularity(Dabbebiet al., 2017).
Second, we consider that LAD reflects users dur-ing their learning situation. So, we noted that the ex-pression of decision-making related to LAD visual-ization can affect its design.
Third, we found out that representing indicatorsin LAD is connected to different levels of analy-sis. Teachers have organized their proposed indica-tors based on the three level of analysis: departmen-tal, class and individual level.
Finally, LAD displays different indicators(Schwendimann et al., 2017). These indicators canbe visualized through simple textual representation,or through the use of sophisticated visual display.The choice of visual displays depends on the user’spreferences, the context of use and the choice ofindicators itself. In the end, we noted that ourparticipatory-based design tools take into account theidentification of these findings. Actually, this toolis being used from need capture to LAD modeling,which it will be discussed in the next phase.
4 PHASE 2: SPECIFY USERREQUIREMENTS
The two phases ”understand users and their contexts”and ”specify user requirements were tightly coupledas our models were refined at each iteration. The mainobjective of these iterations is to specify all the ele-ments that make it possible to characterize the rele-vant LAD’s structure(s) and gradually refine all ourconceptual models. The modeling phase can be usedto formalize and to evaluate the identified needs withthe aim to make it operational. LAD can be consid-ered as an aggregation of a set of components, includ-ing indicators and visual displays that serve to an-swer user context (Schwendimann et al., 2017). In-deed, identifying these components separately can be
CSEDU 2019 - 11th International Conference on Computer Supported Education
262
used to promote their reuse in similar contexts. In ourwork, LAD reuse is maintained by three main points:
1. A meta-model used to describe LAD componentsin a generic way to ensure its reuse.
2. A LAD pattern used to specify how to organizeLAD components regarding user contexts.
3. A generic description of LAD key elements to en-sure its identification and its reuse in similar con-texts.
4.1 LAD Meta-model
We proposed meta-model in order to describe mainlythe organization of LAD components. In other words,it represents explicitly LAD structure.
We propose an hierarchical structure to better or-ganize displays and to facilitate generations accordingto user needs. In our work, we focus on screen visu-alizations. So, we adopt a classic document structure.We propose LAD meta-model based on three hierar-chical components: widget, section and view.
A widget is an atomic component which repre-sents visual elements such as a graph, grid, table orimage. It is usually represented by a pair of informa-tion indicator,visual display.
A section represents an intermediate component.It aims to regroup a set of related widgets in order tohighlight their relationships.
Finally, the view is considered as the root compo-nent. It may be represented as a graphical container. Itwas created mainly to provide a context in which thevarious components can be arranged and displayed.The definition of a view is about to regroup and orga-nize a set of sections to meet a specific objective.
4.2 LAD Pattern Modeling
A pattern is used to group a set of generic specifica-tions around the selection and organization of LADin a specific context of use. The pattern is about de-scribing both LAD structure and content in a genericway. Actually, it is a main element to assist LADto data storytelling (Knaflic, 2015) in order to facil-itate decision-making. This generic specification isdesigned mainly to ensure LAD reuse in similar con-texts. We propose then to associate a pattern to LADview to guide its structuring.
Decision Guidance. The choice of pattern is mainlyrelated to user decision. In fact,in BI, decisions aremade at different levels in the organization’s hier-archy: Operational, tactical and strategic(Golfarelliet al., 2004).
The operational decision relates to the day-to-dayrunning of an activity. They are mainly dedicated tothe different business lines, which aims at measuringthe performance of a specific action or process.
The tactical decision level, which is narrow inscope and short-term in nature, helps to implementthe strategy. These kinds of dashboards are usuallybuilt for middle management.
The strategic decisions are long-term in their im-pact. They affect and shape the direction of the wholeorganization. They are generally made for seniormanagers. Decision levels in general depends on (1)the frequency of dashboard visualization and (2) onthe level of detail. (1)The frequency indicates the pe-riod of time in which indicators should be presented.(2)In LA, we identify mainly three level of analysisthat may be represented by three levels of detail whichthey are individual, class or departmental level. Thechoice of decision level influence the choice of indi-cators. Only key performance indicators (KPI) shouldbe providing it to users(Pauwels et al., 2009). To as-sist LAD to data storytelling, we need to identify deci-sion levels and to help users to focus their attention ona particular target. Indicator can be focused on learn-ing activity, data producers, time and learning context(Schwendimann et al., 2017). Thus, to guide decision,we need to identify decision level and LAD targets.
4.3 LAD Key Elements
LAD generation requires three mandatory key ele-ments to be modeled (Dabbebi et al., 2017): indica-tors, visual displays and user context.Indicator Modeling. In our case, indicators are al-ready calculated by several analysis platforms. Theseindicators are focused on a particular learning objec-tive. This model answer mainly to the ”What” dimen-sion. Indicators modeling aim to index and to catego-rize indicators. This model includes the type of indi-cator, the context of use (Learning objective, learningsituation, etc.) and its technical characteristics (dataquantity, dimensions, etc.). In our model, indicatorsdescription should be sufficiently detailed in order tofacilitate their representation regarding the adequatelevel of analysis, the level of detail and to facilitatevisual displays selection.Visual Display Modeling. Data visualization helpsusers to get into indicators and understand what ishappening in a simple way. The choice of an adequatevisual display may be critical. Indeed, presenting awrong visual display or providing a sophisticated onecan cause a wrong data interpretation. We, therefore,propose a visual display model with the aim to de-scribe and to index the existing visualization meth-
User Centered Approach for Learning Analytics Dashboard Generation
263

ods. The choice of visual display depends mainly onuser preference and on the characteristics of indica-tors. Visual display can be used to empower indi-cators objectives. This model represents mainly the”How” dimension.User Context Modeling. LAD generation requiresto understand who is the user. Each user has theirrole, objectives, preferences, learning environment,and which decision needs to take. This model willhelp our generation process to provide the user withan adapted LAD to make decision easily.
Using these different models in general aim toassist and guide LAD generations. Thus, identify-ing, organizing and presenting these key elements willform the main steps of the generation process.
5 PHASE 3: LAD GENERATIONPROCESS
In this section, we present our LAD generation pro-cess (DGP). The purpose is to produce LAD in dif-ferent contexts in a dynamic way. We define in thissection the steps followed for LAD generations.
5.1 Process Description
DGP is organized around the same contextual dimen-sions. Each dimension is represented within the dif-ferent LAD models that will be operated by DGP.In fact, DGP should respect LAD meta-model andthe chosen pattern to ensure the links between LADkey elements. Hence, LAD should present a groupof learning indicators in line with the user context.These indicators should be well-organized in a way torespect to LAD meta-model and the pattern descrip-tion. Then, to make these indicators easy to under-stand, the identification of an appropriate visual dis-play is required.
We can resume DGP workflow in three steps:1)Content identification, 2) Content organization and3)Dashboard Presentation;
5.1.1 First Step: Content Identification
This step of content identification is detailed in Fig1.1) Identifying User Context: Based on user con-
text model, DGP start by identifying the user role,learning platforms and learning activities and learn-ing objectives (etc.) in order to be able to preparethe dedicated learning indicators and to understandhis preferences. 2) Identifying user decision: De-pending on expressed users objectives and on whatand when the decision needs to be made, DGP select
Identify userdecision
WHO? WHY?
VerifyExtract KeyIndicators
(KI)
Identifydecisionrelated
indicators
Identify LADpattern
Identify usercontext
WHAT?
HOW?
WHAT?
Figure 1: Content identification step.
LAD patterns which describe the level of decision in-cluding the level of detail and the decision target. 3)Extract Key indicators (KI): The selected pattern ver-ify whether the selected indicators are considered askey indicators (KI) or not. In BI, KI is defined asa set of measures that are considered most importantfor an organization. Following the same logic, DGPshould identify only important measures. To evaluateits importance, DGP should follow the pattern indica-tion including mainly the decision target, the level ofdetail. For example, when user decides to plan theirlearning activities dedicated to a specific class, DGPselects only the indicators related to the learning ac-tivity as a decision target and it should extracts andregroup all measures to represent a synthetic view ofa specific class activities. At this stage, LAD contentis ready to be used.
5.1.2 Second Step: Content Organization
This step is about establishing relationships betweenindicators according to LAD meta-model. This stepis based mainly on a set of organizational rules withthe aim to:
• Propose an elaboration rule for representing apair of KI when one gives additional informationrelated to another KI. This rule can be appliedwhen the two KI share the same context, the samesource of data (same learning activity).
• Group indicators together when one provides ashort summary, it can be a textual indicator oreven a global indicator that summary the result vi-sualized in another indicator.
• Propose a group of indicators together when theyrepresent all the same information with a differentlevel of detail.
The purpose is to transform LAD from a simple in-formation visualization (which is a minimum LADrequirement) to a decision-making tool by relying oncause-and-effect relationships. By identifying theserelationships, DGP will be able to constitute and or-ganize LAD components: widget, section and view.This step ends by adjusting the chosen pattern to bemore adapted to user preferences.
CSEDU 2019 - 11th International Conference on Computer Supported Education
264
5.1.3 Third Step: LAD Presentation
This step is about preparing a list of possible visualdisplays and populating LAD with data. 1) Selecting
Extractedkey
IndicatorsSelect Visual
displayPopulatewidgets
Reselect(Purposes)Generated LAD
WHAT?
Adjust dataformat
OK
HOW? HOW? WHAT?
Figure 2: LAD Presentation’s Step.
visual displays are based on different criteria. Firstly,DGP should connect both indicator and visual displaymodels. Thus, it compares KI descriptions with thoseof visual displays like their dimensions and data quan-tity. Secondly, DGP will check users model to iden-tify user preference. In the case of having more thanone visual displays for each KI, DGP propose visualdisplay by default. In case of failure, for example,when kI measures represent the time evolution, butDGP select a bar chart rather than a timeline chart be-cause of the technical choices (regarding dimensionsor amount of data). Thus, DGP will reselect anothervisual display sharing the same purpose as a bar chartand represent the time evolution. Actually, this step isbased mainly on the kI visualization where each ex-tracted key indicators will be presented into adequatevisual displays.
2) Adjust data format: The adjustment step is per-formed automatically by the system. Considering thateach visual display has different data format require-ments, it is necessary to adapt the kI measures. Thenthe KI measures can be reprocessed individually ac-cording to the required format. In case of failure,DGP choose another visual display sharing the samepurpose.
3) Populate widget : After the KI measures areadjusted based on the format, they are sent to the cor-responding visualization algorithms. Actually, DGPwill work on populating every widget with their re-spective data (measures and dimensions). Data willbe represented according to the chosen period of timeand LAD level of detail.
6 PHASE 4: EVALUATE DESIGNPROPOSAL AGAINSTREQUIREMENTS
This phase is about evaluating the design proposalthroughout the iterative cycle. This is used mainlyto acquire feedback on DGP and to refine our mod-
els. Moreover, we tried to highlight decision impactson LAD generations. Actually, the need to establishan iterative evaluation phase is justified by our needto ensure the effectiveness of our DGP. Indeed, (Dicket al., 2005) recommends the use of rapid prototypingthroughout iterative cycle as a strategic and effectiveapproach to ensure product effectiveness. We con-ducted this evaluation phase by implementing LADsto TactileoMap teachers. We carried out two LADgeneration iterations. The first iteration was about en-suring an automatic LAD generation. The second it-eration was about taking into account user decisions.LADs was evaluated during focus groups. These fo-cus groups were semi-structured. The idea is to guideparticipants to evaluate and analyze LAD’s compo-nents, although the discussion was open.
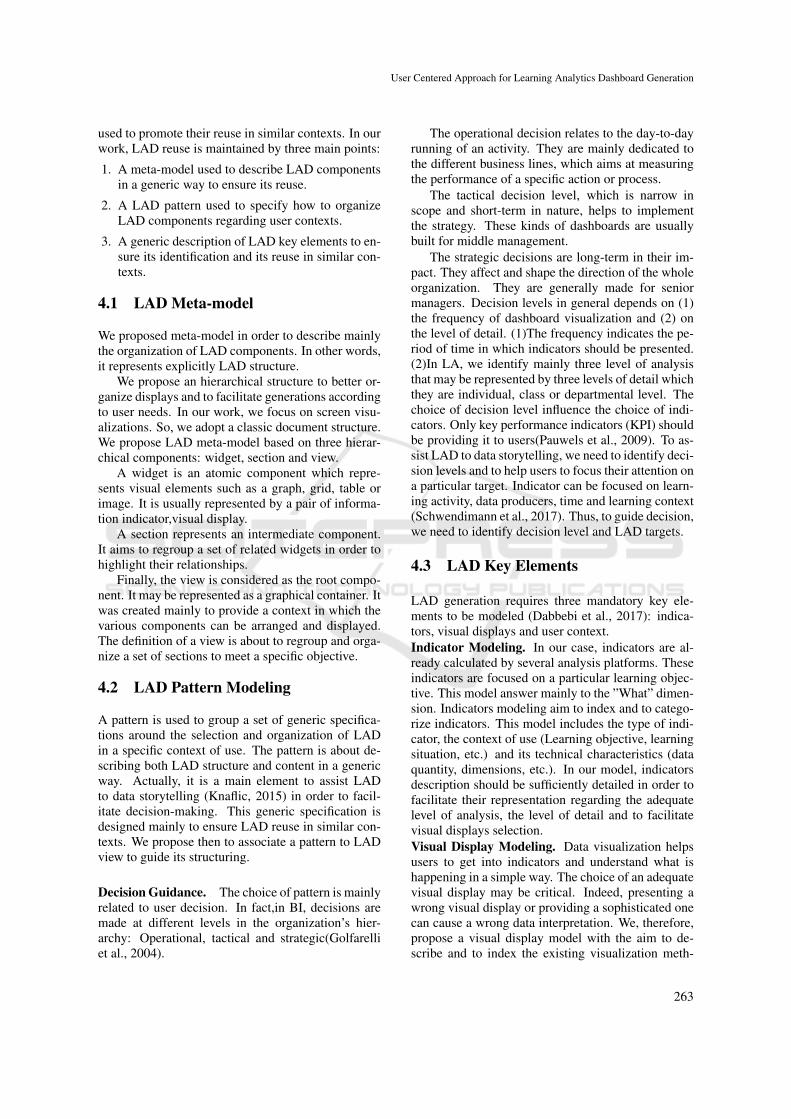
6.1 First Iteration: LAD DynamicGeneration
The first LAD was designed and developed for thesame group of teachers. We proposed LAD to helpteachers in monitoring student performance (Fig3).The choice of LAD content and structure dependsmainly on teacher needs. Thereafter, we carried out
Tableau de bord
Génération dynamique Section 1: Top Ranking students
Section 2.1: Synthetic view of Interaction between groups of learners
Section 2.2: Detailed view by group of learners
Section 3:Representation of learning activities
Figure 3: First LAD Generation.
an evaluation session based on focus group method.We organized this session with two groups of teach-ers(G1 and G2). Each group should evaluate LADcontent and structure. In other words, they shouldevaluate, first, the usefulness of learning indicator inregard to their learning objective. Then, they evaluatewhether LAD presentation was easy to interpret.
Findings: Therefore, we detail teacher feedback:Structure: Both G1 and G2 shared the same idea aboutLAD structure. Actually, they found LAD organiza-tion conforms to what they expected.Content: The evaluation includes the indicators andvisual displays.
We noted that each group had its own vision aboutLAD content. The first group (G1) need more de-
User Centered Approach for Learning Analytics Dashboard Generation
265

tailed indicators. While the second group (G2) askedto have fewer indicators with synthetic data.
We have deduced that visual display choice wasaffected by LAD level of detail and indicators. In fact,G1 preferred to move from using simple histograms todrill-down histograms with the aim to visualize moredetailed indicators.
We concluded that LAD generation was fully ade-quate for both groups. We noticed that LAD was eval-uated based on if it helps teachers take decisions andnot based on only their objective. In fact, we notedeven if teachers share the same learning objective,they did not share the same need to make the samedecision. Whereas, the use of dashboard is clearlyillustrated in BI process. Thus, we noted that this it-eration confirms the need to adopt the BI approach.
6.2 Second Iteration: LAD Generationof Decision-making
We carried out another LAD generation with a refinedLAD model. This iteration guided by decision andpattern specifications. We propose two versions ofLAD where each version represents a specific deci-sion level. As we mentioned, decision level is definedby the level of detail and the frequency of use (deci-sion horizon). These LADs are dedicated to answerthe same objective about monitoring learner perfor-mance. However, each one of them will be guided bydifferent decisions (decision target and level).
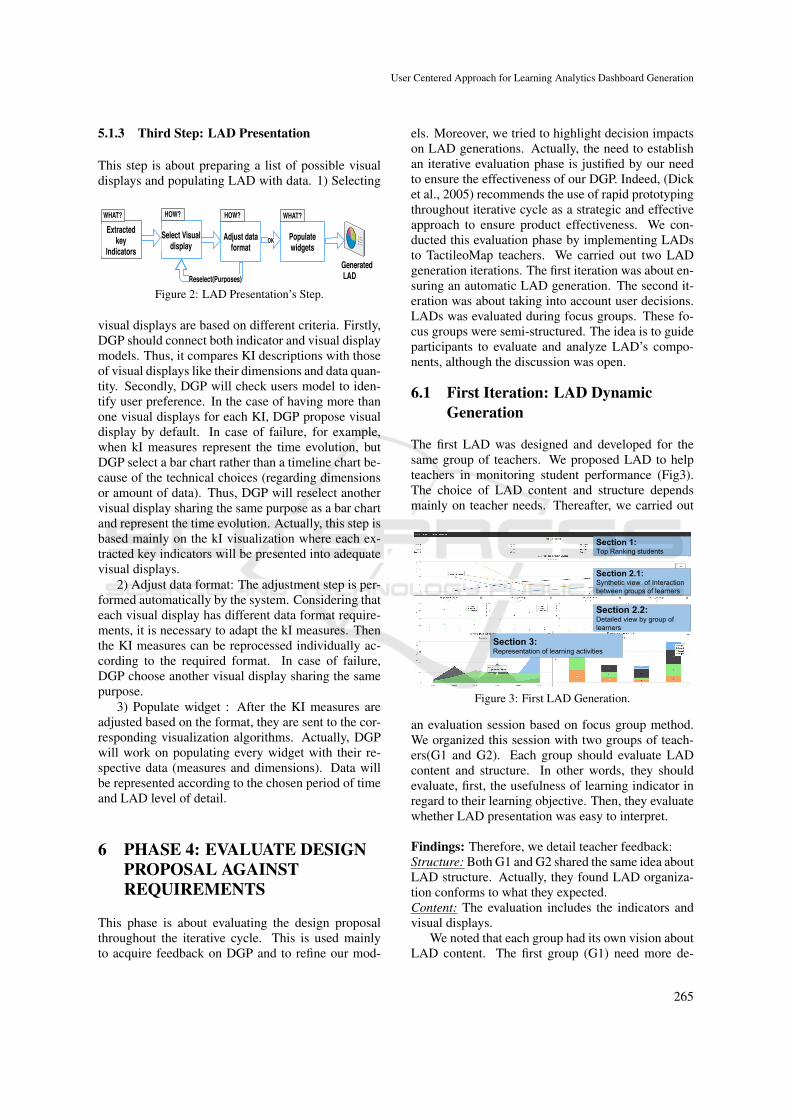
We proposed for G1 an operational LAD (Fig4).This choice was justified by the need to visualize de-tailed indicators daily. Thus, we offered G1 the sameindicators with detailed view. In addition to decisionlevel, DGP presented kI according to G1 decision tar-get which is learners. Actually, kI should be, on theone hand, about learners. On the other hand, measuresthat represent learners should be presented mainly onx-axis. This will guide teachers to focus more onlearner performance rather than another target.
For the second group of teachers (G2), we pro-posed a tactical LAD (Fig5). This decision level wasjustified by the need to visualize relatively frequentlyof fewer indicators. This is a medium-term decision.Therefore, DGP selected only two indicators. Thepurpose is to help teachers to evaluate and to organizelearners into teams for their future activities. Thus,LAD decision target is the same as G1. Since thefrequency of use is different and G2 will not be ableto visualize daily indicators, DGP propose presentingmeasures over a period of time to provide more syn-thetic view. To conclude, the evaluation phase wasused to validate the effectiveness of our DGP. Whilethe first iteration was a way to refine our models, the
OperationalLAD Learners Performance
over Time
Number of actionsperformed by Learners
Detailed view of learnersactivity
General Information aboutlearners activity
Figure 4: Operational LAD: Monitoring learners perfor-mance over time.
Tactical LADNumber of actions performed
by Learners
Detailed view of learnersactivity
Figure 5: Tactical LAD: Monitoring learners performanceover a period of time.
second iteration demonstrated the impact of the de-cision on LAD’s generation. Thus, we can concludethat decision is considered as a centered element forLAD generations. Actually, by changing only the de-cision, DGP proposes a different dashboard automat-ically.
7 CONCLUSION
A key assumption of our work is that users can makedecision using LAD. The idea is LAD can be more ef-fective if it is designed with a thorough understandingof user needs and contexts. In this paper, we carriedout a complete user-centered design approach withthe aim to capitalize, in an iterative way, an explicitcomprehension of users. We propose an equipped ap-proach from capturing the user needs to LAD genera-tion thanks a dedicated DGP which allows rapid pro-totyping to have user evaluations. During our first it-
CSEDU 2019 - 11th International Conference on Computer Supported Education
266

eration, we identified the users’ difficulties in express-ing their needs. We have made the choice to introducethe decision as a dimension of the process. The intro-duction of the decision provided a number of informa-tion: During the first phase, we found a richer expres-sion of needs. During the third phase of LAD gener-ation, we found that introducing decision contributeto the generation of different LADs. During the lastphase, we validate that these different LADs were rel-evant to the decision identified. We therefore confirmthat considering the decision as a centered dimensionin our work has a positive impact on the design ofLAD. The next stage of our work is to evaluate ourDGP with other users while refining decision makingmodeling. We also aim to capitalize LADs to enhancethe ability of our process to propose alternatives.
ACKNOWLEDGEMENTS
We thank all participants who took part in our stud-ies. This work has been supported by the HUBBLEproject (ANR-14-CE24-0015).
REFERENCES
Abel, T. D. and Evans, M. (2013). Cross-disciplinary par-ticipatory & contextual design research: Creating ateacher dashboard application. IxD&A, 19:63–76.
Arnold, K.-E. and Pistilli, M.-D. (2012). Course signals atPurdue: using learning analytics to increase studentsuccess. The 2nd International Conference on Learn-ing Analytics and Knowledge, pages 267–270.
Chatti, M. A., Dyckhoff, A. L., Schroeder, U., and Thus,H. (2012). A reference model for learning analytics.International Journal of Technology Enhanced Learn-ing, 4(5-6):318–331.
Dabbebi, I., Iksal, S., Gilliot, J.-M., May, M., and Garlatti,S. (2017). Towards adaptive dashboards for learninganalytic: An approach for conceptual design and im-plementation. pages 120–131.
Dick, W., Carey, L., and Carey, J. O. (2005). The systematicdesign of instruction.
Doroftei, D., De Cubber, G., Wagemans, R., Matos, A.,Silva, E., Lobo, V., Cardoso, G., Chintamani, K.,Govindaraj, S., Gancet, J., et al. (2017). User-centereddesign. In Search and Rescue Robotics-From Theoryto Practice. InTech.
Gilliot, J.-M., Iksal, S., Medou, D., and Dabbebi, I.(2018). Conception participative de tableaux de bordd’apprentissage. In 30eme conference francophonesur l’interaction homme-machine, page 9p.
Golfarelli, M., Rizzi, S., and Cella, I. (2004). Beyond datawarehousing: what’s next in business intelligence? InProceedings of the 7th ACM international workshopon Data warehousing and OLAP, pages 1–6. ACM.
Jokela, T., Iivari, N., Matero, J., and Karukka, M. (2003).The standard of user-centered design and the standarddefinition of usability: analyzing iso 13407 against iso9241-11. pages 53–60.
Knaflic, C. N. (2015). Storytelling with data: A data visu-alization guide for business professionals. John Wiley& Sons.
Knibbe, C. (2016). Concevoir avec des technolo-gies emergentes pour la construction conjointedes pratiques et des artefacts : apports d’unemethodologie participative a l’innovation tech-nologique et pedagogique. Theses, Conservatoire na-tional des arts et metiers - CNAM.
Lanter, D. and Essinger, R. (2016). User-centered design.International Encyclopedia of Geography: People,the Earth, Environment and Technology, pages 1–4.
Lebis, A., Lefevre, M., Luengo, V., and Guin, N. (2016).Towards a capitalization of processes analyzing learn-ing interaction traces. In European Conferenceon Technology Enhanced Learning, pages 397–403.Springer.
Miksch, S. and Aigner, W. (2014). A matter of time: Ap-plying a data–users–tasks design triangle to visual an-alytics of time-oriented data. Computers & Graphics,38:286–290.
Pauwels, K., Ambler, T., Clark, B. H., LaPointe, P., Reib-stein, D., Skiera, B., Wierenga, B., and Wiesel, T.(2009). Dashboards as a service: why, what, how, andwhat research is needed? Journal of Service Research,12(2):175–189.
Rasmussen, N. H., Bansal, M., and Chen, C. Y. (2009).Business dashboards: a visual catalog for design anddeployment. John Wiley & Sons.
Sanchez, E., Kalmpourtzis, G., Cazes, J., Berthoix, M., andMonod-Ansaldi, R. (2015). Learning with TactileoMap: From Gamification to Ludicization of Field-work. GI Fourm Journal for Geographic InformationScience.
Sanders, E. B.-N., Brandt, E., and Binder, T. (2010). Aframework for organizing the tools and techniques ofparticipatory design. In Proceedings of the 11th Bien-nial Participatory Design Conference, PDC ’10, pages195–198, New York, NY, USA. ACM.
Schwendimann, B. A., Rodriguez-Triana, M. J., Vozniuk,A., Prieto, L. P., Boroujeni, M. S., Holzer, A., Gillet,D., and Dillenbourg, P. (2017). Perceiving learningat a glance: A systematic literature review of learningdashboard research. IEEE Transactions on LearningTechnologies, 10(1):30–41.
Shaw, M. (2012). The role of design spaces. IEEE software,29(1):46–50.
Siemens, G. and Long, P. (2011). Penetrating the fog: Ana-lytics in learning and education. EDUCAUSE review,46(5):30.
Xhakaj, F., Aleven, V., and McLaren, B. M. (2017). Ef-fects of a teacher dashboard for an intelligent tutor-ing system on teacher knowledge, lesson planning,lessons and student learning. In European Conferenceon Technology Enhanced Learning, pages 315–329.Springer.
User Centered Approach for Learning Analytics Dashboard Generation
267