COVID-19 school cluster and transmission analysis - Fraser ...
Upload
khangminh22Category
view
0download
0
Cluster Analysis withthe BigMLDashboard
The BigML Team
Version 1.2
MACHINE LEARNING MADE BEAUTIFULLY SIMPLE
Copyright © 2022, BigML, Inc.

Copyright© 2022, BigML, Inc., All rights reserved.
BigML and the BigML logo are trademarks or registered trademarks of BigML, Inc. in the United Statesof America, the European Union, and other countries.
This work by BigML, Inc. is licensed under a Creative Commons Attribution-NonCommercial-NoDerivatives 4.0 International License. Based on work at http://bigml.com.
Last updated May 5, 2022

About this Document
This document provides a comprehensive description of how to solve cluster analysis using the BigMLDashboard. BigML Clusters are covered in detail. Learn how to use the BigML Dashboard to configure,visualize, and interpret these unsupervised predictive models and use them to find centroids for singleinstances and whole datasets as well.
This document assumes that you are familiar with:
• Sources with the BigML Dashboard. The BigML Team. June 2016. [6]
• Datasets with the BigML Dashboard. The BigML Team. June 2016. [5]
To learn how to use the BigML Dashboard to build supervised predictive models read:
• Classification and Regression with the BigML Dashboard. The BigML Team. June 2016. [4]
• Time Series with the BigML Dashboard. The BigML Team. July 2017. [7]
To learn how to use the BigML Dashboard to build other unsupervised models read:
• Anomaly Detection with the BigML Dashboard. The BigML Team. June 2016. [2]
• Association Discovery with the BigML Dashboard. The BigML Team. June 2016. [3]
• Topic Modeling with the BigML Dashboard. The BigML Team. November 2016. [8]

Contents
1 Introduction 1
2 Understanding Clusters 32.1 K-Means . . . . . . . . . . . . . . . . . . . . . . . . . . . . . . . . . . . . . . . . . . . . . 32.2 G-Means . . . . . . . . . . . . . . . . . . . . . . . . . . . . . . . . . . . . . . . . . . . . . 32.3 On the Repeatability of Clusters . . . . . . . . . . . . . . . . . . . . . . . . . . . . . . . . 42.4 Clusters with Images . . . . . . . . . . . . . . . . . . . . . . . . . . . . . . . . . . . . . . . 4
3 Creating Clusters with 1-Click 6
4 Cluster Configuration Options 84.1 Clustering Algorithms . . . . . . . . . . . . . . . . . . . . . . . . . . . . . . . . . . . . . . 10
4.1.1 K-Means Algorithm . . . . . . . . . . . . . . . . . . . . . . . . . . . . . . . . . . . . 104.1.2 G-Means Algorithm . . . . . . . . . . . . . . . . . . . . . . . . . . . . . . . . . . . 10
4.2 Number of Clusters . . . . . . . . . . . . . . . . . . . . . . . . . . . . . . . . . . . . . . . . 104.3 Critical Value . . . . . . . . . . . . . . . . . . . . . . . . . . . . . . . . . . . . . . . . . . . 114.4 Default Numeric Value . . . . . . . . . . . . . . . . . . . . . . . . . . . . . . . . . . . . . . 114.5 Scale Fields & Auto-Scaled Fields . . . . . . . . . . . . . . . . . . . . . . . . . . . . . . . 124.6 Weights . . . . . . . . . . . . . . . . . . . . . . . . . . . . . . . . . . . . . . . . . . . . . . 134.7 Sampling Options . . . . . . . . . . . . . . . . . . . . . . . . . . . . . . . . . . . . . . . . 14
4.7.1 Rate . . . . . . . . . . . . . . . . . . . . . . . . . . . . . . . . . . . . . . . . . . . . 144.7.2 Range . . . . . . . . . . . . . . . . . . . . . . . . . . . . . . . . . . . . . . . . . . . 154.7.3 Sampling . . . . . . . . . . . . . . . . . . . . . . . . . . . . . . . . . . . . . . . . . 154.7.4 Replacement . . . . . . . . . . . . . . . . . . . . . . . . . . . . . . . . . . . . . . . 154.7.5 Out of Bag . . . . . . . . . . . . . . . . . . . . . . . . . . . . . . . . . . . . . . . . 15
4.8 Creating Clusters with Configured Options . . . . . . . . . . . . . . . . . . . . . . . . . . . 154.9 API Request Preview . . . . . . . . . . . . . . . . . . . . . . . . . . . . . . . . . . . . . . . 16
5 Visualizing Clusters 175.1 Cluster Visualization . . . . . . . . . . . . . . . . . . . . . . . . . . . . . . . . . . . . . . . 17
5.1.1 Distance Histogram . . . . . . . . . . . . . . . . . . . . . . . . . . . . . . . . . . . 195.1.2 Centroid . . . . . . . . . . . . . . . . . . . . . . . . . . . . . . . . . . . . . . . . . . 195.1.3 Cluster Visualization with Images . . . . . . . . . . . . . . . . . . . . . . . . . . . . 21
5.2 Creating a Dataset From a Cluster . . . . . . . . . . . . . . . . . . . . . . . . . . . . . . . 23
6 Cluster Summary Report 256.1 Cluster Summary . . . . . . . . . . . . . . . . . . . . . . . . . . . . . . . . . . . . . . . . . 25
7 Cluster Predictions: Centroids 277.1 Introduction . . . . . . . . . . . . . . . . . . . . . . . . . . . . . . . . . . . . . . . . . . . . 277.2 Predicting Centroids . . . . . . . . . . . . . . . . . . . . . . . . . . . . . . . . . . . . . . . 28
7.2.1 Centroid . . . . . . . . . . . . . . . . . . . . . . . . . . . . . . . . . . . . . . . . . . 297.2.1.1 Local Predictions . . . . . . . . . . . . . . . . . . . . . . . . . . . . . . . 31
iii

iv CONTENTS
7.2.1.2 Centroid with Images . . . . . . . . . . . . . . . . . . . . . . . . . . . . . 327.2.2 Batch Centroid . . . . . . . . . . . . . . . . . . . . . . . . . . . . . . . . . . . . . . 33
7.2.2.1 Batch Centroid with Images . . . . . . . . . . . . . . . . . . . . . . . . . . 377.3 Configuring Centroid Predictions . . . . . . . . . . . . . . . . . . . . . . . . . . . . . . . . 38
7.3.1 Field Mapping . . . . . . . . . . . . . . . . . . . . . . . . . . . . . . . . . . . . . . 387.3.2 Output Settings . . . . . . . . . . . . . . . . . . . . . . . . . . . . . . . . . . . . . . 39
7.4 Visualizing Cluster Predictions . . . . . . . . . . . . . . . . . . . . . . . . . . . . . . . . . 407.4.1 Single Centroid . . . . . . . . . . . . . . . . . . . . . . . . . . . . . . . . . . . . . . 407.4.2 Batch Predictions . . . . . . . . . . . . . . . . . . . . . . . . . . . . . . . . . . . . . 41
7.4.2.1 Output CSV File . . . . . . . . . . . . . . . . . . . . . . . . . . . . . . . . 417.4.2.2 Output Dataset . . . . . . . . . . . . . . . . . . . . . . . . . . . . . . . . . 427.4.2.3 Batch Centroid 1-Click Actions . . . . . . . . . . . . . . . . . . . . . . . . 43
7.5 Consuming BigML Centroids Programmatically . . . . . . . . . . . . . . . . . . . . . . . . 447.5.1 Using Centroids Via the BigML API . . . . . . . . . . . . . . . . . . . . . . . . . . . 447.5.2 Using Centroids Via BigML Bindings . . . . . . . . . . . . . . . . . . . . . . . . . . 44
7.6 Descriptive Information . . . . . . . . . . . . . . . . . . . . . . . . . . . . . . . . . . . . . 457.6.1 Name . . . . . . . . . . . . . . . . . . . . . . . . . . . . . . . . . . . . . . . . . . . 457.6.2 Description . . . . . . . . . . . . . . . . . . . . . . . . . . . . . . . . . . . . . . . . 467.6.3 Category . . . . . . . . . . . . . . . . . . . . . . . . . . . . . . . . . . . . . . . . . 467.6.4 Tags . . . . . . . . . . . . . . . . . . . . . . . . . . . . . . . . . . . . . . . . . . . . 47
7.7 Cluster Predictions Privacy . . . . . . . . . . . . . . . . . . . . . . . . . . . . . . . . . . . 477.8 Moving Centroids . . . . . . . . . . . . . . . . . . . . . . . . . . . . . . . . . . . . . . . . . 487.9 Stopping Centroids . . . . . . . . . . . . . . . . . . . . . . . . . . . . . . . . . . . . . . . . 487.10 Deleting Centroids . . . . . . . . . . . . . . . . . . . . . . . . . . . . . . . . . . . . . . . . 48
8 Consuming Clusters 508.1 Exporting and Downloading Clusters . . . . . . . . . . . . . . . . . . . . . . . . . . . . . . 508.2 Updating Clusters . . . . . . . . . . . . . . . . . . . . . . . . . . . . . . . . . . . . . . . . 508.3 Using Clusters Via the BigML API . . . . . . . . . . . . . . . . . . . . . . . . . . . . . . . 518.4 Using Clusters Via the BigML Bindings . . . . . . . . . . . . . . . . . . . . . . . . . . . . . 51
9 Clusters Limits 52
10 Cluster Descriptive Information 5310.1 Cluster Name . . . . . . . . . . . . . . . . . . . . . . . . . . . . . . . . . . . . . . . . . . . 5310.2 Description . . . . . . . . . . . . . . . . . . . . . . . . . . . . . . . . . . . . . . . . . . . . 5410.3 Category . . . . . . . . . . . . . . . . . . . . . . . . . . . . . . . . . . . . . . . . . . . . . 5410.4 Tags . . . . . . . . . . . . . . . . . . . . . . . . . . . . . . . . . . . . . . . . . . . . . . . . 5510.5 Counters . . . . . . . . . . . . . . . . . . . . . . . . . . . . . . . . . . . . . . . . . . . . . 55
11 Clusters Privacy 56
12 Moving Clusters to Another Project 57
13 Stopping Cluster Creation 59
14 Deleting Clusters 60
15 Takeaways 62
List of Figures 64
List of Tables 66
Glossary 67
References 69
Copyright © 2022, BigML, Inc.

CHAPTER 1Introduction
There are problems that require separating datasets into subsets of instances bearing some similarities.Cluster analysis is a Machine Learning task that partitions a dataset and groups together those instancesthat are similar. It separates a set of instances into a number of groups so that instances in the samegroup, called cluster, are more similar to each other than to those in other groups. Cluster analysis doesnot require using previously labeled data. For this reason, it falls under the category of unsupervisedlearning.
BigML clusters use proprietary learning algorithms to group together the instances according to a dis-tance measure, computed using the values of the fields as input. Each cluster group is represented byits center (or centroid). All BigML field types are valid inputs for clustering, i.e. categorical, numeric,text and items fields, although there are a few caveats. First, numeric fields are automatically scaled toensure that their different magnitudes do not bias the distance calculation. Second, clustering does nottolerate missing values for numeric fields, so BigML provides several strategies for dealing with them(see Section 4.4), otherwise those instances are excluded to compute the clusters.
BigML clusters can be built using two different unsupervised learning algorithms:
• K-means: the user needs to specify the number of clusters in advance. Learn more about k-meansin Section 2.1.
• G-means: the algorithm automatically learns the number of different clusters by iteratively takingexisting cluster groups and testing whether the cluster’s neighborhood appears Gaussian in itsdistribution. Learn more about g-means in Section 2.2.
This chapter provides a comprehensive description of BigML clusters including how they can be created(Chapter 3) and configured (Chapter 4). Powerful visualizations are provided of the results of clusteringdata instances, which give insight into their internal structure (see Chapter 5). Besides their visualrepresentations, clusters also provide a textual summary view of the most essential information aboutthem (see Chapter 6). Clusters are actionable, since they allow you to identify the cluster that is closestto any given new data point (Chapter 7). You can even download and calculate the nearest cluster locally(see Section 8.1). It is also worth noting that you can create, update, list, and delete clusters using theBigML API (see Section 8.3).
In BigML, the fourth tab of the main menu of your Dashboard allows you to list all your available clusters.In the cluster list view (Figure 1.2), you can see, for each cluster, the dataset it was created from, aswell as the cluster’s Name, Algorithm (either k-means or g-means), the number of cluster groups K,Age (time elapsed since it was created), Size, and number of centroids or batch centroids that havebeen created using that cluster. The SEARCH menu option in the top right corner of the cluster list viewallows you to search your clusters by name.
1

2 Chapter 1. Introduction
Figure 1.1: Clusters list view
When you first create an account at BigML, or every time you start a new project, your list view of clusterswill be empty. (See Figure 1.2.)
Figure 1.2: Empty Dashboard cluster view
Finally, in Figure 1.3 you can see the icon used to represent a cluster in BigML.
Figure 1.3: Cluster icon
Copyright © 2022, BigML, Inc.

CHAPTER 2Understanding Clusters
This section describes internal details about BigML clusters. Besides being useful to better understandhow BigML implements them, it will also provide the foundations for you to decide why and when to usethe two available clustering algorithms. You can safely skip this section on first read.
2.1 K-Means
K-means is one of two algorithms that BigML provides for cluster analysis. K-means clustering aims topartition the data instances contained in your dataset in K clusters, such that each data instance belongsto the cluster with the nearest center.
BigML proprietary implementation of K-means is optimized for scalability, thus mitigating one of themajor limitations of standard K-means. BigML adopted the mini-batch1 approach, which is known toreduce computation cost by orders of magnitude compared to the classic K-means algorithm.
One key factor when using K-means clustering is how the algorithm is initialized, which can greatlyaffect the quality of the identified clusters. In standard K-means, initial clusters are chosen at random.This means that the quality of the clusters identified by the algorithm usually varies a lot from run torun, so it is fair to say that standard K-means provides no guarantee of accuracy2. Therefore, alternativeapproaches for the selection of the initial clusters have been described in literature, such as K-means++,which is a little too slow for BigML purposes. Instead, BigML preferred approach is K-means ||3, whichis similar to K-means++ but much faster.
Another dimension where BigML clusters improve on standard K-means is the way they handle categor-ical data. Instead of “binarizing” each category, meaning a field with 40 categories becomes 40 binaryfields, BigML chose a technique called k-prototypes4 which modifies the distance function to be morecategory-friendly so each cluster chooses the most common category from its neigborhood. So, BigMLClusters use mode instead of mean for categorical fields.
2.2 G-Means
Sometimes, it is hard to know in advance how many clusters can be identified in a given dataset (the Kin K-means). To solve this issue, an alternative algorithm has been proposed, G-means5, which usesa special technique for running K-means multiple times while adding centroids in a hierarchal fashion.
1http://www.eecs.tufts.edu/~dsculley/papers/fastkmeans.pdf2http://ilpubs.stanford.edu:8090/778/1/2006-13.pdf3http://theory.stanford.edu/%7Esergei/papers/vldb12-kmpar.pdf4http://www.iipl.fudan.edu.cn/%7Ezhangjp/literatures/cluster%20analysis/apkdd.pdf5http://papers.nips.cc/paper/2526-learning-the-k-in-k-means.pdf
3

4 Chapter 2. Understanding Clusters
G-means has the advantage of being relatively resilient to covariance in clusters and has no need tocompute a global covariance (as is the case with using the Mahalanobis6 distance, a popular variant onclassic K-means to deal with covariance).
BigML implementation differs from the original paper. First, we reuse our sample-based K-means ratherthan running full K-means, with the already described performance and scalability advantage. Addi-tionally, BigML clusters choose new candidate clusters with kmeans|| rather than the PCA calculationfrom the paper. While this gives us better scalability, it means BigML version of G-means is no longerdeterministic as in the paper. Given the same data, we may find a different number of clusters from onerun to the next (if no seed is given).
Finally, BigML G-means have different stopping criteria than the original paper. We currently enforcea maximum limit of 128 clusters. Also, if BigML algorithm does not make sufficient progress in findingGaussian clusters after multiple iterations of G-means, it stops early. Both techniques ensure that BigMLalgorithm returns fewer clusters.
G-means is almost parameter-free, except for one, the critical_value parameter. G-means iterativelytakes existing clusters and tests whether the cluster’s neighborhood appears Gaussian. If it does not,the cluster is split into two. The critical_value sets how strict the test is when deciding whether datalooks Gaussian. The current default is 5, but ranges between 1 and 20 can be reasonable dependingon the dataset. A critical value of 1 means data must look very Gaussian to pass the test and can leadto more clusters being detected. Higher critical_values will tend to find fewer clusters.
2.3 On the Repeatability of Clusters
As mentioned, standard K-means provides results that vary strongly from run to run due to the randomselection of initial clusters. However, BigML clusters strive to ensure that obtained results are repeatable,to some extent. In particular, when applying K-means||, BigML will ensure that the same initial clusterselection is done for each given dataset.
As an end effect, if you choose the K-means algorithm, BigML Clusters are repeatable when you use thesame dataset to create them. Alternatively, if you create different datasets from the same datasource,no guarantee can be provided as to the repeatability of the results.
The same considerations apply to BigML G-means repeatability.
2.4 Clusters with Images
Image obviously is one of the most important categories among all data, and its presence is ever in-creasing. It is estimated that more than 85% of all Internet traffic today are visual data. Research alsoindicates that 90% of the information transmitted to human brain is visual. Therefore it’s very importantto support and develop machine learning with images.
BigML extracts image features at the source level. Image features are sets of numeric fields for eachimage. They can capture parts or patterns of an image, such as edges, colors and textures. BigMLalso supports image features extracted by pre-trained CNNs which capture more sophisticated features.Depending on different machine learning use cases and goals, all these image features can be effectivein cluster analysis, as well as other unsupervised and supervised models.
For information about the image features, please refer to section Image Analysis of the Sources with theBigML Dashboard7[6].
6https://en.wikipedia.org/wiki/Mahalanobis_distance7https://static.bigml.com/pdf/BigML_Sources.pdf
Copyright © 2022, BigML, Inc.

Chapter 2. Understanding Clusters 5
Figure 2.1: A dataset with images and image features
As shown in Figure 2.1, the example dataset has an image field image_id. It also has image featuresextracted from the images referenced by image_id. Image feature fields are hidden by default to reduceclutter. To show them, click on the icon “Click to show image features”, which is next to the “Search byname” box. In Figure 2.2, the example dataset has 512 image feature fields, extracted by a pre-trainedCNN, ResNet-18.
Figure 2.2: A dataset with image feature fields shown
From image datasets like this, clusters can be created and configured using the steps described in thefollowing chapters.
Copyright © 2022, BigML, Inc.

CHAPTER 3Creating Clusters with 1-Click
To create a cluster in BigML you have two options: you can use the BigML unique 1-click feature whichprovides a convenient way to create a cluster from a dataset, or you can configure a number of optionsthat give you fine control on how the cluster is created. This section will guide you through the processof creating a cluster with just 1-click.
By far, the easiest and quickest way to create a cluster is using the 1-CLICK CLUSTER option that isavailable in the 1-click action menu. (See Figure 3.1.)
Figure 3.1: 1-click cluster
Alternatively, you can select the 1-CLICK CLUSTER option in the 1-click action menu from the datasetlist view. (See Figure 3.2.)
Figure 3.2: Pop up menu option to create a 1-click cluster from list view
Either option builds a new cluster using default values for all available configuration options (see Chap-ter 4). This can give you a quick starting point to understand how your clustering behaves and how toimprove it.
Creating a cluster may take a variable time, depending on how big your dataset is, your subscriptionplan, etc. Once your clusuter is ready, it will be automatically displayed on your BigML Dashboard and
6

Chapter 3. Creating Clusters with 1-Click 7
you will be able to explore it through BigML sophisticated visualizations (see Chapter 5,) and using it forpredictions (see Chapter 7.)
Copyright © 2022, BigML, Inc.

CHAPTER 4Cluster Configuration Options
While 1-click creation (see Chapter 3) provides a convenient and easy way to create a cluster from adataset, there are cases when you want more control. This section will focus on the options that BigMLoffers to configure its internal algorithms for clustering.
You can set a number of parameters that affect the way BigML creates models from a dataset. Suchparameters can be grouped in two categories:
• Parameters that are permanently associated to the dataset, such as its objective field and preferredfields. Once you provide a value for a dataset’s permanent parameters, they will be used as adefault value for the creation of models from that dataset.
• Parameters that only affect the model that is currently being created and that you are expectedto set each time. Those include the objective field, included/excluded fields, and a number ofconfiguration options that are described below.
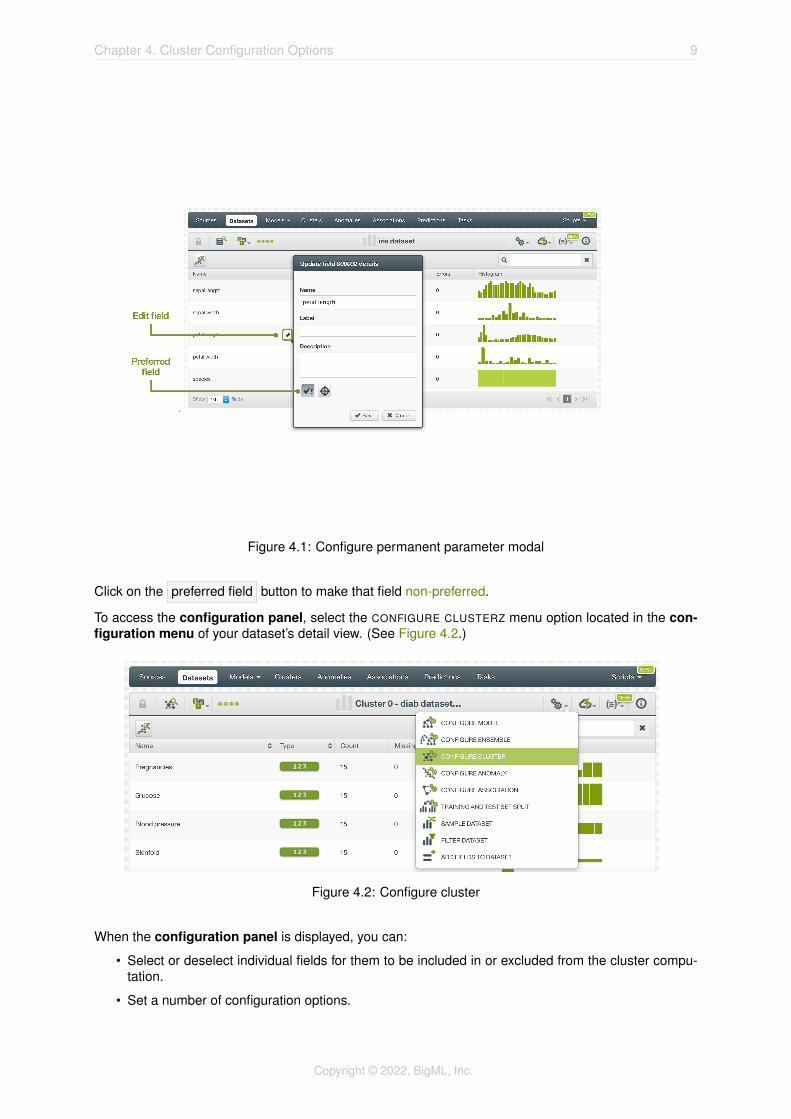
Set a dataset’s permanent parameters by clicking on the edit button that is displayed when you hoveron the dataset’s fields. This opens a modal dialog where you can set some of the field properties (SeeFigure 4.1).
8
Chapter 4. Cluster Configuration Options 9
Figure 4.1: Configure permanent parameter modal
Click on the preferred field button to make that field non-preferred.
To access the configuration panel, select the CONFIGURE CLUSTERZ menu option located in the con-figuration menu of your dataset’s detail view. (See Figure 4.2.)
Figure 4.2: Configure cluster
When the configuration panel is displayed, you can:
• Select or deselect individual fields for them to be included in or excluded from the cluster compu-tation.
• Set a number of configuration options.
Copyright © 2022, BigML, Inc.

10 Chapter 4. Cluster Configuration Options
Note: when the configuration panel is displayed, the edit is not visible, so you cannot setthe dataset’s permanent properties.
You can find a detailed explanation of the configuration options in the following sections.
4.1 Clustering Algorithms
BigML provides two distinct algorithms for clustering. Choose between K-means1 and G-means2 [1] tocreate your cluster. (See Figure 4.3.)
Figure 4.3: Cluster options: clustering algorithm
4.1.1 K-Means Algorithm
Using the K-means algorithm requires that you already know the number of cluster groups (the K in K-means) that are present in your dataset. If you do not know it, an inappropriate choice of K may yieldpoor results.
The maximum number of clusters that you can specify is 300.
4.1.2 G-Means Algorithm
If you do not know which is the optimal number of cluster groups present in your dataset, you can haveBigML discover it by using G-means. G-means solves the problem of trying to find the number of clustersby iteratively taking existing clusters and testing whether the cluster’s neighborhood appears Gaussianin its distribution (based on Anderson-Darling tests3). See this blogpost4 for more information.
G-means will yield a maximum of 128 clusters.
4.2 Number of Clusters
When you select the K-means algorithm, you are required to configure the number of clusters that youknow are to be found. (See Figure 4.4.)
1https://en.wikipedia.org/wiki/K-means_clustering2http://papers.nips.cc/paper/2526-learning-the-k-in-k-means.pdf3https://en.wikipedia.org/wiki/Anderson\T1\textendashDarling_test4http://blog.bigml.com/2015/02/24/divining-the-k-in-k-means-clustering/
Copyright © 2022, BigML, Inc.

Chapter 4. Cluster Configuration Options 11
Figure 4.4: Number of clusters
Note: choosing an inappropiate K can yield poor results. If you do not have any initial idea ofhow many clusters your data may contain, it is better to use G-means.
4.3 Critical Value
When you select the G-means algorithm, you can choose a critical value. (See Figure 4.5.)
Figure 4.5: Critical value options
The critical value determines how “strict” the G-means algorithm is when identifying clusters. When youselect G-means, BigML iteratively tests new clusters looking for Gaussian distributions in the clusters’neighborhoods. If a new cluster does not pass the test, it is split into two new clusters. The criticalvalue sets how strict this statistical test should be when deciding if the underlying data looks Gaussian.A critical value of 1 means the data must look very Gaussian to pass the test, so it can lead to moreclusters being detected. Alternatively, higher critical values loosens the Gaussian constraint and leadsto fewer clusters.
By default, BigML uses a value of 5, which seems to work well in most cases. A range between 1 and10 is acceptable.
4.4 Default Numeric Value
Figure 4.6: Cluster options: default numeric value
Copyright © 2022, BigML, Inc.

12 Chapter 4. Cluster Configuration Options
When training a cluster, BigML may encounter missing values, which can be either considered or ig-nored. Indeed, clusters compute the Euclidean distance5. Since the distance to a missing value isundefined, instances containing missing values will be ignored.
BigML. though, lets you use a default value in place of any missing value, by setting a default numericvalue. You can choose to replace the missing numeric values with the field’s maximum, mean, median,minimum or zero. There is one catch. If all the instances contain at least one missing value, this wouldinvalidate the entire training set. In this situation, BigML automatically replaces the missing numericvalues by the median.
Missing values for categorical fields are always considered valid categorical values, for example [red,green, blue, <missing>]. This means a cluster centroid may contain a missing value. (See Fig-ure 4.7.)
Figure 4.7: Example of a centroid with missing values for some categorical fields
4.5 Scale Fields & Auto-Scaled Fields
Datasets often contain fields with very different magnitudes. For example, two fields such as age andsalary. Since clusters compute the Euclidean distance6 between numeric values, salary will dominatethe clustering.
BigML provides two options to re-scale your fields (Figure 4.8):
• Scale fields: set a specific scale for your fields using an integer multiplier. This will increase theirinfluence as many times as the number you set to calculate the clusters. If the auto-scaled optionis enabled, it will be applied first so you can control how much weight you assign to a particularfield relative to others. For example, if you want the age to be twice as influential as salary you justneed to set auto-scaled to true and assign a multiplier of 2 to the age field.
5https://en.wikipedia.org/wiki/Euclidean_distance6https://en.wikipedia.org/wiki/Euclidean_distance
Copyright © 2022, BigML, Inc.

Chapter 4. Cluster Configuration Options 13
• Auto-scaling: when the auto-scaled option is enabled, all the numeric fields will be scaled so thattheir standard deviations are 1. This ensures each field will have equal influence.
Figure 4.8: Cluster options: field scaling
4.6 Weights
This option allows you to assign individual weights to each instance by choosing a special weight field.This is useful when you have an unbalanced dataset, where data instances ofa given kind, e.g., thoseindicating a fraudulent transaction, are scarce in comparison to other ones. In such case, you may wantto assign more weight to the scarce instances so they are equivalent to the abundant ones.
Figure 4.9: Cluster options: weight field
The selected field must be numeric, and it must not contain any missing values. The field selected forweighting purposes will not be taken into account as an input to calculate cluster distances. You canselect an existing field in your dataset, or you can create a new one to assign customized weights.
For example, below you can find a transactional dataset example for which we included a field called“Weight”. This field indicates that fraudulent instances weigh 10 more times than non fraudulent ones.BigML Flatline editor is a powerful tool for adding new fields to your dataset, such as a weight field.Another field that could be used in this example may be the transaction “Amount” so that transactionswith higher amounts will have higher weights in the cluster.
Copyright © 2022, BigML, Inc.

14 Chapter 4. Cluster Configuration Options
Trans. ID Products Online Amount $ Fraud Weight
xxxxxx098 XYZGH yes 3,218 FALSE 1
xxxxxx345 VBHGF no 1,200 FALSE 1
xxxxxx123 UYFHJ yes 5,000 FALSE 1
xxxxxx567 HSNKI no 390 FALSE 1
xxxxxx789 SHSYA yes 500 TRUE 10
xxxxxx093 DFSTU yes 423 FALSE 1
xxxxxx012 TYISJ yes 60,000 FALSE 1
xxxxxx342 SJSOP no 789 FALSE 1
xxxxxx908 IOPKJ no 9,450 FALSE 1
xxxxxx334 HIOPN yes 50,678 TRUE 10
Table 4.1: Weight Field example for transactional dataset
4.7 Sampling Options
Sometimes you do not need all the instances contained in your testing dataset to build your cluster. Ifyou have a very large dataset, sampling may be a good way of getting faster results. (See Figure 4.10.)
The same sampling options described in the Datasets with the BigML Dashboard document [5] tosample datasets are also available when building clusters. They are divided in two groups: samplingand advanced sampling options.
Figure 4.10: Sampling options for clusters
4.7.1 Rate
The sampling rate is the frequency of instances being extracted from the dataset and included in yoursample. A sampling rate of 100% means that all instances are included; a rate of 10% means thatonly every tenth instance is included. This option may take any value between 0% and 100%. You caneasily configure the rate by moving the slider in the configuration panel for sampling, or by typing thepercentage in the tiny input box, both highlighted in Figure 4.10.
Copyright © 2022, BigML, Inc.

Chapter 4. Cluster Configuration Options 15
By default, BigML uses a 100% rate.
4.7.2 Range
The sampling range is the linear subset of the dataset instances that you want to include in the sample,e.g., from instance 5 to instance 1,000. The rate will be applied over the range configured.
By default, all instances are included, i.e., the range is (1, num. rows in dataset).
4.7.3 Sampling
The sampling option represents the type of the sampling process, which can be either random ordeterministic.
When using deterministic sampling the random-number generator will always use the same seed, pro-ducing repeatable results.
By default, BigML uses random sampling.
4.7.4 Replacement
The replacement option controls whether a single instance can be selected multiple times or not. Sam-pling without replacement ensures that each instance cannot be selected more than once.
By default, BigML generates samples without replacement.
4.7.5 Out of Bag
The out of bag option allows you to include in your sample only those instances that were not selectedin the first place, thus effectively inverting the sampling outcome. It is only selectable when a sample isdeterministic and the sample rate is less than 100%. The total percentage of instances included in yoursample will be one minus the rate (when replacement is not allowed). This can be useful for splitting adataset into training and testing subsets.
By default, BigML will not use out of bag instances.
4.8 Creating Clusters with Configured Options
After finishing the configuration of your options, you can change the default cluster name in the ed-itable text box. Then you can click on the Create cluster button to create the new cluster, or reset theconfiguration by clicking on the Reset button.
Copyright © 2022, BigML, Inc.

16 Chapter 4. Cluster Configuration Options
Figure 4.11: Create cluster after configuration
4.9 API Request Preview
The API Request Preview button is in the middle on the bottom of the configuration panel, next to
the Reset button (See (Figure 4.11)). This is to show how to create the cluster programmatically:the endpoint of the REST API call and the JSON that specifies the arguments configured in the panel.Please see (Figure 4.12) below:
Figure 4.12: Cluster API request preview
There are options on the upper right to either export the JSON or copy it to clipboard. On the bottomthere is a link to the API documentation for clusters, in case you need to check any of the possible valuesor want to extend your knowledge in the use of the API to automate your workflows.
Please note: when a default value for an argument is used in the chosen configuration, the argumentwon’t appear in the generated JSON. Because during API calls, default values are used when argumentsare missing, there is no need to send them in the creation request.
Copyright © 2022, BigML, Inc.

CHAPTER 5Visualizing Clusters
Being able to effectively visualize a model is of great help to understand how cluster groups relate oneanother. To this aim, BigML provides powerful interactive visualizations for clusters.
5.1 Cluster Visualization
BigML cluster visualization is available for all clusters. (See Figure 5.1.)
Figure 5.1: Clusters visualization
17

18 Chapter 5. Visualizing Clusters
It conveys a wealth of information through a natural representation of cluster groups:
• Each cluster is associated to a circle, a standard representation for clusters.
• Different cluster groups have different colors associated.
• The distances between clusters in the visualization is related to the actual distances. However, itis not strictly to scale, as to ensure that all clusters fit the screen. (See Figure 5.1.)
• When you mouse over a cluster, additional information will be displayed in a tooltip and in a datapanel on the right side.
The tooltip includes the cluster name, ID, and the number of instances that it comprises.
The data panel shows the distance histogram (see Subsection 5.1.1) for the data points com-prising that cluster as well as the centroid information Subsection 5.1.2). You can freeze the panelby pressing SHIFT; press ESCAPE to release the view.
If you click on the “Summary View” tab on the top right, the summary information of all the clusters willbe listed in the panel on the right side. (See Figure 5.2.)
Figure 5.2: Summary view for clusters
The summary information includes the cluster name, its distance histogram and its number of instances.There may be more clusters than what are shown in the right panel, but if you mouse over a cluster inthe diagram on the left, the panel will slide to show the corresponding cluster summary.
You can mouse over the cluster name bar to show its resource ID, or click on the pencil icon to edit thecluster name. In addition, you can mouse over a histogram to inspect its bins (ranges and instances),and mouse over the stats icon (sigma) to see the statistical summary of the instances in the cluster.
Copyright © 2022, BigML, Inc.

Chapter 5. Visualizing Clusters 19
5.1.1 Distance Histogram
The distance histogram represents the distribution of distances from the cluster’s center to each of thepoints that fall into the cluster’s neighborhood.
Figure 5.3: Distance histogram for clusters
5.1.2 Centroid
The cluster centroid is the center of the cluster. It is computed by using the mean for each numeric fieldand the mode for categorical ones.
Copyright © 2022, BigML, Inc.

20 Chapter 5. Visualizing Clusters
Figure 5.4: Centroid data inspector
For text and items fields, you will get a tag cloud where you can see the terms or items that minimize theaverage cosine distance between the centroid and the points in its neighborhood.
Copyright © 2022, BigML, Inc.

Chapter 5. Visualizing Clusters 21
Figure 5.5: Centroid tag cloud for text and items fields
5.1.3 Cluster Visualization with Images
When clusters have images, their visualization is the same as described in the previous sections of thischapter. Additionally, there are image previews in the data panel.
Copyright © 2022, BigML, Inc.

22 Chapter 5. Visualizing Clusters
Figure 5.6: Cluster view with images
As shown in Figure 5.6, in the cluster view, when users mouse-over a cluster, its information will bedisplayed in a tooltip, as well as in the data panel on the right side. The data panel not only includesthe distance histogram and the centroid information, it also presents a list of thumbnail images. Thethumbnail images serve as previews of the images and can be changed by using the reloading icon nextto them. Clicking on a thumbnail will bring up the close-up view of the image.
Copyright © 2022, BigML, Inc.

Chapter 5. Visualizing Clusters 23
Figure 5.7: Cluster summary view with images
In the summary view, as shown in Figure 5.7, the data panel includes the cluster name, its distancehistogram, its number of instances, as well as a list of thumbnail images as previews.
5.2 Creating a Dataset From a Cluster
Create a dataset from a cluster if you want to have all of the instances that belong to that cluster in adataset for further analysis.
To create a dataset from a cluster, select the cluster by clicking it, then press SHIFT, and click the dataseticon at the bottom of your cluster’s data panel.
Copyright © 2022, BigML, Inc.

24 Chapter 5. Visualizing Clusters
Figure 5.8: Create a dataset from a cluster
Copyright © 2022, BigML, Inc.

CHAPTER 6Cluster Summary Report
From a cluster’s detail view, access the cluster summary report by clicking on the icon highlighted inFigure 6.1.
Figure 6.1: Button to display a cluster’s summary report
The cluster summary report displays a summary about the cluster.
6.1 Cluster Summary
The cluster summary gives you a summarized view of your cluster, including the following metrics: datadistribution, cluster metrics, centroids, and intercentroid distance. (See Figure 6.2.)
• Data distribution: data distribution within the clusters: for each cluster, the percentage of datainstances that belong to that cluster is given. The “global” cluster always includes all of the datainstances, i.e. it accounts for 100% of them.
• Cluster metrics: a summary of the distances between the data instances expressed in terms ofvarious aggreagate measures:
– total_ss: the total sum of squares of the distances between each data instance and theglobal centroid;
– within_ss: the total sum of squares of the distances between each data instance and thecentroid it belongs to;
– between_ss: the total sum of squares of the distances between each centroid and the globalcentroid;
– ratio_ss: the ratio of between_ss and total_ss. This is a measure of how well your datainstances can be grouped into clusters.
• Centroids: general statistics for each of the idnetified clusters, including the global one.
• Intercentroid distance: distribution of distances between centroids.
25

26 Chapter 6. Cluster Summary Report
Figure 6.2: Cluster summary report
Copyright © 2022, BigML, Inc.

CHAPTER 7Cluster Predictions: Centroids
7.1 Introduction
The ultimate goal in building a BigML cluster is being able to make predictions for previously unseeninstances with an unknown label. Predictions for clusters are referred to as centroids, since they aimto identify the nearest centroid for new data. In BigML, you can make predictions with clusters basedon single instances or multiple instances in batch. Each prediction tells you which is the nearestcentroid to your input data along with the distance separating them.
The predictions tab in the main menu of your BigML Dashboard is where all of your saved centroids arelisted (see Figure 7.1.)
Figure 7.1: Empty Dashboard centroids view
Cluster predictions are saved under the CLUSTER ANALYSIS option in the menu. (See Figure 7.2.)
Figure 7.2: Menu options of the predictions list view
From this view you can select to view the list for your single instances centroits or your batch cen-troids by clicking the corresponding icons. (See Figure 7.3 and Figure 7.4.)
27

28 Chapter 7. Cluster Predictions: Centroids
Figure 7.3: Single predictions icon
Figure 7.4: Batch predictions icon
In the predictions list view, you can see, for each prediction, the Cluster icon used for the prediction,the Name of the prediction, the nearest Centroid predicted, the Distance from the specified input data,and the Age (time since the prediction was created). You can also search your predictions by name byclicking the SEARCH icon on the top right menu in Figure 7.1.
By default, when you first create an account at BigML, or every time that you start a new project, yourlist view for predictions will be empty. (See Figure 7.5.)
Figure 7.5: Empty Dashboard centroids view
Centroids are saved under the cluster icon in the menu options on the top left corner of the predictionslist view.
7.2 Predicting Centroids
As shown in Figure 7.6, BigML provides two options to create centroids from your cluster:
• CENTROID: to predict single instances.
• BATCH CENTROID: to predict multiple instances in batch.
Copyright © 2022, BigML, Inc.

Chapter 7. Cluster Predictions: Centroids 29
Figure 7.6: Centroid option from cluster pop up menu
7.2.1 Centroid
BigML allows you to quickly find the nearest centroid for single data instances by providing a formcontaining the fields used by the cluster, so you can easily set the input data and get an immediateresponse. This option is only available from the BigML Dashboard for clusters with less than 100 fields.If you want to make single instance predictions for clusters with a higher number of fields, you can usethe BigML API1.
Follow the steps detailed below to create a single prediction:
1. Choose the CENTROID option under the cluster 1-click menu (see Figure 7.7).
Figure 7.7: Predict option from cluster 1-click menu
Alternatively, click the CENTROID option in the pop up menu in the list view as shown in Figure 7.6.
2. You will be redirected to the prediction form where you will find all the fields used by the cluster.
1https://bigml.com/api/centroids
Copyright © 2022, BigML, Inc.

30 Chapter 7. Cluster Predictions: Centroids
Figure 7.8: Single predictions form
3. Set input values for the cluster fields. Depending on the field type, you will need to input thevalues differently:
• Numeric fields: move the slider or input a specific value in the edition box.
• Categorical fields: select one class from the selector.
• Text fields: write one or several terms in the free text box.
• Date-time fields: select the appropriate values from the selector.
• Items fields: when you write the first three characters of an item name, several items matchingthose characters will appear, so you can select the right one. You can input more than oneitem for a field.
4. Get the centroids along with the distance displayed on the top of the form. BigML predictions aresynchronous, i.e., when you send the input data you get an immediate response. Moreover, singlecentroids are calculated locally so when you configure the input data you can see how predictionschange immediately. (Read more about local predictions in Subsection 7.2.1.1).
Copyright © 2022, BigML, Inc.

Chapter 7. Cluster Predictions: Centroids 31
Figure 7.9: Single predictions view
5. Optionally, Save the prediction so you can get a view of the single clusters predictions (seeSubsection 7.4.1) and also to find it afterwards in the prediction list view.
Figure 7.10: Save single cluster predictions
7.2.1.1 Local Predictions
BigML provides local predictions from the BigML Dashboard for single instance predictions. Local pre-dictions allow you to get a real-time prediction without consuming any credits or requiring an internetconnection. This is possible because your cluster is saved in the browser’s memory so when the inputvalues change, BigML immediately calculates the nearest centroid in a matter of microseconds.
Copyright © 2022, BigML, Inc.

32 Chapter 7. Cluster Predictions: Centroids
7.2.1.2 Centroid with Images
BigML clusters can be trained from images using extracted image features (Section 2.4). Becauseimage features are automatically generated numeric fields, creating centroids with images is the sameas creating other centroids. The only thing different is input fields of images.
Note: When the input fields contain images, in order to create the centroid, BigML will extractimage features automatically to match what were used in the dataset to train the cluster.
Figure 7.11: Select a single image source in the image input field
The cluster in Figure 7.11, “butterfly-grape-horse”, was created from a dataset containing image featuresextracted from a pre-trained CNN, ResNet-18. Creating a centroid using the cluster will be directed tothe prediction form which presents all input fields used by the cluster. One of them is the image field.Because this is a single centroid, which is a single prediction, an image is input by using a single imagesource. Clicking on the input field box, single image sources available will be in the dropdown list. Thereis also a search box which can be used to locate specific ones.
Figure 7.12: List the components of a composite source
Oftentimes single image sources were used for creating a composite source, they become componentsources of the composite source. Or an image was uploaded as a part of an archive file (zip/tar) whichcreated a composite source. In those cases, the composite source will be shown in the dropdownlist, along with an icon “List components”. In the example in Figure 7.12, predict-images.zip is acomposite source, click on the icon to show its component sources.
Copyright © 2022, BigML, Inc.

Chapter 7. Cluster Predictions: Centroids 33
Figure 7.13: Select a component of a composite source
After the component sources of the composite are listed, scroll the dropdown list to find the desired one,then click to select it, as shown in Figure 7.13. There is also a search box to locate specific componentsources.
Figure 7.14: A centroid with images
After a new centroid is created, as shown in Figure 7.14, the predicted cluster is at the top of the formalong with its distance. The centroid interface is the same as ones created by non-image clusters.Everything described earlier in this section (Subsection 7.2.1) applies.
7.2.2 Batch Centroid
BigML batch centroids allow you to make predictions for multiple instances simultaneously. All you needis the cluster you want to use to make predictions and a dataset containing the instances for which youwant to calculate the nearest centroids. BigML will create a prediction for each instance in the dataset.Follow the steps detailed below to create a batch centroid:
1. Select the BATCH CENTROID option under the cluster 1-click menu (see Figure 7.15) or the CREATEBATCH CENTROID option from the pop up menu of the list view (see Figure 7.15).
Copyright © 2022, BigML, Inc.

34 Chapter 7. Cluster Predictions: Centroids
Figure 7.15: Batch centroid option from cluster 1-click menu
Figure 7.16: Batch centroid option from cluster pop up menu
2. Select the dataset containing all the instances you want to predict. The instances should containthe input values for all the fields used by the cluster. Remember that BigML batch centroids canhandle missing data in your prediction dataset only for categorical, text and items fields but not fornumeric fields (see Section 4.4). Instances with missing data for numeric fields will be ignored.
3. Optionally, select the cluster you want to use for the prediction. BigML pre-selects the clusteryou created the batch centroid from at step 1, but you can change it at any time in the batchcentroid view by selecting another cluster from the custer selector displayed in the right pane.
Copyright © 2022, BigML, Inc.

Chapter 7. Cluster Predictions: Centroids 35
Figure 7.17: Select dataset for batch predictions
4. Once the cluster and the dataset are selected, the batch centroid configuration options willappear along with a preview of the prediction output (a CSV file). The default format includesall your cluster fields and adds a last column with the cluster predictions.
Note: BigML does not include by default the calculated distance from the centroid, so youwill have to configure your output file to include that information. You can find a detailedexplanation of all configuration options in Section 7.3.
Figure 7.18: Configuration options displayed and output preview
5. By default, BigML generates an output dataset with your batch centroids that you can later find inyour datasets section in the BigML Dashboard. This dataset can be helpful to analyze your resultsafterwards. This option is active by default, but you can deactivate it by clicking in the icon shownin Figure 7.19
Copyright © 2022, BigML, Inc.

36 Chapter 7. Cluster Predictions: Centroids
Figure 7.19: Create dataset from batch predictions
6. Once you have your batch centroid configured, click in the green Centroid button to generateyour batch prediction.
Figure 7.20: Predicting batch centroids
Copyright © 2022, BigML, Inc.

Chapter 7. Cluster Predictions: Centroids 37
7. When the batch centroid is created, you will be able to download the CSV file containing all yourdataset instances along with a prediction for each one of them. (See Figure 7.21).
Figure 7.21: Download batch centroid output CSV file
8. If you didn’t disable the option to create a dataset, explained in step 4, you will also be able toaccess the output dataset from the batch centroid view.
Figure 7.22: View batch predictions output dataset
7.2.2.1 Batch Centroid with Images
BigML clusters can be trained from images using extracted image features (Section 2.4). The input of abatch centroid is a dataset. So when creating a batch centroid with images, the dataset has to have thesame image features used to train the cluster. The image features are in the dataset used to create thecluster.
Copyright © 2022, BigML, Inc.
38 Chapter 7. Cluster Predictions: Centroids
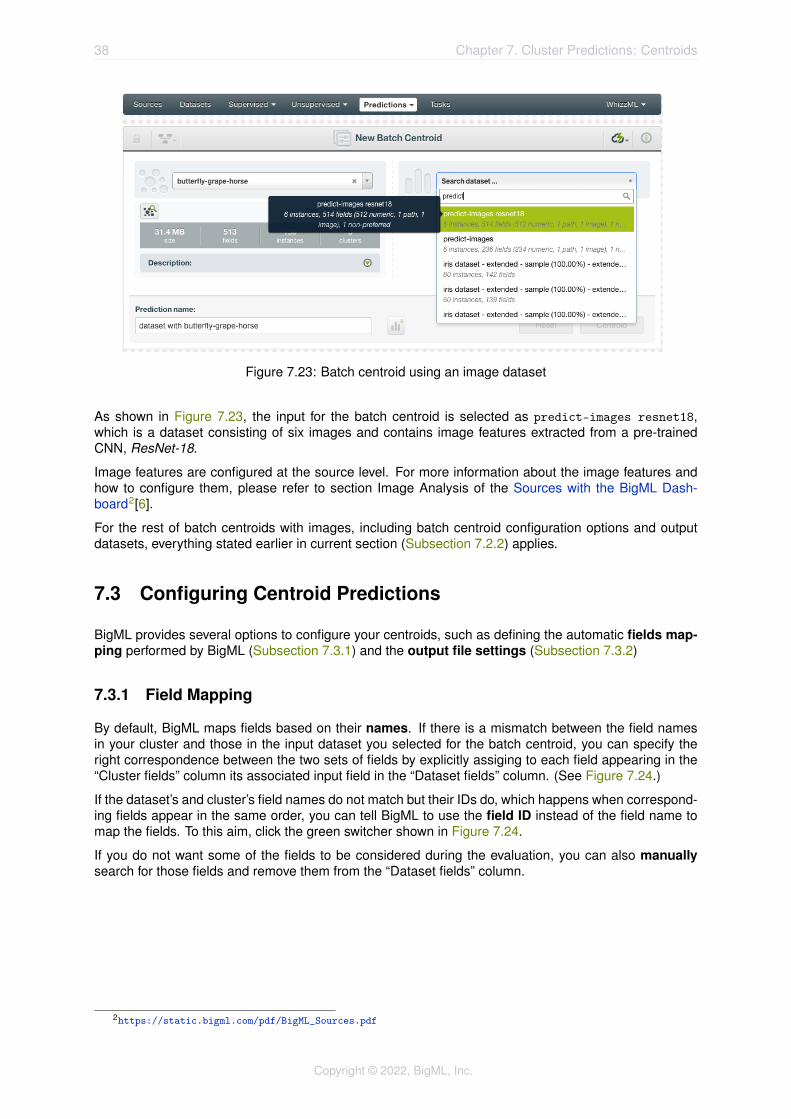
Figure 7.23: Batch centroid using an image dataset
As shown in Figure 7.23, the input for the batch centroid is selected as predict-images resnet18,which is a dataset consisting of six images and contains image features extracted from a pre-trainedCNN, ResNet-18.
Image features are configured at the source level. For more information about the image features andhow to configure them, please refer to section Image Analysis of the Sources with the BigML Dash-board2[6].
For the rest of batch centroids with images, including batch centroid configuration options and outputdatasets, everything stated earlier in current section (Subsection 7.2.2) applies.
7.3 Configuring Centroid Predictions
BigML provides several options to configure your centroids, such as defining the automatic fields map-ping performed by BigML (Subsection 7.3.1) and the output file settings (Subsection 7.3.2)
7.3.1 Field Mapping
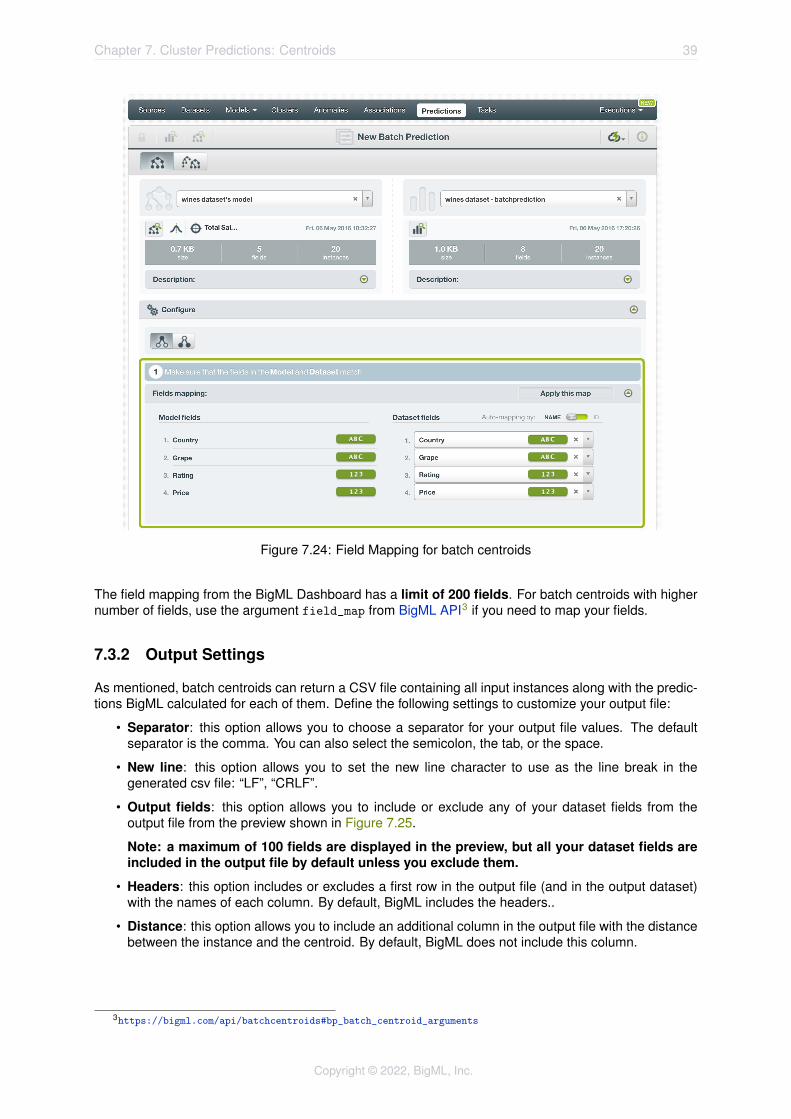
By default, BigML maps fields based on their names. If there is a mismatch between the field namesin your cluster and those in the input dataset you selected for the batch centroid, you can specify theright correspondence between the two sets of fields by explicitly assiging to each field appearing in the“Cluster fields” column its associated input field in the “Dataset fields” column. (See Figure 7.24.)
If the dataset’s and cluster’s field names do not match but their IDs do, which happens when correspond-ing fields appear in the same order, you can tell BigML to use the field ID instead of the field name tomap the fields. To this aim, click the green switcher shown in Figure 7.24.
If you do not want some of the fields to be considered during the evaluation, you can also manuallysearch for those fields and remove them from the “Dataset fields” column.
2https://static.bigml.com/pdf/BigML_Sources.pdf
Copyright © 2022, BigML, Inc.
Chapter 7. Cluster Predictions: Centroids 39
Figure 7.24: Field Mapping for batch centroids
The field mapping from the BigML Dashboard has a limit of 200 fields. For batch centroids with highernumber of fields, use the argument field_map from BigML API3 if you need to map your fields.
7.3.2 Output Settings
As mentioned, batch centroids can return a CSV file containing all input instances along with the predic-tions BigML calculated for each of them. Define the following settings to customize your output file:
• Separator: this option allows you to choose a separator for your output file values. The defaultseparator is the comma. You can also select the semicolon, the tab, or the space.
• New line: this option allows you to set the new line character to use as the line break in thegenerated csv file: “LF”, “CRLF”.
• Output fields: this option allows you to include or exclude any of your dataset fields from theoutput file from the preview shown in Figure 7.25.
Note: a maximum of 100 fields are displayed in the preview, but all your dataset fields areincluded in the output file by default unless you exclude them.
• Headers: this option includes or excludes a first row in the output file (and in the output dataset)with the names of each column. By default, BigML includes the headers..
• Distance: this option allows you to include an additional column in the output file with the distancebetween the instance and the centroid. By default, BigML does not include this column.
3https://bigml.com/api/batchcentroids#bp_batch_centroid_arguments
Copyright © 2022, BigML, Inc.

40 Chapter 7. Cluster Predictions: Centroids
• Centroid column name: this option allows you to customize the name for the distance column.By default BigML uses “distance”.
Figure 7.25: Output settings for batch centroids
7.4 Visualizing Cluster Predictions
Centroid visualization changes depending on whether you are predicting one single instance CENTROIDor multiple instances using the BATCH CENTROID option (see Subsection 7.4.1).
7.4.1 Single Centroid
For single instance predictions, you can find the nearest centroid at the top of the form along with itsdistance from the input data. (See Figure 7.26.) You can change the value of the displayed input fieldsany time to have your prediction recalculated in real time.
Copyright © 2022, BigML, Inc.

Chapter 7. Cluster Predictions: Centroids 41
Figure 7.26: Single predictions view
7.4.2 Batch Predictions
For batch centroids, you always get a CSV file and an optional output dataset.
7.4.2.1 Output CSV File
From the batch centroid view, you can access the CSV file containing your predictions for each of yourdataset instances in the last column (see Figure 7.27.)
Figure 7.27: Download batch centroid output CSV file
You can configure several options to customize your CSV file including the separator for the columns,the name of your centroid and distance column, the dataset fields you want to include, and whether
Copyright © 2022, BigML, Inc.

42 Chapter 7. Cluster Predictions: Centroids
you want to include the headers for your fields. You can find a detailed explanation of those options inSubsection 7.3.2.
Note: by default, BigML does not include the centroid distance in your output file. Click therelevant option from the output settings panel if you want to include it.
See an output CSV file example in Figure 7.28 where the two last columns contain the cluster and thedistance for each instance.
Pregnancies,Glucose,Blood pressure,BMI,Age,cluster,distance
3,78,50,32,26,Cluster 3,0.40608
7,100,0,0,30,32,Cluster 6,0.35249 1,103,30,38,33,Cluster 3,0.53011
1,97,66,15,17,22,Cluster 5,0.24655 5,117,92,0,38,Cluster 2,0.25536
10,122,78,31,45,Cluster 1,0.36629 11,138,76,0,35,Cluster 2,0.37024
3,180,64,25,26,Cluster 3,0.52466 7,133,84,0,37,Cluster 2,0.36563
Figure 7.28: An example of a batch centroid CSV file
7.4.2.2 Output Dataset
By default BigML automatically creates a dataset out of your batch centroid. (See Subsection 7.3.2.)You can access your output dataset from the batch centroid view as shown in Figure 7.30.
Figure 7.29: View batch centroid output dataset
In the output dataset you can find an additional field (named by default “cluster”) containing the nearestcentroid for each one of your instances. If you configured your batch centroid to include the distanceyou will be able to find it in the last field of your output dataset as shown in Figure 7.30.
Copyright © 2022, BigML, Inc.

Chapter 7. Cluster Predictions: Centroids 43
Figure 7.30: Batch centroid output dataset
7.4.2.3 Batch Centroid 1-Click Actions
From the batch centroid view you can perform the following actions shown in Figure 7.31
• BATCH CENTROID AGAIN: this option will redirect you to the batch centroid creation view where youwill have the same cluster and prediction dataset already selected. This option will rapidly createthe batch centroid using a different configuration.
• BATCH CENTROID WITH ANOTHER DATASET: this option is an easy way to create a batch centroidusing the same cluster and a different dataset.
• BATCH CENTROID USING ANOTHER CLUSTER: this option will easily create a batch centroid usingthe same dataset and a different cluster.
• NEW BATCH CENTROID: this option will redirect you to the batch centroid creation view where youcan select a prediction dataset and a cluster to create your batch centroid.
Copyright © 2022, BigML, Inc.

44 Chapter 7. Cluster Predictions: Centroids
Figure 7.31: Batch centroid 1-click actions
7.5 Consuming BigML Centroids Programmatically
BigML provides plenty of means for developers to integrate BigML centroids within their apps. In thefollowing sections, we will describe how you can use BigML REST API and BigML Python bindings towork with centroids.
7.5.1 Using Centroids Via the BigML API
Centroids have full citizenship in the BigML API. This means you can programmatically create, update,list, and delete them. For example, this is how you can create a single centroid using the commandline from a given cluster and defining the input data. This will require properly setting the BIGML_AUTHenvironment variable to contain your authentication credentials:
curl "https://bigml.io/centroid?$BIGML_AUTH" \-X POST \-H 'content-type: application/json' \-d '{"cluster": "cluster/50650bdf3c19201b64000020",
"input_data": {"000001": 3, "000002":4.5, "000003": "2.2"}}}'
For more information on using centroids through the BigML API, please refer to centroid REST APIdocumentation.
7.5.2 Using Centroids Via BigML Bindings
BigML bindings provide a convenient way to access BigML REST API from your language of choice.They offer a higher-level view of BigML Machine Learning resources and algorithms in a number oflanguages, including Python, Node.js, Java, Swift, and Objective-C. For example, this is how you cancreate a centroid in Python using BigML bindings:
from bigml.api import BigMLapi = BigML()centroid = api.create_centroid("cluster/573d997058a27e0f620038df",
{"first field": 5,
Copyright © 2022, BigML, Inc.
Chapter 7. Cluster Predictions: Centroids 45
"second field": 2.5},{"name": "my centroid"})
BigML bindings also provide the means to calculate the nearest centroid locally, without ever hitting thenetwork, which can greatly improve the latency of predicting from your apps. This is made possible byBigML clusters being white-box, meaning you can download and use them independently from BigML.For example, the following code snippet shows how you can download a cluster and use it for making alocal prediction using BigML bindings for Python:
from bigml.cluster import Modelfrom bigml.api import BigMLapi = BigML()cluster = api.get_cluster("cluster/502fdbff15526876610002615",
query_string="only_model=true;limit=-1")
local_cluster = Cluster(cluster)centroid = local_cluster.centroid({"first field": 3, "second field": 1})
For more information on using centroids through the BigML API, please refer to BigML bindings docu-mentation.
7.6 Descriptive Information
Descriptive information is what allows you to describe a centroid so you can find it later and easilyrecognize it among other centroids.
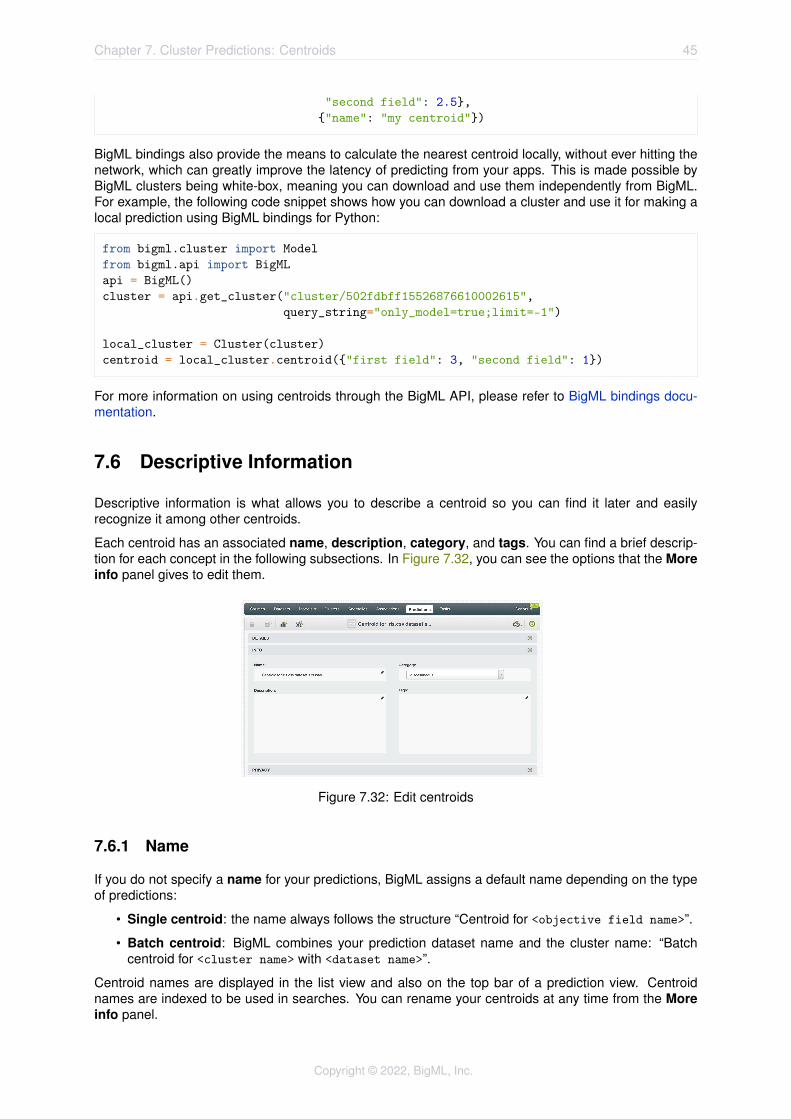
Each centroid has an associated name, description, category, and tags. You can find a brief descrip-tion for each concept in the following subsections. In Figure 7.32, you can see the options that the Moreinfo panel gives to edit them.
Figure 7.32: Edit centroids
7.6.1 Name
If you do not specify a name for your predictions, BigML assigns a default name depending on the typeof predictions:
• Single centroid: the name always follows the structure “Centroid for <objective field name>”.
• Batch centroid: BigML combines your prediction dataset name and the cluster name: “Batchcentroid for <cluster name> with <dataset name>”.
Centroid names are displayed in the list view and also on the top bar of a prediction view. Centroidnames are indexed to be used in searches. You can rename your centroids at any time from the Moreinfo panel.
Copyright © 2022, BigML, Inc.

46 Chapter 7. Cluster Predictions: Centroids
The name of a centroid cannot be longer than 256 characters. There is no restriction on the charactersthat can be used in a name. More than one centroids can have the same name even within the sameproject, since they are automatically assigned unique internal identifiers.
7.6.2 Description
Each cluster prediction also has a description that it is very useful for documenting your MachineLearning projects. Centroids take the description from the clusters used to create them.
Descriptions can be written using plain text and also markdown4. BigML provides a simple markdowneditor that accepts a subset of markdown syntax. (See Figure 7.33.)
Figure 7.33: Markdown editor for centroids descriptions
Descriptions cannot be longer than 8192 characters and can use almost any character.
7.6.3 Category
Each prediction has associated a category taken from cluster used to create it. Categories are usefulto classify predictions according to the domain which your data comes from. This is useful when youuse BigML to solve problems across industries or multiple customers.
A prediction category must be one of the categories listed on table Table 7.1.
4https://en.wikipedia.org/wiki/Markdown
Copyright © 2022, BigML, Inc.

Chapter 7. Cluster Predictions: Centroids 47
Table 7.1: Categories used to classify predictions by BigML
Category
Aerospace and Defense
Automotive, Engineering and Manufacturing
Banking and Finance
Chemical and Pharmaceutical
Consumer and Retail
Demographics and Surveys
Energy, Oil and Gas
Fraud and Crime
Healthcare
Higher Education and Scientific Research
Human Resources and Psychology
Insurance
Law and Order
Media, Marketing and Advertising
Miscellaneous
Physical, Earth and Life Sciences
Professional Services
Public Sector and Nonprofit
Sports and Games
Technology and Communications
Transportation and Logistics
Travel and Leisure
Uncategorized
Utilities
7.6.4 Tags
A prediction can also have a number of tags associated with it that can help to retrieve it via the BigMLAPI or to provide predictions with some extra information. Your prediction inherits the tags from thecluster use to create it. Each tag is limited to a maximum of 128 characters. Each prediction can haveup to 32 different tags.
7.7 Cluster Predictions Privacy
The link displayed in the privacy panel is the private URL of your centroid, so only a user logged into youraccount is able to see it. Neither single nor batch centroids can be shared from your BigML Dashboardby sharing a link, as you can do with other resources.
Copyright © 2022, BigML, Inc.

48 Chapter 7. Cluster Predictions: Centroids
Figure 7.34: Private link of a prediction
7.8 Moving Centroids
When you create a cluster prediction, it will be assigned to the same project where the original clusteris located. You cannot move predictions between projects as you do with other resources.
7.9 Stopping Centroids
Single centroids are synchronous resources, so you cannot cancel them during the creation since youget the result immediately.
Batch centroids are asynchronous resources, so you can stop the creation before the task is finished.You can use the DELETE option from the 1-click action menu (Figure 7.35) or from the pop up menu onthe clusters list view. If you stop the prediction during its creation, you won’t be able to resume the sametask again, so if you want to create the same prediction, you will have to start a new task.
Figure 7.35: Stop prediction from the 1-click menu
7.10 Deleting Centroids
You can DELETE your single or batch centroids from the predictions view, using the 1-click action menu(see Figure 7.36) or using the pop up menu on the predictions list view (see Figure 7.37).
Copyright © 2022, BigML, Inc.

Chapter 7. Cluster Predictions: Centroids 49
Figure 7.36: Delete prediction from the 1-click menu
Figure 7.37: Delete prediction from popu up menu
A modal window will be displayed asking you for confirmation. Once a prediction is deleted, it is perma-nently deleted and there is no way you (or even the IT folks at BigML) can retrieve it.
Figure 7.38: Delete prediction confirmation
Copyright © 2022, BigML, Inc.

CHAPTER 8Consuming Clusters
In the previous sections, we have described how you can create clusters, configure them, use them tomake predictions, and more. This section will introduce a number of BigML features that enable powerfulways of taking advantages of BigML clusters: exporting them locally, and using them programmaticallyvia the BigML REST API and BigML Python bindings.
8.1 Exporting and Downloading Clusters
You can download your cluster in several languages including Python, JSON PML or Node.js. Click onthe downloading icon in the top menu, and select your preferred language.
By downloading your cluster, you will be able to compute centroids locally, free of latency and at no cost.It works the same way as local predictions for clusters and ensembles.
Figure 8.1: Download your cluster
8.2 Updating Clusters
Change the names of your individual clusters by clicking on the edit icon next to each cluster’s name.
50

Chapter 8. Consuming Clusters 51
Figure 8.2: Edit a cluster name
8.3 Using Clusters Via the BigML API
Clusters have full citizenship in the BigML API. This means you can programmatically create, update,list, delete, and use them for predictions. For example, this is how you can create a cluster from thecommand line with custom values for a few available arguments. This will require you have properly setthe BIGML_AUTH environment variable to contain your authentication credentials:
curl "https://bigml.io/cluster?$BIGML_AUTH" \-X POST \-H 'content-type: application/json' \-d '{"dataset": "dataset/4f66a80803ce8940c5000006",
"name": "my model","range": [25, 125]}'
For more information on using clusters through the BigML API, please refer to cluster REST API docu-mentation.
8.4 Using Clusters Via the BigML Bindings
BigML bindings provide a convenient way to access the BigML REST API from your language of choice.They offer a higher-level view of BigML Machine Learning resources and algorithms in a number oflanguages, including Python, Node.js, Java, Swift, and Objective-C. For example, this is how you cancreate a cluster in Python using BigML bindings:
from bigml.api import BigMLapi = BigML()prediction = api.create_cluster("dataset/573d997058a27e0f620038df",
"range": [1, 10],{"name": "my cluster"})
For more information on using clusters through the BigML API, please refer to BigML bindings docu-mentation.
Copyright © 2022, BigML, Inc.

CHAPTER 9Clusters Limits
BigML imposes a few limits to the characteristics of a cluster:
• K-means: BigML K-means can handle up to 300 cluster groups.
• G-means: BigML G-means can handle up to 128 cluster groups.
• Histogram & planets: You can use the histogram & planets visualization for clusters if your datasetcontains less than 8 numeric fields and no other categorical or text data.
52

CHAPTER 10Cluster Descriptive Information
Each cluster has an associated name, description, category, and tags. A brief description follows foreach concept. In Figure 10.1, you can see the options the More info panel provides to edit them.
Figure 10.1: Panel to edit a cluster’s name, category, description, and tags
10.1 Cluster Name
Each cluster has an associated name that is displayed on the list view and also on the top bar of acluster view. Cluster names are indexed to be used in searches. When you create a cluster, by default,it gets the name of the dataset that you used to create it. You can edit it using the MORE INFO menuoption on the right corner of the cluster view (see Figure 10.1). The name of a cluster cannot be longerthan 256 characters. There is no restriction on the characters that can be used in a cluster name. Morethan one cluster can have the same name even within the same project, since they are automaticallyassigned unique internal identifiers.
53

54 Chapter 10. Cluster Descriptive Information
10.2 Description
Each cluster inherits the description of the dataset used to create it. Descriptions can be very usefulfor documenting your Machine Learning projects. Descriptions can be written using plain text and alsomarkdown1. BigML provides a simple markdown editor that accepts a subset of markdown syntax. (SeeFigure 10.2.)
Figure 10.2: Markdown editor for cluster descriptions
Descriptions cannot be longer than 8192 characters and can use almost any character.
10.3 Category
Each cluster takes the category from the dataset used to create it. Categories are useful to classifyclusters according to the domain which your data comes from. This is useful when you use BigML tosolve problems across industries or multiple customers.
A cluster category must be one of the 24 categories listed in table Table 10.1.
1https://en.wikipedia.org/wiki/Markdown
Copyright © 2022, BigML, Inc.

Chapter 10. Cluster Descriptive Information 55
Table 10.1: Categories used to classify clusters by BigML
Category
Aerospace and Defense
Automotive, Engineering and Manufacturing
Banking and Finance
Chemical and Pharmaceutical
Consumer and Retail
Demographics and Surveys
Energy, Oil and Gas
Fraud and Crime
Healthcare
Higher Education and Scientific Research
Human Resources and Psychology
Insurance
Law and Order
Media, Marketing and Advertising
Miscellaneous
Physical, Earth and Life Sciences
Professional Services
Public Sector and Nonprofit
Sports and Games
Technology and Communications
Transportation and Logistics
Travel and Leisure
Uncategorized
Utilities
10.4 Tags
A cluster can also have a number of tags associated with it that can help to retrieve it via the BigML APIor to provide clusters with some extra information. Clusters inherit the tags of the dataset used to createthem.
Each tag is limited to a maximum of 128 characters. Each cluster can have up to 32 different tags.
10.5 Counters
For each cluster, BigML also stores counters to track the number of other resources that have beencreated using that cluster as a starting point. In the cluster view, you can see a menu option thatdisplays these counters. It also allows you to quickly jump to all the resources of one type that havebeen created with this cluster as shown in Figure 10.3.
Figure 10.3: Menu option to quickly access to resources created with a cluster
Copyright © 2022, BigML, Inc.
CHAPTER 11Clusters Privacy
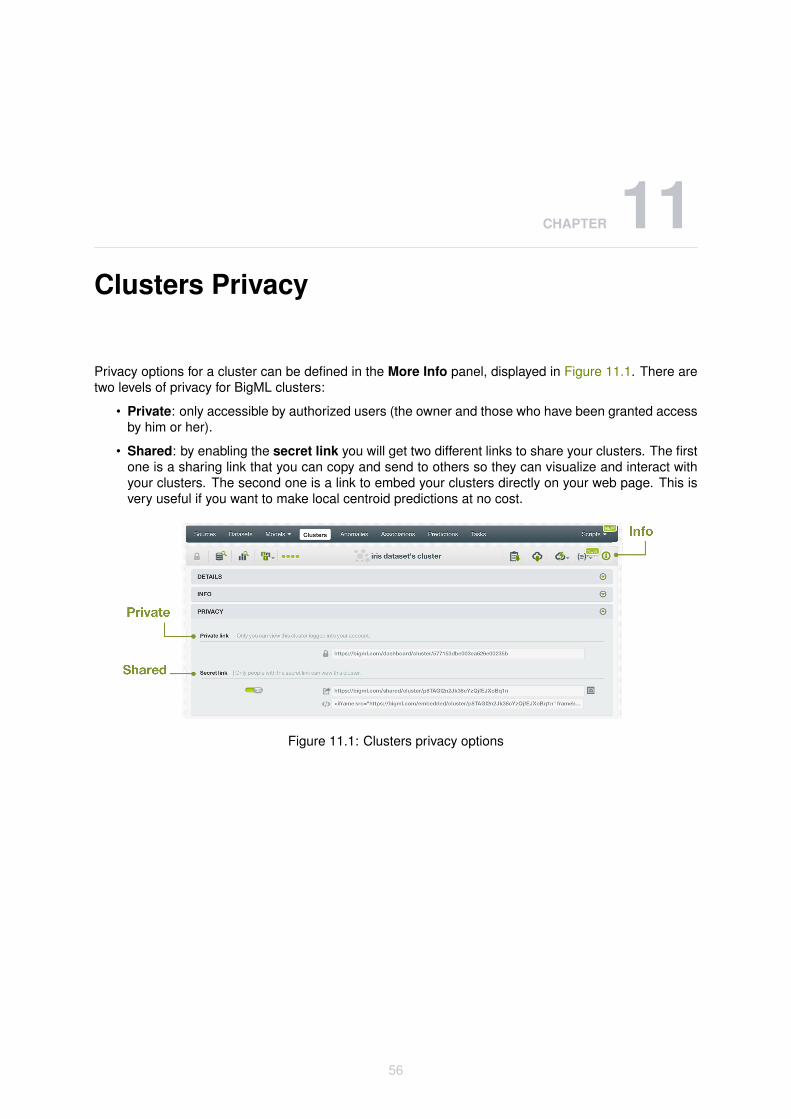
Privacy options for a cluster can be defined in the More Info panel, displayed in Figure 11.1. There aretwo levels of privacy for BigML clusters:
• Private: only accessible by authorized users (the owner and those who have been granted accessby him or her).
• Shared: by enabling the secret link you will get two different links to share your clusters. The firstone is a sharing link that you can copy and send to others so they can visualize and interact withyour clusters. The second one is a link to embed your clusters directly on your web page. This isvery useful if you want to make local centroid predictions at no cost.
Figure 11.1: Clusters privacy options
56

CHAPTER 12Moving Clusters to Another Project
Clusters will be assigned to the same project as the dataset used to create them belongs to. However,you can move clusters between projects. The menu option to do this can be found in two places:
1. In the cluster detail view, among the 1-click actions for each cluster. (See Figure 12.1).
Figure 12.1: Menu option to move clusters
2. In the cluster list view, within the pop up menu (see Figure 12.2).
57
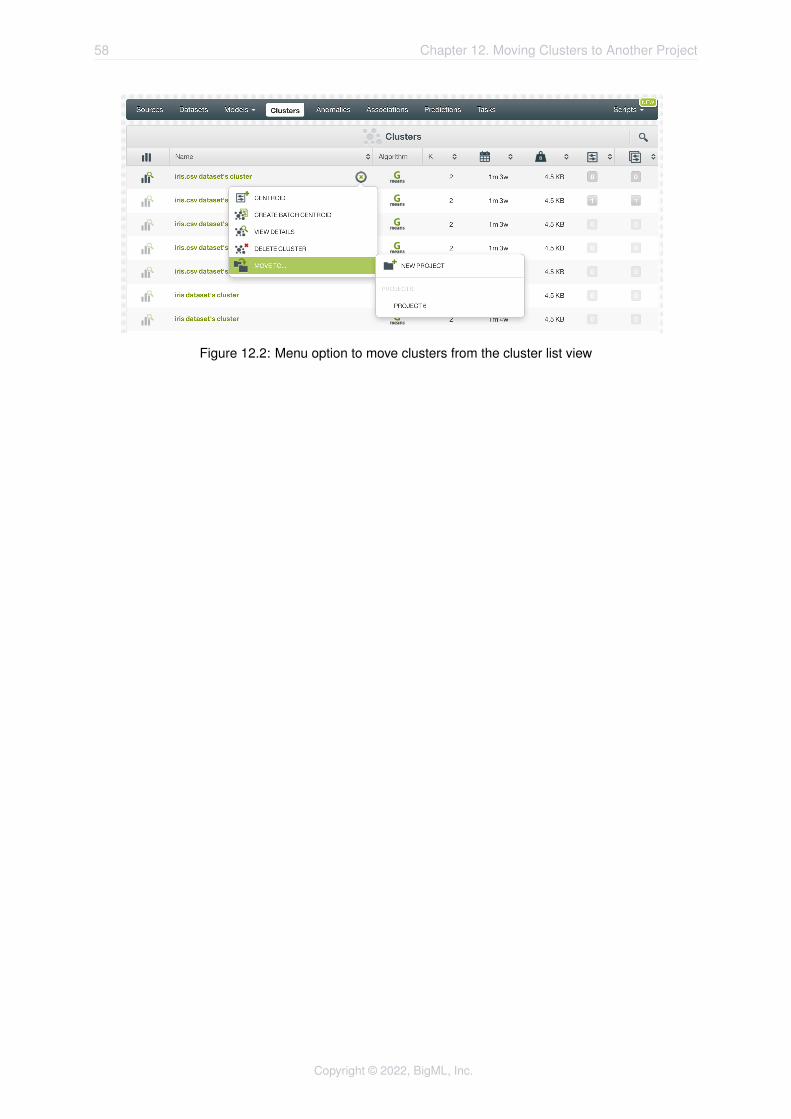
58 Chapter 12. Moving Clusters to Another Project
Figure 12.2: Menu option to move clusters from the cluster list view
Copyright © 2022, BigML, Inc.

CHAPTER 13Stopping Cluster Creation
You can also stop a cluster’s creation process, while BigML is not yet done with it, from the 1-click actionsmenu (Figure 13.1).
Figure 13.1: Menu option to stop a cluster’s creation
A modal window (Figure 13.2) will be displayed asking you for confirmation.
Figure 13.2: Menu option to stop a cluster’s creation
59

CHAPTER 14Deleting Clusters
You can delete your clusters in two ways:
• From the cluster view, using the 1-click action menu. (See Figure 14.1.)
Figure 14.1: Menu option to delete a cluster
• Using the pop up menu on the cluster list. (See Figure 14.2.)
60

Chapter 14. Deleting Clusters 61
Figure 14.2: Cluster deletion pop up menu option
A modal window (see Figure 14.3) will be displayed asking you for confirmation. Once you delete acluster, it is deleted permanently and there is no way you (or even the IT folks at BigML) can retrieve it.
Figure 14.3: Cluster deletion modal window
Copyright © 2022, BigML, Inc.

CHAPTER 15Takeaways
This document covered clusters in detail. We conclude it with a list of key points:
• BigML Clusters can learn how your data instances group together based on their similarity.
• Each cluster group is represented by its center, called centroid.
• To build a cluster you just need a dataset. (See Figure 15.1).
• A cluster can be an input to a prediction, to a batch prediction, to a dataset, or to a BigML model.(See Figure 15.1).
• Create centroids or batch centroids from a cluster to know to which instance group previouslyunseen data instances belong.
• You can also create clusters using BigML REST API or the BigML bindings for your language ofchoice.
• Create a BigML model or a dataset from a cluster to further analyze the instances that belong toany given group of instances discovered by training the cluster. For example, a BigML model mayhelp you identify which fields are more relevant in determining whether a data instance should beconsidered member of a cluster group.
• Numeric fields are automatically scaled to prevent their different magnitudes from biasing the cal-culation.
• BigML provides two different methods to do the clustering: K-means and G-means. Use G-meanswhen you do not know how many cluster groups can be found.
• When you create a BigML Cluster from a dataset, you can define a number of options, such as thenumber K of clusters (K-means) or the critical value (G-means), field scaling and weighting, andsampling.
• BigML visualizes clusters through circles of different colors that represent found centroids. Eachcircle is sized according to the number of instances that belong to the corresponding cluster group.
• You can use BigML Clusters to calculate the nearest centroid to a given data instance or to anumber of instances.
• You can download clusters in several languages, including Python, JSON PML, and Node.js, touse for local computation.
• At any time you can update a cluster’s descriptive information, move a cluster to a different project,rename it, or delete it permanently.
62

Chapter 15. Takeaways 63
Figure 15.1: Cluster Workflows
Copyright © 2022, BigML, Inc.

List of Figures
1.1 Clusters list view . . . . . . . . . . . . . . . . . . . . . . . . . . . . . . . . . . . . . . . . . 21.2 Empty Dashboard cluster view . . . . . . . . . . . . . . . . . . . . . . . . . . . . . . . . . 21.3 Cluster icon . . . . . . . . . . . . . . . . . . . . . . . . . . . . . . . . . . . . . . . . . . . . 2
2.1 A dataset with images and image features . . . . . . . . . . . . . . . . . . . . . . . . . . . 52.2 A dataset with image feature fields shown . . . . . . . . . . . . . . . . . . . . . . . . . . . 5
3.1 1-click cluster . . . . . . . . . . . . . . . . . . . . . . . . . . . . . . . . . . . . . . . . . . . 63.2 Pop up menu option to create a 1-click cluster from list view . . . . . . . . . . . . . . . . . 6
4.1 Configure permanent parameter modal . . . . . . . . . . . . . . . . . . . . . . . . . . . . 94.2 Configure cluster . . . . . . . . . . . . . . . . . . . . . . . . . . . . . . . . . . . . . . . . . 94.3 Cluster options: clustering algorithm . . . . . . . . . . . . . . . . . . . . . . . . . . . . . . 104.4 Number of clusters . . . . . . . . . . . . . . . . . . . . . . . . . . . . . . . . . . . . . . . . 114.5 Critical value options . . . . . . . . . . . . . . . . . . . . . . . . . . . . . . . . . . . . . . . 114.6 Cluster options: default numeric value . . . . . . . . . . . . . . . . . . . . . . . . . . . . . 114.7 Example of a centroid with missing values for some categorical fields . . . . . . . . . . . . 124.8 Cluster options: field scaling . . . . . . . . . . . . . . . . . . . . . . . . . . . . . . . . . . . 134.9 Cluster options: weight field . . . . . . . . . . . . . . . . . . . . . . . . . . . . . . . . . . . 134.10 Sampling options for clusters . . . . . . . . . . . . . . . . . . . . . . . . . . . . . . . . . . 144.11 Create cluster after configuration . . . . . . . . . . . . . . . . . . . . . . . . . . . . . . . . 164.12 Cluster API request preview . . . . . . . . . . . . . . . . . . . . . . . . . . . . . . . . . . . 16
5.1 Clusters visualization . . . . . . . . . . . . . . . . . . . . . . . . . . . . . . . . . . . . . . . 175.2 Summary view for clusters . . . . . . . . . . . . . . . . . . . . . . . . . . . . . . . . . . . . 185.3 Distance histogram for clusters . . . . . . . . . . . . . . . . . . . . . . . . . . . . . . . . . 195.4 Centroid data inspector . . . . . . . . . . . . . . . . . . . . . . . . . . . . . . . . . . . . . 205.5 Centroid tag cloud for text and items fields . . . . . . . . . . . . . . . . . . . . . . . . . . . 215.6 Cluster view with images . . . . . . . . . . . . . . . . . . . . . . . . . . . . . . . . . . . . 225.7 Cluster summary view with images . . . . . . . . . . . . . . . . . . . . . . . . . . . . . . . 235.8 Create a dataset from a cluster . . . . . . . . . . . . . . . . . . . . . . . . . . . . . . . . . 24
6.1 Button to display a cluster’s summary report . . . . . . . . . . . . . . . . . . . . . . . . . 256.2 Cluster summary report . . . . . . . . . . . . . . . . . . . . . . . . . . . . . . . . . . . . . 26
7.1 Empty Dashboard centroids view . . . . . . . . . . . . . . . . . . . . . . . . . . . . . . . . 277.2 Menu options of the predictions list view . . . . . . . . . . . . . . . . . . . . . . . . . . . . 277.3 Single predictions icon . . . . . . . . . . . . . . . . . . . . . . . . . . . . . . . . . . . . . . 287.4 Batch predictions icon . . . . . . . . . . . . . . . . . . . . . . . . . . . . . . . . . . . . . . 287.5 Empty Dashboard centroids view . . . . . . . . . . . . . . . . . . . . . . . . . . . . . . . . 287.6 Centroid option from cluster pop up menu . . . . . . . . . . . . . . . . . . . . . . . . . . . 297.7 Predict option from cluster 1-click menu . . . . . . . . . . . . . . . . . . . . . . . . . . . . 297.8 Single predictions form . . . . . . . . . . . . . . . . . . . . . . . . . . . . . . . . . . . . . . 30
64

LIST OF FIGURES 65
7.9 Single predictions view . . . . . . . . . . . . . . . . . . . . . . . . . . . . . . . . . . . . . . 317.10 Save single cluster predictions . . . . . . . . . . . . . . . . . . . . . . . . . . . . . . . . . 317.11 Select a single image source in the image input field . . . . . . . . . . . . . . . . . . . . . 327.12 List the components of a composite source . . . . . . . . . . . . . . . . . . . . . . . . . . 327.13 Select a component of a composite source . . . . . . . . . . . . . . . . . . . . . . . . . . 337.14 A centroid with images . . . . . . . . . . . . . . . . . . . . . . . . . . . . . . . . . . . . . . 337.15 Batch centroid option from cluster 1-click menu . . . . . . . . . . . . . . . . . . . . . . . . 347.16 Batch centroid option from cluster pop up menu . . . . . . . . . . . . . . . . . . . . . . . . 347.17 Select dataset for batch predictions . . . . . . . . . . . . . . . . . . . . . . . . . . . . . . . 357.18 Configuration options displayed and output preview . . . . . . . . . . . . . . . . . . . . . . 357.19 Create dataset from batch predictions . . . . . . . . . . . . . . . . . . . . . . . . . . . . . 367.20 Predicting batch centroids . . . . . . . . . . . . . . . . . . . . . . . . . . . . . . . . . . . . 367.21 Download batch centroid output CSV file . . . . . . . . . . . . . . . . . . . . . . . . . . . . 377.22 View batch predictions output dataset . . . . . . . . . . . . . . . . . . . . . . . . . . . . . 377.23 Batch centroid using an image dataset . . . . . . . . . . . . . . . . . . . . . . . . . . . . . 387.24 Field Mapping for batch centroids . . . . . . . . . . . . . . . . . . . . . . . . . . . . . . . . 397.25 Output settings for batch centroids . . . . . . . . . . . . . . . . . . . . . . . . . . . . . . . 407.26 Single predictions view . . . . . . . . . . . . . . . . . . . . . . . . . . . . . . . . . . . . . . 417.27 Download batch centroid output CSV file . . . . . . . . . . . . . . . . . . . . . . . . . . . . 417.28 An example of a batch centroid CSV file . . . . . . . . . . . . . . . . . . . . . . . . . . . . 427.29 View batch centroid output dataset . . . . . . . . . . . . . . . . . . . . . . . . . . . . . . . 427.30 Batch centroid output dataset . . . . . . . . . . . . . . . . . . . . . . . . . . . . . . . . . . 437.31 Batch centroid 1-click actions . . . . . . . . . . . . . . . . . . . . . . . . . . . . . . . . . . 447.32 Edit centroids . . . . . . . . . . . . . . . . . . . . . . . . . . . . . . . . . . . . . . . . . . . 457.33 Markdown editor for centroids descriptions . . . . . . . . . . . . . . . . . . . . . . . . . . 467.34 Private link of a prediction . . . . . . . . . . . . . . . . . . . . . . . . . . . . . . . . . . . . 487.35 Stop prediction from the 1-click menu . . . . . . . . . . . . . . . . . . . . . . . . . . . . . 487.36 Delete prediction from the 1-click menu . . . . . . . . . . . . . . . . . . . . . . . . . . . . 497.37 Delete prediction from popu up menu . . . . . . . . . . . . . . . . . . . . . . . . . . . . . 497.38 Delete prediction confirmation . . . . . . . . . . . . . . . . . . . . . . . . . . . . . . . . . . 49
8.1 Download your cluster . . . . . . . . . . . . . . . . . . . . . . . . . . . . . . . . . . . . . . 508.2 Edit a cluster name . . . . . . . . . . . . . . . . . . . . . . . . . . . . . . . . . . . . . . . . 51
10.1 Panel to edit a cluster’s name, category, description, and tags . . . . . . . . . . . . . . . . 5310.2 Markdown editor for cluster descriptions . . . . . . . . . . . . . . . . . . . . . . . . . . . . 5410.3 Menu option to quickly access to resources created with a cluster . . . . . . . . . . . . . . 55
11.1 Clusters privacy options . . . . . . . . . . . . . . . . . . . . . . . . . . . . . . . . . . . . . 56
12.1 Menu option to move clusters . . . . . . . . . . . . . . . . . . . . . . . . . . . . . . . . . . 5712.2 Menu option to move clusters from the cluster list view . . . . . . . . . . . . . . . . . . . . 58
13.1 Menu option to stop a cluster’s creation . . . . . . . . . . . . . . . . . . . . . . . . . . . . 5913.2 Menu option to stop a cluster’s creation . . . . . . . . . . . . . . . . . . . . . . . . . . . . 59
14.1 Menu option to delete a cluster . . . . . . . . . . . . . . . . . . . . . . . . . . . . . . . . . 6014.2 Cluster deletion pop up menu option . . . . . . . . . . . . . . . . . . . . . . . . . . . . . . 6114.3 Cluster deletion modal window . . . . . . . . . . . . . . . . . . . . . . . . . . . . . . . . . 61
15.1 Cluster Workflows . . . . . . . . . . . . . . . . . . . . . . . . . . . . . . . . . . . . . . . . 63
Copyright © 2022, BigML, Inc.

List of Tables
4.1 Weight Field example for transactional dataset . . . . . . . . . . . . . . . . . . . . . . . . 14
7.1 Categories used to classify predictions by BigML . . . . . . . . . . . . . . . . . . . . . . . 47
10.1 Categories used to classify clusters by BigML . . . . . . . . . . . . . . . . . . . . . . . . 55
66

Glossary
Centroids the center of a cluster found by a clustering algorithm. Centroids are computed by using themean for numeric fields and the mode for categorical fields. For text and items fields, it selectsthe values which minimizes the average cosine distance between the centroid and the points in itsneighborhood. ii, 1, 27, 62
Cluster neighborhood the nearest points to the centroid which may finally conform a cluster. 1, 10, 18
Clustering an unsupervised Machine Learning task in which dataset instances are grouped into geo-metrically related subsets. ii, 27, 62
Dashboard The BigML web-based interface that helps you privately navigate, visualize, and interactwith your modeling resources. ii, 1, 27
Dataset the structured version of a BigML source. It is used as input to build your predictive models.For each field in your dataset a number of basic statistics (min, max, mean, etc.) are parsed andproduced as output. ii, 35
Field an attribute of each instance in your data. Also called "feature", "covariate", or "predictor". Eachfield is associated with a type (numeric, categorical, text, items, or date-time). 1
Gaussian distribution a symmetric probability distribution in which the majority of the mass is clusteredabout a mean value and values increasingly far from the mean in either direction are increasinglyunlikely. Also called the normal distribution or the bell curve. 1
G-means a clustering algorithm that tries to learn the number of different clusters by iteratively takingexisting clusters and testing whether the cluster’s neighborhood follow a Gaussian distribution. 1
Instances the data points that represent the entity you want to model, also known as observations orexamples. They are usually the rows in your data with a value (potentially missing) for each fieldthat describes the entity. ii, 1
K-means the canonical clustering algorithm, which attempts to fit a pre-specified number (k) of clustersto the dataset. 1
Local predictions the predictions made in your local environment, faster, at no cost, by downloadingyour model. 31, 50
Missing value the data points that represent the entity you want to model may present missing value,i.e., not provide a value for all fields that compose the entity. 11
Non-preferred fields fields that, for a number of possible reasons, are by default not included in themodeling process. One example of this is fields that contain the same value for every instance; ingeneral, constant fields add no information to the modeling process. 9
67

68 Glossary
Predicting the result of obtaining the objective field value for your new data using an existing model.The model returns the predicted value along with a performance measure (confidence for classifi-cation or expected error for regression). 27
Predictive Model a machine-learned model that has been created using statistical learning. It can helpdescribe or infer some statistical properties of an entity using the instances provided by a dataset.ii
Project an abstract resource that helps you group related BigML resources together. 2, 28, 57
Sampling the process of partitioning your dataset to consider just a subset of your instances. 14
Unsupervised learning a type of Machine Learning problem in which the objective is not to learn apredictor, and thus does not require each instance to be labeled. Typically, unsupervised learningalgorithms infer some summarizing structure over the dataset, such as a clustering or a set ofassociation rules. ii, 1
Copyright © 2022, BigML, Inc.

References
[1] Greg Hamerly and Charles Elkan. “Learning the K in K-Means”. In: In Neural Information ProcessingSystems. MIT Press, 2003.
[2] The BigML Team. Anomaly Detection with the BigML Dashboard. Tech. rep. BigML, Inc., Jan. 2016.[3] The BigML Team. Association Discovery with the BigML Dashboard. Tech. rep. BigML, Inc., Dec.
2015.[4] The BigML Team. Classification and Regression with the BigML Dashboard. Tech. rep. BigML, Inc.,
May 2016.[5] The BigML Team. Datasets with the BigML Dashboard. Tech. rep. BigML, Inc., Jan. 2016.[6] The BigML Team. Sources with the BigML Dashboard. Tech. rep. BigML, Inc., Jan. 2016.[7] The BigML Team. Time Series with the BigML Dashboard. Tech. rep. BigML, Inc., July 2017.[8] The BigML Team. Topic Models with the BigML Dashboard. Tech. rep. BigML, Inc., Nov. 2016.
69

Copyright © 2022 FDOKUMEN