Dashboard Develop - Oracle Help Center
198
HYPERION® INTERACTIVE REPORTING RELEASE 11.1.1 OBJECT MODEL AND DASHBOARD DEVELOPMENT SERVICES DEVELOPER’S GUIDE VOLUME VII: COMPONENT REFERENCE GUIDE
-
Upload
khangminh22 -
Category
Documents
-
view
3 -
download
0
Transcript of Dashboard Develop - Oracle Help Center

H Y P E R I O N ® I N T E R A C T I V E R E P O R T I N G
R E L E A S E 1 1 . 1 . 1
O B J E C T M O D E L A N D D A S H B O A R DD E V E L O P M E N T S E R V I C E S D E V E L O P E R ’ S
G U I D E
VOLUME VII: COMPONENT REFERENCE GUIDE

Interactive Reporting Object Model and Dashboard Development Services Developer’s Guide, 11.1.1
Copyright © 2000, 2008, Oracle and/or its affiliates. All rights reserved.
Authors: EPM Information Development Team
This software and related documentation are provided under a license agreement containing restrictions on use anddisclosure and are protected by intellectual property laws. Except as expressly permitted in your license agreement orallowed by law, you may not use, copy, reproduce, translate, broadcast, modify, license, transmit, distribute, exhibit,perform, publish or display any part, in any form, or by any means. Reverse engineering, disassembly, or decompilationof this software, unless required by law for interoperability, is prohibited.
The information contained herein is subject to change without notice and is not warranted to be error-free. If you findany errors, please report them to us in writing.
If this software or related documentation is delivered to the U.S. Government or anyone licensing it on behalf of the U.S.Government, the following notice is applicable: U.S. GOVERNMENT RIGHTS: Programs, software, databases, and relateddocumentation and technical data delivered to U.S. Government customers are "commercial computer software" or"commercial technical data" pursuant to the applicable Federal Acquisition Regulation and agency-specific supplementalregulations. As such, the use, duplication, disclosure, modification, and adaptation shall be subject to the restrictions andlicense terms set forth in the applicable Government contract, and, to the extent applicable by the terms of the Governmentcontract, the additional rights set forth in FAR 52.227-19, Commercial Computer Software License (December 2007).Oracle USA, Inc., 500 Oracle Parkway, Redwood City, CA 94065.
This software is developed for general use in a variety of information management applications. It is not developed orintended for use in any inherently dangerous applications, including applications which may create a risk of personalinjury. If you use this software in dangerous applications, then you shall be responsible to take all appropriate fail-safe,backup, redundancy and other measures to ensure the safe use of this software. Oracle Corporation and its affiliates disclaimany liability for any damages caused by use of this software in dangerous applications.
This software and documentation may provide access to or information on content, products and services from thirdparties. Oracle Corporation and its affiliates are not responsible for and expressly disclaim all warranties of any kind withrespect to third party content, products and services. Oracle Corporation and its affiliates will not be responsible for anyloss, costs, or damages incurred due to your access to or use of third party content, products or services.

Contents
Chapter 1. Dashboard Development Services Components . . . . . . . . . . . . . . . . . . . . . . . . . . . . . . . . . . . . . . . 9
About Components . . . . . . . . . . . . . . . . . . . . . . . . . . . . . . . . . . . . . . . . . . . . . . . . . . . . 9
About Dashboard Studio Runtime Releases . . . . . . . . . . . . . . . . . . . . . . . . . . . . . . . . . . . 9
Creating Runtime Releases . . . . . . . . . . . . . . . . . . . . . . . . . . . . . . . . . . . . . . . . . . . . . . . 9
Self-Optimizing Runtime Dashboards . . . . . . . . . . . . . . . . . . . . . . . . . . . . . . . . . . . . . . 10
Merging Components . . . . . . . . . . . . . . . . . . . . . . . . . . . . . . . . . . . . . . . . . . . . . . . . . . 10
Applying and Configuring Component Buttons . . . . . . . . . . . . . . . . . . . . . . . . . . . . . . . 12
Component Buttons . . . . . . . . . . . . . . . . . . . . . . . . . . . . . . . . . . . . . . . . . . . . . . . . 12
Toolbar Buttons . . . . . . . . . . . . . . . . . . . . . . . . . . . . . . . . . . . . . . . . . . . . . . . . . . . 14
Configuration Frame Buttons . . . . . . . . . . . . . . . . . . . . . . . . . . . . . . . . . . . . . . . . . 15
Adding and Configuring Buttons to Dashboards or Templates . . . . . . . . . . . . . . . . . . 16
Chapter 2. Customizing Plug-and-Play Components (Programmers Only) . . . . . . . . . . . . . . . . . . . . . . . . . . . . 21
About Plug-and-Play Components . . . . . . . . . . . . . . . . . . . . . . . . . . . . . . . . . . . . . . . . . 21
Component Fingerprints . . . . . . . . . . . . . . . . . . . . . . . . . . . . . . . . . . . . . . . . . . . . . . . . 22
Functions and Method Prototypes . . . . . . . . . . . . . . . . . . . . . . . . . . . . . . . . . . . . . . . . . 23
Standard Component Methods . . . . . . . . . . . . . . . . . . . . . . . . . . . . . . . . . . . . . . . . . . . 24
Reverting to a Template . . . . . . . . . . . . . . . . . . . . . . . . . . . . . . . . . . . . . . . . . . . . . . . . 24
Creating Plug-and-Play Components . . . . . . . . . . . . . . . . . . . . . . . . . . . . . . . . . . . . . . . 24
Chapter 3. Dashboard Studio Chart Shade Component . . . . . . . . . . . . . . . . . . . . . . . . . . . . . . . . . . . . . . . . 27
Chart Shade Component . . . . . . . . . . . . . . . . . . . . . . . . . . . . . . . . . . . . . . . . . . . . . . . . 27
Using a Runtime Release of the Chart Shade Component . . . . . . . . . . . . . . . . . . . . . . . . 27
Configuring the Chart Shade Component . . . . . . . . . . . . . . . . . . . . . . . . . . . . . . . . . . . . 29
Configuring Chart Shade Buttons . . . . . . . . . . . . . . . . . . . . . . . . . . . . . . . . . . . . . . 29
Setting Color Palettes in the Chart Shade Component . . . . . . . . . . . . . . . . . . . . . . . . 30
Notes on Performance . . . . . . . . . . . . . . . . . . . . . . . . . . . . . . . . . . . . . . . . . . . . . . . . . . 31
Test Cases . . . . . . . . . . . . . . . . . . . . . . . . . . . . . . . . . . . . . . . . . . . . . . . . . . . . . . . 31
Test Results . . . . . . . . . . . . . . . . . . . . . . . . . . . . . . . . . . . . . . . . . . . . . . . . . . . . . . 32
Setting Filters . . . . . . . . . . . . . . . . . . . . . . . . . . . . . . . . . . . . . . . . . . . . . . . . . . . . . 32
Updating Interactive Reporting Documents that Contain the Chart ShadeComponent . . . . . . . . . . . . . . . . . . . . . . . . . . . . . . . . . . . . . . . . . . . . . . . . . . . . . . 32
Contents iii

Chapter 4. Dashboard Studio Conditional Navigation Properties Frame . . . . . . . . . . . . . . . . . . . . . . . . . . . . . 33
Conditional Navigation Properties Frame . . . . . . . . . . . . . . . . . . . . . . . . . . . . . . . . . . . . 33
Configuring with the Conditional Navigation Properties Frame . . . . . . . . . . . . . . . . . . . . 33
Chapter 5. Dashboard Studio Conditional Sub-Queries Component . . . . . . . . . . . . . . . . . . . . . . . . . . . . . . . . 37
Conditional Sub-Queries Component . . . . . . . . . . . . . . . . . . . . . . . . . . . . . . . . . . . . . . 37
Conditional Sub-Queries Component Example . . . . . . . . . . . . . . . . . . . . . . . . . . . . . . . 38
Activating Sub-Queries with the Conditional Sub-Queries Component in a RuntimeRelease . . . . . . . . . . . . . . . . . . . . . . . . . . . . . . . . . . . . . . . . . . . . . . . . . . . . . . . . . . . . . 39
Configuring the Conditional Sub-Queries Component . . . . . . . . . . . . . . . . . . . . . . . . . . 40
Building Conditional Sub-Queries Component Entries . . . . . . . . . . . . . . . . . . . . . . . 40
Creating Primary Queries that Execute Sub-Queries . . . . . . . . . . . . . . . . . . . . . . . . . 40
Creating Custom Events that Execute Sub-Queries . . . . . . . . . . . . . . . . . . . . . . . . . . 42
Scheduling Conditional Sub-Queries Component Documents on the Server . . . . . . . . 43
Chapter 6. Dashboard Studio Copy Scale Component . . . . . . . . . . . . . . . . . . . . . . . . . . . . . . . . . . . . . . . . . 45
Copy Scale Component . . . . . . . . . . . . . . . . . . . . . . . . . . . . . . . . . . . . . . . . . . . . . . . . . 45
Using a Runtime Release of the Copy Scale Component . . . . . . . . . . . . . . . . . . . . . . . . . 45
Configuring Charts for use in the Copy Scale Component . . . . . . . . . . . . . . . . . . . . . . . . 47
Chapter 7. Dashboard Studio Drill Across Component . . . . . . . . . . . . . . . . . . . . . . . . . . . . . . . . . . . . . . . . . 49
Drill Across Component . . . . . . . . . . . . . . . . . . . . . . . . . . . . . . . . . . . . . . . . . . . . . . . . 49
Using a Runtime Release of the Drill Across Component . . . . . . . . . . . . . . . . . . . . . . . . . 50
Example Using Sales and Costs Dashboards . . . . . . . . . . . . . . . . . . . . . . . . . . . . . . . 50
Using Source and Target Dashboards . . . . . . . . . . . . . . . . . . . . . . . . . . . . . . . . . . . . 50
Drilling Operations . . . . . . . . . . . . . . . . . . . . . . . . . . . . . . . . . . . . . . . . . . . . . . . . . 51
Configuring the Drill Across Component . . . . . . . . . . . . . . . . . . . . . . . . . . . . . . . . . . . . 52
Building Dashboards . . . . . . . . . . . . . . . . . . . . . . . . . . . . . . . . . . . . . . . . . . . . . . . . 52
Creating an Excel Spreadsheet . . . . . . . . . . . . . . . . . . . . . . . . . . . . . . . . . . . . . . . . . 53
Using the Drill Across Properties Frame . . . . . . . . . . . . . . . . . . . . . . . . . . . . . . . . . . 54
Drilling to Separate Tables within the Same Query Structure . . . . . . . . . . . . . . . . . . . 55
Using Pivot Trees Component as a Drill Across Source . . . . . . . . . . . . . . . . . . . . . . . 55
Chapter 8. Dashboard Studio Drill and Slice Component . . . . . . . . . . . . . . . . . . . . . . . . . . . . . . . . . . . . . . . 57
Drill and Slice Component . . . . . . . . . . . . . . . . . . . . . . . . . . . . . . . . . . . . . . . . . . . . . . 57
Using a Runtime Release of the Drill and Slice Component . . . . . . . . . . . . . . . . . . . . . . . 57
Configuring the Drill and Slice Component . . . . . . . . . . . . . . . . . . . . . . . . . . . . . . . . . . 58
Configuring Drill and Slice Buttons . . . . . . . . . . . . . . . . . . . . . . . . . . . . . . . . . . . . . 58
Creating and Displaying Charts and Pivots on Drill and Slice Frames . . . . . . . . . . . . . 59
Renaming the Marker Column . . . . . . . . . . . . . . . . . . . . . . . . . . . . . . . . . . . . . . . . 60
Using the Drill and Slice Properties Frame . . . . . . . . . . . . . . . . . . . . . . . . . . . . . . . . 61
iv Contents

Chapter 9. Dashboard Studio Workspace Alert Component . . . . . . . . . . . . . . . . . . . . . . . . . . . . . . . . . . . . . 63
About the Workspace Alert Component . . . . . . . . . . . . . . . . . . . . . . . . . . . . . . . . . . . . . 63
Using the Workspace Alert Component with the Conditional Sub-Queries Component . . 64
Displaying Exceptions or Alerts . . . . . . . . . . . . . . . . . . . . . . . . . . . . . . . . . . . . . . . . . . . 64
Configuring the Workspace Alert Component . . . . . . . . . . . . . . . . . . . . . . . . . . . . . . . . 66
Orcl_Exception.txt Table and Output.properties . . . . . . . . . . . . . . . . . . . . . . . . . . . . 68
Using the OnPostProcess() Method Call . . . . . . . . . . . . . . . . . . . . . . . . . . . . . . . . . . 69
Chapter 10. Dashboard Studio Format Header Component . . . . . . . . . . . . . . . . . . . . . . . . . . . . . . . . . . . . . 71
Format Header Component . . . . . . . . . . . . . . . . . . . . . . . . . . . . . . . . . . . . . . . . . . . . . 71
Using a Runtime Release of the Format Header Component . . . . . . . . . . . . . . . . . . . . . . 71
Configuring the Format Header Component . . . . . . . . . . . . . . . . . . . . . . . . . . . . . . . . . 73
Adding Format Header Text Labels . . . . . . . . . . . . . . . . . . . . . . . . . . . . . . . . . . . . . 73
Configuring the Header Rule . . . . . . . . . . . . . . . . . . . . . . . . . . . . . . . . . . . . . . . . . . 74
Adding Format Header Specifications to Reports . . . . . . . . . . . . . . . . . . . . . . . . . . . 76
Chapter 11. Dashboard Studio Graphic Gauges Component . . . . . . . . . . . . . . . . . . . . . . . . . . . . . . . . . . . . . 77
Graphic Gauges Component . . . . . . . . . . . . . . . . . . . . . . . . . . . . . . . . . . . . . . . . . . . . . 77
Using Gauges as Measures in a Runtime Release . . . . . . . . . . . . . . . . . . . . . . . . . . . . . . . 78
Naming Gauges . . . . . . . . . . . . . . . . . . . . . . . . . . . . . . . . . . . . . . . . . . . . . . . . . . . 79
Setting Gauge Visibility or Invisibility . . . . . . . . . . . . . . . . . . . . . . . . . . . . . . . . . . . . 80
Configuring the Graphic Gauges Component . . . . . . . . . . . . . . . . . . . . . . . . . . . . . . . . . 80
Determining Range Values and Creating Computed Columns . . . . . . . . . . . . . . . . . . 81
Pasting or Duplicating Gauges . . . . . . . . . . . . . . . . . . . . . . . . . . . . . . . . . . . . . . . . . 82
Setting Gauge Properties . . . . . . . . . . . . . . . . . . . . . . . . . . . . . . . . . . . . . . . . . . . . . 83
Chapter 12. Dashboard Studio Group Tabs Component . . . . . . . . . . . . . . . . . . . . . . . . . . . . . . . . . . . . . . . . 85
Group Tabs Component . . . . . . . . . . . . . . . . . . . . . . . . . . . . . . . . . . . . . . . . . . . . . . . . 85
Using a Runtime Release of the Group Tabs Component . . . . . . . . . . . . . . . . . . . . . . . . . 85
Configuring the Group Tabs Component . . . . . . . . . . . . . . . . . . . . . . . . . . . . . . . . . . . . 86
Chapter 13. Dashboard Studio Ignore Percentile Component . . . . . . . . . . . . . . . . . . . . . . . . . . . . . . . . . . . . 89
Ignore Percentile Component . . . . . . . . . . . . . . . . . . . . . . . . . . . . . . . . . . . . . . . . . . . . 89
Using a Runtime Release of the Ignore Percentile Component . . . . . . . . . . . . . . . . . . . . . 89
Configuring the Ignore Percentile Component . . . . . . . . . . . . . . . . . . . . . . . . . . . . . . . . 90
Configuring the Ignore Percentile Button . . . . . . . . . . . . . . . . . . . . . . . . . . . . . . . . . 90
Configuring Ignore Percentile Computed Items . . . . . . . . . . . . . . . . . . . . . . . . . . . . 91
Incompatibility with the Checkpoint Control . . . . . . . . . . . . . . . . . . . . . . . . . . . . . . . . . 92
Chapter 14. Dashboard Studio Lookup Component . . . . . . . . . . . . . . . . . . . . . . . . . . . . . . . . . . . . . . . . . . . 93
Lookup Component . . . . . . . . . . . . . . . . . . . . . . . . . . . . . . . . . . . . . . . . . . . . . . . . . . . 93
Contents v

Using a Runtime Release of the Lookup Component . . . . . . . . . . . . . . . . . . . . . . . . . . . . 93
Configuring the Lookup Component . . . . . . . . . . . . . . . . . . . . . . . . . . . . . . . . . . . . . . . 94
Selecting Mapping Providers . . . . . . . . . . . . . . . . . . . . . . . . . . . . . . . . . . . . . . . . . . 94
Configuring Mapping Providers . . . . . . . . . . . . . . . . . . . . . . . . . . . . . . . . . . . . . . . 94
Changing Default Column Names . . . . . . . . . . . . . . . . . . . . . . . . . . . . . . . . . . . . . . 95
Escape the URL . . . . . . . . . . . . . . . . . . . . . . . . . . . . . . . . . . . . . . . . . . . . . . . . . . . . 96
Adding and Configuring Tables or Results . . . . . . . . . . . . . . . . . . . . . . . . . . . . . . . . 96
Reassociating Sections Using Dashboard Studio . . . . . . . . . . . . . . . . . . . . . . . . . . . . 97
Incompatibility with EPM Workspace . . . . . . . . . . . . . . . . . . . . . . . . . . . . . . . . . . . . . . 97
Chapter 15. Dashboard Studio Maps Component . . . . . . . . . . . . . . . . . . . . . . . . . . . . . . . . . . . . . . . . . . . . 99
About the Maps Component . . . . . . . . . . . . . . . . . . . . . . . . . . . . . . . . . . . . . . . . . . . . . 99
Using a Runtime Release of the Maps Component . . . . . . . . . . . . . . . . . . . . . . . . . . . . . 99
Highlighting Map Features with the Maps Component . . . . . . . . . . . . . . . . . . . . . . . . . 100
Creating Summary Tables . . . . . . . . . . . . . . . . . . . . . . . . . . . . . . . . . . . . . . . . . . . 100
Spotlighting the Map . . . . . . . . . . . . . . . . . . . . . . . . . . . . . . . . . . . . . . . . . . . . . . . 102
Defining Color Computed Items . . . . . . . . . . . . . . . . . . . . . . . . . . . . . . . . . . . . . . 103
Configuring the Map Blank Frame . . . . . . . . . . . . . . . . . . . . . . . . . . . . . . . . . . . . . . . . 104
Chapter 16. Dashboard Studio Metadata Component . . . . . . . . . . . . . . . . . . . . . . . . . . . . . . . . . . . . . . . . 107
Metadata Component . . . . . . . . . . . . . . . . . . . . . . . . . . . . . . . . . . . . . . . . . . . . . . . . . 107
Using Metadata . . . . . . . . . . . . . . . . . . . . . . . . . . . . . . . . . . . . . . . . . . . . . . . . . . 107
Using Various Interactive Reporting Database Connections to Build Dashboards . . . 108
Accessing Metadata by Using the Metadata Button in a Runtime Release . . . . . . . . . . . . 108
Configuring Dashboards for the Metadata Component . . . . . . . . . . . . . . . . . . . . . . . . . 109
Creating Interactive Reporting Database Connections with References toMetadata . . . . . . . . . . . . . . . . . . . . . . . . . . . . . . . . . . . . . . . . . . . . . . . . . . . . . . . 110
Customizing the Metadata Component . . . . . . . . . . . . . . . . . . . . . . . . . . . . . . . . . 112
Creating Metadata Templates . . . . . . . . . . . . . . . . . . . . . . . . . . . . . . . . . . . . . . . . 114
Designing Dashboards with the Metadata-Enhanced Template . . . . . . . . . . . . . . . . 116
Chapter 17. Dashboard Studio Pivot Trees Component . . . . . . . . . . . . . . . . . . . . . . . . . . . . . . . . . . . . . . . 117
Pivot Trees Component . . . . . . . . . . . . . . . . . . . . . . . . . . . . . . . . . . . . . . . . . . . . . . . 117
Creating a Query Definition . . . . . . . . . . . . . . . . . . . . . . . . . . . . . . . . . . . . . . . . . . . . 117
Building Queries . . . . . . . . . . . . . . . . . . . . . . . . . . . . . . . . . . . . . . . . . . . . . . . . . . . . . 118
Configuring the Pivot Trees Component . . . . . . . . . . . . . . . . . . . . . . . . . . . . . . . . . . . 119
Chapter 18. Dashboard Studio Point of View (POV) Component . . . . . . . . . . . . . . . . . . . . . . . . . . . . . . . . . 121
Point of View (POV) Component . . . . . . . . . . . . . . . . . . . . . . . . . . . . . . . . . . . . . . . . 121
Using a Runtime Release of the Point of View Component . . . . . . . . . . . . . . . . . . . . . . 121
Configuring the Point of View Component . . . . . . . . . . . . . . . . . . . . . . . . . . . . . . . . . 122
vi Contents

Collecting POV URLs . . . . . . . . . . . . . . . . . . . . . . . . . . . . . . . . . . . . . . . . . . . . . . 122
Naming and Configuring URLs for Dashboards . . . . . . . . . . . . . . . . . . . . . . . . . . . 124
Using Manage URL Library . . . . . . . . . . . . . . . . . . . . . . . . . . . . . . . . . . . . . . . . . . 124
Using Set URL Properties . . . . . . . . . . . . . . . . . . . . . . . . . . . . . . . . . . . . . . . . . . . 127
Using Map URL Attributes . . . . . . . . . . . . . . . . . . . . . . . . . . . . . . . . . . . . . . . . . . 128
Creating Embedded Browsers . . . . . . . . . . . . . . . . . . . . . . . . . . . . . . . . . . . . . . . . 128
Accessing Multiple Point of View Embedded Browsers with Option Buttons . . . . . . . 129
Adding Option Buttons . . . . . . . . . . . . . . . . . . . . . . . . . . . . . . . . . . . . . . . . . . . . . 129
Creating Multiple Shared Embedded Browsers . . . . . . . . . . . . . . . . . . . . . . . . . . . . 130
Configuring the Refresh Button . . . . . . . . . . . . . . . . . . . . . . . . . . . . . . . . . . . . . . . 131
Import Interactive Reporting Documents into EPM Workspace . . . . . . . . . . . . . . . 132
Import Server Names Must Match . . . . . . . . . . . . . . . . . . . . . . . . . . . . . . . . . . . . . . . . 132
Chapter 19. Dashboard Studio Query Limits Component . . . . . . . . . . . . . . . . . . . . . . . . . . . . . . . . . . . . . . 133
Query Limits Component . . . . . . . . . . . . . . . . . . . . . . . . . . . . . . . . . . . . . . . . . . . . . . 133
Using a Runtime Release of the Query Limits Component . . . . . . . . . . . . . . . . . . . . . . . 134
Configuring the Query Limits Component . . . . . . . . . . . . . . . . . . . . . . . . . . . . . . . . . . 135
Adding and Configuring the Query Limits Button . . . . . . . . . . . . . . . . . . . . . . . . . . 135
Configuring the Query Limits Frame . . . . . . . . . . . . . . . . . . . . . . . . . . . . . . . . . . . 136
Setting Query Limits as the Startup Section . . . . . . . . . . . . . . . . . . . . . . . . . . . . . . . 137
Connected Queries Displayed as Disconnected . . . . . . . . . . . . . . . . . . . . . . . . . . . . . . . 137
Chapter 20. Dashboard Studio Quick Query Limits Component . . . . . . . . . . . . . . . . . . . . . . . . . . . . . . . . . . 139
Quick Query Limits Component . . . . . . . . . . . . . . . . . . . . . . . . . . . . . . . . . . . . . . . . . 139
Using Query Panel within a Runtime Release of the Quick Query Limits Component . . . 139
Applying Quick Query Limits . . . . . . . . . . . . . . . . . . . . . . . . . . . . . . . . . . . . . . . . 140
Control Buttons and Guidelines . . . . . . . . . . . . . . . . . . . . . . . . . . . . . . . . . . . . . . . 141
Using the Favorites Option . . . . . . . . . . . . . . . . . . . . . . . . . . . . . . . . . . . . . . . . . . 143
Editing Favorites . . . . . . . . . . . . . . . . . . . . . . . . . . . . . . . . . . . . . . . . . . . . . . . . . . 144
Configuring the Quick Query Limits Component . . . . . . . . . . . . . . . . . . . . . . . . . . . . . 144
Adding and Configuring the Query Panel Button . . . . . . . . . . . . . . . . . . . . . . . . . . 145
Identifying Queries to Process . . . . . . . . . . . . . . . . . . . . . . . . . . . . . . . . . . . . . . . . 146
Configuring Quick Query Limit Controls . . . . . . . . . . . . . . . . . . . . . . . . . . . . . . . . 147
Configuring Other Controls . . . . . . . . . . . . . . . . . . . . . . . . . . . . . . . . . . . . . . . . . 147
Configuring Multi-Selection for Query Processing . . . . . . . . . . . . . . . . . . . . . . . . . 152
Configuring the Quick Query Limit Properties Frame . . . . . . . . . . . . . . . . . . . . . . . 152
Configuring the Required Query Limits . . . . . . . . . . . . . . . . . . . . . . . . . . . . . . . . . 153
Setting Query Panel as the Startup Section . . . . . . . . . . . . . . . . . . . . . . . . . . . . . . . 154
Processing All, One, or More Queries . . . . . . . . . . . . . . . . . . . . . . . . . . . . . . . . . . . . . . 154
Contents vii

Chapter 21. Dashboard Studio Tree Component . . . . . . . . . . . . . . . . . . . . . . . . . . . . . . . . . . . . . . . . . . . . 157
Tree Component . . . . . . . . . . . . . . . . . . . . . . . . . . . . . . . . . . . . . . . . . . . . . . . . . . . . 157
Drilling Down . . . . . . . . . . . . . . . . . . . . . . . . . . . . . . . . . . . . . . . . . . . . . . . . . . . 157
Filters on Queries to Improve Performance . . . . . . . . . . . . . . . . . . . . . . . . . . . . . . 158
Multiple Paths . . . . . . . . . . . . . . . . . . . . . . . . . . . . . . . . . . . . . . . . . . . . . . . . . . . 158
Multiple Trees . . . . . . . . . . . . . . . . . . . . . . . . . . . . . . . . . . . . . . . . . . . . . . . . . . . 158
Drill Down on Limits and Filters . . . . . . . . . . . . . . . . . . . . . . . . . . . . . . . . . . . . . . 158
Unicode Characters . . . . . . . . . . . . . . . . . . . . . . . . . . . . . . . . . . . . . . . . . . . . . . . 159
Using Tree Views in the Tree Limits Component Runtime Sample . . . . . . . . . . . . . . . . . 159
Configuring the Tree Component . . . . . . . . . . . . . . . . . . . . . . . . . . . . . . . . . . . . . . . . 160
About Tree Limit Controls . . . . . . . . . . . . . . . . . . . . . . . . . . . . . . . . . . . . . . . . . . 160
Adding Tree Limits Controls . . . . . . . . . . . . . . . . . . . . . . . . . . . . . . . . . . . . . . . . . 161
Configuring Tree Limits Controls . . . . . . . . . . . . . . . . . . . . . . . . . . . . . . . . . . . . . 162
Selecting Query and Data Model Sections . . . . . . . . . . . . . . . . . . . . . . . . . . . . . . . . 163
Tree Component Compatibility with EPM Workspace . . . . . . . . . . . . . . . . . . . . . . 164
Optimizing Tree Limits for EPM Workspace . . . . . . . . . . . . . . . . . . . . . . . . . . . . . 164
Chapter 22. Dashboard Studio Webdash Builder Component . . . . . . . . . . . . . . . . . . . . . . . . . . . . . . . . . . . 165
Webdash Builder Component . . . . . . . . . . . . . . . . . . . . . . . . . . . . . . . . . . . . . . . . . . . 165
Using the Webdashbuilder Sample . . . . . . . . . . . . . . . . . . . . . . . . . . . . . . . . . . . . . . . . 166
Configuring the Webdash Builder Component . . . . . . . . . . . . . . . . . . . . . . . . . . . . . . . 166
Adding Shapes to Frame Prototypes . . . . . . . . . . . . . . . . . . . . . . . . . . . . . . . . . . . . 167
Including Templates . . . . . . . . . . . . . . . . . . . . . . . . . . . . . . . . . . . . . . . . . . . . . . . 168
Creating Local Filters . . . . . . . . . . . . . . . . . . . . . . . . . . . . . . . . . . . . . . . . . . . . . . 169
Building Dashboards . . . . . . . . . . . . . . . . . . . . . . . . . . . . . . . . . . . . . . . . . . . . . . . 169
Design Notes . . . . . . . . . . . . . . . . . . . . . . . . . . . . . . . . . . . . . . . . . . . . . . . . . . . . 170
Embedding Sections . . . . . . . . . . . . . . . . . . . . . . . . . . . . . . . . . . . . . . . . . . . . . . . 171
Creating Runtime Documents . . . . . . . . . . . . . . . . . . . . . . . . . . . . . . . . . . . . . . . . 173
Verifying Dashboard Functionality . . . . . . . . . . . . . . . . . . . . . . . . . . . . . . . . . . . . 174
Customizing Dashboards Using Dashboard Studio . . . . . . . . . . . . . . . . . . . . . . . . . 175
Chapter 23. Dashboard Studio Blank Component . . . . . . . . . . . . . . . . . . . . . . . . . . . . . . . . . . . . . . . . . . . 177
Blank Component . . . . . . . . . . . . . . . . . . . . . . . . . . . . . . . . . . . . . . . . . . . . . . . . . . . . 177
Customizing the Component Core . . . . . . . . . . . . . . . . . . . . . . . . . . . . . . . . . . . . . . . . 177
Blank Component Properties Frame and User Interface . . . . . . . . . . . . . . . . . . . . . . . . 181
Glossary . . . . . . . . . . . . . . . . . . . . . . . . . . . . . . . . . . . . . . . . . . . . . . . . . . . . . . . . . . . 183
Index . . . . . . . . . . . . . . . . . . . . . . . . . . . . . . . . . . . . . . . . . . . . . . . . . . . . . . . . . . . . . 193
viii Contents

1Dashboard Development
Services Components
In This Chapter
About Components .. . . . . . . . . . . . . . . . . . . . . . . . . . . . . . . . . . . . . . . . . . . . . . . . . . . . . . . . . . . . . . . . . . . . . . . . . . . . . . . . . . . . . . . . . . . . . . . . . . . . . . . . . . . . . . . . 9
About Dashboard Studio Runtime Releases ... . . . . . . . . . . . . . . . . . . . . . . . . . . . . . . . . . . . . . . . . . . . . . . . . . . . . . . . . . . . . . . . . . . . . . . . . . . . . . . . . . . 9
Creating Runtime Releases ... . . . . . . . . . . . . . . . . . . . . . . . . . . . . . . . . . . . . . . . . . . . . . . . . . . . . . . . . . . . . . . . . . . . . . . . . . . . . . . . . . . . . . . . . . . . . . . . . . . . . . 9
Self-Optimizing Runtime Dashboards ... . . . . . . . . . . . . . . . . . . . . . . . . . . . . . . . . . . . . . . . . . . . . . . . . . . . . . . . . . . . . . . . . . . . . . . . . . . . . . . . . . . . . . . . . .10
Merging Components .. . . . . . . . . . . . . . . . . . . . . . . . . . . . . . . . . . . . . . . . . . . . . . . . . . . . . . . . . . . . . . . . . . . . . . . . . . . . . . . . . . . . . . . . . . . . . . . . . . . . . . . . . . . . .10
Applying and Configuring Component Buttons... . . . . . . . . . . . . . . . . . . . . . . . . . . . . . . . . . . . . . . . . . . . . . . . . . . . . . . . . . . . . . . . . . . . . . . . . . . . . . . .12
About ComponentsOracle's Hyperion® Dashboard Development Services components are plug-and-play software,which are Oracle's Hyperion® Interactive Reporting documents (BQYs) that can be merged intoDashboard Studio templates and dashboards. See “Merging Components” on page 10.
About Dashboard Studio Runtime ReleasesA runtime release is a slender version of an editable source master (ESM) dashboard. It does notcontain build time or development structures, and cannot be connected to or modified by theDashboard Studio wizard interface. A runtime release is usually deployed to users, as it containsidentical features and properties as the ESM from which it was created. If no runtime is created,only the ESM release is saved.
Creating Runtime ReleasesAfter setting the dashboard functionalities and style elements with Dashboard Studio, save thedocument. A message box asks if you want to save a smaller, runtime version of the dashboard.
➤ To create a runtime release:
1 Using the Dashboard Studio wizard interface, navigate to Step 8: Configure Style, and click to saveand close document.
2 In Save As, accept the default file name or specify another name.
If the specified name exists, save the file with another name.
About Components 9

If the default file name is accepted, an _esm suffix is added to the file name. If a file name isspecified, the _esm suffix is not added.
3 After naming the dashboard, click Yes when a message is displayed asking to save a slimmer, runtime versionof the dashboard.
Select a Framework Template is displayed.
4 Alternatively, if the document is closed and a runtime version is saved (using a Release 8.3.8 template orlater), select Pack JavaScript to compact the JavaScript and remove all trace statements.
See “Packing JavaScript Feature” in the Hyperion Interactive Reporting – Object Model andDashboard Development Services Developer's Guide, Volume 5: Dashboard Studio.
New dashboards are saved to the default save location associated with the template from whichthey were built. Runtime dashboards are saved to a Runtime folder in the location of the savedESM. Existing dashboards are saved to the location from which they were opened.
Self-Optimizing Runtime DashboardsWhen creating runtime documents, unused component sections are deleted to reduce thedashboard size and to improve performance. Therefore, an ESM contains the cooperatingcomponents (some components cannot share an Interactive Reporting document with others;for example, Query Limits and Quick Query Limits) without burdening the runtime with unusedresources, such as code, language strings, and sections. The ESM is a developer release of theInteractive Reporting document and is less efficient, but the runtime is slim and provides theconfigured functionality.
Runtimes created for production should use the packing option. See “Packing JavaScriptFeature” in the Hyperion Interactive Reporting – Object Model and Dashboard DevelopmentServices Developer's Guide, Volume 5: Dashboard Studio.
Runtimes created for unit testing experimental Interactive Reporting documents, thosecontaining new JavaScript in the form of custom components or in 1100 Custom (see “1100Custom” in the Hyperion Interactive Reporting – Object Model and Dashboard DevelopmentServices Developer's Guide, Volume 5: Dashboard Studio), should not be packed as the diagnosticsthat tracing enables is used.
Note:
The option to pack runtimes has been available since Release 8.3.
Merging ComponentsThe Dashboard Development Services components are Interactive Reporting documents thatcan be merged with templates or dashboards and configured to perform their unique tasks.Components include buttons, graphics, and other style elements that extend dashboardfunctionality.
10 Dashboard Development Services Components

The Dashboard Studio Merge Utility is a module management mechanism that is used tocombine a component with a template or dashboard and thus to produce documents that offera variety of capabilities and features.
➤ To merge a component with a template or dashboard:
1 Start Oracle's Hyperion® Interactive Reporting Studio, and, on the Welcome dialog, click Cancel.
2 Start Dashboard Studio, click , and select Merge, and select Select and Re-order Sections.
3 Optional: To consolidate duplicate images into the Resource Manager, select Remove duplicate imagesfrom the final document.
All instances of an image are changed to reference the single copy of the image in the ResourceManager. The Interactive Reporting document file size and memory footprint are reduced. Thus,loading speed is improved, and reuse of existing images from the Resource Manager is madepossible when creating dashboards and reports. See “Resource Manager” in the HyperionInteractive Reporting Studio User's Guide.
4 Click (next to Primary Document), and navigate to the template or dashboard that is to be merged withthe component.
5 Click (next to Secondary Document), and navigate to <componentname>_component.bqy.
A save path is generated.
6 Optional: To rename the file and change the default save path, click (next to Save Path).
7 Click Merge.
Select and Re-order Sections is displayed, with a list of sections from the secondary document.
8 Move selected sections between Available Sections and Selected Sections by clicking and ,
or move all sections by clicking and .
9 Optional: Reorder Selected Sections by selecting a section and clicking or .
10 Click OK.
A report detailing the sections that were merged is presented. Removed duplicate images arereported at the end of the report.
11 Click Save or OK.
12 Click View to view the merged Interactive Reporting document in Interactive Reporting Studio, and clickClose.
Note:
When merging components into Dashboard Studio templates or Interactive Reportingdocuments, both BMP and GIF files are available.
Merging Components 11
Applying and Configuring Component ButtonsThis topic provides examples of the component objects, buttons, and describes how to add andconfigure these controls.
Component ButtonsThe buttons in Table 1 are available in Oracle's Hyperion® Dashboard Development Servicescomponents.
Table 1 Component Buttons
Component Button Description
Chart Shade Load a set of hatched monochrome colors to be used on charts
Load the classic color palette set by Interactive Reporting Studio or select acustom color palette
Drill Across Drill into target document
Drill back to source document
Activate the Query Panel
Drill and Slice Drill down to the next member of the hierarchy
Drill up to the previous member of the hierarchy (can be configured to resetlower filters)
Ignore Percentile Present percentile ranges, from which values are discarded, according to theselected range
Metadata Examine the Data Layout for objects on the frame and filter the metadataresults to display only those objects
POV Refresh the view
Query Limits Activate the Query Limits frame
Find queries, if no variable limits are displayed
Connect Available Queries
Disconnect Available Queries
12 Dashboard Development Services Components

Component Button Description
Process Available Queries
Move limits between Required and Optional Limits lists
Reorder items within lists
Quick Query Limits Activate the Quick Query Limit Properties frame
Reinitialize the Query Panel and repopulate lists with values from configuredsources
Present the specified Home section
Add, edit, or remove items from the favorites list
Clear all selected values from limits (does not affect values in hierarchies)
Apply the selected values to limits (does not affect values in tree hierarchies)
Process queries (after Process is clicked, you are returned to the Homesection)
Activate the Query Panel
All Select all available values
Clear Delete all selected values from the list, and clear previously applied values
Add (list box) Add custom values to the list
Rem Remove values from the list
Ref Update or scroll through values in the list
Tree Expand and collapse selected nodes in the Tree Limits lists
Add (tree) Add selected values from the Tree Limits lists (this button works with querylimits and filters)
Remove Remove selected values from the Tree Limits lists (this button works with querylimits and filters)
Process Process selected query sections in the document (added when the dashboardframe contains Tree Limits lists that apply query limits)
Clear Remove applied query limits
Applying and Configuring Component Buttons 13

Component Button Description
Note: To clear filters, click , on the Dashboard Studio toolbar
Webdash Add dashboard name and associate a frame prototype
Modify frame prototype
Move selected items to right list box
Move selected items to left list box
Move selected items up
Move selected items down
Restore Reload the original settings
Clear All Remove all entries
Clear Remove the icons from the preview frame
Apply Create the dashboard
Toolbar ButtonsThe buttons in Table 2 are available on frames.
Table 2 Toolbar Buttons
Button Description
Return to previous frame
Refresh the frame
Present the specified Home section
Print selected items or frames
Export sections from a dashboard into non-Interactive Reporting Studio formats, such as Excel, tab- orcomma-separated, HTML, JPEG, and PDF
Activate a related document; for example, a file, folder, or URL or an e-mail message
14 Dashboard Development Services Components

Button Description
Select the language in which the dashboard text is displayed
● Activate help or floating comments and annotations, which detail the main dashboard navigational andfunctional elements
● Display or hide release information or annotations
Configuration Frame ButtonsThe buttons in Table 3 are displayed and used on multiple configuration frames.
Table 3 Configuration Frame Buttons
Button Description
Refresh the frame
Present the specified Home section
● Activate help or floating comments and annotations, which detail the main dashboardnavigational and functional elements
● Display or hide release information or annotations
Move items left or right between list
Reorder items within lists
View the frame, after configuration properties are applied
Delete an item
Copy an item
Paste an item
Activate the Query Panel or the Query Limits frame
Rename or modify an item
Browse Navigate to a location to select a file or item
Apply Apply configuration settings
Applying and Configuring Component Buttons 15

Button Description
Rename Rename an item
Reset Return an item to the original setting
Clear Remove applied settings
Restore Load the previously applied settings
Add URLs Append selected URLs to the POV component
Import URLs Import a list of configured URLs as a text file into the POV component
Export URLs Export the list of configured URLs to a text file from the POV component
Restore URL Restore the previously saved selected URL settings in the POV component
Clear All Remove all configured URLs from the POV component
Change Value Type Change the selected source for limit values application type
Refresh Refresh values on the frame
Adding and Configuring Buttons to Dashboards or TemplatesThis topic describes adding and configuring buttons on dashboard or template frames.
There are three ways to add buttons to dashboards:
● Copy button graphics from the <componentname>_component.bqy file
● Use button graphics that are available in the components folders
● Use button graphics in the Resource Manager (see “Resource Manager” in the HyperionInteractive Reporting Studio User's Guide)
All Dashboard Studio buttons contain a line of JavaScript that determines the action to take,and the control handler to call. The code must be entered for buttons, results, or table sections.
➤ To add buttons by copying graphics from <componentname>_component.bqy:
1 In Interactive Reporting Studio, open <componentname>_component.bqy.
Most components have a <componentname>_component.bqy file; however, not allcomponents contain or require button graphics.
2 Locate the buttons on the top panel, and press Ctrl+D to enter Design mode.
3 Select a button graphic.
4 Optional: To represent the not selectable button state, first select the component_grey.bmp orcomponent_gray.bmp.
5 Right-click and select Copy.
6 Navigate to the dashboard frame that will include the button, right-click, and select Paste.
16 Dashboard Development Services Components

7 Position the button on the dashboard toolbar, and double-click it.
Properties is displayed.
8 Select Visible and Locked, and click OK.
9 If a not selectable button is positioned on the frame, the selectable button is also required. Perform theseactions to select and position the selectable button:
a. Repeat steps 3–8 to select and add the selectable button (without the _grey or _graysuffix).
b. Select the not selectable and selectable buttons.
c. On the Interactive Reporting Studio toolbar, click Left and click Top to justify the buttonsdirectly on top of each other.
10 Press Ctrl+D to exit Design mode and save the dashboard.
Note:
There is no need to rename the buttons copied from <componentname>_component.bqy, noris there any need to configure the properties and scripts for each button, as these are alreadyincluded.
➤ To add buttons by using graphics in the components folders:
1 In Interactive Reporting Studio, open a dashboard that contains the component.
2 Select the frame on which to add the button, and press Ctrl+D to enter Design mode.
3 From the catalog pane, expand Graphics, and drag a picture object onto the frame.
4 Optional: If a results or table section is being configured, perform these requirements:
a. Double-click the results or table section that was dragged onto the frame.
Properties is displayed.
The object name must take the form of <prefix>^Qiq_componentname^<suffix>where <prefix> is the results or table name, and <suffix> is a unique identifier. Anexample is, Table^Qiq_componentname^1.
b. Select Active, and click OK.
5 In Select Image, navigate to the button graphic (BMP), and select Open to insert the button.
6 Optional: To represent the not selectable button state, first add the component_grey.bmp orcomponent_gray.bmp.
7 Position the button on the dashboard toolbar, and double-click it.
Properties is displayed.
8 Select Locked, and click OK.
9 If a not selectable button is positioned on the frame, the selectable button is also required. Perform theseactions to locate and position the selectable button:
Applying and Configuring Component Buttons 17

a. Repeat steps 3–8 to locate and select the selectable button (without the _grey or _graysuffix).
b. Select the not selectable and selectable buttons.
c. On the Interactive Reporting Studio toolbar, click Left and click Top to justify the buttonsdirectly on top of each other.
10 Double-click the button on top.
Properties is displayed.
11 Enter pic^Qiq_componentname as the object name.
For example, enter pic^Qiq_chartshade^color or pic^Qiq_chartshade^hatch.
12 Select Visible and Locked, and click OK.
Proceed to configuring the button properties and scripts.
➤ To configure the properties and scripts for each button:
1 On the frame, select the button, right-click, and select Scripts.
Scripts Editor is displayed.
2 In Scripts Editor, perform an action:
● Enter this line of code
ActiveDocument.Sections[txlMe.Text].Qiq_onControlClick(this.Parent,this)
(In some template versions, ActiveSection replaces this.Parent. This does not affectthe execution of the code)
● Copy and paste the line of code from another button on the toolbar to avoid data entryerrors
3 Click OK.
4 Perform an action:
● Editing a dashboard—Add the button to every frame
● Editing a template—Copy the button to each frame so the feature is available, regardless ofthe frame in use
5 After the button is configured, press Ctrl+D to exit Design mode.
➤ To add button graphics from the Resource Manager:
1 In Interactive Reporting Studio, press Ctrl+D to enter Design mode.
2 From the catalog pane, expand Resources.
3 Select, drag, and position a graphic on the dashboard frame.
4 Right-click the graphic, select Properties, and select Visible and Locked.
5 Click OK.
6 Repeat steps 3–6 for the _grey or _gray equivalent button.
18 Dashboard Development Services Components

7 Align the buttons directly on top of each other, right-click, and select Properties.
8 Select Visible, Locked, and click OK.
Additional steps are required to add buttons to templates.
➤ To add buttons to templates:
1 In Interactive Reporting Studio, open a template.
2 To display the available frame prototypes, select View, then Unhide Section.
3 Optional: To display custom frame templates, select View, then Unhide Section.
4 Repeat the procedures in:
a. To add buttons to dashboards
b. To configure the properties and scripts for each button
5 Select each template frame or prototype individually, and select View, then Hide Section.
6 Save the template.
The custom template including the buttons is ready to be used as a basis for a dashboard.
Applying and Configuring Component Buttons 19

20 Dashboard Development Services Components

2Customizing Plug-and-PlayComponents (Programmers
Only)
In This Chapter
About Plug-and-Play Components .. . . . . . . . . . . . . . . . . . . . . . . . . . . . . . . . . . . . . . . . . . . . . . . . . . . . . . . . . . . . . . . . . . . . . . . . . . . . . . . . . . . . . . . . . . . . . .21
Component Fingerprints .. . . . . . . . . . . . . . . . . . . . . . . . . . . . . . . . . . . . . . . . . . . . . . . . . . . . . . . . . . . . . . . . . . . . . . . . . . . . . . . . . . . . . . . . . . . . . . . . . . . . . . . . . .22
Functions and Method Prototypes... . . . . . . . . . . . . . . . . . . . . . . . . . . . . . . . . . . . . . . . . . . . . . . . . . . . . . . . . . . . . . . . . . . . . . . . . . . . . . . . . . . . . . . . . . . . . .23
Standard Component Methods ... . . . . . . . . . . . . . . . . . . . . . . . . . . . . . . . . . . . . . . . . . . . . . . . . . . . . . . . . . . . . . . . . . . . . . . . . . . . . . . . . . . . . . . . . . . . . . . . .24
Reverting to a Template ... . . . . . . . . . . . . . . . . . . . . . . . . . . . . . . . . . . . . . . . . . . . . . . . . . . . . . . . . . . . . . . . . . . . . . . . . . . . . . . . . . . . . . . . . . . . . . . . . . . . . . . . .24
Creating Plug-and-Play Components.. . . . . . . . . . . . . . . . . . . . . . . . . . . . . . . . . . . . . . . . . . . . . . . . . . . . . . . . . . . . . . . . . . . . . . . . . . . . . . . . . . . . . . . . . . . .24
About Plug-and-Play ComponentsA component is a combination of one or more Interactive Reporting document sections, thatcontain related configuration information, data models, GUIs, and JavaScript service functionsrequired for performance. The Dashboard Studio Merge Utility is used to combine these sectionsand produces reusable templates that offer a variety of capabilities and features.
Components are standalone entities that may rely on a framework and other components intowhich they can be plugged. The framework is a Dashboard Studio template that exports servicesthrough the Globals_EIS section. See “Template Structure” in the Hyperion Interactive Reporting– Object Model and Dashboard Development Services Developer's Guide, Volume 5: DashboardStudio.
The framework looks for components that contain a known set of characteristics or fingerprints.If these characteristics are found, the component is included as part of the regular processingcycle. See “Component Fingerprints” on page 22.
Although JavaScript and Interactive Reporting Studio are not pure Object Oriented (OO)environments, they offer many of the OO features. If these attributes are carefully used, manybenefits of OO can flow through to Interactive Reporting Studio JavaScript development.
One component may interact with another through published interfaces. Interfaces are pureJavaScript functions or JavaScript functions implemented as objects that are added to theInteractive Reporting Studio dynamic runtime object model. If components interact with eachother, they must be able to degrade gracefully and operate in a standalone mode if their peercomponent does not exist.
If a component requires the presence of the peer component, the two components are combined.JavaScript provides a Boolean test mechanism for determining the existence of objects andproperties alongside the usual try-and-catch facilities.
About Plug-and-Play Components 21

Component FingerprintsThis topic describes the characteristics of a component. A blank component(Blank_component.bqy) is provided and installed with Dashboard Studio. The blankcomponent is used to implement the core of a component. See Chapter 23, “Dashboard StudioBlank Component.”
These properties are used to identify Dashboard Studio frames from other dashboard sections.The FrameType property is the key property that marks a dashboard as the core of a component.
FrameType.Text—A text string used by the framework to identify dashboard sections whereJavaScript services and properties for the component are defined. Value = 1020.
txlMe.Text—A text string used by JavaScript routines to set the context of their declarationsand definitions. Value = dashboard section name.
VersionInfo.Text—A string separated by a carriage return. Component builders can changethe first five elements: the identifiers for VersionMajor, VersionMinor,VersionRevision, VersionBuild, and VersionCheckin. However, some elements arereserved for system and future use and should not be changed.
VersionMajor=xVersionMinor=xVersionRevision=xVersionBuild=xVersionCheckin=xInterfaceMajor=2InterfaceMinor=0GUID={C1282A7B-9455-48dc-BBBB-46C2EB525AF5}
gtxlLanguageStrings.Text—A set of keywords or value pairs that hold language-sensitivevalues used on buttons and in messages. Loaded by the framework into an associative or hashedarray when the document starts up or the language is changed. The array can be accessed usingJavaScript of the form:
ActiveDocument.Qiq_harConstants[<keyword>]
where <keyword> is derived from the values in the text label. Examples of two language stringsthat can be placed in the text label are:
HOME=ENUS~Home|FRFR~Acceuil|DEDE~HomepageFILTERS=ENUS~Filters|FRFR~Filtres|DEDE~Filter
The framework creates two entities in the hashed array indexed by the string valuestxlMe.Text+”HOME” and txlMe.Text+”FILTERS”, as the keywords to reference the entriesin the array. The use of txlMe ensures uniqueness. The language text must be in escaped formif it contains a carriage return (\r\n), equals (=), tilde (~), or pipe (|).
gtxlToolTip.Text—A set of keywords or value pairs used to hold language-sensitive valuesfor floating comments displayed in Help mode. The value must match the control name itdescribes. gtxlToolTip.Text uses identical syntax to gtxlLanguageStrings.Text. Loadedby the framework into an associative or hashed array when the dashboard starts up or thelanguage is changed. The array can be accessed using JavaScript of the form:
ActiveDocument.Qiq_harToolTip[<keyword>]
22 Customizing Plug-and-Play Components (Programmers Only)

where <keyword> is the name of the control that is clicked. For example, txlMe.Text+"TOOLTIP_"+myControlName is used to find a control floating comment. The language textmust be in escaped form if it contains a carriage return (\r\n), equals (=), tilde (~), or pipe (|).If a floating comment keyword is not found using this method, the framework calls thecomponent Qiq_initToolTip function to return the correct floating comment.
txlParent.Text—The component name from which features are inherited. Reserved forfuture use.
PrototypeName.Text—Not used in FrameTypes under 1100.
Implements.Text—Not used in FrameTypes under 1100.
CloneImplements.Text—Not used in FrameTypes under 1100.
See “Template Structure” in the Hyperion Interactive Reporting – Object Model and DashboardDevelopment Services Developer's Guide, Volume 5: Dashboard Studio.
Functions and Method PrototypesDuring document startup, the Dashboard Studio template framework causes the OnClick()event of every command button on a FrameType 1020. Each event is preconfigured withJavaScript that declares or instantiates functions that can be called by the clients of thecomponent. This pattern of JavaScript declares the function and instantiates it as part of theInteractive Reporting Studio dynamic runtime object model.
var trl=0var thisSection=this.ParentQiq_trace("In " + txlMe.Text+"."+ this.Name,trl,thisSection)var cnAD=ActiveDocumentvar cnClass=cnAD.Sections[txlMe.Text]var Qiq_clsGlobals=cnAD.Qiq_clsGlobals
function Qiq_service(in_clsCaller){//============================= Qiq_trace("In "+txlMe.Text+".Qiq_service()",trl+1,thisSection) Qiq_trace("Out "+txlMe.Text+".Qiq_service()",trl+1,thisSection)}cnClass.Qiq_service=Qiq_service
Qiq_trace("Out " + txlMe.Text+"."+ this.Name,trl,thisSection)
A line by line explanation follows:
// set the base trace level// create a reference to the section on which this control is found// trace the start of the event that instantiates the functions// create a reference to the ActiveDocument// create a reference to the Class that hold our functions// create a reference to the Globals class
// declare the function header//============================= // trace the start of the function call
Functions and Method Prototypes 23
// trace the end of the function call// terminate the function// create a property in cnClass that references the function
// trace the end of the event that has instantiated the functions
Standard Component MethodsThe Dashboard Studio template framework recognizes and calls the functions listed in theJavaDoc that is installed with this program.
For details on the Standard Component Methods, see the JavaDoc files.
Reverting to a TemplateA template cannot be tested in its raw form. It is a mechanism by which reusable elements canbe delivered to non-programmers. Before a component is constructed, an application must becreated from which a template can be derived. Use Dashboard Studio to take generalizedtemplates and turn them into applications.
➤ To use the typical development process:
1 In Dashboard Studio, merge Blank_component.bqy into an editable source master (ESM) for testing.
Use the Dashboard Studio Merge Utility. See “Merging Components” on page 10.
2 Change the name of the blank merged component, and add language strings, constants, and JavaScript.
Include code in the Qiq_reset function.
3 Test the custom component, and update the JavaScript until the component functions correctly.
4 Make Dashboard Studio visible, and click Reset.
This calls Qiq_isSystem for the component before it removes any section. If the componentrequires a section to be kept, return true in this function. The framework removes these sections:
● All query sections, and all other sections that depend on it
● All sections with FrameType >= 1100, where the value in prototype labels is not the framename or if the value Is Null
5 The framework calls Qiq_reset so that lists, labels, drop-down lists, and other controls are made clean.
Creating Plug-and-Play ComponentsComponents that plug into a template or an ESM come in two formats:
● Components saved into an Interactive Reporting document (Sections that constitute thecomponent are selected in the Dashboard Studio Merge Utility)
24 Customizing Plug-and-Play Components (Programmers Only)

● Each component saved into individual Interactive Reporting documents (These documentsare merged using the Dashboard Studio Merge Utility)
This procedure refers to creating a plug-and-play component at a high-level. The instructionsare directed at programmers.
➤ To create and test a plug-and-play component:
1 Use Dashboard Studio and Interactive Reporting Studio to create and test the application.
2 From the ESM, revert to template status, and test creating an application from the template.
3 When the template functions correctly, place it under configuration management.
In this high-level example, configuration management refers to saving the template into arepository, and applying the associated repository functions.
4 Copy and name the template.
For example, componentname_component_xxxx.bqy (where xxxx is the release number).
5 Open and delete all sections, except those that constitute the component.
6 Save the component.
Creating Plug-and-Play Components 25

26 Customizing Plug-and-Play Components (Programmers Only)

3Dashboard Studio Chart Shade
Component
In This Chapter
Chart Shade Component .. . . . . . . . . . . . . . . . . . . . . . . . . . . . . . . . . . . . . . . . . . . . . . . . . . . . . . . . . . . . . . . . . . . . . . . . . . . . . . . . . . . . . . . . . . . . . . . . . . . . . . . . .27
Using a Runtime Release of the Chart Shade Component . . . . . . . . . . . . . . . . . . . . . . . . . . . . . . . . . . . . . . . . . . . . . . . . . . . . . . . . . . . . . . . . . . . .27
Configuring the Chart Shade Component.. . . . . . . . . . . . . . . . . . . . . . . . . . . . . . . . . . . . . . . . . . . . . . . . . . . . . . . . . . . . . . . . . . . . . . . . . . . . . . . . . . . . . . .29
Notes on Performance... . . . . . . . . . . . . . . . . . . . . . . . . . . . . . . . . . . . . . . . . . . . . . . . . . . . . . . . . . . . . . . . . . . . . . . . . . . . . . . . . . . . . . . . . . . . . . . . . . . . . . . . . . .31
Chart Shade ComponentThe Chart Shade component enables you to switch the internal color palette used by charts toa set of custom predefined colors. The custom colors are loaded from a Dashboard Studio palettefile (PAL). A set of hatched monochrome colors are available for black and white printing orcolor blind users.
The component is extended to enable these options:
● End users apply alternate color schemes to color charts at runtime
● Dashboard developers define one or more palettes to be available at runtime
The component is extended to define multiple palettes on top of the existing hatchedmonochrome palette. Palettes can also be concatenated if a chart contains many bars orsegments. A repeating cycle of color values occurs if all palettes are exhausted.
Sets of colors in one or more palettes are defined by using the Color Palette Properties frame.See “Using the Color Palette Properties Frame” in the Hyperion Interactive Reporting – ObjectModel and Dashboard Development Services Developer's Guide, Volume 5: Dashboard Studio.
The component includes button graphics that must be added to dashboard frames andconfigured. See “Component Buttons” on page 12.
Using a Runtime Release of the Chart Shade Component Dashboards that include the Chart Shade component should contain two additional buttons onthe top panel. The buttons determine whether the charts use the standard colors applied byInteractive Reporting Studio, or a set of color palettes applied by the dashboard developer, or ahatched monochrome palette. However, to conserve space on the dashboard toolbar, dashboarddevelopers can choose to configure only one button. Therefore, you can toggle between theoptions by clicking that button. See “Configuring Chart Shade Buttons” on page 29.
Chart Shade Component 27

The Chart Shade component enables users at runtime to select from multiple color schemes tocolor charts.
See “Setting Color Palettes in the Chart Shade Component” on page 30.
Note:
If no custom palette is configured, clicking the buttons switches between the standard colorapplied by Interactive Reporting Studio and hatched monochrome palette. If multiple palettes
are selected and or are clicked, a drop-down list is displayed that contains the entriesset in the Chart Shade Properties frame.
Caution!
Shading charts can cause a dashboard to run slowly and inefficiently.
➤ To use the Chart Shade component:
1 In Interactive Reporting Studio, open a dashboard that is configured with the Chart Shade component.
2 Perform an action depending on the available button.
a. Click to apply the palette.
The colors on the chart are changed to a set of hatched monochrome colors. The optionis provided for monochrome printing or color blind users.
b. Click to apply the palette.
The classic color palette applied by Interactive Reporting Studio, or custom color palettespecified by the dashboard developer are displayed in a drop-down list. See “Setting ColorPalettes in the Chart Shade Component” on page 30.
The Chart Shade feature changes the color of all charts in the dashboard. However, it does notaffect pivots, charts configured with the Chart Spotlighting feature, nor maps configured withthe Maps component, as spotlighting takes precedence over Chart Shade configurations. See“Using a Runtime Release of the Maps Component” on page 99.
Drilling down may revert a chart back to the classic color palette assigned by Interactive
Reporting Studio. Click to reactivate the custom colors. Similarly, if filters are set andcustom colors applied, when those filters are removed, some bars in the chart may use customcolors and some may use the classic Interactive Reporting Studio color palette. If this occurs,
click to reactivate the custom colors.
The Chart Shade component works with the Checkpoint control to store or restore the currentpalette on a dashboard. See “Using Checkpoint Control” in the Hyperion Interactive Reporting– Object Model and Dashboard Development Services Developer's Guide, Volume 5: DashboardStudio.
28 Dashboard Studio Chart Shade Component

In Dashboard Studio Release 8.3.2 and earlier, the Chart Shade buttons had other names. Theywere Custom Colors and Standard Colors, which are now Hatch and Color, respectively. If adashboard developer uses the previous button names, they still operate in this release. That is,using pic^Qiq_chartshade^custom to define the Custom Colors button still works, as doespic^Qiq_chartshade^standard to define the Standard Colors button.
Configuring the Chart Shade ComponentTo configure the Chart Shade component:
1. Merge the component. See “Merging Components” on page 10.
2. Add and configure and .
3. Specify a color palette.
Configuring Chart Shade Buttons
Before you can set the color palette for the Chart Shade component, add and configure and
. After the component is configured, the buttons enable you to manipulate chart shading.
➤ To add and configure the Chart Shade buttons:
1 In Interactive Reporting Studio, open a dashboard that contains the Chart Shade component.
2 Select the frame on which to add the buttons, and press Ctrl+D to enter Design mode.
3 From the catalog pane, expand Graphics, and drag a picture object onto the frame.
4 Navigate to chartshade_custom.bmp in the Chart Shade component directory, and position the buttonon the dashboard toolbar.
5 Double-click the button.
Properties is displayed.
6 Enter pic^Qiq_chartshade^hatch as the object name, and click OK.
7 On the frame select the button, right-click, and select Scripts.
Scripts Editor is displayed.
8 In Scripts Editor, perform an action:
● Enter this line of code
ActiveDocument.Sections[txlMe.Text].Qiq_onControlClick(this.Parent,this)
● Copy and paste the line of code from another button on the toolbar to avoid data entryerrors
9 Click OK.
Configuring the Chart Shade Component 29

10 Repeat steps 3–9 to select chartshade_standard.bmp, and enterpic^Qiq_chartshade^color as the object name.
11 Optional: Add, configure, and name the corresponding gray buttons for the not selectable state.
12 Press Ctrl+D to exit Design mode.
The buttons are configured and can be tested.
13 Save the dashboard.
Note:
The Chart Shade component works only on associated charts. If charts have not been associated,
open Dashboard Studio, and move to the Associate step, and click to associate the embeddedobjects (buttons).
Optional: An alternative way to configure the images is to select View, then Unhide Sections,and select Qiq_chartshade. Enter Design mode, copy the buttons from the toolbar, and pastethem onto the dashboard frames that will utilize the buttons. Exit Design mode and save thedashboard.
Proceed to configuring the color palettes for the component.
Setting Color Palettes in the Chart Shade ComponentDashboard Studio contains color palettes that are used to configure the look and feel ofdashboard frames. To configure and apply color palettes, use the Chart Shade Properties frame.Color palettes to use for Chart Shade can be configured in the Color Palette Properties frame.See “Using the Color Palette Properties Frame” in the Hyperion Interactive Reporting – ObjectModel and Dashboard Development Services Developer's Guide, Volume 5: Dashboard Studio.
➤ To use the Chart Shade Properties frame:
1 Use the Interactive Reporting document from the Configuring Chart Shade Buttons procedure, and navigateto Chart Shade Properties.
To access the configuration frame, use Sections or the Configuration drop-down list found inDashboard Studio.
2 Optional: From Palette Configuration, select Concatenate Palettes to enable a cycle of color schemes.
For example, if a user specifies a color palette that contains 16 color values and a bar chart thatcontains more than 16 bars, the color of the seventeenth bar is the first color of the next palette.A repeating cycle of color values occurs if all palettes are exhausted.
The 16 colors of a palette are displayed in the 16 squares under Available Palettes and SelectedPalettes.
3 Move selected palettes between Available Palettes and Selected Palettes by clicking and .
30 Dashboard Studio Chart Shade Component
4 Optional: Reorder Selected Palettes by selecting a palette and clicking or .
5 Perform an action:
● To discard selected palettes and reload the original settings, click Restore
● To remove Selected Palettes, click Clear
● To remove all entries, click Clear All
● To load the palettes, click Apply
6 Navigate to the Interactive Reporting document from the Configuring Chart Shade Buttons procedure, and
click either or .
If multiple palettes are selected, a drop-down list is displayed.
7 Select a palette.
The chart color properties change to reflect the selection.
Optional: Select Refresh all charts if Refresh After Process. Selecting Chart, then RefreshData, and then After Process in Interactive Reporting Studio causes all charts in InteractiveReporting Studio to be refreshed after a process operation. When charts are refreshed columnscould change. If a column is added to a chart, it is added with the previously applied color schemeor hatching. Therefore, if all charts are refreshed, that is, Refresh Data, then After Process isselected, and the user opens a report that contains that chart, the extra unshaded column isdisplayed. Selecting Refresh all charts if Refresh After Process in the Chart Shade componenteliminates that situation at the cost of refreshing all charts in the system when a user changes asection, and both conditions are met. The process can be slow if there are multiple sections andcharts.
Notes on PerformanceThe Chart Shade component changes the legends for charts in a dashboard. As a result, if a largenumber of charts are present, the Chart Shade function may take longer to execute.
This performance issue affects embedded charts in reports. Groupings in reports can result inmultiple charts being generated from one chart section. These charts must be painted or shadedindividually, resulting in changes to shading taking a noticeable amount of time.
Test CasesThese are test case results.
Test Case 1: Interactive Reporting document with 4 charts and empty report section.
Test Case 2: Interactive Reporting document with 4 charts and a report that contains Chart A(no items on z-axis).
Test Case 3: Interactive Reporting document with 4 charts and a report that contains Chart B(contains items on z-axis).
Notes on Performance 31

Test Case 4: Interactive Reporting document with 4 charts and a report that contains Chart Awith group headers.
Test Case 5: Interactive Reporting document with 4 charts and a report that contains Chart Bwith group headers.
Test Case 6: Interactive Reporting document with 4 charts and a report that contains Chart Aand Chart B with group headers that result in many charts.
Test ResultsThe recorded times in Table 4 are estimates.
Table 4 Test Results
Apply Hatching Apply Color Palette
Case 1 <= 1 second <= 1 second
Case 2 <= 2 seconds < 2 seconds
Case 3 < 2 seconds <= 2 seconds
Case 4 <= 5 seconds <= 6 seconds
Case 5 <= 42 seconds <= 43 seconds
Case 6 <= 60 seconds <= 64 seconds
Setting FiltersWhen using the Chart Shade component in combination with setting filters in dashboards,Interactive Reporting Studio Release 6 may return a message that the chart contains bad data.The problem is intermittent and was resolved in Release 8.
Updating Interactive Reporting Documents that Contain theChart Shade ComponentUpdating an Interactive Reporting document that includes the Chart Shade component, updatesthe code but does not add the Chart Shade Properties frame, because the DashboardDevelopment Services Update Utility does not enforce the addition of component sections.Therefore, the user must merge the component configuration frame into the document. See“Merging Components” on page 10. After the component is merged, the code is updated andrecognizes the configuration frame.
32 Dashboard Studio Chart Shade Component

4Dashboard Studio ConditionalNavigation Properties Frame
In This Chapter
Conditional Navigation Properties Frame ... . . . . . . . . . . . . . . . . . . . . . . . . . . . . . . . . . . . . . . . . . . . . . . . . . . . . . . . . . . . . . . . . . . . . . . . . . . . . . . . . . . . . .33
Configuring with the Conditional Navigation Properties Frame ... . . . . . . . . . . . . . . . . . . . . . . . . . . . . . . . . . . . . . . . . . . . . . . . . . . . . . . . . . . . . .33
Conditional Navigation Properties FrameThe Conditional Navigation Properties frame provides a mechanism to configure thenavigational structure of dashboards based on selected query limits values. The componentextends navigation, which is set in Step 5: Configure Navigation of Dashboard Studio by enablingusers to specify fixed and conditional navigation items. Fixed navigation items are displayed onevery section. Conditional navigation items are displayed only if the appropriate query limitshave been set.
Conditional Navigation Properties enables sections to be hidden that contain no data if a queryis processed with restrictive query limits selected. For example, a dashboard that contains ananalysis called Rental Returns, is not blank if rr is selected for the query limits called Actions. InActions, if del is selected, and the query is processed, you can use the Conditional NavigationProperties frame to suppress the Rental Returns section.
Note:
Configuration frames are part of the design process and are only available in templates and ESMs;therefore, they are not available in runtime releases.
Configuring with the Conditional Navigation Properties FrameThe Conditional Navigation Properties frame enables users to dynamically create a uniformnavigation structure for dashboards, by enabling only specific frames to be visible when certainquery limits are selected.
To configure the Conditional Navigation Properties, the component must first be merged withan Interactive Reporting document (see “Merging Components” on page 10). And query limitsmust be available.
Conditional Navigation Properties Frame 33

➤ To create the query limits:
1 Merge the component, Conditionalnavigation_component.bqy with an ESM; for example,Sample_en_esm.bqy.
See “Merging Components” on page 10.
2 From Sections, select a query.
For example, select Sales Query.
3 Drag columns from the topics onto the Filter line; for example, select and drag State.
Filter is displayed.
4 Optional: If Sample.oce is displayed, click OK without entering any data.
5 In Filter, click Show Values and select one or more values.
For example, select AZ and CA.
6 Click OK.
7 Click Process on the Interactive Reporting Studio toolbar.
The results are displayed and query limits are set.
➤ To use query limits to create conditional navigation:
1 Use the Interactive Reporting document that contains query limits, and navigate to Conditional NavigationProperties.
To access the configuration frame, use Sections or the Configuration drop-down list found inDashboard Studio.
2 From Query Limits, select an option.
● All query limits—Displays all query limits
● Configured query limits—Displays only query limits for which at least one conditionalnavigation specification exists
● Unconfigured query limits—Displays only query limits for which no conditional navigationspecifications exist
These options filter query limits that are displayed in Select a Query Limit, which is created whensearching for query limits in queries, data models, and appended queries.
3 Select a query limit in preparation for configuring how a selected value will dynamically change the navigationstructure.
4 Optional: Select an option:
● Enter one or more Query Limit Values separated by ++, and manually enter the values
● Select an existing Query Limit Value, and from the drop-down list, select a value
5 Control the types of Available Sections by selecting or clearing the section check boxes.
Available Sections are not displayed in the navigation structure of the dashboard.
34 Dashboard Studio Conditional Navigation Properties Frame

6 Move selected sections to be set as Fixed Navigational Items by clicking (next to Fixed NavigationalItems).
Fixed Navigational Items are displayed in the navigation structure no matter which query limitsare selected.
7 Move selected Available Sections to associate with the entered or selected query limit value, by clicking
(next to Conditional Navigation Items).
Conditional Navigation Items display in the navigation structure if the associated query limit isselected. These items are added only if a query limit is selected and if a value for that query limitis specified. See steps 4 and 5 in this procedure.
Query Limit _:_ Limit Value _:_ Section refers to the query limit chosen in Select a Query Limit,the limit values specified in Enter a new Query Limit Value or Select an existing Query LimitValue, and the dashboard frame that is displayed.
8 Optional: Reorder selected items in Fixed Navigational Items or Conditional Navigation Items by selecting
an item and clicking or .
9 Perform an action:
● To discard all current entries and to reload the original settings, click Restore
● To remove the items from the Fixed Navigational Items and Conditional Navigation Items,click Clear
● To load the navigational settings, click Apply
Note:
Configuration frames are part of the design process and are only available in templates and ESMs;therefore, they are not available in runtime releases.
Configuring with the Conditional Navigation Properties Frame 35

36 Dashboard Studio Conditional Navigation Properties Frame

5Dashboard Studio Conditional
Sub-Queries Component
In This Chapter
Conditional Sub-Queries Component .. . . . . . . . . . . . . . . . . . . . . . . . . . . . . . . . . . . . . . . . . . . . . . . . . . . . . . . . . . . . . . . . . . . . . . . . . . . . . . . . . . . . . . . . . . .37
Conditional Sub-Queries Component Example... . . . . . . . . . . . . . . . . . . . . . . . . . . . . . . . . . . . . . . . . . . . . . . . . . . . . . . . . . . . . . . . . . . . . . . . . . . . . . . .38
Activating Sub-Queries with the Conditional Sub-Queries Component in a Runtime Release... . . . . . . . . . . . . . . . . . . . . . . . . . . .39
Configuring the Conditional Sub-Queries Component .. . . . . . . . . . . . . . . . . . . . . . . . . . . . . . . . . . . . . . . . . . . . . . . . . . . . . . . . . . . . . . . . . . . . . . . . .40
Conditional Sub-Queries ComponentThe Conditional Sub-Queries component enables you to sort through numerous detailedtransactions, highlighting low-level exceptions and identifying the small number that fail to meetthe threshold.
Sifting through a sales database with numerous daily consumer transactions to find exceptionsis inefficient. To discover these exceptions, data must be sorted at a detailed level—transactionby transaction. Sorting involves reading all transactions and applying exception criteria. Toolsthat undertake this task, must load the transactions into memory and take time to read the data.If the data is cached in a document; such as, an Interactive Reporting document, time is requiredfor the document to open and exceptions to be viewed. Users do not want to wait for theirdocuments to open, and system managers do not want their resources to be used inefficiently,in this case; reading, saving, and shipping large information volumes over the network.
The Conditional Sub-Queries component provides a solution by dividing the process into twoqueries—the primary query and the sub-query.
Primary Query
The primary query (multiple queries can exist in an Interactive Reporting document) isscheduled and runs in the scheduler. It reads only the columns needed to identify exceptionaltransactions, and produces a table of key values that identify those transactions. The table is theLimit Lookup Table. Unlike most scheduled queries, the primary query results are not saved,because the data is mostly of little interest and increases the Interactive Reporting documentsize.
Sub-Query
The sub-query (multiple sub-queries can exist in an Interactive Reporting document) is notscheduled, but is executed programmatically by the component after the scheduler runs theprimary query. The Conditional Sub-Queries component transfers key values from the Limit
Conditional Sub-Queries Component 37

Lookup Table and applies them as filters to the sub-query, processed by the component. Thesub-query retrieves exceptional transaction details, and saves the results.
Applying filters to the sub-query, enables the sub-query to generate only exception details thatrequire action. The end result is the slimmest Interactive Reporting document with the full detailrequired to manage and analyze exceptions.
The Conditional Sub-Queries component also enables dashboards to activate sub-queries basedon a user event; for example, when a user selects an item from a drop-down list. In this case, acustom event, such as <Dropdown Selection> as defined by the dashboard developer, replacesthe primary query. When the component receives the custom event, it activates the sub-queryassociated with the event. The Limit Lookup Table associated with the custom event defines thesub-query filters.
Other regular queries may be available in the Interactive Reporting document.
Conditional Sub-Queries Component ExampleExample: Working with Conditionalsubqueries_component.bqy.
Note:
For Conditionalsubqueries_component.bqy to work correctly, it must be first mergedwith another Interactive Reporting document; for example, Sample_en_esm.bqy. See“Merging Components” on page 10.
➤ To use Conditionalsubqueries_component.bqy:
1 Merge Conditionalsubqueries_component.bqy and Sample_en_esm.bqy.
See “Merging Components” on page 10.
2 In Interactive Reporting Studio, from Sections, right-click Sales Query and select Duplicate section.
Sales Query2 and Sales Results2 are created.
3 Rename Sales Query2 to be Secondary Query, and Sales Results2 to be Secondary Result.
4 Select Sales Query, and drag State to the Filter line.
Filter is displayed.
5 Optional: If the Sample.oce dialog box is displayed, click OK without entering any information.
6 Select Show Values, and select AZ and CA.
7 Click OK, and select State on the Filter line.
8 Select Query, then Variable Filter.
9 From Sections, select Secondary Query, and drag State to the Filter line.
10 For Secondary Query, repeat steps 5-7, but do not set as a variable filter.
Proceed with setting the component properties and processing the queries.
38 Dashboard Studio Conditional Sub-Queries Component

➤ To set the component properties and process the queries:
1 From Sections, select Conditional Sub-Queries Properties frame.
2 From Available Queries, select Sales Query and click to move it to Primary Events.
3 From Event Name, select Sales Query.
4 From Limit Lookup Table, select Sales Results.
5 From Available Queries, select Secondary Query and click to move it to Sub-Queries.
6 Click Apply.
7 From Sections, select Sales Query, and click Process.
Filter is displayed with AZ and CA selected. Click OK. Sales Results displays data only for AZand CA.
8 From Sections, select Secondary Results.
The data from the primary query is returned in the sub-query; that is, the data is displayed onlyfor AZ and CA.
Activating Sub-Queries with the Conditional Sub-QueriesComponent in a Runtime Release
Two ways to activate and run a sub-query are:
1. Using a primary query.
2. Using a custom user event.
➤ To run a sub-query using a primary query:
1 In Interactive Reporting Studio, open the sample Conditional Sub-Queries component document(Conditionalsubqueries_sample_esm.bqy).
Process Event Example displays the primary query results and the results of the attached sub-query. Primary Query Results (Limit Lookup Table) is empty to conserve space, as the resultsare not saved with the document.
2 Click Process Selected values in Primary Query, and launch Sub-Query to get detailed results.
3 If the Filter dialog box is displayed, select filter values, and click OK.
For example, select Store Type, then Computer, and then click OK. Select OS, then SCSI, andthen click OK.
Primary Query Results (Limit Lookup Table) displays the key values identifying the items ofinterest; for example, Store Type and Os.
The Conditional Sub-Queries component detects a primary query was processed and activatesthe attached sub-query, by using the Limit Lookup Table as a filter. As a result, Sub-Query Resultsis updated to reflect the values in the Primary Query Results (Limit Lookup Table).
Activating Sub-Queries with the Conditional Sub-Queries Component in a Runtime Release 39

➤ To run a sub-query using a custom user event:
1 In Interactive Reporting Studio, open the sample Conditional Sub-Queries component document(Conditionalsubqueries_sample_esm.bqy).
2 From Sections, select User Event Example.
The section displays information about under-performing stores whose transactions are belowa certain amount. The Limit Lookup Table is the results section of a regular query, that is savedwith the document and displayed when opened.
3 From with transactions below $, select a value.
For example, select $200 to enable the filter in the Limit Lookup Table to display keys that identifystores with daily sales below $200. The action also passes a <Dropdown Selection> customevent to the Conditional Sub-Queries component, which launches the associated sub-query.
Sub-Query Results (Details of underperforming stores) displays the stores with daily sales below$200.
In these instances, there is no need to embed a results section or a Limit Lookup Table indashboard sections for the component to work. The sections are illustrations only. Charts, pivots,or tables created from sub-queries can be embedded to provide more information for end users.
Configuring the Conditional Sub-Queries ComponentTo configure the Conditional Sub-Queries component:
1. Merge the component. See “Merging Components” on page 10.
2. Build component entries by creating an item:
● a primary query
● a custom event
3. Schedule the document on the server.
Building Conditional Sub-Queries Component EntriesThe Conditional Sub-Queries component enables you to open sub-queries for an event bylaunching a primary query or defining a custom event and broadcasting the event when it occurs.The component then launches the nominated sub-queries.
Build a Conditional Sub-Queries component entry by creating a primary query or a customevent to execute sub-queries.
Creating Primary Queries that Execute Sub-Queries
➤ To create a primary query that executes sub-queries:
1 In Interactive Reporting Studio, open a dashboard that contains the Conditional Sub-Queries component.
40 Dashboard Studio Conditional Sub-Queries Component

2 Build a primary query to retrieve columns that contain transactions of interest.
3 Process the query.
Use computed values in the results section filters to limit results and display transactions ofinterest.
A sub-query needs keys to identify the transactions. Primary Query Results may contain key andadditional information, such as computed items or columns used to analyze transactions;therefore, another table may be required that contains only keys.
4 Optional: If Primary Query Results contains more than key information, build a Limit Lookup Table thatcontains only the keys needed to identify the transactions.
Each column in the table is transferred as a filter to the sub-query.
5 Build a sub-query that displays transaction information that is identified in the primary query.
For example, to obtain information on under–performing stores, drag the columns; storelocation, manager, and contact phone number onto the Request line.
For each primary query, one or more sub-queries can be built.
6 Create filters within the sub-query to match columns in the Limit Lookup Table by performing an action:
● If the Conditional Sub-Queries component is used, values are transferred from the LimitLookup Table into the sub-query as filters before processing the sub-query (Because thesub-query contains filters, the component retrieves details for a small number of rows, savingtime and disk space)
● The conventional way of searching for exceptions without using the component, is to obtaindetails for all transactions and search for exceptions all in one query (A column in the LimitLookup Table may have no equivalent filter in a sub-query. This scenario is possible if twoor more sub-queries are present. In this case, there is no need to add the filter to the sub-query. The component does not apply the missing filter when it executes the sub-query)
7 Under the File, Save Options, select Save Query Results with document.
8 Clear the primary query.
Clearing prevents the Interactive Reporting document from becoming too large (by includingthe primary query results).
9 After the primary query is processed:
a. Open the Interactive Reporting document and navigate to the Conditional Sub-QueryProperties frame.
Available Queries displays all queries available in the document.
b. Move selected queries between Available Queries and Primary Events by clicking and
.
Multiple primary queries can exist in an Interactive Reporting document.
c. In Sub-Query Properties, define the action that the component must perform when theprimary query is processed.
Configuring the Conditional Sub-Queries Component 41

d. From Event Name, select the primary query added in step b.
The component loads the sub-query that the primary query is to launch. It also displaysthe Limit Lookup Table from which the sub-query obtains the filter values. As it is the firsttime that the primary query is defined, the items are blank.
e. Optional: Select Add Custom Event. See “Creating Custom Events that Execute Sub-Queries” on page 42.
f. From Limit Lookup Table, select the results or table that contains values to filter the sub-query.
g. Move selected sub-queries to be launched when the selected primary query is processed,
between Available Queries and Sub-Queries by clicking and .
h. Click Apply.
After the primary query is created, it must be tested.
➤ To test the primary query:
1 Navigate to the primary query results.
The results should be empty.
2 Process the primary query.
The results section is populated.
3 Navigate to the sub-query results section.
The results are updated to reflect the transactions identified in the Limit Lookup Table.
Import the Interactive Reporting document to the server so it processes more quickly and canbe run at a convenient time; for example, overnight in an office environment.
Creating Custom Events that Execute Sub-QueriesA custom event is an event in which sub-queries are launched. Events need not be launchedfrom primary queries. For example, you can execute a sub-query when an item is selected froma drop-down list, or a button is clicked, or where a complex calculation is included in the code.The event is defined, and, when the component receives the event, the component executes thenominated sub-queries by using values from the nominated Limit Lookup Table as query limits.
➤ To define and test a custom event:
1 In Interactive Reporting Studio, open a dashboard that contains the Conditional Sub-Queries component.
2 Build a results or table section that contains columns to be used as filters for the sub-queries.
This is the Limit Lookup Table.
3 Build one or more queries to be launched when the custom event occurs.
The queries are later designated as sub-queries.
4 Create filters within each sub-query by using columns in the Limit Lookup Table.
42 Dashboard Studio Conditional Sub-Queries Component

When the Conditional Sub-Queries component processes the sub-query, values are transferredfrom the Limit Lookup Table into the sub-query as filters.
A column in the Limit Lookup Table may have no equivalent filter in a sub-query. This scenariois possible if two or more sub-queries are present. In this case, there is no need to add the filterto the sub-query. The component does not apply the missing filter when it executes the sub-query.
5 Link the sub-queries and the Limit Lookup Table to the custom event.
a. Open the Interactive Reporting document and navigate to Conditional Sub-QueryProperties.
b. From Sub-Query Properties, select Add Custom Event.
c. In the text box, enter the custom event name, and click Add.
The custom event is added to Event Name.
d. In Sub-Query Properties, define the action that the component must perform when thecustom event is processed.
e. From Event Name, select the custom event added in step c.
The component loads the sub-query. It displays the Limit Lookup Table from which thesub-query obtains the filter values. As it is the first time the custom event is defined, theitems are blank.
f. From Limit Lookup Table, select the results or table that contains values to be used to filterthe sub-query.
g. Move selected sub-queries to be launched when the component receives the custom event,
between Available Queries and Sub-Queries by clicking and .
h. Click Apply.
6 In the document, add JavaScript to the event.
For example, in a button handler OnClick(), or drop-down list handler OnSelection(), orin the code enter this JavaScript:
if (ActiveDocument.Hysl_csq) { Hysl_csq.Hysl_doSubQuery("<My Event Name>")}
7 To test, run the event.
The Conditional Sub-Queries component executes the nominated sub-queries.
Scheduling Conditional Sub-Queries Component Documentson the ServerThe Conditional Sub-Queries component works only on server Release 8.2 and earlier.
The component performs chained queries on a desktop computer. However, if millions oftransactions are stored, a desktop computer requires an excessive amount of process time. In
Configuring the Conditional Sub-Queries Component 43

this case, the Interactive Reporting document can be imported and scheduled to run on a server,preferably when it can run in an uninterrupted environment; for example, overnight.
➤ To schedule an Interactive Reporting document on the server:
1 On the server, import and schedule an Interactive Reporting document.
From Query Connections and Processing, select only primary queries and ordinary queries, ifavailable, for scheduling.
Do not schedule sub-queries as they are processed by the Conditional Sub-Queries componentusing the primary query results.
2 Run the query.
3 If a prompt is displayed asking for variable filters, select the values, and click OK.
4 Open the resulting Interactive Reporting document in Oracle Enterprise Performance ManagementWorkspace, Fusion Edition or Oracle's Hyperion® Interactive Reporting Web Client.
If the scheduling process was run in conjunction with a sub-query that uses a custom user event,the sub-query results in Process Event Example display store details that were specified by thecustom user event. See “Activating Sub-Queries with the Conditional Sub-Queries Componentin a Runtime Release” on page 39.
44 Dashboard Studio Conditional Sub-Queries Component
6Dashboard Studio Copy Scale
Component
In This Chapter
Copy Scale Component .. . . . . . . . . . . . . . . . . . . . . . . . . . . . . . . . . . . . . . . . . . . . . . . . . . . . . . . . . . . . . . . . . . . . . . . . . . . . . . . . . . . . . . . . . . . . . . . . . . . . . . . . . .45
Using a Runtime Release of the Copy Scale Component .. . . . . . . . . . . . . . . . . . . . . . . . . . . . . . . . . . . . . . . . . . . . . . . . . . . . . . . . . . . . . . . . . . . . .45
Configuring Charts for use in the Copy Scale Component .. . . . . . . . . . . . . . . . . . . . . . . . . . . . . . . . . . . . . . . . . . . . . . . . . . . . . . . . . . . . . . . . . . . .47
Copy Scale ComponentThe Copy Scale component enables you to configure chart axes to behave in an alternate mannerto the default behavior applied by Interactive Reporting Studio.
The component is designed to manipulate bar and line charts. A bar and line chart displays factsusing pairs of columns. The first column is displayed as a bar, the second is shown as a line. Thisbehavior displays a comparison of two value types.
1. Values that do not use the same scale; for example, Revenue and Rainfall, Revenue and UnitsSold, and so on.
2. Values that are similar in scale; for example, Plan versus Actual.
Interactive Reporting Studio independently calculates bar and line chart axes (left and right).The behavior is ideal for example 1, but is problematic for example 2, as it can present amisleading data view. In example 2, the scales on the sides should be identical to showimmediately how close the planned value is to the actual value.
The Copy Scale component manipulates chart axes and sets the scales to match. The largest valueis set within the visual scope of the chart. The component includes a configuration frame thatspecifies which charts are to be manipulated and which keep the default behavior.
Using a Runtime Release of the Copy Scale ComponentThe default behavior in Interactive Reporting Studio is to independently calculate bar and linechart axes (left and right). However, a misleading view of the data can result. In dashboardsconfigured with the Copy Scale component, this feature can be applied to a chart so that thescales on the axes are identical. The result is a more accurate representation of the data.
Figure 1 displays a chart that is not configured with the Copy Scale component, and Figure 2displays a chart with the Copy Scale feature applied.
Copy Scale Component 45

Figure 1 Bar and Line Chart Displays Default Behavior
Figure 2 Copy Scale Component Applied to Chart
46 Dashboard Studio Copy Scale Component

Configuring Charts for use in the Copy Scale ComponentThis procedure describes the process of configuring bar and line charts used by the Copy Scalecomponent.
➤ To configure bar and line charts:
1 In Interactive Reporting Studio, open a dashboard that contains the Copy Scale component.
2 Navigate to QIQ CopyScale Properties.
To access the configuration frame, use Sections or the Configuration drop-down list found inDashboard Studio.
Use QIQ CopyScale Properties to specify the bar and line charts to which the componentfunction is applied.
When the component is merged into a dashboard, the default Interactive Reporting Studiobehavior is applied to all bar and line charts.
3 From Default Scale Configuration, select an option.
Default Scale Configuration applies the selected option to all bar and line charts (without anapplied explicit configuration).
● Do not adjust the scales—Applies the default Interactive Reporting Studio behavior for allcharts
● Apply maximum scale to both axes—Selects the larger scale of a bar and line chart andapplies it to the left and right axes of all bar and line charts
4 To apply another configuration for charts, from Explicit Scale Configuration, select an option to manipulatechart sections.
● All Dashboards—All frames in the dashboard
● Unconfigured Dashboards—Only frames with the default scale applied
● Configured Dashboards—Only frames that contain explicit settings
5 In Explicit Scale Configuration, from the drop-down list, select a frame to be manipulated.
6 Optional: Click to view the selected frame.
7 From Configure Selected Dashboard, select an option to set the scales to apply to the charts.
● Do not adjust the scales—Applies the default Interactive Reporting Studio behavior forselected charts
● Apply maximum scale to both axes—Enables the scale of the selected chart to be manipulated
All available chart sections from the selected frame are displayed in Use Default Scale.
8 Select the chart to be configured, and click to identify the underlying chart sections on the frame.
Charts are listed as Chart1, Chart2, and so on, not as the display names assigned by the dashboarddeveloper.
9 Click Apply.
Configuring Charts for use in the Copy Scale Component 47

The scales on the selected charts are configured.
The Copy Scale feature takes effect only after the embedded charts are associated through theAssociate step in Dashboard Studio.
➤ Optional: To determine the name of the chart that is being configured:
1 Move to the frame that contains the chart.
2 Press Ctrl+D to enter Design mode.
3 Perform an action:
● Click the chart and note the name provided on the status bar
● Double-click the chart to view the name in Properties
If the selected section is not a bar and line chart, the scale settings are not applied until the charttype is changed to bar and line.
4 Press Ctrl+D to exit Design mode.
48 Dashboard Studio Copy Scale Component

7Dashboard Studio Drill Across
Component
In This Chapter
Drill Across Component .. . . . . . . . . . . . . . . . . . . . . . . . . . . . . . . . . . . . . . . . . . . . . . . . . . . . . . . . . . . . . . . . . . . . . . . . . . . . . . . . . . . . . . . . . . . . . . . . . . . . . . . . . .49
Using a Runtime Release of the Drill Across Component .. . . . . . . . . . . . . . . . . . . . . . . . . . . . . . . . . . . . . . . . . . . . . . . . . . . . . . . . . . . . . . . . . . . . .50
Configuring the Drill Across Component .. . . . . . . . . . . . . . . . . . . . . . . . . . . . . . . . . . . . . . . . . . . . . . . . . . . . . . . . . . . . . . . . . . . . . . . . . . . . . . . . . . . . . . . .52
Drill Across ComponentThe Drill Across component caches data in an Interactive Reporting document, dynamicallyretrieves un-cached data just-in-time, and drills into the data. The technique is also available inInteractive Reporting Studio as Drill to Detail, and in the Conditional Sub-Queries component.
Using the Drill Across component, you can double-click a cell (using theOnCellDoubleClick event) in an embedded active pivot (source embedded pivot or SEP) ina dashboard section. The intersection of the side label and top label values, plus active local filtersand query filters becomes the context for the drill across operation, and you are taken to a targetembedded pivot (TEP). For example, you are examining a general ledger pivot and you use thedrill across operation to navigate to view the contents of a cell value, the underlying invoice,freight costs, and salaries. At any point, you can drill back to the launch point.
Each SEP is configured to have one or more associated TEPs. TEPs can reside in the samedocument as SEPs or in different documents. The relationship between SEPs and TEPs is througha tabular structure, such as an Excel spreadsheet or a database table. (Replicate the table in alldocuments that contain SEP and TEP configuration.)
The Drill Across component includes the following sections:
● Hysl_idc (Inter-document Communication)—Manages the initiation of drilled-todocuments and the passing of information between documents; initiaties drill across anddocuments responding to drill across requests
● Hysl_drillAcross (Drill Across)—Manages the gathering of the drill-point intersection,local filters, and query limits, and makes the drill request to the correct document by usingHysl_idc; administers the configuration of the sources and targets through a table; usesHysl_queryDatamodel to discover the query limits set in the source; and uses internalstructures to execute a subordinate query if responding to a drill request.
Drill Across Component 49

Note:
The Drill Across component functions with Interactive Reporting documents in Release 9.0 andlater.
Note:
The Drill Across component does not work in EPM Workspace since theOnCellDoubleClick event is not available, and it is not possible to communicate betweendocuments. Drilling across to a separate document is not available in Interactive Reporting WebClient since only one document can be active at a time. However, if the SEP and the TEP are inthe same document, the feature is available to users of Interactive Reporting Web Client.
Using a Runtime Release of the Drill Across ComponentAn example using two sample dashboards, sales and costs, is provided in this topic.
The Sales Dashboard_esm.bqy and the Costs Dashboard_esm.bqy sample files areavailable with the Drill Across component in this installation.
Example Using Sales and Costs DashboardsBoth documents contain a summary query that can be processed by using the Query Panel anda pivot from which detailed information is obtained using the Drill Across component. You canobtain additional detail for sales or costs using the drill across target in the same document, orby obtaining detailed sales or costs information using the drill across target in the otherdocument. For example, from the sales dashboard you can drill across to the costs dashboardto acquire further information.
Inter-document communication is managed by settings in the IDC Table, which is an importeddata file from an Excel spreadsheet, or is created as a query from a central database. The tableand column names can be configured or reconfigured through the Drill Across Propertiesconfiguration frame. See “Using the Drill Across Properties Frame” on page 54.
Note:
The example uses the sample Access database, sample documents, and data models.
Using Source and Target Dashboards
➤ To use a source and a target dashboard:
1 Open a source document (for example, Sales Dashboard_esm.bqy)..
Query panel is displayed.
2 Select one or more filters, and run the query.
50 Dashboard Studio Drill Across Component

The Home dashboard is displayed.
3 Optional: Click , and process another query using different query limits.
4 Optional: Set local filters.
5 Optional: Modify the target of the drill operation using .
6 Double-click a cell in a pivot to commence the drill request. These actions are performed:
● The drill intersection is computed
● Local filters are gathered
● Query limits are gathered
● The Query Panel connection credentials are gathered
● The drill request is initiated
● The target document is opened
● The credentials and limits are applied to the drill query of the target document and the queryis processed
● The target section is displayed
7 Optional: Close the document and the source is displayed, or click to display the source.
Drilling Operations
➤ To drill by double-clicking a pivot cell:
1 Open a dashboard that contains the Drill Across component.
2 From the Query Panel, click to process the query.
A pivot is displayed.
3 Double-click a cell in the pivot.
A dialog box is displayed asking for confirmation of the target and to drill across.
Optional: To change the drill target, see the procedure below.
4 Click OK to accept the default target and drill across.
The target is displayed.
➤ To change the drill target:
1 From the dialog box that asks for confirmation of the target and to drill across, select No.
2 Click to change the drill target.
3 Double-click the pivot cell again.
Using a Runtime Release of the Drill Across Component 51

➤ To return from a drill operation, click . The source section, from which the drill was initiated,is displayed.
Configuring the Drill Across ComponentConfiguring the Drill Across component involves:
● Identifying and configuring Source documents and Target sections
● Merging the necessary components
● Creating an IDC Table and merging it into Source documents
● Configuring Drill Across Properties in Source documents
Source documents contain the pivot that enables you to drill to a target section. Sourcedocuments must have the following Dashboard Studio components merged to it. Thecomponents must be merged separately.
● Drill Across
● Quick Query Limits
Target documents contain the section drilled into by source documents. (The target documentcan be the same as the source document). If the target section is in a different document thanthe Source document, then the document containing the Target section must also have the DrillAcross component merged to it.
Note:
The Quick Query Limits component and the Drill Across component must be merged separately.
Building Dashboards
➤ To build dashboards:
1 Use the Dashboard Studio wizard, or the Webdash Builder component Build Dashboard frame.
See “Chapter 4, Using Dashboard Studio to Develop Dashboards” for wizard steps in theHyperion Interactive Reporting – Object Model and Dashboard Development Services Developer'sGuide, Volume 5: Dashboard Studio, or Chapter 22, “Dashboard Studio Webdash BuilderComponent.”
2 Merge the necessary components to the document.
See “Merging Components” on page 10.
3 Use the Query Panel to create query limits.
4 Set the Query Panel as the default startup section.
5 Import the Excel spreadsheet that was created when building a network of dashboards.
52 Dashboard Studio Drill Across Component

The spreadsheet defines the sources and targets in the dashboard. For simplicity, the documentsshould share the same spreadsheet.
6 From Sections, select Drill Across Properties and identify the table that contains the source and targetmappings.
See “Using the Drill Across Properties Frame” on page 54.
Using the OnCellDoubleClick event, the component:
● Navigates to each embedded pivot on the dashboard that acts as a launch point for a drillacross operation and enters Design mode.
● Copies and pastes the common line of script from any button on the toolbar into theOnCellDoubleClick event:
ActiveDocument.Sections.Item(txlMe.Text).Qiq_onControlClick(this.Parent,this)
Creating an Excel SpreadsheetExcel spreadsheets should contain column headers similar to those found; for example, in theSales Dashboard_esm.bqy which is installed with the Drill Across component.
SourceDocument
SourceSection
TargetPath
TargetDocument
TargetSection
TargetQuery
TargetLabel
Target ServiceKey
SalesDashboard
SummarySales
c:\Targets CostsDashboard
CostsDetail
CostsDetailQuery
Costs Hysl_drillAcross
Column header definitions include:
● Source Document—Interactive Reporting document from which to drill across (Thedocument contains a source pivot that enables you to drill to a target section. The _esm suffixis not required for the file name as the Drill Across component works with ESMs and runtimereleases)
● Source Section—Interactive Reporting document section that contains an embedded pivotobject that is the launch point of the drill across operation
● Target Path—Absolute path to the folder of the target document (The column can be emptyif the target document is in the same folder as the source document)
● Target Document—Target Interactive Reporting document which is drilled into (Thedocument can be the same as or different to the source document)
● Target Section—Target Interactive Reporting document section that is displayed when thedrill across is complete
● Target Query—Target Interactive Reporting document query section (When a drill acrossoperation is performed, query filters, local filters, and the intersection of the pivotdimensions from the source document are applied as filter values to the InteractiveReporting document query section)
Configuring the Drill Across Component 53

● Target Label—Optional: User-friendly name for the target section, which is displayed inpreference to the section name
● Target Service Key—For the Drill Across component this is Hysl_drillAcross
➤ To create an Excel spreadsheet:
1 Create an Excel spreadsheet that maps the sources and targets.
2 Save the spreadsheet, import it into your dashboard, and rename it to be IDC Table.
Note:
IDC Table can also be implemented as a database table. The names and positions of the columnsare not important as these are selected in the Drill Across Properties frame.
Using the Drill Across Properties FrameUse Drill Across Properties to identify the table section that contains the source and targetmappings, and to identify which columns contain the required information.
If the dashboards are located together in one folder, then the Target Path column can be set tonull. However, the null column must be identified in Drill Across Properties.
➤ To use the Drill Across properties frame:
1 In Interactive Reporting Studio, open a dashboard that contains the Drill Across component.
For example, open Sales Dashboard_esm.bqy or Costs Dashboard_esm.bqy located inthe components folder with this installation.
2 Navigate to Drill Across Properties.
To access the configuration frame, use Sections or the Configuration drop-down list found inDashboard Studio.
3 From Drill Sources and Target Definitions Table, select a table.
For example, select IDC Table.
4 In Source Mappings, perform these actions:
● From Documents List Column, select a source document
● From Pivot Sections List Column, select a source section
5 In Target Mappings, perform these actions:
● From Path List Column, select a target path
● From Documents List Columns, select a target document
● From Target Query Names Column, select a target query
● From Sections List Column, select a target section
● From Target Labels Column, select a target label
● From Target Service Names Column, select a target service key
54 Dashboard Studio Drill Across Component

6 Perform an action:
● To discard drill across source and target mappings and reload the original settings, clickRestore
● To remove selected mappings, click Clear
● To load selected mappings, click Apply
7 From Sections, select the dashboard frame, and use the “Drilling Operations” on page 51 instructions todrill across.
Drilling to Separate Tables within the Same Query StructureIf it is not practical to run separate queries against a data source in response to a drill acrossrequest, you can configure the source and the target so they are in the same document andtherefore, depend on the same query. Typically the target is a table with the details and localfilters that only apply to that table. Therefore, the pivot acts as a summary and the table acts asthe detail without having to return to the data source and retrieve further data.
To configure the Drill Across component for this operation, the Target Query column must beempty, so no process takes place and only local filters are applied for the target structure. Thedashboard developer must set up the filters in the source and target structures. Typically in sucha configuration the filters that apply to the target structure are not present in the source structure,so that the source pivot does not change as filters are applied to focus the target on the selecteddetails.
Using Pivot Trees Component as a Drill Across SourceThe Drill Across component can be initiated from a pivot used by the Pivot Trees component.In the Pivot Trees component, a tree structure contained in one pivot column is used to expandor collapse a hierarchy. When a row that is a leaf node of the tree is double-clicked, then a drillacross operation is performed from that point if the current pivot is defined as a drill acrosssource. See Chapter 17, “Dashboard Studio Pivot Trees Component.”
Configuring the Drill Across Component 55

56 Dashboard Studio Drill Across Component

8Dashboard Studio Drill and
Slice Component
In This Chapter
Drill and Slice Component .. . . . . . . . . . . . . . . . . . . . . . . . . . . . . . . . . . . . . . . . . . . . . . . . . . . . . . . . . . . . . . . . . . . . . . . . . . . . . . . . . . . . . . . . . . . . . . . . . . . . . . .57
Using a Runtime Release of the Drill and Slice Component .. . . . . . . . . . . . . . . . . . . . . . . . . . . . . . . . . . . . . . . . . . . . . . . . . . . . . . . . . . . . . . . . . .57
Configuring the Drill and Slice Component .. . . . . . . . . . . . . . . . . . . . . . . . . . . . . . . . . . . . . . . . . . . . . . . . . . . . . . . . . . . . . . . . . . . . . . . . . . . . . . . . . . . . .58
Drill and Slice ComponentThe Drill and Slice component enables the dashboard developer to create a hierarchy of localfilters that are used as the basis for navigating through a data set in an Interactive Reportingdocument. Only one hierarchy can exist in an Interactive Reporting document. The hierarchymembers must be local filters.
As you descend through the hierarchy, the current hierarchy column replaces a pivot row labeland chart axis or both. At each level, you can select values to reduce the data that is available tothe next level.
Using a Runtime Release of the Drill and Slice ComponentUse the Drill and Slice component to create a hierarchy of filters that enable easy navigationthrough a data set in an Interactive Reporting document.
➤ To use the Drill and Slice component:
1 In Interactive Reporting Studio, open a dashboard that is configured with the Drill and Slice component.
2 From Quick Drill, select an item.
If the dashboard developer did not apply the setting to select the first item by default, no valuesare available in Quick Drill. A hierarchy item must be clicked to display the values to drill into.
3 Click to drill down.
The items are displayed in Quick Drill.
4 Optional: To drill up one level, click , and, to move to the top level, from the lowest level of the hierarchy,
click .
Drill and Slice Component 57

5 Double-click an item in Quick Drill to apply the item as a filter before moving to the next level in the hierarchy.
A chart located behind a pivot that is being drilled, is simultaneously being sliced.
Items selected in Quick Drill are applied as filters before the next column in the hierarchy isadded to the pivot.
To enable long entry names to be seen in full, select the item in Quick Drill. The full name isdisplayed as a text label above Quick Drill. For more information on expanding list descriptions,see “Using the List Expansion Properties Frame” in the Hyperion Interactive Reporting – ObjectModel and Dashboard Development Services Developer's Guide, Volume 5: Dashboard Studio.
The Drill and Slice component works with the Checkpoint control to store or restore the drillpath on a dashboard. See “Using Checkpoint Control” in the Hyperion Interactive Reporting –Object Model and Dashboard Development Services Developer's Guide, Volume 5: DashboardStudio.
Configuring the Drill and Slice ComponentTo configure the Drill and Slice component:
1. Merge the component. See “Merging Components” on page 10.
2. Optional: If a frame prototype including and was not created, configure buttonsto perform the drill and slice.
3. Create charts and pivots, and add the marker column where columns from the drill pathwill display.
4. Display charts and pivots on Drill and Slice frame prototypes, and associate these sectionsby using Dashboard Studio.
5. Optional: If issues arise because the marker column is called ... (an ellipsis), rename thecolumn.
6. In the Drill and Slice Properties frame, select and order local filters to create the drill path.
Configuring Drill and Slice Buttons
After merging the component, add and configure and . When the component isconfigured, the buttons enable you to drill into the data.
➤ To add and configure the Drill and Slice buttons:
1 In Interactive Reporting Studio, open a dashboard that contains the Drill and Slice component.
2 Select the frame on which to add the buttons, and press Ctrl+D to enter Design mode.
3 From the catalog pane, expand Graphics, and drag a picture object onto the frame.
4 Navigate to drill_down_Button.bmp in the Drill and Slice component directory, and position thebutton on the dashboard toolbar.
58 Dashboard Studio Drill and Slice Component

5 Double-click the button.
Properties is displayed.
6 Enter pic^hysl_drillAndSlice^down as the object name, and click OK
7 Select the button, right-click, and select Scripts.
Scripts Editor is displayed.
8 In Scripts Editor, perform an action:
● Enter this line of code
ActiveDocument.Sections[txlMe.Text].Qiq_onControlClick(this.Parent,this)
● Copy and paste the line of code from another button on the toolbar to avoid data entryerrors
9 Click OK.
10 Repeat steps 3–9 to select drill_up_Button.bmp, and enter pic^hysl_drillAndSlice^up asthe object name.
11 Optional: Add, configure, and name the corresponding gray buttons for the not selectable state.
12 Press Ctrl+D to exit Design mode.
Proceed with configuring the Drill and Slice component by creating and displaying charts andpivots.
Creating and Displaying Charts and Pivots on Drill and SliceFramesCharts and pivots to be displayed in the Drill and Slice component must be associated with Drilland Slice frames, so that the data is drilled and sliced correctly.
Drill and Slice frame prototypes are available with the installation and are selected in DashboardStudio, Step 2: Add and Rename Frames.
➤ To create, add, and associate charts and pivots with Drill and Slice frames:
1 In Interactive Reporting Studio, create the Interactive Reporting documents to be used, including thetemplate.
2 Create the charts and pivots to be drilled and sliced.
● Do not add the columns from your hierarchy
● Add and position the marker column that the Drill and Slice component uses to substitutecolumns from the hierarchy (see “Renaming the Marker Column” on page 60)
3 In Step 2: Add and Rename Frames of Dashboard Studio, add the frames upon which charts and pivotsare to be displayed.
Configuring the Drill and Slice Component 59

The frames must be the frame prototypes available in Drillslice_component.bqy. TheseDrill and Slice frame prototypes are also available in the Frame_Library.bqy in the templatesfolder.
4 Create Drill and Slice frames from a frame prototype:
● Top Controls Drop Down
● Top Controls Tabs
● Side Controls Tabs
5 In Step 3: Layout of Dashboard Studio, use Interactive Reporting Studio to drag the charts and pivots ontothe frames.
6 In Step 4: Associate Frames with Charts, Pivots, or Tables of Dashboard Studio, configure the featuresavailable for the charts and pivots.
7 Click to associate the charts and pivots with the frame prototypes.
Renaming the Marker ColumnThe Drill and Slice component creates a marker column called … (an ellipsis) in every resultsor table section. The column is empty and hidden from view. It acts as a placeholder for thecolumn values selected in the drill operation. A marker column must be added to each chart orpivot section to be drilled. If charts and pivots are to be drilled and sliced, they must be displayedusing the frame prototypes available with this component. These prototypes contain
placeholders for the drill path, and the buttons ( and ).
If a dashboard does not contain a marker column, no marker column is available. A markercolumn is created when the Drill and Slice Properties configuration frame is activated.
Optional: Use the Drill and Slice Properties configuration frame to rename the marker column.
➤ To rename the marker column:
1 Use the Interactive Reporting document from the Configuring Drill and Slice Buttons procedure, and navigateto Drill and Slice Properties.
To access the configuration frame, use Sections or the Configuration drop-down list found inDashboard Studio.
2 In Rename Marker Column, enter a name.
3 Click Rename.
Marker Column Name is refreshed to display the replacement name.
If, for example, the display name is entered by pressing the spacebar. The marker column nameis >| |<, bounded by >| and |<. In cases of escapable characters, the escaped form of the name isalso displayed; for example, >|%20|<.
60 Dashboard Studio Drill and Slice Component

Using the Drill and Slice Properties FrameThe Drill and Slice Properties frame is used to configure local filters into a hierarchy. Local filtersthat are excluded from the hierarchy are, however, made available in Step 6: Configure Filtersof Dashboard Studio.
➤ To configure Drill and Slice hierarchy path properties:
1 In Interactive Reporting Studio, navigate to QIQ Filter Properties and create local filters.
2 Add a marker column to row labels and the x-axis of pivots and charts that are included in the Drill and Sliceoperation.
The marker column is replaced by columns of the hierarchy during drill and slice.
3 After pivots and charts are configured with marker columns, move to Drill and Slice Properties.
4 From Hierarchy Source, select the section that contains the local filters that were created in QIQ FilterProperties.
5 Optional: Configure the hierarchy source by selecting one or both proposed options:
● First item is selected by default
● Filters are retained when drilling up
6 Move selected filters between Available Columns and Hierarchy Columns by clicking and .
7 Optional: Reorder selected Hierarchy Columns by selecting a column and clicking or .
8 Click Apply.
The hierarchy and all frames that use it are configured.
Configuring the Drill and Slice Component 61

62 Dashboard Studio Drill and Slice Component

9Dashboard Studio Workspace
Alert Component
In This Chapter
About the Workspace Alert Component.. . . . . . . . . . . . . . . . . . . . . . . . . . . . . . . . . . . . . . . . . . . . . . . . . . . . . . . . . . . . . . . . . . . . . . . . . . . . . . . . . . . . . . . . .63
Using the Workspace Alert Component with the Conditional Sub-Queries Component .. . . . . . . . . . . . . . . . . . . . . . . . . . . . . . . . . . . .64
Displaying Exceptions or Alerts .. . . . . . . . . . . . . . . . . . . . . . . . . . . . . . . . . . . . . . . . . . . . . . . . . . . . . . . . . . . . . . . . . . . . . . . . . . . . . . . . . . . . . . . . . . . . . . . . . .64
Configuring the Workspace Alert Component .. . . . . . . . . . . . . . . . . . . . . . . . . . . . . . . . . . . . . . . . . . . . . . . . . . . . . . . . . . . . . . . . . . . . . . . . . . . . . . . . . .66
About the Workspace Alert ComponentThe Workspace Alert component contains a Workspace Alert Properties frame to configureWorkspace Alert Interactive Reporting documents using tables. You can create a summary table(see “Creating Summary Tables” on page 100) or use an available table. Tables are configuredto display the data monitored. A system filter in the table bypasses other filters on the columnbeing evaluated. The component tests for any outlying rows from the threshold filter, and anyremaining rows are reported as an alert or exception. A list of tables is displayed under TableSections. Tables that contain exception items include the hidden column _sysException.
If rows are visible after processing a query and applying a filter, an alert or exception has occurred,and an output.properties file is created. Notification of no exceptions also occur. ClickApply in Workspace Alert Properties to create an orcl_Exception.txt file containing theexception data. For more information on exceptions and alerts, see “Using Exceptions” in theHyperion Workspace User's Guide.
Alerts are available to users when they subscribe to job output, and are displayed in EPMWorkspace Personal Pages, e-mails, or dashboards. See “Displaying Exceptions or Alerts” onpage 64.
Note:
Interactive Reporting documents that use the Workspace Alert component to report alerts orexceptions must be configured as a jobs in EPM Workspace.
Note:
In EPM Workspace, only one alert per Interactive Reporting document is displayed at a time,otherwise an error occurs.
About the Workspace Alert Component 63

Using the Workspace Alert Component with the Conditional Sub-Queries Component
The Workspace Alert component can be used with the Conditional Sub-Queries component,and is linked to the Conditional Sub-Queries primary table (see Chapter 5, “Dashboard StudioConditional Sub-Queries Component”).
The Conditional Sub-Queries component is configured to handle the threshold and monitorfor exception conditions. Using the Conditional Sub-Queries component, threshold filters canbe configured with more flexibility; for example, where business rules are more complex andmultiple thresholds require handling at one time.
➤ To use the Workspace Alert component with the Conditional Sub-Queries component, selectUsed Conditional Sub-Queries (CSQ) in EPM Workspace Alert Properties.
When Used Conditional Sub-Queries is selected, you do not have to enter values for Column,Operator, and Threshold Limit; however, threshold values must be configured for theConditional Sub-Queries, and the primary query must be selected from Alert Details Query.
When using conditional sub-queries, you provide table, query, and exception string data. The_sysException column and filter are not added to the table, however, since the WorkspaceAlert component relies on the Conditional Sub-Queries limits to look for exception data. Thespecified Conditional Sub-Queries table is monitored after the process is run, and any exceptionsor alerts are reported.
Note:
For the Workspace Alert component to work with the Conditional Sub-Queries component,EPM Workspace Alert Properties must have a higher priority than Conditional Sub-QueryProperties. During the onPostProcess() event, the Workspace Alert componentonPostProcess() method must be called before the Conditional Sub-Queries componentonPostProcess() event. If the Conditional Sub-Queries component onPostProcess()method is called first, it causes complications and incorrect behavior when handling alertmessages.
Displaying Exceptions or AlertsYou can display exceptions or alerts in:
● Personal Pages
● E-mail messages
● Dashboards
Tip:
Ensure that Interactive Reporting documents are imported into EPM Workspace as job files.
64 Dashboard Studio Workspace Alert Component

➤ To display exceptions or alerts in Personal Pages:
1 In EPM Workspace, select an Interactive Reporting job, right-click, and select Subscribe.
2 Select Personal Pages.
3 Select Add to Exceptions Dashboard, and click OK.
4 On the menu bar, select Favorites, then My Personal Page.
5 Scroll to the bottom of My Personal Page to view the Exceptions Dashboard information.
If no exception or alert information is displayed, click .
➤ To display exceptions or alerts in e-mail messages:
1 In EPM Workspace, select an. Interactive Reporting job, right-click, and select Subscribe.
2 Select Notifications.
3 Select Subscribe and send e-mail notifications to.
4 Enter an e-mail address.
When an exception or alert occurs in the job, an e-mail is sent to the recipient.
5 Select exception items, and click OK.
6 Optional: Select Attach output from <Interactive Reporting document> to email message (ifpossible).
➤ To display exceptions or alerts in dashboards:
1 In EPM Workspace, select an Interactive Reporting job, right-click, and select Properties.
2 Under General, General Properties, select and copy the SmartCut URL.
3 Click OK to close Properties.
4 In Interactive Reporting Studio, open the Interactive Reporting document, and select a dashboard frame.
5 Press Ctrl+D to enter Design mode.
6 Expand Controls, and drag an Embedded Browser into the frame.
7 Select the Embedded Browser, right-click, and select Properties.
8 In URL, paste the SmartCut URL.
9 Edit the SmartCut URL by changing get to read getexception.
For example, change: http://oracle.com:19000/workspace/browse/get/MyFolder/Workspace_Alert_Sample_esm?jobOutput=true
to read: http://oracle.com:19000/workspace/browse/getexception/MyFolder/Workspace_Alert_Sample_esm?jobOutput=true
10 Click OK to close Properties.
11 Press Ctrl+D to exit Design mode.
12 Enter your user name and password to log on to EPM Workspace.
Displaying Exceptions or Alerts 65

An alert traffic light icon is displayed. The icon image is determined by EPM Workspace.
13 Hover your mouse over the alert icon to display the document name and alert message.
14 Click the alert icon to launch EPM Workspace.
15 Optional: If you have configured a Personal Page in EPM Workspace to display exceptions or alerts, selectFavorites, then My Personal Page, and scroll to the bottom of the page to view the Exceptions Dashboardinformation.
16 Refresh the alerts in EPM Workspace by clicking .
The listed alerts messages are updated.
Note:
For information on SmartCuts, see the Hyperion Interactive Reporting – Object Model andDashboard Development Services Developer's Guide, Volume 1: Dashboard Design
Configuring the Workspace Alert Component
➤ To configure the Workspace Alert component:
1 Merge the component. (See “Merging Components” on page 10.)
2 Optional: Create a summary table (see “Creating Summary Tables” on page 100), or use an existing tableas a summary table.
3 Optional: Use the Workspace Alert component with the Conditional Sub-Queries component. (See “Usingthe Workspace Alert Component with the Conditional Sub-Queries Component” on page 64.)
➤ To use the EPM Workspace Alert Properties configuration frame:
1 In Interactive Reporting Studio or EPM Workspace, open a dashboard that contains anWorkspace Alertcomponent.
To access the configuration frame, use Sections or the Configuration drop-down list found inDashboard Studio.
2 From Tables Sections, select an option:
● All Tables—All tables are available.
● Configured Tables—Only tables with applied exception or alert configurations are available.
● Unconfigured Tables—Only tables without applied exception or alert configurations areavailable.
3 From the drop-down list, directly under the options, select a table to be monitored.
Available tables vary depending on the selected option.
4 Optional: To view the selected table, click .
66 Dashboard Studio Workspace Alert Component

5 Optional: Select Used Conditional Sub-Queries (CSQ) to employ the Conditional Sub-Queries componentto configure an alert.
If selected, you are not required to provide alert details for column, operator, or threshold values.The option is only available when the Conditional Sub-Queries component is used.
6 From Alert Details, select the Query that the exception table is dependent upon.
The onPostProcess() method is activated for the selected query. See “Using theOnPostProcess() Method Call” on page 69.
7 Select the Column of the selected table, the data of which is compared to the use- specified ThresholdLimit.
8 Optional: If the selected Column contains date values, Threshold Limit is unavailable and a calendar controlis displayed. Perform these actions:
● Select a date
● Click Set
The date value is added to Threshold Limit.
9 From Operator, select the comparison operator for the evaluation of the threshold value.
If the BETWEEN operator is selected, Threshold Max is available, which defines the maximumvalue that you want to add.
10 Enter a Threshold Limit that is used in the evaluation.
The limit value causes the exception, and is used to create a filter. If rows remain after the limitis applied, an output.properties text file is created and exported.
● If you are using Interactive Reporting Studio, the output.properties file is exported tosame directory as the Interactive Reporting document.
● If you are using EPM Workspace, the output.properties file is collected by the eventservice that generates alerts when a job is executed.
11 From Exception String Format, select an option:
● Alert=True—String displayed when an exception occurs
● Alert=False—String displayed when no exception occurs
These options determine the editable exception text in Alert String Format.
12 From Keywords, select the values that dynamically create an exception string.
● Row Count—Number of rows after the filter is applied
● Threshold Value—Use the specified value
● Column Name—Column selected for an alert
● Table Name—Table selected for an alert
● Time Stamp—Time and date of the exception
13 In Alert String Format, the exception string is created and displayed.
Configuring the Workspace Alert Component 67

If an alert is reported, the exception string reads; for example: As there are _:_1_:_ rows that arewithin a range, in table _:_4_:_, this raises an alert as of _:_5_:_. If no alert is reported, theexception string reads; for example: No alert has occurred.
14 Optional: Edit the exception string text.
15 Optional: Enter the string format without selecting Keywords.
16 Perform an action:
● To discard in-memory settings and revert to original settings, click Restore.
● To remove all in-memory table configuration settings, click Clear All.
● To remove the selected table configuration, click Clear.
● To commit current settings and call configuration methods to prepare tables for theonPostProcess() method, click Apply.
When Apply is clicked, the orcl_Exception.txt table is created, and a limit is added tothe specified table that is used to look for the exception.
Note:
Clicking Apply, confirms that the orcl_Exception.txt table exists, and if it does not, thetable is created. The Exception Info column in orcl_Exception.txt is hidden. If a falseexception alert is returned, you must select the appropriate table and populate EPM WorkspaceAlert Properties. Users are alerted and process is stopped. Clicking Apply, also verifies that thecomputed column called Exception Text exists in orcl_Exception.txt. If does not, thecomputed column is added, and Exception Info is populated with default syntax.
Orcl_Exception.txt Table and Output.propertiesThe orcl_Exception.txt file contains two columns:
● Exceptions Info—Contains row a where the exception is displayed as true or false, and rowb where the exception string is placed
● Exception Text—A computed column modified in the onPostProcess() method call thatdisplays a message about the exception (Exception information is hidden when the exceptiontext is displayed.)
Rows are counted in the table selected in EPM Workspace Alert Properties after the filter isprocessed to determine which syntax statement is displayed in the computed column of theorcl_Exception.txt table. When the filter is processed, the exception text displayed to theuser is; for example:
exception.default=offexception.default.text=There were no Product Lines with excessive discount rates.
Note:
These lines of syntax are exported to the output.properties text file without headers.
68 Dashboard Studio Workspace Alert Component

From the orcl_Exception.txt table, the output.properties file is generated.
Following is an example of the text for exception items in the output.properties file:
exception.default=onexception.default.text=There were 1 Product Lines with an average discount rate over 25% as of Wednesday, September 13, 2006 15:12:05
Following is an example of the text for non-exception items in the output.properties file:
exception.default=offexception.default.text=No exception has occurred
Using the OnPostProcess() Method CallThe onPostProcess() method call performs these tasks in the Workspace Alert component:
● Creates a table
● Checks which query is processed, and if a table is configured for the query
● Counts the number of rows in the table
● Adds and modifies the computed column syntax in orcl_Exception.txt to display thecorrect exception alert information
● Exports orcl_Exception.txt as the generated output.properties text file into atemporary working directory
Configuring the Workspace Alert Component 69

70 Dashboard Studio Workspace Alert Component

10Dashboard Studio Format
Header Component
In This Chapter
Format Header Component .. . . . . . . . . . . . . . . . . . . . . . . . . . . . . . . . . . . . . . . . . . . . . . . . . . . . . . . . . . . . . . . . . . . . . . . . . . . . . . . . . . . . . . . . . . . . . . . . . . . . . .71
Using a Runtime Release of the Format Header Component .. . . . . . . . . . . . . . . . . . . . . . . . . . . . . . . . . . . . . . . . . . . . . . . . . . . . . . . . . . . . . . . . .71
Configuring the Format Header Component .. . . . . . . . . . . . . . . . . . . . . . . . . . . . . . . . . . . . . . . . . . . . . . . . . . . . . . . . . . . . . . . . . . . . . . . . . . . . . . . . . . . .73
Format Header ComponentThe Format Header component generates a header for dashboard frames and reports based oncurrently applied filters. When a filter is applied, the header is recomputed based on selectedvalues.
The header varies depending on the prefix and suffix rule defined by the dashboard developer.
Using a Runtime Release of the Format Header ComponentThe Format Header component generates a header for dashboard frames and reports based oncurrently applied filters.
A static title can be specified for a header. Filter columns are displayed as a prefix or suffix of thestatic title. Prefixes and suffixes are comprised of one or more filter columns that are configuredto be displayed unconditionally or as part of a hierarchy. In a hierarchy, only one filter is displayedon the header at a given time. You can also specify formatting for every header column.
Filter values are displayed if only one value from each filter is set. If multiple values are selectednothing is displayed for that heading part.
➤ To format a header on a frame:
1 In Interactive Reporting Studio, open the sample Format Header component document.
2 Select a frame.
For example, select Revenue by Locality by Quarter.
Format Header Component 71

In the example, Revenue is the static title and Locality is the default prefix. Locality and City canbe set as prefix filter columns. Year and Quarter can be set as suffix filter columns.
3 From Quick Filters, select a Locality filter, and click Set Filter.
For example, select CA. The default heading is replaced by the selected filter value.
4 From the top panel, select the Filters drop-down list, select a filter, and click OK.
For example, select City. The Filter dialog box is displayed. Select a City value; for example, LongBeach, to replace the Locality value in the header. The replacement is an example of headercolumns grouped in a hierarchy.
5 Use Quick Filters to select another filter.
For example, select Q2. The selected value is displayed as part of the heading.
6 Select the Filters drop-down list, select another filter, and click OK.
For example, select Year. The Filter dialog box is displayed. Select a Year; for example, 2000. TheYear value is displayed before the Quarter value because the columns do not belong to ahierarchy.
72 Dashboard Studio Format Header Component

The Format Header component works with the Checkpoint control to store or restore theformatted header based on the selected filters in a dashboard. See “Using Checkpoint Control”in the Hyperion Interactive Reporting – Object Model and Dashboard Development ServicesDeveloper's Guide, Volume 5: Dashboard Studio.
Configuring the Format Header ComponentTo configure the Format Header component:
1. Merge the component. See “Merging Components” on page 10.
2. Add a text label txlFrameTitle to frames.
3. Decide which frames to apply header specifications to and which filter columns to apply asprefix or suffix headers.
4. Use Format Header Properties to configure the Format Header rule for each frame.
Adding Format Header Text LabelsA text label must be added to the frame to display the configured format header.
➤ To add a Format Header text label:
1 In Interactive Reporting Studio, open a dashboard that contains the Format Header component.
2 Move to the frame that is to contain an inserted text label.
3 Press Ctrl+D to enter Design mode.
Configuring the Format Header Component 73

4 From the catalog pane, expand Graphics folder, and drag a text label onto the frame.
5 Position and format the text label, and ensure that the length is adequate to accommodate multiple filters.
6 Right-click the text label and select Properties.
Properties is displayed.
7 Enter txlFrameTitle as the object name, and click OK.
8 Press Ctrl+D to exit Design mode.
9 Save the dashboard.
The Format Header text label is added to the frame.
Configuring the Header RuleUse the Format Header Properties frame to specify the rule for the header that is displayed foreach dashboard frame.
The rule consists of three parts.
1. Static title—A title is displayed in the Format Header text label regardless of whether filtersare set for the dashboard.
2. Prefix header—One or more filter columns can be set as prefix headers for the frame. If avalue from a filter is set, the set value is displayed as a prefix for the specified static title. Adefault prefix value can also be specified.
3. Suffix header—Filters are specified to display as suffixes for the static title.
When header columns are selected, the order in which columns are listed is the order in whichvalues are displayed in the Format Header text label. By default, prefix and suffix filter valuesare displayed unconditionally. However, an option is available to include a group of columns aspart of a hierarchy. In a hierarchy, only one filter is displayed on the header at a time. The valuefor the lowest set filter is shown in the header. A combination of hierarchical or non-hierarchicalcolumns in a prefix or suffix specification is possible. For example, if locality and city are set asheader columns and [H] Part of Hierarchy is selected for the columns:
● Applying locality = CA, results in CA being displayed in the header
● Applying city = Long Beach, without clearing the locality filter, results in Long Beach beingdisplayed in the header
However, if locality and city are set as header columns and [H] Part of Hierarchy is not selected,CA and Long Beach are displayed in the header.
A format can be applied to one or more header columns. Header formats can be appliedunconditionally or only if a value from a prior filter is set.
For example, if year and quarter are set as header columns and [F] Show if Prior filter exists isselected for quarter, applying quarter = Q1 as a filter results in:
1. Q1 (with formatting) is added to the header if a year filter is set.
2. Q1 (with no formatting) is added to the header if no year filter is set.
74 Dashboard Studio Format Header Component

Spaces are inserted between the three header parts. However, to allow for formatting such ascomma separators, no space is inserted between the columns inside the prefix or suffix.
➤ To configure the Format Header feature:
1 In Interactive Reporting Studio, open a dashboard that contains the Format Header component.
2 Navigate to Format Header Properties.
To access the configuration frame, use Sections or the Configuration drop-down list found inDashboard Studio.
3 From Define Format Header, select the frame to configure.
The listed frames vary depending upon which option is selected:
● All dashboards—All frames are available from the list
● Configured dashboards—Only frames with applied headers are available
● Unconfigured dashboards—Only frames without applied headers are available
If a selected dashboard does not contain a Format Header text label, a message is displayedrequesting that the text label must be configured.
4 Optional: Perform an action:
● To view the selected section, click
● To copy the Format Header specifications from one frame to another, click , select
another dashboard, and click to paste
5 Optional: Enter a Static Heading for the dashboard.
6 In Configure Header Columns, select an option to configure the Prefix or Suffix header.
7 In Define Format, perform an action:
● Select [F] Show if prior filter exists, to apply the format only if a value from a prior filter inthe list is set (If this option is not selected, the format is displayed)
● Enter the left and right format characters to apply to the filter values (For example, enter( in Left format characters and ) in Right format characters)
For example, to define the format:
a. From Configure Header Columns, select Suffix.
b. From Filters Columns, select an item and click to move it to Suffix Filter Columns.
For example, [- : -] Year is displayed, where [- : -] indicates that Year is always displayed.
c. Select [F] Show if prior filter exists, and enter ( in the Left format characters and ) in theRight format characters.
d. From Filters Columns, select another item and click to move it to Suffix FilterColumns.
Configuring the Format Header Component 75

For example, [- :F] (Quarter) is displayed, where (Quarter) indicates that it is a suffix tothe Year filter; for example, 2000 (Q4).
8 In Select Header Columns, select the filter columns to set as prefix or suffix headers for the frame.
9 Optional: Perform one or all of these actions:
● Select [H] Part of Hierarchy to make a filter part of a hierarchy (Selected Filter Columns aredisplayed in Prefix or Suffix Filter Columns with [H:-])
● Move selected columns between Filter Columns and Prefix or Suffix Filter Columns, by
clicking and
● Reorder the Prefix or Suffix Filter Columns by selecting a column and clicking or
(Moving columns may affect the outcome of the header, if [F] Show if prior filter existsor [H] Part of Hierarchy options are set for the columns)
10 Optional: Enter a Default Prefix or Suffix for the frame.
11 Perform an action:
● To reload the original settings, click Restore
● To clear current entries, click Clear
● To save the configured header specifications, click Apply
Adding Format Header Specifications to ReportsFormat Header specifications can be displayed on report sections.
➤ To add Format Header specifications to reports:
1 In Interactive Reporting Studio, open a dashboard that contains the Format Header component and reportsections.
2 Navigate to a report.
3 From the catalog pane, expand HYSL Report Headings.
A list of frames with Format Header specifications is displayed.
4 Drag a frame onto the report.
The header for the selected frame is displayed in the report.
76 Dashboard Studio Format Header Component
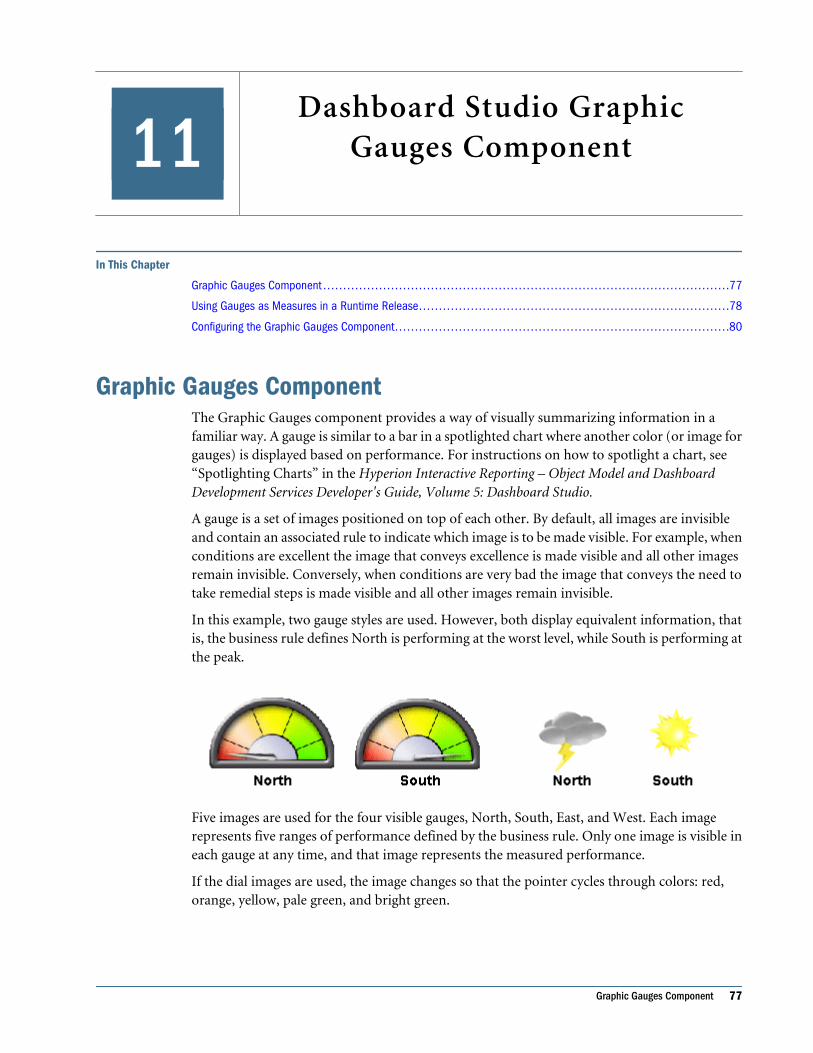
11Dashboard Studio Graphic
Gauges Component
In This Chapter
Graphic Gauges Component .. . . . . . . . . . . . . . . . . . . . . . . . . . . . . . . . . . . . . . . . . . . . . . . . . . . . . . . . . . . . . . . . . . . . . . . . . . . . . . . . . . . . . . . . . . . . . . . . . . . . .77
Using Gauges as Measures in a Runtime Release... . . . . . . . . . . . . . . . . . . . . . . . . . . . . . . . . . . . . . . . . . . . . . . . . . . . . . . . . . . . . . . . . . . . . . . . . . . .78
Configuring the Graphic Gauges Component.. . . . . . . . . . . . . . . . . . . . . . . . . . . . . . . . . . . . . . . . . . . . . . . . . . . . . . . . . . . . . . . . . . . . . . . . . . . . . . . . . . .80
Graphic Gauges ComponentThe Graphic Gauges component provides a way of visually summarizing information in afamiliar way. A gauge is similar to a bar in a spotlighted chart where another color (or image forgauges) is displayed based on performance. For instructions on how to spotlight a chart, see“Spotlighting Charts” in the Hyperion Interactive Reporting – Object Model and DashboardDevelopment Services Developer's Guide, Volume 5: Dashboard Studio.
A gauge is a set of images positioned on top of each other. By default, all images are invisibleand contain an associated rule to indicate which image is to be made visible. For example, whenconditions are excellent the image that conveys excellence is made visible and all other imagesremain invisible. Conversely, when conditions are very bad the image that conveys the need totake remedial steps is made visible and all other images remain invisible.
In this example, two gauge styles are used. However, both display equivalent information, thatis, the business rule defines North is performing at the worst level, while South is performing atthe peak.
Five images are used for the four visible gauges, North, South, East, and West. Each imagerepresents five ranges of performance defined by the business rule. Only one image is visible ineach gauge at any time, and that image represents the measured performance.
If the dial images are used, the image changes so that the pointer cycles through colors: red,orange, yellow, pale green, and bright green.
Graphic Gauges Component 77
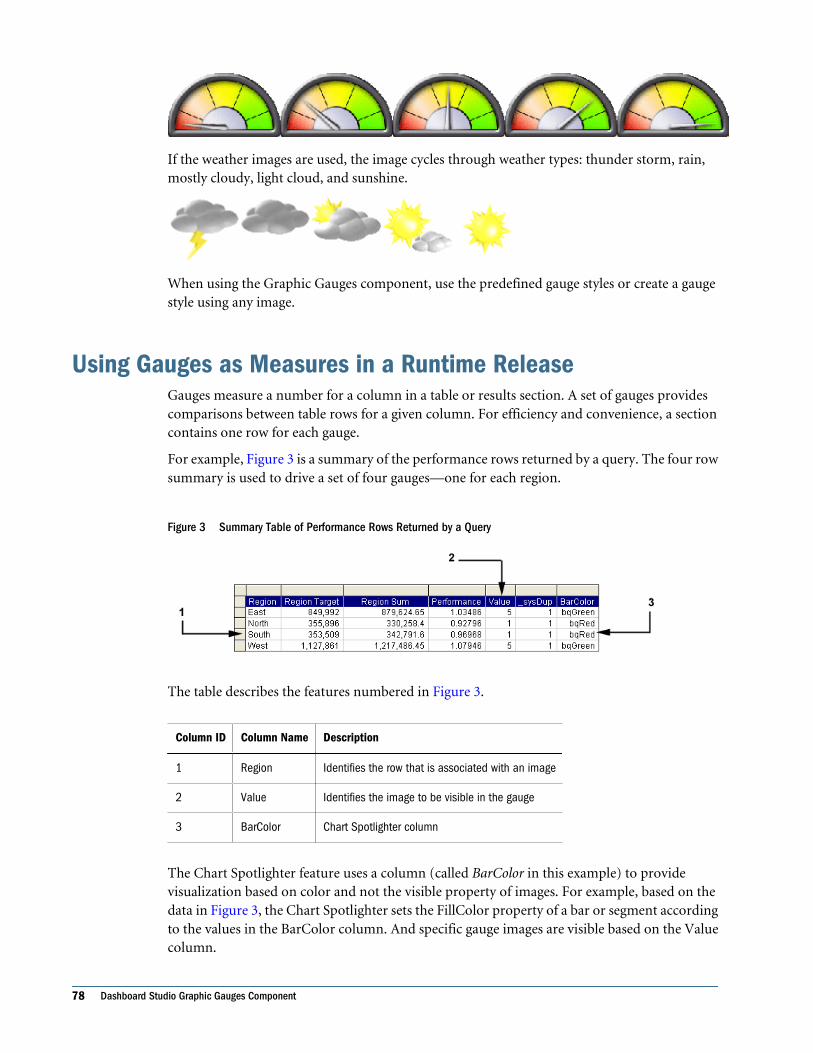
If the weather images are used, the image cycles through weather types: thunder storm, rain,mostly cloudy, light cloud, and sunshine.
When using the Graphic Gauges component, use the predefined gauge styles or create a gaugestyle using any image.
Using Gauges as Measures in a Runtime ReleaseGauges measure a number for a column in a table or results section. A set of gauges providescomparisons between table rows for a given column. For efficiency and convenience, a sectioncontains one row for each gauge.
For example, Figure 3 is a summary of the performance rows returned by a query. The four rowsummary is used to drive a set of four gauges—one for each region.
Figure 3 Summary Table of Performance Rows Returned by a Query
The table describes the features numbered in Figure 3.
Column ID Column Name Description
1 Region Identifies the row that is associated with an image
2 Value Identifies the image to be visible in the gauge
3 BarColor Chart Spotlighter column
The Chart Spotlighter feature uses a column (called BarColor in this example) to providevisualization based on color and not the visible property of images. For example, based on thedata in Figure 3, the Chart Spotlighter sets the FillColor property of a bar or segment accordingto the values in the BarColor column. And specific gauge images are visible based on the Valuecolumn.
78 Dashboard Studio Graphic Gauges Component

The Graphic Gauges component works with the Checkpoint control to store and restorecomparisons between table rows for a given column in a table or results section. See “UsingCheckpoint Control” in the Hyperion Interactive Reporting – Object Model and DashboardDevelopment Services Developer's Guide, Volume 5: Dashboard Studio.
Naming GaugesThe Graphic Gauges component employs a naming scheme to identify and manage gauges. Thescheme compiles names in four parts; parts are separated by (^).
Example, sun^Hysl_gg^1^1:
● sun—Gauge style or image; includes all characters except space or caret (^)
● Hysl_gg—Unique identifier of the Graphic Gauges component
● 1, 2, 3, 4, and so on—The value range associated with the image; for example, 1 very bad and5 excellent
● 1, 2, 3, 4, and so on—The gauge instance (For example, all images with identical values inparts 1, 2, and 4 are sections of one gauge; therefore, gauges can be duplicated and instancenumbers can be automatically incremented)
Table 5 Images and Names that Comprise the Sun and Small Traffic Light Gauges
Image Name
sun^Hysl_gg^1^1
sun^Hysl_gg^2^1
sun^Hysl_gg^3^1
sun^Hysl_gg^4^1
sun^Hysl_gg^5^1
Using Gauges as Measures in a Runtime Release 79

Image Name
trl_sm^Hysl_gg^1^1
trl_sm^Hysl_gg^2^1
trl_sm^Hysl_gg^3^1
Note:
Any image can be used for a gauge; however, it must follow the naming pattern scheme. Importthe images into the Interactive Reporting document, name them according to the definedscheme, and use them in the same way as the previously created gauges.
Setting Gauge Visibility or InvisibilityIn this example, four gauges are described that display up to five alternative settings. Using theinformation in Figure 3, each gauge represents the performance of a region. The four gaugeimages are associated with a value in the Region column. That is, the gauges take the names:East, North, South, and West. The four gauge images are also associated with the performancerange in the Value column. The performance ranges are 5 and 1.
If, for example, the sun gauge image is used with instance 1 as East, instance 2 as North, instance3 as South, and instance 4 as West, a string is generated by the Gauge Properties configurationframe and the values in the table (Figure 3). The string creates the name of the image that isvisible. For example,
● sun^Hysl_gg^5^1 (sunshine)
● sun^Hysl_gg^1^2 (thunder storm)
● sun^Hysl_gg^1^3 (thunder storm)
● sun^Hysl_gg^5^4 (sunshine)
Configuring the Graphic Gauges ComponentTo configure the Graphic Gauges component:
1. Merge the component. See “Merging Components” on page 10.
2. Determine the value range for the gauge and create a computed column to produce thevalues.
3. Paste or duplicate gauges.
4. Set gauge properties using the Gauge Properties frame.
80 Dashboard Studio Graphic Gauges Component

Determining Range Values and Creating Computed ColumnsDetermine the range values for the gauges and create a computed column to produce the ranges.
➤ To determine the gauge range values and create a computed column to construct the values:
1 In Interactive Reporting Studio, open a dashboard that contains the Graphic Gauges component.
2 Open the results or table that contains a fact column, and determine the value range for the gauge.
The Gauge Samples frame contains a list of gauge controls and the range of supported values.For example, Label for Set of 5 means the gauge supports values from 1 to 5.
3 In the results or table, create a computed column to produce the range values by reading the fact column.
For example, if the gauge contains five gradations, the computed column produces 1 to 5 as therange. The fact column criteria determines the value of each row. A gauge that measures the factPerformance, has a computed column with the formula:
if (Performance < .990) { 1 }else if (Performance < .995) { 2 }else if (Performance < 1) { 3 }else if (Performance < 1.03) { 4 }else { 5 }
In Figure 4, the computed column, or value range column, is called Value. The results or tableis called the Gauge table. Each row in the table is potentially a gauge. Gauges are labelled todifferentiate between them. For example, the Region column is a label column that is used todistinguish each gauge.
Figure 4 Gauge Table Example
If the Gauge table contains multiple fact columns, create another computed column. Configurethe value range column for a second collection of gauges.
Tip:
To use, for example three out of five gauge images, ensure that the computed column returnsonly those three values.
Caution!
The Graphic Gauges component uses "_._" as a separator. Therefore, the string cannot be usedin table or column names. For example, Gauge_._Table or My_._Column are not permitted.
Configuring the Graphic Gauges Component 81

Pasting or Duplicating GaugesThis procedure describes how to paste or duplicate gauge image sets so manipulating the sets iseasier.
➤ To paste gauges:
1 In Interactive Reporting Studio, open a dashboard that contains the Graphic Gauges component.
2 From Sections, select Gauge Samples.
3 Press Ctrl+D to enter Design mode.
4 Drag a rectangle with the mouse around the gauge set, including the label, to select all.
5 Press Ctrl+C to copy to the objects.
6 Move to another dashboard frame, and select View, then Zoom 50%.
7 From the catalog pane, expand Controls, and drag a command button onto the frame, and position it belowthe level of the lowest frame object.
The button is created as a marker object for pasting the gauge objects.
When a frame is selected in Design mode, or an object is dragged onto a frame, a dotted rectangledisplays the furthest boundaries within which objects exist. Ensure the marker is dragged belowor to the right of the boundary, so all gauge images are available for selection.
8 Select the marker and press Ctrl+V to paste the gauge objects.
Selecting the marker ensures the pasted objects are positioned below the marker. Paste as manygauge sets as there are unique labels in the results or table column. For example, if the columncontains five unique labels, paste up to five gauge sets on the frame.
9 Delete the marker object, and press Ctrl+D to exit Design mode.
Duplicate a gauge set by performing this procedure.
➤ To duplicate gauges:
1 Use the gauge sets and frames that were created in the paste gauges procedure.
The frame remains zoomed to 50%.
2 Press Ctrl+D to enter Design mode.
3 Drag a rectangle with the mouse around the objects: the gauge images and labels.
4 Press Ctrl and click a selected object, and without releasing the mouse drag the gauges to create a duplicate.
Ensure the gauges and the duplicate do not overlap.
5 Repeat steps 3 and 4 to create as many duplicates as required.
6 Position the selected objects.
7 Press Ctrl+D to exit Design mode.
Pasted or duplicated gauge sets are available on the frame.
82 Dashboard Studio Graphic Gauges Component

Setting Gauge PropertiesUse the Gauge Properties frame to set gauge properties. Each gauge set is mapped to acorresponding label value.
➤ To set gauge properties:
1 In Interactive Reporting Studio, open a dashboard that contains the Graphic Gauges component.
2 Navigate to Gauge Properties.
To access the configuration frame, use Sections or the Configuration drop-down list found inDashboard Studio.
3 From Dashboards with Gauges, select an option and a frame to configure:
● All dashboards—All frames in the dashboard
● Configured dashboards—Only frames containing gauges
● Unconfigured dashboards—Only frames without gauges
4 Optional: Click to view the selected frame.
5 From Gauge Configuration, select these items:
a. Select a Gauge Table.
The results section or table that contains the value range computed item. See Figure 4.
b. Select a Value Range Column.
The computed column that the gauges measure. See the Value column in Figure 4.
c. Select a Label Column.
The values that the gauges represent. See the Region column in Figure 4.
d. Select a Gauge Label.
The individual label column values assigned to a gauge set. For example, in Figure 4, East,North, South, or West.
The Graphic Gauges component uses "_._" as a separator. Therefore, to avoid operational errors,table or column names containing the string are not permitted, and are not selectable.
6 Move selected gauges between Available Gauges and Configured Gauges by clicking and .
The selected gauges are mapped to the label value displayed in Gauge Label.
7 Repeat steps 3–6 to configure and label all gauges.
8 Optional: Perform an action:
● To revert to previously saved settings, click Restore
● To remove all current specifications, click Clear All
9 Click Apply to load the gauges.
10 Navigate to the frame containing the gauges.
Configuring the Graphic Gauges Component 83

The gauges reflect the values in the Value Range column of the results or table.
84 Dashboard Studio Graphic Gauges Component

12Dashboard Studio Group Tabs
Component
In This Chapter
Group Tabs Component .. . . . . . . . . . . . . . . . . . . . . . . . . . . . . . . . . . . . . . . . . . . . . . . . . . . . . . . . . . . . . . . . . . . . . . . . . . . . . . . . . . . . . . . . . . . . . . . . . . . . . . . . . .85
Using a Runtime Release of the Group Tabs Component .. . . . . . . . . . . . . . . . . . . . . . . . . . . . . . . . . . . . . . . . . . . . . . . . . . . . . . . . . . . . . . . . . . . . .85
Configuring the Group Tabs Component .. . . . . . . . . . . . . . . . . . . . . . . . . . . . . . . . . . . . . . . . . . . . . . . . . . . . . . . . . . . . . . . . . . . . . . . . . . . . . . . . . . . . . . . .86
Group Tabs ComponentThe Group Tabs component enables navigation tabs to be grouped under a grouping tab.Navigation is displayed in two rows. The first row displays the groups, and selecting an itemfrom the first row displays the first member of that group in the second row, or returns to thesection last visited. Selecting a tab in the second row behaves like standard navigation. Usinggrouped navigation on dashboards mirrors many Web site navigation schemes, and provides agreater number of available tabs in an Interactive Reporting document.
Using a Runtime Release of the Group Tabs ComponentThe Group Tabs component commits the history of selected tabs on the second and subsequentrows to memory. Therefore, if you select a tab on the first navigation row, and then select a tabon the second navigation row, when you return to the first row tab, the second row tab isremembered and the associated frame is displayed.
➤ To use the Group Tabs component:
1 In Interactive Reporting Studio, open a dashboard that is configured with the Group Tabs component.
2 Navigate to a frame that contains the group tab navigation structure.
3 Select a tab on the first navigation row.
The dashboard locates and displays the selected frame.
4 Select a tab on the second navigation row.
The selected frame is displayed.
5 Select another tab on the first navigation row.
The selected frame is displayed.
6 Repeat step 3, by selecting the same first row tab.
Group Tabs Component 85

The frame associated with the tab from step 4, on the second row, is displayed. Therefore, youare returned to the frame last visited on that row.
Configuring the Group Tabs ComponentTo configure the Group Tabs component:
1. Merge the component. See “Merging Components” on page 10.
2. Configure group navigation tabs using the Group Tab Properties.
➤ To use the Group Tab configuration frame:
1 In Interactive Reporting Studio, open a dashboard that contains the Group Tabs component.
2 Navigate to Group Tab Properties.
To access the configuration frame, use Sections or the Configuration drop-down list found inDashboard Studio.
3 In Group Tab Name, enter a name for the group or first row of navigation tabs.
4 To add the group name into Group Tabs, click (Add).
The name is appended at the end of the Group Tabs list.
5 Optional: To rename the selected group, click .
6 Optional: To delete the selected group, click .
7 Optional: Reorder Group Tabs by selecting a group and clicking or .
8 Control the types of Available Sections by selecting or clearing the section check boxes.
The selected sections are displayed in Available Sections.
9 Move selected sections between Available Sections and Selected Sections by clicking and .
10 Optional: Reorder Selected Sections by selecting a section and clicking or .
11 Perform an action:
● To discard group tabs and reload the original settings, click Restore
● To remove all group tabs, click Clear All
● To remove selected group tabs, click Clear
● To load the selected group tabs, click Apply
A group must include at least one dashboard that is configured for group navigation. Forexample, a group with only queries selected will display an error message. Please specify at leastone member for the following: Group Name, where member is a dashboard configured with atleast one tab, and Group Name is the name entered in Group Tabs.
86 Dashboard Studio Group Tabs Component

12 To test the grouped navigation structure, click .
Configuring the Group Tabs Component 87

88 Dashboard Studio Group Tabs Component

13Dashboard Studio Ignore
Percentile Component
In This Chapter
Ignore Percentile Component .. . . . . . . . . . . . . . . . . . . . . . . . . . . . . . . . . . . . . . . . . . . . . . . . . . . . . . . . . . . . . . . . . . . . . . . . . . . . . . . . . . . . . . . . . . . . . . . . . . . .89
Using a Runtime Release of the Ignore Percentile Component.. . . . . . . . . . . . . . . . . . . . . . . . . . . . . . . . . . . . . . . . . . . . . . . . . . . . . . . . . . . . . . .89
Configuring the Ignore Percentile Component.. . . . . . . . . . . . . . . . . . . . . . . . . . . . . . . . . . . . . . . . . . . . . . . . . . . . . . . . . . . . . . . . . . . . . . . . . . . . . . . . . .90
Incompatibility with the Checkpoint Control . . . . . . . . . . . . . . . . . . . . . . . . . . . . . . . . . . . . . . . . . . . . . . . . . . . . . . . . . . . . . . . . . . . . . . . . . . . . . . . . . . . . .92
Ignore Percentile ComponentThe Ignore Percentile component enables you to discard outlying values from one or moreresults sets.
To configure the component, four computed items must be created in a results section todetermine the percentile range for each column value. A table is created from the results set,from which all charts and pivots that use this function are created.
The component includes a button graphic that must be added to dashboard frames andconfigured. See “Component Buttons” on page 12.
Using a Runtime Release of the Ignore Percentile ComponentThis procedure applies only to a runtime release of the Ignore Percentile component.
➤ To use the Ignore Percentile component:
1 In Interactive Reporting Studio, open a dashboard that is configured with the Ignore Percentile component.
2 Click .
A drop-down list with percentile ranges is displayed.
3 From the drop-down list, select a percentile range.
For example, select 10% – 90%. Values are discarded from the data according to the selectedrange. The range is displayed in Active Filters.
4 Click to clear the selected percentile and revert to the original view.
Ignore Percentile Component 89

Configuring the Ignore Percentile ComponentTo configure the Ignore Percentile component:
1. Merge the component. See “Merging Components” on page 10.
2. Configure (Ignore Percentile).
3. Configure Ignore Percentile computed items. Configuring the Ignore Percentile componentinvolves creating Interactive Reporting Studio dashboard sections and creating thecomputed items necessary to determine the percentile range of values in the data.
Configuring the Ignore Percentile Button
Before you can configure the Ignore Percentile component, add and configure . After thecomponent is configured, the button enables you to manipulate the data percentile ranges.
➤ To add and configure (Ignore Percentile):
1 In Interactive Reporting Studio, open a dashboard that contains the Ignore Percentile component.
2 Select the frame on which to add the button, and press Ctrl+D to enter Design mode.
3 From the catalog pane, expand Graphics, and drag a picture object onto the frame.
4 Navigate to outer_n.bmp in the Ignore Percentile component directory, and position the button on thedashboard toolbar.
5 Double-click the button.
Properties is displayed.
6 Enter pic^Qiq_IgnorePercentile as the object name, and click OK.
7 Select the button, right-click, and select Scripts.
Scripts Editor is displayed.
8 In Scripts Editor, perform an action:
● Enter this line of code
ActiveDocument.Sections[txlMe.Text].Qiq_onControlClick(this.Parent,this)
● Copy and paste the line of code from another button on the toolbar to avoid data entryerrors
9 Click OK.
10 Optional: Add, configure, and name the corresponding gray buttons for the not selectable state.
11 Press Ctrl+D to exit Design mode.
Proceed with configuring the computed items.
90 Dashboard Studio Ignore Percentile Component

Configuring Ignore Percentile Computed Items
➤ To configure the Ignore Percentile component:
1 Use the Interactive Reporting document from the Configuring the Ignore Percentile Button procedure.
2 Navigate to a results section that contains the data to be manipulated, right-click, and select Add ComputedItem.
Computed Item is displayed.
3 In Name, enter QiqION, click Reference, select the column from which to discard values outside thepercentiles of interest, and click OK.
4 Click OK.
5 In the results set, create these computed items, and in Definition, enter the specified values.
Table 6 Computed Item Names and Definition Placeholders
Computed Item Name Definition Placeholders
QiqBot 1
QiqTop 2
Qiq Percentile “value”
6 Use the same results set, and insert a table.
7 From the catalog pane, drag onto the Data Layout the Qiq Percentile computed item and other columns thatare to be reported upon and that use the table, charts, or pivots.
8 Double-click the Qiq Percentile column to make it a local filter.
9 In Filter, click Show Values, Select All, and OK.
To apply Ignore Percentile correctly, filters must be set by using the QIQ Filter Properties frame
or by clicking in Step 6: Configure Filters of Dashboard Studio. See “Using the QIQ FilterProperties Frame” or “Step 6: Configure Filters” in the Hyperion Interactive Reporting – ObjectModel and Dashboard Development Services Developer's Guide, Volume 5: Dashboard Studio.
10 Create the percentile sections from the table, inserted in step 6.
11 Open Dashboard Studio, and move to the Frames step, to add frames.
12 Optional: Add , if it is not available on the frame at this point. See “Configuring the Ignore PercentileButton” on page 90.
13 In Interactive Reporting Studio, from the catalog pane, drag the report sections (table, charts, or pivots) ontothe frames.
14 In Dashboard Studio, move to the Associate step, and click to associate the frames.
15 In Interactive Reporting Studio, test the component by clicking .
Configuring the Ignore Percentile Component 91

16 Save the dashboard.
It is not necessary to set the Qiq Percentile filter as an active filter for the dashboard.
Note:
Use the Checkpoint control to store or restore the computed item. See "Using CheckpointControl" in the Hyperion Interactive Reporting – Object Model and Dashboard DevelopmentServices Developer's Guide, Volume 5: Dashboard Studio.
Incompatibility with the Checkpoint ControlCheckpoints that contain an Ignore Percentile filter are not applied correctly to the dashboard,because the Ignore Percentile component uses computed items to apply values. These computeditems are not handled correctly by the Checkpoint control.
See “Using Checkpoint Control” in the Hyperion Interactive Reporting – Object Model andDashboard Development Services Developer's Guide, Volume 5: Dashboard Studio.
92 Dashboard Studio Ignore Percentile Component

14Dashboard Studio Lookup
Component
In This Chapter
Lookup Component .. . . . . . . . . . . . . . . . . . . . . . . . . . . . . . . . . . . . . . . . . . . . . . . . . . . . . . . . . . . . . . . . . . . . . . . . . . . . . . . . . . . . . . . . . . . . . . . . . . . . . . . . . . . . . . .93
Using a Runtime Release of the Lookup Component.. . . . . . . . . . . . . . . . . . . . . . . . . . . . . . . . . . . . . . . . . . . . . . . . . . . . . . . . . . . . . . . . . . . . . . . . . .93
Configuring the Lookup Component.. . . . . . . . . . . . . . . . . . . . . . . . . . . . . . . . . . . . . . . . . . . . . . . . . . . . . . . . . . . . . . . . . . . . . . . . . . . . . . . . . . . . . . . . . . . . .94
Incompatibility with EPM Workspace... . . . . . . . . . . . . . . . . . . . . . . . . . . . . . . . . . . . . . . . . . . . . . . . . . . . . . . . . . . . . . . . . . . . . . . . . . . . . . . . . . . . . . . . . . .97
Lookup ComponentThe Lookup component enables you to launch an Internet-based mapping provider, such asYahoo maps, to display the location of an address selected from an embedded table or resultssection in a dashboard.
The mapping provider is configured in the Qiq_addresslookup dashboard frame thataccompanies the component. Use one of the two default mapping providers or configure anotherprovider.
The component displays a map of the selected address by inserting the address data into a URLwith a known format. The default address, displayed in text labels within the frame, is shownas:
http://maps.yahoo.com/py/maps.py?BFCat=&Pyt=Tmap&newFL=Use+Address+Below&Get%A0Map=Get+Map&Country=|||Country|||&addr=|||Street_Address|||&csz=|||City|||,|||Locality|||
The text between each set of (|||) separators or delimiters, is the column name. For example,|||Country||| is replaced by the contents of the column named country in the selected row.Use the same process for |||Street_Address|||, |||Locality|||, and |||City|||. Touse the default address shown, the results or table section must include columns named Country,Locality, City, and Street_Address.
To use other columns for a table, replace the column names within the format. See “ChangingDefault Column Names” on page 95.
Using a Runtime Release of the Lookup ComponentThis procedure applies only to a runtime release of the Lookup component.
Lookup Component 93

➤ To use the Lookup component:
1 In Interactive Reporting Studio, open a dashboard that is configured with the Lookup component.
2 Double-click a row in a results or table section that contains addresses.
A mapping provider is launched in a Web browser that displays the selected address. Themapping provider varies depending on the setting used by the dashboard developer.
Configuring the Lookup ComponentTo configure the Lookup component:
1. Merge the component. See “Merging Components” on page 10.
2. Select or configure a mapping provider.
3. Optional: Escape the address URL.
4. Add and configure the table or results section onto the dashboard.
5. Reassociate the section using Dashboard Studio.
Selecting Mapping Providers
➤ To select Yahoo Map or Maporama as the mapping provider:
1 In Interactive Reporting Studio, open a dashboard that contains the Lookup component.
2 From Sections, select Qiq_addresslookup, or View, then Unhide Section, select Qiq_addresslookup, andclick OK.
Qiq_addresslookup is displayed. On the right side of the frame is a list of mapping provideroptions.
3 Select one of these options:
● Yahoo Map Service—View addresses in the U.S., with a two-letter country identifier (Toview an address using Yahoo Map, country column values must be set to US)
● Maporama Map Service—View addresses in Europe, with a three-letter country identifier(For example, to view an address in Austria using Maporama, country column values mustbe set to AUT)
For correct country codes, see http://maps.yahoo.com or http://www.maporama.com.
Configuring Mapping ProvidersQiq_addresslookup includes a third option and corresponding text label that can be configuredto use a mapping provider other than Yahoo Map or Maporama.
94 Dashboard Studio Lookup Component

➤ To configure and select the third mapping provider option:
1 In Interactive Reporting Studio, open a dashboard that contains the Lookup component.
2 Press Ctrl+D to enter Design mode.
3 From Sections, select Qiq_addresslookup, and double-click Local Map Service.
Properties is displayed.
4 Enter a title for the mapping provider, and click OK.
For example, enter Map Quest.
5 Open a Web browser, and enter a URL; for example, http://www.mapquest.com.
The requested Website is displayed.
6 Enter an address; for example, 17 West Adams, Chicago, IL, and click Search.
A map of the specified address is displayed.
7 From the Web browser, copy the URL.
8 In Interactive Reporting Studio, select Qiq_addresslookup, click the third text label, and paste the URL.
9 Replace the address with generic identifiers (|||Street_Address|||, |||City|||, |||Locality|||, and |||Country|||) so it works with any address in the table.
For example, if the URL for 17 West Adams, Chicago, IL is:
http://www.mapquest.com/maps/map.adp?country=US&addtohistory=&address=17+West+Adams&city=Chicago&state=IL&zipcode=&homesubmit=Get+Map
Change the URL to read:
http://www.mapquest.com/maps/map.adp?country=|||Country|||&addtohistory=&address=|||Street_Address|||&city=|||City|||&state=|||Locality|||&zipcode=&homesubmit=Get+Map
If other column names from the results or tables are used, replace the string between the |||separators or delimiters with those values. See “Changing Default Column Names” on page95.
10 Press Ctrl+D to exit Design mode.
11 Select the third option to use the personalized mapping provider.
12 From Sections, select Qiq_addresslookup, and select View, then Hide Section.
Changing Default Column NamesThe default settings for the Lookup component require Country, Locality, City, andStreet_Address columns in the results or table section. If multiple column names are used foraddresses, change column names within the form as needed.
➤ To change column names:
1 In Interactive Reporting Studio, open a dashboard that contains the Lookup component.
Configuring the Lookup Component 95

2 Select View, then Unhide Section.
Unhide Sections is displayed.
3 Select Qiq_addresslookup,
Qiq_addresslookup is displayed. The frame includes several text labels. The labels contain URLsfor each available mapping provider.
The strings between the ||| separators or delimiters reflect the expected column names in theresults or table section.
4 Change the default column names to reflect the results or tables that are expected.
5 From Sections, select Qiq_addresslookup, and select View, then Hide Section.
Escape the URLAn option to escape the URL is available, because in localized releases of the component, anissue may arise where characters are not recognized. The selected address is displayed incorrectlyor not at all, and the Web browser Address box displays extra characters. In this case, you mustchange the value in text label called txlEscaped on Qiq_addresslookup.
The value in txlEscaped can be changed from or to one of these options:
1=Escaped
0=Not escaped
Note:
The escape option is on by default.
Adding and Configuring Tables or ResultsUse the table or results from the Changing Default Column Names procedure.
➤ To add and configure a table or results section:
1 In Interactive Reporting Studio, press Ctrl+D to enter Design mode.
2 From the catalog pane, drag the table or results onto the dashboard.
3 Select the table or results, right-click, and select Properties.
Properties is displayed.
4 Rename the embedded table or results, by entering <Table_Name orResults_Name>^Qiq_addresslookup^1.
For example, enter Customer_Results^Qiq_addresslookup^1.
5 Select Active, and click OK.
6 Select the table or results, right-click, and select Scripts.
96 Dashboard Studio Lookup Component

Scripts Editor is displayed.
7 In Scripts Editor, perform an action:
● Enter this line of code
ActiveDocument.Sections[txlMe.Text].Qiq_onControlClick(this.Parent,this)
● Copy and paste the line of code from another button on the toolbar to avoid data entryerrors
8 Click OK.
9 Press Ctrl+D to exit Design mode.
Proceed to reassociate the table or results using Dashboard Studio.
Reassociating Sections Using Dashboard StudioUse the Interactive Reporting document from the Adding and Configuring Tables or Resultsprocedure.
➤ To reassociate tables or results with Dashboard Studio:
1 On Dashboard Studio Start, connect to the Interactive Reporting document that contains the table or results.
2 Move to the Associate step.
3 Select the table or results from the list, and click to reassociate it.
4 In Interactive Reporting Studio, double-click a row in the table or results to test the association and launchthe mapping provider.
5 In the Web browser, the configured mapping provider; for example, Yahoo Map, displays the selected address.
6 Save the dashboard.
Incompatibility with EPM WorkspaceThe Lookup component does not work in EPM Workspace, because EPM Workspace cannotaccess the server operating system environment, nor can it make use of pop-ups to collectparameters for several of the operations.
Incompatibility with EPM Workspace 97

98 Dashboard Studio Lookup Component

15Dashboard Studio Maps
Component
In This Chapter
About the Maps Component .. . . . . . . . . . . . . . . . . . . . . . . . . . . . . . . . . . . . . . . . . . . . . . . . . . . . . . . . . . . . . . . . . . . . . . . . . . . . . . . . . . . . . . . . . . . . . . . . . . . . .99
Using a Runtime Release of the Maps Component.. . . . . . . . . . . . . . . . . . . . . . . . . . . . . . . . . . . . . . . . . . . . . . . . . . . . . . . . . . . . . . . . . . . . . . . . . . . .99
Highlighting Map Features with the Maps Component .. . . . . . . . . . . . . . . . . . . . . . . . . . . . . . . . . . . . . . . . . . . . . . . . . . . . . . . . . . . . . . . . . . . . . . 100
Configuring the Map Blank Frame ... . . . . . . . . . . . . . . . . . . . . . . . . . . . . . . . . . . . . . . . . . . . . . . . . . . . . . . . . . . . . . . . . . . . . . . . . . . . . . . . . . . . . . . . . . . . 104
About the Maps ComponentThe Maps component contains additional frames incorporating prebuilt maps that can behighlighted to represent trends in data. The component extends the Dashboard Studio ChartSpotlighter functionality.
The Maps component includes Maps.bqy with supplementary frames that contain prebuiltmaps that can be spotlighted to emphasize key trends across certain states.
The component offers a process for spotlighting graphical elements by using a prebuilt map. Forinstructions on how to spotlight a chart, see the “Spotlighting Charts” section of the HyperionInteractive Reporting – Object Model and Dashboard Development Services Developer's Guide,Volume 5: Dashboard Studio.
Note:
Map Spotlight and Chart Spotlight operations applied to maps and charts take precedence overthe application of Chart Shade configurations. See “Chart Shade Component” on page 27.
Using a Runtime Release of the Maps ComponentThis procedure applies only to a runtime release of the Maps component. Also see “SpotlightingCharts” in the Hyperion Interactive Reporting – Object Model and Dashboard Development ServicesDeveloper's Guide, Volume 5: Dashboard Studio.
➤ To use the Maps component:
1 In Interactive Reporting Studio, open a dashboard that is configured with the Maps component.
2 Navigate to a spotlighted map.
About the Maps Component 99

Graphical elements representing relevant states are spotlighted according to measures set by thedashboard developer.
3 Change the data in the current view by adding filters.
The colors change to reflect the altered data.
Highlighting Map Features with the Maps ComponentThis topic explains how to configure a map to show trends for key states or localities by using atechnique called spotlighting. The topic assumes that the dashboard contains prebuilt maps andall necessary Interactive Reporting Studio sections. To spotlight a map based on conditions orelements that are not presented in these examples, replace the columns and variables with othervalues.
Procedures to spotlight a map:
1. Merge the component. See “Merging Components” on page 10.
2. Create summary tables.
3. Spotlight the map.
Tip:
Renaming a map frame in a dashboard must be performed before spotlighting the map.
Note:
Frame prototypes that contain map images are available in the Maps component and in theFrame_Library.bqy in the templates folder.
Creating Summary TablesThe Create Summary Table frame is designed to automate the process of building summarytables by creating columns to group by, creating computed items, sorting columns, local tables,and filters. Using the Create Summary Table frame saves development time.
Create Summary Table creates a structure that contains the same number of rows as there arebars or segments in a spotlighted chart, or shapes in a spotlighted shape set; for example, a map.See “Configuring the Map Blank Frame” on page 104.
➤ To use the Create Summary Table frame:
1 In Interactive Reporting Studio, open a dashboard that contains the Maps component.
2 Navigate to Create Summary Table.
To access the configuration frame, use Sections or the Configuration drop-down list found inDashboard Studio.
3 In Grouping Column Configuration, select a Table/Results Section that contains your data.
100 Dashboard Studio Maps Component

4 Optional: To view the selected section, click .
5 Optional: Enter a Grouping Column Name to override the default created by the system.
If you are grouping multiple columns, enter a Grouping Column Name. For example, groupingcountry and city, where city is not a unique entity, the user can override the default name whichis the concatenation of the column names; for example, Country_City. The computed dimensionis a concatenation of the column values.
6 Select an available column to highlight in the map.
For example, if you merged the component with Sample_en_esm.bqy, select State.
7 Sort columns by moving selected columns between Available Columns and Grouping Columns by clicking
and .
If Grouping Columns contains multiple items, create a computed item which is a concatenationof the selected columns, otherwise the selected column is the grouping column. Add the groupingcolumn to the Interactive Reporting Studio Sort line of the section.
8 Optional: Reorder Grouping Columns by selecting a column and clicking or .
9 In Summary Table Configuration, enter a Summary Table Name.
For example, enter State_Color. (This name must match the shape set name used later in thespotlighting process).
10 Select a Function to create an aggregated total for each label value.
For example, select Sum.
The function is the summary formula used when creating Summary Fact Columns. The function
value is combined with selected Available Columns when is clicked to generate SummaryFact Columns.
11 Move selected columns between Available Columns and Summary Fact Columns by clicking and
, to identify the columns for which to create summary computed items.
For example, select Revenue to create a summary computed item called Revenue_._Sum_._.
12 Optional: Reorder Summary Fact Columns by selecting a column and clicking or .
13 Optional: To add more columns, move selected columns between Available Columns and Summary Table
Columns by clicking and , to identify which columns are added to the summary table.
14 Optional: Reorder Summary Table Columns by selecting a column and clicking or .
15 Perform an action:
● To remove all settings, click Clear
● To build the summary table, click Create
Highlighting Map Features with the Maps Component 101

All validation is performed. The summary table is created.
The computed column that determines the color to use for a bar or a shape is typically locatedin this section. Use the lower section of the Create Summary Table frame to create the computedcolumn, or if the column is complex, create it directly in the table and only reference it throughthe Create Summary Table frame.
Proceed to Spotlighting the Map.
Spotlighting the MapTo spotlight the map, use the Chart Spotlight Properties frame. The configuration frame includesthe optional creation of a computed item using an expression builder. Spotlighting a map issimilar to spotlighting a chart.
➤ To use the Chart Spotlight Properties frame:
1 Use the Interactive Reporting document from the Creating Summary Table procedure.
2 From Sections, or the Configuration drop-down list found in Dashboard Studio, select Chart SpotlightProperties.
3 From Dashboards with Charts, select an option:
● All Dashboards—Sections in a dashboard with an associated vertical bar, horizontal bar, orpie chart
● Configured Dashboards—Contains at least one Chart Spotlight specification
● Unconfigured Dashboards—Contains no Chart Spotlight specifications
These options filter the frames that are displayed in the drop-down list.
4 Select a map section from the drop-down list:
For example, select Map US.
5 Optional: To view the selected section, click .
If no section is selected, is not selectable.
6 Under Spotlight Configuration, select an item from Chart Section/Shape Set.
For example, select State_Color (Shape Set). The drop-down list displays names for charts onthe selected dashboard and sets of shapes that can be colored by the spotlight feature. Shapeexamples include circles or rectangles that represent color indicators or points on a map, andso on. You must select the shape set name that matches the summary table name. Shape setnames cannot contain spaces.
Table Section is displayed. For example, State_Color is displayed.
7 From Table Section, to view the table, click (next to the table text label).
The displayed table is the source for the selected map.
102 Dashboard Studio Maps Component

If no section is selected, is not selectable.
8 From Labels Column, select a column that associates with the x-axis of the selected chart or one of theshapes.
For example, select State.
The remaining tools on Chart Spotlight Properties assist with defining computed items. Proceedto Defining Color Computed Items.
Defining Color Computed ItemsThere are two ways to define color computed items; externally outside the Chart SpotlightProperties frame or within the Chart Spotlight Properties frame.
Using an Externally Defined ColumnYou can create and maintain the column that determines bar or shape colors externally to theChart Spotlight Properties frame. In this case, use the Chart Spotlight Properties frame drop-down list to select the existing column and click Apply.
Using a Column Defined in the Chart Spotlight Properties FrameThe created or modified computed item is defined using the tools that remain on the ChartSpotlight Properties frame. Computed items cannot be read from the object model, so settingsare remembered and loaded as part of the specification. If the user modifies the specificationdirectly, the modification is unable to be read.
➤ To define the computed item:
1 On Chart Spotlight Properties, perform an action:
a. Ensure Create Color Column is selected, and enter the name of the computed column tocreate in the text box.
For example, enter State_Color.
b. Do not select Create Color Column.
The drop-down list displays the computed item to be modified. Computed and non-computed columns are displayed, separated by a blank line. Computed columns are at thetop of the list.
2 From Value Column, select a column that contains the values that determine which colors to apply.
3 Specify the color condition by selecting an Operator and Value.
a. Select an Operator.
For example, select > (greater than). Operator lists a set of logical operators to be used inthe expression that is being generated.
b. In Value, enter characters (numbers or letters) to use in expressions.
Highlighting Map Features with the Maps Component 103

For example, enter 55000.
4 From the drop-down list, select a palette to change the color scheme of the displayed option buttons.
For example, select Default 4. If no palettes are displayed use the Color Palette Properties frameto configure a palette. See “Using the Color Palette Properties Frame” in the Hyperion InteractiveReporting – Object Model and Dashboard Development Services Developer's Guide, Volume 5:Dashboard Studio.
5 Select an option (color) to combine with Operator and Value to create an expression.
6 Move selected specifications, by clicking and .
The specification is displayed as it is used to construct the computed item.
7 Optional: To enable Selected Condition, select a specification.
The color associated with the expression is displayed.
8 Optional: Reorder selected specifications, by selecting a specification and clicking or .
9 Perform an action:
● To discard specifications and to reload the original settings, click Restore (This occurs atdocument startup)
● To remove the specification for a map or shape set, click Clear
● To remove all current specifications, click Clear All
● To load spotlight settings, click Apply (Clicking Apply after clicking Clear All also results inthe specification being cleared)
10 From Dashboards with Charts, click , to verify that the map is spotlighted correctly.
Configuring the Map Blank FrameThe Maps.bqy file contains a blank frame that can be configured to represent spotlighted maps.
Bitmaps (BMPs) are required, and each item to be spotlighted must be configured.
Note:
The blank frame prototype is also available in the Frame_Library.bqy in the templates folder.
➤ To configure the Map Blank frame:
1 In Interactive Reporting Studio, open a dashboard that contains a section called Map Blank.
2 From Sections, select Map Blank, and rename it.
3 Optional: To configure multiple maps, duplicate the blank map section, and configure each map individually.Repeat steps 5–10 as many times as required.
4 Press Ctrl+D to enter Design mode.
104 Dashboard Studio Maps Component
5 From the catalog pane, expand Graphics or Resources, drag a map image onto the frame, and position theimage.
6 From Graphics, drag an shape object onto the frame, and in Properties set the fill color to white.
7 Position the shape on top of the map in an area to be spotlighted, and double-click the object.
Properties is displayed again.
8 Enter the object name as QiqColor^<summary_table_name>^<column value>.
For example, enter QiqColor^State_Color^CA. Shape set names cannot contain spaces. Theobject name is divided into three parts:
● QiqColor—Text label name
● <summary_table_name>—Must match the summary table name (The second part of theshape set name is the summary table name.)
● <column value>—Must match the name of a value in the results section to be spotlighted
9 Click OK.
10 Optional: Copy and paste as many instances of the object as required, and repeat these procedures as manytimes as needed, once for each pasted object.
a. Position a pasted object on a map area to be spotlighted.
b. Double-click the pasted object to open Properties.
c. Change the third part of the object name to match the names of the other column valuesto be spotlighted.
11 Press Ctrl+D to exit Design mode, and save the dashboard.
Configuring the Map Blank Frame 105

106 Dashboard Studio Maps Component

16Dashboard Studio Metadata
Component
In This Chapter
Metadata Component .. . . . . . . . . . . . . . . . . . . . . . . . . . . . . . . . . . . . . . . . . . . . . . . . . . . . . . . . . . . . . . . . . . . . . . . . . . . . . . . . . . . . . . . . . . . . . . . . . . . . . . . . . . 107
Accessing Metadata by Using the Metadata Button in a Runtime Release ... . . . . . . . . . . . . . . . . . . . . . . . . . . . . . . . . . . . . . . . . . . . . . 108
Configuring Dashboards for the Metadata Component.. . . . . . . . . . . . . . . . . . . . . . . . . . . . . . . . . . . . . . . . . . . . . . . . . . . . . . . . . . . . . . . . . . . . . . 109
Metadata ComponentThe Metadata component enables you to view metadata associated with data from within adashboard. The component enables you to refer to the content and function of database tables,columns, and so on, in easy-to-understand and relevant terms.
Using MetadataMetadata is described as data about data. Stored in database tables, metadata describes thehistory, content and function of the database tables, columns, and joins in intelligible businessterms.
Metadata can overcome awkward names or ambiguous abbreviations often used in a database.Complex and confusing names are derived because, while database engineers are good atdesigning tables, they may not understand the business process as the users of the database; forexample, managers or salespeople. Therefore, a database engineer can create a table calledProd, when the users prefer to call it Product Descriptions. As database tables cannot be easilychanged after creation, Interactive Reporting Studio offers metadata as a way of making thetables (and columns in each table) more user-friendly.
When tables are retrieved using an Interactive Reporting database connection (OCE extension)with metadata (Metadata OCE), the table names are displayed; for example, as ProductDescriptions and Sales Figures, rather than the raw names Prod and Sal. Queries, charts, and pivotsare then created with more familiar names, such as Product Descriptions, instead of Prod.
Metadata Component 107

Using Various Interactive Reporting Database Connectionsto Build DashboardsA business query built using a raw Interactive Reporting database connection creates tables andcolumns that are returned from the database as is. Therefore, column headings may not be user-friendly.
Note:
Interactive Reporting Studio supplies a default raw Interactive Reporting database connectioncalled Sample.oce.
From raw tables and columns, pivots and charts are created, and dashboards are built. As rawInteractive Reporting database connections do not use metadata, the column names reflect thephysical names of the tables; however, they may not be meaningful to end users.
A business query built using an Interactive Reporting database connection with references tometadata, contains a metadata definition that translates physical names in the database intobusiness names using metadata tables. By using the database connection, a more user-friendlyview of the database is available.
Note:
Interactive Reporting Studio supplies one such Interactive Reporting database connection, calledSample with Metadata.oce.
Pivots and charts are created with user-friendly names, and dashboards are built from them. Asmetadata database connections use metadata tables to assign practical names, the Metadatacomponent can also use the tables to retrieve descriptions.
The Metadata component can be added to a previously constructed dashboard. Firstly, modifythe sample metadata query, point it at the metadata tables and select the columns. The metadataquery reads the metadata tables and displays dynamic information about the columns used bythe dashboard.
The metadata query uses a raw Interactive Reporting database connection, instead of a databaseconnection with metadata, because the query needs direct access to the metadata tables. Adatabase connection with metadata does not enable you to see the metadata tables.
Accessing Metadata by Using the Metadata Button in a RuntimeRelease
The Metadata component provides descriptions of the columns used by a dashboard.
108 Dashboard Studio Metadata Component

➤ To access metadata by using (Metadata button):
1 In Interactive Reporting Studio, open a dashboard that is configured with the Metadata component and thatcontains metadata structures.
A metadata sample Interactive Reporting document is available with the component, which canbe merged into Dashboard Studio templates and dashboards. See “Merging Components” onpage 10.
2 Click .
The component examines the Data Layout for the objects that are on the frame, and filters themetadata results to display only those objects. Qiq Metadata is displayed with a table describingthe columns used in the current dashboard frame.
When using the sample Interactive Reporting document do not refresh the metadata. TheInteractive Reporting document points to a placeholder database deliberately so the componentcan be customized to point to a database determined by the user. See “Customizing the MetadataComponent” on page 112.
3 Return to the previous frame and change the current view.
For example, use Quick Slice to add Year to the z-axis (depth).
4 Click again.
Qiq Metadata is displayed. The frame includes data on Year.
Configuring Dashboards for the Metadata ComponentThis taskflow is for dashboard developers who want to add the Metadata component todashboards.
1. Optional: Create an Interactive Reporting database connection with references to metadata(if a connection does not exist). A metadata database connection can be created for eachavailable data source later.
2. Customize the Metadata component to read the correct metadata tables. If multiple datasources are present, multiple Metadata components can be created, each pointing todifferent data sources.
3. Create metadata templates.
a. Add the Metadata component to a Dashboard Studio template, so the component isavailable for building dashboards. However, the component can be added later to othertemplates.
b. Add and configure (Metadata) on frames, to access metadata (see “Adding andConfiguring Buttons to Dashboards or Templates” on page 16), or extend the Help
feature, so frames without can use metadata.
Configuring Dashboards for the Metadata Component 109

4. Save the template.
5. Design dashboards with the metadata-enhanced template by creating one of these options:
● A business query that uses the metadata database connection
● Charts and pivots that use the business query
● Dashboard frames (using metadata-enhanced frames) that contain charts and pivots
6. Save the dashboard.
Creating Interactive Reporting Database Connections withReferences to MetadataPerform this procedure only if no Interactive Reporting database connection file provides accessto metadata descriptions.
This topic demonstrates how to create a metadata database connection that uses Sample.oce,which is supplied with Interactive Reporting Studio. After you complete the procedure, you cancreate your own metadata database connections.
A metadata database connection enables you to use user-friendly names provided by themetadata database connection to build queries, charts, and pivots and to use the Metadatacomponent with a dashboard.
➤ To create a database connection with references to metadata:
1 Start Interactive Reporting Studio, and, on the Welcome dialog, click Cancel.
2 Select File, then New.
New File is displayed.
3 Select Sample.oce, and click OK.
4 On Log on, click OK.
A blank Interactive Reporting document is displayed.
5 Select Tools, then Connection, and then Modify.
Database Connection Wizard is displayed.
6 Select On the current connection, and click Next.
7 Below Custom, click Edit.
Metadata Definition is displayed.
a. On Tables. select Custom Definition.
b. Fill in the text boxes, and use these examples as a guide:
*Physical Table Name: table_name
Table Alias: business_name
From: meta_data_tables
110 Dashboard Studio Metadata Component

c. Select Columns, and select Custom Definition.
d. Fill in the text boxes, and use these examples as a guide:
*Physical Column Name: column_name
Column Alias: business_name
Column Number: sequence
*Column Type: data_type
*Byte Length: length
From: meta_data_columns
Where: table_name=: TABLE
e. Configure the options on Joins, and select Custom.
f. Fill in the text boxes, and use these examples as a guide:
*Primary Table: pkey_table_name
*Primary Column: pkey_column_name
*Foreign Table: fkey_table_name
*Foreign Column: fkey_column_name
From: meta_data_joins
g. On Remarks, select Table Remarks, and configure these entries:
i. In Remarks Tabs, select Description.
ii. Enter Remarks SQL, and use these examples as a guide:
Tab Name: Description
Select: description
From: meta_data_tables
Where: (:TABLE = table_name or :TABALIAS = table_name)
iii. In Remarks Tabs, select Usage Notes.
iv. Enter Remarks SQL, and use these examples as a guide:
Tab Name: Usage Notes
Select: usage_notes
From: meta_data_tables
Where: :TABLE = table_name
8 Click OK to return to the Database Connection Wizard, and click Finish.
A dialog box is displayed asking that the Interactive Reporting database connection file be saved.
9 Click Yes, and name the file.
10 Close the document without saving.
11 Create an Interactive Reporting document that uses the database connection just created.
Configuring Dashboards for the Metadata Component 111
Instead of the raw tables usually seen when using the original Sample.oce, a more user-friendlydatabase view is available. The view excludes the list of metadata tables.
Customizing the Metadata ComponentThe component uses a metadata query section to read metadata tables and return descriptionsof columns that are used in the Interactive Reporting document.
This topic explains how to customize a metadata query so that it points to database metadatatables that are used by Sample.oce. Use this procedure to customize the component to returnmetadata from your own database.
➤ To customize the Metadata component:
1 Use the Interactive Reporting document from the Adding and Configuring the Metadata Button procedure.
2 From Sections, select QIQ Metadata Query.
This query contains sample metadata tables, which must be replaced.
➤ To replace the sample tables with metadata tables:
1 From the catalog pane, expand Tables.
Tables contains a list of topics, including metadata topics.
Sample.oce log on is displayed.
2 Click OK.
3 Select DataModel, then Data Model Options.
4 Clear Auto join tables, and click OK.
5 Drag the replacement pair of metadata topics onto the dashboard.
For example, topics called Meta Data Tables and Meta Data Columns describe tables and columnsin the database.
6 Create joins between the topics.
a. From Meta Data Tables, select Owner, and drag it to the corresponding Owner item inMeta Data Columns.
b. For the Table Name item, repeat the step 6a.
The result is two joins between the topics.
The Request line references columns in the sample metadata topics. These references must beupdated to point to the columns in the metadata tables.
➤ To ensure that the Metadata component points to the correct metadata tables in the database:
1 On the Request line, double-click each item, and, in Item Properties, click Reference.
2 Replace the reference with the topic and item values, as shown in Table 7.
112 Dashboard Studio Metadata Component

Table 7 Replacement Request Line Items
Request Line Item Topic Item
Table Business Name Meta_Data_Tables_2 Business_Name
Column Business Name Meta_Data_Columns_2 Business_Name
Table Name Meta_Data_Tables_2 Table_Name
Column Physical Name Meta_Data_Columns_2 Column_Name
Column Description Meta_Data_Columns_2 Description
Column Usage Notes Meta_Data_Columns_2 Usage_Notes
Column Transformation Rules Meta_Data_Columns_2 Transformation_Rules
Column Source System Meta_Data_Columns_2 Source_System
3 Remove the sample request items that do not exist in the metadata topics.
4 Drag items from the metadata structures to the Request line to make them visible.
Items on the Filter line must be updated as they reference old topics.
➤ To update Filter line items:
1 On the Filter line, delete Table Name and Column Name.
The deleted items reference the old topics.
2 Add the equivalent columns from the metadata topics, name the first filter Table Name and the second filterColumn Name.
3 From Meta Data Tables 2, add Table Name, and from Meta Data Columns 2, add Column Name asfilters.
4 In Filter, click Show Values, Select All, and OK.
Values must be assigned to a filter before being added to the filter.
5 Delete the original sample metadata topics from the content area.
6 Double-click Meta Data Tables 2.
Topic Properties is displayed.
7 Rename Topic Name as Meta Data Table, and click OK.
8 For Meta Data Columns 2, repeat steps 7–8, and rename Meta Data Columns 2 as Meta Data Column.
The item references are updated.
9 On the Interactive Reporting Studio toolbar, click Process, to process the query section.
QIQ Metadata results is populated with metadata from the Sample.oce database. The resultssection represents the component local cache of metadata from the Sample.oce database. Fromthis point forward, the component uses the cache to show the database metadata. The local cacheenables a dashboard with the Metadata component to display metadata, even if the dashboardand component are disconnected from their databases. However, the cache of metadata can be
Configuring Dashboards for the Metadata Component 113

updated when it is connected to the database, by reprocessing the QIQ Metadata query or by
clicking on QIQ Metadata.
10 Select File, then Save As.
Name the component by describing the database to which the component is linked. For example,name the component Metadata_component_for_Sample_OCE.bqy.
11 Close the document.
Creating Metadata TemplatesThe Metadata component must be added to a template to create a metadata template. Access is
provided by clicking or using the Help feature.
Adding the Metadata ComponentMerge the Metadata component into a template to create a metadata template. See “MergingComponents” on page 10.
Frames created from the template contain , which enables you to access the metadata table.Use Dashboard Studio to extend the button functionality to perform specialized functions.
Providing Access to the Metadata Component
The Metadata component provides two frame prototypes for which is configured. Use theprototypes as the basis for creating a template. These Metadata frame prototypes are alsoavailable in the Frame_Library.bqy in the templates folder.
Metadata can also be accessed by using one of these methods:
● Add to frames
● Extend the Help feature
In this procedure, add and configure to access to metadata.
➤ To add and configure (Metadata):
1 In Interactive Reporting Studio, open a dashboard that contains the Metadata component.
2 Select the frame on which to add the button, and press Ctrl+D to enter Design mode.
3 From the catalog pane, expand Graphics, and drag a picture object onto the frame.
4 Navigate to Metadata.bmp in the Metadata component directory, and position the button on thedashboard toolbar.
114 Dashboard Studio Metadata Component

5 Double-click the button.
Properties is displayed.
6 Enter pic^Qiq_metadata as the object name, and click OK.
7 Select the button, right-click, and select Scripts.
Scripts Editor is displayed.
8 In Scripts Editor, perform an action:
● Enter this line of code
ActiveDocument.Sections[txlMe.Text].Qiq_onControlClick(this.Parent,this)
● Copy and paste the line of code from another button on the toolbar to avoid data entryerrors
9 Click OK.
10 Optional: Add, configure, and name the corresponding gray button for the not selectable state.
11 Press Ctrl+D to exit Design mode.
In this procedure, the Help feature is extended to enable access to metadata.
➤ To extend the Help feature:
1 In Interactive Reporting Studio, open a template that contains the Metadata component.
2 Select View, then Unhide Section.
3 Select 1100 Custom Metadata and 1100 Custom, and click OK.
4 From Sections, select 1100 Custom Metadata.
5 Press Ctrl+D to enter Design mode.
6 Right-click , and select Scripts.
Scripts Editor is displayed that contains code that must be added to the 1100 Custom frame.
7 In Scripts Editor, select the code, and press Ctrl+C to copy.
8 Click OK.
9 Move to 1100 Custom, right-click , and select Scripts.
10 In Scripts Editor, select the code, and press Ctrl+V to paste the code copied from the previous frame.
11 Click OK, and press Ctrl+D to exit Design mode.
12 On 1100 Custom, click , to initialize the code.
Clicking on every frame of type 1100 (that is, every frame that does not contain )provides access to the metadata table.
13 From Sections, select 1100 Custom, and select View, then Hide Section.
Configuring Dashboards for the Metadata Component 115

14 From Sections, select 1100 Custom Metadata, and select View, then Hide Section.
15 Save the template.
Designing Dashboards with the Metadata-EnhancedTemplate
➤ To design a dashboard with the metadata-enhanced template:
1 From Dashboard Studio Start, select a template or editable source master (ESM) that contains the Metadata
component, and click .
Dashboard Studio moves to Step 1: Create Queries, Tables, Charts, Pivots, and Reports.
2 Insert a query using an Interactive Reporting database connection with metadata definitions.
In this step, use the database connection that was created in “Creating Interactive ReportingDatabase Connections with References to Metadata” on page 110. This action enables chartsand pivots to be created that use user-friendly names.
3 Create the Interactive Reporting Studio sections, such as charts, pivots, and tables, to be displayed on thedashboard, and use Dashboard Studio to name them.
4 In Dashboard Studio, click to move to the Frames step.
5 Select the frame prototype to use for the dashboard.
6 Click to move to the Layout step.
7 In Interactive Reporting Studio, drag sections onto the frames.
8 In Dashboard Studio, click to move to the Associate step.
9 Click to associate the sections.
10 Complete the remaining Dashboard Studio steps, and save the dashboard.
The Metadata feature is accessible by clicking or , depending on how the template iscustomized.
116 Dashboard Studio Metadata Component

17Dashboard Studio Pivot Trees
Component
In This Chapter
Pivot Trees Component .. . . . . . . . . . . . . . . . . . . . . . . . . . . . . . . . . . . . . . . . . . . . . . . . . . . . . . . . . . . . . . . . . . . . . . . . . . . . . . . . . . . . . . . . . . . . . . . . . . . . . . . . . 117
Creating a Query Definition ... . . . . . . . . . . . . . . . . . . . . . . . . . . . . . . . . . . . . . . . . . . . . . . . . . . . . . . . . . . . . . . . . . . . . . . . . . . . . . . . . . . . . . . . . . . . . . . . . . . 117
Building Queries.. . . . . . . . . . . . . . . . . . . . . . . . . . . . . . . . . . . . . . . . . . . . . . . . . . . . . . . . . . . . . . . . . . . . . . . . . . . . . . . . . . . . . . . . . . . . . . . . . . . . . . . . . . . . . . . . . 118
Configuring the Pivot Trees Component.. . . . . . . . . . . . . . . . . . . . . . . . . . . . . . . . . . . . . . . . . . . . . . . . . . . . . . . . . . . . . . . . . . . . . . . . . . . . . . . . . . . . . . . 119
Pivot Trees ComponentThe Pivot Trees component uses the OnCellDoubleClick event that an embedded pivotexposes to expand or drill into hierarchies of information. The operation is similar to using TreeViews in the Tree component (see Chapter 21, “Dashboard Studio Tree Component”).
The component initially displays top level nodes in pivots. However, when a row containingPivot Trees properties is double-clicked, the descendants are displayed or hidden.
Note:
The Pivot Trees component uses appended queries to view data in a hierarchical structure. Anappended query is a group of different queries appended together. Each query in an appendedquery has the same column names and column data types. For detailed information on appendedqueries, see the section titled “Appending Queries” in the Hyperion Interactive Reporting Users'Guide.
Creating a Query DefinitionCreating a query definition is a requirement for the component to function correctly, and youmust provide a hierarchical structure for the results set.
As an example, open the PivotTree_Sample_esm.bqy, and from Sections, select Sales PTResults. The Item Type column represents the first level of the hierarchy, Store Type is the secondlevel, OS is the third level, and State is the fourth level. The columns called Units and Amountare summary data. Therefore, to define the query, you must decide on the hierarchy and factsthat are required before building the query.
Pivot Trees Component 117

Building QueriesUsing the sample, PivotTree_Sample_esm.bqy, from Sections, select Sales PT Query. Thisquery is a union of four separate query requests where each query has the same column names.In Sales PT Query 1, Item Type is added, and then the remaining hierarchical columns are addedas NULL columns. The Units column, for example, becomes the Sum of Units for Item Type.See Table 8 for the column names and values.
Table 8 Sales PT Query 1 Column Names and Values
Column Name Column Values
Item Type Item Type
Store Type NULL
OS NULL
State NULL
Sum(Units) Sum(Units)
Sum(Amount) Sum(Amount)
In Sales PT Query 2, Store Type is added as the next hierarchical level, it contains data ratherthan being a NULL column. The remaining columns are again added as NULL columns. TheSum of Units column, for example, becomes the Sum of Units for Item Type and Store Type.See Table 9 for the column names and values.
Table 9 Sales PT Query 2 Column Names and Values
Column Name Column Values
Item Type Item Type
Store Type Store Type
OS NULL
State NULL
Sum(Units) Sum(Units)
Sum(Amount) Sum(Amount)
➤ To create a union of queries:
1 In Interactive Reporting Studio, open a dashboard that contains the Pivot Trees component, and selectInsert, then New Query.
2 If prompted, select the database connection file.
For example, select Sample.oce, and click OK at the user name and password login withoutentering any information.
118 Dashboard Studio Pivot Trees Component

3 From catalog, expand Tables, and drag tables onto the content area.
4 Optional: Create links between the tables, if not automatically linked.
5 Select topics or columns and drag them onto the Request line.
6 Select Query, then Append Query to create the union.
A set of query tabs is displayed beneath the Request line.
7 Optional: Select a query tab, right-click, and select Rename.
8 Select topics or columns and drag them onto the Request line for the appended queries.
9 From the Interactive Reporting Studio toolbar, select Process.
The results are displayed.
10 Select Insert, then New Table and drag all columns to the Content pane.
Configuring the Pivot Trees Component
➤ To configure the Pivot Trees component:
1 Merge the component. See “Merging Components” on page 10.
2 Create a query definition. See “Creating a Query Definition” on page 117.
3 Build a query. See “Building Queries” on page 118.
4 Configure the Pivot Trees tables using the Pivot Trees Properties.
➤ To use the Pivot Trees configuration frame:
1 In Interactive Reporting Studio, open a dashboard that contains the Pivot Trees component.
To access the configuration frame, use Sections or the Configuration drop-down list found inDashboard Studio.
2 From Base Table Section, select a results or table section that contains the full row set representing everytree node, and that will be used as the base for the pivot tree.
The selected table or results populates Available Columns.
3 From Tree Table Section, select an option:
● Select a Tree Table Section—A list of recognized Pivot Trees tables created from the existingresults set is displayed (The first Pivot Trees table is displayed by default)
● Create a Tree Table Section—The table is based on the Base Table Section name; for example,if the base section is called Revenue Results, then the Pivot Trees table is calledOrcl_pivotTree_Revenue Results (Where no Pivot Trees tables exist, Create a new table isdisplayed by default)
Base tables can have one or more associated Pivot Trees tables.
Configuring the Pivot Trees Component 119

4 Move selected Available Columns between Column Hierarchy and Other Columns by clicking and
.
5 Optional: Reorder Column Hierarchy and Other Columns by selecting a column and clicking or
.
The Column Hierarchy list should match the column order in the Request line.
6 From Descendants Indicator, select a character to indicate that one or more descendants exist.
The indicators are displayed as a hexadecimal representation: character representation. The
default value is 25BC: .
7 Optional: Replace the default Hierarchy Separator value if the default value will cause a conflict with yourdata.
The Hierarchy Separator creates the hierarchical path for each node with the separator betweeneach value. Although the separator is never displayed, it is used by the component to create thecolumns called __break_Gen1, __break_Gen2, and so on.
8 Optional: Clear Automatically configure Embedded Pivot Objects on dashboards, which is selected bydefault, to configure the pivots that belong to the Pivot Trees component.
When this option is selected, the Associate step in Dashboard Studio adds theOnCellDoubleClick code to pivots created from the Pivot Trees table, and txlClass is updatedto reference Orcl_pivotTree so the correct code handles double-clicking a cell. The option is notset if another component uses txlClass, in which case the developer must add code lines to theOnCellDoubleClick event.
9 Perform an action:
● To discard in-memory settings and revert to original settings, click Restore
● To remove all in-memory settings, click Clear All (A dialog box is displayed that promptsto remove all computed sections. To retain the existing configuration of the base, tree, andpivot tables, click Yes. The tables are removed from the Interactive Reporting document.Click No for the component to remove the configurations. Clicking Apply saves the changes,and clicking Restore reloads the saved configurations)
● To remove in-memory settings from table sections, click Clear (The user selects to delete alltables and pivots, or only the in-memory representations of the configurations. This issimilar to clicking Clear All. Clicking Apply saves the changes, and clicking Restore reloadsthe saved configurations)
● To create computed columns, the table and pivot, and save the settings, click Apply (ClickingApply creates the base, tree, and default pivot)
10 Drag the pivot that is created onto a Dashboard frame. Right click the pivot, go to Properties and select theActive option button. Click OK.
11 Connect the dashboard to the Wizard, move to Step 4, and click .
120 Dashboard Studio Pivot Trees Component
18Dashboard Studio Point of View
(POV) Component
In This Chapter
Point of View (POV) Component .. . . . . . . . . . . . . . . . . . . . . . . . . . . . . . . . . . . . . . . . . . . . . . . . . . . . . . . . . . . . . . . . . . . . . . . . . . . . . . . . . . . . . . . . . . . . . . . 121
Using a Runtime Release of the Point of View Component .. . . . . . . . . . . . . . . . . . . . . . . . . . . . . . . . . . . . . . . . . . . . . . . . . . . . . . . . . . . . . . . . . 121
Configuring the Point of View Component .. . . . . . . . . . . . . . . . . . . . . . . . . . . . . . . . . . . . . . . . . . . . . . . . . . . . . . . . . . . . . . . . . . . . . . . . . . . . . . . . . . . . 122
Import Server Names Must Match... . . . . . . . . . . . . . . . . . . . . . . . . . . . . . . . . . . . . . . . . . . . . . . . . . . . . . . . . . . . . . . . . . . . . . . . . . . . . . . . . . . . . . . . . . . . 132
Point of View (POV) ComponentThe POV component enables you to manipulate Oracle's Hyperion® Web Analysis Studio andOracle Hyperion Financial Reporting Studio, Fusion Edition views embedded within InteractiveReporting Studio dashboards.
The views are displayed using URLs that are associated with filters in the dashboard. In a runtimedocument, users set filters in dashboards which results in the Point of View attribute beingrefreshed. For example, Interactive Reporting Studio may display expense information for anorganization, while Web Analysis Studio may display budgets, and Reporting Studio may displayactual revenue. The three reporting environments must share common dimensions such as,geography or sales organization with common members. Operations then applied to thedashboards are extended to other views so that a coherent synchronized set of operations isperformed.
When connecting to a dashboard with an embedded view, you may be prompted to:
● Enter your login and password every time
● Remove your login and passwords from the document
Using a Runtime Release of the Point of View ComponentThis procedure applies only to a runtime release of the POV component.
➤ To use the POV component:
1 In Interactive Reporting Studio, open a dashboard that is configured with the POV component.
2 Optional: Perform an action if prompted:
● If a Point of View login screen is displayed:
Point of View (POV) Component 121

❍ Enter your login and password for each POV URL, and click OK.
Your credentials are stored for that session. You can select multiple URLs before youenter your login information.
❍ Click on the toolbar to begin using your document.
● To remove the Point of View login and password information from your InteractiveReporting document, click Yes, and save your document.
3 Navigate to a frame that contains a POV embedded browser.
4 Set filters by selecting one or a combination of these actions:
● From the Filters drop-down list, select items
● Use Quick Filters or Quick Slice on the side-label navigation panel, if these options areconfigured
If the dashboard developer enabled Automatically refresh when Filters are set, the refreshed
frames reflect the filters. If the option is not enabled, click .
A POV embedded browser is refreshed only if the applied filter is associated with the POV URLattributes. See “Using Map URL Attributes” on page 128.
5 Optional: If configured, share an embedded browser among multiple POVs to reduce the size of the spaceused, by selecting an option button. See “Accessing Multiple Point of View Embedded Browsers with OptionButtons” on page 129.
Configuring the Point of View ComponentThe POV component works only with dashboards built with Release 9.0 templates.
To configure the POV component:
1. Merge the component. See “Merging Components” on page 10.
2. Collect URLs.
3. Name and configure URLs.
4. Create a POV embedded browser.
5. Add option buttons to access multiple POV embedded browsers.
6. Optional: Configure (Refresh).
7. Optional: Import the Interactive Reporting document into EPM Workspace.
Collecting POV URLsThe POV component displays Reporting Studio and Web Analysis Studio views in dashboardembedded browsers. URLs that display the content must first be gathered, saved to text files,
122 Dashboard Studio Point of View (POV) Component
and tested. The text files are used to import the URLs, see “Using Manage URL Library” on page124.
➤ To collect, save, and test URLs for Reporting Studio:
1 Log on to EPM Workspace on a server.
2 Navigate to the folder that contains the Reporting Studio document to be displayed.
Note the folder path and file name.
3 Open a Web browser, and enter the URL:
http://server:port/workspace/browse/listXML?path=<folder path>
4 If prompted, log on to EPM Workspace again.
An XML file listing URLs for all documents in the folder is displayed.
5 Search for the elected file name, and copy the HTML URL.
6 Paste the URL into a text file.
7 In EPM Workspace, provide a user name and password by replacing sso_token=$SSO_TOKEN$&$CONTEXT$ with sso_username=username&sso_password=password.
The replacement enables EPM Workspace to display content without prompting for a user nameand password.
8 If the document contains modifiable dimensions, append the dimensions to the URL in the form:
&attribute=Dimension.id.SampleValue
For example, if the document contains two modifiable dimensions, year and market, appendthis text to the URL:
&attribute=Year.id.Qtr1&attribute=Market.id.New+York
9 Save the text file.
10 Test the URL in a Web browser, by using the text file created in step 6.
By default, the view pane and masthead are enabled in EPM Workspace. Therefore, to providea larger content area to display a URL in a frame, turn these elements off by appending&layout=embedded to the URL.
➤ To collect, save, and test URLs for Web Analysis Studio:
1 Log on to EPM Workspace, and navigate to the Web Analysis Studio document to be displayed.
2 In a Web browser, note the server and port, and the file path.
3 Open another Web browser, and enter a URL as http://server:port.
For example, enter http://folsom:19000.
4 Append this string to instruct Web Analysis Studio to load the document:
/WebAnalysis/servlet/HTMLViewer?action=login&postlogin=loadReport
5 Append the location of the Web Analysis Studio document &report=file path.
For example, append &report=/DavidW/Chart.
Configuring the Point of View Component 123

6 To test the URL on the desktop, in EPM Workspace, provide a user name and password by appending&userid=user_name&password=password.
Appending the string enables EPM Workspace to display content without prompting for a username and password.
7 If the document contains modifiable dimensions, append the dimensions to the URL in the form:
&attribute=Dimension.id.SampleValue
For example, if the document contains two modifiable dimensions, year and market, appendthis text to the URL:
&attribute=Year.id.Qtr1&attribute=Market.id.New+York
8 Provide screen dimensions for the Web Analysis Studio document by appending this string:
&reportWidth=NumberOfPixels&reportHeight=NumberOfPixels
For example, append &reportWidth=400&reportHeight=300.
By default, the view pane and menu bar are enabled in a POV embedded browser. Therefore, toprovide a larger content area to display a URL in a frame, turn off these elements by appending&templatePath=hitemplates&hideSubToolbar=true to the URL.
9 Press Enter in the Web browser to launch the URL.
The URL is displayed; for example, as:
http://folsom:19000/WebAnalysis/servlet/HTMLViewer?action=login&postlogin=loadReport&report=/DavidW/Chart&userid=ld_admin&password=quality&attribute=Year.id.Jul&attribute=Market.id.New+York&reportWidth=400&reportHeight=300&templatePath=hitemplates&hideSubToolbar=true
10 Copy and paste the URL into a text file, and save the file.
Naming and Configuring URLs for DashboardsThe three configuration frames that are associated with the POV component, are discussed inthese topics.
1. Use Manage URL Library to import or enter the URLs gathered in the Collecting POV URLsprocedure.
2. Use Set URL Properties to configure the properties of each URL; for example, the size of theview.
3. Use Map URL Attributes to associate filters within a dashboard with the hierarchy membersof each URL.
Using Manage URL LibraryThe Manage URL Library frame enables you to load a set of URLs and specify the URLs to bedisplayed in POV embedded browsers.
124 Dashboard Studio Point of View (POV) Component

The fastest way to load URLs is to import a text file that contains URLs, although you canmanually enter URLs into the list. These URLs must be assigned names so they are associatedwith embedded browsers in the dashboards. The URLs must be fully-featured before beingimported. That is, the URLs must contain the properties in Table 10.
Table 10 Essential URL Properties and Explanations
URL Parameter Explanation
Web Analysis Studio URLs
userid=username
password=password
Log on details
attribute=Dimension.id.Value Append to the URL for every modifiable dimension in the Web Analysis Studiodocument
reportWidth=number
reportHeight=number
Size of the Web Analysis Studio document
templatePath=hitemplates
hideSubToolbar=true
Maximize the content area (optional)
Reporting Studio URLs
sso_username=username
sso_password=password
Log on details
attribute=Dimension.id.Value Append to the URL for every modifiable dimension in the Reporting Studio document
layout=embedded Maximize the content area (use full to display the masthead and the view pane)
Note:
Omitted essential properties are not editable in the POV configuration frames.
URLs must be valid. URL property values must not contain these special characters:
<space> ? & =
Replace special characters with escaped characters, as presented in Table 11.
Table 11 Special Characters and Replacement Values
Special Character Replacement
<space> +
? %3F
& %26
= %3D
Configuring the Point of View Component 125

For example, the URL:
attribute=Industry.key.[Industry].[1. Mining & Construction].[10. Metal mining]
is replaced with:
attribute=Industry.key.[Industry].[1.+Mining+%26+Construction].[10.+Metal+mining]
Each attribute must contain a valid separator. You must use the separator “id” for ReportingStudio and Web Analysis Studio; for example:
Dimension.id.Value
➤ To import a text file with URL values:
1 In Interactive Reporting Studio, navigate to Manage URL Library.
2 Perform an action:
● In File with URL values, enter the file path
● Click Browse and navigate to the file (Browse is available only if the common file dialog boxis accessible and can be called from within Interactive Reporting Studio)
3 Click Import URLs,
The operation clears all other entries from the list.
➤ To manually add a URL:
1 Enter the URL.
2 Click Add URL.
The action appends entries to the list.
Imported or entered URLs are displayed in Select a URL.
➤ To name and store a URL:
1 Select a URL, and enter the URL Name.
The URL name is used to identify the URL displayed in the embedded browser, and as the nameforms part of the embedded browser name, spaces must be replaced with underscores (_). Thename must be unique.
2 Click to store the URL.
The name is displayed in Available URLs, and an application type is assigned to the URL.
3 If the wrong application is assigned, from the drop-down list, select the correct type.
4 Name the other URLs to be displayed in the embedded browsers.
5 Click Apply.
Use Set URL Properties and Map URL Attributes to configure the POV URLs.
126 Dashboard Studio Point of View (POV) Component

➤ To delete a POV URL:
1 From Available URLs, select the URL to be deleted.
2 Optional: Select a URL Type.
3 Click .
4 Click Apply.
To export configured URLs with assigned names, click Export URLs to export the list to a textfile. These URLs are available to be imported into other dashboards.
Using Set URL PropertiesURLs imported into the POV component are usually long and complex. The Set URL Propertiesframe divides URLs into manageable chunks, and enables you to edit the URL properties. OnlyURLs with names assigned in Manage URL Library are available in this procedure.
➤ To configure the URL properties:
1 In Interactive Reporting Studio, navigate to Set URL Properties.
2 From Available URLs, select a URL name.
URL properties are displayed.
● EPM Workspace Server Path—Application module (for example, Reporting Studio or WebAnalysis Studio) to which the EPM Workspace server redirects the URL (If the URL doesnot require redirection, the default is <Automatic>)
● Application Path—Application module
● URL User Id—User name
● URL Password—Password
The user name and password are used to log on to the application module when theInteractive Reporting document is run; for example, in Interactive Reporting Studio.However, when the Interactive Reporting document is imported into EPM Workspace, thePOV component uses EPM Workspace credentials to log on.
● Other URL Properties—Other modifiable properties (Depending on the application type,properties for modification are; for example, the width and height of displayed content, thecolor scheme, and whether to hide or show toolbars. The number of editable properties isdependent on the total properties present in the imported URL. See Table 10 for essentialproperties)
● Instance—Individual values to use if the selected URL property contains multiple values
● URL Instance Property Value—The value of the selected URL property
3 Optional: Edit the properties.
4 Click Apply.
Configuring the Point of View Component 127

Using Map URL AttributesThe Map URL Attributes frame enables you to associate a local filter with each attribute memberin a POV URL. The association determines whether a POV URL should be updated when a filteris set in the dashboard.
Before using Map URL Attributes, ensure that data values are shared by dashboard filters, anddimensions in Reporting Studio and Web Analysis Studio.
To automatically refresh a POV embedded browser when a filter is set, select Automaticallyrefresh when Filters are set. Or provide a means to manually refresh items; for example, configure
on the frame. See “Configuring the Refresh Button” on page 131.
➤ To associate filters with a URL attribute:
1 In Interactive Reporting Studio, navigate to Map URL Attributes.
2 From Available URLs, select a URL.
URL Attributes are displayed. Local filters are displayed in Available Filters.
3 Select an item in URL Attributes.
URL Attribute Members are displayed. The number of attributes is dependent on the attributespresent in the imported URL. See Table 10 for essential properties.
4 Move selected filters between Available Filters and Associated Filters by clicking and .
5 Optional: Reorder multiple members to specify a hierarchy of filter values, by selecting a filter and clicking
or .
The hierarchy order must correspond to the order of the attribute members in the list. If theselected filter is set, each member value is replaced by the corresponding selected filter value (ifthe value exists in the application database).
6 Configure other attribute members to be associated with filters.
7 Click Apply.
Creating Embedded Browsers Point of View objects are displayed on the frames through embedded browsers.
➤ To create a POV embedded browser:
1 In Interactive Reporting Studio, navigate to a frame that is to contain the POV objects.
2 Press Ctrl+D to enter Design mode.
3 From the catalog pane, expand Controls, and drag an embedded browser object onto the frame.
4 Double-click the browser object.
Properties is displayed.
128 Dashboard Studio Point of View (POV) Component
5 Enter the object name as <url_name>^Hysl_pov.
For example, for a URL named Metrics_Clip, enter Metrics_Clip^Hysl_pov.
6 Click OK.
7 Press Ctrl+D to exit Design mode.
8 Navigate to another frame and return to refresh the embedded browser.
9 Optional: To apply filters and observe embedded browsers updating on the frame, add Quick Filters. See“Configuring Quick Filters” in the Hyperion Interactive Reporting – Object Model and DashboardDevelopment Services Developer's Guide, Volume 5: Dashboard Studio.
For example, use the Tree component to select hierarchical values that are used in ReportingStudio and Web Analysis Studio. Consider using the Tree component to navigate and apply thefilters. See“Using Tree Views in the Tree Limits Component Runtime Sample” on page 159 and“Configuring the Tree Component” on page 160.
Obtain the tree hierarchy source by creating an OLAP query to Oracle Essbase for OracleHyperion Financial Reporting Studio, Fusion Edition and Oracle's Hyperion® Web AnalysisStudio.
Accessing Multiple Point of View Embedded Browsers withOption ButtonsDashboard developers who want to place related documents on one dashboard frame, to enableusers to view related information within one context, and without moving from frame to frame,can use option buttons.
A single Point of View embedded browser can occupy more than half the screen, so placingmultiple POV objects on one frame can be difficult. The Point of View component enables youto share one embedded browser between multiple POV objects. Users select an option buttonto switch between POV views.
Adding Option ButtonsThe POV component enables you to use option buttons to switch between embedded browsers,and reduce the amount of space used.
Before adding option buttons, create a shared embedded browser.
➤ To create a shared POV embedded browser:
1 In Interactive Reporting Studio, navigate to a frame that is to contain multiple POV objects.
2 Press Ctrl+D to enter Design mode.
3 From the catalog pane, expand Controls, and drag an embedded browser object onto the frame.
4 Double-click the browser object.
Properties is displayed.
Configuring the Point of View Component 129

5 Enter all^Hysl_pov as the object name.
6 Click OK.
7 Press Ctrl+D to exit Design mode.
8 Navigate to another frame and return to refresh the embedded browser.
Note:
Information in earlier releases regarding adding option buttons is still applicable; however, it isnot as efficient as the latest information provided in this documentation.
➤ To add option buttons:
1 In Interactive Reporting Studio, open a dashboard frame containing POV embedded browsers.
2 Press Ctrl+D to enter Design mode.
3 From the catalog pane, expand Controls, and drag an option button onto the frame.
4 Double-click the option button.
Properties is displayed.
5 Enter <url_name>^Hysl_pov^rbt as the object name.
For example, for a URL named Metrics_Clip, enter Metrics_Clip^Hysl_pov^rbt.
6 Click OK.
7 Select the option button, right-click, and select Scripts.
Scripts Editor is displayed.
8 In Scripts Editor, perform an action:
● Enter this line of code
ActiveDocument.Sections[txlMe.Text].Qiq_onControlClick(this.Parent,this)
● Copy and paste the line of code from another button on the toolbar to avoid data entryerrors
9 Click OK.
10 Repeat steps 3–9 for every option button to be added.
11 Press Ctrl+D to exit Design mode.
Creating Multiple Shared Embedded BrowsersUsers with large screen sizes can place multiple shared POV embedded browsers on a frame.Each shared browser is individually controlled by a set of option buttons.
➤ To create multiple shared embedded browsers:
1 In Interactive Reporting Studio, navigate to a frame that is to contain the POV objects.
130 Dashboard Studio Point of View (POV) Component

2 Press Ctrl+D to enter Design mode.
3 From the catalog pane, expand Controls, and drag an embedded browser object onto the frame.
4 Double-click the browser object.
Properties is displayed.
5 Enter all2^Hysl_pov as the object name.
The object name numbers must be sequential. For example, enter all3^Hysl_pov,all4^Hysl_pov, and so on.
6 To assign an option button to a shared browser, use the Adding Option Buttons procedural steps, and nameit <url_name>^Hysl_pov^rbt^<browser_id>.
For example, to assign an option button with a Metrics_Clip URL to the shared browserall2^Hysl_pov, name the option button Metrics_Clip^Hysl_pov^rbt^all2.
If a browser_id is not specified, the option button points to the default shared browser,all^Hysl_pov.
7 Select the option button, right-click, and select Scripts.
Scripts Editor is displayed.
8 In Scripts Editor, perform an action:
● Enter this line of code
ActiveDocument.Sections[txlMe.Text].Qiq_onControlClick(this.Parent,this)
● Copy and paste the line of code from another button on the toolbar to avoid data entryerrors
9 Click OK.
10 Press Ctrl+D to exit Design mode.
Configuring the Refresh Button
To manually refresh a POV item when a filter is set, configure on the frame.
➤ To add and configure (Refresh):
1 In Interactive Reporting Studio, open a dashboard that contains POV embedded browsers.
2 Select the frame on which to add the button, and press Ctrl+D to enter Design mode.
3 From the catalog pane, expand Graphics, and drag a picture object onto the frame.
4 Navigate to refresh.bmp in the POV component directory.
5 Position the button on the dashboard toolbar.
6 Double-click the button.
Properties is displayed.
Configuring the Point of View Component 131

7 Enter picRefresh^Hysl_pov as the object name.
8 Click OK.
9 Select , right-click, and select Scripts.
Scripts Editor is displayed.
10 In Scripts Editor, perform an action:
● Enter this line of code
ActiveDocument.Sections[txlMe.Text].Qiq_onControlClick(this.Parent,this)
● Copy and paste the line of code from another button on the toolbar to avoid data entryerrors
11 Click OK.
12 Press Ctrl+D to exit Design mode.
13 Set filters on the frame, and click .
The POV embedded browsers refresh to reflect the set filters.
Import Interactive Reporting Documents into EPMWorkspace To import an Interactive Reporting document into EPM Workspace use the standard importprocedure. The imported Interactive Reporting document contains the POV componentfunctionality.
When the POV component is run in EPM Workspace, the EPM Workspace log on authenticationis required.
See “Import Server Names Must Match” on page 132, for troubleshooting when importingInteractive Reporting documents into EPM Workspace.
Import Server Names Must MatchIf a POV embedded browser displays an error message, ensure that the server names of the URLused to log on to EPM Workspace and the URL imported into the POV component match.
For example, if the Web browser displays the log on URL for EPM Workspace as:
http://folsom:19000/workspace/index.jsp
And the imported URL is displayed as:
http://folsom.hyperion.com:19000/metrics/viewer/clip?
A mismatch in the server names of the URLs is apparent. To rectify the mismatch, change oneof the URLs so that the names are identical.
132 Dashboard Studio Point of View (POV) Component
19Dashboard Studio Query Limits
Component
In This Chapter
Query Limits Component .. . . . . . . . . . . . . . . . . . . . . . . . . . . . . . . . . . . . . . . . . . . . . . . . . . . . . . . . . . . . . . . . . . . . . . . . . . . . . . . . . . . . . . . . . . . . . . . . . . . . . . . 133
Using a Runtime Release of the Query Limits Component .. . . . . . . . . . . . . . . . . . . . . . . . . . . . . . . . . . . . . . . . . . . . . . . . . . . . . . . . . . . . . . . . . . 134
Configuring the Query Limits Component .. . . . . . . . . . . . . . . . . . . . . . . . . . . . . . . . . . . . . . . . . . . . . . . . . . . . . . . . . . . . . . . . . . . . . . . . . . . . . . . . . . . . . 135
Connected Queries Displayed as Disconnected ... . . . . . . . . . . . . . . . . . . . . . . . . . . . . . . . . . . . . . . . . . . . . . . . . . . . . . . . . . . . . . . . . . . . . . . . . . . . 137
Query Limits ComponentThe Query Limits component manages the gathering of limits and the processing of queries. Itenables you to process the dashboard without having to deal with variable limits individually insections.
After the component is merged, it can be used to:
● Configure component properties at design time (See “Configuring the Query LimitsComponent” on page 135)
● Gather limit values and execute queries in the dashboard at runtime (See “Using a RuntimeRelease of the Query Limits Component” on page 134)
The Query Limits component conceals the complexity of having to provide identical answersmultiple times to different limits. For example, a dashboard can contain separate structures (ordatabases) for costs and sales information, or it may require multiple appended queries toproduce a consolidated revenue report from various types of revenue-oriented transactions.
Typically the time period of interest is identical in all query structures.
Specifying the time frame for a query only once, is a practical and time saving feature. Havingthe dashboard developer configure a mechanism to apply an identical time frame to theremaining limits, saves you having to repeat the answer for each limit.
The related-limits mechanism relies on two requirements:
● similar data type
● common name prefix
Two variable limits share a name prefix, if they fall in one of these categories:
● identical names
● names contain two periods (..) with identical information on the left of the two periods
Query Limits Component 133

Table 12 Query Limits Name Prefix Examples
Data Model Regular Query 1 Regular Query 2 Appended 1 Appended 2 Comment
Quarter Quarter Quarter
Quarter Quarter Quarter Quarter Quarter See Note 1
Quarter Quarter Quarter Quarter Quarter..2 See Note 2
Acct No Acct No Acct No Acct No Acct No See Note 1
Acct No Acct No Acct No Acct No Acct No..2 See Note 2
Note 1. The scheme does not work, as attempts to manage limits with common names inappended queries have no effect.
Note 2. The scheme is the workaround to the problem described in Note 1.
For example, selecting quarter at runtime displays a list of quarters to choose from. Clicking OKapplies the selected value to the five locations shown in the table, subject to Note 1 and Note 2.
Using a Runtime Release of the Query Limits ComponentThis procedure applies only to a runtime release of the Query Limits component. The QueryLimits frame that is displayed in a runtime release differs from the ESM release. For informationon configuring an ESM release, see “Configuring the Query Limits Component” on page 135.
Note:
If the dashboard developer configured the No Login Required option, Available Queries is notvisible.
➤ To use the Query Limits component:
1 In Interactive Reporting Studio, open a dashboard that is configured with the Query Limits component.
2 From Sections, select Query Limits.
3 From Available Queries, select one or more queries, and click .
Log on is activated to connect to the data source.
4 Enter the query user name and password, and click OK.
A successful connection is indicated by []======[].
If the dashboard is viewed in EPM Workspace, some connected queries may be displayed asdisconnected. See “Connected Queries Displayed as Disconnected” on page 137.
5 From Required Limits, select a limit.
If the dashboard is viewed in EPM Workspace, click Set (next to Required Limits) after selectinga limit and before limit values are set.
134 Dashboard Studio Query Limits Component
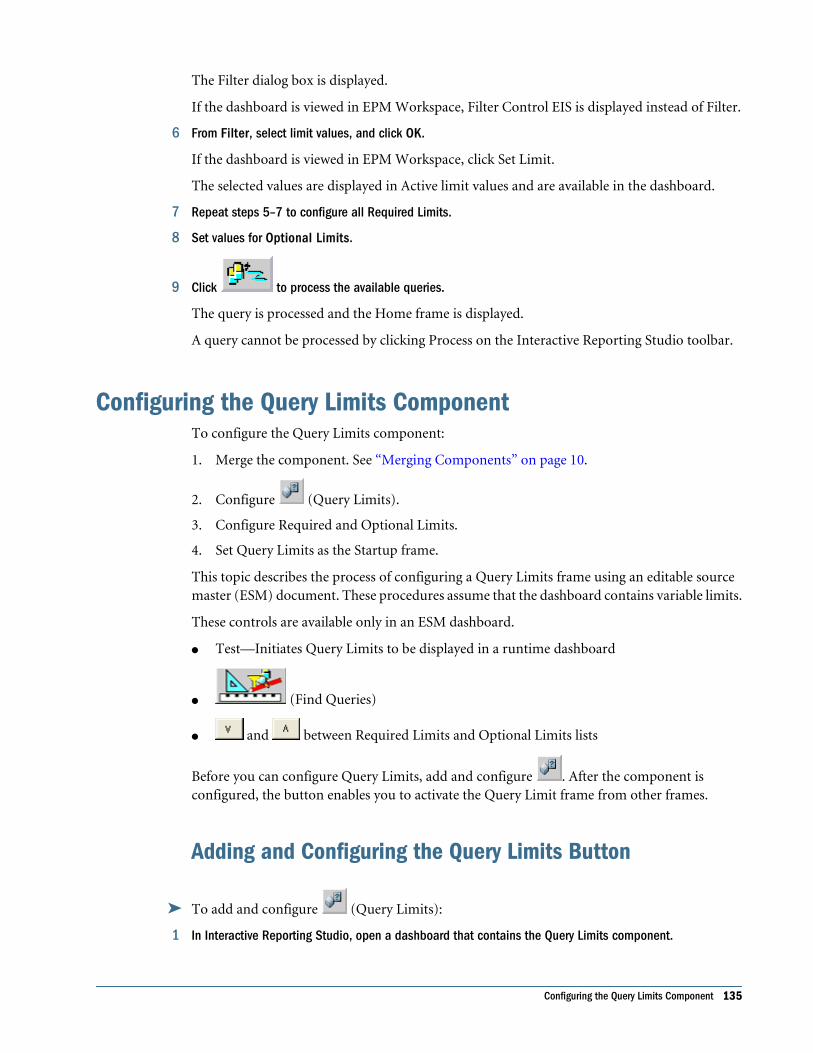
The Filter dialog box is displayed.
If the dashboard is viewed in EPM Workspace, Filter Control EIS is displayed instead of Filter.
6 From Filter, select limit values, and click OK.
If the dashboard is viewed in EPM Workspace, click Set Limit.
The selected values are displayed in Active limit values and are available in the dashboard.
7 Repeat steps 5–7 to configure all Required Limits.
8 Set values for Optional Limits.
9 Click to process the available queries.
The query is processed and the Home frame is displayed.
A query cannot be processed by clicking Process on the Interactive Reporting Studio toolbar.
Configuring the Query Limits ComponentTo configure the Query Limits component:
1. Merge the component. See “Merging Components” on page 10.
2. Configure (Query Limits).
3. Configure Required and Optional Limits.
4. Set Query Limits as the Startup frame.
This topic describes the process of configuring a Query Limits frame using an editable sourcemaster (ESM) document. These procedures assume that the dashboard contains variable limits.
These controls are available only in an ESM dashboard.
● Test—Initiates Query Limits to be displayed in a runtime dashboard
● (Find Queries)
● and between Required Limits and Optional Limits lists
Before you can configure Query Limits, add and configure . After the component isconfigured, the button enables you to activate the Query Limit frame from other frames.
Adding and Configuring the Query Limits Button
➤ To add and configure (Query Limits):
1 In Interactive Reporting Studio, open a dashboard that contains the Query Limits component.
Configuring the Query Limits Component 135
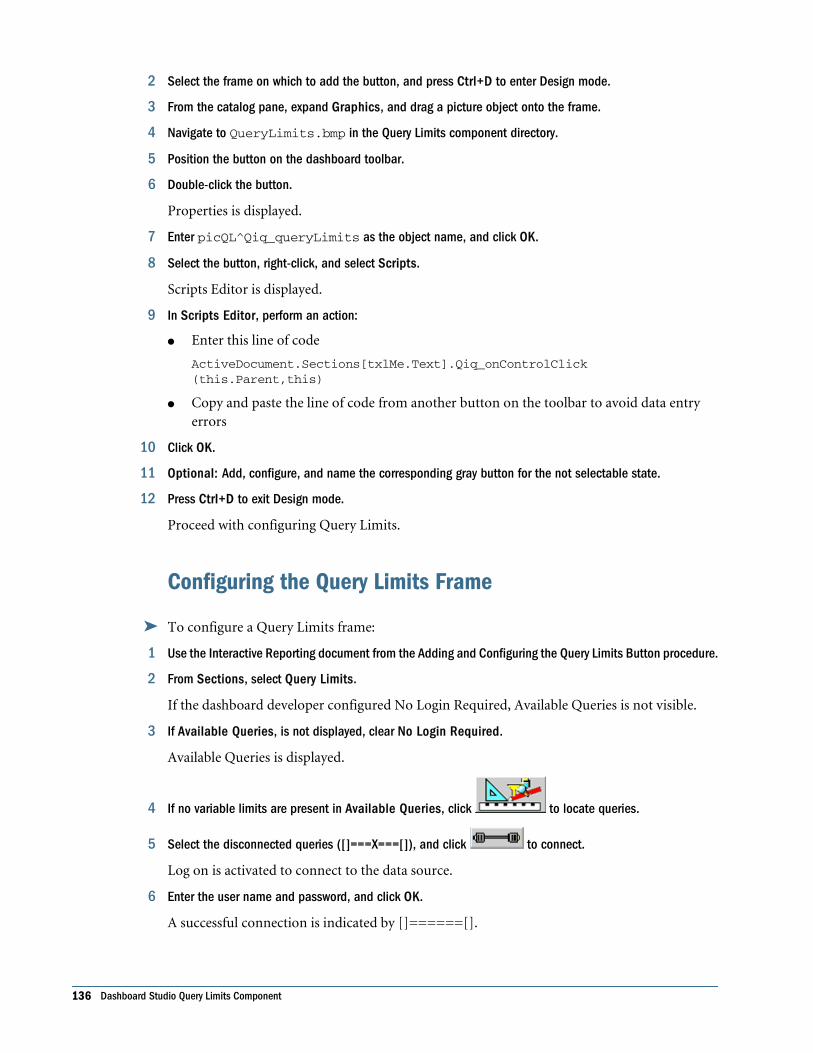
2 Select the frame on which to add the button, and press Ctrl+D to enter Design mode.
3 From the catalog pane, expand Graphics, and drag a picture object onto the frame.
4 Navigate to QueryLimits.bmp in the Query Limits component directory.
5 Position the button on the dashboard toolbar.
6 Double-click the button.
Properties is displayed.
7 Enter picQL^Qiq_queryLimits as the object name, and click OK.
8 Select the button, right-click, and select Scripts.
Scripts Editor is displayed.
9 In Scripts Editor, perform an action:
● Enter this line of code
ActiveDocument.Sections[txlMe.Text].Qiq_onControlClick(this.Parent,this)
● Copy and paste the line of code from another button on the toolbar to avoid data entryerrors
10 Click OK.
11 Optional: Add, configure, and name the corresponding gray button for the not selectable state.
12 Press Ctrl+D to exit Design mode.
Proceed with configuring Query Limits.
Configuring the Query Limits Frame
➤ To configure a Query Limits frame:
1 Use the Interactive Reporting document from the Adding and Configuring the Query Limits Button procedure.
2 From Sections, select Query Limits.
If the dashboard developer configured No Login Required, Available Queries is not visible.
3 If Available Queries, is not displayed, clear No Login Required.
Available Queries is displayed.
4 If no variable limits are present in Available Queries, click to locate queries.
5 Select the disconnected queries ([]===X===[]), and click to connect.
Log on is activated to connect to the data source.
6 Enter the user name and password, and click OK.
A successful connection is indicated by []======[].
136 Dashboard Studio Query Limits Component
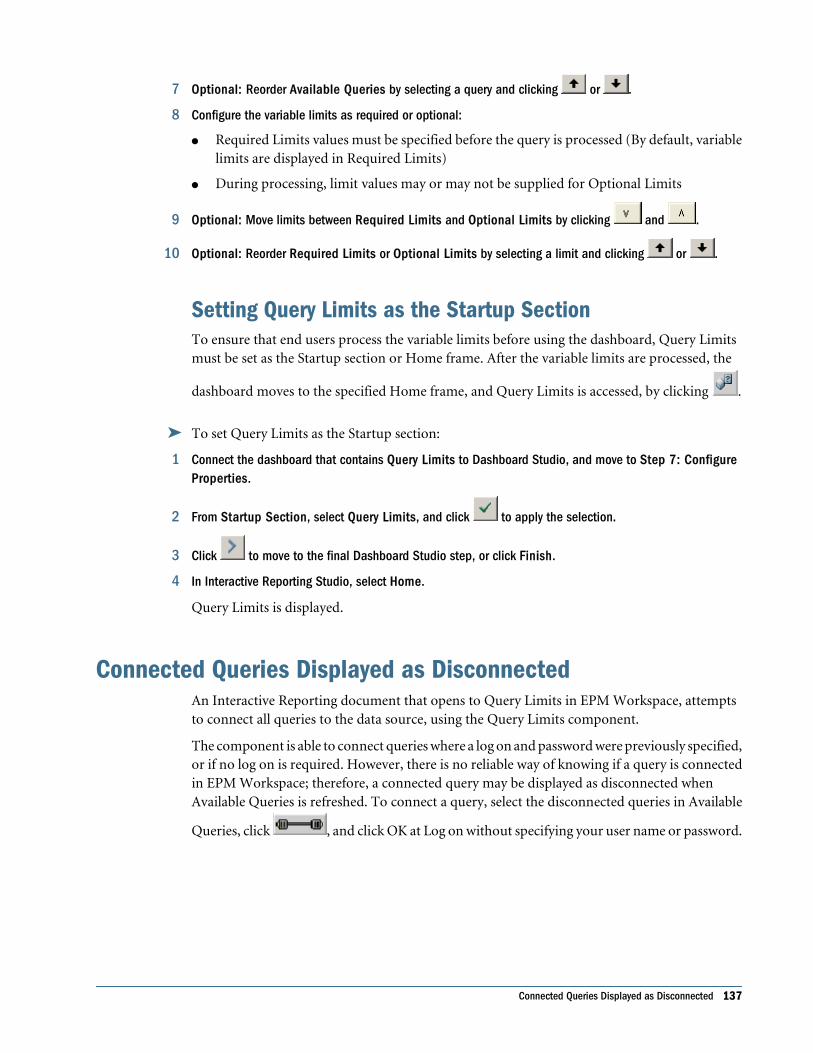
7 Optional: Reorder Available Queries by selecting a query and clicking or .
8 Configure the variable limits as required or optional:
● Required Limits values must be specified before the query is processed (By default, variablelimits are displayed in Required Limits)
● During processing, limit values may or may not be supplied for Optional Limits
9 Optional: Move limits between Required Limits and Optional Limits by clicking and .
10 Optional: Reorder Required Limits or Optional Limits by selecting a limit and clicking or .
Setting Query Limits as the Startup SectionTo ensure that end users process the variable limits before using the dashboard, Query Limitsmust be set as the Startup section or Home frame. After the variable limits are processed, the
dashboard moves to the specified Home frame, and Query Limits is accessed, by clicking .
➤ To set Query Limits as the Startup section:
1 Connect the dashboard that contains Query Limits to Dashboard Studio, and move to Step 7: ConfigureProperties.
2 From Startup Section, select Query Limits, and click to apply the selection.
3 Click to move to the final Dashboard Studio step, or click Finish.
4 In Interactive Reporting Studio, select Home.
Query Limits is displayed.
Connected Queries Displayed as DisconnectedAn Interactive Reporting document that opens to Query Limits in EPM Workspace, attemptsto connect all queries to the data source, using the Query Limits component.
The component is able to connect queries where a log on and password were previously specified,or if no log on is required. However, there is no reliable way of knowing if a query is connectedin EPM Workspace; therefore, a connected query may be displayed as disconnected whenAvailable Queries is refreshed. To connect a query, select the disconnected queries in Available
Queries, click , and click OK at Log on without specifying your user name or password.
Connected Queries Displayed as Disconnected 137

138 Dashboard Studio Query Limits Component

20Dashboard Studio Quick Query
Limits Component
In This Chapter
Quick Query Limits Component .. . . . . . . . . . . . . . . . . . . . . . . . . . . . . . . . . . . . . . . . . . . . . . . . . . . . . . . . . . . . . . . . . . . . . . . . . . . . . . . . . . . . . . . . . . . . . . . . 139
Using Query Panel within a Runtime Release of the Quick Query Limits Component .. . . . . . . . . . . . . . . . . . . . . . . . . . . . . . . . . . . . 139
Configuring the Quick Query Limits Component.. . . . . . . . . . . . . . . . . . . . . . . . . . . . . . . . . . . . . . . . . . . . . . . . . . . . . . . . . . . . . . . . . . . . . . . . . . . . . . 144
Processing All, One, or More Queries .. . . . . . . . . . . . . . . . . . . . . . . . . . . . . . . . . . . . . . . . . . . . . . . . . . . . . . . . . . . . . . . . . . . . . . . . . . . . . . . . . . . . . . . . . 154
Quick Query Limits ComponentThe Quick Query Limits component manages the selection and display of limits and theprocessing of queries in a similar way to the Query Limits component. Limit selections are setby selecting values from check boxes, drop-down lists, option buttons, list boxes, calendarcontrols, or tree controls configured by the dashboard developer.
The component also includes a Favorites option which captures and stores the currently selectedlimits. End users select a favorite to reapply those values. See “Using the Favorites Option” onpage 143.
Using Query Panel within a Runtime Release of the Quick QueryLimits Component
A query limit is one or more limits that share a name in one or more queries; therefore, selectionsare applied to all instances of a limit. For example, in an expense and revenue dashboard theuser selects the month only once and it is applied to the expense and revenue queries if bothcontain an equivalent month limit.
Query Panel enables users to select from query limit controls configured by the dashboarddeveloper. Query limit controls are one or more controls that are responsible for helping theuser select values to be applied to an individual limit.
Individual query limit values are set by using one or more of these controls:
● check boxes
● option buttons
● list boxes
● drop-down lists
Quick Query Limits Component 139

● tree controls
● calendar controls
The controls available in Query Panel vary depending on the dashboard developer configuration,and whether the dashboard is a runtime or an editable source master (ESM). For example,
and are not available in runtime dashboards. Query Panel includes other buttons onthe top panel. See “Toolbar Buttons” on page 14.
Applying Quick Query LimitsThis procedure describes applying quick query limits only in a runtime dashboard.
➤ To apply and save quick query limits:
1 In Interactive Reporting Studio, open a dashboard that is configured with the Quick Query Limits component.
HYSL Query Login is displayed if connection to a database is required. If a connection is notrequired, the dashboard opens to Query Panel, if this is configured as the Startup section. See“Setting Query Panel as the Startup Section” on page 154.
2 In HYSL Query Login, enter log on details, and click OK.
If Quickquerylimits_sample_esm.bqy is used, click OK, without entering log on details.
Query Panel is displayed.
3 Select the query limit values by using the dashboard developer configured controls.
Several buttons can be associated with a control to make it easier to select, add, or clear values.See “Control Buttons and Guidelines” on page 141.
4 Click to apply the selected values.
Selected values are displayed in Currently Selected Query Limits.
5 Optional: Save a set of query limit values by clicking .
See “Using the Favorites Option” on page 143.
6 Click to process the queries.
If Allow Custom Process is enabled, a drop-down list is displayed. Process all queries or onequery. If only one query is available or if custom processing is not set, all available queries are
processed when is clicked.
If the dashboard designer allowed multi-selection for query processing, a list box is displayed.
Select one or more queries to process and click .
To get rid of the list box without processing, click any area in the list box below the query values
to deselect all values and click .
140 Dashboard Studio Quick Query Limits Component

Control Buttons and GuidelinesThe dashboard developer can configure command buttons to be associated with certain querylimit controls.
a. Add and Remove buttons for tree controls
Add—Applies the current selection as query limit values. The entire hierarchy is applied. Forexample, clicking Add includes Region = Americas, Territory = South Americas, and Country= Brazil to the list of currently selected query limits. Selecting another value from the tree andclicking Add appends the selection to the list instead of replacing previous values.
Remove—Clears the highlighted value in the tree. For example, clicking Remove, removes onlyCountry = Brazil from the list of selected query limits.
b. List box buttons
List boxes come with a variety of buttons.
Add—Adds custom values to the list box. Custom values are entered in a text box that isconfigured to point to the query limit.
All—Selects all available values in the list box.
Clear—Removes all selected values in the list box and clears previously applied values. Thisbutton sets the limit Ignore property to true.
Ref —Updates the values in a list box based on selections. For example, if Country = U.S.A. isselected, clicking Ref in the City list displays only cities in the U.S.A.
A group of limits that use the data model properties of available queries can be configured bythe dashboard developer. Typically, limits that share a database table are in a matching group.
For example, if Product Line = Videos is selected, clicking Ref associated with Product Familydisplays values that are categorized under the Videos line. Clicking Ref associated with ProductCategory updates the list based on selections made in Product Line and Product Family.
Ref can also be used to scroll through values in the list box, in which case a text box must beconfigured to point to a query limit. For example, if the Product Name list box is configured toshow only 20 values at a time. Clicking Ref, with (+) entered in the associated text box, displaysthe next 20 values in the list. The dashboard developer configures the number of values to displayin a list at a given time.
Using Query Panel within a Runtime Release of the Quick Query Limits Component 141

Ref is used to update values based on a search criteria. For example, entering E,F in the text boxand clicking Ref, returns products starting with E and F. This list is case-sensitive, and spacesshould not be added after commas.
Rem —Removes values from the list box.
c. Calendar control and button
142 Dashboard Studio Quick Query Limits Component

If, for example, two calendars are configured on Query Panel, selecting a value in the From andTo calendars returns all values between the selected dates. The dates are displayed in CurrentlySelected Query Limits.
The calendar contains a Clear button, which removes selected dates from the Currently SelectedQuery Limits list.
For more detailed information on calendars, see “Adding and Configuring Calendars” in theHyperion Interactive Reporting – Object Model and Dashboard Development Services Developer'sGuide, Volume 5: Dashboard Studio.
Using the Favorites OptionQuery Panel includes a Favorites option, which saves limit values sets and stores them in theInteractive Reporting document. To reapply values, select a favorite.
➤ To save limit values sets as favorites:
1 Click .
A drop-down list of controls is displayed.
2 Select Add Favorites.
The limit values selected are saved as Favorites 1, Favorites 2, Favorites 3, and so on.
Using Query Panel within a Runtime Release of the Quick Query Limits Component 143

Editing FavoritesThe Quick Query Limits component includes an Edit Favorites frame, which enables you torename, remove, or change the order of favorites.
➤ To edit favorites:
1 Click .
A drop-down list of controls is displayed.
2 Select Edit Favorites.
Edit Favorites is displayed.
Several options are available within the Edit Favorites frame:
a. Rename a favorite.
i. From Available Favorites, select an item, and enter a Favorite Name.
ii. Click to rename the favorite.
If another favorite is selected from the list, Favorite Name is not updated. To display
the name of the selected favorite in Favorite Name, click . The entry in FavoriteName takes precedence over the selected Available Favorites.
b. Reorder the favorites list.
From Available Favorites, select an item, and click or .
c. Delete a favorite from the list.
From Available Favorites, select an item, and click .
Configuring the Quick Query Limits ComponentTo configure the Quick Query Limits component:
1. Merge the component. See “Merging Components” on page 10.
2. Configure (Query Panel).
3. Add the query sections and the limits required in those sections.
4. Identify queries to process using HYSL Queries and Datamodels.
5. Configure Quick Query Limit controls with the Query Panel prototype frame.
6. Configure other controls.
7. Configure query limit properties using Quick Query Limit Properties.
8. Optional: Configure the required query limits using Required Query Limits Properties.
144 Dashboard Studio Quick Query Limits Component

9. Set Query Panel as the Startup frame.
This topic describes the process of configuring a dashboard using the Quick Query Limitscomponent.
Before you can configure the Quick Query Limits component, add and configure . After thecomponent is configured, the button enables you to activate the Query Panel from anotherframe.
Note:
Dashboards developed with the Quick Query Limits component Release 11.1.1 or later, containlbxQueryLog and lbxQueries by default on the Query Panel. Dashboards developed with anearlier release of the Quick Query Limits component require an update using the DashboardDevelopment Services Update Utility to provide these two list boxes on the Query Panelprototype frame. For these lists to function on existing Query Panel frames, users must add oneor both to the frames. Otherwise the lists can be deleted.
Adding and Configuring the Query Panel ButtonAdd and configure the button to enable activation of the Query Panel from another frame.
➤ To add and configure (Query Panel):
1 In Interactive Reporting Studio, open a dashboard that contains the Quick Query Limits component.
2 Select the frame on which to add the button, and press Ctrl+D to enter Design mode.
3 From the catalog pane, expand Graphics, and drag a picture object onto the frame.
4 Navigate to QueryPanel.bmp in the Quick Query Limits component directory.
5 Position the button on the dashboard toolbar.
6 Double-click the button.
Properties is displayed.
7 Enter picGo^Hysl_qql as the object name, and click OK.
8 Select the button, right-click, and select Scripts.
Scripts Editor is displayed.
9 In Scripts Editor, perform an action:
● Enter this line of code
ActiveDocument.Sections[txlMe.Text].Qiq_onControlClick(this.Parent,this)
● Copy and paste the line of code from another button on the toolbar to avoid data entryerrors
10 Click OK.
Configuring the Quick Query Limits Component 145

11 Optional: Add, configure, and name the corresponding gray buttons for the not selectable state.
12 Press Ctrl+D to exit Design mode.
Proceed with configuring Quick Query Limits, by determining the queries to be processed.
Identifying Queries to ProcessBefore configuring the Quick Query Limit controls, query sections that contain the query limitsto be displayed in Query Panel, must be available for processing.
➤ To identify queries for processing:
1 In Interactive Reporting Studio, open a dashboard that contains the Quick Query Limits component.
2 Navigate to HYSL Queries and Datamodels.
3 Optional: To prevent locking a user out of a database, clear Stop logging in on first connection error onthe HYSL Queries and Datamodels frame to force the dashboard to connect to the remaining queries evenif it encounters an error.
Locking occurs when a user logs into multiple queries using the HYSL Query Login frame, andan error is encountered on one query. If the queries use the same database, and the database hasa connection attempt limit, the user can be locked out.
4 Move query sections between Available Sections and Sections to Process by clicking and .
5 Repeat step 3 for each query section to be processed.
6 Optional: You can leave queries in Available Sections that are not processed.
Queries remaining in Available Sections are used to cache values that are displayed in tree limits,lists or, drop-down lists that obtain values from a cached result section. These sections arerefreshed by running the dashboard regularly in the scheduler. When running in the scheduleronly the queries in Available Sections are refreshed.
7 Optional: Reorder Sections to Process by selecting a section and clicking or .
8 Click Apply.
9 Move to Query Panel.
If one or more selected queries require a database connection, HYSL Query Login is displayed.
10 If HYSL Query Login is displayed, enter log on details, and click OK.
Query Panel is displayed.
Note:
If HYSL Query Login fails to connect to a query on the Oracle's Hyperion® Interactive ReportingWeb Client or in EPM Workspace, an explanatory dialog box is displayed that contains thedatabase connection error.
146 Dashboard Studio Quick Query Limits Component

Configuring Quick Query Limit ControlsQuery Panel contains sample Quick Query Limit controls that can be configured to representquery limit values. The frame is created from the Query Panel frame prototype when the templateis converted into an editable source master (ESM).
Configuring Quick Query Limit controls is similar to configuring Quick Filters. See“Configuring Quick Filters” in the Hyperion Interactive Reporting – Object Model and DashboardDevelopment Services Developer's Guide, Volume 5: Dashboard Studio.
Copy and paste as many instances of a control as required. A control must point to an existingquery limit or one that is created before the completion of the configuration task. All samplecontrol names begin with User_Limit, which is replaced with the name of the query limit tobe associated with the current control. Similarly, the names of buttons and text boxes that maysupplement a control are replaced.
Spaces in query limit names must be replaced with underscores (_). As appended queries andqueries that share a data model cannot use a limit twice, limits with numeric suffixes are treatedas one limit.
A query limit is configured only once in Query Panel. For example, if a list box is configured toshow quarter values, a check box cannot be configured to also represent quarter values. Thesecond query limit occurrence is ignored.
➤ To configure Quick Query Limit controls:
1 In Interactive Reporting Studio, open a dashboard that contains the Quick Query Limits component.
2 Press Ctrl+D to enter Design mode.
3 Configure the controls.
See “Configuring Other Controls” on page 147.
4 Click the control group background, and change the label to display the configured query limit name.
5 Press Ctrl+D to exit Design mode.
6 Click to update the values.
Values that were specified when creating the query limit are displayed in Currently SelectedQuery Limits.
Configuring Other ControlsOther controls are check boxes, list boxes, option buttons, drop-down lists, calendar controls(apply limits that contain a date or timestamp data type), and tree controls. These proceduresexamine configuring the controls individually. To configure the controls, ensure that Designmode (Ctrl+D) is activated.
➤ To configure check box controls:
1 Select a sample query limit check box, right-click, and select Properties.
Configuring the Quick Query Limits Component 147
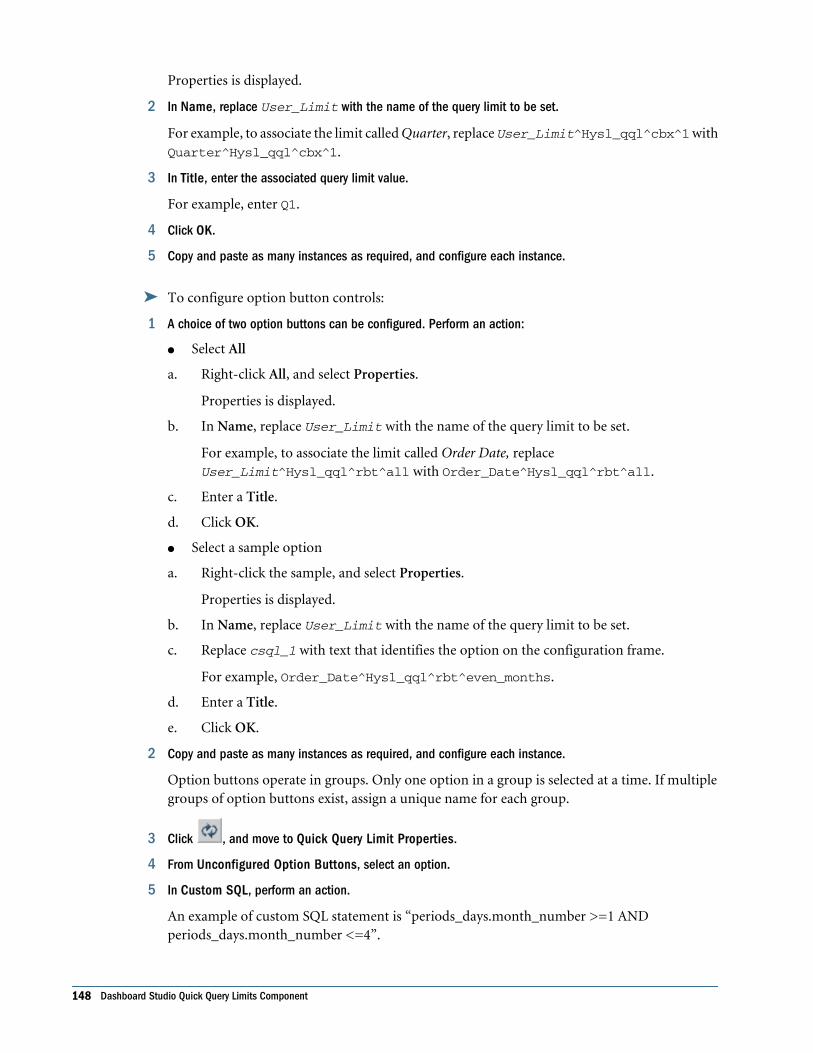
Properties is displayed.
2 In Name, replace User_Limit with the name of the query limit to be set.
For example, to associate the limit called Quarter, replace User_Limit^Hysl_qql^cbx^1 withQuarter^Hysl_qql^cbx^1.
3 In Title, enter the associated query limit value.
For example, enter Q1.
4 Click OK.
5 Copy and paste as many instances as required, and configure each instance.
➤ To configure option button controls:
1 A choice of two option buttons can be configured. Perform an action:
● Select All
a. Right-click All, and select Properties.
Properties is displayed.
b. In Name, replace User_Limit with the name of the query limit to be set.
For example, to associate the limit called Order Date, replaceUser_Limit^Hysl_qql^rbt^all with Order_Date^Hysl_qql^rbt^all.
c. Enter a Title.
d. Click OK.
● Select a sample option
a. Right-click the sample, and select Properties.
Properties is displayed.
b. In Name, replace User_Limit with the name of the query limit to be set.
c. Replace csql_1 with text that identifies the option on the configuration frame.
For example, Order_Date^Hysl_qql^rbt^even_months.
d. Enter a Title.
e. Click OK.
2 Copy and paste as many instances as required, and configure each instance.
Option buttons operate in groups. Only one option in a group is selected at a time. If multiplegroups of option buttons exist, assign a unique name for each group.
3 Click , and move to Quick Query Limit Properties.
4 From Unconfigured Option Buttons, select an option.
5 In Custom SQL, perform an action.
An example of custom SQL statement is “periods_days.month_number >=1 ANDperiods_days.month_number <=4”.
148 Dashboard Studio Quick Query Limits Component

a. Enter the Custom SQL to be associated with the selected option.
b. Retrieve the table.column definition:
i. Navigate to the query.
ii. Double-click the limit column in the table.
Filters is displayed.
iii. Click Custom SQL.
iv. Copy the table.column definition.
v. Return to the Quick Query Limit Properties frame, and paste the SQL into CustomSQL.
6 Move selected options between Unconfigured Options Buttons and Option Buttons with Custom SQL by
clicking and .
7 If All was not selected, configure the Custom SQL for the other option buttons.
It is not necessary to specify the Custom SQL for All.
8 Click Apply.
9 Move to Query Panel, and click .
➤ To configure list box controls:
1 Select a sample query limit list box, right-click, and select Properties.
2 In Name, replace User_Limit with the name of the query limit to be set.
For example, to associate the limit called Quarter, replace User_Limit^Hysl_qql^lbx^1 withQuarter^Hysl_qql^lbx^1.
3 Optional. Change the order in which Dashboard Studio loads query limits. (The default is to load query limitsin ascending order.)
To configure a list to load values in descending order, add ^d as the fourth part of the objectname (for example,. Region^Hysl_qql^lbx^d^2).
To configure a list to load values without sorting, add ^n as the fourth part of the object name(for example, Region^Hysl_qql^lbx^n^2).
Note that ^n is only recommended when the source for limit values is set to be a cached resultsor table section. This option is not recommended where lists are populated from more than onevalue source.
4 Click OK.
Each list box can have associated buttons and a text box.
The available buttons determine the level of control exercised by the end user. These areguidelines:
● If users select values from the list and nothing else, all sample buttons and text boxes can bedeleted
Configuring the Quick Query Limits Component 149

● If users select or clear all values, All and Clear must be configured, and the remaining buttonsmust be deleted
● If users add custom values to the list, the text box and Add and Remove, must be configured
● If users refresh the list of available values, Ref must be configured
● If a list box contains a large number of values, it can cause the Query Panel to be slow(Therefore, restrict the number of values to be displayed in the list box, and configure a textbox and Ref to enable users to scroll through the values)
● If limit values are not cascading, exclude Ref
5 Configure buttons or text boxes to be associated with the list box, by replacing User_Limit in the buttonor text box name with the query limit to which the list box points.
6 Copy and paste as many list boxes, and associated buttons and text boxes as required, and configure eachinstance.
➤ To configure drop-down list controls:
1 Select the sample query limit drop-down list, right-click, and select Properties.
Properties is displayed.
2 In Name, replace User_Limit with the name of the query limit to be set.
3 Optional. Change the order in which Dashboard Studio loads query limits. (The default is to load query limitsin ascending order.)
To configure a list to load values in descending order, add ^d as the fourth part of the objectname (for example,. Region^Hysl_qql^lbx^d^2).
To configure a list to load values without sorting, add ^n as the fourth part of the object name(for example, Region^Hysl_qql^lbx^n^2).
Note that ^n is only recommended when the source for limit values is set to be a cached resultsor table section. This option is not recommended where lists are populated from more than onevalue source.
4 Click OK.
Ref is available with drop-down lists. Configure Ref by replacing User_Limit with the querylimit that was configured for the drop-down list.
5 Copy and paste as many drop-down lists and instances of Ref as required, and configure each instance.
➤ To configure calendar controls:
1 Select Clear, right-click, and select Properties.
Properties is displayed.
2 In Name, replace User_Limit with the name of the query limit to be set.
A query limit can be a date or timestamp data type.
Only one calendar button (Clear) can be renamed.
3 Click OK.
150 Dashboard Studio Quick Query Limits Component

4 Copy and paste as many calendar controls as required, and configure each instance.
5 Optional: To duplicate a calendar control, drag the mouse over the calendar to select all shapes, hold theCtrl key, and drag the shapes to another part of the frame.
See “Adding and Configuring Calendars,” in the Hyperion Interactive Reporting – Object Modeland Dashboard Development Services Developer's Guide, Volume 5: Dashboard Studio.
Creating a Date Range
➤ To create a date range:
1 Perform these actions to create a from and to date limit in a query:
a. In the query, drag a date column onto the Filters line.
b. In Filter, enter a Name.
For example, enter From.
c. Set the operator to >=.
d. Click Show Values, select a date, and click OK.
e. From the query, drag the date column onto the Filters line again.
f. In Filter, enter To as the Name.
g. Set the operator to <=.
h. Click Show Values, select a date, and click OK.
2 On the dashboard, create two calendar controls.
See “Adding and Configuring Calendars,” in the Hyperion Interactive Reporting – Object Modeland Dashboard Development Services Developer's Guide, Volume 5: Dashboard Studio.
3 Name the calendars, From and To.
These calendars set values in the query limits defined in step 1.
Tree controls are part of another component and include a separate configuration frame. See“Configuring the Tree Component” on page 160.
➤ To configure query limit tree controls:
1 Copy and paste as many tree controls as required.
2 Move to QIQ Tree Limit Properties.
3 From Tree Limit Objects, select a tree control to configure.
4 Select Query Limits.
5 From Hierarchy Source, select an item.
6 Select the query limits to be displayed in the tree limit control.
7 Configure the other query limit tree controls.
8 Click Apply, and return to Query Panel.
Configuring the Quick Query Limits Component 151

Available values are displayed in Currently Selected Query Limits.
Configuring Multi-Selection for Query ProcessingThe Query Panel Prototype section includes a list box called lbxQuery. If lbxQuery is available
on the frame, queries are displayed when you click .
To allow multi-selection for queries, position the list box in the desired location, taking care notto obstruct any other controls on the frame. If the list box is deleted, queries are displayed in thedefault manner using a dropdown list.
Configuring the Quick Query Limit Properties FrameQuick Query Limit Properties enables you to manipulate query limits properties, and to entercustom SQL statements, and associate the statements with available options.
Maximum limit values to show—Enables a restriction to be set on the number of values thatare displayed in a Quick Query Limits list box (List box controls that contain a large number ofavailable values may affect the performance of Query Panel).
➤ To set the maximum value:
1 Enter the number of values to be displayed.
2 Click Apply.
3 Click to activate Query Panel.
Lists in Query Panel are displayed using the specified number of values. The text box and Refcan be configured to scroll through the list of values. A plus sign (+) displayed in the text boxenables the next set of values to be viewed.
Allow Custom Process—Enables users to process individual query sections (If enabled, a drop-
down list is displayed when is clicked. Users select the query sections to process, or chooseto process all. The drop-down list is displayed only if multiple query sections require processing.See “Processing All, One, or More Queries” on page 154).
Prompt Login—Prompts users to connect to the data source every time the dashboard is opened.
Section to Display after Process—Enables developers to select a section to be displayed after theuser clicks Process (The dashboard home section is the default).
Sources for Limit Values—Enables users to specify the source of the query limits configured inthe Query Panel.
➤ To configure the sources for the limit values:
1 From the list, select a query limit.
152 Dashboard Studio Quick Query Limits Component

Only query limits associated with lists and drop-down lists are displayed, because they mustdetect from where the available values are loaded.
2 Use the options to select a source.
If Values Cached in Results is selected, a drop-down list is displayed, that provides availableresults and tables for selection.
3 Click Change Value Type.
The selected source is appended to the query limit in Sources for Limit Values. See ValueTypes.
4 Click Apply.
Value Types
Value types nominate how lists obtain the values that are displayed to users.
● No Values—If a query limit exists in multiple queries, it is not necessary for the values tobe read from all sections, so No Values is used for those queries in which no values need tobe obtained (However, one section for each limit requires an option other than NoValues. Values need only be obtained from multiple queries for a limit if a section does notprovide the full set of values from which the user can choose)
● Available Values—The full set of values for the limit are retrieved from the database, in asimilar manner to Show Values in a query (Use this option cautiously as it takes time torefresh the list of values)
● Custom Values—Functioning in a similar manner to Custom Values in a query, the valuesthat are added to the custom values list of the limit are used, and not the values in the database
● Values Cached in Results—Read values in a column with an identical name to the limit ina nominated table or results (A more powerful option than Custom Values, but functioningin a similar way, the values are not obtained from the database, hence the speed is comparablewith Custom Values. The query associated with the nominated results can be scheduledregularly, so the list of cached values in the Interactive Reporting document is available tobe refreshed as required)
Custom SQL for Option Buttons—Enables users to configure the custom SQL to associate withoptions in Query Panel (see the procedure to configure option button controls in “ConfiguringOther Controls” on page 147).
Configuring the Required Query LimitsRequired Query Limits extends the Quick Query Limits component by enabling the dashboarddeveloper to nominate one or more required query limits. If values from a required query limitare not selected, then the query will not run. When the required values are entered, then thequery can be processed.
➤ To use the Required Query Limits Properties frame:
1 From Sections, select Required Query Limits Properties.
Configuring the Quick Query Limits Component 153

Required Query Limits Properties is displayed.
2 Move selected limits between Optional Query Limits and Required Query Limits by clicking and
.
Moving values to Required Query Limits creates mandatory limits that are required forprocessing the query. Therefore, when configured, Required Query Limits cannot be ignored.
3 Perform an action:
● To reload the original settings, click Restore
● To remove selected limits, click Clear
● To load selected limits, click Apply
4 Return to the Query Panel and click to process the query with the required query limits.
Note:
When processing a query on the Query Panel by clicking , an error message is displayed ifno values are selected for a required query limit. You must select one or more values for thatrequired query limit and then reprocess the query.
Setting Query Panel as the Startup SectionIt is recommended that Query Panel be set as the Startup section or Home frame, because usersmust set query limit values before using the dashboard.
➤ To set Query Panel as the Startup section:
1 Connect the dashboard that contains Query Panel to Dashboard Studio, and move to Step 7: ConfigureProperties.
2 From Startup Section, select Query Panel, and click to apply the setting.
3 Click to move to the final Dashboard Studio step, or click Finish.
4 In Interactive Reporting Studio, select Home.
Query Panel is displayed.
Processing All, One, or More QueriesThe Quick Query Limits component provides the ability to process all, one, or more processablequeries. From the Query Panel, the dashboard developer selects an option:
154 Dashboard Studio Quick Query Limits Component

● Process All queries—Enabled when is clicked on the Query Panel and where AllowCustom Process is cleared in the Quick Query Limit Properties frame (All configured queriesare processed and the results are displayed on the Home section. If a list box calledlbxQueryLog is present on the Query Panel, it logs the beginning and end of each queryrequest)
● Process One and Process All queries—Enabled when Allow Custom Process is selected in
the Quick Query Limit Properties frame and is clicked on the Query Panel, whichdisplays a drop-down list from which the user selects a query to process (The user remainson the Query Panel so further queries can be selected and processed. If the user selects theProcess All option in the drop-down list, all configured queries are processed and the resultsare displayed on the Home section. If a list box called lbxQueryLog is present on the QueryPanel, it logs the beginning and end of each query request)
● Process One or More queries—Enabled when Allow Custom Process is selected in the QuickQuery Limit Properties frame, a list box called lbxQueries is present on the Query Panel, and
when is clicked on the Query Panel, lbxQueries displays all queries selected (The user
clears or selects queries in the list, clicks , and only the selected queries are processed.If all queries are selected, the results are displayed on the Home section. If a list box calledlbxQueryLog is present on the Query Panel, it logs the beginning and end of each queryrequest)
Processing All, One, or More Queries 155

156 Dashboard Studio Quick Query Limits Component

21Dashboard Studio Tree
Component
In This Chapter
Tree Component.. . . . . . . . . . . . . . . . . . . . . . . . . . . . . . . . . . . . . . . . . . . . . . . . . . . . . . . . . . . . . . . . . . . . . . . . . . . . . . . . . . . . . . . . . . . . . . . . . . . . . . . . . . . . . . . . . 157
Using Tree Views in the Tree Limits Component Runtime Sample... . . . . . . . . . . . . . . . . . . . . . . . . . . . . . . . . . . . . . . . . . . . . . . . . . . . . . . . . 159
Configuring the Tree Component .. . . . . . . . . . . . . . . . . . . . . . . . . . . . . . . . . . . . . . . . . . . . . . . . . . . . . . . . . . . . . . . . . . . . . . . . . . . . . . . . . . . . . . . . . . . . . . 160
Tree ComponentThe Tree component consists of two parts:
● Tree Limits enables you to apply filters to queries, data models, or results, by manipulatingtree views (It is similar to the Interactive Reporting Studio Pivot Drill Down feature. TreeLimits enables you to filter data in a hierarchical fashion)
● Tree View enables you to display hierarchical objects as a tree inside a list (It is very similarto the way folders are viewed in the left pane of Windows Explorer. Tree View is a buildingblock and is used by other components to display their hierarchies; consequently, it is ofinterest to programmers who need to use it to display their hierarchical data)
The Tree component contains these notable features.
Drilling DownThe Tree component enables you to filter data in a hierarchical fashion.
Traditionally, applying filters in an Interactive Reporting document was performed one at atime. For example, previously to filter data to the following location, one filter was added at atime.
Asia Pacific > Pacific Rim > Australia > New South Wales > Sydney
That is, each filter was located and a value was selected from the list.
● First filter: Region = Asia Pacific
● Second filter: Territory = Pacific Rim
● Third filter: Country = Australia
● Fourth filter: State = New South Wales
● Fifth filter: City = Sydney
Tree Component 157

As several cities are called Sydney around the world, applying one filter may result in data fromcities other than Sydney, Australia being included.
The component presents all geographical information in a tree view and enables you to drill apath down to a city. After selecting a city, click Add, and all values in the path; for example, AsiaPacific, Pacific Rim, Australia, New South Wales, and Sydney, are applied as filters at the onetime.
Filters on Queries to Improve PerformanceAs dashboards enable you to quickly add and remove filters to perform data analysis, they requireall data to be present in memory (specifically, a results section) for the filters to work. If thedataset is small, it is not a problem, but a big dataset can overwhelm the memory capacity of adesktop computer. You may not want to wait for a big dataset to be loaded and processed, if youare concerned only with a section of the data.
To solve this problem, you can apply filters to the data query, or underlying data model. See“Drill Down on Limits and Filters” on page 158. The query is processed, and the relevant datais retrieved from the database, reducing the time and memory needed to perform the analysis.The Tree component enables you to quickly apply a hierarchy of filters to a query.
Multiple PathsYou can select alternative paths on a tree and apply them to a query simultaneously.
All path selections must be peers—there cannot be two different path levels. For example,Americas > North America and Asia Pacific > Pacific Rim > Australia results in no data beingdisplayed. Whereas, an example of paths as peers is, Americas > North America > U.S.A. andAsia Pacific > Pacific Rim > Australia.
Multiple TreesMultiple tree views can exist on a dashboard frame. For example, you can select filters from ageographical hierarchy and a product line hierarchy.
Drill Down on Limits and FiltersA tree view can apply hierarchical limits and filters.
● Limits applied to queries and data models—Click Process to re-execute selected queries sothat related results, charts, and pivots are updated
● Filters applied to the document—A filter applies to all results or table sections intheInteractive Reporting document
Filters offer three interfaces:
❍ Pop-ups in Interactive Reporting Studio
158 Dashboard Studio Tree Component

❍ Quick Filters (check boxes, drop-down lists, and so on)
❍ Tree views
Unicode CharactersIn Unicode releases of Interactive Reporting Studio, tree controls use characters that more closelyresemble a tree structure.
Modify existing tree list boxes by changing the font to a monospace font; such as, Courier New,Lucida Console, Andale Mono, or OCR A Extended.
Using Tree Views in the Tree Limits Component Runtime SampleTo use Tree Views in the Tree Limits Sample Interactive Reporting document, you must addone or more filters or query limits.
➤ To add a filter:
1 In Interactive Reporting Studio, open the Tree Limits Sample Interactive Reporting document.
2 Select Home.
3 Select one or an assortment of paths from one or more tree views.
For example, from Geographical Hierarchy, select the regions Americas and Europe. FromProduct Hierarchy, select the product line Music, and product family Dance and DJ.
4 Click Add.
Filters displays the selections.
Dashboard charts and pivots immediately reflect the changes.
➤ To add query limits:
1 In Interactive Reporting Studio, open the Tree Limits Sample Interactive Reporting document.
2 Select TreeLimits.
3 Select one or an assortment of paths from one or more tree views.
For example, from the first Query Limits list, select the regions Americas and Asia Pacific, theterritories North America and Pacific Rim, and the countries USA and Australia. From thesecond Query Limits list, select the product line for books and videos.
4 Click Add.
Selected Limits displays the selections.
Using Tree Views in the Tree Limits Component Runtime Sample 159
5 Click Process to process the selected query sections in the document.
The related tables and charts of the query are updated.
For consistency, Tree Views share a state across frames. For example, if the Product Hierarchytree is expanded on the Home frame, Product Hierarchy is also expanded on the Tree Limitsframe.
Note:
Double-clicking a node is not supported in EPM Workspace; therefore, is supplied with eachTree Limits list. The button is hidden from view in a desktop application of Interactive ReportingStudio. See “Tree Component Compatibility with EPM Workspace” on page 164.
The Tree component works with the Checkpoint control to cache and reinstate (if required)filters only, not query limits. See “Using Checkpoint Control” in the Hyperion InteractiveReporting – Object Model and Dashboard Development Services Developer's Guide, Volume 5:Dashboard Studio.
Configuring the Tree ComponentTo configure the Tree component:
1. Merge the TreeLimits component. See “Merging Components” on page 10. The TreeViewcomponent is a subset of TreeLimits, and is used to develop your own components.
2. Add tree limit controls.
3. Configure tree limit controls.
4. Select query and data model sections.
5. Optimize tree limits for use on EPM Workspace.
This topic discusses tree limit controls, and how to add and configure the controls in dashboardsthat contain the Tree component.
About Tree Limit ControlsTree limit controls located in the QIQ Tree Limits Samples, include list boxes and buttons thatcan be copied and pasted onto frames.
Tree Limits List Boxes—Display a hierarchy; for example, geography or product line (UseHierarchy Source on QIQ Tree Limit Properties to configure the list contents. To view multiplehierarchies, paste another tree limits list onto the frame. The number at the end of the list nameis incremented).
160 Dashboard Studio Tree Component

Tip:
In Unicode releases of Interactive Reporting Studio, existing tree list boxes are better representedby changing to a Unicode font. See “Unicode Characters” on page 159.
Expand and Collapse Button—Clicking expands and collapses nodes selected in the treelimits lists (It is provided for compatibility with EPM Workspace, because double-clicks are notsupported on the EPM Workspace platform. See “Tree Component Compatibility with EPMWorkspace” on page 164. The Visible property is not selected by default).
Add and Remove Buttons—Add and remove selected values in the tree limits lists (Only oneset is required on a frame, as both work with query limits and filters. Removing a value from atree control in the Tree component causes the selected value and values beneath to be removedin a cascading manner).
Display List Boxes—Two list boxes exist: Filters and Selected Limits (Filters displays all appliedfilters. Add this list when the frame requires tree limits lists that apply filters. Selected Limitsdisplays all applied query limits).
Process Button—Process selected query sections in the dashboard (Add this button when theframe requires tree limits lists that apply query limits).
Clear Button—Remove applied query limits (To clear filters, click , on the Dashboard Studiotoolbar).
Adding Tree Limits ControlsA set of blank tree limits controls are provided within QIQ Tree Limit Samples.
➤ To add tree limit controls to a dashboard:
1 In Interactive Reporting Studio, open a dashboard that contains the Tree component.
2 From Sections, select QIQ Tree Limits Samples.
3 Press Ctrl+D to enter Design mode.
4 Copy the controls, press Ctrl, and select multiple items.
5 Paste the controls onto a frame.
Only one set of Add and Remove buttons is required on a frame, as both work with every treecontrol on a frame. Ensure the Add and Remove buttons are namedcbtSelect^Qiq_treeLimits and cbtRemove^Qiq_treeLimits respectively.
6 Repeat steps 4 and 5 as required.
7 Press Ctrl+D to exit design mode.
8 Save the dashboard.
Configuring the Tree Component 161
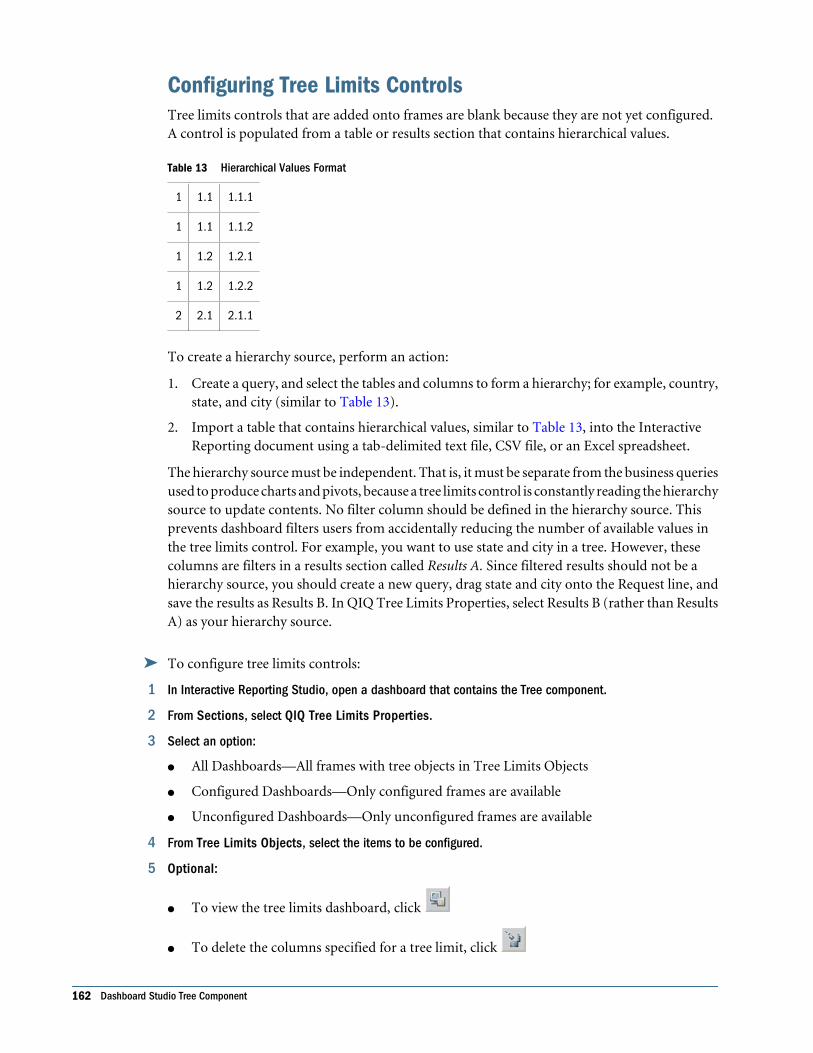
Configuring Tree Limits ControlsTree limits controls that are added onto frames are blank because they are not yet configured.A control is populated from a table or results section that contains hierarchical values.
Table 13 Hierarchical Values Format
1 1.1 1.1.1
1 1.1 1.1.2
1 1.2 1.2.1
1 1.2 1.2.2
2 2.1 2.1.1
To create a hierarchy source, perform an action:
1. Create a query, and select the tables and columns to form a hierarchy; for example, country,state, and city (similar to Table 13).
2. Import a table that contains hierarchical values, similar to Table 13, into the InteractiveReporting document using a tab-delimited text file, CSV file, or an Excel spreadsheet.
The hierarchy source must be independent. That is, it must be separate from the business queriesused to produce charts and pivots, because a tree limits control is constantly reading the hierarchysource to update contents. No filter column should be defined in the hierarchy source. Thisprevents dashboard filters users from accidentally reducing the number of available values inthe tree limits control. For example, you want to use state and city in a tree. However, thesecolumns are filters in a results section called Results A. Since filtered results should not be ahierarchy source, you should create a new query, drag state and city onto the Request line, andsave the results as Results B. In QIQ Tree Limits Properties, select Results B (rather than ResultsA) as your hierarchy source.
➤ To configure tree limits controls:
1 In Interactive Reporting Studio, open a dashboard that contains the Tree component.
2 From Sections, select QIQ Tree Limits Properties.
3 Select an option:
● All Dashboards—All frames with tree objects in Tree Limits Objects
● Configured Dashboards—Only configured frames are available
● Unconfigured Dashboards—Only unconfigured frames are available
4 From Tree Limits Objects, select the items to be configured.
5 Optional:
● To view the tree limits dashboard, click
● To delete the columns specified for a tree limit, click
162 Dashboard Studio Tree Component

6 In Tree Limit Configuration, select Filters or Query Limits.
a. If Filters is selected, a filter applied to the tree limits is applied to results, that is, the localdata that was retrieved from the database. For this reason, filters are also known as localfilters. The advantage of using filters is that tables, pivots, and charts are updated instantlywithout reconnecting to a database. A filter is also applied to the results sections thatcontain the filter column, so tables, pivots, and charts are consistent throughout theInteractive Reporting document.
b. If Query Limits is selected, the tree limits object is applied to the selected query and datamodel sections of the document. The advantage of using query limits is that only requestedqueries are updated, so fewer results, charts, and pivots require recalculating. See “SelectingQuery and Data Model Sections” on page 163. However, a connection to a database, toprocess the queries, is required for tables, pivots and charts to be updated.
7 From Hierarchy Source, select the results or table that the Tree component uses to obtain a hierarchy.
Data in this section determines the selections in the tree limits list. Therefore, the section containshierarchical data with columns called; for example, Region, Territory, and Country or ProductName, Product Line, and Product Family.
8 Move selected columns in the hierarchy that are displayed in the tree limits list, by clicking and
.
9 Optional: Reorder selected columns, by selecting a column and clicking or .
10 Click Apply.
The tree limits list contains a tree view.
Note:
Use the Checkpoint control to cache and reinstate (if required) filters only, not query limits. See"Using Checkpoint Control" in the Hyperion Interactive Reporting – Object Model and DashboardDevelopment Services Developer's Guide, Volume 5: Dashboard Studio.
Selecting Query and Data Model SectionsIf tree limits lists apply query limits, you must select the queries and data model sections to whichthe query limits apply.
➤ To select queries and data model sections:
1 In Interactive Reporting Studio, open a dashboard that contains the Tree component.
2 From Sections, select HYSL Queries and Datamodels.
3 Move sections between Available Sections and Sections to Process by clicking and .
4 Click Apply.
Configuring the Tree Component 163

From this point, when Process is clicked on a tree limits list to apply query limits, the limits areapplied to the selected query and data model sections.
Tree Component Compatibility with EPM WorkspaceClick a node to expand or collapse it in the hierarchy. Double-clicking a node, however, is not
supported in EPM Workspace; therefore, is supplied with each tree limits list. In Interactive
Reporting Studio, is hidden from view.
Optimizing Tree Limits for EPM WorkspaceWhen an item is selected in the tree limits list in EPM Workspace, an unnecessary call is sent toEPM Workspace notifying it that the item is selected. These procedures explain how to preventthe call from occurring.
➤ To optimize tree limits lists for use in EPM Workspace:
1 In Interactive Reporting Studio, open a dashboard that contains the Tree component.
2 Press Ctrl+D to enter Design mode.
3 Right-click a list box, and select Scripts.
Scripts Editor is displayed.
4 Select code in Scripts Editor, and delete it.
5 Click OK.
6 Press Ctrl+D to exit Design mode.
7 Navigate to another frame and return to refresh the screen.
The tree limit list no longer makes redundant calls to EPM Workspace when an item is selected.The result of removing the code from Scripts Editor is that nothing happens if a node is double-clicked in EPM Workspace or in Interactive Reporting Studio. The user can expand and collapse
nodes by clicking .
8 Save the Interactive Reporting document, and import it back into EPM Workspace.
164 Dashboard Studio Tree Component
22Dashboard Studio Webdash
Builder Component
In This Chapter
Webdash Builder Component.. . . . . . . . . . . . . . . . . . . . . . . . . . . . . . . . . . . . . . . . . . . . . . . . . . . . . . . . . . . . . . . . . . . . . . . . . . . . . . . . . . . . . . . . . . . . . . . . . . 165
Using the Webdashbuilder Sample ... . . . . . . . . . . . . . . . . . . . . . . . . . . . . . . . . . . . . . . . . . . . . . . . . . . . . . . . . . . . . . . . . . . . . . . . . . . . . . . . . . . . . . . . . . 166
Configuring the Webdash Builder Component .. . . . . . . . . . . . . . . . . . . . . . . . . . . . . . . . . . . . . . . . . . . . . . . . . . . . . . . . . . . . . . . . . . . . . . . . . . . . . . . 166
Webdash Builder ComponentUse the Webdash Builder component to build dashboardsRF in environments (such as pureHTML, Web plug-ins, or desktop applications) that process Interactive Reporting documents.
The build tool is a Dashboard Studio configuration frame, called Build Dashboard, that uses theplacement features of the object model. These features enable you to create, place, and sizedashboard objects without going into Design mode.
The component eliminates the need for the Dashboard Studio wizard in most cases. The eightsteps have become one configuration frame. However, the wizard is required to combinedocuments and templates (using the Dashboard Studio Merge Utility), create and customizetemplates, configure styles, and build more sophisticated, user-configured dashboards.
You use the dashboard sections and prototypes provided by the component to support runtimemode for dashboard building and to position and size embedded objects.
➤ To incorporate Webdash Builder component into customized dashboard templates:
1 Update the template, using the Dashboard Development Services Update Utility.
2 Add shapes such as Panel_Background_1, Panel_Background_2, and Panel_Background_3 to frameprototypes that the facility will use.
3 Import data models into the template, and then import the template into EPM Workspace.
Webdash is available in multiple formats and can be used in multiple ways. See “Using theWebdash Template to Build Dashboards ” in the Hyperion Interactive Reporting – Object Modeland Dashboard Development Services Developer's Guide, Volume 5: Dashboard Studio.
Webdash Builder Component 165

Using the Webdashbuilder SampleThe Webdashbuilder_sample_esm.bqy provides features for creating local filters andbuilding a dashboard. To build a dashboard, see “Configuring the Webdash BuilderComponent” on page 166.
➤ To use the Webdashbuilder sample, do one of the following:
● Import the sample ESM with one or more data models into EPM Workspace to createqueries, charts, or pivots; then, convert the sections into a dashboard.
● Import an ESM that contains charts or pivots into EPM Workspace.
➤ To use the Webdashbuilder sample in Interactive Reporting Studio to create local filters:
1 In Interactive Reporting Studio, open Webdashbuilder_sample_esm.bqy.
2 Select Sections, then Build Dashboard.
3 In Create Local Filters, select a results section.
For example, select Sales Results. The results columns are displayed.
4 Select Columns to add to the local filters.
For example, select Revenue.
5 Move selected columns between Columns and Local Filters by clicking and .
6 Click Apply at this point in development, or build your dashboards before clicking Apply.
7 Navigate to another dashboard frame, and verify that the local filters function correctly.
8 From Filters on the top panel or Quick Filters, select and set a filter.
The local filter selected in Build Dashboard is displayed in the Filters or Quick Filters, and thedashboard data changes to reflect the selected filter.
9 Save the dashboard.
Tip:
To reorder local filters, use the Filter Aliases Properties Frame. See “Filter Aliases PropertiesFrame” in the Hyperion Interactive Reporting – Object Model and Dashboard Development ServicesDeveloper's Guide, Volume 5: Dashboard Studio.
Configuring the Webdash Builder ComponentTasks that you perform to use the Webdash Builder component to create dashboards:
1. Merge the component. See “Merging Components” on page 10.
Merging the component names the frame panels as Panel_Background_1,Panel_Background_2, Panel_Background_3, and so on. You can verify the Properties of the
166 Dashboard Studio Webdash Builder Component

panel names. Then, you can configure the component, by adding shapes and controls,creating local filters, and building dashboards.
2. Add shapes to frame prototypes.
3. Optional: Using Dashboard Studio Options, include the template.
4. Optional: Import or create sections.
5. Create local filters. See “Creating Local Filters” on page 169 and “Using the WebdashbuilderSample” on page 166.
6. Use Build Dashboard in Interactive Reporting Studio to create a dashboard.
7. Optional: Customize the dashboard using Dashboard Studio.
You can view and configure the merged template or document in Interactive Reporting Studio.
Adding Shapes to Frame PrototypesYou use the Build Dashboard UI frame to add one or more Webdash shapes (a drop-down list,command button, list box, and rectangle) to frame prototypes so that runtime Build Dashboardfeatures can be used with existing templates.
The drop-down list, button, and list controls are used to make filters generically accessible. Youshould add the drop-down list, button, and list box controls to all frame prototypes to be usedwith the Build Dashboard section. The button is required only for frame prototypes that do notcontain a button for a Quick Filters list box.
The rectangle identifies the location and size of pivots, charts, and tables to be embedded. Youcopy the rectangle one or more times to each frame prototype to be used with the BuildDashboard section, and position and resize as required.
Frame prototypes are available in the Webdash_Template.bqy and Frame_Library.bqy.These files are located in the templates folder.
Tip:
If the component is merged with a document, display frame prototypes in Interactive ReportingStudio, by selecting View, then Unhide Section.
Note:
If you want to use Quick Slice on your dashboards, configure options before importing intoEPM Workspace.
➤ To add shapes and controls to frames:
1 In Interactive Reporting Studio, open the merged document or template.
2 From Sections, select Build Dashboard UI.
3 Press Ctrl+D to enter Design mode.
Configuring the Webdash Builder Component 167

4 Select the rectangle, and press Ctrl+C.
5 From Sections, select a frame prototype on which to place the rectangle.
For example, if the component was merged with the Round Tab Panel Template, select 4 PanelsRound Tab.
6 Paste the rectangle by pressing Ctrl+V, and resize if necessary.
Shapes are named according to the order in which they are pasted. For example, the panelheadings are displayed as Heading 1, Heading 2, Heading 3, and Heading 4, left to right.Therefore, you should paste shapes in the order in which you want them numbered.
7 Optional: To view a shape name, right-click the shape, and select Properties.
The name is displayed as Panel_Background_1, Panel_Background_2, Panel_Background_3, andso on, with an incremental end number.
8 On the frame prototype, select and delete all Quick Filters controls.
9 In Build Dashboard UI, copy the drop-down list, button, and list controls to replace the deleted frameprototype controls.
10 Paste and position the controls on the frame prototype.
The section called Hysl_rtdb is required to enable the functionality of the shapes in Webdash-configured documents. Hysl_rtdb is not required to be visible to function correctly. To locatethe section, select View, then Unhide Section, and then click Cancel.
11 Repeat steps 2–10 to add shapes to other frame prototypes.
12 Press Ctrl+D to exit Design mode.
13 Select File, then Save.
14 Close the template or document.
Including TemplatesOptional: This step is required only if a template was customized.
➤ To include a template:
1 Start Dashboard Studio.
2 From Select a Framework Template, click .
Options is displayed. See “Options Window” in the Hyperion Interactive Reporting – Object Modeland Dashboard Development Services Developer's Guide, Volume 5: Dashboard Studio.
3 Click Include.
4 Navigate to the customized template.
5 Click OK.
The template is displayed in Create a Document From Template.
6 Optional: Use the Dashboard Studio wizard to import sections or create sections.
168 Dashboard Studio Webdash Builder Component
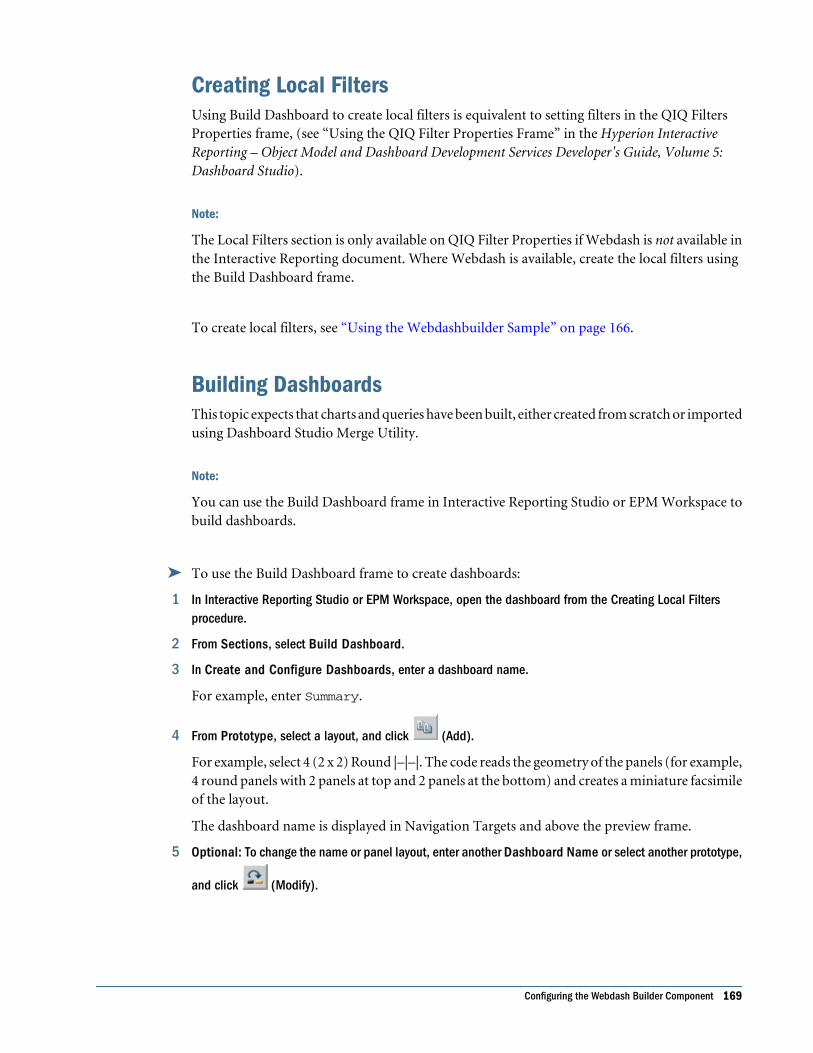
Creating Local FiltersUsing Build Dashboard to create local filters is equivalent to setting filters in the QIQ FiltersProperties frame, (see “Using the QIQ Filter Properties Frame” in the Hyperion InteractiveReporting – Object Model and Dashboard Development Services Developer's Guide, Volume 5:Dashboard Studio).
Note:
The Local Filters section is only available on QIQ Filter Properties if Webdash is not available inthe Interactive Reporting document. Where Webdash is available, create the local filters usingthe Build Dashboard frame.
To create local filters, see “Using the Webdashbuilder Sample” on page 166.
Building DashboardsThis topic expects that charts and queries have been built, either created from scratch or importedusing Dashboard Studio Merge Utility.
Note:
You can use the Build Dashboard frame in Interactive Reporting Studio or EPM Workspace tobuild dashboards.
➤ To use the Build Dashboard frame to create dashboards:
1 In Interactive Reporting Studio or EPM Workspace, open the dashboard from the Creating Local Filtersprocedure.
2 From Sections, select Build Dashboard.
3 In Create and Configure Dashboards, enter a dashboard name.
For example, enter Summary.
4 From Prototype, select a layout, and click (Add).
For example, select 4 (2 x 2) Round |–|–|. The code reads the geometry of the panels (for example,4 round panels with 2 panels at top and 2 panels at the bottom) and creates a miniature facsimileof the layout.
The dashboard name is displayed in Navigation Targets and above the preview frame.
5 Optional: To change the name or panel layout, enter another Dashboard Name or select another prototype,
and click (Modify).
Configuring the Webdash Builder Component 169
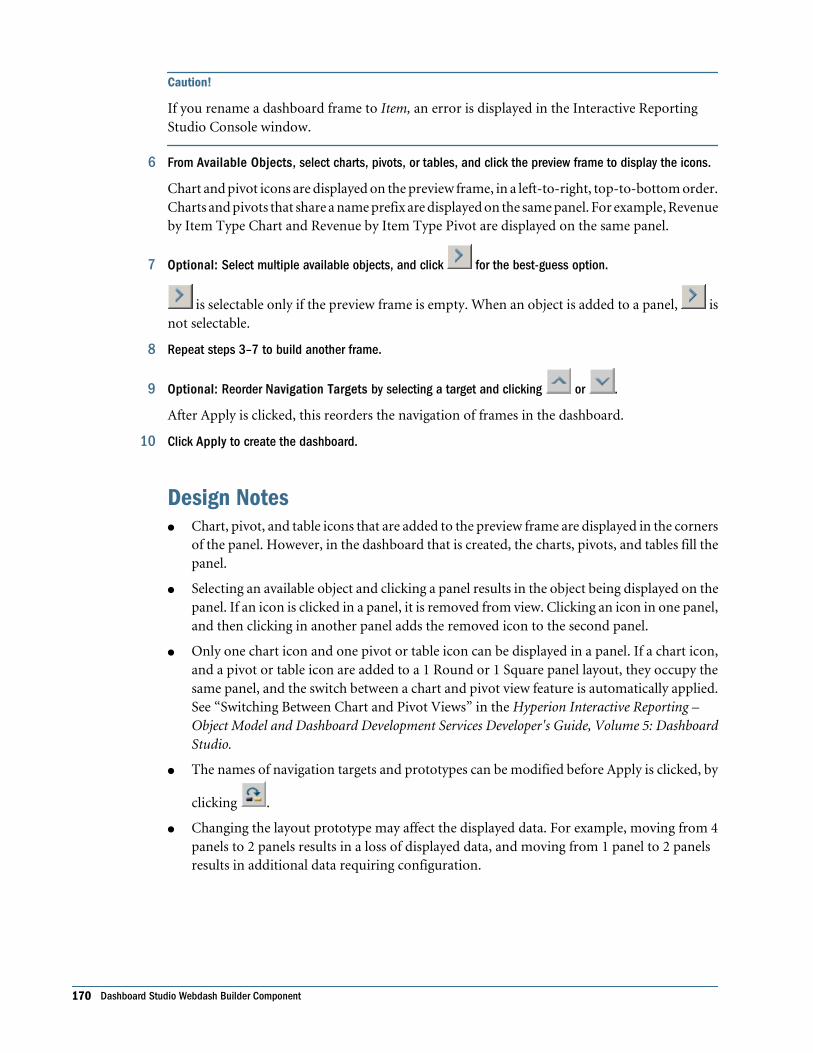
Caution!
If you rename a dashboard frame to Item, an error is displayed in the Interactive ReportingStudio Console window.
6 From Available Objects, select charts, pivots, or tables, and click the preview frame to display the icons.
Chart and pivot icons are displayed on the preview frame, in a left-to-right, top-to-bottom order.Charts and pivots that share a name prefix are displayed on the same panel. For example, Revenueby Item Type Chart and Revenue by Item Type Pivot are displayed on the same panel.
7 Optional: Select multiple available objects, and click for the best-guess option.
is selectable only if the preview frame is empty. When an object is added to a panel, isnot selectable.
8 Repeat steps 3–7 to build another frame.
9 Optional: Reorder Navigation Targets by selecting a target and clicking or .
After Apply is clicked, this reorders the navigation of frames in the dashboard.
10 Click Apply to create the dashboard.
Design Notes● Chart, pivot, and table icons that are added to the preview frame are displayed in the corners
of the panel. However, in the dashboard that is created, the charts, pivots, and tables fill thepanel.
● Selecting an available object and clicking a panel results in the object being displayed on thepanel. If an icon is clicked in a panel, it is removed from view. Clicking an icon in one panel,and then clicking in another panel adds the removed icon to the second panel.
● Only one chart icon and one pivot or table icon can be displayed in a panel. If a chart icon,and a pivot or table icon are added to a 1 Round or 1 Square panel layout, they occupy thesame panel, and the switch between a chart and pivot view feature is automatically applied.See “Switching Between Chart and Pivot Views” in the Hyperion Interactive Reporting –Object Model and Dashboard Development Services Developer's Guide, Volume 5: DashboardStudio.
● The names of navigation targets and prototypes can be modified before Apply is clicked, by
clicking .
● Changing the layout prototype may affect the displayed data. For example, moving from 4panels to 2 panels results in a loss of displayed data, and moving from 1 panel to 2 panelsresults in additional data requiring configuration.
170 Dashboard Studio Webdash Builder Component
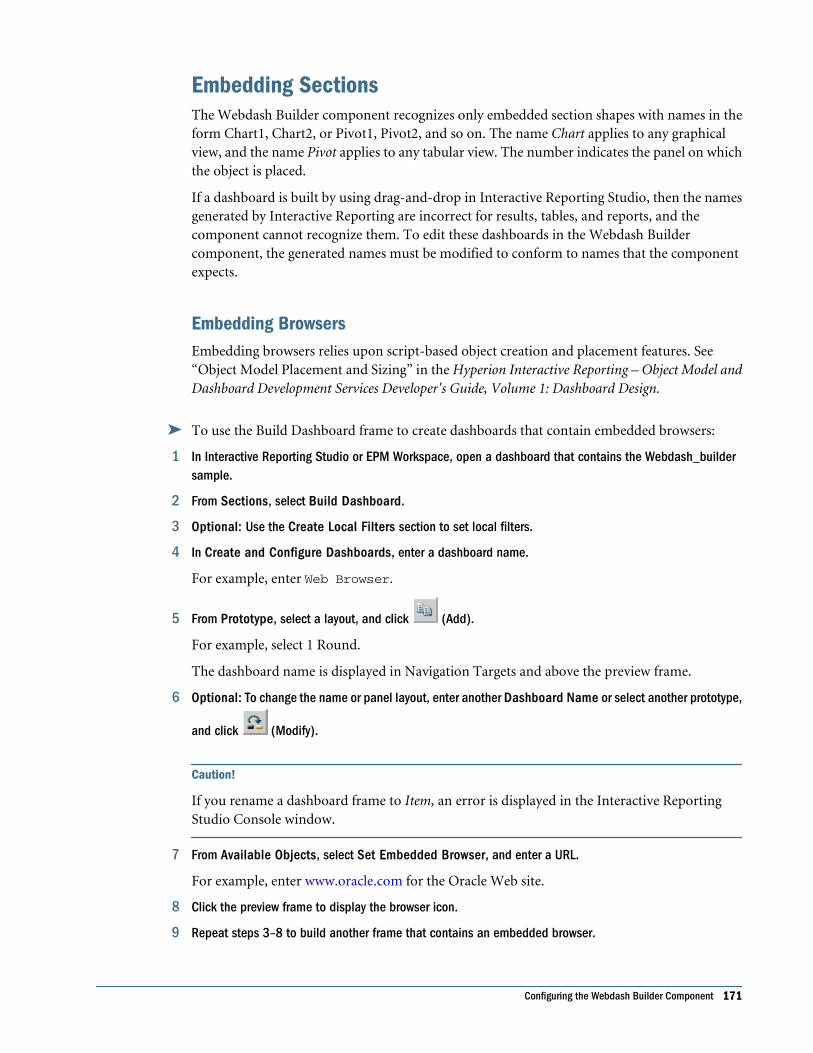
Embedding SectionsThe Webdash Builder component recognizes only embedded section shapes with names in theform Chart1, Chart2, or Pivot1, Pivot2, and so on. The name Chart applies to any graphicalview, and the name Pivot applies to any tabular view. The number indicates the panel on whichthe object is placed.
If a dashboard is built by using drag-and-drop in Interactive Reporting Studio, then the namesgenerated by Interactive Reporting are incorrect for results, tables, and reports, and thecomponent cannot recognize them. To edit these dashboards in the Webdash Buildercomponent, the generated names must be modified to conform to names that the componentexpects.
Embedding BrowsersEmbedding browsers relies upon script-based object creation and placement features. See“Object Model Placement and Sizing” in the Hyperion Interactive Reporting – Object Model andDashboard Development Services Developer's Guide, Volume 1: Dashboard Design.
➤ To use the Build Dashboard frame to create dashboards that contain embedded browsers:
1 In Interactive Reporting Studio or EPM Workspace, open a dashboard that contains the Webdash_buildersample.
2 From Sections, select Build Dashboard.
3 Optional: Use the Create Local Filters section to set local filters.
4 In Create and Configure Dashboards, enter a dashboard name.
For example, enter Web Browser.
5 From Prototype, select a layout, and click (Add).
For example, select 1 Round.
The dashboard name is displayed in Navigation Targets and above the preview frame.
6 Optional: To change the name or panel layout, enter another Dashboard Name or select another prototype,
and click (Modify).
Caution!
If you rename a dashboard frame to Item, an error is displayed in the Interactive ReportingStudio Console window.
7 From Available Objects, select Set Embedded Browser, and enter a URL.
For example, enter www.oracle.com for the Oracle Web site.
8 Click the preview frame to display the browser icon.
9 Repeat steps 3–8 to build another frame that contains an embedded browser.
Configuring the Webdash Builder Component 171

10 Optional: Reorder Navigation Targets by selecting a target and clicking or .
After Apply is clicked, this reorders the navigation of frames in the dashboard.
11 Click Apply to create the dashboard.
Embedding ReportsEmbedding reports relies upon script-based report object creation and placement features. See“Embedding Reports” in the Hyperion Interactive Reporting – Object Model and DashboardDevelopment Services Developer's Guide, Volume 5: Dashboard Studio.
➤ To use the Build Dashboard frame to create dashboards that contain embedded reports:
1 In Interactive Reporting Studio or Oracle Enterprise Performance Management Workspace, Fusion Edition,open a dashboard that contains the Webdash_builder sample.
2 From Sections, select Build Dashboard.
3 Optional: Use the Create Local Filters section to set local filters.
4 In Create and Configure Dashboards, enter a dashboard name.
For example, enter Summary Report.
5 From Prototype, select a layout, and click (Add).
For example, select 1 Square.
The dashboard name is displayed in Navigation Targets and above the preview frame.
6 Optional: To change the name or panel layout, enter another Dashboard Name or select another prototype,
and click (Modify).
Caution!
If you rename a dashboard frame to Item, an error is displayed in the Interactive ReportingStudio Console window.
7 From Available Objects, select a report, and click the preview frame to display the icon.
8 Optional: Select multiple available objects, and click for the best-guess option.
is selectable only if the preview frame is empty. When an object is added to a panel, isnot selectable.
9 Repeat steps 3–8 to build another frame that contains an embedded report.
10 Optional: Reorder Navigation Targets by selecting a target and clicking or .
After Apply is clicked, this reorders the navigation of frames in the dashboard.
11 Click Apply to create the dashboard.
172 Dashboard Studio Webdash Builder Component

Note:
When embedding a report into a Webdash document using the Build Dashboard frame, thename of the report must begin with Pivot to be recognized as a tabular structure.
Creating Runtime Documents
Note:
Creating a runtime document removes the code necessary to create and configure dashboardsections. It is not possible to reconfigure a runtime document. As a result, you should alwayssave an updated copy of your working ESM BQY before creating a runtime document.
➤ To create a runtime document when there is no existing runtime folder or document:
1 In the Build Dashboards section, click Make Runtime.
A Create a Runtime document dialog box is displayed.
2 Read the information in the Create a Runtime Document dialog box and click Yes to continue.
A Runtime folder is created and an Alert dialog box is displayed.
3 In the Alert dialog box, click Yes to continue.
A runtime document is created and saved in the newly-created Runtime folder, and the ESMdocument is closed.
➤ To create a runtime document when a runtime document exists with the same path and name:
1 In the Build Dashboards section, click Make Runtime.
A message is displayed letting you know that there is already a file with the same name in theRuntime folder.
2 Do one of the following and click Yes to continue.
● Select Overwrite file.
● Change the file name.
An Alert dialog box is displayed.
3 In the Alert dialog box, click Yes to continue.
A runtime document is created and saved, and the ESM document is closed.
➤ To create a runtime document in Workspace:
1 Save your original ESM document as <some_name>_esm.bqy.
2 Save this same document as <some_name>.bqy.
This is the document that will be turned into a runtime document.
3 In the Build Dashboards section, click Make Runtime.
Configuring the Webdash Builder Component 173

A Create a Runtime Document dialog box is displayed.
4 In the Create a Runtime Document dialog box, click Yes to continue.
An Alert dialog box is displayed.
5 In the Alert dialog box, click Yes to continue.
The Alert dialog box lets you know when the process is complete and the runtime document iscreated.
6 Click OK.
7 Save and close the document.
8 Open the runtime version of the document in Workspace.
➤ To create a packed runtime document:
1 In the Build Dashboards section, click Make Runtime.
A Create a Runtime Document dialog box is displayed.
2 In the Create a Runtime Document dialog box, select Packed Runtime.
An Alert dialog box is displayed.
3 In the Alert dialog box, click Yes to continue.
A packed runtime document is created.
Verifying Dashboard Functionality
➤ To test dashboard functionality:
1 In Interactive Reporting Studio, navigate to the dashboard sections created in the Building Dashboardsprocedure.
2 Use the frame navigation to move between the sections.
For example, if a tab prototype was created, use tabs.
3 Optional: If a chart and a pivot or table are configured on a 1 Round or 1 Square panel frame, click
or , to switch between the views.
4 Use other dashboard functions, by selecting controls on the top panel.
For example, click or , to sort data.
5 Optional: Set filters using Quick Filters.
6 Save the dashboard.
174 Dashboard Studio Webdash Builder Component

Customizing Dashboards Using Dashboard StudioA dashboard that is created using Build Dashboard can be customized (but does not have to be)in Dashboard Studio. The dashboard properties and styles can be configured by using Step 7 ofDashboard Studio and Step 8 of Dashboard Studio (see chapters “Step 7: Configure Properties”and “Step 8: Configure Style” in the Hyperion Interactive Reporting – Object Model and DashboardDevelopment Services Developer's Guide, Volume 5: Dashboard Studio). The dashboard can bemerged or imported into another document by using the Dashboard Studio Merge Utility (see“Merging Components” on page 10).
Configuring the Webdash Builder Component 175

176 Dashboard Studio Webdash Builder Component

23Dashboard Studio Blank
Component
In This Chapter
Blank Component .. . . . . . . . . . . . . . . . . . . . . . . . . . . . . . . . . . . . . . . . . . . . . . . . . . . . . . . . . . . . . . . . . . . . . . . . . . . . . . . . . . . . . . . . . . . . . . . . . . . . . . . . . . . . . . . 177
Customizing the Component Core ... . . . . . . . . . . . . . . . . . . . . . . . . . . . . . . . . . . . . . . . . . . . . . . . . . . . . . . . . . . . . . . . . . . . . . . . . . . . . . . . . . . . . . . . . . . . 177
Blank Component Properties Frame and User Interface ... . . . . . . . . . . . . . . . . . . . . . . . . . . . . . . . . . . . . . . . . . . . . . . . . . . . . . . . . . . . . . . . . . . 181
Blank ComponentThe blank component enables developers to create and customize components. The componenthas restricted standard functional capabilities that are associated with naming, generating, andcreating component definition properties.
Blank_component.bqy contains the sections described in Table 14.
Table 14 Blank Component Sections, Core Properties, and Descriptions
Section Name Core Properties Description
Orcl_blank FrameType = 1020 Each component contains this core section that contains the codeto make the component function, the static properties (such asmultilingual string constants), and the configuration properties toenable the component to perform correctly in different situations
Orcl_blank Properties Implements = STYLES1
FrameType = 1051
txlClass = Orcl_blank
A component can contain one, multiple, or no properties frames(These frames are only present in ESMs and assist the dashboarddeveloper to set the required options for the dashboard to functionin the current context)
Orcl_blank UI FrameType = 1022 A component can contain one, multiple, or no user interfacesections (These sections contain user interface samples that canbe cut and pasted into other sections; for example, the GraphicGauges component includes a set of images, or the calendarcontrol object has a sample calendar)
Customizing the Component CoreUse the Orcl_blank frame to customize the component. Table 15 describes the Orcl_blank objecttitles, names, and functions required to construct a component.
Blank Component 177

Table 15 Orcl_blank Object Titles, Names, and Functionality
Object Title Object Name (where applicable) Functionality
ParentOrcl_blank txlParent Reserved for future use (also seeMeOrcl_blank)
MeOrcl_blank txlMe Provides the component name whichis identical to the section name (Canbe used internally by the componentcode)
Run Time Event Handlers and Functions cbt_events_runTime Activated at document startup, thebutton contains functions that areused by the runtime document (Theblank component is preconfiguredwith a set of empty functions thathave tracing to enable developers totest that the component propertiesare correctly configured, and that thecomponent is functioning beforeadding custom code)
Configuration Time Event Handlers andFunctions
cbt_events_config Activated at document startup, thebutton contains functions that areused during dashboard developmentto handle the configuration orproperties frames (The first line ofcode establishes if the document is aruntime release, and if so, it exits. Theblank component is preconfiguredwith a set of empty functions thathave tracing to enable developers totest that the component propertiesare correctly configured, and that thecomponent is functioning beforeadding custom code)
Aspect Event Handlers cbt_events_aspec Commented out pre- and post-eventhandlers called before or after theevent handlers for an event. These arecommented out because they addoverhead to every event and shouldonly be used where some specificbehavior that cannot be achievedthrough standard events is required.
Note: These override the behavior ofother components; however, thedeveloper can un-comment thesehandlers where required. Mostcomponents do not use them.
VersionInfo Release information about thecomponent
txlReqBrio Minimum required release number ofInteractive Reporting Studio (Theframework checks for the release andonly initializes the component if the
178 Dashboard Studio Blank Component

Object Title Object Name (where applicable) Functionality
release of Oracle's Hyperion®Interactive Reporting Studio is equalto or later than the listed value)
txlReqTemplate Minimum required release number ofthe Dashboard Studio core template(The framework checks for the releaseand only initializes the component ifthe release of the template is equalto or later than the listed value)
txlFrameName Name of the first configuration framefor the component
txlPriority Order in which the component isinitialized; that is, the order thecomponent receives broadcastevents, such as OnStartup,OnShutDown, OnActivate,OnPreProcess, and so on,including aspect events (The lower thepriority, the earlier the component isacted upon. Priorities range from 1–10, with an empty value being treatedas a priority of 10)
ComponentDefinition Core component sections, sequenceof properties frames, and sections toremove when an ESM is saved as aruntime (The text label is affected bySynch Component Definition,Rename Component, and RenameProperty Editor)
gtxlProperties Unique settings and options fordashboards (Clicking Apply on aconfiguration or properties frameupdates the gtxlProperties text label)
gtxlToolTip (click to generate forconfigurator)
Parses the configuration frame andgenerates, in the Console Window, adefault floating comment for eachclickable shape (The developercopies, pastes, and edits these intothe gtxlToolTip text label)
gtxlToolTip Language strings for floatingcommentsdisplayed when hoveringover clickable objects
gtxlLanguageStrings (click to generatefor configurator)
Parses the configuration frame andgenerates, in the Console Window, adefault text string for each shape witha text property (Developers copy,paste, and edit these strings into thegtxlLanguageStrings text label)
Customizing the Component Core 179

Object Title Object Name (where applicable) Functionality
gtxlLanguageStrings Language strings for text labels, alertboxes, and so on, displayed in thecomponent user interface
gtxlLanguageMappings Association between strings andobjects so code is not required forchanges in the user interface textvalues; for example, in response to auser switching the dashboardlanguage
Synch Component Definition txlSynchCompoentDefinition Only visible if the InteractiveReporting document is a component;that is, not a template, an ESM, nor aruntime (Updates the contents ofComponentDefinition using sectionslocated in the component, andassumes all sections are part of thecomponent and must be retained. Itidentifies configuration or propertiesframes based on the FrameType, andclicking Default when creating aruntime release selects all sections,except the core, to be discarded)
Rename Component txlRenameComponent Code to apply consistent renaming tosections in the component (Whenrenaming is complete, it calls SynchComponent Definition if theInteractive Reporting document is acomponent)
Revert to Component txlMakeComponent Discards sections that are not part ofthe component, so the componentcan be extracted from the template(Only operates if the InteractiveReporting document is a template)
Rename Property Editor txlRenamePropertyEditor Renames the selected Property Editor(configuration or properties frame),and updates ComponentDefinitionand txlFrameName
Set Dependency Version To Current txlSetDep Updates txlReqBrio to the currentrelease, and if the InteractiveReporting document is a template, anESM, or a runtime release, setstxlReqTemplate to the version of thecurrent template
txlName User-friendly component name (Usedby Dashboard Architect to generatethe JavaDoc for the component)
Descriptive text txlDescription Component synopsis (Used byDashboard Architect to generate theJavaDoc for the component)
180 Dashboard Studio Blank Component

Blank Component Properties Frame and User InterfaceOrcl_blank Properties is a blank configuration or properties frame that contains the minimalobjects and controls required to customize a configuration or properties frame.
Orcl_blank UI is an empty section that user interface objects can be pasted into from other partsof an Oracle's Hyperion® Interactive Reporting document.
Blank Component Properties Frame and User Interface 181

182 Dashboard Studio Blank Component

Glossary
access permissions A set of operations that a user can
perform on a resource.
accountability map A visual, hierarchical representation of
the responsibility, reporting, and dependency structure of
the accountability teams (also known as critical business
areas) in an organization.
active service A service whose Run Type is set to Start rather
than Hold.
active user A user who is entitled to access the system.
active user/user group The user or user group identified as
the current user by user preferences. Determines default
user preferences, dynamic options, access, and file
permissions. You can set the active user to your user name
or any user group to which you belong.
adaptive states Interactive Reporting Web Client level of
permission.
aggregate cell A cell comprising several cells. For example,
a data cell that uses Children(Year) expands to four cells
containing Quarter 1, Quarter 2, Quarter 3, and Quarter 4
data.
aggregate limit A limit placed on an aggregated request line
item or aggregated metatopic item.
alias An alternative name. For example, for a more easily
identifiable column descriptor you can display the alias
instead of the member name.
appender A Log4j term for destination.
application (1) A software program designed to run a
specific task or group of tasks such as a spreadsheet program
or database management system. (2) A related set of
dimensions and dimension members that are used to meet
a specific set of analytical and/or reporting requirements.
artifact An individual application or repository item; for
example, scripts, forms, rules files, Interactive Reporting
documents, and financial reports. Also known as an object.
attribute Characteristics of a dimension member. For
example, Employee dimension members may have
attributes of Name, Age, or Address. Product dimension
members can have several attributes, such as a size and
flavor.
attribute dimension A type of dimension that enables
analysis based on the attributes or qualities of dimension
members.
authentication service A core service that manages one
authentication system.
axis (1) A straight line that passes through a graphic used
for measurement and categorization. (2) A report aspect
used to arrange and relate multidimensional data, such as
filters, pages, rows, and columns. For example, for a data
query in Simple Basic, an axis can define columns for values
for Qtr1, Qtr2, Qtr3, and Qtr4. Row data would be retrieved
with totals in the following hierarchy: Market, Product.
bar chart A chart that can consist of one to 50 data sets,
with any number of values assigned to each data set. Data
sets are displayed as groups of corresponding bars, stacked
bars, or individual bars in separate rows.
batch POV A collection of all dimensions on the user POV
of every report and book in the batch. While scheduling the
batch, you can set the members selected on the batch POV.
book A container that holds a group of similar Financial
Reporting documents. Books may specify dimension
sections or dimension changes.
book POV The dimension members for which a book is
run.
Glossary 183

bookmark A link to a reporting document or a Web site,
displayed on a personal page of a user. The two types of
bookmarks are My Bookmarks and image bookmarks.
bounding rectangle The required perimeter that
encapsulates the Interactive Reporting document content
when embedding Interactive Reporting document sections
in a personal page, specified in pixels for height and width
or row per page.
cache A buffer in memory that holds data temporarily.
calculation The process of aggregating data, or of running
a calculation script on a database.
Catalog pane Displays a list of elements available to the
active section. If Query is the active section, a list of database
tables is displayed. If Pivot is the active section, a list of
results columns is displayed. If Dashboard is the active
section, a list of embeddable sections, graphic tools, and
control tools are displayed.
categories Groupings by which data is organized. For
example, Month
cause and effect map Depicts how the elements that form
your corporate strategy relate and how they work together
to meet your organization's strategic goals. A Cause and
Effect map tab is automatically created for each Strategy
map.
cell (1) The data value at the intersection of dimensions in
a multidimensional database; the intersection of a row and
a column in a worksheet. (2) A logical group of nodes
belonging to one administrative domain.
chart A graphical representation of spreadsheet data. The
visual nature expedites analysis, color-coding, and visual
cues that aid comparisons.
chart template A template that defines the metrics to
display in Workspace charts.
child A member with a parent above it in the database
outline.
choice list A list of members that a report designer can
specify for each dimension when defining the report's point
of view. A user who wants to change the point of view for a
dimension that uses a choice list can select only the members
specified in that defined member list or those members that
meet the criteria defined in the function for the dynamic list.
clustered bar charts Charts in which categories are viewed
side-by-side; useful for side-by-side category analysis; used
only with vertical bar charts.
column A vertical display of information in a grid or table.
A column can contain data from one field, derived data from
a calculation, or textual information.
computed item A virtual column (as opposed to a column
that is physically stored in the database or cube) that can be
calculated by the database during a query, or by Interactive
Reporting Studio in the Results section. Computed items
are calculations of data based on functions, data items, and
operators provided in the dialog box and can be included in
reports or reused to calculate other data.
connection file See Interactive Reporting connection file
(.oce).
content Information stored in the repository for any type
of file.
cookie A segment of data placed on your computer by a
Web site.
correlated subqueries Subqueries that are evaluated once
for every row in the parent query; created by joining a topic
item in the subquery with a topic in the parent query.
critical business area (CBA) An individual or a group
organized into a division, region, plant, cost center, profit
center, project team, or process; also called accountability
team or business area.
critical success factor (CSF) A capability that must be
established and sustained to achieve a strategic objective;
owned by a strategic objective or a critical process and is a
parent to one or more actions.
cube A block of data that contains three or more
dimensions. An Essbase database is a cube.
custom calendar Any calendar created by an administrator.
custom report A complex report from the Design Report
module, composed of any combination of components.
dashboard A collection of metrics and indicators that
provide an interactive summary of your business.
Dashboards enable you to build and deploy analytic
applications.
184 Glossary

data function That computes aggregate values, including
averages, maximums, counts, and other statistics, that
summarize groupings of data.
data layout The data layout interface is used to edit a query,
arrange dimensions, make alternative dimension member
selections, or specify query options for the current section
or data object.
data model A representation of a subset of database tables.
database connection File that stores definitions and
properties used to connect to data sources and enables
database references to be portable and widely used.
descendant Any member below a parent in the database
outline. In a dimension that includes years, quarters, and
months, the members Qtr2 and April are descendants of the
member Year.
Design Report An interface in Web Analysis Studio for
designing custom reports, from a library of components.
detail chart A chart that provides the detailed information
that you see in a Summary chart. Detail charts appear in the
Investigate Section in columns below the Summary charts.
If the Summary chart shows a Pie chart, then the Detail
charts below represent each piece of the pie.
dimension A data category used to organize business data
for retrieval and preservation of values. Dimensions usually
contain hierarchies of related members grouped within
them. For example, a Year dimension often includes
members for each time period, such as quarters and months.
dimension tab In the Pivot section, the tab that enables you
to pivot data between rows and columns.
dimension table (1) A table that includes numerous
attributes about a specific business process. (2) In Essbase
Integration Services, a container in the OLAP model for one
or more relational tables that define a potential dimension
in Essbase.
display type One of three Web Analysis formats saved to
the repository: spreadsheet, chart, and pinboard.
dog-ear The flipped page corner in the upper right corner
of the chart header area.
drill-down Navigation through the query result set using
the dimensional hierarchy. Drilling down moves the user
perspective from aggregated data to detail. For example,
drilling down can reveal hierarchical relationships between
years and quarters or quarters and months.
drill-through The navigation from a value in one data
source to corresponding data in another source.
dynamic report A report containing data that is updated
when you run the report.
Edit Data An interface for changing values and sending
edits to Essbase.
employee A user responsible for, or associated with,
specific business objects. Employees need not work for an
organization; for example, they can be consultants.
Employees must be associated with user accounts for
authorization purposes.
ending period A period enabling you to adjust the date
range in a chart. For example, an ending period of “month”,
produces a chart showing information through the end of
the current month.
exceptions Values that satisfy predefined conditions. You
can define formatting indicators or notify subscribing users
when exceptions are generated.
external authentication Logging on to Oracle's Hyperion
applications with user information stored outside the
applications, typically in a corporate directory such as
MSAD or NTLM.
externally triggered events Non-time-based events for
scheduling job runs.
Extract, Transform, and Load (ETL) Data source-specific
programs for extracting data and migrating it to
applications.
fact table The central table in a star join schema,
characterized by a foreign key and elements drawn from a
dimension table. This table typically contains numeric data
that can be related to all other tables in the schema.
filter A constraint on data sets that restricts values to
specific criteria; for example, to exclude certain tables,
metadata, or values, or to control access.
folder A file containing other files for the purpose of
structuring a hierarchy.
Glossary 185

footer Text or images at the bottom of report pages,
containing dynamic functions or static text such as page
numbers, dates, logos, titles or file names, and author
names.
format Visual characteristics of documents or report
objects.
free-form grid An object for presenting, entering, and
integrating data from different sources for dynamic
calculations.
generic jobs Non-SQR Production Reporting or non-
Interactive Reporting jobs.
grid POV A means for specifying dimension members on
a grid without placing dimensions in rows, columns, or page
intersections. A report designer can set POV values at the
grid level, preventing user POVs from affecting the grid. If
a dimension has one grid value, you put the dimension into
the grid POV instead of the row, column, or page.
group A container for assigning similar access permissions
to multiple users.
highlighting Depending on your configuration, chart cells
or ZoomChart details may be highlighted, indicating value
status: red (bad), yellow (warning), or green (good).
host A server on which applications and services are
installed.
host properties Properties pertaining to a host, or if the
host has multiple Install_Homes, to an Install_Home. The
host properties are configured from the LSC.
hyperlink A link to a file, Web page, or an intranet HTML
page.
Hypertext Markup Language (HTML) A programming
language specifying how Web browsers display data.
image bookmarks Graphic links to Web pages or
repository items.
implied share A member with one or more children, but
only one is consolidated, so the parent and child share a
value.
inactive group A group for which an administrator has
deactivated system access.
inactive service A service suspended from operating.
inactive user A user whose account has been deactivated by
an administrator.
Install_Home A variable for the directory where Oracle's
Hyperion applications are installed. Refers to one instance
of Oracle's Hyperion application when multiple
applications are installed on the same computer.
Interactive Reporting connection file (.oce) Files
encapsulating database connection information, including:
the database API (ODBC, SQL*Net, etc.), database
software, the database server network address, and database
user name. Administrators create and publish Interactive
Reporting connection files (.oce).
intersection A unit of data representing the intersection of
dimensions in a multidimensional database; also, a
worksheet cell.
Investigation See drill-through.
Java Database Connectivity (JDBC) A client-server
communication protocol used by Java based clients and
relational databases. The JDBC interface provides a call-
level API for SQL-based database access.
job output Files or reports produced from running a job.
job parameters Reusable, named job parameters that are
accessible only to the user who created them.
jobs Documents with special properties that can be
launched to generate output. A job can contain Interactive
Reporting, SQR Production Reporting, or generic
documents.
join A link between two relational database tables or topics
based on common content in a column or row. A join
typically occurs between identical or similar items within
different tables or topics. For example, a record in the
Customer table is joined to a record in the Orders table
because the Customer ID value is the same in each table.
JSP Java Server Pages.
186 Glossary
layer (1) The horizontal location of members in a
hierarchical structure, specified by generation (top down)
or level (bottom up). (2) Position of objects relative to other
objects. For example, in the Sample Basic database, Qtr1 and
Qtr4 are in the same layer, so they are also in the same
generation, but in a database with a ragged hierarchy, Qtr1
and Qtr4 might not be in same layer, though they are in the
same generation.
legend box A box containing labels that identify the data
categories of a dimension.
level A layer in a hierarchical tree structure that defines
database member relationships. Levels are ordered from the
bottom dimension member (level 0) up to the parent
members.
line chart A chart that displays one to 50 data sets, each
represented by a line. A line chart can display each line
stacked on the preceding ones, as represented by an absolute
value or a percent.
link (1) A reference to a repository object. Links can
reference folders, files, shortcuts, and other links. (2) In a
task flow, the point where the activity in one stage ends and
another begins.
linked data model Documents that are linked to a master
copy in a repository
linked reporting object (LRO) A cell-based link to an
external file such as cell notes, URLs, or files with text, audio,
video, or pictures. (Only cell notes are supported for Essbase
LROs in Financial Reporting.)
local report object A report object that is not linked to a
Financial Reporting report object in Explorer. Contrast with
linked reporting object (LRO).
local results A data model's query results. Results can be
used in local joins by dragging them into the data model.
Local results are displayed in the catalog when requested.
locked data model Data models that cannot be modified by
a user.
LSC services Services configured with the Local Service
Configurator. They include Global Services Manager
(GSM), Local Services Manager (LSM), Session Manager,
Authentication Service, Authorization Service, Publisher
Service, and sometimes, Data Access Service (DAS) and
Interactive Reporting Service.
Map Navigator A feature that displays your current
position on a Strategy, Accountability, or Cause and Effect
map, indicated by a red outline.
master data model An independent data model that is
referenced as a source by multiple queries. When used,
“Locked Data Model” is displayed in the Query section's
Content pane; the data model is linked to the master data
model displayed in the Data Model section, which an
administrator may hide.
MDX (multidimensional expression) The language that
give instructions to OLE DB for OLAP- compliant
databases, as SQL is used for relational databases. When you
build the OLAPQuery section's Outliner, Interactive
Reporting Clients translate requests into MDX instructions.
When you process the query, MDX is sent to the database
server, which returns records that answer your query. See
also SQL spreadsheet.
measures Numeric values in an OLAP database cube that
are available for analysis. Measures are margin, cost of goods
sold, unit sales, budget amount, and so on. See also fact
table.
member A discrete component within a dimension. A
member identifies and differentiates the organization of
similar units. For example, a time dimension might include
such members as Jan, Feb, and Qtr1.
member list A named group, system- or user-defined, that
references members, functions, or member lists within a
dimension.
metadata A set of data that defines and describes the
properties and attributes of the data stored in a database or
used by an application. Examples of metadata are
dimension names, member names, properties, time
periods, and security.
metric A numeric measurement computed from business
data to help assess business performance and analyze
company trends.
MIME Type (Multipurpose Internet Mail Extension) An
attribute that describes the data format of an item, so that
the system knows which application should open the object.
A file's mime type is determined by the file extension or
HTTP header. Plug-ins tell browsers what mime types they
support and what file extensions correspond to each mime
type.
Glossary 187

minireport A report component that includes layout,
content, hyperlinks, and the query or queries to load the
report. Each report can include one or more minireports.
missing data (#MISSING) A marker indicating that data in
the labeled location does not exist, contains no value, or was
never entered or loaded. For example, missing data exists
when an account contains data for a previous or future
period but not for the current period.
model (1) In data mining, a collection of an algorithm's
findings about examined data. A model can be applied
against a wider data set to generate useful information about
that data. (2) A file or content string containing an
application-specific representation of data. Models are the
basic data managed by Shared Services, of two major types:
dimensional and non-dimensional application objects. (3)
In Business Modeling, a network of boxes connected to
represent and calculate the operational and financial flow
through the area being examined.
multidimensional database A method of organizing,
storing, and referencing data through three or more
dimensions. An individual value is the intersection point for
a set of dimensions.
native authentication The process of authenticating a user
name and password from within the server or application.
note Additional information associated with a box,
measure, scorecard or map element.
null value A value that is absent of data. Null values are not
equal to zero.
online analytical processing (OLAP) A multidimensional,
multiuser, client-server computing environment for users
who analyze consolidated enterprise data in real time. OLAP
systems feature drill-down, data pivoting, complex
calculations, trend analysis, and modeling.
origin The intersection of two axes.
page member A member that determines the page axis.
palette A JASC compliant file with a .PAL extension. Each
palette contains 16 colors that complement each other and
can be used to set the dashboard color elements.
performance indicator An image file used to represent
measure and scorecard performance based on a range you
specify; also called a status symbol. You can use the default
performance indicators or create an unlimited number of
your own.
personal pages A personal window to repository
information. You select what information to display and its
layout and colors.
personal recurring time events Reusable time events that
are accessible only to the user who created them.
personal variable A named selection statement of complex
member selections.
perspective A category used to group measures on a
scorecard or strategic objectives within an application. A
perspective can represent a key stakeholder (such as a
customer, employee, or shareholder/financial) or a key
competency area (such as time, cost, or quality).
pie chart A chart that shows one data set segmented in a pie
formation.
pinboard One of the three data object display types.
Pinboards are graphics, composed of backgrounds and
interactive icons called pins. Pinboards require traffic
lighting definitions.
pins Interactive icons placed on graphic reports called
pinboards. Pins are dynamic. They can change images and
traffic lighting color based on the underlying data values and
analysis tools criteria.
plot area The area bounded by X, Y, and Z axes; for pie
charts, the rectangular area surrounding the pie.
predefined drill paths Paths used to drill to the next level
of detail, as defined in the data model.
presentation A playlist of Web Analysis documents,
enabling reports to be grouped, organized, ordered,
distributed, and reviewed. Includes pointers referencing
reports in the repository.
primary measure A high-priority measure important to
your company and business needs. Displayed in the
Contents frame.
Production Reporting See SQR Production Reporting.
188 Glossary

promotion The process of transferring artifacts from one
environment or machine to another; for example, from a
testing environment to a production environment.
property A characteristic of an artifact, such as size, type,
or processing instructions.
proxy server A server acting as an intermediary between
workstation users and the Internet to ensure security.
public job parameters Reusable, named job parameters
created by administrators and accessible to users with
requisite access privileges.
public recurring time events Reusable time events created
by administrators and accessible through the access control
system.
publish The process that enables a model owner to forward
a model or model changes for inclusion in an enterprise
model.
range A set of values including upper and lower limits, and
values falling between limits. Can contain numbers,
amounts, or dates.
reconfigure URL URL used to reload servlet configuration
settings dynamically when users are already logged on to the
Workspace.
recurring time event An event specifying a starting point
and the frequency for running a job.
relational database A type of database that stores data in
related two-dimensional tables. Contrast with
multidimensional database.
report object In report designs, a basic element with
properties defining behavior or appearance, such as text
boxes, grids, images, and charts.
resources Objects or services managed by the system, such
as roles, users, groups, files, and jobs.
result frequency The algorithm used to create a set of dates
to collect and display results.
role The means by which access permissions are granted to
users and groups for resources.
row heading A report heading that lists members down a
report page. The members are listed under their respective
row names.
RSC services Services that are configured with Remote
Service Configurator, including Repository Service, Service
Broker, Name Service, Event Service, and Job Service.
scale The range of values on the Y axis of a chart.
schedule Specify the job that you want to run and the time
and job parameter list for running the job.
score The level at which targets are achieved, usually
expressed as a percentage of the target.
scorecard Business Object that represents the progress of
an employee, strategy element, or accountability element
toward goals. Scorecards ascertain this progress based on
data collected for each measure and child scorecard added
to the scorecard.
scorecard report A report that presents the results and
detailed information about scorecards attached to
employees, strategy elements, and accountability elements.
secondary measure A low-priority measure, less important
than primary measures. Secondary measures do not have
Performance reports but can be used on scorecards and to
create dimension measure templates.
Section pane Lists all sections that are available in the
current Interactive Reporting Client document.
security agent A Web access management provider (for
example, Netegrity SiteMinder) that protects corporate
Web resources.
security platform A framework enabling Oracle's
Hyperion applications to use external authentication and
single sign-on.
services Resources that enable business items to be
retrieved, changed, added, or deleted. Examples:
Authorization and Authentication.
servlet A piece of compiled code executable by a Web
server.
Servlet Configurator A utility for configuring all locally
installed servlets.
sibling A child member at the same generation as another
child member and having the same immediate parent. For
example, the members Florida and New York are children
of East and each other's siblings.
Glossary 189

single sign-on Ability to access multiple Oracle's Hyperion
products after a single login using external credentials.
SmartCut A link to a repository item, in URL form.
snapshot Read-only data from a specific time.
SPF files Printer-independent files created by a SQR
Production Reporting server, containing a representation
of the actual formatted report output, including fonts,
spacing, headers, footers, and so on.
Spotlighter A tool that enables color coding based on
selected conditions.
SQL spreadsheet A data object that displays the result set
of a SQL query.
SQR Production Reporting A specialized programming
language for data access, data manipulation, and creating
SQR Production Reporting documents.
stacked charts A chart where the categories are viewed on
top of one another for visual comparison. This type of chart
is useful for subcategorizing within the current category.
Stacking can be used from the Y and Z axis in all chart types
except pie and line. When stacking charts the Z axis is used
as the Fact/Values axis.
Start in Play The quickest method for creating a Web
Analysis document. The Start in Play process requires you
to specify a database connection, then assumes the use of a
spreadsheet data object. Start in Play uses the highest
aggregate members of the time and measures dimensions to
automatically populate the rows and columns axes of the
spreadsheet.
strategic objective (SO) A long-term goal defined by
measurable results. Each strategic objective is associated
with one perspective in the application, has one parent, the
entity, and is a parent to critical success factors or other
strategic objectives.
Strategy map Represents how the organization
implements high-level mission and vision statements into
lower-level, constituent strategic goals and objectives.
structure view Displays a topic as a simple list of
component data items.
Structured Query Language A language used to process
instructions to relational databases.
subscribe Flags an item or folder to receive automatic
notification whenever the item or folder is updated.
Summary chart In the Investigates Section, rolls up detail
charts shown below in the same column, plotting metrics at
the summary level at the top of each chart column.
super service A special service used by the
startCommonServices script to start the RSC services.
target Expected results of a measure for a specified period
of time (day, quarter, etc.,)
time events Triggers for execution of jobs.
time scale Displays metrics by a specific period in time,
such as monthly or quarterly.
token An encrypted identification of one valid user or
group on an external authentication system.
top and side labels Column and row headings on the top
and sides of a Pivot report.
top-level member A dimension member at the top of the
tree in a dimension outline hierarchy, or the first member
of the dimension in sort order if there is no hierarchical
relationship among dimension members. The top-level
member name is generally the same as the dimension name
if a hierarchical relationship exists.
trace level Defines the level of detail captured in the log file.
traffic lighting Color-coding of report cells, or pins based
on a comparison of two dimension members, or on fixed
limits.
transformation (1) Transforms artifacts so that they
function properly in the destination environment after
application migration. (2) In data mining, modifies data
(bidirectionally) flowing between the cells in the cube and
the algorithm.
transparent login Logs in authenticated users without
launching the login screen.
trusted password A password that enables users
authenticated for one product to access other products
without reentering their passwords.
trusted user Authenticated user
user directory A centralized location for user and group
information. Also known as a repository or provider.
190 Glossary

Web server Software or hardware hosting intranet or
Internet Web pages or Web applications.
weight Value assigned to an item on a scorecard that
indicates the relative importance of that item in the
calculation of the overall scorecard score. The weighting of
all items on a scorecard accumulates to 100%. For example,
to recognize the importance of developing new features for
a product, the measure for New Features Coded on a
developer's scorecard would be assigned a higher weighting
than a measure for Number of Minor Defect Fixes.
ws.conf A configuration file for Windows platforms.
wsconf_platform A configuration file for UNIX platforms.
Y axis scale Range of values on Y axis of charts displayed in
Investigate Section. For example, use a unique Y axis scale
for each chart, the same Y axis scale for all Detail charts, or
the same Y axis scale for all charts in the column. Often,
using a common Y axis improves your ability to compare
charts at a glance.
Zero Administration Software tool that identifies version
number of the most up-to-date plug-in on the server.
zoom Sets the magnification of a report. For example,
magnify a report to fit whole page, page width, or percentage
of magnification based on 100%.
ZoomChart Used to view detailed information by
enlarging a chart. Enables you to see detailed numeric
information on the metric that is displayed in the chart.
Glossary 191

192 Glossary
Index
Aaccess multiple POV embedded browsers, 129
option buttons, 129
Bblank component
properties frame, 181summary, 177user interface, 181
build dashboarddrill across, 52webdash builder component, 169
buttonadd, tree limits, 161apply and configure, 12clear, tree limits, 161component toolbar, 14components, 12configuration frames, 15drill and slice, 58expand and collapse, tree limits, 161ignore percentile, 90process, tree limits, 161query limits, 135query panel, 145remove, tree limits, 161
Cchart shade
buttons, 29notes on performance, 31set color palette, 30setting filters, 32summary, 27test cases, 31test results, 32update Interactive Reporting documents, 32
chart spotlightermaps component, 99
checkpoint controlchart shade component, 27drill and slice component, 57format header component, 71graphic gauges component, 78ignore percentile component, 91ignore percentile component, incompatibility, 92tree component, filters, 159, 162
componentbuttons, 12create, 24customize, 21fingerprints, 22functions and method prototypes, 23merge, 10revert to template, 24standard component methods, 24standard methods, 24
component corecustomize, 177
conditional navigation propertiessummary, 33
conditional sub-queriesactivate sub-queries, 39activate sub-queries from custom user events, 39activate sub-queries from primary queries, 39build entry, 40create custom event that executes sub-queries, 42create primary query that executes sub-queries, 40example, 38running sub-queries, custom user event, 39running sub-queries, primary query, 39scheduling documents on server, 43summary, 37
configuration framebuttons, 15
A B C D E F G H I L M O P Q R S T U W
Index 193

configurecomponents
chart shade, 29chart shade set color palette, 30conditional navigation properties, 33conditional sub-queries, 40conditional sub-queries build entry, 40copy scale configure charts, 47drill across, 52drill and slice, 58format header, 73graphic gauges, 80group tabs, 86highlight map features, 100ignore percentile, 90lookup, 94map blank frame, 104metadata dashboards, 109optimizing tree limits for use on EPM
Workspace, 164pivot trees, 119POV, 122query limits, 135quick query limits, 144tree component, 160tree component, compatibility with EPM
Workspace, 164tree component, select query and data model
sections, 163tree limits controls, 162webdash builder component, 166workspace alert, 66
name, urls for dashboards, 124control buttons in quick query limits, 141copy scale
configure charts, 47summary, 45
create POVembedded browsers, 128multiple shared embedded browsers, 130
create spreadsheetdrill across, 53
customizecomponent core
blank component, 177
Ddashboard, self-optimize runtime, 10display
exceptions or alerts, 64drill across. See pivot trees
build dashboards, 52configure, 52create spreadsheet, 53drill to separate tables within the same query, 55drilling operations, 51example, sales and costs dashboards, 50properties configuration frame, 54source and target dashboards, 50summary, 49use pivot trees component as source, 55
drill and sliceassociate charts and pivots, 59buttons, 58configure, 58frames, charts and pivots, 59properties configuration frame, 61rename marker column, 60summary, 57
drill downon limits and filters
tree limits and tree view, 158tree limits and tree view, 157
drill to separate tables within the same querydrill across, 55
drilling operationsdrill across, 51
Eembed
browsers, webdash builder component, 171reports, webdash builder component, 172sections, webdash builder component, 171
embedded browsers, POVaccess multiple, 129create, 128create multiple shared, 130option buttons, 129
exception alertuse onPostProcess() method, 69
exceptions or alertsdisplay, 64
A B C D E F G H I L M O P Q R S T U W
194 Index
Ffavorites, quick query limits, edit, 144filters on queries
improve performancetree limits and tree view, 158
tree limits and tree view, 158Reporting Studio, collect, save, and test urls, 123format header
add text label, 73add to reports, 76configure, 73configure header rule, 74summary, 71
frame prototypesblank map frame, 104
frame_library.bqy, 104drill and slice
frame_library.bqy, 59drillslice_component.bqy, 59maps
frame_library.bqy, 100maps.bqy, 100metadata
frame_library.bqy, 114metadata_component.bqy, 114webdash
frame_library.bqy, 167webdash_template.bqy, 167
framesdrill and slice, 59
functions and method prototypes, 23
Ggraphic gauges
as measures, 78configure, 80create computed column, 81determine value ranges, 81naming, 79paste or duplicate gauges, 82set properties, 83summary, 77visible or invisible, 80
group tabsconfigure, 86summary, 85
Hheader rule, configure, 74
Iignore percentile
button, 90computed items, 91configure, 90incompatibility with checkpoint control, 92summary, 89
importPOV, server names match, 132
Llookup
add and configure table or results section, 96change default columns names mapping provider,
95configure dashboard, 94configure mapping providers, 94escape url, 96incompatibility with EPM Workspace, 97mapping providers, 94reassociate sections using Dashboard Studio, 97select, mapping provider, 94summary, 93
Mmaps
configure blank frame, 104highlight map features, 100
create summary table, 100define computed items, 103spotlighting, 102
summary, 99marker column
drill and slice component, rename, 60merge
component, 10metadata
access using metadata button, 108configure dashboard, 109
add metadata, 114create Interactive Reporting database connection
(oce) with references to metadata, 110create template, 114
A B C D E F G H I L M O P Q R S T U W
Index 195

customize, 112design dashboard using metadata-enhanced
template, 116provide access to metadata, 114update columns on request line, 112update items on filter line, 113
Interactive Reporting database connections, 108summary, 107use, 107
multiple pathstree limits and tree view, 158
multiple treestree limits and tree view, 158
OonPostProcess() method
exception alert, 69options buttons, POV, add, 129orcl_Exceptions.txt. See workspace n alertoutput.properties. See workspace alert
Ppivot trees
build queries, 118create query definition, 117summary, 117
pivot trees component as sourcedrill across, 55
plug-and-play component, create, 24POV
add option buttons, 129collect urls, 122configure, 122embedded browsers, 128import Interactive Reporting documents into EPM
Workspace, 132import, server names match, 132manage url library, 124map url attributes, 128multiple embedded browsers, 129name and configure urls, 124refresh button, 131set url properties, 127shared multiple embedded browsers, 130summary, 121
process
all queriesquick query limits, 154
one or more queriesquick query limits, 154
Qquery limits
button, 135configure, 135configure frame, 136connected queries display as disconnected, 137properties, 136set as startup section, 137summary, 133
query panelbutton, 145quick query limits, 139set as startup section, 154
quick query limitsapply query limits, 140configure, 144configure controls, 147configure frame, 152control buttons and guidelines, 141favorites, 143identify queries, 146multi-selection, 152other controls, 147process queries, 154properties, 152query panel, 139query panel button, 145required query limits properties, 153set query panel as startup section, 154summary, 139
Rrequired query limits
configure frame, 153revert to template, 24runtime
about, 9access metadata component using metadata button,
108conditional sub-queries component
A B C D E F G H I L M O P Q R S T U W
196 Index

activate sub-queries from custom user events,39
activate sub-queries using primary queries, 39conditional sub-queries, activate, 39create, 9self-optimize, 10tree component, 159using chart shade component, 27using copy scale component, 45using drill across component, 50using drill and slice component, 57using format header component, 71using gauges as measures, 78using group tabs component, 85using ignore percentile component, 89using lookup component, 93using maps component, 99using POV component, 121using query limits component, 134using quick query limits component, 139
Ssales and costs dashboards, example
drill across, 50sample
webdashbuilder, 166source and target dashboards
drill across, 50spotlight
chartsdefine color computed items externally, 103define color computed items in the chart
spotlight properties frame, 103standard component methods, 24
Ttemplate, revert, 24toolbar, buttons, 14tree
add tree limits controls, 161add and remove buttons, 161clear button, query limits, 161process button, 161
compatibility with EPM Workspace, 164configure, 160configure tree limits controls, 162
optimizing tree limits for use on EPM Workspace,164
select query and data model sections, 163tree limits controls, 160
display list boxes, 161expand and collapse button, 161list boxes, 160
using tree views, 159filters, 159query limits, 159
tree limits and tree viewdrill down, 157drill down on limits and filters, 158filters on queries, 158multiple paths, 158multiple trees, 158summary, 157Unicode characters, 159
UUnicode characters
tree limits and tree view, 159urls, collect, 122
WWeb Analysis Studio, collect, save, and test urls, 123webdash builder component
add shapes to frame prototypes, 167build dashboard frame, 169create local filters, 169create runtime documents, 173customize with Dashboard Studio, 175design notes, 170embed
browsers, 171reports, 172reports, browsers, shapes, 171sections, 171
include template, 168sample, 166summary, 165verify functionality, 174
EPM Workspaceimport Interactive Reporting documents, POV,
132incompatibility with lookup, 97
A B C D E F G H I L M O P Q R S T U W
Index 197

workspace alertorcl_Exceptions.txt, 68output.properties, 68
A B C D E F G H I L M O P Q R S T U W
198 Index