
Universal transition state scaling relations for (de) hydrogenation over transition metals
6
20760 Phys. Chem. Chem. Phys., 2011, 13, 20760–20765 This journal is c the Owner Societies 2011 Cite this: Phys. Chem. Chem. Phys., 2011, 13, 20760–20765 Universal transition state scaling relations for (de)hydrogenation over transition metalsw S. Wang, a V. Petzold, a V. Tripkovic, a J. Kleis, a J. G. Howalt, ab E. Sku´lason, ac E. M. Ferna´ndez, a B. Hvolbæk, a G. Jones, a A. Toftelund, a H. Falsig, a M. Bjo¨rketun, a F. Studt, d F. Abild-Pedersen, d J. Rossmeisl, a J. K. Nørskov de and T. Bligaard* a Received 28th February 2011, Accepted 21st September 2011 DOI: 10.1039/c1cp20547a We analyse the transition state energies for 249 hydrogenation/dehydrogenation reactions of atoms and simple molecules over close-packed and stepped surfaces and nanoparticles of transition metals using Density Functional Theory. Linear energy scaling relations are observed for the transition state structures leading to transition state scaling relations for all the investigated reactions. With a suitable choice of reference systems the transition state scaling relations form a universality class that can be approximated with one single linear relation describing the entire range of reactions over all types of surfaces and nanoclusters. 1. Introduction Linear energy relations have proven useful in simplifying the theoretical analysis of a number of catalytic reactions, thereby helping to establish an improved understanding of their under- lying trends. 1–3 The linear energy relations in question are especially the so-called Brønsted–Evans–Polanyi (BEP) relations 4–13 describing correlations between transition states and reaction energies, and the adsorbate scaling relations 14 describing correlations between the adsorption energies of adsorbed reaction intermediates containing hydrogen with respect to either C, N, or O. More generalized, the BEP relations can be viewed as resulting from a scaling relation between reaction intermediates and transition states. By combining transition state scaling relations and adsorbate scaling relations the number of individual parameters that needs to be determined in order to describe the energetic trends underlying the kinetics of a complex catalytic reaction can be significantly reduced, and often limited to only one or very few descriptors. Good descriptors are typically adsorption energies of some of the key reactive intermediates, or combinations of these. 15–23 In the present paper we analyse the transition state energies for 249 dehydrogenation reactions of small hydrogen containing molecules over close-packed and stepped surfaces and nano- particles of transition metals using Density Functional Theory (DFT). Linear energy correlations are observed for the transition state structures leading to transition state scaling relations for all the investigated reactions. Upon implementing a suitable choice of reference systems all the transition state scaling relations form a universality class 8,9 in which only one single descriptor can be used to determine the transition state for every reaction over all types of surfaces and nanoclusters. 2. Computational method The calculations were carried out using the DACAPO plane wave Density Functional Theory code. 24 Exchange–correlation effects were described using the RPBE functional 25 with an energy cutoff of 340 eV or more. The ionic cores were described by Vanderbilt ultrasoft pseudopotentials. 26 A slab model with three (or in some cases four) close-packed atomic- layers was chosen to represent the transition metal surfaces describing the close-packed and stepped surfaces. At least one (in some cases two) top layer was fully relaxed and the rest of the metal layers were held at fixed positions. The size of a surface supercell was 2 Â 2 for the close-packed surfaces, and supercell sizes of 1 Â 2, 2 Â 2, and 2 Â 3 were used for the stepped surfaces depending on the size of the adsorbed molecules. The Brillouin zones were sampled using a Center for Atomic-scale Materials Design, Department of Physics, Building 307, Technical University of Denmark, DK-2800 Kgs. Lyngby, Denmark. E-mail: [email protected]; Fax: +45 4593 2399; Tel: +45 4525 3179 b Risø National Laboratory for Sustainable Energy, Materials Research Division, Building 228, Technical University of Denmark, DK-4000 Roskilde, Denmark c Science Institute, VR-III, University of Iceland, IS-107 Reykjavik, Iceland d SUNCAT Center for Interface Science and Catalysis, SLAC National Accelerator Laboratory, 2575 Sand Hill Road, Menlo Park, California 94025, USA e Department of Chemical Engineering, Stanford University, Stanford, CA 94305, USA w Electronic supplementary information (ESI) available. See DOI: 10.1039/c1cp20547a PCCP Dynamic Article Links www.rsc.org/pccp PAPER
-
Upload
independent -
Category
Documents
-
view
3 -
download
0
Transcript of Universal transition state scaling relations for (de) hydrogenation over transition metals

20760 Phys. Chem. Chem. Phys., 2011, 13, 20760–20765 This journal is c the Owner Societies 2011
Cite this: Phys. Chem. Chem. Phys., 2011, 13, 20760–20765
Universal transition state scaling relations for (de)hydrogenation over
transition metalsw
S. Wang,aV. Petzold,
aV. Tripkovic,
aJ. Kleis,
aJ. G. Howalt,
abE. Skulason,
ac
E. M. Fernandez,aB. Hvolbæk,
aG. Jones,
aA. Toftelund,
aH. Falsig,
a
M. Bjorketun,aF. Studt,
dF. Abild-Pedersen,
dJ. Rossmeisl,
aJ. K. Nørskov
deand
T. Bligaard*a
Received 28th February 2011, Accepted 21st September 2011
DOI: 10.1039/c1cp20547a
We analyse the transition state energies for 249 hydrogenation/dehydrogenation reactions of
atoms and simple molecules over close-packed and stepped surfaces and nanoparticles of
transition metals using Density Functional Theory. Linear energy scaling relations are observed
for the transition state structures leading to transition state scaling relations for all the
investigated reactions. With a suitable choice of reference systems the transition state scaling
relations form a universality class that can be approximated with one single linear relation
describing the entire range of reactions over all types of surfaces and nanoclusters.
1. Introduction
Linear energy relations have proven useful in simplifying the
theoretical analysis of a number of catalytic reactions, thereby
helping to establish an improved understanding of their under-
lying trends.1–3 The linear energy relations in question are
especially the so-called Brønsted–Evans–Polanyi (BEP)
relations4–13 describing correlations between transition states
and reaction energies, and the adsorbate scaling relations14
describing correlations between the adsorption energies of
adsorbed reaction intermediates containing hydrogen with
respect to either C, N, or O. More generalized, the BEP
relations can be viewed as resulting from a scaling relation
between reaction intermediates and transition states. By
combining transition state scaling relations and adsorbate
scaling relations the number of individual parameters that
needs to be determined in order to describe the energetic
trends underlying the kinetics of a complex catalytic reaction
can be significantly reduced, and often limited to only one or
very few descriptors. Good descriptors are typically adsorption
energies of some of the key reactive intermediates, or
combinations of these.15–23
In the present paper we analyse the transition state energies
for 249 dehydrogenation reactions of small hydrogen containing
molecules over close-packed and stepped surfaces and nano-
particles of transition metals using Density Functional Theory
(DFT). Linear energy correlations are observed for the transition
state structures leading to transition state scaling relations for
all the investigated reactions. Upon implementing a suitable
choice of reference systems all the transition state scaling
relations form a universality class8,9 in which only one single
descriptor can be used to determine the transition state for
every reaction over all types of surfaces and nanoclusters.
2. Computational method
The calculations were carried out using the DACAPO plane
wave Density Functional Theory code.24 Exchange–correlation
effects were described using the RPBE functional25 with an
energy cutoff of 340 eV or more. The ionic cores were
described by Vanderbilt ultrasoft pseudopotentials.26 A slab
model with three (or in some cases four) close-packed atomic-
layers was chosen to represent the transition metal surfaces
describing the close-packed and stepped surfaces. At least one
(in some cases two) top layer was fully relaxed and the rest of
the metal layers were held at fixed positions. The size of a
surface supercell was 2 � 2 for the close-packed surfaces, and
supercell sizes of 1 � 2, 2 � 2, and 2 � 3 were used for the
stepped surfaces depending on the size of the adsorbed
molecules. The Brillouin zones were sampled using
a Center for Atomic-scale Materials Design, Department of Physics,Building 307, Technical University of Denmark, DK-2800 Kgs.Lyngby, Denmark. E-mail: [email protected];Fax: +45 4593 2399; Tel: +45 4525 3179
bRisø National Laboratory for Sustainable Energy, MaterialsResearch Division, Building 228, Technical University of Denmark,DK-4000 Roskilde, Denmark
c Science Institute, VR-III, University of Iceland, IS-107 Reykjavik,Iceland
d SUNCAT Center for Interface Science and Catalysis, SLACNational Accelerator Laboratory, 2575 Sand Hill Road,Menlo Park, California 94025, USA
eDepartment of Chemical Engineering, Stanford University, Stanford,CA 94305, USAw Electronic supplementary information (ESI) available. See DOI:10.1039/c1cp20547a
PCCP Dynamic Article Links
www.rsc.org/pccp PAPER

This journal is c the Owner Societies 2011 Phys. Chem. Chem. Phys., 2011, 13, 20760–20765 20761
Monkhorst-Pack k-point meshes of 4 � 4 � 1 points or
denser.27 For the M12 nanoparticles, all the 12 atoms were
fixed, while the adsorbates were allowed to relax. The M12
cluster was fixed in a planar structure identical to the geometry
used in a recent study on CO oxidation.18 The calculations on
the M12 nanoparticles were carried out using only the gamma-
point. The transition state energies were calculated using either
a bond stretching method28 or the nudged elastic band method
which can be combined with the climbing image method to
precisely determine the maximum barrier.29 Several pathways
were tested for each reaction step and in this paper we only
report the first order saddle points corresponding to the lowest
barrier. The maximum coverage on the active site was one half.
The convergence with respect to, number of layers, cutoff
energy, and k-point sampling has been studied elsewhere30 and
we refer to this work for a more detailed evaluation of the
accuracy of the data presented in this paper.
3. Results and discussion
A diagram explaining the reference energy levels used in the
transition state scaling relations and in the Brønsted–Evans–
Polanyi (BEP) relations for the dehydrogenation/hydrogenation
processes is presented in Scheme 1. The transition state scaling
relations are based on the transition state energy, Ets, and the
final state energy Ediss, with respect to the gas phase species31
CH4, NH3, H2O and H2, see Scheme 1A. Whereas the BEP
relation is based on the reaction energy, DEdiss, which is the
energy difference between the initial and the final state, while
the activation barrier, DEadiss, is the energy based on the
difference in energy between the initial state and the transition
state. This can be seen in Scheme 1B.
Fig. 1 shows a universal transition state (TS) scaling relation
for a series of dehydrogenation reactions over a wide range of
transition metal surfaces, such as close-packed and stepped
surfaces and nanoparticles. The fitted data for the transition
state scaling relations for all the dehydrogenation reactions are
presented in Table 1. Here the data have been arranged in
categories of individual, classes, groups and overall. The
individual fit is based on only one type of reaction on one
surface type, the class is based on a specific reaction on all the
types of surfaces, the grouped data are for all data containing
either nitrogen, carbon or oxygen, and lastly the overall fit is
based on all reactions on all types of surfaces.
The mean absolute error (MAE) of the fitted line in Fig. 1 is
0.28 eV. The correlation is certainly not perfect, and compared
to so-called ‘‘chemical accuracy’’ which is typically defined as
1 kcal mole�1 or approximately 40 meV, the error on a
prediction based on using the linear relation shown in Fig. 1
will have a typical error one order of magnitude larger. The
prediction error, however, has to be seen in the light of how
well a typical GGA exchange–correlation functional can
describe the reaction and transition state energies. The error
in currently employed exchange–correlation functionals could
easily be of the same size as the error from predictions based
on the transition state scaling relations. The errors in the
presented relation are certainly small enough to rapidly
produce a first rough estimation of activation barriers for
hydrogenation/dehydrogenation reactions. The universal TS
scaling relation relates the energies of transition states with
final states of dehydrogenation reactions.13 Such correlation
originates from the geometrical similarity of the structures of
transition states and final states.8
Fig. 1 collects different types of dehydrogenation reactions
on transition metal surfaces and clusters. The deviation of the
Scheme 1 The definition of energies used in this paper for the
hydrogenation/dehydrogenation processes. All energies are with
respect to the gas phase molecules of CH4, NH3, H2O, and H2.
Top-view. (A) The transition state (TS) scaling relation are based upon
the energies given by the two blue arrows denoted as Ets for the transition
state energy and Ediss for the final state energy. Bottom-view. (B) The
Brønsted–Evans–Polanyi (BEP) relations use another reference energy.
The BEP relations are based upon the activation barrier DEadiss/ass and the
reaction energy DEdiss/ass as defined in the bottom panel.
Fig. 1 Transition state energies plotted against dissociation energies
with respect to energies of gas-phase CH4, H2O, NH3, and H2. The
fully filled symbols refer to dissociation over close-packed surfaces,
and the half-filled symbols refer to dissociation over stepped surfaces
and OOHx species have been dissociated on a M12 nanocluster. The
colors represent the different hydrogen content in the molecules, where
black is the first dehydrogenation step, red is the second step, green is
the third step, and blue is the fourth dehydrogenation step.

20762 Phys. Chem. Chem. Phys., 2011, 13, 20760–20765 This journal is c the Owner Societies 2011
points comes predominantly from the difference of the structures
of the reactions. As expected from Table 1, the MAE becomes
smaller when we look into a certain reaction or a series of
similar reactions, since the structures are more similar to each
other. The MAE is typically smaller than 0.15 eV for an
individual reaction over a given geometry of an active surface
site, as evidenced in Table 1. When looking at several reactions
simultaneously or several surface geometries, the uncertainty
of a prediction made from their common linear regression fit
will generally increase, but in all cases stays below 0.3 eV. It is
therefore useful to see Table 1 as a hierarchy of accuracy that
allows treating a particular reaction more accurately if it
resembles one of the specifically presented reactions, whereas
the overall universal TS scaling can be used for a general
hydrogen bond breaking reaction which has not been specifi-
cally treated in this study.
Fig. 2 shows the BEP relations of the whole set of
dehydrogenation reactions. The MAE of 0.27 eV is close to
that of the above-discussed universal TS scaling relation. The
practical performance of these two relations with respect to
estimation of activation energies should be very similar, based
on the fact that their MAEs are very close.
Although the universal BEP relation in Fig. 2 may at a first
glance look less presentable than the universal TS scaling
relation, we would like to emphasize several merits of it. The
first merit of BEP relations is of course the clear trend reflected
by the relations. Since activation energies and reaction
Table 1 The fitted parameters of the transition state scaling relations with respect to energies of gas-phase CH4, H2O, NH3, and H2
Reaction Surface Slope Constant/eV MAE/eV
H2O(g) + 2* - OH* + H* Close packed 0.47 � 0.10 0.99 � 0.07 0.20Step 0.77 � 0.02 0.95 � 0.04 0.17All 0.58 � 0.05 0.94 � 0.04 0.16
OH* + * - O* + H* Close packed 0.75 � 0.03 1.32 � 0.04 0.12Step 0.63 � 0.03 0.92 � 0.03 0.21All 0.78 � 0.03 1.13 � 0.05 0.20
Water group All 0.74 � 0.03 1.06 � 0.04 0.20NH3* + * - NH2* + H* Close packed 0.57 � 0.09 0.95 � 0.11 0.24
Step 0.69 � 0.05 1.45 � 0.07 0.14All 0.59 � 0.06 1.19 � 0.09 0.23
NH2* + * - NH* + H* Close packed 0.81 � 0.03 1.26 � 0.05 0.15Step 0.78 � 0.04 1.41 � 0.05 0.16All 0.79 � 0.03 1.32 � 0.04 0.16
NH* + * - N* + H* Close packed 0.92 � 0.04 1.09 � 0.08 0.12Step 0.91 � 0.04 1.41 � 0.09 0.17All 0.87 � 0.03 1.34 � 0.07 0.19
Ammonia group All 0.82 � 0.02 1.33 � 0.04 0.24CH4(g) + 2* - CH3* + H* Close packed 0.67 � 0.11 1.04 � 0.10 0.19
Step 0.64 � 0.09 1.01 � 0.07 0.19All 0.67 � 0.06 1.03 � 0.05 0.18
CH3* + * - CH2* + H* Close packed 0.92 � 0.05 0.80 � 0.08 0.11Step 0.86 � 0.03 0.78 � 0.05 0.09All 0.89 � 0.03 0.79 � 0.05 0.11
CH2* + * - CH* + H* Close packed 0.94 � 0.02 1.02 � 0.07 0.20Step 0.88 � 0.06 1.22 � 0.11 0.22All 0.90 � 0.04 1.20 � 0.10 0.27
CH* + * - C* + H* Close packed 1.00 � 0.03 0.72 � 0.06 0.16Step 0.88 � 0.07 1.29 � 0.17 0.26All 0.92 � 0.04 1.02 � 0.08 0.23
C2H6(g) + 2* - C2H5* + H* Step 0.85 � 0.03 0.87 � 0.05 0.14C2H5* + * - C2H4* + H* Step 0.99 � 0.10 0.77 � 0.20 0.11C2H4* + * - C2H3* + H* Step 0.92 � 0.11 1.57 � 0.31 0.18C3H8(g) + 2* - C3H7* + H* Step 0.76 � 0.06 1.49 � 0.13 0.08C3H6* + * - C3H5* + H* Step 1.04 � 0.04 1.03 � 0.13 0.07Hydrocarbon group All 0.95 � 0.02 0.97 � 0.04 0.25H2(g) + 2* - 2H* Close packed 0.67 � 0.06 0.69 � 0.04 0.08
Step 0.54 � 0.14 0.60 � 0.08 0.11All 0.61 � 0.07 0.65 � 0.04 0.10
All All 0.86 � 0.01 1.14 � 0.02 0.28
Fig. 2 Activation energies, DEadiss, plotted against reaction energies,
DEdiss, of the dehydrogenation reactions. The fully filled symbols refer
to data on close-packed surfaces, and the half filled symbols mean the data
on step surfaces. The colors represent the different hydrogen content in the
molecules, where black is the first dehydrogenation step, red is the second
step, green is the third step and blue is the fourth dehydrogenation step.
This journal is c the Owner Societies 2011 Phys. Chem. Chem. Phys., 2011, 13, 20760–20765 20763
energies are typical experimentally measured properties for the
analysis of catalytic reactions, rather than the transition state
total energies and final state total energies with respect to a gas
phase reference it may also be easier to correlate theory and
experiments using the BEP relations. The TS scaling relations
are (in the present study) based on the structural similarities of
the transition states and the final states of a reaction. Such
direct similarity between states generally only holds for a
limited range of surface reactivity. On the late transition
metals there will be a tendency towards having late transition
states, and over the early transition metals the transition states
will also be earlier. The TS scaling relations (in the form
presented above) will thus have a relatively larger MAE when
applied to reactions over early transition metals. Therefore it
makes more sense to use the TS scaling relations in the
presented form for reactions over surfaces of a rather similar
reactivity. The BEP relations correlate the activation barrier
with contributions from both initial and final states. Therefore
the BEP relations tend to be valid for the catalytic reactions in
a larger window of variation of the surface reactivity. The shift
in similarity of the transition state structures with initial and
final states thus gives rise to a slightly v-shaped distribution of
errors in Fig. 1, whereas the noise distribution is more homo-
geneous in Fig. 2.
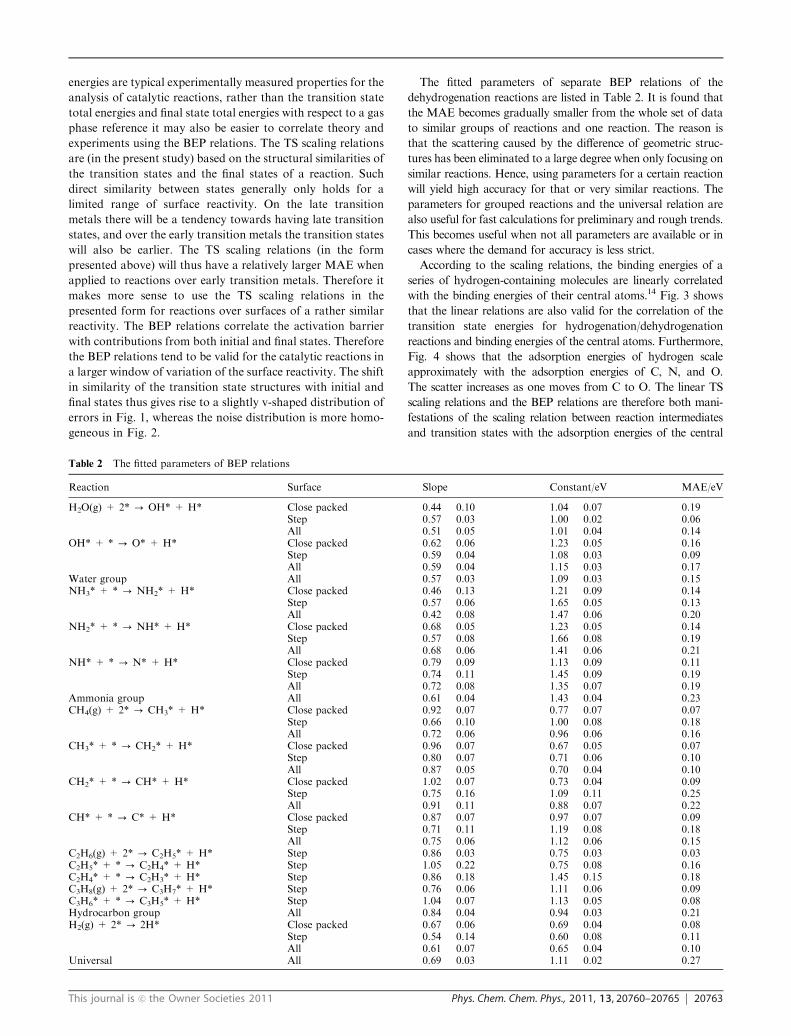
The fitted parameters of separate BEP relations of the
dehydrogenation reactions are listed in Table 2. It is found that
the MAE becomes gradually smaller from the whole set of data
to similar groups of reactions and one reaction. The reason is
that the scattering caused by the difference of geometric struc-
tures has been eliminated to a large degree when only focusing on
similar reactions. Hence, using parameters for a certain reaction
will yield high accuracy for that or very similar reactions. The
parameters for grouped reactions and the universal relation are
also useful for fast calculations for preliminary and rough trends.
This becomes useful when not all parameters are available or in
cases where the demand for accuracy is less strict.
According to the scaling relations, the binding energies of a
series of hydrogen-containing molecules are linearly correlated
with the binding energies of their central atoms.14 Fig. 3 shows
that the linear relations are also valid for the correlation of the
transition state energies for hydrogenation/dehydrogenation
reactions and binding energies of the central atoms. Furthermore,
Fig. 4 shows that the adsorption energies of hydrogen scale
approximately with the adsorption energies of C, N, and O.
The scatter increases as one moves from C to O. The linear TS
scaling relations and the BEP relations are therefore both mani-
festations of the scaling relation between reaction intermediates
and transition states with the adsorption energies of the central
Table 2 The fitted parameters of BEP relations
Reaction Surface Slope Constant/eV MAE/eV
H2O(g) + 2* - OH* + H* Close packed 0.44 � 0.10 1.04 � 0.07 0.19Step 0.57 � 0.03 1.00 � 0.02 0.06All 0.51 � 0.05 1.01 � 0.04 0.14
OH* + * - O* + H* Close packed 0.62 � 0.06 1.23 � 0.05 0.16Step 0.59 � 0.04 1.08 � 0.03 0.09All 0.59 � 0.04 1.15 � 0.03 0.17
Water group All 0.57 � 0.03 1.09 � 0.03 0.15NH3* + * - NH2* + H* Close packed 0.46 � 0.13 1.21 � 0.09 0.14
Step 0.57 � 0.06 1.65 � 0.05 0.13All 0.42 � 0.08 1.47 � 0.06 0.20
NH2* + * - NH* + H* Close packed 0.68 � 0.05 1.23 � 0.05 0.14Step 0.57 � 0.08 1.66 � 0.08 0.19All 0.68 � 0.06 1.41 � 0.06 0.21
NH* + * - N* + H* Close packed 0.79 � 0.09 1.13 � 0.09 0.11Step 0.74 � 0.11 1.45 � 0.09 0.19All 0.72 � 0.08 1.35 � 0.07 0.19
Ammonia group All 0.61 � 0.04 1.43 � 0.04 0.23CH4(g) + 2* - CH3* + H* Close packed 0.92 � 0.07 0.77 � 0.07 0.07
Step 0.66 � 0.10 1.00 � 0.08 0.18All 0.72 � 0.06 0.96 � 0.06 0.16
CH3* + * - CH2* + H* Close packed 0.96 � 0.07 0.67 � 0.05 0.07Step 0.80 � 0.07 0.71 � 0.06 0.10All 0.87 � 0.05 0.70 � 0.04 0.10
CH2* + * - CH* + H* Close packed 1.02 � 0.07 0.73 � 0.04 0.09Step 0.75 � 0.16 1.09 � 0.11 0.25All 0.91 � 0.11 0.88 � 0.07 0.22
CH* + * - C* + H* Close packed 0.87 � 0.07 0.97 � 0.07 0.09Step 0.71 � 0.11 1.19 � 0.08 0.18All 0.75 � 0.06 1.12 � 0.06 0.15
C2H6(g) + 2* - C2H5* + H* Step 0.86 � 0.03 0.75 � 0.03 0.03C2H5* + * - C2H4* + H* Step 1.05 � 0.22 0.75 � 0.08 0.16C2H4* + * - C2H3* + H* Step 0.86 � 0.18 1.45 � 0.15 0.18C3H8(g) + 2* - C3H7* + H* Step 0.76 � 0.06 1.11 � 0.06 0.09C3H6* + * - C3H5* + H* Step 1.04 � 0.07 1.13 � 0.05 0.08Hydrocarbon group All 0.84 � 0.04 0.94 � 0.03 0.21H2(g) + 2* - 2H* Close packed 0.67 � 0.06 0.69 � 0.04 0.08
Step 0.54 � 0.14 0.60 � 0.08 0.11All 0.61 � 0.07 0.65 � 0.04 0.10
Universal All 0.69 � 0.03 1.11 � 0.02 0.27

20764 Phys. Chem. Chem. Phys., 2011, 13, 20760–20765 This journal is c the Owner Societies 2011
atoms (those atoms in contact with the surface). Because the
transition state for dehydrogenation reactions is very similar over
close-packed and stepped surfaces or a nanoparticle, there is no
major geometrical effect for the single TS scaling relation and the
BEP relation for all treated hydrogenation/dehydrogenation steps,
and all points fall on one line in Fig. 2. For a single reaction,
however, there can be a significant electronic effect going from a
close-packed surface to a more under-coordinated surface, such as
a step or a nanocluster. This is a particular feature of hydro-
genation/dehydrogenation reactions and somewhat different
from many other bond-breaking reactions on transition metal
surfaces, where steps are typically many orders of magnitude
more reactive than the close-packed surfaces.10,32
If we now more generally consider a transition state scaling
relation to represent a general correlation between the energy of
the transition state and some combination of relevant adsorption
energies, then the BEP relation is one such particular choice of
linear combination of the relevant adsorption energies. One may
then well ask the question: ‘‘what linear combination of relevant
energies of adsorption intermediates is the best representation of
a given reaction?’’ This question we shall attempt to address in a
subsequent piece of work based on a statistical viewpoint.33
Conclusions
We have presented a universal transition state scaling relation
for dehydrogenation reactions over close-packed and stepped
surfaces as well as nanoparticles of transition metals. One
Fig. 3 The transition state energies of dehydrogenation reactions
plotted against the adsorption energies of (a) O, (b) N and (c) C with
respect to their gas-phase energies. The black and red colors indicate
the results on close-packed and step surfaces respectively.
Fig. 4 The adsorption energies of H plotted against the adsorption
energies of (a) O, (b) N and (c) C with respect to their gas-phase energies.

This journal is c the Owner Societies 2011 Phys. Chem. Chem. Phys., 2011, 13, 20760–20765 20765
simple relation is demonstrated to cover a very broad class of
hydrogenation/dehydrogenation surface chemistry over
transition metals, since all of the investigated reactions, metals,
and surface geometries can be reasonably well approximated by
one universal linear transition state scaling relation. This holds
promise that in the future the search for new hydrogenation
catalysts may be facilitated by the fact that a first rough initial
screening can be carried out based on this general linear energy
relation without the need for performing full DFT calculations.
Together with the adsorbate scaling relations for various reaction
intermediates, the universal BEP relation for (de)hydrogenation
reactions can become a tool with predictive power and give a fast
and semi-accurate first-hand knowledge for a number of catalytic
reactions which can then subsequently be analyzed in greater
detail.
Acknowledgements
The Center for Atomic-scale Materials Design is funded by
The Lundbeck Foundation. The SUNCAT Center for
Interface Science and Catalysis at SLAC is funded by the
U.S. Department of Energy. We thank the Danish Center for
Scientific Computing (DCSC) and the Catalysis for Sustainable
Energy (CASE) initiative funded through the Danish Ministry
of Science, Technology, and Innovation for financial support.
Notes and references
1 J. K. Nørskov, T. Bligaard, J. Rossmeisl and C. H. Christensen,Nat. Chem., 2009, 1, 37.
2 J. K. Nørskov, F. Abild-Pedersen, F. Studt and T. Bligaard, Proc.Natl. Acad. Sci. U. S. A., 2011, 108, 937.
3 M. Neurock, Ind. Eng. Chem. Res., 2010, 49, 10183.4 M. G. Evans and M. Polanyi, Trans. Faraday Soc., 1938, 34, 11.5 V. Pallassana and M. Neurock, J. Catal., 2000, 191, 301.6 Z.-P. Liu and P. Hu, J. Chem. Phys., 2001, 114, 8244.7 A. Logadottir, T. H. Rod, J. K. Nørskov, B. Hammer and C. J.H. Jacobsen, J. Catal., 2001, 197, 229.
8 J. K. Nørskov, T. Bligaard, A. Logadottir, S. R. Bahn,L. B. Hansen, M. V. Bollinger, H. S. Bengaard, B. Hammer,Z. Sljivancanin, M. Mavrikakis, Y. Xu, S. Dahl and C. J.H. Jacobson, J. Catal., 2002, 209, 275.
9 A. Michaelides, Z.-P. Liu, C. J. Zhang, A. Alavi, D. A. King andP. Hu, J. Am. Chem. Soc., 2003, 125, 3704.
10 S. Wang, B. Temel, J. Shen, G. Jones, L. C. Grabow, F. Studt,T. Bligaard, F. Abild-Pedersen, C. H. Christensen andJ. K. Nørskov, Catal. Lett., 2011, 141, 370.
11 P. Crawford, B. McAllister and P. Hu, J. Phys. Chem. C, 2009,113, 5222.
12 J. Cheng, P. Hu, P. Ellis, S. French, G. Kelly and C. M. Lok,J. Phys. Chem. C, 2008, 112, 1308.
13 D. Loffreda, F. Delbecq, F. Vigne and P. Sautet, Angew. Chem.,Int. Ed., 2009, 48, 4978.
14 F. Abild-Pedersen, J. Greeley, F. Studt, J. Rossmeisl,T. R. Munter, P. G. Moses, E. Skulason, T. Bligaard andJ. K. Nørskov, Phys. Rev. Lett., 2007, 99, 016105.
15 F. Studt, F. Abild-Pedersen, T. Bligaard, R. Z. Sørensen,C. H. Christensen and J. K. Nørskov, Science, 2008, 320, 1320.
16 M. P. Andersson, T. Bligaard, A. Kustov, K. E. Larsen, J. Greeley,T. Johannessen, C. H. Christensen and J. K. Nørskov, J. Catal.,2006, 239, 501.
17 G. Jones, J. G. Jakobsen, S. S. Shim, J. Kleis, M. P. Andersson,J. Rossmeisl, F. Abild-Pedersen, T. Bligaard, S. Helveg,B. Hinnemann, J. R. Rostrup-Nielsen, I. Chorkendorff,J. Sehested and J. K. Nørskov, J. Catal., 2008, 259, 147.
18 H. Falsig, B. Hvolbæk, I. S. Kristensen, T. Jiang, T. Bligaard,C. H. Christensen and J. K. Nørskov, Angew. Chem., Int. Ed.,2008, 47, 4835.
19 A. Hellman, E. J. Baerends, M. Biczysko, T. Bligaard,C. H. Christensen, D. C. Clary, S. Dahl, R. van Harrevelt,K. Honkala, H. Jonsson, G. J. Kroes, M. Luppi, U. Manthe,J. K. Nørskov, R. A. Olsen, J. Rossmeisl, E. Skulason,C. S. Tautermann, A. J. C. Varandas and J. K. Vincent, J. Phys.Chem. B, 2006, 110, 17719.
20 P. Ferrin, D. Simonetti, S. Kandoi, E. Kunkes, J. A. Dumesic,J. K. Nørskov and M. Mavrikakis, J. Am. Chem. Soc., 2009,131, 5809.
21 G. A. Somorjai and Y. Li, Top. Catal., 2010, 53, 311.22 N. Schumacher, A. Boisen, S. Dahl, A. A. Gokhale, S. Kandoi,
L. C. Grabow, J. A. Dumesic, M. Mavrikakis and I. Chorkendorff,J. Catal., 2005, 229, 265.
23 J. Cheng and P. Hu, J. Am. Chem. Soc., 2008, 130, 10868.24 The Dacapo plane wave/pseudopotential DFT code is available as
open source software at http://wiki.fysik.dtu.dk/dacapo.25 B. Hammer, L. B. Hansen and J. K. Nørskov, Phys. Rev. B:
Condens. Matter Mater. Phys., 1999, 59, 7413.26 D. Vanderbilt, Phys. Rev. B: Condens. Matter, 1990, 41, 7892.27 H. J. Monkhorst and S. D. Pack, Phys. Rev. B: Solid State, 1976,
13, 5188.28 M. P. Andersson, F. Abild-Pedersen, I. N. Remediakis,
T. Bligaard, G. Jones, J. Engbæk, O. Lytken, S. Horch,J. H. Nielsen, J. Sehested, J. R. Rostrup-Nielson, J. K. Nørskovand I. Chorkendorff, J. Catal., 2008, 255, 6.
29 G. Henkelman and H. Jonsson, J. Chem. Phys., 2000, 113, 9978.30 F. Abild-Pedersen and M. P. Andersson, Surf. Sci., 2007,
601, 1747.31 R. Alcala, M. Mavrikakis and J. A. Dumesic, J. Catal., 2003,
218, 178.32 J. K. Nørskov, T. Bligaard, B. Hvolbæk, F. Abild-Pedersen,
I. Chorkendorff and C. H. Christensen, Chem. Soc. Rev., 2008,37, 2163.
33 T. Bligaard, et al., in preparation.