
Neighbourhoods in Transition - OAPEN Library
257
The Urban Book Series Emmanuel Rey Martine Laprise Sophie Lufkin Neighbourhoods in Transition Brownfield Regeneration in European Metropolitan Areas
-
Upload
khangminh22 -
Category
Documents
-
view
2 -
download
0
Transcript of Neighbourhoods in Transition - OAPEN Library
The Urban Book Series
Emmanuel ReyMartine LapriseSophie Lufkin
Neighbourhoods in TransitionBrownfield Regeneration in European Metropolitan Areas
The Urban Book Series
Editorial Board
Margarita Angelidou, Aristotle University of Thessaloniki, Thessaloniki, Greece
Fatemeh Farnaz Arefian, The Bartlett Development Planning Unit, UCL, SilkCities, London, UK
Michael Batty, Centre for Advanced Spatial Analysis, UCL, London, UK
Simin Davoudi, Planning & Landscape Department GURU, Newcastle University,Newcastle, UK
Geoffrey DeVerteuil, School of Planning and Geography, Cardiff University,Cardiff, UK
Paul Jones, School of Architecture, Design and Planning, University of Sydney,Sydney, NSW, Australia
Andrew Kirby, New College, Arizona State University, Phoenix, AZ, USA
Karl Kropf, Department of Planning, Headington Campus, Oxford BrookesUniversity, Oxford, UK
Karen Lucas, Institute for Transport Studies, University of Leeds, Leeds, UK
Marco Maretto, DICATeA, Department of Civil and Environmental Engineering,University of Parma, Parma, Italy
Ali Modarres, Tacoma Urban Studies, University of Washington Tacoma, Tacoma,WA, USA
Fabian Neuhaus, Faculty of Environmental Design, University of Calgary, Calgary,AB, Canada
Steffen Nijhuis, Architecture and the Built Environment, Delft University ofTechnology, Delft, The Netherlands
Vitor Manuel Aráujo de Oliveira , Porto University, Porto, Portugal
Christopher Silver, College of Design, University of Florida, Gainesville, FL, USA
Giuseppe Strappa, Facoltà di Architettura, Sapienza University of Rome, Rome,Roma, Italy
Igor Vojnovic, Department of Geography, Michigan State University, East Lansing,MI, USA
Jeremy W. R. Whitehand, Earth & Environmental Sciences, University ofBirmingham, Birmingham, UK
Claudia Yamu, Department of Spatial Planning and Environment, University ofGroningen, Groningen, Groningen, The Netherlands

The Urban Book Series is a resource for urban studies and geography researchworldwide. It provides a unique and innovative resource for the latest developmentsin the field, nurturing a comprehensive and encompassing publication venue forurban studies, urban geography, planning and regional development.
The series publishes peer-reviewed volumes related to urbanization, sustain-ability, urban environments, sustainable urbanism, governance, globalization, urbanand sustainable development, spatial and area studies, urban management, transportsystems, urban infrastructure, urban dynamics, green cities and urban landscapes. Italso invites research which documents urbanization processes and urban dynamicson a national, regional and local level, welcoming case studies, aswell as comparativeand applied research.
The series will appeal to urbanists, geographers, planners, engineers, architects,policymakers, and to all of those interested in a wide-ranging overview of contempo-rary urban studies and innovations in the field. It acceptsmonographs, edited volumesand textbooks.
Indexed by Scopus.
More information about this series at http://www.springer.com/series/14773

Emmanuel Rey · Martine Laprise · Sophie Lufkin
Neighbourhoodsin TransitionBrownfield Regeneration in EuropeanMetropolitan Areas

Emmanuel ReyLAST, École polytechnique fédérale deLausanneLausanne, Switzerland
Sophie LufkinLAST, École polytechnique fédérale deLausanneLausanne, Switzerland
Martine LapriseLAST, École polytechnique fédérale deLausanneLausanne, Switzerland
ISSN 2365-757X ISSN 2365-7588 (electronic)The Urban Book SeriesISBN 978-3-030-82207-1 ISBN 978-3-030-82208-8 (eBook)https://doi.org/10.1007/978-3-030-82208-8
© The Editor(s) (if applicable) and The Author(s) 2022. This book is an open access publication.OpenAccess This book is licensed under the terms of the Creative Commons Attribution 4.0 InternationalLicense (http://creativecommons.org/licenses/by/4.0/), which permits use, sharing, adaptation, distribu-tion and reproduction in any medium or format, as long as you give appropriate credit to the originalauthor(s) and the source, provide a link to the Creative Commons license and indicate if changes weremade.The images or other third party material in this book are included in the book’s Creative Commons license,unless indicated otherwise in a credit line to the material. If material is not included in the book’s CreativeCommons license and your intended use is not permitted by statutory regulation or exceeds the permitteduse, you will need to obtain permission directly from the copyright holder.The use of general descriptive names, registered names, trademarks, service marks, etc. in this publicationdoes not imply, even in the absence of a specific statement, that such names are exempt from the relevantprotective laws and regulations and therefore free for general use.The publisher, the authors and the editors are safe to assume that the advice and information in this bookare believed to be true and accurate at the date of publication. Neither the publisher nor the authors orthe editors give a warranty, expressed or implied, with respect to the material contained herein or for anyerrors or omissions that may have been made. The publisher remains neutral with regard to jurisdictionalclaims in published maps and institutional affiliations.
This Springer imprint is published by the registered company Springer Nature Switzerland AGThe registered company address is: Gewerbestrasse 11, 6330 Cham, Switzerland
Foreword
The regeneration of urban brownfields to help controlling urban sprawl in citiesand metropolitan areas has been a subject of interest for a while. Most examplesand studies have focused on contaminated and degraded soil remediation, greeninfrastructures or heritage preservation. However, the integration of sustainabilityaspects during the regeneration process to deliver successful neighbourhoods in aholisticwaywith priority given to thequality of life of its inhabitants has hadvery littleattention. The subject is complex, involves many actors and can be long enduring.Moreover, there is a lack of decision-making methodologies helping to integratesustainability criteria.
This book addresses these issues and proposes a comprehensive approachin support to the regeneration of urban brownfield into liveable and enjoyablehealthy urban neighbourhoods, contributing to the urban sustainability transitionof metropolitan areas in Europe.
Sustainability can encompass a very broad scope. In this book sustainabilityaddresses environmental, sociocultural, economic and quality issues, which includeaspects dealing with the local context and the design project, but also with gover-nance, such as management, processes, and participation. The contextual aspectsinclude issues related to the local climate, air quality, accessibility and mobility,population density, proximity to essential facilities, green areas and outdoor spacesas well as the provision of local jobs. The aspects related to the design project addressthose linked to urban life qualities, such as health and well-being, social integration,security, good access to services and considerations with low-carbon construction,clean energy sources and operational costs, among other.
The book is carefully organized in eleven chapters. After a concise introduction,the following three chapters focus on urban brownfields, with discussions on its defi-nition, origin and variety, on its potential, complexities and issues, as well as on thechallenges to integrating sustainability considerations. The next three chapters dealwith neighbourhoods and the regeneration strategies and processes at the architec-tural scale and also address issues related to inhabitants’ awareness and participation.The last three chapters before the conclusion concentrate on sustainability assessmentapproaches and provide a useful and innovative multi-criteria evaluation and opera-tional monitoring tool based on an indicator system to help with decision-making.
v
vi Foreword
The application of this tool was tested in real case studies in three selected neighbour-hoods in Liège (Belgium), Yverdon-les-Bains (Switzerland) and Besanҫon (France)and the outcomes of the latter case study are also presented and discussed.
In the current challenging scenario of a pandemic with continuous lockdownspeople have been temporarily prevented from entering or leaving a restricted area. Itis clear that our lives have been limited to our nearest neighbourhood and these havebeen more important now than ever before. Luckily, we were all well equipped totake on such a challenge; our mobiles, the internet, online storage, new digital waysof communication and meeting virtually, all these technologies allowed us to work,teach and learn, attend cultural events, socialize, and shop from home. However,the local urban realm was still fundamental for our healthy strolls, weekly exercise,daily dog walking and essential shopping. It has been the engagement of people inneighbourhoods and the spirit of local communities that have supported those mostvulnerable living around us. As these scenarios may stay with us for a while, I thinkthere is no better time to bring a subject like the one in this book and to disseminatea multi-criteria evaluation tool to help us making informed decisions as soon aspossible when dealing with these projects.
I am certain “Neighbourhoods in Transition” will provide inspiration and adviceto a wide variety of an audience, in particular those responsible for shaping ourbuilt environment. I am also confident that the decision-making tool here presentedwill be useful to all those involved in regeneration processes, including designers,researchers, students, public authorities, developers, investors, and local communi-ties. I hope the valuable contribution of this book can steer the conversation on urbanregeneration forward and help on the transformation of our cities and neighbour-hoods into more sustainable and resilient, healthier and more attractive places tolive, work, socialize and grow.
London, UKSpring 2021
Dr. Paula Cadima
Dr. Paula Cadima author of the foreword, is Director of the MArch+MSc Sustainable Environ-mental Design, AA Ph.D. Supervisor and a Member of the AA Teaching Committee. She practicedin architecture and environmental design in various architectural offices and lived in Lisbon, Zurich,London, and Brussels. She chaired the Environment & Sustainable Architecture working group atthe Architect’s Council of Europe in 2009 and was the president of the International PLEANetworkfrom 2011 to 2017, where she continues as advisor to the Director’s Board.

Acknowledgements
The primemotivations underlying this book are rooted in the encounter of theoreticalconcerns—centred around issues related to the evolution of cities towards sustain-ability—and more concrete questions arising from field experiences. Its publicationwould not have been possible without the support of many people, whom we wouldlike to thank warmly. Our thanks are especially addressed to the collaborators andpartners involved in the research and teaching activities of the Laboratory of Archi-tecture and Sustainable Technologies (LAST). The quality of the exchanges, thediversity of the interdisciplinary contributions, and the intensity of the reflectionscarried out within this framework are a precious source of motivation to pursuethe development of knowledge on the transformation of the built environment. Morebroadly, our gratitude goes to the Ecole Polytechnique Fédérale de Lausanne (EPFL),the School of Architecture, Civil and Environmental Engineering (ENAC), and theInstitute of Architecture (IA), which–thanks to the quality of their members and theirinfrastructure–provided a particularly favourable setting for the development of sucha publication. Accordingly, we acknowledge the open access financial support fromtheEPFLLibrary.Wealso acknowledge thefinancial support from theSwissNationalScience Foundation (within the framework of Project No 100013_143376) as well asthe commitment and technical support fromM. Alain Guye, Globalite Management,which led to the development of the operational monitoring tool presented in thisbook. We also wish to thank M. Olivier Govignaux, project manager at the DirectionUrbanisme Projets et Planification, Grand Besançon Metropole for its collaborationduring themonitoring of the Pôle Viotte neighbourhood and Emily Darrow for proof-reading. Finally, we thank all those who accepted to share images of brownfield orregeneration projects to illustrate this book.
vii

Contents
Part I Definition and Issues
1 Introduction . . . . . . . . . . . . . . . . . . . . . . . . . . . . . . . . . . . . . . . . . . . . . . . . . . 3References . . . . . . . . . . . . . . . . . . . . . . . . . . . . . . . . . . . . . . . . . . . . . . . . . . . . 6
2 Urban Brownfields: Origin, Definition, and Diversity . . . . . . . . . . . . . 72.1 Determining the Notion of Urban Brownfield . . . . . . . . . . . . . . . . . 72.2 The Origin of the Word Brownfield and Its Polysemous
Nature . . . . . . . . . . . . . . . . . . . . . . . . . . . . . . . . . . . . . . . . . . . . . . . . . . 82.2.1 An Agricultural Etymology . . . . . . . . . . . . . . . . . . . . . . . . 82.2.2 A Polysemic Notion . . . . . . . . . . . . . . . . . . . . . . . . . . . . . . . 8
2.3 The Emerging Consensus Around a Definition . . . . . . . . . . . . . . . . 92.3.1 A Broad-Spectrum Definition . . . . . . . . . . . . . . . . . . . . . . . 92.3.2 Urban and Metropolitan Brownfields . . . . . . . . . . . . . . . . 11
2.4 The Diversity of Urban Brownfields in Europe . . . . . . . . . . . . . . . . 112.4.1 A Multiplicity of Causes . . . . . . . . . . . . . . . . . . . . . . . . . . . 112.4.2 Classification Attempts . . . . . . . . . . . . . . . . . . . . . . . . . . . . 12
References . . . . . . . . . . . . . . . . . . . . . . . . . . . . . . . . . . . . . . . . . . . . . . . . . . . . 41
3 The Multiple Potentials of Urban Brownfields . . . . . . . . . . . . . . . . . . . . 473.1 Urban Brownfields as a Range of Opportunities . . . . . . . . . . . . . . . 473.2 The Qualitative Potential of Urban Brownfields
(Environmental, Sociocultural, and Economic) . . . . . . . . . . . . . . . 483.2.1 Opportunities for Density, Mobility,
and Functional Mix . . . . . . . . . . . . . . . . . . . . . . . . . . . . . . . 483.2.2 Opportunities for the Environment, Society
and Economy . . . . . . . . . . . . . . . . . . . . . . . . . . . . . . . . . . . . 503.3 The Quantitative Potential of Urban Brownfields . . . . . . . . . . . . . . 53
3.3.1 Situation in the United Kingdom . . . . . . . . . . . . . . . . . . . . 553.3.2 Situation in Switzerland . . . . . . . . . . . . . . . . . . . . . . . . . . . 563.3.3 Situation in France . . . . . . . . . . . . . . . . . . . . . . . . . . . . . . . . 563.3.4 Construction Potential: Urban Brownfields’
Contribution to Containing Urban Sprawl . . . . . . . . . . . . 58
ix

x Contents
References . . . . . . . . . . . . . . . . . . . . . . . . . . . . . . . . . . . . . . . . . . . . . . . . . . . . 60
4 Urban Brownfield Regeneration Projects: Complexitiesand Issues . . . . . . . . . . . . . . . . . . . . . . . . . . . . . . . . . . . . . . . . . . . . . . . . . . . . 654.1 Regenerating Urban Brownfields . . . . . . . . . . . . . . . . . . . . . . . . . . . 654.2 Sociocultural Barriers . . . . . . . . . . . . . . . . . . . . . . . . . . . . . . . . . . . . . 66
4.2.1 Negative Perceptions . . . . . . . . . . . . . . . . . . . . . . . . . . . . . . 664.2.2 Railway Related Nuisances . . . . . . . . . . . . . . . . . . . . . . . . . 664.2.3 Opposition Risks . . . . . . . . . . . . . . . . . . . . . . . . . . . . . . . . . 67
4.3 The Multiplication of Actors in the Project’s Process . . . . . . . . . . 684.3.1 Five Categories of Stakeholders . . . . . . . . . . . . . . . . . . . . . 684.3.2 The Importance of Governance . . . . . . . . . . . . . . . . . . . . . 69
4.4 Legal and Regulatory Constraints . . . . . . . . . . . . . . . . . . . . . . . . . . . 694.5 Deterrent Costs for Potential Investors . . . . . . . . . . . . . . . . . . . . . . . 70
4.5.1 Soil Contamination . . . . . . . . . . . . . . . . . . . . . . . . . . . . . . . 714.5.2 Relocation of Activities . . . . . . . . . . . . . . . . . . . . . . . . . . . . 72
4.6 The Need for Project Dynamics to Overcome Obstacles . . . . . . . . 73References . . . . . . . . . . . . . . . . . . . . . . . . . . . . . . . . . . . . . . . . . . . . . . . . . . . . 75
5 Sustainability Issues at the Neighbourhood Scale . . . . . . . . . . . . . . . . . 775.1 Sustainability and Europe’s Changing Urban Territories . . . . . . . . 775.2 Framing the Concept of Urban Sustainability . . . . . . . . . . . . . . . . . 78
5.2.1 Sustainability as Transition Dynamics: The FourPillars . . . . . . . . . . . . . . . . . . . . . . . . . . . . . . . . . . . . . . . . . . . 79
5.2.2 The Polycentric Restructuration of Built Territories . . . . 815.2.3 Neighbourhoods in Transition . . . . . . . . . . . . . . . . . . . . . . 81
5.3 The Neighbourhood Scale as a Means of Action for Cities . . . . . 825.4 Built Density, Functional Mix, and Sustainable Mobility . . . . . . . 845.5 High Environmental Quality of Buildings
and Developments . . . . . . . . . . . . . . . . . . . . . . . . . . . . . . . . . . . . . . . . 855.6 Urban Contextualization and Preservation of Architectural
Heritage . . . . . . . . . . . . . . . . . . . . . . . . . . . . . . . . . . . . . . . . . . . . . . . . 865.7 Well-being and Conviviality Within the Neighbourhood . . . . . . . . 875.8 Intergenerational and Social Diversity . . . . . . . . . . . . . . . . . . . . . . . 885.9 Control of Global Costs . . . . . . . . . . . . . . . . . . . . . . . . . . . . . . . . . . . 88References . . . . . . . . . . . . . . . . . . . . . . . . . . . . . . . . . . . . . . . . . . . . . . . . . . . . 90
Part II Project Dynamics and Support Tools
6 Key Steps of a Regeneration Process . . . . . . . . . . . . . . . . . . . . . . . . . . . . 976.1 Identification of Five Key Steps . . . . . . . . . . . . . . . . . . . . . . . . . . . . 976.2 Early Reflections at Regional or Metropolitan Level . . . . . . . . . . . 986.3 The Project as a Basis for Reflection on Urban
and Architectural Coherence . . . . . . . . . . . . . . . . . . . . . . . . . . . . . . . 996.3.1 Overcoming Negative Perceptions . . . . . . . . . . . . . . . . . . . 996.3.2 Fostering the Emergence of a Shared Vision . . . . . . . . . . 100

Contents xi
6.3.3 Identifying Sectors and Phasing Operations . . . . . . . . . . . 1016.4 The Transition from Urban to Architectural Project . . . . . . . . . . . . 1026.5 Multiple Forms of Participatory Processes . . . . . . . . . . . . . . . . . . . 103
6.5.1 Participation of Landowners and LandManagement . . . . . . . . . . . . . . . . . . . . . . . . . . . . . . . . . . . . . 103
6.5.2 Integration of Civil Society to Foster StakeholderSupport . . . . . . . . . . . . . . . . . . . . . . . . . . . . . . . . . . . . . . . . . 104
6.6 Evaluation of Sustainability Objectives . . . . . . . . . . . . . . . . . . . . . . 1056.6.1 The Various Roles of Operational Evaluation . . . . . . . . . 1066.6.2 Operational Evaluation Integrated in Project
Dynamics . . . . . . . . . . . . . . . . . . . . . . . . . . . . . . . . . . . . . . . 107References . . . . . . . . . . . . . . . . . . . . . . . . . . . . . . . . . . . . . . . . . . . . . . . . . . . . 108
7 Specific Skills and Adapted Support . . . . . . . . . . . . . . . . . . . . . . . . . . . . 1117.1 Courses of Action to Support the Evolution of Current
Practices . . . . . . . . . . . . . . . . . . . . . . . . . . . . . . . . . . . . . . . . . . . . . . . . 1117.2 Strategies at the Territorial Level . . . . . . . . . . . . . . . . . . . . . . . . . . . 112
7.2.1 Awareness of Urban Brownfield Potential . . . . . . . . . . . . 1127.2.2 Evolution of the Legal Framework . . . . . . . . . . . . . . . . . . 1137.2.3 Development of Financial Levers . . . . . . . . . . . . . . . . . . . 113
7.3 Strategies at the Metropolitan Level . . . . . . . . . . . . . . . . . . . . . . . . . 1147.3.1 Integration of Urban Brownfield Regeneration
Projects Within Urban Planning Tools . . . . . . . . . . . . . . . 1147.3.2 Identification of Strategic Sectors for Urban
Development . . . . . . . . . . . . . . . . . . . . . . . . . . . . . . . . . . . . . 1157.4 Strategies at the Project Level . . . . . . . . . . . . . . . . . . . . . . . . . . . . . . 116
7.4.1 Initiation and Governance of Regeneration Project . . . . . 1167.4.2 Integration of Sustainability Objectives . . . . . . . . . . . . . . 1177.4.3 Follow-Up of Sustainability Objectives . . . . . . . . . . . . . . 1177.4.4 User Awareness . . . . . . . . . . . . . . . . . . . . . . . . . . . . . . . . . . 118
References . . . . . . . . . . . . . . . . . . . . . . . . . . . . . . . . . . . . . . . . . . . . . . . . . . . . 118
8 Sustainability Monitoring: Principles, Challenges,and Approaches . . . . . . . . . . . . . . . . . . . . . . . . . . . . . . . . . . . . . . . . . . . . . . . 1218.1 Sustainability and Urban Brownfield Regeneration Projects . . . . 1218.2 Principles of Sustainability Evaluation and Monitoring . . . . . . . . 122
8.2.1 Multi-criteria Evaluation Principles . . . . . . . . . . . . . . . . . . 1228.2.2 Monitoring Principles . . . . . . . . . . . . . . . . . . . . . . . . . . . . . 124
8.3 Operational Monitoring Tool Challenges . . . . . . . . . . . . . . . . . . . . . 1268.3.1 Operational Limitations . . . . . . . . . . . . . . . . . . . . . . . . . . . . 1278.3.2 Target Audience . . . . . . . . . . . . . . . . . . . . . . . . . . . . . . . . . . 1288.3.3 Results Reporting . . . . . . . . . . . . . . . . . . . . . . . . . . . . . . . . . 129
8.4 The Need for Tailor-Made Operational SustainabilityMonitoring . . . . . . . . . . . . . . . . . . . . . . . . . . . . . . . . . . . . . . . . . . . . . . 1318.4.1 Consideration of Specific Features . . . . . . . . . . . . . . . . . . 1328.4.2 Operational Monitoring Tool Requirements . . . . . . . . . . . 134

xii Contents
8.5 Critical Analysis of Existing Approaches . . . . . . . . . . . . . . . . . . . . 1358.5.1 Existing Certifications at the Neighbourhood Scale . . . . 1368.5.2 Existing Evaluation Methods for Brownfield
Regeneration Projects . . . . . . . . . . . . . . . . . . . . . . . . . . . . . 1378.5.3 Towards a Hybridization of Existing Approaches . . . . . . 138
References . . . . . . . . . . . . . . . . . . . . . . . . . . . . . . . . . . . . . . . . . . . . . . . . . . . . 139
9 An Operational Monitoring Tool . . . . . . . . . . . . . . . . . . . . . . . . . . . . . . . . 1439.1 The Hybridization of Methodologies . . . . . . . . . . . . . . . . . . . . . . . . 1439.2 The Multi-Criteria Evaluation System . . . . . . . . . . . . . . . . . . . . . . . 145
9.2.1 Description . . . . . . . . . . . . . . . . . . . . . . . . . . . . . . . . . . . . . . 1459.2.2 Adaptations . . . . . . . . . . . . . . . . . . . . . . . . . . . . . . . . . . . . . . 147
9.3 The Quality Management Monitoring Software . . . . . . . . . . . . . . . 1489.3.1 Description . . . . . . . . . . . . . . . . . . . . . . . . . . . . . . . . . . . . . . 1489.3.2 Adaptations . . . . . . . . . . . . . . . . . . . . . . . . . . . . . . . . . . . . . . 150
9.4 AnOperationalMonitoringTool to SupportNeighbourhoodin Transitions . . . . . . . . . . . . . . . . . . . . . . . . . . . . . . . . . . . . . . . . . . . . 153
References . . . . . . . . . . . . . . . . . . . . . . . . . . . . . . . . . . . . . . . . . . . . . . . . . . . . 157
10 Application to a Case Study . . . . . . . . . . . . . . . . . . . . . . . . . . . . . . . . . . . . 15910.1 Monitoring the Pôle Viotte Neighbourhood in Besançon,
France . . . . . . . . . . . . . . . . . . . . . . . . . . . . . . . . . . . . . . . . . . . . . . . . . . 15910.1.1 Description of the Urban Brownfield Site . . . . . . . . . . . . . 16010.1.2 Description of the Urban Brownfield Regeneration
Project . . . . . . . . . . . . . . . . . . . . . . . . . . . . . . . . . . . . . . . . . . 16110.2 Detailed Monitoring Results . . . . . . . . . . . . . . . . . . . . . . . . . . . . . . . 165
10.2.1 Checklist—Context Indicators . . . . . . . . . . . . . . . . . . . . . 16510.2.2 Checklist—Project Indicators . . . . . . . . . . . . . . . . . . . . . . 17610.2.3 Checklist—Governance Indicators . . . . . . . . . . . . . . . . . . 189
10.3 Overall Monitoring Results . . . . . . . . . . . . . . . . . . . . . . . . . . . . . . . . 19310.4 Towards Integration of Sustainability Issues into the Project
Dynamics of a Neighbourhood in Transition . . . . . . . . . . . . . . . . . 199References . . . . . . . . . . . . . . . . . . . . . . . . . . . . . . . . . . . . . . . . . . . . . . . . . . . . 200
11 Conclusion . . . . . . . . . . . . . . . . . . . . . . . . . . . . . . . . . . . . . . . . . . . . . . . . . . . 203References . . . . . . . . . . . . . . . . . . . . . . . . . . . . . . . . . . . . . . . . . . . . . . . . . . . . 206
Appendix . . . . . . . . . . . . . . . . . . . . . . . . . . . . . . . . . . . . . . . . . . . . . . . . . . . . . . . . . 209
References . . . . . . . . . . . . . . . . . . . . . . . . . . . . . . . . . . . . . . . . . . . . . . . . . . . . . . . . 243

About the Authors
Prof. Emmanuel Rey head of theLaboratory ofArchitecture andSustainableTech-nologies (LAST) at Ecole polytechnique fédérale de Lausanne (EPFL) and a partnerat Bauart Architects and Planners in Bern, Neuchâtel and Zurich. He is the author ofa doctoral thesis at the Université catholique de Louvain (UCLouvain) on urbanbrownfield regeneration and the integration of sustainability evaluation into theproject dynamics, awarded by the European Gustave Magnel Prize in 2009. Hispractice, research and teaching focus on the field of sustainable architecture, withparticular emphasis on the transcription of the principles of sustainability at differentlevels of intervention.He is the editor and author of several books on architectural andurban design and author of numerous articles in scientific journals and conferenceproceedings. In 2015, he is awarded by the Swiss Academies of Arts and Sciencesand received the swiss-academies award for transdisciplinary research (td-award).
Dr. Martine Laprise graduated from theEcole polytechnique fédérale deLausanne(EPFL) in 2017, after several years of experience in professional practice as an archi-tect in Canada and Switzerland. She is the author of a doctoral thesis on operationalmonitoring for the integration of sustainability issues into urban brownfield regenera-tion projects. She is currently working as a scientist at the Laboratory of Architectureand Sustainable Technologies (LAST) carrying out research and teaching activities.She is the author of several articles in scientific journals and conference proceedings.
Dr. Sophie Lufkin graduated as an architect from the Ecole polytechnique fédéralede Lausanne (EPFL) in 2005. She is the author of a doctoral thesis on the densifica-tion potential of railway brownfields in Switzerland. After an international practicalexperience at LAR-Fernando Romero (Mexico City), she is currently working as asenior scientist and lecturer at the Laboratory of Architecture and Sustainable Tech-nologies (LAST) carrying out research and teaching activities. She is the author ofseveral articles in scientific journals, conference proceedings, and books.
xiii

List of Figures
Fig. 2.1 Werkspoor Fabriek, Utrecht (NL). Transformationof an industrial warehouse into a mixed-use officebuilding in the Werkspoor District. Zecc Architecten,2016–2019 (photo: © Zecc Architecten and Stijn Poelstra,2019) . . . . . . . . . . . . . . . . . . . . . . . . . . . . . . . . . . . . . . . . . . . . . . . 17
Fig. 2.2 Werkspoor Fabriek, Utrecht (NL). Transformationof an industrial warehouse into a mixed-use officebuilding in the Werkspoor District. Interior view. ZeccArchitecten, 2016–2019 (photo: © Zecc Architectenand Stijn Poelstra, 2019) . . . . . . . . . . . . . . . . . . . . . . . . . . . . . . . . 17
Fig. 2.3 Parco Dora, Torino (IT). Transformation of a formermetallurgical plant into an urban park. LATZ +PARTNER, 2012 (photo: Uccio “Uccio2” D’Agostino,2015) . . . . . . . . . . . . . . . . . . . . . . . . . . . . . . . . . . . . . . . . . . . . . . . 19
Fig. 2.4 Station F, Paris (FR). Transformation of the former HalleFreyssinet of Gare d’Austerlitz into a start-up campus.Wilmotte & Associés SAS, 2017 (photo: PatrickTourneboeuf, 2017) . . . . . . . . . . . . . . . . . . . . . . . . . . . . . . . . . . . . 22
Fig. 2.5 Nyugati Grund, Budapest (HU). Regeneration of a disusedrailway area. Ongoing regeneration project (photo: ©István Keresztes for KÉK-Hungarian ContemporaryArchitecture Centre, 2014) . . . . . . . . . . . . . . . . . . . . . . . . . . . . . . 23
Fig. 2.6 Ecoparc Neighbourhood, Neuchâtel (CH). Aerial viewon the pioneering regeneration project of an obsoleterailway area into a sustainable neighbourhood. BauartArchitects and Planners, 2000–2011 (photo: © YvesAndré, 2013) . . . . . . . . . . . . . . . . . . . . . . . . . . . . . . . . . . . . . . . . . 24
Fig. 2.7 Ecoparc Neighbourhood, Neuchâtel (CH). An open publicspace in the heart of the sustainable neighbourhood.Bauart Architects and Planners, 2000–2011 (photo: ©Yves André, 2013) . . . . . . . . . . . . . . . . . . . . . . . . . . . . . . . . . . . . 24
xv

xvi List of Figures
Fig. 2.8 Plateau des Capucins, Brest (FR). Regenerationof a former military area into a mixed-use neighbourhooddedicated to housing, economy, leisure, culture,and tourism. Public space and urban cable car, 2017(photo: Emmanuel Rey, 2019) . . . . . . . . . . . . . . . . . . . . . . . . . . . 27
Fig. 2.9 Plateau des Capucins, Brest (FR). Regenerationof a former military area into a mixed-use neighbourhooddedicated to housing, economy, leisure, culture,and tourism. Interior view. Atelier de l’île, 2017 (photo:Emmanuel Rey, 2019) . . . . . . . . . . . . . . . . . . . . . . . . . . . . . . . . . . 28
Fig. 2.10 Paper Island, Copenhagen (DK). Rehabilitation of formermaritime paper storage facilities into a new districtwith street food halls, art exhibitions, fashion shows,concerts, and flea markets. Cobe architects, ongoingproject (photo: News Øresund – Jenny Andersson, 2016) . . . . . 30
Fig. 2.11 Telakkaranta, Helsinki (FI). Regeneration of a historicshipyard into an urban waterfront neighbourhood.Lundgaard & Tranberg Arkitekter, ongoing project(image: © Skanska, Huttunen-Lipasti Arkkitehditand Lundgaard & Tranberg Arkitekter A/S, 2021) . . . . . . . . . . . 31
Fig. 2.12 Matadero, Madrid (ES). Regeneration of a formerslaughterhouse area into a new neighbourhood dedicatedto culture. Ensamble Studio, A. Franco, Martin +Batanero, CH + QS arquitectos, 2006–2012 (photo: FredRomero, 2017) . . . . . . . . . . . . . . . . . . . . . . . . . . . . . . . . . . . . . . . . 33
Fig. 2.13 Hellinikon Olympic Hockey Centre, Athens (GR).Abandoned Athens Olympic 2004 venues since 2004(photo: Arne Müseler, 2019) . . . . . . . . . . . . . . . . . . . . . . . . . . . . 34
Fig. 2.14 Magic Movie Park, Muggiò (IT). 21,000 square metresmultiplex and commercial centre in the outskirt of Milan,abandoned since 2006 (photo: Roberto Barbone, 2016) . . . . . . . 36
Fig. 2.15 Mühleberg Nuclear Power Plant, Canton of Bern (CH).Decommissioning of buildings as part of the strategyof abandoning nuclear power in Switzerland startedin 2020 and to be completed by 2034 (photo: EmmanuelRey, 2021) . . . . . . . . . . . . . . . . . . . . . . . . . . . . . . . . . . . . . . . . . . . 37
Fig. 2.16 Mülheim-Kärlich nuclear power plant,Mülheim-Kärlich (DE). Collapsed of the coolingtower of the decommissioned nuclear power plant in 2019(photo: Phantom3Pix, 2019) . . . . . . . . . . . . . . . . . . . . . . . . . . . . . 38
Fig. 2.17 Battersea Power Station, London (UK). Transformationof a former power station into a headquarters in the heartof a 7.6-ha new development. Masterplan by RafaelViñoly Architects, ongoing project (photo: AurelienGuichard, 2010) . . . . . . . . . . . . . . . . . . . . . . . . . . . . . . . . . . . . . . 39

List of Figures xvii
Fig. 2.18 Haggerston Gasworks, London (UK). One of the fewand oldest remaining abandoned gasworks structures(photo: © Alizé Soubeyran, 2020) . . . . . . . . . . . . . . . . . . . . . . . . 39
Fig. 2.19 Val-Benoît, Liège (BE). Regeneration of the Liègeuniversity campus abandoned in 2005 into a newmixed-use neighbourhood including office spacesfor start-ups and a diversity of housing. Baumans-DeffetArchitecure et Urbanisme, ongoing project startedin 2011 (photo: Jean Housen, 2017) . . . . . . . . . . . . . . . . . . . . . . 41
Fig. 3.1 Schematic representation illustrating the compactand polycentric city model adapted to the metropolitanarea. From the metropolization phenomenon emergesa hierarchy within the city and its transport network.The neighbourhoods are mixed and compactpoles, which allow a certain reduction in the needfor individual motorized journeys by the creation of denseand multifunctional secondary centres . . . . . . . . . . . . . . . . . . . . 49
Fig. 3.2 EuraTechnologies Campus, Lille (FR). Transformationof a former spinning mill into a start-up incubatorand accelerator. B + A Architectes, 2009 (photo:Stefan83~fwiki, 2018) . . . . . . . . . . . . . . . . . . . . . . . . . . . . . . . . . 52
Fig. 3.3 La Cité du Cinéma, Paris (FR). Conversion of a formerpower station into a film studio complex supportedby director and producer Luc Besson. Reichen et Robert& Associés Architectes Urbanistes, 2012 (photo: ©Reichen et Robert – Architectes Urbanistes © LaurentDesmoulins, photographer, 2016) . . . . . . . . . . . . . . . . . . . . . . . . 52
Fig. 3.4 La Cité du Cinéma, Paris (FR). Conversion of a formerpower station into a film studio complex. Viewof the central nave. Reichen et Robert & AssociésArchitectes Urbanistes, 2012 (photo: © Reichen etRobert – Architectes Urbanistes © Laurent Desmoulins,photographer, 2016) . . . . . . . . . . . . . . . . . . . . . . . . . . . . . . . . . . . 53
Fig. 3.5 Estimation of the area of urban brownfields in Europeanregions and countries. Data according to Ferberand Grimski (2002) . . . . . . . . . . . . . . . . . . . . . . . . . . . . . . . . . . . . 54
Fig. 4.1 The relative importance of the various obstaclesto the regeneration of brownfields. Data accordingto Valda and Westermann (2004) . . . . . . . . . . . . . . . . . . . . . . . . . 74
Fig. 5.1 The four pillars of sustainability in relation to the urbanproject . . . . . . . . . . . . . . . . . . . . . . . . . . . . . . . . . . . . . . . . . . . . . . 80
Fig. 5.2 The neighbourhood as an efficient spatial scalefor the implementation of transition dynamicstowards sustainability . . . . . . . . . . . . . . . . . . . . . . . . . . . . . . . . . . 82

xviii List of Figures
Fig. 6.1 Modification possibilities compared to the levelof information according to the project progress . . . . . . . . . . . . 107
Fig. 8.1 Schematic representation of the constituent elementsof an operational monitoring tool . . . . . . . . . . . . . . . . . . . . . . . . . 126
Fig. 8.2 Balance between normative principles of sustainabilityevaluation and practical user requirements for the designof an operational monitoring tool (Laprise 2017) . . . . . . . . . . . . 129
Fig. 8.3 Example of radar chart showing multi-criteria evaluationresults and objectives simultaneously . . . . . . . . . . . . . . . . . . . . . 131
Fig. 8.4 Sustainability monitoring throughout an urban brownfieldregeneration project’s lifecycle . . . . . . . . . . . . . . . . . . . . . . . . . . 133
Fig. 8.5 Schematic representation of the three generalrequirements for a tailor-made operational monitoring tool . . . . 135
Fig. 9.1 Hybridization of the multicriteria evaluation systemSIPRIUS and the quality management monitoringsoftware OKpilot to create SIPRIUS+ . . . . . . . . . . . . . . . . . . . . . 145
Fig. 9.2 Graphical representation of context (above) and project(below) indicators . . . . . . . . . . . . . . . . . . . . . . . . . . . . . . . . . . . . . 146
Fig. 9.3 Graphical representation of governance indicators . . . . . . . . . . . 148Fig. 9.4 Evaluation module for a given indicator . . . . . . . . . . . . . . . . . . . 153Fig. 9.5 Chart display showing the expected final situation
of context indicators . . . . . . . . . . . . . . . . . . . . . . . . . . . . . . . . . . . 154Fig. 9.6 Evolution display showing the performance of given
indicators . . . . . . . . . . . . . . . . . . . . . . . . . . . . . . . . . . . . . . . . . . . . 155Fig. 9.7 Evolution display showing all indicators’ performances . . . . . . 156Fig. 9.8 Schematic representation of the structure of SIPRIUS+
hybridizing an indicator system (SIPRIUS)and a monitoring software (OKpilot) . . . . . . . . . . . . . . . . . . . . . . 156
Fig. 9.9 SIPRIUS+ Homepage . . . . . . . . . . . . . . . . . . . . . . . . . . . . . . . . . . 157Fig. 10.1 SIPRIUS+ Homepage customized for the Pôle Viotte
monitoring . . . . . . . . . . . . . . . . . . . . . . . . . . . . . . . . . . . . . . . . . . . 160Fig. 10.2 Aerial view of the brownfield site surrounding Viotte
train station (photo: Ville de Besançon, 2007) . . . . . . . . . . . . . . 161Fig. 10.3 The old Sernam Hall south sector of the brownfield
was an emblematic building of railway sites (photo:Martine Laprise, 2016) . . . . . . . . . . . . . . . . . . . . . . . . . . . . . . . . . 162
Fig. 10.4 View on the brownfield site from Rue Jeanneney showingthe steep drop and an SNCF building, 2016 (photo:Martine Laprise, 2016) . . . . . . . . . . . . . . . . . . . . . . . . . . . . . . . . . 162
Fig. 10.5 The military platform in the northern sectorof the brownfield site, 2016 (photo: Martine Laprise, 2016) . . . 163
Fig. 10.6 A parking in the northern sector of the site next to publicaccess to the multi-modal hub, which was completedduring the first phase of development (photo: MartineLaprise, 2016) . . . . . . . . . . . . . . . . . . . . . . . . . . . . . . . . . . . . . . . . 163

List of Figures xix
Fig. 10.7 Location map of the Viotte brownfield site, Besançon,France . . . . . . . . . . . . . . . . . . . . . . . . . . . . . . . . . . . . . . . . . . . . . . 164
Fig. 10.8 Masterplan of the Pôle Viotte neighbourhood . . . . . . . . . . . . . . . 166Fig. 10.9 New tertiary centre under construction (photo: Ville de
Besançon, 2021) . . . . . . . . . . . . . . . . . . . . . . . . . . . . . . . . . . . . . . 167Fig. 10.10 Evolution displays for the context
indicators—environmental impact . . . . . . . . . . . . . . . . . . . . . . . . 168Fig. 10.11 Evolution displays for the context
indicators—sociocultural impact . . . . . . . . . . . . . . . . . . . . . . . . . 169Fig. 10.12 Evolution displays for the context indicators—economic
impact . . . . . . . . . . . . . . . . . . . . . . . . . . . . . . . . . . . . . . . . . . . . . . 170Fig. 10.13 Evolution displays for the project
indicator—environmental balance . . . . . . . . . . . . . . . . . . . . . . . . 177Fig. 10.14 Evolution displays for the project indicator—sociocultural
quality . . . . . . . . . . . . . . . . . . . . . . . . . . . . . . . . . . . . . . . . . . . . . . 178Fig. 10.15 Evolution displays for the project indicator—economic
efficiency . . . . . . . . . . . . . . . . . . . . . . . . . . . . . . . . . . . . . . . . . . . . 179Fig. 10.16 Evolution displays for the governance
indicators—management . . . . . . . . . . . . . . . . . . . . . . . . . . . . . . . 189Fig. 10.17 Evolution displays for the governance indicators—process . . . . 190Fig. 10.18 Overall results of the initial situation (context indicators)
and the initial objective (project indicators and governanceindicators) . . . . . . . . . . . . . . . . . . . . . . . . . . . . . . . . . . . . . . . . . . . 195
Fig. 10.19 Overall results of the current situation (contextand governance indicators) and the construction phaseof the current situation (project indicators) . . . . . . . . . . . . . . . . . 196
Fig. 10.20 Overall results of the expected final situation (context,project, and governance indicators) . . . . . . . . . . . . . . . . . . . . . . . 197
Fig. 10.21 Evolution display showing the distribution of allindicators’ performances based on the valuesobtained for the expected final situation. The figurealso shows the breakdown by sustainability dimension:environmental, sociocultural, and economic impact . . . . . . . . . . 198
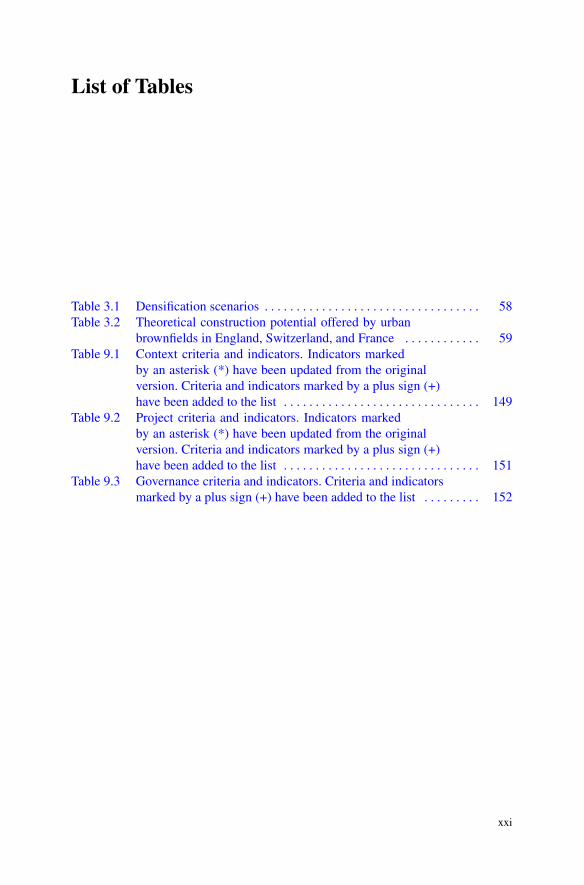
List of Tables
Table 3.1 Densification scenarios . . . . . . . . . . . . . . . . . . . . . . . . . . . . . . . . . . 58Table 3.2 Theoretical construction potential offered by urban
brownfields in England, Switzerland, and France . . . . . . . . . . . . 59Table 9.1 Context criteria and indicators. Indicators marked
by an asterisk (*) have been updated from the originalversion. Criteria and indicators marked by a plus sign (+)have been added to the list . . . . . . . . . . . . . . . . . . . . . . . . . . . . . . . 149
Table 9.2 Project criteria and indicators. Indicators markedby an asterisk (*) have been updated from the originalversion. Criteria and indicators marked by a plus sign (+)have been added to the list . . . . . . . . . . . . . . . . . . . . . . . . . . . . . . . 151
Table 9.3 Governance criteria and indicators. Criteria and indicatorsmarked by a plus sign (+) have been added to the list . . . . . . . . . 152
xxi

Part IDefinition and Issues

Chapter 1Introduction
Abstract The regeneration of brownfields in European metropolitan areas repre-sents an important potential to mitigate urban sprawl by increasing density withinthe existing built fabric and to revitalize portions of cities at the neighbourhoodscale. Although research and projects on urban brownfields are active, several issuesstill need to be overcome, especially regarding the sustainability transition chal-lenge. Based on this observation, we introduce the present book, which proposes anintegrated and theoretically grounded approach to highlight how urban brownfieldregeneration projects—and the neighbourhood scale that they entail—can effectivelycontribute to the urban sustainability transitions of metropolitan areas. It is structuredin two parts that are both distinct and complementary: the first part aims to clarifythe framework of the investigations with definition and analysis and the second partpresents a deep analysis of processes, project dynamics, and sustainability assessmentapproaches of urban brownfield regeneration.
Keywords European metropolitan areas · Urban brownfield regeneration ·Neighbourhood scale · Sustainability transitions · Urban sprawl · Urban design ·Architectural design
Observation of post-industrial European metropolitan areas reveals a singularparadox spanning decades. While planning politics seek to limit urban sprawl inorder to slow the occupation of space, pressure on the landscape and its impacts onthe environment, a considerable stock of land in the heart of urban territories stillremains neglected or underutilized (Rey 2014).
Emblematic of a post-industrial era, their widespread appearance can be explainedby the significant reduction or technological change in certain activities withinthe European territories. The disappearance of obsolete activities, the relocation ofcertain functions, the automationof production, or other changes in needs have locallyimbalanced the relationships between functional needs and their spatial extent.Goingbeyond the sole question of industrial sectors, these urban brownfields may also havepreviously hosted activities such as railway, military, port, logistics, infrastructural,commercial, or energy concerns. Yet, these urban brownfields represent an impor-tant potential: their regeneration allows the mitigation of urban sprawl by increasing
© The Author(s) 2022E. Rey et al., Neighbourhoods in Transition, The Urban Book Series,https://doi.org/10.1007/978-3-030-82208-8_1
3

4 1 Introduction
density within the existing built fabric—in particular when located near public trans-port—and to revitalize portions of metropolitan areas at the neighbourhood scale(Rey 2012).
Among the pioneering examples of urban regeneration, we can cite in partic-ular the Internationale Bauausstellung Emscher Park (IBA Emscher Park), whichconstituted an ambitious programme for structural changes in the so-called GermanRuhr region from 1989 to 1993 (Nordrhein-Westfalen Minister für Stadtentwick-lung 1988). In a context of strong industrial decline, this approach consisted of akind of laboratory for the implementation of new concepts in brownfield transfor-mation processes, integrating diverse sociocultural and ecologic dimensions. In thespirit of these first experiences, a growing number of urban brownfield regenerationprojects have emerged in Europe over the past twenty years. The projects alreadycarried out and the many sites still in the study phase are not limited to regions witha strong industrial past, but today concern a particularly large number of Europeanmetropolitan areas.
Arousing the interest of the various players in regional planning, these achieve-ments have helped to overcome certain negative perceptions traditionally associatedwith declining sites and to recognize their development potential. However, they didnot reduce the importance of the phenomenon, which remains more relevant thanever at a time of climate crisis. Many abandoned or underused sites are still waitingfor new programmes, whether by hosting emblematic public institutions or, morebroadly, by integrating a functional mix allowing links with the surrounding urbanfabric to be re-established.
Although research and projects on urban brownfields are active, several issuesstill need to be overcome, especially regarding the sustainability transition challenge.With this in mind, the question is not limited solely to considerations of location andbuilding densification. If density is an inescapable challenge, it ought to be consideredas a necessary but not sufficient condition. Our observation of multiple regenerationprojects highlighted that they do not automatically contribute to the sustainability ofurban areas. To achieve sustainability, the integration of a proactive and continuoussearch for global quality into the dynamics of the project is essential (Rey et al.2015). This involves taking into account multiple environmental, sociocultural, andeconomic dimensions from the first steps of the project, then careful monitoring ofthe sustainability objectives during the various stages of the design process until thecommissioning of the new neighbourhoods.
It is in this spirit that this book proposes an integrated and theoretically groundedapproach to highlight how urban brownfield regeneration projects—and the neigh-bourhood scale that they entail—can effectively contribute to the urban sustainabilitytransitions of metropolitan areas. The challenge is undeniably significant and itsaccomplishment requires planning, conscience, and a mastery of complex processes.In terms of practice and usage, such an evolution must be accompanied by a truereappraisal of urban lifestyles. This requires the emergence of a habitat offering anincreased quality of life to an increased number of inhabitants, while simultane-ously promoting a sparse use of resources, a move towards carbon neutrality, and aminimization of environmental impacts. The health crisis induced by the COVID-19

1 Introduction 5
pandemic has further heightened awareness of the necessary conditions for ensuringwell-being within dwellings and to meet the need for services and amenities in aperimeter easily accessible on foot or by bicycle.
This search for quality and proximity, understood broadly, finds at the neighbour-hood level a framework of actions and experiments that are particularly adapted inoperational terms. This makes it possible to grasp the urban reality in a dimensionvast enough to touch on sustainability criteria that go beyond the size of a singlebuilding, but circumscribed enough to be able to visualize concrete interventions.The neighbourhoods thus lend themselves well to a tangible realization of sustain-ability transitions, for example, by the increase in sustainable mobility, developmentof public spaces, development of local services, energy renovation of existing build-ings, construction of new low-carbon buildings, promotion of the circular economy,and the realization of true sociocultural and intergenerational diversity.
Such projects should be understood as a dynamic process which involves manyactors and underpins a common learning of how sustainability can be transposedin each operation. This subject is important because urban brownfield regenerationprojects are not inherently sustainable. That is explained by the complexity of thenature of urban brownfields and their scale, the project process, and the holisticconcept of sustainability itself. To overcome these complexities, a good under-standing of the nature of urban brownfields and regeneration projects’ process isrequired. Moreover, evaluation and monitoring are necessary approaches to ensurethe integration of sustainability objectives into these operations.
Based on these findings and multiple works carried out within the Laboratoryof Architecture and Sustainable Technologies (LAST) of the Ecole polytechniquefédérale de Lausanne (EPFL), the present book is structured in two parts that are bothdistinct and complementary. The first part aims to clarify the framework of the inves-tigations presented by an effort to define the polysemic concept of brownfield and byan analysis of the different risks of their regeneration in regard to their potential contri-bution to the sustainability transition of European metropolitan areas. Highlightingthe heterogeneity of situations, our presentation of a number of examples allows usto illustrate the phenomenon of urban brownfields and certain characteristics of theirregeneration.
The second part of the book next presents a deep analysis of processes, projectdynamics, and sustainability assessment approaches of urban brownfield regenera-tion. It highlights that the optimizations of the project are part of an iterative searchfor improvement and that all key players must be involved in this complex process.For this to happen, it is necessary to have an increased knowledge of the initial situ-ation, and to define common objectives with the various actors, then assess whetherthey have been reached in order to draw concrete conclusions in the form of changesto the project and targeted adaptations of operational actions. It is for this reason thatthe book also provides an operational monitoring tool specifically focusing on issuesraised by urban brownfield regeneration projects, whose method and principles canbe concretely transferred as tools for supporting decision-making in professionalpractice (Laprise et al. 2018). The application of this tool was tested in real casestudies in three selected neighbourhoods in Liège (Belgium), Yverdon-les-Bains
6 1 Introduction
(Switzerland) and Besançon (France), and the outcomes of the latter case study arealso presented and discussed.
Thus, these two complementary parts constitute a theoretical and practicalreference book that provides detailed information on urban brownfield regenera-tion projects as contributions—at their own scale—to the evolution of Europeanmetropolitan areas. Faced with the current ecological and climate crises, urban areasrepresent both a huge challenge and a formidable potential. Among the multitudeof actions to be undertaken and taking into account the long timeframe which char-acterizes urban projects, sustainable brownfield regeneration remains an unmissableissue, and a relevant operational strategy. In other words, at the beginning of thetwenty-first century, a regeneration project constitutes a neighbourhood in transi-tion that turns urban brownfield potential into opportunities for sustainability. In thislight, this book attempts to highlight that rethinking urban territories through theprism of the neighbourhood scale gives the advantage of sufficient circumscriptionto be tangible, yet large enough to have an impact.
References
Laprise M, Lufkin S, Rey E (2018) An operational monitoring tool facilitating the transformationof urban brownfields into sustainable neighborhoods. Build Environ 221–233. https://doi.org/10.1016/j.buildenv.2018.06.005
Nordrhein-Westfalen Minister für Stadtentwicklung W und V (1988) Internationale Bauausstel-lung Emscher-Park Werkstatt für die Zukunft alter Industriegebiete: Memorandum zu Inhaltund Organisation. Minister für Stadtentwicklung, Wohnen und Verkehr des Landes Nordrhein-Westfalen, Düsseldorf
Rey E (2014) From Spatial Development to Detail. Quart Publishers, Lucerne, Collection NotatioRey E (2012) Régénération des friches urbaines et développement durable : vers une évaluationintégrée à la dynamique du projet. Presses Universitaires de Louvain, Louvain-La-Neuve
Rey E (ed) (2015) Urban recovery. Presses Polytechniques et Universitaires Romandes, Lausanne
Open Access This chapter is licensed under the terms of the Creative Commons Attribution 4.0International License (http://creativecommons.org/licenses/by/4.0/), which permits use, sharing,adaptation, distribution and reproduction in any medium or format, as long as you give appropriatecredit to the original author(s) and the source, provide a link to the Creative Commons license andindicate if changes were made.
The images or other third party material in this chapter are included in the chapter’s CreativeCommons license, unless indicated otherwise in a credit line to the material. If material is notincluded in the chapter’s Creative Commons license and your intended use is not permitted bystatutory regulation or exceeds the permitted use, you will need to obtain permission directly fromthe copyright holder.

Chapter 2Urban Brownfields: Origin, Definition,and Diversity
Abstract Brownfield is a polysemic notion that encompasses a whole range ofdiverse spaces. Although there is no official definition at the European level, anemerging consensus has arisen around the urban character of brownfields and theneed for intervention. Indeed, their location within metropolitan areas represents astrategic opportunity to densify and rejuvenate the urban fabric at the neighbourhoodscale. Hence, we propose a definition of urban brownfields that is flexible enough tooptimize the potential development of abandoned sites and precise enough to enableframing the discussion. Then, we take a look at the diversity of urban brownfieldsin European metropolitan areas by briefly explaining the factors that cause a siteto become a brownfield and then attempting to classify different types of urbanbrownfields. The proposed classification aims to create a non-exhaustive referenceframework by offering in-depth knowledge of the urban brownfield and regenerationprojects phenomenon across Europe, without setting its meaning in stone.
Keywords Urban brownfield definition · Urban brownfield classification ·Industrial brownfields · Railway brownfields ·Military brownfields ·Waterfrontbrownfields · Infrastructural brownfields · Commercial brownfields · Energybrownfields
2.1 Determining the Notion of Urban Brownfield
Initially confined to urban planning specialists, the notion of urban brownfields isnow frequently discussed within politics, the media, and associations professional.However, brownfields encompass awhole range of diverse spaces. In order to providea satisfactory meaning, it is worthwhile not only to define the coverage of the notionof brownfields, but also to clarify the characteristics of their localization, whichformally determines its belonging to urban and, more broadly, metropolitan areas.
© The Author(s) 2022E. Rey et al., Neighbourhoods in Transition, The Urban Book Series,https://doi.org/10.1007/978-3-030-82208-8_2
7

8 2 Urban Brownfields: Origin, Definition, and Diversity
2.2 The Origin of the Word Brownfield and Its PolysemousNature
2.2.1 An Agricultural Etymology
It is worth pointing that the origins of the French word for brownfield, friche, areto be found in agriculture. Etymologically, the term comes from an evolution of themedieval Dutch word versch, which meant “fresh soil” (Dubois et al. 2001). Morebroadly, it refers to uncultivated agricultural land, disused due to low soil fertility,excess land available, or transitory fallow situation. The English word brownfield,which comes from a combination of the adjective “brown” and the noun “field”,started being commonly used within urban planning circles at the beginning of thenineties to generically qualify abandoned land (Merlin and Choay 2010). The UnitedStates Environmental Protection Agency (EPA), for instance, established its Brown-fields Redevelopment Initiative as early as 1993 to encourage and support localgovernments in their efforts to inventory and assess brownfields (EnvironmentalProtection Agency (EPA) 2006).
According to the generic Merriam-Webster1 dictionary, a brownfield refers to“a tract of land that has been developed for industrial purposes, polluted, and thenabandoned”. More specifically, urban brownfields are characterized by
• a state of imbalance, which reflects an inadequacy between the site’s occupationpotential and the activities performed (dysfunction, escheat, obsolescence);
• an extended period without investments, which tends to significantly reduce thesite’s value in use—or even its exchange value—in the foreseeable future.
2.2.2 A Polysemic Notion
Brownfields can be found to different extents within industrialized countries aroundthe world. However, there is no such thing as a common, official definition of abrownfield, either on the European or American continents (Oliver et al. 2005). Theformulation of criteria to precisely describe the state of “brownfield” varies amongthe institutions concerned. As a matter of fact, the study by Oliver et al. identifiesas many as 19 different definitions and variations for the term brownfield in Europealone.
Several cultural or geographical tendencies, however, can be identified, such asthe idea that the term, in the American and Canadian understandings, mainly refersto land affected (or potentially affected) by contaminations due to former activities(Nathanail et al. 2003). For the government of Canada, for instance, brownfieldsare defined as “abandoned, idle or underutilized commercial or industrial properties
1 https://www.merriam-webster.com/dictionary/brownfield.

2.2 The Origin of the Word Brownfield and Its Polysemous Nature 9
where past actions have caused environmental contamination”.2 In the United Statesof America, a brownfield is a “property, the expansion, redevelopment, or reuse ofwhich may be complicated by the presence or potential presence of a hazardoussubstance, pollutant, or contaminant”.3
But to reduce our understanding of brownfields to the sole issue of contamina-tion would clearly be an over-simplification. Furthermore, some definitions, suchas the Spanish or Dutch ones, tend to limit the scope to former industrial activi-ties (Oliver et al. 2005). Analogously, the entry for brownfield in the BrownfieldsCenter’s glossary exclusively refers to an “industrial or commercial property”.4 Inreality, a multiplicity of factors, which we will further develop below, can potentiallylead to the creation of a brownfield. Field observations show that the term coversa rather heterogeneous reality of vast spaces crowded with obsolete infrastructures,mid-sized areas bearing witness to forgotten activities, and vacant lots at the heart ofurban fabrics.
Therefore, in view of the diversity of origins and situations, it is worth keeping inmind that the term itself, aswell as its resulting definition, has an inherent polysemousnature (Rey and Lufkin 2015). In that sense, the concept of tiers paysage introducedby Clément (2020) seems able to embrace themanymeanings of the term. Accordingto the French philosopher, brownfield refers primarily to something “abandoned”,but also, more rarely, to something “reserved”. The first category includes abandonedlands, formerly used for multiple purposes, such as agricultural, industrial, urban, ortouristic, whereas the second designates an unexploited site, whose existence may beeither coincidental or due to lack of access, which makes it impossible or expensiveto run.
Stemming from the American context, the concept of drosscape, developed by A.Berger, is another inspiring approach to inclusively accommodate the diverse natureof brownfields, which he regards as “waste landscapes” within urbanized territories(Berger 2007). European metropolitan areas, as we will see in the next sections, arereservoirs of such sites. In this sense, brownfield sites can be considered as an integralpart of the Horizontal Metropolis phenomenon (Viganò et al. 2018) and require fullattention from urban space professionals.
2.3 The Emerging Consensus Around a Definition
2.3.1 A Broad-Spectrum Definition
These observations underline the fact that there is no precise or unambiguous param-eter to designate a specific site as brownfield land. Rather, it is a situation that can
2 https://www.canada.ca/en/environment-climate-change/services/federal-contaminated-sites/about.html.3 https://www.epa.gov/brownfields/overview-epas-brownfields-program.4 https://web.archive.org/web/20150226001245/.

10 2 Urban Brownfields: Origin, Definition, and Diversity
present many different faces. Following this broad-spectrum perspective, the defini-tion established by the CABERNET network is one of the most commonly adoptedwithin scientific and research circles: “Brownfields are sites that have been affectedby the former uses of the site and surrounding land; are derelict and underused; mayhave real or perceived contamination problems; are mainly in developed urban areas;and require intervention to bring them back to beneficial use” (CABERNET 2006).Apart from the fact that contamination is not identified as a determining stake per se,three aspects are worthmentioning in the framework of this publication. The two firstare the urban character of brownfields and the need for intervention.Wewill have theopportunity to further both aspects in the following chapters. The third one is the termbeneficial use. In today’s context looking towards the sustainable city, “beneficialuse” implies that a brownfield regeneration project includes environmental, social,and economic considerations (Laprise et al. 2018). This will be considered in depthin Chap. 5.
Furthermore, besides the great variety of definitions, the common thread is acertain degradation of the urban fabric, as well as a loss of social and economicvitality. Since there is no single definition criterion, it is possible to assume that eachurban land reserve represents a positive opportunity to densify and rejuvenate theurban fabric at the neighbourhood scale. For this publication, we propose a definitionthat is flexible enough to optimise the potential development of abandoned sites andprecise enough to enable framing the discussion. This definition is largely inspiredby that of the Institut d’aménagement et d’urbanisme de la region d’Île-de-France(IAURIF), which revolves around three major principles (IAURIF 1999):
1. Dimension
The dimension is greater than half a hectare (i.e., 5,000 m2), whilst acknowl-edging that smaller sized abandoned lands might be of significant importancein terms of urban continuity.
2. Type
The nature and quality may be many and varied, according to the type ofactivities performed and the level of impairment of existing infrastructures.
3. Activity
The vacancy time is more than one year, considering that the longer the siteremains abandoned, the more negative the impacts on the surroundings will be.
It is worth noting that brownfields may also accommodate temporary or transi-tional uses (Oswalt et al. 2013), such as cultural events (artists’ workshops, exhibi-tions, festivals, or performances), or simple uses such as storage locations or parkingplaces. More on temporary uses in Chap. 6, “Key Steps of a Regeneration Process”.

2.3 The Emerging Consensus Around a Definition 11
2.3.2 Urban and Metropolitan Brownfields
The localization of brownfields can be very heterogeneous. However, as the titlesuggests, the present publication focuses more specifically on brownfields locatedwithin metropolitan areas, which are often referred to as urban brownfields, if notmetropolitan brownfields. Indeed, the phenomenon of metropolization, which canbe interpreted as the advent of urbanization on a global scale, exists within eachEuropean country (EU 2019).
Broadly speaking, we can define urban or metropolitan areas as territories with arather high density of population and a continuous built fabric. They can be character-ized by a two-fold dynamic, namely the extension of suburban and peri-urban areas,which tends to merge the main agglomerations and the concentration of activitieswithin urban polarities. At this stage, it seems important to underline that althoughmetropolization processes exist throughout Europe (and throughout the world), theyremain very specific to each region and continent. Therefore, as is the case for thenotion of brownfield, there is no precise, single definition of what is considered anurban or metropolitan area at European level.
This being said, it should be clarified that urban densification strategies devel-oped within the compact and polycentric city perspective are clearly not limitedto city centres (see Chap. 5). Our reflections, therefore, include a large numberof brownfields located within surrounding suburban rings and peri-urban areas,which represent particularly strategic opportunities for the sustainability transi-tion of metropolitan territories as a whole. The commonly accepted wording urbanbrownfield is therefore adopted for this work.
2.4 The Diversity of Urban Brownfields in Europe
2.4.1 A Multiplicity of Causes
In an ideal perspective, any city or urban region should offer at each moment of itshistory a total coherence between its “container” (the urban fabric) and its “con-tent” (the activities carried out thereon). However, it appears that these two essentialcomponents of the urban identity are governed by different logics. Whereas socio-economic data move in relatively short-term cycles, answers in terms of construc-tion, infrastructure, and networks are most often based on long-term dynamics. Thisfundamental discrepancy causes urban brownfields to appear (Rey 2012).
If the evolution of urban activities is spread over a long period of time, the progres-sive shift from one point of equilibrium to the next is possible through converting,transforming, and adapting buildings, public spaces, and infrastructures. Such spon-taneous regulating processes have persisted to the present day, in particular in stagesof economic growth, during which urban spaces are rapidly converted to new uses.If the evolution instead occurs within short-term cycles and the economic climate is

12 2 Urban Brownfields: Origin, Definition, and Diversity
rather stagnant, the micro-processes of reallocation prove unable to catch up with theemerging flow of abandoned lands and constructions. In case the situation extends, astock of brownfields inevitably appears, progressively carving the active urban fabric.Several specific causes for their appearance can be identified and are described below.
Land use is strongly impacted by a society’s technological developments, princi-pally in terms of energy sources, modes of transportation, and industrial innovations.The latter, whose objectives are to increase productivity, generally tend to decreasethe surface area required for their operation. From a historical perspective, the riskthat a large stock of urban brownfields is created concerns primarily metropolitanregions where a dominant activity, company, or institution occupies a particularlysignificant proportion of urban space. Indeed, an important mutation of the industryin question could abruptly free up surfaces clearly exceeding the requirements ofother activities.
The creation of a stock of urban brownfields is accentuated by the acceleratedchange of location of many activities. While some of them are moved towards theoutskirts of cities for logistical reasons, others are relocated in emerging countries foreconomic purposes. As an integral part of the increased territorial competition, thesephenomena tend to amplify along with the multiple restructuring processes associ-ated with financial globalization. The rapid pace of these mutations often preventsensuring the transfer of workforce from one company to another, or even from branchto another, even though the service, high-technology, tourism, and health sectors havenow taken over from more traditional production sectors in the European context.
In most industrialized countries, the modifications of economic activities leadto relatively different spatial needs, which tends to prevent fluid and harmonioussuccession of change of uses. In other words, the flow of cessation of activities andvacation of premises exceeds that of reuse inmany Europeanmetropolitan territories,hence the creation of a stock of vacant lands, infrastructures, and buildings.
2.4.2 Classification Attempts
After the definition of brownfields based on CABERNET and IAURIF, their identifi-cation and description, the next important phase of our reflection focuses on the clas-sification of brownfields—that is, their sorting into distinct categories. While someEuropean authors, such as (Ferber et al. 2006) or, more recently, (Dolezelová et al.2014), propose classification systems that tend to prioritize brownfields’ economicviability (namely, the A-B-C classification approach), others focus primarily on thetechnical or environmental dimensions (Schädler et al. 2012). Other kinds of cate-gorizations may refer to localization (rural, peri-urban, urban), type (under-utilized,vacant, derelict, dangerous), development phase (urgent need of action, in planning,etc.) (Ferber et al. 2006), ownership situation (multiple or single landowner, privateor public), and size of the site (Clarinet 2002).
In the framework of this publication, however, we have opted to conduct an urbanbrownfields’ classification by referring in the first instance to the activity performed

2.4 The Diversity of Urban Brownfields in Europe 13
on the site before its abandonment. Referring to authors such as (ACUF 2010; Lotz-Coll 2018), this approach based on the brownfield’s previous use not only allowsus to estimate the type and extent of potential soil contamination—and thereforeroughly predict remediation costs (more on this important issue in Chap. 4)—but itmay also help us focus on different reuse options (Clarinet 2002) and regenerationstrategies (Dolezelová et al. 2014).
Classifications based on brownfields’ origins typically include categories such asindustrial, railway, military, institutional, commercial, cultural, and leisure (Yakhlefand Abed 2019). Based on our previous experience (Rey and Lufkin 2015) and witha view to update the list of categories according to society’s recent evolutions, inparticular the energy transition, we propose a classification based on the followingeight categories: industrial, railway,military, waterfront, infrastructural, commercial,energy, and diverse.
However, due to the highly variable nature of brownfield land, establishing astrict typological classification is a complicated—and probably doomed—enterprise.Therefore, the eight categories of urban brownfields proposed within the presentpublication remain flexible. They are neither fully tight nor exclusive. Indeed, anabandoned site may, for instance, be considered simultaneously as an industrial andrailway brownfield, these two activities having been intimately linked in the past.Likewise, it can happen that a currently abandoned parcel of land had previouslyexperienced a change of use without having transited through a state of brownfield,that is, without a period of cessation of activities. By that we mean, for example,the case of a munitions factory that, due to decreasing demand in the armamentssector, may have been converted into a traditional mechanical manufacturing factory.The site in question might well belong to the categories of military and industrialbrownfields.
Finally, the idea, here, is not to establish an exhaustive list of urban brownfieldand regeneration projects across Europe, but rather to highlight the diversity andrichness of situations. Moreover, recent brownfield regeneration projects aim atintegrating explicitly sustainability-related considerations, in particular, its environ-mental dimension. This section will not focus specifically on these aspects, as theywill be the object of Chap. 5.
These considerationsmake it possible to put the proposed classification in perspec-tive, all while acknowledging its potential to create a reference framework. Itis our hope that this classification offers in-depth knowledge of the brownfieldsphenomenon without setting our understanding of it in stone.
2.4.2.1 Industrial Brownfields
At the European level, the lack of clear definition for the general notion of brownfieldalso extends to the concept of industrial brownfield. There is no such thing as aunique, shared definition of the term. In France, for example, an industrial brownfieldis considered as a “space, built or unbuilt, that has participated or still marginallyparticipates to an industrial activity and whose state of deterioration is such that any

14 2 Urban Brownfields: Origin, Definition, and Diversity
new use of the land or built structure is possible only after a significant rehabilitation”(Lusso 2013). In Germany, more radically, industrial brownfields are “abandonedspaces that have been used for production but can no longer host any economicactivity” (Güthling 2009). In Switzerland, the term designates “empty lands afterthe demolition of industrial constructions” and “disused industrial buildings”. In anevolutive perspective, the definition also includes sites that “have been the subject ofa reconversion plan” (ARE 2008).
Our concern here is to maintain a broad-spectrum definition of industrial brown-fields. Therefore, sites that hosted artisanal, handicraft or small manufacturing activ-ities, lightly mechanized, medium in size and production scale, are also includedwithin the “industrial brownfields” category. In reality, across the European territory,it is often impossible to establish a clear distinction between industrial and artisanalbrownfields. Therefore, these types of brownfields are mostly accounted for jointly.More on this topic in the section is dedicated to inventories and quantitative potential,Chap. 3.
The first industrial or artisanal brownfields essentially appeared from the 1950s,following both the creation of new industrial areas on the outskirts of urban regionsand significant cessations of activities in thefields of energy and industrial production.At first, this phenomenon seemed to concern mainly coalfield regions in NorthernEurope, the so-called noirs areas of Lorraine or Nord-Pas-de-Calais in France, or theRuhr in Germany (Lusso 2014). Great Britain, of course, is deeply affected by theeffects of deindustrialization, especially the counties of Staffordshire, Lancashire,West Yorkshire, Northumberland, and Durham, as well as the Great Manchester,South of Wales, and central Scotland regions (Beaver 1971; Lusso 2010). It is inter-esting to note here that the question of the recuperation of these early industrialbrownfields started being seen as a problem as early as the 1960s (Oxenham 1966).
In Switzerland, where land is a scarce resource due to a combination of smallterritory and limited possibilities of urbanization in the mountains, industrial declinestarted to be integrated into specialized studies on land use only from the beginningof the 1990s, noticeably later than in Great Britain. At that time, however, derelictindustrial zones were only seen in terms of an opportunity to create new workplaces,and not as a potential for new housing.
Progressively, industrial decline has spread across nearly all Europeanmetropolitan areas, all types of industrial and artisanal activities included (Raffestin1988). Peripheral regions in Europe, albeit to a lesser extent, have also been touchedby this development. In theAlps, for instance, where the phenomenon hasmanifestedwith considerable delay in comparison to the surrounding lowlands, deindustrializa-tion has been accelerated by the economic crisis of 2008, turning Alpine regionsinto an interesting field of study for researchers and professionals concerned withthe management of industrial brownfields (Modica 2019).
More often than not, the emergence of a new industrial brownfield site is thedirect consequence of the dynamics of offshoring enterprises. The decision to relo-cate is generally taken for economic reasons by an industrial company or group’smanagement. The offshoring may take place at highly variable distances, from arelocation towards the outskirts of the same urban region to the complete export of

2.4 The Diversity of Urban Brownfields in Europe 15
a production sector to another metropolitan region, country, or even continent. In aglobalized economy, issues related to this type of situations go clearly beyond thephysical limits of the concerned urban region.
More concretely, the abandonment of a production sector follows the convergenceof varied conditions, among which we can cite the more or less sudden emergenceof a technological obsolescence context, the failure to respond adequately to interna-tional competition—in particular in relation to so-called “emerging” countries (forinstance, steel factories or manufactured products)—or the closure of certain produc-tion sectors due to government decision, which is part of the political evolution ofsome nations’ global context (for instance, ammunition factories).
Industrial Sites from the Nineteenth and the First Half of the TwentiethCenturies
Because many parameters can lead to the creation of an industrial or artisanal urbanbrownfield, the spatial settings of these sites have many different aspects. A part ofindustrial brownfields is constituted by groups of buildings built in the nineteenthand the first half of the twentieth centuries, usually located within or close to histor-ical city centres, which were abandoned by the industries that had been their raisond’être. From the 1990s, a large portion of these sectors has been the subject of requal-ification projects that have, in particular, enabled actors to make industrial heritagepreservation a design principle (Bertrand 2018). Indeed, many of these construc-tions are well embedded in the urban fabric and have a considerable historic interest,often the driving force of intense heritage enhancement processes, sometimes calledpatrimonialization processes (more on heritage in Chaps. 3 and 5).
Culture tends to play a major role in these requalification processes, which seekto offer abandoned buildings or groups of buildings a second life. Indeed, the trans-formation of a brownfield into a cultural space represents a new opportunity forindustrial sites. Not only does it help to reintroduce life to a derelict place, but italso provides the surrounding neighbourhood with a new space for sharing sociocul-tural activities (Bertrand 2018; Fiori et al. 2020). Artists’ squats have often initiatedregeneration processes of industrial brownfields into cultural spaces. Frequently, thelatter are subsequently the object of institutional recuperation, turning a temporaryuse into a permanent one (Bosák et al. 2020). Other typical requalification functionsinclude educational or administrative programmes—for instance, companies lookingfor representative head offices—or, more recently, activities related to the digital andinformational revolution such as co-working spaces, digital campuses, or start-upincubators (Aoudjhane 2019).
Most European metropolitan areas host several such emblematic examples of re-allocated industrial brownfield sites from the nineteenth and beginning of twentiethcenturies, which provide unique opportunities to stimulate the local economy andpromote a new identity for the urban region as a whole. In addition to heritage preser-vation,manymore recent regeneration projects attempt to integrate sustainability andenvironmental issues more prominently (more in Chap. 5).
In France, we can point to several examples, for instance, the Friche La Belle deMai inMarseille, located in the formerManufacture des tabacs, which today includes

16 2 Urban Brownfields: Origin, Definition, and Diversity
artistic, cultural, exhibition, and theatre spaces (Rodrigues-Malta 2001). The Bellede Mai brownfield, occupied as early as 1992 by the SFT cultural association, laterbecame part of the Euroméditerranée plan—we will further develop this project inthe section dedicated to railway brownfields—with French architects Jean Nouveland Patrick Bouchain actively participating in its urban and architectural develop-ment (Bertrand 2018). Another interesting example, also located in Marseille, isthe building of Rizeries Indochinoises, originally built in 1885 to transform andpackage rice imported from Indochina. Abandoned since 1968, the building wascompletely transformed in 2000 to host the headquarters of a telecommunicationscompany. Other recent industrial brownfield regeneration projects include EuraTe-chnologies in Lille (see Fig. 3.2, Chap. 3), established within an 8-ha digital campus,the redevelopment of the ancient factories of the Dollfus-Mieg et Compagnie (DMC)and the KMØ in the former casting foundry of the Société Alsacienne de construc-tion mécanique (SACM), both located in Mulhouse, or the Lab’o digital incubatorinstalled within a 4-ha industrial brownfield in the city centre of Orléans (Aoudjhane2019).
We can also cite several famous cases in Central Europe, in Switzerland forinstance: the emblematic transformations of the Sulzer industrial areas inWinterthur,or those of previously derelict sites in Zurich West, such as the Hürlimann Areal, anancient brewery that now hosts a spa, shops, and restaurants in the midst of the city,the Löwenbräu Areal, which has become an important contemporary arts centre,or the Maag Areal, the headquarters of the Prime Tower, the highest skyscraperin the country, which embodies the mutation of an industrial district into a livelyalternative, then economic centre. Belgian examples include the impressive KanalPompidoumuseum, installed in a former Citroën factory in the city centre of Brusselsbuilt in 1934 or the recent LaVallée in Molenbeek, a co-working space for creativesestablished in a former laundry facility,which hostsmore than 100 art and innovation-oriented entrepreneurs (Bertrand 2018).Many examples can also be found in Poland,such as the Manufaktura shopping centre, established within the former Poznanskifactory in the city of Lodz (Kozlowska, 2007).
Northern and Baltic countries such as the Netherlands, Sweden, Denmark,Finland, Estonia, Latvia, and Lithuania also have a rather high—sometimesextremely high—number of abandoned industrial sites from the nineteenth centuryand the first half of the twentieth century located in the heart of their cities (Qureshiand Leal Filho 2007). Hence, there is a very long list of successful industrial brown-field regeneration projects, among which we have made a selection aiming at illus-trating the diversity of approaches. Werkspoor District in Utrecht, the Netherlands,an immense former industrial warehouse with a length of 175 m, is now a symbolfor the circular economy. It houses a range of businesses, from creative independententrepreneurs to a large beer brewery (see Figs. 2.1 and 2.2). In the centre of Riga,Latvia, we can cite theKimmelQuarter, a nineteenth century beer brewery to be rede-veloped into office buildings and a hotel with public facilities on the ground floor(gym, child care, café, spa, food court, etc.) (Luca 2019). Estonia also has a certainnumber of examples, such as the Rotermanni Quarter and the Telliskivi Creative City,both in the city of Tallinn, or the former Widget Factory in Tartu, transformed into

2.4 The Diversity of Urban Brownfields in Europe 17
Fig. 2.1 Werkspoor Fabriek, Utrecht (NL). Transformation of an industrial warehouse into amixed-use office building in the Werkspoor District. Zecc Architecten, 2016–2019 (photo: © ZeccArchitecten and Stijn Poelstra, 2019)
Fig. 2.2 Werkspoor Fabriek,Utrecht (NL). Transformation of an industrialwarehouse into amixed-use office building in the Werkspoor District. Interior view. Zecc Architecten, 2016–2019 (photo:© Zecc Architecten and Stijn Poelstra, 2019)

18 2 Urban Brownfields: Origin, Definition, and Diversity
a “culture factory”, which has housed creative entrepreneurs, artists and designerstudios, commerce and entertainment and a flea market since 2014 (Luca 2019).
Large Sub- or Peri-Urban Industrial Sites
Other sectors, generally located outside city centres, within the suburban or peri-urban areas of a metropolitan territory, may be characterized by the presence ofindustrial installations covering large areas (such as steel plants or metal factories),or heterogeneous ensembles of production-related and auxiliary structures (such asoffice buildings, warehouses, or depots). Considering these sites’ substantial size andspecific territorial location within intermediary or “in-between” territories (Rueggand Deschenaux 2003; Sieverts 2004), it can frequently happen that their redevel-opment is caried out with the contribution of landscape architects or artists whodevelop a thought process aiming at rebuilding a new landscape that is likely to offeran attractive and innovative environment.
In Germany, we can cite the famous example of the Internationale BauausstellungEmscher Park (IBAEmscher Park), in the conurbation of theRuhr,which experienceda profound economic decline from the 1960s due to the gradual cessation of the textileindustry and coal mining, its major industrial activities (Lusso 2010). The urbanregeneration project developed by the Land of the Rhineland of North-Westphaliaproposes a highly ecological, cultural, and patrimonial approach, aiming at recon-structing the landscape and restoring the river Emscher system while highlightingthe industrial cultural heritage. The regional landscaped park, which covers approx-imately 45,000 ha, was designed by renown landscape architects, among whom wasPeter Latz, author of the Landschaftspark inDuisburg-Nord. The industrial structureswere preserved and participate in creating new, striking aesthetics of the site.
Eternitten inAalborg, Denmark, is another interestingNorthern Europe reference.Located 1.5 km southeast of the city centre, the 36-ha former industrial area (whichhoused Danish Eternit since 1927) has become a resolutely mixed-use urban districtwith residential units (in particular youth and student housing), workplaces, stores,cafes, and amenities.
Another emblematic European example is the Belval project in Grand Duché duLuxembourg, close to the French border, whose redevelopment project has allowedthe preservation of approximately 550 ha of greenfield sites, that is, the equivalentof 3 years of urbanization (Cenci 2018; Glumac and Decoville 2020). The QueenElisabeth Olympic Park in east London, England, which was built and regeneratedfor the 2012 SummerOlympics and Paralympics, can also be cited as one of themajorEuropean operations of this kind (Hou et al. 2015). The EntrepôtMacdonald in Paris,France, is another impressive example: the former 617-m-long concrete building,built in the 1970s and located between the exterior boulevards and the Parisian ringroad, has become the centrepiece within the wider urban transformation of north-eastParis. The project realized between 2007 and 2015 by OMA consisted in building anew piece of the city atop an existing one, includingmore than 1,100 residential units(among which 50% is social housing), retail spaces, cafés and restaurants, offices, abusiness incubator, and amenities (Rambert 2015).

2.4 The Diversity of Urban Brownfields in Europe 19
Southern Europe, Italy in particular, also hosts an important number of examplesof huge industrial complexes that have been the subject of regeneration projects.The ILVA steel plant in Bagnoli, in the Western periphery of Naples, is one ofthem. Closed at the end of the 1980s after the relocation of its activities in Asia, theindustrial site, rebranded “Bagnoli Futura”, today hosts a more or less successfulmultifunctional complex dedicated to tourism (Parisi 2011; Manceau 2014). ParcoDora in Torino, Northern Italy, designed by landscape architects LATZ+PARTNER,is another successful example of the transformation of a former metallurgical plantinto an urban park (see Fig. 2.3).
In Switzerland, the Attisholz-Areals, a 110-ha former cellulose factory, is thecountry’s largest industrial brownfield undertaking a regeneration process. The siteof the ancient Briqueterie et Tuilerie de Renens (BTR), located in West Lausanne,offers another interesting example of suburban industrial brownfields awaiting newuses—albeit at a smaller scale than the previous examples. A new mixed-use neigh-bourhood including housing and activities is expected to be built on this 25-ha site.Like the above-mentioned Emscher Park project, the suburban character is predom-inant: the confluence of heterogenous sceneries reveals specific landscaping issues,which resonate with the emergence of a metropolitan region on the entire SwissPlateau (Rey 2017).
Beyond these stimulating examples of successfully regenerated industrial sites,it is important to stress that there is still an important number of sites awaitinga redevelopment project (Qureshi and Leal Filho 2007). Indeed, many European
Fig. 2.3 Parco Dora, Torino (IT). Transformation of a former metallurgical plant into an urbanpark. LATZ + PARTNER, 2012 (photo: Uccio “Uccio2” D’Agostino, 2015)
20 2 Urban Brownfields: Origin, Definition, and Diversity
industrial sites still have the status of brownfield, that is, they have not yet beenregenerated. The cities of Turku (Finland), Livani (Latvia), orKohtla-Järve (Estonia),for instance, are sadly famous for their large industrial brownfields. In Romania too,brownfield sites are still very common, especially in big cities like Timisoara and informer industrial cities (Moscovici et al. 2017). But it would be wrong to think thatthe topicality of the industrial brownfield subject is restricted to Baltic or EasternEuropean countries. As the section dedicated to inventories will demonstrate (seeChap. 3), Western European countries also remain largely affected by the brownfieldphenomenon, both in terms of qualitative and quantitative potentials.
2.4.2.2 Railway Brownfields
Inmost European countries, railway companies—and armies—are among the largesturban landowners. Their property, both land and buildings, is of considerable signif-icance in terms of urban development—although it is not exclusively located withinmetropolitan areas and is often characterized by relatively linear configurations,which tend to be sub-optimal for traditional urban forms.
On an indicative basis, the total French railway heritage is estimated at 110,000ha, which correspond to approximately 4% of the total urbanized surface (Coutellier2003; Giraud 2006). If the French railway brownfields are mainly sites linked with4,000 km of disused railroads, they also include a certain amount of technical orfunctional buildings that no longer serve rail operation purposes (Lotz-Coll 2018).In England, the land property of the railway sector is also significant. It representsapproximately 70,000 ha, or around 2.6% of the total urbanized surface (DEFRA2003). In Switzerland, one of the European countrieswith the densest rail networks—togetherwithGermany and theCzechRepublic—the railway property proportionallyhas a large surface: approximately 13,000 ha, which represents almost 5% of the totalurbanized surface (OFS 2003). By way of comparison, the German railway companyDeutsche Bahn (DB) owns 120,000 ha, which also represent approximately 5% ofthe country’s overall built-up areas (OECD 2014).
However, if it is relatively easy to determine the surface of railway companies’land holdings, it is extremely difficult to estimate the exact extent of areas locatedwithin metropolitan areas that are no longer needed for rail operation. At the endof the 1990s, diverse sources estimated that 5–10% of the impressive amount ofsurfaces owned by rail companies could be considered as brownfields (Chaline 1999).Today, in most European countries, these disused railway brownfields have beenacknowledged as a strategic asset: as land reserves located in urban, suburban, orperi-urban territories, situated in close connection to public transport systems, theyoffer particularly interesting features for metropolitan areas in a transition towardssustainability (Merzaghi and Wyss 2009).
Recognizing this, and aware of the valuation gains achievable through obtainingbuilding rights, several European railway companies have created dedicated realestate management divisions. It is for instance the case of SBB Real Estate, respon-sible for the operational direction and development of the Swiss Federal Railways’s

2.4 The Diversity of Urban Brownfields in Europe 21
land property (Lufkin 2010). In France, the initiative Espace Ferroviaire, a subsidiaryof the Société nationale des chemins de fer français SNCF (the French NationalRailway Company), plays the role of urban planner and real estate developer onbehalf of the latter (SNCF 2021). InGreat Britain, NetworkRail Property specializes,among others, in property and land development for Network Rail, the owner, oper-ator, and developer of Britain’s railway infrastructure. Its activities include releasingland for development through partnerships with public and private sectors (NetworkRail 2021).
Indeed, the specific interest of railway brownfields—versus industrial brownfieldsin general—is the ability to engage in a joint reflection with a single stakeholder(Jaccaud et al. 2009). With that in mind, it is possible to identify different types ofrailway brownfields; each has particular qualitative potentials that require specificdevelopment strategies.
Abandoned Railway Stations
The first type of railway brownfield includes former railway stations dedicated eitherto passengers, freight or yard, totally or partially abandoned due to the evolu-tion of demand. In many cases, similarly to railway brownfields, because of theirsymbolic and heritage dimensions, these buildings have been the subject of ambitiousregeneration projects revolving around cultural activities.
Several iconic examples can be cited across Europe, such as the Gare d’Orsay inParis, which became a museum after forty years of abandonment, or the HamburgerBahnhof in Berlin, which eventually shared the same evolution. Heavily bombedduring World War II, the latter building situated in the no man’s land between EastandWest Berlin remained abandoned for several decades. Finally, after a long recon-struction work, the building hosts a contemporary art museum since 1996. Morerecent examples include Station F, established in the former Halle Freyssinet ofGare d’Austerlitz in Paris, inaugurated in 2017 (see Fig. 2.4). The former freighthall, measuring 34,000 square metres and built in 1920 by French engineer EugèneFreyssinet, was transformed into the world’s biggest start-up campus (Aoudjhane2019). Another interesting reference in Paris is Ground Control, in close proximityto Gare de Lyon. This former mail sorting hall belonging to SNCF has become anindependent cultural space including cafés, restaurants, stores, a photo studio, andan art gallery.
There are of course several examples of still derelict train stations across Europe.We can cite the Berlin-Pankow-Heinersdorf station in Berlin or the Estación Interna-cional de Canfranc, in the Spanish Pyrenees, probably one of the most emblematicbuildings of this category although not in a metropolitan area.
Obsolete Railway Areas
The second type of railway brownfield includes railway areas that are no longeruseful due to certain technological evolutions. Significant sectors are thus suddenlyderelict, either because line sections are abandoned in favour of new ones or becausespace requirements decrease. Furthermore, freight transport activities follow thistrend: globally, the amount of goods carried by rail decreases, and (un)loading is
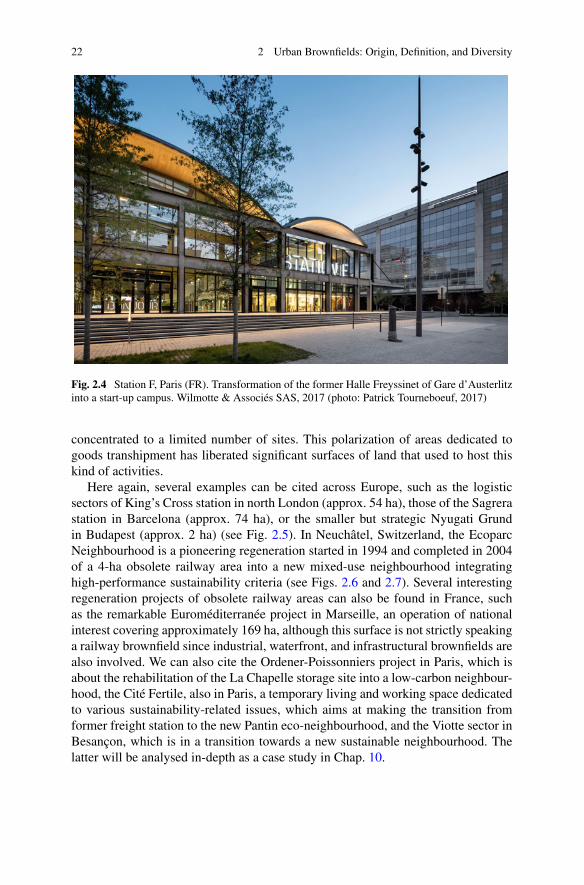
22 2 Urban Brownfields: Origin, Definition, and Diversity
Fig. 2.4 Station F, Paris (FR). Transformation of the former Halle Freyssinet of Gare d’Austerlitzinto a start-up campus. Wilmotte & Associés SAS, 2017 (photo: Patrick Tourneboeuf, 2017)
concentrated to a limited number of sites. This polarization of areas dedicated togoods transhipment has liberated significant surfaces of land that used to host thiskind of activities.
Here again, several examples can be cited across Europe, such as the logisticsectors of King’s Cross station in north London (approx. 54 ha), those of the Sagrerastation in Barcelona (approx. 74 ha), or the smaller but strategic Nyugati Grundin Budapest (approx. 2 ha) (see Fig. 2.5). In Neuchâtel, Switzerland, the EcoparcNeighbourhood is a pioneering regeneration started in 1994 and completed in 2004of a 4-ha obsolete railway area into a new mixed-use neighbourhood integratinghigh-performance sustainability criteria (see Figs. 2.6 and 2.7). Several interestingregeneration projects of obsolete railway areas can also be found in France, suchas the remarkable Euroméditerranée project in Marseille, an operation of nationalinterest covering approximately 169 ha, although this surface is not strictly speakinga railway brownfield since industrial, waterfront, and infrastructural brownfields arealso involved. We can also cite the Ordener-Poissonniers project in Paris, which isabout the rehabilitation of the La Chapelle storage site into a low-carbon neighbour-hood, the Cité Fertile, also in Paris, a temporary living and working space dedicatedto various sustainability-related issues, which aims at making the transition fromformer freight station to the new Pantin eco-neighbourhood, and the Viotte sector inBesançon, which is in a transition towards a new sustainable neighbourhood. Thelatter will be analysed in-depth as a case study in Chap. 10.
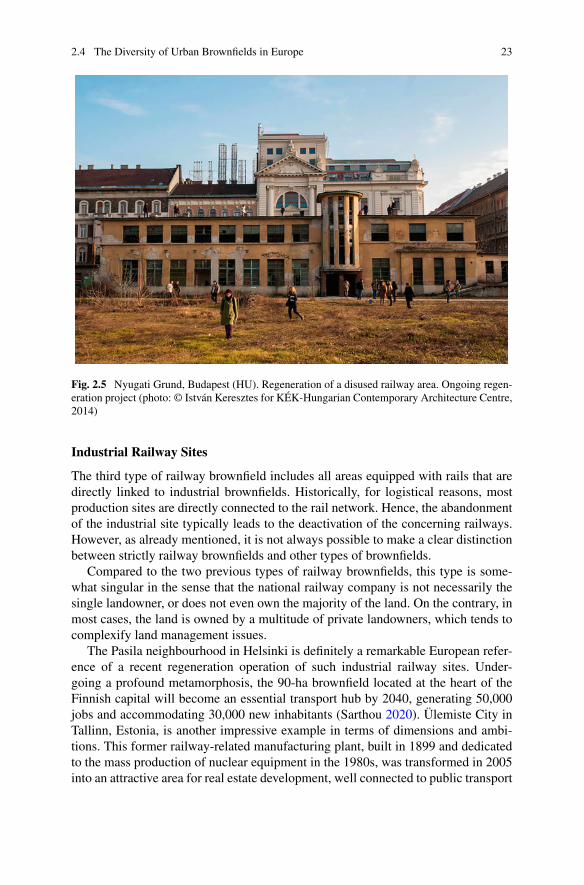
2.4 The Diversity of Urban Brownfields in Europe 23
Fig. 2.5 Nyugati Grund, Budapest (HU). Regeneration of a disused railway area. Ongoing regen-eration project (photo: © István Keresztes for KÉK-Hungarian Contemporary Architecture Centre,2014)
Industrial Railway Sites
The third type of railway brownfield includes all areas equipped with rails that aredirectly linked to industrial brownfields. Historically, for logistical reasons, mostproduction sites are directly connected to the rail network. Hence, the abandonmentof the industrial site typically leads to the deactivation of the concerning railways.However, as already mentioned, it is not always possible to make a clear distinctionbetween strictly railway brownfields and other types of brownfields.
Compared to the two previous types of railway brownfields, this type is some-what singular in the sense that the national railway company is not necessarily thesingle landowner, or does not even own the majority of the land. On the contrary, inmost cases, the land is owned by a multitude of private landowners, which tends tocomplexify land management issues.
The Pasila neighbourhood in Helsinki is definitely a remarkable European refer-ence of a recent regeneration operation of such industrial railway sites. Under-going a profound metamorphosis, the 90-ha brownfield located at the heart of theFinnish capital will become an essential transport hub by 2040, generating 50,000jobs and accommodating 30,000 new inhabitants (Sarthou 2020). Ülemiste City inTallinn, Estonia, is another impressive example in terms of dimensions and ambi-tions. This former railway-related manufacturing plant, built in 1899 and dedicatedto the mass production of nuclear equipment in the 1980s, was transformed in 2005into an attractive area for real estate development, well connected to public transport

24 2 Urban Brownfields: Origin, Definition, and Diversity
Fig. 2.6 Ecoparc Neighbourhood, Neuchâtel (CH). Aerial view on the pioneering regenerationproject of an obsolete railway area into a sustainable neighbourhood.BauartArchitects andPlanners,2000–2011 (photo: © Yves André, 2013)
Fig. 2.7 Ecoparc Neighbourhood, Neuchâtel (CH). An open public space in the heart of thesustainable neighbourhood. Bauart Architects and Planners, 2000–2011 (photo: © Yves André,2013)

2.4 The Diversity of Urban Brownfields in Europe 25
and perfectly adapted for smart-city-related activities (Luca 2019). The 35-ha areahosts approximately 400 businesses, a park, and cafes. In order to make the placelively outside working hours—one of the improvement potentials of the regenerationproject—residential surfaces are expected to be included by 2025.
There are also examples of smaller-scale hybrid, largely industrial railway sites,such as the derelict industrial railway of Fribourg, Switzerland. Originally stretchingbetween the main station and the sawmill plant located at the end of the Pérollesplateau, the ancient railwaybuilt in 1871 contributed considerably to the zone’s indus-trial development. From the 1960s, following the creation of new industrial areas onthe outskirts of the urban region, companies started to leave the plateau. This progres-sive deindustrialization liberated an important number of structures, including theformer Cardinal brewery, which eventually closed in 2011. The cantonal and munic-ipal authorities took this opportunity to create a new innovation-based neighbourhoodmeeting high environmental standards. Entitled blueFACTORY, the project includesthe creation of the Smart Living Lab, a research centre bringing together scientistsfrom Ecole Polytechnique fédérale de Lausanne (EPFL), the University of Fribourg(UNIFR), and the Haute école d’ingénierie et d’architecture de Fribourg (HEIA-FR).
2.4.2.3 Military Brownfields
From the eighteenth century and until the middle of the twentieth century, the recur-rence of armedconflicts resulted in the establishment ofmultiplemilitary installationswithin metropolitan territories on the European continent as a whole. Hence, armieshave become among the largest landowners. For illustrative purposes, we can stressthat the French military sector owns about 268,000 ha, which represent close to 10%of the country’s total urbanized surfaces (Coutellier 2003). In the UK, the militaryowns over 450,000 ha—or the equivalent of up to 32% of total built-up areas—whichmakes them the third biggest owner in the country (ABC Finance 2018). In Switzer-land, the army is resolutely the biggest landowner in the country. The military owns24,000 ha of land—or the equivalent of the entire Canton of Zoug, i.e., approximately12% of total urbanized land (Rey and Lufkin 2015).
After a long period of stability, a substantial decrease of military budgets occurredfrom the 1980s. This reduction, as well as other factors such as enhancing militarytechnology, led in the 1990s to the emergence of huge military brownfields aroundthe world in general, and in Europe in particular (Jauhiainen 2007). Several Euro-pean countries made efforts to streamline the size of their military heritage, by wayof selling the sites that no longer had a true operational or strategic raison d’être(Jaques 2004). Therefore, throughout the decade of 1990, successive reforms andrestructurings of the military led to the progressive liberation of many surfaces likelyto be rehabilitated for civil uses.
If this phenomenon is significant in European countries in general, it is particularlythe case in Central Europe, where troops from the NATO and the Warsaw Pacthad been stationed. After their departure, disused military bases are progressivelyrestituted to central public authorities, who more often than not dispose of them for
26 2 Urban Brownfields: Origin, Definition, and Diversity
the benefit of local and regional authorities (Beyer 2006). In Poland, for instance,76,000 ha of post-military land were liberated after 1990 due to the surrendering ofthe Russian Federation Army and the reduction of the number and sizes of the PolishArmy bases (Jarczewski and Kuryło 2010). Although only a relatively small part ofthis surface (11,861 ha) is located within urban areas, this nevertheless represents aconsiderable land resource for the country.
Similarly, in the Balkan region, and notably in Croatia, the reorganization of thedefence system has led to an increasing number of abandoned military sites, espe-cially within major cities. A recent inventory identified more than 325 ha of mili-tary brownfields in the Zagreb Urban Agglomeration alone (Matkovic and Jakovcic2020).
Another typical example of the phenomenon of the liberation of military basesis the Baltic region (Jauhiainen 2007). Latvia, for instance, is particularly affected,with approximately 850 sites abandoned after the withdrawal of the Soviet forces.Furthermore, it is estimated that 300 sites among the latter, covering an area ofapproximately 95,000 ha, are contaminated due to the presence of unexplodedmines,bomb residues, heavy metals, residues from waste incineration, fuel contaminationin former missile bases, and sediment contamination at marine bases (Qureshi andLeal Filho 2007).
Yet, for obvious confidentiality issues, the national competence centres respon-sible for managing military land have been the subject of far less detailed studiesthan their corresponding divisions in the railway sector. Some of these surfacesliberated for civil reconversion purposes were not necessarily qualified as urban ormetropolitan when they were established as military areas, but they progressivelybecame integrated into such territorial contexts due to urban sprawl. Inherited frommultiple evolutions in terms of defence strategies, the spatial configuration of thesemilitary sites may vary from one brownfield to the next.
In the city centres, it is mostly about command buildings, such as, for instance, theFrench Ecole Militaire, which covers around ten hectares in Paris. These buildings,which often represent a considerable heritage value, are frequently rehabilitated forother types of institutional uses or may also be converted into residential units.Another relevant Swiss example is that of the former army barracks in Geneva, builtat the end of the eighteenth century, which now accommodate chic apartments inthe heart of the old town. It is worth noting here that this type of rehabilitation ofmilitary constructions located in historical centres is not new or unusual. It has beenpart of the transformation processes of European cities for centuries.
In metropolitan sectors located in close proximity to the city centre, militarybrownfield sites usually include former military garrisons, with barracks, arsenals,hospitals, warehouses, fuel stations, etc. They often create urban enclaves that maycover significant surfaces. Several examples can be cited, in Italy to start with, suchas the Caserna Sani (11 ha) in the city centre of Bologna, the Artillery Arsenal FranzJosef (13 ha) in the city centre of Verona and the Pertite area (28 ha) in the citycentre of Piacenza (Ponzini and Vani 2014). In France, we can also mention severalsuccessful rehabilitation projects, mostly steered by “Sociétés d’Economie mixte”(SEM), such as the Plateau des Capucins in Brest, a former 11 ha-site military

2.4 The Diversity of Urban Brownfields in Europe 27
area in the city now dedicated to housing, economy, leisure, culture, and tourism(see Figs. 2.8 and 2.9), the Bosquet barracks in Mont-de-Marsan, in the Landesdepartment, now an administrative and residential pole, or the quite famous formerbarracks in Albi, transformed into a new university campus hosting around 2,800students (Cros 2008, 2011; AFP 2014). Another emblematic example of this type ofmutation is the progressive transformation of the arsenal of Sion, Switzerland, intoa cultural centre including a media library, cantonal archives, the municipal library,and the “Culture Valais” platform.
Military brownfields can also include sites located inmore peripheralmetropolitanareas, hosting defence facilities, fortification works, airbases, or submarine bases.The size of these sites can be rather impressive, such as the 230-ha innovation parkplanned on the former Dübendorf airfield, located near Zurich, Switzerland, or the166-ha masterplan for the transformation of the old army barracks of Aldershot,UnitedKingdom, into a newdistrict (Bagaeen andCelia 2018). TheEstonianNationalMuseum in Tartu, Estonia, also provides a striking example. Located in the formerRaadi Manor, built in 1783, the museum was established in 1922. Heavily damagedin 1944 during the fighting between German and Soviet forces, it was subsequentlytransformed into a Soviet military airbase. Hence, access was restricted for fiftyyears and the site became a “closed city”. Officially inaugurated in 2016, the actualmuseumbuilding, located on the abandonedmilitary land, is designed as a brand-newentity symbolically built over the “ruins” of history.
Fig. 2.8 Plateau des Capucins, Brest (FR). Regeneration of a former military area into a mixed-useneighbourhood dedicated to housing, economy, leisure, culture, and tourism. Public space and urbancable car, 2017 (photo: Emmanuel Rey, 2019)

28 2 Urban Brownfields: Origin, Definition, and Diversity
Fig. 2.9 Plateau des Capucins, Brest (FR). Regeneration of a former military area into a mixed-useneighbourhood dedicated to housing, economy, leisure, culture, and tourism. Interior view. Atelierde l’île, 2017 (photo: Emmanuel Rey, 2019)
Ultimately, each disused military site is unique. In that sense, each site is likely topresent interesting architectural features, sometimes with buildings that are symbolicfor the history of the entire metropolitan area. Their rehabilitation can thereforesignificantly contribute to the development of the city or region. To wrap up thissection on military brownfields, we can cite several inspiring references, such asthe city of Cherbourg, France, which created a new campus for the InternationalFilm School of Paris (French: École Internationale de Création Audiovisuelle etde Réalisation, EICAR) by transforming the 10-ha site of a former army hospitalcomplex; the Herzogenaurach former German military site, which was graduallydeveloped into the current 59-ha sports campus ofAdidas, whose global headquartersis located in this Bavarian city (Beyer 2006); or the implementation of a solar parkin the abandoned Tutow air base, also in Germany. And last but not least, one ofthe most spectacular transformations is probably the creation of the Tropical Islandtheme park, the world’s largest indoor tropical swimming pool, in the huge airshiphangar of the former Brand-Briesen airfield in Halbe, near Berlin (Beyer 2006).
However, although several military sites are already being or have already beenregenerated—sometimes with a lot of creativity, as the above-cited references illus-trate—there is still an important stock of military brownfields awaiting new uses.Indeed, the conversion of military sites into new pieces of the city is far from easy,but rather a complex andmultidimensional process (Ponzini and Vani 2014; Bagaeen

2.4 The Diversity of Urban Brownfields in Europe 29
and Celia 2018). Furthermore, the former activity of these sites often causes miscon-ception or even mistrust in their regard (Lotz-Coll 2018). Among the considerablenumber of still abandoned, disused or underused military areas, we can cite, asmost renowned examples, the Ma.C.Ri.Co. (the acronym of Magazzino CentraleRicambi Mezzi Corazzati) in Caserta, Italy (32.5 ha) (Di Pinto 2020), the ArtilleryArsenal Franz Josef in Verona, Italy, the Metz-Frescaty military airbase in the Metzmetropolitan area, France (AFP 2014), or the Željava airbase, situated on the borderbetween Croatia and Bosnia and Herzegovina, one of the largest underground airportand military airbases in Europe.
2.4.2.4 Waterfront Brownfields
The naval field has always been a stimulus for the development of cities: rivers andseas have often been a driver in the choice of a site. Until the middle of the twentiethcentury, waterfront sectors were places dedicated to multiple commercial activitiesthat combined storage, handling, and production. Due to the significance of fluvio-maritime transport during the early industrialization era, a large number of factorieswere indeed created along the shores of rivers, lakes, and seas (Urban Vestbro 2007).Often located in the centre of urban regions, they represented their economic base,whether as a simple river port (such as Paris, Frankfurt or Prague), as an estuarysite (such as London, Hamburg, Nantes or Lisbon) or as installations in proximityto the open sea, like most Mediterranean harbours (such as Barcelona, Marseille orGenoa).
However, while ensuring substantial sources of income, these mostly indus-trial harbour sectors also contributed to making these waterfronts inaccessible and,therefore, unattractive to civil society. From the 1970s, these sites started under-going radical reconsideration in most fluvio-maritime metropolitan regions acrossthe world, including Europe, resulting in a multiplication of abandoned waterfrontareas. Due to competition with land transportation, and even more so under theeffect of new logistical requirements (shift to container technology, new constraintsin terms of handling, storage and access), the storage function of these areas has beenconsiderably reduced (IRSIT 2004).
Today, waterfront brownfields include loading and unloading docks, piers andwharves, basins, warehouses and storage buildings, production facilities, and ship-yards, sometimes located beyond the original borders of industrial cities, which werelater included within the territories of fluvio-maritime metropolitan regions with theadvent of urban sprawl. They are often characterized by a sectorial organization thattends to separate urban and harbour spaces from their associated industrial zone.Therefore, the reconversion of such waterfront areas is a rather slow and complexprocess. It requires a decompartmentalization or re-permeabilization of the urban-harbour interface, which is to become a new public space shared among the diversestakeholders of the metropolitan region (Tiano 2010; Lotz-Coll 2018).
We can cite, to illustrate these waterfront liberation processes, the case of theharbours situated along the riverbanks of the Parisian Seine, which underwent a

30 2 Urban Brownfields: Origin, Definition, and Diversity
radical decrease of their port activities, in particular following the removal of ware-houses in Bercy, Tolbiac and the reduction of the business sectors along the Saint-Martin canal. Dunkerque (180 ha), La Seyne-sur-Mer near Toulon (40 ha), andLa Ciotat near Marseille (40 ha) are other well-known French examples of ship-yards abandoned due to the economic crisis faced by the shipbuilding industry(Lelogeais 2005; Prelorenzo 2010). Bilbao, Spain, an ancient industrial city dedi-cated to ironworks and chemistry, also hosts considerable surfaces of waterfrontbrownfields resulting from deindustrialization processes that drastically affectedthe region (Bertrand 2018). The city of Prague, which presents a particularly largesurface of waterfront brownfields (approximately 160 ha of abandoned factories andwarehouses), is another typical European example (Chaline 1999; Vantorre 2018).
Several inspiring examples of beautifully regenerated harbour brownfields can befound in Europe. In Northern Europe, to start with, we can cite the Frøsilo project byMVRDV, a radical waterfront conversion of an ancient silo into a residential buildingin the old harbour area ofCopenhagen, or the impressive Paper Island project byCobearchitects, also situated in the Danish capital, which consists of the rehabilitation offormer maritime paper storage facilities into a new district with street food halls,art exhibitions, fashion shows, concerts, and flea markets (see Fig. 2.10). Otherinteresting examples inNorthernEuropean countries include, in a non-exhaustive list,the NDSMWharf in North Amsterdam, a former shipyard that hosts festivals, fairs,exhibitions, and even Europe’s largest flea market (Luca 2019), and the emblematicexpansionof thePortAuthorityBuilding inAntwerp, byworld-famous architect ZahaHadid. Telakkaranta is another harbour regeneration project in Helsinki, Finland (seeFig. 2.11). The historic shipyard is planned to open to the citizens as a dense, lively,
Fig. 2.10 Paper Island, Copenhagen (DK). Rehabilitation of former maritime paper storage facil-ities into a new district with street food halls, art exhibitions, fashion shows, concerts, and fleamarkets. Cobe architects, ongoing project (photo: News Øresund – Jenny Andersson, 2016)

2.4 The Diversity of Urban Brownfields in Europe 31
Fig. 2.11 Telakkaranta, Helsinki (FI). Regeneration of a historic shipyard into an urban waterfrontneighbourhood. Lundgaard & Tranberg Arkitekter, ongoing project (image: © Skanska, Huttunen-Lipasti Arkkitehdit and Lundgaard & Tranberg Arkitekter A/S, 2021)
urban waterfront neighbourhood, offering a promenade with cafes, restaurants anda jetty, but also apartments for about 300 people, as well as business and culturalfacilities (Luca 2019).
In Western Europe, we can cite the Bassin à flot project, a 160-ha site at the heartof urban development strategies of the metropolitan region of Bordeaux, France, theNeptune project in Dunkerque, also in France, a former 180-ha shipyard in closeproximity to the city centre. The Baltic Sea region cities are also rich in waterfrontbrownfields and regeneration projects, such as—to name but one—Spıkeri Quarterin Riga, Latvia. This former port warehouse area from the nineteenth century, usedfor cargo loading and unloading, is an inspiring example in terms of heritage (13warehouses out of 58 have been preserved and included in the UNESCO WorldHeritage list) and public space design and activation: the project, which includes anew promenade along the Daugava embankment and hosts flea markets, fairs, and amodern culture forum (Luca 2019).
2.4.2.5 Infrastructural Brownfields
In a similar manner to industrial sectors, many facilities and infrastructures are alsosubject to processes of technological change that can lead to the abandonment ofsome sites, which, in turn, leads to the creation of urban or metropolitan brownfields.Although it seems impossible to compile an exhaustive inventory of suchmultifacetedphenomena, several categories of infrastructures, relatively significant in terms offunctional evolution and rehabilitation potential, can nevertheless be identified.

32 2 Urban Brownfields: Origin, Definition, and Diversity
Transport-Related Infrastructures
Beyond railway and fluvio-maritime fields, the entire transport field has been subjectto substantial mutations since the middle of the twentieth century. Following logis-tical evolutions, many transport infrastructures become obsolete and lose theirprimary function.
We can cite the case of airports that become too landlocked due to the urbanextension of ametropolitan area, such as Croydon in London, or Tempelhof in Berlin,which became a huge 350-ha public park—that is, larger than Central Park in NewYork. Former tram depots, such as Kalkbreite in Zurich, Switzerland, also belongto this category. For this latter cooperative project, opened in 2014, the on-site tramdepot was covered by a 2,500 m2 terrace above the tracks, available to residents andthe public as a green recreation area. This kind of infrastructural brownfield mayalso include sites related to road transport, such as ancient bus stations (for instanceBellevue, south of Saint-Etienne, France) or motorway viaducts. This is the case, forinstance, for A8ernA in Koog aan de Zaan, a village near Amsterdam. In order torestore the connection between both sides of town, NL architects activated the areaunder the road with public space, a marina, a skateboard park, a basketball field, asupermarket, and various shops (Rambert 2015).
Agro-Food Facilities
Many agro-food-related facilities also tend to lose their purpose, due to technicalevolutions, relocations or commercial strategies of geographical clustering. Munic-ipal slaughterhouses occupy a key place in this category of agro-food infrastructuralbrownfield. Because of tighter hygiene rules and increased liberalization of the globalmeat market, these constructions—often considered troublesome—are progressivelyabandoned in favour of new facilities located on the outskirts of urban ormetropolitanregions.
Gradually, thanks to the often monumental spatial, architectural, and aestheticpotential of these constructions, it has been possible to overcome the negative percep-tions linked with these sites. In terms of soil contamination, these killing places arenevertheless qualified as “clean”, in the sense that this industry doesn’t generate anykind of pollutant—except for the carbon dioxide rejected by the furnace and thecremation oven during operation. In the past decades, several regeneration projectshave thus been initiated and realized in Europe. We can certainly cite the Frenchslaughterhouses of Toulouse, transformed into a contemporary art museum, andLyon, which is now a modern concert hall (the Halle Tony Garnier, named afterits original designer). Furthermore, not a lot of people know that the famous 55-haParc de la Villette in Paris, designed by French architect Bernard Tschumi, is estab-lished on the former site of the La Villette slaughterhouse, originally built in 1867.In Belgium, the former slaughterhouse of Mons hosts, since 2006, spaces dedicatedto culture and exhibition. In Spain, the slaughterhouse of Valence has become asports complex, and that of Madrid (see Fig. 2.12), which included a cattle market,was recently transformed into the Nave de la Música, a centre for multidisciplinarycontemporary creation (Rambert 2015). In Switzerland, the Zurich slaughterhouse

2.4 The Diversity of Urban Brownfields in Europe 33
Fig. 2.12 Matadero, Madrid (ES). Regeneration of a former slaughterhouse area into a newneighbourhood dedicated to culture. Ensamble Studio, A. Franco, Martin + Batanero, CH + QSarquitectos, 2006–2012 (photo: Fred Romero, 2017)
and its surrounding are currently undergoing a test planning process to develop aregeneration concept and strategy.
Considering their often-problematic rehabilitation, grain silos and their juxtaposedbuildings (offices, depots, warehouses, etc.) may also belong to this sub-category ofagro-food facilities. Several European examples can be cited, such as the ancientgrain silo in Fribourg, Switzerland, transformed into a residential high-rise building,the Armani silos inMilan, where the famous Italian fashion designer Giorgio Armaniopened a contemporary exhibition space, or Silo 13, a few metres away from Parisring road, where the old industrial facility was literally transformed into an urbansculpture hosting a new, vibrant neighbourhood.
Tertiary Sector Facilities
Even though the phenomenon is more recent, and perhaps more modest in terms ofsurfaces, it is important to stress that some tertiary sector infrastructures may also besubject to functional obsolescence, which sometimes results in their abandonment. Awide variety of facilities related to communication or sports, administrative centresof companies undergoing restructuring or closure (for instance, postal companies),and public buildings that no longer serve a purpose are all types of constructionsbelonging to the category of tertiary sector infrastructural brownfields.
The emergence of postal brownfields is specifically linked to several substantialevolutions in thefield ofmail delivery, in particular the double impulse of increasingly

34 2 Urban Brownfields: Origin, Definition, and Diversity
digital exchanges and the proliferation of private actors in the sector. The results aresignificant impacts on logistical and spatial needs, in particular in terms of traditionalmail sorting and management centres, which tend to lose their full or partial purpose.
We can cite several European references for stimulating tertiary sector regenera-tion projects. The Cité numérique in Bordeaux, France, a vibrant location for start-upcompanies and digital entrepreneurs redesigned by architect Alexandre Chemetov,is established in the former postal sorting centre of Bègles. Also in France, theNational Dance Centre is hosted in the brutalist architecture of the former admin-istrative centre of the city of Pantin, in north-eastern Paris, originally built in 1972by architect Jacques Kalisz. The Carandá municipal market in Braga, Portugal, wasalso transformed into dance-related activities. The rehabilitation project by architectEduardo Souto Moura includes exhibition and performance spaces.
Similarly to the other types of brownfields, the large number of infrastructuralbrownfields awaiting new uses demonstrates the topicality of the issue. We can cite,to name but one, the case of the Athens Olympic Sports Complex, restructured tohost the 2004 Olympic games by Spanish architect Santiago Calatrava Valls. Due toits large size and the lack of funds to ensure adequate maintenance, the site is mostlyabandoned since the international event and its general state is rapidly deteriorating(see Fig. 2.13).
Fig. 2.13 Hellinikon Olympic Hockey Centre, Athens (GR). Abandoned Athens Olympic 2004venues since 2004 (photo: Arne Müseler, 2019)

2.4 The Diversity of Urban Brownfields in Europe 35
2.4.2.6 Commercial Brownfields
Considering the increasingly changing economic activities and their constantly trans-forming logistical and spatial needs, it is likely that some unbalance between the builtenvironment and the functions it accommodates will continue to manifest. Hence,new types of brownfields are continuously emerging. And although they probablywon’t reach industrial brownfields’ proportions, these new species of brownfieldsare starting to find their niche in the specialized literature.
Commercial brownfields, to start with, are among these fresh fields of inves-tigation. They could potentially represent a significant spatial impact. Indeed, theestablishment of abundant commercial surfaces on the outskirts of most Europeanmetropolitan areas has led, in some regions, to an absolute explosion in the supplyof commercial areas. Several authors stress that this proliferation of large shoppingcentres is based on a globally fragile financial logic (Capucin 2013). Changes incustomers’ behaviour, for instance, the significant increase in online shopping or thedemand for local products emphasized by the pandemic situation, may thus lead toa heavy mutation of this field and to the brutal closure of commercial sites that willfind no buyer.
The study of the American situation reveals a serious risk. As a consumerist iconof a flourishing America, the oversized suburban shopping mall seems to face thereconsidering of a societal model that prevailed for several decades. According to astudy by Green Street Advisors, about 15% of shopping malls currently in operationin the United States are expected to either close or be converted into non-commercialspaces over the next years (Lekeu 2014). According to another source, up to one-third of American shopping malls—which represents several hundreds of centres—are practically dead (de Graffenried 2017). Furthermore, the recent publication of aseries of photographs by American artist Seph Lawless, representing shopping mallsabandoned following the last financial crisis of 2008, draws a particularly strikingparallel with the aesthetic universe of industrial brownfields (Lawless 2014).
As shopping mall redevelopment projects appear both costly and perilous, thequestion of what to do with abandoned commercial centres remains open (Voien2017). In order to go beyond processes of demolition/reconstruction, it may be usefulto turn to less recent commercial centres to find inspiration. The Kunsthaus Tacheles,a large 1-ha building and sculpture park in the Mitte district of Berlin, is certainlyamong the most stimulating references in processes of urban regeneration—or urbanrecycling—involving commercial architecture. Originally named Friedrichstraßen-passage when it was built in 1907–1908, the five-story department store made ofreinforced concrete is a typical example of early Modern architecture. After a firstbankruptcy, the building was successively used as a new department store, show-room, and Nazi prison during World War II, before being occupied by the artists’collectiveKünstlerinitative Tacheles, which opened studios andworkshops, a gallery,a nightclub and a cinema. After having experienced multiple uses, demolition andtransformation works, the building is now expected to be renovated by Herzog & deMeuron in 2022 in order to host the Fotografiska contemporary Swedish photographymuseum.

36 2 Urban Brownfields: Origin, Definition, and Diversity
Fig. 2.14 Magic Movie Park, Muggiò (IT). 21,000 square metres multiplex and commercial centrein the outskirt of Milan, abandoned since 2006 (photo: Roberto Barbone, 2016)
Unlike industrial, railway, military, or waterfront brownfields, there are relativelyfew other examples of commercial brownfields in Europe. We can site for instancetheMagicMovie Park, inMilanmetropolitan area, Italy (see Fig. 2.14), or the CentroOvale in Chiasso, Switzerland, both abandoned for several years. Testifying to therelevance and up-to-datedness of the topic, the web platform “Dead Malls Europe”provides a list of abandoned shopping centres across Europe. The online map identi-fies some twenty “debris” of “consumer society”, mostly located in France, Belgium,and the United Kingdom (DeadMaller 2013). This attempt to establish an inventory,albeit partial, opens up encouraging perspectives towards greater acknowledgementof the acute question of the future of abandoned shopping malls.
2.4.2.7 Energy Brownfields
Similarly to commercial brownfields, energy brownfields appear as a relatively newcategory, preidentified in (Rey and Lufkin 2015), and whose emergence is largelyrelated to the energy transition. Indeed, the possibility of being confronted by energybrownfields is strongly linked with the evolution of energy consumption patternsover the next decades. The strategies developed for the energy transition—blendinga search for sobriety and priority recourse to renewable energy—have already started

2.4 The Diversity of Urban Brownfields in Europe 37
to modify our current uses, and are expected to even more so in the near future. Theyalso impact several infrastructures related to energy production and distribution.
The endof the dominance of oil, aswell as the objectives of several European coun-tries to phase out of nuclear energy, represent a real turnaround on the political andtechnological levels. Hence, this energy transition phase is generating unprecedentedquestions for several still fully and heavily exploited sites. In the evolving energysector, which presents particularly challenging, major environmental and economicissues, several electrical installations (in particular those related to nuclear plants) oroil-related sites (refinery or storage) will, in turn, be facing obsolescence, disman-tling, and remediation. In that case, these sites will most likely nourish the catalogueof metropolitan brownfields over the next decades. We can site as an example theMühleberg Nuclear Power Plant in the Canton of Bern, Switzerland, which decom-missioning began in January 2020 and is forecasted to be completed by 2034 (seeFig. 2.15) or the Mülheim-Kärlich nuclear power plant (DE), which dismantlingwork started in 2004 and is expected to be completed around 2029 (see Fig. 2.16).
However, while the energy transition induces the emergence of this new categoryper se, energy brownfields have certainly existed in the past, although not to theextent of creating a separate, clearly identified group. Abandoned urban networkmanagement areas like electricity conversion compounds, gasholder works, powerstations, and coal-mining sites, for instance, were typically included in the industrialbrownfield category.
Fig. 2.15 Mühleberg Nuclear Power Plant, Canton of Bern (CH). Decommissioning of buildings aspart of the strategy of abandoning nuclear power in Switzerland started in 2020 and to be completedby 2034 (photo: Emmanuel Rey, 2021)

38 2 Urban Brownfields: Origin, Definition, and Diversity
Fig. 2.16 Mülheim-Kärlich nuclear power plant, Mülheim-Kärlich (DE). Collapsed of the coolingtower of the decommissioned nuclear power plant in 2019 (photo: Phantom3Pix, 2019)
Several such European regeneration projects can be cited, such as the BatterseaPower Station, a decommissioned coal-fired power station located on the south bankof the river Thames in London, United Kingdom, expected to host the new Britishheadquarters of Apple (the project was interrupted due to the COVID-19 pandemics)(see Fig. 2.17). London has also various gasholders awaiting a regeneration project inorder to prevent them from demolition, such as the Haggerston, Kensington, and OldKent Road Gasworks or the Kennington, Wandsworth and Rotherhithe Gasholders(see Fig. 2.18). Similarly, the former Italgas Gazometro in the Ostiense district inRome is worth mentioning. The Gasometers in Vienna, four former monumentalgasholder houses rehabilitated for commercial and residential use, is an example ofsuch a reconversion.
Finaly, we can cite the former mine of Beringen, a unique 10-ha heritage coal-mining site in Flanders, Belgium, redeveloped into the be-MINE integrated tourismand recreational project, the ancient power plant of Saint-Denis, north of Paris,commissioned in 1933 to power the Parisian metro and whose reconversion into thehuge Cité du Cinema film complex was designed and supported by French directorand producer Luc Besson (see Fig. 3.4, Chap. 3), or, last but not least, the mesmer-izing Hlubina Mine in in the traditionally industrial post-socialist city of Ostrava,Czech Republic, an interesting example of cultural regeneration with temporary uses(Luca 2019; Bosák et al. 2020).

2.4 The Diversity of Urban Brownfields in Europe 39
Fig. 2.17 Battersea Power Station, London (UK). Transformation of a former power station intoa headquarters in the heart of a 7.6-ha new development. Masterplan by Rafael Viñoly Architects,ongoing project (photo: Aurelien Guichard, 2010)
Fig. 2.18 Haggerston Gasworks, London (UK). One of the few and oldest remaining abandonedgasworks structures (photo: © Alizé Soubeyran, 2020)

40 2 Urban Brownfields: Origin, Definition, and Diversity
2.4.2.8 Diverse Derelict Sites
In parallel to the seven above-mentioned categories of urban or metropolitan brown-fields, relatively clearly identified in terms of their initial activities, it should be notedthat a significant number of derelict sites may also be taken into account. Indeed,since the 1950s, very few activities taking place within metropolitan regions haveescaped being reconsidered due to their functionality or their localization.
These multi-layered situations often result in the liberation of unbuilt spaces,sometimes accompanied by the abandonment or even demolition of constructions.These sectors tend to turn into wastelands, that is, devitalized metropolitan enclavesthat often suffer from a lack of identity. Countless circumstances, present throughoutmost European metropolitan areas, can lead to this type of situation.
This last category of diverse derelict sites includes, to start with, the residentialor habitat brownfields (Lotz-Coll 2018). This sub-category is composed of neigh-bourhoods of housing buildings abandoned due to population migration (for jobs orbetter life conditions), changes in fertility rate, de-industrialization or post-socialism.It is important to stress that while this situation of shrinking cities may be found inEurope—in particular in Eastern and, to a lesser extent, Central European urban areas(Wolff et al. 2013)—it certainly doesn’t reach the extent of some North-Americanmetropolitan regions. The case of Detroit, for instance, is particularly representativeof this phenomenon, with approximately 200,000 derelict housing units (Rey andLufkin 2015).
Ultimately, this hybrid group comprises all other types of abandoned sites—whoselist, in theory, can expand infinitely considering the proliferation of socio-economicmechanisms that impact activities in and uses of buildings. The non-exhaustive listof sub-categories includes
• Hospital or health brownfields, such as the former hospital area in Berlin-Kreuzberg, resulting from concentration or relocation strategies, which cancreate considerable enclaveswithinmetropolitan territories (Pascal andKostrzewa2017);
• Religious brownfields, which includes numerous sites across Europe such as theGreat Synagogue of Constanta in Romania abandoned in the 1990s, ButtevantConvent of Mercy in Ireland abandoned in 2012 or the Benedictine priory inAmay in Belgium abandoned in 2012, to name just a few;
• Educational brownfields, such as the Val-Benoît site in Belgium, former prop-erty of the University of Liège which housed the engineering faculty, completelyabandoned by students and lecturers in 2006 (see Fig. 2.19);
• Prison brownfields, such as the former Sainte-Anne Prison in the centre ofAvignon, France, which should be reconverted in a mixed-use residential andcultural centre, including notably a youth hostel;
• Recreational brownfields, such as the abandoned amusement parks of Fun ParkFyn in Denmark or Mirapolis and Parc Avenue France;
• Speculative brownfields, i.e., districts or blocks intentionally left abandoned forreal estate development purposes, such as several neighbourhoods in Brussels;

2.4 The Diversity of Urban Brownfields in Europe 41
Fig. 2.19 Val-Benoît, Liège (BE). Regeneration of the Liège university campus abandoned in 2005into a newmixed-use neighbourhood including office spaces for start-ups and a diversity of housing.Baumans-Deffet Architecure et Urbanisme, ongoing project started in 2011 (photo: Jean Housen,2017)
• and finally, the more rare, so-called strategic brownfields, for instance, bufferzones located in historically divided cities such as Berlin or Belfast.
References
ABC Finance (2018) Who really owns the UK? In: Commer. Finance Experts. https://abcfinance.co.uk/blog/who-owns-the-uk/. Accessed 7 Jan 2021
ACUF A des communautés urbaines de F (2010) Les friches, coeur du renouveau urbain. Lescommunautés urbaines face aux friches: état des lieux et cadre pour agir
AFP AFP (2014) Les friches militaires, opportunité mais parfois aussi cadeau empoisonné.Libération
Aoudjhane S (2019) StationF, H7, KMØ... Ces friches industrielles transformées en campusnumériques. https://www.usinenouvelle.com/article/en-images-stationf-h7-kmo-ces-friches-industrielles-transformees-en-campus-numeriques.N875065
ARE (Office fédéral du développement territorial) (2008) Les friches industrielles et artisanales deSuisse: Reporting 2008. Bern
Bagaeen S, Celia C (eds) (2018) Sustainable regeneration of former military sites. Routledge,Abingdon-on-Thames
Beaver TH (1971) Le problème des friches d’origine industrielle en Grande-Bretagne. HommesTerres Nord 2:5–10

42 2 Urban Brownfields: Origin, Definition, and Diversity
Berger A (2007) Drosscape: Wasting Land Urban America. Princeton Architectural Press, NewYork
Bertrand J (2018) Les friches en Europe, Reconvertir l’industriel en culturel. European think & dotank
Beyer A (2006) Wiggins/PlaneStation ou l’échec d’une mise en réseau spéculative de frichesaéroportuaires. Rev Géographique Est 46
BosákV, SlachO, Novácek A, Krticka L (2020) Temporary use and brownfield regeneration in post-socialist context: from bottom-up governance to artists exploitation. Eur Plan Stud 28:604–626.https://doi.org/10.1080/09654313.2019.1642853
CABERNET (2006) Sustainable brownfield regeneration: CABERNET Network ReportCapucin M (2013) Le désastre annoncé des friches commerciales en France: un potentiel derecomposition. In: Paysages de l’après-pétrole? COREDEM, pp 123–127
Cenci J (2018) From factory to symbol: identity and resilience in the reuse of abandoned industrialsites of Belgium. Hist Environ Policy Pract 9:158–174. https://doi.org/10.1080/17567505.2018.1506017
Chaline C (1999) La régénération urbaine. PUF, ParisClarinet (2002) Brownfield and redevelopment of urban areasClément G (2020) Manifeste du Tiers Paysage. Editions du CommunCoutellierA (2003)L’artificialisation s’étend sur tout le territoire.DonnéesL’environnement 80:1–3Cros P (2008) Les Sem métamorphosent les friches militaires. In: Serv. Public. https://www.servirlepublic.fr/dossier/les-sem-metamorphosent-les-friches-militaires/
Cros P (2011) Brest réinvente son centre-ville. In: Serv. Public. https://www.servirlepublic.fr/2011/10/brest-reinvente-son-centre-ville/
de Graffenried V (2017) Aux Etats-Unis, les «malls» se vident. Le TempsDeadMaller (2013) Dead Malls Europe. In: Dead Malls Eur. http://deadmallseurope.blogspot.com/p/blog-page.html. Accessed 25 Jan 2021
DEFRA (2003) Land by agricultural and other uses 2002. Department for Environment, Food andRural Affairs
Di Pinto V (2020) Urban Brownfields Towards a GIS-based approach to support the development ofplanning strategies for dismissed and derelict urban areas. Maggioli, Santarcangelo di Romagna
Dolezelová L, Hadlac M, Kadlecová M, et al (2014) Redevelopment potential of brownfields: A-B-C Classification and its practical application. Ekonomie 17. https://doi.org/10.15240/tul/001/2014-2-003
Dubois J, Mitterand H, Dauzat A (2001) Dictionnaire d’étymologie. Larousse, ParisEnvironmental Protection Agency (EPA) (2006) Brownfields program achievements linked to earlysuccess
EU EU (2019) Focus on European cities. In: Kotzeva M (ed) Eurostat regional yearbook. Eurostat,Luxebourg, pp 181–194
Ferber U, Grimski D, Millar K, Nathanail P (2006) Sustainable brownfield regeneration:CABERNET Network Report. University of Nottingham, Nottingham
Fiori S, Mariolle B, Poli D (2020) Réparer les territoires post-miniers. Cah Rech Archit UrbainePaysagère. https://doi.org/10.4000/craup.4162
Giraud H (2006) Les friches ferroviaires très convoitées. EchosGlumac B, Decoville A (2020) Brownfield redevelopment challenges: a Luxembourg example. JUrban Plan Dev 146. https://doi.org/10.1061/(ASCE)UP.1943-5444.0000565
Güthling M (2009) Innerstädtische Brachflächen: Untersuchungen zur Umgestaltung von inner-städtischen Bahnflächen am Beispiel des Reichsbahnausbesserungswerkes Potsdam. Univerlag-tuberlin, Berlin
Hou D, Al-Tabbaa A, Hellings J (2015) Sustainable site clean-up from megaprojects: Lessons fromLondon 2012. Proc Inst Civ Eng Eng Sustain 168:61–70. https://doi.org/10.1680/ensu.14.00025
IAURIF I d’aménagement et d’urbanisme d’île-de-France (1999) Friches industrielles en Ile-de-France:plus nombreuses depuis 1995, mais plus petites. Note Rapide Sur Léconomie
References 43
IRSIT (2004) Les villes portuaires en Europe. Analyse comparative. CNRSGDRLIBERGEO1559,Montpellier
Jaccaud J-P, Kaufmann V, Lufkin S, Littlejohn K (2009) Densification des friches ferroviairesurbaines. Lausanne
Jaques M (2004) Quel avenir pour les ouvrages militaires? Cah ASPAN-SO 3:3–5JarczewskiW,KuryłoM(2010)Regeneration of post-military areas inPoland. EurXXI21:117–133.https://doi.org/10.7163/Eu21.2010.21.9
Jauhiainen J (2007) Conversion of military brownfields in Oulu. In: Rebuilding the City. Managingthe built environment and remediation of brownfields. The Baltic University Press
Kozlowska, B (2007) Old face—New function. Revitalization of former industrial buildings. In:Rebuilding the city managing the built environment and remediation of brownfields. The BalticUniversity Press
Laprise M, Lufkin S, Rey E (2018) An operational monitoring tool facilitating the transformationof urban brownfields into sustainable neighborhoods. Build Environ 221–233. https://doi.org/10.1016/j.buildenv.2018.06.005
Lawless S (2014) BLACK FRIDAY-The Collapse of the American Shopping MallLekeu G (2014) Les photos saisissantes de l’agonie des centres commerciaux américains. In:L’avenir. https://www.lavenir.net/cnt/dmf20140530_003. Accessed 21 Jan 2021
Lelogeais E (2005) La seconde vie des friches portuaires. EchosLotz-Coll S (2018) La friche militaire urbaine, un nouvel espace convoité? Carnets Géographes.https://doi.org/10.4000/cdg.1443
Luca FD (2019) Overview of brownfields regeneration projects in the Baltic states and in Europe.Tallinn University of Technology
Lufkin S (2010) Entre ville et campagne: Stratégies de densification qualitative ciblée des frichesferroviaires régionales. EPFL, Lausanne
Lusso B (2013) Patrimonialisation et greffes culturelles sur des friches issues de l’industrie minière.Regards croisés sur l’ancien bassinminier duNord-Pas deCalais (France) et la vallée de l’Emscher(allemagne). EchoGéo 26. https://doi.org/10.4000/echogeo.13645
Lusso B (2014) Les équipements culturels de la vallée de l’Emscher (Ruhr, Allemagne): de larégénération urbaine au développement d’une économie culturelle et créative. Belg Rev BelgeGéographie. https://doi.org/10.4000/belgeo.13358
Lusso B (2010) Culture et régénération urbaine: les exemples du Grand Manchester et de la valléede l’Emscher. Métropoles 8. https://doi.org/10.4000/metropoles.4357
Manceau E (2014) La reconversion de l’aire industrielle de Bagnoli à Naples: anatomie d’un échec.Belg Rev Belge Géographie 1. https://doi.org/10.4000/belgeo.12718
Matkovic I, Jakovcic M (2020) Conversion and sustainable use of abandoned military sites in theZagreb urban agglomeration. Hrvat Geogr Glas 82:81–106. https://doi.org/10.21861/HGG.2020.82.02.03
Merlin P, Choay F (2010) Dictionnaire de l’urbanisme et de l’aménagement. PUF, ParisMerzaghi F, Wyss M (2009) Comment une friche ferroviaire se transforme en quartier durable: Lequartier Écoparc à Neuchatel en Suisse. VertigO - Rev. Électronique En Sci. Environ. 9
Modica M (2019) Industrial brownfield sites in the alps. A first quantitative overview and potentialimplications for regional development. https://doi.org/10.4000/rga.5274
Moscovici A-M, Banescu O-A, Vaduva R (2017) Integrating brownfield sites into city redevelop-ment strategies, pp 675–682
Nathanail P, Thornton G, Millar K (2003) What’s in a word: UK and international definitions of‘brownfield.’ Sustain 4
Network Rail (2021) Network rail property. In: Netwwork Rail. https://www.networkrail.co.uk/industry-and-commercial/network-rail-property/
OECD (2014) Built-up area and built-up area change in countries and regions. https://stats.oecd.org/Index.aspx?DataSetCode=BUILT_UP
OFS (2003) Annuaire statistique de la Suisse. NZZ Libro, ZurichOliver L, Ferber U, Grimski D, et al (2005) The scale and nature of European brownfields

44 2 Urban Brownfields: Origin, Definition, and Diversity
Oswalt P, Overmeyer K, Misselwitz P (2013) Urban catalyst: the power of temporary use. DOMPublishers, Berlin
Oxenham JR (1966) Reclaiming derelict land. Faber & Faber, LondonParisi R (2011) L’usine, l’espace et la ville à Naples dans une perspective historique: installation,réemploi, délocalisation. Rives Méditérranéennes 38:27–41. https://doi.org/10.4000/rives.3979
Pascal E, Kostrzewa J (2017) Patrimoine de la santé: vers une méthode de reconversion pour dessites historiques d’envergure urbaine. Situ Rev Patrim 31. https://doi.org/10.4000/insitu.14469
Ponzini D, Vani M (2014) Planning for military real estate conversion: collaborative practices andurban redevelopment projects in two Italian cities. Urban Res Pract 7:56–73. https://doi.org/10.1080/17535069.2014.885743
Prelorenzo C (2010) Le retour de la ville portuaire. CahMéditerrannée 80:157–167. https://doi.org/10.4000/cdlm.5239
Qureshi A, Leal FilhoW (2007) An overview of brownfields in the Baltic Sea region. In: Rebuildingthe city. Managing the built environment and remediation of brownfields. The Baltic UniversityPress
Raffestin C (1988) Réflexions sur la notion de friche industrielle. Cah L’ASPAN-SO 3:14–15Rambert F (ed) (2015) Un bâtiment, combien de vies? La transformation comme acte de création.Cité de l’architecture et du patrimoine, Paris
Rey E (2012) Régénération des friches urbaines et développement durable: vers une évaluationintégrée à la dynamique du projet. Presses Universitaires de Louvain, Louvain-La-Neuve
Rey E (2017) Helvepolis, une vision intégrative pour les territoires du Plateau suisse. Cah L’ASPAN6–9
Rey E, Lufkin S (2015) Des friches urbaines aux quartiers durables. Presses polytechniques etuniversitaires romandes, Lausanne
Rodrigues-Malta R (2001) Régénération urbaine: variations sud-européennes. Inf Géographique65:321–339. https://doi.org/10.3406/ingeo.2001.2774
Ruegg J,DeschenauxC (2003)Territoires intermédiaires et espaces ruraux. In: Politik des ländlichenRaumes. Suisse, p 11
Sarthou M (2020) Friches réhabilitées – L’exemple ambitieux d’Helsinki. Formes 15:Schädler S, Morio M, Bartke S, Finkel M (2012) Integrated planning and spatial evaluation ofmegasite remediation and reuse options. GQ10 Groundw Qual Manag Rapidly Chang World127:88–100. https://doi.org/10.1016/j.jconhyd.2011.03.003
Sieverts T (2004) Entre-ville: une lecture de la Zwischenstadt. Ed. Parenthèses, MarseilleSNCF (2021) espaces ferroviaires. http://www.espacesferroviaires.fr/. Accessed 5 Jan 2021Tiano C (2010) Neptune: le discours de la méthode, La requalification de friches industrialoportu-aires. Ann Rech Urbaine 106:63–73
Urban Vestbro D (ed) (2007) Rebuilding the city. Managing the built environment and remediationof brownfields, Baltic University Urban Forum. The Baltic University Press
Vantorre H (2018) Le recyclage urbain. Université catholique de Louvain, Louvain-La-NeuveViganò P, Cavalieri C, Corte MB (eds) (2018) The horizontal metropolis between urbanism andurbanization. Springer International Publishing, Cham
Voien G (2017) What should be done with America’s abandoned malls? In: Archit. Dig. https://www.architecturaldigest.com/story/abandoned-malls
Wolff M, Fol S, Roth H, Cunningham-Sabot E (2013) Shrinking Cities, villes en décroissance: unemesure du phénomène en France. Cybergeo Eur J Geogr. https://doi.org/10.4000/cybergeo.26136
Yakhlef M, Abed A (2019) Identification of brownfield sites classification typologies case study ofAmman, Jordan. J Eng Appl Sci 14:3144–3149. https://doi.org/10.36478/jeasci.2019.3144.3149

References 45
Open Access This chapter is licensed under the terms of the Creative Commons Attribution 4.0International License (http://creativecommons.org/licenses/by/4.0/), which permits use, sharing,adaptation, distribution and reproduction in any medium or format, as long as you give appropriatecredit to the original author(s) and the source, provide a link to the Creative Commons license andindicate if changes were made.
The images or other third party material in this chapter are included in the chapter’s CreativeCommons license, unless indicated otherwise in a credit line to the material. If material is notincluded in the chapter’s Creative Commons license and your intended use is not permitted bystatutory regulation or exceeds the permitted use, you will need to obtain permission directly fromthe copyright holder.

Chapter 3The Multiple Potentials of UrbanBrownfields
Abstract The phenomenon of urban brownfields is significant throughout Euro-pean metropolitan areas. In this chapter, we assess, both in qualitative and quanti-tative terms, the inherent potential of urban brownfields to provide a relevant andsubstantial densification strategy for metropolitan areas. First, we explore the variousopportunities for improvement of the built environment offered by urban brownfieldsin terms of environment, society, and economics, which are the core principles ofsustainable development. This analysis is, inter alia, a juxtaposition between urbanbrownfields and the compact and polycentric city model, adapted to the metropolitanarea. While brownfield regeneration appears to be a relevant densification strategy,it nevertheless implies that a sufficient reserve of land is available to engage policy-makers. Thus, we attempt to estimate the urban brownfield stock in three countries:the United Kingdom, Switzerland, and France. The data subsequently serves as abasis for our calculation of the theoretical construction potential of brownfield sites.
Keywords Urban brownfield regeneration · Compact and polycentric city model ·Densification strategies · Urban brownfields potential · Urban brownfield stock
3.1 Urban Brownfields as a Range of Opportunities
The different categories of urban brownfields presented in Chap. 2 highlighted thegreat diversity of this type of site. The multiplicity of former activities translatesinto not only a great variety of situations, but also significant spatial dissemina-tion of the phenomenon within European metropolitan areas. Indeed, at the time ofestablishment, the choice of where to install the activity—and ergo buildings andfacilities—was thoroughly studied particularly with regard to accessibility condi-tions and raw materials available onsite. As a result of this, many urban brownfieldsbenefit from a strategic location.
The present chapter aims to assess, both in qualitative and quantitative terms,the inherent potential of urban brownfields to provide a relevant and substantialdensification strategy for metropolitan areas. In other words, the regeneration ofurban brownfields offers a range of opportunities to transform these territories byfostering their transition towards sustainability. Our purpose, in particular, is to raise
© The Author(s) 2022E. Rey et al., Neighbourhoods in Transition, The Urban Book Series,https://doi.org/10.1007/978-3-030-82208-8_3
47

48 3 The Multiple Potentials of Urban Brownfields
awareness of policy makers and actors involved in regional and city planning on theimportance of the issue.
3.2 The Qualitative Potential of Urban Brownfields(Environmental, Sociocultural, and Economic)
The definition adopted for urban brownfields reveals a great diversity of derelictsites which, mainly due to their abandonment, appear a priori to be unattractive oreven dreary. It is therefore relevant to underline why urban brownfields can, on thereverse, be of interest for the sustainable transition of European metropolitan areas.To appreciate their qualitative potential, we propose a juxtaposition between urbanbrownfields and the reference model of the compact and polycentric city adapted tothe metropolitan area (more on this reference model in Chap. 5), which is organizedaround three major principles: density, mobility, and functional mix. Subsequently,we will explore through a literature review various opportunity for the built environ-ment’s improvement offered by urban brownfields, in terms of environment, society,and economics, which represent the core principles of sustainable development.
3.2.1 Opportunities for Density, Mobility, and FunctionalMix
In 2011, in its “Roadmap to a Resource Efficient Europe”, the European Commis-sion called on politicians from member states to be accountable for their land use,with the aim to put an end to the net increase in urbanized land by 2050 (EuropeanCommission 2011). In this context of reconsideration of urban sprawl, giving priorityto projects located on urban brownfields appears to be a relevant strategy to reachthese densification objectives. Indeed, urban brownfields enable greater compact-ness within cities and metropolitan areas, especially due to their localization withinexisting urban fabrics. In that sense, they offer a unique opportunity to participatein efforts towards limiting urban sprawl. This feature is probably one of the mostobvious and spontaneous potentials offered by brownfield sites. It is acknowledgedas such by a large number of territorial authorities (Thornton et al. 2007; Apparu2011; ARE 2014; DGO4 2014).
In terms of public policy, one of the most notorious examples comes from theUnited Kingdom, where in 1998 the government introduced an ambitious target forthe reuse of brownfields. The initial objective was to reach at least 60% of newresidential housing built on brownfields by 2008. For the record, the objective wasreached eight years earlier than the deadline (politics.co.uk 2011; Schulze Bäingand Wong 2012). Since 2010, the new political approach is to make local planningauthorities responsible for establishing the level and localization of dwellings on their

3.2 The Qualitative Potential of Urban Brownfields … 49
territory.More concrete rules concerning the redevelopment of brownfields, however,still need to be refined (Department for Communities and Local Government 2015).In 2016, a 1.2 billion £ special fund was created to support the purchase of andconstruction on abandoned land, thus encouraging the densification of urban regions(Carr 2016). It is, however, expected that the funding allocated to soil remediationwill be withdrawn, which will most likely penalize such developments in the poorestregions of the country (Harvey 2016).
We have seen previously that the geographical definition of a metropolitan regionis far from limited to the city centre (see Chap. 2). A large number of urban ormetropolitan brownfields are located in the suburbs or on the peripheries of urbanareas. Following the compact and polycentric city model adapted to the metropolitanarea (see Fig. 3.1), the notion of urban brownfield finds its place among the multi-plicity of territories waiting to be reconquered. Urban brownfields are likely topromote the creation ofmixed-use, compact polarities or, in otherwords, to contributeto the (re)development of dense secondary centres that redistribute to public trans-port hubs the functions normally found in the inner city (Rogers and Gumuchdjian1998). In view of all this, brownfields represent particularly strategic opportunities
Home, workplace and leisure: mixed and compact pole with short distance that allows walking and cycling.
Trains, trams and buses: metropolitan public transport system that connects the neighbourhoods of the urban entity to central nodes.
Fig. 3.1 Schematic representation illustrating the compact and polycentric city model adapted tothe metropolitan area. From the metropolization phenomenon emerges a hierarchy within the cityand its transport network. The neighbourhoods are mixed and compact poles, which allow a certainreduction in the need for individual motorized journeys by the creation of dense and multifunctionalsecondary centres

50 3 The Multiple Potentials of Urban Brownfields
for the sustainable transition of metropolitan territories considered as a whole (Reyand Lufkin 2015; Rey et al. 2015).
In that sense, it is also worth strengthening those secondary centres’ accessibilityand multifunctionality (Lufkin 2010). Let us first remind the reader how importantthe proximity of modal transport nodes is for that model and, by extension, for urbanbrownfields. By definition, the densification of those sites will always offer moreopportunities in terms of connection to public transport networks and soft mobilitythan the development of peri-urban or rural sites. Therefore, their densificationmakessense only if coordinated with a reflection on mobility (Williams et al. 2000).
Ultimately, we also note that because of their very size (at least a half hectare),urban brownfields truly represent a piece of the city. In otherwords, they clearly relateto neighbourhood-scale issues. Their redevelopment thus provides an opportunity tocreate a mixed-use built environment that combines housing, shops, offices, servicesor craft workshops, as well as quality public spaces and infrastructure. This diversityaims at avoiding monofunctional spaces, such as bedroom communities or businessdistricts, which empty out completely at certain hours of the day (Merlin and Choay2010). Moreover, merging density and functional mix reduces the geographical gapbetween activities and supports the creation of a short-distance territory (Hauri 2011).
3.2.2 Opportunities for the Environment, Societyand Economy
As previously explained, in accordance with the compact and polycentric city modeladapted to the metropolitan area, the regeneration of urban brownfields is a relevantstrategy for containing urban sprawl (Schulze Bäing and Wong 2012) and thus forminimizing its numerous negative impacts (European Commission 2013). We high-light here how the regeneration of urban brownfields embodies significant potentialto improve the built environment, with positive repercussions on environmental,sociocultural, and economic levels.
We can start by considering projects located on brownfields with contaminatedsoil. Their remediation represents a real improvement for a wide range of ecosystems(small wildlife, groundwater, soil quality, etc.) (Martin et al. 2005; ADEME 2014).From this perspective, we can cite the “greening” and “soft re-use” approaches,both fast-growing fields of research (Doick et al. 2009; Pediaditi et al. 2010; DeSousa 2014; Bardos et al. 2016). Furthermore, brownfield decontamination providesthe advantage of reducing health hazards, and even premature deaths (Rowan andFridgen 2003; Gilderbloom et al. 2014).
Studies have established a link between abandoned sites and low property valueof adjacent plots, as well as an increased number of foreclosures associated withresidents’ precarity and low quality of life (Gilderbloom et al. 2014). Althoughdecontamination costs can be extremely high, a strategic redevelopment project cancreate awin–win scenario for the local economy, the environment, and the community

3.2 The Qualitative Potential of Urban Brownfields … 51
(Thornton et al. 2007;Kotval-K2016). Indeed,works have highlighted the capacity ofregeneration projects to positively influence the economy (Sousa 2002; Lange andMcNeil 2004), generate local tax income (Kotval-K 2016), increase employmentlevels (Sousa 2008), as well as revitalize communities and property values (DennisandNorman 2006; Schulze Bäing andWong 2012). Furthermore, some rehabilitationprojects count among the strategies developed to tackle the phenomenon of urbanshrinkage, which mainly affects Eastern Europe (Rall and Haase 2011). Even thoughbrownfields are an unfortunate (but natural) consequence of a maturing metropolitaneconomy, their regeneration can become a significant—even vital—contribution tothe local economy, notably as an opportunity for diversification.
In parallel, it is essential to understand that regeneration projects enable a restruc-turing of the metropolitan area, reflected in the emergence of a new urbanity servingthe community (Dumesnil and Ouellet 2002). This urban remodelling can occureither by erasing the history of the brownfield, when negatively perceived, or byenhancing the site through an emblematic architectural project (ADI 2015). Fromthe sociocultural perspective, redeveloping a brownfield site can act as a powerfultool to valorise abandoned cultural heritage (Berens 2011; Mieg and Oevermann2014), creating, once again, positive impacts on neighbouring property values (VanDuijn et al. 2014) (see also Chap. 5 for more detail on preservation of architecturalheritage). In addition, the valorization of this heritage contributes to improving thepublic’s perception of the abandoned site, all while reviving a site’s specific history(CABERNET 2004). The previously cited example in Germany of Emscher Valley(see Chap. 2) is particularly emblematic of those dynamics.
Regenerated sites, which are very often transformed into cultural spaces, mustcontinue to offer creative and fertile spaces, avoiding the pitfalls of “museumifi-cation” (Mieg and Oevermann 2014; Matthews et al. 2014). Indeed, regardless ofthe building quality, brownfields often temporarily host artist groups and associa-tions with social added value, who take advantage of low-cost premises offeringhigh flexibility of use. The redevelopment of these sites provides an occasion toinclude a cultural component embedded in local economic and social life, improveuser services, regularize situations, and secure the spaces (Barthel 2009; OFEV2010a; Lusso 2013). The previously mentioned Belle deMai brownfield inMarseilleprovides a successful illustration of these processes (see Chap. 2). However, if cultureand “patrimonialization” can provide lever effects, their broader definition encour-ages the diversification of objectives in terms of social, functional, or even economicmix (Mckenzie and Hutton 2014). Figures 3.2, 3.3 and 3.4 show two successfulbrownfield regeneration projects in France that illustrate this point.
Our multiple converging findings clearly underline the richness of urban brown-fields’ qualitative potential. Politics aiming at controlling urban sprawl and strategicbrownfield regeneration offer the advantage of improving the built environment forthe simultaneous benefit of projects’ initiators, future users, and the metropolitanterritory as a whole. Therefore, in many European countries, that kind of argumenthas slowly contributed to shifting the perception of urban brownfields from burdento opportunity (Adams et al. 2010).

52 3 The Multiple Potentials of Urban Brownfields
Fig. 3.2 EuraTechnologies Campus, Lille (FR). Transformation of a former spinning mill into astart-up incubator and accelerator. B + A Architectes, 2009 (photo: Stefan83~fwiki, 2018)
Fig. 3.3 La Cité du Cinéma, Paris (FR). Conversion of a former power station into a film studiocomplex supported by director and producer Luc Besson. Reichen et Robert &Associés ArchitectesUrbanistes, 2012 (photo: © Reichen et Robert – Architectes Urbanistes © Laurent Desmoulins,photographer, 2016)

3.3 The Quantitative Potential of Urban Brownfields 53
Fig. 3.4 La Cité du Cinéma, Paris (FR). Conversion of a former power station into a film studiocomplex. View of the central nave. Reichen et Robert & Associés Architectes Urbanistes, 2012(photo: © Reichen et Robert – Architectes Urbanistes © Laurent Desmoulins, photographer, 2016)
3.3 The Quantitative Potential of Urban Brownfields
After this qualitative perspective, we now propose to evaluate the quantitative poten-tial of urban brownfields, that is, the magnitude of the available European brownfieldstock. Indeed, while brownfield regeneration appears to be a relevant densificationstrategy, it nevertheless implies that a sufficient reserve of land is available in order toengage policymakers. Therefore, inventories are key. Beyond static inventories, themain objective is to enable a community to observe its territory in order to anticipateand detect transformations, and to proactively address the spaces about to becomeavailable. An inventory is not only the basis for promoting dialogue between privateand public partners (Williams and Dair 2007), but it also contributes to reducing thetransitory period during which a site remains abandoned. Ultimately, inventories arepowerful tools to help brownfields serve the urban development objectives that thecommunity has set for itself (ACUF 2010).
To proceed with an efficient and reliable census approach, a robust shared defi-nition of a brownfield is required (Oliver et al. 2005). However, as mentioned inChap. 2, since the EU does not yet have a general brownfield policy (Vanheusden2009), there is no such thing as a common definition at the European level; nor isthere an inventory. Overall, when it comes to collecting data on brownfields, tech-nical issues—in particular contamination—are the main concern. Our understandingof brownfields must therefore evolve beyond simple contamination risks and extend

54 3 The Multiple Potentials of Urban Brownfields
towards a more integrated reflection in terms of sustainable urban development. Thisnaturally requires a broader definition, allowing public institutions to realize the fullpotential of brownfield regeneration strategies (Oliver et al. 2005).
Due to the lack of definition at the European level, a very few, yet valuable workshave taken up the challenge of outlining a European brownfield inventory based onthe available data. As far as we are aware, two studies are worth mentioning. Thefirst one was realized in 2002 by the “Brownfield Redevelopment” working group ofCLARINET (Ferber and Grimski 2002). Although by then, most European countrieswere already aware of brownfield issues, the report stated that only a few countrieshave started collecting data. It estimated or identified approximately 128,000 ha ofbrownfield land in Germany, 39,600 ha in the United Kingdom, 20,000 ha in France,between 9,000 and 11,000 ha in the Netherlands, and some 14,500 ha in Belgium(Fig. 3.5).
The second study, carried out by the CABERNET network in 2005 (Oliver et al.2005), is the most recent and comprehensive European brownfield inventory workas of today. Since the report by CLARINET, the 2004 expansion of the EuropeanUnion from 15 to 25 member states significantly increased the brownfield stockby adding a large number of former industrial, mining, railway, and military sites(Franz et al. 2006), making the task of collecting data even more complex. The studyfirst identifies a list of countries that present no data at all, or very limited data:Bulgaria, Greece, Hungary, Slovak Republic, Denmark, Finland, Ireland, Sweden,Italy, Portugal, and Spain. The surfaces for nationswith some formof national datasetavailable are consistent with the previously cited CLARINET study, in particularGermany, France, and the Netherlands.
The cases of Poland and Romania, respectively, 800,000 and 900,000 ha, revealthe methodological issues with recording brownfield land statistics without a generic
Germany
0 150,000100,000 125,00050,000 75,00025,000
United Kingdom
France
Netherlands
Belgium
Fig. 3.5 Estimation of the area of urban brownfields in European regions and countries. Dataaccording to Ferber and Grimski (2002)

3.3 The Quantitative Potential of Urban Brownfields 55
definition. Indeed, the authors of the study suggest that the magnitude of brownfieldsin these two latter countries could be explained by how brownfields are defined andinformation is collected. Since Polish and Romanian brownfield lands are defined bythe presence of contamination, large sections of contaminated coalfields that remainin operation have been inventoried as brownfields—which would not be the case inWestern Europe. This illustrates the considerable impact of methodology and criteriawhen collecting data for inventorying purposes.
In order to illustrate the diversity of approaches, we briefly discuss the strategiesdeveloped by three countries: the United Kingdom, Switzerland, and France. Weanalyse the different existing brownfield inventories for each of these nations, whichallows an understanding of the urban development potential offered by these specificterritories. The data will subsequently serve as a basis to calculate the theoreticalconstruction potential of brownfield sites for the three nations.
3.3.1 Situation in the United Kingdom
Of all the European countries, the United Kingdom is a role model when it comesto brownfield inventory. The fact that the UK was the birthplace of the industrialrevolution—after centuries of intense industrial activities generating large numbersof brownfield—certainly helps explain this situation. After publishing the revisedversion of its development strategy in 2005, which aims at achieving sustainabilitywith the planning system (DEFRA—Department for Environment, Food and RuralAffairs 2005), the UK government has made brownfield regeneration one of its toppriorities. It has provided incentives for remediation and redevelopment with recentlegislation and made available monitoring tools and triggering networks (Williamsand Dair 2007; Uklanddirectory 2014).
In terms of brownfield inventory, England is clearly a few steps ahead of the othercountries in the UK (Scotland, Wales, and Northern Ireland). In 2019, the Campaignto Protect Rural England (CPRE) affirmed in its annual State ofBrownfield report that“each local planning authority now has a brownfield register recording brownfieldland considered to be suitable for housing led development” (CPRE—Campaign toProtect Rural England 2019). These brownfield registers reported over 18,000 sites,covering over 26,000 ha, which could accommodate more than 1 million homes,according toCPRE calculations. Interestingly enough, these estimates differ substan-tially from the numbers published by theCABERNETstudy,which calculated 65,760ha for England (and 10,847 ha for Scotland) based on data from 2003–2004 (Oliveret al. 2005).
Aiming at extending the English approach nationwide, the UK Governmentcommunicated the launch of a national brownfield sites map in its 2020 policydocument “Planning for the Future” (Ministry of Housing, Communities and LocalGovernment 2020). At the time of writing, the announced document—geared atcomplementing the existing interactive English brownfield land map (NationalHousing Federation 2019)—was not yet published.
56 3 The Multiple Potentials of Urban Brownfields
3.3.2 Situation in Switzerland
Switzerland, due to its small territory and limited urbanization possibilities, is anotherinteresting example. Although the country does not have official, exhaustive statisticson urban brownfields, several surveys on industrial and artisanal brownfields havedemonstrated the scale of the phenomenon. In 2003, a study estimated approximately1,700 ha of Swiss industrial brownfield land, which may seem of lesser significancegiven the previously mentioned surfaces across European countries. It neverthelesscorresponds approximately to the area of the city of Geneva (Valda and Westermann2004). In 2008, a report including military, railway, and infrastructural brownfieldsestimated the total surface at 1,820 ha (ARE 2008), mainly located within urbanareas (Rey and Froidevaux 2009).
In 2014, the new legislation on territorial planning (Loi sur l’aménagement duterritoire, or LAT), aiming at stabilizing urbanized land, in particular by exploitingexisting under-utilized reserves more rationally (DETEC 2014), resulted in priori-tizing the redevelopment of urban brownfields (CH 2013). In this context, a privatecompany created a database called “Development Atlas”, a nationwide databaseof Swiss sites with a densification potential that are at least 10,000 m2 (Wüest &Partner AG 2014). The inventory identifies 704 sites, for a total surface of 5,626 ha.Among those sites, 381 items (or 1,922 ha) are clearly industrial, railway, or militarybrownfields. The remaining 323 sites, which include neighbourhood developments,existing buildings with transformation potential, and vacant building plots, are notconsidered as brownfields based on the previously proposed definition (see Chap. 2).
However, since theDevelopmentAtlas only reports sitesmeasuring 1 ha andmore,the Swiss quantitative potential could be more important if we consider brownfieldsites from 0.5 ha, as specified in the definition section of this book (see Chap. 2).Completing this dataset, the Federal Office for the Environment (FOEN) launched awebplatformdesigned as a continuously updated observation and information tool onindustrial brownfields. Aiming at bridging the gap between private and institutionallandowners, site developers, temporary users, investors and public authorities, theplatform also presents useful information on legal procedures (in particular, sourcingfinancial aid) and best practice projects of redeveloped sites (OFEV 2010b).
Based on these multiple sources, a more recent study calculates the total surfaceof Swiss brownfield land at between 2,500 and 3,500 ha (Rey and Lufkin 2015).While this number remains an indicative range, it nonetheless provides a realisticorder of magnitude and serves as a benchmark on the subject.
3.3.3 Situation in France
Although France is also a country with a rich industrial past and, therefore, greatdiversity and abundance of brownfields, until recently it had neither an official terri-torial planning definition for the term “urban brownfield”, nor did it have a planning
3.3 The Quantitative Potential of Urban Brownfields 57
or monitoring tool likely to enable the realization of a consistent nationwide inven-tory. However, as wewill see at the end of this section, things are rapidly progressing,thanks to many actors insisting on the necessity of agreeing on a common, integra-tive definition established at the national level (ACUF 2010), capable of extendingthe brownfields phenomenon beyond the notion of potentially contaminated formerindustrial sites (ADEME, Agence de l’Environnement et de la Maîtrise de l’Energie2014).
Previously, scarce information could be obtained, and only for the most affectedregions. In the 1990s, for instance, it was established that the Nord-Pas-de-Calaisregion held the sad record of 10,000 ha of industrial brownfields, which represented50% of the total surface of brownfields in France (Pacaux and Decocp 2010). In2010, after the redevelopment of approximately 5,000 ha of brownfields, a total of20,000 ha could be estimated for the country, located mainly in urban areas (Merlinand Choay 2010).
The Delegation for Local Development and Regional Action (DATAR) alsocarried out a national census, which estimated the same total surface of 20,000ha of industrial brownfields (Rey 2012). This slightly dated estimate, however, isonly a very rough calculation. Moreover, it does not include other types of brown-field—such as military, waterfront, infrastructural, commercial—and reports siteslocated outside metropolitan or urban regions. Therefore, based on a combinationof sources, experts estimated the total surface of urban brownfields of all typesbetween 30,000 and 35,000 ha (Rey 2012). This clearly exceeds the calculations by(Oliver et al. 2005), which approximated the figure of 20,000 ha. Furthermore, theAgency for the Environment and Energy Control (ADEME), which promotes brown-field regeneration (among other things, by financially supporting soil remediation toinitiate redevelopment projects) estimated a surface of tens of thousands of hectaresof urban brownfields (ADEME 2010).
Very recently, the growing interest for redeveloping brownfields—in particularcontaminated ones (ADEME 2020a)—and for land and real estate monitoring tools(ACUF 2010) reflects the emergence of territorial knowledge as a new challenge.In this favourable context, initiatives and activities by various actors, such as theLaboratoire d’initiatives foncières et territoriales innovantes (LIFTI), are about tolead to the creation of a national brownfield inventory. Indeed, such an inventorywas recently identified by a working group launched by the Ministry of EcologicalTransition as a powerful tool to stop the urbanization of new land and reach thetarget of net zero artificialization (Laperche 2020). As a result of these joint effortsto support the national brownfield inventory, a test version of an online applicationcalled “Cartofriches”, developed by the Cerema, was launched in July 2020 (Cerema2020).
The realization of this online portal, which should soon provide researchers andpractitioners with updated, reliable, and precise quantitative data on the brownfieldsituation in France, was made possible by the creation in 2020 of a 300 million egovernment fund aiming at supporting the regeneration of urban brownfields. Themain objective of this special “brownfield recycling fund”, open to public authoritiesand private companies, is to unblock situations which fail to progress without public

58 3 The Multiple Potentials of Urban Brownfields
support, in particular due to soil contamination (ADEME 2020b; Ministère de laTransition écologique 2020).
However, for the time being, since certain urban communities still lack precisestatistics on the scale and nature of brownfields located on their territory, we haveto make do with the above-mentioned order of magnitude of 20,000 ha, which,again, reflects themethodological complexities ofmaking an efficient andmeaningfulinventory.
3.3.4 Construction Potential: Urban Brownfields’Contribution to Containing Urban Sprawl
The previous section demonstrated that the scale of urban brownfields in each of theselected countries—except England—remains a more or less approximate estimate.As illustrated, the numbers fromonenation to another are difficult to compare becauseeach inventory is based on a different definition. Despite this, the above-mentionedestimates can allow us to calculate the theoretical construction potential offered byurban brownfields. Based on three densification scenarios: “S1-Low density”, with afloor area ratio (FAR) of 0.5; “S2-Medium density”, with a FAR of 1; and “S3-Highdensity”, with a FARof 2 (Table 3.1), we nowpresent these densification perspectives(Table 3.2).
Based on our calculations andwith amedium-density assumption (S2), the currenturban brownfield stock could host a population increase between 7% (Switzerlandand France) and 11% (England). At first glance, these estimates of the potentialnumber of housings and inhabitants could seem ambitious. But one must take intoaccount that the density of this type of metropolitan site is often higher than theaverage urbanized land. We would also like to underline the fact that new brownfield
Table 3.1 Densificationscenarios
Scenarioassumptions
S1 low density S2 mediumdensity
S3 highdensity
Densificationpotential
FAR = 0.5 FAR = 1 FAR = 2
Housingpotential
96 m2 GFAa
Inhabitantspotential
2.3/housingb
aEuropean average. Average size of dwelling by household typeand degree of urbanization, eurostat, 2012. https://appsso.eurostat.ec.europa.eu/nui/show.do?dataset=ilc_hcmh02&lang=enbEuropean average. Taille moyenne des ménages - enquête EU-SILC, eurostat, 2018FAR = Floor area ratioGFA = Gross floor area

3.3 The Quantitative Potential of Urban Brownfields 59
Table 3.2 Theoretical construction potential offered by urban brownfields in England, Switzerland,and France
Reference UK (England) Switzerland France
Estimated surface(ha)
Census(official/partial)
26,000 ha 1,922 ha 20,000 ha
Rey (2012) – 2,500–3,500 ha 30,000–35,000 ha
Oliver et al.(2005)
65,760 ha – 20,000 ha
Adopted estimatea 26,000 ha 2,500 ha 20,000 ha
S1 low density Densificationpotential
130 M m2 12.5 M m2 100 M m2
Housing potential 1,354,167 130,208 1,041,667
Total inhabitants 3,114,583 299,479 2,395,833
S2 mediumdensity
Densificationpotential
260 M m2 25 M m2 200 M m2
Housing potential 2,708,333 260,417 2,083,333
Total inhabitants 6,229,167 598,958 4,791,667
S3 high density Densificationpotential
520 M m2 50 M m2 400 M m2
Housing potential 5,416,667 520,833 4,166,667
Total inhabitants 12,458,333 1,197,917 9,583,333
Percentage of thepopulation
Total population 56,286,961b 8,606,000c 67,098,824d
Percentage of thepopulation (S1)
5.5% 3.5% 3.6%
Percentage of thepopulation (S2)
11.1% 7.0% 7.1%
Percentage of thepopulation (S3)
22.1% 13.9% 14.3%
aFor Switzerland, due to approximative and/or incomplete data, we adopted an average value. ForFrance and England, we used the more recent, reliable sourcebOffice for National Statistics, National Records of Scotland, Northern Ireland Statistics andResearch Agency – Population, 2019 Estimates. https://www.ons.gov.uk/peoplepopulationandcommunity/populationandmigration/populationestimates/bulletins/annualmidyearpopulationestimates/mid2019estimates#population-growth-in-england-wales-scotland-and-northern-irelandcOffice fédéral de la statistique, 2020dPopulation au 1er janvier, eurostat, 2020
inhabitants are hosted without using additional land. In that sense, the higher thehosting capacity, the lower the pressure on developing other, not yet urbanized sites.Therefore, regardless of incomplete or imprecise inventories,we can affirm that urbanbrownfields offer a very real, far from negligible construction potential. From thatperspective, their regeneration is a relevant strategy to limit urban sprawl.
To wrap up this reflection on brownfields’ quantitative potential, allow us todigress on the idea that, as certain opponents claim, urban brownfield stock is

60 3 The Multiple Potentials of Urban Brownfields
about to disappear. On the contrary, as authors L. Andres and B. Bochet remindus, “[brownfields] are a punctual, yet perennial phenomenon in urban history. Theyreflect economic, political, democratic, ideological and social upheavals in urbanizedsocieties” (Andres and Bochet 2010). They are certainly not perennial on the long-term, but rather are an integral part of a constantly evolving territory. Brownfieldscan thus be considered as a “perpetually regenerating resource, with the potentialto provide a steady pipeline of development opportunities” (CPRE—Campaign toProtect Rural England 2019). Evidence of these processes includes recent events,such as the 2008 economic crisis, which has proven to turn the system into a true“brownfield maker” (Lafeuille and Steichen 2015).
References
ACUF A des communautés urbaines de F (2010) Les friches, coeur du renouveau urbain. Lescommunautés urbaines face aux friches: état des lieux et cadre pour agir
AdamsD,De Sousa C, Tiesdell S (2010) Brownfield development: a comparison of NorthAmericanand British approaches. Urban Stud 47:75–104. https://doi.org/10.1177/0042098009346868
ADEME (2014) Biodiversité & reconversion des friches urbaines polluéesADEME (2020a) Reconvertir les friches polluéesADEME (2020b) Travaux de dépollution pour la reconversion de friches. In: Agir pour la transition.https://agirpourlatransition.ademe.fr/entreprises/dispositif-aide/20201105/friches2021-7
ADEME, Agence de l’Environnement et de la Maîtrise de l’Energie (2014) La reconversion dessites et des friches urbaines pollués. Connaître pour agir
ADEME A de l’Environnement et de la M de l’Energie (2010) Friches urbaines. http://www2.ademe.fr/servlet/KBaseShow?sort=-1&cid=96&m=3&catid=22289. Accessed 20 January 2014
ADI A des DI (2015) Reconvertir les friches industrielles et urbaines, Le Moniteur. Emilie Guillier,Antony
Andres L, Bochet B (2010) Regenerating brownfields and promoting sustainable developmentin France and in Switzerland: what convergences? Revue d’Economie Regionale & Urbaine729–746
Apparu B (2011) Pour un Urbanisme de projetARE O fédéral du développement territorial (2008) Les friches industrielles et artisanales de Suisse- Reporting 2008, Zurich
ARE O fédéral du développement territorial (2014) Friches industrielles: réhabilitation desfriches industrielles. http://www.are.admin.ch/themen/raumplanung/00236/00423/index.html?lang=fr. Accessed 16 January 2014
Bardos RP, Jones S, Stephenson I et al (2016) Optimising value from the soft re-use of brownfieldsites. Sci Total Environ. https://doi.org/10.1016/j.scitotenv.2015.12.002
Barthel P-A (2009) Faire la preuve de l’urbanisme durable: Les enjeux de la régénération de l’îlede Nantes. VertigO - La Revue Électronique En Sciences De L’environnement. https://doi.org/10.4000/vertigo.8699
Berens C (2011) Redeveloping industrial sites: a guide for architects, planners, and developers.Wiley, Hoboken, NJ
CABERNET (2004) The need to consider social and cultural objectives when regeneratingbrownfields in Europe
Carr D (2016) Government expands densification policy. In: Building4change. http://www.building4change.com/article.jsp?id=2725. Accessed 8 April 2016

References 61
Cerema (2020) Une application pour aider à l’inventaire national des friches lancée en version testpar le Cerema. https://www.cerema.fr/fr/actualites/application-aider-inventaire-national-friches-lancee-version. Accessed 15 September 2020
CH CF (2013) Loi fédérale sur l’aménagement du territoire (LAT)CPRE—Campaign to Protect Rural England (2019) State of Brownfield 2019. An updated analysison the potential of brownfield land for housing
De Sousa C (2014) The greening of urban post-industrial landscapes: past practices and emergingtrends. Local Environ 19:1–19. https://doi.org/10.1080/13549839.2014.886560
DEFRA—Department for Environment, Food and Rural Affairs (2005) Sustainable developmentindicators in your pocket. Defra, London
Dennis AK, Norman RC (2006) The impact of small brownfields and greenspaces on residentialproperty values. J Real Estate Finan Econ 33:19–30. https://doi.org/10.1007/s11146-006-8272-7
Department for Communities and Local Government (2015) Building more homes on brownfieldland - Consultation proposals
DETECD fédéral de l’environnement des transports, de l’énergie et de la communication (2014) Larévision de la loi sur l’aménagement du territoire garantit une utilisation mesurée du sol. http://www.are.admin.ch/dokumentation/00121/00224/index.html?lang=fr&msg-id=47371. Accessed16 January 2014
DGO4 D générale opérationnelle- aménagement du territoire Logement, Patrimoine et Energie(2014) Aménagement opérationnel - Les sites à réaménager (SAR). http://dgo4.spw.wallonie.be/DGATLP/DGATLP/Pages/DAU/Pages/PouvPubl/Aides.asp
Doick KJ, Pediaditi K, Moffat AJ, Hutchings TR (2009) defining the sustainability objectives ofbrownfield regeneration to greenspace. Int J Manag Decis Mak 10:282–302
Dumesnil F, Ouellet C (2002) La réhabilitation des friches industrielles: un pas vers la ville viable?VertigO - La Revue Électronique En Sciences De L’environnement. https://doi.org/10.4000/vertigo.3812
European Commission (2011) Communication from the commission to the European parliament,the council, the European economic and social committee and the committee of the regions.Roadmap to a Resource Efficient Europe, Brussels
European Commission (2013) Science for environment policy. Thematic issue, BrownfieldRegeneration. Science Communication Unit, University of West England, Bristol
Ferber U, Grimski D (2002) Brownfields and redevelopment of urban areas. CLARINETFranz M, Pahlen G, Nathanail P et al (2006) Sustainable development and brownfield regeneration.What defines the quality of derelict land recycling? Environ Sci 3:135–151. https://doi.org/10.1080/15693430600800873
Gilderbloom JI, MearesWL, RiggsW (2014) How brownfield sites kill places and people: an exam-ination of neighborhood housing values, foreclosures, and lifespan. J Urban Int Res PlacemakUrban Sustain 9:1–18. https://doi.org/10.1080/17549175.2014.905488
Harvey F (2016) Government cuts funding for making brownfield sites suitable for new homes. TheGuardian
Hauri E (2011) Densité, mixité, mobilité et politique du logement. In: Forum Ecoparc. NeuchâtelKotval KZ (2016) Brownfield redevelopment why public investments can pay off. Econ Dev Q30:275–282. https://doi.org/10.1177/0891242416656049
Lafeuille C, Steichen P (2015) La politique de réutilisation du foncier des friches industriellesstimulée par la loi ALUR. Revue Juridique De L’environnement 40:264–281
Lange D, McNeil S (2004) Clean it and they will come? Defining successful brownfield devel-opment. J Urban Plann Dev 130:101–108. https://doi.org/10.1061/(ASCE)0733-9488(2004)130:2(101)
Laperche D (2020) L’inventaire national des friches : un outil pour le zéro artificialisation nete?Actu-Environnement.com
Lufkin S (2010) Entre ville et campagne: Stratégies de densification qualitative ciblée des frichesferroviaires régionales. EPFL, Lausanne

62 3 The Multiple Potentials of Urban Brownfields
Lusso B (2013) Patrimonialisation et greffes culturelles sur des friches issues de l’industrie minière.Regards croisés sur l’ancien bassinminier duNord-Pas deCalais (France) et la vallée de l’Emscher(allemagne). EchoGéo 26. https://doi.org/10.4000/echogeo.13645
Martin MK, Daniel TR, Kent SM (2005) An empirical model for estimating remediation costsat contaminated sites. Water Air Soil Pollut 167:365–386. https://doi.org/10.1007/s11270-005-0214-0
Matthews EC, Sattler M, Friedland CJ (2014) A critical analysis of hazard resilience measureswithin sustainability assessment frameworks. Environ Impact Assess Rev 49:59–69. https://doi.org/10.1016/j.eiar.2014.05.003
Mckenzie M, Hutton T (2014) Culture-led regeneration in the post-industrial built environment:complements and contradictions in victory square, Vancouver. J Urban Des 1–20. https://doi.org/10.1080/13574809.2014.974149
Merlin P, Choay F (2010) Dictionnaire de l’urbanisme et de l’aménagement. PUF, ParisMieg HA, Oevermann H (2014) Industrial heritage sites in transformation: clash of discourses.Routledge
Ministère de la Transition écologique (2020) Lancement du premier appel à projet dans le cadre duFonds Friches. In: Ministère de la Transition écologique. https://www.ecologie.gouv.fr/lancement-du-premier-appel-projet-dans-cadre-du-fonds-friches. Accessed 23 Nov 2020
Ministry of Housing, Communities and Local Government (2020) Planning for the future. LondonNational Housing Federation (2019) England’s brownfield land map. https://www.housing.org.uk/resources/housing-sites-brownfield-land-map/. Accessed 28 August 2020
OFEV O fédéral de l’environnement (2010a) Guide sur les affectations transitoires. BerneOFEV O fédéral de l’environnement (2010b) Valoriser les friches industrielles - une idée qui gagnedu terrain. In: Plateforme sur les friches industrielles en Suisse. http://www.sites.friches.ch/
Oliver L, Ferber U, Grimski D, et al (2005) The Scale and Nature of European BrownfieldsPacaux M, Decocp C (2010) Friches industrielles et pollutions historiques - Mission d’informationet d’évaluation
Pediaditi K, Doick KJ, Moffat AJ (2010) Monitoring and evaluation practice for brownfield, regen-eration to greenspace initiatives: a meta-evaluation of assessment and monitoring tools. LandscUrban Plan 97:22–36. https://doi.org/10.1016/j.landurbplan.2010.04.007
politics.co.uk (2011) Brownfield Development. In: politics.co.uk. http://www.politics.co.uk/reference/brownfield-development. Accessed 11 December 2015
Rall EL, Haase D (2011) Creative intervention in a dynamic city: a sustainability assessment ofan interim use strategy for brownfields in Leipzig, Germany. Landsc Urban Plan 100:189–201.https://doi.org/10.1016/j.landurbplan.2010.12.004
Rey E (2012) Régénération des friches urbaines et développement durable: vers une évaluationintégrée à la dynamique du projet. Presses Universitaires de Louvain, Louvain-La-Neuve
Rey E, AndersenM, Erkman S et al (2015) Urban recovery. Presses Polytechniques et UniversitairesRomandes, Lausanne
Rey E, Froidevaux H (2009) Les friches industrielles, un réservoir de nouvelles urbanités. Tracé26–30
Rey E, Lufkin S (2015) Des friches urbaines aux quartiers durables. Presse polytechniques etuniversitaires romandes, Lausanne
Rogers R, Gumuchdjian P (1998) Cities for a small planet, Icon Editions. Westview, Boulder, ColoRowan GT, Fridgen C (2003) Brownfields and environmental justice: the threats and challenges ofcontamination. Environ Pract Null 58–61. https://doi.org/10.1017/S1466046603030163
Schulze Bäing A, Wong C (2012) Brownfield residential development: what happens to the mostdeprived neighbourhoods in England? Urban Stud 49:2989–3008. https://doi.org/10.1177/0042098012439108
Sousa CAD (2002) Measuring the public costs and benefits of brownfield versus Greenfield devel-opment in the greater Toronto area. Environ Plann B Plann Des 29:251–280. https://doi.org/10.1068/b1283
References 63
Sousa CAD (2008) Brownfields redevelopment and the quest for sustainability, vol 3. EmeraldGroup Publishing, Amsterdam, Netherlands, Boston Mass
Thornton G, Franz M, Edwards D et al (2007) The challenge of sustainability: incentives forbrownfield regeneration in Europe. Environ Sci Policy 10:116–134. https://doi.org/10.1016/j.envsci.2006.08.008
Uklanddirectory (2014) Brownfield land development information. http://www.uklanddirectory.org.uk/brownfield.asp. Accessed 17 December 2015
Valda A, Westermann R (2004) La Suisse et ses friches industrielles - Des opportunités dedéveloppement au coeur des agglomérations
Van Duijn M, Rouwendal J, Boersema R (2014) Transformation of industrial heritage: insights intoexternal effects on house prices
Vanheusden B (2009) Recent developments in European policy regarding brownfield remediation.Null 11:256–262. https://doi.org/10.1017/S1466046609990202
Williams K, Burton E, Jenks M (eds) (2000) Achieving sustainable urban form. Taylor & Francis,London
WilliamsK,Dair C (2007)A framework for assessing the sustainability of brownfield developments.J Environ Plann Manage 50:23–40. https://doi.org/10.1080/09640560601048275
Wüest & Partner AG (2014) Atlas du développement. https://www.wuestundpartner.com/fr/applikationen/entwicklungsatlas.html. Accessed 17 December 2015
Open Access This chapter is licensed under the terms of the Creative Commons Attribution 4.0International License (http://creativecommons.org/licenses/by/4.0/), which permits use, sharing,adaptation, distribution and reproduction in any medium or format, as long as you give appropriatecredit to the original author(s) and the source, provide a link to the Creative Commons license andindicate if changes were made.
The images or other third party material in this chapter are included in the chapter’s CreativeCommons license, unless indicated otherwise in a credit line to the material. If material is notincluded in the chapter’s Creative Commons license and your intended use is not permitted bystatutory regulation or exceeds the permitted use, you will need to obtain permission directly fromthe copyright holder.
Chapter 4Urban Brownfield RegenerationProjects: Complexities and Issues
Abstract Because of urban brownfields’ inherent complexity related to theirvery nature, as well as their intermediate scale—the neighbourhood—regenerationprojects are not a spontaneous process. Indeed, an urban brownfield regenerationproject may encounter several issues, which can be obstacles, barriers, or resis-tance, that we classify in four types: sociocultural barriers, governance involved bythe multiplication of actors, legal and regulatory constraints, and deterrent costs.While these issues contribute in turn to complexify brownfield regeneration projects,they are not insurmountable. Finally, to overcome urban brownfield regenerationprojects’ complexities and issues, we argue that there is a need to implement realproject dynamics. To this end, we provide four potential approaches to foster thecreative development of tailored solutions.
Keywords Urban brownfield regeneration project · Sociocultural barriers ·Stakeholders · Governance · Legal and regulatory constraints · Costs · Soilcontamination · Project dynamics
4.1 Regenerating Urban Brownfields
While urbanbrownfields’ potential for the sustainable transitionofmetropolitan areashas been demonstrated in the previous chapters, notably as a densification strategy,it should be noted that their redevelopment is far from a spontaneous process. Inthe real world, brownfield regeneration projects encounter a series of issues—notto say obstacles, barriers, or resistance—related in particular to the complexity ofsuch operations. Indeed, brownfield regeneration projects are far more complex thanthe construction of an isolated building or the development of a new neighbourhoodon a vacant plot. Related to the very nature of urban brownfield sites covering anintermediate scale—the neighbourhood—with a building legacy of variable quality,often disconnected from their context, sometimes contaminated, and suffering from apoor image, we identify regeneration project issues according to four distinct types:sociocultural barriers, governance involved by the multiplication of actors, legaland regulatory constraints, and deterrent costs. In turn, these issues contribute tocomplexify brownfield regeneration projects. The proposed classification of issues
© The Author(s) 2022E. Rey et al., Neighbourhoods in Transition, The Urban Book Series,https://doi.org/10.1007/978-3-030-82208-8_4
65
66 4 Urban Brownfield Regeneration Projects: Complexities and Issues
needs to be balanced by a certain degree of flexibility in terms of permeabilitybetween the different types of issues, since the legal, economic, or social dimensionsare sometimes combined within a single resistance factor. Ultimately, we argue thatthe emergence of a real project dynamic in an urban brownfield regeneration, whichextends far beyond the initial stages of the process, can contribute to revealing thesite’s potential and establishing a guiding vision. This approach is essential to allowfor efficient management of these complex operations.
4.2 Sociocultural Barriers
4.2.1 Negative Perceptions
The implantation of certain programmes—in particular, housing—on brownfieldsites may, a priori, appear counter-intuitive. By definition, urban brownfields arepartially or totally abandoned sectors, which tends to give them a sense of decline.For a long time assimilated to inhospitable territories, these abandoned sites tend tobecome a privileged place for the expression of urban counter-cultures andmarginal-ities of all sorts, sometimes resulting in a nefarious reputation (Menerault and Barré2001). This negative image can discourage many potential investors.
Uncertainties related to soil contamination (more on this below) also contribute toreinforcing the negative perception of these sites. In addition, the inhospitable aspector the resulting negative connotations do not support the triggering of investmentsnor the identification of target users. Hence, a veritable vicious circle can set in:unattractive sites do not encourage investment, and this lack of investment makesthem even less desirable.
Despite this climate of negative perceptions, there is a true renewal of interest incity life. The desire for fresh air and open nature, whichmotivatedmany city dwellersto seek single-family houses in rural areas, is now clearly counterbalanced by theidea that urban life has become “chic” (Federal Environmental Agency 2005). Inmany European cities, populations are on the rise again. Among other aspects, cityresidents are typically attracted by such urban attributes as old building atmosphere,historical character, proximity toworkplaces or educational facilities, infrastructures,cafés, restaurants, etc. The “back to the city” trend certainly gives new chances tourban brownfields and positively influences their overall perception.
4.2.2 Railway Related Nuisances
Railway brownfields and industrial brownfields located in proximity to railroads areparticularly affected by this phenomenon. Indeed, often too close to heavy mobility

4.2 Sociocultural Barriers 67
infrastructure, with an environment characterized by air pollution and electromag-netic fields, railway stations were systematically located away from urban centres.Today, advances in technology make it possible to overcome a large part of thenuisances traditionally associated with railway, in particular noise pollution, both interms of emissions (modern disc brakes, composite brake blocks) and immissions(localization of living areas, noise barrier walls, soundproofing double glazing, etc.).Regarding non-ionizing radiation, railway electric transport lines have been shownto generate a relatively low level compared to other sources. Furthermore, additionalshielding measures can be implemented within buildings.
European metropolitan regions host several successful examples of residentialbuildings located close to railways. One of the really noteworthy realizations is prob-ably the Röntgenareal in Zurich, Switzerland, in particular because three inhabitantsurveys have been carried out on this ensemble of nine housing units built along therailways (Gloor and Meier 2010). Results demonstrate users’ feeling of improvedquality of life and railway-related nuisances are seldommentioned. Hence, the studyspeaks to the general satisfaction of the “railway residents”, which is certainly theresult of intelligent, carefully planned architectural measures.
4.2.3 Opposition Risks
Diverse types of opposition related to the presence of former users of the site alsorepresent a significant sociocultural resistance factor. Stemming from individualactors or interest groups who fear the loss of character of the site or reject thenew proposed programme, these oppositions may lead to the temporary blockageor definitive end of the regeneration project’s process. Typically, they appear whenthe project is submitted for public approval, during the phase of changing land-useregulations to obtain building rights.
Two main categories of actor can be identified in terms of action potential: thebeneficial owners (owners of the land concerned by the redevelopment project, directneighbours, and some associations), who can be, according to national regulations,directly subject to the right of opposition; and the other citizens, i.e., any inhabitantenjoying civil and political rights, who might have the possibility of participating inreferendum-type processes against decisions made by a public authority. Here again,the latter’s scope for action greatly depends on national political systems: directdemocracies, such as Switzerland and Luxembourg, are clearly more concerned bythis potentially critical situation for a brownfield regeneration project.
Aiming at reducing the risk of opposition, participatory approaches allowplannersto understand the concerned users’ expectations and desires before reaching thiscritical stage. Very often, in practice, the result of a public inquiry or a referendumappears to depend both on the intrinsic qualities of the project and the communicationstrategies deployed by the project leaders (Lufkin 2010). The section of this bookdedicated to the project’s process (see Chap. 6) will provide the opportunity to returnto and go further into that topic.

68 4 Urban Brownfield Regeneration Projects: Complexities and Issues
4.3 The Multiplication of Actors in the Project’s Process
4.3.1 Five Categories of Stakeholders
Considering their size (according to our adopted definition, their surface is supe-rior to a half hectare) and their strategic importance for the development of theentire metropolitan region, brownfield regeneration projects are typically character-ized by the involvement of a multiplicity of stakeholders, which undeniably tendsto complexify the process. Presenting a large diversity of interests and degrees ofinfluence, these stakeholders can be structured according to five main categories:
1. Public authorities and services are involved through their role of guardian ofthe general interest and their direct or indirect support for the project process.
2. Landowners play an active role at the beginning of the project, in particular forthe sake of valorising their property. Subsequently, their involvement can eithercontinue if they decide to invest themselves or diminish if they decide to selltheir property.
3. Clients (or principals) include the different private or public investors partici-pating in the project’s funding.
4. Planners (or agents) include the different professionals involved in the projectdesign and realization: urban planners, architects, engineers, specialists, andconstruction companies.
5. Users are represented either directly in the client’s structures, in the case ofan investment of their own, or in a more limited way if they are only tenants.Besides, temporary uses may mean that the clients need to manage relationswith users not directly related to the project.
The first two categories of stakeholders (i.e., public authorities and services andlandowners), which play strategic roles at the beginning of the project, may poten-tially generate greater complications in the redevelopment project process, as wewillsee in the next section. For municipal authorities, an urban brownfield regenerationrepresents an opportunity to support a project in line with the strategic objectives ofsustainable urban development, which notably aim at encouraging the densificationof already built-up metropolitan areas (more on sustainability issues in Chap. 5).Furthermore, a regeneration project may be an opportunity to meet the need forspecific infrastructure (cultural activities, sports facilities, etc.), foster the creationof new housing or diversify the range of commercial premises. Established withina global approach of improving the metropolitan region’s image, it offers the possi-bility of reintroducing urban continuities while simultaneously creating new publicspaces. For landowners, the primary purpose is to add value to their property, eitherby selling it to a third-party investor or by an investment of their own, which shouldallow them to generate new rental incomes.
4.3 The Multiplication of Actors in the Project’s Process 69
4.3.2 The Importance of Governance
Themultiplicity of stakeholders involved in the process, and therefore of interests anddeployed strategies, represents an additional challenge in starting up and realisinga regeneration project. Therefore, governance becomes key. It can be defined as theability to produce an informed decision based on a plurality of stakeholders. Theorganization of discussions between the latter is indeed the subject of many tensionsand requires some expertise on the part of the decision-making actors.
The first difficulties to overcome are related to the possible necessity of redefiningthe land register (sometimes called parcel framework) and to the determination ofthe land price (agreement to be reached between the different landowners). Thiscoordination between several owners’ actions in order to establish a common visionsometimes faces differences of intention or blockages by certain key stakeholders.
On another level, institutional coordination also represents a major issue in theproject process. Indeed, brownfield sites are often located on different municipalitieswithin a metropolitan area and are often governed by regional policies. This maylead to conflicts related to inter-communality and coordination between the differentpolitical and administrative levels. Intersectoral coordination is also of paramountimportance in the interplay of governance. Municipal or regional public authoritiesmay experience internal communication difficulties, which can result in differentservices expressing contradictory views. The complex coordination between trans-port and urban planning policies can be cited as an example. Many reasons canexplain this complexity, including the projects’ temporality (transport project typi-cally last 1 to 5 years, while urban planning projects last between 10 and 15 years),the continuity of public action, the involved stakeholders’ professional cultures, andthe potential power struggles between administrative services (Ollivier-Trigalo andPiechaczyk 2001).
4.4 Legal and Regulatory Constraints
One of the primary objectives of the legal framework is to ensure citizens’ securityand safety. However, some adverse effectsmay result directly fromoverly rigid archi-tectural or urban planning norms, which can potentially act as additional constraints.Therefore, the challenge is to find a balance between pragmatism and standardization,through creative, specific solutions and incentive public policies.
Until recently, in most European countries, planning tools were relatively inap-propriate to brownfield regeneration strategies. Most regional masterplans projectedsignificant construction potential in suburban and peri-urban municipalities, whichmade it difficult to channel urbanization within already built-up areas. In Chap. 3, webriefly illustrated the trend of territorial politics in the UK, Switzerland, and France.This evolution can also be observed in most European nations, where consensusis growing that brownfield regeneration can play an important role in revitalizing
70 4 Urban Brownfield Regeneration Projects: Complexities and Issues
metropolitan areas (Vanheusden 2009). It aims at rectifying a situation inheritedfrom the “glorious thirty” (the years of reconstruction following the Second WorldWar) by integrating densification strategies in proximity to city centres.
However, despite this favourable context, legal and regulatory frameworks areoften cited as important barriers on the European level (EuropeanCommission 2019).The fact that the European Union does not yet have a general brownfield policy(Vanheusden 2007) probably contributes to complexifying the situation. Among thevarious obstacles, we can cite unclear or complex (transfer of) liability, inadequate,conflicting or changing legal frameworks, compliance with the polluter pays prin-ciple (e.g., orphan sites), or the unnecessary conservatism and precaution of someregulations.
Among the different situations where legal standards may have a constrainingimpact on brownfield regeneration, we find the specific example of former railwaysites. The case of Switzerland, here again, is relatively eloquent. The Swiss Ordi-nance on Protection against Major Accidents applies to all developments next toinfrastructures with frequent transportation of hazardous materials. A developmentthreshold (in terms of buildings’ human density) is set for such areas consideredat risk, according to the probability of a major accident and the severity of thepotential consequences (Lufkin 2010). This can result in the implantation of low-density professional activities, at the expense of residential programmes, commer-cial premises or public institutions with heavy attendance—which, of course, isintrinsically contradictory to strategies of qualitative densification.
However, since debate on softening territorial or urban planning standards is not onthe agenda of the majority of European states, the most realistic strategy is certainlyto consider regulatory constraints, and standards in particular, as incentive obstaclesto be overcome with increased inventiveness and creativity in architectural design.In parallel, the development of a common, long-term, and integrated vision, amongother solutions, may constitute an efficient approach to deal with the complexities ofthe legal and regulatory frameworks (European Commission 2019). We will pursuethese reflections on using the project as a basis for urban and architectural coherencein Chap. 6.
4.5 Deterrent Costs for Potential Investors
Financial resistance can also constitute a particularly problematic parameter inbrownfield regeneration projects (European Commission 2019). Abandoned sites, astheir name evokes, are generally characterized by relatively low demand and there-fore low land values. In most cases, this general lack of interest can be explainedby the additional investments generated by longer planning or construction periodsfor brownfield regeneration projects with respect to new developments on a vacantpiece of land.
4.5 Deterrent Costs for Potential Investors 71
4.5.1 Soil Contamination
A whole range of parameters tends to increase the uncertainty level in a brownfieldregeneration project, starting with soil contamination, cited earlier. The high costsof soil investigation and remediation, determined by the level and type of pollution,represent a significant risk factor. Furthermore, in addition to generating potentialobstacles to brownfield regeneration, the issue of soil, as a non-renewable resource,has been identified by many European public entities as a major challenge. Soilquality, especially in terms of soil functions and associated services to humans,is of paramount importance, and probably even more so in increasingly urbanizedmetropolitan contexts (Monfort et al. 2020).
In quantitative terms, theEuropeanEnvironmentalAgency (EEA) estimates a totalof 250,000 contaminated sites across Europe, and approximately 3million potentiallycontaminated sites (i.e., where an investigation is necessary to establish whetherremediation is required) (European Environmental Agency (EEA) 2007). However,this impressive figure must be put into perspective. In addition to sites contaminatedby industrial and military use, it includes sites polluted due to waste landfills andagricultural activities. Contamination caused by industrial andmilitary use representsaround 70% of all cases (European Court of Auditors 2012). Thus, the number ofsites potentially contaminated by such activities can be estimated at 2.1 million.Considering the industrial past of most EU countries, a relatively large proportion ofthe latter could be considered as brownfields (Vanheusden 2009). Therefore, despitethe roughness of the calculations, potentially contaminated brownfield sites representa consequent figure.
Many European countries such as the Netherlands, Germany, Belgium, or theUnited Kingdom have established finely tuned legal instruments to manage soilcontamination issues (Ferguson et al. 2005). In Switzerland, all cantons are requiredto make a land register of polluted sites. The inventory, which is mainly based on ahistorical investigation on the type of activity and operational life of the site, deter-mines the risk of soil pollution for each plot in the territory (Rey and Lufkin 2015). InFrance, similar mechanisms have been implemented by theALUR law (2014), whichaims at overcoming barriers to contaminated brownfield regeneration, in particularby clarifying responsibilities and introducing information on soil pollution in thePlan Local d’Urbanisme (Local Urbanism Plan) (Lafeuille and Steichen 2015).
At the European level, although community legislation specifically focused onsoil protection does not exist so far, there are several relevant legal documents whichaddress brownfield remediation (Vanheusden 2009). Recent actions have been takenby the European Commission and new official directives have been approved bythe European Parliament. The latter can contribute to improving the situation withrespect to liability and traceability of environmental contamination, in particular byidentifying the company responsible for the contamination—which, according to theEnvironmental Crime Directive (Official Journal of the European Union 2008), maynow be seen as a criminal offence.

72 4 Urban Brownfield Regeneration Projects: Complexities and Issues
In the real world, however, things are not so simple. On the one hand, access toinformation is not always guaranteed. On the other hand, the speculative nature ofthis type of investigation should not be minimized. Indeed, without an in-depth studyof the soil, the determination of the precise level of contamination will always remainapproximative. Therefore, investigations are not totally reliable instruments, and thefact that a site is not reported in an inventory does not necessarily mean that it isclean (Indaco and Chappuis 2008). Furthermore, each contaminated site has uniquecharacteristics and features, which will determine the specific methods to be appliedfor its remediation (in situ, on-site or off-site), as well as the resulting costs. Off-sitetreatments are clearly the most expensive ones because they combine excavation,transport, and elimination. The elimination costs alone may vary a lot, depending onthe adopted approach. On an indicative basis, experts calculate a factor 50 betweenthe simple discharging of inert materials and their high-temperature incineration ina specialised centre (Indaco and Chappuis 2008).
In most European countries, the necessary measures (investigation, monitoring,sanitation, or reporting) are theoretically covered by the holder of the contaminatedland (owner or tenant). Depending on the circumstances and national regulations,the polluter pays principle may sometimes be applied in order to privilege equaltreatment.
Of course, this is not always possible, for instance in case of orphan sites withno traceability (impossible to find out who is responsible), or if the polluter is foundto be insolvent. In those situations, a public authority may assume part of the reme-diation costs. However, despite the variance in legal provisions from country tocountry, the idea that the site owner is required to bear the remediation costs remainswidespread. Therefore, since the financial risk associated with potential costs isproportional to the level of uncertainty, unknown information about the nature andscale of contamination tends to discourage some investors.
4.5.2 Relocation of Activities
Besides soil contamination, the relocation of activities also occupies a considerableplace in the list of financial resistance factors. Some transitory uses (residual rentals,temporarily authorized occupations)may put up resistance to the regeneration projectbecause it implies their end. They may therefore stay on the site longer than initiallyexpected. In addition, many abandoned sites depend on the relocation of part ofpersisting activities, whether industrial, artisanal, harbour, or other. The relocationof these activities may present challenges: the relocation costs can not only be high,but their temporalities can also be shifted from a site’s development requirements.Therefore, the phasing of the project in conjunction with existing uses can sometimesbe delicate. It may even lead more extended planning to deadlock.
Beyond financial aspects, the relocation of activities deserves to be viewed with acritical and global eye because it transcends conflicts of interest internal to the brown-field. Indeed, from a sustainable territorial development perspective, the strategy to
4.5 Deterrent Costs for Potential Investors 73
relocate industrial and artisanal activities or freight transport towards the outskirtsof metropolitan regions is questionable. A mix of functions and the preservationof production activities within cities are necessary conditions to create sustainableneighbourhoods which are dynamic on the economic and sociocultural levels (seeChap. 5).
The example of railway brownfields, for instance, provides a clear illustration ofthe complexity of relocation issues. In terms of logistics, the relocation of sortingcentres towards peripheral areas contributes to increasing the distance with the endconsumer, thus generating important truck traffic within the metropolis. Relocatingalso tends to reproduce dynamics of territorial fragmentation similar to those ofzoning practices. Indeed, the removal of cargo activities from urban centres increasesthe development of production sectors in peri-urban districts. And since public trans-port networks perform less well there than in denser areas, the rise in commuter flowsresults in massive use of individual cars.
Similar arguments can be developed with regard to regeneration projects ofharbour brownfields. Arbitrage between the creation of new residential neighbour-hoods and the preservation of port activities is a delicate issue, which needs to beconsidered from a global and systemic perspective—and certainly not a sectorialviewpoint. The systematic removal of freight transport activities (and artisanally orindustrially related functions) for the benefit of exclusively residential or tertiaryprogrammes does not provide a satisfactory answer to the challenges faced bymetropolitan areas in transition.
Ultimately, the coexistence of activities of various scopes and natures requires anarbitrage that needs to be operated upstream, including all concerned stakeholdersin order to avoid major blockages or large-scale functional deficits.
4.6 The Need for Project Dynamics to Overcome Obstacles
While all the above-mentioned issues contribute to complexify brownfield regenera-tion projects, they are not, however, insurmountable obstacles. To better understandthese mechanisms and identify the leverage likely to encourage these sites’ redevel-opment, a survey was carried out on Swiss industrial brownfield landowners (Valdaand Westermann 2004). The results analysis shows that the most acutely perceivedbarriers are mainly related to unfavourable conditions (lack of users or land-use planbuilding constraints) and to the difficulty of triggering the necessary investments tolaunch a project (lack of initial funding and absence of financial help).
Given these results, it appears essential to note that the importance generallyassigned to brownfield remediation costs should not be overemphasized (seeFig. 4.1).No brownfield landowner has cited the latter in the list of obstacles to brown-field redevelopment. To explain this outcome, the survey’s authors mention severalassumptions:
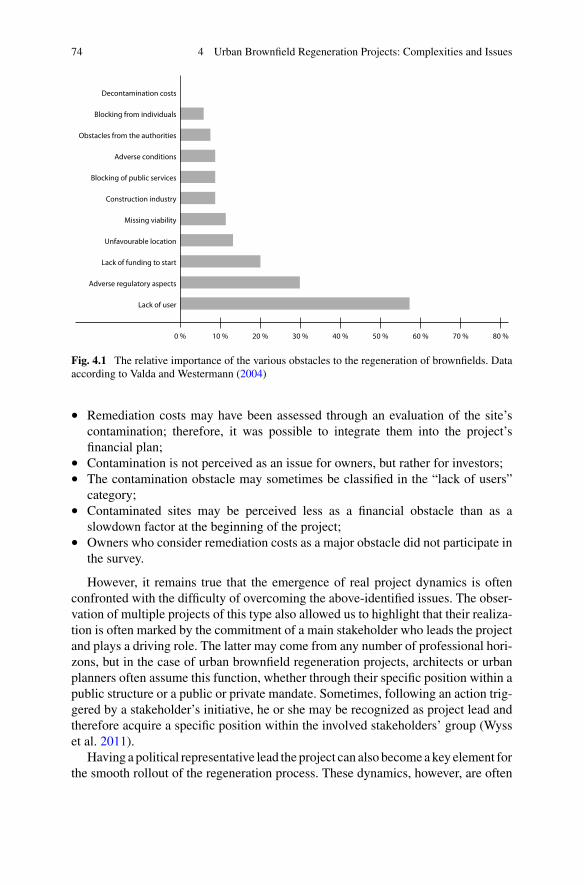
74 4 Urban Brownfield Regeneration Projects: Complexities and Issues
Decontamination costs
Blocking from individuals
Obstacles from the authorities
Adverse conditions
Blocking of public services
Construction industry
Missing viability
Unfavourable location
Lack of funding to start
Lack of user
Adverse regulatory aspects
0 % 10 % 20 % 30 % 40 % 50 % 60 % 70 % 80 %
Fig. 4.1 The relative importance of the various obstacles to the regeneration of brownfields. Dataaccording to Valda and Westermann (2004)
• Remediation costs may have been assessed through an evaluation of the site’scontamination; therefore, it was possible to integrate them into the project’sfinancial plan;
• Contamination is not perceived as an issue for owners, but rather for investors;• The contamination obstacle may sometimes be classified in the “lack of users”
category;• Contaminated sites may be perceived less as a financial obstacle than as a
slowdown factor at the beginning of the project;• Owners who consider remediation costs as a major obstacle did not participate in
the survey.
However, it remains true that the emergence of real project dynamics is oftenconfronted with the difficulty of overcoming the above-identified issues. The obser-vation of multiple projects of this type also allowed us to highlight that their realiza-tion is often marked by the commitment of a main stakeholder who leads the projectand plays a driving role. The latter may come from any number of professional hori-zons, but in the case of urban brownfield regeneration projects, architects or urbanplanners often assume this function, whether through their specific position within apublic structure or a public or private mandate. Sometimes, following an action trig-gered by a stakeholder’s initiative, he or she may be recognized as project lead andtherefore acquire a specific position within the involved stakeholders’ group (Wysset al. 2011).
Having a political representative lead the project can also becomeakey element forthe smooth rollout of the regeneration process. These dynamics, however, are often
4.6 The Need for Project Dynamics to Overcome Obstacles 75
complex and generally unpredictable. Indeed, the time span of an urban projectconsiderably exceeds that of an elected person’s office, which tends to generateconflicts of interest or interruptions in decision-making processes.
The presence of a driver at the operational level also appears as an essentialelement not only to motivate investors’ interest in the regeneration project, but alsoto organize negotiations, implement adequate regulations, and, more generally, toovercome blocking points throughout the operation. More specifically, this can betranslated into the creative development of tailored solutions, which can be structuredaccording to four axes (Von Fischer and Bulliard 2002):
• Consultation processes. The project dynamics enables to stimulate converginginterests and arbitrate between the potentially divergent interests of somestakeholders (networking and mediation);
• Organization and cooperation models. The project dynamics supports the emer-gence of innovative partnership models, which aim at pragmatically conciliatingpublic interest (in particular in terms of sustainable development) and privatesector logics;
• Funding Mechanisms. The project dynamics encourages the implementation offinancial synergies between private investors and public authorities, which areresponsible for stimulating the dynamism of the urban territory they are in chargeof;
• Tools for controlling urban development. The project dynamics facilitates thedevelopment of innovative processes, which allow the achievements of a concretestrategy for the site’s management.
Ultimately, the need for implementing a project dynamic in an urban brownfieldregeneration extends far beyond the initial stages of the process, which relate torevealing the site’s potential and establishing a guiding vision. Until the project’scompletion, this approach is essential to allow efficient management of such acomplex operation. The Chap. 6 dedicated to the “Key steps of a regenerationprocess” will provide us with an opportunity to analyse the different stages of abrownfield regeneration project and study operational project strategies likely tofacilitate the operation’s success.
References
European Commission (2019) Brownfield redevelopment in the EU. BrusselsEuropean Court of Auditors (2012) Have EU structural measures successfully supported theregeneration of industrial and military brownfield sites? Luxembourg
European Environmental Agency (EEA) (2007) Progress in management of contaminated sites.Copenhagen
Federal Environmental Agency (2005) The future lies on brownfields. DessauFerguson C, Darmendrail D, Menger P (2005) Évaluation des risques issus des sites pollués:réglementation et pratiques dans 16 pays européens, Rapport BRGM/RP-53716-FR

76 4 Urban Brownfield Regeneration Projects: Complexities and Issues
Gloor D, Meier H (2010) Siedlung Röntgenareal, Zürich 5, 1999 bis 2010. Schlussbericht dersoziologischen Langzeitstudie. Social Insight GmbH, Schinznach-Dorf
Indaco A, Chappuis B (2008) Les sites pollués. Tracés 3Lafeuille C, Steichen P (2015) La politique de réutilisation du foncier des friches industriellesstimulée par la loi ALUR. Revue Juridique De L’environnement 40:264–281
Lufkin S (2010) Entre ville et campagne: stratégies de densification qualitative ciblée des frichesferroviaires régionales. EPFL, Lausanne
Menerault P, Barré A (2001) Gares et quartiers de gares: signes et marges. INRETS 77Monfort D, Limasset E, Mossman J-R et al (2020) Sensibiliser les acteurs de l’aménagement àl’importance des fonctions du sol et des services rendus lors de projets de reconversion de frichesurbaines: retour d’expérience en métropole lilloise. Etude Et Gestion Des Sols 27:377–392
Official Journal of the European Union (2008) Directive 2008/99/EC of the European Parliamentand of the Council of 19 November 2008 on the protection of the environment through criminallaw
Ollivier-Trigalo M, Piechaczyk X (2001) Evaluer, débattre ou négocier l’utilité publique? Conflitsd’aménagement et pratiques de conduite de projet. INRETS, Paris
Rey E, Lufkin S (2015) Des friches urbaines aux quartiers durables. Presses polytechniques etuniversitaires romandes, Lausanne
Valda A, Westermann R (2004) La Suisse et ses friches industrielles - des opportunités dedéveloppement au coeur des agglomérations
Vanheusden B (2007) Brownfield redevelopment in the European Union. Boston Coll Environ AffLaw Rev 34:559–575
Vanheusden B (2009) Recent developments in European Policy regarding brownfield remediation.Null 11:256–262. https://doi.org/10.1017/S1466046609990202
Von Fischer C, Bulliard P (2002) Managers de site. Collage 19–20Wyss M, Merzaghi F, Nedelcu M, Suter C (2011) «De l’utopie au faire». D’une friche ferroviaireau quartier Ecoparc à Neuchâtel
Open Access This chapter is licensed under the terms of the Creative Commons Attribution 4.0International License (http://creativecommons.org/licenses/by/4.0/), which permits use, sharing,adaptation, distribution and reproduction in any medium or format, as long as you give appropriatecredit to the original author(s) and the source, provide a link to the Creative Commons license andindicate if changes were made.
The images or other third party material in this chapter are included in the chapter’s CreativeCommons license, unless indicated otherwise in a credit line to the material. If material is notincluded in the chapter’s Creative Commons license and your intended use is not permitted bystatutory regulation or exceeds the permitted use, you will need to obtain permission directly fromthe copyright holder.

Chapter 5Sustainability Issuesat the Neighbourhood Scale
Abstract We previously identified that urban brownfield regeneration projects arerelevant strategies to limit urban sprawl while revitalizing portions of cities, namelymixed-use neighbourhoods.Moreover, these neighbourhoods in transition are oppor-tunities to foster the implementation of sustainability objectives within Europeanmetropolitan areas. This chapter explore this subject by deepening the sustainabilityissues at the neighbourhood scale. To provide the basis for discussion,we first attemptto frame the urban sustainability concept and to explain how the neighbourhood scaleis a means of action for cities. Then, we analyse the different sustainability issuesaccording to a wide variety of parameters that must especially be taken into accountduring sustainable neighbourhood projects, and more precisely urban brownfieldregeneration projects. These parameters cover the four pillars of sustainability—theenvironment, society, economy, and governance—and the polycentric reorganizationof European metropolitan areas.
Keywords Urban sustainability · Neighbourhood scale · Sustainableneighbourhoods · Transition dynamics · Environmental balance · Socioculturalquality · Economic efficiency · Governance
5.1 Sustainability and Europe’s Changing UrbanTerritories
The sustainable city has now for decades been the dominant paradigm of urbandevelopment (Whitehead 2003). According to ideologies and discourses, sustainableurban planning as a holistic approach is a unique opportunity to create dynamic citiesthat respect both the population and the environment (Rogers and Gumuchdjian1998) as well as mitigate climate change (IPCC et al. 2018). But in practice, strivingconcretely towards the sustainable city is a subject in perpetual construction (UN2015; iiSBE 2020), which requires concerted efforts with research. According to K.Williams, we can identify two challenges for the sustainable city: the first challenge isthat of a vision (do we knowwhat the sustainable city is?) and the second challenge isthat of change (dowe know how tomake and support the sustainable city?) (Williams2010). Following these considerations, we concentrate in this chapter on the vision
© The Author(s) 2022E. Rey et al., Neighbourhoods in Transition, The Urban Book Series,https://doi.org/10.1007/978-3-030-82208-8_5
77
78 5 Sustainability Issues at the Neighbourhood Scale
challenge by focusing on the changing urban territories of European metropolitanareas, marked by the post-industrial era.
In fact, the European population being highly urbanized, mainly in small tomedium-sized cities of less than 250,000 inhabitants, these territories do face the chal-lenges of sustainability (Carter 2016). In general, theirmore-or-less organized growthmodel is responsible for irrational soil consumption: urban sprawl, sector-by-sectorurban approach, deindustrialization, increased urbanization, etc. This model’s manynegative repercussions on the environment (pollution linked to transport, degradationof ecosystems, etc.), the economy (infrastructure costs, increased energy costs, etc.),and society (social segregation, inadequate services and equipment, etc.) have beenwell proven (Newman and Kenworthy 1999; EEA and OFEV 2016). Consequently,a critical reading of the urban evolution of these territories allows us to frame theconcept of urban sustainability. This understanding of the concept is confronted withthe neighbourhood scale as a means of action. This focus will allow the identificationof specific sustainability issues later on, notably for urban brownfield regenerationprojects.
5.2 Framing the Concept of Urban Sustainability
The concept of sustainable development has its origins in the determination providedby the Brundtland report in 1987 (BRUNTLAND 1987).1 In 1992, at the EarthSummit in Rio de Janeiro, the concept evolved towards a search for balance betweenpreserving the environment, social justice, and economic progress: namely the threepillars of sustainability (UNCED1992). These three dimensions now have consensussupport and sustainable development has acquired legal and political legitimacy.Reinforced through the 2030 Agenda’s 17 Sustainable Development Goals (SDGs),it remains, however, a concept with no realmodus operandi, notablywhen juxtaposedwith the built environment such as in Goal 11, “Sustainable cities and communities”(SDSN and IEEP 2019).
Since the milestones laid down by the Aalborg Charter in 1994, updated by theNew Urban Agenda in 2016, cities have emerged as key players in sustainable urbandevelopment. Within these cities, the concept of urban sustainability is mentioned inmany political objectives but remains complex and hardly tangible. The adoption ofa unique definition of urban sustainability is rare and often disputed. This is mostlyexplained by the great number of actors—from practitioners to urban thinkers—involved in the making of the city. Each field (engineering, social sciences, urbanplanning, architecture, etc.) prefers an adaptation of the concept representing themost essential elements, a kind of ideal from their own perspective of what thesustainable city could be (Bithas and Christofakis 2006; Tanguay et al. 2010). Inthe words of S. Guy and S. Marvin, “none of these definitions represents a global
1 “Development that meets the needs of the present without compromising the ability of futuregenerations to meet their own needs”.

5.2 Framing the Concept of Urban Sustainability 79
portrait—although some claim it—since each is only part of a complex whole whichis the city”. Far from being a problem, it is important to continue to develop thismultitude of definitions, which opens the dialogue on the kind of future that we cancreate. This role can be assumed, inter alia, by research (Guy and Marvin 1999).
In accordance with the latter, the definition advanced here of urban sustainabilityis adjusted to the context and challenges of the changing territories of Europeanmetropolitan areas,marked by post-industrialisation. In that sense, it does not pretendto be universal. In order to keep a certain consistency with major discourses, our defi-nition is first anchored on the consensus around the three pillars of sustainability andenriched by a fourth pillar, that relates together to transition dynamics. Secondly,by linking sustainability to the built environment, it relates to the polycentricrestructuration of built territories, which introduces the neighbourhood scale.
5.2.1 Sustainability as Transition Dynamics: The FourPillars
To contribute to the discourse on the sustainable city, we rely first on the commonlyaccepted concept that is the search for balance between the three pillars of sustainabledevelopment (Elkington 1997), also known as the “triple bottom line” (People, Planetand Profit/Prosperity) (UN 2002). Figure 5.1 below shows objectives linked to thissearch for balance in the context of urban projects, which notably underlies theecological management of resources, decarbonation of urban systems, and proactiveanticipation of societal changes.
Even though the conceptual approach to sustainable development makes itpossible to formulate clear objectives, from an operational point of view, it seemsimpossible to reach only “win–win–win” solutions that are systematically the mostecological, the most interesting at the sociocultural level, and the most economicallyadvantageous (Rey 2006; Voituriez 2013).2 More likely, the definition of sustain-ability for European urban territories is made up of trade-offs between the threedimensions. Nevertheless, these trade-offs must maintain and strengthen natural andhuman capital, an idea underpinned by strong sustainability (Allen 1980), as well asconsider temporal and territorial scales (Andres 2013; Mallet and Zanetti 2015).
Making these trade-offs can be a complex task for the stakeholders involved in thefuture of a sustainable city. In response to this, the three-pillar concept is, nowadays,enriched by adding a fourth pillar, governance, which provides, in a way, the meansto realize these trade-offs (Yigitcanlar and Kamruzzaman 2015). This transversalpillar refers to all means deployed to identify and integrate sustainability objectivesin a project process to increase their success by aiming to improve overall quality(Tanguy et al. 2020). Governance considerations serve as a link between short and
2 The theory refers to this complex challenge as “wicked problems”, which are confronted byinterdependencies, uncertainties, circularities, and conflicting effort to find a solution (Rittel andWebber 1973; Rowe 1987; Lazarus 2009).

80 5 Sustainability Issues at the Neighbourhood Scale
long-term preoccupations as well as between local and global scales (Sharifi andMurayama 2013). This supports the idea that the concept of urban sustainability isnot an end in itself, but a means embodied in transition dynamics.
In that respect, it is also interesting to mention the 4P approach, which stronglyfocuses on practice and reflects on what the fourth pillar of sustainability may entail(Van Dorst and Duijvestein 2004). First, the approach is linked to the 3P of theconcept of the triple bottom line (People, Planet, and Profit/Prosperity). To theseis added a fourth P, which refers to Project and Process. The P-Project representsthe spatial qualities, which are the result of the integration of sustainability aspectsin relation to the specific features of a site. The P-Process refers to the interactionsbetween the different actors and institutions to carry out the project. Here too, the4P approach emphasizes the transition dynamics towards holistic sustainable devel-opment: not only must the 3P be taken into consideration, but also the context andthe particularities of each project in a given territory as well as the decision-makingprocess related to environmental, economic, and social aspects (who is in charge?
Sustainability
objectives related tothe environmental pillar
objectives related tothe sociocultural pillar
objectives related tothe economic pillar
objectives related tothe governance pillar
impact management
sociocultural links
endogenous economy
optimal use of resources
quality of life
decision-making process
carbon neutralitypollutant (air, soil, water)waste noise
mixed-use
heritage
populationemploymentlocal circular economy
contextuniquenesstemporality
interdisciplinaritytop-down & bottom-upmonitoring
landenergywaterbiodiversity
well-being (outdoor)well-being (indoor)proximity
construction costsoperating costsexternal costs
CriteriaObjectives
Hol
istic
app
roac
h
Tow
ards
a tr
ansi
tion
dyna
mic
Fig. 5.1 The four pillars of sustainability in relation to the urban project

5.2 Framing the Concept of Urban Sustainability 81
how? and when?) (Norrman et al. 2015). Essentially, it stresses the importance ofgovernance as the fourth pillar of sustainability. On the basis of the above, we referagain to Fig. 5.1 showing governance objectives and criteria in the context of urbanprojects.
5.2.2 The Polycentric Restructuration of Built Territories
In his book “Cities for a Small Planet”, R. Rogers argues that the sustainable city isa compact and polycentric city that protects the countryside, targets and integratescommunities within the neighbourhoods (poles), and maximizes proximity (RogersandGumuchdjian 1998). Already introduced in Chap. 3, the compact and polycentriccity model adapted to the metropolitan area represents a relevant strategy to addressthe shortcomings of land-use planning for European metropolises.
This model comes from the compact city densification model, which supportsthe idea of inward urbanization or, in other words, building the city within the city.Yet, densification must be understood as a “necessary but not sufficient condition” toapproach sustainable urban development (Jenks 1998; Burton 2000). Hence, goingfrom a unipolar point of view to a more nuanced one, the compact and polycentriccity model reinforces density, diversity and mobility at several focal points of anurban territory, while limiting the risks that an excessive concentration of activi-ties in the city centre could generate (Dupont and Pumain 2000). The compact andpolycentric city model is, therefore, appropriate for European post-industrial urbanterritories, which often have an urban structure with multiple centres (metropolitanareas for example) accompanied by a public transport network with varying degreesof efficiency.
The advantage of this model lies in the coordination between urbanization andmobility while increasing quality of life (satisfaction of sociocultural aspirations,diversity, optimal densification) and maintaining economic attractiveness (strength-ening the economic fabric in urban areas) (Rey 2012). In other words, the poly-centric restructuration of built territories can be seen as a form of optimisation ofexisting metropolitan areas based on their potential at the various interconnectionpoints of their territory—namely, the neighbourhoods—to reinforce their inherentcharacteristics (density, diversity, mobility).
5.2.3 Neighbourhoods in Transition
Our framing of the concept of urban sustainability provides a vision for the evolutionof European metropolitan areas and is the result of a convergence between twoinputs. First, it is reflected in a transition dynamic, which concerns the connection ofenvironment, society, economy to the governance of urban transformations. Second,it relies on the polycentric restructuring of built territories, including themanagement

82 5 Sustainability Issues at the Neighbourhood Scale
of ecological resources, urban system decarbonation, and proactive anticipation ofsocietal changes. In this regard, developments at the neighbourhood scale can bedeterminant tools to help build and support the transition towards urban sustainability.Urban brownfield regeneration projects perfectly embody these neighbourhoods intransition. In other words, a regeneration project is a neighbourhood in transition thatturns urban brownfield potentials (Chap. 3) into strengths for sustainability.
5.3 The Neighbourhood Scale as a Means of Actionfor Cities
Between city and building, the neighbourhood scale offers a sample of the urbanreality that is sufficiently broad to address sustainability criteria (see Fig. 5.2). It goesbeyond the single building by including open spaces and urban networks, but is alsotargeted enough to consider concrete interventions within a reasonable timeframe(Rey 2011; Sharifi 2015; Hajer et al. 2020). In addition, the neighbourhood scaleturns out to be the minimum operational level to consider the social dimensionof urban sustainability (Berardi 2011). As a portion of a city, there is no officialdefinition for the neighbourhood. We can consider it as a spatial unit that people canrelate to, that is a coherent living environment where we work, live, and have shopsand services (Talen 2019). The physical limit is not precisely defined because it willdepend on the type of neighbourhood (density of housing, public spaces, diversityof building functions, identity) and any future interventions (Choguill 2008; RieraPérez et al. 2018).
country
top-downnationalobjectives
metropolisobjectives
sustainabilityconcept
individualobjectives
awareness bottom-up
region
metropolitan area
neighbourhood
building
single user
Fig. 5.2 The neighbourhood as an efficient spatial scale for the implementation of transitiondynamics towards sustainability

5.3 The Neighbourhood Scale as a Means of Action for Cities 83
From the urban densification perspective, the neighbourhood must embody anurban way of life, with dense, good quality and sustainable housing, in order to offera credible alternative to the peri-urban single-family home. In this sense, the “sus-tainable neighbourhood” now appears to be the emblematic figure of the sustainablecity in the making, as can be seen from the abundance of initiatives promoting thistype of project (Machline et al. 2020; Hajer et al. 2020).3
Still, a sustainable neighbourhood is not a panacea, and faces multiple andcomplex challenges (see Chap. 8). In many cases, sustainable neighbourhoods are,within social, economic, and urban issues, used as an opportunity to work on thelocal image and identity of a city. Hence, through its—often mostly environmental(Tanguy et al. 2020)—performance, the sustainable neighbourhood contributes toextracting the site, and more generally the city, from a negative image towards anattractive, dynamic, and innovative one. This is particularly true for the sustainableneighbourhoods developed as a response to the presence of urban brownfields.
According to the definition elaborated in Chap. 2, urban brownfield regenerationprojects concern areas of at least 5,000 m2. Therefore, they are not limited to theconstruction or transformation of a single building, but most often correspond tothe creation of a real neighbourhood. Hence, the thought processes that govern theirdevelopment are situated on an intermediate scale between urban strategies and thearchitectural creation of buildings. They are part of the interlocking logic of planningactivities that today covers the notion of “urban project”.
Ameticulous regeneration of an urban brownfield is able to respond to the compactand polycentric city model while incorporating a transition dynamic towards sustain-ability. As such, the urban brownfield regeneration project embodies the neighbour-hood in transition.Hence, urban brownfield regeneration projects are subject to issuessimilar to those that govern sustainable neighbourhood projects. If they are some-times perceived as additional constraints, these issues can also turn into resourcesfor the project (Rey 2014). They then become potential sources of creativity andinspiration for the architects or urban planners in charge.
No unilateral formula can be applied to the sustainable neighbourhood. Neverthe-less, the next sections of this chapter will provide a detailed overview of the conceptof sustainable neighbourhood by drawing up a non-exhaustive inventory of the mainsustainability issues at the neighbourhood scale. It is indeed a question of reconcilinga wide variety of parameters.
3 Highly publicized, the first eco-neighbourhoods such as the Vauban neighbourhood in Freiburgim Breisgau (DE), Bo01 in Malmö (SE), Hammarby Sjöstad in Stockholm (SE), BedZED inBeddington (UK), Eva-Lanxmeer in Culemborg (NL) or Ecoparc inNeuchâtel (CH) have often beenconsidered from a technical-environmental perspective. These have inspired many other initiatives,but with generally more modest requirements.

84 5 Sustainability Issues at the Neighbourhood Scale
5.4 Built Density, Functional Mix, and Sustainable Mobility
The creation of a sustainable neighbourhood falls within the coordination betweenurbanization and mobility, by structuring the transformation of the built environ-ment with the development of public transport (encouraging “soft” or sustainablemobility) (Zhu and Leibowicz 2020) and by simultaneously breaking with the prin-ciple of dissociation of activities (encouraging a diversity of functions). Studies haveshown that an attractive public transport offer requires a good perceived availabilitycomparable to that of the private car as well as a perception of safety, highlightinginformation and comfort as main drivers (Steg 2003; Friman et al. 2020). Accordingto expert opinions, the area served by public transport must meet a minimum builtdensity corresponding to a floor area ratio (FAR) between 0.3 and 0.6 to be environ-mentally and economically sound (Gasser 2003). In urban areas, recent examplesshow that quality regeneration projects can be carried out with a clearly higher floorarea ratio of the order of 1–2 (Lauring et al. 2010; Kurvinen and Saari 2020).
The compact and polycentric citymodel can be a relevant strategy to promote jointcontrol of urbanization and mobility. Indeed, as previously described, this model ispart of an evolution and optimisation logic based on the current situation of Europeanurban territories. It follows the idea of an urban structure with multiple centreswhose implementation appears both flexible and adapted to metropolitan areas. Thisurban development approach allows greater compactness within metropolises whilelimiting problems such as road congestion and air or noise pollution in the citycentre caused by an excessive concentration of activities. It leads to the creation of“mixed and compact poles”, namely the strengthening and development of dense andmultifunctional secondary sectors, which distribute the functions of the metropolisat public transport interconnection points.
At these strategic poles, the objective is therefore to create dense and mixed-use neighbourhoods with proximity to public transport stops to promote sustain-able mobility. As detailed in Chap. 3, this objective coincides with the regenerationopportunity of urban brownfields, contributing concurrently to densify and revitalizeexisting built fabrics. Theprovisionwithin the sameneighbourhoodof spaces devotedto housing, activities, and local services avoids creating monofunctional sectors, likebedroom communities or business districts, which are deserted at certain hours ofthe day or night (Merlin and Choay 2010). To link these different functions, specialcare must be taken to provide sustainable mobility networks throughout the neigh-bourhood (walking and cycling routes) and its connections with surrounding areas.Moreover, giving pedestrians more space increases the safety of all users (Wang andYang 2019).

5.5 High Environmental Quality of Buildings and Developments 85
5.5 High Environmental Quality of Buildingsand Developments
Among the various issues raised by the creation of a sustainable neighbourhood, envi-ronmental considerations—especially energy consumption—have been integratedprimarily into the thought processes. This echoes the gradual emergence of collectiveecological awareness since the 1970s.Within the context of climate changemitigation(UN andUNFCCC2015), environmental considerations still play a central role in thearchitectural and urban concerns related to sustainable development. This is largelyexplained by the fact that building construction and exploitation remains a particu-larly energy-intensive sector. Even if there are large disparities in building perfor-mance across countries, buildings account for 41% of final energy consumption and60% of electricity consumption in the EU-28. The average annual consumption forall types of buildings reaches around ~200 kWh/m2. Two-thirds of this consumptionis from residential buildings (Rousselot and Pollier 2018). Moreover, the construc-tion sector accounts today for 36% of the European Union’s GHG emissions (EU2017).
In the face of such a challenge, a sustainable neighbourhood should be designed toreduce not only its energy consumption, but also that of all non-renewable resources(soil, water, biodiversity), as well as minimize its ecological footprint. A sustainableapproach results in the adoption of bioclimatic architectural strategies and high-performance technological devices. The latter aim is, in particular, to reduce heatingrequirements (high thermal quality of the envelope, controlled air renewal in winter,promotion of passive solar gains and internal gains), reduce demand for electricity(natural light, solar protection, passive cooling, high-efficiency devices), and developrenewable energies (active solar, wood, geothermal, biomass) to cover the remainingneeds. The use of environmentally friendly materials is another relevant strategy, byintegrating ecological analysis (grey energy and pollutant emissions) into the earlyarchitectural design process of the buildings (Jusselme 2020). The aim is to limit thegeneration of waste during construction and to ecologically manage those that areunavoidable (sorting at source). Promoting circularity in building practices throughthe re-use of onsite materials is also an opportunity to be seized during brownfieldregeneration projects (Fivet and Brütting 2020). Ultimately, both on the neighbour-hood and building scale, the optimal management of water aims to reduce waterconsumption and maintain the natural regime of rainwater (recovery, infiltration,retention).
Life Cycle Analyses (LCA) of buildings, labelling processes, performance moni-toring after commissioning and raising users’ awareness of environmental consid-erations are also effective levers for action and an integral part of the sustainableneighbourhood process. We will address these topics in detail in Chap. 8.

86 5 Sustainability Issues at the Neighbourhood Scale
5.6 Urban Contextualization and Preservationof Architectural Heritage
As previously mentioned, the creation of a sustainable neighbourhood is often takenas an opportunity to restructure a city and work, at the same time, on local image andidentity. Unlike new neighbourhoods built in the outskirts on greenfields, neighbour-hoods as brownfield regeneration projects confront an urban situation that is alreadystrongly constructed. In order to promote the integration of the future neighbour-hood into the existing surroundings, the project should consider the notions of builtheritage and cultural identity from the outset.
Indeed, many urban brownfields, whether industrial, infrastructural, military, orother types, are home to buildings of significant historical interest (see Chaps. 2 and3). Initially, their transformation involved the demolition of the existing infrastructurebecause the brownfield site was considered too negative, not to say too complex (seeChap. 4) (Lusso 2013). But an urban brownfield “also bears the interests, hopes, fears,and memories of the different actors related to each vacant site” (Trigo 2020). Moreoften today, under the impetus emanating notably from civil society, brownfieldregeneration into a sustainable neighbourhood implies enhancing the site via anemblematic architectural project (Berens 2011; ADI 2015).
Thus, strategies for recycling existing infrastructures are often prioritized (Berens2011; Mieg and Oevermann 2014), while producing positive effects on surroundingproperty values (Van Duijn et al. 2014).4 This heritage dynamics, by which thesociety recognizes a site as worthy of conservation, contributes to improving theperception and image of the brownfield while reviving a specific history of the place(CABERNET 2004). Entering into interaction with existing structures, the regen-eration project implies by definition taking a stand for that which deserves to bepreserved, transformed, or replaced. Thus, in a prospective and dynamic vision, it isa question of considering the historical and morphological substance of the buildingsand adapting them to contemporary needs. The example of the Emscher Valley inGermany described in Chap. 2 is particularly representative of that matter.
Often converted into spaces with a cultural vocation, culture becomes a tool forimproving the conditions in given areas of cities and handling their new urban trajec-tories (Mecca and Lami 2020). These new places must continue to offer creative andfertile spaces while avoiding the pitfalls of “museumization” (Mieg and Oevermann2014; Mecca and Lami 2020). Indeed, urban brownfields offer the possibility of newthird places,5 particularly in neighbourhoods where culture, in its traditional form,is absent (Bertrand 2018). Whatever the quality of the buildings, urban brownfieldsare often temporary hosts of artists and associations with added social value whotake advantage of inexpensive spaces offering flexible use. As discussed in Chap. 3,the regeneration of these places is, therefore, an opportunity to include a culturalcomponent, which can be an integral part of the local economy and social life of
4 The counterpart may be new-built gentrification. See Sect. 5.9.5 A third place is the social surroundings separate from the two usual social environments of home(first place) and the workplace (second place) (Oldenburg 1999).
5.6 Urban Contextualization and Preservation … 87
sustainable neighbourhoods. The regeneration of the Belle de Mai brownfield inMarseille, France, is a particularly good example of this approach (see Chap. 2).
However, if culture and heritage can be levers for the transformation of a brown-field into a sustainable neighbourhood, a broader definition of these aspects invites adiversification of objectives in terms of social and programmatic mix and economicactivities (Mckenzie and Hutton 2014). Our search for the optimal degree of inter-vention, depending on the specific project dynamics, involves a certain number ofdiagnoses, which are an integral part of the project evaluation. This will be dealt within the second part of this book, entitled Project Dynamics and Support Tools.
5.7 Well-being and Conviviality Within the Neighbourhood
An argument often opposed to urban densification strategies is that they do notcorrespond to inhabitants’ aspirations, whose ideal would be to live in a detachedhouse in the countryside and move freely by car. If these aspirations symbolize acertain number of wishes and needs (privacy, property, proximity to natural spaces),some studies today put their scope into perspective. Residential preferences, whichresult from psychological, sociological, and financial considerations, are not limitedto the peri-urban countryside. The suburban model—and resulting dependence onthe automobile—are, therefore, not the result of a general aspiration (Vos et al. 2016;Jansen 2020).Whether urban or suburban, neighbourhood satisfaction can be definedas the extent to which the residential neighbourhood’s needs are met (Lovejoy et al.2010).
Earlier, we described the sustainable neighbourhood as the development of a denseand multifunctional secondary sector in coordination with public transport services.As this strategy increases the density of the already-built fabric, like with urbanbrownfield regeneration, it consequently implies improving the image of housingin urban areas. This densification with high added value—both for the inhabitantsof the neighbourhood and for those of the whole metropolis—is taking even moreimportance in peri-urban territories, because it allows an alternative to the single-family home (Vos et al. 2016). Questions of quality of life and user comfort, therefore,occupy a central place in the process of designing built and non-built spaces.
Among the many qualitative parameters that can contribute to a neighbourhood’sattractiveness and conviviality, the development of green spaces and quality publicplaces is particularly important (Shaftoe 2012). The spaces allow the generation ofa specific identity for each neighbourhood and promote exchanges and meetingsamongst inhabitants. They accompany the integration of a diversified offer of localservices (institutional spaces, cultural places, cafe-restaurants, small shops, gameand leisure spaces), adapted in particular to the needs of families and older people(Reiter 2007; Gehl 2010). Being part of sustainable neighbourhood design processes,diverse degrees of participation and bottom-up planning approaches can help definethe future-users’ needs and promote their acceptance of the project. We will furtherdevelop this topic in Chap. 6.

88 5 Sustainability Issues at the Neighbourhood Scale
5.8 Intergenerational and Social Diversity
The planning of framework conditions that favour intergenerational and social diver-sity is also, to a certain extent, part of a search for wellbeing and conviviality inthe broad sense of the term. A rich and balanced neighbourhood life contributes toquality exchanges between inhabitants.
To encourage this diversity, a particular emphasis should be placed on mecha-nisms likely to promote intergenerational cohabitation as well as a social and culturalmix. We can cite, for example, the establishment of childcare facilities (crèches,after-school drop-in, extracurricular programmes), spaces specifically adapted forexchanges between users (community centres, cafes, meeting spaces, libraries, fablabs, repair cafés) or opportunities for leisure activities (cultural spaces, entertainmentand creative workshops, community gardens, sports facilities).
The creation of a variety of types of housing, in terms of dimension, standards,and spatial typologies, also allows one to respond to a wider audience (students,single people, families, early retirees, elderly people, people with reduced mobility).Moreover, this varied offer opens up possibilities to explore different avenues ofintermediate or semi-individual housing; the resulting density enables the reconcil-iation of a satisfactory appropriation of the neighbourhood and an attractive publictransport offering.
Once the neighbourhood is completed, the existence of organizations allowingresidents to get involved in neighbourhood life also tends to favour the identificationof residents with their living environment and the harmonious coexistence betweenall neighbourhood users. Ultimately, the use-value will be a good indicator to judge,a posteriori, the success of the transition from urban brownfield to a sustainableneighbourhood. If the neighbourhood is lively throughout the day, the feeling ofurbanity intensifies, offering a multitude of possible appropriations according toindividual lifestyles.
5.9 Control of Global Costs
As urban areas account for the vast majority of the population and jobs, they arelegitimately considered the main drivers of economic activity in most Europeancountries (EU 2019). Hence, strategies to limit urban sprawl and develop sustainablemobility should be done while simultaneously aiming to strengthen the economicattractiveness of specific urban areas (Glaeser 2011). This urban densification—as analternative to new constructions on the outskirts—can offer a favourable frameworkfor diversification of economic activities in metropolises, which helps to maintainand create jobs in urban areas. In that sense, brownfield regeneration contributes toan image of economic dynamism, favourable to the strengthening and developmentof urban areas.

5.9 Control of Global Costs 89
At this stage, it is important to remember that, on the whole, urban brownfieldsare characterised by good accessibility and a high centrality. Inventories carriedout in several European countries show that most of the identified brownfields arelocated within metropolitan territories (see Chap. 3). In fact, at the time of theirconstruction, industrial facilities were installed on the outskirts of cities to avoidany nuisance. Still, the choice of their location was carefully studied, i.e., close totraffic routes, particularly railways, to facilitate access to goods and users. Followingthe extension of urbanization, these sectors gradually found themselves integratedinto the metropolitan area. In most cases, they have been able to preserve—or evenreinforce—their advantageous accessibility conditions.
From the end of the 1990s, the literature wondered about the existence of certainbehaviours, which tend to demonstrate that physical accessibility remains a real assetfor places of life and work, despite the emergence of a society increasingly orientedtowards information and communication technologies (Ascher 1995). “It is cleartoday that what is not communicable, digitizable, takes more and more value ineconomic life as in social life. Yet, never before the value of office real estate hasdepended that much on the quality of its location, its physical accessibility, and itseconomic and urban environment (Ascher 2001)”.
Years later, a central location still offers significant advantages in terms of accessto job markets, various urban facilities, and services. It is increasingly sought afterby companies, whose location strategies are based on trade-offs between prox-imity to transport hubs, land prices, and taxation (Pritchard and Frøyen 2019).6
For households, residential location refers to the same types of criteria, even if thesechoices are more complex. As we have seen before, trade-offs are of course made interms of accessibility and price, but also according to possibilities or constraints andaspirations to certain residential models (single-family homes, townhouses, etc.).
As a result, due to their central and accessible location, new sustainable neigh-bourhoods on regenerated urban brownfields find themselves at the heart of a seriesof tensions. At the same time, places of concentration of flows and public spaces,these sectors can quickly become a city showcase, supposing a strong architectural,symbolic, and land valuation. However, the opportunity to revitalize a decliningsector, both economically and socially, is also criticized for the phenomenon of“new-built gentrification” that it generates (Rérat et al. 2010), and gentrification inthe neighbouring sectors (Schulze Bäing and Wong 2012). As previously discussed,without consideration for social diversity, these projects are often for the sole benefitof the upper social classes (Squires and Hutchison 2021). Because social problemsare less apparent in brownfield regenerations than in the case of the urban renewalof degraded districts, their regeneration focuses more intensively on the dense anddynamic city (Andres and Bochet 2010).
Despite the obvious advantages linked to location attractiveness, the economicfeasibility of a brownfield’s regeneration into a sustainable neighbourhood is riskydue to the complexity of this type of operation (see Chap. 4). It involves controlling
6 However, the impact of the recent democratization of teleworking due to the COVID-19 pandemicon business property and the demand for office space is difficult to assess (CreditSuisse 2020).

90 5 Sustainability Issues at the Neighbourhood Scale
overall costs over the long term, either by considering the construction or the oper-ating phase. Poorly controlled costs tend to penalize the balance of the operationdue to inefficiency, or even to unfortunately defer certain charges to the finances ofpublic authorities.
The next chapter, which addresses the key steps of an urban brownfield regenera-tion process, will discuss questions of land management and the distribution of costsbetween owners. It will be an opportunity to elaborate on the participation of civilsociety not only in economic and social aspects, but also in environmental designconsiderations. Participation is an integral part of the governance of a neighbourhoodin transition.
References
ADI Association des directeurs immobiliers (2015) Reconvertir les friches industrielles et urbaines,Editions du Moniteur, Paris
Allen R (1980) How to save the world: strategy for world conservation. Kogan Page, LondonAndres L (2013) L’intérim, le temporaire et la veille comme enjeux d’une ville réversible et éminem-mentmutable. Villes, Territoires, Réversibilités, 49–62. https://doi.org/10.3917/herm.scher.2013.01.0049
Andres L, Bochet B (2010) Regenerating brownfields and promoting sustainable development inFrance and in Switzerland: what convergences? Rev Econ Reg Urbaine 729–746. https://doi.org/10.3917/reru.104.0729
Ascher F (1995) Métapolis, ou, L’avenir des villes. Editions O. Jacob, ParisAscher F (2001) La nouvelle révolution urbaine: de la planification au management stratégiqueurbain. In: Masboungi A (ed) Fabriquer la ville. Outils et méthodes: les aménageurs proposent,La Documentation française. Paris
Berardi U (2011) Beyond sustainability assessment systems: upgrading topics by enlarging thescale of assessment. Int J Sustain Build Technol Urban Dev 2:276–282. https://doi.org/10.5390/SUSB.2011.2.4.276
Berens C (2011) Redeveloping industrial sites: a guide for architects, planners, and developers.Wiley, Hoboken, NJ
Bertrand J (2018) Les friches en Europe, reconvertir l’industriel en culturel. Pour la solidarité.European think and do tank.
BithasKP,ChristofakisM (2006)Environmentally sustainable cities. Critical reviewand operationalconditions. Sustain Dev 14:177–189. https://doi.org/10.1002/sd.262
BRUNTLAND G (1987) Our common future: the world commission on environment anddevelopment. Oxford University Press, Oxford
Burton E (2000) The compact city: just or just compact?: a preliminary analysis. Urban Stud 37CABERNET (2004) The need to consider social and cultural objectives when regeneratingbrownfields in Europe
Carter DK (ed) (2016) Remaking post-industrial cities: lessons from North America and Europe.Routledge, New York, NY
Choguill CL (2008) Developing sustainable neighbourhoods. Habitat Int 32:41–48. https://doi.org/10.1016/j.habitatint.2007.06.007
CreditSuisse (2020) COVID-19 strengthens real estate market trends. In: Real Estate Monitor Q32020, Credit Suisse AG, Investment Solutions & Products
Dupont V, Pumain D (2000) De la ville compacte aux métropoles polycentriques. In: Dureau F,Dupont V, Lelièvre E et al (eds) Métropoles en mouvement: une comparaison internationale.Anthropos, Paris, pp 51–71

References 91
EEA, OFEV (2016) Urban sprawl in Europe. Publications Office, LuxembourgElkington J (1997) Cannibals with forks: the triple bottom line of 21st century business. Capstone,Oxford
EU EC (2017) Commission welcomes agreement on energy performance of buildings. BrusselsEU (2019) Focus on regional socioeconomic developments. In: Kotzeva M (ed) Eurostat regionalyearbook. Eurostat, Luxembourg, pp 195–216
Fivet C, Brütting J (2020) Nothing is lost, nothing is created, everything is reused: the new structuraldesign assignment for a circular economy. Struct Eng
FrimanM, Lättman K, Olsson L (2020) Public transport quality, safety, and perceived accessibility.Sustainability 12:3563. https://doi.org/10.3390/su12093563
Gasser P (2003) Trafic lent et qualité de l’habitat. In: ASPAN-SO. ASPAN-SO, LausanneGehl J (2010) Cities for people. Island PressGlaeser EL (2011) The triumph of the city. Macmillan, LondonGuy S, Marvin S (1999) Understanding sustainable cities: competing urban futures. Eur Urban RegStud 6:268–275. https://doi.org/10.1177/096977649900600307
Hajer M, Buitelaar E, Dam CT et al (2020) Neighbourhoods for the future: a plea for a social andecological urbanism, 1er édition. Valiz, Amsterdam
iiSBE (2020) International initiative for a sustainable built environment. http://www.iisbe.org/.Accessed 21 Jan 2021
IPCC IP on CC, Rogelj J, Shindell D et al (2018) Mitigation pathways compatible with 1.5 °C inthe context of sustainable development 82
Jansen SJT (2020) Urban, suburban or rural? Understanding preferences for the residential envi-ronment. J Urban Int Res Placemaking Urban Sustain 13:213–235. https://doi.org/10.1080/17549175.2020.1726797
Jenks M (1998) The compact city: a sustainable urban form? Spon, London etc. (Reprinted)Jusselme TBP (2020) Data-driven method for low-carbon building design at early stages. Ecolepolytechnique fédérale de Lausanne (EPFL)
Kurvinen A, Saari A (2020) Urban housing density and infrastructure costs. Sustainability 12:497.https://doi.org/10.3390/su12020497
Lauring M, Andrade V, Jensen OB, Heiselberg P (2010) The density of sustainable settlements2020. Sustain Cities Build 13
Lazarus R (2009) Super wicked problems and climate change: restraining the present to liberatethe future. Georget Law Fac Publ Works
LovejoyK, Handy S,Mokhtarian P (2010) Neighborhood satisfaction in suburban versus traditionalenvironments: an evaluation of contributing characteristics in eight California neighborhoods.Landsc Urban Plan 97:37–48. https://doi.org/10.1016/j.landurbplan.2010.04.010
Lusso B (2013) Patrimonialisation et greffes culturelles sur des friches issues de l’industrie minière.Regards croisés sur l’ancien bassinminier duNord-Pas deCalais (France) et la vallée de l’Emscher(allemagne). EchoGéo 26. https://doi.org/10.4000/echogeo.13645
Machline E, Pearlmutter D, Schwartz M, Pech P (2020) Green neighbourhoods and eco-gentrification: a tale of two countries. Springer Nature. https://doi.org/10.1007/978-3-030-38036-6
Mallet S, Zanetti T (2015) Le développement durable réinterroge-t-il les temporalités du projeturbain? VertigO Rev Électronique En Sci Environ
Mckenzie M, Hutton T (2014) Culture-led regeneration in the post-industrial built environment:complements and contradictions in Victory Square, Vancouver. J Urban Des 0:1–20. https://doi.org/10.1080/13574809.2014.974149
Mecca B, Lami IM (2020) The appraisal challenge in cultural urban regeneration: an evaluationproposal. In: Lami IM (ed) Abandoned buildings in contemporary cities: smart conditions foractions. Springer International Publishing, Cham, pp 49–70
Merlin P, Choay F (2010) Dictionnaire de l’urbanisme et de l’aménagement. PUF, ParisMieg HA, Oevermann H (2014) Industrial heritage sites in transformation: clash of discourses.Routledge

92 5 Sustainability Issues at the Neighbourhood Scale
Newman P, Kenworthy JR (1999) Sustainability and cities overcoming automobile dependence.Island Press, Washington, D.C.
Norrman J, Volchko Y, Maring L et al (2015) BALANCE 4P: balancing decisions for urbanbrownfield redevelopment. Gothenburg, Sweden
Oldenburg R (1999) The great good place cafés, coffee shops, bookstores, bars, hair salons, andother hangouts at the heart of a community. Da Capo Press, Cambridge
Pritchard R, Frøyen Y (2019) Location, location, relocation: how the relocation of offices fromsuburbs to the inner city impacts commuting on foot and by bike. Eur Transp Res Rev 11:14.https://doi.org/10.1186/s12544-019-0348-6
Reiter S (2007) Elaboration d’outils méthodologiques et techniques d’aide à la conceptiond’ambiances urbaines de qualité pour favoriser le développement durable des villes. Universitécatholique de Louvain
Rérat P, Söderström O, Piguet E, Besson R (2010) From urban wastelands to new-build gentri-fication: the case of Swiss cities. Popul Space Place 16:429–442. https://doi.org/10.1002/psp.595
Rey E (2006) Régénération des friches urbaines et développement durable. Vers une évaluationintégrée à la dynamique de projet. Université Catholique de Louvain, Faculté des SciencesAppliquées, Département d’architecture, d’urbanisme de génie civil et environnement
Rey E (2011) Quartiers durables. Défis et opportunités pour le développement urbain. BerneRey E (2012) Régénération des friches urbaines et développement durable: vers une évaluationintégrée à la dynamique du projet. Presses Universitaires de Louvain, Louvain-La-Neuve
Rey E (2014) From spatial development to detail. Collection notatio. Quart Publishers, LucerneRiera Pérez MG, Laprise M, Rey E (2018) Fostering sustainable urban renewal at the neighborhoodscale with a spatial decision support system. Sustain Cities Soc 38:440–451. https://doi.org/10.1016/j.scs.2017.12.038
Rittel HWJ, Webber MM (1973) Dilemmas in a general theory of planning. Policy Sci 4:155–169.https://doi.org/10.1007/BF01405730
Rogers R, Gumuchdjian P (1998) Cities for a small planet, Icon Editions. Westview, Boulder, CORousselot M, Pollier K (2018) Energy efficiency trends in buildings. ODYSSEE-MURE PolicyBrief 4
Rowe PG (1987) Design thinking. MIT PressSchulze Bäing A, Wong C (2012) Brownfield residential development: what happens to the mostdeprived neighbourhoods in England? Urban Stud 49:2989–3008. https://doi.org/10.1177/0042098012439108
SDSN, IEEP I for EEP (2019) Europe Sustainable Development Report 2019. SustainableDevelopment Solutions Network and Institute for European Environmental Policy. Paris andBrussels
Shaftoe H (2012) Convivial urban spaces: creating effective public places. EarthscanSharifi A (2015) From Garden City to eco-urbanism: the quest for sustainable neighborhooddevelopment. Sustain Cities Soc. https://doi.org/10.1016/j.scs.2015.09.002
Sharifi A, Murayama A (2013) A critical review of seven selected neighborhood sustainabilityassessment tools. Environ Impact Assess Rev 38:73–87. https://doi.org/10.1016/j.eiar.2012.06.006
Squires G, Hutchison N (2021) Barriers to affordable housing on brownfield sites. Land Use Policy102. https://doi.org/10.1016/j.landusepol.2020.105276
Steg L (2003) Can public transport compete with the private car? IATSS Res 27:27–35. https://doi.org/10.1016/S0386-1112(14)60141-2
Talen E (2019) Neighborhood. Oxford University Press, New York, NYTanguay GA, Rajaonson J, Lefebvre J-F, Lanoie P (2010) Measuring the sustainability of cities: ananalysis of the use of local indicators. Ecol Indic 10:407–418. https://doi.org/10.1016/j.ecolind.2009.07.013
Tanguy A, Breton C, Blanchet P, Amor B (2020) Characterising the development trends drivingsustainable neighborhoods. Build Cities 1:164–181. https://doi.org/10.5334/bc.22

References 93
Trigo SF (2020) Vacant land in London: a planning tool to create land for growth. Int Plan Stud25:261–276. https://doi.org/10.1080/13563475.2019.1585231
UN (2002) Report of the world summit on sustainable development. Johannesburg, South AfricaUN (2015) Transforming our world: the 2030 agenda for sustainable developmentUN, UNFCCC (2015) Paris agreement. Paris, FranceUNCED (1992) Agenda 21: programme of action for sustainable development; Rio declarationon environment and development ; Statement of forest principles ; the final text of agreementsnegotiated by governments at the United Nations Conference on Environment and Development(UNCED), Rio de Janeiro, Brazil. United Nations, Department of Public Information, Rio deJaneiro
Van Dorst MJ, Duijvestein CAJ (2004) Concepts of sustainable development. University ofManchester, United Kingdom
Van Duijn M, Rouwendal J, Boersema R (2014) Transformation of industrial heritage: insights intoexternal effects on house prices. Tinbergen Institute. VIII:14–122.
Voituriez T (2013) What is the purpose of the sustainable development goals? IDDRI 18Vos JD, Acker VV, Witlox F (2016) Urban sprawl: neighbourhood dissatisfaction and urban pref-erences. Some evidence from Flanders. Urban Geogr 37:839–862. https://doi.org/10.1080/02723638.2015.1118955
Wang H, Yang Y (2019) Neighbourhood walkability: a review and bibliometric analysis. Cities93:43–61. https://doi.org/10.1016/j.cities.2019.04.015
Whitehead M (2003) (Re)analysing the sustainable city: nature, urbanisation and the regulation ofsocio-environmental relations in the UK. Urban Stud 40:1183–1206. https://doi.org/10.1080/0042098032000084550
Williams K (2010) Sustainable cities: research and practice challenges. Int J Urban Sustain Dev1:128–132. https://doi.org/10.1080/19463131003654863
Yigitcanlar T, Kamruzzaman M (2015) Planning, development and management of sustainablecities: a commentary from the guest editors. Sustainability 7:14677–14688. https://doi.org/10.3390/su71114677
ZhuQ, Leibowicz BD (2020)Vehicle efficiency improvements, urban form, and energy use impacts.Cities 97:102486. https://doi.org/10.1016/j.cities.2019.102486
Open Access This chapter is licensed under the terms of the Creative Commons Attribution 4.0International License (http://creativecommons.org/licenses/by/4.0/), which permits use, sharing,adaptation, distribution and reproduction in any medium or format, as long as you give appropriatecredit to the original author(s) and the source, provide a link to the Creative Commons license andindicate if changes were made.
The images or other third party material in this chapter are included in the chapter’s CreativeCommons license, unless indicated otherwise in a credit line to the material. If material is notincluded in the chapter’s Creative Commons license and your intended use is not permitted bystatutory regulation or exceeds the permitted use, you will need to obtain permission directly fromthe copyright holder.

Part IIProject Dynamics and Support Tools

Chapter 6Key Steps of a Regeneration Process
Abstract Because of their inherent complexity, urban brownfield regenerationprojects are long-term operations. The study of the evolution from urban brown-field site to a new—and ideally sustainable—neighbourhood through a regenera-tion process has led to the identification of five key steps: Backgrounds, Initiators,Guidelines, Legal Basis, and Realization. This chapter highlights the specific issuesencountered during these different steps. Thus, our early reflections on the future of anurban brownfield at the regional andmetropolitan levels concern theBackground andInitiator steps. The formulation of a coherent project to overcome negative percep-tion and foster a shared vision relates to theGuidelines steps. The transition from theurban to the architectural project is dealt with during the Legal Basis and Realizationsteps. Finally, issues concerning themultiple forms of participatory processes and theevaluation of sustainability objectives must be taken into consideration throughoutthe regeneration process. These reflections provide a foundation for developing aseries of measures and more concrete lines of action.
Keywords Regeneration process · Key steps · Urban project · Architecturalproject · Project dynamics · Participatory processes · Civil society · Sustainabilityevaluation
6.1 Identification of Five Key Steps
A study of urban brownfields at various stages, from early phases of revealing thesite potential to completed construction, including first steps of the building site andplanning process under development, has led to the identification of five key stepswithin a regeneration project: Backgrounds, Initiators, Guidelines, Legal Basis, andRealization (Jaccaud et al. 2009; Lufkin 2010). Each step results in the elaborationof a planning document, which allows the team to validate a segment of the processand proceed to the next step.
The present chapter aims to highlight the specific issues encountered during eachof these steps. These reflections will provide a foundation for developing a series ofmeasures and more concrete lines of action, which will be presented in Chap. 7.
© The Author(s) 2022E. Rey et al., Neighbourhoods in Transition, The Urban Book Series,https://doi.org/10.1007/978-3-030-82208-8_6
97

98 6 Key Steps of a Regeneration Process
6.2 Early Reflections at Regional or Metropolitan Level
The Backgrounds step is, not strictly speaking, a phase of the project. Instead, itconstitutes a sort of position zero in the regeneration process. It refers to events thatare external to the project and have indirectly contributed to its elaboration. In manycase studies, the antecedents may be other projects developed on the brownfield’sperimeter that, due to various circumstances, have experienced blocking situationsand therefore were not taken to their completion.
Thanks to those more or less unfruitful experiences, and provided that they stayinvolved in the new project, stakeholders acquire an expertise in the local context.This allows them to understand what factors led to the total or partial failure of theprevious projects and to identify the positive aspects worth keeping.
As a second step, the phase involving the Initiators includes all the events thatcontribute to triggering the project’s development. In most cases, these catalysingevents belong to a relatively large planning scale. They define development objectivesfor the urban or metropolitan area, without necessarily mentioning a specific actionfor the urban brownfield’s perimeter.
In some cases, the reflection focuses exclusively on the concerned urban region,which tends to facilitate the process. The question then becomes to identify themost strategic sectors for intervention, while leaving enough place for the uncer-tainty associated with the economy and the market. In that configuration, the earlydiscussions often take place within non-institutional or informal frameworks. Themeeting between an informed personality (from the political or business world) anda committed architect or urban planner often initiates the launch of the process.
During this step, time constraints can also play a triggering role, especially whenlinked to funding possibilities. For instance, in the framework of government support,whichmay be conditional on strict realization deadlines, time constraints can becomea strong incentive.
Questions raised during the Initiators step are not related to architectural orurban design. The focus is instead on the specifications of the future regenerationproject. Although they stay relatively vague in terms of concrete actions to be under-taken, the decisions made at that moment set the rules on cooperation between themain stakeholders. In other words, they give precise indications on “how to do”rather than defining “what to do”. Ideally, the selection of processes and regulationmodes between stakeholders takes place during that step (more or less cooperativeprocedure, more or less close cooperation, etc.).
Official documents resulting at the end of this step (regional masterplan or roadmap, synthetic reports, etc.) are of paramount importance for the next steps of theprocess. These documents validate the selected options and constitute a long-termreference basis for future developments. Therefore, a statement of intentions helpsto launch the formulation of objectives, especially when there is a large number ofstakeholders and the decision-making power is diffuse among them.

6.3 The Project as a Basis for Reflection … 99
6.3 The Project as a Basis for Reflection on Urbanand Architectural Coherence
Once the site has been identified as a strategic intervention sector at a regional ormetropolitan level, the brownfield’s evolution potential must be demonstrated by aconvincing urban project. This next step aims at defining the regeneration project’smain Guidelines. This neighbourhood-scale vision will not only help overcome thevarious previously analysed obstacles (see Chap. 4), it will also reveal the site’spotential and act as a detonator.
6.3.1 Overcoming Negative Perceptions
Overcoming negative perceptions associated with the brownfield site is one of themajor obstacles when defining the regeneration project’s main guidelines. First, theappropriation of abandoned territories by pioneer populations is likely to positivelyimpact the site’s image, notably through temporary uses. Thanks to the developmentof public activities, in particular cultural activities, these once impenetrable territo-ries gradually become accessible to the population. Furthermore, these mechanismscontribute to rebuilding links between the brownfield and its surrounding context.On the topic of temporary cultural uses, it is interesting to mention the TransEurope-Halles network, a European platform for the exchange of information, support, andexpertise between cultural sites established on urban brownfields (Bertrand 2018) orthe Yes We Camp initiative for the inventive use of available space (Yes We Camp2020). Other examples are the Saint-Sauveur and Fives-Cail industrial brownfieldsin Lille (FR) that builds on the co-creation of viable third places on these sites.The latter approach is both the expression of transitory actors participating in thesymbolic revaluation of brownfields and those same actors claiming a full role in themaking of the urban project (Liefooghe 2020).
The notion of regeneration is understood by analogy with living tissue. It is amodification process that consists of a coordinated and progressive renewal of thebrownfield site, aiming at recovering certain lost features.While the impulse given bythe project can be triggered by different channels, direct or indirect involvement bypublic authorities is frequent. Indeed, as highlighted when analysing Initiators step-related issues, this type of project contributes to the urban and economic developmentof the entire urban or metropolitan region. Besides, partnerships with the privatesector are not rare, as part of the land is often owned by private landlords.

100 6 Key Steps of a Regeneration Process
6.3.2 Fostering the Emergence of a Shared Vision
The vision emerges during the definition phase of the guidelines. It allows decision-makers to formulate what is desirable—and feasible—on the site awaiting rede-velopment. The site’s image plays an essential role, in the sense that it helps toconvey quantitative and qualitative information, which can also influence emotionsand atmospheres. The project dynamics, which we already addressed in Chap. 4, aretypically implemented during this step of the regeneration process.
The triggering action can occur with the realization of a first sketch, either sponta-neously initiated by an urban planning office or in the framework of a studymandatedby the private or public sector. Whenever possible, the vision’s fabrication processshould be participatory, that is, open to all concerned stakeholders. Its definition is ofgreat importance for the next steps of the process. According to the local context andurban planning specificities, many different types of possible procedures exist: urbanplanning, architecture competition, and mandate for parallel studies or test-study, toname a few.
Multiple recent brownfield regeneration processes across Europe selected thetest-study procedure. Essentially, a test-study brings together several teams of urbanplanners and architects (in general 3 or 4, according to the project), to work onthe same site. To foster synergies without the competitive mind that sometimescharacterizes architecture competitions, all offices are paid equally for their outputs,regardless of their experience or reputation. Projects are, therefore, developed ina participatory way. The proposals are discussed and evaluated during workshopsinvolving different members: a strategic committee, an operational committee, theclients (or their representative), and the experts. Besides which, representatives fromcivil society may punctually be invited to share their opinion. At the end of eachworkshop, guidelines are given to each team so they can orient their work in thedirection that seems desirable for the site’s future development. Ultimately, the mainobjective is to elaborate a first analysis that must generate a certain consensus amongthe involved entities. That consensus becomes the basis for the emergence of a firstvision of the site’s desired future (plans, models, 3D renderings, etc.).
Beyond this revealing role, the brownfield regeneration project also has the voca-tion to initiate an evolution of the concerned sector. Symbolized by a global conceptfor the site, this dynamic gives the project a guiding thread for the different buildingsto be renovated or constructed. It also serves as a common basis for all stakeholdersduring the multiple development phases of the project. Provided it is consensuallyelaborated, this shared vision contributes to defining various orientations for the siteand serves to gather and mobilize the stakeholders towards a common goal.
Indeed, in an urban context marked by the rapid evolution of needs, this notion ofdynamics is of particular importance. Considering that urban regeneration projectsare in most cases achieved in stages, they must generate, from the first design phases,guidelines that are strong enough to maintain the urban and architectural coherenceof the project and flexible enough to absorb the eventual evolutions of needs andcircumstances.

6.3 The Project as a Basis for Reflection … 101
Advancing based on a global concept is deeply linked to the project’s outcome.This logic is radically different from approaches based on the simple addition ofexpert reports or the coordination of punctual solutions to juxtaposed problems. Thestrength of project-based strategies is to enable designers to deal with the uncer-tainty that is inevitable during the early stages of a regeneration process. Indeed,the study of successful brownfield regeneration projects stresses the catalyst roleof such approaches. Projects allow a focus on spatial coherence at an early stage.They have the advantage of acting both as a tool for anticipation (vision embodiedin a still approximate pattern) and as a tool for integration for sectorial approaches,necessarily varying according to the stakeholders under consideration.
Taking part in the broader evolution of classical urban planning, project-basedapproaches enable planners to imagine guidelines for the site that go beyond abstractprogrammatic data. Even during the earlier stages, they address the notion of spacein a comprehensive, concrete, and evolutive sense (Devillers 1994).
In terms of concrete results, the main objective of the Guidelines step is thevalidation of the regeneration project,whichwill allow to endorse the selected optionsfor the sector’s development. The goal is therefore to set guidelines for the elaborationof the legal bases,without freezing theprogramming.Themore complex the situation,the greater the extent of that step.
6.3.3 Identifying Sectors and Phasing Operations
The Guidelines phase also aims at defining the perimeter of intervention. Thisapproach involves establishing afiner differentiation inside the sector—often a neigh-bourhood—and identifying areas with a specific vocation. This sectorization mustbe done considering the project’s temporality. Indeed, the scale and complexity ofurban brownfield regeneration projects generally generate an important time gapbetween the identification of the site’s potential (competition, feasibility study, etc.)and the moment when the last built or transformed buildings are put into service.This process will usually take more than ten years. Such a lengthy duration requires astaged process, associating successive stakeholders in an evolutive context. Financialrisk for investors can be kept to a minimum by staggering the operation.
The phasing of operations implies that decision-makers and planners must dealwith fixed elements, which guarantee the coherence of the initial concept, and withfluctuating elements, whichmake it possible to absorb contextual changes. Evolutioncan be linked either to the surrounding context (economic situation, needs, frameworkconditions, etc.) or directly to the project (entry or departure of a stakeholder, modi-fication of the decision-making structures, details linked to the project’s progress,etc.).
When defining the phasing, as reflections become more and more concrete, it isessential not to lose sight of the big picture. The rushed realization of partial projectscan give the illusion a faster progress. However, when the Guidelines step of the
102 6 Key Steps of a Regeneration Process
vision’s formulation and validation is neglected, it becomes difficult to generate ormaintain interest around the project as a whole.
6.4 The Transition from Urban to Architectural Project
Subsequently, the step establishing Legal Basis consists of translating the guidelinesinto a specialmasterplan.According to the local context, a great variety of expressionscan be used: Neighbourhood Plan, Detailed Development Plan, Partial Land-UsePlan, etc. Themain objective is to obtain approval from the public authorities. Indeed,the masterplan represents an official document, recognized by all stakeholders, andis binding in nature for municipalities and landowners. Failure can come in the formof refusal by the municipal council or by oppositions from civil society.
Provided that the project has been conducted in a spirit of cooperation betweenthe partners (public authorities, owners, civil society, etc.), the likelihood of havingcommunal approval denied is rather low. Some parameters nevertheless tend tocomplexify the situation, especially when a project involves inter-municipal nature,which multiplies potential risks. In parallel, in order to avoid the hurdle of publicoppositions, communication and participatory approaches are central elements of theproject’s steering activities (more on this topic in Sect. 6.5). Overall, the implementa-tion of a specific structure to deal with these issues, in the form of an interdisciplinaryurban planning platform, has increasingly proven to be a factor for success.
Once the masterplan is approved (Legal Basis step), the project can finallyevolve towards the Realization step. This step of the development process follows amore classical pattern, which leaves room for architects and investors to maneuvre.However, certain considerations must be taken into account. In order to optimizetime management, it is possible—and even desirable—to overlap the Legal Basisand Realization steps. In other words, it may not be necessary to wait for thefinal recourses to be dismissed before launching projects or architecture compe-titions. Reducing realization time increases the project’s economic attractiveness bydecreasing the financial risk for investors.
The Realization step ensures the communication between urban and architecturalscales. Thus, it should guarantee the quality, coherence, and continuity of the entireproject over the long term. An architectural competition can provide an adequatemeans tomanage the transition between the two scales. The selection of jurymembersis of utmost importance. It guarantees the competition’s outreach and, in a sense,the propositions’ architectural quality. The organization of competitions in multiplestages allows for framed interactions between the jury and the participants, whichtends to guarantee coherence at the various scales of the project. Besides, the involve-ment of actors from the process’s previous steps is a crucial element to ensure thecontinuity of the project’s development.
6.5 Multiple Forms of Participatory Processes 103
6.5 Multiple Forms of Participatory Processes
Depending on the local urban planning context, participation can take various forms.Its definition can vary considerably from country to country, ranging from infor-mation to coproduction (co-decision), including consultation and concertation (DaCunha 2006). Participatory processes are an essential component to creating a formof social pact, or, in other words, support of the project by all stakeholders. The socialpact contributes to implementing a virtuous cycle dynamic and reduces risk at eachstep of the project.
Therefore, optimizing the participatory process is of high importance. The aimshould be a transversal and concerted participation, conducted throughout the project,ideally already at the early stages. In order to specify the various issues raised byparticipatory processes, it is essential to distinguish two types of approaches: the firstone, conducted with landowners directly concerned by the regeneration project, andthe second one, aiming at establishing a link with civil society.
6.5.1 Participation of Landowners and Land Management
This first approach to participatory processes focuses primarily on the landownerswho are directly concerned. It aims at implementing appropriate platforms to ensuretheir support and involvement in the regeneration project. Often neglected in urbanplanning, the land management issue is key. Indeed, a total or partial lack of landmanagement can generate obstacles and is high on the list of resistance factors tobrownfield regeneration. Hence, it is worth examining this crucial question.
Two notions can help us clarify the land management issue: on the one hand,land-use regulations, and on the other hand, their utilization. Land-use regulationsare governed by public law and deal with public interest objectives and measuresdefined in the framework of territorial planning. They can only be observed througha representation of reality (land-use plans, etc.). The notion of utilization is governedby private law. Directly observable, it reflects the reality of land appropriationby landowners. Therefore, it relates to landowners’ level of support and roomfor manoeuvre, since European legal provisions can make it very difficult to useexpropriation for planning purposes.
Urban brownfields are, by definition, emblematic examples of a discrepancybetween land-use regulations and land utilization (Rey 2012). Implementing bettercoordination between territorial planning and land management—in other words,a greater convergence between public and private interests—appears to be the beststrategy to overcome this obstacle. Indeed, it is important to keep in mind that abrownfield regeneration project generates financial advantages for landowners. Theadded value created by the acquisition of building rights, notably land-use change—for instance from industrial to mixed zone—justifies their contribution to planningand equipment costs. It is essential early on in the project to negotiate the allocation

104 6 Key Steps of a Regeneration Process
method of these costs and the added value to avoid any blockage or opposition riskin the project’s later steps.
While each brownfield has its own land tenure issues, it is nevertheless possible todefine two basic patterns: shared and single ownership. Because their scale relates tothat of a neighbourhood, the large majority of urban brownfields belongs to the firstcategory, which presents an increased degree of complexity. The multiplication oflandowners raises a certain number of challenges when it comes to re-drawing plotboundaries and cost allocation. There is no such thing as an ideal procedure; thereexist as many urban planning tools as specific contexts. Overall, the main issue isto define fair distribution rules among the different owners, who do not necessarilyhave liquid assets that are available over the short term. This is what the projectdeveloped during the Guidelines phase is all about. It will allow the landowners tounite around a shared vision to overcome land-related obstacles. The involvementof public authorities plays an essential role in dealing with situations of shared landownership.
As mentioned above, a large array of instruments exists to deal with such issues,but not all are adapted to the specificities of urban brownfields, where the number oflandowners can sometimes be considerable. Among the approaches likely to solveparticularly complex situations, we can cite, for instance, bilateral contractual agree-ments between the municipality and each owner. This allows for the resolution ofissues related to public equipment financing—for instance, according to proximityto the concerned equipment.
The second category of brownfield includes abandoned sites where a single actorowns virtually all the land, such as military or railway brownfields (see Chap. 2). Inthis situation, it may be possible to engage in a joint reflection between the concernedpublic authority and the entity in charge of the site, more specifically, its real estatedivision. The lattermay take the initiative in the planning procedures, and discussionsaround public equipment financing may be conducted directly with representativesfrom the municipality. This can potentially make the process significantly easier,but here again, it is important to bear in mind that solutions must be pragmatic andtailor-made in order to be successful.
6.5.2 Integration of Civil Society to Foster StakeholderSupport
The second approach to participatory processes seeks to integrate civil society. First,thanks to their lived field experience, civil society may contribute to better iden-tifying brownfield-related issues that are not easily identified by technical experts.Therefore, the integration of civil society mobilizes local stakeholders and takes intoconsideration their diverse and specific interests. Here, the main challenge is findingan optimal adaptation of the participatory process according to the type of actor.This requires an integration of their expertise into the regeneration project without

6.5 Multiple Forms of Participatory Processes 105
overly slowing down the decision-making process. Moreover, the project’s accep-tance, as well as its connection to the surrounding city and metropolitan area, canbe greatly facilitated by the implementation of participatory processes that enablebetter integration of future users’ needs.
Once again, several forms of participatory structures are possible depending onthe specificities of the local context and the stage of the project. We can cite, amongother examples, coffee get-togetherswith stakeholders from the economic, academic,and administrative worlds, sounding boards gathering interest groups, informationsessions or open house events for the population, site visits, discovery trails, etc.Although these approaches constitute a sort of urban planning toolbox for participa-tory processes, they are not the main focus of this book. Therefore, we will not enterinto details but refer the interested reader to the abundant existing literature on thetopic.
The nature of communication supports during participatory processes is of highimportance because the large majority of them implies a bilateral exchange ofexpertise between civil society and technical experts in the fields of urban plan-ning. Representation tools which help transfer information to civil society (plans,models, 3D visualizations) aim at presenting the vision developed for the site andthe future actions that will be undertaken. To avoid misunderstandings when usingthese communication supports, it is essential to develop adapted tools, that is, toolsthat are both understandable for laypersons and updatable according to progress. Thissubject will be further developed in the following chapters, notably within Chap. 9,which introduce an operational monitoring tool designed to support urban brownfieldregeneration projects.
In that sense, despite their reduced accessibility for certain parts of the popula-tion (elderly people, disadvantaged socio-professional groups, etc.), websites offeran interesting platform to support participatory approaches, which consistentlycomplement in situ experiences.
Ultimately, these reflections illustrate the complexity of driving forces behindcommunication strategies in a brownfield regeneration project, but also their essentialrole in the project’s process. Several experts claim that the success of a redevelopmentoperation is linked to the project’s intrinsic qualities as much as to the communica-tion skills of its leaders (Rey and Lufkin 2015). Overall, it appears that successfulregeneration projects are characterized by personalities or steering groups that havedemonstrated innovation and creativity to experiment with tailor-made forms ofparticipatory approaches. Original initiatives have proven to be efficient and havesignificantly contributed to the success of the concerned projects.
6.6 Evaluation of Sustainability Objectives
While urban brownfield regeneration theoretically fights against urban sprawl, theseprojects often integrate sustainability issues only partially or superficially. More-over, environmental aspects are almost systematically privileged, particularly at the

106 6 Key Steps of a Regeneration Process
expense of sociocultural considerations (Laprise et al. 2014). Indeed, to ensure aregeneration project’s global quality, an important number of parameters must beintegrated into the decision-making process leading to its realization. In order tobe efficient, this simultaneous consideration of environmental, economic, socio-cultural and governance aspects, which involves a vast array of actors, cannot beconducted superficially nor only on occasion. It must be part of an in-depth evalua-tive approach, allowing for continuous, iterative monitoring of the project, startingfrom the Initiators steps, and integrated in theGuidelines,LegalBasis andRealizationsteps.
Furthermore, it is important to stress that brownfield regeneration projects requirea specifically adapted evaluation. The latter should take into consideration the partic-ular features of that kind of project, which have been carefully analysed in theprevious chapters of this publication. Indeed, urban brownfields are not sites like anyother, in the sense that they occupy large areas—often disconnected from their directenvironment—involve strategies to transform already built-up areas, and often havea relatively strong identity, which can sometimes be negative (contamination, insecu-rity, etc.). Regeneration projects are also distinguished by their complex processes:their duration tends to be longer than that of a traditional construction project, frame-work conditions may vary, and stakeholders may multiply throughout the process.Therefore, a tailored evaluation is required to ensure the rigour and reliability of theresults.
6.6.1 The Various Roles of Operational Evaluation
If it is based on amethodology adapted to the issues, the evaluation may play diverse,complementary roles at the service of the project’s dynamics. First, operational evalu-ation provides increased knowledge of the project concerningmultiple dimensions ofsustainability. The goal is not so much to offer turnkey solutions to decision-makers,but rather to allow them to make a more informed choice. Indeed, it is essential tohave precise and structured information on how the project meets the objectives andexpectations that have been set. By providing practitioners and decision-makers withindications on the project’s performance, the evaluation is not disconnected from thelatter, but rather participates in its definition. Evaluation can thus become a precioustool for critical analysis, verification, and decision support, which allows the estab-lishment of a balance between complexity of information and transparency of theresults (Schädler et al. 2011).
In parallel, the evaluation also plays the role of support tool, thanks to the infor-mation it provides. It enables stakeholders to assess the project’s evolution andcompare, if necessary, different options to feed into a structured problem-solvingand optimization process.
Unlike label or certification approaches, the implementation of evaluation at eachstep of the project’s process can also provide the main stakeholders with efficientcommunication support. The dynamics of sustainable neighbourhoods are indeed

6.6 Evaluation of Sustainability Objectives 107
Design Construction
-
+
TIMENeighbourhood life cycle Renewal
Knowledge of the project
Fig. 6.1 Modification possibilities compared to the level of information according to the projectprogress
based on the organization of increased communication between multiple stake-holders. In this perspective, an operational evaluation may offer an efficient wayto structure and manage exchange between the partners involved in the project. Itsresults may also feed into some participatory processes.
6.6.2 Operational Evaluation Integrated in Project Dynamics
The operational evaluation should ideally be integrated as early as possible in theregeneration project’s dynamics. Indeed, the most crucial decisions are often madein the initial phases. These early stages, which are characterized by considerablefreedom to optimize the project, correspond, however, to a moment when knowledgeof the project parameters is often very weak (Fig. 6.1).
Gradually, as the design and realization stages progress, knowledge on the projecttends to increase, but decisions made in the early stages generate fixed points andcan decrease room for manoeuvring to influence the project and reduce the planners’reaction possibilities. In order for the best decisions to bemade at the criticalmoment,that is, when they have great weight in the project’s formulation, it is essential tohave the maximum amount of information at the earliest stage possible.
Subsequently, it is necessary to continue evaluation beyond the design process toachieve sustainability objectives. Many decisions made during the project’s designphase should be specifically followed up on during the next stages, mainly becausetheir materialization depends on decisions taken during the realization phase andconcerning later use of built and unbuilt spaces. Considering their rather long dura-tion, this need for follow-up or monitoring is particularly significant in the case ofurban brownfield regeneration into sustainable neighbourhoods.
Evaluation should therefore cover several distinct phases:

108 6 Key Steps of a Regeneration Process
• Prospective evaluation: At the project’s early stages, evaluation consists in an esti-mate of the expected performances. It is obtained with estimation and simulationmethods which allow a comparison of the project’s estimated performances withthe aims set.
• Supporting evaluation: During the phases leading to the project’s realization,evaluation consists in a regular verification of the project’s performances, as wellas an optimization of the latter through successive adjustments (decision-makingand problem-solving support).
• Synthetic evaluation: At the end of the operation, evaluation offers a synthesis ofthe project’s features and highlights singular aspects of its process. In the eventof discrepancies between set objectives, expected performances, and achievedresults, the evaluation can foster the emergence of new knowledge, particularlyvaluable for the future stages of the project and, more broadly, for other similarbrownfield regeneration operations.
A large array of methods is available to evaluate the sustainability of metropolitanareas today in Europe. Very few, however, meet the above-mentioned conditions(tailored to brownfields’ specificities, integrated throughout the project’s dynamic,and with a search for overall quality in all dimensions of sustainability). Chapter 8,“Sustainability Monitoring: Principles, Challenges and Approaches”, will be theoccasion to come back to and further develop this crucial aspect of brownfieldregeneration projects.
References
Bertrand J (2018) Les friches en Europe, Reconvertir l’industriel en culturel. European think & dotank
Da Cunha A (ed) (2006) Participation et développement urbain durable. Urbia 3. Observatoireuniversitaire de la ville et du développement durable, Université de Lausanne
Devillers C (1994) Le projet urbain. In: Conférences “Paris d’architectes”. Pavillon de l’Arsenal,Paris
Jaccaud J-P, Kaufmann V, Lufkin S, Littlejohn K (2009) Densification des friches ferroviairesurbaines. Lausanne
Laprise M, Lufkin S, Rey E (2014) An operational indicator system for the integration of sustain-ability into the design process of urban wasteland regeneration projects. In: Sustainable habitatfor developing societies. Choosing the way forward. Ahmedabad, India
Liefooghe C (2020) Tiers-lieux et transition urbaine. Le pari de la co-création de valeur(s) sur lesfriches industrielles de Saint-Sauveur et Fives-Cail à Lille (France). In: CIST2020—population,temps, territoires. Centre National de la Recherche Scientifique [CNRS], Ined, Université Paris1, Paris-Aubervilliers, France
Lufkin S (2010) Entre ville et campagne: stratégies de densification qualitative ciblée des frichesferroviaires régionales. EPFL, Lausanne
Rey E (2012) Régénération des friches urbaines et développement durable: vers une évaluationintégrée à la dynamique du projet. Presses Universitaires de Louvain, Louvain-La-Neuve
Rey E, Lufkin S (2015) Des friches urbaines aux quartiers durables. Presses polytechniques etuniversitaires romandes, Lausanne

References 109
Schädler S,MorioM,BartkeSet al (2011)Designing sustainable and economically attractive brown-field revitalization options using an integrated assessment model. J EnvironManage 92:827–837.https://doi.org/10.1016/j.jenvman.2010.10.026
Yes We Camp (2020) Vision | What we propose is a prototype for the inventive use of availablespace. In: Yes We Camp. https://yeswecamp.org/en/vision/. Accessed 25 Jan 2021
Open Access This chapter is licensed under the terms of the Creative Commons Attribution 4.0International License (http://creativecommons.org/licenses/by/4.0/), which permits use, sharing,adaptation, distribution and reproduction in any medium or format, as long as you give appropriatecredit to the original author(s) and the source, provide a link to the Creative Commons license andindicate if changes were made.
The images or other third party material in this chapter are included in the chapter’s CreativeCommons license, unless indicated otherwise in a credit line to the material. If material is notincluded in the chapter’s Creative Commons license and your intended use is not permitted bystatutory regulation or exceeds the permitted use, you will need to obtain permission directly fromthe copyright holder.

Chapter 7Specific Skills and Adapted Support
Abstract Although urban brownfields hold significant inherent potential, especiallyin limiting urban sprawl, a large number of sites are still awaiting a regenerationproject. Moreover, many of these projects only partially or superficially addresssustainability principles. Hence, concrete courses of action are required to supportthe evolution of current practices towards increased sustainability. These courses ofaction, which rely on specific skills and adapted supports, require a complementaryapproach. In otherwords, strategies should be conducted consistently at the territorial,metropolitan, and project levels. In this regard, the present chapter provides a seriesof courses of action to be implemented at these levels. Our aim here is to foster thesustainable transition of metropolitan areas, andmore precisely brownfield sites, intolively neighbourhoods.
Keywords Urban brownfield regeneration · Sustainable transition of Europeanmetropolitan areas · Evolution of current practices · Increased sustainability ·Territorial strategies ·Metropolitan strategies · Project strategies
7.1 Courses of Action to Support the Evolution of CurrentPractices
When observing brownfields in European metropolitan areas, we must stress that themajority of them are not in the process of regenerating. Moreover, many redevel-opment operations only partially or superficially address sustainability principles.Due to their adverse impacts on environmental, sociocultural, and economic levels,the issue of brownfields is not only well understood at the European level but alsoranked high on the agenda of European Union regional development, environmentalprotection, and urban initiatives (Franz et al. 2006).
In this context, the different concerned stakeholders must converge to a series ofmeasures andmore concrete courses of action to support the evolution of current prac-tices towards increased sustainability. In a complementary approach, these actionsshould be conducted consistently not only at the territorial levels of the metropolitanarea, urban region, and municipality but also at the urban and architectural levels,embodied in the neighbourhood scale of the regeneration project itself. In this regard,
© The Author(s) 2022E. Rey et al., Neighbourhoods in Transition, The Urban Book Series,https://doi.org/10.1007/978-3-030-82208-8_7
111
112 7 Specific Skills and Adapted Support
the present chapter provides strategies at different levels to develop courses of actioninvolving specific skills and adapted support.
7.2 Strategies at the Territorial Level
First, three main courses of action can be identified at the level of public authoritiesin charge of territorial development at the national or regional scales. It should bespecified that some of these strategies already (partially) exist in certain Europeancountries.
7.2.1 Awareness of Urban Brownfield Potential
Thefirst course of action focuses on raising awareness of urban brownfields’ potential(see Chap. 3). The main objective is to modify the general perception of brownfieldsand to make stakeholders more aware of their potential to increase the sustainabilityof European metropolitan areas. Several professional urban planning networks havebeen developed in the past, such as CABERNET or RESCUE, but it is essential thatexchanges of that type also be created or reinforced with non-specialists.
Just like with other challenges related to the densification of built fabric, urbanbrownfields’ potential is not automatically perceived by all political and economicdecision-makers. Among the various possible measures to improve this situation, wecan cite:
• developing communication campaigns (publications, public conferences, dissem-ination in the media, etc.);
• valorizing exemplary projects in terms of sustainability integration, stressing, inparticular, their compatibility with economic success (pilot projects, awards, etc.);
• organizing meetings between brownfield landowners and potential investors;• raising awareness of sustainable development issues within structures in charge
of the real estate management of large urban brownfield landowners, in particulararmies and railway companies.
In parallel, it is highly important that quantitative monitoring of an urban brown-field be generalized in European countries, with a detailed and regularly updatedinventory. As explained earlier, the lack of data about brownfields tends to preventan objective picture of the phenomenon or even to minimize its importance (Rey andLufkin 2015).

7.2 Strategies at the Territorial Level 113
7.2.2 Evolution of the Legal Framework
The second course of action aims at creating a legal framework that supports thelaunching of brownfield regeneration operations. Keeping in mind that obstaclesto redeveloping abandoned sites concern primarily the initial, start-up phase of theproject, improving the framework in the early stages helps mitigate blockages andfosters the emergence of project dynamics. Diverse forms of impulse may exist:
• integrating one ormore specific articles focusing onurban brownfield regenerationin territorial planning regulations (in particular to enable procedures facilitatingland-use change and the project’s start-up);
• explicitly mentioning urban brownfield regeneration as a strategic objective ofterritorial development policies;
• promoting a general territorial organization of dense, mixed-use polarities, coor-dinated at the national or regional scales, which will help actors anticipate theevolution of urban brownfields’ regulatory status and react more rapidly to theevolution of needs (exogenous economic promotion, housing stock to anticipatethe risk of shortages, etc.).
In order to overcome obstacles related to remediation costs, it also seems appro-priate to implement financial support for the investigation and remediation of contam-inated sites. A possible measure is the creation of specific funds managed at thenational level, made up of part of the increased value of land generated by brown-field regeneration. This mechanism offers landowners the advantage of removinguncertainty regarding their site’s contamination, focus initial investments on theproject itself and refund certain expenses once the redevelopment is guaranteed (riskreduction).
7.2.3 Development of Financial Levers
The third course of action, probably one of the most efficient, focuses on the devel-opment of financial levers, which support—directly or indirectly—urban brownfieldregeneration and, more broadly, the densification of built fabrics. Today, it is notnecessarily more interesting for a real estate stakeholder to invest in an urban sitethan a peripheral one. Tax mechanisms, which tend to be impacted by strong compe-tition between municipalities, do not really reflect costs generated by peri-urbandevelopment and may not adequately reflect the potential brownfield regenerationhas for contributing to the general interest. In Great Britain, the president of the RoyalTown Planning Institute summarized this situation by declaring that urban plannerswere asked to fight the battle of sustainable development without any weapon (citedin Fouchier 1997).
The better orientation of certain fiscal or regulatory modalities for sites rede-veloped in a sustainability perspective may also help accelerate the regeneration

114 7 Specific Skills and Adapted Support
of urban brownfields. As examples, we can cite improving financial equalizationbetween municipalities of an urban or metropolitan area, adapting certain taxes forurban brownfields or implementing premia for higher densities, which may allow fora better valorization of the land.
Support for exemplary projects in terms of sustainability, as well as targetingcertain subsidies specially attributed to this kind of project, may also help consolidatethe most interesting approaches. Considering their strategic importance, some urbanbrownfield regeneration operations could benefit from specific financial supports.As an example, we can cite the case of the German North Rhine-Westphalia, who,since 1997, only subsidizes housing located near train stations or efficient publictransport—including housing created on regenerated urban brownfield sites. Besidesdensity and sustainablemobility, the next stepwould be to consider additional criteriarelated to environmental, sociocultural, and economic sustainability in the calculationof the financial supports to be attributed.
7.3 Strategies at the Metropolitan Level
To amplify their impact, the three above-described territorial courses of action shouldbe relayed at the metropolitan and city levels, which requires active participationby public entities and, especially, increased inter-municipal collaboration. Indeed,the development of urbanization and the complexity of post-industrial Europeancities tend to explode the traditional limits of municipal management. Moreover,it appears that collaboration is necessary at an inter-municipal level. It implies theemergenceof novel types of governance,which are capable ofmanagingmetropolitanor conurbation projects and pooling converging visions of territorial development.
7.3.1 Integration of Urban Brownfield Regeneration ProjectsWithin Urban Planning Tools
The first course of action at the metropolitan level focuses on increased integrationof urban brownfield regeneration projects within urban planning tools, in partic-ular metropolitan or conurbation projects, which help overcome inter-municipality-related obstacles. This type of approach seems likely to strongly impact the local-ization of urban activities, limit peripheral constructions based on public transportsystems, support the densification of already built-up areas, and efficiently meet thevarious sociocultural needs of metropolitan areas.
Considering its potential contribution to the built environment’s sustainability,urban brownfield regeneration—in particular, that of large sites—should be included

7.3 Strategies at the Metropolitan Level 115
in the issues to be examinedwithinmetropolitan or conurbation projects. This embed-ding will help multiply their chance of redevelopment. By integrating urban brown-fields into a vision that goes beyond the limits of their perimeter, it is indeedpossible toincrease opportunities for convergence between needs—considered at metropolitanscale—and land available for new (re)development.
7.3.2 Identification of Strategic Sectors for UrbanDevelopment
In parallel, the embedding of urban brownfields within metropolitan or conurbationprojects should lead to a finer census of the latter, integrating specific informationsuch as the degree of proximity to public transport systems, effective densificationpossibilities, possible land-use changes, and funding possibilities for a regenerationproject. As illustrated in Chap. 3, this type of analytical inventory is far from system-atic among European countries, which sometimes makes it difficult to identify themost strategic sectors to be redeveloped.
However, the identification of an abandoned site as a pole of strategic developmentis not sufficient to guarantee the spontaneous start of its regeneration process. In somecases, the site has real estate potential, but may eventually redevelop without inte-grating broader issues related to needs at the metropolitan level or sustainabilityaspects. In other cases, the site is strategic for the sustainable transition of themetropolitan area but struggles to find investors.
Therefore, it is fundamental that the dialogue between partners from the publicand private sectors be intensified, and all the more so when land is privately owned.Collaboration in the early stages of the regeneration process helps to target the mostimportant aspects, concretely discuss framework conditions, and potentially accel-erate the procedure by anticipating any risk of blockage. According to the site’sfeatures and the circumstances surrounding the project launch, the objective willbe to find a tailored strategy to best accommodate the general interest and financialconstraints.
This proactive involvement of public authorities becomes even more essentialbecause their means are often limited to buying land or investing directly in regener-ation projects. Even if the public authority does not own the land, it can, by collabo-rating with private stakeholders, take advantage of certain dynamics all while mate-rializing sustainability-related objectives such as densification, functional mix andsocial diversity, sustainable mobility, or the emergence of an urbanity fostering ahigh quality of life.
By benefitting from room to manoeuvre (such as density bonuses or adaptationsof some equipment taxes), public authorities and concerned servicesmay even obtainthe guarantee of a stricter follow-up of all sustainability dimensions of the project,for instance by requiring more explicitly the use of a monitoring methodology (moreon monitoring in Chap. 8).

116 7 Specific Skills and Adapted Support
7.4 Strategies at the Project Level
Finally, specific measures taken at the project level are necessary not only to makethe start-up of a sustainable regeneration project possible but also to ensure thatthe future neighbourhood contributes to the sustainability transition of the city andmetropolitan area. In that regard, we identify four main courses of action.
7.4.1 Initiation and Governance of Regeneration Project
In order to make the start-up of a sustainable regeneration project possible, theinitiation of the operation and the emergence of the project dynamic are crucialmeasures. The initiation of the operation is based on a process likely to play atriggering role. It mainly results from two types of approaches, according to thesite’s characteristics and involved stakeholders:
• the organization of urban planning or architecture competition by the landowner(generally in collaboration with the concerned public authority);
• the realization of a test study or a project, either mandated by the landowneror a potentially interested investor, or on the spontaneous initiative of an urbanplanning or architecture office.
The different triggering possibilities demonstrate that the process is generallybased on shared responsibility between different stakeholders (landowners, publicauthorities, project designers, investors, etc.). The initiation of the process dependson the efficiency of their collaboration. The landlord has the possibility to block theprocess, and therefore certainly plays a crucial role in this initial phase.
Subsequently, the emergence of the project dynamic corresponds to the consoli-dation of this first stage. In other words, the objective is to effectively integrate allinvolved partners within the approach to a project—rather than within the vision foran abandoned site. Our analysis of several large-scale regeneration projects acrossEuropean metropolitan areas stresses that the creation of a project dynamic is mostcommonly related to the emergence of the main stakeholder, who plays the drivingrole for the project.
The main stakeholder may come from diverse professional backgrounds, consid-ering the multiple possibilities a project represents. Our study of different operationshighlights that architects and urban planners have a certain propensity to play thatdriving role, as long as they have the capacity to perceive a site’s potential, moti-vate other actors to support the project, and coordinate complex processes or evenconduct mediation when interests diverge or the risk of blockage appears. This obser-vation results in the need to raise awareness of the importance of this skill set, notonly among architecture and urban planning students but also among the concernedprofessional associations.

7.4 Strategies at the Project Level 117
7.4.2 Integration of Sustainability Objectives
Moreover, the recognition and integration of sustainability objectives in the projectdynamics are essential conditions for their materialization. To be effective, this inte-gration should be translated into the implementation of a holistic, inter-disciplinary,and evaluative approach, under the auspices of the main stakeholder playing thedriving role. Indeed, the success of an operational evaluation depends, first and fore-most, on the effective motivation of the involved actors—in particular the decision-makers (public and/or private clients)—to apply sustainability principles. Based ona selection of relevant indicators, the operational evaluation helps to structure theproject’s objectives and implement a consistent monitoring methodology.
The project’s transition towards increased sustainability involves implementingparticipative and inter-disciplinary collaborations, which should be consistently inte-grated within the project. For the project leader, this requires, by definition, a greatcapacity to integrate data from heterogeneous sectors, coordinate actors with diversereferences and knowledge, and identify future necessary competencies. For all impor-tant stakeholders involved in the project, this entails increased competencies in thefield of sustainable development, allowing them to establish links between the varietyof dimensions at stake.
7.4.3 Follow-Up of Sustainability Objectives
According to the project’s characteristics, two main scenarios are possible for identi-fying the person responsible for the evaluation, the major condition is that the entityin charge of the project supports the selected process.
• In the first scenario, the project’s driver (for instance, the public authority’surban planning department) directly steers the evaluation, motivated by inte-grating sustainability within the project. This option tends to facilitate theprocess and allows for continuous optimization. The risk of subjective evalua-tion can be limited by constituting a follow-up group including different interests(representatives of the authorities, the client, etc.).
• The second scenario consists of selecting an external expert to steer the evalua-tion. This situation may ensure greater independence in the evaluation process.However, it poses the risk of creating a gap between the evaluation results andthe project development. This may be avoided by implementing a tight collabo-ration between the external expert and the project’s driver, which may generate amore unwieldy and costly process. This type of approach may be recommended,in particular, when the project’s driver lacks competences or motivation—orboth—with regard to sustainability.
In both scenarios, a follow-up group must be created to regularly accompanythe project’s evolution and its operational evaluation during specific meetings (as a

118 7 Specific Skills and Adapted Support
rule, every 3–6months). The project’s usual coordination meetings then help addressthe concrete integration of the measures adopted. In that sense, creating a specificframework for discussion relating to sustainability seems to encourage the emergenceof an adhesion and ripple effect among the different involved stakeholders.
The implementation of a sustainability follow-up—or more precisely monitoring(see Chap. 8)—necessarily generates additional costs compared to current planningexpenditures. The latter should, however, be weighed against the operation’s globalcost, especially since this approach results in most cases in buildings of superioroverall quality. The long-term benefits induced by the increases in the properties’real estate value often outweigh the additional costs incurred (Chegut et al. 2019).Based on our analysis of brownfield regeneration projects into sustainable neighbour-hoods, the specific cost of sustainability monitoring and data synthesis is estimatedat approximately 0.5% of the operation’s global cost (Rey 2012).
Several measures can be envisaged to decrease the additional financial load ofsustainability monitoring. Without going into too much operational detail, we cancite the following measures: using part of the increase in the land value generatedby the regeneration operation, receiving financial contributions from programmessupporting exemplary projects, and collecting a specific percentage of the totalconstruction costs.
7.4.4 User Awareness
The commissioning of an urban brownfield regeneration project is usually conductedon a step-by-step basis. It generally implies an information process for the neigh-bourhood’s users, who will live or work for several years within a changing urbanenvironment. Communications made in this context may also provide an opportunityto raise user awareness of specific aspects of sustainability, especially those signifi-cantly conditioned by user behaviour (such as the consumption of heat, electricity, ordrinking water). This approach targeting user awareness helps to inform users of theintentions of the project’s designers, as well as facilitate their appropriation thereof.
References
Chegut A, Eichholtz P, Kok N (2019) The price of innovation: an analysis of the marginal cost ofgreen buildings. J Environ Econ Manag 98:102248. https://doi.org/10.1016/j.jeem.2019.07.003
Fouchier V (1997) Les densités urbaines et le développement durable, le cas de l’Ile-de-France etdes villes nouvelles. Editions du SGVN, Paris
Franz M, Pahlen G, Nathanail P et al (2006) Sustainable development and brownfield regeneration.What defines the quality of derelict land recycling? Environ Sci 3:135–151. https://doi.org/10.1080/15693430600800873

References 119
Rey E (2012) Régénération des friches urbaines et développement durable: vers une évaluationintégrée à la dynamique du projet. Presses Universitaires de Louvain, Louvain-La-Neuve
Rey E, Lufkin S (2015) Des friches urbaines aux quartiers durables. Presses polytechniques etuniversitaires romandes, Lausanne
Open Access This chapter is licensed under the terms of the Creative Commons Attribution 4.0International License (http://creativecommons.org/licenses/by/4.0/), which permits use, sharing,adaptation, distribution and reproduction in any medium or format, as long as you give appropriatecredit to the original author(s) and the source, provide a link to the Creative Commons license andindicate if changes were made.
The images or other third party material in this chapter are included in the chapter’s CreativeCommons license, unless indicated otherwise in a credit line to the material. If material is notincluded in the chapter’s Creative Commons license and your intended use is not permitted bystatutory regulation or exceeds the permitted use, you will need to obtain permission directly fromthe copyright holder.

Chapter 8Sustainability Monitoring: Principles,Challenges, and Approaches
Abstract Because of the inherent complexity of urban brownfield regenerationprojects, achieving sustainability objectives is not easy. It requires approachesadapted to the specificities of this type of operation, that allow for structured andregular follow-up, and that are integrated into the project dynamics. In this chapter,we argue that sustainability monitoring can help address this challenge. We startby defining the principles of sustainability evaluation and monitoring. Then, welook deeper at the challenges of an operational monitoring tool from the brownfieldregeneration perspective. On this basis, we plead for the necessity of tailor-madeoperational monitoring tools for this type of operation and define, to this end, threegeneral requirements for said tools. Finally, we make a critical analysis of existingcertifications at the neighbourhood scale and different approaches developed forbrownfield regeneration projects.
Keywords Sustainability monitoring · Indicators ·Multi-criteria evaluation ·Operational monitoring tools · Urban brownfield regeneration project ·Tailor-made requirements
8.1 Sustainability and Urban Brownfield RegenerationProjects
We have seen so far that the regeneration of urban brownfields can be a relevantstrategy to limit European metropolitan sprawl and, at the same time, to revitalizedeclining sectors. In a context marked by the imperatives of the sustainable city,we note that public authorities and developers—unduly—often praise urban brown-field regeneration as intrinsically sustainable.1 This correlation is not automatic andappears to be unsatisfactory at the neighbourhood scale. In other words, even thoughthe regeneration of brownfield sites is a sustainable land management solution at aterritorial level, the projects are not in themselves inherently sustainable.
Three interconnected complexity factors can explain the difficulty of integratingsustainability objectives into the project dynamics. First, site complexity: brownfields
1 “Any argument that all brownfields redevelopment is inherently sustainable is unjustified” (Eisen1999).© The Author(s) 2022E. Rey et al., Neighbourhoods in Transition, The Urban Book Series,https://doi.org/10.1007/978-3-030-82208-8_8
121
122 8 Sustainability Monitoring: Principles, Challenges, and Approaches
are complicated sites covering an intermediate scale—the neighbourhood—with abuilding legacy of variable quality, often disconnected from its context, sometimescontaminated, and suffering from a poor public image (see Chap. 4). Second, thecomplexity of the regeneration project process: it involves multiple stakeholders andoften lasts over a decade. Hence, chances are that the different stakeholders willchange during the process, which makes it difficult to keep to the objectives thatwere set at the beginning (see Chap. 6). Finally, the complexity of the sustainabilityconcept itself: it asks for the simultaneous consideration of a multitude of parametersthat are not necessarily compatible. To strive for the overall quality of the futureneighbourhood, holistic sustainability objectives must be shared as a common goalthrough genuine involvement of all stakeholders and assimilated to the differenttemporalities of the project from the very beginning (see Chap. 5).
Unsurprisingly, the integration of sustainability in an urban brownfield regenera-tion project is not a spontaneous process and goes far beyond the limits of intuition.To handle this complexity, it is fundamental to act on the basis of sound informa-tion and to put a system in place to collect this information appropriately (Pediaditiet al. 2010). In that respect, this chapter focuses on sustainability monitoring thatdemonstrates an overarching desire to promote integration as well as a structured andcontinuous follow-up of sustainability objectives (see Chaps. 6 and 7 for the inter-action between monitoring practices and urban brownfield regeneration projects).Sustainability monitoring acts as an interface, simplifying the encounter betweenthe urban brownfield regeneration project, marked by complexity, and the sustain-ability objectives, implying the consideration of multiple parameters. To account forthis, we first give an overview of multi-criteria evaluation and monitoring principles.Then, we analyse monitoring challenges from an operational angle. This allows usto define the requirements for an operational monitoring tool. Finally, we look at aseries of approaches available at the neighbourhood scale and, more specifically, forbrownfield regeneration projects.
8.2 Principles of Sustainability Evaluation and Monitoring
8.2.1 Multi-criteria Evaluation Principles
We witness today a strong trend: the practice of evaluation using indicators isincreasing in urban projects, notably in new neighbourhoods wanting to participatein the sustainability of the built environment, projects which are themselvesmore andmore common (Adewumi 2020; Sharifi et al. 2021). Indeed, the last few decades haveseen the emergence of an abundance of tools and frameworks aiming to assess urban

8.2 Principles of Sustainability Evaluation and Monitoring 123
sustainability (Pedro et al. 2019). This trend is emphasized by Sustainable Develop-ment Goal (SDG) 11, “Sustainable cities and communities”, of United Nations 2030Agenda for Sustainable Development2 (Klopp and Petretta 2017; Eurostat 2019).
Stating a sustainability goal leads to its measurement—i.e., its evaluation—whichis essential to understand sustainable development in the making (Bossel 1999).Hence, sustainable development indicators are used to show, measure, or assess aphenomenon. Indicators are both derived from values and create value: “we measurewhat we care about and care about what we measure” (Meadows 1998). At theurban level, they are markers towards which the interest of generations of urban-ites, present and future, is supposed to tend (Voituriez 2013). However, a simplelist of indicators cannot be considered sufficient to support sustainable develop-ment decision-making. To achieve this purpose, multi-criteria evaluation approachesmust be adopted, allowing actors to deal with the multiple parameters inherent in asustainable city vision.
Multi-criteria evaluations are, therefore, at the heart of an informed decision-making process and an overall high-quality approach (Sala et al. 2015). They makeit possible to carry out, to the best of knowledge, the essential trade-offs related to thepillars of sustainability (see Chap. 5). When integrated into project processes, multi-criteria evaluations also have the advantage of providing a framework for action andsupport for sustainability objectives. The evaluation results are a way to promote thehuman, technical, and financial effortsmade in terms of sustainability, to demonstratethat they bring added value, and to encourage best practices. They prove to be anexcellent tool for communicating with a specialized or wider audience. In this vein,multi-criteria evaluations are also a means of establishing a shared vision for theproject, towards which the involved stakeholders agree to orient themselves.
To meet these expectations, a multi-criteria evaluation must, therefore, take intoaccount a set of parameters, such as the appropriate choice of indicators or thecontext (Ramos 2019). In this regard, we like to refer to the eight Bellagio STAMPprinciples,3 which serve as a benchmark for measuring progress towards sustainabledevelopment (Pintér et al. 2012).
Multi-criteria evaluations can take various forms, with a highly variable degree ofapplicability and exhaustiveness: certifications, checklists, technical guides, eval-uation frameworks, rating tools, classification systems, life cycle analysis tools(LCA), etc. Coming from an “Eco-Label” trend, certification methods today tend toprevail over other approaches. They are standardized, reproducible, encourage bench-marking, and offer market visibility of the finished or current operation. However,on the scale of a sustainable neighbourhood, certification methods like LEED-ND,BREEAM communities, or Label EcoQuartier also present their share of blindspots:
2 As a reminder, Goal 11 aims “to renew and plan cities and other human settlements in a way thatoffers opportunities for all, with access to basic services, energy, housing, transportation, and greenpublic spaces while reducing resource use and environmental impact”.3 On an indicative basis, the principles coming from the well-known Bellagio principles are: Prin-ciple 1: Guiding vision, Principle 2: Essential considerations, Principle 3: Adequate scope, Principle4: Framework and indicators, Principle 5: Transparency, Principle 6: Effective communications,Principle 7: Broad participation, and Principle 8: Continuity and capacity.

124 8 Sustainability Monitoring: Principles, Challenges, and Approaches
significant labelling costs, indicators sometimes poorly suited to the local context,the imposition of means instead of the objective to be achieved, limited and unbal-anced coverage of sustainability dimensions, a separation between the project processand the evaluation, or even use of the label for “greenwashing” purposes (Sharifiand Murayama 2013; Adewumi et al. 2019; Pedro et al. 2019; Sharifi et al. 2021).According to some researchers: “Altogether, this means that an area can be certifiedwithout being sustainable” (Wangel et al. 2016). The following sections will discusscomplementary principles and alternative approaches to certification methods.
In any case, in Europe, the use of a multi-criteria evaluation approach is achievedon a voluntary basis, that is to say non-regulatory. At the neighbourhood scale,nonetheless, multi-criteria evaluations have more chances to be adopted whensupported by the public sector and local government (funding programmes, taxabatement, public-private partnerships, or other incentives) (Cease et al. 2019). Theyare also one of the means to implement and measure the performance of an urbansustainability policy within a project or its management. This implies integratingthe evaluation into the project dynamics and going beyond a simple communicationof the results. In other words, multi-criteria evaluations must migrate to operationaltools, including the principles of monitoring.
8.2.2 Monitoring Principles
Neighbourhoods in a transition towards sustainability follow a long process. Like-wise, urban brownfield regeneration projects also span an extended timeframe. Inthat context, ensuring the pursuit of sustainability objectives or their improvement isa daunting challenge. Those responsible for evaluation have every interest in remem-bering that multi-criteria evaluations cannot guarantee results on their own, althoughit is, conversely, impossible to obtain good results without them (Meadows 1998).So, it is not enough to report on a sustainability status; it is also necessary to follow itup and know how to communicate it (Levett & Therivel 2004). Taking this stand andadopting the monitoring principles could promote the integration of multi-criteriaevaluations within project dynamics.
Monitoring is a management tool already well established in the fields of manage-ment of private and public organizations, where the abbreviation M&E (monitoringand evaluation) is widely used. It is frequently reported that it is difficult to draw aclear line between the roles of each concept since any evaluation proves unproduc-tive without the contributions of monitoring; the two are complementary (Moore andSpires 2000).
Monitoring, like evaluation, is primarily a means of gathering information, butwith the aim to track the evolution methodically over time for early detection ofproblematic changes (Eurostat and Boesch 2014). The OECD defines monitoring as“continuing function that uses systematic collection of data on specified indicators

8.2 Principles of Sustainability Evaluation and Monitoring 125
to provide management and the main stakeholders of an ongoing development inter-vention with indications of the extent of progress and achievement of objectives andprogress in the use of allocated funds” (OECD 2010).
The idea behind this definition is the use of monitoring to communicate a messagecarried by indicators. In other words, this is essential feedback to assess the achieve-ment of objectives and take action accordingly; monitoring provides informationon changing aspects of a project depending on their direction, pace, and magnitude(Kusek and Rist 2004).
When reconciling these definitions with the concept of urban sustainability as atransition process, the notion of temporality adds to that of communication. Indeed,sustainability is neither static in time nor does it imply a fixed spatial perspective.“It cannot be seen as a destination but rather as a never-ending journey—at least onthe timescale at which human society operates” (Franz et al. 2006). The evaluationof sustainability, and all the more, its monitoring, is therefore directly linked tonotions of time and open-ended outcomes. In this sense, it is ideal to follow up allof the project processes: the evaluation must evolve from being static, carried out ata precise moment of a project, towards being more dynamic.4 From an operationalpoint of view, we explain in Chap. 6 that evaluation must be done at the early stages(prospective evaluation), checked during and at the end of construction (supportingevaluation), and continuously updated during the life of a neighbourhood (syntheticevaluation).
If one adopts the idea that sustainability is a transition process, open-ended, andmore than an idealized outcome, then the juxtaposition of monitoring principles witha multi-criteria evaluation turns out to be an effective implementation and manage-ment tool. It can facilitate decision-making linked to the integration of objectives intothe project dynamics. Besides, regular evaluation is central to a continuous improve-ment process, thanks to the feedback it provides. It thus fosters an iterative approachthat will allow the different temporalities of multiple sustainability objectives toconverge.
In the same vein, the first step towards collaboration between the different stake-holders is the exchange of updated information. Only accurate data concerningthe sustainability objectives will be usable and will trigger clear commitments andagreements between these partners (Van Noordt and De Mulder 2015).
Ultimately, monitoring allows the creation of evaluation reports, which can playdifferent roles and be put to different uses (Kusek and Rist 2004):
• To convince, using evidence from findings;• To educate, reporting findings;• To explore and investigate what works, what does not, and why;• To demonstrate accountability, delivering on promises made to citizens and other
stakeholders;• To document, recording and creating a memory of the project;• To involve, engaging stakeholders through a participatory process;
4 It is customary to categorize the evaluation approaches according to the time of action: ex-ante,in-itinere, or ex-post.

126 8 Sustainability Monitoring: Principles, Challenges, and Approaches
• To gain support among stakeholders, demonstrating results;• To promote understanding, reporting results to enhance understanding of the
projects.
For all these reasons, it seems justified to recommend a complementary combina-tion of multi-criteria evaluation approaches and monitoring principles to encouragethe integration of sustainability in urban brownfield regeneration projects. To dothis, sustainability monitoring tools are required. This can contribute to ensuring thepursuit of sustainability objectives within neighbourhoods in transition.
8.3 Operational Monitoring Tool Challenges
As we have just seen, a monitoring tool can facilitate taking into account sustain-ability objectives. To achieve this, the tool must be operational, that is to say, anefficient management device, adapted to the professional practice, and user-friendly.We consider an operational monitoring tool to be a digital tool that makes comple-mentary use of multi-criteria evaluation and monitoring principles (see Fig. 8.1).Despite the obvious advantages of sustainability monitoring tools, their integra-tion into the dynamics of urban projects often meets with reluctance. As recentresearch says, “practice has not yet reached a situation where particular methodsor approaches are proven to work well” (Ramos 2019). Evaluation, per se, is saidto be time-consuming and its cost–benefit ratio is often underestimated (Weddingand Crawford-Brown 2007; Sharifi and Murayama 2013). Besides, multi-criteriasustainability evaluation methodologies often require a large volume of data, ask forthe participation of several experts, and provide complex results, which make themdifficult to apply in practice (Sharifi et al. 2021).
Furthermore, aswewill explain inSect. 8.5, analysis of several evaluationmethodsat the neighbourhood scale, and in particular those adapted to brownfield sites, revealsthat their development is mainly from the context of scientific research; they aregenerally not adapted to the context of practice and have often not gone beyond casestudies (Laprise et al. 2015).
evaluation results results management
model
OPERATIONAL MONITORING TOOL
iteration /optimisation
multicriteria evaluation monitoring
Fig. 8.1 Schematic representation of the constituent elements of an operational monitoring tool

8.3 Operational Monitoring Tool Challenges 127
Between theory and practice, the ideal monitoring tool does not seem to exist(Bartke and Schwarze 2015). Nevertheless, some evidence allows us to define whatmay be optimal for a monitoring tool to be operational. We will next explore thelimitations and requirements used in the design of monitoring tools that can play arole in their integration into the dynamics of urban brownfield regeneration projectsso that they are accepted and used or, in other words, operational.
8.3.1 Operational Limitations
To be concretely manageable and integrated into project dynamics, a monitoringtool should not be overloaded with indicators, otherwise, too much time will bespent on data collection and not enough on its analysis (Kusek and Rist 2004).However, research highlights a lack of consensus on the selection and the optimalnumber of indicators (Tanguay et al. 2010). For instance, the theoretical require-ments of completeness or transparency deriving from the BellagioSTAMP (seeSect. 8.2.1) inevitably lead to a system with specific indicators answering specificquestions. In other words, pushing towards a holistic indicator system, which coversthe sustainability concept, involves a large number of indicators.
In daily practice, the resources required to use such a system are limited (time,budget, skills, and capacities). For example, obtaining neighbourhood-wide data foran adequate assessment can be a problem: many aspects are relatively detailed orof a qualitative nature and difficult to assess. When these aspects can be quantified,the necessary data for a fine degree of analysis is both cumbersome and costly toobtain (Larco 2015). From a technical point of view, some indicators are deemedicebergs: they require a disproportionate workload compared to other indicators toobtain the desired final data (simulations, analyses, calculations, etc.) (Riera Pérez2016). Furthermore, as urban brownfield regeneration projects change and developin a context that is also changing, some indicators may lose their relevance. Theymayhave to be replaced by indicators that are more adequate under the current conditions.
The challenge is, therefore, to condense and simplify the indicator system, and byextension the monitoring tool, without losing the essential elements. Indeed, how anindicator system is simplified can be critical and lead to simplistic and misleadingconclusions (Bell and Morse 2006). In that respect, recent research identifies risksof indicator overuse (the use of indicators whose value is negligible for decision-making), non-use (the potential of the information provided by the indicators is notfully utilized), or misuse (the indicators are used to distort or create false impressionsor the information they provide is interpreted erroneously) (Lyytimäki et al. 2020).
The recurring question thus concerns the time spent on the assessment, althoughour investigation indicates little by way of the ideal compromise. As a rule of thumb,we measure the effectiveness of a monitoring tool and its embedded evaluationapproach by the amount of time and effort required to carry out an evaluation, whichmust be proportional to the benefits that it brings. As argued in Chap. 7, to convinceactors of urban projects to spend time on data collection and monitoring, they must

128 8 Sustainability Monitoring: Principles, Challenges, and Approaches
take part in the process in order to be able to use and relate to the informationgenerated.
Nowadays, certifications such as LEED-ND, BREEAM communities or LabelEcoQuartier can be an attractive means for implementing an evaluation process andcompensating for the additional costs generated by themarket visibility they provide,even if they are said to be complex, time-consuming, and bureaucratic.5 Another wayto encourage this practice is through incentive ormandatorymeasures within policiessupporting evaluation and monitoring (see Chap. 7). Finally, public awareness of theimportance of including sustainability objectives added to market demand for eco-friendly projects can influence the choice of whether to monitor the transition of anurban brownfield towards a sustainable neighbourhood.
8.3.2 Target Audience
The challenge for monitoring tool designers is to incorporate not only the hetero-geneous sustainability aspects but also the very different end-users requirements.However, requirements such as completeness, thoroughness, transparency, user-friendliness, flexibility, and affordability in terms of investment can be contradic-tory. According to research on the matter, “tool designers have to give up a certaindegree of scientific and normative rigour in order to achieve practicability and long-term implementation” (Bartke and Schwarze 2015). The latter research suggests thatno tool is capable of meeting all the requirements of different potential users. Soinstead of trying to develop the “perfect tool”, developers should focus on identi-fying the target audience of the monitoring tool and their specific needs. Putting apriority on one aspect thus depends on the end-user’s expectations (decision-makers,representatives of the public, scientists, and experts).
Hence, the aim is to find a balance between the normative principles of sustain-ability evaluation and the practical requirements of users (see Fig. 8.2). In otherwords, a monitoring tool can be operational when it is accepted and adopted by rele-vant end-users and, at the same time, helps to make informed decisions that supportsustainability goals. As discussed in Chap. 7, defining the right target audience forthe monitoring tool is crucial to ensure its credibility and duration over time (Kusekand Rist 2004):
• Ownership: Who are the users willing to invest time and resources in the tool?• Management: Who, how and where will the tool be installed and operated?• Maintenance: Who will be responsible for problem solving and updates, in
particular on long-term operations?
5 Certifications provide a multi-criteria evaluation approach but not necessarily structured andcontinuous follow-up required by monitoring principles.

8.3 Operational Monitoring Tool Challenges 129
Design of a sustainability monitoring tool(allows integration of objectives and decision-making)
Constituent parts of the sustainable development concept
Sustainability principles: minimum requirement for a sustainable development
User needs: minimum requirement for usability and adoption of an evaluation method
Resource and capacity limitationsfor decision making
Fig. 8.2 Balance between normative principles of sustainability evaluation and practical userrequirements for the design of an operational monitoring tool (Laprise 2017)
8.3.3 Results Reporting
An operational monitoring tool, when properly used, constitutes a database on thesustainability objective and performance of a project that allows sharing regularfeedback on the operation. It can thus act as an exchange platform between manystakeholders from different spheres of action. In this sense, the communication ofresults is essential: the main challenge is to deliver a message. It should ideally bepart of a larger communication strategy.
Regular communication of the results brings up some questions:Whowill receivethe information, in what format, and when? Who will prepare the information andwhowill present it, whether it gives good or bad results? Here too, the target audiencemust be identified and reflected in the data collection, analysis of the evaluation, andreporting of the results.
So far, we have noted that the desire to create a monitoring tool representingthe complexity of sustainability objectives can be contradictory to the expectationsrelated to its usability, notably clear and simple communication of results. Neverthe-less, methods such as aggregation or the selection of representative indicators canhelp simplify the communication of results.
Multiple aggregation methods are used, especially when the list of indicators islong. They raise the question of the transformation of qualitative and quantitative

130 8 Sustainability Monitoring: Principles, Challenges, and Approaches
indicators into homogeneous values, and that of their weighting. Aggregation feasi-bility and relevance, andmore particularly weightingmethods, are criticized for theirsubjective and ambiguous nature and their varying degrees of transparency (Haapioand Viitaniemi 2008; Tanguay et al. 2010). Indeed, weighting methods imply givingparticular consideration to an indicator, while it is difficult to compare and prioritizeone aspect of sustainability with another (Riera Pérez 2016).
Another strategy consists of selecting relevant flagship indicators, knowing thatall sustainability dimensionsmust be covered in a sustainable neighbourhood project.The involved stakeholders can make this selection during specific workshops withvarying degrees of participation. This approach can establish a collaborative culturewith a positive social impact within sustainable neighbourhood projects: the assess-ment is designed by the actors themselves, based on their discussions, and adaptedto the realities of the context (Ramos 2019).
Furthermore, identifying mandatory indicators can be a strategy to ensure theachievement of a certain level of performance.However,mandatory indicators shouldnot mean that some sustainability aspects are more legitimate than others and shouldnot undermine the indicator system’s flexibility (Wangel et al. 2016).
Finally, how the evaluation results are reported, that is to say, their graphicalrepresentation, can have a significant impact on their usefulness in decision-making,the latter being the central issue in any monitoring tool. An evaluation report mustoffer a balanced representation of the sustainability dimensions, including both goodand bad results, and be adapted to the right audience. The graphical representationof the results must be simple, clear, and in enough detail to allow some form oftransparency. The ability of these results representations to track changes over timeis also a question that is directly linked to the monitoring principles. For example, thetransposition of evaluation results into a radar chart is easier to communicate than asimple list (see Fig. 8.3).
There are many requirements for operational monitoring tools: to be reliableand accessible, including, beyond environmental aspects, economic and socialones, while recognizing local particularities and, above all, capable of commu-nicating, creating and enabling participation. This means more complex, precise,and demanding tools (GBCe 2014). We must, therefore, find an acceptable balancebetween this complexity and a sufficient level of accuracy; between theory and prac-tice. Since an operational monitoring tool may prove to be relevant for ensuring thetransition from urban brownfield sites to sustainable neighbourhoods, it must alsomeet this challenge. Hence, it is important to have in-depth knowledge of the subjectto be evaluated—in our case, urban brownfield regeneration projects—and to adaptthe monitoring tool to this specific subject.
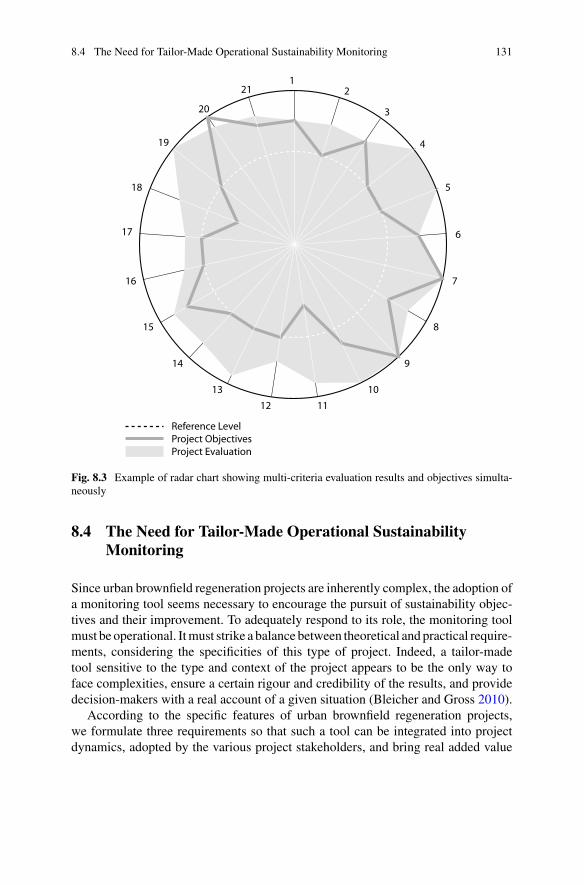
8.4 The Need for Tailor-Made Operational Sustainability Monitoring 131
1
Reference LevelProject Objectives Project Evaluation
2
3
4
5
6
7
8
9
101112
13
14
15
16
17
18
19
20
21
Fig. 8.3 Example of radar chart showing multi-criteria evaluation results and objectives simulta-neously
8.4 The Need for Tailor-Made Operational SustainabilityMonitoring
Since urban brownfield regeneration projects are inherently complex, the adoption ofa monitoring tool seems necessary to encourage the pursuit of sustainability objec-tives and their improvement. To adequately respond to its role, the monitoring toolmust be operational. Itmust strike a balance between theoretical and practical require-ments, considering the specificities of this type of project. Indeed, a tailor-madetool sensitive to the type and context of the project appears to be the only way toface complexities, ensure a certain rigour and credibility of the results, and providedecision-makers with a real account of a given situation (Bleicher and Gross 2010).
According to the specific features of urban brownfield regeneration projects,we formulate three requirements so that such a tool can be integrated into projectdynamics, adopted by the various project stakeholders, and bring real added value
132 8 Sustainability Monitoring: Principles, Challenges, and Approaches
compared to current practices. Further developed in Sect. 8.4.2, these three require-ments are: a search for overall quality, adequacy with the specificities of urbanbrownfield regeneration projects, and integration into the project dynamics.
8.4.1 Consideration of Specific Features
The complexity of an urban brownfield regeneration project depends notably onits location and size, the nature of the regeneration, as well as the timeframe andinvolved stakeholders. Because the scale of the project corresponds to that of theneighbourhood, a suitable monitoring tool cannot only assess isolated objects withina definedperimeter. Itmust also address how thenewneighbourhood influences—likea system—its context and vice versa (Wangel et al. 2016). Sustainability evaluationat this scale involves the consideration of factors, both qualitative and quantitative,that provide sensitive results to adapt the project to the changing needs of differentstakeholders (Zheng et al. 2014).
To promote the integration—and continuation—of sustainability objectives, thedecision-making support provided by the tool should focus on the regenerationproject and its development and management, rather than policies to be evaluated.As discussed in Chap. 7, such a tool can also be used in collaboration with citizensand in this way gain social relevance (Ramos 2019). Communicating regularly on themonitoring results makes it possible to promote the future neighbourhood but also tomitigate expectations by explaining its limits. Because a neighbourhood in transitioncertainly produces not only winners but also losers, having an adapted monitoringtool facilitates project-related trade-offs in a search for sustainability optimizationand contributes to the acceptability of these trade-offs. In other words, it can be usedas a means to facilitate exchanges and constructive discussions between the variousstakeholders and the citizens.
In a brownfield regeneration project characterized by temporal complexity,sustainable development is far from constituting a unifying element, but, on thecontrary, brings different paces into play. By managing sustainability objectives,a tailor-made operational monitoring tool can mitigate this temporal complexity(Wangel et al. 2016).
As neighbourhoods are in transition, urban brownfield regeneration projects arecontinuously changing. Because their realization spans over 20 or even 30 years, theyare unlikely to conform to their original design. Marked by uncertainties, the perfor-mances of these projects are only partially predictable and controllable: there willalways be elements that will influence the project and appear over time. Even thoughpredictive assessment provided by an adapted tool remains partial, it can contribute tomaintaining a certain level of consistency over timewith the sustainability objectives.Based on this observation, measuring sustainability challenges cannot be limited toad hoc reviews. As shown in Fig. 8.4, it must participate fully in the project dynamicsand be embodied in a reflective approach allowing continuous and iterative adjust-ment of its intents (Rey 2012). Hence, monitoring throughout an urban brownfield

8.4 The Need for Tailor-Made Operational Sustainability Monitoring 133
TEMPORARYUSE
URBANRENEWAL
SITE ENFRICHE
(soil remediation)
PLANNING AND DESIGNPHASE
CONSTRUCTIONPHASE
CONSTRUCTIONPHASE
OPERATIONALPHASE
EX-ANTEEVALUATION
IN-ITINEREEVALUATION
EX-POSTEVALUATIONEX-POST
EVALUATION
BROWNFIELDSITE
Fig. 8.4 Sustainability monitoring throughout an urban brownfield regeneration project’s lifecycle
regeneration project’s lifecycle can be a useful source of information and contributesto developing more accurate sustainability strategies (Cahantimur et al. 2010).
Already discussed in Sect. 6.6.2, the early integration of monitoring can be partic-ularly crucial, as decisions made at this stage will affect the neighbourhood’s sustain-ability throughout its lifecycle (Romm 1994). Indeed, early monitoring allows timefor reflection and maturation of the sustainability objectives related to the neigh-bourhood’s transition. The early days provide a window for the project to includeflexibility,whichmay increase the possibilities for subsequentmodification and delayunalterable decisions. The latter introduces the idea of taking into account aspectsthat can help prevent the regenerated site from returning to a state of neglect, or, inother words, becoming a brownfield site again (HOMBRE 2014).
An urban brownfield regeneration project may not be linear. On the contrary, theactivities of each step of the process may overlap or merge; actors may move fromdifferent activities and steps, depending on the project’s unique set of characteristics.Capturing the potential nonlinearity through monitoring is fundamental in terms ofthe optimization of sustainability objectives. An adapted tool can support this overallcomplexity, thanks to the creation of a shared image of the project. As discussed inChap. 7, a person responsible for evaluating the sustainability objectiveswill promotethis shared image and lead the monitoring process within the project.

134 8 Sustainability Monitoring: Principles, Challenges, and Approaches
8.4.2 Operational Monitoring Tool Requirements
The consideration of these specific features calls for the development of an opera-tional monitoring tool that includes a continuous, engaging, and efficient evaluationapproach, specially adapted to the needs of urban brownfield regeneration projects.To do this, it is necessary to encourage a proactive research for high-quality, inte-grated voluntarily into the project dynamics, and introduce structured and continuousmonitoring of sustainability while taking into account the characteristics specific tourban brownfield regeneration projects. We identify the following requirements:
Search for overall quality
The tool must provide monitoring of sustainability objectives in a holistic manner.Consequently, the recurrent evaluation will have to examine, equally and concur-rently, the environmental, sociocultural, and economic aspects of the project as wellas the sound management of the project process, i.e., its governance.
• The tool must assess the three pillars of sustainability;• The tool must assess the “fourth pillar” of sustainability (governance).
Adequacy with the specificities of urban brownfield regeneration projects
The tool must respond to the problems that are at the origin of the brownfield, aswell as to the inherent characteristics of the urban brownfield site and regenerationproject process, which brings challenges related to sustainability assessment.
• The tool must be specific to urban brownfield issues;• The tool must be specific to the process of the regeneration project, notably, its
multi-disciplinary aspect.
Integration into the project dynamics
The tool must ensure an operational evaluation that is integrated into the projectdynamics. It allows easy monitoring throughout the site’s transition from urbanbrownfield to a sustainable neighbourhood. It provides clear communication of theevaluation results that allows iterative and informed action to change performances.
• The tool must include ex-ante assessment and follow-up;• The tool must include in-itinere assessment and follow-up;• The tool must include ex-post assessment and follow-up;• The tool must promote continuous improvement of the regeneration project.
Formulating these requirements is not trivial. It is deduced from the threecomplexity factors discussed at the beginning of this chapter. Thus, the “search foroverall quality” refers to the definition of the sustainability of Europeanmetropolitanareas elaborated in Chap. 5. “Adequacy with the specificities of urban brownfieldregeneration projects” relates to the analysis made of the potential and particu-larities of a neighbourhood in transition in Chap. 4. Finally, “integration into the

8.4 The Need for Tailor-Made Operational Sustainability Monitoring 135
Search for overall quality
+ +
Integration into the project dynamics
Fig. 8.5 Schematic representation of the three general requirements for a tailor-made operationalmonitoring tool
project dynamics” reflects concerns about projectmonitoring, as discussed inChap. 6as well as in the present chapter.
However, as illustrated in Fig. 8.5, these requirements are not independent ofeach other, but rather intersect. For instance, integration into the project dynamicscan only be conclusive if the tool is in line with the specificities of urban brownfieldregeneration projects. The same goes for this adequacy with the specificities of urbanbrownfield regeneration projects, which will only be complete if it responds to asearch for overall quality. Hence, the operational monitoring tool must entirely andsimultaneously embrace the three general requirements.
8.5 Critical Analysis of Existing Approaches
The themes raised so far highlight the need for an operational monitoring tool withspecific requirements. The identification of such a targeted need is confronted withthe fact that the fields of multi-criteria evaluation as much as monitoring itself arealready widely explored and that a real profusion of tools already exists. To closethis chapter, we present a critical analysis of existing approaches (certifications at theneighbourhood scale andmost relevant evaluationmethods developed for brownfieldsites). The objective is not to provide an exhaustive list of all approaches, but tohighlight the most encountered limitations.6 This critical analysis will lead us to theobservation that—for several reasons—existing approaches do not entirely fulfil thegeneral requirements identified in Sect. 8.4.2.
6 For detailed analysis, refer to Laprise (2017).

136 8 Sustainability Monitoring: Principles, Challenges, and Approaches
8.5.1 Existing Certifications at the Neighbourhood Scale
As discussed above, certification methods such as LEED-ND, BREEAM commu-nities, Label EcoQuartier, HQE Aménagement, DGNB System for districts or OnePlanet Living OPL, to name a few, are frequently used in current practice acrossEurope; much has been said about their benefits and pitfalls (Lützkendorf andBalouktsi 2019; Sharifi et al. 2021). We observe that, even if they are designedto assess sustainability at the neighbourhood scale, certifications do not meet themany specific challenges of urban brownfield regeneration projects.
Symptomatic of this mismatch, several of these certification methods considerthe reclamation of brownfield in their indicator system as a separate conditioncontributing to the overall sustainability of a project. By way of example, in the caseof LEED-ND, the Smart Location and Linkage (SLL) Credit: Brownfield remedia-tion grants 1–2 points for projects taking place on contaminated sites (USGBC2018).Similarly, BREEAM communities’ indicator LE02-Land use aims to encourage theuse of previously developed or contaminated land, offering 1–2 credits (BRE GlobalLimited 2013). While it is true that a thoughtful location on a brownfield site is asustainable solution by reducing pressure on unexploited land, indicators of this kindcan be misleading regarding the direct benefits that can be generated by regenerationprojects on their own. In other words, it reduces the many specificities relating tothese sites and confines them to the concepts of contamination or built density.
The criticism has been made that, regardless of the development site chosen(urban brownfield, allotment in outskirt area, or land which has not been previouslydisturbed), these tools generally use the same indicators and benchmarks (Sharifiand Murayama 2014). Because these certifications are specially designed for newdevelopments, they are seen as ineffective in assessing issues relating to a brown-field site confronted with existing conditions and marked by the complexity of itsregeneration. This calls into question the use of certifications for urban brownfieldregeneration projects unless they are simply used as checklists (Wangel et al. 2016).In addition, certification consists generally of the one-off assessment of a projectby a third party (external audit) to award a label. Thus, the evaluation intervenesindirectly and passively in the project process, which prevents it from integratinginto the project dynamics (Schweber and Haroglu 2014).
However, it should be noted that most certifications include indicators regardingthe governance of the project with varying levels of engagement from themain stake-holders. For instance, process quality is one of the five topics rated by the DGNBsystem for the district, accounting for 20% of the global score. It aims to increaseplanning and construction quality but leaves little room for bottom-up approaches.The Label EcoQuartier assesses the project’s governance initiatives such as commu-nication and inclusion of the population. It also adds to its list the criterion “imple-ment evaluation and continuous improvement procedures”, which demonstrates thata label is expressly a tool that excludes monitoring principles.

8.5 Critical Analysis of Existing Approaches 137
Ultimately, many evaluation approaches, such as the iiSBE SN Tool (Larsson2020), offer generic performance assessment frameworks for rating the sustain-able performances of neighbourhoods, although they are not certifications, per se.However, like the certification methods, these approaches are not designed specifi-cally for brownfield regeneration. Moreover, as far as we could determine, they arenot integrated into operational tools, further limiting their usefulness.
8.5.2 Existing Evaluation Methods for BrownfieldRegeneration Projects
We also identify from the literature a number of sustainability evaluation methodsthat relate to the issues raised by brownfield regeneration projects. However, weobserve from the outset that most of these methods remain at the theoretical level,or at best at the experimental level. They can be classified into three categories.
The first category consists of targeted methods. The latter aims at simplifying thecomplex brownfield regeneration process by shedding light on a single aspect. Forexample, many approaches focus on soil remediation (Rizzo et al. 2016; Huysegomsand Cappuyns 2017). In fact, within the larger context of sustainable land-use plan-ning, urban brownfield redevelopments and sustainable soil remediations often inter-weave. It is worth mentioning—for the sustainable soil remediation guidance theyprovide—the qualitative impact assessment model developed by Nijkamp et al.(2002), the REFRINdd approach (ARTELIA et al. 2016), and the participatorydecision support system for contaminated brownfield redevelopment elaborated byTendero and Plottu (2019). Other targeted methods narrow the assessment on asingle aspect of sustainability—quite often on the reduction of energy consumption,carbon emission, and motorized private transport—like the 2000-Watt Site certifi-cate (SwissEnergy 2019). In short, we witness that targeted methods do not addressall the specificities of an urban brownfield regeneration project and are not adaptedto a structured and continuous follow-up integrated at every stage of the projectdynamics.
The second category refers to ex-ante methods, which are designed to inter-vene at the early stage of project planning. Many of these predictive tools—usinggeographic information systems (GIS)—were developed to compare the sustain-ability of different scenarios on brownfield sites at a pre-design stage, predict optimalplanning solutions, and/or identify sites for priority development at a territorial level.We can cite interesting works on GIS an indexing scheme (Chrysochoou et al. 2012),an integrated assessment model (Schädler et al. 2011), a definition on the points ofattention in designing tools for regional brownfield prioritization (Limasset et al.2018), and the TIMBRE project’s brownfield prioritization tool (TBPT) (Pizzol et al.2016). The work of HOMBRE (holistic framework for zero brownfield perspective)allowed the development of the so-called BFN (brownfield navigator) (HOMBRE2013). It is a sophisticated spatial planning tool that helps identify at an early stage

138 8 Sustainability Monitoring: Principles, Challenges, and Approaches
how a brownfield site can be successfully regenerated. One of the tool’s specialfeatures is the inclusion of “early indicators”, which detect the risk of a given sitebecoming a brownfield and allows the parties concerned to watch over the sites atrisk. Finally, RESCUE’s work led to the creation of a checklist that focuses on thefuture functional use of brownfields and sustainable development-related impacts.The checklist was, however, limited to rating a project to obtain public funding(RESCUE 2004). If the early use of a monitoring tool is essential for integratingsustainability issues into brownfield regeneration projects, continuing the evaluationis just as important. Indeed, sustainability objectives risk being abandoned along theway of the project and falling into the trap of “Build and let’s see what happens”.
The third category consists of frameworks that were developed to help orient thetransformation of urban brownfields into new neighbourhoods integrating sustain-ability principles. The framework created byWilliams and Dair (2007) and the rede-velopment assessment framework (RAF) developed by Pediaditi et al. (2005) areguidelines based on a participatory approach. Theymainly consist of a list of sustain-ability objectives,withinwhich users are free to define themost appropriate indicatorsto measure their goals. Without possible comparison or uniform measurement, theseframeworks do not enable an informed choice among different iterations or vari-ants of a project. For its part, the sustainable brownfield redevelopment (SBR) tool(Wedding and Crawford-Brown 2007) is a result-oriented framework that evaluatesand communicates successes related to the sustainability of completed brownfieldredevelopment projects. However, despite its project monitoring ambition, the toolprovides only a list of weighted indicators and quantitative aggregation principles.Themethodological framework for brownfield assessment developed byCappai et al.(2019) includes a list of new criteria, resulting from crossing brownfield redevelop-ment issues with the parameters of project design. The evaluation must be performedduring each phase of the lifecycle of the project. However, since it has not yet beenvalidated in cases studies, this approach cannot be considered operational. Finally,we also identify the sustainability indicator system SIPRIUS, which is specificallyadapted to issues raised by brownfield regeneration projects in the post-industrialEuropean context and offers opportunities to follow the entire project process indetail (Rey 2012). Furthermore, a successful test application to a case study, theEcoparc Neighbourhood in Neuchâtel, Switzerland (already mentioned in Chap. 2),was performed. However, the latter framework, taken in this version, is not yet oper-ational. In all cases, these frameworks do not consider nor assess aspects related tothe fourth pillar of sustainability.
8.5.3 Towards a Hybridization of Existing Approaches
The critical analysis shows that existing approaches do not entirely fulfil the generalrequirements for an operational monitoring tool previously elaborated in Sect. 8.4.2.Indeed, most methods are dissociated from the overall project dynamics. Therefore,they cannot be applied on a regular basis or do not address all the phases of a project.
8.5 Critical Analysis of Existing Approaches 139
This lack of structured and continuous follow-up limits the ability of actors to makeinformed choices and communicate the results and, as a consequence, reduces theirability to integrate holistic sustainability objectives into the regeneration project.
This chapter highlights a paradoxical situation: the importance of not only devel-oping a tailor-made operational monitoring tool but also the presence of a multitudeof approaches. The next chapter proposes, rather than starting from scratch, to relyon existing “know-how” in order to come up with an optimal tool. This hybridiza-tion strategy is inspired by the fact that often in the built environment, new ideasare formed by combining old ones (Glaeser 2011). Entitled SIPRIUS+, this tool isthus the hybridization of two existing approaches: SIPRIUS, the previously identi-fied indicator system, and OKpilot, a user-friendly, web-based monitoring softwaredesigned to check andmanage compliance with different frameworks and checklists.
References
Adewumi AS (2020) Enhancing urban regeneration at the neighbourhood level: the role of sustain-ability assessment frameworks. EmeraldOpenRes 2:1. https://doi.org/10.35241/emeraldopenres.13418.2
Adewumi AS, Onyango V, Moyo D, AlWaer H (2019) A review of selected neighbourhood sustain-ability assessment frameworks using the Bellagio STAMP. Int J Build Pathol Adapt 37:108–118.https://doi.org/10.1108/IJBPA-07-2018-0055
ARTELIA, Collet J-L, ARMINES (2016) REFRINdd Phase 2: REdéveloppement de FRichesINdustrielles prenant en considération le développement durable. BRGM
BartkeS, SchwarzeR (2015)Noperfect tools: trade-offs of sustainability principles anduser require-ments in designing support tools for land-use decisions between greenfields and brownfields. JEnviron Manag 153:11–24. https://doi.org/10.1016/j.jenvman.2015.01.040
Bell S,Morse S (2006)Measuring sustainability: learning by doing. Earthscan Publications, London(reprint 2006)
Bleicher A, Gross M (2010) Sustainability assessment and the revitalization of contaminated sites:operationalizing sustainable development for local problems. Int J Sustain Dev AmpWorld Ecol17:57–66. https://doi.org/10.1080/13504500903488263
Bossel H (1999) Indicators for sustainable development: theory, method, applicationsBRE Global Limited (2013) BREEAMCommunities Technical Manual: SD202. Version 0.1:2012.BRE Global. http://www.breeam.org/communities
Cahantimur AI, Öztürk RB, Öztürk AC (2010) Securing land for urban transformation throughsustainable brownfield regeneration—the case of Eskisehir, Turkey. Environ Urban 22:241–258.https://doi.org/10.1177/0956247809362641
Cappai F, Forgues D, Glaus M (2019) A methodological approach for evaluating brownfieldredevelopment projects. Urban Sci 3:45. https://doi.org/10.3390/urbansci3020045
Cease B, Kim H, Kim D et al (2019) Barriers and incentives for sustainable urban development: ananalysis of the adoption of LEED-ND projects. J Environ Manag 244:304–312. https://doi.org/10.1016/j.jenvman.2019.04.020
Chrysochoou M, Brown K, Dahal G et al (2012) A GIS and indexing scheme to screen brownfieldsfor area-wide redevelopment planning. LandscUrban Plan 105:187–198. https://doi.org/10.1016/j.landurbplan.2011.12.010
Eisen JB (1999) Brownfield policies for sustainable cities. Duke Environ Law Policy Forum 9:187–229

140 8 Sustainability Monitoring: Principles, Challenges, and Approaches
Eurostat (2019) SDG 11—sustainable cities and communities—statistics explained. In: EurostatStat. Explain. https://ec.europa.eu/eurostat/statistics-explained/index.php?title=SDG_11_-_Sustainable_cities_and_communities&oldid=439596. Accessed 2 June 2020
Eurostat, Boesch A (2014) Getting messages across using indicators. A handbook based onexperiences from assessing sustainable development indicators. European Union (EU)
Franz M, Pahlen G, Nathanail P et al (2006) Sustainable development and brownfield regeneration.What defines the quality of derelict land recycling? Environ Sci 3:135–151. https://doi.org/10.1080/15693430600800873
GBCe (ed) (2014)WSB14Barcelona—arewemoving as quickly as we should? It’s up to us! GBCe,Barcelona
Glaeser EL (2011) The triumph of the city. Macmillan, LondonHaapioA,Viitaniemi P (2008)A critical reviewof building environmental assessment tools. EnvironImpact Assess Rev 28:469–482. https://doi.org/10.1016/j.eiar.2008.01.002
HOMBRE (2013) Holistic management of brownfield regeneration. http://www.zerobrownfields.eu/index.aspx
HOMBRE (2014) HOMBRE’s role in brownfield management and avoidance. http://www.zerobrownfield.eu
HuysegomsL, CappuynsV (2017) Critical review of decision support tools for sustainability assess-ment of site remediation options. J Environ Manag 196:278–296. https://doi.org/10.1016/j.jenvman.2017.03.002
Klopp JM, Petretta DL (2017) The urban sustainable development goal: indicators, complexity andthe politics of measuring cities. Cities 63:92–97. https://doi.org/10.1016/j.cities.2016.12.019
Kusek JZ, Rist RC (2004) Ten steps to a results-basedmonitoring and evaluation system: a handbookfor development practitioners. World Bank Publications
Laprise M (2017) Monitoring opérationnel pour l’intégration des enjeux de durabilité aux projetsde régénération de friches urbaines. Ecole polytechnique fédérale de Lausanne (EPFL)
Laprise M, Lufkin S, Rey E (2015) An indicator system for the assessment of sustainability inte-grated into the project dynamics of regeneration of disused urban areas. Build Environ 86:29–38.https://doi.org/10.1016/j.buildenv.2014.12.002
Larco N (2015) Sustainable urban design—a (draft) framework. J Urban Des 21(1):1–29. https://doi.org/10.1080/13574809.2015.1071649
LarssonN (2020)Neighbourhoods and SNTool, iiSBE (The International Initiative for a SustainableBuilt Environment). http://www.iisbe.org/node/295
Levett & Therivel (2004) Report to the sue-MOT consortium: sustainable urban environment—metrics, models and toolkits: analysis of sustainability-social tools
Limasset E, Pizzol L, Merly C et al (2018) Points of attention in designing tools for regionalbrownfield prioritization. Sci Total Environ 997–1008. https://doi.org/10.1016/j.scitotenv.2017.11.168
Lützkendorf T, Balouktsi M (2019) Sustainability assessment systems for new and existing neigh-bourhoods. In: Albiez M, Banse G, Lindeman KC, Quint A (eds) Designing sustainable urbanfutures: concepts and practices from different countries. KIT Scientific Publishing, Karlsruhe, pp27–42
Lyytimäki J, Salo H, Lepenies R et al (2020) Risks of producing and using indicators of sustainabledevelopment goals. Sustain Dev. https://doi.org/10.1002/sd.2102
Meadows D (1998) Indicators and information systems for sustainable development—a report tothe Balaton Group. In: Donella Meadows Institute, Hartland, USA. http://www.donellameadows.org/archives/indicators-and-information-systems-for-sustainable-development/.Accessed 4 June2013
Moore B, Spires R (2000) Monitoring and evaluation. In: Roberts P (ed) Urban regeneration: ahandbook. SAGE, London, pp 203–227
Nijkamp P, Rodenburg CA, Wagtendonk AJ (2002) Success factors for sustainable urban brown-field development: a comparative case study approach to polluted sites. In: Spatial aspects ofenvironmental policy, pp 211–228
References 141
OECD (2010) Glossary of key terms in evaluation and results based managementPediaditi K, Doick KJ, Moffat AJ (2010) Monitoring and evaluation practice for brownfield, regen-eration to greenspace initiatives: a meta-evaluation of assessment and monitoring tools. LandscUrban Plan 97:22–36. https://doi.org/10.1016/j.landurbplan.2010.04.007
Pediaditi KE,WehrmeyerW, Chenoweth J (2005) Monitoring the sustainability of brownfield rede-velopment projects: the Redevelopment Assessment Framework (RAF). Contam Land Reclam13:173–183.
Pedro J, Reis A, Duarte Pinheiro M, Silva C (2019) A systematic review of the internationalassessment systems for urban sustainability. IOP Conf Ser Earth Environ Sci 323:012076. https://doi.org/10.1088/1755-1315/323/1/012076
Pintér L, Hardi P, Martinuzzi A, Hall J (2012) Bellagio STAMP: principles for sustainabilityassessment and measurement. Ecol Indic 17:20–28. https://doi.org/10.1016/j.ecolind.2011.07.001
Pizzol L, Zabeo A, Klusácek P et al (2016) Timbre Brownfield Prioritization Tool to supporteffective brownfield regeneration. J Environ Manag 166:178–192. https://doi.org/10.1016/j.jenvman.2015.09.030
Ramos TB (2019) Sustainability assessment: exploring the frontiers and paradigms of indicatorapproaches. Sustainability 11(3):824. https://doi.org/10.3390/su11030824
RESCUE (2004) Guidance on sustainable land use and urban design on brownfield sites—Work-package 4
Rey E (2012) Régénération des friches urbaines et développement durable: vers une évaluationintégrée à la dynamique du projet. Presses Universitaires de Louvain, Louvain-La-Neuve
Riera Pérez MG (2016) Méthodologie multicritère d’aide à la décision pour le renouvellementurbain à l’échelle du quartier. EPFL (Ecole Polytechnique Fédérale de Lausanne)
Rizzo E, Bardos P, Pizzol L et al (2016) Comparison of international approaches to sustainableremediation. J Environ Manag. https://doi.org/10.1016/j.jenvman.2016.07.062
Romm JJ (1994) Lean and clean management: how to boost profits and productivity by reducingpollution. Kodansha International, New York
Sala S, Ciuffo B, Nijkamp P (2015) A systemic framework for sustainability assessment. Ecol Econ119:314–325. https://doi.org/10.1016/j.ecolecon.2015.09.015
Schädler S, Morio M, Bartke S et al (2011) Designing sustainable and economically attractivebrownfield revitalization options using an integrated assessmentmodel. J EnvironManag 92:827–837. https://doi.org/10.1016/j.jenvman.2010.10.026
Schweber L, Haroglu H (2014) Comparing the fit between BREEAM assessment and designprocesses. Build Res Inf 42:300–317. https://doi.org/10.1080/09613218.2014.889490
Sharifi A, Dawodu A, Cheshmehzangi A (2021) Neighborhood sustainability assessment tools: areview of success factors. J Clean Prod 125912. https://doi.org/10.1016/j.jclepro.2021.125912
Sharifi A, Murayama A (2013) A critical review of seven selected neighborhood sustainabilityassessment tools. Environ Impact Assess Rev 38:73–87. https://doi.org/10.1016/j.eiar.2012.06.006
Sharifi A, Murayama A (2014) Neighborhood sustainability assessment in action: cross-evaluationof three assessment systems and their cases from the US, the UK, and Japan. Build Environ72:243–258. https://doi.org/10.1016/j.buildenv.2013.11.006
SwissEnergy (2019) Catalogue of criteria for the 2000-Watt-Site certificate. https://www.2000watt.swiss/en/english.html
Tanguay GA, Rajaonson J, Lefebvre J-F, Lanoie P (2010) Measuring the sustainability of cities: ananalysis of the use of local indicators. Ecol Indic 10:407–418. https://doi.org/10.1016/j.ecolind.2009.07.013
Tendero M, Plottu B (2019) A participatory decision support system for contaminated brownfieldredevelopment: a case study from France. J Environ Plan Manag 62:1736–1760. https://doi.org/10.1080/09640568.2018.1512476
USGBC (2018) LEED v4 for neighborhood development

142 8 Sustainability Monitoring: Principles, Challenges, and Approaches
Van Noordt A, De Mulder S (2015) In: Schrenk M, Popovich VV, Zeile P, Elisei P, Beyer C (eds)Online territorial consultation tool. Gent, Belgium
Voituriez T (2013) What is the purpose of the sustainable development goals? IDDRI 18Wangel J, Wallhagen M, Malmqvist T, Finnveden G (2016) Certification systems for sustainableneighbourhoods: what do they really certify? Environ Impact Assess Rev 56:200–213. https://doi.org/10.1016/j.eiar.2015.10.003
Wedding GC, Crawford-Brown D (2007) Measuring site-level success in brownfield redevelop-ments: a focus on sustainability and green building. J Environ Manag 85:483–495. https://doi.org/10.1016/j.jenvman.2006.10.018
WilliamsK,Dair C (2007)A framework for assessing the sustainability of brownfield developments.J Environ Plan Manag 50:23–40. https://doi.org/10.1080/09640560601048275
Zheng HW, Shen GQ, Wang H (2014) A review of recent studies on sustainable urban renewal.Habitat Int 41:272–279. https://doi.org/10.1016/j.habitatint.2013.08.006
Open Access This chapter is licensed under the terms of the Creative Commons Attribution 4.0International License (http://creativecommons.org/licenses/by/4.0/), which permits use, sharing,adaptation, distribution and reproduction in any medium or format, as long as you give appropriatecredit to the original author(s) and the source, provide a link to the Creative Commons license andindicate if changes were made.
The images or other third party material in this chapter are included in the chapter’s CreativeCommons license, unless indicated otherwise in a credit line to the material. If material is notincluded in the chapter’s Creative Commons license and your intended use is not permitted bystatutory regulation or exceeds the permitted use, you will need to obtain permission directly fromthe copyright holder.

Chapter 9An Operational Monitoring Tool
Abstract The transition from an urban brownfield to a sustainable neighbourhoodis a complex operation. To help decision-makers reach sustainability objectivesthrough measurement, follow-up, and communication about performance indica-tors, we introduce in this chapter a tailor-made operational monitoring tool. Such atool should satisfy three general requirements: a search for overall quality, adequacywith the specificities of urban brownfield regeneration projects, and integration intothe project dynamics. Accordingly, the multi-criteria evaluation system SIPRIUSand the quality management monitoring software OKpilot are hybridized to createSIPRIUS+. In the first section, we explain the functioning of the two existingmethod-ologies and the adaptionswemade to helpmeet the general requirements and to createthe hybrid tool. Then, we present the resulting monitoring tool, SIPRIUS+, and itsfunctionalities.
Keywords Operational monitoring tool ·Hybridization · Sustainability indicators ·Multi-criteria evaluation · Quality management ·Monitoring software · SIPRIUS+
9.1 The Hybridization of Methodologies
Urban brownfield regeneration projects are opportunities to create new sustainableneighbourhoods within metropolitan areas. Because of the overall complexity ofthese neighbourhoods in transition, we previously argued that a tailor-made oper-ational monitoring tool was required to integrate sustainability objectives, ensuretheir implementation, measure their performance, and communicate about theirresults. The tool should satisfy three general requirements: first, a search for overallquality (the tool must equally assess the economic, environmental, social, and insti-tutional/governance dimensions of sustainability); second, adequacy with the speci-ficities of urban brownfield regeneration projects (the tool must be specific to urbanbrownfield issues as well as the regeneration project process, in particular, its multi-disciplinary aspect); and third, an integration into the project dynamics (the tool mustinclude ex-ante, in itinere, and ex-post evaluation as well as promote continuousfollow-up and improvement of the project).
© The Author(s) 2022E. Rey et al., Neighbourhoods in Transition, The Urban Book Series,https://doi.org/10.1007/978-3-030-82208-8_9
143
144 9 An Operational Monitoring Tool
Chapter 8 reported some evaluation methods adapted to brownfield regener-ation projects, which meet the general requirements to some extent. However,the critical analysis revealed that these methods are dissociated from the overallproject dynamics. In other words, they are not operational and fail at monitoringsustainability objectives.
In response to this common major failure, a research project, conducted at Ecolepolytechnique fédérale de Lausanne (EPFL),1 allowed the development of a newoperationalmonitoring tool tailored to issues raised by urban brownfield regenerationprojects. Called SIPRIUS+, the tool is based on a hybridization strategy relying on thepotential of existing knowledge and expertise. Hybridization offers the possibility ofcombining different techniques to compensate for the complexity of decision-makingin a world where information is varied and sometimes contradictory (Zavadskas et al.2016). It puts elements of different origin in synergy and collaboration in order toobtain a combined function that is more efficient and user-friendly. Hybridizationrequires adapting the two parts sufficiently to make them compatible with each otherwhile remaining identifiable separately (Battilana et al. 2012). Creating new hybridtools is part of transdisciplinary research (td-net and Swiss Academies of Arts andSciences 2017). Close to our concerns, Glaeser paraphrases Janes Jacob’s motto,“New ideas need old buildings”, and transforms it into “New ideas are formed bycombining old ideas” (Jacobs 1961; Glaeser 2011).
Thus, SIPRIUS+ originates from the hybridization of existing methodologiesfrom different fields: the built environment and quality management. While sustain-ability considerations and associated indicators may differ, the methods used tomonitor objectives in business or project development are considerably similar.An extensive analysis led us to the complementary selection of SIPRIUS, a multi-criteria evaluation system specifically designed to integrate sustainability into thedynamics of urban brownfield regeneration projects (see Chap. 8), and OKpilot, aweb-based quality management monitoring software for public and private organiza-tions (Laprise et al. 2018). Based on their inherent assets, the initial hypothesis wasthat, put together, they could fulfil the previously described requirements (Fig. 9.1).
This chapter describes the two methodologies and presents the adaptations thatwere required before performing the hybridization. Then, it describes the mainfunctionalities of SIPRIUS+.
1 With financial support from the Swiss National Science Foundation (within the framework ofProject No 100013_143376).

9.2 The Multi-Criteria Evaluation System 145
OKpilot OPERATIONALMONITORING
TOOL
SIPRIUS
Fig. 9.1 Hybridization of themulticriteria evaluation systemSIPRIUS and the qualitymanagementmonitoring software OKpilot to create SIPRIUS+
9.2 The Multi-Criteria Evaluation System
9.2.1 Description
SIPRIUS is a multi-criteria evaluation system adapted to urban brownfield regener-ation projects reflecting the Swiss context (Rey 2012). It develops criteria and indi-cators according to a holistic approach, based on a definition of the fundamentalobjectives of sustainable development (Rey 2006). It also includes methodolog-ical considerations for assessment and measurement (Pintér et al. 2012), seekingexhaustiveness but non-redundancy.
The criteria—and the associated indicators—cover environmental, sociocultural,and economic aspects and are grouped into two categories: context and project.Context criteria concern aspects that are clearly beyond the physical boundaries ofthe site. Either the project has a larger impact than that defined by the brownfield site,or external factors interact with the project. Project criteria concern aspects whoseissues lie within the boundaries of the site. These criteria relate to both built andunbuilt areas of the site.
For each criterion, a set of quantitative and qualitative indicatorsmeasure a dimen-sion of sustainability. To do so, SIPRIUS attributes four reference values. Limit value(VL)—minimum value required for any project (or veto value); average value (VA)—value corresponding to the usual practice, no performance in particular; target value(VT)—value to target in order to achieve a greater performance; and best prac-tice value (VB)—value corresponding to particularly high performances. Each indi-cator has its own datasheet containing all the relevant information to perform theevaluation: description, evaluation method, measurement unit, reference values, andreferences.

146 9 An Operational Monitoring Tool
The representation of the results in a histogram allows comparing and followingthe evolution of the performances according to an urban brownfield regenerationproject’s progress. For indicators relating to context criteria, the evaluation resultsshow, simultaneously, the current situation (upon evaluation), the initial situation(before the regeneration process), and the expected final situation (predictable valueat the end of the project, based on all the elements known at the time of the evaluation).For indicators relating to project criteria, the evaluation reflects the long duration andthe realization in many stages characterizing urban brownfield regeneration projects.Indeed, one part of a regeneration project is often already completed while another isat the designphase. In this sense, the evaluation results show thedifferent evolutionaryphases of the project: the initial objective, the final expected situation, as well asthe current situation (the design, construction, and operating phases). Figure 9.2shows the histograms for the context and project criteria. In addition to the levelscorresponding to the reference values (right axis), the histogram also indicates theconventional regular graduated scale (left axis).
SIPRIUS has proven to be a relevant method to evaluate the sustainability of urbanbrownfield regeneration projects. Indeed, a successful test application to a case study
Eval
uatio
n sc
ale
[uni
t]Ev
alua
tion
scal
e [u
nit]
0
initial situation
currentsituation situation
VL
VA
VT
VB
0
initialobjectives situation
operatingphase
constructionphase
designphase
VL
VA
VT
VB
Fig. 9.2 Graphical representation of context (above) and project (below) indicators
9.2 The Multi-Criteria Evaluation System 147
was performed (Rey 2012): the Ecoparc Neighbourhood in Neuchâtel, Switzerland,introduced in Chap. 2. However, this earlier version of SIPRIUS is not operational;because it is not integrated into a digital tool, its use on a regular basis depends toomuch on stakeholders’ motivation. Moreover, the indicator system does not addressgovernance aspects. Developed in 2006, SIPRIUS needs adaptations if it is to complywith current practice.
9.2.2 Adaptations
To help meet our three general requirements, the following adaptations of themulti-criteria evaluation system SIPRIUS were necessary: first, the update of theexisting indicators and reference values, second, the inclusion of missing criteriaand indicators, and third, the creation of a list of governance criteria and indicators.
Our update concerned seven indicators to reflect current concerns and evolvingpractices, norms, and standards. In these cases, the reference values (VL, VA, VT,and VB) are more restrictive today than the ones suggested by the original versionof SIPRIUS. For example, indicators regarding global warming potential (GWP)and non-renewable primary energy for construction, renovation, and demolition ofbuildings had no reference values in the first version of SIPRIUS because, at thetime, no comparative calculations or targets were available. Since then, the Swissrecommendation SIA 2040 has been released, which encloses objectives for bothindicators (SIA 2017).
We added four new indicators after comparing SIPRIUS with other indicatorsystems specifically developed for brownfield regeneration projects and sustain-ability certifications at the neighbourhood scale (see Chap. 8). For example, mobilityplans for companies and the prevention of light emissions are considerations that weintegrated as new indicators.
To meet the fourth pillar of sustainability, governance, we created a new listby analysing the literature as well as other indicator and certification systems. Thelist contains 11 indicators, which use a determined reference value to evaluate themanagement and the process of the project. The indicators linked to the manage-ment of the project have a concrete dimension such as remediation, temporary use,construction site, and commissioning. They are limited in time to a specific projectphase. This does not exclude a regular evaluation, starting from the beginning ofthe project, in order to set objectives. The indicators linked to the process evaluatethe smooth execution of the regeneration project and the proper implementation ofthe sustainability objectives. Participation, collaboration, information access, and theevaluation process are integrated. As was done with the context and project indica-tors, the evaluation results for each indicator are presented in a histogram. Figure 9.3shows the performance for the objective, the current situation, and the expected finalsituation.
After completing these adaptations, the multi-criteria evaluation system offers57 indicators. Tables 9.1, 9.2, and 9.3, respectively, list the context, project, and

148 9 An Operational Monitoring Tool
Eval
uatio
n sc
ale
[uni
t]
0
initialobjectives
currentsituation situation
V L
V A
V T
V B
Fig. 9.3 Graphical representation of governance indicators
governance criteria and indicators. Within each list, we identify indicators that havebeen updated and ones that have been added from the original version of SIPRIUS.The full catalogue of indicators is available in datasheet form in the appendix.
The resulting multi-criteria evaluation system was then adjusted to other nationalcontexts. The challenge was to reflect current and innovative practices from differentcountries and regions while keeping a certain homogeneity of the indicator system.So far, adjustments have been made to comply with the French and Belgian nationalcontexts. The changes concerned mostly quantitative indicators, and more preciselytheir reference values. The qualitative indicators remainmostly unchanged, as long asthis does not conflict with specific national practices (also available in the appendix).
9.3 The Quality Management Monitoring Software
9.3.1 Description
OKpilot is a web-based collaborative monitoring tool developed as a software-as-a-service (SaaS) based on cloud computing, which ensures the user’s smoothimplementation, simple maintenance, and lower operating costs. It is accessibleonline simultaneously via different individual logins (usernames and passwords). Itis designed to help private and public organizations comply with different standards(sustainability, quality, social responsibility, health and safety, etc.) using checklistsof indicators and increase their performance (GLOBALITE Management 2014). Inservice to those users, the tool emphasizes clear, simple, and transparent communica-tion of results. The operational monitoring software has features that allow setting,managing, and reaching objectives for optimal control of projects and activities.OKpilot is actually composed of four main inter-related modules: evaluation (based

9.3 The Quality Management Monitoring Software 149
Table 9.1 Context criteria and indicators. Indicators marked by an asterisk (*) have been updatedfrom the original version. Criteria and indicators marked by a plus sign (+) have been added to thelist
Context criteria and indicators
Environmental impact
C1 Mobility C1.1 Quality of service in publictransport
C1.2 Number of parking spaces
* C1.3 Tying status with “soft”mobility networks
+ C1.4 Company mobility plan
C2 Air pollution * C2.1 Average annual emissions ofNO2
* C2.2 Global warming potential(GWP)
C2.3 Acidification potential (AP)
C3 Noise pollution C3.1 Average emissions ofnoise—day
C3.2 Average emissions ofnoise—night
+ C4 Light pollution + C4.1 Degree of prevention of lightemissions
Sociocultural impact
C5 Proximity of schoolfacilities
C5.1 Average distance to anursery
C5.2 Average distance to akindergarten
C5.3 Average distance to anelementary school
C5.4 Average distance to a juniorhigh/middle school
C5.5 Average distance to a highschool
C6 Proximity of commercialfacilities
C6.1 Average distance to acommercial zone
C7 Proximity of recreationalfacilities
C7.1 Average distance to a publicpark
C7.2 Average distance to arecreational green/naturalarea
C7.3 Average distance to acultural centre
(continued)

150 9 An Operational Monitoring Tool
Table 9.1 (continued)
Context criteria and indicators
C7.4 Average distance to a sportcentre
Economic impact
C8 Population C8.1 Net population density
C9 Employment C9.1 Net employment density
C10 Local economy C10.1 Proportion of work carriedout by local companies
on a checklist of indicators evaluated at different states); outcomes (with diversepossibilities of visualization modes, benchmarking, and reporting exports); manage-ment (includingmanagement solutions such as the setting of objectives and responsi-bility assignment, risk alerts, internal messaging, user configuration, etc.); and infor-mation database (gathering documents and other evidence on the evaluated object aswell as documentation supports for the evaluation like norm or standards).
Although OKpilot is business-oriented—and consequently not used to monitorsustainability in the built environment—its versatility and high level of flexibility aremajor assets. Thanks to a clear dissociation between its monitoring functionalitiesand the evaluation database, OKpilot has the potential—with some adaptations—to answer the need for an operational monitoring tool tailored to urban brownfieldregeneration projects.
9.3.2 Adaptations
In collaboration with the software’s computer service, we made a series of adapta-tions of OKpilot to make it compatible with the revised version of SIPRIUS. Moreprecisely, we adapted some features of OKpilot to evaluate and display sustain-ability indicators according to the logic of SIPRIUS. Consequently, our adaptationsconcerned the evaluation and outcome modules; the management and informationdatabase modules were highly functional and already compatible with SIPRIUS.
Most of the adaptations required only minor programming adjustments. Forexample, this was the case for the harmonization of technical terms used by OKpilotand SIPRIUS, the addition of an extra level of evaluation to make a distinction inthe results between sustainability dimensions, or the possibility to unselect irrelevantindicators according to projects (heritage or remediation for instance). Nevertheless,two adaptations required more extensive programming.
The first one asked for a change in the way indicators are measured and had adirect impact on the evaluation module (see Fig. 9.4). OKpilot originally workedwith relative values, expressed as a percentage. We made an adaptation allowingthe measurement with absolute values, corresponding to SIPRIUS’ reference values
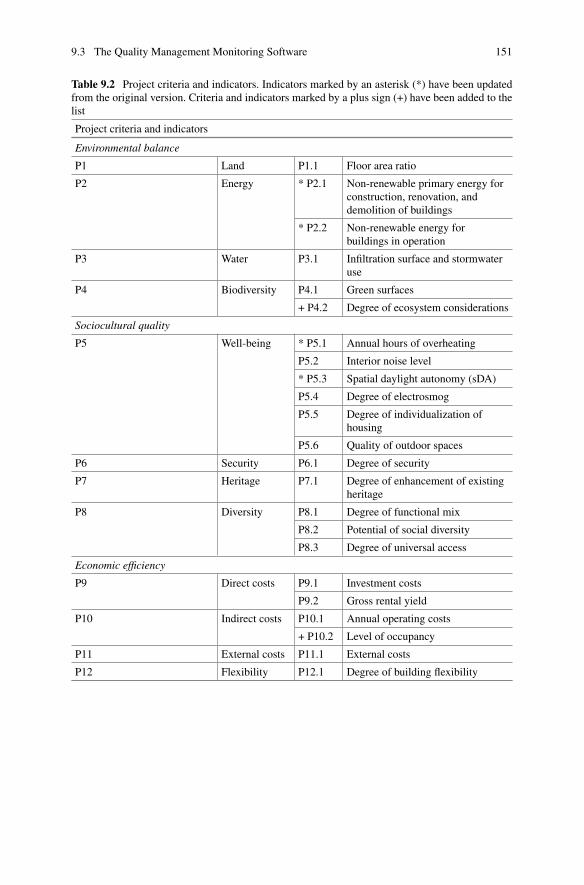
9.3 The Quality Management Monitoring Software 151
Table 9.2 Project criteria and indicators. Indicators marked by an asterisk (*) have been updatedfrom the original version. Criteria and indicators marked by a plus sign (+) have been added to thelist
Project criteria and indicators
Environmental balance
P1 Land P1.1 Floor area ratio
P2 Energy * P2.1 Non-renewable primary energy forconstruction, renovation, anddemolition of buildings
* P2.2 Non-renewable energy forbuildings in operation
P3 Water P3.1 Infiltration surface and stormwateruse
P4 Biodiversity P4.1 Green surfaces
+ P4.2 Degree of ecosystem considerations
Sociocultural quality
P5 Well-being * P5.1 Annual hours of overheating
P5.2 Interior noise level
* P5.3 Spatial daylight autonomy (sDA)
P5.4 Degree of electrosmog
P5.5 Degree of individualization ofhousing
P5.6 Quality of outdoor spaces
P6 Security P6.1 Degree of security
P7 Heritage P7.1 Degree of enhancement of existingheritage
P8 Diversity P8.1 Degree of functional mix
P8.2 Potential of social diversity
P8.3 Degree of universal access
Economic efficiency
P9 Direct costs P9.1 Investment costs
P9.2 Gross rental yield
P10 Indirect costs P10.1 Annual operating costs
+ P10.2 Level of occupancy
P11 External costs P11.1 External costs
P12 Flexibility P12.1 Degree of building flexibility

152 9 An Operational Monitoring Tool
Table 9.3 Governance criteria and indicators. Criteria and indicators marked by a plus sign (+)have been added to the list
Governance criteria and indicators
Management
+ G1 Remediation + G1.1 Logic of project footprint
+ G1.2 Degree of site remediation
+ G1.3 Degree of residualcontamination
+ G2 Temporary use + G2.1 Transitional occupationinitiatives
+ G3 Construction site + G3.1 Management of constructionwaste
+ G3.2 Management of constructiondisturbances
+ G4 Commissioning + G4.1 Commissioning plan forbuildings
Process
+ G5 Participation + G5.1 Degree of participation ofpopulation
+ G6 Collaboration + G6.1 Degree of collaboration ofprofessionals
+ G7 Information access + G7.1 Degree of access toinformation
+ G8 Evaluation + G8.1 Degree of integration of anevaluation process
(VL, VA, VT, and VB). Accordingly, we developed a new slider in the evaluationmodule, which allows assigning a value to each indicator. A standard colour codewasassociated with each reference value: orange corresponds to VL, yellow to VA, lightgreen to VT, and dark green to VB. As for red, it corresponds to an indicator whoseperformance does not reach the limit value (VL). Finally, the module improvementalso includes all relevant information and references to assist the evaluation for eachindicator, thanks to a digital transposition of the datasheet presented in the appendix.
This adaptation required coding work that had repercussions on the presentationof the results in the outcomes module. Thus, we did this work concurrently withthe second major adaptation: enhancement of the graphical displays. The “Chart”display, which gives an overview of the results at a given moment, showed in theprevious version only aggregated results under each criterion. It has thus evolved toshow every indicator simultaneously. Furthermore, we developed options allowingfor customized visualization according to a selection of indicators, a sustainabilitydimension, or a value obtained (Fig. 9.5). The resulting graphical display called “Evo-lution” is a completely new monitoring feature of OKpilot. It shows the evolution ofa given indicator from the objective or initial situation to the expected final situation,including the various situations (Fig. 9.6). It has the same options as the “Chart”

9.3 The Quality Management Monitoring Software 153
Fig. 9.4 Evaluation module for a given indicator
display, plus the option to show a summary of the repartition of several indicators(context, project, or governance), according to their performance (Fig. 9.7).
9.4 An Operational Monitoring Tool to SupportNeighbourhood in Transitions
Following these adaptations, we consolidated the hybridization between the indicatorsystem SIPRIUS and the monitoring software OKpilot, allowing the creation of theoperationalmonitoring tool SIPRIUS+.Figure 9.8 is a schematic representationof thetool’s structure. More precisely, SIPRIUS provides the content of SIPRIUS+, whileOKpilot supports it and makes it operational. It means that the three summary lists ofcriteria and indicators (context, project, and governance and the attached datasheet)were coded and imported into OKpilot. From there, they became checklists used tomonitor, in this case, urban brownfield regeneration projects located in Switzerland.The operation was then repeated for the French and Belgian lists. In total, ninechecklists are available within SIPRIUS+.
Figure 9.9 introduces the homepage of SIPRIUS+, which welcomes users with asimplified menu designed to make the tool more user-friendly. It can be customizedto the project that is monitored. To start using the tool, users must create a “site”, thatis to say, an urban brownfield regeneration project in a specific country. Then, they

154 9 An Operational Monitoring Tool
Fig. 9.5 Chart display showing the expected final situation of context indicators
must select a checklist (context, project, or governance) and a state (initial situationor objective, current situation, and expected final situation). Users can always accessthese selection buttons in the top toolbar. After these preliminary steps, they can startmonitoring their neighbourhood in transition.
Essentially, the result of this hybridization process is a tailor-made operationalmonitoring tool that specifically supports the regeneration of urban brownfields intosustainable neighbourhoods. In that sense, it is designed to meet the three generalrequirements set at the beginning: a search for overall quality, adequacy with thespecificities of urbanbrownfield regeneration projects, and integration into the projectdynamics.
In order to validate this result, SIPRIUS+went through a complementary two-stepverification process (Laprise et al. 2018). The first step consisted in the test applica-tion on three case studies: Val Benoit neighbourhood in Liège (Belgium), Gare-Lacneighbourhood in Yverdon-les-Bains (Switzerland), and Pôle Viotte neighbourhoodBesanҫon (France). The aim was to validate the functioning and robustness of themonitoring tool. The second step consisted of interactions with the stakeholdersinvolved in each case study. The aim was to challenge the tool and gather points

9.4 An Operational Monitoring Tool to Support Neighbourhood … 155
Fig. 9.6 Evolution display showing the performance of given indicators
of view of future end-users on the reality of the practice. The process has shownthat the inclusion of a monitoring practice is not only feasible but also realistic anddesired. It revealed that SIPRIUS+ has the potential, not only to facilitate a structuredand regular follow-up of sustainability objectives integrated into project dynamicsbut also to provide outputs easy to interpret by different professionals involved inthe project and simple to communicate to a wider audience. Hence, SIPRIUS+ isexpected to contribute to decision-making in a multi-disciplinary manner, withoutgiving ready-made solutions, but allowing iterative project settings. Concretizationof the sustainability vision and maintaining the objectives will always depend onthe motivation and involvement of the stakeholders (Laprise and Rey 2019). Thenext chapter illustrates a real-world application on an ongoing urban brownfieldregeneration project.

156 9 An Operational Monitoring Tool
Fig. 9.7 Evolution display showing all indicators’ performances
EvaluationHomepage
Checklists BE / CH / FRcriteria and indicators
(context, project, and governance)
datasheets
ex-ante, in-itinere, ex-postEvaluation States
Reference Sources
Outputslinks to documentation
referencesfollow-up
reportsresult display
objectivesactions
riskscommunication
Management
SIPRIUS+SIPRIUS
OKpilot
Fig. 9.8 Schematic representation of the structure of SIPRIUS+ hybridizing an indicator system(SIPRIUS) and a monitoring software (OKpilot)

9.4 An Operational Monitoring Tool to Support Neighbourhood … 157
Fig. 9.9 SIPRIUS+ Homepage
References
Battilana J, Lee M, Walker J, Dorsey C (2012) In search of the hybrid ideal. Stanf Soc Innov RevGlaeser EL (2011) The triumph of the city. Macmillan, LondonGLOBALITE Management (2014) OKpilot - solution. http://okpilot.com/okp_fr/Solution.html.Accessed 2 November 2014
Jacobs J (1961) The death and life of great American cities. Random House, New YorkLaprise M, Lufkin S, Rey E (2018) An operational monitoring tool facilitating the transformationof urban brownfields into sustainable neighborhoods. Build Environ 221–233. https://doi.org/10.1016/j.buildenv.2018.06.005
Laprise M, Rey E (2019) Implementation of a sustainability monitoring tool into the dynamics ofan urban brownfield regeneration project. IOP Conf Ser Earth Environ Sci 323. https://doi.org/10.1088/1755-1315/323/1/012083
Pintér L, Hardi P, Martinuzzi A, Hall J (2012) Bellagio STAMP: principles for sustainabilityassessment and measurement. Ecol Indic 17:20–28. https://doi.org/10.1016/j.ecolind.2011.07.001
Rey E (2006) Régénération des friches urbaines et développement durable. Vers une évaluationintégrée à la dynamique de projet. Université Catholique de Louvain, Faculté des SciencesAppliquées, Département d’architecture, d’urbanisme de génie civil et environnement
Rey E (2012) Régénération des friches urbaines et développement durable: vers une évaluationintégrée à la dynamique du projet. Presses Universitaires de Louvain, Louvain-La-Neuve

158 9 An Operational Monitoring Tool
SIA (2017) SIA 2040:2017, La voie SIA vers l’efficacité énergétique. SIA Société suisse desingénieurs et des architectes, Zurich
td-net N for TR, Swiss Academies of Arts and Sciences (2017) Transdisciplinary research for what?In: Netw. Transdiscipl. Res. http://www.transdisciplinarity.ch/en/td-net/Transdisziplinaritaet/Forschungszwecke.html. Accessed 21 September 2017
Zavadskas EK, Govindan K, Antucheviciene J, Turskis Z (2016) Hybrid multiple criteria decision-making methods: a review of applications for sustainability issues. Econ Res-Ekon Istraživanja29:857–887. https://doi.org/10.1080/1331677X.2016.1237302
Open Access This chapter is licensed under the terms of the Creative Commons Attribution 4.0International License (http://creativecommons.org/licenses/by/4.0/), which permits use, sharing,adaptation, distribution and reproduction in any medium or format, as long as you give appropriatecredit to the original author(s) and the source, provide a link to the Creative Commons license andindicate if changes were made.
The images or other third party material in this chapter are included in the chapter’s CreativeCommons license, unless indicated otherwise in a credit line to the material. If material is notincluded in the chapter’s Creative Commons license and your intended use is not permitted bystatutory regulation or exceeds the permitted use, you will need to obtain permission directly fromthe copyright holder.

Chapter 10Application to a Case Study
Abstract Wepresent an application of the operational monitoring tool SIPRIUS+ toan ongoing case study representative of urban brownfield regeneration projects: thePôle Viotte neighbourhood, located in Besançon (France).We start with a descriptionof the brownfield site, followed by the regeneration project. Then, we evaluate 52indicators linked to the context, project, and governance. Each monitoring result isillustrated by a graph showing the evolution of the performances. Then, we analysethe overall results, which allows us to assess the sustainability strategy of the regener-ation project. Through this analysis, we identify four actions to improve sustainabilityobjectives. Finally, we conclude that SIPRIUS+ has the potential to contribute to theintegration of sustainability issues into the dynamics of neighbourhoods in transition.The operational monitoring tool is expected to contribute to decision-making in amulti-disciplinary manner, without giving ready-made solutions. Interactions withproject stakeholders reveal that, while the use of such a tool would require a changein project management, the evolutions to adopt to include this practice appear notonly feasible but realistic and desired.
Keywords Urban brownfield regeneration project · Operational monitoring tool ·SIPRIUS+ · Case study · Pôle Viotte neighbourhood · Sustainableneighbourhood · Results reporting · Decision-making support
10.1 Monitoring the Pôle Viotte Neighbourhoodin Besançon, France
Chapter 9 explained briefly the functioning of the operational monitoring toolSIPRIUS+. The objective of this chapter is to demonstrate the benefits and limi-tations of SIPRIUS+, thanks to its application to an ongoing case study represen-tative of urban brownfield regeneration projects: the Pôle Viotte neighbourhood,located in Besançon (France). The monitoring is carried out in a neutral way; as arule, performance is not compared with other projects and no specific recommen-dations are made. The first application of the monitoring tool took place duringfall 2016, performed by the research team (LAST—EPFL) with the support of thecase study’s project manager (Direction Urbanisme Projets et Planification, Grand
© The Author(s) 2022E. Rey et al., Neighbourhoods in Transition, The Urban Book Series,https://doi.org/10.1007/978-3-030-82208-8_10
159

160 10 Application to a Case Study
Fig. 10.1 SIPRIUS+ Homepage customized for the Pôle Viotte monitoring
Besançon Metropole) (Laprise 2017). We present here the latest monitoring results.They were obtained with an application of the monitoring tool during fall 2020 andperformed by the same team configuration (see Fig. 10.1).
We start with a description of the urban brownfield site, followed by the regenera-tion project. Then, we present the detailed monitoring results of the context, project,and governance indicators illustrated by the evolution displays of SIPRIUS+. Finally,we show the overall monitoring results using the graph display of SIPRIUS+ aswell as an analysis of the monitoring tool’s potential to facilitate the integration ofsustainability issues into the project dynamics of a neighbourhood in transition.
10.1.1 Description of the Urban Brownfield Site
Railway activities characterize the Viotte site. The railway station was built in 1885and then rebuilt in 1962 to make room for underground circulation systems, whichlater became difficult to access and illegible for users. It added to the decline in railoperations throughout the site. More specifically, the closure of the old Sernam Hall(Fig. 10.3) in 2001 caused the loss of several jobs. At the beginning of the twenty-first century, the Viotte site embodied a typical urban brownfield, breaking with itscontext. The steep drop in level between the northern sector and the southern sector,as well as the lack of vitality of in situ activities, accentuated the barrier created

10.1 Monitoring the Pôle Viotte Neighbourhood in Besançon, France 161
Fig. 10.2 Aerial view of the brownfield site surrounding Viotte train station (photo: Ville deBesançon, 2007)
by the railways. Only a few jobs linked to the SNCF (the French National RailwayCompany) remained on site.
Thebrownfield site has a global hold of 11hectares in the city, including the surfaceoccupied by railways and various neglected spaces. It is located at the intersection ofthe Charpais and Saint-Claude neighbourhoods, near the Battant neighbourhood andthe glacis (pavedwall) of Vauban ramparts, whichwas transformed into a public parkin 2013. The Parc des Glacis, listed as a UNESCOWorld Heritage site, forms a greencorridor towards the city centre. The urban brownfield is accessed mainly by Avenuede la Paix to the south and RueNicolas Bruand to the north. It benefits from a locationthat is both privileged—its proximity to the historical city centre—and strategic, dueto the expanded transport offer of the Besaçon-Viotte railway station (TGV, regionaltrain, tram, bus, etc.), which can help promote economic development. Figure 10.2is an aerial view of the brownfield site before the start of the regeneration project.Figures 10.3, 10.4, 10.5, and 10.6 give an overview of the initial situation of thebrownfield site. Figure 10.7 locates the brownfield within the city of Besançon.
10.1.2 Description of the Urban Brownfield RegenerationProject
Since 2008, the city of Besançon has been supporting a global project to reclaim theurban brownfield site surrounding the Viotte railway. The Pôle Viotte neighbourhoodis designed as a new dense and mixed vibrant sustainable neighbourhood where itwill be possible to work, live, do daily shopping, move around, or travel. The trigger

162 10 Application to a Case Study
Fig. 10.3 The old Sernam Hall south sector of the brownfield was an emblematic building ofrailway sites (photo: Martine Laprise, 2016)
Fig. 10.4 View on the brownfield site from Rue Jeanneney showing the steep drop and an SNCFbuilding, 2016 (photo: Martine Laprise, 2016)

10.1 Monitoring the Pôle Viotte Neighbourhood in Besançon, France 163
Fig. 10.5 The military platform in the northern sector of the brownfield site, 2016 (photo: MartineLaprise, 2016)
Fig. 10.6 A parking in the northern sector of the site next to public access to the multi-modal hub,which was completed during the first phase of development (photo: Martine Laprise, 2016)

164 10 Application to a Case Study
0 25 50 100 500
Fig. 10.7 Location map of the Viotte brownfield site, Besançon, France
for the regeneration project was the Viotte station’s transformation into a 2-ha multi-modal hub. This first phase of development addressed a global mobility issue forthe City area, which opened the station to the north and made it accessible to alltravel modes. A preliminary consultation file was made public in 2009, following aseries of studies carried out by the firm Arep, architects-urban planners, representinga multi-disciplinary group. Work on this first phase—the multi-modal hub—beganin November 2012 and ended in October 2014.
The multi-modal hub created in phase 1 serves as an anchor and support for thesecond phase of development, another urban and metropolitan issue: developing amulti-functional neighbourhood of 3.1 ha to the north and south of the tracks as partof a comprehensive sustainable development approach. As previously described, thesector is a brownfield mainly occupied to the south by the old Sernam Hall and tothe north by various abandoned areas impervious to rainwater. At a global cost of 58M e (excluding tax), 46,535 m2 of the surface will emerge from the ground creatingalmost 1,000 jobs and more than 225 housing units. The driving force behind thisnew neighbourhood is Sernam Hall’s replacement by a new tertiary centre (approx.27,000 m2, buildings A and B). It will bring together several hundred agents fromthe state and regional services, currently spread over the territory of Besançon. Theproject was subject to an architectural competition won in July 2016 by Métra +Associés architects. The tertiary centre project is under the stewardship of SEDIA,a local semi-public company. The developer of the urban brownfield regenerationproject is Territoire 25, a local public development and construction’s company.

10.1 Monitoring the Pôle Viotte Neighbourhood in Besançon, France 165
Figure 10.8 shows the masterplan of the Pôle Viotte neighbourhood. The deliveryof the first neighbourhood buildings A and B is scheduled for 2021 (see Fig. 10.9).Final delivery of all buildings, landscaping, and exterior facilities is scheduled for2025.
10.2 Detailed Monitoring Results
From a monitoring point of view, it is especially interesting to focus on the detailedresults. Doing so makes it possible to see the effects that some sustainability objec-tives set by the regeneration project may have on the site’s improvement, includingthe risks, challenges, and opportunities. We present here the detailed monitoringresults updated during fall 2020. To do so, we start with the complete checklist ofcontext indicators, followed by the project indicators and the governance indicators.We can retrieve from the datasheet in the appendix the definition of each indicator,the evaluation method, the measurement unit, and the level assigned to the refer-ence values (VL—limit value, VA—average value, VT—target value, and VB—“bestpractice” value).
The monitoring focuses mainly on the second phase of development of theproject but also takes into account planned improvements of the recent multi-modalhub (phase 1). The documents used for the evaluation are mainly the masterplan, theapplication file for the EcoQuartier Label—phase 2 (Ville de Besançon 2018), anddiverse communications on the project produced by the City and the Arep represen-tatives (Ville de Besançon 2015; Arep ville et al. 2015, 2016). The Grand Besançonwebsite was also regularly consulted. As a complement, we performed site visits,interviews, and working sessions with the city of Besançon projects and planningdepartment to acquire the necessary knowledge and data for the project evaluation.
10.2.1 Checklist—Context Indicators
For these indicators, we evaluate the initial, current, and expected final situations(see Figs. 10.10, 10.11, and 10.12). The initial situation corresponds to that of 2007,before the start of the project. The current situation corresponds to the one closest tothe evaluation period (fall 2020) for which the data was available. Since constructionwork on the southern sector of the site—started in 2018—is still in progress, wenote that it is sometimes not relevant to measure the current situation. In these cases,evaluation of the current situation will evolve with the project. Such is the case for theindicators under the sociocultural impact (C5.1 to C7.4).We evaluate these indicatorsby the various services supplied for the neighbourhood inhabitants within a givenradius from their residence place (entrance of the building). For the moment, noexisting or new apartment building allows measuring these indicators for the initialand current situation. Only the expected final situation gives an overview of what

166 10 Application to a Case Study
A
B
A
C
D
E
F
G
1st phase(Multimodal Hub)
2nd phaseH
I
J
K
K
L
0 105 20 50
Fig. 10.8 Masterplan of the Pôle Viotte neighbourhood

10.2 Detailed Monitoring Results 167
Fig. 10.9 New tertiary centre under construction (photo: Ville de Besançon, 2021)
can be anticipated; the evaluation of the current situation will be specified as theproject progresses. To date, the expected final situation corresponds to the objectivesdescribed in the project guidelines used for the assessment.
Moreover, we cannot evaluate indicators C2. Air pollution—C2.2. Globalwarming potential (GWP) and C2.3. Acidification potential (AP)—because thereare not enough comparable calculations on full lifecycle analysis of buildings toestablish reliable reference values.
10.2.1.1 Environmental Impact
C1. Mobility—C1.1. Average distance to a public transport stop
The future neighbourhood will benefit from a real quality of service in public trans-port, thanks to the multi-modal hub’s existence within the Viotte site perimeter.Indeed, the offer includes, for the railway station, the TGV and the main and regionallines, and, for the public transport of greater Besançon, the tramway, the urban andsuburban bus network GINKO, and the regional and departmental inter-urban busnetwork. For the expected final situation, we calculate a weighted average distance of192m to the closest public transport stop, which leads to the best practice value (VB).For the initial situation calculation, the public transport offer was not as complete
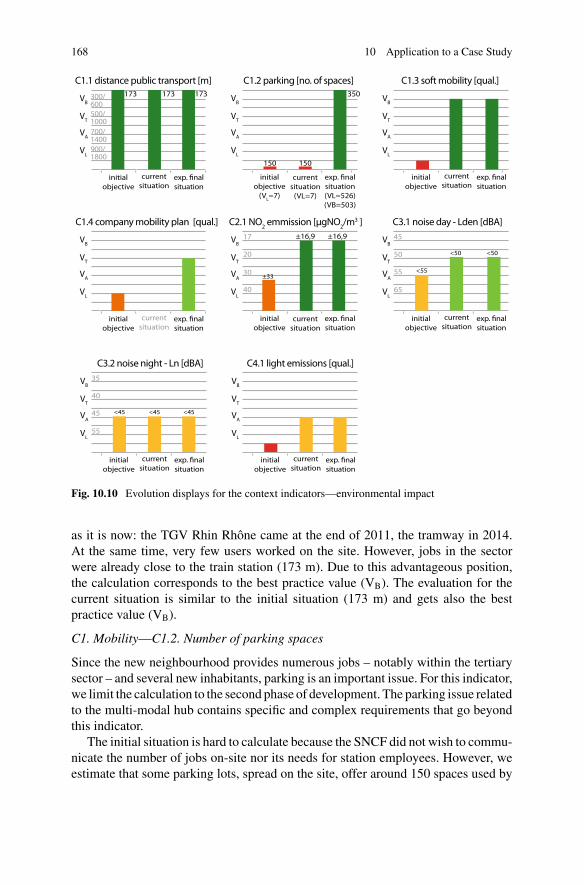
168 10 Application to a Case Study
C3.2 noise night - Ln [dBA]
C1.4 company mobility plan [qual.]
VL
VA
VT
VB
initialobjective situation
current situation
C1.1 distance public transport [m]173 173 173300/
600500/1000700/1400900/1800
C1.3 soft mobility [qual.]
VL
VA
VT
VB
initialobjective situation
current situation
C1.2 parking [no. of spaces]
VL
VA
VT
VB
initialobjective
(VL=7)
situation(VL=526)(VB=503)
current situation
(VL=7)
150 150
350
VL
VA
VT
VB
initialobjective situation
current situation
C2.1 NO2 emmission [µgNO
2/m3 ]
40
30
20
17 ±16,9
VL
VA
VT
VB
initialobjective situation
current situation
±16,9
±33
C3.1 noise day - Lden [dBA]
65
55
50
45
VL
VA
VT
VB
initialobjective situation
current situation
<50 <50
<55
55
40
45
35
VL
VA
VT
VB
initialobjective situation
current situation
<45 <45 <45
C4.1 light emissions [qual.]
VL
VA
VT
VB
initialobjective situation
current situation
Fig. 10.10 Evolution displays for the context indicators—environmental impact
as it is now: the TGV Rhin Rhône came at the end of 2011, the tramway in 2014.At the same time, very few users worked on the site. However, jobs in the sectorwere already close to the train station (173 m). Due to this advantageous position,the calculation corresponds to the best practice value (VB). The evaluation for thecurrent situation is similar to the initial situation (173 m) and gets also the bestpractice value (VB).
C1. Mobility—C1.2. Number of parking spaces
Since the new neighbourhood provides numerous jobs – notably within the tertiarysector – and several new inhabitants, parking is an important issue. For this indicator,we limit the calculation to the second phase of development. The parking issue relatedto the multi-modal hub contains specific and complex requirements that go beyondthis indicator.
The initial situation is hard to calculate because the SNCF did not wish to commu-nicate the number of jobs on-site nor its needs for station employees. However, weestimate that some parking lots, spread on the site, offer around 150 spaces used by

10.2 Detailed Monitoring Results 169
VL
VA
VT
VB
initialobjective situation
currentsituation
300
500
700
900
C5.1 distance nursery [m] C5.2 distance kindergarten [m]
492 492
C5.3 distance elem. school [m]
C5.4 distance junior school [m] C5.5 distance high school [m] C6.1 distance com. zone [m]
C7.1 distance public park [m] C7.2 distance recreational area [m] C7.3 distance cultural centre [m]
C7.4 distance sport centre [m]
VL
VA
VT
VB
initialobjective situation
currentsituation
VL
VA
VT
VB
initialobjective situation
currentsituation
750
300
500
700
900
VL
VA
VT
VB
initialobjective situation
current situation
600
1000
1400
1800VL
VA
VT
VB
objective situationcurrent
situation
600
1000
1400
1800 VL
VA
VT
VB
objective situationcurrent
situation
300
500
700
900
300
500
700
900
VL
VA
VT
VB
initialobjective situation
current situation
600
1000
1400
1800VL
VA
VT
VB
objective situationcurrent
situation
300
500
700
900 VL
VA
VT
VB
objective situationcurrent
situation
300
500
700
900
VL
VA
VT
VB
objective situationcurrent
situation
340
354
890
861
>900
358 150
Fig. 10.11 Evolution displays for the context indicators—sociocultural impact
SNCF employees. If we strictly consider the second-phase sector, we calculate thelimit value (VL) at 75 parking spaces. So, we evaluate the initial situation under thelimit value (VL). The evaluation of the current situation is not relevant because thereis no activity at the moment in the northern sector, and the southern sector of the siteis under construction.
Based on the urban planning code requirements, the future inhabitants’ andworkers’ needs will be 526 spaces for the limit value (VL) and 503 spaces for

170 10 Application to a Case Study
C10.1 local companies [%]C9.1 employment density [jobs/ha]C8.1 population density [inhabs/ha]
VL
VA
VT
VB
initialobjective
(VA=17.1)situation
current situation(VA=16.7)
34.1
25.8
17.2
15.5 50%
60%
70%
80%57.1
42.8
28.5
25.7VL
VA
VT
VB
initialobjective(VA=28.1)
situationcurrent
situation(VA=27.7)
VL
VA
VT
VB
initialobjective situation
current situation
52.3
0 0
98
13.6 13.6
100 >80
Fig. 10.12 Evolution displays for the context indicators—economic impact
the best practice value (VB). The new neighbourhood project intends to providean optimal number of parking spaces. First, we know that no parking spaces will beoffered to employees of state services. In the southern sector, the project includes asemi-underground car park with 300 spaces. A shared car park with 150 spaces willprobably equip the northern part. Of these spaces, 100 are not taken into account, asthey are intended for SNCF agents. With its estimated total of 350 parking spaces,we assign the best (VB) practice value to the expected final situation.
C1. Mobility—C1.3. Tying status with “soft” mobility networks
For the initial situation, we notice that the Viotte sector made little room for pedes-trians and bicycles, particularly because of the rupture between the northern andsouthern sectors of the site caused by the railways. This observation is one of thetriggers that led to the new multi-modal hub’s conception. Indeed, one of the objec-tives was to “get across the station” as well as to create “clear, legible, and securepedestrian links from the city centre” and “continuity of paths”. Another achievedobjective was “the accessibility and the provision of bicycle parking”. Given thedevelopment work completed in 2014, the current situation corresponds to the bestpractice value (VB). We evaluate the initial situation as below the limit value (VL).
Finally, the guidelines for the Pôle Viotte neighbourhood also show strong consid-eration of soft and sustainable mobility. Indeed, in the neighbourhood’s southernsector, a landscaped lane will be accessible only to pedestrians and bicycles.Throughout the site, the project plans a fine-meshed pedestrian and bike network,accompanied by the strong presence of greenery. It will improve the neighbourhood’sconnectivity to the rest of the city, both in its northern and southern sectors. For thesereasons, we assign the best practice value (VB) to the expected final situation.
C1. Mobility—C1.4. Company mobility plan
A company mobility plan between the tertiary centre’s different agencies to promotenon-motorized commuting is currently under development. For example, stateemployees could be offered a 50% reduction in public transport subscriptions. Dueto the tertiary centre’s strategic localization close to the multi-modal hub and the citycentre, we can also expect that a significant proportion of employees will use publictransport or other sustainable mobility modes (cycling, walking, etc.). As mentioned

10.2 Detailed Monitoring Results 171
for indicatorC1.2 Number of parking spaces, no parking space for state employees isgranted, representing the vast majority of future jobs in the sector. Besides, the PôleViotte neighbourhood will offer an optimal supply of parking spaces, based, amongother things, on a pooling strategy. According to this information, the expected finalsituation is likely to reach the target value (VT).
Evaluating the initial situation required an examination of the measures formerlyin place for SNCF employees. The latter had free use of SNCF transport services. Onthe other hand, we also know that all employees had a free parking space available,which was used systematically. Faced with this ambiguity and the simplitic offeras an alternative to motorized private transport, we evaluate the initial situation atthe limit value (VL). Evaluating the current situation is not relevant because thereis no activity at the moment in the northern sector, and the southern sector is underconstruction.
C2. Air pollution—C2.1. Average annual emission of NO2
For the current performance in air pollution, we take into account the measurementsof the European Prévoyance station (urban type), located about 500 m from the PôleViotte neighbourhood.An average annual emission of 16.9µgNO2/m3 wasmeasuredfor the year 2019 (13.2µgNO2/m3 is currently foreseeable for the year 2020) (ATMOBFC 2020). This measurement corresponds to the best practice value (VB).
For the initial situation,wemust refer to theMégevand station (traffic type) locatedin downtown Besançon at a distance of about 1.5 km and an altitude of +246 m.Indeed, the Prévoyance station (+281 m) is only been effective since 2013. Theaverage annual emission for 2007 was 43 µgNO2/m3, which is below the limit value(VL). However, we note significant differences between the two stations’ measure-ments of the order of 10 µgNO2/m3 from 2013 to 2016. For this reason, we judgethe initial situation to be more or less 33 µgNO2/m3, that is to say, the limit value(VL).
As for the expected final situation, trends observed since 2013 show generalimprovement, which, however, does not allow us to affirm continuity or stabilizationof emissions level. We know from the outset that an increase in site occupancy,including new buildings and increased traffic, will have an impact on the level of NO2
emissions. That said, the project plans energy-efficient buildings (RT2012 −20%)based on renewable energies, such as geothermal energy. Besides, constant technicaldevelopment in the automobile and a change in mentality about public transport usecan help improve air quality. For these reasons, we give the best practice value (VB)to the expected final situation, in continuity with the current situation.
C3. Noise pollution—C3.1. Average emissions of noise—day (Lden)
For the initial situation, we consider the cartographic data of rail and road noise from2012 (Grand Besançon 2016). The current and expected final situations use TypeA maps with isophone curves starting at 55 dBA, updated in 2019 (Ministère dela Transition Ecologique et Solidaire and Ministère de la Cohésion des Territoires2019). For this indicator, we evaluate only the second phase of the development of

172 10 Application to a Case Study
the project. Indeed, the multi-modal hub (first phase) has specific requirements, lessimpacted by noise pollution.
Regarding noise caused by road traffic, 13% of the site is in a 55–60 dBA zone and9% in a 60–65 dBA zone. These areas are scattered around the site. For railway noise,12% of the site is in a 55–60 dBA zone, 36% in a 60–65 dBA zone (in the northernpart), and 6% of the site reaches levels between 65 and 70 dBA (in the south-easternpart, near Rue du Chasnot, where the free spaces are). The Sernam Hall makes asignificant contribution to noise reduction in the south. For the initial situation, thereis no building to the north. We estimate through the analysis of these data that mostof the occupied site is below 55 dBA, which corresponds to the average value (VA)for the initial situation.
For the current and the expected final situation, the new measurements show thatalmost all the buildings will be located outside the noise pollution zones greaterthan 55 dBA (railways and roads combined). Only the west tip of the tertiary centre(building A) meets a zone of 60 dBA. The noise is mainly around the station, Ruede Vesoul, and Avenue de la Paix. At this stage of the project, there is no indicationof specific construction measures to counter noise. Like the Sernam Hall, we expectthat the tertiary centre will have a deflecting effect in the southern sector. Based onthese data, and for lack of more precise measurement, we evaluate the two situationsfor the moment at the target value (VT).
C3. Noise pollution—C3.2. Average emissions of noise—night (Ln)
The evaluation conditions for Ln are similar to the previous indicator Lden. For theinitial situation, we consider the cartographic data of rail and road noise from 2012(Grand Besançon 2016). The current and expected final situations consider TypeA maps with isophone curves starting at 50 dBA, updated in 2019 (Ministère dela Transition Ecologique et Solidaire and Ministère de la Cohésion des Territoires2019).
For the initial situation, concerning road traffic noise, 10% of the site area is in a50–55 dBA zone. These areas are located around the site. For rail traffic noise, 16%of the site is in a 50–55 dBA zone, 30% in a 55–60 dBA zone (i.e., almost all of thenorthern portion), and 4% in a 60–65 dBA zone to the north along the Sernam Hall.For the initial situation, there is no building to the north. We estimate through theanalysis of these data that most of the occupied site is below 45 dBA, which givesthe average value (VA) for the initial situation.
For the current and expected final situations, the new measurements show thatall the buildings will be located outside noise pollution zones greater than 50 dBA(railways and roads combined). The noise is concentrated around the main roads ofRue de Vesoul, Avenue de la Paix, and near the station. The deflecting effect of thetertiary centre has less impact on this indicator since almost no train travels overnight.Based on these data, and for lack of more precise measurement, we evaluate the twosituations for the moment at the average value (VA).
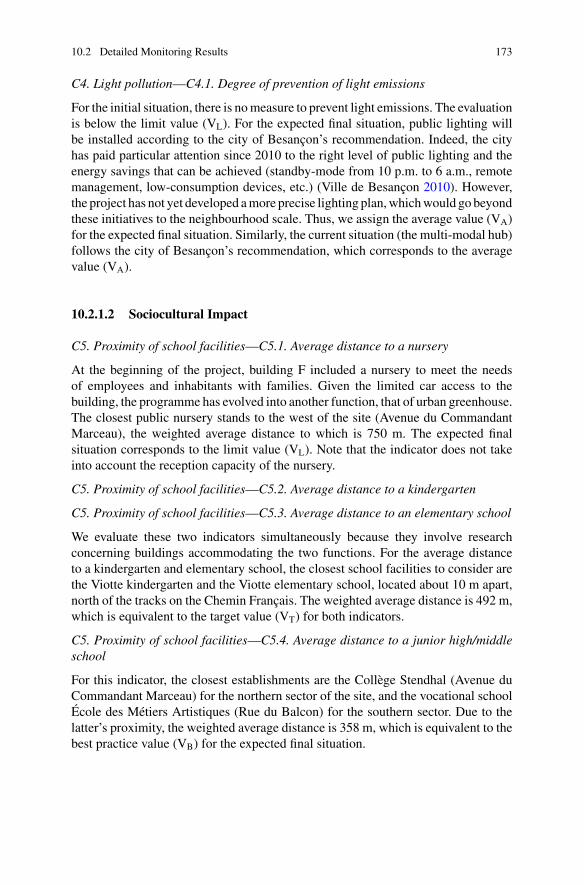
10.2 Detailed Monitoring Results 173
C4. Light pollution—C4.1. Degree of prevention of light emissions
For the initial situation, there is nomeasure to prevent light emissions. The evaluationis below the limit value (VL). For the expected final situation, public lighting willbe installed according to the city of Besançon’s recommendation. Indeed, the cityhas paid particular attention since 2010 to the right level of public lighting and theenergy savings that can be achieved (standby-mode from 10 p.m. to 6 a.m., remotemanagement, low-consumption devices, etc.) (Ville de Besançon 2010). However,the project has not yet developed amore precise lighting plan,whichwould go beyondthese initiatives to the neighbourhood scale. Thus, we assign the average value (VA)for the expected final situation. Similarly, the current situation (the multi-modal hub)follows the city of Besançon’s recommendation, which corresponds to the averagevalue (VA).
10.2.1.2 Sociocultural Impact
C5. Proximity of school facilities—C5.1. Average distance to a nursery
At the beginning of the project, building F included a nursery to meet the needsof employees and inhabitants with families. Given the limited car access to thebuilding, the programme has evolved into another function, that of urban greenhouse.The closest public nursery stands to the west of the site (Avenue du CommandantMarceau), the weighted average distance to which is 750 m. The expected finalsituation corresponds to the limit value (VL). Note that the indicator does not takeinto account the reception capacity of the nursery.
C5. Proximity of school facilities—C5.2. Average distance to a kindergarten
C5. Proximity of school facilities—C5.3. Average distance to an elementary school
We evaluate these two indicators simultaneously because they involve researchconcerning buildings accommodating the two functions. For the average distanceto a kindergarten and elementary school, the closest school facilities to consider arethe Viotte kindergarten and the Viotte elementary school, located about 10 m apart,north of the tracks on the Chemin Français. The weighted average distance is 492 m,which is equivalent to the target value (VT) for both indicators.
C5. Proximity of school facilities—C5.4. Average distance to a junior high/middleschool
For this indicator, the closest establishments are the Collège Stendhal (Avenue duCommandant Marceau) for the northern sector of the site, and the vocational schoolÉcole des Métiers Artistiques (Rue du Balcon) for the southern sector. Due to thelatter’s proximity, the weighted average distance is 358 m, which is equivalent to thebest practice value (VB) for the expected final situation.
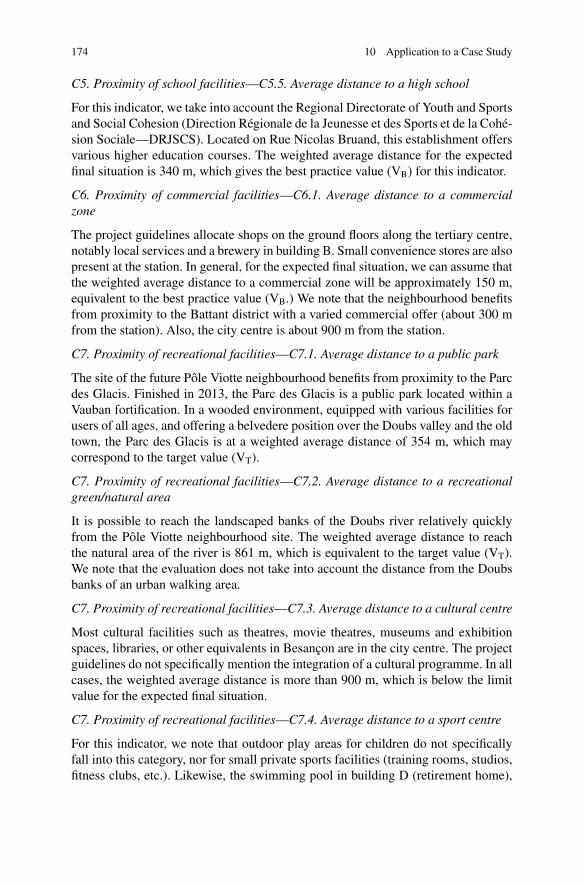
174 10 Application to a Case Study
C5. Proximity of school facilities—C5.5. Average distance to a high school
For this indicator, we take into account the Regional Directorate of Youth and Sportsand Social Cohesion (Direction Régionale de la Jeunesse et des Sports et de la Cohé-sion Sociale—DRJSCS). Located on Rue Nicolas Bruand, this establishment offersvarious higher education courses. The weighted average distance for the expectedfinal situation is 340 m, which gives the best practice value (VB) for this indicator.
C6. Proximity of commercial facilities—C6.1. Average distance to a commercialzone
The project guidelines allocate shops on the ground floors along the tertiary centre,notably local services and a brewery in building B. Small convenience stores are alsopresent at the station. In general, for the expected final situation, we can assume thatthe weighted average distance to a commercial zone will be approximately 150 m,equivalent to the best practice value (VB.) We note that the neighbourhood benefitsfrom proximity to the Battant district with a varied commercial offer (about 300 mfrom the station). Also, the city centre is about 900 m from the station.
C7. Proximity of recreational facilities—C7.1. Average distance to a public park
The site of the future Pôle Viotte neighbourhood benefits from proximity to the Parcdes Glacis. Finished in 2013, the Parc des Glacis is a public park located within aVauban fortification. In a wooded environment, equipped with various facilities forusers of all ages, and offering a belvedere position over the Doubs valley and the oldtown, the Parc des Glacis is at a weighted average distance of 354 m, which maycorrespond to the target value (VT).
C7. Proximity of recreational facilities—C7.2. Average distance to a recreationalgreen/natural area
It is possible to reach the landscaped banks of the Doubs river relatively quicklyfrom the Pôle Viotte neighbourhood site. The weighted average distance to reachthe natural area of the river is 861 m, which is equivalent to the target value (VT).We note that the evaluation does not take into account the distance from the Doubsbanks of an urban walking area.
C7. Proximity of recreational facilities—C7.3. Average distance to a cultural centre
Most cultural facilities such as theatres, movie theatres, museums and exhibitionspaces, libraries, or other equivalents in Besançon are in the city centre. The projectguidelines do not specifically mention the integration of a cultural programme. In allcases, the weighted average distance is more than 900 m, which is below the limitvalue for the expected final situation.
C7. Proximity of recreational facilities—C7.4. Average distance to a sport centre
For this indicator, we note that outdoor play areas for children do not specificallyfall into this category, nor for small private sports facilities (training rooms, studios,fitness clubs, etc.). Likewise, the swimming pool in building D (retirement home),

10.2 Detailed Monitoring Results 175
which will be open to the public at certain times, is not taken into account either. Forthe expected final situation, we consider the Denfert-Rochereau gymnasium, whichis the closest sports centre to the site. We measure the weighted average distance at890 m, which places the indicator just above the limit value (VL).
10.2.1.3 Economic Impact
C8. Population—C8.1. Net population density
The city of Besançon has a territory of 6,505 ha, of which 2,324 ha are green spaces(forests, parks, and natural areas). For this indicator, we estimate the entire city’s netpopulation density at 28.1 inhabitants per hectare (inhabs/ha) for the initial situationand 27.7 inhabs/ha for the current situation (Insee 2020a). For the expected finalsituation, an annual average population increase of 0.32% is forecast until 2025.This makes it possible to estimate the entire city’s net population density at 28.5inhabs/ha.
Following the indicator’s logic, the brownfield’s entire area is considered for thedensity calculation for the initial, current, and expected final situations. As alreadymentioned, the site was uninhabited during the initial and current situations, whichin these two cases corresponds to an assessment below the limit value (VL).
The Pôle Viotte project development principles are to make continuity with thecity by creating a new lively, calm, and peaceful neighbourhood estimated at 268housing units, which can eventually accommodate 575 inhabitants. This is madepossible by creating favourable conditions, such as a strong presence of nature. Itallows a greater density than that corresponding to the city average in the metropoliscentre. Thus, for the expected final situation, the population density is estimated at52.3 inhabs/ha. This result is above the target value (VT), set at 42.8 inhabs/ha, whichis one-and-a-half times the metropolitan area’s net population density.
C9. Employment—C9.1. Net employment density
The calculation for this indicator is similar to that for C8.1 Net population density.For this indicator, we estimate the employment density of the entire city at 17.1jobs per hectare (jobs/ha) for the initial situation (2007 statistics) and 16.7 jobs/hacurrently (Insee 2020a). Regarding the evolution of employment, it is hard to makepredictions. The statistics institute expects an average annual population increaseof 0.32% until 2025. We use the same rate to estimate the employment density forthe expected final situation, which gives 17.2 jobs/ha. It is a balance between theexpectations of a late retirement of the older working group and a lower entry ofyoung working people into the job market.
Following the indicator’s logic, the brownfield’s entire area is considered forthe initial, current, and expected final situations. Thus, for the initial and currentsituation, the net employment density mainly takes into account the SNCF station,

176 10 Application to a Case Study
which provides several jobs.1 For the initial situation, few activities on the site provideemployment related to the company. We assume for the current situation that thesejobs are relocated to the operating portion of the site (multimodal hub). Despite agenerally degraded condition, the site currently provides 13.6 jobs/ha, which remainsbelow the limit value (VL).
Initiated as a veritable dynamic centre to bring together various governmentdepartments under one roof, the tertiary centre plans to accommodate nearly 1,000agents (state and regional services). If we estimate 1 job/50 m2 for the rest of thespaces provided for local services and shops, we already know that the Pôle Viotteneighbourhood will reach around 1,075 jobs. This corresponds to an employmentdensity of 98 jobs/ha, which is above the best practice value (VB) for the expectedfinal situation.
C10. Local economy—C10.1. Proportion of work carried out by local companies
We should first note for this indicator the systematic absence of a value for the initialsituation. In fact, the said work begins in principle with the realization of the project.
The current situation first takes into account the work for the multi-modal hub,completed in 2014. For this first phase of development, the project management wasprovided by the SNCF, which concluded work contracts according to its procedures.All of the companies selected were local. For buildings A and B—as a reminderunder the contracting authority of the local semi-public company SEDIA—the lawon public contracts does not allow the setting of objectives as to the proportionof the work to be carried out by a local company. Nevertheless, this proportion alsoamounts to thewhole. The current situation is, therefore, evaluated at the best practicevalue (VB). The same evaluation goes for the expected final situation, although theproportion may be less because the other buildings will be under the contractingauthority of private developers.
10.2.2 Checklist—Project Indicators
For these indicators, we evaluate the objective and the expected final situation,together with the current situation, namely the design, construction, and operatingphases. This allows us to monitor the regeneration project in detail (see Figs. 10.13,10.14, and 10.15).
The evaluation of the initial objective takes its data from the document providedby the city of Besançon’s projects and planning department (project guidelines,masterplan, etc.) (Ville de Besançon 2018).
When it is relevant, the operating phase evaluation relates mainly to the multi-modal hub sector (first phase of development). The construction phase evaluation
1 The SNCF does not wish to disclose the number of jobs on-site. Thus, we hypothesize this numberby extrapolating from current parking needs (150 spaces).

10.2 Detailed Monitoring Results 177
VL
VA
VT
VB
initialobjective situation
current situation
op.Phase
const.Phase
designPhase
≈0
P2.2 non-renewable energy [kWh/m2GFAa]
<40<40 <40 <40
50
45
40
VL
VA
VT
VB
initialobjective situation
current situation
op.Phase
const.Phase
designPhase
1.381.1
1.7
0.25
1.5
0.5
1.0
1.5
2.0
VL
VA
VT
VB
initialobjective situation
current situation
op.Phase
const.Phase
designPhase
51 5155
39
26
P4.1 green surfaces [%]
20
30
40
50
VL
VA
VT
VB
initialobjective situation
current situation
op.Phase
const.Phase
designPhase
51 5155
39
26
20
30
40
50
P4.2 ecosystems [qual.]
VL
VA
VT
VB
initialobjective situation
current situation
op.Phase
const.Phase
designPhase
Fig. 10.13 Evolution displays for the project indicator—environmental balance
corresponds to the tertiary centre (buildings A, B, and the underground parking—southern sector). The elements evaluated for the design phase correspond to all theother buildings and planned arrangements described in the project guidelines, mainlythe northern sector.
The expected final situation is, at this stage, extrapolated from the objective andthe construction phase.
Even if the proximity of SNCF railway lines immediately raises the questionof exposure to non-ionizing radiation, the indicator P5.4 Degree of electrosmog isconsidered irrelevant for the Viotte neighbourhood, since the responsibility restssolely with the SNCF. An ANSES report mentions that the SNCF has, for 15 years,carried out various series of measurements on station platforms and in the perimeter

178 10 Application to a Case Study
VL
VA
VT
VB
initialobjective situation
current situation
op.Phase
const.Phase
designPhase
40
30
20
10
70119
24
P5.1 nbr overheating hours [h]
VL
VA
VT
VB
initialobjective situation
current situation
P5.2 interior noise level [dBA ]
35
30
25
20
±35 ±35±35 ±35
op.Phase
const.Phase
designPhase
VL
VA
VT
VB
initialobjective situation
current situation
op.Phase
const.Phase
designPhase
717071
P5.3 spatial daylight autonomy [%]
50
55
65
75
VL
VA
VT
VB
initialobjective situation
current situation
op.Phase
const.Phase
designPhase
P5.5 individualization of housing [qual.]
VL
VA
VT
VB
initialobjective situation
current situation
op.Phase
const.Phase
designPhase
P5.6 outdoor spaces [qual.]
VL
VA
VT
VB
initialobjective situation
current situation
op.Phase
const.Phase
designPhase
P6.1 degree of security [qual.]
VL
VA
VT
VB
initialobjective situation
current situation
op.Phase
const.Phase
designPhase
P7.1 heritage [qual.]
VL
VA
VT
VB
initialobjective situation
current situation
op.Phase
const.Phase
designPhase
P8.1 functional mix [qual.]
P8.2 social diversity [qual.]
VL
VA
VT
VB
initialobjective situation
current situation
op.Phase
const.Phase
designPhase
P8.3 universal access [qual.]
VL
VA
VT
VB
initialobjective situation
current situation
op.Phase
const.Phase
designPhase
Fig. 10.14 Evolution displays for the project indicator—sociocultural quality
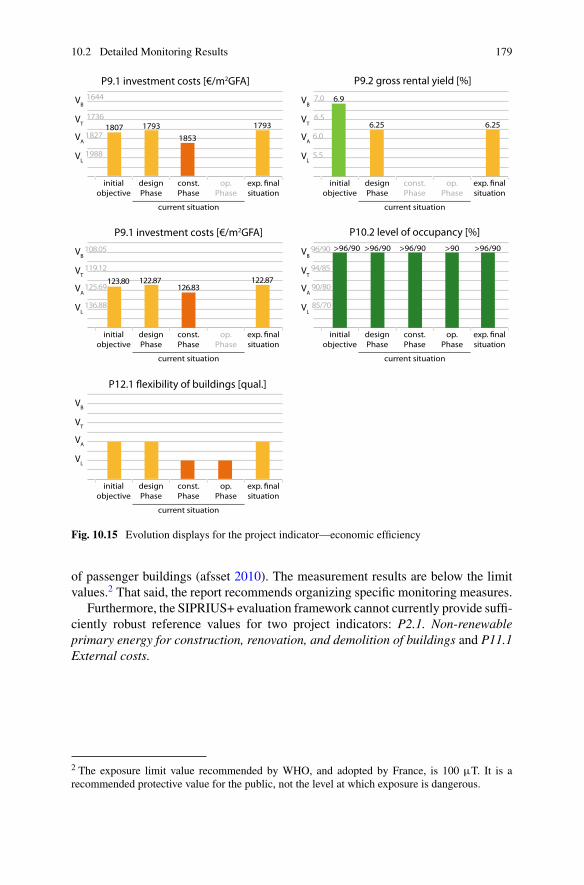
10.2 Detailed Monitoring Results 179
VL
VA
VT
VB
initialobjective situation
current situation
op.Phase
const.Phase
designPhase
P10.2 level of occupancy [%]
85/70
90/80
94/85
96/90 >96/90 >96/90 >96/90 >96/90>90
VL
VA
VT
VB
initialobjective situation
current situation
op.Phase
const.Phase
designPhase
6.25 6.25
6.9
P9.2 gross rental yield [%]
5.5
6.0
6.5
7.0
VL
VA
VT
VB
initialobjective situation
current situation
op.Phase
const.Phase
designPhase
1807 17931853
1793
1988
1827
1736
1644
P9.1 investment costs [€/m2GFA]
VL
VA
VT
VB
initialobjective situation
current situation
op.Phase
const.Phase
designPhase
123.80 122.87126.83
122.87
136.88
125.69
119.12
108.05
P9.1 investment costs [€/m2GFA]
VL
VA
VT
VB
initialobjective situation
current situation
op.Phase
const.Phase
designPhase
Fig. 10.15 Evolution displays for the project indicator—economic efficiency
of passenger buildings (afsset 2010). The measurement results are below the limitvalues.2 That said, the report recommends organizing specific monitoring measures.
Furthermore, the SIPRIUS+ evaluation framework cannot currently provide suffi-ciently robust reference values for two project indicators: P2.1. Non-renewableprimary energy for construction, renovation, and demolition of buildings and P11.1External costs.
2 The exposure limit value recommended by WHO, and adopted by France, is 100 µT. It is arecommended protective value for the public, not the level at which exposure is dangerous.

180 10 Application to a Case Study
10.2.2.1 Environmental Balance
P1. Land—P1.1. Floor area ratio
Like most urban brownfield regeneration projects, the new Viotte neighbourhoodproject allows the densification of a city sector with loose built fabric. For the floorarea ratio (FAR) indicator calculation, the portion of the brownfield site taken intoconsideration corresponds to the perimeter of the second phase of development, i.e.,3.1 ha.
For the initial objective, we consider a programme of 42,712 m2 of floor areaplanned for the northern and southern sectors. The FAR is 1.38, which is equivalentto the average value (VA). It is interesting to mention that the FAR is around 0.25for this portion of the site in its brownfield state. For the expected final situation, weconsider an increase in the planned square meters to 46,535m2. The FAR is therefore1.50, which is equivalent to the target value (VT).
For the current situation, taking the same data, the design phase (northern sector)plans 10,530 m2 of floor area, whereas the construction phase (southern sector)provides for 36,005m2 of floor area. Reported to their respective sectors, this suggeststhat the average value (VA) and the target value (VT) are 1.1 and1.7FAR, respectively.The multi-modal hub centre’s operating phase has a 0.25 FAR, below the limit value(VL). This is explained by the large logistical clearances specific to transportationmanagement.
P2. Energy—P2.2. Non-renewable energy for buildings in operation
The project guidelines state that the buildings will have to reach the RT2012 normminus 20%, corresponding to the Effinergie + label. The project also commits to aminimum of 40% renewable energy in the energy mix used to heat each building(biomass, solar, geothermal, etc.). Among the possibilities offered to achieve thisgoal, the developer proposes creating geothermal batteries in the underground level,allowing the immediate development of a naturally renewable potential present onthe site.
Our evaluation is equivalent to the target value (VT) for the initial objective andthe expected final situation. We give the same target value (VT) for the design andconstruction phases of the current situation. Regarding the operating phase, the SNCFdoes not wish to communicate information on the energy performance level of theirbuildings.
P3. Water—P3.1. Infiltration surface and stormwater use
The project plans to discharge only wastewater from the neighbourhood into thenetwork of the city of Besançon. While the site’s karstic terrain is conducive to rain-water infiltration, the project will also encourage on-site water reuse (interior—sani-tary/exterior—irrigation). Each plot will store its own rainwater, closest to buildings.The creation of green open conduits will make it possible to channel rainwater frompublic spaces to two retention and infiltration basins in green areas to the neighbour-hood’s northern and southern sectors. The project will also seek to control the runoff

10.2 Detailed Monitoring Results 181
of surface water by limiting impermeable surfaces through careful management oftopography and slopes in the design of public spaces.
For the initial objective and the expected final situation, we estimate about 51%of the surface to be suitable for stormwater infiltration, without counting the greenroofs mentioned in the guidelines as a possibility. Some preliminary renderings andthe tertiary centre do, however, feature pitched roofs. We give the best practice value(VB) to these two situations.
For the current situation, taking the same data, the design phase (northern sector)offers about 55% of infiltration surfaces, whereas the construction phase (southernsector) provides 39% of infiltration surfaces, which correspond to the best practicevalue (VB) and the average value (VA), respectively. Finally, for the operating phase(multi-modal hub sector), we estimate that about 26% of the area is suitable forrainwater infiltration. The means used for the harvesting of rainwater and wastewaterare not known. We thus grant the limit value (VL).
P4. Biodiversity—P4.1. Green surfaces
The project guidelines describe the future Pôle Viotte as a natural neighbourhoodwhere vegetation is predominant. The intention is to create generous, open greenareas and to favour green roofs. The project also plans to install an urban greenhouse(building F). At this stage of the project, the green areas taken into account are thesame as the infiltration areas calculated for the previous indicator.
For the initial objective and the expected final situation, the project plans about51% of the area as green surfaces, which corresponds to the best practice value (VB)for both situations.
For the current situation, taking the same data, the design phase (northern sector)offers about 55% of green surfaces, whereas the construction phase (southern sector)provides 39% of green areas, which correspond to the best practice value (VB) andthe average value (VA), respectively. Finally, for the operating phase (multi-modalhub sector), we calculate about 26% developed as green surfaces, which correspondto the limit value (VL).
P4. Biodiversity—P4.2. Degree of ecosystem considerations
Reclaiming abandoned landscaped areas is one of the strong intentions of the PôleViotte neighbourhood. Hence, the project proposes a development principle empha-sizing the natural potential of the site, notably biodiversity. It includes continuouslandscaped public spaces to form a green network that fits with the city’s greatgreen belt logic (Parc des Glacis among others). In this sense, the project plans forsignificant embankments around the site to promote biodiversity development at theinterface of the surrounding neighbourhoods. Besides, the project provides for theconstruction of an urban greenhouse allowing social exchangeswithin the district andother ecological measures such as ponds or nest boxes. Note that the city of Besançonis very attached to the ecological management of green spaces, particularly via theEcojardin label.
These intentions allow for now to evaluate the initial objective and the expectedfinal situation at the best practice value (VB). Likewise, the best practice value (VB)

182 10 Application to a Case Study
applies to the design and construction phases of the current situation. Regarding theoperating situation, the interventions in the northern part (the belvedere) receive theaverage value (VA).
10.2.2.2 Sociocultural Quality
P5. Well-being—P5.1. Annual hours of overheating
The initial project guidelines make no mention of measures taken to ensure summercomfort. The initial objective is, therefore, not evaluated for this indicator. To evaluatethe expected final situation and the current situation, we performed a numericalsimulation, allowing us to estimate the annual number of overheating hours or hoursduring which the interior temperature of the buildings is above 28 °C. To do this, weproduced a 3D model representing the volumes of the Pôle Viotte neighbourhood’sbuildings, excluding the urban greenhouse, building F.3 We obtained in this way thenumber of overheating hours for each building. It was then extrapolated in proportionto the gross floor area of the entire neighbourhood.
On this basis, we estimated the annual number of hours exceeding 28 °C at 70for the entire neighbourhood, which is below the limit value (VL) for the expectedfinal situation. For the construction phase, we estimated the annual number of hoursexceeding 28 °C at 119 h for buildings A and B, which is also below the limit value(VL). We noted that the south orientation, the windows of the two buildings, andmainly the internal gains of buildings dedicated to activities influenced overheating.Evaluating this indicator using digital simulations helps identify a risk to be verifiedonce the buildings are operational. For the design phase (buildings C to L), weestimate that annually 24 hwill be exceeding 28 °C,which corresponds to the averagevalue (VA). We explain this difference in the results mostly by the building type, i.e.,housing. It appears that climatic changes, the continental climate condition in theFranche-Comté region, associated with the increasing thermal performances of newbuildings, can create overheating pathologies within the new neighbourhood. Theguidelines mention thus that the question of thermal comfort should be treated withcare when designing new housing buildings.
Finally, the operating phase evaluation is not relevant: no requirement regardingoverheating hours applies for the station.
P5. Well-being—P5.2. Interior noise level
In the southern sector, the tertiary centre along the railway tracks is designed togenerate a deflecting effect. The intention is to reduce the negative impacts of noisepollution on residential buildings. In the northern sector, the residential buildingswill be set back from the railway tracks to minimize noise pollution.
3 The simulation was performed with Design Builder v5.0. (EnergyPlus). For the working assump-tions used to perform the simulation (U values of materials, proportion of glazed surfaces, sunprotection, etc.), see Laprise (2017).

10.2 Detailed Monitoring Results 183
Since the buildings are not built yet, we obviously could not give a precise eval-uation for the moment. Considering the quite simple measures described above andthe relatively high level of railway noise, the initial objective is estimated at the limitvalue (VL). For the moment, we gave the same value to the design and constructionphases and the expected final situation. The evaluation will evolve following theproject’s progress. Regarding the operating phase, it would be erroneous to evaluateit because of its eminently noisy function, especially since there is no housing andonly a few offices.
P5. Well-being—P5.3. Spatial daylight autonomy (sDA)
The spatial daylight autonomy (sDA) metric is the surface percentage of a given areathat reaches a minimum of 300 lx during a given number of hours per year (50% ofhours between 8 a.m. and 6 p.m.).
Since the project guidelines made no mention of the amount of natural lightdesired in the buildings, we did not evaluate the initial objective. We performeda numerical simulation to estimate the sDA of the expected final situation and thecurrent situation. To do this, we produced a 3Dmodel representing the volumes of thebuildings of the Pôle Viotte neighbourhood—except the urban greenhouse, buildingF—assuming that the central spaces of the floors would be occupied by functionsthat do not need natural light (circulation, technical rooms, etc.).4 We obtained inthis way a specific percentage for each building. It was then reported in proportionto the gross floor area of the entire neighbourhood.
Our simulations revealed that the autonomy in natural light for the entire sitewould reach 71% of the areas assigned to offices or housing. This estimation gavethe target value (VT) for the expected final situation. It generates similar results tothe design phase of the current situation. We can add that buildings A and B ofthe tertiary centre obtain 74% and 56%, respectively. Extrapolated to their grossfloor area yields an sDA of 70%, which corresponds to the target value (VT) forthe construction phase of the current situation. However, this good performance willprobably be affected by the use of blinds. An evaluation of the operating phase is notrelevant at the moment in the case of this indicator.
P5. Well-being—P5.5. Degree of individualization of housing
At this stage of the project, the guidelines provide little information on the degreeof housing individualization. Within the diversity of housing expected, modularityis desired and encouraged to adapt to inhabitants’ different life stages. Otherwise,we note that the buildings’ shape will follow the natural slope of the terrain. It willprovide distant views of the historic centre while minimizing views on the railwaytracks. Treatment of the boundaries between public and private spaces will be subjectto architectural prescriptions.
4 We performed the simulation with Diva for Rhino v4.0. For consistency, the fenestration is thesame as for P5.1 annual hours of overheating. For the other working assumptions made at this stageof the project, see Laprise (2017).

184 10 Application to a Case Study
Thanks to this information,we evaluated the initial objective and the expected finalsituation at an average value (VA). For the current situation, the design phase receivedthe same average value (VA). Buildings A and B provide 14 luxury apartments with aslight degree of individualization. Hence, the construction phase gets the limit value(VL). As regards the operating phase, here evaluation does not apply because thebuildings do not contain accommodation.
P5. Well-being—P5.6. Quality of outdoor spaces
The guidelines include the intention to pay particular attention to the design of thepublic spaces, which will be mainly free from cars. The project foresees a networkof landscaped pedestrian and cyclist paths. The latter will settle around central greenalleys in the northern as well as the southern sectors. The treatment of public spaceswill follow a logic of sobriety and optimization. A public urban greenhouse managedby the neighbourhood’s users will contribute to making the public spaces lively.
Based on these descriptions, we set the initial objective at the target value (VT).For now, we attributed the same value to the expected final situation and the designand construction phases of the current situation. Regarding the operating phase, thebelvedere in the northern sector and the landscaping in the southern sector improvedthe initial situation to a level that corresponds to the average value (VA).
P6. Security—P6.1. Degree of security
The guidelines recommend the implementation of passivemeasures to ensure generalsafety within the neighbourhood.More specifically, the project plans to secure publicoutdoor spaces through several means. It will promote pedestrian and cyclist pathsand mutualized parking to avoid cars on the neighbourhood’s roads and on-streetparking. Also, the mix of functions (offices, housing, and shops) combined with thequality of outdoor spaces will generate a neighbourhood that is “lively, calm, andpeaceful” for several hours of the day throughout the week.
These few elements allowed us to assign the average value (VA) to the initialobjective, to the expected final situation, and to the design phase of the current situa-tion. For the construction phase, security measures congruent with the requirementsof the state and regional services are put in place (e.g., video surveillance). Hence,the average value (VA) is also assigned.
The station and its surroundings are secured by standard measures for this typeof building (security agents, adequate public lighting, surveillance cameras, etc.).The multi-modal hub’s facilities also contribute to clarifying motorized and non-motorized traffic on-site. We evaluated the operating phase at the target value (VT).
P7. Heritage—P7.1. Degree of enhancement of existing heritage
None of the brownfield buildings is officially listed as historic monuments. However,some of them attest to the old railway activity of the site, which has marked theBesançon urban space since the mid-nineteenth century (military platform to thenorth, Sernam Hall to the south). The Pôle Viotte neighbourhood project does notpreserve any specific buildings. However, the tertiary centre’s principal building(building A) will faithfully evoke Sernam Hall’s morphology through its location
10.2 Detailed Monitoring Results 185
along the railway tracks and its size. Moreover, the construction principle will evokethe original wooden frame of the Sernam Hall. The tinted tiles of the pitched roof area reinterpretation of the “Blue City”, which highlights the stone of Chailluz, typicalof Besançon.
Based on these considerations, we give an average value (VA) to the initial objec-tive, the expected final situation, and the construction phase of the current situation.The design and operating phases are not affected by heritage considerations. Wenote the presence of a significant Gallo-Roman archaeological heritage site, mainlyin the northern sector, that will be investigated before construction begins. But theseaspects are not taken into account by this indicator.
P8. Diversity—P8.1. Degree of functional mix
By developing a mixed-use district near the station, the Pôle Viotte neighbourhoodproject, with the various urban functions offered, strengthens the role of the extendedurban city centre. In other words, functional diversity is at the centre of projectplanning. By bringing together several complementary functions, it transforms themonofunctional past of the site dedicated to rail activities.
From the initial objective comprising a 54% ratio activities/housing—best prac-tice value (VB)—the project evolved to a 66% ratio activities/housing for the expectedfinal situation—target value (VT). For the construction phase of the current situa-tion (southern sector), we estimated the ratio of activities/housing at 77%, whichcorresponds to the average value (VA). On the contrary, for the design phase of thecurrent situation (northern sector), the ratio of housing/activities was estimated at70%, which also corresponds to the average value (VA). The operating phase, mainlyoccupied by the multi-modal hub activities, corresponds for its part to the limit value(VL).
P8. Diversity—P8.2. Potential of social diversity
ThePôleViotte neighbourhood aims at a strong integration of social diversity. Indeed,among the 230 housing units planned, 20% will be public housing (including 10%social housing) and 15% low-cost housing, reserved for first-time buyers. Addi-tionally, the guidelines recommend an extended typology of housing. That meansspacious apartments intended for families and others adapted to inter-generationalneeds. Building D will accommodate a retirement home. Some self-promotionopportunities will also be possible.
This information is sufficient to assign the best practice value (VB) to the initialobjective, the expected final situation, and the design phase of the current situation.As for the construction phase, buildings A and B are making way for 14 luxuryapartments, which limits the potential for social diversity. Hence, we temporarilyevaluate this phase at the limit value (VL). Evaluation of the operating phase is notrelevant for the moment.
P8. Diversity—P8.3. Degree of universal access
Because of the steep slope of the site (more than 17 m difference between the northand south sectors), it is relevant to consider accessibility for users with impaired

186 10 Application to a Case Study
mobility throughout the various exterior developments. Therefore, gently slopingfacilities and lifts are planned where necessary to allow universal access to the wholesite. However, the guidelines do notmention particularmeasures regarding the designof the different buildings.
The average value (VA) is given to the initial objective, the expected final situation,as well as to the construction and design phases of the current situation. For theoperating phase, all the multi-modal hub’s facilities are accessible to users withreduced mobility, including the underpass, which constitutes a clear improvement interms of freedomofmovement for these users. Here, the target value (VT) is assigned.
10.2.2.3 Economic Efficiency
P9. Direct costs—P9.1. Investment costs
To evaluate this indicator, we need to know the average construction cost of build-ings in the Besançon area. However, the most reliable data available is from theconstruction cost index for residential buildings calculated by the INSEE. The latteris estimated at 1,765 e/m2 for the third semester of 2020 (Insee 2020b). We alsoneeded to know the average constructible land price within a radius of 5 km fromBesançon city centre, which is 93e/m2 (Terrain-construction.com2016, 2020).Withan average floor area ratio of 1.5, we obtained for this indicator an investment costof 1,827 e/m2, which was the reference for the average value.
At this stage of the project, when work with the various public and private devel-opers is not yet underway, it is hard to precisely evaluate this indicator for the entireneighbourhood. Besides, the guidelines do not set any formal objective in this area.The gross amount communicated on land acquisitions (1.3 M e, excl. tax) tells us,at least, about land price, which is equivalent to 42 e/m2. Hence, for the initialobjective, we estimated the investment cost at 1,807 e/m2, i.e., the addition of theaverage construction cost and the actual cost of the land (floor area ratio of 1.38),which corresponds to the average value (VA).
For the construction phase of the current situation (the tertiary centre, buildingsA and B), it is estimated that the construction costs will be around 50 M e (privateinvestment). With a floor area of 27,458 m2, this equates to a cost of 1,828 e/m2.When we add the actual cost of the land (floor area ratio of 1.7), we obtain aninvestment cost of 1,853 e/m2, which corresponds to the limit value (VL). However,this is only a partial view of the entire Pôle Viotte neighbourhood project; the tertiarycentre (two office buildings with 14 luxury apartments) is designed as signaturebuildings.
Because the other constructionswill bemore standard ones, the costs will likely belower. For the moment, therefore, we situate the design phase of the current situationas well as the expected final situation at around 1,793 e/m2, i.e., the addition ofthe average construction cost and the cost of the land (floor area ratio of 1.5). Itcorresponds to the average value (VA).
Regarding the operating phase of the current situation, we know that the multi-modal hub represented an investment of 15.3 M e excl. tax. However, because

10.2 Detailed Monitoring Results 187
we cannot rely on robust comparable costs to establish the reference values, theevaluation of this phase is currently irrelevant.
P9. Direct costs—P9.2. Gross rental yield
For this indicator, we did not consider data concerning offices and commercialpremises. Hence, at this stage of the project, we made a theoretical calculation ofthis indicator based on the spaces allocated to housing, which corresponds to agross floor area of 15,399 m2. As a reminder, we previously estimated the construc-tion cost at 1,827 e/m2. A minimum income of around 28 M e is thus required. InBesançon, around the PôleViotte neighbourhood, the averagemonthly rent fluctuatesbetween 12.30 e/m2 (Battant district), 11.80 e/m2 (St-Claude district), and 11.50e/m2 (Charpais district) (SeLoger.com 2020). We considered an average monthlyrent of 11.90 e/m2. Besançon has rental profitability that oscillates between 4.07and 7.97% (OuInvestir 2019). Thus, we considered an average gross rental yield at6.02% for the reference value.
According to the preliminary calculation of the initial objective, the gross rentalyield was set at 6.9%, i.e., the target value (VT). The construction phase of thecurrent situation is not relevant to this indicator. 14 luxury apartments (15% abovethe price market) are offered for sale. The design phase of the current situation andthe expected final situation follows the same calculation. We estimated the net livingarea at 12,319 m2 or 20% less than the gross floor area. Thus, we estimated a grossrental yield at 6.25%, which corresponds to the average value (VA).
Concerning the operating phase, the evaluation is not relevant because the multi-modal hub does not include housing.
P10. Indirect costs—P10.1. Annual operating costs
Weestimated the heat and energy consumption costs according to the results obtainedfor indicator P2.2 and the investments and maintenance costs of buildings accordingto the results obtained for indicator P9.1. Together, these results determine an indica-tion of the annual operating costs.5 For the investment costs, we assumed an interestrate on the capital of 2.0% amortized over 25 years, i.e., a coefficient of 0.051 forthe calculation of annuities. For maintenance costs, we used an average rate of 1.5%(the annuity by the amortization period) (SIA 2004). For heat costs, the assumptionused to establish the average reference cost was heat production running 100% onnatural gas, costing 8.43 cents/kWh (Le médiateur national de l’énergie 2020). Theprice change takes into account an average increase of 5% over the next 25 years, i.e.,a coefficient of 1.78 (Müller and Walter 1994). Finally, the average reference costfor electricity in Besançon is 14.25 cents/kWh (Le médiateur national de l’énergie2020). The price change takes into account an average increase of 3% over the next25 years, i.e., a coefficient of 1.39 (Müller and Walter 1994).
For the initial objective, the expected final situation as well as the design phaseof the current situation, the same assumptions applied for the costs of investment,
5 We based the calculation on the 2016 reference values, the launch year of the second phase of theproject following the architecture competition.

188 10 Application to a Case Study
maintenance, heating, and electricity, even if other sources of energy supply areconsidered (such as geothermal).We know that the investment costs are equivalent to1,807 e/m2, 1,793 e/m2, and 1,793 e/m2, respectively. For the buildings’ operationprimary energy, we estimated performance to be equivalent to RT2012 −20%. Thesum of the various operating costs amounts to 123.80, 122.87, and 122.87e/m2 GFAannually, which is below the average value (VA).
For the construction phase of the current situation (the tertiary centre, buildingsA and B), we have estimated an investment cost of 1,827e/m2. Similarly, we expectan RT2012−20% energy performance. The calculation for operating costs turns outto be 126.83 e/m2 GFA annually, which corresponds to the limit value (VL).
The evaluation of the operating phase is not relevant because of the complexityand specificity of the multi-modal hub’s installations.
P10. Indirect costs—P10.2. Level of occupancy
Aswith the previous economic indicators, we based the evaluation of this indicator onestimations. Indeed, the project sets no official objective for this indicator. That said,interviews with the project team revealed that strong demand for office rental exists,which would already exceed the current supply planned by the project. Furthermore,we know that the project carried out conclusive pre-marketing tests based on urbanplanning studies and the real estate market reality (unfortunately not disclosed).Finally, built to accommodate the state and regional agents of Besançon, the tertiarycentre will be fully occupied.
Based on this information, we gave the initial objective and the expected finalsituation the best practice value (VB). We assigned the same value for the momentto the construction and design phases of the current situation. For the operatingphase, we know that the multi-modal hub rental spaces are all occupied and that theoccupation intensity of the SNCF offices increased due to the restructuring on-site.The best practice value (VB) was therefore also attributed.
P12. Flexibility—P12.1. Degree of building flexibility
At this stage of the project, it is hard to judge the concrete means implemented topromote flexibility. Only the intention to “encourage modular housing to cope withthe different life stages of the inhabitants” is mentioned in the project guidelines.
Given this meagre information, we considered the degree of building flexibilityfor the initial objective equivalent to the average value (VA). By extrapolation, weassigned the same value to the expected final situation and the design phase of thecurrent situation. It is interesting to note that the car park is designedwith reversibilitymeasures to eventually minimize its capacity and respond to new uses for this sectorideally served by public transport. However, the tertiary centre (buildings A andB) contains no specific flexibility measures. Thus, we evaluated the constructionphase of the current situation at the limit value (VL). For the operating phase, whichmainly concerns the station, the evaluation is also at the limit value (VL), becausethe building typology with construction features specific to its function leaves littleroom for flexibility.

10.2 Detailed Monitoring Results 189
10.2.3 Checklist—Governance Indicators
For these indicators, we evaluate three situations: the initial objective, the currentsituation, and the expected final situation (see Figs. 10.16 and 10.17). Althoughthe project guidelines set no clear objective for some indicators, observation of theproject progress makes an evaluation possible. It incidentally reveals the risks oropportunities associated with a given indicator. As a reminder, we divide governanceindicators into two dimensions: management and process.While the indicators underthe process dimensionmay extend to the entire regeneration project, indicators underthe management dimension often refer to a specific project phase and may be limitedin timespan.
G4.1 commissioning [qual.]
G3.2 disturbances [qual.]G3.1 construction wastes [qual.]G2.1 transitional occupation [qual.]
G1.3 residual contamination [qual.]G1.2 remediation [qual.]G1.1 project footprint [qual.]
VL
VA
VT
VB
initialobjective situation
current situation
VL
VA
VT
VB
initialobjective situation
current situation
VL
VA
VT
VB
initialobjective situation
current situation
VL
VA
VT
VB
initialobjective situation
current situation
VL
VA
VT
VB
initialobjective situation
current situation
VL
VA
VT
VB
initialobjective situation
current situation
VL
VA
VT
VB
initialobjective situation
current situation
Fig. 10.16 Evolution displays for the governance indicators—management

190 10 Application to a Case Study
G8.1 evaluation process [qual.]
G7.1 access to information [qual.]G6.1 collaboration [qual.]G5.1 participation [qual.]
VL
VA
VT
VB
initialobjective situation
current situation
VL
VA
VT
VB
initialobjective situation
current situation
VL
VA
VT
VB
initialobjective situation
current situation
VL
VA
VT
VB
initialobjective situation
current situation
Fig. 10.17 Evolution displays for the governance indicators—process
10.2.3.1 Management
G1. Remediation—G1.1. Logic of project footprint
The environmental impact assessment, which includes an investigation of healthrisk, revealed some soil pollution traces. For the southern sector, moderate pollutiongradients were measured (3,200 m3), mainly coming from old landfills linked to thenineteenth-century railway activities and located on the first layers of soil near theSernam Hall. The organization of the public spaces and the programming of urbanfunctions—notably the parking and building A location—deal with this pollutionpresence, which is compatible with the project. Thus, the project provides for anoptimized and economic management plan for contaminated soil (excavation andbackfill) to limit the risks. For the northern part, the investigation reveals a smallamount of contaminated soil (80 m3) that will be evacuated to a treatment centre. Inany case, the masterplan is flexible enough to evolve based on the unlikely discoveryof soil pollution. Based on this information, we evaluate the initial objective, thecurrent situation, and the expected final situation at the best practice value (VB).
G1. Remediation—G1.2. Degree of site remediation
As mentioned in the evaluation of the indicator G1.1, the brownfield site has 80 m3
of contaminated soil in the northern sector, which will be evacuated to a treatmentcentre, and 3,200 m3 of contaminated soil in the southern sector. The treatment ofthis latter pollution is to correlate with the use of the site. A pedestrian ramp tothe east of the site will use around 1,200 m3 of contaminated soil to consolidatethe foundations. The ramps will serve to connect the new neighbourhood with itssurrounding. The remaining contaminated soil (2,000 m3) will be confined inside a

10.2 Detailed Monitoring Results 191
geotextile membrane under the self-ventilated car park, which is used as a buffer.These ongoing remediationmeasuresmake it possible to evaluate the initial objective,the current situation, and the expected final situation at the average value (VA).
G1. Remediation—G1.3. Degree of residual contamination
For now, management of the residual contamination is limited to the obligation ofa mention in the deeds of sale to keep records. We give thus the limit value (VL) tothe current situation and expected final situation. No initial objective was set for thisindicator.
G2. Temporary use—G2.1. Transitional occupation initiatives
There were initially some activities related to SNCF jobs in the southern sector ofthe site, such as a canteen for employees’ children, an activity room, and a smalllibrary. The new neighbourhood project planned to combine these services withinnew programmes (e.g., a company restaurant could serve the canteen meals), or torelocate them within the surroundings of the site. We evaluated the initial objectiveat the target value (VT). The project evolved slightly differently along with the initialobjective. Only the SNCF library is reconstituted in buildingA. The previous canteenusers have contracted with nearby company restaurants, although an inter-agencyrestaurant is also available in building A. We evaluate the current situation and theexpected final situation at the target value (VT).
G3. Construction site—G3.1. Management of construction waste
The guidelinesmention the implementation of a “Green Charter” for the constructionsite annexed to theworks contract. It aims at limiting the carbon footprint of theworks.It includes, notably, recommendations on waste sorting, a limitation on outsourcedbackfill, and on-site reuse of material from excavation and demolition. The “GreenCharter” also requires a certain percentage of waste recovery (sorting, recycling,reuse, and reduction). Moreover, a “Green Charter” manager is appointed before theconstruction works begin to ensure its application by all companies and workers onthe site. Currently, no detailed data as to the share ofwaste reused are available yet.Weknow that various public landscaping and installations include a certain percentage ofrecovered waste. Since buildings are being demolished, the products resulting fromthe demolition work are reused in road fill. Besides the on-site remediation measures(see indicator G1.2), the making of public spaces will reuse 8,000 m3 of clean soilfrom the 17,000 m3 excavation material.
Based upon this information, we give the initial objective, the current situation,and the expected final situation the best practice value (VB).
G3. Construction site—G3.2. Management of construction disturbances
The neighbourhood site is surrounded to the north, south, and east by residentialareas. However, the steep slope between the site and the south area creates a buffer.In the west, the multi-modal hub is quite crowded in the daytime. This observationhighlights the importance of taking into account disturbances during the construction

192 10 Application to a Case Study
phase.However, no specificmention ismade to this effect in the guidelines, nor duringthe tertiary centre construction.
Given this lack of measures, we give the limit value (VL) to the initial objectiveand the current situation. By extrapolation, the expected final situation obtains thesame evaluation.
G4. Commissioning—G4.1. Commissioning plan for buildings
The new neighbourhood project provides for the establishment of workshops called“AteliersViotte”. Theworkshops aim to transmit and share the project’s spiritwith thedifferent building developers, including, notably, energy issues. The guidelines alsospecify that the “Ateliers Viotte” must integrate future building managers. Addition-ally, a prescription book for each building will make users aware of the issues linkedto climate change, mainly summer overheating management, as soon as they arrivein the neighbourhood. Finally, monitoring by an environmental expert and ex-postevaluation questionnaires will be put in place to take advantage of any performancegaps between the design and the construction of buildings and improving the projectalong the way.
These various measures allow us to evaluate the initial objective, the currentsituation, and the expected final situation at the best practice value (VB).
10.2.3.2 Process
G5. Participation—G5.1. Degree of participation of population
Since 2008, the city of Besançon has initiated consultation for the entire regenerationof the brownfield.6 The public consultation closed at the end of the neighbourhoodpre-operational studies, i.e., at the end of 2015. A series of more specific publicmeetings with various associations (surrounding neighbourhood, transport users,cyclists, etc.) are closely associated with the project throughout the different stages.The city of Besançon projects and planning department is available at any timeto collect requests for information and suggestions. Finally, the “Ateliers Viotte”provides the opportunity to exchange views with all stakeholders, including futuresite managers, and to take into account the practices of future end-users.
These elements lead our evaluation of the initial objective at the average value(VA). The current situation and the expected final situation follow this evaluation.
G6. Collaboration—G6.1. Degree of collaboration of professionals
Our evaluation of this indicator is also based on the workshop principle, the “AteliersViotte”. In addition to the city of Besançon and future users, as described above, the“Ateliers Viotte” involves the developer and the project team (urban project manage-ment) from the pre-operational studies phase. During the design phase, it is expectedthat the building projects proposed by the different developers will be optimized and
6 Complies with provisions L 300-2 of the Urban Planning Code (Code de l’urbanisme).

10.2 Detailed Monitoring Results 193
finalized within the framework of these workshops with the support of the consultantarchitect of the urban project management. The same will apply to the supervisionof construction work. These interactive workshops allow co-construction, that is tosay, a project that is negotiated and shared between all professionals while openinga permanent and effective dialogue between urban and built spaces. The “AteliersViotte” also aims to convey and share the project’s spirit with the different opera-tors, as recently experienced for the choice of buildings C, D, and E’s architects anddevelopers.
We set the initial objective at the best practice value (VB). The current situationand the expected final situation obtain the same evaluation.
G7. Information access—G7.1. Degree of access to information
According to the project guidelines, a dedicated website for the Pôle Viotte neigh-bourhood will be online with the first arrivals. A testimonial book retracing theentire development is being produced. The website will include an exchange plat-form between users, which will facilitate, among other things, the organization ofclient groups or local economy initiatives. However, the degree of access to infor-mation is currently limited to the few downloadable presentation documents on thecity of Besançon website.
In light of this information, we evaluate the initial objective and the expected finalsituation at the average value (VA) and the current situation at the limit value (VL).
G8. Evaluation—G8.1. Degree of integration of an evaluation process
The Pôle Viotte neighbourhood has initiated a certification process since 2014: theEcoQuartier Label. Currently, the project has the label for step 2 (four steps: design,construction, delivery, and post-occupation). The project guidelines mention thatall the commitments related to the EcoQuartier Label process are integrated intoa spreadsheet. The aim is to facilitate their monitoring, like a sustainable develop-ment dashboard. Annually, a global update on this dashboard is produced and avail-able to the various stakeholders upon request. Moreover, the guidelines prescribepost-occupancy performance monitoring of all buildings, performed through anonline questionnaire available on the neighbourhood’s website. With the intent ofproviding feedback and continuous improvement opportunities, private developerswill be required to communicate the results.
For these reasons, we evaluate the initial objective and the expected final situationat the best practice value (VB). Because all these measures are not yet in place, weevaluate the current situation at the average value (VA).
10.3 Overall Monitoring Results
We have just carried out the one-by-one monitoring of the indicators related to thecontext, the project, and the governance of the Pôle Viotte neighbourhood project

194 10 Application to a Case Study
using the SIPRIUS+ monitoring tool, which represents a total of 52 out of 57 indi-cators. One indicator was deemed irrelevant (P5.4 Degree of electrosmog) and fourindicators were not evaluated due to the current lack of robust reference values (C2.2.Global warming potential (GWP), C2.3. Acidification potential (AP), P2.1. Non-renewable primary energy for construction, renovation and demolition of buildings,and P11.1 External costs).
We argue that, from the perspective of integrating sustainability issues into thedynamics of the urban brownfield regeneration project, communicating the overallresults of the monitoring is just as important as the monitoring itself. The latter is thesource of iterations aimed at continuous improvement of the project. In that regard,SIPRIUS+ allows the different actors involved in the project to visualize the overallresults in several forms. As a rule, the tool is not designed to compare projects indifferent locations, nor to rate projects, as some labels do. Nevertheless, as can beseen in Figs. 10.18, 10.19, and 10.20, the Chart displaysmake visible and comparablethe overall monitoring results for specific stages of the project. Figure 10.21 providesa synoptic view of all the indicators for the expected final situation according to theperformance achieved at the moment of the evaluation.
These visualizations of the results allow the actorwho consults them tomake somegeneral observations. First, for the context indicators, the expected final situation isgenerally better than the initial and current situations. The comparison between thesedifferent situations allows assessing the efforts undertaken by the brownfield regen-eration project in terms of sustainability issues improvement. For project indicators,the initial objective and the expected final situation are very similar. Only two indica-tors get different results (P1.1 Floor area ratio and P8.1 Degree of functional mix).This fact can be explained by the progress level of the project; the expected finalsituation is still a transposition of the initial objective. However, variations appear inthe evaluation of the current situation (especially the construction phase). It can bean opportunity to pay attention to certain aspects that could potentially affect projectperformances. For governance indicators, the initial objective and the expected finalsituation are also similar. However, the current situation indicates possible trends thatthe project may take. Finally, through the Evolution display (Fig. 10.21), we note ingeneral that the evaluation results of the expected final situation are quite favourable,with more than half being above the target value (VT). However, it is interestingto underline that the environmental dimension is more efficient than, in particular,the social dimension. As mentioned in Chap. 5, this is typical of new sustainableneighbourhood projects, where a focus is often on energy or ecological aspects.
By looking more closely, the three Chart display comparison makes it possibleto identify four critical aspects of the project that deserve special attention from theproject stakeholders. This is where SIPRIUS+ can best play its decision-support role.
• The first is to identify the indicators that are not taken into account by the brown-field regeneration project and, ideally, integrate them into new objectives. In thecase of the Pôle Viotte neighbourhood, little consideration is given to P5. Well-being—P5.1. Annual hours of overheating and P5.3. Spatial daylight autonomy(sDA).

10.3 Overall Monitoring Results 195
Fig. 10.18 Overall results of the initial situation (context indicators) and the initial objective (projectindicators and governance indicators)
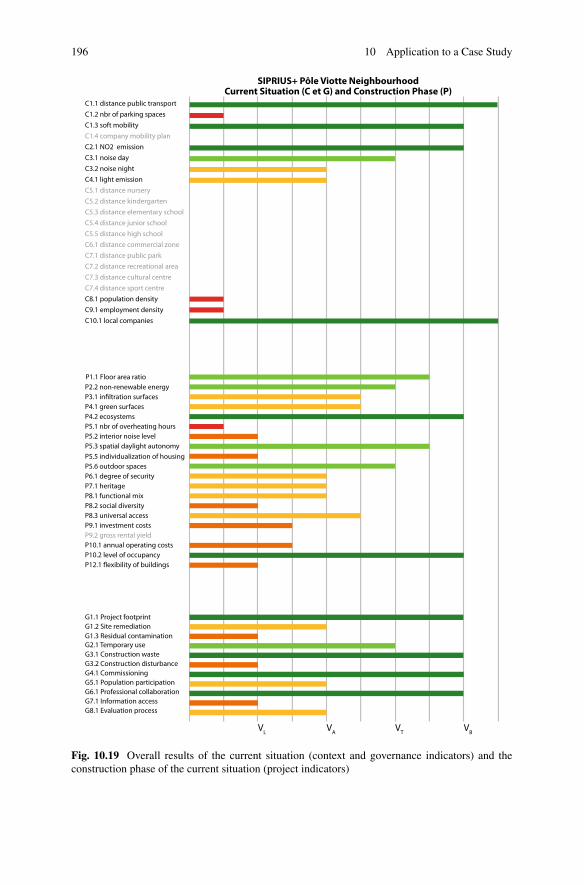
196 10 Application to a Case Study
VL
VA
VT
VB
SIPRIUS+ Pôle Viotte NeighbourhoodCurrent Situation (C et G) and Construction Phase (P)
C3.1 noise day
C1.2 nbr of parking spaces
C1.4 company mobility plan
C1.3 soft mobility
C2.1 NO2 emission
C3.2 noise night
C4.1 light emission
C5.1 distance nursery
C5.2 distance kindergarten
C5.3 distance elementary school
C1.1 distance public transport
C5.4 distance junior school
C5.5 distance high school
C6.1 distance commercial zone
C7.1 distance public park
C7.2 distance recreational area
C7.3 distance cultural centre
C7.4 distance sport centre
C8.1 population density
C9.1 employment density
C10.1 local companies
P5.5 individualization of housing
P2.2 non-renewable energy
P4.1 green surfacesP4.2 ecosystems
P5.2 interior noise levelP5.3 spatial daylight autonomy
P5.6 outdoor spacesP6.1 degree of securityP7.1 heritageP8.1 functional mixP8.2 social diversityP8.3 universal accessP9.1 investment costsP9.2 gross rental yieldP10.1 annual operating costsP10.2 level of occupancy
G1.3 Residual contamination
G1.1 Project footprintG1.2 Site remediation
G2.1 Temporary useG3.1 Construction wasteG3.2 Construction disturbanceG4.1 CommissioningG5.1 Population participationG6.1 Professional collaborationG7.1 Information accessG8.1 Evaluation process
P5.1 nbr of overheating hours
P1.1 Floor area ratio
Fig. 10.19 Overall results of the current situation (context and governance indicators) and theconstruction phase of the current situation (project indicators)

10.3 Overall Monitoring Results 197
VL VA VT VB
SIPRIUS+ Pôle Viotte neighbourhood
C3.1 Noise - day
C1.2 Nbr of parking spaces
C1.4 Company mobility planC1.3 Soft mobility network
C2.1 NO2 emission
C3.2 Noise - nightC4.1 Prevention of light emissionC5.1 Distance nurseryC5.2 Distance kindergartenC5.3 Distance elementary school
C1.1 Quality of public transport
C5.4 Distance middle schoolC5.5 Distance high schoolC6.1 Distance commercial zoneC7.1 Distance public parkC7.2 Distance green/natural areaC7.3 Distance cultural centerC7.4 Distance sport centerC8.1 Population densityC9.1 Employment densityC10.1 Local companies
P5.5 Individualization of housing
P2.2 Energies buildings operation
P4.1 Green surfacesP4.2 Ecosystems
P5.2 Noise - indoorP5.3 Spatial daylight autonomy
P5.6 Outdoor spaces
P1.1 Floor area ratio
P6.1 Degree of securityP7.1 Existing heritageP8.1 Functional mixP8.2 Social diversityP8.3 Universal accessP9.1 Investment costsP9.2 Gross rental yieldP10.1 Operating costsP10.2 Level of occupancy
G2.1 Temporary useG3.1 Construction wasteG3.2 Construction disturbanceG4.1 CommissioningG5.1 Population participationG6.1 Professional collaborationG7.1 Information accessG8.1 Evaluation process
P5.1 Overheating
G1.2 Site remediationG1.3 Residual contamination
G1.1 Project footprint
Fig. 10.20 Overall results of the expected final situation (context, project, and governanceindicators)

198 10 Application to a Case Study
greater than VL
greater than VA greater than VT greater than VB
2/21 12/912/712/212/1
02/802/1 02/502/502/1
31/431/2
11/511/111/211/3
4/8 3/81/8
02/402/702/402/302/2
7/13
5/522/52 25/9125/3125/31VIOTTE
Environment
Society
Economy
Context
Project
Governance
Fig. 10.21 Evolution display showing the distribution of all indicators’ performances based onthe values obtained for the expected final situation. The figure also shows the breakdown bysustainability dimension: environmental, sociocultural, and economic impact
• The second is to focus on the expected final situation results that would be belowthe limit value (VL), or in other words, a veto value. Indeed, two indicators ofthe Pôle Viotte neighbourhood project deserve to be improved: C7.3. Averagedistance to a cultural centre and P5.1. Annual hours of overheating.
• The third is to pay particular attention to the indicators whose expected finalsituation result is lower than the initial situation or the initial objective. For thePôle Viotte neighbourhood project, this is the case for indicator P8.1 Degree offunctional mix.
• Finally, stakeholders involved in the project can look for indicators whose perfor-mance could be improved, such as those evaluated at the limit value (VL). Asan example, indicatorG3. Construction site—G3.2. Management of constructiondisturbances could be better considered during the next upcoming work.
Essentially, taken together, the indicators embody different urban strategies usedby the brownfield regeneration project to promote the transition towardsmore sustain-able cities. The monitoring of sustainability—using evaluation of indicators andmanagement functionalities—makes it possible to transcribe these various urbanstrategies and to visualize their performance through time. With the monitoringresults and following the above considerations, SIPRIUS+ can support, in theirdecision-making, the stakeholders who are concerned about greater integration ofsustainability into their regeneration project.

10.4 Towards Integration of Sustainability Issues … 199
10.4 Towards Integration of Sustainability Issuesinto the Project Dynamics of a Neighbourhoodin Transition
Thesemonitoring results using SIPRIUS+ are, by definition, the portrait of a situationat a given moment. Hence, they are subject to change according to the evolution ofthe projects. In other words, the monitoring makes visible urban changes within theneighbourhood in transition. It provides useful information to integrate and pursuesustainability objectives throughout the regeneration process, thanks to global anddetailed results. It can be used to iteratively compare different options, especiallyduring the preliminary phases when the project is the most flexible and offers roomfor the integration of high-sustainability targets.
It is interesting to mention that the Pôle Viotte neighbourhood project is currentlysubject to considerable change that, unfortunately, couldnot be included in the presentmonitoring. Indeed, the development of the northern sector is on hold in the aftermathof the municipal team change after the election of 2019. Because the neighbourhoodproject is an important method of exploration to implement sustainable urbanisticand architectural solutions, the new political team wants to improve its sustainabilityobjectives (reduce built density to increase green spaces,make a car- and parking-freearea, etc.). In this case, the monitoring update promises to be interesting.
As a reminder, this monitoring was performed by the research team (LAST—EPFL) with the support of the case study’s project manager (Direction Urban-isme Projets et Planification, Grand Besançon Metropole). To verify the potentialof SIPRIUS+ as a support for the practical integration of sustainability in the PôleViotte neighbourhood project, we presented and discussed the previous monitoringresults with different stakeholders of the development team (Laprise et al. 2018).The stakeholders agreed that SIPRIUS+ could contribute to maintaining sustain-ability objectives over the long term, much like a dashboard. They also agreed thatSIPRIUS+ could be a relevant tool to build a shared vision on sustainability for theneighbourhood. In that sense, it could facilitate multi-disciplinary communicationabout this vision within the internal and external teams of the project. It could alsofacilitate communication with a broader audience, such as the population. However,divergences appeared among stakeholders about the level of information to communi-cate to the public. In the end, the stakeholders agreed that the monitoring provided bySIPRIUS+ could stimulate a willingness to improve and optimize the sustainabilityparameters of their project.
Ultimately, what emerges from these interactions is that, whereas the use of such atool would imply a change in the management of the projects, the evolutions to adoptto include this practice appear not only feasible but realistic and desired. In this sense,the operational monitoring tool is expected to contribute to decision-making by facil-itating unavoidable trade-offs in a multi-disciplinary manner, without giving ready-made solutions. However, at present, the monitoring tool is still not used regularly. Itcould be consulted on a yearly basis, for example, coincidingwith the annual reviews.In any case, concretizing a sustainability vision and maintaining the objectives willalways depend on the stakeholders’ motivation and genuine involvement.

200 10 Application to a Case Study
References
afsset A française de sécurité sanitaire de l’environnement et du travail (2010) Les extrême-ment basses fréquences. Effets sanitaires des champs électromagnétiques extrêmement bassesfréquences
Arep ville, Métra + Associés architectes, OZévert paysagistes et al (2016) Besançon Viotte - Eco-quartier de Viotte. Requalification urbaine et aménagement d’un éco-quartier autour du pôled’échanges de Viotte
Arep ville, OZévert paysagistes, Cabinet Merlin, BeA groupe pingat (2015) Besançon Viotte -Eco-quartier de Viotte. Requalification urbaine et aménagement d’un éco-quartier autour du pôled’échanges de Viotte
ATMO BFC (2020) L’air en Bourgogne Franche-Comté. https://www.atmo-bfc.org/. Accessed 6Jan 2021
Grand Besançon (2016) Evaluation et gestion du bruit dans le Grand Besançon. http://www.besancon.fr/index.php?p=1751. Accessed 15 Sept 2016
Insee Institut national de la statistique et des études économiques (2020a) Comparateur deterritoire—Commune de Besançon (25056). https://www.insee.fr/fr/statistiques/1405599?geo=COM-25056. Accessed 6 Jan 2021
Insee Institut national de la statistique et des études économiques (2020b) Indices de coûts et deprix dans la construction. https://www.insee.fr/fr/statistiques/2015347. Accessed 7 Jan 2021
Laprise M (2017) Monitoring opérationnel pour l’intégration des enjeux de durabilité aux projetsde régénération de friches urbaines. Ecole polytechnique fédérale de Lausanne (EPFL)
Laprise M, Lufkin S, Rey E (2018) Monitoring tool for urban brownfield regeneration projectsinteraction with stakeholders. In: PLEA 2018 smart healthy two-degree limit. http://infoscience.epfl.ch/record/262506. Accessed 6 Jan 2021
Le médiateur national de l’énergie (2020) Le comparateur d’offres d’électricité et de gaz natureldu médiateur national de l’énergie. In: Site Médiateur Natl. Lénergie. https://www.energie-mediateur.fr/. Accessed 7 Jan 2021
Ministère de la Transition Ecologique et Solidaire, Ministère de la Cohésion des Territoires (2019)Carte stratégique du bruit dans le département du Doubs. http://cartelie.application.developpement-durable.gouv.fr/cartelie/voir.do?carte=Carte_du_bruit_2018&service=DDT_25. Accessed6 Jan 2021
Müller A, Walter F (1994) Guide pratique pour les calculs de rentabilité. Publications RAVEL.Office Fédéral des Questions Conjoncturelles
OuInvestir (2019) Investir à Besançon, un bon rendement locatif ? In: OuInvestir. https://ouinvestir.net/rendement-locatif/besancon. Accessed 7 Jan 2021
SeLoger.com (2020) Loyer à Besançon d’un appartement ou une maison - Prix au m2 à la loca-tion. https://www.seloger.com/prix-de-l-immo/location/franche-comte/doubs/besancon/250056.htm. Accessed 7 Jan 2021
SIA SS des I et des A (2004) SIA 480Calcul de rentabilité pour les investissements dans le bâtiment.Terrain-construction.com (2016) Prix moyen du terrain constructible à Besançon. http://www.terrain-construction.com/prix-moyen-terrain/25-Doubs/Besan%C3%A7on-25000-29782/5.Accessed 15 Feb 2017
Terrain-construction.com (2020) Terrain à vendre dans le Doubs (25). https://www.terrain-construction.com/search/terrain-a-vendre/Doubs-25. Accessed 12 Dec 2020
Ville de Besançon (2010) Eclairage public. http://www.besancon.fr/index.php?p=1361&art_id=4708. Accessed 15 Sept 2016
Ville de Besançon (2015) Candidat Label Pole ViotteVille de Besançon (2018) Dossier de labelisation pour la démarche EcoQuartier - Etape 2

References 201
Open Access This chapter is licensed under the terms of the Creative Commons Attribution 4.0International License (http://creativecommons.org/licenses/by/4.0/), which permits use, sharing,adaptation, distribution and reproduction in any medium or format, as long as you give appropriatecredit to the original author(s) and the source, provide a link to the Creative Commons license andindicate if changes were made.
The images or other third party material in this chapter are included in the chapter’s CreativeCommons license, unless indicated otherwise in a credit line to the material. If material is notincluded in the chapter’s Creative Commons license and your intended use is not permitted bystatutory regulation or exceeds the permitted use, you will need to obtain permission directly fromthe copyright holder.

Chapter 11Conclusion
Abstract The inventory of urban brownfields in post-industrial Europeanmetropolitan areas and the study of regeneration projects highlight the absolutenecessity of these resources for the sustainability transitions of urban territoriesand the undeniable complexity of this type of process. Given the complexity of thevariables involved, there is no simple and unambiguous recipe to make urban territo-ries evolve towards more sustainability. In a synthetic way, we recall how this bookexamines the strategies and methods of regenerating urban brownfields through thelens of sustainability at the neighbourhood scale. Then, we question how the urbanbrownfield phenomenon will evolve in the decades to come. Finally, we argue thatit is through inter-disciplinarity of approaches that neighbourhoods in transition cancontribute, on their scale, to the mutation and adaptability of urban territories.
Keywords Post-industrial European metropolitan areas · Sustainabilitytransitions · Urban brownfield regeneration project · Neighbourhood scale · Futureurban brownfields · Resilience · Inter-disciplinary approaches · Integrated design
The inventory of urban brownfields in post-industrial European metropolitan areasand the study of regeneration projects, of which many are in the course of beingdeveloped, highlight the absolute necessity of these resources for the sustainabilitytransitions of urban territories and the undeniable complexity of this type of process.Identifying obstacles to development (negative public image, risk of opposition,multiplication of players, regulatory constraints, anddissuasive costs) largely justifiesthe panoplyof development strategies that are deployed at different levels of territorialintervention to increase the chances of success of such operations (Rey 2014).
Given the complexity of the variables involved, there is no simple and unam-biguous recipe to make urban territories evolve towards more sustainability. At themoment when a consensus appears in the face of the need for a response to theecological and climate crises, this evolution will rather emerge from the realizationof tailor-made solutions, developed in a manner that is iterative and adapted in termsof project and process to the specificities of eachmetropolitan area, municipality, andsite. Facedwith this simultaneous demand for precision, innovation and flexibility, anapproach to sustainability issues in urban brownfield regeneration projects constitutesa set of particular interesting experiences. Due to its inherently intense operational
© The Author(s) 2022E. Rey et al., Neighbourhoods in Transition, The Urban Book Series,https://doi.org/10.1007/978-3-030-82208-8_11
203

204 11 Conclusion
complexity, this type of operation developed at the neighbourhood scale representsa suitable place for invention and experimentation and encourages the emergenceof solutions that are both creative and unifying, leading to the engagement of anincreasing number of actors.
Beyond the characteristics specific to each particular situation, the realization ofthe first experiences of transforming urban brownfields into sustainable neighbour-hoods has made it possible to generate new operational approaches, explore newworking methods, and test the integration of evaluation processes into the projectapproach. These first projects clearly demonstrate the need for a structured meansof evaluation, in particular at the neighbourhood scale. These turn out to be all themore essential, as the complexity induced by the multiplicity of parameters to beconsidered on this scale exceeds the limits of intuition alone. From a sustainabilityperspective, this evaluative approach is part of a holistic process that translates into aglobal, optimized, and integrated look at the issues to be addressed (Rey and Lufkin2016). It implies a simultaneous and optimal consideration of environmental, socio-cultural, and economic parameters, a visualization of architectural projects not onlyas isolated objects but also as participating elements of a broader whole, and an opti-mization between the different constituent elements of the sustainable neighbourhoodproject.
These first experiments were often seen as “laboratories”, paving the way foran evolution of common practices towards better consideration of the complexityinherent in sustainability.However, they cannot be considered as recipes to be used as-is for other projects. Strategies for sustainable development of the built environmentcannot be seen as the search and application of an ideal and fixed model. Rather,they result from a logic of evolution from the current situation of various Europeanmetropolitan areas that need to be recognized, rethought, and redesigned, basedsimultaneously on existing characteristics and new perspectives.
The complex encounter between parameters linked to sustainability transitionsand fixed points stemming from pre-existing situations makes the work of urbanplanners and architects who can, in partnership with other actors in urban areas,integrate multiple distinct aspects within a coherent spatial synthesis. The neigh-bourhood scale, which is an integral part of the regeneration of urban brownfields,constitutes, in this context, a basis for particularly interesting work. Situated on thescale between city and building, the neighbourhood appears well-suited to experi-menting with specific practices aimed at increasing the sustainability of the urbanenvironment. This makes it possible to make tangible and understand urban issuesthat clearly go beyond the scale of a single building. The necessity of a coordi-nated mastery of urbanization and mobility, the creation of dense mixed clusters,and the search for an increased quality of life in urban areas can thus be approachedand trialled through concrete solutions. Thus, the regeneration of urban territoriesclearly takes place at a crossroads with large-scale considerations such as territorialdevelopment and more circumscribed definitions of buildings and public spaces insearch of new configurations (Rey and Lufkin 2015).
This book examines the methods of regenerating urban brownfields through thelens of sustainability. It testifies to the pivotal period currently experienced by urban

11 Conclusion 205
territories after the calling into question of continued urban sprawl and increasedattention being paid to reserves remaining within the built environment. Followingthis effort towards synthesis is the question of how this phenomenon will evolvein the decades to come. Indeed, the metropolitan areas currently undergoing reno-vation projects address sectors that became urbanized during the nineteenth andtwentieth centuries, afterwards becoming obsolete. Given the importance accordednowadays to urban densification projects, the regeneration of urban brownfields istruly underway, and could thus indicate a gradual disappearance of the phenomenon.
It must, however, be noted that the multitude of sites still awaiting revitalizationimplies that urban brownfields will, in fact, be visible for a long time to come inthe heart of European metropolitan areas and, probably, in other continents facingspatio-functional changes of the same order. Given the accelerated developmentof economic activities and their constantly changing needs, it is likely that someimbalances will continue to appear between the built environment and the functionsit is supposed to fulfil. New types of brownfield not yet imagined in this book arelikely to emerge in the coming decades, even if low population growth of Europeancountries and increased interest in densification potential should, in principle, reducethe intensity of the phenomenon.
Faced with the profound functional changes observed today within Europeanpost-industrial metropolitan areas, it is also legitimate—beyond the extension ofcurrent urban brownfields and possible new spaces facing the risk of abandonment—to question the potentially cyclical nature of this type of phenomenon. In other words,will the neighbourhoods resulting from the regeneration of urban brownfields them-selves become brownfields in a more distant future? It would be reckless, to say theleast, to attempt to respond to this question in a definitive and peremptory manner,which would be tantamount to predicting the future of metropolitan territories quiteprecisely and over a very long term. The multiple interactions facing the urbanenvironment in the twenty-first century will be as strongly marked by the global-ized framework of socioeconomic exchanges as by changing geopolitical situations,locally diverse sociodemographic evolutions, and tensions related to limited accessto resources.
In this context, oscillating between the hope of transition and apocalypticannouncements of collapse, it is not easy to predict the nature of the trade-offs thatwill be established in the face of these variables. Nevertheless, the issues discussedin this book underline the need for multi-dimensional approaches to transformingunderusedmetropolitan sites. The integration of a functional and sociocultural mix inoperations, as well as taking into account certain flexibility at the scale of the neigh-bourhoods considered, suggests a potentially greater adaptability than in previousoccupations and, in principle, a lower risk of the sudden reappearance of obsolescenceor abandonment.
If specific attention is paid to these conditions, brownfields can realize theirintrinsic evolutive potential, allowing them to resist future contextual changes andinfluence their use. One can thus avoid a vacancy phase specific to urban brownfieldsin favour of a more continuous and fluid logic of renovation, transformation, and

206 11 Conclusion
urban renewal, going beyond the classic vision of the urban brownfield’s lifecycle(Laprise 2017).
On their level, sustainable neighbourhoods built on urban brownfields are thuslikely to join and integrate certain dimensions inherent in the concept of resilience.Applied to the city, this can be defined as “the capacity of an urban system to absorba disturbance and to regain its functions following this disturbance” (Toubin et al.2012). As future developments always remain surrounded by uncertainty, it seemsopportune to question the ability of urban territories to resist changes they have under-gone and to withstand sudden impacts. As Thomas Sieverts points out, the objectivesof resilience are mainly the conservation of resources through careful maintenance,tolerance for errors, and an ability to remedy them, reconciling the longevity ofurban structures with scalable uses and the achievement of resource-saving throughthe versatility of use (Sieverts 2013). That which we build or rehabilitate today must,therefore, be able to serve future needs by integrating several possibilities of resettingits use.
The vast field of investigation opened by this challenge implies integrating anincreased number of skills in the development of regeneration projects, which trans-lates into the need to develop intelligent inter-disciplinary cooperations. It is throughthis inter-disciplinarity of approaches—firmly coupled with a process of conceptual,spatial, and expressive integration of distinct contributions to coherent design—that neighbourhoods in transition can contribute, on their scale, to the mutation andadaptability of urban territories.
References
Laprise M (2017) Monitoring opérationnel pour l’intégration des enjeux de durabilité aux projetsde régénération de friches urbaines. Ecole polytechnique fédérale de Lausanne (EPFL)
Rey E (2014) From Spatial Development to Detail. Quart Publishers, Lucerne, Collection NotatioRey E, Lufkin S (2016) Green density. a transdisciplinary reasearch and teaching project for thedesign of sustainable neighbourhoods. Gaia 25:185–190
Rey E, Lufkin S (2015) Des friches urbaines aux quartiers durables. Presses polytechniques etuniversitaires romandes, Lausanne
Sieverts T (2013) La résilience, une nouvelle ère pour le développement urbain ? COREDEM,Paysages de l’après-pétrole ? 50–57
Toubin M, Lhomme S, Diab Y et al (2012) La Résilience urbaine: un nouveau concept opérationnelvecteur de durabilité urbaine ? Développement Durable Et Territoires Économie, Géographie,Politique, Droit, Sociologie. https://doi.org/10.4000/developpementdurable.9208

References 207
Open Access This chapter is licensed under the terms of the Creative Commons Attribution 4.0International License (http://creativecommons.org/licenses/by/4.0/), which permits use, sharing,adaptation, distribution and reproduction in any medium or format, as long as you give appropriatecredit to the original author(s) and the source, provide a link to the Creative Commons license andindicate if changes were made.
The images or other third party material in this chapter are included in the chapter’s CreativeCommons license, unless indicated otherwise in a credit line to the material. If material is notincluded in the chapter’s Creative Commons license and your intended use is not permitted bystatutory regulation or exceeds the permitted use, you will need to obtain permission directly fromthe copyright holder.

Appendix
Context indicators
Environmental impact
Indicator C1.1 Quality of service in public transport BE
Definition The level of service offered by public transport, definedby the type of transport, the rate of service, and thedistance to the nearest stop
Evaluation method Analysis of the frequency of public transport (bus, tram,subway, train) and measurement of the average distanceto the stop under consideration
Measurement unit [–]
VL (limit value) At least 1 mode of public transport reaches a low levelof service
VA (average value) At least 1 mode of public transport reaches an averagelevel of service
VT (target value) At least 1 mode of public transport reaches a good levelof service
VB (best practice value) At least 1 mode of public transport reaches a high levelof service
Data sources Information from public transport companies, scheduleanalysis, measures on city plans
References SPW (2011, 2015)
© The Editor(s) (if applicable) and The Author(s) 2022E. Rey et al., Neighbourhoods in Transition, The Urban Book Series,https://doi.org/10.1007/978-3-030-82208-8
209

210 Appendix
Indicator C1.1 Quality of service in public transport CH
Definition The level of service offered by public transport, definedby the type of transport, the rate of service, and thedistance to the nearest stop
Evaluation method Analysis of the frequency of public transport (bus, tram,subway, train) and measurement of the average distanceto the stop under consideration
Measurement unit Class A, B, C, D
VL (limit value) Class D
VA (average value) Class C
VT (target value) Class B
VB (best practice value) Class A
Data sources Information from public transport companies, scheduleanalysis, measures on city plans
References VSS (1993), Bridel (1996), Bonanomi (2000)
Indicator C1.1 Average distance to a public transport stop FR
Definition The average distance to walk from the front door of theapartment and office buildings to the closest publictransit stop under consideration, weighted by therespective gross floor area of the different buildings
Evaluation method Measurement of the distance to the public transport stop(bus, tram, subway, train)
Measurement unit [m]
Bus/subway/tram Train station
VL (limit value) 900 (about 15 min walk) 1800 (about 30 minwalk)
VA (average value) 700 (about 12 min walk) 1400 (about 25 minwalk)
VT (target value) 500 (about 8 min walk) 1000 (about 15 minwalk)
VB (best practice value) 300 (about 5 min walk) 600 (about 10 min walk)
Data sources Information from public transport companies, measureson city plans
References Tarzia (2003), Charlot-Valdieu and Outrequin (2012),Cerema (2015)
Indicator C1.2 Number of parking spaces BE
Definition The number of parking spaces planned to meet the needsof inhabitants, workers, and visitors
Evaluation method Calculation of the number of parking spaces in relationto the quality of public transport services
(continued)

Appendix 211
(continued)
Indicator C1.2 Number of parking spaces BE
Measurement unit Number of parking spaces
VL (limit value) ≤maximum theoretical need
VA (average value) ≤the value between VL and VT
VT (target value) ≤maximum optimized need
VB (best practice value) ≤minimum optimized need
Data sources Plan and table of parking spaces, report of the impactstudy, calculations of reduced needs according to SPW(2015)
References SPW (2011, 2015)
Indicator C1.2 Number of parking spaces CH
Definition The number of parking spaces planned to meet the needsof inhabitants, workers, and visitors
Evaluation method Calculation of the number of parking spaces
Measurement unit Number of parking spaces
VL (limit value) Value corresponding to the maximum reduced needaccording to VSS (1993)
VA (average value) Mean value between VL and VB
VT (target value) Mean value between VM and VB
VB (best practice value) Value corresponding to the minimum reduced needaccording to VSS (1993)
Data sources Plan and table of parking spaces, report of the impactstudy, calculations of reduced needs according to VSS(1993)
References VSS (1993), Bridel (1996)
Indicator C1.2 Number of parking spaces FR
Definition The number of parking spaces planned to meet the needsof inhabitants, workers, and visitors
Evaluation method Calculation of the number of parking spaces
Measurement unit Number of parking spaces
VL (limit value) ≤the requirements of “Code de l’Urbanisme” (orPLU/PDU if more restrictive)
VA (average value) ≤the mean value between VL and VB
VT (target value) ≤ the mean value between VA and VB
VB (best practice value) ≤optimized theoretical need
Data sources Plan and table of parking spaces, report of the impactstudy, and calculations of the optimized theoretical need
(continued)

212 Appendix
(continued)
Indicator C1.2 Number of parking spaces FR
References Charlot-Valdieu and Outrequin (2012), Meunier-Chabert(2012), Legifrance (2016)
Indicator C1.3 Tying status with “soft” mobility networks BE/CH/FR
Definition The intensity of connection to different “soft” andsustainable mobility networks for pedestrians andbicycles
Evaluation method Analysis of the number and quality of the differentconnections
Measurement unit [Qualitative scale]
VL (limit value) The project is characterized by a relatively lowconsideration of “soft” mobility and is relatively weaklyconnected to surrounding areas (every 900 m)
VA (average value) The project is characterized by a relatively moderateconsideration of “soft” mobility and is moderatelyconnected to surrounding areas (every 700 m)
VT (target value) The project provides for a significant consideration of“soft” mobility and is significantly connected tosurrounding areas (every 500 m)
VB (best practice value) The project provides for systematic consideration of“soft” mobility (several specific devices) and issystematically connected to surrounding areas (every300 m)
Data sources Site plan, project guidelines
References écoconso (2008), Meunier-Chabert (2012), OFROU andMobilité piétonne Suisse (2014), DGO2 (2015),Ministère de l’écologie, du développement durable et del’énergie and Ministère délégué aux transports, à la meret à la pêche (2015)
Indicator C1.4 Company mobility plan (CMP) BE/CH/FR
Definition The measures offered by on-site companies toencourage the use of alternative transport duringcommuting or business trips
Evaluation method Qualitative analysis of the measures of the companymobility plan (CMP) and their accessibility
Measurement unit [Qualitative scale]
VL (limit value) A small proportion of jobs have access to a CMP, limitedto a single alternative measure to individual transport
VA (average value) A moderate proportion of jobs have access to a CMP,supported by a great offer of alternative measures toindividual transport
(continued)

Appendix 213
(continued)
Indicator C1.4 Company mobility plan (CMP) BE/CH/FR
VT (target value) An important proportion of jobs have access to a CMP,supported by a great offer of alternative measures toindividual transport
VB (best practice value) An important proportion of jobs have access to a CMP,supported by a great offer of alternative measures toindividual transport and relying on a permanentcommunication campaign
Data sources Site plan, project guidelines
References Mobilservice and Kanton Aargau (2009), Etat de Vaud,Département des infrastructures and Etat de Genève,Département de l’intérieur, de l’agriculture et del’environnement (2014), DGO2 (2015), ADEME(2016), mobitool (2016)
Indicator C2.1 Average annual emissions of NO2 BE
Definition The estimated average concentration of NO2 induced byemissions of nitrogen oxides (NOx) due to road trafficand heating of buildings in a wider area compared to theproject under consideration
Evaluation method Methodology specific to Environmental ImpactAssessment (EIA)
Measurement unit [µgNO2/m3]
VL (limit value) 40 limit value according to WHO (2005)
VA (average value) 32 mean value between VL and VT (urban area)
VT (target value) 23 mean value weighted according to population(irCELine 2015)
VB (best practice value) 15 annual spatial value (irCELine 2015)
Data sources Project data, EIA report, on-site measurement
References WHO (2005), irCELine (2015)
Indicator C2.1 Average annual emissions of NO2 CH
Definition The estimated average concentration of NO2 induced byemissions of nitrogen oxides (NOx) due to road trafficand heating of buildings in a wider area compared to theproject under consideration
Evaluation method Methodology specific to Environmental ImpactAssessment (EIA)
Measurement unit [µgNO2/m3]
VL (limit value) 30 limit value according to Opair (1985) (Conseilfédéral suisse 1985)
(continued)

214 Appendix
(continued)
Indicator C2.1 Average annual emissions of NO2 CH
VA (average value) 25 mean value between VL and VT
VT (target value) 20 low annual average value in urban site (backgroundpollution)
VB (best practice value) 13 rural area (OFS 2013)
Data sources Project data, EIA report, on-site measurement
References Conseil fédéral suisse (1985), Hertig (2006), OFS (2013)
Indicator C2.1 Average annual emissions of NO2 FR
Definition The estimated average concentration of NO2 induced byemissions of nitrogen oxides (NOx) due to road trafficand heating of buildings in a wider area compared to theproject under consideration
Evaluation method Methodology specific to Environmental ImpactAssessment (EIA)
Measurement unit [µgNO2/m3]
VL (limit value) 40 limit value according to WHO (2005) (WHO 2005)
VA (average value) 30 mean value between VL and VT (flora protection)
VT (target value) 20 annual mean value in urban site
VB (best practice value) 17 low annual average value in urban site (percentile10%)
Data sources Project data, EIA report, on-site measurement
References WHO (2005), MEEM (2014), MEDDE (2014)
Indicator C2.2 Global warming potential (GWP) CH
Definition The annual equivalent quantity of kg CO2 caused by theconstruction, renovation, operation, and demolition ofbuildings
Evaluation method Methodology specific to lifecycle analysis (LCA) (cf.indicator P2.1)
Measurement unit [kgeqCO2/m2CAy]
VL (limit value) 125% of VB
VA (average value) Between VL and VB
VT (target value) Between VA and VB
VB (best practice value) Values corresponding to the recommendations of the2000 Watt Society/SIA 2040 (SIA 2011; Liman et al.2014)
Data sources LCA realized with the project data
References SIA (2011), Liman et al. (2014), Swissenergy et al.(2014)

Appendix 215
Indicator C2.2 Global warming potential (GWP) BE/FR
Definition The annual equivalent quantity of kg CO2 caused by theconstruction, renovation, operation, and demolition ofbuildings
Evaluation method Methodology specific to lifecycle analysis (LCA) (cf.indicator P2.1)
Measurement unit [kgeqCO2/m2CAy]
VL (limit value) To date, there are not enough comparable calculationson full lifecycle analysis of buildings in order toestablish reference values
VA (average value)
VT (target value)
VB (best practice value)
Data sources LCA realized with the project data
References Agence wallonne de l’air & du climat (2014), Lebertet al. (2014), Wallonie (2014), Association HQE (2015),CSTB (2016), INIES (2016)
Indicator C2.3 Acidification potential (AP) BE/CH/FR
Definition The annual equivalent quantity of kg SO2 caused by theconstruction, renovation, operation, and demolition ofbuildings
Evaluation method Methodology specific to lifecycle analysis (LCA) (cf.indicator P2.1)
Measurement unit [kgeqSO2/m2CAy]
VL (limit value) To date, there are not enough comparable calculationson full lifecycle analysis of buildings in order toestablish reference values
VA (average value)
VT (target value)
VB (best practice value)
Data sources LCA realized with the project data
References Brecheisen and Theis (2015), Lotteau et al. (2015)
Indicator C3.1 Average emissions of noise—day (Lden) BE/FR
Definition The average noise exposure value of buildings located inthe perimeter of the project and in a wider area
Evaluation method Methodology specific to Environmental ImpactAssessment (EIA)
Measurement unit [dBA]
VL (limit value) 65 (+10 dBA according to WHO 2009 Lnight, rule ofthumb)
VA (average value) 55
VT (target value) 50 (+10 dBA according to WHO 2009 Lnight, rule ofthumb)
(continued)

216 Appendix
(continued)
Indicator C3.1 Average emissions of noise—day (Lden) BE/FR
VB (best practice value) 45
Data sources Cadastre of road and motorway network, project data,EIA report, on-site measurement
References CE (2002), Gouvernement wallon (2004), RF et al.(2006), WHO (2009), EEA (2010)
Indicator C3.1 Average emissions of noise—day CH
Definition The average noise exposure value of buildings located inthe perimeter of the project and in a wider area
Evaluation method Methodology specific to Environmental ImpactAssessment (EIA)
Measurement unit [dBA]
VL (limit value) VA = alert value according to OPB (CH 2015)
VA (average value) VLI = limit value according to OPB (CH 2015)
VT (target value) VLI—5 dBA
VB (best practice value) VLI—10 dBA
Data sources Cadastre of road and motorway network, project data,EIA report, on-site measurement
Reference CH (2015)
Indicator C3.2 Average emissions of noise—night (Lnight) BE/FR
Definition The average noise exposure value of buildings located inthe perimeter of the project and in a wider area
Evaluation method Methodology specific to Environmental ImpactAssessment (EIA)
Measurement unit [dBA]
VL (limit value) 55—threshold according to WHO (2009)
VA (average value) 45
VT (target value) 40—threshold according to WHO (2009)
VB (best practice value) 35
Data sources Cadastre of road and motorway network, project data,EIA report, on-site measurement
References CE (2002), Gouvernement wallon (2004), RF et al.(2006), WHO (2009), EEA (2010)
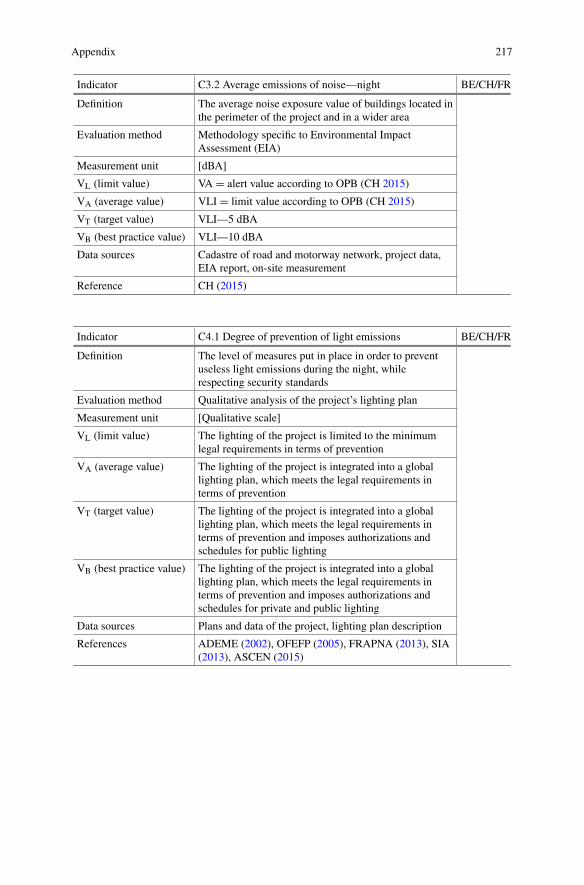
Appendix 217
Indicator C3.2 Average emissions of noise—night BE/CH/FR
Definition The average noise exposure value of buildings located inthe perimeter of the project and in a wider area
Evaluation method Methodology specific to Environmental ImpactAssessment (EIA)
Measurement unit [dBA]
VL (limit value) VA = alert value according to OPB (CH 2015)
VA (average value) VLI = limit value according to OPB (CH 2015)
VT (target value) VLI—5 dBA
VB (best practice value) VLI—10 dBA
Data sources Cadastre of road and motorway network, project data,EIA report, on-site measurement
Reference CH (2015)
Indicator C4.1 Degree of prevention of light emissions BE/CH/FR
Definition The level of measures put in place in order to preventuseless light emissions during the night, whilerespecting security standards
Evaluation method Qualitative analysis of the project’s lighting plan
Measurement unit [Qualitative scale]
VL (limit value) The lighting of the project is limited to the minimumlegal requirements in terms of prevention
VA (average value) The lighting of the project is integrated into a globallighting plan, which meets the legal requirements interms of prevention
VT (target value) The lighting of the project is integrated into a globallighting plan, which meets the legal requirements interms of prevention and imposes authorizations andschedules for public lighting
VB (best practice value) The lighting of the project is integrated into a globallighting plan, which meets the legal requirements interms of prevention and imposes authorizations andschedules for private and public lighting
Data sources Plans and data of the project, lighting plan description
References ADEME (2002), OFEFP (2005), FRAPNA (2013), SIA(2013), ASCEN (2015)

218 Appendix
Sociocultural impact
Indicator C5.1 Average distance to a nursery BE/CH/FR
Definition The average distance to walk from the entrance ofresidential buildings to the nearest nursery, weighted bythe respective gross floor area of the different buildings
Evaluation method Measurement on maps and city plans
Measurement unit [m]
VL (limit value) 900 (about 15 min walk)
VA (average value) 700 (about 12 min walk)
VT (target value) 500 (about 8 min walk)
VB (best practice value) 300 (about 5 min walk)
Data sources Municipal data on nursery, specific studies, maps andcity plans
References Bridel (1996), OFL (2000), Teller (2009), Ministère del’égalité des territoires et du logement (2014)
Indicator C5.2 Average distance to a kindergarten BE/CH/FR
Definition The average distance to walk from the entrance ofresidential buildings to the nearest school facilities,weighted by the respective gross floor area of thedifferent buildings
Evaluation method Measurement on maps and city plans
Measurement unit [m]
VL (limit value) 900 (about 15 min walk)
VA (average value) 700 (about 12 min walk)
VT (target value) 500 (about 8 min walk)
VB (best practice value) 300 (about 5 min walk)
Data sources Municipal data on school facilities, specific studies,maps, and city plans
References Bridel (1996), OFL (2000), Teller (2009), Ministère del’égalité des territoires et du logement (2014)
Indicator C5.3 Average distance to an elementary school BE/CH/FR
Definition The average distance to walk from the entrance ofresidential buildings to the nearest school facilities,weighted by the respective gross floor area of thedifferent buildings
Evaluation method Measurement on maps and city plans
Measurement unit [m]
VL (limit value) 900 (about 15 min walk)
(continued)

Appendix 219
(continued)
Indicator C5.3 Average distance to an elementary school BE/CH/FR
VA (average value) 700 (about 12 min walk)
VT (target value) 500 (about 8 min walk)
VB (best practice value) 300 (about 5 min walk)
Data sources Municipal data on school facilities, specific studies,maps, and city plans
References Bridel (1996), OFL (2000), Teller (2009), Ministère del’égalité des territoires et du logement (2014)
Indicator C5.4 Average distance to a junior high/middle school BE/CH/FR
Definition The average distance to walk from the entrance ofresidential buildings to the nearest school facilities,weighted by the respective gross floor area of thedifferent buildings
Evaluation method Measurement on maps and city plans
Measurement unit [m]
VL (limit value) 1800 (about 30 min walk)
VA (average value) 1400 (about 24 min walk)
VT (target value) 1000 (about 16 min walk)
VB (best practice value) 600 (about 10 min walk)
Data sources Municipal data on school facilities, specific studies,maps, and city plans
References Bridel (1996), OFL (2000), Teller (2009), Ministère del’égalité des territoires et du logement (2014)
Indicator C5.5 Average distance to a high school BE/CH/FR
Definition The average distance to walk from the entrance ofresidential buildings to the nearest school facilities,weighted by the respective gross floor area of thedifferent buildings
Evaluation method Measurement on maps and city plans
Measurement unit [m]
VL (limit value) 1800 (about 30 min walk)
VA (average value) 1400 (about 24 min walk)
VT (target value) 1000 (about 16 min walk)
VB (best practice value) 600 (about 10 min walk)
Data sources Municipal data on school facilities, specific studies,maps, and city plans
References Bridel (1996), OFL (2000), Teller (2009), Ministère del’égalité des territoires et du logement (2014)

220 Appendix
Indicator C6.1 Average distance to a commercial zone BE/CH/FR
Definition The average distance to walk from the entrance ofresidential buildings to the nearest commercial zone,weighted by the respective gross floor area of thedifferent buildings
Evaluation method Measurement on maps and city plans
Measurement unit [m]
VL (limit value) 900 (about 15 min walk)
VA (average value) 700 (about 12 min walk)
VT (target value) 500 (about 8 min walk)
VB (best practice value) 300 (about 5 min walk)
Data sources Municipal data on businesses, information frommerchant associations, maps, and city plans
References Bridel (1996), OFL (2000), Teller (2009), Ministère del’égalité des territoires et du logement (2014)
Indicator C7.1 Average distance to a public park BE/CH/FR
Definition The average distance to walk from the entrance ofresidential buildings to the nearest public park, weightedby the respective gross floor area of the differentbuildings
Evaluation method Measurement on maps and city plans
Measurement unit [m]
VL (limit value) 900 (about 15 min walk)
VA (average value) 700 (about 12 min walk)
VT (target value) 500 (about 8 min walk)
VB (best practice value) 300 (about 5 min walk)
Data sources Municipal data on public parks, information fromcultural and sports associations, maps, and city plans
References Bridel (1996), OFL (2000), Teller (2009), Ministère del’égalité des territoires et du logement (2014)
Indicator C7.2 Average distance to a recreational green/naturalarea
BE/CH/FR
Definition The average distance to walk from the entrance ofresidential buildings to the nearest recreationalgreen/natural area, weighted by the respective grossfloor area of the different buildings
Evaluation method Measurement on maps and city plans
Measurement unit [m]
VL (limit value) 1800 (about 30 min walk)
(continued)

Appendix 221
(continued)
Indicator C7.2 Average distance to a recreational green/naturalarea
BE/CH/FR
VA (average value) 1400 (about 24 min walk)
VT (target value) 1000 (about 16 min walk)
VB (best practice value) 600 (about 10 min walk)
Data sources Municipal data on recreational green/natural area(forest, lake or river shore, et.), maps, and city plans
References Bridel (1996), OFL (2000), Teller (2009), Ministère del’égalité des territoires et du logement (2014)
Indicator C7.3 Average distance to a cultural centre BE/CH/FR
Definition The average distance to walk from the entrance ofresidential buildings to the nearest cultural centre,weighted by the respective gross floor area of thedifferent buildings
Evaluation method Measurement on maps and city plans
Measurement unit [m]
VL (limit value) 900 (about 15 min walk)
VA (average value) 700 (about 12 min walk)
VT (target value) 500 (about 8 min walk)
VB (best practice value) 300 (about 5 min walk)
Data sources Municipal data on cultural centre, information fromcultural associations, maps, and city plans
References Bridel (1996), OFL (2000), Teller (2009), Ministère del’égalité des territoires et du logement (2014)
Indicator C7.4 Average distance to a sport centre BE/CH/FR
Definition The average distance to walk from the entrance ofresidential buildings to the nearest sport centre,weighted by the respective gross floor area of thedifferent buildings
Evaluation method Measurement on maps and city plans
Measurement unit [m]
VL (limit value) 900 (about 15 min walk)
VA (average value) 700 (about 12 min walk)
VT (target value) 500 (about 8 min walk)
VB (best practice value) 300 (about 5 min walk)
Data sources Municipal data on sport centre, information from sportsassociations, maps, and city plans
References Bridel (1996), OFL (2000), Teller (2009), Ministère del’égalité des territoires et du logement (2014)

222 Appendix
Economic impact
Indicator C8.1 Net population density BE/CH/FR
Definition The number of inhabitants per hectare of buildable land(excluding green areas, forests, water bodies, etc.)
Evaluation method Estimated number of inhabitants according to theproject’s gross floor area and the expected occupationrate according to the statistical values, divided by thebuildable land area for the site
Measurement unit [hab/ha]
VL (limit value) 90% of the net density of the centre of the city or themetropolitan area
VA (average value) 100% of the net density of the centre of the city or themetropolitan area
VT (target value) 150% of the net density of the centre of the city or themetropolitan area
VB (best practice value) 200% of the net density of the centre of the city or themetropolitan area
Data sources Data of the housing project, municipal statistics
References Fouchier (1997), Ruzicka-Rossier and Kotchi (2002),DREIF (2009), IWEPS (2011), Insee (2016)
Indicator C9.1 Net employment density BE/CH/FR
Definition The number of jobs per hectare of buildable land(excluding green areas, forests, water bodies, etc.)
Evaluation method Estimated number of jobs according to the project’sgross floor area and the expected occupation rateaccording to the statistical values, divided by thebuildable land area for the site
Measurement unit [job/ha]
VL (limit value) 90% of the net density of the centre of the city or themetropolitan area
VA (average value) 100% of the net density of the centre of the city or themetropolitan area
VT (target value) 150% of the net density of the centre of the city or themetropolitan area
VB (best practice value) 200% of the net density of the centre of the city or themetropolitan area
Data sources Communal statistical tables of employment
References Fouchier (1997), Ruzicka-Rossier and Kotchi (2002),DREIF (2009), IWEPS (2011), Insee (2016)

Appendix 223
Indicator C10.1 Proportion of work carried out by local companies BE/CH/FR
Definition The percentage of the costs of the work—preparatorywork, buildings, and landscaping—made by companieslocated in the project’s urban area
Evaluation method Analysis of construction cost
Measurement unit [%]
VL (limit value) 50% of the total construction cost
VA (average value) 60% of the total construction cost
VT (target value) 70% of the total construction cost
VB (best practice value) 80% of the total construction cost
Data sources Final construction cost, statistics of federations ofcontractors
References CRB (2001), MEEM (2012), SPW (2014)
Project indicators
Environmental balance
Indicator P1.1 Floor area ratio BE/CH/FR
Definition The ratio between the floor area of buildings and thetotal area of the site
Evaluation method Measure of the project plans’ surface area
Measurement unit [–]
VL (limit value) 0.5 (the limit for public transport according to Gasser(2003)
VA (average value) 1.0
VT (target value) 1.5
VB (best practice value) 2.0 (density of central urban areas)
Data sources Project plans, land cadastral data
References SIA (2004b), IAURIF (2005a, b, c), CPDT (2013)
Indicator P2.1 Non-renewable primary energy for construction,renovation, and demolition of buildings
BE/FR
Definition The quantity of non-renewable primary energy neededfor the construction, renovation (maintenance andreplacement of elements), and demolition of buildings
Evaluation method Methodology specific to lifecycle analysis (LCA)
Measurement unit [MJ/m2CAy]
VL (limit value) To date, there are not enough comparable calculationson full lifecycle analysis of buildings in order toestablish reference values
VA (average value)
VT (target value)
(continued)

224 Appendix
(continued)
Indicator P2.1 Non-renewable primary energy for construction,renovation, and demolition of buildings
BE/FR
VB (best practice value)
Data sources LCA realized with the project data
References UE (2010), Commission Européenne (2014)
Indicator P2.1 Non-renewable primary energy for construction,renovation, and demolition of buildings
CH
Definition The quantity of non-renewable primary energy neededfor the construction, renovation (maintenance andreplacement of elements), and demolition of buildings
Evaluation method Methodology specific to lifecycle analysis (LCA)
Measurement unit [MJ/m2CAy]
VL (limit value) 125% of VB
VA (average value) Between VL and VB
VT (target value) Between VT and VB
VB (best practice value) Values corresponding to the recommendations of the2000 Watt Society/SIA 2040 (SIA 2011; Liman et al.2014)
Data sources LCA realized with the project data
References SIA (2011), Liman et al. (2014), Swissenergy et al.(2014)
Indicator P2.2 Non-renewable energy for buildings in operation BE
Definition The ratio between the primary energy required for theannual consumption for the buildings’ operation(heating, hot water, and electricity) and an annualconsumption of primary reference energy
Evaluation method Energy balance required for PEB certificate—accordingto Walloon calculations
Measurement unit [Level Ew]
VL (limit value) 80 (PEB Certificate)
VA (average value) 70 (Reference level Brussels)
VT (target value) 50 (Reference level Flanders)
VB (best practice value) 30 (UE 2021 Objective)
Data sources Energy balance, report on energy consumption whenapplying for a building permit
References UE (2010, p. 20), SPW et al. (2015)

Appendix 225
Indicator P2.2 Non-renewable energy for buildings in operation CH
Definition The quantity of non-renewable primary energy neededfor annual consumption for the buildings’ operation(heating, hot water, and electricity)
Evaluation method Energy balance
Measurement unit [MJ/m2CAy]
VL (limit value) Value determined from the limit values according to therelevant reference standard (SIA 380/et SIA 380/4)
VA (average value) Value determined from the target values according to therelevant reference standard (SIA 380/et SIA 380/4)
VT (target value) Value corresponding to the good performance of thepractice in this area (label Minergie-P) (Minergie 2014)
VB (best practice value) Value corresponding to the best performance of thepractice in this area (label Minergie-A) (Minergie 2014)
Data sources Energy balance, report on energy consumption whenapplying for a building permit
References SIA (2009), Minergie (2014)
Indicator P2.2 Non-renewable energy for buildings in operation FR
Definition The quantity of non-renewable primary energy requiredfor annual consumption for the buildings’ operation(heating, domestic hot water, and electricity)/housing,offices and education
Evaluation method Energy balance
Measurement unit [kWh/m2SHONRTa]
VL (limit value) Value corresponding to the requirements of law RT2012(CSTB 2012)
VA (average value) Mean value between VL and VT
VT (target value) Value corresponding to the good performance of thepractice in this area (RT2012-20% or label Effinergie +(effinergie 2016))
VB (best practice value) Value corresponding to the best performance of thepractice in this area (label BePos Effinergie (effinergie2017))
Data sources Energy balance, report on energy consumption whenapplying for a building permit
References RF et al. (2010a, b), CSTB (2012), effinergie (2016,2017)
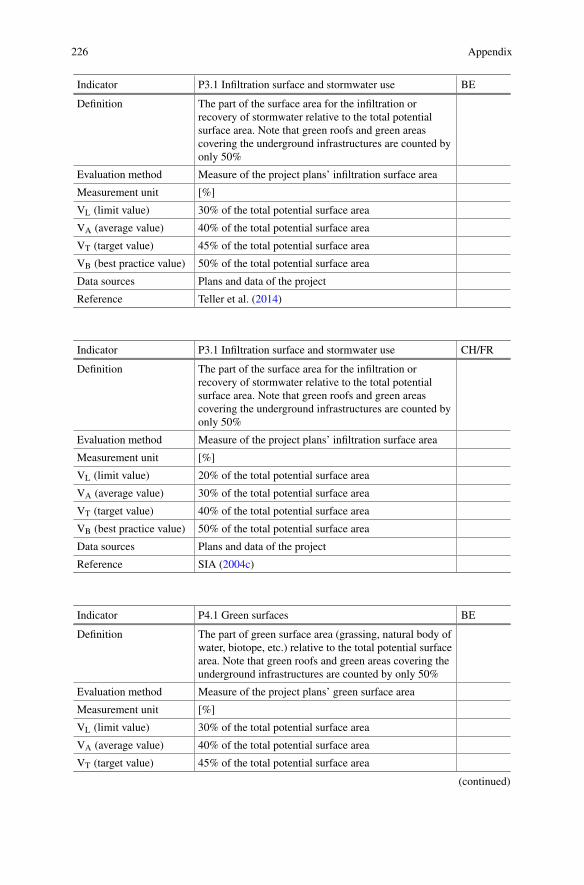
226 Appendix
Indicator P3.1 Infiltration surface and stormwater use BE
Definition The part of the surface area for the infiltration orrecovery of stormwater relative to the total potentialsurface area. Note that green roofs and green areascovering the underground infrastructures are counted byonly 50%
Evaluation method Measure of the project plans’ infiltration surface area
Measurement unit [%]
VL (limit value) 30% of the total potential surface area
VA (average value) 40% of the total potential surface area
VT (target value) 45% of the total potential surface area
VB (best practice value) 50% of the total potential surface area
Data sources Plans and data of the project
Reference Teller et al. (2014)
Indicator P3.1 Infiltration surface and stormwater use CH/FR
Definition The part of the surface area for the infiltration orrecovery of stormwater relative to the total potentialsurface area. Note that green roofs and green areascovering the underground infrastructures are counted byonly 50%
Evaluation method Measure of the project plans’ infiltration surface area
Measurement unit [%]
VL (limit value) 20% of the total potential surface area
VA (average value) 30% of the total potential surface area
VT (target value) 40% of the total potential surface area
VB (best practice value) 50% of the total potential surface area
Data sources Plans and data of the project
Reference SIA (2004c)
Indicator P4.1 Green surfaces BE
Definition The part of green surface area (grassing, natural body ofwater, biotope, etc.) relative to the total potential surfacearea. Note that green roofs and green areas covering theunderground infrastructures are counted by only 50%
Evaluation method Measure of the project plans’ green surface area
Measurement unit [%]
VL (limit value) 30% of the total potential surface area
VA (average value) 40% of the total potential surface area
VT (target value) 45% of the total potential surface area
(continued)
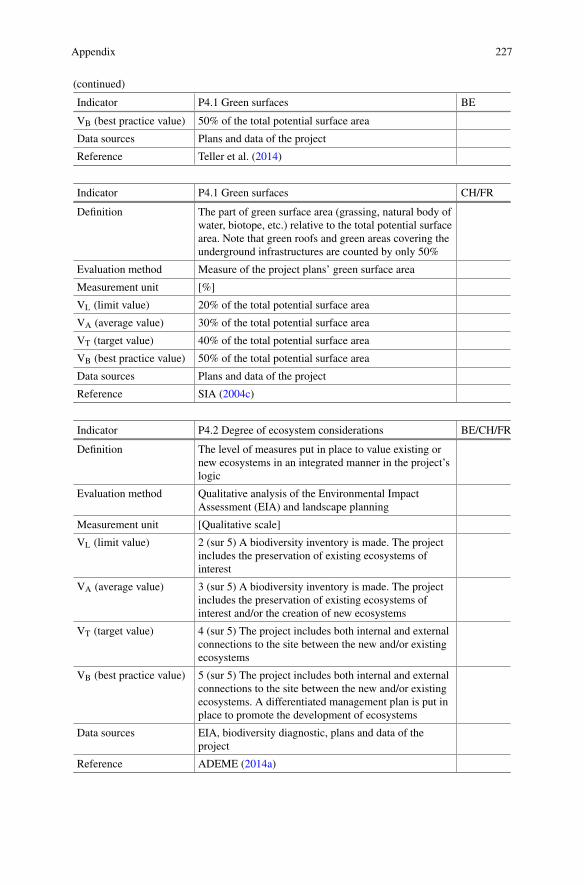
Appendix 227
(continued)
Indicator P4.1 Green surfaces BE
VB (best practice value) 50% of the total potential surface area
Data sources Plans and data of the project
Reference Teller et al. (2014)
Indicator P4.1 Green surfaces CH/FR
Definition The part of green surface area (grassing, natural body ofwater, biotope, etc.) relative to the total potential surfacearea. Note that green roofs and green areas covering theunderground infrastructures are counted by only 50%
Evaluation method Measure of the project plans’ green surface area
Measurement unit [%]
VL (limit value) 20% of the total potential surface area
VA (average value) 30% of the total potential surface area
VT (target value) 40% of the total potential surface area
VB (best practice value) 50% of the total potential surface area
Data sources Plans and data of the project
Reference SIA (2004c)
Indicator P4.2 Degree of ecosystem considerations BE/CH/FR
Definition The level of measures put in place to value existing ornew ecosystems in an integrated manner in the project’slogic
Evaluation method Qualitative analysis of the Environmental ImpactAssessment (EIA) and landscape planning
Measurement unit [Qualitative scale]
VL (limit value) 2 (sur 5) A biodiversity inventory is made. The projectincludes the preservation of existing ecosystems ofinterest
VA (average value) 3 (sur 5) A biodiversity inventory is made. The projectincludes the preservation of existing ecosystems ofinterest and/or the creation of new ecosystems
VT (target value) 4 (sur 5) The project includes both internal and externalconnections to the site between the new and/or existingecosystems
VB (best practice value) 5 (sur 5) The project includes both internal and externalconnections to the site between the new and/or existingecosystems. A differentiated management plan is put inplace to promote the development of ecosystems
Data sources EIA, biodiversity diagnostic, plans and data of theproject
Reference ADEME (2014a)

228 Appendix
Sociocultural quality
Indicator P5.1 Heat gains BE
Definition The number of Kelvin per hour over a year beyond 23 °C
Evaluation method Digital simulation, on-site measurement
Measurement unit [kh]
VL (limit value) 6500
VA (average value) 3750
VT (target value) 2375
VB (best practice value) 1000
Data sources Heat engineer report, on-site measurement
Reference SPW et al. (2015)
Indicator P5.1 Annual hours of overheating CH
Definition The annual number of hours when the interiortemperature of a building is greater than 26.5 °C
Evaluation method Digital simulation, on-site measurement
Measurement unit [h]
VL (limit value) 100
VA (average value) 80
VT (target value) 60
VB (best practice value) 40
Data sources Heat engineer report, on-site measurement
Reference SIA (2007)
Indicator P5.1 Annual hours of overheating FR
Definition The annual number of hours when the interiortemperature of a building is greater than 28 °C
Evaluation method Digital simulation, on-site measurement
Measurement unit [h]
VL (limit value) 40
VA (average value) 30
VT (target value) 20
VB (best practice value) 10
Data sources Heat engineer report, on-site measurement
Reference Sidler and MAF (2013)
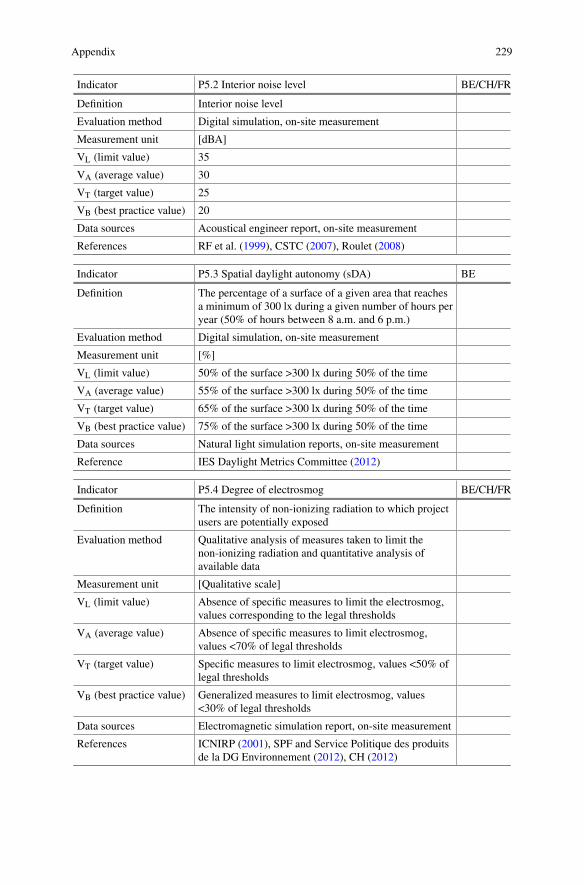
Appendix 229
Indicator P5.2 Interior noise level BE/CH/FR
Definition Interior noise level
Evaluation method Digital simulation, on-site measurement
Measurement unit [dBA]
VL (limit value) 35
VA (average value) 30
VT (target value) 25
VB (best practice value) 20
Data sources Acoustical engineer report, on-site measurement
References RF et al. (1999), CSTC (2007), Roulet (2008)
Indicator P5.3 Spatial daylight autonomy (sDA) BE
Definition The percentage of a surface of a given area that reachesa minimum of 300 lx during a given number of hours peryear (50% of hours between 8 a.m. and 6 p.m.)
Evaluation method Digital simulation, on-site measurement
Measurement unit [%]
VL (limit value) 50% of the surface >300 lx during 50% of the time
VA (average value) 55% of the surface >300 lx during 50% of the time
VT (target value) 65% of the surface >300 lx during 50% of the time
VB (best practice value) 75% of the surface >300 lx during 50% of the time
Data sources Natural light simulation reports, on-site measurement
Reference IES Daylight Metrics Committee (2012)
Indicator P5.4 Degree of electrosmog BE/CH/FR
Definition The intensity of non-ionizing radiation to which projectusers are potentially exposed
Evaluation method Qualitative analysis of measures taken to limit thenon-ionizing radiation and quantitative analysis ofavailable data
Measurement unit [Qualitative scale]
VL (limit value) Absence of specific measures to limit the electrosmog,values corresponding to the legal thresholds
VA (average value) Absence of specific measures to limit electrosmog,values <70% of legal thresholds
VT (target value) Specific measures to limit electrosmog, values <50% oflegal thresholds
VB (best practice value) Generalized measures to limit electrosmog, values<30% of legal thresholds
Data sources Electromagnetic simulation report, on-site measurement
References ICNIRP (2001), SPF and Service Politique des produitsde la DG Environnement (2012), CH (2012)

230 Appendix
Indicator P5.5 Degree of individualization of housing BE/CH/FR
Definition The level of measures offering the potential for theindividualized appropriation of housing; typologyfostering multiple uses, removable partitions,preservation of privacy, private, protected areas, etc.
Evaluation method Qualitative analysis of the project’s characteristics
Measurement unit [Qualitative scale]
VL (limit value) The project is characterized by few measures fosteringthe individualized appropriation of housing
VA (average value) The project is characterized by some measures fosteringthe individualized appropriation of housing
VT (target value) The project is characterized by a large number ofmeasures fostering the individualized appropriation ofhousing
VB (best practice value) The project is characterized by a very large number ofmeasures fostering individualized appropriation ofhousing
Data sources Plans and data of the project
Reference SIA (2004a)
Indicator P5.6 Quality of outdoor spaces BE/CH/FR
Definition The nature of the outdoor spaces and the amenitiesprovided contributing to the well-being of users
Evaluation method Qualitative analysis of outdoor spaces
Measurement unit [Qualitative scale]
VL (limit value) A small number of outdoor spaces is accessible to thepublic
VA (average value) A large number of outdoor spaces is accessible to thepublic, but with few amenities for the well-being of users
VT (target value) A large number of outdoor spaces is accessible to thepublic, with some amenities for the well-being of users
VB (best practice value) A very large number of outdoor spaces is accessible tothe public, with multiple amenities for the well-being ofusers (seating, vegetation, play area, etc.)
Data sources Plans and data of the project
References OFL (2000), Reiter (2007)
Indicator P6.1 Degree of security BE/CH/FR
Definition The level of devices contributing to the safety of theneighbourhood’s users (lighting of common areas,access control, presence of technical or specialized staff,etc.)
Evaluation method Qualitative analysis of the security aspects of the project
(continued)

Appendix 231
(continued)
Indicator P6.1 Degree of security BE/CH/FR
Measurement unit [Qualitative scale]
VL (limit value) The handling of security issues is limited to compliancewith regulatory aspects
VA (average value) Some simple security measures, in addition to theregulatory aspects
VT (target value) Several specific security measures, in addition to theregulatory aspects
VB (best practice value) Generalized security measures, in addition to theregulatory aspects
Data sources Plans and data of the project
Reference Charlot-Valdieu and Outrequin (2012)
Indicator P7.1 Degree of enhancement of existing heritage BE/CH/FR
Definition The level of appropriateness of the interventions on theexisting buildings according to their heritage value
Evaluation method Qualitative analysis of the interventions on buildings
Measurement unit [Qualitative scale]
VL (limit value) The project is limited to valuing only existing buildingsthat are legally protected
VA (average value) The project reallocates some existing buildings, inaddition to those that are protected, with respect for theoriginal substance
VT (target value) The project reallocates most existing buildings, inaddition to those that are protected, with high respect forthe original substance
VB (best practice value) The project reallocates most existing buildings, inaddition to those that are protected, with particular highcare for the original substance
Data sources Plans and data of the project
References CABERNET (2004), Berens (2011)
Indicator P8.1 Degree of functional mix BE/CH
Definition The level of diversity of project functions
Evaluation method Qualitative analysis of the distribution of differentfunctions
Measurement unit [Qualitative scale]
VL (limit value) The project has essentially one function, with a smallshare of other secondary functions
VA (average value) The project has the main function, with a significantshare of other secondary functions
(continued)

232 Appendix
(continued)
Indicator P8.1 Degree of functional mix BE/CH
VT (target value) The project has several functions that coexist randomlyon the site, without being part of a specific concept
VB (best practice value) The project has several complementary functions thatcontribute to a concept of functional diversity at the sitelevel
Data sources Plans and data of the project
References Ruzicka-Rossier and Kotchi (2002), PUCA and Mialet(2011)
Indicator P8.1 Degree of functional mix FR
Definition The level of diversity of project functions
Evaluation method Qualitative analysis of the distribution of differentfunctions and ratio between surface area allocated forlight industries, offices, services, and public facilitiesand surface area allocated to housing
Measurement unit [Qualitative scale]
VL (limit value) The project has essentially one function, with a smallshare of other secondary functions, in a ratio <20% or>90%
VA (average value) The project has one main function, with a significantshare of other secondary functions, in a ratio of 20–30%or 80–90%
VT (target value) The project has several functions, in a ratio of 30–40%or 60–80%, which coexist randomly on the site, withoutbeing part of a specific concept
VB (best practice value) The project has several complementary functions, in aratio of 40–60%, which are part of a concept offunctional diversity at the site level
Data sources Plans and data of the project
References Ruzicka-Rossier and Kotchi (2002), PUCA and Mialet(2011)
Indicator P8.2 Potential of social diversity BE/CH/FR
Definition The potential diversity of the inhabitants, particularly atthe socio-professional and generational level
Evaluation method Qualitative analysis of housing typologies andquantitative analysis of rent diversity and housing size
Measurement unit [Qualitative scale]
VL (limit value) The project has low diversity in rents and housing types
VA (average value) The project has an average diversity in rents and housingtypes
(continued)

Appendix 233
(continued)
Indicator P8.2 Potential of social diversity BE/CH/FR
VT (target value) The project has a high diversity in rents and housingtypes
VB (best practice value) The project has a very high diversity in rents andhousing types, with a specific search on social mix andintegration of public housing
Data sources Plans and data of the project, tables of housing types andrents
References OFL (2000), Ruzicka-Rossier and Kotchi (2002), CPDT(2013), MLHD (2016)
Indicator P8.3 Degree of universal access BE/CH/FR
Definition The level of measures contributing to the integration ofusers with impaired mobility
Evaluation method Qualitative analysis of the specific devices on that matter
Measurement unit [Qualitative scale]
VL (limit value) The project takes into account users with impairedmobility but is limited to simple compliance withregulatory aspects
VA (average value) The project takes into account a few simple measuresfostering the integration of users with impaired mobility
VT (target value) The project takes into account several specific measuresfostering the integration of users with impaired mobility
VB (best practice value) The project is characterized by a global concept thatpromotes broad integration of users with impairedmobility
Data sources Plans and data of the project
References CAWab (2015), CSCAH (2016), MEEM (2016)
Economic efficiency
Indicator P9.1 Investment costs BE/CH/FR
Definition The total investment, including all project costs (landpurchase, construction work, secondary costs)
Evaluation method Calculation based on project costs and project areas
Measurement unit [Euro/m2] [CHF/m2] gross floor area
VL (limit value) 110% of the average cost according to the market
VA (average value) 100% of the average cost according to the market
VT (target value) 95% of the average cost according to the market
VB (best practice value) 90% of the average cost according to the market
(continued)

234 Appendix
(continued)
Indicator P9.1 Investment costs BE/CH/FR
Data sources Quotation, cost statements, real estate statistics
References SPF Economie (2014), Wüest & Partner (2015), CIFI(2016), Notaires de France (2016)
Indicator P9.2 Gross rental yield BE/CH/FR
Definition The ratio of rents to total investment costs for rentalhousing
Evaluation method Calculation based on project costs and rents
Measurement unit [%]
VL (limit value) −0.50% of the average market yield
VA (average value) Average market yield
VT (target value) +0.50% of the average market yield
VB (best practice value) +1.0% of the average market yield
Data sources Cost and rent calculations, real estate statistics
References SPF Economie (2014), CIFI (2016), FPI (2016),Notaires de France (2016), UPSI (2016)
Indicator P10.1 Annual operating costs BE/CH/FR
Definition The sum of annual investment, energy consumption, andmaintenance costs
Evaluation method Calculations based on construction costs and energyconsumption
Measurement unit [Euro/m2] [CHF/m2] gross floor area
VL (limit value) Value deducted from the VL for the indicators P2.2 andP9.1
VA (average value) Value deducted from the VA for the indicators P2.2 andP9.1
VT (target value) Value deducted from the VT for the indicators P2.2 andP9.1
VB (best practice value) Value deducted from the VB for the indicators P2.2 andP9.1
Data sources Estimates, cost and rent calculations, energy data
References Refer to P2.2 and P9.1

Appendix 235
Indicator P10.2 Level of occupancy BE/CH/FR
Definition The state of occupancy (to own and to rent) after the firstavailability
Evaluation method Calculations based on the occupation data of thebuildings over a year according to the function (housingor office and commercial premises)
Measurement unit [%]
VL (limit value) Housing ≥85% Premises ≥70%
VA (average value) Housing ≥90% Premises ≥80%
VT (target value) Housing ≥94% Premises ≥85%
VB (best practice value) Housing ≥96% Premises ≥90%
Data sources Rental status of the building administrator, salesstatement of the building developer
References USECE and SVKG (2012), SNBS (2013), FPI (2016),UPSI (2016)
Indicator P11.1 External costs BE/CH/FR
Definition The external costs generated by non-renewable energyconsumption for the project’s buildings
Evaluation method Calculations from energy data and methodology specificto lifecycle analysis (LCA)
Measurement unit [Euro/m2] [CHF/m2] gross floor area
VL (limit value) To date, there are not enough comparable calculationson full lifecycle analysis of buildings in order toestablish reference values
VA (average value)
VT (target value)
VB (best practice value)
Data sources Energy data, LCA realized with the project data
Reference BBSR (2010)
Indicator P12.1 Degree of building flexibility BE/CH/FR
Definition The level of flexibility to a diversity of uses (short- andmedium-term flexibility: the appropriation of the spaces)and changing needs (long-term flexibility: theadaptability of the buildings)
Evaluation method Qualitative analysis of typologies, measures and devicesfostering flexibility
Measurement unit [Qualitative scale]
VL (limit value) The project’s flexibility is limited to the usualconstructive measures
VA (average value) The project is characterized by a few simple flexibilitymeasures fostering a diversity of appropriation of spaces
(continued)

236 Appendix
(continued)
Indicator P12.1 Degree of building flexibility BE/CH/FR
VT (target value) The project is characterized by several flexibilitymeasures fostering a variety of appropriation of thespaces and the adaptability of buildings
VB (best practice value) The project is characterized by increased flexibilitymeasures, which are an integral part of most buildings’concept
Data sources Plans and data of the project
Reference SIA (2004a)
Governance indicators
Management
Indicator G1.1 Logic of project footprint BE/CH/FR
Definition The level of integration and coordination between soilpollution data and the site’s development plan (masterplan)
Evaluation method Qualitative analysis of the coordination between the soilpollution diagnosis and the site’s development plan(master plan)
Measurement unit [Qualitative scale]
VL (limit value) The masterplan is limited to ensuring that the pollutiondata of the site, after remediation, is compatible with theintended uses
VA (average value) The masterplan takes into account the pollution data ofthe site in order to avoid disproportionate remediationmeasures
VT (target value) The masterplan takes into account the pollution data ofthe site and provides some scenarios in order to avoiddisproportionate remediation measures
VB (best practice value) The masterplan’s conception is an integral part of theplanning and selection process of remediation measures;it is adaptable and offers different scenarios
Data sources Diagnosis of the site’s pollution condition, remediationmanagement plan, project masterplan
References Schädler et al. (2011), ADEME (2014a)
Indicator G1.2 Degree of site remediation BE/CH/FR
Definition The level of remediation achieved while offering thebest compromise based on environmental, health,technical, and economic considerations
(continued)
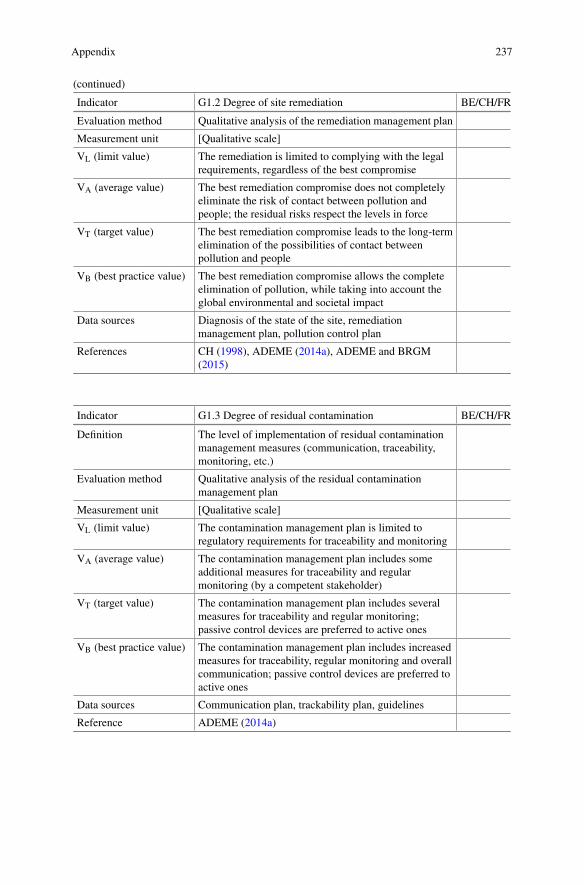
Appendix 237
(continued)
Indicator G1.2 Degree of site remediation BE/CH/FR
Evaluation method Qualitative analysis of the remediation management plan
Measurement unit [Qualitative scale]
VL (limit value) The remediation is limited to complying with the legalrequirements, regardless of the best compromise
VA (average value) The best remediation compromise does not completelyeliminate the risk of contact between pollution andpeople; the residual risks respect the levels in force
VT (target value) The best remediation compromise leads to the long-termelimination of the possibilities of contact betweenpollution and people
VB (best practice value) The best remediation compromise allows the completeelimination of pollution, while taking into account theglobal environmental and societal impact
Data sources Diagnosis of the state of the site, remediationmanagement plan, pollution control plan
References CH (1998), ADEME (2014a), ADEME and BRGM(2015)
Indicator G1.3 Degree of residual contamination BE/CH/FR
Definition The level of implementation of residual contaminationmanagement measures (communication, traceability,monitoring, etc.)
Evaluation method Qualitative analysis of the residual contaminationmanagement plan
Measurement unit [Qualitative scale]
VL (limit value) The contamination management plan is limited toregulatory requirements for traceability and monitoring
VA (average value) The contamination management plan includes someadditional measures for traceability and regularmonitoring (by a competent stakeholder)
VT (target value) The contamination management plan includes severalmeasures for traceability and regular monitoring;passive control devices are preferred to active ones
VB (best practice value) The contamination management plan includes increasedmeasures for traceability, regular monitoring and overallcommunication; passive control devices are preferred toactive ones
Data sources Communication plan, trackability plan, guidelines
Reference ADEME (2014a)

238 Appendix
Indicator G2.1 Transitional occupation initiatives BE/CH/FR
Definition The type of transitional occupation to improve andpromote the brownfield and the sector’s image as well asits degree of integration into the final project
Evaluation method Quantitative analysis of planned transitional occupationon the brownfield site
Measurement unit [Qualitative scale]
VL (limit value) The transitional occupation is limited to traditionalactivities replaced without transition by the definitiveoccupation
VA (average value) The transitional occupation consists mainly of traditionalactivities gradually replaced by the definitive occupation
VT (target value) The transitional occupation consists mainly of activitieswith sociocultural added value, some of which areretained within the definitive occupation
VB (best practice value) The transitional occupation consists mainly of activitieswith socio-cultural added value, the majority of whichwill be included in the final occupation
Data sources Plans and data of the project
References OFEV (2010), ADEME (2014b)
Indicator G3.1 Management of construction waste BE/CH/FR
Definition The level of reduction, reuse, recovery, and disposal ofwaste and the adoption of a construction sitemanagement plan, including the preparatory work phase
Evaluation method Qualitative analysis of the waste management plan
Measurement unit [Qualitative scale]
VL (limit value) Waste management is limited to the legal requirementsfor sorting
VA (average value) A waste management plan is put in place, an effort ismade to sort and recover waste off-site
VT (target value) A waste management plan is put in place (sorting andrecovery) and includes a systematic and regularinventory to reuse the materials on-site
VB (best practice value) A comprehensive waste management plan is put in place(sorting, recovery, reuse, and reduction), adopted inadvance by all stakeholders and is an integral part of theconstruction site’s logic
Data sources Plans and data of the project
References SIA (1993), MEEM (2000), Commission Européenne(2008), Association eco-bau (2014), FFB (2014), CCWet al. (2014), Portail construction durable (2015)

Appendix 239
Indicator G3.2 Management of construction disturbances BE/CH/FR
Definition The level of measures put in place to limit disturbance(noise, odours, air quality, cleanliness, traffic, etc.) inorder to coordinate construction work and activities onthe site (first occupants)
Evaluation method Qualitative analysis of the phasing of the project and thecoordination between construction work and activitieson the site
Measurement unit [Qualitative scale]
VL (limit value) The measures put in place only allow compliance withthe legal requirements in terms of disturbance
VA (average value) Some simple measures are put in place to limitdisturbance in order to promote coordination betweenconstruction work and activities
VT (target value) Several measures are put in place to limit disturbance inorder to promote coordination between constructionwork and activities
VB (best practice value) Increased measures integrated into the constructionsite’s logic are put in place to limit disturbance and arefully coordinated with the site’s activities and itssurroundings; the measures are adjusted according to thework’s progress
Data sources Construction site charter
References CCW et al. (2014), OFEV (2016)
Indicator G4.1 Commissioning plan for buildings BE/CH/FR
Definition The level of information, support, and training for usersand managers provided by the commissioning plan ofthe various buildings
Evaluation method Qualitative analysis of the commissioning plan
Measurement unit [Qualitative scale]
VL (limit value) The commissioning plan is limited to informing andeducating users and managers
VA (average value) The commissioning plan includes structured support forusers and managers
VT (target value) The commissioning plan includes training andstructured support for users and managers
VB (best practice value) The commissioning plan includes training andstructured support for users and managers as well ascapitalization of experiences and feedbacks
Data sources Commissioning plan
Reference Ministère de l’égalité des territoires et du logement(2014)

240 Appendix
Process
Indicator G5.1 Degree of participation of population BE/CH/FR
Definition The level of participation of population (futureinhabitants and surrounding residents) in thedecision-making process of the project
Evaluation method Qualitative analysis of the participation of population
Measurement unit [Qualitative scale]
VL (limit value) The level of participation is limited to sharinginformation
VA (average value) The level of participation allows the establishment of aconsultation process (interaction and dialogue)
VT (target value) The level of participation provides consultation andcollaboration process (to agree on a project)
VB (best practice value) The level of participation allows community initiatives;future inhabitants share responsibility for theirimplementation (delegated management)
Data sources Participation charter, guidelines
References Arnstein (1969), ADEME (2014c)
Indicator G6.1 Degree of collaboration of professionals BE/CH/FR
Definition The level of collaboration between differentprofessionals
Evaluation method Qualitative analysis of the collaboration betweendifferent professionals
Measurement unit [Qualitative scale]
VL (limit value) The collaboration is limited to the engagement of thestakeholders within an imposed common framework ofaction
VA (average value) Some measures promote collaboration and enable thedevelopment of a common framework of action
VT (target value) Several measures promote collaboration and enable thedevelopment of a common framework of action
VB (best practice value) Generalized measures promote collaboration and enablethe development of a common framework of actionresulting in a shared vision of the project
Data sources Project management plan, guidelines, organization chart
References Souami (2011), OpenGov (2014), ADEME (2014d)
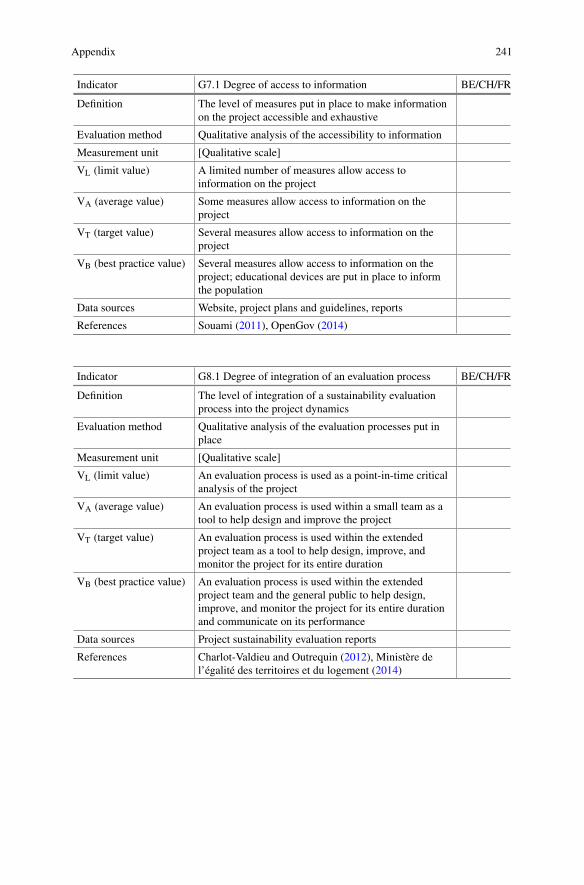
Appendix 241
Indicator G7.1 Degree of access to information BE/CH/FR
Definition The level of measures put in place to make informationon the project accessible and exhaustive
Evaluation method Qualitative analysis of the accessibility to information
Measurement unit [Qualitative scale]
VL (limit value) A limited number of measures allow access toinformation on the project
VA (average value) Some measures allow access to information on theproject
VT (target value) Several measures allow access to information on theproject
VB (best practice value) Several measures allow access to information on theproject; educational devices are put in place to informthe population
Data sources Website, project plans and guidelines, reports
References Souami (2011), OpenGov (2014)
Indicator G8.1 Degree of integration of an evaluation process BE/CH/FR
Definition The level of integration of a sustainability evaluationprocess into the project dynamics
Evaluation method Qualitative analysis of the evaluation processes put inplace
Measurement unit [Qualitative scale]
VL (limit value) An evaluation process is used as a point-in-time criticalanalysis of the project
VA (average value) An evaluation process is used within a small team as atool to help design and improve the project
VT (target value) An evaluation process is used within the extendedproject team as a tool to help design, improve, andmonitor the project for its entire duration
VB (best practice value) An evaluation process is used within the extendedproject team and the general public to help design,improve, and monitor the project for its entire durationand communicate on its performance
Data sources Project sustainability evaluation reports
References Charlot-Valdieu and Outrequin (2012), Ministère del’égalité des territoires et du logement (2014)

References
ADEME Agence de l’Environnement et de la Maîtrise de l’Energie (2002) Eclairer juste. Eclairagepublic routier, urbain, grands espaces, illuminations et cadre de vie
ADEME Agence de l’Environnement et de la Maîtrise de l’Energie(2014a) Biodiversité &reconversion des friches urbaines polluées
ADEMEAgence de l’Environnement et de laMaîtrise de l’Energie (2014b) Assurer une dynamiquede projet. Définir des usages transitoires et/ou alternatifs à la construction de logements
ADEMEAgence de l’Environnement et de laMaîtrise de l’Energie (2014c) Assurer une dynamiquede projet. Impliquer les riverains dans le projet
ADEMEAgence de l’Environnement et de laMaîtrise de l’Energie (2014d) Assurer une dynamiquedu projet. Coordonner les acteurs
ADEME Agence de l’Environnement et de la Maîtrise de l’Energie (2016) Le plan de mobilité,qu’est-ce que c’est? https://www.ademe.fr/entreprises-monde-agricole/reduire-impacts/optimiser-mobilite-salaries/dossier/plan-mobilite/plan-mobilite-quest-cest. Accessed 12 Oct 2020
ADEME Agence de l’Environnement et de la Maîtrise de l’Energie, BRGM Bureau de RecherchesGéologiques et Minières (2015) Outil interactif de pré-sélection des techniques de dépollution.http://www.selecdepol.fr/. Accessed 27 Nov 2020
Agence wallonne de l’air & du climat (2014) Air & Climat. http://www.awac.be/index.php/outils/calculateur-co2. Accessed 13 Nov 2020
Arnstein SR (1969) A ladder of citizen participation. J Am Inst Plan 35:216–224. https://doi.org/10.1080/01944366908977225
ASCEN (2015) Association pour la Sauvegarde du Ciel et de l’Environnment Nocturnes. http://www.ascen.be. Accessed 15 Nov 2020
Association eco-bau (2014) ECO-CFC. Fiches de construction écologique selon le code des fraisde construction (CFC)
AssociationHQE (2015)HQEPerformance - Règles d’application pour l’évaluation environnemen-tale des bâtiments neufs
BBSR Federal Institute for Research on Building, Urban Affairs and Spatial Development (2010)External costs in construction. In: Federal Institute for Research on Building, Urban Affairs andSpatial Development. http://www.bbsr.bund.de/BBSR/EN/Publications/BMVBS/Online/2010/ON172010.html
Berens C (2011) Redeveloping industrial sites: a guide for architects, planners, and developers.Wiley, Hoboken, NJ
Bonanomi L (2000) Vers un urbanisme de la proximité: coordonner développement urbain ettransports. OFCL/EDMZ, Bern
Brecheisen T, Theis T (2015) Life cycle assessment as a comparative analysis toll for sustainablebrownfield redevelopment projects: cumulative energy demand and greenhouse gas emissions.
© The Editor(s) (if applicable) and The Author(s) 2022E. Rey et al., Neighbourhoods in Transition, The Urban Book Series,https://doi.org/10.1007/978-3-030-82208-8
243
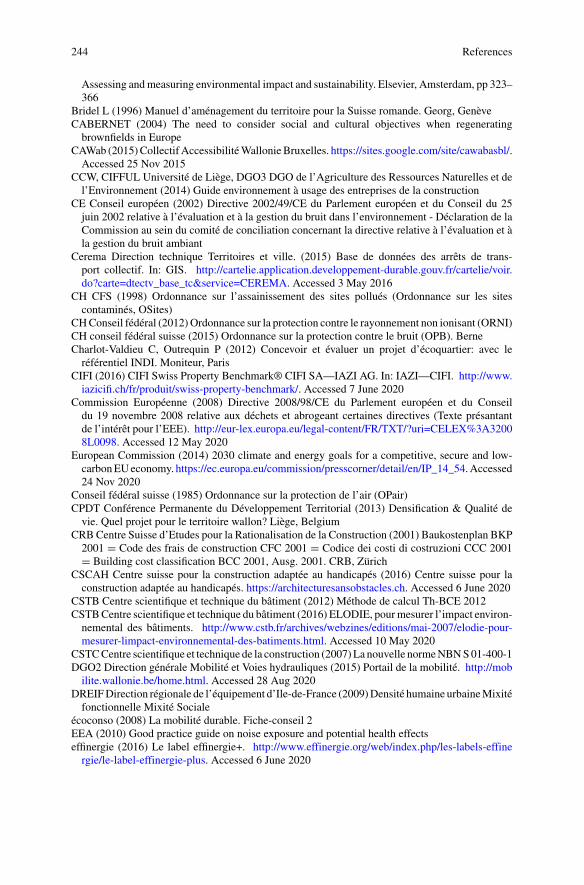
244 References
Assessing andmeasuring environmental impact and sustainability. Elsevier, Amsterdam, pp 323–366
Bridel L (1996) Manuel d’aménagement du territoire pour la Suisse romande. Georg, GenèveCABERNET (2004) The need to consider social and cultural objectives when regeneratingbrownfields in Europe
CAWab (2015)Collectif AccessibilitéWallonieBruxelles. https://sites.google.com/site/cawabasbl/.Accessed 25 Nov 2015
CCW, CIFFUL Université de Liège, DGO3 DGO de l’Agriculture des Ressources Naturelles et del’Environnement (2014) Guide environnement à usage des entreprises de la construction
CE Conseil européen (2002) Directive 2002/49/CE du Parlement européen et du Conseil du 25juin 2002 relative à l’évaluation et à la gestion du bruit dans l’environnement - Déclaration de laCommission au sein du comité de conciliation concernant la directive relative à l’évaluation et àla gestion du bruit ambiant
Cerema Direction technique Territoires et ville. (2015) Base de données des arrêts de trans-port collectif. In: GIS. http://cartelie.application.developpement-durable.gouv.fr/cartelie/voir.do?carte=dtectv_base_tc&service=CEREMA. Accessed 3 May 2016
CH CFS (1998) Ordonnance sur l’assainissement des sites pollués (Ordonnance sur les sitescontaminés, OSites)
CHConseil fédéral (2012)Ordonnance sur la protection contre le rayonnement non ionisant (ORNI)CH conseil fédéral suisse (2015) Ordonnance sur la protection contre le bruit (OPB). BerneCharlot-Valdieu C, Outrequin P (2012) Concevoir et évaluer un projet d’écoquartier: avec leréférentiel INDI. Moniteur, Paris
CIFI (2016) CIFI Swiss Property Benchmark® CIFI SA—IAZI AG. In: IAZI—CIFI. http://www.iazicifi.ch/fr/produit/swiss-property-benchmark/. Accessed 7 June 2020
Commission Européenne (2008) Directive 2008/98/CE du Parlement européen et du Conseildu 19 novembre 2008 relative aux déchets et abrogeant certaines directives (Texte présantantde l’intérêt pour l’EEE). http://eur-lex.europa.eu/legal-content/FR/TXT/?uri=CELEX%3A32008L0098. Accessed 12 May 2020
European Commission (2014) 2030 climate and energy goals for a competitive, secure and low-carbonEUeconomy. https://ec.europa.eu/commission/presscorner/detail/en/IP_14_54.Accessed24 Nov 2020
Conseil fédéral suisse (1985) Ordonnance sur la protection de l’air (OPair)CPDT Conférence Permanente du Développement Territorial (2013) Densification & Qualité devie. Quel projet pour le territoire wallon? Liège, Belgium
CRBCentre Suisse d’Etudes pour la Rationalisation de la Construction (2001) Baukostenplan BKP2001 = Code des frais de construction CFC 2001 = Codice dei costi di costruzioni CCC 2001= Building cost classification BCC 2001, Ausg. 2001. CRB, Zürich
CSCAH Centre suisse pour la construction adaptée au handicapés (2016) Centre suisse pour laconstruction adaptée au handicapés. https://architecturesansobstacles.ch. Accessed 6 June 2020
CSTB Centre scientifique et technique du bâtiment (2012) Méthode de calcul Th-BCE 2012CSTBCentre scientifique et technique du bâtiment (2016) ELODIE, pourmesurer l’impact environ-nemental des bâtiments. http://www.cstb.fr/archives/webzines/editions/mai-2007/elodie-pour-mesurer-limpact-environnemental-des-batiments.html. Accessed 10 May 2020
CSTCCentre scientifique et technique de la construction (2007)La nouvelle normeNBNS01-400-1DGO2 Direction générale Mobilité et Voies hydrauliques (2015) Portail de la mobilité. http://mobilite.wallonie.be/home.html. Accessed 28 Aug 2020
DREIFDirection régionale de l’équipement d’Ile-de-France (2009)Densité humaine urbaineMixitéfonctionnelle Mixité Sociale
écoconso (2008) La mobilité durable. Fiche-conseil 2EEA (2010) Good practice guide on noise exposure and potential health effectseffinergie (2016) Le label effinergie+. http://www.effinergie.org/web/index.php/les-labels-effinergie/le-label-effinergie-plus. Accessed 6 June 2020

References 245
effinergie (2017) Le label Bepos Effinergie 2017. https://www.effinergie.org/web/les-labels-effinergie/le-label-bepos-bepos-effinergie-2017. Accessed 6 June 2020
Etat de Vaud, Département des infrastructures, Etat de Genève, Département de l’intérieur, del’agriculture et de l’environnement (2014) Plan de Mobilité d’Entreprise
FFB Fédération française du bâtiment (2014) Déchets de chantier - Les réponses aux questionsque vous vous posez. https://www.preventionbtp.fr/Media/Files/Formation/Supports-formation/36532/Dechets-de-chantier-les-reponses-aux-questions-que-vous-vous-posez-FFB. Accessed 12May 2020
Fouchier V (1997) Les densités urbaines et le développement durable, le cas de l’Ile-de-France etdes villes nouvelles. Editions du SGVN, Paris
FPI Fédération promoteurs immobiliers (2016) Les indices et index de l’immobilier. http://fpifrance.fr/fr/content/les-indices-et-index-de-limmobilier. Accessed 7 June 2020
FRAPNA (2013) Cahier de recommandation. Eclairage extérieur. GrenobleGasser P (2003) Trafic lent et qualité de l’habitat. In: ASPAN-SO. ASPAN-SO, LausanneGouvernement wallon (2004) Arrêté du Gouvernement wallon relatif à l’évaluation et la gestion dubruit dans l’environnement
Hertig J-A (2006) Etudes d’impact sur l’environnement. PPUR presses polytechniques, LausanneIAURIF Institut d’aménagement et d’urbanisme d’île-de-France (2005a) Note rapide surl’occupation du sol 1. Les repères historiques.
IAURIF Institut d’aménagement et d’urbanisme d’île-de-France (2005b) Note rapide surl’occupation du sol 2. Les indicateurs de densité.
IAURIF Institut d’aménagement et d’urbanisme d’île-de-France (2005c) Note rapide surl’occupation du sol 3. Formes urbaines et densités.
ICNIRPCommission internationale pour la protection contre les rayonnements non ionisants (2001)Guide pour l’établissement de limites d’exposition aux champs électriques, magnétiques etélectromagnétiques
IES Daylight Metrics Commitee (2012) Approved method: IES Spatial Daylight Autonomy (sDA)and Annual Sunlight Exposure (ASE). IES Illuminating Engineering Society, New York
INIES (2016) Les données environnementales et sanitaires de référence pour le bâtiment. http://www.inies.fr/accueil/. Accessed 10 May 2020
Insee Institut national de la statistique et des études économiques (2016) Population. http://www.insee.fr/fr/themes/theme.asp?theme=2. Accessed 6 June 2020
irCELine (2015) Dioxyde d’azote—informing you on ambiant air quality in the Belgian Regions.http://www.irceline.be/fr/qualite-de-lair/mesures/dioxyde-dazote. Accessed 14 July 2020
IWEPS Institut wallon de l’évaluation de la prospective et de la statistique (2011) Peuplement etdensité de population. http://www.iweps.be/peuplement-et-densite-de-population. Accessed 17Nov 2020
Lebert A, Lasvaux S, Grannec F, et al (2014) Expérimentation HQE Performance 2012–2013 -Capitalisation des résultats - Analyse statistique
Legifrance (2016) Code de l’urbanismeLiman U, Roulet Y, Fabris-Donzel A, et al (2014) SméO, Société à 2000 wattsLotteau M, Loubet P, Pousse M et al (2015) Critical review of life cycle assessment (LCA) for thebuilt environment at the neighborhood scale. Build Environ 93(Part 2):165–178. https://doi.org/10.1016/j.buildenv.2015.06.029
MEDDE Ministère de l’Ecologie du Développement Durable et de l’Energie (2014) Bilan de laqualité de l’air en France en 2013 et principales tendances observées sur la période 2000–2013
MEEMMinistère de l’environnement de l’énergie et de lamer (2000)Circulaire du 15/02/00 relativeà la planification de la gestion des déchets de chantier du bâtiment et des travaux publics (BTP)
MEEMMinistère de l’environnement de l’énergie et de la mer (2012) Les cahiers des clauses tech-niques générales—CCTG. http://www.marche-public.fr/Marches-publics/Definitions/Entrees/CCTG.htm. Accessed 7 June 2020

246 References
MEEM Ministère de l’environnement de l’énergie et de la mer (2014) La pollution de l’air par lesoxydes d’azote: observation et statistiques. http://www.donnees.statistiques.developpement-durable.gouv.fr/lesessentiels/essentiels/air-azote.htm. Accessed 9 May 2020
MEEM Ministère de l’environnement de l’énergie et de la mer (2016) Accessibilité. http://www.developpement-durable.gouv.fr/-Accessibilite-.html. Accessed 12 May 2020
Meunier-Chabert M (2012) Les déplacements dans les écoquartiers: de l’expérimentation auxbonnes pratiques, Editions du Certu. Certu, Lyon
Minergie (2014) Minergie - Home. https://www.minergie.ch/fr/. Accessed 23 July 2020Ministère de l’écologie, du développement durable et de l’énergie,Ministère délégué aux transports,à la mer et à la pêche (2015) Plan d’action mobilités actives (PAMA)
Ministère de l’égalité des territoires et du logement (2014) Dossier de Labellisation. Label écoquartier.
MLHD Ministère du Logement et de l’Habitat durable (2016) Le projet de loi “Égalité etCitoyenneté”: la mixité sociale dans l’habitat
Mobilservice, Kanton Aargau (2009) Gestion de la mobilité. Extrait du guide “Mobilitätmanage-ment in Unternehmen”
mobitool (2016)mobitool - pour unemobilité durable des entreprises. http://mobitool.ch/. Accessed22 Jan 2020
Notaires de France (2016) Baromètre immobilier des notaires de France : évolution et tendance desprix immobiliers. https://barometre.immobilier.notaires.fr/. Accessed 7 June 2020
OFEFP Office fédéral de l’environnement des forêts et du paysage (2005) Recommandations pourla prévention des émissions lumineuses. Berne
OFEV Office fédéral de l’environnement (2010) Guide sur les affectations transitoires. BerneOFEVOffice fédéral de l’environnement (2016) Projets de construction et sites pollués. Un modulede l’aide à l’exécution “Gestion générale des sites pollués”
OFL Office fédéral du logement (2000) Concevoir, évaluer et comparer des logements. Systèmed’évaluation de logements SEL, 2ième édition 2008
OFROU Office fédéral des routes, Mobilité piétonne Suisse (2014) Réseaux de cheminementspiétons. Manuel de planification. Version pour la consultation
OFS Office fédéral de la statistique (2013) Evolution de la pollution dans différents typesd’emplacements
OpenGov (2014) Open Government Partnership. In: Open Government Partnership. https://www.opengovpartnership.org. Accessed 24 Feb 2020
Portail construction durable (2015) Gestion des déchets de construction et de démolition. https://www.portailconstructiondurable.be. Accessed 27 Nov 2017
PUCA, Mialet F (2011) Mixité fonctionnelle et flexibilité programatiqueReiter S (2007) Elaboration d’outils méthodologiques et techniques d’aide à la conceptiond’ambiances urbaines de qualité pour favoriser le développement durable des villes. Universitécatholique de Louvain
RF, Borloo J-L, Apparu B (2010a) Arrêté du 26 octobre 2010 relatif aux caractéristiques thermiqueset aux exigences de performance énergétique des bâtiments nouveaux et des parties nouvelles debâtiments
RF, Borloo J-L, Apparu B (2010b) Décret n° 2010-1269 du 26 octobre 2010 relatif auxcaractéristiques thermiques et à la performance énergétique des constructions
RF, Gayssot J-C, Aubry M, Besson L (1999) Arrêté du 30 juin 1999 relatif aux caractéristiquesacoustiques des bâtiments d’habitation
RF, Olin N, Perben D (2006) Arrêté du 4 avril 2006 relatif à l’établissement des cartes de bruit etdes plans de prévention du bruit dans l’environnement
Roulet C-A (2008) Santé et qualité de l’environnement intérieur dans les bâtiments, 2e éd. mise àjour et complétée. Presses Polytechniques et Universitaires Romandes, Lausanne
Ruzicka-Rossier M, Kotchi M (2002) Densité et mixité. Analyse d’une portion d’agglomération del’Ouest lausannois. Lausanne

References 247
Schädler S, Morio M, Bartke S et al (2011) Designing sustainable and economically attractivebrownfield revitalization options using an integrated assessmentmodel. J EnvironManag 92:827–837. https://doi.org/10.1016/j.jenvman.2010.10.026
SIA Société Suisse des Ingénieurs et des Architectes (2004a) Construction durable - bâtimentSIA Société Suisse des Ingénieurs et des Architectes (2004b) Aménagement du territoire - Mesuresde l’utilisation du sol = Raumplanung - Nutzungsziffern. SIA, Zurich
SIA Société Suisse des Ingénieurs et des Architectes (2004c) SNARC - Méthode pour l’évaluationde l’écologie dans les projets d’architecture. SIA, Zurich
SIA Société Suisse des Ingénieurs et des Architectes (2009) SIA 380/1:2009 L’énergie thermiquedans le bâtiment. Zurich
SIA Société Suisse des Ingénieurs et des Architectes (2011) SIA 2040 “La voie SIA vers l’efficacitéénergétique”
SIA Société Suisse des Ingénieurs et des Architectes (2007) Installations de ventilation etclimatisation - Basses générales et performances requises. SIA, Zürich
SIA Société Suisse des Ingénieurs et des Architectes (1993) Gestion des déchets de chantier lorsde travaux de construction, de transformation et de démolition, Ed. de 1993. SIA, Zurich
SIA Société Suisse des Ingénieurs et des Architectes (2013) Prévention des émissions inutiles delumière à l’extérieur. SIA, Zurich
Sidler O, MAFMutuelle des Architectes Français assurances (2013) Le confort d’été. Mutuelle desArchitectes Français assurances
SNBS (2013) SNBS - Standard de construction durable suisse - Bâtiment. Un projet précurseur despouvoirs publics et des milieux économiques pour le développement durable.
Souami T (2011) Ecoquartiers secrets de fabrication. Analyse critique d’exemples européens, 2eEdition. Les Carnets de l’Info, Paris
SPF Economie (2014) Prix de l’immobilier - Statistiques & Analyses. https://economie.fgov.be/fr.Accessed 7 June 2020
SPF Santé publique Sécurité de la Chaine alimentaire et environnement, Service Politique desproduits de la DG Environnement (2012) Les champs électromagnétiques et la santé. Votre guidedans le paysage électromagnétique
SPW Service public de Wallonie (2011) Quantifier les besoins de stationnement privé dans le cadrede projets immobiliers en Wallonie. Guide méthodologique
SPW Service public de Wallonie (2014) CCTB - Cahier des charges type bâtiments 2022, 01.02SPW Service public de Wallonie (2015) Stationnement 4 - Besoins de stationnement de voitures etprojets immobiliers: quelle stratégie?, SPW Editions. Wallonie
SPW Service public de Wallonie, DGO4 Direction générale opérationnelle- aménagement du terri-toire Logement, Patrimoine et Energie, ULg Université de Liège, CIFFUL Université de Liège(2015) Le guide PEB 2015
Swissenergy, Ville de Zürich, SIA (2014) Concept pour l’établissement du bilan de la société à2000 watts
Tarzia V (2003) European common indicators—towards a local sustainability profileTeller J (2009) Développement de l’entre soi communautaire dans les espaces résidentielspériurbains. Déviance Et Société 33:547. https://doi.org/10.3917/ds.334.0547
Teller J, Marique A-F, Loiseau V, et al (2014) Un référentiel wallon sur les quartiers durables.SPW—DGO4
UE Union européenne (2010) Directive 2010/31/UE sur la performance énergétique des bâtimentsUPSIUnion professionnelle du secteur immobilier (2016)Une fédération pour l’immobilier - UPSI-BVS. http://upsi.be/fr/organisation/une-federation-pour-limmobilier/. Accessed 7 June 2016
USECE Union suisse des experts cantonaux en matière d’évaluation des immeubles, SVKG (eds)(2012) Le manuel suisse de l’estimateur : le manuel pédagogique global et axé sur la pratique,relatif aux méthodes d’évaluation les plus importantes de Suisse de biens immobiliers, 4ème éd.,actualisé et élargie en 2012. Sekretariat SVKG, Aarau
VSS Association suisse des professionnels de la route et des transports (1993) Stationnement -Besoin, limite, besoin réduit, offre

248 References
Wallonie (2014) Oser, innover, rassembler 2014–2019WHO World Health Organization (2005) Air quality guidelines—global update 2005WHO World Health Organization (2009) Night noise guidelines for EuropeWüest & Partner (2015) Immo-Monitoring 2015, Printemps. Verlag W&P, Genève
Open Access This book is licensed under the terms of the Creative Commons Attribution 4.0International License (http://creativecommons.org/licenses/by/4.0/), which permits use, sharing,adaptation, distribution and reproduction in any medium or format, as long as you give appropriatecredit to the original author(s) and the source, provide a link to the Creative Commons license andindicate if changes were made.
The images or other third partymaterial in this bookare included in the book’sCreativeCommonslicense, unless indicated otherwise in a credit line to the material. If material is not included in thebook’s Creative Commons license and your intended use is not permitted by statutory regulation orexceeds the permitted use, you will need to obtain permission directly from the copyright holder.