Flood Risk Assessment of Residential Neighbourhoods in ...
13
Environment and Natural Resources Research; Vol. 6, No. 2; 2016 ISSN 1927-0488 E-ISSN 1927-0496 Published by Canadian Center of Science and Education 115 Flood Risk Assessment of Residential Neighbourhoods in Calabar Metropolis, Cross River State, Nigeria Benedict E. Ojikpong 1 , Bassey E. Ekeng 2 , Ukpali E. Obongha 3 & Samuel I. Emri 4 1 Department of Urban and Regional Planning, Cross River University of Technology, Calabar, Nigeria Correspondence: Benedict E. Ojikpong, Department of Urban and Regional Planning, Cross River University of Technology, Calabar, Nigeria. E-mail: [email protected] Received: November 5, 2015 Accepted: November 21, 2015 Online Published: May 23, 2016 doi:10.5539/enrr.v6n2p115 URL: http://dx.doi.org/10.5539/enrr.v6n2p115 Abstract The study is aimed at examining the vulnerability of some residential neighbourhoods in Calabar to the menace of flooding with a view to determining residential areas of high, medium and low flood risk. Two hypotheses were formulated such as: there is no significant relationship between the magnitude of flood, and the vulnerability of residential neighbourhoods and the elements-at-risk to flood in residential neighbourhoods in Calabar do not vary significantly according to the topography of the area. The major primary data were obtained from the metric measurement of the coverage of flood and the assessment of the numerical value of the residential buildings considered vulnerable to flood within the areas measured. Secondary data were also obtained from the collection of both published and unpublished materials and data on flooded buildings and displaced persons were also obtained from the State Emergency Management Agency (SEMA), Calabar. The data were analyzed using descriptive statistics and hypotheses tested using the regression coefficient of the least square method and scatter grams for prediction. The results of the hypotheses were found to be significant as the magnitude of flood determined the vulnerability of some residential neighbourhoods. Vulnerability was found to be higher in low lying residential neighbourhoods. The study, however, recommends among others, planned and autonomous adaptation responses, flood plain zoning to urban agriculture, landscaping and recreational uses. Proper channelization of Calabar urban drainage system, stringent flood control legislation, and development control measures should be enforced so as to discourage people from building on or near flood-prone areas of Calabar. Keywords: flood risk, vulnerability, residential neighbourhoods 1. Introduction Flood is among the most devastating natural hazards in the world claiming lives and property more than any other natural phenomena (Ologunorisa, 2006). In the past decade in Nigeria, thousands of lives and property worth millions of naira have been lost directly or indirectly from flooding every year. In most urban centers of Nigeria such as Lagos, Port Harcourt, and Calabar, human population increase is high thus resulting to exploding cities (Oyesiku, 2009). This results in congestion of people and buildings leading to increased risk of flooding. In Calabar for instance over 3000 buildings were affected by flood, displacing about 34000 people in the year 2011(SEMA, 2013). Landscaping in paved areas, narrow drainage channels, streams and channel obstruction due to poor waste disposal habit and other human activities at flood plains are considered to be the major causes of flood. Flooding in urban areas and River basins is intensifying due to rapid urbanization which is causing a major change in rainfall-runoff phenomenon and the drainage system as well. Flooding primarily occurs because of drainage congestion of inland flow and/or over bank flow of river during severe rainfall event. The overland flow pattern is becoming complex due to huge structural development, and therefore, the correct prediction of surface runoff is becoming a challenging issue (Ologunorisa, 2006). Flood is an excess of water on land that is normally dry and is a situation where the inundation is caused by high flow, or over flow of water in an established watercourse, such as a river, stream, drainage channel, or pond of water at or near the point where the rain falls.
-
Upload
khangminh22 -
Category
Documents
-
view
1 -
download
0
Transcript of Flood Risk Assessment of Residential Neighbourhoods in ...
Environment and Natural Resources Research; Vol. 6, No. 2; 2016 ISSN 1927-0488 E-ISSN 1927-0496
Published by Canadian Center of Science and Education
115
Flood Risk Assessment of Residential Neighbourhoods in Calabar Metropolis, Cross River State, Nigeria
Benedict E. Ojikpong1, Bassey E. Ekeng2, Ukpali E. Obongha3 & Samuel I. Emri4 1 Department of Urban and Regional Planning, Cross River University of Technology, Calabar, Nigeria Correspondence: Benedict E. Ojikpong, Department of Urban and Regional Planning, Cross River University of Technology, Calabar, Nigeria. E-mail: [email protected] Received: November 5, 2015 Accepted: November 21, 2015 Online Published: May 23, 2016 doi:10.5539/enrr.v6n2p115 URL: http://dx.doi.org/10.5539/enrr.v6n2p115 Abstract The study is aimed at examining the vulnerability of some residential neighbourhoods in Calabar to the menace of flooding with a view to determining residential areas of high, medium and low flood risk. Two hypotheses were formulated such as: there is no significant relationship between the magnitude of flood, and the vulnerability of residential neighbourhoods and the elements-at-risk to flood in residential neighbourhoods in Calabar do not vary significantly according to the topography of the area. The major primary data were obtained from the metric measurement of the coverage of flood and the assessment of the numerical value of the residential buildings considered vulnerable to flood within the areas measured. Secondary data were also obtained from the collection of both published and unpublished materials and data on flooded buildings and displaced persons were also obtained from the State Emergency Management Agency (SEMA), Calabar. The data were analyzed using descriptive statistics and hypotheses tested using the regression coefficient of the least square method and scatter grams for prediction. The results of the hypotheses were found to be significant as the magnitude of flood determined the vulnerability of some residential neighbourhoods. Vulnerability was found to be higher in low lying residential neighbourhoods. The study, however, recommends among others, planned and autonomous adaptation responses, flood plain zoning to urban agriculture, landscaping and recreational uses. Proper channelization of Calabar urban drainage system, stringent flood control legislation, and development control measures should be enforced so as to discourage people from building on or near flood-prone areas of Calabar. Keywords: flood risk, vulnerability, residential neighbourhoods 1. Introduction Flood is among the most devastating natural hazards in the world claiming lives and property more than any other natural phenomena (Ologunorisa, 2006). In the past decade in Nigeria, thousands of lives and property worth millions of naira have been lost directly or indirectly from flooding every year. In most urban centers of Nigeria such as Lagos, Port Harcourt, and Calabar, human population increase is high thus resulting to exploding cities (Oyesiku, 2009). This results in congestion of people and buildings leading to increased risk of flooding. In Calabar for instance over 3000 buildings were affected by flood, displacing about 34000 people in the year 2011(SEMA, 2013). Landscaping in paved areas, narrow drainage channels, streams and channel obstruction due to poor waste disposal habit and other human activities at flood plains are considered to be the major causes of flood. Flooding in urban areas and River basins is intensifying due to rapid urbanization which is causing a major change in rainfall-runoff phenomenon and the drainage system as well. Flooding primarily occurs because of drainage congestion of inland flow and/or over bank flow of river during severe rainfall event. The overland flow pattern is becoming complex due to huge structural development, and therefore, the correct prediction of surface runoff is becoming a challenging issue (Ologunorisa, 2006). Flood is an excess of water on land that is normally dry and is a situation where the inundation is caused by high flow, or over flow of water in an established watercourse, such as a river, stream, drainage channel, or pond of water at or near the point where the rain falls.
www.ccsenet.org/enrr Environment and Natural Resources Research Vol. 6, No. 2; 2016
116
According to Abua and Eze (2002), two types of floods are common in Nigeria namely flash and perennial floods. Floods have affected some residential neighbourhoods in the metropolitan areas of Nigeria. This has posed a lot of danger to lives and property and thereafter, renders some people vulnerable. In Calabar for instance, the effect of flood could be felt on the disruption of economic activities, traffic problems, destruction of infrastructure and buildings, prevention of human and vehicular movements, psychological impact on human beings, environmental effect and degradation (such as damage to surroundings, forests, bridges, wild life, urban community trees, water bodies, shrubs, grass, turfs, and vegetables). Flooding in Calabar is also known to affect the planned and unplanned environments. So far the assessment of the risk of residential neigbourhoods to floods has not been determined and this is the main thrust of this research. 1.1 Aim and Objectives The aim of this study is to examine the vulnerability of some residential neighbourhoods in Calabar to the menace of flooding with a view to determining residential areas of low, medium and high flood risk zones. The specific objectives of the study are: (1) To define the boundaries of residential neigbourhoods affected by flood in Calabar Metropolis. (2) To determine the impact of flood in relation to the topography of the affected residential neighbourhoods. (3) To evaluate the level of vulnerability of residential neighbourhoods to the magnitude of flood. (4) To proffer recommendations through predictive models on management of flood riskand flood incidence in
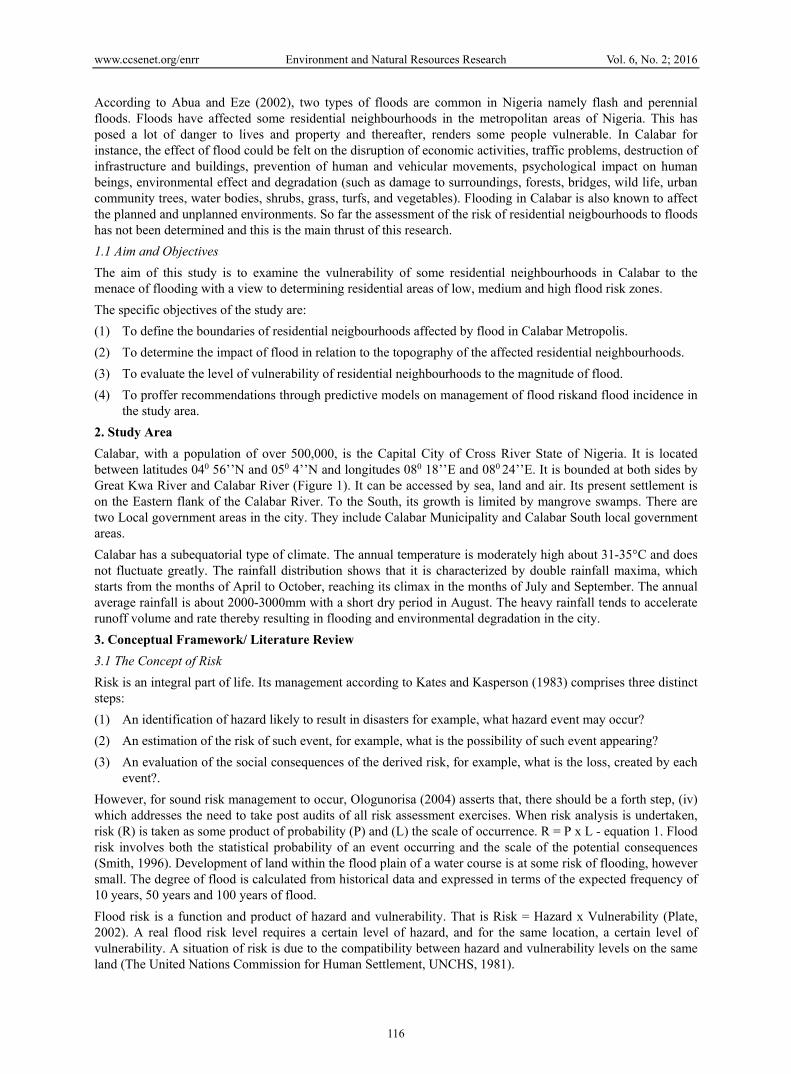
the study area. 2. Study Area Calabar, with a population of over 500,000, is the Capital City of Cross River State of Nigeria. It is located between latitudes 040 56’’N and 050 4’’N and longitudes 080 18’’E and 080 24’’E. It is bounded at both sides by Great Kwa River and Calabar River (Figure 1). It can be accessed by sea, land and air. Its present settlement is on the Eastern flank of the Calabar River. To the South, its growth is limited by mangrove swamps. There are two Local government areas in the city. They include Calabar Municipality and Calabar South local government areas. Calabar has a subequatorial type of climate. The annual temperature is moderately high about 31-35°C and does not fluctuate greatly. The rainfall distribution shows that it is characterized by double rainfall maxima, which starts from the months of April to October, reaching its climax in the months of July and September. The annual average rainfall is about 2000-3000mm with a short dry period in August. The heavy rainfall tends to accelerate runoff volume and rate thereby resulting in flooding and environmental degradation in the city. 3. Conceptual Framework/ Literature Review 3.1 The Concept of Risk Risk is an integral part of life. Its management according to Kates and Kasperson (1983) comprises three distinct steps: (1) An identification of hazard likely to result in disasters for example, what hazard event may occur? (2) An estimation of the risk of such event, for example, what is the possibility of such event appearing? (3) An evaluation of the social consequences of the derived risk, for example, what is the loss, created by each
event?. However, for sound risk management to occur, Ologunorisa (2004) asserts that, there should be a forth step, (iv) which addresses the need to take post audits of all risk assessment exercises. When risk analysis is undertaken, risk (R) is taken as some product of probability (P) and (L) the scale of occurrence. R = P x L - equation 1. Flood risk involves both the statistical probability of an event occurring and the scale of the potential consequences (Smith, 1996). Development of land within the flood plain of a water course is at some risk of flooding, however small. The degree of flood is calculated from historical data and expressed in terms of the expected frequency of 10 years, 50 years and 100 years of flood. Flood risk is a function and product of hazard and vulnerability. That is Risk = Hazard x Vulnerability (Plate, 2002). A real flood risk level requires a certain level of hazard, and for the same location, a certain level of vulnerability. A situation of risk is due to the compatibility between hazard and vulnerability levels on the same land (The United Nations Commission for Human Settlement, UNCHS, 1981).
www.ccsenet.org/enrr Environment and Natural Resources Research Vol. 6, No. 2; 2016
117
Figure 1. Map of Calabar showing the study area
3.2 The Concept of Vulnerability The concept of vulnerability is central in discussion of environmental risk in the context of climate change and offers a vulnerable framework for this study. The Intergovernmental Panel on Climate Change (IPCC, 2008) defines vulnerability as the extent to which a natural or social system is susceptible to sustaining damage from climate change. Vulnerability is a function of the sensitivity of a system to changes in climate and ability to adapt the system to changes in climate. Cong et al. (2008) noted that the two factors that contribute to vulnerability are largely determined by the development context which has such a strong influence on households’ income, education and access to information on people’s exposure to environmental hazards in their homes and work places on the quality and extent of provision for infrastructure and services. In urban areas, vulnerability is also influenced by the extent and quality of infrastructure and services, especially for vulnerable population (UNFCCC, 2008). Three perspectives of vulnerability from climate change and hazard research have been identified, which combined address the dynamic and integrated nature of social and environmental vulnerability. The first perspective characterizes vulnerability in terms of exposure to hazardous events and how these affect people and structures. The second perspective views vulnerability as basically a human relationship and not a physical one, this is, social vulnerability, while the third integrates both the physical events and the underlying causal characteristic of population that lead to risk exposure and limited
www.ccsenet.org/enrr Environment and Natural Resources Research Vol. 6, No. 2; 2016
118
capacity of communities to respond. The integrated vulnerability approach is useful in cities where inherent susceptibilities and resiliencies of both biophysical and social environments interact to result in observed vulnerability (Few et al., 2006). However, the concepts of risk and vulnerability are both adopted into this study. The study is out to assess the risk of flood on the residential neighbourhoods in Calabar Metropolis. The concept of risk addresses hazards and vulnerabilities as related to the study, while the concept of vulnerability takes assessment of the extent of damage to natural and social systems by flood. On this note, the two concepts are highly applicable and useful in this study. 3.3 Literature Review Flood risk has been researched on by a number of authors in different parts of the globe. Hogue et al. (1997) for instance, undertook an assessment of the flood risk involved with cyclones and storm surges in Chitagong, Bangladesh through depth measurement. The study finds that the extent of storm surge flooding and the related risk in the Metropolitan area was significant. To identify the risk, the depth and extent of storm surge flooding for different probabilities of occurrence have been predicted and were expressed in a hazard index. The city area was divided into five categories of land use:- Industrial area, commercial area, planned housing area, unplanned housing area and mixed area. For each, population density and economic importance of the areas have been considered and were expressed as an important index. Using the hazard index, the risk for each area was calculated. In the analysis, the whole city was classified into four categories, the low risk area, the medium risk area, the high risk area and the severe flood risk area. Most Cities in developing countries especially in Africa have a large proportion of their population in informal settlements, which developed outside of the control of authorities charged with the regulation of land uses and building construction (Rakodi & Leduka, 2003). Officials formally charged with land delivery for housing have largely failed to meet the needs of the people. Thus the disadvantaged and the poor have little or no access to land for housing. In Lusaka, Zambia, attempts are made to allocate free land to people in or adjacent to the regularized informal settlements, but this requires good political or official connections which are beyond the reach of the poor (Mwange, 2006). It is hard therefore to stop people from building houses where they see vacant land. Since rain in Zambia is seasonal, many marshy areas are built on during dry periods only to be flooded when the rains come, displacing mostly the poor who build in such areas (Chooma, 2006). In considering some specific effects of flood, it is observed that in the autumn of 2000 in the United Kingdom 16,000 residential properties were affected by flood, some more than once. In 2003, about 1,200 properties were flooded in Central and Southern England (Bada, 1997). In Nigeria, the flood disaster of 1980 in the city of Ibadan rendered 50,000 people homeless and property worth millions of naira were destroyed. In 1988 over 40,000 people were rendered homeless in Kano state and another 2,000 people displaced in Dekina, Kogi State. In Nassarawa state, 1,000 people were rendered homeless in floods that ravaged Pategi, Kpada and Gbogdondogi Local Government Areas in May 1997 (UNDP, 2005). Ologunorisa (2004) undertook a flood-risk assessment of the Niger-Delta region of Nigeria using a combination of hydrological techniques considering some measurable physical characteristics of flooding and socio-economic techniques of vulnerability. Some of the physical characteristics of flooding selected and measured include depth of flooding (metres), duration of flood (hours/ weeks), perceived frequency of flood occurrence, and relief or elevation (metres) while the vulnerability factors selected and measured include proximity to hazard source, land use or dominant economic activity and adequacy of flood alleviation schemes and perceived extent of flood damage. He derived rating scale for the nine parameters selected, and 18 settlements randomly selected across the three ecological zones in the region were rated on the basis of the parameters. Three flood risk zones emerged from the analysis. These are the severe flood risk, moderate flood risk, and low flood risk zones. This methodology could be adopted in this study based on its validity and clarity. Similarly, Oriola (2000) carried out flood studies in Abeokuta, Ogun state through a careful observation method. He observed that various socio-cultural activities have promoted flooding in many Nigerian urban environments. These activities are characterized by stream or river channel encroachment and abuse, increased paved surfaces and poor solid waste disposal techniques due to high level of illiteracy, a low degree of community awareness, poor environmental education, ineffective town planning laws, and poor environmental management. He argued that government, at various levels needs to address these issues. Oriola (2000) concluded that flood risk in Abeokuta urban environment was a function of the following factors: land use pattern, refuse disposal habits, the nature of the surroundings, distance of buildings from the course of streams, the relief or terrain, slope, gradient, and rainfall amount and duration. The rainfall amount and duration
www.ccsenet.org/enrr Environment and Natural Resources Research Vol. 6, No. 2; 2016
119
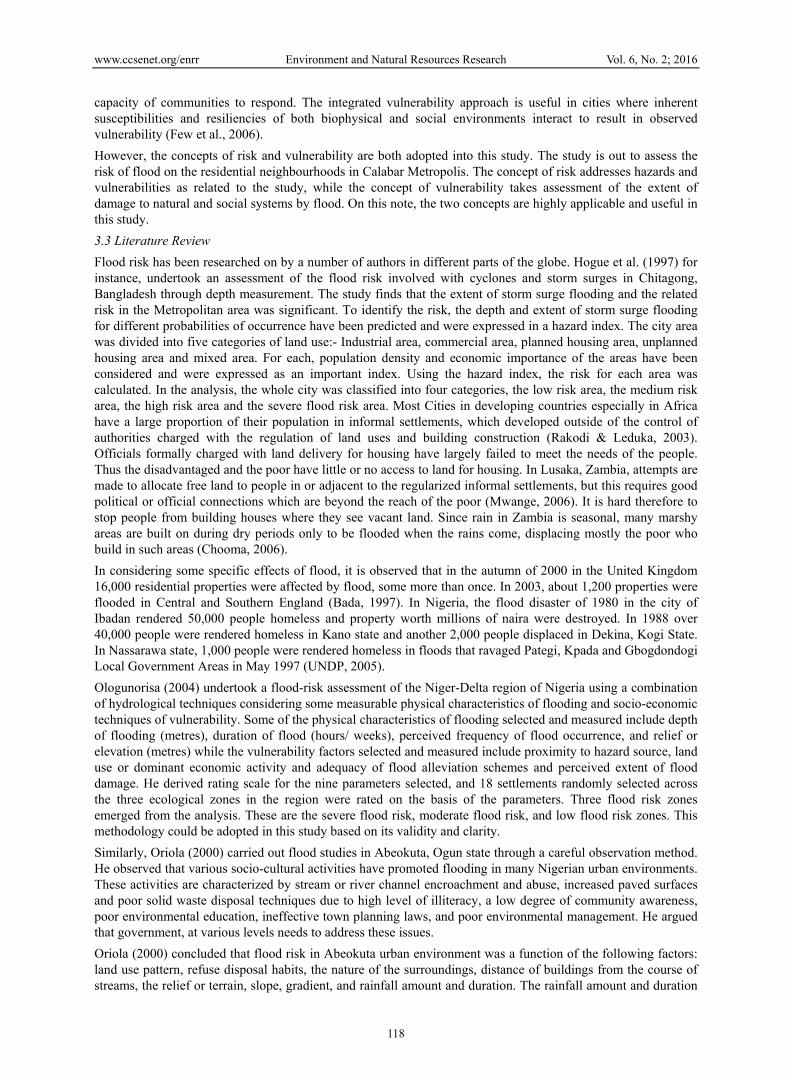
can also be carefully observed in Calabar. For instance, the State Emergency Management Agency reported that on July 23, 2011, rainfall lasting 5 hours resulted in serious flooding of some parts of Calabar city. Durotoye (2009), through observation methods highlighted the increasing tendency of human occupation of potential hazards area in the Niger-Delta region. She observed that the physical condition and natural processes prevailing in the Niger-Delta environment that impinges on the people living there are numerous such as flooding, marine incursion, coastal recession, and subsistence. This research will rely on some of these techniques applied in other areas for the study of flood risk in Calabar. 4. Method of Study The research adopted survey and regression approaches. The survey approach involved the metric measurement of the magnitude of flood by taking linear measurements across the areas covered by the hazard in the affected residential neighbourhoods. The vulnerability of residential neighbourhoods was determined through assessment of the numerical value of the affected residential buildings and other structures in November, 2013. Through the regression approach the relationship between the magnitude of flood and the vulnerability of residential neighbourhoods was measured. The variation of flood risk was also determined using the simple linear regression analysis.
Figure 2. Map of Calabar showing the 18 residential neighbourhoods
www.ccsenet.org/enrr Environment and Natural Resources Research Vol. 6, No. 2; 2016
120
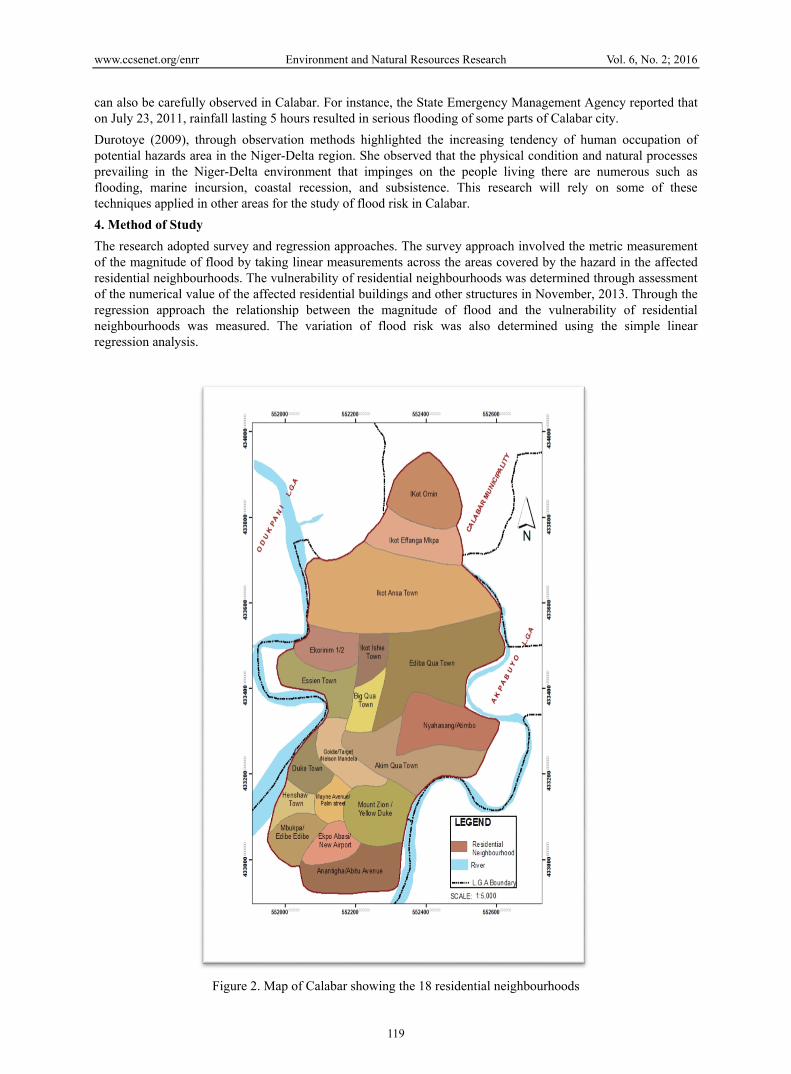
Table 1. Some selected residential neighbourhoods in calabar metropolis S/N NEIGBOURHOOD NAME LOCATION
1. IkotAnsa Town Calabar Municipal 2. IkotIshie Town Calabar Municipal 3. Ediba Qua Town Calabar Municipal 4. Big Qua Town Calabar Municipal 5. Nyahasang/Atimbo Calabar Municipal 6. Akim Qua Town Calabar Municipal 7. Mount Zion,Yellow Duke Calabar South 8. Goldie, Target/Nelson Mandela Calabar South 9. Mayne Avenue, Palm Street Calabar South 10. EkpoAbasi/New Airport Road Calabar South 11. Anantigha /Abitu Avenue Calabar South
Source: Researchers Field Survey, (2013).
Figure 3. Map of Calabar showing 11 selected residential neighbourhoods under study
www.ccsenet.org/enrr Environment and Natural Resources Research Vol. 6, No. 2; 2016
121
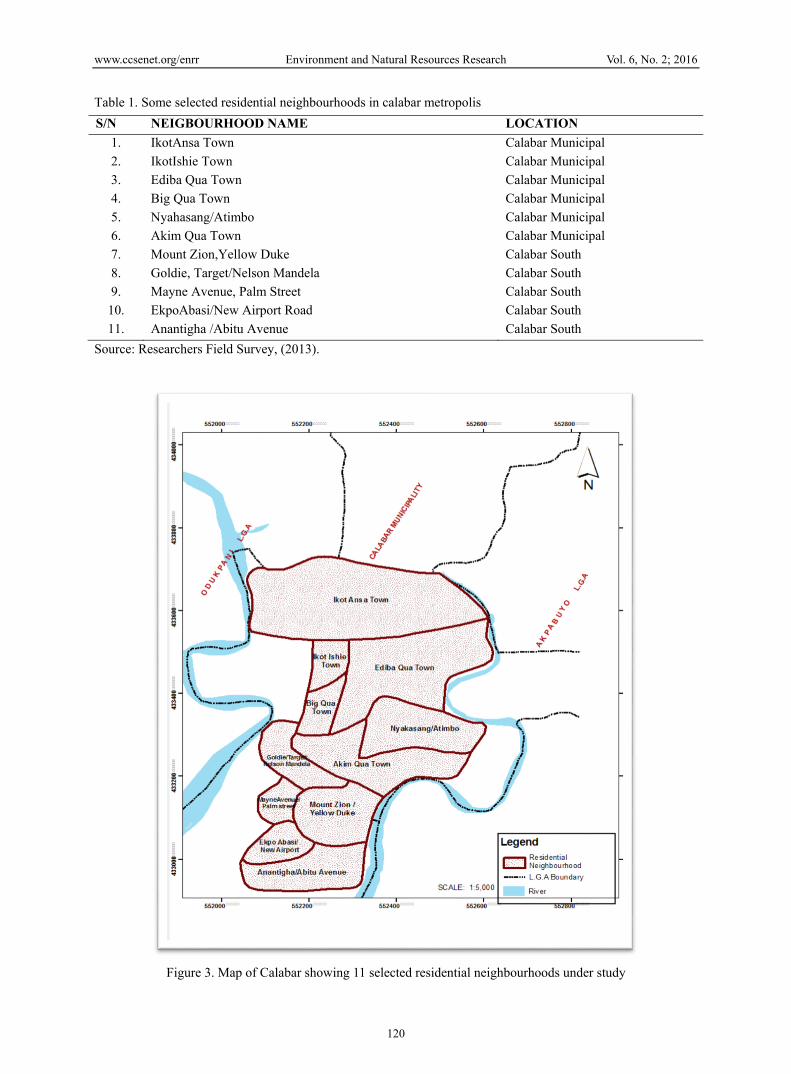
Furthermore, the survey in general was a cross sectional one in that it took place in 2013 and longitudinal survey which was very useful for comparison of flood risk assessment over a period of time spanning from 2009 to 2013. This research covered the residential neighbourhoods in Calabar Metropolis. These residential neighbourhoods were delineated based on shared drainage channels. They include, IkotOmin, IkotEfanga, IkotAnsa, IkotIshie, Ekorinim 1and 2, EssienTown,Ediba qua town,Big qua town, Nyahasang/Atimbo, Akimquq town, all in Calabar Municipality. Others include, Mount Zion/Yellow Duke, Goldie, Target/Nelson Mandela, Mayne Avenue/Anantigha, Mbukpa/Edibedibe, Henshaw Town and Duke Tow in Calabar South Local Government area (see Figure 2). Floods do not occur evenly in all the residential neighbourhoods listed above. Flood phenomena are found in sections of the Metropolitan area that are mentioned in Table 1 below. These residential neighbourhoods were carefully selected based on the fact the flood phenomenon is frequently experienced by residents of the areas. These selected residential neighbourhoods make up 61 percent of the total number of neighbourhoods mentioned above (see Figure 3 ). 4.1 Sampling Technique The stratified sampling technique was adopted for the study. Each neighbourhood was taken as a stratum. In each residential neighbourhood, there are places of flood occurrences or vulnerable to flood. These places also have elements that are at risk to flood including buildings, human beings and physical features. The magnitude of flood could also be observed in each residential neighbourhood that was selected in Table 1 above. Since there may be more than one point of flood in each area, the points or streets of flood were selected randomly in each neighbourhood. 5. Presentation of Data The data from the field survey is hereunder presented in a tabular form. This information is therefore used for the analysis of data using descriptive statistics of percentages which was used in achieving the set objectives of this study. Table 2. Magnitude of flood in residential neighbourhoood streets
S/N NEIGHBOURHOOD NAME LINEAR MEASUREMENT ACROSS PRONE AREAS (METERS)
PERCENTAGE
1 IkotAnsa Town 578 5.57 2 IkotIshie Town 599 9.92 3 Ediba Qua Town 345 5.71 4 Big Qua Town 174 2.88 5 Nyahasang/Atimbo 397 6.58 6 Akim Qua Town 403 6.67 7 Mount Zion/Yellow Duke 772 12.79 8 Goldie, Target/Nelson Mandela 997 16.51 9 Mayne Avenue/Palm Street 368 6.09 10 EkpoAbasi/New Airport 835 13.83 11 Anantigha/Abitu Avenue 570 9.44 TOTAL 6,038 100
Source: researchers field survey, 2013. Goldie, Target/Nelson Mandela residential neighbourhood has the largest area affected by flood with 997 (16.51 percent) followed by Ekpo Abasi/New Airport residential neighbourhood with 835 (13.83 percent) while the least was found to be Big Qua Town residential neighbourhood with 174 (2.88percent) as illustrated in Table 2 above. However, the flood coverage was measured as a straight line along the residential streets prone to flood in meters. This measurement was drawn from the drainage channels of each neighbourhood street.
www.ccsenet.org/enrr Environment and Natural Resources Research Vol. 6, No. 2; 2016
122
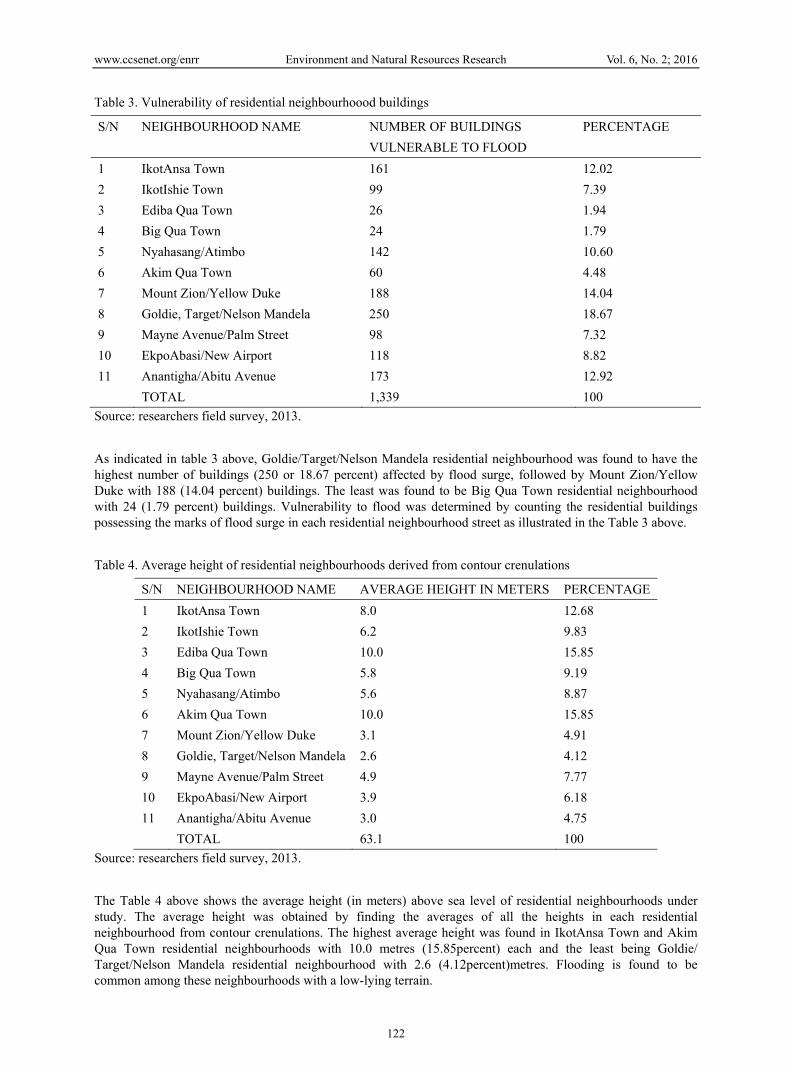
Table 3. Vulnerability of residential neighbourhoood buildings
S/N NEIGHBOURHOOD NAME NUMBER OF BUILDINGS VULNERABLE TO FLOOD
PERCENTAGE
1 IkotAnsa Town 161 12.02 2 IkotIshie Town 99 7.39 3 Ediba Qua Town 26 1.94 4 Big Qua Town 24 1.79 5 Nyahasang/Atimbo 142 10.60 6 Akim Qua Town 60 4.48 7 Mount Zion/Yellow Duke 188 14.04 8 Goldie, Target/Nelson Mandela 250 18.67 9 Mayne Avenue/Palm Street 98 7.32 10 EkpoAbasi/New Airport 118 8.82 11 Anantigha/Abitu Avenue 173 12.92 TOTAL 1,339 100
Source: researchers field survey, 2013. As indicated in table 3 above, Goldie/Target/Nelson Mandela residential neighbourhood was found to have the highest number of buildings (250 or 18.67 percent) affected by flood surge, followed by Mount Zion/Yellow Duke with 188 (14.04 percent) buildings. The least was found to be Big Qua Town residential neighbourhood with 24 (1.79 percent) buildings. Vulnerability to flood was determined by counting the residential buildings possessing the marks of flood surge in each residential neighbourhood street as illustrated in the Table 3 above. Table 4. Average height of residential neighbourhoods derived from contour crenulations
S/N NEIGHBOURHOOD NAME AVERAGE HEIGHT IN METERS PERCENTAGE 1 IkotAnsa Town 8.0 12.68 2 IkotIshie Town 6.2 9.83 3 Ediba Qua Town 10.0 15.85 4 Big Qua Town 5.8 9.19 5 Nyahasang/Atimbo 5.6 8.87 6 Akim Qua Town 10.0 15.85 7 Mount Zion/Yellow Duke 3.1 4.91 8 Goldie, Target/Nelson Mandela 2.6 4.12 9 Mayne Avenue/Palm Street 4.9 7.77 10 EkpoAbasi/New Airport 3.9 6.18 11 Anantigha/Abitu Avenue 3.0 4.75 TOTAL 63.1 100
Source: researchers field survey, 2013. The Table 4 above shows the average height (in meters) above sea level of residential neighbourhoods under study. The average height was obtained by finding the averages of all the heights in each residential neighbourhood from contour crenulations. The highest average height was found in IkotAnsa Town and Akim Qua Town residential neighbourhoods with 10.0 metres (15.85percent) each and the least being Goldie/ Target/Nelson Mandela residential neighbourhood with 2.6 (4.12percent)metres. Flooding is found to be common among these neighbourhoods with a low-lying terrain.
www.ccsenet.org/enrr Environment and Natural Resources Research Vol. 6, No. 2; 2016
123
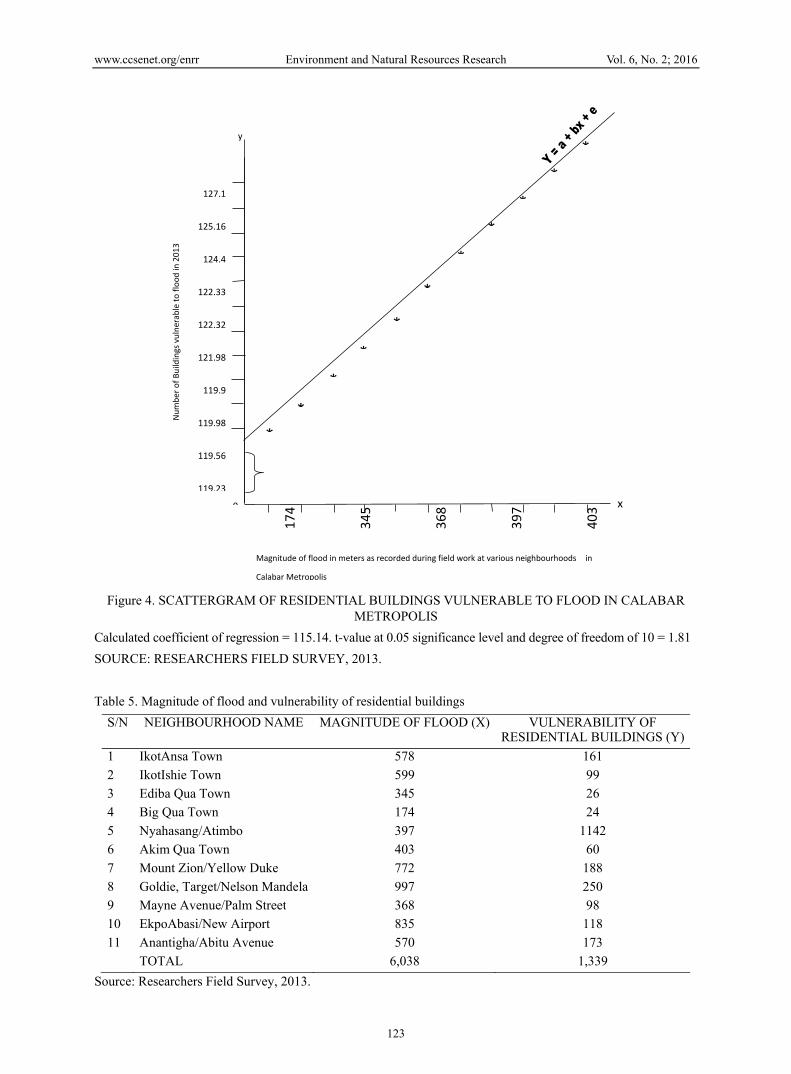
Figure 4. SCATTERGRAM OF RESIDENTIAL BUILDINGS VULNERABLE TO FLOOD IN CALABAR METROPOLIS
Calculated coefficient of regression = 115.14. t-value at 0.05 significance level and degree of freedom of 10 = 1.81 SOURCE: RESEARCHERS FIELD SURVEY, 2013. Table 5. Magnitude of flood and vulnerability of residential buildings
S/N NEIGHBOURHOOD NAME MAGNITUDE OF FLOOD (X) VULNERABILITY OF RESIDENTIAL BUILDINGS (Y)
1 IkotAnsa Town 578 161 2 IkotIshie Town 599 99 3 Ediba Qua Town 345 26 4 Big Qua Town 174 24 5 Nyahasang/Atimbo 397 1142 6 Akim Qua Town 403 60 7 Mount Zion/Yellow Duke 772 188 8 Goldie, Target/Nelson Mandela 997 250 9 Mayne Avenue/Palm Street 368 98 10 EkpoAbasi/New Airport 835 118 11 Anantigha/Abitu Avenue 570 173 TOTAL 6,038 1,339
Source: Researchers Field Survey, 2013.
127.1
125.16
124.4
122.33
122.32
121.98
119.9
119.98
119.56
119.23
0
174
345
368
397
403
**
**
*
*
**
**
*y
x
Magnitude of flood in meters as recorded during field work at various neighbourhoods in
Calabar Metropolis
Num
ber o
f Bui
ldin
gs v
ulne
rabl
e to
floo
d in
201
3
www.ccsenet.org/enrr Environment and Natural Resources Research Vol. 6, No. 2; 2016
124
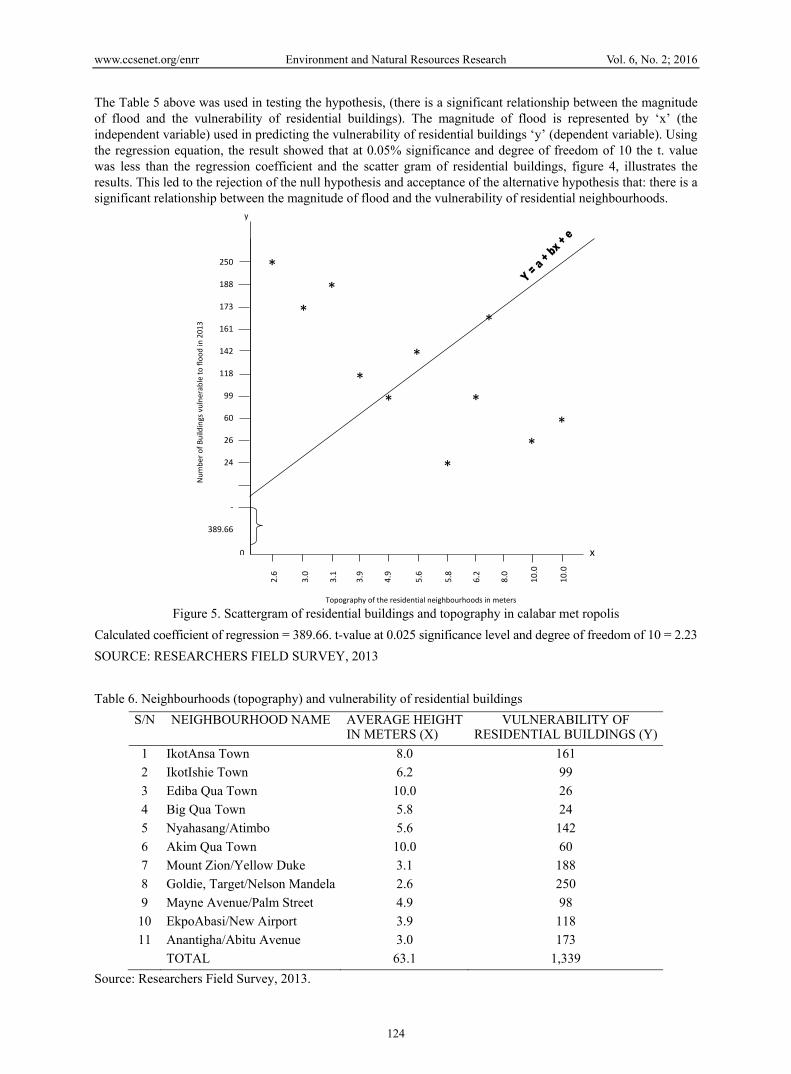
The Table 5 above was used in testing the hypothesis, (there is a significant relationship between the magnitude of flood and the vulnerability of residential buildings). The magnitude of flood is represented by ‘x’ (the independent variable) used in predicting the vulnerability of residential buildings ‘y’ (dependent variable). Using the regression equation, the result showed that at 0.05% significance and degree of freedom of 10 the t. value was less than the regression coefficient and the scatter gram of residential buildings, figure 4, illustrates the results. This led to the rejection of the null hypothesis and acceptance of the alternative hypothesis that: there is a significant relationship between the magnitude of flood and the vulnerability of residential neighbourhoods.
Figure 5. Scattergram of residential buildings and topography in calabar met ropolis
Calculated coefficient of regression = 389.66. t-value at 0.025 significance level and degree of freedom of 10 = 2.23 SOURCE: RESEARCHERS FIELD SURVEY, 2013 Table 6. Neighbourhoods (topography) and vulnerability of residential buildings
S/N NEIGHBOURHOOD NAME AVERAGE HEIGHT IN METERS (X)
VULNERABILITY OF RESIDENTIAL BUILDINGS (Y)
1 IkotAnsa Town 8.0 161 2 IkotIshie Town 6.2 99 3 Ediba Qua Town 10.0 26 4 Big Qua Town 5.8 24 5 Nyahasang/Atimbo 5.6 142 6 Akim Qua Town 10.0 60 7 Mount Zion/Yellow Duke 3.1 188 8 Goldie, Target/Nelson Mandela 2.6 250 9 Mayne Avenue/Palm Street 4.9 98
10 EkpoAbasi/New Airport 3.9 118 11 Anantigha/Abitu Avenue 3.0 173
TOTAL 63.1 1,339 Source: Researchers Field Survey, 2013.
250
188
173
161
142
118
99
60
26
24
-
389.66
0
2.6
3.0
3.1
3.9
4.9
5.6
5.8
6.2
8.0
10.0
10
.0
*
**
**
*
*
*
*
**
y
x
Topography of the residential neighbourhoods in meters
Num
ber o
f Bui
ldin
gs v
ulne
rabl
e to
floo
d in
201
3

www.ccsenet.org/enrr Environment and Natural Resources Research Vol. 6, No. 2; 2016
125
Table 6 above was used in testing hypothesis 2 (The elements at risk to flooding in residential neighbourhoods in Calabar vary significantly according to the topography of the area.). The topography of the area (average height) is represented by ‘x’ (independent variable) and the vulnerability of residential buildings is represented by ‘y’ (dependent variable). Using regression equation and as illustrated in Figure 5 to draw the line of ‘best fit’, the result showed that at 0.025% significance and degree of freedom of 10, the regression coefficient was greater than the T. value and the scatter gram of residential buildings also determined the line of “best fit”. This result has also rejected the null hypothesis and accepted the alternative hypothesis that: the elements-at-risk to flood in residential neighbourhoods in Calabar vary significantly according to the topography of the area. 6. Results/Findings Findings show a significant relationship between the magnitude of flood and vulnerability of residential buildings and the elements-at-risk vary significantly according to the location and topography of the area. However, the results were in support of the reviewed literature as vulnerability is explained in terms of exposure to hazardous events and how it affects people and structures. It has also been reviewed in the literature that rapid urbanization, population increase and waste disposal habit have also inundated the magnitude of flood. Human activities such as transportation, industrial development and pavements have contributed to change in climate resulting to increase in rainfall pattern which brings about flooding affecting residential buildings and other physical features. Findings also show that the magnitude of flood is responsible for the vulnerability of residential buildings because the larger the magnitude of flood the more residential buildings would be affected by the hazard. The topography of residential neighbourhoods expressed by the average height (in meters) also contributes to vulnerability of buildings and other physical features. This was found in Table 6 that the lowest topography (average height in meters) of 2.6 (4.12percent) has the highest number, 250 (18.67percent) of buildings vulnerable to flood and the highest average height of 10.0 meters has 26 buildings vulnerable to flood. This has resulted to variation in the elements-at-risk to flood depending on the topography of the area. Tables 2, 3, and 4 were used in estimating residential areas of high flood risk, medium flood risk and low flood risk zones. For example, Table 2 shows the highest to be 835 (13.83percent) to 997 (16.51percent) flood diameter, Table 3 shows 118 (8.82percent) to 250 (18.67percent) buildings, and Table 4 shows 2.6 (4.12percent) to 3.1 (4.91percent) average heights. However, six residential neighbourhoods were estimated at high flood risk zone. These are Goldie/ Target / Nelson Mandela; Mount Zion / Yellow Duke; Anantigha / Abitu Avenue; EkpoAbasi / New Airport; IkotAnsa and Nyahasang / Atimbo residential neighbourhoods. The estimated medium flood risk zone has three residential neighbourhoods such as Mayne Avenue / Palm Street; Ikot Ishie and Akim Qua Town. The estimated low flood risk zone has two residential neighbourhoods which include Ediba Qua Town and BigQuaTown. 7. Recommendations The study recommends some regulatory approaches to reduce vulnerability; these are: • Flood plain zoning: Laws can be passed that restrict construction of buildings and habitation of flood plains
of Calabar. Instead flood plains can be zoned for urban agriculture, landscaping and recreational uses. • Flood plain building codes: Structures that are allowed within the Flood plains of Calabar could be
restricted to those that can withstand the high velocity of flood waters and are high enough off the ground to reduce risk of contact with water.
• Mortgage limitations: Lending institutions could refuse to give loans to buy or construct buildings (structures) or businesses in flood- prone areas of Calabar.
The study further recommends a proper channelization of Calabar urban drainage system, stringent flood control legislation, and development control measures should be enforced so as to discourage people from building on or near flood-prone areas of Calabar especially the estimated areas of high flood risk zones. Developers, who have to build their houses near or on flood prone areas, must present their building plans to the Ministry of Lands and Town Planning for scrutiny before building approval is granted. There is need for adequate planning and improvement of flood prediction techniques. Planning and efficient management of the physical environment is the best way for tackling flood problems. The act of flood planning requires a team-work. This makes it mandatory for the involvement of relevant experts in specific planning projects. In the preparation of plans for coastal settlements and flood-prone areas or regions, Meteorologists and Oceanographers should be included in the planning team.
www.ccsenet.org/enrr Environment and Natural Resources Research Vol. 6, No. 2; 2016
126
A comprehensive study of flooded settlements to determine their level of vulnerability to flood disasters should be undertaken. Residential neighbourhoods with high level of vulnerability should be relocated to inland locations that are sufficiently safe. The Nigerian Institute of Town Planners should focus on ‘climate change and flood planning’ in one of its Mandatory Continuing Professional Development Programmes (MCPDP) held annually in Nigeria. This would afford the practicing Town Planners opportunities to have good knowledge of flood risk planning and management. There is high confidence that adaptation can reduce vulnerability, especially in the short term. However, adaptive capacity is intimately connected to social and economic development, but it is not evenly distributed across and within societies. There is always a distinction between the two types of adaptation measures namely: autonomous adaption and planned adaptation. • Autonomous adaptation action are responses that will be implemented by individuals and organizations in
fighting flood disasters without any intervention or coordination by regional or state and national governments and international agreements. This is recommended for the residential neighbourhoods estimated at high flood risk zones.
• Planned adaptations are the result of deliberate policy decision that specifically take flood disaster into account. Planned adaptations, therefore, includes changes in policies, institutions and dedicated infrastructure would be needed to facilitate and maximize long-term benefits of adaptation response to flooding with the situation at hand in Calabar Metropolis within the delineated residential neighbourhoods. Planned adaptation solutions and policy coordination across multiple institutions may be necessary to facilitate adaptation to flood damage.
Finally, the following planned adaptation options would be effective for flood risk control in Calabar Metropolis. • Environmental policy reforms, changes in urban and housing designs, removal of laws that can
inadvertently increase flood vulnerability. • Appropriate infrastructure investments:- Build-up of unblocked drainage patterns, flood defenses,
increasing investments, improved health care through flood shelters and assistance shelters as part of community emergency preparedness programmes.
• Changes in water and land-use management polices:- Devising tenure markets, appropriate town planning and encouraging building of water sinking mechanisms.
• Development of flood controls and monitoring:- Capacity building for research and training to enable adaptation. Capacity building to integrate climate change and its impacts into urban development planning involving local communities, raising public awareness and education on flooding and its impacts on residential neighbourhoods of Calabar Metropolis.
8. Conclusion The study examined the vulnerability of some residential neighbourhoods in Calabar to the menace of flooding and determined residential areas of low, medium and high flood risk zones. The significant results obtained from the regression coefficient of the least square method and the scatter gram was that the magnitude of flood predicted the vulnerability of residential buildings and other physical elements. Also the topography of the area determined the level of vulnerability of physical elements to flood. However, through metric measurement of the diameter of flood surge to determine the magnitude of flood and counting of residential buildings affected by flood in each residential neighborhood, the study found that: the larger the diameter of flood surge the more physical elements including residential buildings are affected and the lower the topography of the area the higher the estimated level of risk of flooding in that particular area. To stem the vulnerability of residential areas, it is imperative that a proper channelization of Calabar urban drainage system, stringent flood control legislation and development control measures be enforced so as to discourage people from building on or near flood-prone areas of Calabar especially areas of high flood risk zones. References Abua, M. A., & Eze, B. E. (2002). Environmental Hydrology. Calabar, Ushie Printers and publishing Co. ltd. Bada, T. J. (1997). The June 24th 1995 flood in Ondo, its Antecedent and Incident. Research Publications in
Geography. Ronal Press, New York. Chooma, B. (2006). Surface Water Drainage in Urban Areas: The Poor Die Young (pp. 158-168). London,
Earthscan Publications.
www.ccsenet.org/enrr Environment and Natural Resources Research Vol. 6, No. 2; 2016
127
Cong, C., Collins, E., & Simpson, L. (2008). The Impact of Climate Change on Insuring Flood Risk. Institute of Actuaries of Australia, New Zealand.
Ebong, M. O. (1983). The Perception of Residential Quality. Third World Planning Review. Few, R. M., Ahen, F., Matthies, M., & Kovats, S. (2006). Linking Climate Change Adaptation and Disaster
Management for Sustainable Poverty Reduction. Synthesis Report for Vulnerability and Adaption Resource Group (VARG). Retrieved from wwwec.europa.eu/development/icenter/envecvarg adaptation en pdf.
Georgakos, K. P., Guctter, A. K., & Sperfslage, J. A. (1997). Estimation of Flash Flood Potential for Long Areas (pp. 87-100). IAHS Publication No. 239.
Hogue, M. M., Abdullah, A., & Khan, M. S. (1997). Storm Surge Flooding in Chittagong City and Associated Risk (pp. 115-122). IAHS publication No. 239.
Intergovernmental Panel on Climate Change (IPCC). (2008). Climate Change Impact, Adaptation and Vulnerability. Third Assessment Report.
International Federation of Red Cross and Red Crescent Societies (IFRS). (2003). Towards Integrated Approaches to Increase Resilience and Robustriess for the Prevention and Mitigation of Flood Risk in Urban Areas.
Kates, R. W., & Kasperson, J. X. (1983). Comparative Risk Analysis of Technological Hazards: Proceedings of National Academy of Science, 80, 7027-7038.
Mwange, T. (2006). Kalikiliki Dam Floods: Report to the Technical Unit. Ministry of Energy and Water Affairs, Government of the Republic of Zambia, Lusaka.
Obongha, U. E. (2013). Flood Assessment of Residential Neighbourhoods in Calabar Metropolis. An unpublished undergraduate Research Project.
Offiong, R. A. (2004). Floral Biodiversity of the Kwafalls River Valley: A Case Study of Akamkpa L.G.A. (unpublished Msc. Thesis). University of Calabar, Calabar.
Ologunorisa, E. T. (2012). Climate Change Impact, Vulnerability and Adaptation in Nigeria. Paper presented at the Mandatory Continuing Professional Development Programme (MCPDP) Uyo April 18-19, 2012.
Ologunorisa, E. T. (2004). An Assessment of Flood Vulnerability Zones in the Niger Delta, Nigeria. International Journal of Environmental Studies, 61(1), 309.
Ologunorisa, E. T. (2006). Flood Management and Control in Nigeria. Research Review, 27(6), 102-203. Oyesiku, O. K. (2009). City Liveability: Implications and challenges, Planning for iveable Human Settlements.
Proceedings of NITP and CAP of West African Workshop Settlement held in Lagos Nigeria, 3 & 4, 61-107 Plate, E. J. (2002). Flood Risk and Flood Management. Journal of Hydrology, 267, 2-11. Rakodi, C., & Leduka, C. (2003). Informal land delivery processes and access to land for the Poor in six African
Cities: Toward a conceptual framework. Working paper I in the Informal land delivery processes in African cities series. University of Birmingham, UK.
SEMA. (2013). Flood statistics. Cross River State Emergency Management Agency Smith, D. (1996). Environmental Hazard. London, Routledge Publication. Udo, C. E. (1981). A Morphometric Analysis of Gullies in Obatone Area of AkwaIbom State. University of
Ibadan. UNDP. (2005). Baseline Report on Flooding and Erosion, Landslide in Anambra, Enugu, Lagos and Kogi states. UNFCCC. (2008). Climate Change, Impacts, Vulnerability and Adaptation in Developing Countries. Retrieved
from http://www.wmoch/pages/prog/indexphp. United Nations Commission for Human Settlement (UNCHS). (1981). Settlement Planning For Disasters.
Nairobi, World Meteorological Organization. Copyrights Copyright for this article is retained by the author(s with first publication rights granted to the journal. This is an open-access article distributed under the terms and conditions of the Creative Commons Attribution license (http://creativecommons.org/licenses/by/3.0/).


![.Noah's Flood WTJ2004[1]](https://static.fdokumen.com/doc/165x107/631c39e73e8acd997705cf6b/noahs-flood-wtj20041.jpg)