criteria for evaluating coastal flood-protection structures
161
-
Upload
khangminh22 -
Category
Documents
-
view
4 -
download
0
Transcript of criteria for evaluating coastal flood-protection structures
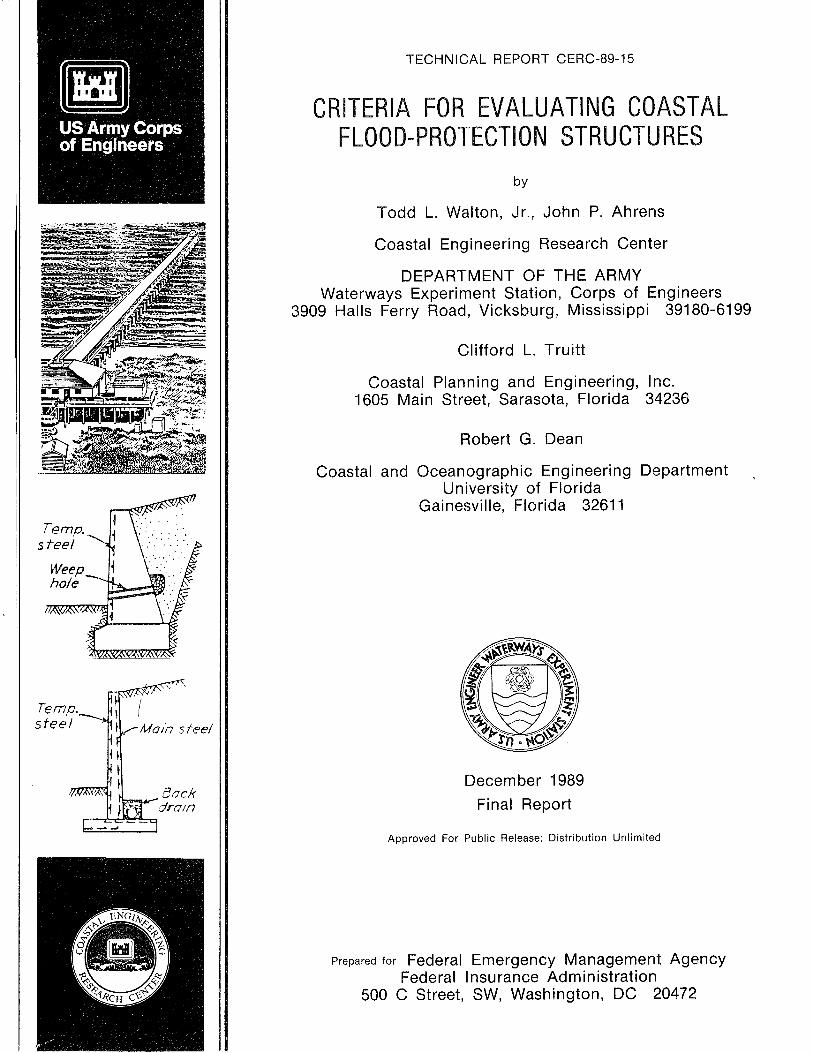

TECHNICAL REPORT CERC-89-15
CRITERIA FOR EVALUATING COASTAL FLOOD-PROTECTION STRUCTURES
Todd L. Walton, Jr., John P. Ahrens
Coastal Engineering Research Center
DEPARTMENT OF THE ARMY Waterways Experiment Station, Corps of Engineers
3909 Halls Ferry Road, Vicksburg, Mississippi 39180-6199
Clifford L. Truitt
Coastal Planning and Engineering, Inc. 1605 Main Street, Sarasota, Florida 34236
Robert G. Dean
Coastal and Oceanographic Engineering Department University of Florida
Gainesville, Florida 3261 1
December 1989
Final Report
Approved For Public Release; Distribution Unlirn~ted
This report has been reviewed in the Federal Emergency Management Agency and approved for publ~cat~on. Approval does not signlfy that the contents necessarily reflect the mews and policies of the Federal Emergency Management Agency.
Prepared for Federal Emergency Management Agency Federal Insurance Administration
500 C Street, SW, Washington, DC 20472

Unclassified SECURITY CLASSIFICATION OF THlS PAGE
l a . REPORT SECURITY CLASSIFICATION RESTRICTIVE MARKINGS
Approved for public release; distribution unlimited.
Technical Report CERC-89-15
I See reverse. 8a. NAME OF FUNDING /SPONSORING 9. PROCUREMENT INSTRUMENT IDENTIFICATION NUMBER I ORGANIZATION
I see reverse. I I
Criteria for Evaluating Coastal Flood-Protection Structures
12. PERSONAL AUTHOR(S)
ity of various types of coastal flood-protection structures is also discussed.
ABSTRACT SECURITY CLASSIFICATION Unclassified
DD Form 1473, JUN 86 Previous editions are obsolete. SECURITY CLASSIFICATION OF THIS PAGE
Unclassified

Unclassified ~CURITY c L u s I C 1 c A n o N oc THIS P*Q@
6a. NAME OF PERFORMING ORGANIZATION (Continued)
USAEWES, Coastal Engineering Research Center; Coastal Planning and Engineering, Inc.; University of Florida Coastal and Oceanographic Engineering Department
6c. ADDRESS OF PERFORMING ORGANIZATION (Continued).
3909 Halls Ferry Road, Vicksburg, MS 39180-6199; 1605 Main Street, Sarasota, EL 34236; Gainesville, FL
8a. NAME OF FUNDING/SPONSORING ORGANIZATION (Continued).
Federal Emergency Management Agency Federal Insurance Administration

SUMMARY
Crude state-of-the art methods are presented for predicting wave runup,
overtopping, and wave transmission past coastal flood-protection structures.
The runup methodology presented provides equations for calculation of runup on
smooth sloped structures along with correction factors to adjust the smooth
slope runup value in the case of rough slopes. The runup methodology can be
used along with the existing Federal Emergency Management Agency (FEMA) meth-
odology for runup on beaches to assess adequacy of a given coastal flood-
protection structure to prevent flooding. A first crude approach to the
problem of predicting wave transmission behind the structure via overtopping
has been presented. The method is preliminary, and insufficient testing of
the method for general usage has been made because of lack of available data.
If necessary, the method could be used as an interim procedure to determine
the level of wave protection afforded buildings behind the coastal flood-
protection structure should runup exceed the crest height of the coastal
flood-protection structure.
The survivability of the coastal flood-protection structure through the
100-year frequency of occurrence storm is also addressed in this report. Com-
mon types of coastal flood-protection structures have been categorized by
functionality, and modes of failure for these structures have been discussed.
The primary types of coastal flood-protection structures are gravity seawalls,
pile-supported seawalls, anchored bulkheads, and dikes (or "levees"). The
first three of these categories can be assessed for stability in a reasonable
manner where sufficient design details of the structure and adequate informa-
tion as to present condition and state of maintenance are known. There are no
adequate stability assessment criteria for application to general types of
coastal dikes, although limited information on some design aspects for a few
specific cases does exist. A flowchart check list has been provided to assess
adequacy of coastal flood-protection structures to withstand the 100-year
return period coastal storm. Literature pertinent to such checks has been
provided to enable a qualified coastal and geotechnical engineer to address
the coastal flood-protection structure survivability issue. One approach to
assessing adequacy of coastal flood-protection structures (where design infor-
mation is limited or where inadequate knowledge of present condition is known)
is via history of past performance of similar type structures. A review of

literature on historical performance of various coastal flood-protection
structures is provided in this report, and it is concluded that only one type
of coastal flood-protection structure (anchored bulkhead) has shown repeated
history of serious failures in large coastal storms. It is recommended that
FEMA not consider anchored bulkheads adequate for coastal flood protection
unless the applicant can prove with sufficient documented engineering evidence
the structure(s) in question will survive the FEMA postulated 100-year return
period coastal storm scenario.
It must be realized that, due to the complexity of the typical coastal
flood-protection structure, definitive answers to the question of structure
adequacy cannot always be made without great expense and numerous engineering
calculations. Even then, many questions such as the internal structural
strength of the coastal flood-protection structure (i.e. adequacy and condi-
tion of reinforcing steel) will still be left unanswered. In such cases, good
engineering judgment and common sense will still have to be an important part
of any evaluation of such structures,
PREFACE
This report examines various methodologies for assessing the adequacy of
coastal flood-protection structures to survive a large coastal storm. The
report was prepared at the Coastal Engineering Research Center (CERC) of the
US Army Engineer Waterways Experiment Station (WES) in response to a request
from the Federal Emergency Management Agency (FEMA). Dr. Frank Tsai was
FEMA's contract monitor.
Dr. Todd L. Walton, Jr., Mr. John P. Ahrens, Dr. Clifford L. Truitt, and
Dr. Robert G. Dean prepared the report under the general supervision of
Mr. Thomas W. Richardson, Chief, Engineering Development Division; and
Dr. James R. Houston and Mr. Charles C. Calhoun, Jr., Chief and Assistant
Chief, CERC, respectively. This report was edited by Ms. Lee Byrne, Informa-
tion Technology Laboratory, WES.
Commander and Director of WES upon publication of this report was
COL Larry B. Fulton, EN. Dr. Robert W. Whalin was Technical Director.

CONTENTS
Pane
PREFACE . . . . . . . . . . . . . . . . . . . . . . . . . . . . . . . . . . . . . . . . . . . . . . . . . . . . . . . . . . . . . . . . . 3
CONVERSION FACTORS. NON-SI TO SI (METRIC) UNITS OF MEASUREMENT . . . . . . . . . . . . . . . . . . . . . . . . . . . . . . . . . . . . . . . . . . . . . . . . . . 6
. . . . . . . . . . . . . . . . . . . . . . . . . . . . . . . . . . . . . . . . . . PART I: OBJECTIVES OF STUDY 7
. . . . . . . . . . . . . . . . . . . . . . . . . . . . . . . . . . . . . PART 11: WAVE RUWP ON STRUCTURES 10
. . . . . . . . . . . . . . . . . . . . . . . . . . . . . . . . . . . . . . . . . . . . . . . . . . . . . . . . Background 10 . . . . . . . . . . . . . . . . . . . . . . . . Regular Wave Runup on Smooth Linear Slopes 14
. . . . . . . . . . . . . . . . . . . . . Regular Wave Runup on Smooth Composite Slopes 29 . . . . . . . . . . . . . . . . . . . . . . . . . . . . . . . . . . . . . . . . . . . Nonsmooth Slope Effects 30
Irregular Wave Runup . . . . . . . . . . . . . . . . . . . . . . . . . . . . . . . . . . . . . . . . . . . 34 . . . . . . . . . . . . . . . . . . . . . . . . . . . . . . . . . . . . . Runup Calculation Conclusions 37
Recommendations . . . . . . . . . . . . . . . . . . . . . . . . . . . . . . . . . . . . . . . . . . . . . . 38
. . . . . . . . . . . . . . . . . . . . . . . . . . . . . . . . . . . . PART 111: OVERTOPPING OF STRUCTURES 40
Background . . . . . . . . . . . . . . . . . . . . . . . . . . . . . . . . . . . . . . . . . . . . . . . . . . . . . 40 Overtopping Calculation Conclusions . . . . . . . . . . . . . . . . . . . . . . . . . . . . . . . 49
. . . . . . . . . . . . . . . . . . . . . . . . . . . . . . . . . . . . . . . . . . . . . . . . . . . . Recommendation 50
PART IV . WAVE TRANSMISSION OVER COASTAL STRUCTURES .................... 51
. . . . . . . . . . . . . . . . . . . . . . . . . . . . . . . . . . . . . . . . . . . . . . . . . . . . . . . . Background 51 . . . . . . . . . . . . . . . . . . . . . . . . . . . . . . . . . . . . . . . . . . . . . . . . . . . . Recommendation 55
. . . . . . . . . . . PART V . WAVE FORCES ON COASTAL FLOOD-PROTECTION STRUCTURES 56
Methods in Use . . . . . . . . . . . . . . . . . . . . . . . . . . . . . . . . . . . . . . . . . . . . . . . . . . . . 57 . . . . . . . . . . . . . . . . . . . . . . . . . . . . . . . . . . . . . . . . . . . . . Suggested Methodology 65
. . . . . . . . . . . . . . . . . . . . . . . . . . . . . . . . . . . . The Horn-ma and Horikawa Method 68 . . . . . . . . . . . . . . . . . . . . . . . . . . . . . . . . . . . . . . . . . . . . . . . . . . . . Recommendation 71
. . . . . . . . . . . . . . . . . PART VI . COASTAL FLOOD-PROTECTION STRUCTURE INTEGRITY 72
Description and Classification of Coastal Flood-Protection Structures . . . . . . . . . . . . . . . . . . . . . . . . . . . . . . . . . . . . . . . . . . . . . . . . . . . . . . 72
Case Histories During Storms . . . . . . . . . . . . . . . . . . . . . . . . . . . . . . . . . . . . . 87 . . . . . . . Recommendation of Design Features for Acceptable Structures 96
. . . . . . . . . . . . . . . . . . . . . . . . . . . . . . . . . . . . . . . . Sumnary and Recommendation 100
. . . . . . PART VII . EVALUATING EXISTING COASTAL FLOOD-PROTECTION STRUCTURES 101
F%owchart/Outline Approach . . . . . . . . . . . . . . . . . . . . . . . . . . . . . . . . . . . . . . . . 101 Seunmary . . . . . . . . . . . . . . . . . . . . . . . . . . . . . . . . . . . . . . . . . . . . . . . . . . . . . . . . . . . 105
REFERENCES . . . . . . . . . . . . . . . . . . . . . . . . . . . . . . . . . . . . . . . . . . . . . . . . . . . . . . . . . . . . . 106
APPENDIX A: MAXIMUM PERIODIC WAVE RUNUP ON SMOOTH SLOPES . . . . . . . . . . . . . . . A1
Analysis Procedure . . . . . . . . . . . . . . . . . . . . . . . . . . . . . . . . . . . . . . . . . A3 Resul .tls . . . . . . . . . . . . . . . . . . . . . . . . . . . . . . . . . . . . . . . . . . . . . . . . . . . . A7

Page
APPENDIX B: PRELIMINARY METHOD FOR COMPUTATION OF WAVE OVERTOPPING AND . . . . . . . . . . . . . . . . . . . . . . . . . . . . . . . . . . . . . . . . . . WAVE TRANSMISSION
. . . . . . . . . . . . . . . . . . . . . . . . . . . . . . . . . . . . . . . . . . . . . . . . Methodology Results . . . . . . . . . . . . . . . . . . . . . . . . . . . . . . . . . . . . . . . . . . . . . . . . . . . .
. . . . . . . . . . . . . . . . . Comparison of Method with Hall (1940) Data . . . . . . . . . . . . . . . . . . . . . . . . . . . . . . . . . . . . Summary and Conclusions
. . . . . . . . . . . . . . . . . . . . . . . . . . . . . . . . . . . . . . . . . . . . . APPENDIX C: SCOUR CRITERIA
. . . . . . . . . . . . . . . . . . . . . . . . . . . . . . . . . . . . . . . . . . . . . . . . . . . APPENDIX D: NOTATION
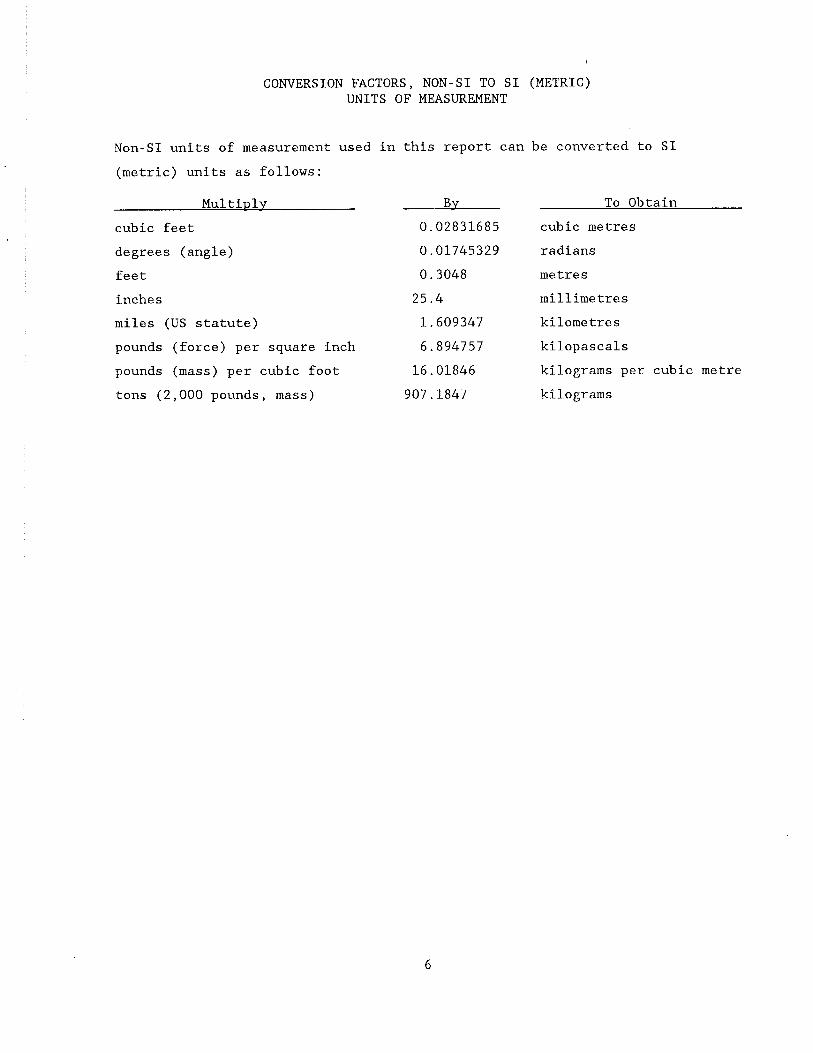
CONVERSION FACTORS, NON-SI TO SI (METRIC) UNITS OF MEASUREMENT
Non-SI units of measurement used in this report can be converted to SI
(metric) units as follows:
Mu1 ti~lv
cubic feet
degrees (angle)
feet
inches
miles (US statute)
pounds (force) per square inch
pounds (mass) per cubic foot
tons (2,000 pounds, mass)
To Obtain
cubic metres
radians
metres
millimetres
kilometres
kilopascals
kilograms per cubic metre
kilograms
CRITERIA FOR EVALUATING COASTAL FLOOD-PROTECTION STRUCTURES
PART I: OBJECTIVES OF STUDY
1. The Federal Emergency Management Agency (FEMA) is tasked with the
job of establishing potential flood zones along the coast for use in determin-
ing property insurance rates within the structure of the Federal Insurance
Administration. Within the high hazard coastal area, many coastal flood-
control structures (such as seawalls) have been built to protect property from
erosion as well as to prevent flooding of the upland areas. At present FEMA
does not have any guidance to determine adesuacv of these structures: (a) to
prevent flooding from a major storm event or (b) to withstand the major storm
event without some type of structural failure occurring.
2. At the onset of the study, specific requests by FEMA were made con-
sidering the philosophical approach to the problem of evaluating a coastal
flood-control structure's potential in providing flood protection. These
requests can be summarized as follow: (a) the methodology recommended be con-
sistent with the state of the art in coastal engineering, (b) the methodology
be generic in the sense it can be used for any structure, and (c) the method-
ology be consistent with existing FEMA guidelines and procedures in evaluating
coastal flood zones. In a preliminary meeting, it was noted that these three
recommendations might not all be capable of being fulfilled completely. As an
example, if it was determined that the state-of-the-art method for determining
wave runup on a structure was via utilization of a random wave method, this
would not be consistent with the present FEMA approach of utilizing depth-
limited breaking wave height for developing coastal high hazard zones (the
V-zone determination). As a result of discussions in these meetings, it was
determined that monochromatic wave theory and depth-limited breaking waves
should be the governing approach. One justification for this is that present
knowledge of wave data around the Nation's coastline is not adequate to jus-
tify usage of a more complex random wave theory for general evaluation of
coastal structures at all locations. This statement does not conflict with
the fact that present site-specific design of coastal. protection is based on
random wave input into a laboratory tank with the measured response providing
design conditions. Rather, this statement suggests that where sufficient wave
climate knowledge is available and where site-specific laboratory tank tests
of the structures can be made, exemptions to a proposed methodology should be
allowed. Further justification for utilizing monochromatic wave theory for a
unified FEMA approach will be provided in the various sections of the report.
3. This report is organized into seven sections. Part I states the
objectives with the next three sections addressing the hydrodynamic recommen-
dations for calculation of wave runup, wave overtopping, and wave transmis-
sion. This methodology is necessary to identify if a coastal structure that
is intact through a major storm event will provide the necessary level of
flood and wave protection to upland property. Part V addresses the calcula-
tion of wave forces on the coastal flood-control structure. Knowledge of the
wave forces on the structure is required to assess the adequacy of the struc-
ture against wave damage during a major storm. Parts I1 through V address
methodology that can be utilized in a generic sense to evaluate any coastal
structure where laboratory talk testing of the structure for the major storm
under consideration does not exist. Part VI addresses the problem of struc-
tural integrity of the coastal flood-protection structure, i.e., its ability
to withstand the major storm intact. In this section, guidelines are provided
for checking various potential failure modes of coastal flood-control struc-
tures. Part V I I provides a flowchart alorrg with recommendations for determin-
ing adequacy of design.
4 . The present report is a first attempt to provide guidance to FEMA
for use in assessing adeauacy of coastal flood-control structures (primarily
seawalls) for flood protection against the extreme event. This report is not
meant to address design of coastal flood-protection structures and. sl-loulcl not
be used for design purposes. Considerable in-depth studies and tests would he
needed for proper design. The subject of design is beyond the scope of this
report.
5 . It should be recognized that the state of the art in understanding
coastal hydrodynamics is very crude and often belies theoretical attempts to
characterize waves and water levels for coastal areas with a desired high
level of accuracy. Present state-of-the-art attempts at characterization of
water waves on structures is highly dependent on laboratory testing done under
controlled environmental conditions to determine empirical knowl.edge of the
resultant interaction between wave and structure. Results from such tests

provide knowledge for use in similar situations in the real world but must be
recognized as only providing an approximate crude answer for the real world
situation. Until considerable further research is done on nearshore wave
interaction with structures, attempts to predict nature's response to a major
storm event will only be a rough guess at what may really occur. In light of
this inadequate knowledge of nature, the attempt is to err on the side of
conservatism where possible.
PART 11: WAVE RUNUP ON STRUCTURES
Background
6. Design of coastal flood-protection structures for which no overtop-
ping or flooding landward thereof is allowable should use a maximum wave runup
criterion. The maximum wave runup criterion is consistent with a desire of
FEMA to have a clearly defined pass/fail type approach to evaluate whether
existing structures should be credited for flood protection. A methodology to
predict maximum wave runup under the existing FEMA approach of depth-limited
waves would allow FEMA to directly evaluate a structure for flood-protection
purposes by evaluating the maximum runup elevation to be above or below the
structure crest elevation. In particular, a reasonable approach for use by
F E W in evaluating flooding potential behind a structure should consist of the
following points:
a. The methodology should be sufficiently robust to work on all - structure slopes, structure roughnesses, and structure types.
b. The methodology should be independent of existing bathymetry - leading to the structure, i,e., decoupled from wave transforma- tion effects prior to encountering the structure.
c. The methodology should be consistent with existing theory and - verified by physical model testing at a scale sufficient to ensure that scale effects are minimized in the data (or provide a rationale to correct for such scale effects).
d. The methodology should be consistent with existing FEMA mono- - chromatic depth-limited breaking wave criteria.
e. The methodology should provide consistent answers with existing - knowledge of coastal flooding events at structure sites.
7. Present state of the art in runup prediction is not sufficient to
adequately address a91 of these points. The primary reason for this inade-
quate state of knowledge is the fact that (in this country as well as in other
countries with coastal flooding problems) generic research sets of runup data
for various structure types, locations, slopes, bathymetry, roughnesses,
scales, etc., do not exist. The primary countries where limited research
efforts have been made advancing the state of knowledge of runup on structures
are the European countries (mainly the United Kingdom, Germany, and the
Netherlands), Japan, and the United States. In the majority of runup studies
within these countries, the studies were made with a limited objective of

designing a site-specific structure of a given type, slope, roughness, off-
shore bathymetry, and with wave conditions consistent with the site. Limited
studies exist that have addressed the physics of runup. These are either
verified (or more likely calibrated) on very limited sets of field or labora-
tory data or not verified at all. A majority of the recent research on wave
runup on structures consists of irregular wave input at laboratory tank wave
generators with corresponding irregular wave runup measurements on the struc-
ture, again for very limited conditions. This recent research has progressed
with irregular wave input (typically for site-specific conditions) in spite of
the fact that the simpler problem of monochromatic wave runup is still not
well understood.
8 . In view of these comments, it must be realized that any approach to
the problem of runup prediction which meets FEMA needs will not be without
limitations, but rather a pragmatic approach to the problem out of need for a
cost justifiable approach which engineers can use to provide a state-of-the-
art answer to a very complex problem. For an improved answer to the runup
problem, it will still be necessary, as in present coastal design, to do labo-
ratory testing for site-specific cases. Those applicants to FEMA requiring
credit for their coastal flood-protection structures should be allowed the
option of providing independent physical (laboratory) testing on their struc-
ture in lieu of any proposed FEMA suggested approach. A short review of
existing available data sets and runup research on both monochromatic and
irregular wave runup is presented followed by discussion of various methodol-
ogies for prediction of wave runup.
9. Much of the existing state-of-the-art approach to computing wave
runup on structures is summarized in nine documents: Koh and Le Mehaute
(1966); Le Mehaute, Koh, and Hwang (1968); the Technical Advisory Committee on
Protection Against Inundation (TACPI) (1974); Stoa (1978a, 1978b, 1979);
Horikawa (1978); the Shore Protection Manual (SPM) (1984); and Allsop, Franco,
and Hawkes (1985).
10. The SPM (1984) as amended by various Coastal Engineering Technical
Aids (CETA's) (primarily those by Stoa (1978b, 1979)) along with Stoa (1978a)
summarizes the present design methodology used by the US Army Corps of Engi-
neers (USACE) in providing preliminary guidance for runup calculations in the
United States. In this approach, runup calculations are made primarily by
means of runup curves based on physical modeling results for various input
wave conditions and a specific type of structure and offshore bathymetry. No
guidance has been provided for situations outside of specific combinations of
offshore bathymetry and structure tested. Design practice dictates that phys-
ical model tests must be made for structures and offshore bathymetry outside
of those special conditions tested. Limited guidance is also provided in SPM
(1984) for scaling up laboratory results of runup to prototype conditions.
Unfortunately such guidance is derived from only three data points* and cannot
be used for steep sloped structures where the runup scale correction factor
approaches infinity. Stoa (1978a) provides a refined suggested curve for
scale correction based on his intuition and the same limited data. An
untested methodology for using the results of the runup curves for computing
irregular wave runup values is also provided in SPM (1984).
11. The TACPI (1974) report provides a review of various data sets and
results of laboratory testing on regular and irregular wave runup, as well as
considerable information on laboratory results of runup effects due to struc-
ture roughness, structure slope(s) (in the case of composite structure slope),
and various features of the offshore bathymetry (such as berm). Again, no
generic runup methodology is provided that would cover all instances, but
rather the approach is predicated based on the use of existing laboratory and
theoretical information for specific structures or structure features where
physical model results exist. A review of both nonbreaking wave and breaking
wave runup theoretical aspects is included, but no guidance is provided that
would cover all instances in design. In particular, most of the literature
reviewed pertains to nonsteep structures typical of dikes rather than steep
sloped structures such as near-vertical walled flood-protection structures.
Dutch methodology in design of coastal structures also utilizes site-specific
physical model testing for obtaining runup. The TACPI (1974) provides infor-
mation that would help in optimizing a model testing program for design of a
flood-protection structure.
12. Horikawa (1978) reviews the Japanese approaches to runup calcula-
tions. Japanese design is also predicated on the results of site-specific
physical modeling with no clear attempts to provide a predictive approach for
calculation of runup under all circumstances of wave action, structure
* T. Saville, Jr., 1 9 6 0 , "Scale Effect in Wave Runup," unpublished paper presented at the American Society of Civil Engineers Convention, Boston, MA.

configuration, etc. Horikawa notes design runup curves derived from physical
model tests for specific beach and structure configurations (Toyoshima, Shuto,
and Hashimoto (1966)) that could be considered analogous to SPM (1984) runup
curves used in the United States.
13. Koh and Le Mehaute (1966) and Le Mehaute, Koh, and Hwang (1968)
provide a general review of theoretical approaches to the runup problem along
with a discussion of wave runup under both breaking and nonbreaking waves.
Intuitive approaches for blending of the two different physical types of runup
(breaking and nonbreaking) to provide a coherent and consistent approach to
presenting runup data are given.
14. Research on runup conducted in other countries (primarily the
United Kingdom and Germany) is confined mostly to various technical papers in
journals, papers presented at conferences, and laboratory reports. Allsop,
Franco, and Hawkes (1985) provide an updated review of much of this research.
15. It is important to note that in all of these countries, there is no
attempt to define a predictive runup computation strategy for all possible
scenarios because all flood-protection structures undergo site-specific physi-
cal modeling tests to optimize structure design based on the known bathymetry
at the site and the known or postulated (irregular or depth-limited) wave
conditions that would occur during design event(s). This approach to design
substantiates the statement made earlier that present state of the art in wave
runup prediction does not allow an engineer to compute wave runup from a theo-
retical basis over all conditions of wave action and structure type/configu-
ration with any degree of confidence. This statement is reinforced for the
case of irregular waves, the reasons for which will be noted later.
16. Some of the more pertinent literature on the topic of runup (with
emphasis on literature not incorporated in the previous nine primary refer-
ences) will be noted in the following paragraphs along with a short di.scussion
of the theoretical aspects of periodic wave runup on smooth slopes under
breaking and nonbreaking waves. A summary of attempts at periodic wave runup
prediction on sloped structures will be reviewed along with results of testing
potentially useful smooth slope methods. A robust approach to the calculation
of a maximum wave runup on structures will be presented for the case of peri-
odic waves on smooth sloping structures. Recent results of measurements of
periodic wave runup on nonsmooth sloped structures will also be presented
along with a recommended approach to modifying smooth slope wave runup to

account for roughness and scale effects. Such a methodology will allow these
smooth slope predictions to be extended to more complex structures by means of
simple correction factors to develop a robust approach for maximum wave runup
under depth-limited breaking waves consistent with present FEMA flood zone
evaluation. A review of attempts to extend the results of periodic wave runup
theoretical calculations or physical modeling results to the irregular wave
domain problem will be made along with a rational explanation of why such
approaches may be of limited use in practical problems at present.
Regular Wave Runuv on Smooth Linear Slopes
17. As noted previously, many of the attempts at predicting runup are
physical modeling based. In the United States, past physical model experi-
ments by Grantham (1953); Saville (1955, 1956, 1958, 1962); Savage (1957,
1958); and Hudson, Jackson, and Cuckler (1957) for periodic wave runup on
smooth slopes (and sand roughened slopes in the case of Savage (1957, 1958))
appear to be the most comprehensive data sets available. The only data set on
periodic wave runup that approximates a generic data set is the smooth slope
data of Saville (1956, 1962) and Savage (1957, 1958), which is the basis for
most of the runup curves in Stoa (1978a) and in SPM (1984) and which extends
over several slopes for a limited number of offshore bathymetric conditions.
These data will be discussed further in a later section of the report. The
data sets of Saville (1956) and Hudson, Jackson, and Cuckler (1957) appear to
be the primary data sets used by Hunt (1959) in his classic empirical approach
to evaluate wave runup under breaking waves. The so-called Hunt equation was
the first attempt at a prediction equation for runup under breaking waves.
The Hunt equatfon is given in its original form as follows (in non-SI units):
where
R = wave runup (feet)
H = wave height (feet)
T = wave period (seconds)
8 = structure slope
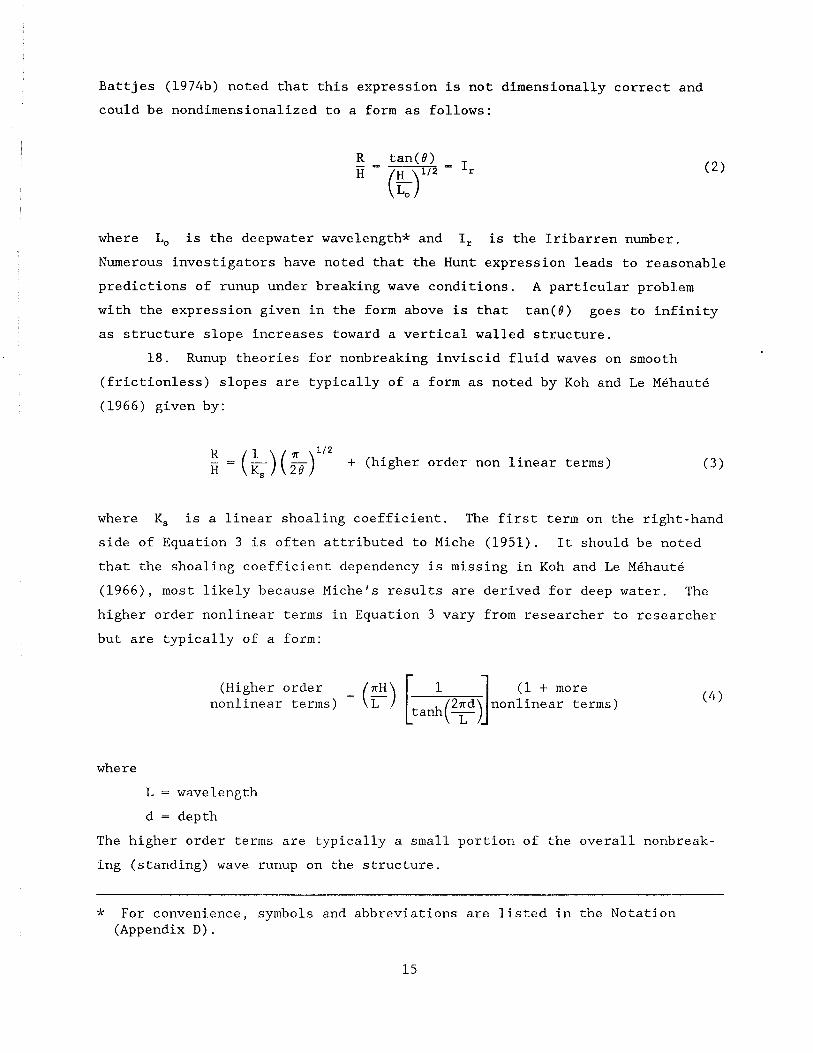
Battjes (1974b) noted that this expression is not dimensionally correct and
could be nondimensionalized to a form as follows:
where Lo is the deepwater wavelength* and I, is the Iribarren number.
Numerous investigators have noted that the Hunt expression leads to reasonable
predictions of runup under breaking wave conditions. A particular problem
with the expression given in the form above is that tan(6) goes to infinity
as structure slope increases toward a vertical walled structure.
18. Runup theories for nonbreaking inviscid fluid waves on smooth
(frictionless) slopes are typically of a form as noted by Koh and Le MBhaute
(1966) given by:
R = (k) (k)'l2 + (higher order non linear terms)
where K, is a linear shoaling coefficient. The first term on the right-hand
side of Equation 3 is often attributed to Miche (1951). It should be noted
that the shoaling coefficient dependency is missing in Koh and Le MBhaute
(1966), most likely because Miche's results are derived for deep water. The
higher order nonlinear terms in Equation 3 vary from researcher to researcher
but are typically of a form:
(Higher order nonlinear terms)
where
L = wavelength
d = depth
The higher order terms are typically a small portion of the overall nonbreak-
ing (standing) wave runup on the structure.
* For convenience, symbols and abbreviations are listed in the Notation (Appendix D) .

19. The critical wave/slope combination at which the transition from
standing wave to initiation of breaking occurs is typically of a form due to
Miche (1951):
It should be noted that Keller (1961) has derived a similar form of Equation. 5
only with sin(0) replaced by " 0 " and a different constant.
20. Other researchers, notably Jackson (1968), Dai and Kame1 (1969),
Ahrens (1975a, 1975b), and Gunbak (1979), have measured periodic wave runup on
a variety of rubble mound, riprap, and concrete-armored block-layered struc-
tures. Ahrens and McCartney (1975), Gunbak (1979), and Coastal Engineering
Research Center (CERC) (1985) (CETN-1-37, 12/85) present equations for runup
that encompass the entire breaking/nonbreaking range of wave conditions for
these type structures with empirical equations of the form:
where a,b are empirical coefficients dependent on structure type and slope.
These equations are meant to provide a fitting of runup data over the entire
breaking/nonbreaking wave runup zone, but unfortunately address only a limited
number of structure types and slopes. The philosophy behind this empirical
equation approach can be seen by assuming small I, (breaking wave region)
where the equation reduces to a form:
Equation 7 is of a Hunt equation form. For the nonbreaking region
(I, >> 0) , the equation reduces to:

Equation 8 is a constant similar to nonbreaking (standing wave) theory for a
given slope and no nonlinear terms.
21. Many of these same runup data sets on nonsmooth (permeable and
impermeable) sloped structures are summarized as well as reworked in Losada
and Gimenez-Curto (1981), who have provided empirical expressions for calcu-
lating wave runup in the form:
R - = a[l - exp (b I,)] H
where a,b are empirically fit coefficients for the data, again slope and
structure dependent.
22. As these empirical equation approaches to calculate periodic wave
runup were fit to runup measurements from a variety of researchers using dif-
ferent measurement techniques, laboratory equipment, and scales of testing,
any attempts to interpolate or extrapolate such results to structures outside
the range or scale of those tested should be done with extreme caution.
23. Losada and Gimenez-Curto (1981), as well as other researchers, note
that runup on smooth slope structures does not follow the trend of the rough-
ened, permeable structures. The smooth slope structure periodic wave runup
data as noted in runup curves of various researchers do not follow a smooth
monotonically increasing value of relative runup (R/H) with increasing Iribar-
ren number (or increasing slope) as does the roughened permeable structure
runup data. Many researchers, notably Gunbak (1979) and Sawaragi, Iwata, and
Kobayashi (1982), attribute this phenomenon to a resonance on the slope,
although it would appear that this is more likely due to a more clearly
defined transition from the breaking wave runup to the nonbreaking wave runup
process under the less turbulent conditions on a smooth slope.
24. Losada and Gimenez-Curto (1981) present a series of expressions for
calculation of wave runup on smooth slopes over the full range of Iribarren
number as follows:

These expressions are not consistent with Saville's (1956) and Savage's (1957)
data presented in a revised format in Appendix A.
25. Tautenhaim, Kohlase, and Partenscky (1982) propose an equation for
periodic wave runup of the form:
where K, is the reflection coefficient of the structure. For the case of
complete breaking (K, = 0.0), this equation can be rewritten as:
Equation 12 shows an additional slope effect beyond what is already included
in the Hunt equation. This equation predicts a finite runup effect on hori-
zontal slopes that increases toward an infinite runup value on vertical slopes
(assuming breaking waves and no reflection). Such effects are contrary to
physical intuition. As noted in previous paragraphs and will be shown in
reanalysis of Saville (1956) and Savage (1957) data, the Hunt equation appears
to be very reliable for mild slopes, suggesting that the additional slope
effect in Equation 12 is not physically correct. For the case of nonbreaking
wave rrinup, i.e., runup under pure standing waves with K, = 1.0 , the Tauten-
haim, Kohlase, and Partenscky (1982) expression would predict zero runup, a
physically incorrect answer. As Tautenhaim, Kohlase, and Partenscky (1982) do
not clearly explain the rationalization for this equation that appears to be
amenable to both breaking and nonbreaking wave regions, it will be dismissed.
26. Chue (1980) also provides an expression for periodic wave runup
with claimed wide applicability. The form of his equation is as follows:

where
where
H, = deepwater wave height
I,, = Chue number
This expression is criticized by Ahrens and Titus (1985) because of its incor-
rect trend of relative runup of nonbreaking waves decreasing with increasing
wave steepness. Due to its lack of physical basis, Chue's equation will also
be dismissed.
27. Ahrens and Titus (1985) used a selected portion of the data from
periodic wave tests by Saville (1956) and Savage (1958) to derive a general
empirical equation for periodic wave runup on plane smooth slopes under both
nonbreaking and breaking periodic wave runup. This equation for transitional waves (between breaking and nonbreaking) is of the form given below. For
2.0 5 I, < 3.5, use:
R - = 1, - 2.0 H 1.5
(nonbreaking relative runup equation)
3.5 - I, + 1.5
(breaking relative runup equation) (15a)
For I, 5 2.0 , a breaking wave runup equation is used. The breaking relative
runup equation is given by:
- = 1.002 I, (breaking) H (15b)
Equation 15b is the Hunt equation for all practical purposes. For I, 1 3.5 ,
a nonbreaking wave runup equation is used. The nonbreaking relative runup
equation given in Ahrens and Titus (1985) necessitates calculating the crest
elevation of the incident wave via stream function theory. Ahrens* has more
recently superseded the nonbreaking relative runup expression with a new
empirical expression of the following form:
R 112 - = 1.087(&) + 0.775G (nonbreaking) H
where G is the Goda (1983) nonlinearity parameter given by:
This expression was tested with the full set of Saville's (1956) and Savage's
(1958) smooth slope periodic wave runup data and found to give reasonable
agreement over much of the data although considerable scatter remained within
the data sets (Figures 1-7).
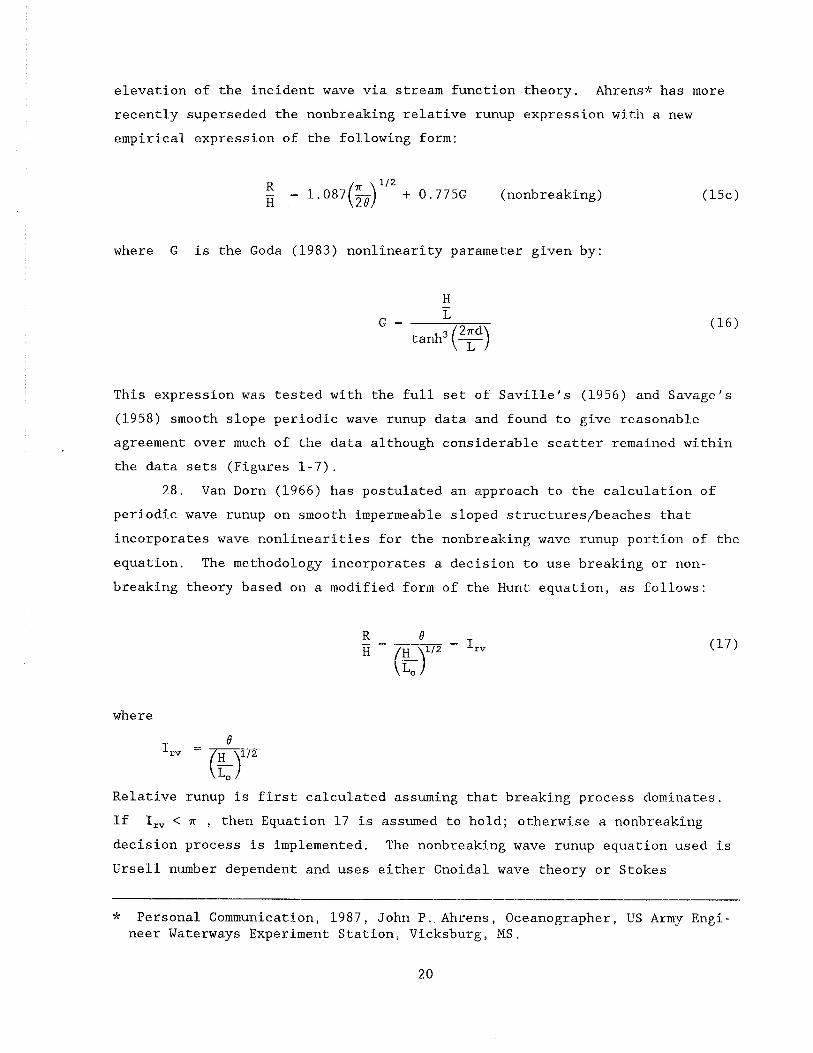
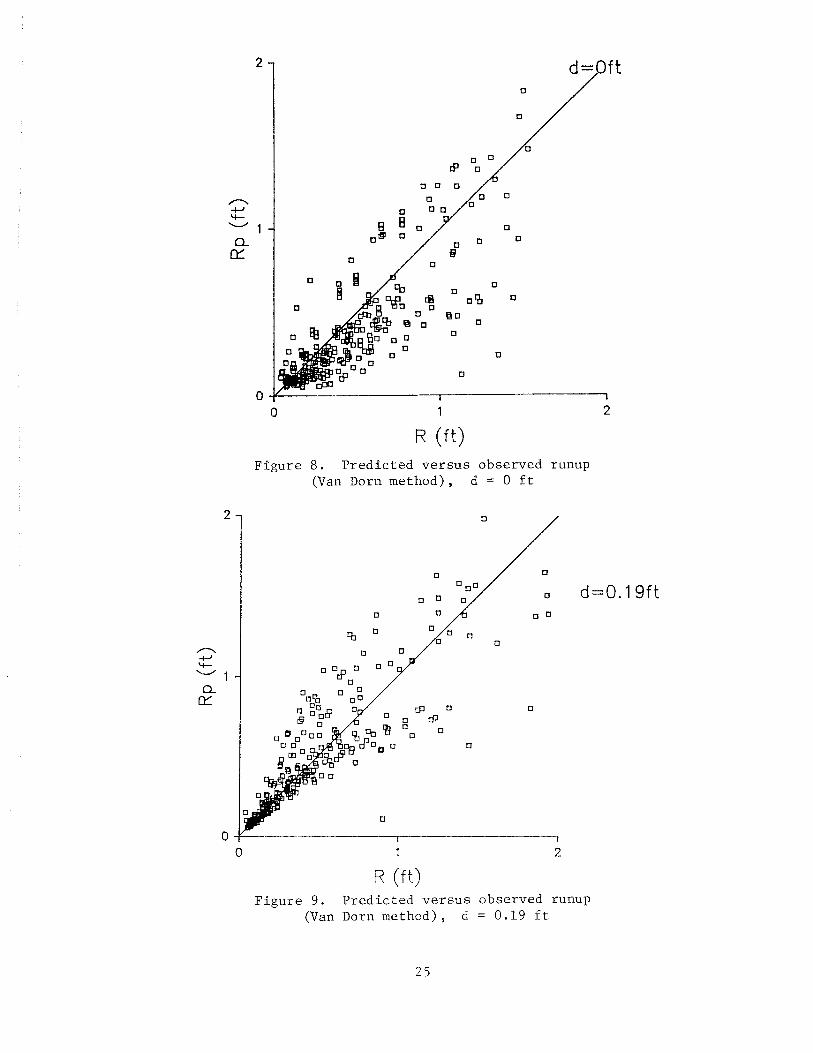
28. Van Dorn (1966) has postulated an approach to the calculation of
periodic wave runup on smooth impermeable sloped structures/beaches that
incorporates wave nonlinearities for the nonbreaking wave runup portion of the
equation. The methodology incorporates a decision to use breaking or non-
breaking theory based on a modified form of the Hunt equation, as follows:
where
Relative runup is first calculated assuming that breaking process dominates.
If I,, < n , then Equation 17 is assumed to hold; otherwise a nonbreaking
decision process is implemented. The nonbreaking wave runup equation used is
Ursell nuniber dependent and uses either Cnoidal wave theory or Stokes
* Personal Communication, 1987, John P. Ahrens, Oceanographer, US Army Engi- neer Waterways Experiment Station, Vicksburg, MS.

Figure 1. Predicted (Rp) versus observed (R) runup (Ahrens method), depth = 0 ft*
second-order wave theory. This methodology was also tested using the smooth
slope periodic wave runup data of Saville (1956) and Savage (1958). Results
of this testing are provided in Figures 8-14, where it can be seen that as in
Ahrens' method, there is also considerable scatter in the data.
29. Nagai and Takada (1972) and Takada (1974) have proposed runup for-
mulae for use on smooth slope impermeable structures that have been compared
with a limited set of Japanese periodic wave runup laboratory measurements as
well as some of Saville's (1956) smooth slope data. Takada (1974) is con-
cerned only with vertical walled structures. Takada (1974) provides periodic
wave runup formulae of a type similar to that proposed by Koh and Le Mkhaute
(1966), where a decision process is made based on critical slope or critical
Iribarren number as to whether the runup process is a breaking or nonbreaking
wave process. The runup equation for the breaking wave process deviates con-
siderably from the Hunt equation and in fact resembles his nonbreaking type of
equation with a minor slope effect change. Although Takada shows supporting
* A table of factors for converting non-SI units of measurement to SI units is presented on page 6.

F i g u r e 2 . P r e d i c t e d v e r s u s observed runup (Ahrens method) , d = 0.19 f t
R (ft) F i g u r e 3 . P r e d i c t e d v e r s u s observed runup
(Ahrens method) , d = 0.38 f t

F i g u r e 4 . P r e d i c t e d v e r s u s observed runup (Ahrens method) , d = 0.75 ft
R (ft) F i g u r e 5 . P r e d i c t e d v e r s u s observed runup
(Ahrens method) , d = 1 . 0 f t

o i 2
R (ft) F i g u r e 6 . P r e d i c t e d v e r s u s o b s e r v e d runup
(Ahrens m e t h o d ) , d = 1 . 2 5 f t
F i g u r e 7 . P r e d i c t e d v e r s u s o b s e r v e d runup (Ahrens m e t h o d ) , d = 1.50 f t
F i g u r e 8 . P r e d k t e d v e r s u s observed runup (Van Dorn method) , d = 0 f t
0 1 2
R (ft) F i g u r e 9 . P r e d i c t e d v e r s u s observed runup
(Van Dorn method) , d = 0 .19 f t

Figure 10. Predicted versus observed runup (Van Dorn method), d = 0.38 f t
0 1 2
R (ft) Figure 11. Predicted versus observed runup
(Van Dorn method), d = 0 .75
F i g u r e 1 2 , P r e d f c t e d v e r s u s observed runup (Van Dorn method) , d = 1 . 0 f t
F i g u r e 13. P r e d i c t e d v e r s u s observed runup (Van Dorn method) , d = 1 . 2 5 f t

Figure 14. Predicted versus observed runup (Van Dorn method), d = 1.5 ft
evidence for such an equation through laboratory data, numerous investigators
who have shown Hunt's equation to be valid in form suggest a dismissal of
Takada's equations from further consideration. Nagai and Takada (1972) show a
meaningful refinement of the runup formulae by using a form of the Hunt equa-
tion in the breaking wave runup process although they have incorrectly speci-
fied the shoaling coefficient dependency. In the nonbreaking wave region,
they use a form of relative runup equation contributed by Miche (1944) but
again misspecify the shoaling coefficient dependency. Their postulated runup
equations are fit to limited data with reasonable success in spite of the
minor shoaling coefficient misspecifications. As their formula is similar to
the approach used by Van Dorn (1966) and Ahrens,* their expressions will not
be discussed further. Takada (1974) addresses the wave runup problem on ver-
tical walls fronted by a 1 on 10 beach slope exclusively. He presents Eormu-
lae different from previous gapers for the case of vertical walls as might be
* Personal Communication, 1987, John P. Ahrens, Oceanographer, US Army Engi- neer Waterways Experiment Station, Vicksburg, MS.
expected since Hunt's equation will not work on vertical walls because of the
slope tangent dependency. His formulae also have provision to account for
wave spray effects but do not address model scale, which can be critical for
consideration of surface tension effects. As his data are presented in terms
of relative runup scaled by deepwater wave height, the runup on the structure
cannot be decoupled from the wave transformation that exists for his particu-
lar laboratory setup, thus making practical application of his equations
impossible for a FEMA depth-limited wave height approach to the runup problem.
Regular Wave Runup on Smooth Composite Slo~es
30. There has been very limited research on wave runup on composite
slope structures such as structures with convex or concave profiles. Saville
(1958) compared laboratory results of wave runup on one type of composite
slope structure with an iterative equivalent slope approach to runup calcula-
tion. This method is the recommended method in SPM (1984). A good discussion
of the method and its limitations is provided in TACPI (1974), which concludes
that the equivalent gradient method of Saville may have some merits, although
there is uncertainty as to the limits of its validity. The TACPI (1974) also
notes that "due to the strongly empirical nature of the method, considerable
caution is necessary in applying it to slope shapes which differ clearly from
the shapes for which the method has been found to be valid. This is all the
more true since the real runup tends to be underestimated rather than over-
estimated." More recently, Kobayashi and Jacobs (1985) have proposed an
alternative empirical method to the calculation of runup on composite slope
structures with berms. The methodology is tested on a limited set of labora-
tory data with results similar to those found by Saville (1958). Although the
method appears promising (as does Saville's method), the limited testing pro-
vided to date does not provide sufficient confidence for the method to be
recommended for general use. There is at present no analytical method based
on sound physical principles to compute wave runup on composite slope struc-
tures that will provide an answer with an acceptable degree of accuracy for
varying structure, wave, and bathymetric conditions. This is especially true
in the case of bermed structures where the width of the structure may be on
the same order as the shallow-water wavelength. The only present recourse for
complex structure shapes is to do laboratory tank testing to find a realistic

answer to wave runup, If the width of the flood-protection structure is short
compared with the shallow-water wavelength, it may be a sufficient approxima-
tion to consider using a linear slope from the toe of the flood-protection
structure to the top of the structure.
Nonsmooth Slope Effects
31. As noted previously, for FEMA purposes a seawall should be defined
as a hardened im~ermeable structure constructed to prevent flooding behind it.
Consistent with this philosophy, any credit for runup reduction by roughened
structures (as opposed to smooth surface seawalls/dikes) should reflect either
theoretical or laboratory findings for impermeable type surfaces or low perme-
ability surfaces such as a hardened impermeable surface covered by a limited
surface layer of rock, rubble, or concrete armor shapes. Runup tests on per-
meable breakwaters where considerable wave energy can be transmitted through
the structure as well as dissipated within the structure should not be con-
sidered as a valid basis for reducing runup from the smooth slope runup
results. As the state of the art in theoretical wave runup prediction does
not allow for an approach to the problem of runup reduction for roughened
structures, any recommendations for the reduction of runup on roughened struc-
tures must be made based on laboratory tests.
32. Due to limited information on runup reduction caused by roughened
surfaces, only crude attempts to account for it have been made, primarily by a
runup reduction factor r applied to smooth slope runup (TACPI 1974, Stoa
1978a, and SPM 1984). The reduction factor r is a combination of effects
caused by both turbulent boundary layer energy dissipation on the face of the
structure (because of roughness effects) and turbulent energy dissipation
within the structure (because of permeability of the structure). A possible
form of the reduction factor might be posed as:
r = (roughness factor ) x (permeability factor) (18)
Existing literature on the subject has not tried to separate these two effects
sufficiently for the purposes of engineering prediction of runup. For the
purposes previously stated, the present attempt to provide guidance for FEMA
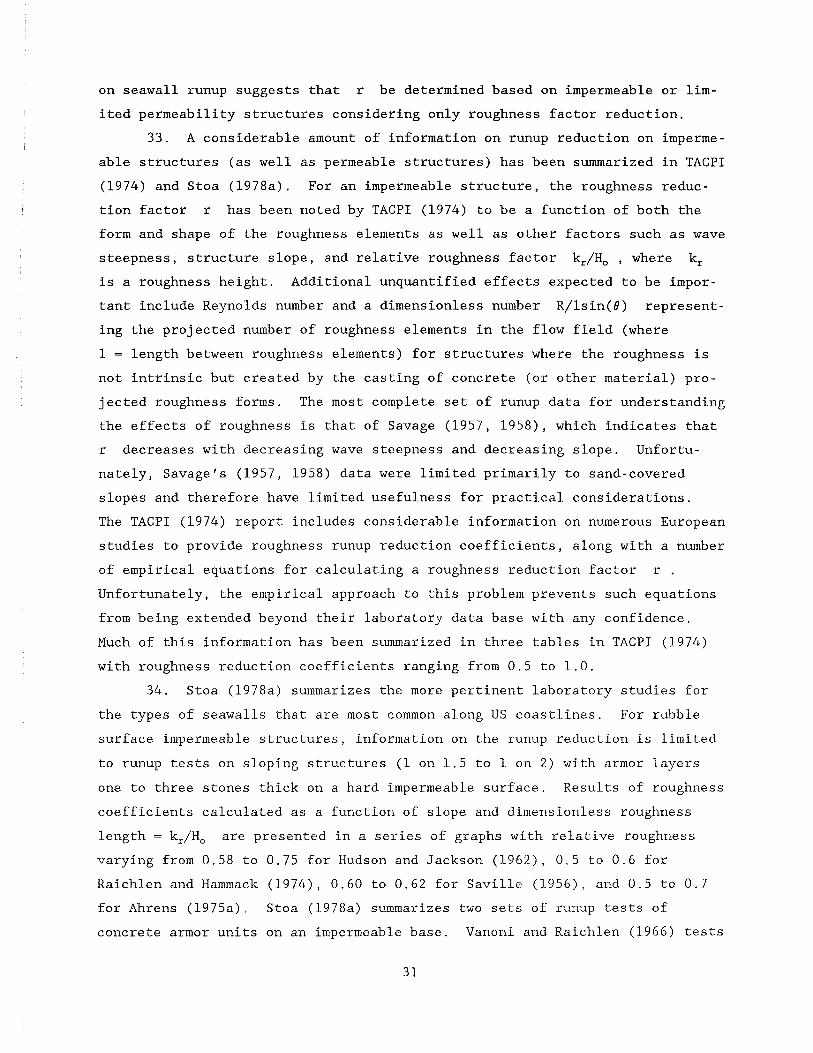
on seawall runup suggests that r be determined based on impermeable or lim-
ited permeability structures considering only roughness factor reduction.
33. A considerable amount of information on runup reduction on imperme-
able structures (as well as permeable structures) has been summarized in TACPI
(1974) and Stoa (1978a). For an impermeable structure, the roughness reduc-
tion factor r has been noted by TACPI (1974) to be a function of both the
form and shape of the roughness elements as well as other factors such as wave
steepness, structure slope, and relative roughness factor k,/H, , where k,
is a roughness height. Additional unquantified effects expected to be impor-
tant include Reynolds number and a dimensionless number R/lsin(B) represent-
ing the projected number of roughness elements in the flow field (where
1 = length between roughness elements) for structures where the roughness is
not intrinsic but created by the casting of concrete (or other material) pro-
jected roughness forms. The most complete set of runup data for understanding
the effects of roughness is that of Savage (1957, 1958), which indicates that
r decreases with decreasing wave steepness and decreasing slope. Unfortu-
nately, Savage's (1957, 1958) data were limited primarily to sand-covered
slopes and therefore have limited usefulness for practical considerations.
The TACPI (1974) report includes considerable information on numerous European
studies to provide roughness runup reduction coefficients, along with a number
of empirical equations for calculating a roughness reduction factor r . Unfortunately, the empirical approach to this problem prevents such equations
from being extended beyond their laboratory data base with any confidence.
Much of this information has been summarized in three tables in TACPI (1974)
with roughness reduction coefficients ranging from 0.5 to 1.0.
34. Stoa (1978a) summarizes the more pertinent laboratory studies for
the types of seawalls that are most common along US coastlines. For rubble
surface impermeable structures, information on the runup reduction is limited
to runup tests on sloping structures (1 on 1.5 to 1 on 2) with armor layers
one to three stones thick on a hard impermeable surface. Results of roughness
coefficients calculated as a function of slope and dimensionless roughness
length = k,/H, are presented in a series of graphs with relative roughness
varying from 0.58 to 0.75 for Hudson and Jackson (1962), 0.5 to 0.6 for
Raichlen and Hammack (1974), 0.60 to 0.62 for Saville (1956), and 0.5 to 0.7
for Ahrens (1975a). Stoa (1978a) summarizes two sets of rtmup tests of
concrete armor units on an impermeable base. Vanoni and Raichlen (1.966) tests

suggested runup reduction for tribars underlain by two filter layers of stone
to be 0.38 to 0.40, while McCartney and Ahrens (1975) runup tests on Gobi
blocks suggested a runup reduction factor of 0.93. For stepped structures,
Stoa (1978a) summarized the results of three runup investigations (Saville
1955, Jachowski 1964, Nussbaum and Colley 1971) that provided runup reduction
factors ranging from 0.66 to 0.90 depending on relative roughness, step size,
relative depth, and slope.
3 5 . Due to a paucity of data on comparisons between runup on smooth
slopes and runup on rough slopes under similar wave and bathymetric condi-
tions, information on runup reduction factors is inadequate to provide more
than an approximation of the reduction offered by a rough (and possibly lim-
ited permeability in the case of stone on a hard surface) surface. Suggested
roughness runup reduction factors r for various surfaces are provided in
Table 1 and are similar to those in Table 7-2 of SPM (1984) as well as summa-
rized literature from the TACPI (1974) and Stoa (1978a). The primary differ-
ence between Table 1 provided here and the tables and information in the above
reports is reflected in the use of an r on the high end of the laboratory
measurements because of the present lack of confidence in extrapolating such
information to field conditions.
Table 1
Suggested Roughness - Runuv Reduction Factors for Various Surfaces
Surface Characteristic --- r
Smooth 1.00
Concrete blocks, Gobi blocks 0.90
Grass 0.90
Quarrys tone, rubble 0.80
Stepped surface 0.80
Scale effects
36. Literature on scale effects in runup laboratory testing is scarce,
and coverage of the subject is limited to very few references (Stoa 1978a,
Fuhrboter 1986, Saville* 1987). This subject has been examined by only two
* T. Saville, Jr., "Scale Effect in Wave Kunup," unpublished report, American Society of Civil Engineers Convention, Boston, MA.

investigators (Fuhrboter 1986; Saville* 1987) when considering only those
investigations that have duplicated small scale runup tests in larger (proto-
type) laboratory facilities.
37. The only extensive review of scale effects on monochromatic wave
runup found is that of Stoa (1978a) who discusses numerous laboratory tests,
primarily of a site-specific nature, and the effects of a water wave defined
Reynolds number on runup results. Stoa (1978a) also provides a suggested
revision of a runup scale correction factor relationship provided in the SPM
(1984). This runup scale correction factor originates from Saville* (1987)
and was in earlier versions of the SPM as well as the most recent (1984) ver-
sion and reflects a very limited amount of data on only three structures
slopes (1:3, 1:6, and 1:15). As noted by both Stoa (1978a) and Saville
(1987), there is also some ambiguity as to whether such scale effects are true
scale effects (i.e., due to modeling at different flow Reynolds numbers) or
due (at least in part) to different relative roughnesses between the large
scale tests and the small scale tests. Stoa's (1978a) scale correction curve
based on Saville's* work reflects an attempt to provide for this ambiguity by
reducing the scale correction factors (as given by Saville* and included in
the present edition of SPM (1984)) to be applied to runup predictions based on
small scale tests. An additional problem addressed by Stoa (1978a) is that
the Saville* runup scale factor correction curve provides enormously high
runup correction factors (approaching infinity) for steep sloped structures.
Stoa's (1978a) revised runup scale factor correction curve is (in part) a
hypothetical curve in which runup scale correction factor reduces to zero (for
vertical walls) as structure slope increases to account for the steep slope
problem in Saville's* original curve.
38. A more recent look into scale effects has been provided by
Fuhrboter (1986) for one relatively smooth slope (1:4) in which waves are
breaking on the slope. Fuhrboter's (1986) conclusions, based on this limited
data set, show little scale effect and contradict the findings of Saville* and
Stoa (1978a).
39. In the course of the present study, a reanalysis was made of both
Fuhrboter's (1986) and Saville's* (1987) data, but due to scatter in both data
sets, no clear recommendations can be provided addressing scale factor
* Saville, op. cit
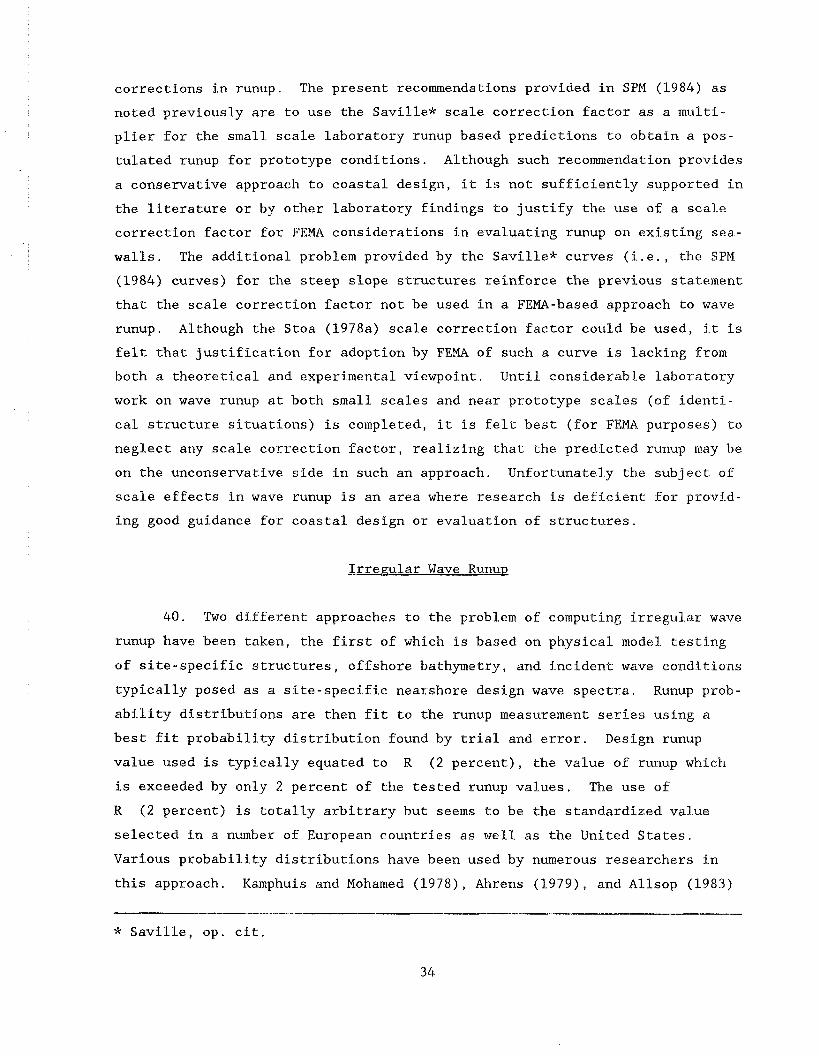
corrections in runup. The present recommendations provided in SPM (1984) as
noted previously are to use the Saville* scale correction factor as a multi-
plier for the small scale laboratory runup based predictions to obtain a pos-
tulated runup for prototype conditions. Although such recommendation provides
a conservative approach to coastal design, it is not sufficiently supported in
the literature or by other laboratory findings to justify the use of a scale
correction factor for FEMA considerations in evaluating runup on existing sea-
walls. The additional problem provided by the Saville* curves (i.e., ehe SPM
(1984) curves) for the steep slope structures reinforce the previous statement
that the scale correction factor not be used in a FEMA-based approach to wave
runup. Although the Stoa (1978a) scale correction factor could be used, it is
felt that justification for adoption by FEW of such a curve is lacking from
both a theoretical and experimental viewpoint. Until considerable laboratory
work on wave runup at both small scales and near prototype scales (of identi-
cal structure situations) is completed, it is felt best (for FEMA purposes) to
neglect any scale correction factor, realizing that the predicted runup may be
on the unconservative side in such an approach. Unfortunately the subject of
scale effects in wave runup is an area where research is deficient for provid-
ing good guidance for coastal design or evaluation of structures.
Irregular Wave Runup
4 0 . Two different approaches to the problem of computing irregular wave
runup have been taken, the first of which is based on physical model testing
of site-specific structures, offshore bathymetry, and incident wave conditions
typically posed as a site-specific nearshore design wave spectra. Runup prob-
ability distributions are then fit to the runup measurement series using a
best fit probability distribution found by trial and error. Design runup
value used is typically equated to R (2 percent), the value of runup which
is exceeded by only 2 percent of the tested runup values. The use of
R (2 percent) is totally arbitrary but seems to be the standardized value
selected in a number sf European countries as well as the United States.
Various probability distributions have been used by numerous researchers in
this approach. Kamphuis and Mohamed (1978), Ahrens (1979), and Allsop (1983)
* Saville, op. cit.

have all fitted Rayleigh distributions to irregular wave runup measurements on
smooth slopes and concluded that while the Rayleigh distribution fits the data
very well over most of the measurements, it tends to underpredict the extreme
runup levels to varying degrees. Ahrens (1979, 1983) has tried the Gamma
distribution and the two-parameter Weibull distribution as well as the
Rayleigh distribution. Two points should be noted in any probability distri-
bution approach:
a. Probability distributions with higher numbers of parameters - will typically fit measurements better than one parameter distributions such as the Rayleigh distribution because proba- bility distribution fitting is just another form of curve fit- ting exercise in which better fits are provided by increasing the number of parameters (degrees of freedom) of the curve and hence its flexibility to adapt to the measured values.
b. A probability distribution found to be a good fit for one site does not guarantee an underlying universal fit of the same distribution to other sites.
As most probability distribution fits are not based on physics of the problem
but simply curve fitting exercises for a site-specific problem, a cautious
approach must be used in attempting to extrapolate random wave runup probabil-
ity distribution information to another site with differing conditions.
Researchers, notably Van Oorschot and d'Angremond (1968) and Gunbak (1979),
have attempted alternative approaches to the probability distribution fitting
by the prediction of R (2 percent) (or R (p percent)) based on gross
parameters of the incident wave spectra such as peak wave period Tp , signif-
icant wave height H, , and spectral width parameter E . As an example of
this approach for breaking waves on slopes, Van Oorschot and d'Angremond
(1968) suggested a modified version of the Hunt equation for the runup value
exceeded by 2 percent of the measured values as follows:
R (2%) = C (2%) I,,
where
C = dimensionless coefficient
I,, = random Iribarren number
where
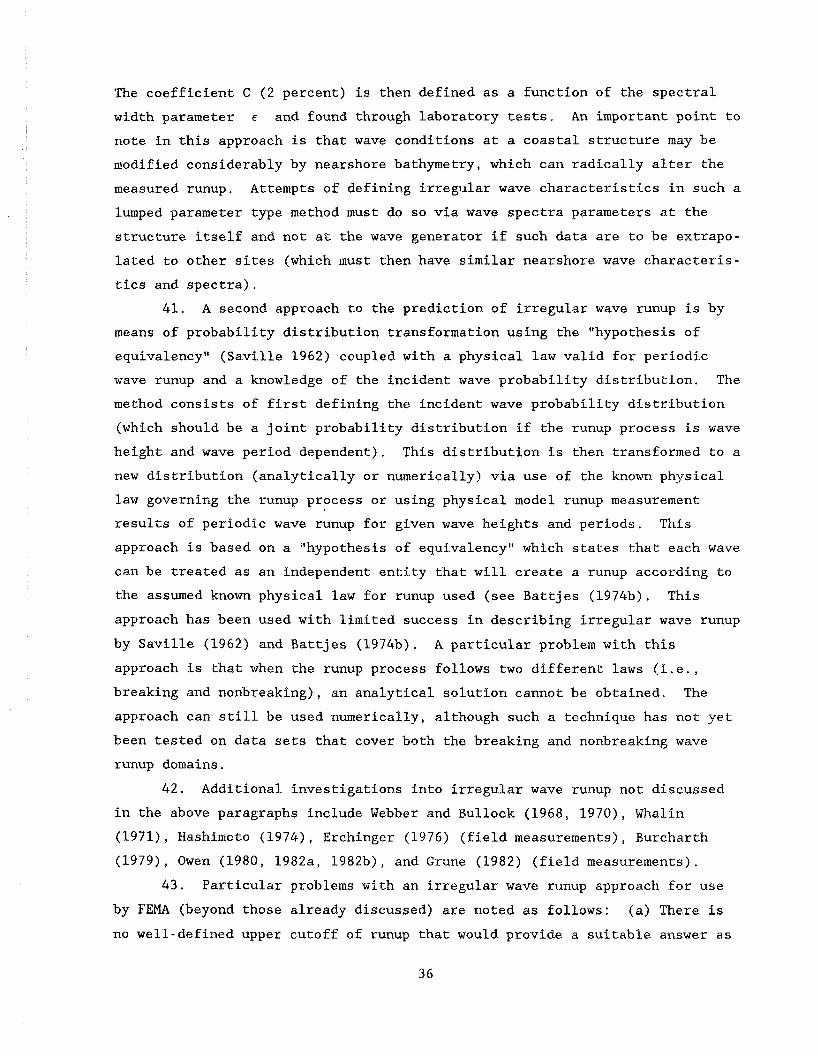
The coefficient C (2 percent) is then defined as a function of the spectral
width parameter c and found through laboratory tests. An important point to
note in this approach is that wave conditions at a coastal structure may be
modified considerably by nearshore bathymetry, which can radically alter the
measured runup. Attempts of defining irregular wave characteristics in such a
lumped parameter type method must do so via wave spectra parameters at the
structure itself and not at the wave generator if such data are to be extrapo-
lated to other sites (which must then have similar nearshore wave characteris-
tics and spectra).
41. A second approach to the prediction of irregular wave runup is by
means of probability distribution transformation using the "hypothesis of
equivalency" (Saville 1962) coupled with a physical law valid for periodic
wave runup and a knowledge of the incident wave probability distribution. The
method consists of first defining the incident wave probability distribution
(which should be a joint probability distribution if the runup process is wave
height and wave period dependent). This distribution is then transformed to a
new distribution (analytically or numerically) via use of the known physical
law governing the runup process or using physical model runup measurement
results of periodic wave runup for given wave heights and periods. This
approach is based on a "hypothesis of equivalencyv1 which states that each wave
can be treated as an independent entity that will create a runup according to
the assumed known physical law for runup used (see Batejes (1974b). This
approach has been used with limited success in describing irregular wave runup
by Saville (1962) and Battjes (1974b). A particular problem with this
approach is that when ehe runup process follows two different laws (i.e.,
breaking and nonbreaking), an analytical solution cannot be obtained. The
approach can still be used numerically, although such a technique has not yet
been tested on data sets that cover both the breaking and nonbreaking wave
runup domains.
42. Additional investigations into irregular wave runup not discussed
in the above paragraphs include Webber and Bullock (1968, 1970), Whalin
(1971), Hashimoto (1974), Erchinger (1976) (field measurements), Burcharth
(1979), Owen (1980, 1982a, 1982b), and Grune (1982) (field measurements).
43. Particular problems with an irregular wave runup approach for use
by FEMA (beyond those already discussed) are noted as follows: (a) There is
no well-defined upper cutoff of runup that would provide a suitable answer as

to whether flooding occurs behind a coastal flood-protection structure; (b) an
irregular wave runup approach would be inconsistent with present FEMA depth-
limited breaking wave and wave transformation methodology as defined in FEMA
(1981); and (c) critical incident wave spectra are known in very few coastal
locations, and knowledge on shallow-water wave transformation from gage sites
to structure locations is beyond the present state of the art (due to shallow-
water nonlinearity) to be applied with any level of confidence.
Runup Calculation Conclusions
44. For the previously stated reasons, the present conclusion is that a
monochromatic wave runup approach is best suited for FEMA needs in evaluating
the flood protection offered by a given coastal flood-protection structure.
The two most promising state-of-the-art runup predictive equations for smooth
linear slope structures are due to Van Dorn (1966) and Ahrens.* These
approaches are not capable of predicting periodic wave runup on smooth slope
structures with a high degree of confidence, but appear better than alterna-
tive approaches. A partial reason for this inability to accurately predict
runup appears to be a poor ability to predict runup in the transition and
nonbreaking wave region. Both methods use Hunt's (1959) equation for the
breaking waves, which limits treatment of steep slope structures to a non-
breaking wave approach.
45. An alternative robust method of predicting maximum wave runup on
any smooth linear sloped structure is proposed for FEMA considerations in
Appendix A. This alternative method unifies various approaches and overcomes
the difficulty of applying Hunt's equation on steep slope structures. This
proposed method is verified with the same smooth slope laboratory data of
Savage (1957, 1958) and Saville (1956) that was used in the Van Dorn (1966)
and Ahrens* approaches. The method consists of a modified Hunt equation in
the region of breakingproken waves and an upper limit to the runup process
that will be suitable for state-of-the-art computation of monochromatic wave
runup in situations of nonbreaking waves on smooth linear slopes. Further
refinements on runup methodology for smooth linear slopes must await good
* Personal Communication, 1987, John P. Ahrens, Oceanographer, US Army Engi- neer Waterways Experiment Station, Vicksburg, MS.

generic data sets on periodic wave runup and improved understanding of labora-
tory scale effects.
46. Corrections to the smooth slope data should be made via a "rough-
ness factor" as suggested in Table 1 applied to the smooth slope answer. The
inherent complexities of rough turbulent flow make an analytical solution to
this problem impossible, and state-of-the-art methods for prediction of runup
on rough slopes will remain heavily dependent on laboratory measurements. It
is recommended that no scale correction adjustment be used because of the
paucity of data on laboratory scale effects and conflicting results among such
sets. No guidance can be provided on composite slope structure runup as
state-of-the-art methodology concerning runup on such structures has not pro-
vided complete guidance or consistent trends. Here again, state-of-the-art
methodology dictates that runup prediction must rely heavily on laboratory
test results.
47. A state-of-the-art method to runup calculation for coastal. flood-
control structures dictates a two-step approach. The first step is to calcu-
late the wave transformation and runup on the natural coastal profile as if no
coastal structure was present. This can be done using existing FEMA methodol-
ogy. The second step is to calculate the runup on the coastal flood-control
structure assuming the wave conditions at the toe of the structure are the
same as those without the structure present (i.e., no wave-structure interac-
tion). Although it is apparent that the true situation is far more complex
than this (because of wave/structure interaction), present state-of-the-art
coastal engineering does not provide a tested methodology which can address
this complex situation.
Recommendations
48. It is recommended that F W use a monochromatic wave runup crite-
rion to assess whethei LL- not flooding occurs behind a coastal flood-
protection structure. Due to the present state of the art in runup prediction
and the need for FEW to use a method consistent with depth-limited breaking
wave criteria, it is recommended that a monochromatic wave runup approach be
used.
49. Numerous empirical criteria exist for determining wave runup on
structures. Most of these criteria are not reasonable for FEMA use because of
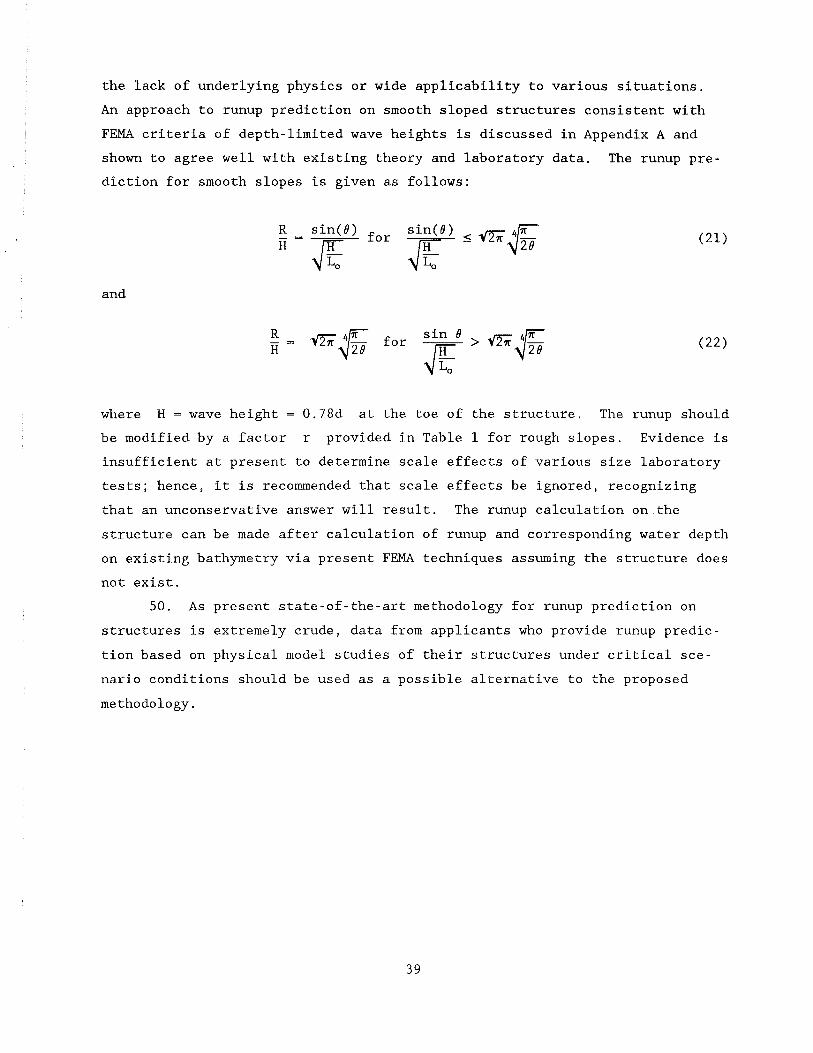
the lack of underlying physics or wide applicability to various situations.
An approach to runup prediction on smooth sloped structures consistent with
FEMA criteria of depth-limited wave heights is discussed in Appendix A and
shown to agree well with existing theory and laboratory data. The runup pre-
diction for smooth slopes is given as follows:
and
5 = for - H
where H = wave height = 0.78d at the toe of the structure. The runup should
be modified by a factor r provided in Table 1 for rough slopes. Evidence is
insufficient at present to determine scale effects of various size laboratory
tests; hence, it is recommended that scale effects be ignored, recognizing
that an unconservative answer will result. The runup calculation on.the
structure can be made after calculation of runup and corresponding water depth
on existing bathymetry via present FEMA techniques assuming the structure does
not exist.
50. As present state-of-the-art methodology for runup prediction on
structures is extremely crude, data from applicants who provide runup predic-
tion based on physical model studies of their structures under critical sce-
nario conditions should be used as a possible alternative to the proposed
methodology.
PART 111: OVERTOPPING OF STRUCTURES
Background -
51. For the purpose of calculating the flood-prevention potential
offered by a coastal flood-protection structure, a predictive calculation of
the overtopping rate under a given set of wave conditions is desirable. Over-
topping prediction can be considered a first step in the calculation of wave
transmission over a coastal flood-protection structure necessary to delineate
the type of hazard zone (V or A zone) for FEMA insurance rate maps. Research
on the prediction of wave overtopping has proceeded primarily in a series of
increments based on site-specific laboratory studies. There has never been a
comprehensive generic (one laboratory) set of overtopping data for a variety
of offshore bathymetry, seawall/revetment configurations and slopes, and wave
conditions. Such a data set would be most desirable to better understand the
physics of overtopping. Most existing laboratory data on overtopping corlsist
of smooth sloped structures for a few structure configurations. Very few
field measurements (primarily Japanese) exist on overtopping. The most com-
prehensive set of laboratory data on overtopping taken to date is the data set
of Owen (1980, 1982a), which was for a few specific types of seawalls or sea-
dikes, offshore bathymetry, and irregular wave conditions, primari1.y of rele-
vance to the English coastline. The model scale for these tests was 1:25.
52. The ideal overtopping prediction equation consistent with a FEMA-
adopted approach of a depth-limited wave height criterion would have the same
five properties discussed earlier in the section on runup. It will be shown
that none of the existing methods for calculation of overtopping are suffi-
cient to adequately address these desirable qualities of a predictive over-
topping method . 53. The primary countries that have studied overtopping are those which
(a) have a coastal flooding problem, (b) have expensive coastal development
that cannot (due to lack of land) or will not (due to desirability of living
on the coast) relocate inland, and (c) have the technology and resources to
provide expensive coastal protection. These are the countries of northern
Europe, the United States, and Japan. Other countries have also pursued
research and development in this area, but research reviews of the overtopping
subject failed to turn up useful material. A short review of the present

state of the art for preliminary design in each of these countries and method-
ology for calculating overtopping is discussed in the following paragraphs
along with a critical appraisal of problems encountered when trying to extend
past overtopping studies to a methodology for calculating overtopping for
establishment of flood insurance credit under FEMA guidelines. It should be
recognized that none of these countries appear to use overtopping calculation
for final design but rather do extensive site-specific laboratory testing to
determine final design overtopping quantities. This reflects a lack of con-
fidence in applying any general approach for overtopping calculation to a spe-
cific site.
54. In the United Kingdom, the present state of the art in overtopping
(for design) is reflected in publications by Owen (1980, 1982a). An equation
of the following type is used by Owen for calculation of overtopping:
q* = A exp (-B F*)
where
q* = q/ (TzgH)
q = average rate of overtopping in volume rate per unit length of structure
T, = zero crossing wave period
g = acceleration of gravity
A,B = coefficients found by laboratory testing
F* = F/[T,(~H,)~/~]
F = freeboard, i.e., crest height of structure above still-water level
H, = significant wave height
55. In an extensive testing program by Owen, A,B coefficients were
fit to laboratory data for a few types of seawalls of a design typical on the
UK coastline. Testing was usually done with irregular waves with a JONSWAP
type spectrum. A method of correction for roughened seawall slopes was also
suggested within these studies.
56. Particular problems exist in using this methodology with either
(a) a coastal structure having different geometry and nearshore bathymetry
than the tested structure or (b) wave conditions different from the assumed
spectrum used in the tests. To calculate overtopping for a structure differ-
ent from the one tested, the coefficients A and B must be interpolated,

which is difficult at best since two coefficients should be estimated simul-
taneously in a nonlinear equation of the form used. The method used by Owen
allows each coefficient to be interpolated separately, but this approach does
not guarantee results consistent with the original data. An additional prob-
lem is that the spectrum tested is not presented at the base of the structure
but rather at the wave generator prior to possible complex wave transformation
in the nearshore zone. Additional problems with adopting Owen's method to a
FEMA approach are (a) using irregular wave data is not consistent with past
FEMA criteria for a limiting monochromatic wave at the coast under a given
100-year water level (i.e., H - 0.78d where d is the 100-year return
period water depth at the coast), (b) the method of presenting the overtopping
as an exponential decreasing function of dimensionless freeboard suggests that
there will always be some water over the wall no matter what the structure
crest height, and (c) the bathymetry modeled is not generic to all sites;
therefore wave transformation and hence overtopping might be very different
for sites with similar structures but different nearshore bathymetry. The
third problem mentioned is common to all laboratory tests in which the waves
are measured prior to transformation by the nearshore bathymetry. Although an
irregular wave approach may be a more realistic method provided the true spec-
trum is known, such a method provides considerable problems to a methodology
that would be consistent with what FEMA has established for the depth-limited
breaking wave height approach. The additional problems caused by the inabil-
ity to accurately extrapolate coefficients A,B for seawalls/coastal flooding
structures not tested and the uncertainty in the wave transformation process
make this method undesirable for FEMA needs.
57. Recently, laboratory tests of irregular wave overtopping of various
seataalls and seawall/revetment configurations have been conducted at the CERC,
US Army Engineer Waterways Experiment Station (WES) (Ahrens and Heimbaugh
1986). Although the geometry of structures and the nearshore bathymetry
tested at CERC are different from those tested by Owen (1982a) at Wallingford,
the approach to predicting overtopping rates is quite similar. The method of
Ahrens and Heimbaugh uses wave conditions at the toe of the structure to esti-
mate wave overtopping rates; otherwise the critique applied to Owen's approach
can be applied to this method.
58. A method used in Japan for preliminary estimation sf wave overtop-
ping at coastal structures is presented in Goda (1970, 1985), Goda, Kishira,
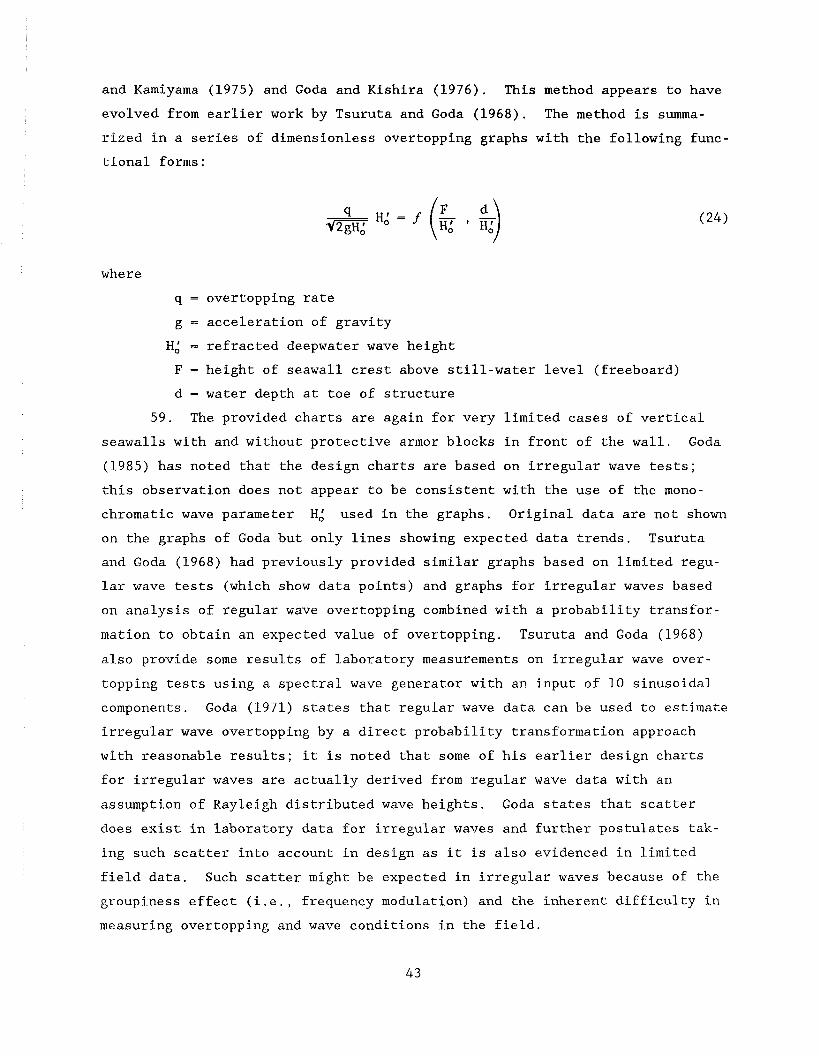
and Kamiyama (1975) and Goda and Kishira (1976). This method appears to have
evolved from earlier work by Tsuruta and Goda (1968). The method is summa-
rized in a series of dimensionless overtopping graphs with the following func-
tional forms:
where
q = overtopping rate
g = acceleration of gravity
Hd = refracted deepwater wave height
F = height of seawall crest above still-water level (freeboard)
d = water depth at toe of structure
59. The provided charts are again for very limited cases of vertical
seawalls with and without protective armor blocks in front of the wall. Goda
(1985) has noted that the design charts are based on irregular wave tests;
this observation does not appear to be consistent with the use of the mono-
chromatic wave parameter HA used in the graphs. Original data are not shown
on the graphs of Goda but only lines showing expected data trends. Tsuruta
and Goda (1968) had previously provided similar graphs based on limited regu-
lar wave tests (which show data points) and graphs for irregular waves based
on analysis of regular wave overtopping combined with a probability transfor-
mation to obtain an expected value of overtopping. Tsuruta and Goda (1968)
also provide some results of laboratory measurements on irregular wave over-
topping tests using a spectral wave generator with an input of 10 sinusoidal
components. Goda (1971) states that regular wave data can be used to estimate
irregular wave overtopping by a direct probability transformation approach
with reasonable results; it is noted that some of his earlier design charts
for irregular waves are actually derived from regular wave data with an
assumption of Rayleigh distributed wave heights. Goda states that scatter
does exist in laboratory data for irregular waves and further postulates tak-
ing such scatter into account in design as it is also evidenced in limited
field data. Such scatter might be expected in irregular waves because of the
groupiness effect (i.e., frequency modulation) and the inherent difficulty in
measuring overtopping and wave conditions in the field.
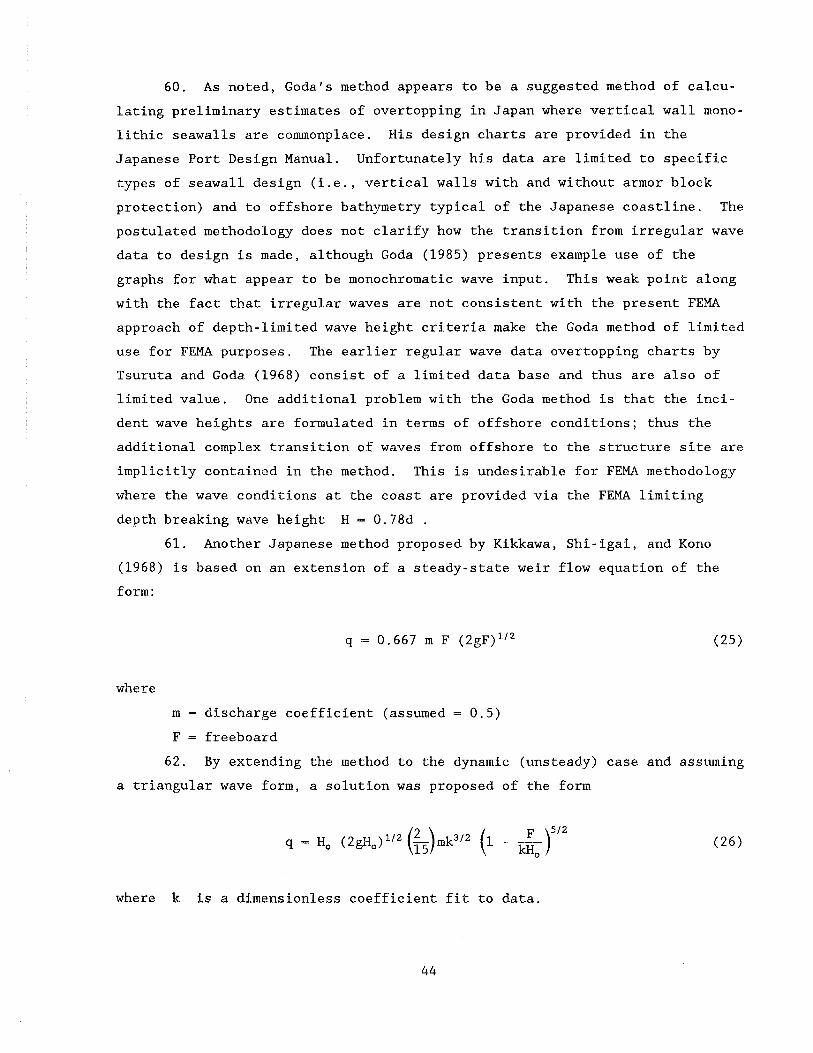
60. As noted, Goda's method appears to be a suggested method of calcu-
lating preliminary estimates of overtopping in Japan where vertical wall mono-
lithic seawalls are commonplace. His design charts are provided in the
Japanese Port Design Manual. Unfortunately his data are limited to specific
types of seawall design (i.e., vertical walls with and without armor block
protection) and to offshore bathymetry typical of the Japanese coastline. The
postulated methodology does not clarify how the transition from irregular wave
data to design is made, although Goda (1985) presents example use of the
graphs for what appear to be monochromatic wave input. This weak point along
with the fact that irregular waves are not consistent with the present FEMA
approach of depth-limited wave height criteria make the Goda method of limited
use for FEMA purposes. The earlier regular wave data overtopping charts by
Tsuruta and Goda (1968) consist of a limited data base and thus are also of
limited value. One additional problem with the Goda method is that the inci-
dent wave heights are formulated in terms of offshore conditions; thus the
additional complex transition of waves from offshore to the structure site are
implicitly contained in the method. This is undesirable for FEMA methodology
where the wave conditions at the coast are provided via the FEMA limiting
depth breaking wave height H = 0.78d . 61. Another Japanese method proposed by Kikkawa, Shi-igai, and Kono
(1968) is based on an extension of a steady-state weir flow equation of the
form:
where
m = discharge coefficient (assumed = 0.5)
F = freeboard
62. By extending the method to the dynamic (unsteady) case and assuming
a triangular wave form, a solution was proposed of the form
where k is a dimensionless coefficient fit to data.
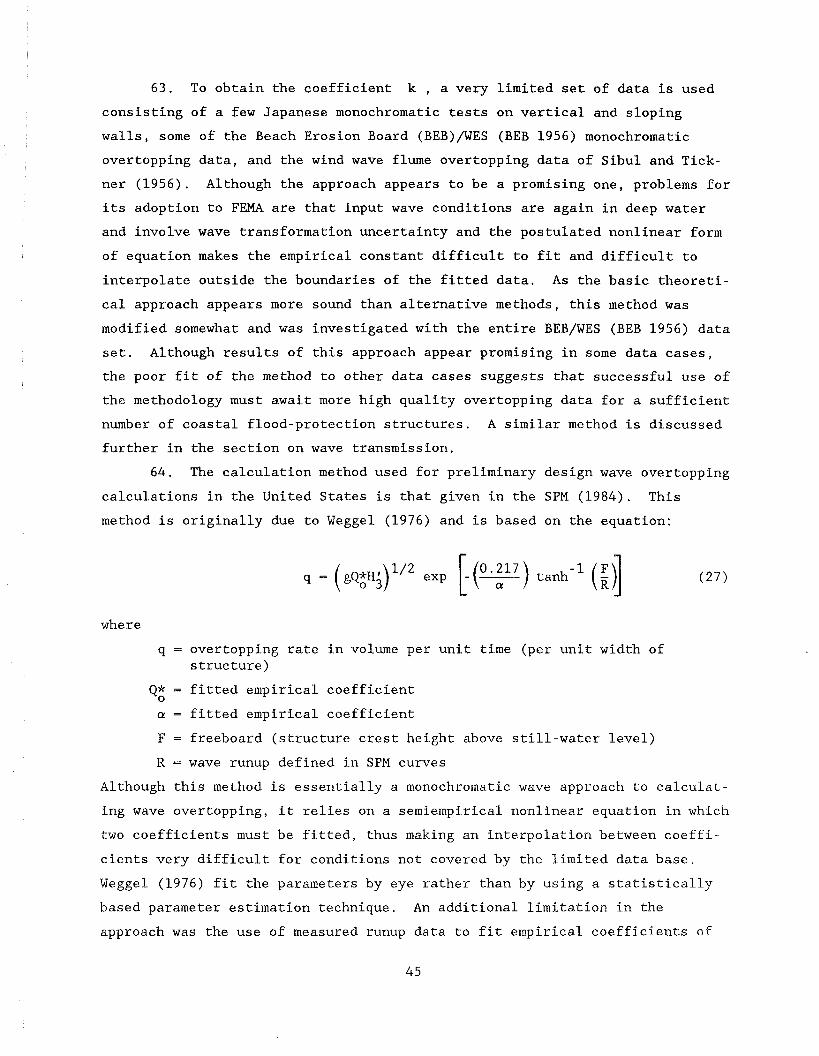
63. To obtain the coefficient k , a very limited set of data is used
consisting of a few Japanese monochromatic tests on vertical and sloping
walls, some of the Beach Erosion Board (BEB)/WES (BEB 1956) monochromatic
overtopping data, and the wind wave flume overtopping data of Sibul and Tick-
ner (1956). Although the approach appears to be a promising one, problems for
its adoption to FEMA are that input wave conditions are again in deep water
and involve wave transformation uncertainty and the postulated nonlinear form
of equation makes the empirical constant difficult to fit and difficult to
interpolate outside the boundaries of the fitted data. As the basic theoreti-
cal approach appears more sound than alternative methods, this method was
modified somewhat and was investigated with the entire BEB/WES (BEB 1956) data
set. Although results of this approach appear promising in some data cases,
the poor fit of the method to other data cases suggests that successful use of
the methodology must await more high quality overtopping data for a sufficient
number of coastal flood-protection structures. A similar method is discussed
further in the section on wave transmission.
64. The calculation method used for preliminary design wave overtopping
calculations in the United States is that given in the SPM (1984). This
method is originally due to Weggel (1976) and is based on the equation:
where
q = overtopping rate in volume per unit time (per unit width of structure)
Q* = fitted empirical coefficient 0
a = fitted empirical coefficient
F = freeboard (structure crest height above still-water level)
R = wave runup defined in SPM curves
Although this method is essentially a monochromatic wave approach to calculat-
ing wave overtopping, it relies on a semiempirical nonlinear equation in which
two coefficients must be fitted, thus making an interpolation between coeffi-
cients very difficult for conditions not covered by the limited data base.
Weggel (1976) fit the parameters by eye rather than by using a statistically
based parameter estimation technique. An additional limitation in the
approach was the use of measured runup data to fit empirical coefficients of

the equation; this limitation provides additional uncertainty in estimating
the overtopping, i.e., that of estimating the runup. This method also uses
deepwater wave input, therefore involving wave transformation uncertainty.
65. In view of the particular limitations in this approach, a test was
made to assess the ability of calculating q with original data sets. Fig-
ures 15 and 16 show measured q versus calculated q for BEB/WES (BEB 1956)
data (the data used to formulate the method) for two slopes. The calculations
were made by utilizing the SPM curves for runup without scale correction. As
seen in these figures, the method does not provide a highly accurate calcula-
tion of overtopping for the data used in its calibration. This problem is
most probably due to the use of an estimated runup from the SPM runup curves.
These problems make the Weggel/SPM method for calculation of overtopping
undesirable from a FEW standpoint where the methodology would have to be
extended to a variety of structure types for which there will be no data.
66. In an earlier US study, Cross and Sollitt (1971) used laboratory
data from an extensive data set on one structure slope to formulate a semiem-
pirical approach to predicting structure overtopping and consequent wave
transmission behind the structure. To evaluate the overtopping, the runup
profile is considered to be parabolic in form and the total runup to be as
provided by Saville's (1956) data. The overtopping amount is essentially that
portion of the wave profile above the structure crest assuming the runup is
the potential runup that would have occurred if the structure slope extended
to the runup limit. As the primary objective of the study was to evaluate
wave transmission, no information on ability of the method to predict wave
overtopping was provided. Further discussion on this method is provided in
the section on wave transmission.
67. Dutch methods for calculation of wave overtopping are limited to a
narrow range of tests with slopes typical of dikes built in The Netherlands.
Pappe (1960) presented a series of tests for the overtopping of dikes with
plane smooth slopes and a horizontal foreshore. These tests, which consisted
of slopes varying from 1 on 2 to 1 on 8, have been resummarized in TACPI
(1974) and provide a measure of irregular wave overtopping in dimensionless
form as follows :
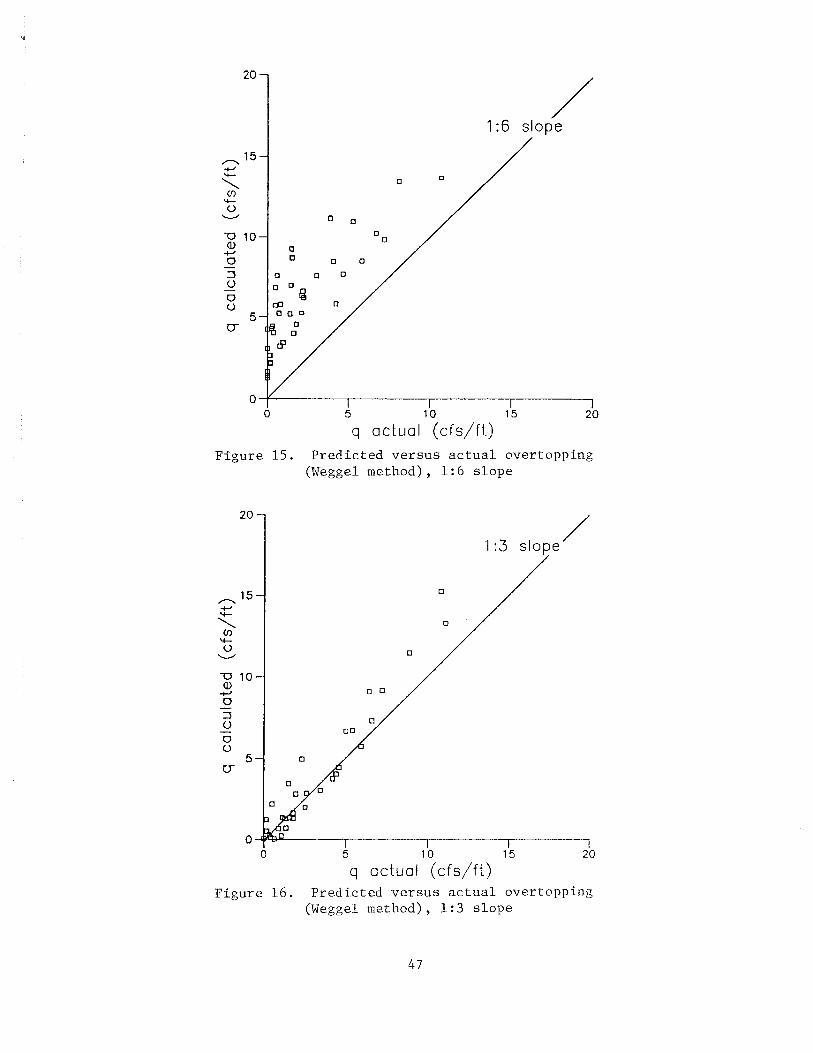
q actual (cfs/ f t )
F i g u r e 15. P r e d i c t e d v e r s u s a c t u a l over topp ing (Weggel method) , 1 :6 s l o p e
q actual (cfs/ f t ) F i g u r e 1 6 . P r e d i c t e d v e r s u s a c t u a l over topp ing
(Weggel method) , 1 : 3 s l o p e

where A
T = average period
H.3 = median wave height - A
L = wavelength calculated via linear theory using T
8 = slope of structure
Particular problems with this set of tests are that the tests were done in a
wind wave facility prior to more modern laboratory spectral wave generators
and no control was exerted on the wave spectra so produced. Again the
approach is of an irregular wave type and has the further complication that
the spectra generated may not resemble true wave spectra. The functional form
is of an exponentially decreasing type and thus does not show a cutoff (i.e.,
no clear crest height of structure at which zero overtopping occurs) desirable
for a FEMA methodology. Considerable scatter was also noted in the data simi-
lar to other irregular wave data overtopping. This may be a result of testing
of too short a sequence of waves (i.e., groupiness effects).
68. Battjes (1974b) proposed a semiempirical equation for calculation
of overtopping based on a limited set of monochromatic smooth linear slope
data taken at Delft and on the similar smooth slope BEB/WES (BEB 1956) data.
The equation proposed is of the form:
where
T = wave period
A = empirically fit constant (= 0.1)
Rh = tan0 (H/L,)-'/~ = wave runup based on Hunt's (1959) runup expression for breaking waves
69. The equation was fit to smooth linear slope monochromatic breaking
wave data with slopes ranging from 1 on 3 to I on 7, and an empirical coeffi-
cient A was recommended. This equation appears to be reasonable within the
limited slope range of data considered. Again its weak point is the limited
data set used to fit the empirical constant A . Battjes (1974b) proposes a
methodology for the calculation of irregular wave overtopping based on this
approach. The Battjes approach is somewhat similar to the earlier Japanese
method of Kikkawa, Shi-igai, and Kono (1968) and could be used in the
development of a FEMA methodology but has not been tested for steep slopes.
As the equation is less well founded in fundamental physics than that of
Kikkawa, Shi-igai, and Kono (1968), it was felt that a modification of the
Japanese equation held more promise for use in overtopping calculation.
Overto~ving Calculation Conclusions
70. None of the existing methods of calculating overtopping fulfill the
previously mentioned requirements of an ideal overtopping methodology for FEMA
adoption. The UK method (Owen (1980, 1982a)), the US method of Ahrens and
Heimbaugh (1986), the Dutch method of Pappe (1960), and the Japanese method of
Goda (1985) use irregular wave input. In addition to specific approach depen-
dent problems, the use of irregular waves is not consistent with FEMA adopted
criteria of depth-limited wave at the coastline, therefore these methods will
not be discussed further.
71. In the equation dependent regular wave methods discussed, the over-
topping calculation was dependent on empirically fit constant(s). In many of
the approaches, these constants were fit by eye to a nonlinear expression for
q rather than using a nonlinear least squares parameter fitting technique.
Very limited data exist for fitting the overtopping equations as can be noted
by the fact that all of the monochromatic wave overtopping equations use the
same set of data in their formulation (i.e., the BEB/WES (BEB 1956) data).
72. The actual design method of a coastal flood-protection structure in
all countries relies on either monochromatic or irregular wave tank testing
with wave transformation accomplished by physical modeling of site bottom
bathymetry. No designs use the crude overtopping prediction equations given
here, but rather site-specific testing is required for the given bottom
bathymetry and the particular structure configuration used. The reasons for
this are as follows: (a) overtopping is extremely sensitive to structure
geometry, water levels, and bottom topography; (b) nearshore transformation of
waves over complex topography and consequent breaking wave transformation is
not within the state of the art to solve either numerically or analytically;
and (c) no extensive set of overtopping data has ever been made for the nwner-
ous types of flood-protection structures that exist. As a result, the types
of calculations made for overtopping are only of a preliminary design nature.
73. Until such time as an extensive generic set of monochromatic over-
topping data becomes available, it is recommended that the FEMA criteria for
determining flooding behind a seawall/coastal flood structure be determined
based on runup. Runup is still a complex process and a first-step calculation
necessary in the prediction of overtopping. More data exist on runup than on
overtopping and as has been shown, although predictive equations for runup are
crude, they are inherently better and exist for a wider variety of cases than
those for overtopping. This is a logical conclusion as runup is a necessary
ingredient (explicit or implicit) in a good overtopping equation.
Recommendation
74. Present state of the art in wave overtopping prediction is not
sufficient to provide calculation of overtopping flows with any confidence
using existing theoretical or empirical equations except in a very few site-
specific structure and bathymetry cases. It is recommended that FEblA use a
runup criteria to determine whether or not flooding occurs behind a coastal
flood-protection structure (see Part 11), therefore negating the need to cal-
culate overtopping in the flooding determination process.

PART IV: WAVE TRANSMISSION OVER COASTAL STRUCTURES
75. During severe storms, water elevations are increased and coastal
flood-protection structures such as revetments and seawalls may be overtopped
by high waves. These waves will reform landward of the structures and,
depending on their height, have the potential of causing substantial damage to
upland structures including dwellings. In order for FEMA to determine the
effectiveness of various structures in providing upland damage reduction, it
is necessary to know the heights of the transmitted waves. The process of
wave regeneration behind the coastal flood-protection structure is complicated
because of effects of wave nonlinearities, reflection, energy dissipation,
wind, etc.
76. Limited research has been accomplished on this subject. As noted
in the preceding sections of this report, design of an actual coastal flood-
protective structure is accomplished through laboratory tank testing. The
reason for this situation is twofold: first, the problem is very complex;
and, secondly, research has not generated sufficient data to test or fit
potential generic theoretical solutions and/or semiempirical methods.
77. The ideal wave transmission prediction equation consistent with a
FEMA-adopted approach of a depth-limited breaking wave height criterion would
have the same properties as those discussed in the preceding sections on runup
and overtopping. Also, as in the overtopping case, none of the existing meth-
ods for the calculation of wave transmission by overtopping are sufficient in
and of themselves to address the desirable qualities of a generic predictive
overtopping method that can be applied uniformly to all scenarios.
7 8 . A very limited number of studies have been carried out in an
attempt to develop an improved understanding of wave generation by overtopping
of coastal structures. Most of these studies have been in the form of fitting
empirical curves and/or relationships to laboratory data for various types of
coastal structures. A difficulty in assessing the relative validity of vari-
ous methods is that no consistent objective "goodness of fit" has been pro-
posed and implemented. A brief review of a number of these studies is
presented here.
79. Cross and Sollitt (1971) have used the data set of Lamarre (1967)
consisting of numerous wave scenarios and one structure slope (1 on 1.5).
They developed a semianalytical approach to predicting transmitted wave
heights due to structure overtopping. The method considers, as a source of
energy for the generated waves, the potential energy of the runup that would
have occurred if the structure had been sufficiently high to prevent overtop-
ping. To evaluate the potential energy of the runup above the structure
crest, the runup profile is considered to be parabolic in form. The method
evaluates the conversion of this potential energy to that of the transmitted
wave. A total of five unknowns are involved with four equations. The neces-
sary fifth source of information is based on wave runup data by Saville
(1956). In addition, two empirical coefficients are required, one relating to
energy losses as the water descends on the downwave side of the structure and
the second, an intrinsic reflection coefficient.
80. The comparison presented by Cross and Sollitt appears reasonable
for the one structure slope investigated, although for low breakwaters, their
theory underestimated the transmission coefficient and for high breakwaters,
the transmission coefficient was overestimated. No quantification of the
agreement of their method with the data was presented.
81. Seelig (1980) conducted tests of wave transmission over and through
structures of various cross sections (17 in total) and permeabilities. Regu-
lar and irregular waves were included in the tests. An empirical procedure
was developed for estimating wave heights due to overtopping of permeable and
impermeable structures. For FEMA purposes, only the results of the imperme-
able structures are of concern.
82. The method first estimates the wave runup on smooth impermeable
slopes for no overtopping. The equation used involves three empirical coeffi-
cients which depend on structure slope. A different equation is employed for
rough slopes. Remaining equations involve the ratio of structure crest width
to structure total vertical height and the ratio of structure freeboard
(defined as crest height of structure above still-water level), F , to maxi-
mum potential runup at zero crest phase angle R (0 deg) . This ratio is
defined as the "relative freeboard." The transmission coefficient was found
to be related to the ratio of structure freeboard to wave height in a reason-
ably linear manner. One disadvantage of using the relative freeboard as the
only independent variable is that overtopping is a nonlinear process and the

transmission coefficient increases with increasing wave height. The recom-
mended expression for predicting the wave transmission coefficient, nT , by
overtopping in this method is
in which nT is the ratio of transmitted to incident wave heights (H,/Hi) and
C is a coefficient that depends on the ratio of structure crest width, B, ,
to total structure height, h, , as
Comparisons presented by Seelig appear favorable; however, in some cases it is
found necessary to use different C values for positive and negative
freeboards.
83. Goda (1969) carried out a reanalysis of existing overtopping data
for vertical walled coastal flood-protection structures and has developed the
following empirical equation for the transmission coefficient, where a and
p are empirical coefficients.
R(OO y;:) +a] , . - ..-- 1 - sin- --- l a - /3 2 a Hi
where
1 0.1 for high mound breakwaters
a = 2.0 and P = 0.3 for medium mound breakwaters
0.5 for low mound breakwaters
8 4 . Goda found that the amount of wave energy dissipated by a vertical
seawall was between 30 to 35 percent with the maximum occurring when the crest
was slightly submerged.
8 5 . Equation 3 was found to bracket the data for seawall structures
with the following pairs of a and P ,
(a = 2 . 2 1 lower limit of K~ \ P = 0.8)
a = 2 . 2 upper limit of KT , !?=o
The general fit of Goda's empirical relationship to the data is encouraging,
although these empirical constants cannot be extrapolated to any other type of
structure with any confidence.
86. Cox and Machemehl (1986) have proposed an analytical procedure for
calculating the wave height distribution with distance after the wave propa-
gates onto a horizontal bed that is initially dry. The method would be appli-
cable to a structure cross section, such as a gravel island, which does not
have standing water behind the structure.
87. It is assumed that the initial wave height at the top of the struc-
ture equals the excess maximum potential runup height [R(OO) - F] at the wave
crest, B = 0" , and that the effective water depth is 10 percent of the
local wave height. The energy losses are considered to be the result of bore
dissipation as originally proposed by Le M6haut6 (1963). The resulting wave
height distribution with distance, x , is given by
where T is the wave period and g is gravity.
88. One problem in Equation 33 is that the wave height does not
approach a stable limit but in fact, strictly interpreted, decreases to zero
and then increases with additional distance. Of course the intent is not to
use the eq.uation beyond the location of zero wave height. No example ealculla-
tions nor comparisons with data were provided. Because treatment by Cox and
Machemehl (1986) does not apply to the case of standing water behind the
structure nor does it consider a stabilized wave height, it was not deemed
appropriate for further consideration.
89. Due to the above noted limitations in the existing state-of-the-art
methodology, no recommendations can be provided at present for computing wave
transmission over coastal flood-protection structures. In Appendix B, an
alternative method for calculating wave overtopping and consequent wave trans-
mission via overtopping is provided and compared with existing limited labora-
tory data. At present, this methodology is preliminary and requires more
testing with a generic set of laboratory data prior to any final recommenda-
tions for its use. The approach in Appendix B may be useful as an interim
measure for the calculation of wave overtopping and wave transmission for FEMA
purposes in delineating the type of flood zone (V or A zone) behind a coastal
flood-protection structure.
Recommendation
90. Present state-of-the-art methodology for prediction of wave trans-
mission past coastal structures is inadequate to determine the wave height
landward of a coastal flood-protection structure with any level of confidence.
A preliminary methodology has been presented in Appendix B for calculation of
the wave transmission past a coastal flood-protection structure. The method
has been tested with a limited amount of data. Recommendation for general
usage of the methodology cannot be made without further testing, although the
methodology could be used as an interim measure to determine the wave height
in the lee of a coastal flood-protection structure. As an interim measure,
the methodology could be used along with present FEMA inland wave routing
models to determine the velocity zone behind a coastal flood-protection
structure.

PART V: WAVE FORCES ON COASTAL FLOOD-PROTECTION STRUCTURES
91. A major question of importance in any evaluation of coastal flood-
protection structures is the survivability of the structure through a major
storm event. This survivability is dependent on a number of factors, many of
which are covered in a later section of this report. The primary requirement
for survivability from an engineering point of view is the ability of the wall
to withstand the wave forces to which it is subjected. For this reason, an
evaluation of wave forces on sloping and vertical wall structures is
necessary.
92. The ideal methodology for calculation of wave forces on coastal
flood-protection structures from a FEMA standpoint would consist of the fol-
lowing points:
a. The methodology would be consistent with present F E W guide- - lines in evaluating waves and water levels; i.e., it should be consfstent with a depth-limited breaking wave height approach.
b. The methodology should be capable of providing a completely defined pressure distribution over the vertical such that shear and moment diagrams necessary for structural evaluation can be made.
c. The methodology should be supported by field and laboratory - data for all possible types of structure under all types of wave conditions and bathymetry.
9 3 . It will be shown in the following section that none of the methods
completely fulfills the above ideal requirements. In the United States, as in
other countries, the design of coastal flood-protection structures is done
after extensive laboratory testing of site-specific conditions. Wave force
calculation methods such as those provided in the following section would be
used only in preliminary design of a structure. No comprehensive set of wave
force measurements covering all types of structures, wave conditions, and
bathymetry exists. As such, any method chosen will be open to questions con-
cerning its accuracy. Where site-specific laboratory data exist for a given
coastal flood-protection structure, they should be considered and possibly
adopted in lieu of any F E W recommended approach.
94. The.study of wave forces on walls in quantitative terms goes back
into the 19th century (see Blackmore and Hewson (1984) for a brief discussion

of this early work). Green* divides the early work on this subject from the
recent with the publication of the results of Rundgren (1958) research. Rund-
gren provides a thorough review of the earlier work including both field mea-
surements and laboratory studies. Early field measurements of wave forces
were made using spring dynamometers. Because of the high inertia of these
devices, it was impossible to measure the high-impact but short-duration loads
(often referred to as shock loadings) caused by waves breaking directly on the
walls; as a consequence, many of the early studies did not record the high
pressures found in later studies.
95. Improvements in strain gages, pressure transducers, and electronics
in general have made it possible to measure wave pressures reliably both in
the laboratory and field. By using high frequency response transducers and
high sampling rates, it is now possible to accurately record the extremely
high impact pressures caused by breaking waves. Important advances are also
being made in numerical modeling of wave forces, and when these methods are
coupled with improved laboratory investigations and field studies, they can be
expected to produce techniques to estimate wave pressures and forces on walls
substantially better than obtained in early studies. Due to the stated limi-
tations of the early work, much of it is of limited value for realistic engi-
neering assessments.
Methods in Use
96. Recent literature on wave forces (since Rundgren (1958)) can be
logically categorized as follows:
a. Experiments using monochromatic waves. -
b. Field measurements of wave pressures.
c. Theoretical work on standing waves. -
d. Work on breaking wave pressures. - e. Work on the response of vertical-walled breakwaters to wave -
forces.
97. To provide perspective on wave force calculations, a schematic
approach to the subject based on present policy of the USACE is shown in Fig-
ure 17. The SPM (1984) divides wave forces into three classes based on
* T. Green, "Recent Work on Wave Forces on Vertical Walls," unpublished report, US Army Engineer Waterways Experiment Station, Vicksburg, MS.
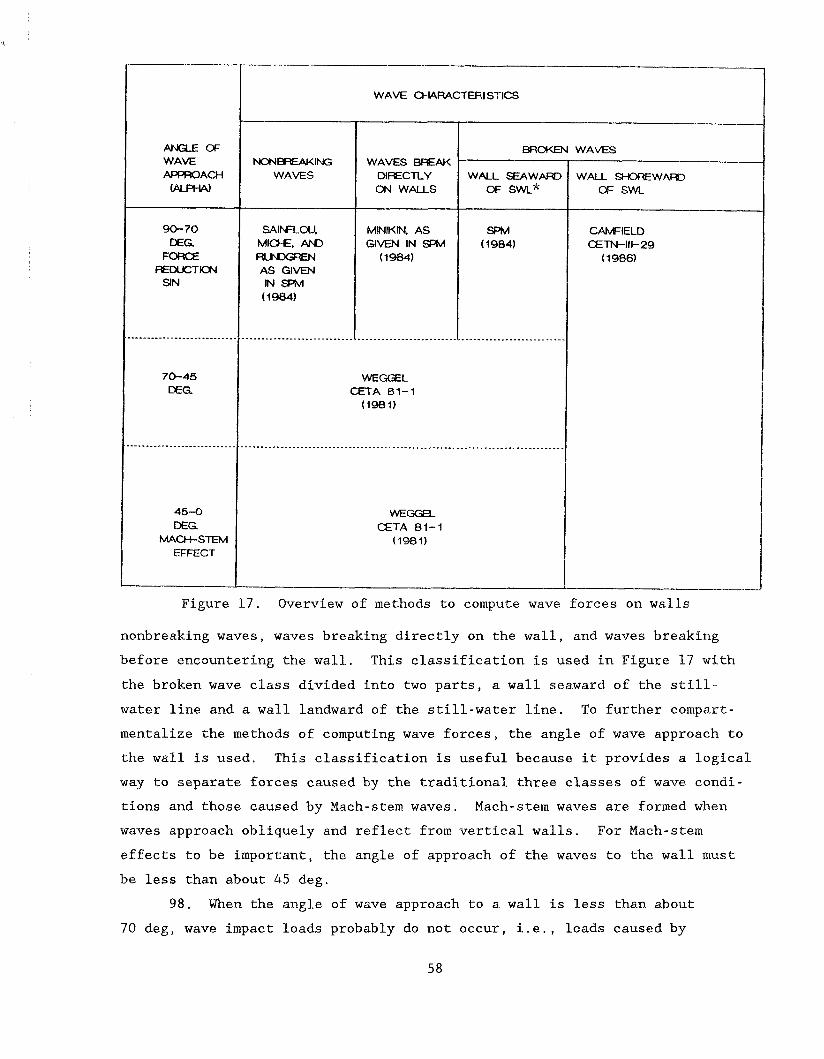
WAVE CHARACTERISTICS
ANGLE OF NONBRW(Iffi WAVES WEAK
GTN-Ill-29
WEGGEL CETA €31-'I
WE- E T A 81-1
MACH-sm
Figure 17. Overview of methods to compute wave forces on walls
nonbreaking waves, waves breaking directly on the wall, and waves breaking
before encountering the wall. This classification is used in Figure 17 with
the broken wave class divided into two parts, a wall seaward of the still-
water line and a wall landward of the still-water line. To further compart-
mentalize the methods of computing wave forces, the angle of wave approach to
the wall is used. This classification is useful because it provides a logical
way to separate forces caused by the traditional three classes of wave condi-
tions and those caused by Mach-stem waves. Mach-stem waves are formed when
waves approach obliquely and reflect from vertical walls. For Mach-stem
effects to be important, the angle of approach of the waves to the wall must
be less than about 45 deg.
98. When the angle of wave approach to a wall is less than about
70 deg, wave impact loads probably do not occur, i.e., loads caused by
extremely high but short-duration pressures occurring when a wave breaks
directly against a wall.
99. The problem of the angle of approach to a vertical wall is gener-
ally not relevant to the design of seawalls on the open coast since seawalls
typically run parallel to shore. Wave refraction usually causes the angle of
approach to a seawall to be about 90 deg. Since the SPM-recommended correc-
tion for wave forces is sin2a where a is the angle of approach, small dif-
ferences from an angle of approach of 90 deg are inconsequential. It should
be recognized that the SPM correction factor for wave angle of approach is
based on an engineering approximation and has not been verified by either
field or laboratory studies. Review of the wave force literature indicates
that it is not within the current state-of-the-art ability to accurately pre-
dict wave forces on walls other than assuming perpendicular approach. It is
recommended that FEMA consider only structure perpendicular (90 deg) wave
force loading in its evaluation of coastal flood-protection structures.
100. The primary emphasis in wave force research has been on laboratory
studies with waves breaking directly on vertical walls or caisson-type break-
waters. Much of this work has been conducted in Japan, the European coun-
tries, and the United States.
101. A substantial portion of recent research has been conducted in
Japan. Such research is very valuable but must be interpreted carefully.
Much of the Japanese effort is directed toward the design of large caisson-
type breakwaters often sited in deep or intermediate water depth on rubble
foundations. This situation is in contrast to the typical coastal flood-
protection structure such as a bulkhead/seawall or revetment located near the
shoreline with relatively shallow water offshore. Because of large mass, a
typical caisson is generally not vulnerable to failure under the very high but
short-duration pressures caused by waves breaking directly on the wall. For a
typical "American coast," nonengineer-designed, low-mass bulkhead/seawall that
has lost its backfill, these short-duration loads create the possibility of
failure of the wall by shear or inward bending moment (Walton and Sensabaugh
1979). Fatigue and corrosion also contribute to the vulnerability of thin,
low-mass sheet-pile walls to these short-duration wave forces. Figure 18
shows pressure records from laboratory tests of wave impact loads on a seawall
(Grace and Carver 1985). In Figure 18 the peak temporal pressures (often
referred to as "shock" pressures) are caused by the wave breaking directly on

PEAK SHOCK PRESSURE
ECONDARY PRESSURE
TYPICAL PRESSURE RECORD FOR TRANSDUCERS LOCATED IN THE SEAWALL
Figure 18. Typical pressure-time record for waves breaking on the structure (Grace and Carver 1985)
the seawall while the secondary or surge pressures are a longer duration
dynamic pressure normally associated with hydrodynamic momentum transfer. It
appears that most formulae to predict maximum pressures are predicting seeond-
ary pressures rather than "shock" pressures; this tendency is particularly
true of the Japanese literature. In fact it is difficult to base a design
criterion strictly on "shock" loads because their short duration make them
hard to measure, resulting in much scatter in the data and controversy in the
literature about their actual magnitude. In addition, it is found that waves
breaking directly on a vertical wall is a relatively rare event in the field.
Blackmore and Hewson (1984) found that approximately 1 in 2,500 waves imping-
ing on the walls that they monitored actually produced "shock" loads. This
discussion suggests that a method of computing wave forces based on a conser-
vative interpretation of secondary nonshock pressures might be a logical
approach for coastal flood-protection structures with substantial mass. For
nonengineered structures with little mass (i.e., sheet-pile seawalls), the
primary "shock" load should be considered.
102. A considerable amount of research on wave forces on walls has been
conducted at Osaka City University, Japan, by Nagai and colleagues. This work
has been primarily directed at the design of vertical-walled caissons placed
in intermediate depths of water and includes extensive laboratory and field
studies. Two good summaries of Nagai's findings are given in Nagai (1973) and
Nagai (1976). Generally Nagai's work is not directly applicable to the design
of many coastal flood-protection structures because of the extensive rubble
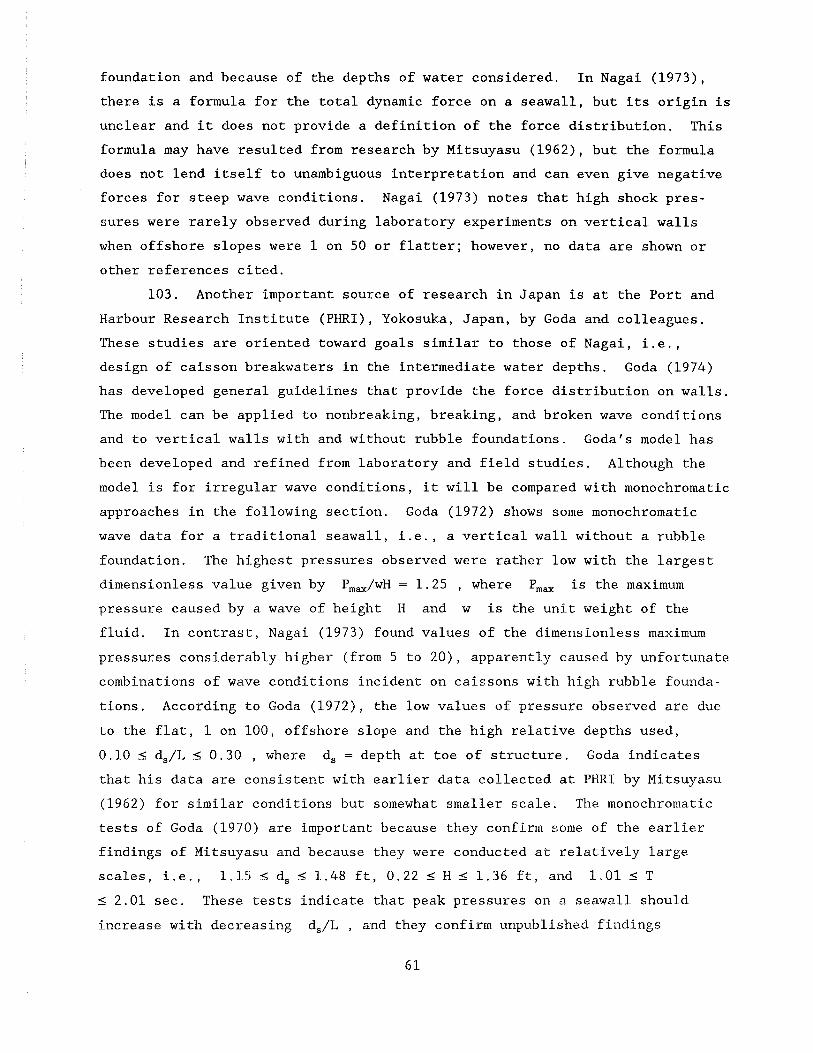
foundation and because of the depths of water considered. In Nagai (1973),
there is a formula for the total dynamic force on a seawall, but its origin is
unclear and it does not provide a definition of the force distribution. This
formula may have resulted from research by Mitsuyasu (1962), but the formula
does not lend itself to unambiguous interpretation and can even give negative
forces for steep wave conditions. Nagai (1973) notes that high shock pres-
sures were rarely observed during laboratory experiments on vertical walls
when offshore slopes were 1 on 50 or flatter; however, no data are shown or
other references cited.
103. Another important source of research in Japan is at the Port and
Harbour Research Institute (PHRI), Yokosuka, Japan, by Goda and colleagues.
These studies are oriented toward goals similar to those of Nagai, i.e.,
design of caisson breakwaters in the intermediate water depths. Goda (1974)
has developed general guidelines that provide the force distribution on walls.
The model can be applied to nonbreaking, breaking, and broken wave conditions
and to vertical walls with and without rubble foundations. Goda's model has
been developed and refined from laboratory and field studies. Although the
model is for irregular wave conditions, it will be compared with monochromatic
approaches in the following section. Goda (1972) shows some monochromatic
wave data for a traditional seawall, i.e., a vertical wall without a rubble
foundation. The highest pressures observed were rather low with the largest
dimensionless value given by P,,,/wH = 1.25 , where P,,, is the maximum
pressure caused by a wave of height H and w is the unit weight of the
fluid. In contrast, Nagai (1973) found values of the dimensionless maximum
pressures considerably higher (from 5 to 20), apparently caused by unfortunate
combinations of wave conditions incident on caissons with high rubble founda-
tions. According to Goda (1972), the low values of pressure observed are due
to the flat, 1 on 100, offshore slope and the high relative depths used,
0.10 5 d,/L 5 0.30 , where d, = depth at toe of structure. Goda indicates
that his data are consistent with earlier data collected at PHRI by Mitsuyasu
(1962) for similar conditions but somewhat smaller scale. The monochromatic
tests of Goda (1970) are important because they confirm some of the earlier
findings of Mitsuyasu and because they were conducted at relatively large
scales, i.e., 1.15 < d, < 1.48 ft, 0.22 5 H 5 1.36 ft, and 1.01 5 T
5 2.01 sec. These tests indicate that peak pressures on a seawall should
increase with decreasing d,/L , and they confirm unpublished findings

mentioned by Nagai (1973) that peak impact pressures are low when the offshore
slope is flat. Best references for this research at PHRI are Goda (1974,
1985),
104. Other research centers for wave forces on walls are located in
Tokyo at Tokyo University and at Nihon University. Studies at these universi-
ties are directly related to the design of seawalls and not caissons on rubble
foundations. Horn-ma and Horikawa (1964, 1965) developed a method (hereafter
referred to as the H and H method) for the pressure distribution and total
force on a seawall. The method accounts for both vertical and inclined walls.
Their model was calibrated with laboratory tests. These tests included both
pressure transducers to obtain the pressure distribution on the wall and
strain gage measurements to obtain the total force. They compared their model
with data collected by Mitsuyasu (1962) and generally found good but not nec-
essarily conservative agreement for breaking wave conditions. Their method
gives surprisingly good estimates of wave pressures on inclined walls when
compared with their laboratory data. This finding is surprising because the
pressure reduction of the H and H method for an inclined wall is quite sub-
stantial, but clearly a wave breaking directly on an inclined slope can cause
very high pressures if there is little overlying water to cushion the impact,
as has been measured by Fuhrboter (1986). Without further research, it is
impossible to reconcile some of the differences in findings between the stud-
ies of Hom-ma and Horikawa and Fuhrboter. Further laboratory tests of th.e
total force on a vertical wall at Nihon University by Takezawa (1979) provides
additional support for the H and H method. Interestingly, Takezawa found that
the Hom-ma/Horikawa model provided relatively conservative results even for
waves breaking directly on the wall. Takezawa developed his own model for the
total force on a wall apparently to provide a somewhat less conservative enve-
lope for forces caused by nonbreaking wave conditions than would be obtained
using the H and H method. Takezawa's work is important because it gives inde-
pendent support for the H and H method based on extensive laboratory tests at
a larger scale. Wave heights used in Takezawa's tests went up to 0.72 ft, and
water depths at the toe of the wall were as great as 0.97 ft. Unfortunately,
there are little contemporary field data to support the H and H method as
noted in Hom-ma and Horikawa (1965).
105. In a discussion of some of the early research conducted in Japan
on wave forces, Goda (1985) mentions the work of Hiroi, who made field
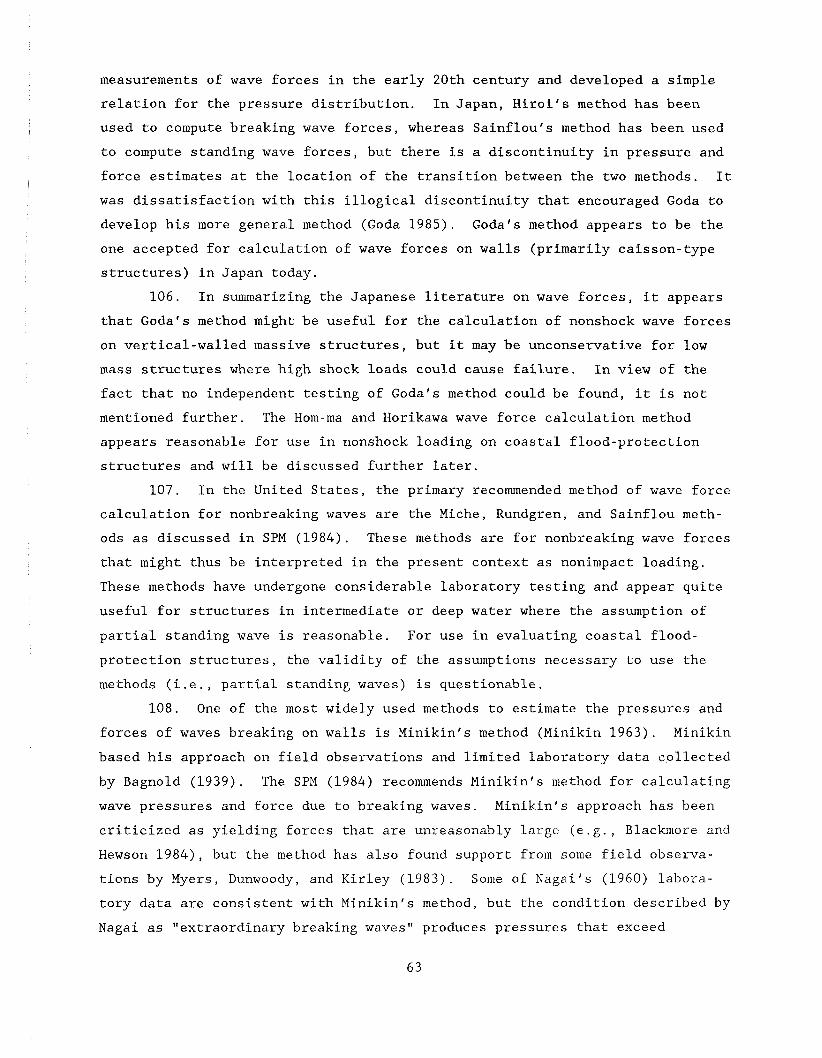
measurements of wave forces in the early 20th century and developed a simple
relation for the pressure distribution. In Japan, Hiroi's method has been
used to compute breaking wave forces, whereas Sainflou's method has been used
to compute standing wave forces, but there is a discontinuity in pressure and
force estimates at the location of the transition between the two methods. It
was dissatisfaction with this illogical discontinuity that encouraged Goda to
develop his more general method (Goda 1985). Goda's method appears to be the
one accepted for calculation of wave forces on walls (primarily caisson-type
structures) in Japan today.
106. In summarizing the Japanese literature on wave forces, it appears
that Goda's method might be useful for the calculation of nonshock wave forces
on vertical-walled massive structures, but it may be unconservative for low
mass structures where high shock loads could cause failure. In view of the
fact that no independent testing of Goda's method could be found, it is not
mentioned further. The Hom-ma and Horikawa wave force calculation method
appears reasonable for use in nonshock loading on coastal flood-protection
structures and will be discussed further later.
107. In the United States, the primary recommended method of wave force
calculation for nonbreaking waves are the Miche, Rundgren, and Sainflou meth-
ods as discussed in SPM (1984). These methods are for nonbreaking wave forces
that might thus be interpreted in the present context as nonimpact loading.
These methods have undergone considerable laboratory testing and appear quite
useful for structures in intermediate or deep water where the assumption of
partial standing wave is reasonable. For use in evaluating coastal flood-
protection structures, the validity of the assumptions necessary to use the
methods (i . e . , partial standing waves) is questionable. 108. One of the most widely used methods to estimate the pressures and
forces of waves breaking on walls is Minikin's method (Minikin 1963). Minikin
based his approach on field observations and limited laboratory data cpllected
by Bagnold (1939). The SPM (1984) recommends Minikin's method for calculating
wave pressures and force due to breaking waves. Minikin's approach has been
criticized as yielding forces that are unreasonably large (e.g., Blackmore and
Hewson 1984), but the method has also found support from some field observa-
tions by Myers, Dunwoody, and Kirley (1983). Some of Nagai's (1960) labora-
tory data are consistent with Minikin's method, but the condition described by
Nagai as "extraordinary breaking waves" produces pressures that exceed

prediction by Minikin. No clear definition of extraordinary breaking waves is
given by Nagai. Kirgoz (1982) also provides laboratory data which exceeds the
pressures predicted by Minikin, but these data could be influenced by scale
effects, as noted below. An unusual aspect of Minikin's method is that pres-
sures and forces decrease with increasing wave period. This trend is at vari-
ance with intuition and most other methods. This rather anomalous trend may
explain some of the controversy related to Minikin's method. Blackmore and
Hewson's pressure observations were for short period waves where Minikin's
formula might be expected to give excessively high values.
109. The study of Blackmore and Hewson (1984) is based on field data
and a thorough review of data collected in the laboratory and field by other
investigators. Nine pressure transducers mounted in a seawall at Ilfracombe,
on Bristol Channel, England, permits evaluation of the pressure distribution
as well as peak pressures for one specific site and type of structure. Other
instrumented seawalls were mentioned as part of the study, but most of the
data discussed come from the one site at Ilfracombe. Blackmore and Hewson's
data summary indicates that with few exceptions the wave conditions had peri-
ods less than 4.7 sec. This means that their wave force model is not cali-
brated for longer period swell waves. They make some interesting comments
regarding scale effects, in that laboratory tests should produce conservative
results on peak pressure measurements. The reason is that surface tension is
more important at small scale, and this causes less air entrained in the labo-
ratory tests when compared with field conditions. With less air entrained in
the laboratory, the scaled peak pressures are higher. These conclusions are
strongly supported by laboratory work by Fuhrboter (1986) which included tests
conducted in both large and small wave tanks. Between the two facilities, the
range of wave heights Fuhrboter investigated was from 0.28 to 6.89 ft.
Although some of the conclusions reached by Fuhrboter relating to scale
effects seem weak, his findings regarding peak pressures provide very strong
support to Blackmore and Hewson's interpretation that small-scale tests pro-
duce greater peak impact pressure than would be expected at prototype. This
finding is also consistent with the interpretation of field measurements of
wave impact pressures made by Miller et al. (1974). Miller examined results
from his own field work and the field work of other investigators and found
that it consistently produced lower wave impact pressures than would be
expected based on laboratory tests.
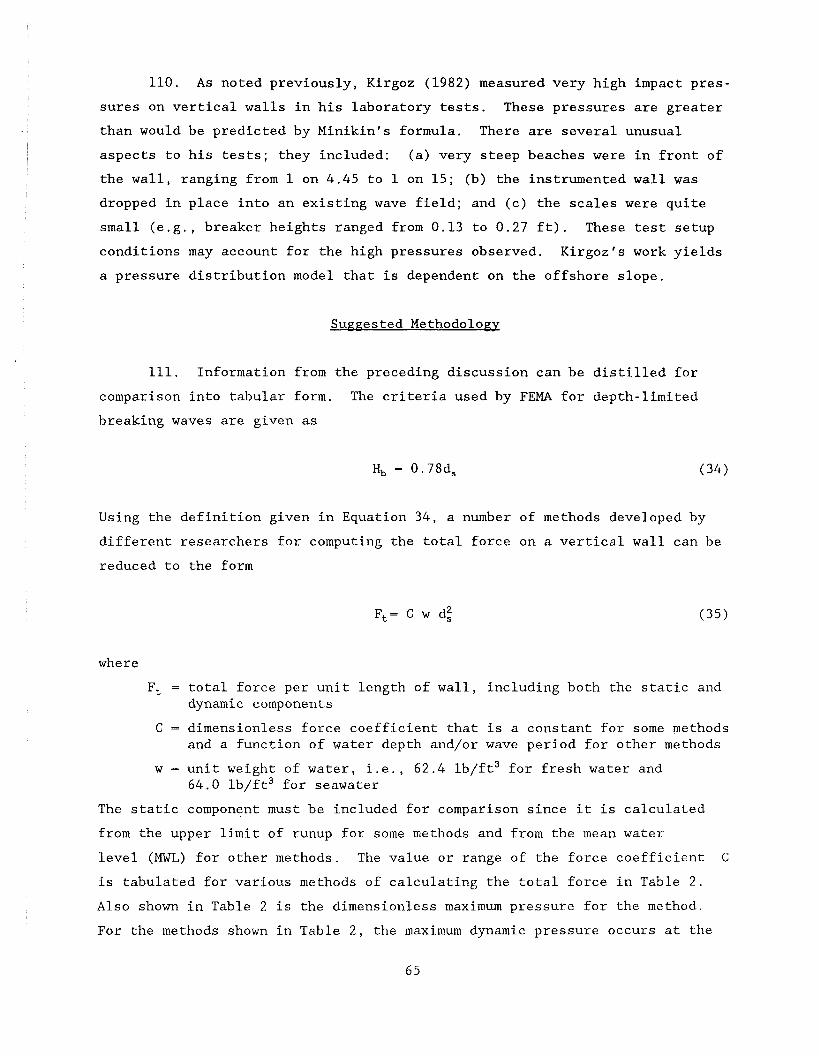
110. As noted previously, Kirgoz (1982) measured very high impact pres-
sures on vertical walls in his laboratory tests. These pressures are greater
than would be predicted by Minikin's formula. There are several unusual
aspects to his tests; they included: (a) very steep beaches were in front of
the wall, ranging from 1 on 4.45 to 1 on 15; (b) the instrumented wall was
dropped in place into an existing wave field; and (c) the scales were quite
small (e.g., breaker heights ranged from 0.13 to 0.27 ft). These test setup
conditions may account for the high pressures observed. Kirgoz's work yields
a pressure distribution model that is dependent on the offshore slope.
Suggested Methodology
111. Information from the preceding discussion can be distilled for
comparison into tabular form. The criteria used by FEMA for depth-limited
breaking waves are given as
Using the definition given in Equation 34, a number of methods developed by
different researchers for computing the total force on a vertical wall can be
reduced to the form
where
F, = total force per unit length of wall, including both the static and dynamic components
C = dimensionless force coefficient that is a constant for some methods and a function of water depth and/or wave period for other methods
w = unit weight of water, i.e., 62.4 lb/ft3 for fresh water and 64.0 lb/ft3 for seawater
The static component must be included for comparison since it is calculated
from the upper limit of runup for some methods and from the mean water
level (MWL) for other methods. The value or range of the force coefficient C
is tabulated for various methods of calculating the total force in Table 2.
Also shown in Table 2 is the dimensionless maximum pressure for the method
For the methods shown in Table 2, the maximum dynamic pressure occurs at the
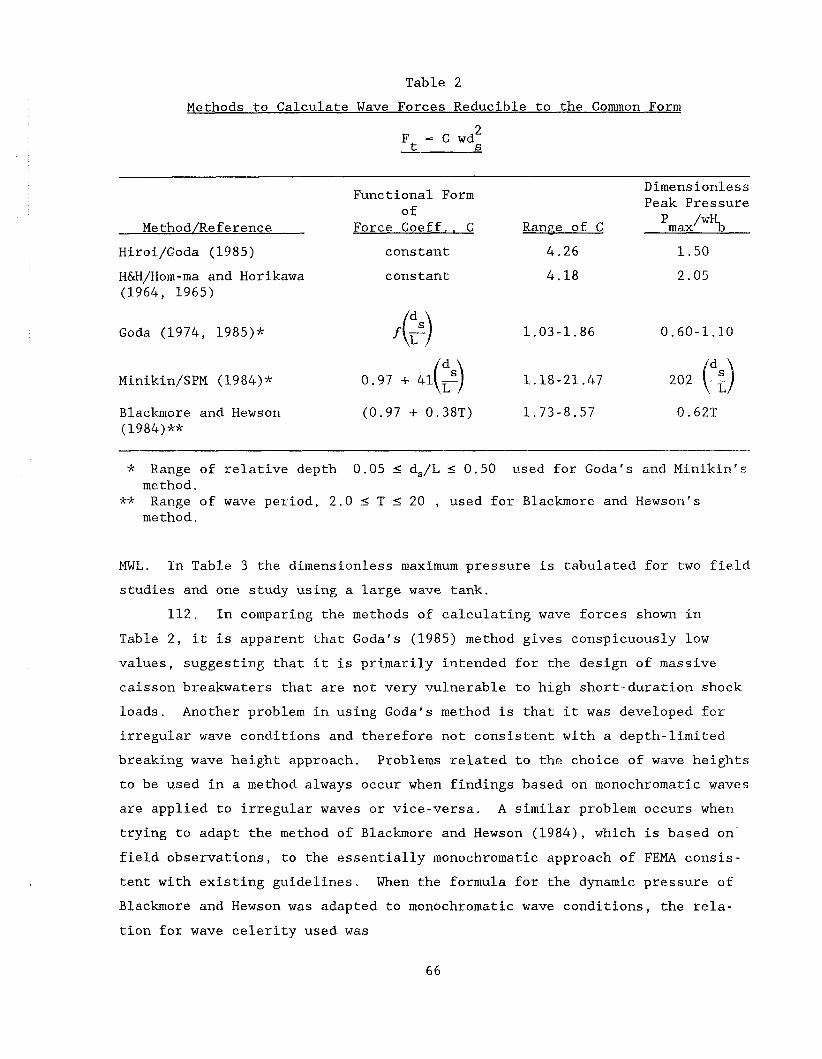
Table 2
Methods to Calculate Wave Forces Reducible to the Common Form
Functional Form , C
Dimensionless Peak Pressure
U I
Method/Reference Force Coeff., C Range of C Pmax/wHb
Hiroi/Goda (1985) constant 4.26 1.50
H&H/Hom-ma and Horikawa constant 4.18 2.05 (1964, 1965)
Goda (1974, 1985)* 1.03-1.86 0.60-1.10
Blackmore and Hewson (0.97 + 0.38T) 1.73-8.57 0.62T (1984)**
* Range of relative depth 0.05 I d,/L I 0.50 used for Goda's and Minikin's method.
** Range of wave period, 2.0 I T I 20 , used for Blackmore and Hewson's method .
MWL. In Table 3 the dimensionless maximum pressure is tabulated for two field
studies and one study using a large wave tank.
112. In comparing the methods of calculating wave forces shown in
Table 2, it is apparent that Goda's (1985) method gives conspicuously low
values, suggesting that it is primarily intended for the design of massive
caisson breakwaters that are not very vulnerable to high short-duration shock
loads. Another problem in using Goda's method is that it was developed for
irregular wave conditions and therefore not consistent with a depth-limited
breaking wave height approach. Problems related to the choice of wave heights
to be used in a method always occur when findings based on monochromatic waves
are applied to irregular waves or vice-versa. A similar problem occurs when
trying to adapt the method of Blackmore and Hewson (1984), which is based on'
field observations, to the essentially monochromatic approach of FEMA consis-
tent with existing guidelines. When the formula for th.e dynamic pressure of
Blackmore and Hewson was adapted to monochromatic wave conditions, the rela-
tion for wave celerity used was
C, = )/gd,(l + 0.7Hb)
or considering Equation 34
where Cb is the celerity of the breaking wave. Using wave periods in the
range of 4 to 5 sec (within the range of Blackmore and Hewson's data) for the
peak pressure relation in Table 2 gives pressures greater than observed in
their study as shown in Table 2 of their report.
Table 3
P max
Values of - from Recent Field Studies and Large-Scale Laboratory Tests w H
Source Tv~ical Value Range
Blackmore and Hewson (1984), Table 2 1.24 0.87-2.26
Miller et al. (1974), Figure 5 2.70 1.46-8.10
Fuhrboter (1986), Table 3 2.2 1.8-2.6
113. Table 2 also shows a rather surprising aspect of Minikin's method
of calculating wave forces. Minikin's methods predict decreasing wave forces
with increasing wavelength. Since breaking wave forces might be expected to
be proportional to wave celerity squared, it is difficult to envision a force
equation with an inverse relation to wavelength. In some ways, Goda's (1974,
1985) model for wave forces appears more intuitively correct, and his model
shows a gradually increasing force with increasing wavelength as would be
expected. Minikin's method gives extremely high forces for short period
waves, T = 3 to 5 sec , as noted by Blackmore and Hewson (1984) but may give
more realistic values for longer period waves.
114. The remaining two methods, Hiroi's and Hom-ma and Horikawa's,
shown in Table 2 give rather similar wave forces. Because of differences in
the pressure distributions used by the two methods, Hiroi gives slightly
higher total force, and Hom-ma and Horikawa give higher maximum pressures.
When the pressures of Table 2 are compared with field and large-scale data in
Table 3, the Hom-ma and Horikawa method shows values within the range of all
three data sets. Although the agreement may be fortuitous, it indicates that
the Hom-ma and Horikawa method provides realistic estimates of prototype wave
loads. Because of the basic simplicity of the method, the independent confir-
mation of the method by the laboratory work of Takezawa (1979), and the agree-
ment with prototype scale measurements, the Hom-ma and Horikawa method is
recommended for use to compute wave pressures, forces, and moments on walls by
FEMA .
The Hom-ma and Horikawa Method
115. A definition sketch for the pressure distribution of the method of
Hom-ma and Horikawa (1964, 1965) is shown in Figure 19. The upper limit for
both the static and dynamic pressure is 1.2 d, above the MWL. Dynamic pres-
sure increases linearly from zero at the upper limit to the maximum value at
the MWL of
P,,,(dynamic) = 1.6 wd, (38)
Dynamic pressure then decreases linearly from the maximum value to zero at the
toe of the wall. This pressure distribution produces a total force on the
wall, i.e., static plus dynamic, of
This acts just below the MWL at z = -0.126 d, , where z is the vertical
axis and the minus sign indicates below the MWL.
116. Hom-ma and Horikawa (1964) suggest a reduction in the pressure
against the wall for plane, inclined walls of sin20 , where 6 is the angle
of inclination with the horizontal. This reduction is supported by their
laboratory data. The general pressure distribution relation for plane walls
is
p, = 0 , at z = 1.2 d,
p,,, = 2.8 wd, sin2fl, at z = 0
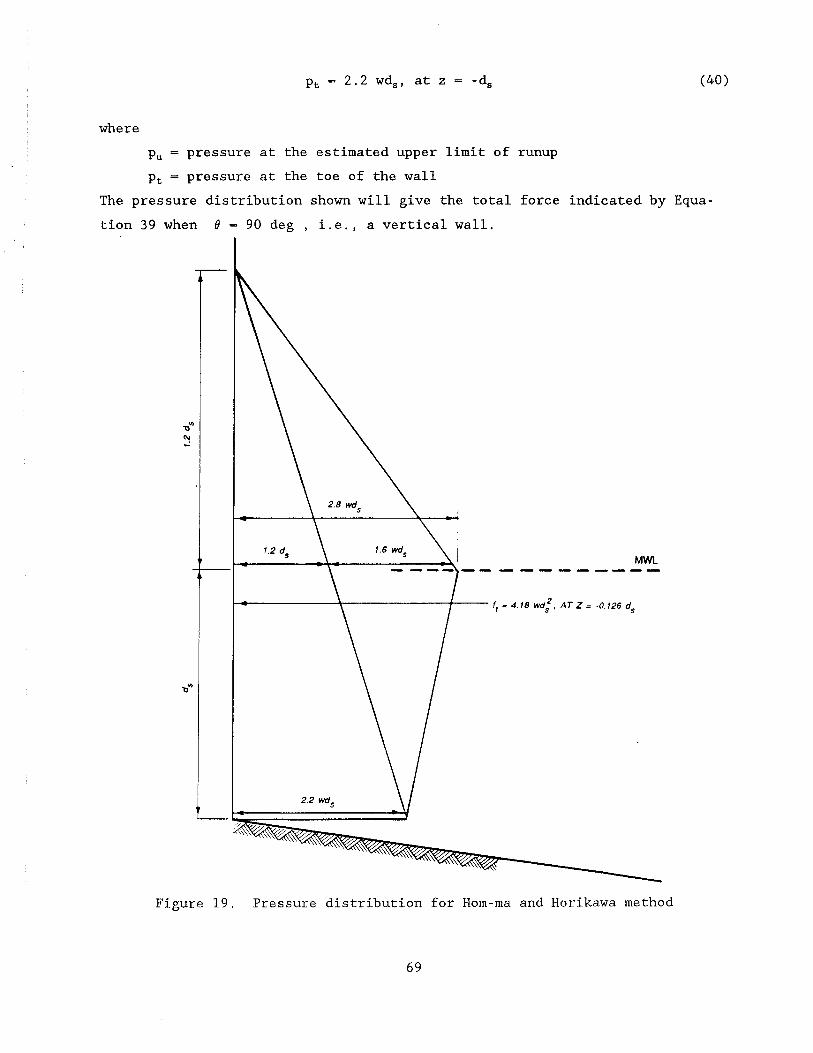
p, = 2.2 wd,, at z - -d, where
p, = pressure at the estimated upper limit of runup
p, = pressure at the toe of the wall
The pressure distribution shown will give the total force indicated by Equa-
tion 39 when 0 = 90 deg , i.e., a vertical wall.
Figure 1 9 . Pressure distribution for Hom-ma and Horikawa method

117. Due to the wide scatter seen in laboratory wave force measurements
for the seemingly identical wave-structure-bathymetry conditions, it mav be appropriate to adjust the coefficients upward for the higher shock pressures
and forces. Although Hom-ma and Horikawa do not provide information for such
an adjustment, results from another study could be used to infer these coeffi-
cients. Fuhrboter (1986) shows that impact pressures have a log-normal dis-
tribution. Fuhrboter's findings suggest that if the maximum pressure in the
vertical plane given by Equation 38 is regarded as the median value of many
impact loads, then the coefficient in the equation can be regarded as a proba-
bilistic function as shown in Table 3. Data plots by Hom-ma and Horikawa
(1964) indicate that it is reasonable to regard the value of the coefficient
as approximately a median value. Table 3 could be used to increase the maxi-
mum dynamic pressure given by Equation 38 if the structure is of low mass and
might fail by short-duration wave force. The total maximum pressure can be
written
dynamic static component component
where the dimensionless coefficient Cp can be chosen from Table 3 based on
the degree of conservatism required for a specific type of structure.
118. There are ambiguities in comparing the findings of Hom-ma and
Horikawa (1964, 1965) and Fuhrboter (1986). The method used to apply
Fuhrboter's findings in Table 3 should provide a reasonable guess as to maxi-
mum pressure. However, the H and H method gives maximum pressures that
decrease as the angle of inclination decreases, which is opposite to the find-
ings of Fuhrboter. It is difficult to reconcile these differences between the
results of two important studies. Further research is required to supply
answers to problems such as noted above to achieve a higher level of confi-
dence for methods of calculating wave pressures and forces.*
* At the time of writing this report an important paper entitled "Dynamic Forces Due to Waves Breaking at Vertical Coastal Structures" by H. W. Partenscky was not available. This paper provides information on large scale laboratory measurements of breaking wave forces on vertical walls.

Table 3
Value of Coefficient for Eauation 37 as a Function of
Probability of Exceedance Based on Fuhrboter (1986)
Coefficient C P
Probability of Exceedance
Recommendation
119. Numerous empirical wave force prediction equations exist for cal-
culating the hydrodynamic force exerted on a coastal flood-protection struc-
ture. The limitations of these equations are not known; therefore, none of
the equations can be used with any level of confidence outside the limited
conditions for which they were formulated. The best equation for FEMA pur-
poses is the wave force equation of Hom-ma and Horikawa (1964, 1965), which
can be used for all structure slopes in a manner consistent with the FEMA
depth-limited breaking wave criteria. It should be recognized that forces
calculated via the Hom-ma and Horikawa method may be low compared with many
measured shock forces, but reasonable guidance on determination of such shock
forces is still not within state-of-the-art coastal engineering predictive
ability.
PART VI: COASTAL FLOOD-PROTECTION STRUCTURE INTEGRITY
Description and Classification of Coastal Flood-Protection Structures
120. Seawalls, dikes, bulkheads, revetments, and other types of coastal
flood-protection structures can be grouped or classified in several ways.
Three of the most commonly used groupings are functional intent, design or
construction method, and construction material(s). Although the classifica-
tion into which a particular structure might be placed using these systems is
somewhat arbitrary and overlapping, it is useful to discuss the groupings to
provide insight into considerations that should be a part of proper engineer-
ing design and/or the technical evaluation of such structures. Further
details on specific key factors in the design, construction, and evaluation of
shore protection structures will be provided in a subsequent section.
121. Functional intent is probably the primary means used to distin-
guish various types of coastal structures. Two functional objectives typi-
cally cited are retaining upland soil and intercepting wave action. Since
many coastal structures perform both of these functions (and others) to some
degree, definitions tend to focus on a "principal" function.
122. As an example, both seawalls and bulkheads retain upland property
and intercept wave forces. However, sources generally distinguish the two
structures on the basis that seawalls are intended principally to intercept
wave action. Further, such wave action is recognized in the design process to
be severe, and the resulting hydrodynamic forces are meant to be resisted
largely within the seawall structure itself. Intercepting wave action is a
secondary objective in the design of bulkheads, and the design wave conditions
considered are less extreme, Bulkheads are often constructed without consid-
ering wave force loadings. In such cases their success depends on transfer-
ring dynamic loadings to the soil behind the bulkhead.
123. In contrast, dikes, revetments, and breakwaters are intended prin-
cipally to intercept wave action, even severe wave action. Bikes, revetments,
and breakwaters are distinguished from seawalls and bulkheads, however, by the
fact that they do not function directly to retain upland soil. In the case of
revetments, the upland soil mass provides support for the structure and serves
to resist wave forces transmitted through the flexible armor layers.

Revetments alone are not meant to prevent flooding. They are used in combina-
tion with or as a functional part of a flood-protection structure such as a
dike. Dikes may or may not be in contact with the upland soil. Breakwaters
are typically not in contact with the upland soil that they protect. They
function by dissipating energy at some distance offshore.
124. One of the difficulties with functional classification is that two
structures which appear physically similar could be classified differently
depending on design intent. This is especially a problem when evaluating
existing construction for which the original design intent may be uncertain.
125. There is no general agreement on the severity of design wave
action that requires a seawall design as opposed to a bulkhead design. The
Naval Facilities Engineering Command (NAVFAC) (1981a) suggests that seawalls
should be selected where the site is exposed to (significant) wave heights
greater than 3 to 4 it. Other references (e.g., SPM (1984), USACE 1985) avoid
stating a precise wave height and simply suggest that bulkheads (and revet-
ments) are not appropriate for "severe" or "high" wave conditions. Perhaps
the most succinct statement of both the definitional problem and at least one
pragmatic solution is found in USACE (1985): "The use [of bulkhead materials]
is limited to those areas where wave action can be resisted by such
materials."
126. Flood-protection structures are frequently described by modifiers
that convey details about the engineering design and/or construction approach
used. Examples are pile-supported seawall, counterfort gravity seawall, or
free-earth support anchored bulkhead. The proper use, recording, and under-
standing of such descriptors is much more than an exercise in semantics; these
grouping terms can contain valuable information about the design intent of a
structure, the forces and/or problems that the designer felt were important at
the site, and likely types of potential damage or modes of failure in the
structure. Some caution must be used in interpretation, however. Unfortu-
nately, terminology has not been adequately standardized, nor does construc-
tion always follow the intended plans or designs.
127. The factors that allow certain structures to be grouped by design
approach generally include such things as the way in which the structure
itself is supported, how applied loads are resisted or transmitted, or the
degree of structural flexibility or rigidity (i.e. assumptions about defor-
mation). A preliminary discussion of the more common terms and design

approaches follows. Several references and handbooks are also available for
additional information (see Peck, Hanson, and Thornburn (1974); US Steel Cor-
poration (1975); Merritt (1976); or NAVFAC (l982a)).
Gravity seawalls
128. Gravity seawalls are those which rest directly on a soil sub-
stratum and rely on that soil for support in the same manner as conventionally
designed shallow foundations. Gravity walls may be constructed of different
types of material and in several configurations. However, as with all grav-
ity-type structures, these walls depend principally on their own weight for
stability against all loading conditions including lateral loads such as
waves. The ability to mobilize that weight for stability is in turn dependent
on the bearing capacity and continued integrity of the underlying soil mass.
129. Since weight is required for stability, gravity structures typi-
cally tend to be massive, monolithic in construction, often unreinforced, and
not particularly efficient in economy of material. The overturning moments
induced in a wall by soil and wave lateral forces are proportionate to the
moment arm length or height at which the forces act above the base. As a
result, height is generally the limiting factor for the use of conventionally
designed rigid gravity walls. As a very rough approximation, true gravity
walls are generally not considered economical for heights much above 15 ft
(Merritt 1976). In coastal applications where a seawall must be high enough
to extend from below some scour depth to above a design overtopping elevation,
this economical height is often exceeded, and variations in gravity wall
designs are frequently seen.
130, Techniques used to increase wall height without proportionate
increases in weight and cross-sectional area (and cost) have been borrowed
from the design of upland retaining walls and applied to seawalls. These
techniques give rise to the use of terms such as semigravity, cantilever,
counterfort, and others (Figure 20) to describe structures that have charac-
teristics generally common to gravity walls, but are not strictly rigid. In
each case an increasing percentage of the lateral thrust is resisted by bend-
ing moments developed within the vertical stem and an extended section of the
base, and by cantilever action between them. Such walls may be quite high,
yet relatively slender compared with conventional gravity structures. Rein-
forcement is required in concrete walls of these types, and external stiff-
eners are necessary for the more rarely used steel or timber gravity walls.

Figure 20. Types of walls; (a) gravity section, (b) semigravity section, (c) cantilever section, (d) counterfort wall
131. Other gravity-type seawalls occasionally seen are variations of
caissonlike structures. These can include true caissons or the expedient use
of precast units such as large-diameter pipe. The design approach used in
these seawalls is similar to conventional gravity walls in that the cross-
sectional areas and weights remain greater than used in cantilevered sections
and the structures are generally considered rigid for the purposes of prelimi-
nary analysis.
132. Gravity-type structures designed to withstand wave forces without
a need for a backfill buffer can fail in four primary ways: monolithic over-
turning, sliding, loss of bearing capacity, or differential settlement. Each
of these problems can ultimately be related either to inadequate analysis,
preparation, and protection of the foundation soil or to poor selection and
placement of the backfill. Each of these failure modes must be checked in a
design to assure stability of the structure.
133. The base of a gravity-type wall must extend below the potential
scour depth, and/or scour protection must be provided if the wall is to per-
form successfully. Scour can directly undermine the structure, causing over-
turning. It can also affect the bearing capacity of the foundation stratum
and the sliding stability of the wall and its retained soil mass by reducing
the passive resistance contribution from overburden soils.
134. Design scour depth at a site is discussed in Appendix C. Various
types of scour protection are described in detail in references including
USACE (1985), Eckert and Callender (1987), and others. Careful evaluation of
potential scour and its effect is especially important in reviewing existing
structures because profile elevations may have changed since the original
design.
135. Richart and Schmertmann (1958) and Eckert and Callender (1987)
discuss the importance of backfill in wall design. They note that free-
draining soils that exhibit large angles of internal friction (i.e. clean
sands) are the preferred backfill.
136. If the soil behind the seawall is not free-draining and if posi-
tive drainage measures are not provided, hydrostatic pressures can build up
from tidal lag, high ground-water levels, and/or overtopping (Walton and
Sensabaugh 1979). The increase in lateral pressure on the wall can be as
great as 50 percent above the drained case (Eckert and Callender 1987). This
increase can be accommodated in the structural design, but it must be recog-
nized in the design process. If a positive drainage alternative is selected,
the drainage media must be capable of removing the excess water without con-
current loss of any backfill. Methods for designing adequate drainage of
backfill are provided in Cedegren (1960), USACE (1983), and others.
137. Conventionally designed gravity seawalls rely principally on their
own weight for stability and on satisfactory foundation soil conditions to
support that weight. Protection of the toe soils from scour is critical to
the performance of gravity walls. Free-draining backfill or special positive-
drainage filter media are also important. New construction of true rigid
gravity seawalls is less common in the last 50 years (possibly because of
costs), but many such structures that were previously built for shore protec-
tion are still in service today.

Pile-su~~orted seawalls
138. Pile-supported seawalls and similar structures rely on deep-pile
foundations for stability. Figures 6-1 through 6-3 of the SPM (1984) show
examples of this type of seawall. Piles transfer the weight of the structure
to deeper soil strata through axial compression and resist the overturning
moments partially by bending and partially by a tension-compression couple.
Although the portion of a pile-supported seawall exposed to wave action may
appear very similar in cross section, materials, and construction to a gravity
seawall, it should be emphasized that the pile structure is designed (or eval-
uated) in a fundamentally different manner.
139. Since pile-supported structures are subjected to bending moments
and to shear at the pile connections, the pile caps and any vertical stiffen-
ing stems tend to be highly reinforced. The cross section can be relatively
slender and high compared with gravity structures. However, the wall bases
are frequently designed to be wider than would otherwise be necessary simply
to allow for installation of multiple pile rows. By increasing the number and
spacing of piles in the perpendicular direction, the unit load (especially in
tension) on individual piles can be reduced. Smaller, shorter piles can be
used, and installation costs tend to be less. This redundancy also increases
the overall factor of safety.
140. It is actually possible for pile-supported structures to fail in
the same four modes as gravity structures: overturning, sliding, bearing, or
settlement. The use of piles, however, allows the designer to rely to a
greater extent on the more predictable properties of the construction materi-
als and to minimize design problems caused by the uncertainties in foundation
soil response. Piles reduce the potential catastrophic effects of undermining
typical in gravity walls. Other problems such as differential settlement and
the difficulty of properly preparing foundation soils near the ground-water
surface are also reduced.
141. As a practical result, reasonably designed pile-supported seawalls
generally do not fail from monolithic overturning, settlement, or bearing.
Instead, the more common problems are deterioration and damage to the struc-
tural connection between the piles and the wall base and loss of backfill.
Both problems can contribute to slidinglike displacements and complete sepa-
ration and overturning of the wall section above the piles. Toe scour pro-
tection similar to that used for gravity walls, and/or sheet-pile cutoff walls

are added to pile-supported seawalls to reduce exposure of the pile-to-wall
connections and to prevent loss of backfill and upland property.
Anchored bulkhead
142. Anchored bulkhead refers to a large class of structures grouped by
a generally common structural design approach, whether or not they are actu-
ally intended to function within the earlier definition of a bulkhead. These
walls are typically constructed of some type of sheet piles driven into the
soil and connected by a cap and possibly one or more stiffeners or wales
placed within the plane of the wall.
143. A wall constructed only as described would actually be considered
a cantilevered structure. The pile penetration would have to be sufficient to
resist the entire lateral load by passive resistance in the soils below the
bottom and by bending within the sheet piles. Since this limits the height of
the wall for practical penetration depths and sheet-pile thicknesses, addi-
tional lateral resistance is usually provided by placing some type of anchor-
age system behind the bulkhead. The result, an anchored bulkhead, is probably
the most commonly used retaining and shore protection structure in the United
States. It is more typically designed to hold upland soil and not to serve as
a flood-control structure. Figure D-1 in Engineer Manual 1110-2-1614 (USACE
1985) provides an example of this type of structure.
144. The two basic design approaches for determining the required depth
of sheet-pile penetration are anchorage resistance and pile section groper-
ties. These approaches are termed free-earth support and fixed-earth support.
The principal variations in method result from two different assumptions
regarding the elastic deformation of the wall under loading. A number of
references are available that describe the details of the several variations
(e.g., Rowe (1952), Terzaghi (1954), US Steel Corporation (1975), NAVFAC
(1981a), USACE (1983), and others). No further explanation of the design
procedures or their variations will be provided here, except to note some
specific characteristics of typical anchorage systems as part of the discus-
sion on failure modes.
145. The sheet piles used in bulkheads vary in material and type.
Engineer Manual 1110-2-1614 (USACE 1985) describes several typical materials
and installation configurations.
146. Eckert and Callender (1987), citing work by Terzaghi (1954),
Sowers and Sowers (1971), and others, note that there is a relatively high

frequency of failure of anchored bulkheads. The principal reasons for failure
which they list include incorrect estimates of backfill loads, poorly designed
anchorage systems, and construction procedures resulting in excessive earth
pressures. The mode of failure from each of these problems would typically be
outward rotation of the wall cap (i.e. away from the retained soil mass).
Although this type of failure is undoubtedly the classic case for upland
retaining walls and dredged/filled harbor quays, Clark (1986a, 1986b) suggests
that the failure mode is quite different for coastal structures under wave
attack.
147. Clark's suggestion will be examined more fully in later discus-
sions of case studies. However, the potential explanation for such a view can
be understood by briefly looking at the traditional manner in which anchorage
systems are designed for upland installations. In these designs, anchors
(e.g. "deadmen," batter piles, etc.) are placed in the upland soil mass a
sufficient distance from the wall to be outside the zone of active pressure.
These anchors are then connected to the wall by some type of tieback system.
The tiebacks resist the tendency of the wall to rotate away from the anchors.
Therefore, the tiebacks are intended to be loaded in tension and are fre-
quently only slender steel rods or possibly cables. If properly designed,
this type of anchorage will perform well to resist lateral earth pressure from
behind the wall.
148. However, when a wall is subjected to large lateral pressures from
waves on its face, the resultant thrust is toward the upland soil and the
anchors. Initially the tendency of the wall to rotate landward is resisted by
the soil mass. But, if soil support is lost, either from deformation in the
soil or from direct washout of the backfill, the tiebacks are placed in com-
pression, a function for which they are not typically designed. One resulting
failure mode can occur under wave action with landward rotation of the wall
and, in extreme cases, shear of the piles at the mudline.
149. Other problems frequently contribute to failures because of the
unique nature of bulkhead design and installation. Scour can reduce the pene-
tration of the sheet piles and lead to toe-out rotation failures. The cyclic
loading from waves causes vibrations and nonuniform deflections of individual
piles which can separate the pile-edge joints and damage the cap. Failure of
the wall at one point can precipitate a ravelling failure along greater
lengths. Also, since the piles and caps are generally relatively thin
sections, any eventual corrosion, spalling, or similar deterioration often
causes a serious reduction in the designed factor of safety against failure.
150. Anchored bulkheads are typically composed of sheet piles installed
into the soil and connected in the parallel direction by a cap and wales and
braced in the perpendicular direction by a tieback and anchorage system. It
is possible that anchored "bulkheadlike" structures can be designed and con-
structed with material and section properties such that they might be classi-
fied as seawalls based on their functional ability to resist wave forces.
This is not the usual case, however. Most conventional bulkheads are designed
primarily as soil-retaining structures to resist lateral earth pressures from
behind the wall. Wave forces load the structure in the opposite manner and
occur during times when the resisting potential in the upland soil mass can be
weakened by overtopping, seepage, and washout. As a result, bulkheads fre-
quently fail when used in exposed coastal installations.
151. The term "dike" or "levee" refers to a large class of structures
typically of a soil mass (clay or sand) covered by a hardened layer consisting
of rock, interlocking concrete shapes, or asphalt underlain by a filter con-
sisting of geotextile or graded rock. The front face of a dike is in essence
a "revetmentqt and must be structurally designed with the same principles as a
revetment, although dikes often have the additional property of an impermeable
layer or core to prevent flooding for the upland area protected. The primary
difference between a dike and a revetment is the fact that a revetment only
defines the hardened front face of an earthen backfill whereas the dike refers
to both the hardened face and the earthen mound supporting the hardened face.
152. As a practical result, reasonably designed dikes do not fail as
would a massive concrete structure but are more susceptible to geotechnical
type failures such as slip circle, wedge, or piping type failures within the
earthen core material of the structure (see Thorn and Roberts (1981)). Addi-
tional modes of failure to consider in this type of structure are cover (hard-
ened) layer failure resulting from uplift pressure and slope instability
caused by wave action. Dike structures are common on the low coastlines of
European countries, although they are not common in the United States.
153. Presently little guidance exists for design of dikes because of
the complexity of adequately defining the geotechnical properties involved in
their design and the complex nature of their failure modes. Although The
Netherlands has been building dikes for centuries, there is still no adequate
design manual or procedure for dike design to resist wave activity as well as
flood water. Present dike design in European countries exposed to severe wave
activity is done in part using large physical modeling facilities for testing
of geophysical as well as structural adequacy of dike components. In certain
cases, though, the facing layer of a dike might be evaluated as would a
revetment.
154. Some structures either do not fit precisely into any of the above
categories or could be placed in more than one. The largest group of these
difficult-to-classify structures is made up of various patented designs and
components. The second major group consists of a number of combinations,
composites, or variations of the basic structure types.
155. The majority of patented structural wall systems do not fit the
basic structure-type descriptions almost by definition. They are deliberately
designed compromises that attempt to capitalize on the desirable features of
conventional designs while eliminating or reducing the undesirable features.
The degree to which these compromises are successful varies considerably.
156. Two general criticisms of patented systems are often made: there
is not enough prototype experience in most cases to draw supportable conclu-
sions, and suppliers tend to claim universal applicability based on limited
success in very specific installations.
157. The first situation is being addressed gradually by increasing
numbers of test installations monitored by the manufacturers, regulatory agen-
cies, and independent research organizations such as universities and CERC.
An example is the Low Cost Shore Protection Demonstration Program conducted by
the USACE (1981). This program included some type of assessment of over
20 proprietary structures or components. Unfortunately for the present dis-
cussion, most of these devices were installed in some type of revetment or
offshore breakwater rather than as a seawall.
158. The second situation, claims of universal applicability, may con-
tinue as a criticism. It would be rare for a design engineer to claim that
any one type of coastal flood-protection structure would be suitable for all
sites or conditions. Yet, under marketing pressures, something close to that
very claim is frequently made by the suppliers of patented devices.
159. In a number of cases, a particular nonproprietary structure may
seem to fit into more than one of the structure-type categories, often because
it is literally a combination of two or more structure-types. Examples

include cantilevered wall sections cast on top of bulkhead sheet piles, grav-
ity walls underpinned with structural piles, or rubble mounds grouted so that
they act structurally like rigid gravity walls.
160. Many times these combinations result from an existing structure's
evolution over a series of repair or rehabilitation efforts. The point is
simply that care must be used to evaluate such structures on the basis of how
they react structurally to applied forces, rather than on their superficial
appearance. This requires analysis on a case-by-case basis and relies on
engineering judgment and experience.
161. Another way of describing a structure is by the material from
which it is constructed. This approach potentially provides some information
about the strength and durability of the structure. It can also suggest
1,ikely behavior and effects during failure. For example, because some materi-
als are more ductile, structures built from them might offer a degree of
residual protection during a prolonged progressive failure. In addition,
certain materials may be inore suitable, or at least less likely to require
maintenance, under particular environmental effects such as i-ce, marine
borers, or corrosion.
162. There is a problem, however, in considering the material proper-
ties without regard to the design or construction method in which they are
used. Equally strong bulkheads might be constructed of timber, steel, alumi-
num, or concrete simply by choosing appropriate sections, thicknesses, and
connection details. Some of these bulkheads might not be appropriate in all
deterioration environments, and some may not be economical, but all could be
constructed to equal design strengths. Each material has its own unique
advantages and disadvantages, and it is not feasible to universally recommend
one construction material over another.
163. Whatever material is selected, it is more important that the prop-
erties are accurately considered in the design process, it conforms to appro-
priate governing quality standards, and it is handled and installed properly
during construction. Brief discussions of the materials commonly used in
coastal protection and their applicable specifications are provided in the
following paragraphs, The references cited, especially Moffatt and Nichol
Engineers (1983), should be consulted for further information.
164. Structural timber has long been recognized as a viable and econom-
ical material for marine use. It is frequently used in sheet-pile bulkheads

and as cutoff walls for gravity seawalls. Round timber piles are probably the
most common structural piles used to support seawalls and similar structures.
Timber is also used as cribs and in other caissonlike installations.
165. Timber has a number of advantages as a construction material. It
has a relatively high strength-to-weight ratio; can be readily field cut,
shaped, and connected; is easy to repair or replace; and is generally avail-
able throughout the country. It is a flexible material and tends to be used
in installations that are structurally flexible and redundant. As a result,
timber structures can typically withstand considerable deformation and damage
to individual members before complete collapse. Timber cannot, however, sur-
vive the extremely high unit stresses allowable in structural concrete or
steel. Longevity can also be cited as a concern.
166. Marine borers are the principal cause of deterioration of timber
structures in salt or brackish water. Generally, only timber that has been
treated to resist borer attack should be used in these environments. The
American Wood Preservers Bureau (AWPB) has established several standards
defining the treatment chemicals, processing methods, and quality control
criteria for treating timber to resist specific classes of exposure. For
example, the AWPB Quality Mark MP-1 (dual treatment) specifies a treated tim-
ber suitable for use in areas of extreme borer hazard and in waters where both
limnoria and pholad attack may be expected. Other AWPB standards are listed
in the references. Additional information about timber treatment is contained
in Naval Civil Engineering Laboratory (NCEL) (1978) and NAVFAC (1982b).
167. Timber can also be damaged by abrasion from ice, debris, and sand,
and by direct impact (e.g., the case studies reported in NAVFAC (1981b)).
These problems are usually addressed by jacketing individual round piles or by
providing fender wales and/or toe revetments along bulkheads. Another common
problem is damage during construction. Timber piles are particularly prone to
splitting and "brushing" if not driven with care. Abrasion, impact, and con-
struction handling cannot only damage the timber directly, but can reduce the
effectiveness of the preserving treatment by making the damaged area more
susceptible to borer intrusion.
168. Concrete is used in virtually every type of coastal structure
including massive gravity-type seawalls. There are two principal forms of
concrete: cast-in-place and precast (including prestressed). The design
methods, reinforcement requirements, and construction techniques are quire
different for each form. Cast-in-place concrete was traditionally used for
the monolithic gravity structures because of its mass and ability to be
batched at the construction site. However, the increased costs of labor-
intensive onsite forming and the concurrent advances in precast component
quality and availability have lead to greater use of precast units. Precast
components are now commonly used as structural piles, sheet-pile panels, tie-
back beams, and even as recurved or stepped-face seawall stem sections.
169. Concrete is a good alternative where abrasion, corrosion, or
marine-borer attack might limit the use of other materials. Studies have
shown that conventional concrete made with Type I cement can perform satisfac-
torily in a saltwater environment without significant leaching or loss of
section (e.g. by Portland Cement Association (PCA) and NAVFAC (1981b)). When
failure does occur, it can usually be related to salt penetration into the
concrete matrix and subsequent corrosion and spalling of the reinforcing
steel. Two factors affect this type of failure: the depth of concrete cover
over the reinforcing and the density (impermeability or watertightness) of the
concrete mix.
170. The minimum depth of concrete covering any reinforcing is recom-
mended to be from 3 in. (PCA 1979, NAVFAC 1981b) to 4 in. (Merritt 1976) in
order to reduce salt intrusion. Ensuring that this minimum is achieved in the
field is much more difficult than simply incorporating it into specifications.
Problems frequently occur at points where the reinforcing is overlapped, tied
to other members, or bent to change direction. The total amount of steel in
the section at these areas is greater, and it tends to be pushed into the
cover dimension.
171. A denser concrete mixture will also assist in reducing salt intru-
sion and reinforcement corrosion. This watertightness depends primarily on
the mixing water-cement ratio in the paste (PCA 1979). Lower ratios are denser
and more watertight. Since the compressive strength of concrete is also
largely dependent on the same water-cement ratio, some references (e.g.,
NAVFAC 1981b) address the problem of permeability indirectly by simply speci-
fying a higher strength concrete, 4000 psi, for exposure to salt water.
172. Structural steel is used in coastal protection structures in sev-
eral ways, but principally as support piles. Steel's great unit strength
makes it ideal for high capacity bearing piles that must be driven into dense
sands or consolidated clays, These bearing piles are typically fabricated

from structural steel shapes or structural steel pipe sections. Steel sheet
piles are also used in bulkheads, although somewhat less frequently on the
open coast (because of a shorter service life) than in harbors or inland
waterways.
173. One of the great advantages of steel, in addition to strength, is
its availability in a wide range of standard shapes, alloys, and section prop-
erties applicable to almost any need. It is generally a very uniform and
predictable material for which there exists considerable service data and
design experience. Steel components are easily field cut, spliced, or rein-
forced to meet variable conditions. Typical steel structures can tolerate
relatively large deformations before failing and continue to exhibit some
residual strength during and after yielding.
174. Steel is probably the simplest material to evaluate for residual
service strength and life in existing structures. If the basic steel grade is
known, the remaining load-carrying capacity can be reasonably estimated from
measurements of section geometry, thickness, and condition of any sections.
Several American Society for Testing and Materials (ASTM) standards governing
structural steel are listed in the references. Section properties and similar
data are tabulated in handbooks such as American Institute of Steel Construc-
tion (AISC) (1980).
175. Experience has shown that conventional carbon steel exposed to the
marine environment may have a limited service life if not protected from cor-
rosion and otherwise inspected and maintained. The factors affecting corro-
sion of steel piling include geographical location, range of tidal or wave
inundation, soil or other cover, abrasion conditions, and protective coating
(NAVFAC 1981b, Moffatt and Nichol Engineers 1983). A number of studies (e.g.,
NAVFAC 1981a and 1981b) suggest that corrosion is a greater problem in the
zone of cyclic wet-dry conditions, rather than below the permanent water
level. As a result, bearing piles driven to below grade and capped are fre-
quently not coated or are given only minimal protection. Conversely, sheet
piles and other members extending above grade into the corrosive zone should
be provided with some protective coating or other system (and periodically
inspected). Moffatt and Nichol Engineers (1983), NAVFAC (1981b) and other
references have extensive discussions of coatings and cathodic protection
systems.

176. Rubble-mound seawalls can be constructed of rock, quarrystone,
riprap, and precast concrete armor units. These materials may be used singly
or in combination, and they may be placed in a variety of cross sections rang-
ing from a single uniform layer to graded multilayers. Design recommendations
for these types of structures are provided in the SPM (1984) and other refer-
ences. Those discussions will not be repeated here since, in general, the
high void ratio and resulting permeability of typically designed rubble-mound
structures would preclude them from consideration as coastal flood-protection
structures. However, rubble-mound structures which have an impermeable sec-
tion (either because of grouting and/or sheet-pile diaphragm) are exceptions
to conventional designs that should be considered and evaluated.
177. The design or construction variations that are of interest are
those that result in either low water and wave transmissibility and/or signif-
icant structural rigidity similar to gravity-type walls. These characteris-
tics can be designed into the structure, such as specifying a core material
with very low permeability in a multilayer cross section or placing sheet
piles or a similar diaphragm as a barrier in the mound. The situation can
also occur as previously mentioned through successive maintenance or rehabili-
tation attempts usually culminating in a structure composed of several mater-
ials finally grouted into a rigid mass.
178. In summary, this section has introduced descriptions of the prin-
cipal shore protection structures likely to be considered for flood protec-
tion. Each of these structures can be described in more than one way using
various classification systems. Three systems discussed were classification
by functional intent, design or construction method, and construction
material.
179. A functional description of a structure cites several performance
objectives and associated design factors. The two objectives commonly stated
for shore protection are intercepting wave action and retaining upland prop-
erty. Similar structures may be distinguished by defining a principal func-
tion and establishing threshold criteria. In this way, for example, a seawall
could be defined as a structure whose principal function is to resist the
effects of waves with heights greater than 3 to 4 ft. The term "bulkhead"
might refer to a structure that is designed principally to retain soil and is
capable of withstanding direct attack from waves with heights less than 3 ft.
180. Since similar appearing structures could be classified differently
by functional intent, additional descriptors are frequently included that
group structures by common approaches in engineering design. These descrip-
tions usually reflect the ways in which structures are supported, transmit or
resist loads, and undergo deformations. Examples discussed included gravity-
type walls, pile-supported walls, anchored bulkheads, and combination struc-
tures. Typical failure modes for each type of structure were noted. In
addition, important common design considerations such as backfill selection
and placement, drainage, and scour protection were introduced and will be
considered more fully in subsequent sections.
181. A third consideration in describing coastal structures is the
construction material. All of the common construction materials, timber,
concrete, steel, and rock or stone are used in shore protection. Since each
material has both advantages and disadvantages, no generalization can be made
about a preferred material. Selection depends on availability, construction
cost, and service life under the environmental conditions at a specific site.
Examples governing specifications were cited for each material.
Case Histories During - Storms
182. The preceding sections have described and summarized the func-
tions, designs, and materials used in "idealized" coastal protection struc-
tures. However, it is important to look beyond the theoretical performance of
a design or material and consider experiences with actual structures.
183. In this section, existing literature on seawall case histories is
reviewed for illustrative examples of protective structure performance under
storm conditions. In each case reviewed, emphasis was placed on those struc-
tural aspects that could be considered as representing "successes" or "fail-
ures" of a particular functional intent, design, or material. General recom-
mended design features for acceptable structures will then be presented in a
later section based on these examples and other experiences. The cases
reviewed do not represent an exhaustive set of examples, but appear to be
reasonably representative. The information presented about each case is the
minimum necessary to illustrate a particular point. Further details on these
structures can be found in the referenced literature. It should be noted that
these reviews extend only to the performance of the structure in accomplishing

its protective goal and do not address any possible impacts or other problems
that might be associated with hardening the shoreline. The topic of impacts
to the beach or adjacent coastal areas is a subject with its own specialized
literature (e.g., the Journal of Coastal Research, Special Issue No. 4, Autumn
1988).
184. Prior to presenting these summaries, some difficulties encountered
in developing the case studies will be mentioned, since the problems associ-
ated with the research may be similar to those eventually faced by FEMA in
evaluating existing coastal flood-protection structures. Difficulties were
found in describing the type and assessing the condition of the structures
reviewed and in characterizing the natural forces that had impacted them. In
many cases there was simply little information available about the type of
construction or details on the materials used. During construction of large
or complex projects, field modifications to the originally designed, typical
sections are common, and "as-built" plans are not always prepared. There is
also a particular problem with large public works structures which have under-
gone repeated repair, modification, and expansion to the extent that the pres-
ent structure may bear little resemblance to the original.
185. In almost no case was it possible to establish the details of the
design conditions (water level, wave forces, scour, etc.) on which the struc-
ture was planned. Similarly, there are often little actual data available (or
it is speculative) about the conditions associated with storms impacting a
structure. The result is that meaningful or complete conclusions about the
performance of a structure in comparison with its design intent are not always
possible. However, some trends are evident, and the following summaries
should be illustrative.
186. The Galveston, TX, seawall is one of the best known examples of a
major shore protection and flood-control project. As described in references
such as US Army Engineer Division (USAED), Galveston (1981), the wall began
with a 3-mile-long segment constructed in 1902. The original wall was a com-
posite structure consisting of a curved-face, reinforced concrete, gravity
wall placed on untreated timber foundation piles. It included a wooden sheet-
pile cutoff wall and riprap for toe-scour protection. Several modifications
were made as a result of performance problems during storms (e.g. hurricanes
in 1909 and 1915). Extensions were also constructed in 1920, 1926, and 1953
through 1962. The wall length now totals 10 miles.

187. The wall can generally be considered a successful structural
design. There has been some long-term settlement because of consolidation of
the foundation soils under the piles. There have also been repeated problems
with scour, sinking of the riprap layer, exposure of the cutoff wall, and
occasional loss of fill under and/or through the wall. However, there has
never been any true structural failure of the wall, and the materials are in
excellent condition, especially for the age of the construction.
188. The general performance of the Galveston wall can be considered a
mixed success. In comparison with the devastation and loss of life in the
city prior to construction, the wall has successfully functioned to offer a
degree of protection to the upland. However, the wall has not been as suc-
cessful, at least in certain key design features. In particular, there was a
serious and recurring problem with overtopping of the wall, scour of fill
behind the wall, and continued (although reduced) flooding.
189. The cap elevation was originally +17 ft (MLW), but a 1909 hurri-
cane with a storm-surge elevation reported at +6 to +7 ft (MLW) caused over-
topping and serious loss of fill behind the wall from runoff. The land behind
the wall was subsequently raised a foot and stabilized with pavement over an
area extending even farther landward. The 1914 hurricane was even more severe
with a reported surge elevation of +14 ft (MLW) and combined wave action
reaching to +21 ft (MLW). The result was continuous sheet flow over the wall
2 ft deep and serious scour of the landward embankment to a depth of 7 to 8 ft
in some areas. The project required extensive repair including raising the
land elevation again (to +21 ft) and installing a concrete sheet-pile bulkhead
approximately 100 ft landward of the main wall to further contain the fill
areas.
190. The beach erosion control project at Virginia Beach has included a
number of structures and beach-fill sections. However, the principal struc-
ture is a 28-block-long concrete bulkhead built by local interests in 1927.
The design of the wall, known typically as a king-pile or pile-and-panel wall,
consists of precast rectangular concrete bearing piles installed on 14-ft
centers with concrete slabs or panels set horizontally between the king-piles.
A massive cast-in-place cap rests on the wall at elevation +11.5 ft National
Geodetic Vertical Datum (NGVD) with a concrete promenade/splash apron extend-
ing landward for 20 ft. In addition, a sand berm was placed seaward of the

wall in 1952-53 at elevation +5.4 ft (NGVD) and has been periodically renour-
ished to provide additional protection.
191. The Virginia Beach wall performance is particularly representative
of experiences with large public works projects of the period. The project
has been exposed to severe storm conditions and suffered major damage. How-
ever, in each case repairs and modifications have extended the service life of
the structure well beyond its original intent.
192. Waves associated with northeasters have repeatedly damaged the
panels forming the wall face. For example, in 1948 many panels were com-
pletely knocked out by a storm and buried, and 44 king-piles were sheared-off
or otherwise severely damaged. The return period for this storm water level,
based only on the height of combined surge and tide, was in the range of 2 to
5 years (USAED, Norfolk 1970). In a 1962 extratropical storm (the "Ash
Wednesday" storm), 4,100 ft of wall was so badly damaged that it had to be
completely rebuilt. Water levels in that storm were the second highest
recorded in the area, +7.4 ft mean sea level (MSL), but represent only a 20-
year return period water level (USAED, Norfolk 1970).
193. Loss of fill from behind the wall has been a recurring problem in
these and lesser events. Also, scour along the face of the wall was severe
during many storms. Beach profile modeling by CERC, described in USAED, Nor-
folk (1970), demonstrated the positive effects of the fill berm placed in 1953
in reducing even greater damage to the wall (and upland structures) in the
1962 storm.
194. Unusually complete information has been compiled (USAED, Norfolk
1970) about the storms impacting the Virginia Beach wall. For example, gage
records and a storm hydrograph calculated for a 1933 hurricane documented a
very rapid rise in still-water level. Although the water level reached cver
8 ft (MSL), it rose so rapidly that waves had little time to erode or impact
the base of the wall, and structural damage was minimized. On the other hand,
considerable water overtopped the wall and deposited large quantities of sand
on the upland area.
195. The maximum water level associated with the 1962 storm was +7.4 ft
(MSL), but tides remained well above normal for 4 days. The overtopping dur-
ing this storm was described as resulting from broken waves and surf being
propelled over the cap by winds and following waves. Flooding up to 1 ft deep
occurred behind the wall, but no direct wave transmission inland was reported.
196. In general, the Virginia Beach wall has successfully reduced
upland flooding to only moderate overtopping during relatively severe storms.
However, the major exceptions to this success have been in situations associ-
ated with structural failure of wall segments leading to more significant
upland impacts. These seawall failures occurred during storm events which had
associated return period water levels considerably less than 100 years.
197. The OIShaughnessy Seawall in San Francisco, CA, built between 1915
and 1920, is another example of composite construction. As described by
OfShaughnessy (1924), the wall is basically a reinforced concrete stepped
revetment supported at the toe on a concrete sheet-pile cutoff wall. The
stepped section is then topped by a recurved concrete parapet wall also sup-
ported along the landward edge by pedestal foundations. The stepped section
extends from approximately elevation +7 to +17 ft mean lower low water (MLLW),
and the top of the recurve is at +27 ft (MLLW). Cross-walls, or returns, were
constructed on 150-ft centers perpendicular to the main wall alignment to
provide compartmentalization. A concrete splash apron placed above a foot-
thick layer of impervious clay prevents seepage of any overspray landward of
the wall.
198. The OIShaughnessy Seawall is probably one of the more successful
shore protection structures. It has never been significantly damaged, even
under the effects of extreme storm events. The only problem with the struc-
ture has been an increasing deterioration of the concrete and corrosion of the
underlying reinforcing steel. This problem is largely the result of abrasion
of the concrete by coarse-grained sediments and the suspension of periodic
repair and maintenance for the last 20 years because of funding shortages.
The wall has performed its protective function equally well and has not been
significantly overtopped, nor scoured. The structure's success is undoubtedly
related to its sheer mass and size: over 12 tons per lineal foot and an ele-
vation of +27 ft (MLLW).
199. Escoffier (1951) reported on his investigation of shore protection
structures along approximately 40 miles of coastal Mississippi. His work
focused on the performance of various designs of seawalls and bulkheads, par-
ticularly under the impact of a major hurricane in 1947. In his analysis, he
grouped structures into nine types based on cross-sectional geometry. These
groups will not be described in detail here, but they included several
variations of pile-supported walls, buttressed gravity walls, anchored bulk-
heads, and stepped and smooth face revetment-bulkhead combinations.
200. The 1947 storm had water levels ranging from +7.7 ft (MSL) in
eastern Mississippi to +15.2 ft (MSL) at Bay Saint Louis. Associated waves
were 6 to 8 ft high. Although the wall sections varied in elevation somewhat,
generally the water levels were at, or above, the wall caps so that there was
no direct breaking wave impact on the wall but considerable flooding behind
the wall. The following discussion of comparative performance is summarized
from Escoffier (1951).
201. The more massive wall sections, such as pile-supported recurved
concrete walls and buttressed gravity walls, survived the storm with little or
no damage. The anchored bulkheads, even those anchored to soldier piles, suf-
fered frequent failures, which generally involved loss of soil from behind the
wall, anchorage collapse, and subsequent wall rotation (seaward in some cases,
and landward in others). In some reaches, the scour behind the wall was great
enough to expose anchor piles to a length sufficient for them to then shear
under cantilever loading. Prior corrosion of steel tieback rods was also
noted as a major contribution to anchorage collapse and wall rotation. The
stepped faced, sloping walls generally performed well and significantly better
than similar smooth slab revetments. However, this was likely not the direct
result of the slightly greater roughness, but because the stepped slabs had to
be cast in thicker sections, almost twice as thick, to allow for the steps.
Where the slab-type structures failed, they did so as a result of loss of
backfill, differential settlement, cyclic stresses in the unsupported spans,
and finally, cracking of the joints along the supports.
202. Fulton-Bennett and Griggs (1986) and Griggs and Fulton-Bennett
(1988) have provided a comprehensive perspective on the effectiveness of
coastal protection structures based largely on their examination of a variety
of types of structures (including rock revetments) in central California.
Their work was in much greater detail than can be described here, but they
confirm a number of trends found in other case histories and suggest some
general conelusions as follow.
203. The structures reviewed in Fulton-Bennett and Griggs (1986) and
Griggs and Fulton-Bennett (1988) tended to be (with some important exceptions)
designed and constructed within the last 25 years. During that period, rock
revetments began to replace concrete and timber walls as the most common

protective structure in their study area. They concluded that this replace-
ment was largely based on lower first costs for the revetments. However, they
state that revetments required frequent maintenance as a result of settlement,
scour, and destabilization of the slope associated with structure rotation.
These same problems can all reoccur relatively quickly under storm attack with
the result that the revetment may offer greatly reduced protection to the
upland. Further, when revetments or similar rubble-mound structures do begin
to fail, either from wave overtopping or flanking, the effect can be a very
rapid, progressive collapse as reported, for example, by Smith and Chapman
(1982).
204. Fulton-Bennett and Griggs (1986) and Griggs and Fulton-Bennett
(1988) found that, in general, well-engineered concrete walls with adequate
height to prevent overtopping and sufficient depth to tolerate scour provided
the more effective protection, especially during the winter storms of 1983,
which were noted to be very severe. The most common problems, other than toe
scour, noted with the concrete walls in the California study area included
loss of upland fill and foundation support. Piping of fill occurred through
interlocking joints if the joints were not carefully grouted. The authors
stress the benefits of a continuous, coherent approach to structure design and
placement based on damage observed following the 1983 storms, during which an
entire group of different, unconnected walls failed at one site and flanking
problems were found at several other sites.
205. Pinellas County is located on the west-central gulf coast of Flor-
ida and includes the major population centers of St. Petersburg and Clear-
water. The majority of the more than 30-mile-long shoreline is fronted by
low-lying, intensively developed barrier islands. Vertical concrete bulkheads
were the most common coastal protective structure in the county (Clark 1986a)
with occasional reaches of restored protective beaches.
206. It is reasonable to state, based on the discussion by Clark
(1986a), that most of the bulkheads (with some exceptions) in the county were
older structures, inadequately designed for the exposed conditions which they
increasingly faced as a result of continued long-term erosion. The walls had
very low cap elevations (e.g. +6 ft (NGVD)), insufficient toe penetration for
the eroded profile, and missing or inadequate return walls. Although these
bulkheads may not be representative of proper, present state-of-the-art engi-
neering, experiences with their performance are instructive in supporting

suggested, desirable features in any proposed structures. This type of wall
is also representative of coastal protective structures which currently exist
on much of the individual residential property along the Florida gulf coast.
207. Hurricane Elena passed offshore of the Florida gulf coast during
29 August through 1 September 1985 and particularly impacted the Pinellas
County barrier islands. Tropical storm Juan passed through the western gulf
between 26 and 3l October 1985, further damaging the west coast of Florida.
Clark (1986a) summarized the coastal damage resulting from these storms
(including over 150 photographs) and provides several general recommendations
for design of proposed reconstruction.
208. Clark (1986a) reported that a total of approximately 17,600 linear
ft of bulkheads in Pinellas County were destroyed or damaged to the extent of
requiring major reconstruction as a result of the two storms. The report
concludes that the most significant problems shared by the damaged walls were
a lack of toe-scour protection and absence of positive measures to contain
upland fill. Specific comparisons are noted between the survival of walls
with toe-scour protection and the collapse of immediately adjacent walls with-
out such protection (e.g. Figures 97-100 in Clark (1986a)).
209. Clark's (1986a) discussion of the second problem, loss of upland
fill and its effect on structure survivability, parallels the description of
failure modes for anchored bulkheads described previously in this report. He
confirms that overtopping waves removed large quantities of upland sediment,
leaving the tiebacks exposed, which then failed in compression; thus, wall
sheet piles were left unsupported and incapable of withstanding impact loads.
Figures 132 and 134, among others, in Clark (1986a) clearly demonstrate this
situation and show sheet piles sheared at the "mud" line and knocked landward,
rather than in a more conventionally supposed toe-out rotational soil failure.
His recommendations for proposed new structures include carefully containeriz-
ing the upland fill by using geotextile filters, adequate return walls at each
end and at intermediate intervals along longer, continuous walls and by avsid-
ing any fill other than clean sand with high permeability. He also suggests
that tiebacks be encased in concrete to resist corrosion and compressive
loads.
210. Reviews of other cases suggest very similar experiences with shore
protection structures in other areas of the country. Oertel, Fowler, and Pope
(1985) discuss the history of erosion control measures at Tybee Island,
Georgia. Essentially all of the 3.5 mile-long Atlantic shoreline of Tybee
Island had beenarmored with a succession of seawalls, bulkheads, and revet-
ments dating to the early 1900s. Segments of the various walls failed repeat-
edly and were repaired or replaced until the area received an initial beach
restoration project in the 1970s and subsequent renourishments. There were
exceptions, but Oertel, Fowler, and Pope (1985) note that the typical succes-
sion of structures was from short lifespan steel sheet-pile bulkheads; to
concrete structures that were more durable, but continued to suffer from toe
scour; to bulkheads with rock revetments for toe protection.
211. Clark (1986b) also described the impacts to the Florida panhandle
associated with hurricane Kate in November 1985. This section of Florida did
not have shore armoring structures to nearly the extent of Pinellas County,
but the damage to those that did exist was similar to that previously dis-
cussed. A total of approximately 2,000 ft of bulkheads was destroyed in the
area. A 1,275-ft section of sloping concrete slab revetment was destroyed in
Port St. Joe, FL, during this storm. Water levels during the storm were on
the order of +8 ft (NGVD), reaching to +9 to +10 ft (NGVD) where wave action
was significant.
212. The Town of Palm Beach, FL, recently completed a comprehensive
reevaluation of shore protection structures along the town's Atlantic shore-
line.* The structures in the area include a number of designs, construction
periods, and private, group, and public projects. However, one predominant
structure is a 6,000-plus-ft steel sheet-pile wall built in 1929. Experiences
with this structure are similar to many other large public works projects of
the period in that, through maintenance and repairs, it has far outlived its
original design life and may now be inadequate for present exposure condi-
tions. Structural problems began to appear in the wall in the 1950s, and
extensive repairs, including a concrete (gunite) overlay, were made at that
time. Additional repairs, new tiebacks, and replacement of some entire seg-
ments are now proposed. One major problem with the existing structure is
inadequate toe penetration (or conversely, scour protection). The original
* Coastal Planning & Engineering, Inc., 1987, "Town of Palm Beach Roadway Protective Seawall Evaluation," unpublished letter report to the Town of Palm Beach, FL, Boca Raton, FL. Cubit Engineering Ltd., 1986, "Town of Palm Beach Roadway Protective Seawall Repairs Design Study Evaluation," unpublished letter report to the Town of Palm Beach, FL, Charleston, SC.
design was based on a fairly stable sand berm along the wall face at the time
of construction at approximately elevation +5 ft (MSL) with piles penetrating
to -8 to -12 ft (MSL). Since that time, the profile has lowered to the extent
that elevations frequently drop to 0 to -1 ft (NGVD) during even minor storms
and spring tides, leaving the piles underpenetrated and the tiebacks over-
stressed. Substantial corrosion of the sheet-pile section and the tieback
rods was also documented; the section modulus of the sheet piles has been
reduced by 43 percent, and the tie-rod cross-sectional area has been reduced
by 48 to 58 percent.*
213. This section has presented very brief summaries of the structural
and functional performance of several case history shore protection structures
or regional groups of structures. The case histories reviewed have not pre-
sented a significantly different view of shore protective structure design
from that used in the present state-of-the-art coastal engineering practice,
and the review has confirmed the importance of certain basic design features.
Those features will be discussed further in a subsequent section.
Recommendation of Design Features for Acceptable Structures
214. Previous sections of this report have reviewed the basic engineer-
ing properties of the materials commonly used in coastal protection struc-
tures, the factors upon which such structure designs are based, the theoreti-
cal failure modes for these structures, and experiences with actual projects
reported in the literature. The results have strongly confirmed the impor-
tance of certain basic design features that should be a part of any acceptable
structure. Those features are summarized in this section.
215. It is clear to the authors of this report and supported by the
case histories previously reviewed that proper consideration of toe scour and
overtopping (resulting in loss of upland) are the two most significant fea-
tures of successful shore protection structures. In almost every case of
failure, including those in which the construction materials themselves actu-
ally failed, the underlying cause was inadequately anticipating the degree and
effect of profile lowering along the wall face and/or the loss of fill behind
the structure. Appendix C discusses "state-of-the-art" design scour criteria
* Cubit Engineering Ltd., op. cit.

(in the absence of toe protection), while previous sections have discussed
runup and consequent overtopping.
216. Obviously, structures under evaluation must be investigated to
ensure that foundation piles or wall sheet piles have a minimum embedment
sufficient to tolerate the expected scour at the site (in the absence of toe
protection). Appendix C notes that the maximum scour design criterion at the
base of a structure (in the absence of toe protection) should be the maximum
wave height at that location. The more successful structures will also in-
clude positive provisions for directly controlling that potential scour along
the face. Such provisions provide an additional factor of safety under design
conditions and reduce the effects of more severe conditions. The most common
approach has been placement of a toe revetment, and considerable guidance
exists for designing, or evaluating the design, of scour revetments and aprons
(e.g. SPM (1984), USACE (1985), Eckert and Callender (1987), and others).
Other projects have relied on providing an overfilled profile or storm berm
seaward of a structure to erode sacrificially and reduce scour effects.
217. The case histories show that either approach can be effective, but
both frequently result in high maintenance requirements to replace lost rock
or counter the effects of revetment settlement, or to replenish the berm vol-
ume. The evaluation of an existing structure should, therefore, probably
focus on the additional protection offered by the scour treatment in a condi-
tion something less than the original full design section since the degree of
maintenance cannot be guaranteed.
218. Similar to the case of scour, evaluating a structure for overtop-
ping would begin by investigating its elevation relative to expected water
levels, the area bathymetry and the wall's position on the profile, and cer-
tain features of its cross-sectional geometry. However, the evaluation should
then expand to include positive provisions to control the effects of overtop-
ping, especially the loss of backfill. This is a desirable feature of a well-
designed coastal flood-protection structure, even though the structure has
been designed not to be overtopped during the design storm.
219. Case histories and other experiences (see especially Richart and
Schmertmann (1958), Clark (1986a), or Fulton-Bennett and Griggs (1986)) have
shown that backfill material can be lost seaward by rundown over the structure
cap, landward by drainage of flood water, or laterally aro~md inadequate
return walls. Sediment can also be piped through joints or seams in the
structure, through drainage openings (weep holes, storm sewers, etc.), under
the toe, and through direct breaches in the wall's face. The condition of the
backfill is further affected by ground-water levels elevated by precipitation
and/or tidal response. Each of these paths must be investigated, and each
usually requires a combination of solutions to be fully effective.
220. For example, grouting or otherwise sealing joints should be con-
sidered a minimum provision against piping. However, grouting alone is usu-
ally not fully effective because of deterioration, differential movements at
the joints, or inadequate initial depth of the seal. A filter medium such as
a geotextile fabric, preformed drain, or graded stone filter should be pro-
vided behind the wall to reduce the hydrostatic gradient and isolate the fill
from the joint areas. In addition, the more successful structures will also
include surface treatments landward of the wall cap such as positive drainage,
stabilized splash aprons, and/or impermeable layers to reduce the volume of
water entering the backfill. Experience has confirmed that this type of
redundancy is necessary to provide an improved factor of safety and control
damage when it occurs. Unfortunately, there is no methodology established
that would lead to a good check for adequate drainage for a coastal flood-
control structure. This is a complex problem requiring good engineering judg-
ment on a case-by-case approach.
221. As a further measure toward successful performance, the basic plan
alignment of a shore protection project should present a continuous structure.
Isolated, individual walls or revetments along staggered alignments have not
performed nearly as well. Waves forces tend to concentrate on the multiple
corners or be diffracted into pocket areas; reflected energy can strike adja-
cent return wall sections producing greater damage; and the failure of one
structure may contribute to failures in adjacent structures if they do not
have adequate return walls or otherwise depend on each other for fill contain-
ment. Examples of these situations are discussed by Fulton-Bennett and Griggs
(1986) at their "Site No. 26," by Clark (1986b) (e.g. Figures 7, 8, and ll),
and by Clark (1986a) (e.g. Figures 66, 67, 94, and 95). As Clark (1986a)
notes, even structures with coherent, contiguous alignments should also incor-
porate redundant return walls at frequent intervals. These intermediate
return walls compartmentalize the upland fill and help ensure that breaching
or other failure at one point will be confined and not ravel into larger
sections.

222. It is difficult to exclude, a priori, a particular type of con-
struction material or design geometry as completely unacceptable from a sta-
bility standpoint, although numerous failures of bulkheads and similar
nonmassive structures during storms with water levels having return periods
less than 100 years may be sufficient evidence for FEMA to decide a priori
that such structures will not be considered for flood credit. It is clear
that some materials and designs have generally performed better than others.
Revetments alone, for example, have not proved particularly useful for protec-
tion against flooding (although they can be used in combination with upland
walls). Slabs, panels, sheet piles, and similar thin-section, "many-pieced"
structures have typically been structurally damaged more frequently than mono-
lithic (massive concrete) sections (e.g. failures at Virginia Beach and
Pinellas County versus little structural damage at Galveston or San Fran-
cisco). Properly reinforced and proportioned concrete appears to be more
durable than steel for coastal exposures, although this durability can depend
on the degree of initial protection and subsequent maintenance given to each
(see, for example, NAVFAC 1981b; Moffatt and Nichol Engineers (1983); and
previously discussed case histories at San Francisco and the Town of Palm
Beach).
223. Based on case histories and the previous discussion in this
report, a model of a typically successful coastal flood-protection structure
might be a composite design structure with a relatively massive concrete grav-
ity-type wall section, but supported on a pile foundation and protected by a
scour revetment and/or sheet-pile cutoff toe wall. It would also be provided
with positive measures to control seepage and loss of backfill and be regu-
larly inspected, maintained, and repaired. Other materials or geometries
might certainly be shown to be equally acceptable, if the basic design fea-
tures discussed were adequately addressed. Unfortunately, most nonmassive
seawalls invariably experience failure to some degree in a major storm because
of some design inadequacy. It can be noted that the "model" seawall described
is rarely built today, and if it were, it would likely be prohibitively expen-
sive* (Clark 1986a, Fulton-Bennett and Griggs 1986).
F
* Coastal Planning & Engineering, Inc., op. cit.
Summary and Recommendation
224. There are four primary types of coastal flood-protection struc-
tures from a functional standpoint: gravity seawalls, pile-supported sea-
walls, anchored bulkheads, and dikes (also referred to as "levees"). Typi-
cally a coastal structure may contain composite features of one or more of
these four broad classes of structure. Properly designed and maintained, any
of these coastal flood-protection structures can survive a 100-year return
period storm and remain functionally intact (in theory). In practice though,
anchored bulkheads have numerous instances of failure in severe coastal
storms. It is recommended that as a general policy, FEMA not consider
anchored bulkheads for flood-protection credit because of extensive failures
of anchored bulkheads during large storms and difficulty in checking the pres-
ent conditions of anchored bulkheads to resist design storms.
PART VII: EVALUATING EXISTING COASTAL FLOOD-PROTECTION STRUCTURES
225. In summary, a flowchart/outline approach will be presented which a
qualified coastal engineer might use to evaluate the adequacy of a particular
existing coastal flood-protection structure. This evaluation should be con-
ducted as an independent, in-depth engineering review of the design, rather
than simply verification of the original designer's certification. Such a
review would need to be made by applicants to FEMA requiring consideration of
protective benefits offered by their coastal flood-control structure. Not
surprisingly, the basic information and approach required for such a review is
similar to that which is necessary for the original design process.
226. This flowchart is presented as Figure 21 and incorporates criteria
similar to information used in design procedures outlined in USACE (1985),
NAVFAC (1981a), and Allsop (1986). For the in-depth structural stability
aspects of the coastal flood-control structure, it is assumed that a certified
professional engineer with coastal engineering experience would be required to
do the analysis. The burden of such an analysis should be put on the person
applying for reduced insurance costs.
227. The flowchart in Figure 21 may be used, as follows, to:
a. Determine the cross section of a structure and cap elevation - along with water-level range and wave conditions for the site; prestorm profile at the site; and bathymetry/topography at the site.
(1) Water levels would range from a maximum of 100-year return period water level to low water level at the site.
(2) Waves for the site might be determined as depth-limited breaking waves in accordance with present FEMA criteria.
b. Evaluate wave runup on a structure to determine if runup is above the crest of the structure (functional failure) or below the crest of the structure. Runup could be calculated via Appendix A methodology and adjusted for roughness of the structure.
c. Collect design details on a seawall; cross-section properties; - history of any structural damage or failures, maintenance, modifications, etc.; record of performance in various large storms (i.e. overtopping or breaching of the structure, toe failure due to scour, etc.). Also collect soil information (laboratory tests, borings, etc.) to determine soil proper- ties. If the structure has experienced failure from storms

4 PASS
SEE EXPANDED MATERIAL FOR THESE BLOCKS DEPENDING ON STRUCTURE TYPE
FAIL 4 -
ADEQUATE FOR FLOOD PROTECTION PURPOSES
STRUCTURE INADEQUATE FOR FLOOD PROTECTION
Figure 21. Flowchart/outline for structure evaluation
less than design storm (100-year storm), then failure under design storm should be assumed.
d. Check for adequacy of toe protection in front of the structure - to determine potential for scour development (see USACE (1985), Eckert and Callender (1987)).
e. Evaluate scour potential in front of the structure in accor- - dance with Appendix C.
f. Evaluate structure stability for minimum seaward water level, - no wave height, and saturated soil conditions behind the structure. Stability check is to be made with or without

scour (step g) depending on adequacy of toe protection (step d l . (1) Required checks for dikeskevetments. Geotechnical
checks are to be made for potential dike failure in land- ward direction by rotational gravity slip of dike (see Terzaghi and Peck (1967), Sowers and Sowers (1970), Department of Navy (1971), Thorn and Roberts (1981), Spangler and Handy (1982)).
(2) Required checks for ~ r a ~ i t ~ / ~ i l e - ~ ~ p ~ ~ r t e d seawall.
(a) Check for sliding toward sea (assume rigid foundation).
(b) Check for overturning toward sea (assume rigid foundation).
(c) Check adequacy of foundation based on maximum pres- sure developed in sliding and overturning calcula- tions (see Terzaghi and Peck (1967), Sowers and Sowers (1970), Winterkorn and Fang (1975), Depart- ment of Navy (1971), Spangler and Handy (1982)).
(3) Required checks for anchored bulkheads.
(a) Check for shear failure in bulkhead.
(b) Check for moment failure in bulkhead.
(c) Check adequacy of tiebacks to resist tension load.
(d) Check adequacy of deadman size and allowable soil pressure to resist deadman loadings. (See Walton and Sensabaugh (1979) for guidelines on these checks) .
g. Evaluate structure stability for critical seaward water level (which might be any water level from minimum to the maximum 100-year return period water level) to include hydrostatic and hydrodynamic (wave) loading on the seaward side of the struc- ture (with the assumption of soil deformation (i.e. no soil pressure) on the landward side in the case of seawalls or bulkheads). Use a condition of scour in front of the struc- ture if inadequate toe protection is provided.
Required checks for dikes/revetment.
(a) Geotechnical checks are to be made for potential dike failure in seaward direction by rotational gravity slip of dike (see Terzaghi and Peck (1967), Sowers and Sowers (1970), Department of Navy (1971), Thorn and Roberts (1981), Spangler and Handy (1982)) or by failure of the foundation because of inade- quate bearing strength under wave and water loading.
(b) Check revetment stability (if applicable) for the following items:
o Stability of rock/riprap/armor blocks to wave action (via procedures given in Chapter 7, of the

SPM (1984), the section on stability or rubble structures and material in EM 1110-2-1614 (USACE 1985), on revetment design in Zanen (1978), or Ahrens (1981).
o Toe stability of structures via material given in SPM (1984), Chapter 7; EM 1110-2-1614 (USACE 1985); Pilarczyk (1987); and Eckert and Callender (1987).
o Uplift forces on blocks or impervious surfaces via material given in Delft University Press (1984) or Pilarczyk (1987).
o Adequacy of geotechnical filter via material provided in Calhoun (1972) and USACE (1977).
o Adequacy of graded rock filter via material pro- vided in Ahrens (1975a), Engineer Manual 1110-2-1913 (USACE 1978), and Zanen (1978).
(2) Checks for ~ravitv seawall/pile-suvvorted seawall.
(a) Check for sliding toward land (assume rigid foundation).
(b) Check for overturning toward land (assume rigid foundation).
(c) Check adequacy of foundation based on maximum bear- ing pressures developed in sliding and overturning calculations (see Terzaghi and Peck (1967), Sowers and Sowers (1970), Department of Navy (1971), Winterkorn and Fang (1975), and Spangler and Handy (1982)).
A reasonable example calculation for sliding and over- turning is given in Chapter 16 of Delft University of Technology (1976) for a caisson with water on both sides and in Chapter 8 of the SPM (USACE 1977). This basic approach can be used for a gravity seawall only with water level at the seawall base on the landward side.
(3) Rewired checks for anchored bulkhead.
(a) Check for shear failure in bulkhead.
(b) Check for moment failure in bulkhead.
Assume tiebacks do not provide support in these calculations.
h. Check for material adequacy (i.e., has expected life of mate- rial been exceeded?).
(1) See US Steel Corporation (1975) and AISC (1980) for eval- uating adequacy of steel in structure.
(2) See AWPB (periodically updated) for evaluating adequacy of wood in structure.
(3) See ASTM (periodically updated) for evaluating all mate- rial standards .
(4) See Moffatt and Nichol Engineers (1983) for general guid- ance on construction materials in the coastal zone.
228. A flowchart approach to check adequacy of the primary types of
coastal flood-protection structures to survive the 100-year return period
storm is provided. References to information necessary to do detailed check-
ing of structures are provided where they exist.
REFERENCES
Ahrens, J. P. 1975a. "Large Wave Tank Tests of Riprap Stability," TM 51, US Army Corps of Engineers, Coastal Engineering Research Center, Fort Belvoir, VA .
. 1975b. "Wave Runup on a 1 on 10 Slope," MP 12-75, US Army Corps of Engineers, Coastal Engineering Research Center, Fort Belvoir, VA.
. 1979. "Irregular Wave Run-Up," Proceedinps Coastal Struc- tures 79, American Society of Civil Engineers, Alexandria, VA.
. 1981. "Design of Riprap Revetments for Protection Against Wave Attack," Technical Paper No. 81-5, US Army Corps of Engineers, Coastal Engi- neering Research Center, Fort Belvoir, VA.
. 1983. "Wave Run-Up on Idealized Structures," Proceedings Coastal Structures 83, American Society of Civil Engineers, Arlington, VA.
Ahrens, J. P., and Heimbaugh, M. S. 1986. "Irregular Wave Overtopping of Seawalls," Proceedings, - Oceans '86, Washington, DC, pp. 96-103.
Ahrens, J. P., and McCartney, B. L. 1975. "Wave Period Effect on the Stabil- ity of Riprap," Proceedings Civil Engineering in the Oceans, 111. American Society of Civil Engineers.
Ahrens, J. P., and Titus, M. F. 1985. "Wave Run-Up Formulae for Smooth Slopes," Proceedings. - American Society of Civil Engineers, Journal. Waterways and Harbors Division, Vol 111, No. 1.
Allsop, N. W. H. 1983. "The SHED Breakwater Armour Unit, Model Tests in Random Waves," Report No. EX 1124, Hydraulics Research Station, Wallingford, UK .
. 1986. "Sea Walls: A Literature Review," Report No. EX 1490, Hydraulics Research, Wallingford, Oxfordshire, UK.
Allsop, N. W. H., Franco, L., and Hawkes, D. J. 1985. "Wave Runup on Steep Slopes--A Literature Review," Report No. SRX, Hydraulics Research Station, Wallingford, UK.
American Institute of Steel Construction. 1980. "Manual of Steel Csnxtruc- tion," Eighth Edition, Chicago, IL.
American Society for Testing and Materials. Periodically Updated. "Applica- ble Material Standards" (see individual titles below), Philadelphia, PA.
Timber: D25 Specification for Round Timber Piles
D245 Standard Methods for Establishing Structural Grades and Related Allowable Properties for Visually Graded Lumber
Structural Steel: A6 Standard Specification for General Requirement for Rolled Steel
Plates, Shapes, Sheet Piling and Bars for Structural Use
A36 Specification for Structural Steel
A242 Specification for High-Strength, Low-Alloy Structural Steel
A690 Specification for High-Strength, Low-Alloy Steel for H-piles and

Sheet Piling for Use in Marine Environments
American Wood Preservers Bureau. Periodically Updated. "Structural Wood Mate- rial Standards" (see individual titles below), Arlington, VA.
MP-1 Standard for Dual Treatment of Marine Piling Pressure Treated with Water-Borne Preservatives and Creosote for Use in Marine Waters
MP-2 Standard for Marine Piling Pressure Treated with Creosote for Use in Marine Waters
MP-4 Standard for Marine Piling Pressure Treated with Water- Borne Preservatives for Use in Marine
MPL Standard for Softwood Lumber, Timber and Plywood Pressure Treated for Marine (Saltwater) Exposure
Bagnold, R. A. 1939. "Interim Report on Wave Pressure Research," Journal of the Institution of Civil Engineers, Vol 12, London, 1939.
Barnett, M. R. 1987. "Laboratory Study of the Effects of a Vertical Seawall on Beach Profile Response," UFL/COEL-87/005, Coastal and Oceanographic Engi- neering Department, University of Florida, Gainesville, FL.
Battjes, J. A. 1974a. "Surf similarity," Proceedings, - 14th Coastal Engineer- - ing - Conference. American Society of Civil Engineers, Copenhagen.
. 1974b. "Computation of Set-Up, Longshore Currents, Runup and Overtopping Due to Wind-Generated Waves," Ph.D. Thesis, Delft University of Technology, The Netherlands.
Beach Erosion Board. 1956. "Laboratory Data on Wave Runup and Overtopping on Shore Structures," Technical Memorandum No. 64, Washington, DC.
Blackmore, P. A., and Hewson, P. J. 1984. "Experiments on Full-Scale Wave Impact Pressures," Coastal Engineering. Vol 8, pp 331-346.
Burcharth, H. R. 1979. "The Effect of Wave Grouping on on-shore Structures," Coastal engineer in^ 2, Elsevier.
Calhoun, C. C., Jr. 1972. "Development of Design Criteria and Acceptance Specifications for Plastic Filter Cloth," Technical Report S-72-7, US Army Engineer Waterways Experiment Station, Vicksburg, MS.
Camfield, F. E. 1986. "Wave Forces on a Wall Shoreward of the Still Water Line," Technical Note CETN-111-29, Vicksburg, MS.
Cedegren, H. R. 1960. Seevage. Drainage. and Flow Nets, John Wiley & Sons, New York.
Chestnutt, C. B., and Schiller, R. E., Jr. 1971. "Scour of Simulated Gulf Coast Sand Beaches Due to Wave Action in Front of Sea Walls and Dune Barri- ers," COE Report No. 139, TAMU-SG-71-207, Texas A&M University.
Chue, S. H. 1980. "Wave Run-up Formula of Universal Applicability," Proceedings - of the Institute of Coastal Engineering. Part 2, Vol 69, TN 274.
Clark, R. R. 1986a. "The Impact of Hurricane Elena and Tropical Storm Juan on Coastal Construction in Florida," Post-Storm Report No. 85-3, Division of Beaches and Shores, Florida Department of Natural Resources, Tallahassee, FL.

Clark, R. R. 1986b. "Hurricane Kate, November 15-23, 1985," Post-Storm Report No. 86-1, Division of Beaches and Shores, Florida Department of Natural Resources, Tallahassee, EL.
Coastal Engineering Research Center. 1985. "Estimating Irregular Wave Runup Heights on Rough Slopes Computer Program: WAVRUNUP" CETN-1-37, US Army Engi- neer Waterways Experiment Station, Vicksburg, MS.
Cox, J. C., and Machemehl, J. 1986. "Overload Bore Propagation Due to an Overtopping Wave," Technical Note, Journal of Waterway, Port. Coastal and Ocean Engineering, Vol 112, No. 1, pp 161-163.
Cross, R. H., and Sollitt, C. K. 1971. "Wave Transmission by Overtopping," Technical Note 15, Department of Civil Engineering, Massachusetts Institute of Technology, Cambridge, MA.
Dai, Y. B., and Kamel, A. M. 1969. "Scale Effect Tests for Rubble-Mound Breakwaters," RR H-69-2, US Army Engineer Waterways Experiment Station, Vicks- burg, MS.
Delft University of Technology. 1976. Coastal, Vol 111, "Break- water Design," Delft, The Netherlands.
Delft University Press. 1984. The Closure of Tidal Basins. The Netherlands.
Department of Navy, Naval Facilities Engineering Command. 1971. "Soil Mechanics, Foundations, and Earth Structures," NAVFAC Design Manual DM-7, Washington, DC . Eckert, J., and Callender, G. 1987. "Geotechnical Engineering in the Coastal Zone," Instruction Report CERC-87-1, US Army Engineer Waterways Experiment Station, Vicksburg, MS.
Erchinger, H. F. 1976. "Wave Run-up in Field Measurements with New Developed Instrument," Coastal Engineering Conference, pp 767-780.
Escoffier, Francis. 1951. "Design and Performance of Sea Walls in Missis- sippi Sound," Proceedin~s of the 2nd Coastal engineer in^ Conference, pp 257- 267.
Federal Emergency Management Agency. 1981. "Floodplain Management, Ways of Estimating Wave Heights in Coastal High Hazard Areas in the Atlantic and Gulf Coast Regions," TD-3, Washington, DC.
Fuhrboter, A. 1986. "Model and Prototype Tests for Wave Impact and Runup on a Uniform 1:4 Slope," Coastal Engineering- Vol 10, Elsevier Science Publish- ers, Amsterdam, pp 49-84.
Fulton-Bennett, K. W., and Griggs, G. B. 1986. "Coastal Protection Struc- tures and Their Effectiveness," joint publication of California State Depart- ment of Boating and Waterways and Institute of Marine Sciences of the University of California at Santa Cruz, Santa Cruz, CA.
Galvln, C. J., Jr. 1972. "Wave Breaking in Shallow Water," Waves on Beaches, R. E. Meyer, Ed., Academic Press, New York, pp 413-456.
Goda, Y. 1969. "Reanalysis of Laboratory Data on Wave Transmission Over Breakwaters," Report of the Port and Harbour Research Institute, Ministry of Transport, Vol. 8, No. 3, Japan.

Goda, Y. 1970. "Estimation of the Rate of Irregular Wave Overtopping of Sea- walls," Report of the Port and Harbour Research Institute, Vol 9, No. 4, pp 3- 14 (in Japanese).
. 1971. "Expected Rate of Irregular Wave Overtopping of Seawalls," Coastal Engineering in Ja~an, Vol 14, pp 45-51.
. 1972. "Experiments on the Transition from Non-Breaking to Post- Breaking Wave Pressures," Coastal Engineering in Javan. Vol 15, pp 81-90.
. 1974. "New Wave Pressure Formulae for Composite Breakwaters," Proceedings of the 14th Coastal Engineering Conference, American Society of Civil Engineers, pp 1702-1720.
. 1983. "A Unified Nonlinearity Parameter of Water Waves," Report of the (Japanese) Port and Harbor Research Institute, Vol 22, No. 3, pp 3-30.
. 1985. Random Seas and Design of Maritime Structures, University of Tokyo Press, Tokyo.
Goda, Y., and Kishira, Y. 1976. "Experiments on Irregular Wave Overtopping Characteristics of Seawalls of Low Crest Types," Technical Note of Port and Harbour Research Institute, No. 242 (in Japanese).
Goda, Y., Kishira, Y., and Kamiyama, Y. 1975. "Laboratory Investigation on the Overtopping Rate of Seawalls by Irregular Waves," Report of the Port and Harbour Research Institute, Vol 14, No. 4, 1975, pp 3-44 (in Japanese).
Grace, P. J., and Carver, R. D. 1985. "Seawall and Revetment Stability Study, Cape Hatteras Lighthouse, North Carolina," Technical Report CERC-85-12, US Army Engineer Waterways Experiment Station, Vicksburg, MS.
Grantham, K. N. 1953. "Wave Runup on Sloping Structures," Transactions of the American Geophysical Union. Vol 34, No. 5.
Griggs, G. B., and Fulton-Bennett, K. W. 1988. "Rip-Rap Revetments and Sea- walls and Their Effectiveness Along the Central California Coast," Shore and Beach. the Journal of the American Shore and Beach Preservation Association, Vol 56, No. 2, pp 3-11.
Grune, J. 1982. "Wave Run-Up Caused by Natural Storm Surge Waves," Proceed- ings - of the 18th Coastal Engineering Conference, Cape Town.
Gunbak, A. R. 1976. "The Stability of Rubble-Mound Breakwaters in Relation to Wave Breaking and Run-Down Characteristics and to the < A tg a A T/& Num- ber," Ph.D. Thesis, University of Trondheim, The Norwegian Institute of Tech- nology, Division of Port and Harbour Engineering, Trondheim, Norway.
. 1979. "Rubble Mound Breakwaters," Norwegian Institute of Tech- nology, Report No. 1, Trondheim, Norway.
Hall, W. C. 1940. "A Model Study of the Effect of Submerged Breakwater on Wave Action," Technical Memorandum No. 1, Beach Erosion Board, Corps of Engi- neers, Washington, DC.
Hashimoto, H . 1974. "An Experimental Study of Irregular Wave Forces on a Coastal Dike," Coastal Engineering in Japan. Vol 17, pp 71-79.
Herbich, J. B., and KO, S. C. 1969. "Scour of Sand Beaches in Front of Sea- walls," Proceedings of 11th Coastal Engineering Conference. American Society of Civil Engineers, pp 622-643.

Herbich, J. B., Murphy, D., and Van Weele, B. 1965. "Scour on Flat Sand Beaches Due to Wave Action in Front of Seawalls," Proceedings of Coastal Enpi- -
neering Specialty Conference, American Society of Civil Engineers, Santa Bar- bara, CA, pp 705-727.
Herbich, J. B., Schiller, R. E., Jr., Watanabe, R. K., Dunlap, W. A. 1984. Seafloor Scour, Marcel Dekker Publishers, New York.
Hom-ma, M., and Horikawa, K. 1964. "Wave Forces Against Sea Wall," Proceed- i n ~ s of the 9th Coastal Engineering Conference, American Society of Civil Engineers, pp 490-503.
. 1965. "Experimental Study on Total Wave Force Against Sea Wall," Coastal Enpineering in Javan. Vol 8, pp 119-124.
Horikawa, K. 1978. "Coastal Engineering, an Introduction to Ocean Engineer- ing," University of Tokyo Press, Tokyo.
Hotta, S., and Marui, No 1976. "Local Scour and Current Around a Porous Breakwater," Chapter 93, Proceedings, 15th Coastal engineer in^ Conference. 11- 17 July 1976. American Society of Civil Engineers, Honolulu, HI, pp 1590-1604.
Hudson, R. Y., and Jackson, R. A. 1962. "Design of Riprap Cover Layers for Railroad Relocation Fills," Miscellaneous Paper 2-465, US Army Engineer Water- ways Experiment Station, Vicksburg, MS.
Hudson, R . Y., Jackson, R . A,, and Cuckler, R. E. 1957. "Wave Runup and Overtopping, Levee Sections, Lake Okeechobee, Florida," Technical Report No. 2-449, US Army Engineer Waterways Experiment Station, Vicksburg, MS.
Hunt, I. A. 1959. "Design of Seawalls and Breakwaters," Proceedings Journal of American Society of Civil Engineers, Vol 85, WW3, pp 123-152, New York.
Iribarren, C. R., and Nogales, C. 1949. "Protection des Ports, Section 11," Communication No. 4, XVIIth International Navization Con~ress, Lisbon, Portugal, pp 31-80.
Jachowski, R. A. 1964. "Interlocking Precast Concrete Block Seawall," Pro- ceedings. 9th Conference on Coastal Engineering, American Society of Civil Engineers, pp 504-517.
Jackson, R. A . 1968. "Limiting Heights of Breaking and Nonbreaking Waves on Rubble Mound Breakwaters," Technical Report H-68-3, US Army Engineer Waterways Experiment Station, Vicksburg, MS.
Jones, D. I?. 1975. "The Effect of Vertical Seawalls on Longshore Currents," Ph.D Thesis, Department of Coastal and Oceanographic Engineering, University of Florida, Gainesville, FL.
Kadib, A. L. 1963. "Beach Profile as Affected by Vertical Walls," Technical Memorandum No. 134, Beach Erosion Board, Corps of Engineers, Washington, DC.
Kamphuis, J . W., and Mohamed, N. 1978. "Run-Up of Irregular Waves on Plane Smooth Slope," Proceedin~s, American Societv of Civil En~ineers. Vol 104, No. WW2, pp 135-146.
Katayama, T., Irie, I., and Kawakami, T. 1974. "Performance of Offshore Breakwaters of the Niigata Coast," Coastal En~ineerin~ in Javan, Vol 17, pp 129-139.
Keller, J. B. 1961. "Tsunamis-Water Waves Produced by Earthquakes," Tsunami Hvdrodvnamics Conference. Honolulu, HI.
Keller, J. B., and Keller, H. B. 1965. "Water Wave Runup on a Beach," Part 11, Office of Naval Research, DDC, No. AD 623136, Washington, DC.
Kikkawa, H., Shi-igai, H., and Kono, T. 1968. "Fundamental Study of Wave- Overtopping on Levees," Coastal Engineering in Ja~an, Vol 11, pp 107-115.
Kirgoz, M. S. 1982. "Shock Pressure of Breaking Waves on Vertical Walls," Journal of Waterway. Port, Coastal. an.d Ocean Division. American Society of Civil Engineers, Vol 108, pp 81-95.
Kobayashi, N., and Jacobs, B. 1985. "Stability of Armor Units on Composite Slopes," Journal of Waterway. Port. Coastal and Ocean Engineering. American Society of Civil Engineers, Vol 111, No. 5, pp 880-894.
Koh, R. C. Y., and Le Mehaute, B. 1966. "Final Report; Volume 11: Wave Runup State of the Art," Report S-245B, National Engineering Science Company, Pasadena, CA.
Kraus, N. C. 1987. "The Effects of Seawalls on the Beach: A Literature Review," Proceedings. Coastal Sediments '87, American Society of Civil Engi- neers, 12-14 May 1987, New Orleans, LA.
. 1988. "The Effects of Seawalls on the Beach: An Extended Lit- erature Review, In: Journal of Coastal Research. N. C. Kraus and 0. H. Pilkey, Ed., The Effects of Seawalls on the Beach. Special issue No. 4, pp 1- 28.
Lamarre, P. 1967. "Water-Waves Transmission by Overtopping of an Impermeable Breakwater," M.S. Thesis, Department of Civil Engineering, Massachusetts Institute of Technology, Cambridge, MA.
Le Mehaute, B. 1963. "On Nonsaturated Breakers and the Wave Runup," Proceed- ings, 8th Conference on Coastal Engineerine, - American Society of Civil Engi- neers, pp 77-92.
Le Mehaute, B., Koh, R. C. Y., and Hwang, L. 1968. "A Synthesis of Wave Run-Up," Journal of Waterways and Harbour Division. Proceedings - of the Ameri- can Society of Civil Engineers, Vol 94, No. WW1, pp 77-92.
Losada, M. S., and Gimenez-Curto LA. 1981. "Flow Characteristics on Rough Permeable Slopes under Wave Action," Coastal Engineering. Vol 4, Elsevier Scientific.
McCartney, B. L., and Ahrens, J. P. 1975. "Stability of Gobi Block Revetment to Wave Attack," TM 55, US Army Corps of Engineers, Coastal Engineering Research Center, Fort Belvoir, VA.
Merritt, F. S., Ed. 1976. "Standard Handbook for Civil Engineers," 2nd Ed., McGraw-Hill, New York.
Miche, R. 1944. "Mouvements Ondulatories de la Mer en Profondeur Constante ou Decroissante," Annales des Ponts et Chaussees, 114e Annee.
. 1951. "Le Pouvoir Reflechissant des Ouvrages Maritimes Exposes a llAction de la Houle," Annales des Ponts et Chaussees, 121e Anne, pp 285-319.

Miller, R. L . , Leverette, S., OqSullivan, J., Tochbo, J., and Thereault, K. 1974. "Field Measurements of Impact Pressures in Surf," Proceedings 14th Con- ference on Coastal Engineering, - Vol 3, Copenhagen, Denmark, pp 1761-1777.
Minikin, R. R. 1963. "Winds, Waves, and Maritime Structures: Studies in Harbor Making and in the Protection of Coasta," 2nd rev. ed., Griffin, London.
Mitsuyasu, H. 1962. "Experimental Study on Wave Force Against a Wall," Coastal Engineering - in Ja~an, Vol 5, pp 23-47.
Moffatt and Nichol Engineers. 1983. "Construction Materials for Coastal Structures," Special Report No. 10, prepared for US Army Engineer Waterways Experiment Station, Coastal Engineering Research Center, Vicksburg, MS.
Munk, W. H., and Wimbush, M. 1969. "A Rule of Thunb for Wave Breaking," Oceanologv, Vol 9, pp 56-69.
Myers, R. M., Dunwoody, A. B., and Kirley, J. A. 1983. "Wave Interaction with Tarsiut Island," Proceedinps - of Offshore Technolorrv - - Societv, Houston, TX, pp 23-26.
Nagai, S. 1960. "Shock Pressures Exerted by Breaking Waves on Breakwaters," Journal of the Waterwavs and Harbors Division, American Society of Civil Engineers, Vol 86, No. WW2, pp 1-38.
. 1973. "Wave Forces on Structures," Advances in Hvdroscience, Vol 9, pp 253-324.
. 1976. "Wave Forces on Vertical-Wall Breakwaters in Deepwater," Port Eneineerinn. 2nd Ed., Per Brunn, Ed., Gulf Publishing Co., pp 554-561.
Nagai, S., and Takada, A. 1972. "Relations Between the Runup and Overtopping of Waves," Proceedings of the 13th Coastal En~ineerin~ Conference. pp 1975-1992.
Naval Civil Engineering Laboratory. 1978. "Treated Wood for Marine Use," Technical Data Sheet 78-50, Naval Construction Battalion Center, Port Hueneme, CA . Naval Facilities Engineering Command. 1981a. "Seawalls, Bulkheads and Quay- walls," NAVFAC DM 25.4, Washington, DC.
. 1981b. "General Criteria for Waterfront Construction," NAVFAC DM 25.6, Washington, DC.
1982a. "Foundations and Earth Structures," NAVFAC DM 7.2, Washington, DC.
. 1982b. "Selection, Procurement and Use of Preservative-Treated Wood Products," NAVFACINST 6250.4B1 Washington, DC.
Nussbaum, P. J., and Colley, B. E. 1971. "Dam Construction and Facing with Soil Cement," Bulletin RDOlO.OlW, Portland Cement Association, Skokie, IL.
Oertel, G. F., Fowler, J. E., and Pope, J. 1985. "History of Erosion Control Efforts at Tybee Island, Georgia," Miscellaneous Paper CERC-85-1, US Army Engineer Waterways Experiment Station, Vicksburg, MS.
OtShaughnessy, M. M. 1924. "Ocean Beach Esplanade, San Francisco, Califor- nia," Transactions of the American Society of Civil Engineers, Vol 87, No. 1539, American Society of Civil Engineers, New York.

Owen, M. W. 1980. "Design of Seawalls Allowing for Wave Overtopping," Report No. Ex 924, Hydraulics Research Station, Wallingford, England.
. 1982a. "The Hydraulic Design of Sea-Wall Profiles," Proceedin~s. -
Conference on Shoreline Protection. ICE, Southampton.
. 1982b. "Overtopping of Sea Defences," International Conference on Hydraulic Modelling of Civil Engineering Structures, Pa~er H3. Sevtem- ber 22-24, Coventry, England.
Pappe, A. 1960. "Experimental Data on the Overtopping of Seawalls by Waves," Proceedings, 7th Conference Coastal Engineers, - The Hague, Vol 2, pp 674-681.
Partenscky, H. W. 1988. "Dynamic Forces Due to Waves Breaking at Vertical Coastal Structures," Proceedings of 21st Coastal Enpineering - Conference. Val 3, pp 2504-2518, American Society of Civil Engineers, New York.
Peck, R. B., Hanson, W. E., and Thornburn, T. H. 1974. "Foundation Engineer- ing," 2nd Ed., John Wiley & Sons, Inc., New York.
Pilarczyk, K. W. 1987. "Dutch Guidelines on Dike Protection," Rijkswaterstaat, Dutch Ministry of Transport and Public Works, Road and Hydraulic Engineering Department, The Netherlands.
Portland Cement Association. 1979. "Design and Control of Concrete Mix- tures," Pamphlet No. EB001.12T, 12th Ed., PCA, Skokie, IL.
Raichlen, F., and Hammack, J. L., Jr. 1974. "Runup Due to Breaking and Non- breaking Waves," Proceedinps of the 14th Coastal Engineering Conference, Amer- ican Society of Civil Engineers, New York, pp 1937-1955.
Richart, F. E., and Schmertmann, J. H. 1958. "The Effect of Seepage on the Stability of Seawalls," Proceedings - of the Sixth Conference on Coastal Engi- neering. - American Society of Civil Engineers, New York, pp 105-128.
Rowe, P. W. 1952. "Anchored Sheet-Pile Walls," Proceedings of the Institute of Civil Engineers, Part I, Vol I, London. Rundgren, L. 1958. "Water Wave Forces," Bulletin No. 54, Royal Institute of Technology, Division of Hydraulics, Stockholm, Sweden.
Rundgren, L. 1958. "Water Wave Forces," Bulletin No. 54, Royal Institute of Technology, Division of Hydraulics, Stockholm, Sweden.
Russell, R. C. H., and Inglis, C. 1953. "The Influence of a Vertical Wall on a Beach in Front of It," Proceedings of the Minnesota International Hydraulics Convention. American Society of Civil Engineers, pp 221-226.
Sato, S., and Kishi, T. "Experimental Study of Wave Runup on Sea Wall and Shore Slope," Coastal Enpineering in Japan, Vol 1, 1958.
Sato, S., Tanaka, N., and Irie, I. 1969. "Study on Scouring at the Foot of Coastal Structures," Proceedings - of 11th Coastal Engineering - - Conference, Amer- ican Society of Civil Engineers, pp 579-598.
Savage, R. P. 1957. "Model Tests of Wave Runup for Hurricane Protection Project," Bulletin, Vol 11, No. 1, US Army Corps of Engineers, Beach Erosion Board, Washington, DC.
. 1958. "Wave Run-Up on Roughened and Permeable Slopes," Journal of the Waterways and Harbours Division, Proceedin~s of American Society of Civil Engineers. No. WW3.

Saville, T., Jr. 1955. "Laboratory Data on Wave Runup and Overtopping on Shore Structures," TM-64, US Army Corps of Engineers, Beach Erosion Board, Washington, DC .
. 1956. "Wave Runup on Shore Structures," Journal of the Waterways and Harbors Division. American Society of Civil Engineers, Vol 82, No. WW2.
. 1958, "Wave Runup on Composite Slopes," Proceedin~s - of the Sixth Conference on Coastal Envineering. Council on Wave Research, pp 691-699.
. 1962. "An Approximation of the Wave Runup Frequency Distribu- tion," Proceedings - of the Eivhth - Conference on Coastal Engineering, - - pp 48-59.
1987. "Early Large-Scale Experiments on Wave Runup," Shore and Beach Mavazine. - Vol 55, No. 3-4, pp 101-108.
Sawaragi, T. 1967. "Scouring Due to Wave Action at the Toe of Permeable Coastal Strucure," Proceedings - of 10th Coastal Engineering - Conference, American Society of Civil Engineers, pp 1036-1047.
Sawaragi, T., Iwata, K., and Kobayashi, M. 1982. "Condition and Probability of Occurrence of Resonance on Steep Slopes of Coastal Structures," Coastal Engineering - in Japan, Vol 25.
Sawaragi, T., and Kawasaki, Y. 1960. "Experimental Study on Behaviors of Scouring at the Toe of Seadikes by Waves," Proceedings of 4th Ja~anese Coastal Enaineeriny Conference, Japan Society of Civil Engineers, pp 1-12 (in Japa- nese; figure and table captions in English).
Seelig, W. N. 1980. "Two-Dimensional Tests of Wave Transmission and Reflec- tion Characteristics of Laboratory Breakwaters," Technical Report 80-1, US Army Coastal Engineering Research Center, Fort Belvoir, VA.
Shore Protection Manual. 1984. 4th ed., 2 Vols, US Army Engineer Waterways Experiment Station, Coastal Engineering Research Center, US Government Print- ing Office, Washington, DC,
Sibul, 0. S., and Tickner, E. G. 1956. "Model Study of Overtopping of Wind- Generated Waves on Levees with Slopes of 1:3 and 1:6," Beach Erosion Board, Technical Memorandum No. 80.
Smith, A. W., and Chapman, B . M. 1982. "The Behavior of Prototype Boulder Revetment Walls," Proceedings - of 18th Coastal Engineering - Conference, Cape Town South Africa, American Society of Civil Engineers, New York.
Song, W. O., and Schiller, R. E., Jr. 1977. "Experimental Studies of Beach Scour Due to Wave Action," Proceedinns of Hydraulics in the Coastal Zone, American Society of Civil Engineers, pp 328-335.
Sowers, G. B., and Sowers, G. F. 1970. Introducing Soil Mechanics and Foun- dations. Third Ed., Macmillian Publishing Co., New York.
. 1971. "Evaluation of Bulkhead and Excavation Bracing Failures," of the National Environmental Engineering - meet in^, American
Society of Civil Engineers, New York.
Spangler, M . G., and Handy, R. L. 1982. Fourth Ed., Harper and Row, Mew York.
Stoa, P. N. 1978a. "Reanalysis of Wave Runup on Structures and Beaches," Technical Paper No. 78-2, US Army Corps of Engineers, Coastal Engineering Research Center, Washington, DC.
. 1978b. "Revised Wave Run-Up Curves for Smooth Slopes," CERC, CETA 78-2, Fort Belvoir, VA.
. 1979. "Wave Run-Up on Rough Slopes," CERC CETA 79-1, Fort Bel- voir, VA.
Streeter, V. L., and Wylie, W. 1979. "Fluid Mechanics," 7th Ed., McGraw Hill Co., New York.
Takada, A. 1974. "Estimation of Wave Overtopping Quantity Over Sea-Walls," Proceedings. 14th Coastal Engineering Conference, American Society of Civil Engineers, New York, pp 1996-2014.
Takezawa, M. 1979. "Experimental Study of Wave Forces on a Vertical Wall," Proceedings Coastal Structures '79. American Society of Civil Engineers, Vol 1, pp 48-66.
Tautenhaim, E., Kohlase, S., and Partenscky, H. W. 1982. "Wave Run-Up at Sea Dikes Under Oblique Wave Approach," Proceedings, 18th Coastal Engineering - Con- ference, Cape Town.
Technical Advisory Committee on Protection Against Inundation. 1974. "Wave- Run-Up and Overtopping," Government Publishing Office, The Hague.
Terzaghi, K. 1954. "Anchored Bulkheads," Transactions of the American Soci- ety of Civil Engineers, Vol 119, pp 1243-1324, New York.
Terzaghi, K., and Peck, R. B. 1967. Soil Mechanics in Engineering Practice, Second Ed., John Wiley and Sons, New York.
Thorn, R. B., and Roberts, A. G. 1981. Sea Defence and Coast Protection Works. 3rd ed., Thomas Telford LTD, Great Britain.
Toyoshima, O., Shuto, N., Hashimoto, H. 1966. "Wave Runup on Coastal Structures," Coastal En~ineering in Japan, Vol 9, pp 119-126, Tokyo, Japan
Tsuruta, S., and Goda, Y. 1968. "Expected Overtopping Discharge of Irregular Waves Over Sea Wall," Proceedings, 11th Conference on Coastal En~ineering, London, Vol 11, pp 833-852.
US Army Corps of Engineers. 1974. "Evaluation and Development of Water Wave Theories for Engineering Application," Special Report No. 1, Vols I and 11, US Government Printing Office, Washington, DC.
. 1977. Shore Protection Manual. Vols 1-3, Government Printing Office, Washington, DC.
. 1978. "Design and Construction of Levees," Engineer Man- ual 1110-2-1913, Washington, DC.
. 1981. "Low Cost Shore Protection: Final Report of the Shoreline Erosion Control Demonstration Program (Section 54)," Washington, DC.
. 1983. "Retaining Walls," Engineer Manual 1110-2-2502, Washing- ton, DC.
. 1985. "Design of Coastal Revetments, Seawalls, and Bulkheads," Engineer Manual 1110-2-1614," Washington, DC.

US Army Engineer District, Galveston. 1981. "Galveston's Bulwark Against the Sea: History of the Galveston Seawall," Galveston, TX.
US Army Engineer District, Norfolk. 1970. "Beach Erosion Control and Hurri- cane Protection: Appendicies," General Design Memorandum, Norfolk, VA.
US Steel Corporation. 1975. "Steel Sheet Piling Design Manual," United States Steel Corporation, Pittsburgh, PA.
Van Dorn, W. G. 1966. "Runup Recipe for Periodic Waves on Uniformly Sloping Beaches," Proceedin~s of the 10th Coastal engineer in^ - Conference, pp 349-363.
Vanoni, V. A., and Raichlen, F. 1966. "Laboratory Design Studies of the Effect of Waves on a Proposed Island Site for a Combined Nuclear Power and Desalting Plant," Report No. KH-R-14, California Institute of Technology, Pasadena, CA.
Van Oorschot, J. H., and dlAngremond, K. 1968. "The Effect of Wave Energy Spectra on Wave Run-Up," _Proceedings. llth Coastal English Conference, London.
Wallace, N. R. 1964. "Deformation of Solitary Waves, Part 11: Shoaling," Report No. URS 631-2.
Walton, T. L., and Sensabaugh, W. 1979. "Seawall Design on the Open Coast," Sea Grant Report No. 29, University of Florida, Gainesville, FL.
Webber, N. B., and Bullock, G. N. 1968. "A Model Study of the Distribution of Run-Up of Wind-Generated Waves on Sloping Sea Walls," Proceedings. 11th Coastal Engineering - Conference. London.
-- . 1970. "Run-Up of Waves on Sloping Faces, a Review of the Present State of Knowledge," Proceedings of Conference of Societv of Earthquake and Civil Engineering Dvnamics, Swansea.
Weggel, J. R. 1976. "Wave Overtopping Equation," Chapter 157, Proceedings. 15th Coastal engineer in^ Conference, American Society of Civil Engineers.
. 1981. "Wave Loading on Vertical Sheet-Pile Groins and Jetties," CERC Report CETA 81-1, Coastal Engineering Research Center, Fort Belvoir, VA.
TJhalin, R. W. 1971. "Run-Up, Set-Up, and Stability of Intermediate Period Water Waves at Monterey, California," In Dynamic Waves in Civil Engineering, Wiley-Interscience, New York,
White, F. M. 1979. Fluid Mechanics. McGraw Hill Publishing Co., New York, pp 280-283.
Winterkorn, M. F . , and Fang, H. Y. 1975. Foundation Engineerinn Handbook. Van Nostrand Reinhold Publishers, New York.
Xie, S-L. 1985. "Scouring Patterns in Front of Vertical Breakwaters," 4 1 Oceanoligica Sinica, Vol 4, No. 1, pp 153-164.
Zanen, A. 1978. Revetments, International Institute for Hydraulic. and Envi- ronmental Engineering, Delft, The Netherlands.

BIBLIOGRAPHY
Battjes, J. A. 1971. "Run-Up Distributions of Waves Breaking on Slopes," Journal. Waterways, Harbour. and Coastal Engineering - - Division. Proceedings, American Society of Civil Engineers, - No. WW1.
Bishop, C. T., Judge, J. T., and Skafel, M. G. 1985. "Modeling Wave Over- topping of a Caisson Island," Proceedings, Canadian Coastal Conference, National Research Council, Canada.
Bucci, R., and Whalin, R. W. 1969. "Runup Characteristics of Explosion- Generated Waves in Major Harbor Areas. Report 1: Wave Intrusion into Monte- rey Harbor, California," Technical Report N-69-4, US Army Engineer Waterways Experiment Station, Vicksburg, MS.
Bullock, G. N. 1968. "A Study of the Run-Up of Irregular Waves on Uniform Slopes," Ph.D. Thesis, Southampton University.
Chan, E. S., and Melville, W. K. 1984. "Deepwater Breaking Wave Forces on Surface Piercing Structures," Oceans '84, Marine Technology Society, pp 565-570.
Dean, R. G. 1974. "Evaluation and Development of Waterwave Theories for Engineering Application," Vols I and 11, Special Report No. 1, US Army Coastal Engineering Research Center, Fort Belvoir, VA.
Douglass, S. L. 1986. "Review and Comparison of Methods for Estimating Irregular Wave Overtopping Rates," Technical Report CERC-86-12, US Army Engi- neer Waterways Experiment Station, Vicksburg, MS.
Fukuda, N., Uno, T., and Irie, I. 1973. "Field Measurements of Wave Over- topping of Seawalls (2nd Report)," Proceedings. 20th Javanese Conference Coastal Engineering, - pp 113-118 (in Japanese).
Gadd, P. E., Machemehl, J. L., and Manikian, V. 1985. "Comparison of Wave Overtopping Prediction to Measurements from Large Scale Model Tests," Proceed- ings - Artic 85, San Francisco, CA.
Gadd, P. E., Potter, R. E., Safaie, B., and Resio, D. 1984. "Wave Run-up and Overtopping: A Review and Recommendations," in Proceedings, - 16th Annual Off- shore Technology Conference. Houston. TX, Paper No. 4674, pp 239-248.
Hanson, S. A. 1982. "Forces Caused by Non-Breaking Waves Striking a Smooth, Vertical Wall at Small Angles of Incidence," Masters Thesis, University of Wisconsin, Madison, WI.
Hattori, M., and Kawamata, K. 1977. "Experiments of Restoration of Beaches Backed by Seawalls," Coastal Engineering in Japan, Vol 17, pp 129-139.
Hensen, W., and Fuhrboter, A. 1962. "Model Tests of Wave Runup on Elbe River Dykes at Finkenwerder," Transactions of the Franzius Institute for Foundation and Hydraulic Ennineering - - of the University of Hannover, Germany, No. 21.
Herbich, J. B., Sorensen, R. M., and Willenbrock, J. H. 1963. "Effect of Berm on Wave Runup on Composite Beaches," Journal of the Waterways and Harbors Division, Vol 89, No. WW2.
Hosoi, M., and Shuto, N. 1964. "Run-Up Height on a Single Slope Dike due to Waves Coming Obliquely," Coastal Engineering - in Japan, Vol 7.
Inoue, M., and Shimada, H. 1982. "Effect of Coastal Configuration on the Quantity of Wave Overtopping," Technical Report No. 23, Kansai University.
Iribarren Cavanilles, R., and Nogales y Olano, C. 1950. "The Critical Slope Between Incipient Breaking and Reflecting of Waves," Translation No. 50-2, US Army Engineer Waterways Experiment Station; from "Talud Limite Entre la Rotura Y la Reflexion de las Olas," Revista de Obras Rubpicas. 1950 (Feb). Madrid.
Irie, I., and Nadaoka, K. 1985. "Laboratory Reproduction of Seabed Scour in Front of Breakwaters," American Society of Civil Engineers, pp 1715-1731.
Isaacson, E. 1950. "Water Waves on a Sloping Bottom," Communication of Pure and Applied Math, Vol 3.
Ishihara, T., Iwagaki, Y., and Mitsui, H. 1960. "Wave Overtopping on Sea- walls," Coastal Engineering in Japan, No. 3, pp 53-62.
Iwagaki, Y., Inoue, M., and Ohori, K. 1966. "Experimental Study on the Mech- anism of Wave Runup on Sloping Structures," Proceedings of the 13th Conference on Coastal Engineering in Japan, pp 198-205.
Iwagaki, Y., Shima, A., and Inoue, M. 1965. "Effects of Wave Height and Sea Water Level on Wave Overtopping and Wave Run-up," Coastal Engineering in Japan, No. 8, pp 141-151.
Iwagaki, Y., Tsuchiya, Y., and Inoue, M. 1966. "On the Effect of Wind on Wave Overtopping on Vertical Seawalls," Bulletin, Dis. Prev. Research Insti- tute, Kyoto University, 16, No. 104, Part 1, pp 11-30.
Jensen, 0. J., and Sorenson, T. 1979. "Overspilling/Ove~topping of Rubble- mound Breakwaters: Results of Studies Useful in Design Procedures," Coastal Engineering, Vol 3, pp 51-65, The Netherlands.
Kato, J. 1959. "Shapes of Shore Structures (Dikes) and Its Damping Effect for Wave Forces--Especially for Wave Runup and Wave Pressure," Coastal Engi- neering in Japan, Vol 2 , pp 73-84.
Kato, J., and Shiraishi, H. 1959. "Wave Runup on Dike," Journal of the A~ri- cultural engineer in^ Society, Japan, Vol 27, No. 4, pp 186-189.
Kato, J., and Uekita, Y. 1969. "On the Wave Damping Effect of" Block Mound Breakwater," Transactions of the Japanese Society of Civil Engineers. Vol 1.
Kramer, J. 1971 (Nov). "Design Criteria for North Sea Dikes," Journal of the Waterways, Harbors and Coastal Engineering Division. Vol 97, No. WW4, pp 703-719.
Longuet-Higgins, M. S., and Stewart, R. W. 1964. "Radiation Stresses in Water Waves: A Physical Discussion with Applications," Deep Sea Research, Vol 11, pp 529-562.
Machemehl, J. L., and Herbich, J. B. 1971. "Wave Runup on Composite Beaches--Effect of Roughness," Offshore Technologv Conference. Paper 1431, pp 179-190.
Merkens, P. W. 1964. "Overtopping of Wind Waves at a Sea Wall as Affected by Water Depth," Shore and Beach Magazine, Vol 32, No. 1.

Miller, R. L. 1968. "Experimental Determination of Run-Up of Undular and Fully Developed Bores," Journal of Geovhvsical Research. Vol 73, No. 14, pp 4497-4510.
Muraki, Y. 1966. "Field Observations of Wave Pressure, Wave Runup and Oscil- lation of Breakwater," Proceedings of the 10th Conference on Coastal Enpineer- inn, pp 302-321. Nakamura, M., Onishi, R., and Sasaki, Y. 1973. "Wave Runup on Composite Slopes," Bulletin of the National Research Institute of Agricultural Engineer- ing, No. 11, Japan.
Saville, T., Jr., and Caldwell, J. M. 1953. "Experimental Study of Wave Overtopping on Shore Structures," Proceedings of the Minnesota International Hydraulics Convention. Minneapolis, MN, pp 261-269.
Saville, T., Jr., McClendon, E. W., and Cochran, A. L. 1962. "Freeboard Allowances for Waves in Inland Reservoirs," Journal of the Waterwavs and Har- bors Division. Vol 88, No. WW2, pp 93-124.
Selezov, I. T., and Zheleznyak, M. I. 1985. "Scour of Sea Bottom in Front of Harbor Seawalls," Proceedings - of 21st International Association for Hydraulic Research Congress, pp 63-67.
Shi-igai, H., and Kono, T. 1970. "Analytical Approach on Wave Overtopping on - - - Levees," Proceedings, - 12th Conference Coastal Engineers. Washington. DC. Vol I, pp 563-573.
Shinohara, K. 1958. "Studies on the Characteristics of Breakers and Wave Runup on Smooth and Artificially Roughened Slopes," Report of the Research Institute for Applied Mechanics, No. 11, Kyushu University, Japan, pp 31-50.
Shiraishi, N., Numata, A., and Endo, T. 1968. "On the Effect of Armour Block Facing on the Quantity of Wave Overtopping," Proceedings, 11th Conference of Coastal Ennineering, London, Vol 11, pp 853-869.
Sibul, 0. 1955. "Flow Over Reefs and Structures by Wave Action," Transaction of American Geophysical Union, Vol 36, No. 1, pp 61-71.
Sorensen, R. M., and Willenbrock, J. H. 1962. "A Study of the Effect of Hor- izontal Berm Variation on Wave Runup Upon a Composite Beach Slope," Project Report No. 35, Lehigh University, Fritz Laboratory, Bethlehem, PA.
Stevenson, T. 1983. "Wave Run-Up on Shingle Beaches," Hvdraulics Research. Report IT 245, Wallingford.
Takada, A. 1976. "Wind Effect on Regular Wave Overtopping," Proceedings, 23rd Japanese Conference on Coastal Engineering. pp 170-175 (in Japanese).
Talian, S. F., and Vesilind, P. A. 1963. "A Study of the Effect of Horizon- tal Berm Variation on Wave Runup Upon a Composite Beach Slope with Depth of Water Equal to Berm Height," Project No. 35 (Supplement), Lehigh University, Fritz Engineering Laboratory, Bethlehem, PA.
Thompson, D. M. 1973. "Hydraulic Design of Sea Dikes," Report No. DE6, Hydraulics Research Station, Wallingford, UK.
Tominaga, Y., Hashimoto, H., and Sakuma, N. 1966. "Wave Run-Up and Overtop- ping on Coastal Dikes," Proceedinns. - 10th Conference on Coastal Engineering. Tokyo, Vol I, pp 364-381.
US Army Corps of Engineers. 1977. "Civil Works Construction, Guide Specifi- cation, Plastic Filler Fabric," No. CW-02215, Washington, DC.
. 1971. "Earth and Rock-Filled Dams," Engineer Manual 1110-2-2300, Washington, DC . Van der Meer, J. W., and Pilarczyk, K. W. 1984. "Stability of Rubble Mound Slopes Under Random Wave Attack," International Coastal Engineering Con- ference, American Society of Civil Engineers, Houston, TX, pp 2620-2634.
Wassing, F. 1957. "Model Investigations of Wave Run-Up on Dikes Carried out in the Netherlands in the Last 20 Years," Proceedings. 6th Coastal Engineerin& -
Conference. Florida.

APPENDIX A: MAXIMUM PERIODIC WAVE RUNUP ON SMOOTH SLOPES
1. A robust approach to data presentation is given here for the case of
short monochromatic waves on smooth surface sloping structures with an intent
to unify various existing theories and approaches for wave runup and to pro-
vide a reasonable means to calculate an upper limit of runup. The reanalysis
of periodic wave runup data provided here shows the raw data points in a new
format. An additional variant in the present reanalysis of runup data is to
provide wave runup in terms of wave height at the structure toe depth as
opposed to using the deepwater wave height. The advantage of using trans-
formed wave height rather than deepwater wave height is that wave height
transformation uncertainty from deep water to the structure site becomes a
separate problem, uncoupled from the problem of runup on the structure caused
by a given wave condition at the toe of the structure. Although it is recog-
nized that the type (shape) of wave existing at the site is important to the
ultimate problem (i.e., the transformation prior to the structure and the
ultimate runup are not entirely uncoupled), the presentation of data in terms
of wave conditions at the base of the slope should be of benefit in dealing
with various types of nearshore bathymetry. Since wave period is considered
invariant throughout the transformation process, deepwater wavelength is still
used in the analysis.
2. The data sources for this runup reanalysis are from earlier tests at
the Coastal Engineering Research Center (CERC) on smooth slope runup. These
data are discussed in length by Saville (1956)* and Savage (1958). For pur-
poses of clarification, a short discussion of this data set follows. Further
information on these tests can be found in Saville (1956) and Savage (1958).
3. The test procedure involved placing a smooth surface plywood test
slope in the end of the wave tank and propagating periodic waves of known
characteristics toward the slope. The waves in each test were measured after
the initial unsteady wave transients died down but prior to rereflection of
waves from the wave generator. An average of 6 to 15 waves were visually mea-
sured by reading the runup on a scale marked on the face of the slope to the
nearest hundredth of a foot in vertical elevation. In all the data presented
in this paper, the water depth was constant (= 0.38 m). Saville (1956) noted
* See References at the end of the main text.
A1
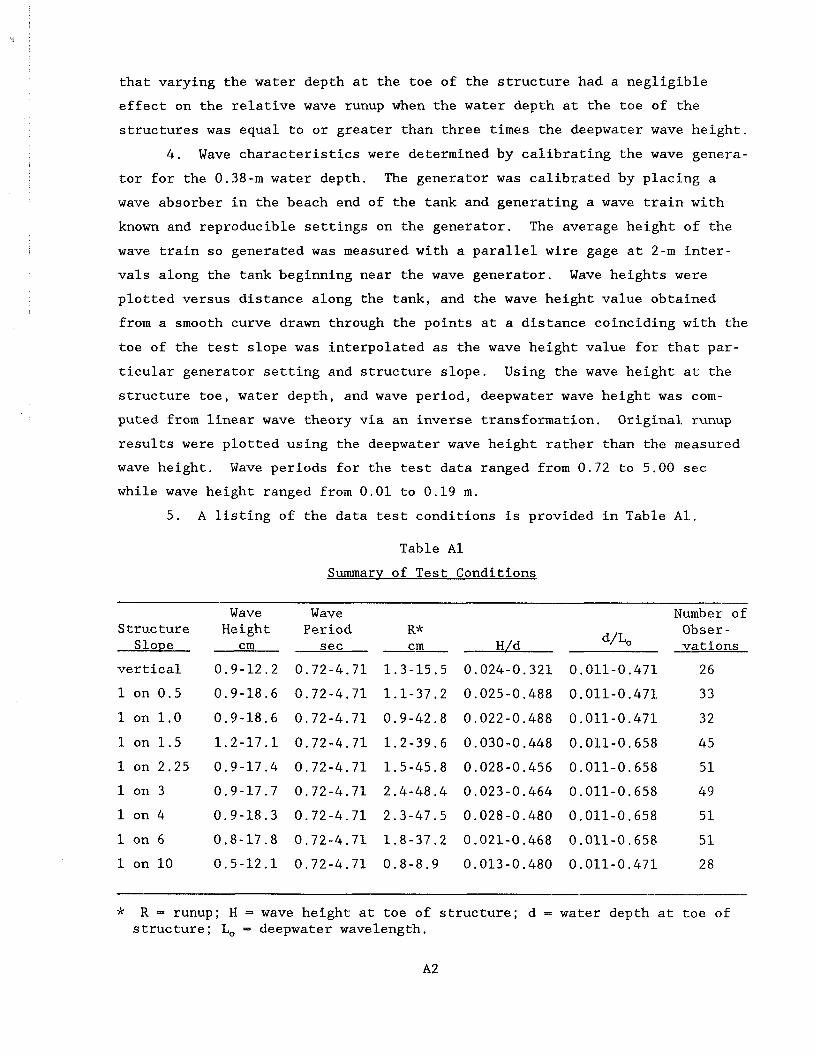
that varying the water depth at the toe of the structure had a negligible
effect on the relative wave runup when the water depth at the toe of the
structures was equal to or greater than three times the deepwater wave height.
4. Wave characteristics were determined by calibrating the wave genera-
tor for the 0.38-m water depth. The generator was calibrated by placing a
wave absorber in the beach end of the tank and generating a wave train with
known and reproducible settings on the generator. The average height of the
wave train so generated was measured with a parallel wire gage at 2-m inter-
vals along the tank beginning near the wave generator. Wave heights were
plotted versus distance along the tank, and the wave height value obtained
from a smooth curve drawn through the points at a distance coinciding with the
toe of the test slope was interpolated as the wave height value for that par-
ticular generator setting and structure slope. Using the wave height at the
structure toe, water depth, and wave period, deepwater wave height was com-
puted from linear wave theory via an inverse transformation. Original runup
results were plotted using the deepwater wave height rather than the measured
wave height. Wave periods for the test data ranged from 0.72 to 5.00 sec
while wave height ranged from 0.01 to 0.19 m.
5. A listing of the data test conditions is provided in Table Al.
Table A1
Summary of Test Conditions
Wave Wave Number of Structure Height Period R* Obser - Slope cm sec cm H/d d/Lo vat ions
vertical 0.9-12.2 0.72-4.71 1.3-15.5 0.024-0.321 0.011-0.471 2 6
* R = runup; H = wave height at toe of structure; d = water depth at toe of structure; Lo = deepwater wavelength.
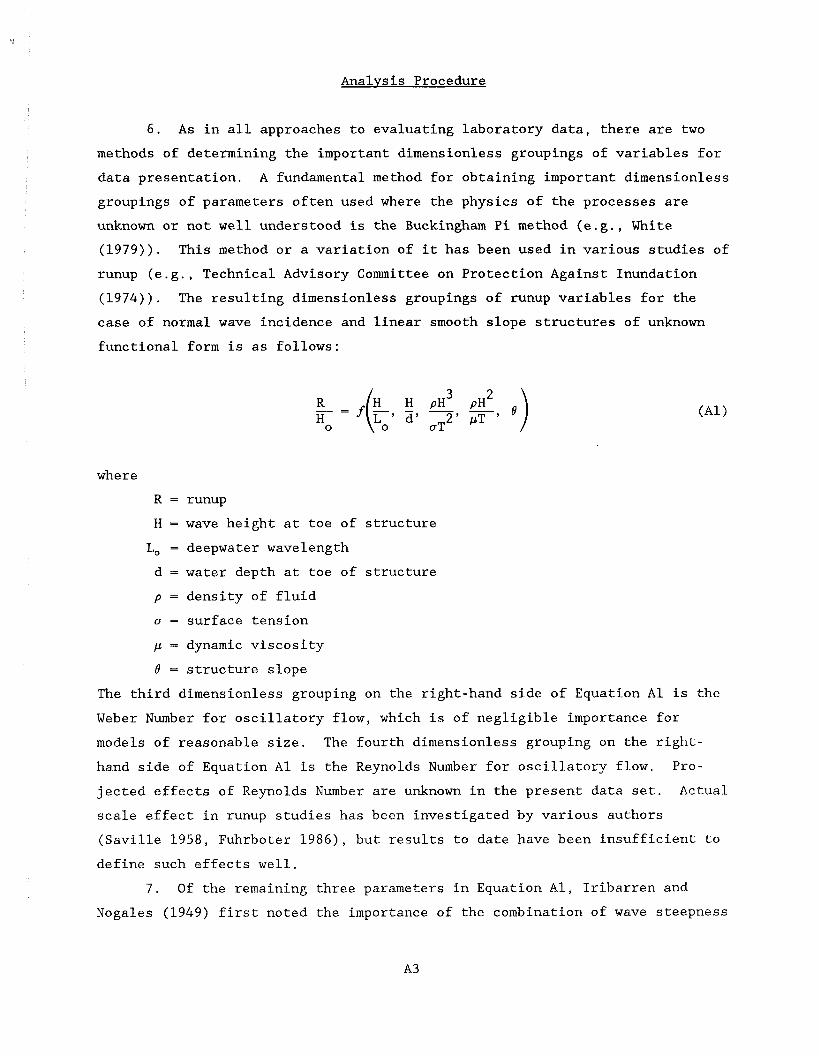
Analysis Procedure
6. As in all approaches to evaluating laboratory data, there are two
methods of determining the important dimensionless groupings of variables for
data presentation. A fundamental method for obtaining important dimensionless
groupings of parameters often used where the physics of the processes are
unknown or not well understood is the Buckingham Pi method (e.g., White
(1979)). This method or a variation of it has been used in various studies of
runup (e.g., Technical Advisory Committee on Protection Against Inundation
(1974)). The resulting dimensionless groupings of runup variables for the
case of normal wave incidence and linear smooth slope structures of unknown
functional form is as follows:
where
R = runup
H = wave height at toe of structure
L, = deepwater wavelength
d = water depth at toe of structure
p = density of fluid
o = surface tension
p = dynamic viscosity
6 = structure slope
The third dimensionless grouping on the right-hand side of Equation A1 is the
Weber Number for oscillatory flow, which is of negligible importance for
models of reasonable size. The fourth dimensionless grouping on the right-
hand side of Equation A1 is the Reynolds Number for oscillatory flow. Pro-
jected effects of Reynolds Number are unknown in the present data set. Actual
scale effect in runup studies has been investigated by various authors
(Saville 1958, Fuhrboter 1986), but results to date have been insufficient to
define such effects well.
7. Of the remaining three parameters in Equation Al, Iribarren and
Nogales (1949) first noted the importance of the combination of wave steepness

(H/Lo) and structure slope (6) in one parameter, the Iribarren number
tan(6 )/(H/Lo) 'I2 . Various researchers (Calvin 1972, Battjes 1974b, Hunt
1959) have noted the importance of this parameter in both the breaking process
and resulting runup on beaches. For mild slope structures, Hunt (1959) recog-
nized that the relative runup was proportional to the Iribarren number under
breaking wave conditions. Battjes (1974b) provides a physical explanation for
the relationship between runup and the Iribarren number for the case of mild
slope structures. A limitation to this equation can be seen for the case of
steep slope structures where the Iribarren number approaches infinity. As it
is desired to provide a unified approach for wave runup on both steep and mild
slope structures, a sin(8) term was used in place of the tan(8) of the
Iribarren number; hence this modified dimensionless grouping will be referred
to as the modified Iribarren number. It should be noted that a slight refine-
ment of Battjes' (1974b) arguments (i.e., considering wavelength defined along
the slope rather than in the horizontal plane) will lead to the sin(8) term
used here. This modification of the Iribarren number is consistent with vari-
ous criteria for delineation of the zone between breaking and nonbreaking.
For example, Munk and Wimbush (1969) provide an expression based on linear
wave theory for breaking on a slope in which the downslope component of the
particle acceleration cannot exceed g sin(6) . As Battjes (1974b) noted,
with proper accounting of the reflected wave height, the Munk and Wimbush
(1969) criteria can be written as:
where the subscript c refers to incipient breaking. Miche (1951) using lin-
ear waver theory also derived a kinematic criterion for the limiting condi-
tions of nonbreaking on a plane slope extending to deep water. His criterion
is given by:
= [.in:( 8 I] (g)'l2 for 8 5 - ?T 4
C

This expression can be reformulated as:
where K, is the linear shoaling coefficient if one assumes the expression
good for all depths. Keller. (1961) finds a similar expression for limiting
conditions for nonbreaking where:
Equation A5 can be rewritten as:
Keller's expression is based on a nonlinear shallow-water theory and therefore
might be considered more valid than the expression of Miche. For small slopes
0 = sin(0) ; hence Keller's criterion, Equation A6, is within a constant of
Miche's expression, Equation A4. For large slopes (i.e., limiting case
0 = ~ / 2 ) , the factor sin(0) differs from 0 by 50 percent.
8. An additional dimensionless grouping d/L, can be formed by divid-
ing the first right-hand side parameter grouping by the second parameter
grouping. This grouping of parameters has the advantage of delineating the
relative water depth in which the structure is situated. An important param-
eter for free surface flows not explicitly mentioned is the Froude number,
which for oscillatory flows in deep water can be represented as the multipli-
cation of the first two right-hand side groupings in Equation Al.
9. A second method of obtaining dimensionless variable groupings of
importance is by casting the physical equations into dimensionless form. The
basic equations of fluid dynamics would point out the importance of the
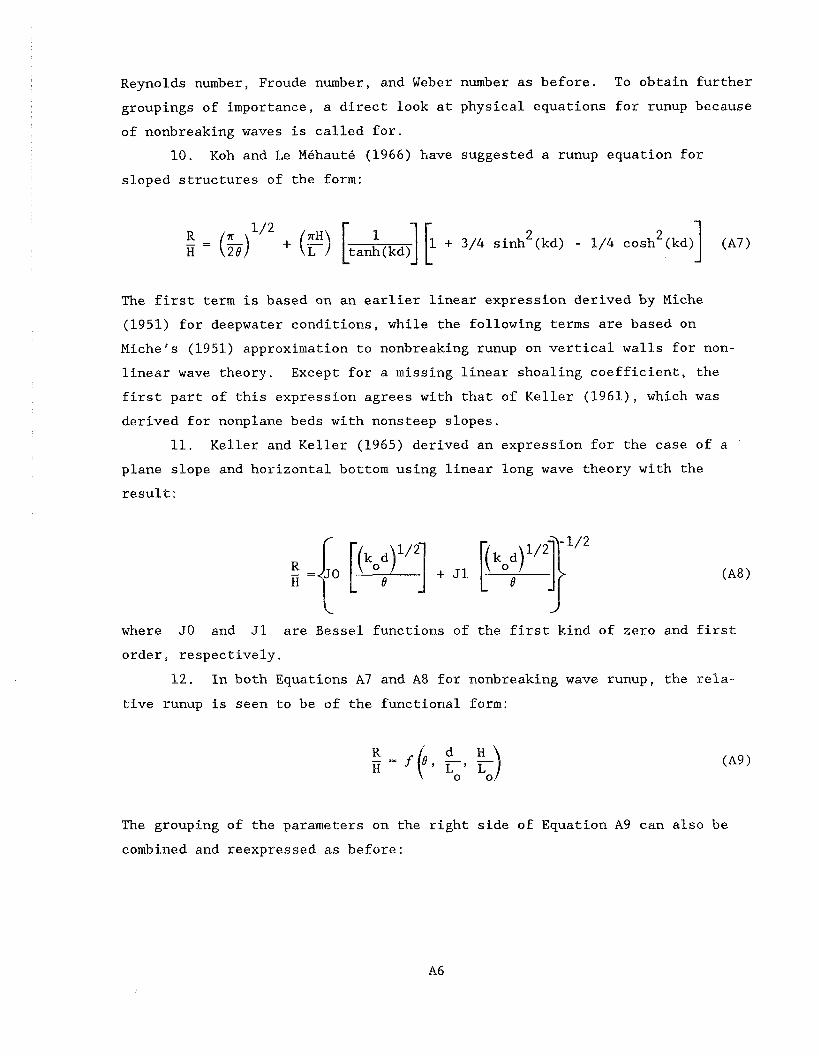
Reynolds number, Froude number, and Weber number as before. To obtain further
groupings of importance, a direct look at physical equations for runup because
of nonbreaking waves is called for.
10. Koh and Le Mehaute (1966) have suggested a runup equation for
sloped structures of the form:
1/2 2 2
= ( ) + (F) [tan:(kd)] [' + 3 / 4 sinh (id) - 1/4cosh H
The first term is based on an earlier linear expression derived by Niche
(1951) for deepwater conditions, while the following terms are based on
Miche's (1951) approximation to nonbreaking runup on vertical walls for non-
linear wave theory. Except for a missing linear shoaling coefficient, the
first part of this expression agrees with that of Keller (1961), which was
derived for nonplane beds with nonsteep slopes.
11. Keller and Keller (1965) derived an expression for the case of a
plane slope and horizontal bottom using linear long wave theory with the
result:
where JO and J1 are Bessel functions of the first kind of zero and first
order, respectively.
12. In both Equations A7 and A8 for nonbreaking wave runup, the rela-
tive runup is seen to be of the functional form:
The grouping of the parameters on the right side of Equation A9 can also be
combined and reexpressed as before:

where the first dimensionless grouping is of a similar form to the modified
Iribarren number used previously.
13. In an attempt to unify the presentation of relative runup on smooth
slopes, the primary independent variable of importance was chosen to be the
modified Iribarren number.
Results
14. Relative runup plots for nine slopes ranging from vertical to
1 on 10 are presented in Figures A1 through A9. The modified Hunt (1959) ex-
pression is:
The expected criterion for breaking waves given by Equation All is super-
imposed on the plots along with an upper limit expression of the Miche-Keller
form (Equations A2 and A4) for nonbreaking wave limit. The expression for
this upper limit found to be most consistent with the data is given by:
If the shoaling coefficient K, is assumed to be unity, this expression is
consistent with Equation A4 (except for a constant (= 2.0)) and with Equa-
tion A6 (using sin(0) rather than 8 ) . Table A2 presents this relative
runup upper limit versus structure slope for the slopes investigated in this
study . 15. The rationalization for this approach to maximum wave runup is that
within the realm of breaking waves (on the slope) the relative runup should
follow the modified Iribarren number. As the modified Iribarren number is
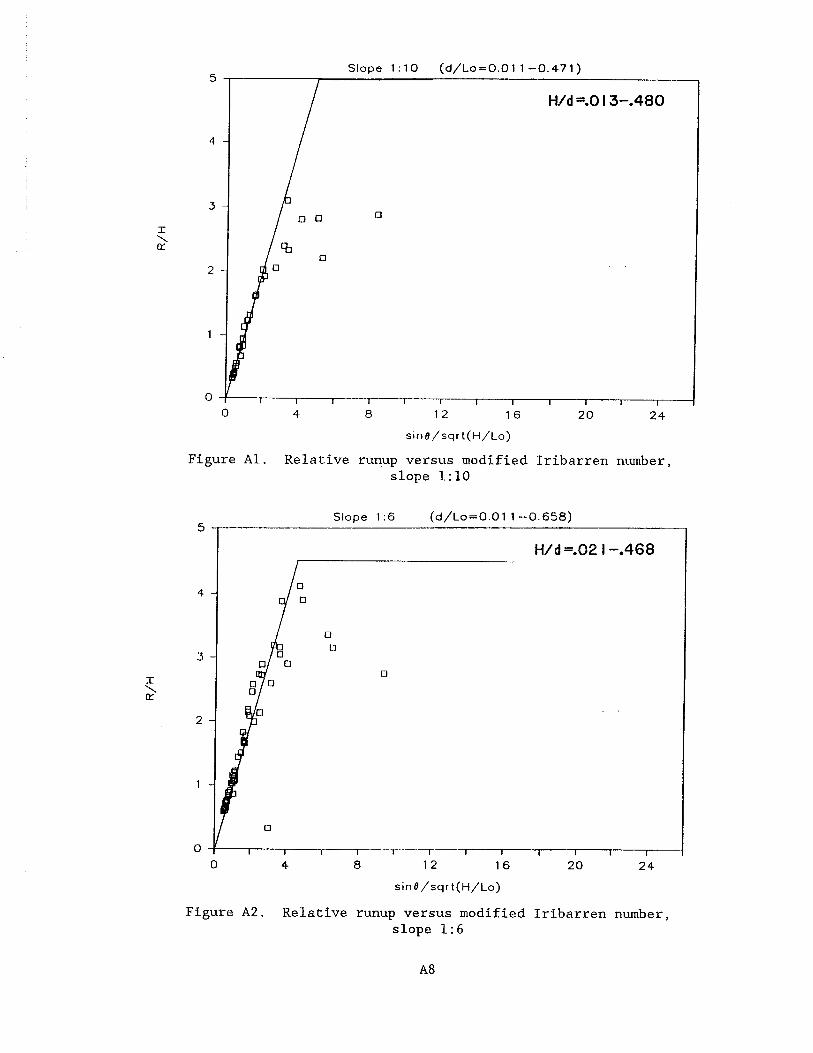
Figure Al. Relative runup versus modified Iribarren number, slope 1: 10
Slope 1 :6 (d/Lo=O.Ol 1 - 0 . 6 5 8 ) 5
H/d r 0 2 1 -.468
4
3
2
1
0
Figure A2. Relative runup versus modified Iribarren number, slope 1:6
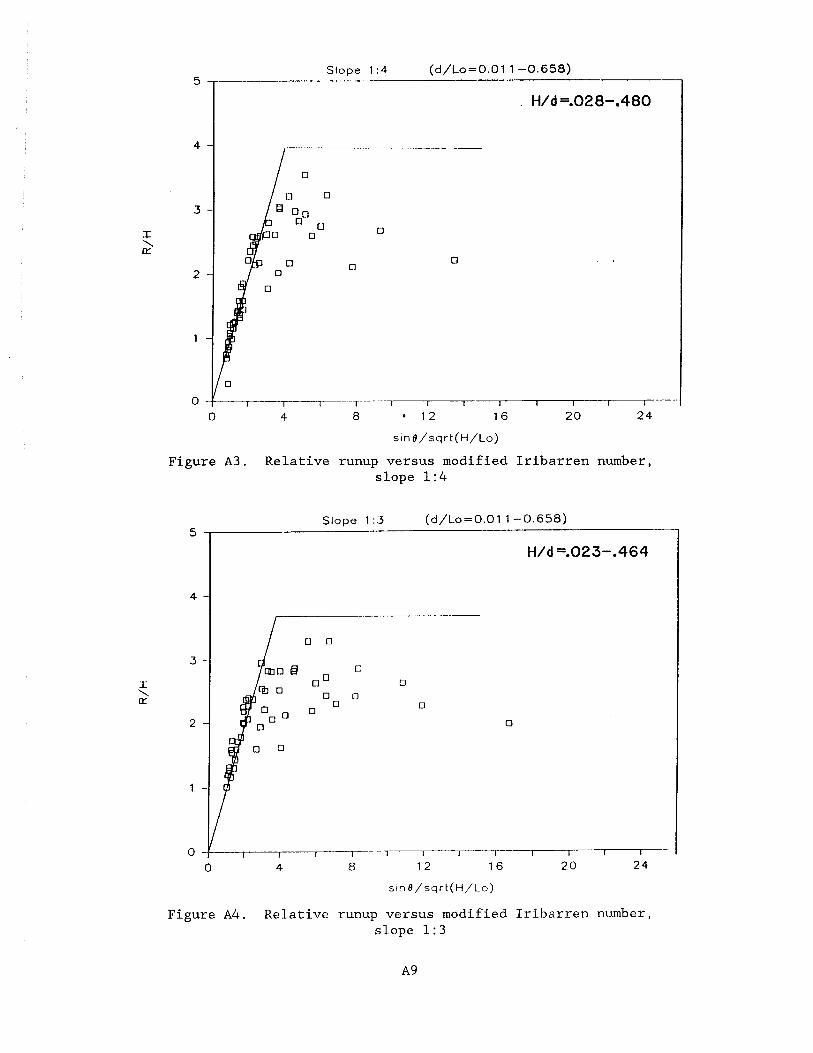
sin o/sqr t (H/ lo)
Figure A 3 . Relative runup versus modified Iribarren number, slope 1:4
Slope 1 :3 (d/Lo=O.Ol 1-0.658) 5
H/d =.023-,464
4
3
0
2
1
0 0 4 8 12 16 2 0 24
sin8/sqrt(H/Lo)
Figure A4. Relative runup versus modified Iribarren number, slope 1: 3
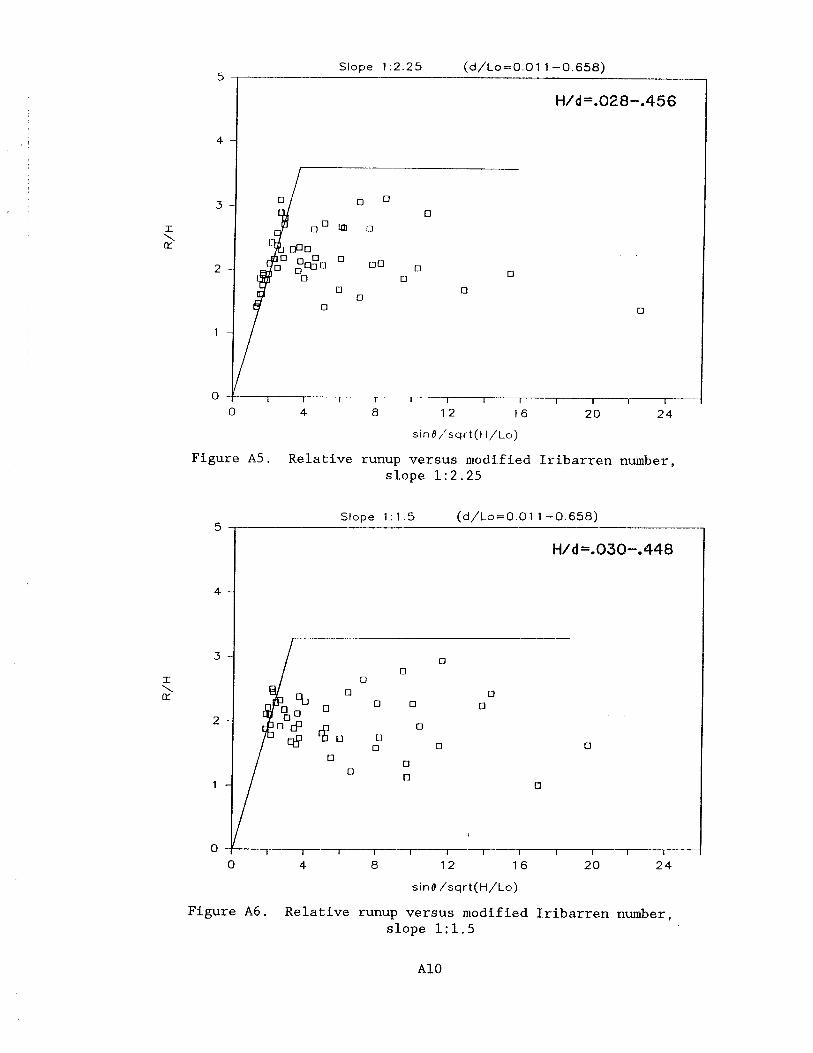
Slope 1:2.25 (d/Lo=0.01 1-0.658)
I \ IY
0
0 4 8 12 16 20 2 4
sin e/sqrt(H/Lo)
Figure A5. Relative runup versus modified Iribarren number, slope 1:2.25
sine /sqrt(H/Lo)
Figure A6. Relative runup versus modified Iribarren number, slope 1:1.5
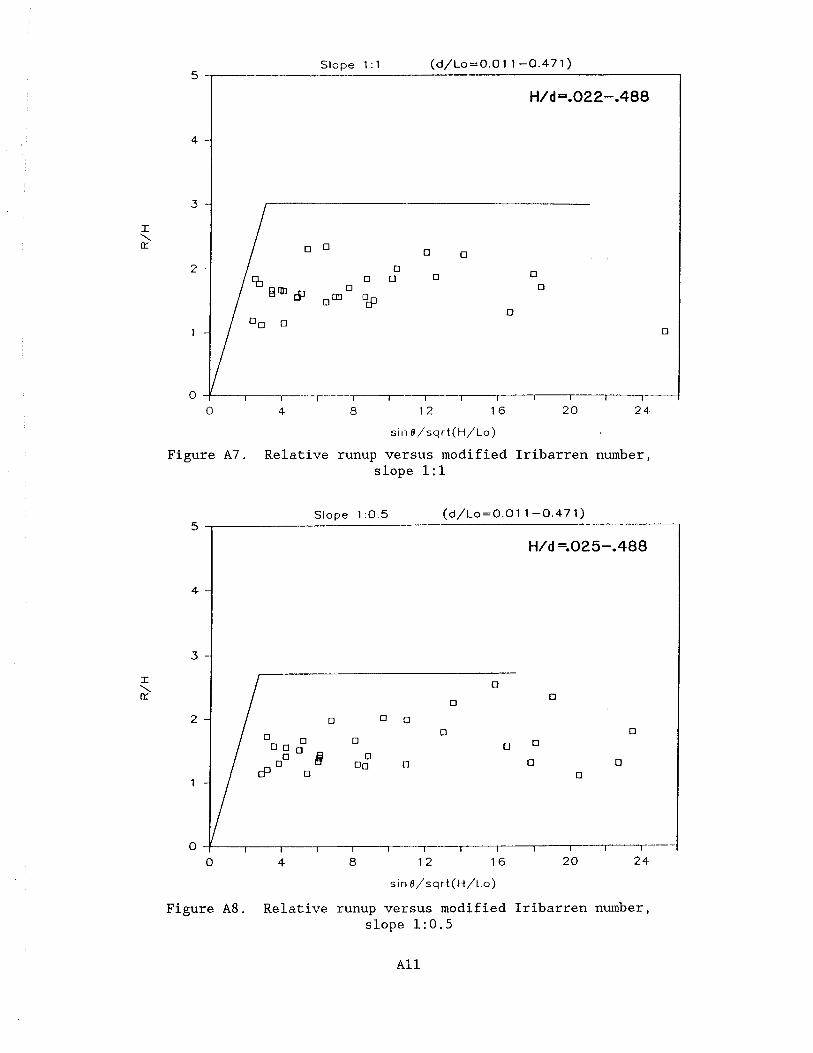
Slope 1 : 1 ( d / L o = O . O l 1 - 0 . 4 7 1 ) 5
H/d=.022-.488
sin @/sqrt(H/Lo)
Figure A7. Relative runup versus modified Iribarren number, slope 1:l
Slope 1 :0.5 ( d / L o = 0 . 0 1 1 - 0 . 4 7 1 ) 5
H/d =.025-.488
sin O/sqrt(H/Lo)
Figure A8. Relative runup versus modified Iribarren number, slope 1:0.5

Slope Vert ical (d/Lo=0.01 1-0.471 )
H/d =.024--32 1
'a 0 B 0
El BB q
00 5 n o
I I I I I I I I I I 1
0 4 8 12 16 2 0 2 4
sin ~ / s q r t ( H / L o )
Figure A9. Re la t ive runup versus modified I r i b a r r e n number, s lope v e r t i c a l
Table A2
Maximum Re la t ive Runup Versus S t r u c t u r e Slope
Slope R/H (Equation A121
V e r t i c a l 2.50
1 : 0 . 5 2.73
1:l 2.97
1 : 1 . 5 3.19
1 :2 .25 3.49
1: 3 3.70
1 : 4 3.95
1 : 6 4.39
1 : 10 5.00
increased and e n t e r s the zone of nonbreaking, t h e r e l a t i v e runup should
decrease ; the re fo re l i m i t s provided should envelope runup d a t a on t h e conserv-
a t i v e s i d e .

16. In all cases, the data in the breaking zone portion of the curve
follow the modified Iribarren number relationship well. Additionally, the
critical transition point for nonbreaking describes well the upper limit of
the relative runup except for the 1 on 10 and vertical slope where it overes-
timates. The reason for this overestimation on the 1 on 10 slope is not
entirely known but believed to be due in part to the greater effect of fric-
tion as slope gets milder and the consequent opportunity for a viscous bound-
ary layer to develop. As typical coastal flood-control structures have slopes
steeper than 1 on 10, this discrepancy should not be a major concern.
17. The upper limit for relative runup on a smooth vertical slope
according to Equation A12 is:
A simple periodic linear standing wave on a vertical slope would produce an
expression with relative runup R/H = 1.0 . Wallace (1964) provided a method
to numerically calculate the runup for solitary waves (which can be considered
to be a limiting case of periodic waves in shallow water). For vertical walls
with H/d > 0.15 , his method produces an estimated R/H = 2.5 in accord
with the above proposed criterion. A value of relative runup R/H = 2.5 on
vertical waves is also consistent with the laboratory findings of Takada
(1974) and with the original recommended value of R/H = 3.0 proposed by Hunt
(1959) for surging (nonbreaking) waves.
18. Although graphs have not been included here, the approach has been
used on one set of data with a 1 on 3 slope in 29.5-cm water depth and is con-
sistent with the results provided herein.

APPENDIX B: PRELIMINARY METHOD FOR COMPUTATION OF WAVE OVERTOPPING AND WAVE TRANSMISSION
1. Several methods were investigated to evaluate their applicability
for predicting overtopped wave heights. With the exception of the method
selected, these included equating that component of candidate overtopped vari-
ables to the same variable in the transmitted wave. These candidate variables
included the following: volume flux, momentum flux, and energy flux. The
portion of the variable in the incident wave crest lying above the structure
crest was equated to the quantity in the transmitted wave, thereby determining
its height.
2. These evaluations established the desirability of using a nonlinear
wave and the necessity of accounting for a localized enhancement of the inci-
dent wave through reflection or convergence for a sloping structure.
3. The method presented here equates the volumetric flow over the
coastal flood-protection structure to that under the crest phase of the trans-
mitted waves. As described later, the volumetric flow rate, q2 , per unit
length of structure is calculated by either a critical flow weir equation or a
submerged flow weir equation, depending on the relative submergence of the
structure crest. Referring to Figure B1, the empirically adopted criterion
for the type of weir flow formula is
F Submerged Weir Flow Equation: - < 0.5
Hi
Critical Flow Equation: F - 2 0.5 Hi
The equations for each of these two flow conditions are discussed below
Submerged Weir Flow Equation: F/Hi < 0.5
4. For this case the head driving the flow is ql - q2 and the flow
area through which the flow occurs is [(ql + q2)/2 - F] , where ql, q 2 = wave
water level above still-water level seaward and shoreward of structure,
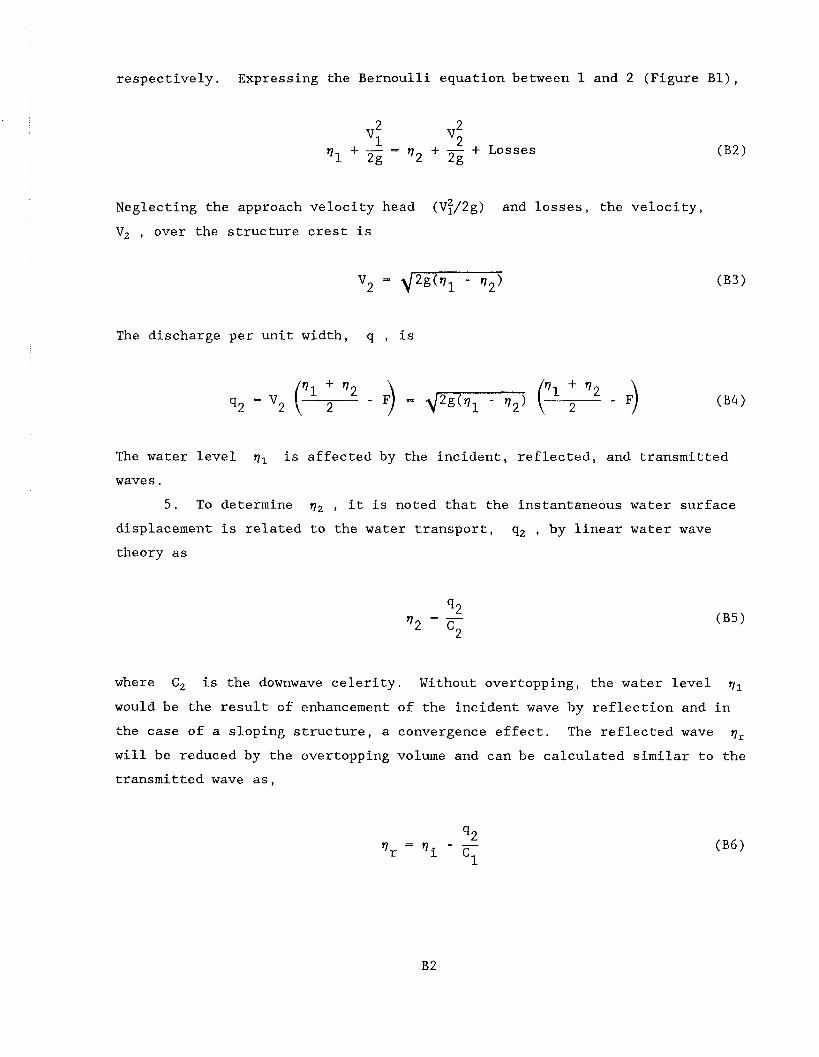
respectively. Expressing the Bernoulli equation between 1 and 2 (Figure El),
I L v1 + - = 9 + - + Losses 2g 2 2g
Neglecting the approach velocity head (~:/2~) and losses, the velocity,
Vz , over the structure crest is
The discharge per unit width, q , is
The water level q 1 is affected by the incident, reflected, and transmitted
waves . 5. To determine q2 , it is noted that the instantaneous water surface
displacement is related to the water transport, q, , by linear water wave
theory as
where Cz is the downwave celerity. Without overtopping, the water level
would be the result of enhancement of the incident wave by reflection and in
the case of a sloping structure, a convergence effect. The reflected wave qr
will be reduced by the overtopping volume and can be calculated similar to the
transmitted wave as,
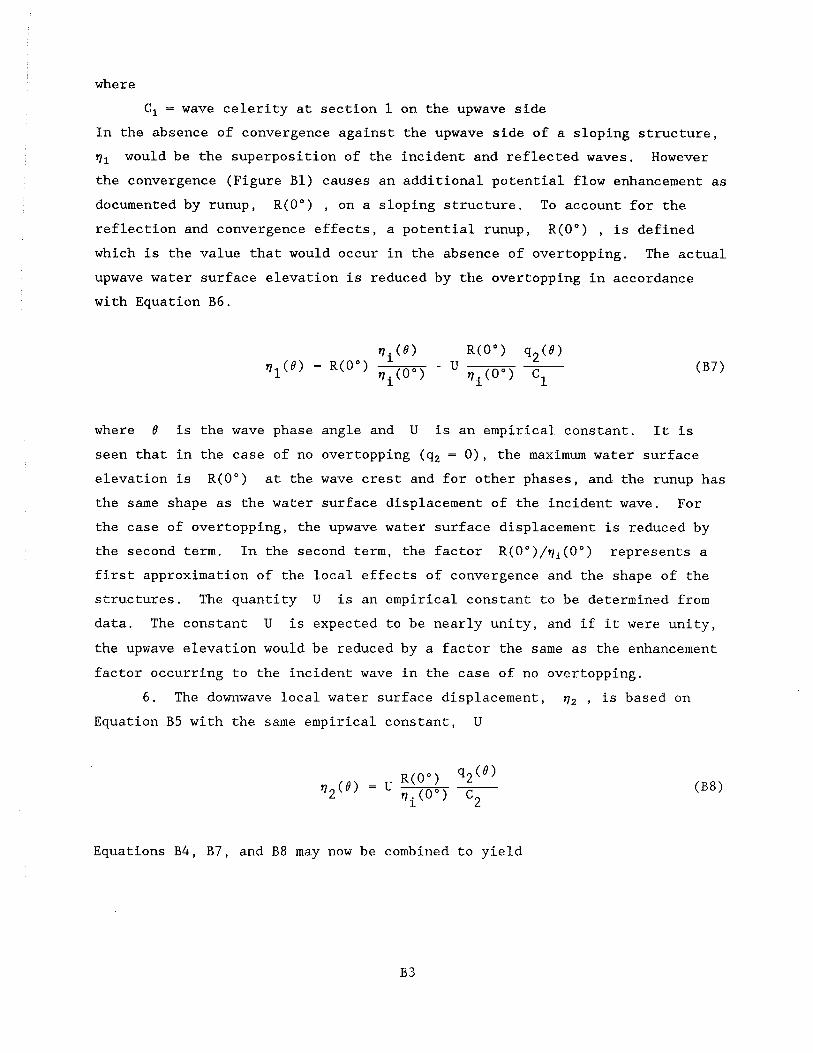
where
C1 = wave celerity at section 1 on the upwave side
In the absence of convergence against the upwave side of a sloping structure,
q would be the superposition of the incident and reflected waves. However
the convergence (Figure B1) causes an additional potential flow enhancement as
documented by runup, R(OO) , on a sloping structure. To account for the
reflection and convergence effects, a potential runup, R(OO) , is defined
which is the value that would occur in the absence of overtopping. The actual
upwave water surface elevation is reduced by the overtopping in accordance
with Equation B6.
where 0 is the wave phase angle and U is an empirical constant. It is
seen that in the case of no overtopping (qz = O), the maximum water surface
elevation is R(OO) at the wave crest and for other phases, and the runup has
the same shape as the water surface displacement of the incident wave. For
the case of overtopping, the upwave water surface displacement is reduced by
the second term. In the second term, the factor R(OO)/qi(OO) represents a
first approximation of the local effects of convergence and the shape of the
structures. The quantity U is an empirical constant to be determined from
data. The constant U is expected to be nearly unity, and if it were unity,
the upwave elevation would be reduced by a factor the same as the enhancement
factor occurring to the incident wave in the case of no overtopping.
6. The downwave local water surface displacement, qz , is based on
Equation B5 with the same empirical constant, U
Equations B4, B7, and B8 may now be combined to yield
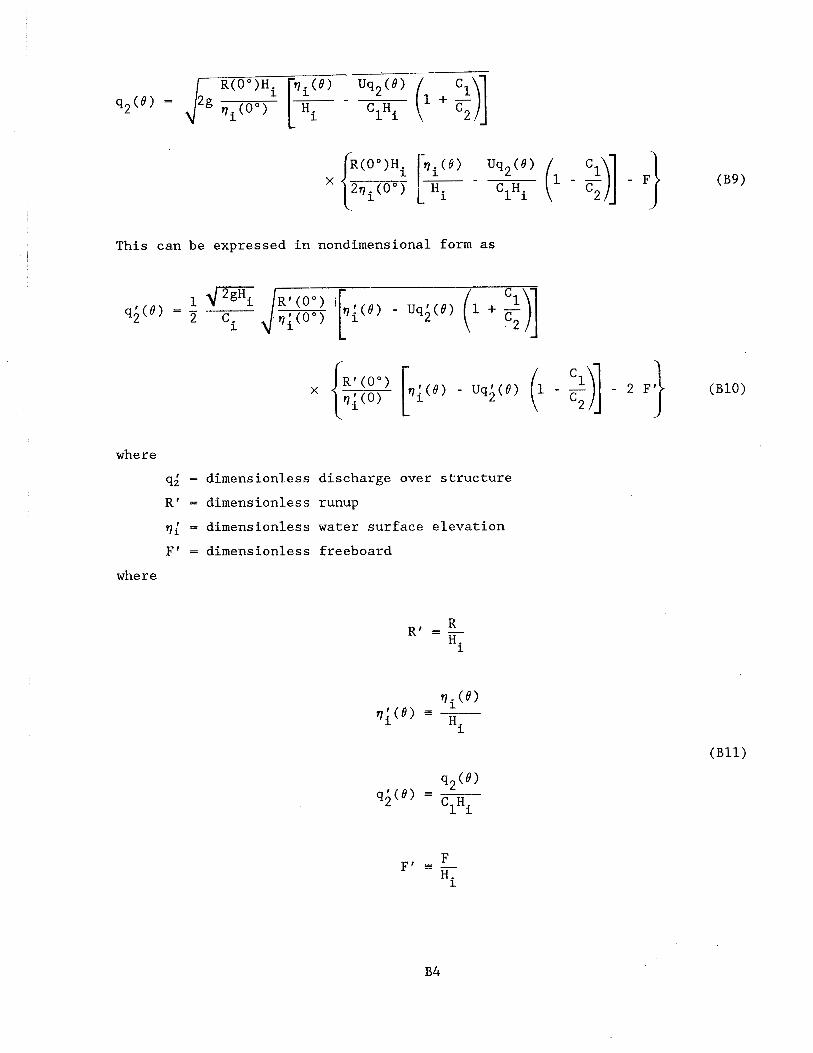
This can be expressed in nondimensional form as
where
q; = dimensionless discharge over structure
R ' = dimensionless runup
~1 = dimensionless water surface elevation
F' = dimensionless freeboard
where

7. With the discharges per unit width qz(d) over the structure now
determined, it remains to establish the transmitted wave height, H, . The
volumetric flux per wave, f, , under the crest phase positions for a linear
wave, is
Equating f, and the overtopping volume, H, is found as
where, as noted previously, the integration occurs over the phase anples of
positive transport. Simpson's rule was used to carry out the numerical inte-
gration of qz(8) , which was calculated at phase angle increments, A8 , of
0.1745 radians (= 10 deg).
Critical Flow Equation: F/H, 2 0.5
8. The critical flow discharge over sharp- and broad-crested weirs can
be derived through application of the Bernoulli equation between the upstream
section and a section over the weir (e.g., Streeter and Wylie (1979)* ,
pp 357-361). The results are
2 Sharp-Crested: q2 = g a (vl - F) 3/2
Broad-Crested: q2 = (i v1 - F)3'2
For purposes here, the sharp-crested weir equation is considered valid with an
"efficiency factor" of 0.62 determined for steady-state (Streeter and Wylie
(1979), p 358).
* See References at the end of the main text.
B 5

9. Using the reduction in reflected wave, the convergence enhancement
factor, and the reduction in upstream water surface elevation due to overtop-
ping, the discharge equation can be expressed as
In dimensionless form, Equation B16 becomes
As for the case of the submerged weir flow, Equation B17 is solved by itera-
tion for a11 phase angles for which the term inside the brackets is positive.
With the positive discharge determined, the transmitted wave height is estab-
lished by Equation X13.
10. Results of applying and evaluating this method against two fairly
extensive sets of laboratory measurements are presented in the next section.
Results
11. Lamarre (1967) carried out a fairly extensive set of laboratory
measurements for a breakwater with side slopes of 1~1.5. A total of si-x wave
periods were investigated; for each period, various combinations of structure
crest elevations and wave heights were tested. For each test, the incident
and transmitted wave heights were measured. The water depth for all 200 tests
was 1.5 ft. Table B1 summarizes the test results of Lamarre, and Figure B2
portrays the dirnensionbess wave characteristics.
12. In the computations, stream function wave profiles for Cases 6-A,
7-A, and 8-A (USACE 1974) were used depending on the relative water depth
d/L, (Figure R2), as follows:
d Case 6-A, - < 0.15
L 0

d Case 7-A, 0.15 - I 0.35 L
0
d Case 8-A, - > 0.35 Lo
Table B1
Summarv of Characteristics of Lamarre Laboratory Experiments (Total
of 200 Tests. Water Depth = 1.5 ft. Side Sloves = 1:1.5)
Relative Structure Crest Incident Wave Height Elevation, F/Hi
Wave Hi Period No. of No. of T, sec Values Ran~e Values Range, ft
0.8 9 -2.022 to 1.880 4 0.090 to 0.211
13. Three bases for evaluating the overall success of the method will
be presented. One basis is simply a plot of measured versus predicted trans-
mitted wave heights for the best-fit value of U . The second is an overall
dimensionless standard deviation, defined as
where the subscript .rn refers to measured, the subscript c refers to com-
puted, and the subscript j is an index. In the above equation, the summa-
tion is carried out over the entire set of 200 run results. It is clear that
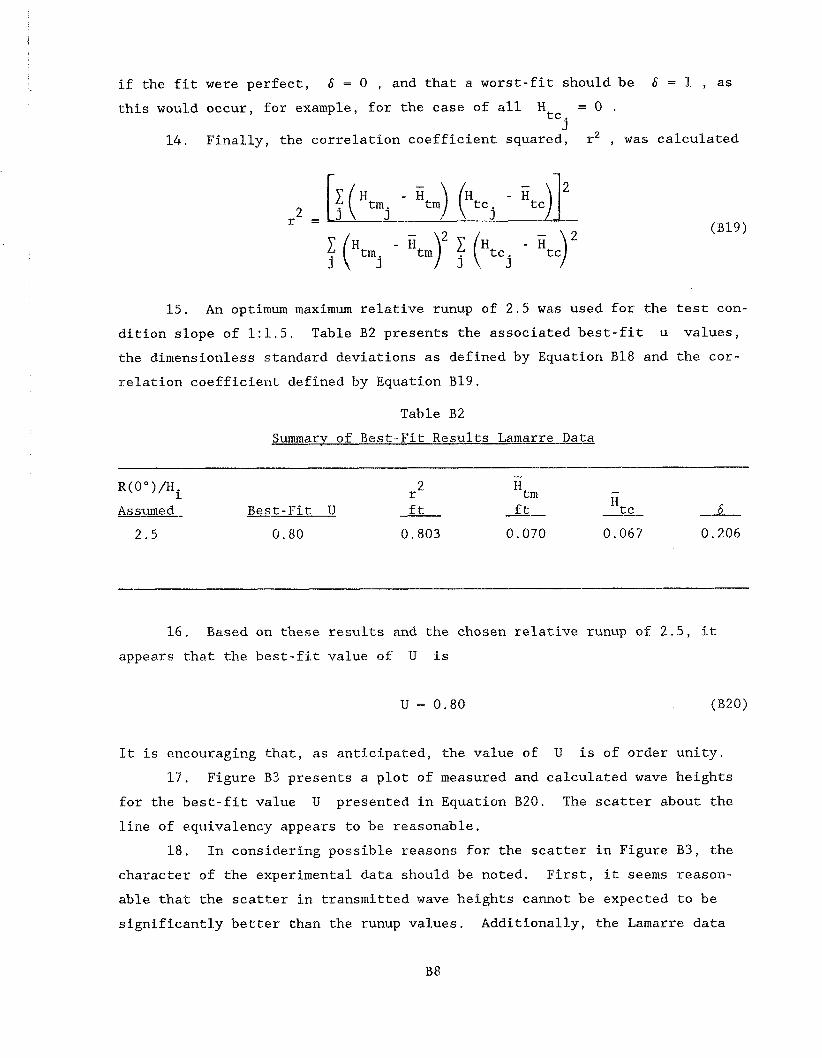
if the fit were perfect, S = 0 , and that a worst-fit should be S = I , as
this would occur, for example, for the case of all Htc = 0 . j
14. Finally, the correlation coefficient squared, r2 , was calculated
15. An optimum maximum relative runup of 2.5 was used for the test con-
dition slope of 1:1.5. Table B2 presents the associated best-fit u values,
the dimensionless standard deviations as defined by Equation B18 and the cor-
relation coefficient defined by Equation B19.
Table B2
Summarv of Best-Fit Results Lamarre Data
- R(O")/Hi r 2 "tm - Assumed Best-Fit U f t ft Htc 6
16. Based on these results and the chosen relative runup of 2.5, it
appears that the best-fit value of U is
It is encouraging that, as anticipated, the value of U is of order unity.
17. Figure B3 presents a plot of measured and calculated wave heights
for the best-fit value U presented in Equation B20. The scatter about the
line of equivalency appears to be reasonable.
18. In considering possible reasons for the scatter in Figure B 3 , the
character of the experimental data should be noted. First, it seems reason-
able that the scatter in transmitted wave heights cannot be expected to be
significantly better than the runup values. Additionally, the Lamarre data

included values of the transmitted wave heights at two locations along the
wave tank. The value used in the comparisons presented in Figure B3 is the
average of these two heights. In some cases, the two transmitted height val-
ues were in good agreement, and in others the agreement was fairly poor. In
12 of the 200 runs, at least one of the two measured transmitted wave heights
was greater than the incident wave height. To quantify the differences
between the two measured transmitted wave heights, a nondimensional standard
deviation, similar to Equation B18, is defined
As before, a value of 6 , = 0 would indicate that in all runs, the two mea-
sured wave heights were identical. The value of 6, for the Lamarre data is
0.23.
Comparison of Method with Hall (1940) Data
19. Hall reported wave tank measurements of transmitted waves due to
overtopping of structures of three different cross sections including 18 tests
on a vertical plate structure which is similar to a seawall, with the excep-
tion that the water depths on both sides of the structure are the same. The
range of variables encompassed in these tests is presented in Table B3, and
the wave characteristics are portrayed graphically in Figure B4.
Table B3
Range of Variables Included in Hall's 18 Tests
with a Vertical Plate
Relative Structures Crest Elevation
Wave Period Incident Wave Height
Water Depth, T. sec F/Hi h. ft Hi, ft
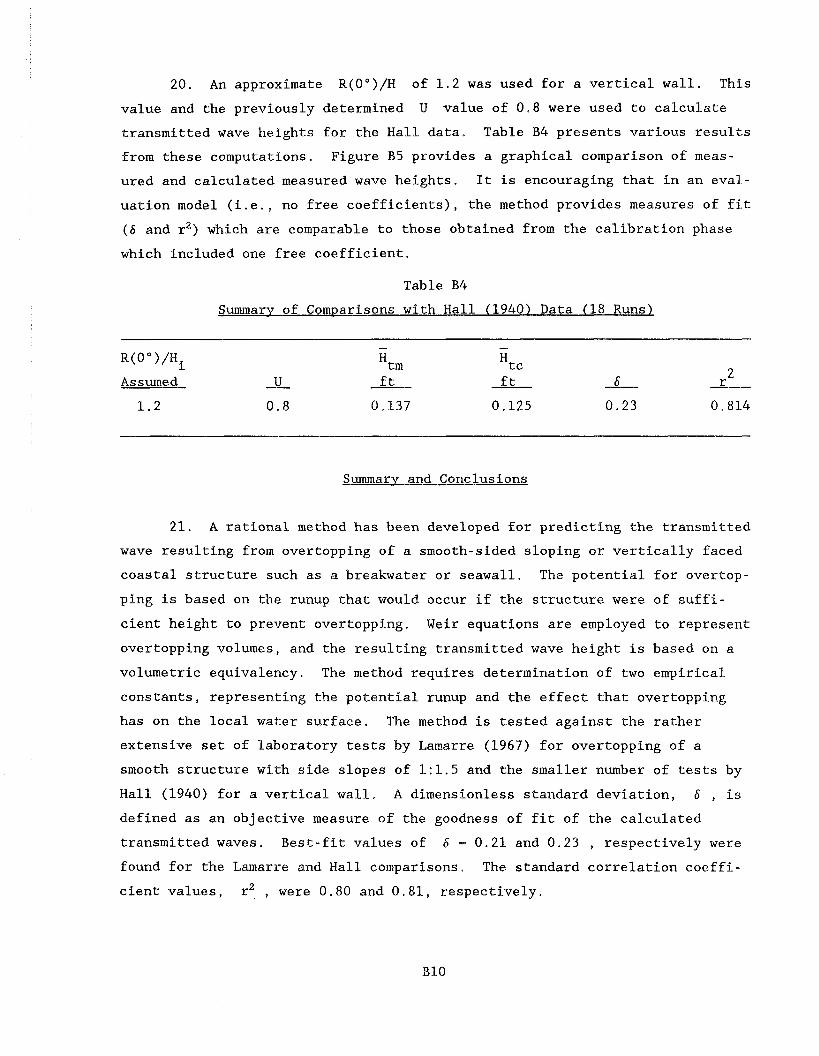
20. An approximate R(OO)/H of 1.2 was used for a vertical wall. This
value and the previously determined U value of 0.8 were used to calculate
transmitted wave heights for the Hall data. Table B4 presents various results
from these computations. Figure B5 provides a graphical comparison of meas-
ured and calculated measured wave heights. It is encouraging that in an eval-
uation model (i.e., no free coefficients), the method provides measures of fit
( 6 and r2) which are comparable to those obtained from the calibration phase
which included one free coefficient.
Table B4
Summary of Com~arisons with Hall (1940) Data (18 Runs)
Assumed - U ft f t 6 -- r
Summary and Conclusions
21. A rational method has been developed for predicting the transmitted
wave resulting from overtopping of a smooth-sided sloping or vertically faced
coastal structure such as a breakwater or seawall. The potential for overtop-
ping is based on the runup that would occur if the structure were of suffi-
cient height to prevent overtopping. Weir equations are employed to represent
overtopping volumes, and the resulting transmitted wave height is based on a
volumetric equivalency. The method requires determination of two empirical
constants, representing the potential runup and the effect that overtopping
has on the local water surface. The method is tested against the rather
extensive set of laboratory tests by Lamarre (1967) for overtopping of a
smooth structure with side slopes of 1:1.5 and the smaller number of tests by
Hall (1940) for a vertical wall. A dimensionless standard deviation, 6 , is
defined as an objective measure of the goodness of fit of the calculated
transmitted waves. Best-fit values of 6 = 0.21 and 0.23 , respectively were found for the Lamarre and Hall comparisons. The standard correlation coeffi-
cient values, r" , were 0.80 and 0.81, respectively.

22. Further testing using a generic set of data taken under both break-
ing and nonbreaking wave conditions would be necessary prior to final recom-
mendation for Federal Emergency Management Agency use.

,' /
Incident Wave - Transmitted
Figure B1. Definition sketch
CASE
RELATIVE DEPTH, h / L.
Figure B2. Ranges of dimensionless wave steepnesses and relative depths of Lamarre data, indicated by vertical
arrows

A IC, rC v
2 0.15 I c- x C3 I
W a= W >
0.10
P w I-- I- - z V) Z a U 0.05 I-
P W I- < -.I 9 0 d 4 0 0
0 0.05 0-1 0 0.1 5
MEASURED TRANSMITTED WAVE HEIGHT, W (ft) trn
Figure B3. Plot of measured versus calculated transmitted wave heights by overtopping, Lamarre data
Llne of Equivalence
0 Svmbol Wave Period
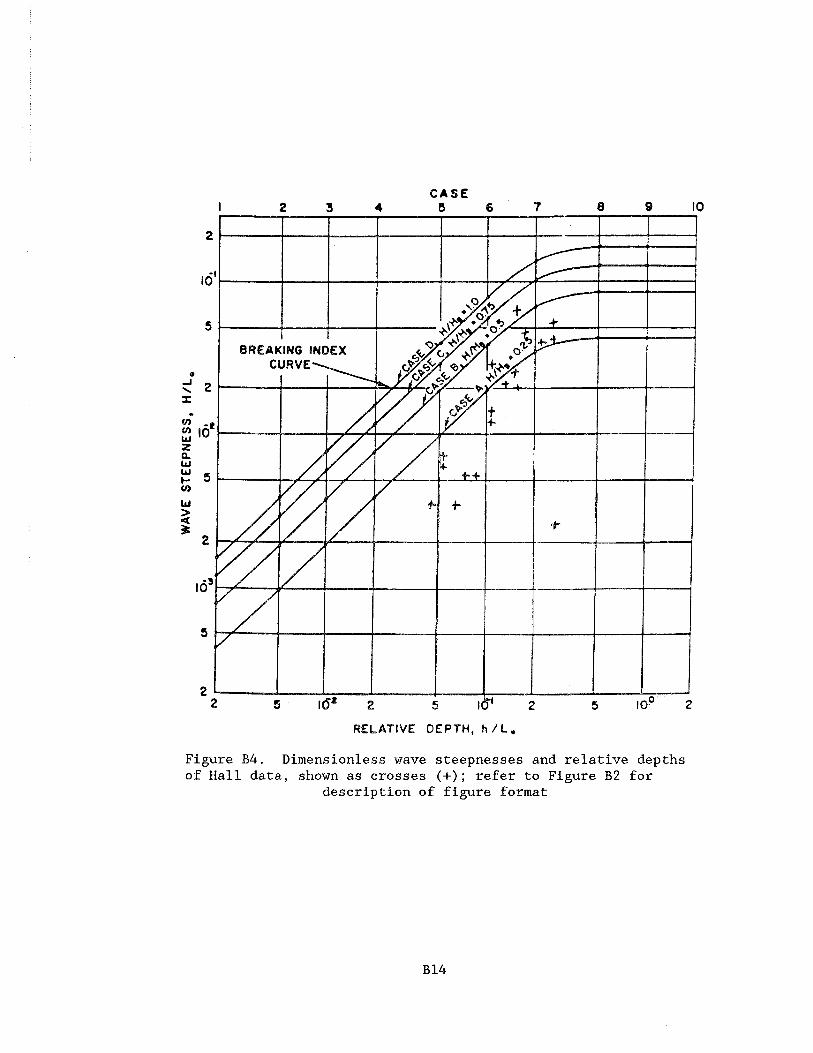
RELATIVE DEPTH, h / L,
Figure B4. Dimensionless wave steepnesses and relative depths of Hall data, shown as crosses (+); refer to Figure B2 for
description of figure format

0.3
Symbol Period Range
2.24 to 2.64
1.56 to 1.74
2.24 to 2.64 0.2
0.1
0 0 0.1 0.2 0.3
MEASURED TRANSMITTED WAVE HEIGHT, Ht,(ft)
Figure 135. Measured versus calcula ted transmitted wave he igh ts , Hall data

APPENDIX C: SCOUR CRITERIA
1. An important criterion for stability of a seawall or coastal flood-
protection dike is the amount of scour that will occur at the toe of the
structure (Figure Cl). If adequate measures have not been taken to protect
the foundation in front of the structure, failure may occur by three possible
modes: (a) inadequate foundation stability if the structure is free standing
such as a massive gravity wall, (b) inadequate resisting soil pressure on the
seaward side of the structure to prevent a seaward sliding failure (in the
case of a free-standing gravity structure), or (c) inadequate soil pressure on
the seaward side to prevent a resisting shear/moment failure (in the case of a
cantilevered structure).
2 . Most of the research to date on scour at coastal flood-protection
structures (primarily impermeable vertical walled structures) is based on
small-scale physical modeling studies. As the state of the art in coastal
engineering is still inadequate to predict the scale effects of small-scale
movable bed models, the results of such studies must be interpreted with cau-
tion. Field studies provide data that are more believable scalewise but
suffer from the inability to adequately monitor scour throughout storm condi-
tions, therefore providing possible unconservative scour data since scour
troughs may fill in prior to measurement. Both laboratory and field studies
typically define a quantity called scour depth as the vertical distance from
the prestorm equilibrium profile to the minimum profile elevation reached at
or very near to the structure toe during the storm/wave event. This defini-
tion will be used in the following paragraphs to delineate from scour defined
in other ways.
3. In an early study of scour, Russell and Inglis (1953)* placed a ver-
tical wall in the swash zone of a laboratory beach that had previously
attained an equilibrium shape under given wave and tide conditions. The same
wave and tide action was then continued and scour at the toe of the wall mea-
sured. Russell and Pnglis concluded from their tests that the scour that
occurred was due to the reflection of wave action from t i r ~ wall and that maxi-
mum scour as measured from low water to the after-storm profile in the vicin-
ity of the structure toe would approximately equal the incident wave height.
* See References at the end of the main text.
C 1
Because of the limited number of tests performed and the complicating effect
of tides, no predictive measure of scour depth as defined in paragraphs 2
and 3 is given. As Russell and Inglis' experimental setup was in a very small
laboratory tank (16.4 m), the results may have considerable scale effects
included.
4. Numerous other laboratory measurements of scour since the Russell
and Inglis (1953) study have suggested similar inconclusive scour relation-
ships based upon small-scale laboratory tests. Kadib (1963) included the
effects of grain size of sand within his experiments with the result that
scour depth decreased for the coarser sand size in agreement with physical
intuition. Kadib (1963) noted greater scour depths than found in earlier
laboratory studies. Maximum scour depths in his experiments were two to three
times the incident wave height. Kraus (1987) notes that Kadib's (1963) exper-
iments are difficult to interpret because of the unknown influence of ponding
and seepage from behind the wall and possible return flow over the wall.
5. Sawaragi and Kawasaki (1960) found the maximum laboratory scour
depth to be approximately equal to the incident deepwater wave height based on
small-scale laboratory measurements with various sand grain sizes. Sawaragi
and Kawasaki (1960) also compiled field data on scour from two storms at
seawall/seadikes on Ise Bay, Japan. They found that the average maximum scour
depth from eight measurements was approximately equal to the water depth at
the toe of the seadikes with the ratio of scour depth to water depth ranging
from 0.25 to 1.68. In a later laboratory study, Sawaragi (1967) measured
scour in front of permeable sloping seawalls (consisting of wood boards with
holes drilled into them) and found that as permeability increased, reflectiv-
ity of the wall decreased and consequent scour decreased. Sawaragi (1967)
presents an empirical relationship for the reflection coefficient versus scour
depth (slope not provided) and noted that maximum scour depth approached
0.6 times the incident deepwater wave height.
6. Sato, Tanaka, and Irie (1969) conducted a comprehensive set of scour
measurements in two laboratory wave tanks (the largest being 105 m long, 3 m
wide, and 2.5 m deep). They ran their tests for a variety of incident wave
conditions that included cases where wave breaking took place on the bottom
profile prior to reaching the seawall providing a reasonable idea of what
might happen under breaking wave conditions at a real seawall during a storm.
The results of these tests provide scour at the toe of the wall ranging from
S/Ho = 0.25 to 2.5, where S = scour depth. The scour was found to be depen-
dent on the location of the wall in the surf zone and on incident wave steep-
ness, as well as wall inclination, composition, and shape. They found that
relative scour depth (S/Ho) decreased with increasing wave steepness. For
deepwater wave steepness in the storm range (0.02 to 0.04), the maximum scour
predicted by them is equal to the incident deepwater wave height. Sato,
Tanaka, and Irie (1969) also noted that inclined walls produced less scour,
and they allude to field measurements made along a breakwater at the Port of
Kashima, which faces the Pacific Ocean. They note that ". . . the maximum scour depth under the stormy conditions may be considered to be nearly equal
to the maximum significant wave height during the storm." Although it is
impossible to directly compare the results of scour that occurs at shore per-
pendicular structures (such as breakwaters that may be heavily influenced by
coastal currents) with seawalls/seadikes that run parallel to the coast, Sato,
Tanaka, and Irie (1969) suggest that such field measurement of scour coincide
with their laboratory testing of vertical walled seawalls/seadikes. Sato,
Tanaka, and Irie's (1969) tests are especially relevant to Federal Emergency
Management Agency (FEMA) design criteria due to the fact that their tests were
run under breaking waves consistent with FEMA depth-limited breaking wave
approach to design.
7. Hotta and Marui (1976) testing permeable and impermeable shore par-
allel breakwaters also found a maximum scour depth on the order of the inci-
dent wave height in deep water. When plotted as a function of depth at the
structure, their results showed a scour depth approximately equal to 0.6 times
the water depth, in reasonable agreement with Katayama, Irie, and Kawakami's
(1974) field findings discussed below.
8. During the late sixties and early seventies, a number of experimen-
tal beach profile responses to structure physical model studies were made at
Texas A&M University (see Herbich, Murphy, and Van Weele (1965); Herbich and
KO (1969); Chestnutt and Schiller (1971); and Song and Schiller (1977). The
results of these studies are discussed in Herbich et al.'s (1984) textbook on
scour. Herbich et al. (1984) present general conclusions on these studies
which often consist of empirical or semiempirical relationships for scour
depth S . Because of the small scale of the tests and the often limited con-
ditions for which the equations were developed, no universal conclusions can
be dram. As an example, Herbich and KO (1969) present a semitheoretical
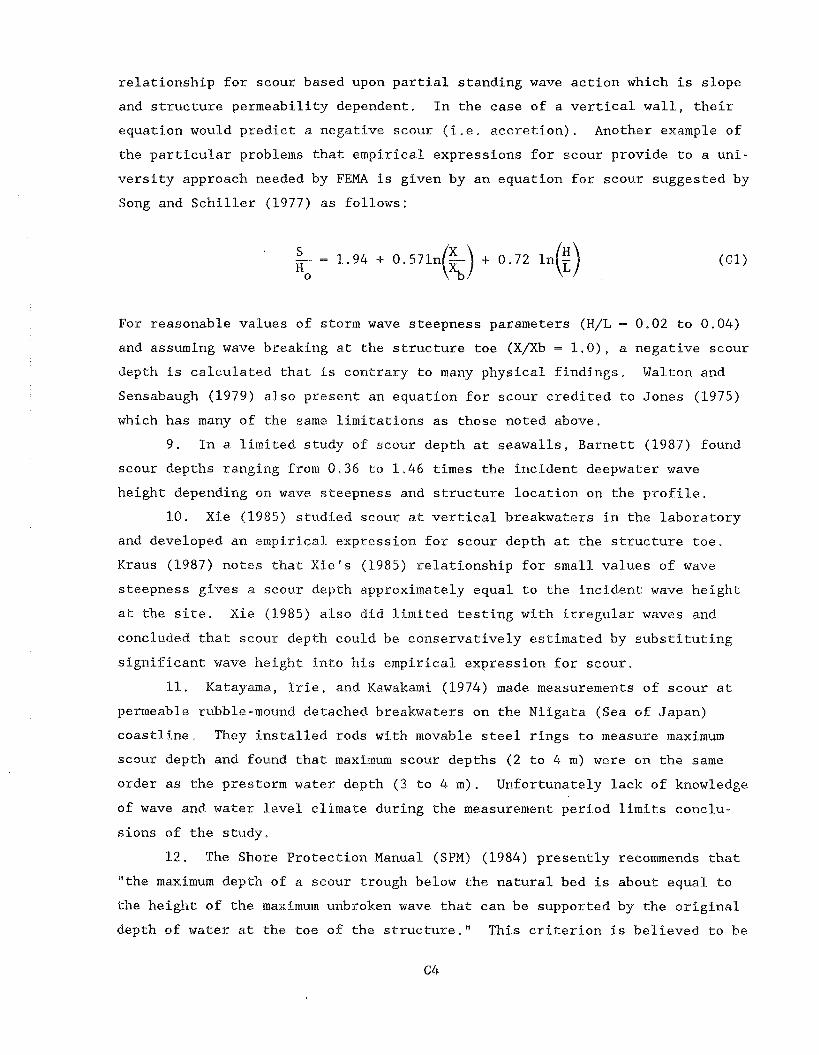
relationship for scour based upon partial standing wave action which is slope
and structure permeability dependent. In the case of a vertical wall, their
equation would predict a negative scour (i.e, accretion). Another example of
the particular problems that empirical expressions for scour provide to a uni-
versity approach needed by FEMA is given by an equation for scour suggested by
Song and Schiller (1977) as follows:
For reasonable values of storm wave steepness parameters (W/L = 0.02 to 0.04)
and assuming wave breaking at the structure toe (X/Xb = 1.0), a negative scour
depth is calculated that is contrary to many physical findings. Walton and
Sensabaugh (1979) also present an equation for scour credited to Jones (1975)
which has many of the same limitations as those noted above.
9. In a limited study of scour depth at seawalls, Barnett (1987) found
scour depths ranging from 0.36 to 1.46 times the incident deepwater wave
height depending on wave steepness and structure location on the profile.
10. Xie (1985) studied scour at vertical breakwaters in the laboratory
and developed an empirical. expression for scour depth at the structure toe.
Kraus (1987) notes that Xie's (1985) relationship for small values of wave
steepness gives a scour depth approximately equal to the incident wave height
at the site. Xie (1985) also did limited testing with irregular waves and
concluded that scour depth could be conservatively estimated by substituting
significant wave height into his empirical expression for scour.
11. Katayama, Irie, and Kawakami (1974) made measurements of scour at
permeable rubble-motmd detached break.waters on the Niigata (Sea of Japan)
coastline. They installed reds with movable steel rings to measure maximum
scour depth and found that maximum scour depths (2 to 4 m) were on the same
order as the prestorm water depth (3 to 4 m). Urlfortunately lack of knowledge
of wave and water level climate during the measurement period limits conclu-
sions of the study.
12. The Shore Protection Nanual (SPM) (1984) presently recommends that
"the maximum depth of a scour trough below the natural bed is about equal to
the height sf the maximum unbroken wave that can be supported by the original
depth of water a& the toe of the structure." This criterion is believed to be

derived from literature research of the problem as well as expert opinion of
various engineers.
13. In final analysis, it is felt that the present state of knowledge
is lacking sufficient answers in this area. Laboratory tests provide informa-
tion on scour, but no existing scour formula or equation has been justified
beyond the limited set of data for which it was proposed. Additional scale
factor uncertainty in laboratory experiments make laboratory results open to
question. Until further advancements are made in this area, a prudent
approach to design suggests using the SPM criteria with a change in wording
from "original depth of water" to "maximum storm depth of water." This
approach suggests considering toe scour depth for seawalls/seadikes with no
toe protection to be equal to incident storm wave height (0.78 times water
depth in existing FEMA guidelines) at maximum storm water level. It should be
recognized that this criterion may be overly conservative, and FEMA may wish
to relax this criterion somewhat.
WAVE -
Figure C1. Scour definition at seawall
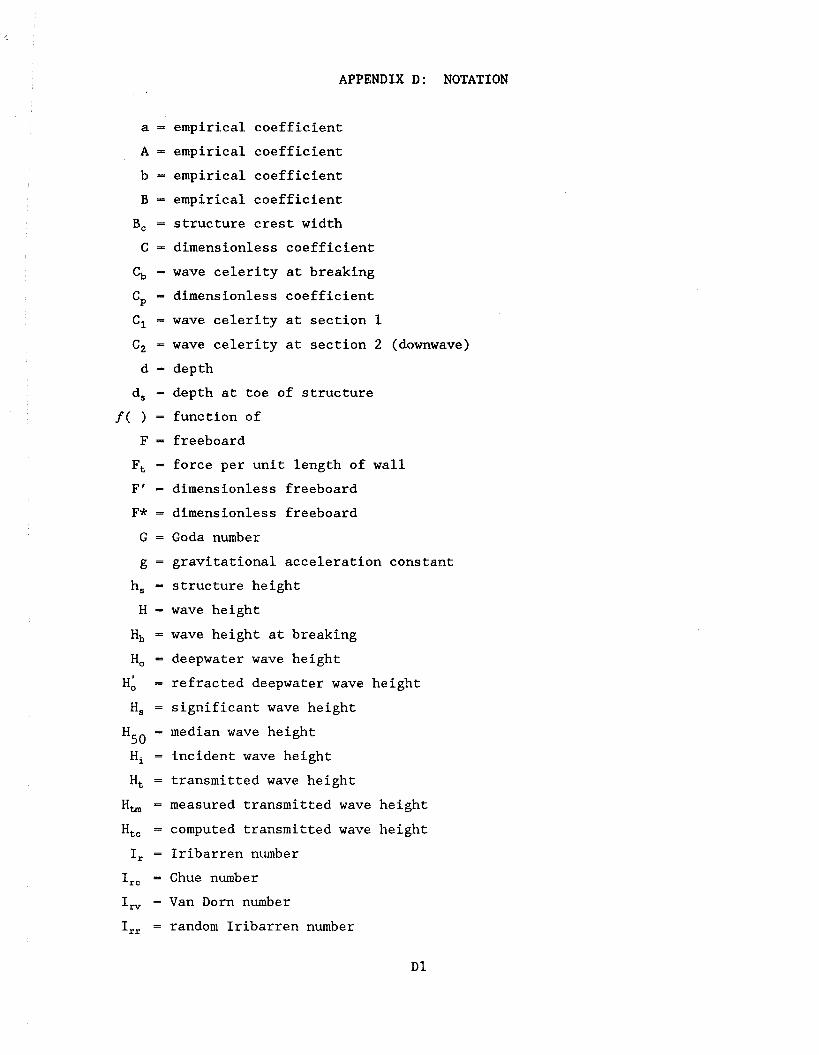
APPENDIX D: NOTATION
a = empirical coefficient
A - empirical coefficient b = empirical coefficient
B = empirical coefficient
B, = structure crest width
C = dimensionless coefficient
Cb = wave celerity at breaking
Cp = dimensionless coefficient
C1 = wave celerity at section 1
Cz = wave celerity at section 2 (downwave)
d = depth
d, = depth at toe of structure
f( ) = function of
F = freeboard
F, = force per unit length of wall
F' = dimensionless freeboard
F* = dimensionless freeboard
G = Goda number
g = gravitational acceleration constant
h, = structure height
H = wave height
Hb = wave height at breaking
H, = deepwater wave height
H: = refracted deepwater wave height
H, = significant wave height
HS0 = median wave height
Hi = incident wave height
H, = transmitted wave height
H,, = measured transmitted wave height
H,, = computed transmitted wave height
I, = Iribarren number
I,, = Chue number
I, = Van Dorn number
I,, = random Iribarren number
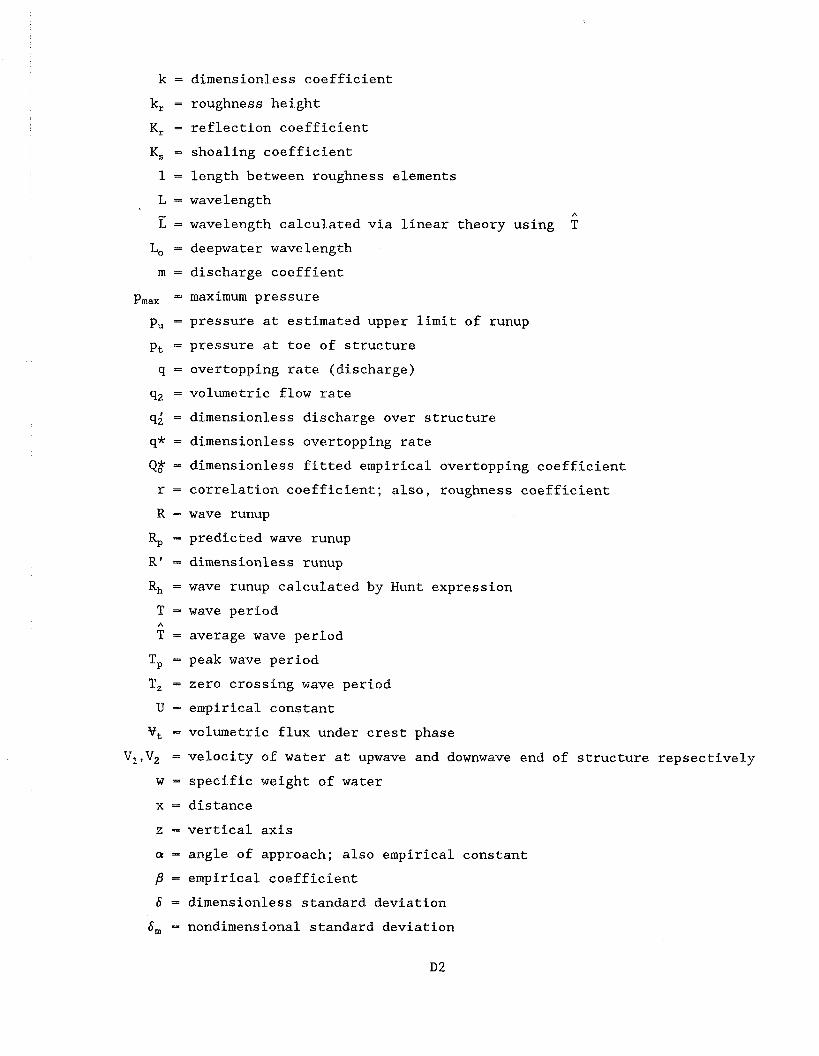
k = dimensionless coefficient
k, = roughness height
K, = reflection coefficient
K, = shoaling coefficient
1 = length between roughness elements
L = wavelength - A
L = wavelength calculated via linear theory using T
Lo = deepwater wavelength
m = discharge coeffient
p,,, = maximum pressure
p, = pressure at estimated upper limit of runup
p, = pressure at toe of structure
q = overtopping rate (discharge)
qz = volumetric flow rate
q$ = dimensionless discharge over structure
q* = dimensionless overtopping rate
Q$ = dimensionless fitted empirical overtopping coefficient
r = correlation coefficient; also, roughness coefficient
R - wave runup R, - predicted wave runup R' = dimensionless runup
Rh = wave runup calculated by Hunt expression
T = wave period A
T = average wave period
Tp = peak wave period
T, = zero crossing wave period
U - empirical constant f, = volumetric flux under crest phase
V,,V2 = velocity of water at upwave and downwave end of structure repsectively
w = specific weight of water
x = distance
z = vertical axis
a - angle of approach; also empirical constant = empirical coefficient
6 = dimensionless standard deviation
6, = nondimensional standard deviation

spectral width parameter
wave transmission
structure slope; also, wave phase angle
dynamic viscosity
incident water wave level above still-water level
reflected water wave level above still-water level
wave water level above still-water level seaward and shoreward of structure respectively
dimensionless water surface elevation
density of fluid
surface tension