Crack growth model for pipelines exposed to concentrated carbonate–bicarbonate solution with high...
9
Crack growth model for pipelines exposed to concentrated carbonate–bicarbonate solution with high pH B.T. Lu a,⇑ , F. Song a , M. Gao b , M. Elboujdaini c a Environmental Performance of Materials, Materials Engineering Dept., Mechanical Engineering Div., Southwest Research Institute, San Antonio, TX 78238, USA b Blade Engineering Partners, 16225 Park Ten Place, Suite 450, Houston, TX 77084, USA c CANMET Materials Technology Laboratory, Nature Resources Canada, 568 Booth St., Ottawa, ON, Canada K1A 0G1 article info Article history: Received 28 June 2010 Accepted 12 August 2010 Available online 22 August 2010 Keywords: A. Steel C. Passive film C. Stress corrosion cracking abstract The crack tip strain rate (CTSR) and the dissolution/repassivation kinetics are the parameters controlling high pH SCC of pipeline steels because the repeated film rupture is the dominative mechanism. The CTSR is mainly produced by the crack tip advance and cyclic load. Theoretical expressions of the CTSR are given to account on these factors. After the anodic current density determined from a polarization curve mea- sured with a potential scanning velocity 1 V/min and the repassivation kinetic exponent obtained by the strained electrode method are utilized, the crack growth model proposed gives a reasonably good predic- tion to the crack velocity experimentally observed. A numeric simulation in a 0.5 M carbonate + 0.5 M bicarbonate solution indicates that the effect of mass transfer within crack on the crack growth is negli- gible when the crack velocity is below 10 9 m/s. Various factors affecting the SCC are discussed. Crown Copyright Ó 2010 Published by Elsevier Ltd. All rights reserved. 1. SCC mechanism of pipeline steel in concentrated carbonate– bicarbonate solution The intergranular stress corrosion cracking (SCC) occurs on the external pipe surface exposed to concentrated carbonate–bicar- bonate solutions with high pH. It is widely accepted that the crack growth is dominated by the repeated rupture of passive film at crack tip [1,2]. The film rupture or slip-dissolution model has been proposed more than half century [2–6]. Theoretically, the average crack velocity produced by the film rupture mechanism can be for- mulated by Faraday’s law: _ a ¼ M zF q Q F _ e ct e F ð1Þ where F is Faraday’s constant, M and z are the molar mass of iron and the number of valence electrons, respectively, Q F is the electric charge passed in time interval between two successive film rupture events, _ e ct is the strain rate at the crack tip and e F is the rupture duc- tility of passive film. The average frequency of film rupture events is given by the reciprocal of mean time interval between the film rup- ture events t f ¼ e F = _ e ct . The crack growth is controlled by the fre- quency of film rupture events and the repassivation kinetics on the fresh metallic surface produced by the film rupture events. Experimental measurements have indicated that the repassivation kinetics of carbon steel after the film rupture can been approxi- mately formulated by [7,8] i a ¼ i a t t 0 n t P t o ð2Þ i a is regarded as the anodic current density immediately after the film rupture. The repassivation exponent n is generally in a range of 0.5–1. When t < t 0 , the surface created by the film rupture is be- lieved to be film-free. The values of repassivation kinetic parame- ters (i a ; n; t 0 ) are the functions of the local chemical environments at the crack tip, which depends heavily, in turn, on external corro- sive environments, the corrosion reactions and mass transport in crack and external pipe surface under disbanded coating. Normally, t 0 << t f ¼ e F = _ e ct . After substituting Eq. (2) into Eq. (1), the crack velocity will be further formulated as [6,7] _ a M zF q i a 1 1 n t 0 e F n _ e n ct ¼ a 1 n t 0 e F n _ e n ct ¼ Ae n ct ð3Þ where A ¼ a 1n t 0 F n ¼ i a 1n M zFq t 0 F n . When the film rupture mechanism dominates the crack growth, the material–environment interactions will affect the cracking kinetics via mainly altering the rupture ductility of passive film e F and the transient anodic dissolution behavior characterized by i a , t 0 and n. The role of material response to the mechanical force will be characterized by the crack tip strain rate (CTSR) as a func- tion of the stress intensity factor, mechanical properties of material and crack geometry. The time-dependent plastic deformation at crack tip can also be enhanced by the local anodic dissolution 0010-938X/$ - see front matter Crown Copyright Ó 2010 Published by Elsevier Ltd. All rights reserved. doi:10.1016/j.corsci.2010.08.023 ⇑ Corresponding author. Tel.: +1 210 522 2721; fax: +1 210 522 5122. E-mail addresses: [email protected], [email protected] (B.T. Lu). Corrosion Science 52 (2010) 4064–4072 Contents lists available at ScienceDirect Corrosion Science journal homepage: www.elsevier.com/locate/corsci
-
Upload
independent -
Category
Documents
-
view
0 -
download
0
Transcript of Crack growth model for pipelines exposed to concentrated carbonate–bicarbonate solution with high...

Corrosion Science 52 (2010) 4064–4072
Contents lists available at ScienceDirect
Corrosion Science
journal homepage: www.elsevier .com/locate /corsc i
Crack growth model for pipelines exposed to concentrated carbonate–bicarbonatesolution with high pH
B.T. Lu a,⇑, F. Song a, M. Gao b, M. Elboujdaini c
a Environmental Performance of Materials, Materials Engineering Dept., Mechanical Engineering Div., Southwest Research Institute, San Antonio, TX 78238, USAb Blade Engineering Partners, 16225 Park Ten Place, Suite 450, Houston, TX 77084, USAc CANMET Materials Technology Laboratory, Nature Resources Canada, 568 Booth St., Ottawa, ON, Canada K1A 0G1
a r t i c l e i n f o
Article history:Received 28 June 2010Accepted 12 August 2010Available online 22 August 2010
Keywords:A. SteelC. Passive filmC. Stress corrosion cracking
0010-938X/$ - see front matter Crown Copyright � 2doi:10.1016/j.corsci.2010.08.023
⇑ Corresponding author. Tel.: +1 210 522 2721; faxE-mail addresses: [email protected], baotong.lu
a b s t r a c t
The crack tip strain rate (CTSR) and the dissolution/repassivation kinetics are the parameters controllinghigh pH SCC of pipeline steels because the repeated film rupture is the dominative mechanism. The CTSRis mainly produced by the crack tip advance and cyclic load. Theoretical expressions of the CTSR are givento account on these factors. After the anodic current density determined from a polarization curve mea-sured with a potential scanning velocity 1 V/min and the repassivation kinetic exponent obtained by thestrained electrode method are utilized, the crack growth model proposed gives a reasonably good predic-tion to the crack velocity experimentally observed. A numeric simulation in a 0.5 M carbonate + 0.5 Mbicarbonate solution indicates that the effect of mass transfer within crack on the crack growth is negli-gible when the crack velocity is below 10�9 m/s. Various factors affecting the SCC are discussed.
Crown Copyright � 2010 Published by Elsevier Ltd. All rights reserved.
1. SCC mechanism of pipeline steel in concentrated carbonate–bicarbonate solution
The intergranular stress corrosion cracking (SCC) occurs on theexternal pipe surface exposed to concentrated carbonate–bicar-bonate solutions with high pH. It is widely accepted that the crackgrowth is dominated by the repeated rupture of passive film atcrack tip [1,2]. The film rupture or slip-dissolution model has beenproposed more than half century [2–6]. Theoretically, the averagecrack velocity produced by the film rupture mechanism can be for-mulated by Faraday’s law:
_a ¼ MzFq
Q F
_ect
eFð1Þ
where F is Faraday’s constant, M and z are the molar mass of ironand the number of valence electrons, respectively, QF is the electriccharge passed in time interval between two successive film ruptureevents, _ect is the strain rate at the crack tip and eF is the rupture duc-tility of passive film. The average frequency of film rupture events isgiven by the reciprocal of mean time interval between the film rup-ture events tf ¼ eF= _ect . The crack growth is controlled by the fre-quency of film rupture events and the repassivation kinetics onthe fresh metallic surface produced by the film rupture events.Experimental measurements have indicated that the repassivation
010 Published by Elsevier Ltd. All
: +1 210 522 [email protected] (B.T. Lu).
kinetics of carbon steel after the film rupture can been approxi-mately formulated by [7,8]
ia ¼ i�att0
� ��n
t P to ð2Þ
i�a is regarded as the anodic current density immediately after thefilm rupture. The repassivation exponent n is generally in a rangeof 0.5–1. When t < t0, the surface created by the film rupture is be-lieved to be film-free. The values of repassivation kinetic parame-ters (i�a;n; t0) are the functions of the local chemical environmentsat the crack tip, which depends heavily, in turn, on external corro-sive environments, the corrosion reactions and mass transport incrack and external pipe surface under disbanded coating. Normally,t0 << tf ¼ eF= _ect . After substituting Eq. (2) into Eq. (1), the crackvelocity will be further formulated as [6,7]
_a � MzFq
i�a1
1� nt0
eF
� �n
_enct ¼
a�
1� nt0
eF
� �n
_enct ¼ Aen
ct ð3Þ
where A ¼ a�1�n
t0�F
� �n¼ i�a
1�nM
zFqt0�F
� �n.
When the film rupture mechanism dominates the crack growth,the material–environment interactions will affect the crackingkinetics via mainly altering the rupture ductility of passive filmeF and the transient anodic dissolution behavior characterized byi�a, t0 and n. The role of material response to the mechanical forcewill be characterized by the crack tip strain rate (CTSR) as a func-tion of the stress intensity factor, mechanical properties of materialand crack geometry. The time-dependent plastic deformation atcrack tip can also be enhanced by the local anodic dissolution
rights reserved.

B.T. Lu et al. / Corrosion Science 52 (2010) 4064–4072 4065
[9]. This effect is not considered because of the difficulty in quan-titative analysis. In the practical applications, the parameters relat-ing to the repassivation kinetics (n, t0) and the ductility of passivefilms (eF) are often roughly regarded as the material constants.Therefore, the formulation of the crack tip strain rate (CTSR) ispractically important for the crack velocity prediction.
2. Local strain rate at crack tip
In the present study, pipelines are assumed to be under smallscale yield condition, i.e., the local stress/strain is K-dominated.When tensile load is applied, a plastic zone will form at crack tip.If the time-dependent plastic strain is not considered, the localstrain within the plastic zone is given by
ect ¼ ectðr;KÞ ð4Þ
where r is the distance from the crack tip. The local strain rate at thecrack tip will be [10]
_ect ¼@ect
@K
� �_K þ @ect
@r
� �_r ¼ @ect
@K
� �_K � @ect
@r
� �_a ¼ _e _K þ _e _a ð5Þ
_r � � _a by definition and _a is the instant crack velocity. In Eq. (5),_e _a ¼ � _a @ect
@r
� �stands for the CTSR component produced by the crack
tip advance and _eK ¼ @ect@K
� �_K is attributed to the changes of stress
intensity factor (SIF) caused by the load fluctuations and/or theincrement of crack size.
2.1. Formulation of CTSR at a growing crack
It has been recognized that the singularity at a non-stationarycrack tip is weaker than that at the stationary one [11]. For astrain-hardening material, one of most widely cited solutions forthe growing crack tip stress/strain field at the plain strain state isproposed by Shoji [12], which is based on the work of Gao andHwang published in 1981 [13],
ect / lnR�
r
� N�N��1
ð6Þ
In Eq. (6), N* is the strain-hardening exponent for a material that isdefined by [13]
eey¼ r
ryþ a�
r� ry
ry
� �N�
ð7Þ
where ey = ry/E, ry and E are the yield strength and Young’s modu-lus of material, the coefficient a* and the exponent N* are materialconstants. Gao and Hwang [13] did not define the parameter R*.Normally, R* is replaced by the plastic zone ahead of crack tip
(Rp). Under the plane strain condition Rp � 13p
Kry
� �2. The typical N*
value for pipeline steel is about 1.6. Seeking the time derivative ofEq. (7), we will have Shoji’s equation [12],
_ect ¼ _eK þ _e _a ¼ 2_KKþ
_aro
!N�
N� � 1bry
Eln
13pro
Kry
� �2" #( ) 1
N��1
ð8Þ
where the coefficient b is a constant with a typical value 5.08 [22].Owing to the singularity of the strain field at crack tip, the localstrain and strain rate tend to be infinite as r ? 0. In the practical cal-culation of local strain rate, the specific length r0 has been intro-duced in Eq. (8) to replace r. r0 is commonly treated as a materialconstant depending on the microstructure of steel and the crackgrowth mechanism [12]. In accordance with the FEM analysis re-ported by Peng et al. [14], r0 is in the range of 1 � 10�6 to5 � 10�6 m for steels. In the present analysis, r0 = 1 � 10�6 m is
employed. The first term at the left side of Eq. (8) represents _e _Kand second term equals to _e _a.
In 1983, Gao et al. [15] revised their model to fit the boundaryconditions of Model III crack better and they found that the expres-sion as follows was more suitable to be used to formulate the strainfield ahead of the steadily growing crack
ect / lnR�
r
� �� 2NN�1
ð9Þ
Again, R� � Rp � 13p
Kry
� �2. In Eq. (9), the strain-hardening behavior of
material is assumed to obey Ramberg–Osgood law (1 < N <1) [16]:
eeyþ r
ryþ a�
r� ry
ry
� �N
ð10Þ
The coefficient a is a material constant depending on the definitionof the yield strength. In engineering applications, 0.2% of plasticstrain is often defined as the yield strain. For pipeline steels,a � 1. The typical N value for pipeline steels is about 6. Seekingthe time derivative of Eq. (10), we can obtain a different equationfor the CTSR ahead of the steady growing crack [17]
_ect ¼ _eK þ _e _a ¼_KKþ
_aro
!2N
N � 1bry
Eln
13pro
Kry
� �2" #( )Nþ1
N�1
ð11Þ
The solution in form of Eq. (10) was also confirmed by Fan et al. [18]in a plate with Mode I crack at the plain stress state and by Gao [19]for Model II crack in materials of which the strain-hardening behav-ior is described by Eq. (7). It is known the cracks in SCC develop nor-mally alone the plain where maximum tensile stress is applied(Mode I cracks) and the major part of crack growth lifetime is spentin the propagation under the plain strain condition. It is hard to con-clude which constitutive relation of material is more suitable to thesolution in form of Eq. (10). Actually, the strain-hardening exponentN instead of N* was often employed, when Shoji’s equation (Eq. (8))was applied to estimate the near-tip strain [10–12,14], although itis not rigorous in theory. A recent review on the effects of strain-hardening exponent on the CTSR estimation has been given by Shojiet al. [17]. They thought the both constitutive models were applica-ble if a suitable r0 value was chosen. With the aid of Eq. (9), Hall [10]proposed an alternative CTSR equation as follows:
_ect ¼ _e _K þ _e _a
¼ 2N1þN
ary
EK2
aInr0r2y
! NNþ1 _K
Kþ 2bN
N�1ry
E_a
r0ln
13pr0
Kry
� �2" #( )Nþ1
N�1
ð12Þ
The difference between Eqs. (11) and (12) is the expressions for _e _K .Hall [10] utilized the time derivative of the strain field of a steadycrack given by Hutchinson [20], Rice and Rosengren [21] (the HRRfield) to replace the first term in Eq. (11), _e _K .
ect ¼ ary
EJ
aInryeyr
� � N1þN
¼ ary
EK2
aInrr2y
! N1þN
ð13Þ
a is the material constant in Ramberg–Osgood law. In is a constantdepending on the strain-hardening exponent. When N � 6, close tothe strain-hardening exponent of pipeline steels, In � 4.9 [20]. Since_e ¼ _d=r0 , Hall’s equation will become the solution given by Riceet al. [22] for elastic and perfectly plastic material (N ?1) underthe plane strain condition [17].
_d ¼ a0Jryþ b _a
ry
E
� �ln
Rp
r
� �ð14Þ

4066 B.T. Lu et al. / Corrosion Science 52 (2010) 4064–4072
2.2. CTSR due to crack tip advance
Under steady load, the term of _KK results from the increase of
crack size. In this case, _e _K << _e _a and _ect � _e _a. So
_ect � _e _a ¼N�
N� � 1_a
r0
bry
Eln
13pr0
Kry
� �2" #( ) 1
N��1
ð15Þ
_e � _e _a ¼2N
N � 1_a
r0
bry
E2 1
3pr0
Kry
� �2" #( )Nþ1
N�1
ð16Þ
The differences in the two above CTSR equations are the exponents[(1/(N* � 1) vs. (N + 1)/(N � 1)] and a term in the coefficient [N*/(N* � 1) vs. 2N/(N � 1)]. Considering N* � 1.6 and N* � 6, the ratioof exponents will be 1.67:1.4 and that of coefficient will be2.67:2.4. It means that the CSTR estimated by these two equationsare quite close. Therefore, in the following sections, only Eq. (16) isexamined because Ramberg–Osgood law is more commonlyutilized.
2.3. CSTR due to cyclic load
There are several different ways to estimate the CTSR undercyclic load but few of them have been directly confirmed by exper-iments. Owing to the heavily plastic deformation in the plasticzone ahead of crack tip, cyclic hardening or softening, the correla-tion between the CTSR and _K or K is likely to be nonlinear. Underthe small scale yield condition, the formulation of local strain rateat crack tip caused by the cyclic load is often correlated the alter-ative crack tip opening displacement (CTOD) range Dd [23]
Dect ¼Ddr0¼ dn
DdEry r0
¼ dn
r0
DK2
Eryð17Þ
dn is a constant depending on the stress state and the strain-hard-ening exponent [24], DK(= Kmax � Kmin) is the cyclic stress intensityfactor range, where Kmax and Kmin are the maximum and minimumstress intensity factors during cyclic loading, respectively. The rela-tion as Eq. (17) has been experimentally confirmed by the in situstereo-image technique [25]. Therefore, the average crack tip strainrate of a stationary crack in a stress cycle can be approximated by
_e _k ¼Dect
Dt¼ fdn
DK2
Eryr0¼ e0f ð1� R0Þ2K2
max ð18Þ
n = e0f(1 � Rr)2 is the unique parameter to characterize the effect ofcyclic load on the CTSR; the stress ratio R ¼ Kmin
Kmax, Dt is the time per-
iod to complete a stress cycle and is equal to the reciprocal of load-ing frequency f; for pipeline steel under the plain strain condition,dn � 0.3 [24]; e0 is regarded as a material constant depending onthe environment of testing because the incorporation of hydrogeninto material or the adsorption of certain species on surface may al-ter the mechanical properties of material. It has been observedexperimentally that the CTODs measured from cracks in the hydro-gen-charged steels are smaller than those measured from the non-charged ones [26], owing to the embrittlement of material. The typ-ical values of yield strength and Young’s modulus of pipeline steelare 450 MPa and 2 � 106 MPa, respectively. In line with Eq. (18),
e0 ¼dn
Eryr0¼ 0:3
2� 106 � 450� 1� 10�6 ¼ 3:33� 10�4MPa�2m�1
This value is close the experimental datum reported by Hudak et al.[25]: e0 � 1.56 � 10�4 MPa�2 m�1, which was measured from type304 stainless steel. It implies that r0 = 1 � 10�6 m is a reasonablygood approximation in the CTSR estimation.
2.4. Threshold SIF for crack growth
Numerous evidences have indicated the existence of a thresholdstress intensity KISCC below which the crack arrests under eithersustained load or cyclic load. Based on the concept of the film rup-ture mechanism for SCC, the local strain accumulated will eventu-ally reach the critical value eF to cause the rupture of passive film atthe crack tip no matter how small the CSTR is. A crack stops prop-agating only in the case that the CSTR is zero. It will only happenwhen the cracked body is stress-free, i.e., Kmax = 0 and DK = 0.Therefore, to predict the propagation behavior of a long crack,some modifications are required to account on the existence ofKISCC.
A large amount of experimental observations have revealed thatthe crack tip cannot open until the stress intensity factor reaches acritical value, during stress-cycling [27]. It has been widely ac-cepted that the SIF can drive a fatigue crack to propagate onlywhen it exceeds the critical value. The crack closure may resultfrom the reversed plastic deformation in the plastic zone aheadof the crack tip, the surface roughness in crack surface and thebuild-up of oxides/corrosion products within the crack enclave[28]. The crack closure effect is significant for a long crack (longerthan a few mm) and it declines and eventually disappears as thecrack size is reduced [29]. Therefore, it is widely utilized to explainwhy long cracks and short cracks behave differently [30]. The de-tails of crack closure mechanisms are out of scope of this studybut the concept of crack closure will be utilized in this study tointroduce the threshold of crack growth, considering the fact thatthe stress fluctuations cannot affect the CTSR when the crack sur-faces keep in touch. Following McEvily’s approach, the real cracktip opening displacement can be expressed as follows [31]:
Ddeff ¼ Dd� Ddth ð19Þ
The fatigue crack velocity will cease propagation as Ddeff ð/ DK2�DK2
thÞ approaches to zero. DKth is the threshold of crack growth.So, Ddth ¼ dnDK2
th=Ery [31]. The CTSR is likely to be a function ofDdeff instead of Dd [31]. The CTSR will be zero, as long as Dd 6 Ddth.Under sustained load, a stress corrosion crack cannot propagatewhen K 6 KISCC [32,33]. Hence, it is reasonable to assume
Ddth ¼ð1� RÞ2K2
ISCC
Ery¼ r0e0ð1� RÞ2K2
ISCC ð20Þ
The CSTR created by the crack tip advance must also be zero as longas Kmax 6 KISCC. After replacing K2 in Eq. (16) and K2
max in Eq. (18)with K2
max � K2ISCC , the CTSR will be re-formulated as follows:
_ect ¼ _e _a þ _e _K
¼_a
r0
2NN � 1
bry
EIn
K2max � K2
ISCC
3pr0r2y
!" #Nþ1N�1
þ n K2max � K2
ISCC
� �ð21Þ
The values of parameters in Eq. (21) can be found in Table 1.
3. Crack growth model
Inserting Eq. (21) into Eq. (3), we have,
_a � A _enct ¼ A
_ar0
2NN � 1
bry
EIn
K2max � K2
ISCC
3pr0r2y
!" #Nþ1N�1
8<:þf e0ð1� RrÞ2ðK2
max � K2ISCCÞ
9=; ð22Þ
Eq. (22) is expression of crack velocity dominated by the film rup-ture mechanism. To check the applicability of Eq. (22), the numericsimulation program originally developed by Song [7] was
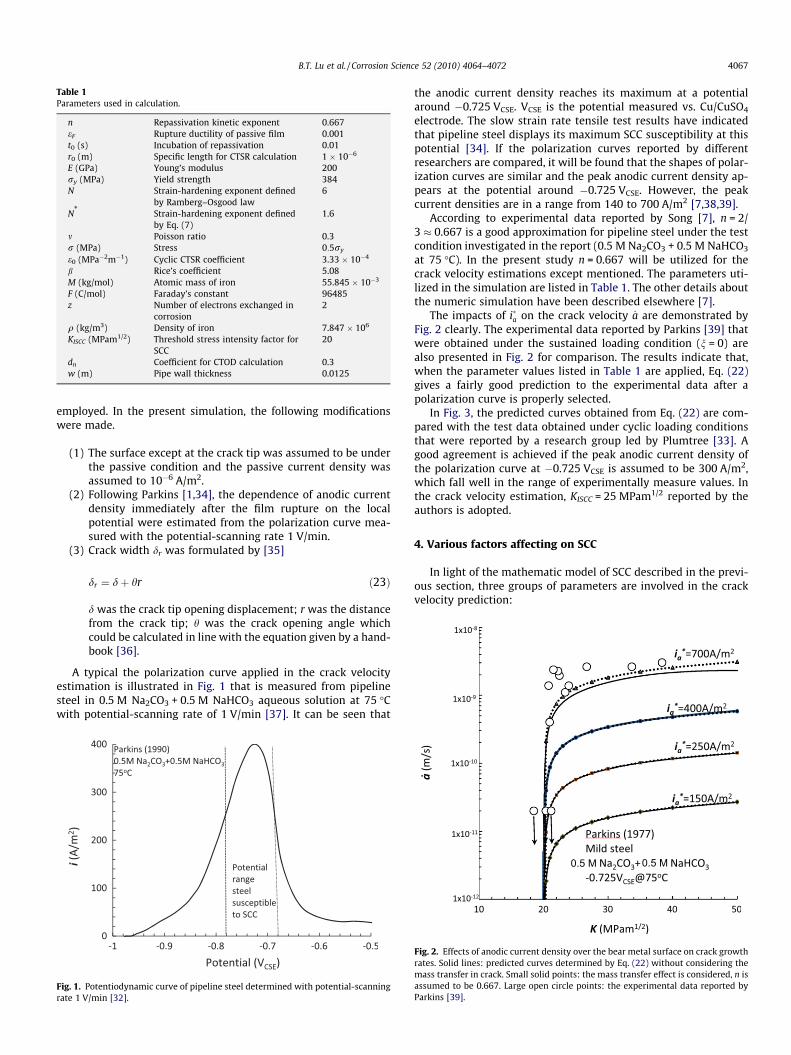
Table 1Parameters used in calculation.
n Repassivation kinetic exponent 0.667eF Rupture ductility of passive film 0.001t0 (s) Incubation of repassivation 0.01r0 (m) Specific length for CTSR calculation 1 � 10�6
E (GPa) Young’s modulus 200ry (MPa) Yield strength 384N Strain-hardening exponent defined
by Ramberg–Osgood law6
N* Strain-hardening exponent definedby Eq. (7)
1.6
m Poisson ratio 0.3r (MPa) Stress 0:5ry
e0 (MPa�2m�1) Cyclic CTSR coefficient 3.33 � 10�4
b Rice’s coefficient 5.08M (kg/mol) Atomic mass of iron 55.845 � 10�3
F (C/mol) Faraday’s constant 96485z Number of electrons exchanged in
corrosion2
q (kg/m3) Density of iron 7.847 � 106
KISCC (MPam1/2) Threshold stress intensity factor forSCC
20
dn Coefficient for CTOD calculation 0.3w (m) Pipe wall thickness 0.0125
B.T. Lu et al. / Corrosion Science 52 (2010) 4064–4072 4067
employed. In the present simulation, the following modificationswere made.
(1) The surface except at the crack tip was assumed to be underthe passive condition and the passive current density wasassumed to 10�6 A/m2.
(2) Following Parkins [1,34], the dependence of anodic currentdensity immediately after the film rupture on the localpotential were estimated from the polarization curve mea-sured with the potential-scanning rate 1 V/min.
(3) Crack width dr was formulated by [35]
Fig. 1. Prate 1 V
dr ¼ dþ hr ð23Þ
d was the crack tip opening displacement; r was the distancefrom the crack tip; h was the crack opening angle whichcould be calculated in line with the equation given by a hand-book [36].
A typical the polarization curve applied in the crack velocityestimation is illustrated in Fig. 1 that is measured from pipelinesteel in 0.5 M Na2CO3 + 0.5 M NaHCO3 aqueous solution at 75 �Cwith potential-scanning rate of 1 V/min [37]. It can be seen that
otentiodynamic curve of pipeline steel determined with potential-scanning/min [32].
the anodic current density reaches its maximum at a potentialaround �0.725 VCSE. VCSE is the potential measured vs. Cu/CuSO4
electrode. The slow strain rate tensile test results have indicatedthat pipeline steel displays its maximum SCC susceptibility at thispotential [34]. If the polarization curves reported by differentresearchers are compared, it will be found that the shapes of polar-ization curves are similar and the peak anodic current density ap-pears at the potential around �0.725 VCSE. However, the peakcurrent densities are in a range from 140 to 700 A/m2 [7,38,39].
According to experimental data reported by Song [7], n = 2/3 � 0.667 is a good approximation for pipeline steel under the testcondition investigated in the report (0.5 M Na2CO3 + 0.5 M NaHCO3
at 75 �C). In the present study n = 0.667 will be utilized for thecrack velocity estimations except mentioned. The parameters uti-lized in the simulation are listed in Table 1. The other details aboutthe numeric simulation have been described elsewhere [7].
The impacts of i�a on the crack velocity _a are demonstrated byFig. 2 clearly. The experimental data reported by Parkins [39] thatwere obtained under the sustained loading condition (n = 0) arealso presented in Fig. 2 for comparison. The results indicate that,when the parameter values listed in Table 1 are applied, Eq. (22)gives a fairly good prediction to the experimental data after apolarization curve is properly selected.
In Fig. 3, the predicted curves obtained from Eq. (22) are com-pared with the test data obtained under cyclic loading conditionsthat were reported by a research group led by Plumtree [33]. Agood agreement is achieved if the peak anodic current density ofthe polarization curve at �0.725 VCSE is assumed to be 300 A/m2,which fall well in the range of experimentally measure values. Inthe crack velocity estimation, KISCC = 25 MPam1/2 reported by theauthors is adopted.
4. Various factors affecting on SCC
In light of the mathematic model of SCC described in the previ-ous section, three groups of parameters are involved in the crackvelocity prediction:
Fig. 2. Effects of anodic current density over the bear metal surface on crack growthrates. Solid lines: predicted curves determined by Eq. (22) without considering themass transfer in crack. Small solid points: the mass transfer effect is considered, n isassumed to be 0.667. Large open circle points: the experimental data reported byParkins [39].

Fig. 3. Comparison between the crack velocities determined by experiments andpredicted by Eq. (22) (the test data are quoted from Ref. [33]).
4068 B.T. Lu et al. / Corrosion Science 52 (2010) 4064–4072
(1) the mechanical properties and microstructural characteris-tics of steels that affect the CTSR, including Young’s modulusE, the yield strength ry, the strain-hardening exponent N (orN*), the specific length r0 and the coefficient b and e0;
(2) the parameters to characterize the external loads, such asthe maximum stress rmax, the stress intensity factor K, thecyclic loading frequency f and the stress ratio Rr etc.;
(3) the service environments (soil chemistry, local solutionchemistry in the area under the disbonded coating, temper-ature etc.) that is characterized by the parameters describingthe electrochemical responses of material to the corrosiveenvironments and the property of passive films, such asi�an; t0; eF , as well as the potential range in which pipelinesteel is susceptible to SCC.
The variables in the first category are mainly material proper-ties. Some of them are well known (e.g., E) or ready to be measuredby experiments (the yield strength and strain-hardening expo-nent). The specific length r0 is regarded as a material constantdepending on microstructure of steel and the crack growth mech-anism [10,12,14], although there is still uncertain about its real va-lue. It is worthy to note the plastic deformation (cold work)produce by the field bending or soil movement may alter the yieldstrength and strain-hardening exponent, reduce ductility of steeland enhance the SCC susceptibility of pipeline steels [40,41].
The second class variables depend mainly on the substance tobe transported (oil or gas). There are some statistical results onthe loading history of various pipelines [42,43]. More discussionson this aspect will be found in the following subsections.
The last kind of variables is related to the material–environ-ment interaction. The information of local solution chemistry onpipe surface can be obtained by the water chemistry analysis forthe water samples collected in field. The SCC susceptibility of pipe-lines is affected by the local environments over the external pipesurface under the disbonded coating [44]. Davies and Burstein[45] pointed out that the presence of HCO3
� accelerated the anodicdissolution of iron in the both active and passive regions, owing tothe formation of the stable soluble complex anoin Fe(CO3)2
2�. Sim-ilar phenomenon was also found in carbon steel/concentratedbicarbonate solution system [46]. With the aid of slow strain ratetensile (SSRT) test technique, Parkins [47] examined the crackingvelocity of a carbon steel in a 0.5 M NaHCO3–0.25 M Na2CO3 solu-tion with the additions of sodium chloride, over a range of 0–200 g/l, sodium sulfate, in a range of 0–50 g/l, and sodium nitrate, with
concentration of 10–100 g/l, respectively. He found that crackvelocity decreased with increasing chloride concentration andthe impacts of the sulfate and nitrate were insignificant. Experi-ments [48–50] and numeric simulation [44,51] have indicated thatthe local solution chemistry is controlled by the soil chemistry, cli-mate, temperature and electrochemical potential distribution overthe pipe surface, as well as the mass transfer under the disbondedcoating. Parkins and Zhou [52,53] evaluated that influence of pH in1 M NaHCO3, obtained by varying the concentrations of CO2 andNa2CO3
�, on the potential range and severity of cracking. It wasfound that the pH range for cracking extended from 6.7 to 11 at25 �C and shifted to the negative direction with an increase ofpH. The crack velocity increased with decreasing pH. Similar phe-nomenon was found at 75 �C but the potential range for crackingextended from 8.5 to 10.5 and narrowed with increasing pH [47].The potential range for cracking is about 0.1 V wide and the crackvelocity decreases with increasing pH and HCO3
� concentration.For the corrosive system of interest in this work, the most
important species affecting the corrosion behavior of steel are H+,CO3
2�, HCO3� and Cl�. A numeric simulation indicated that the
cathodic polarization might repulse the chloride ions out of thedisbonded coating areas [44]. The anodic polarization over the rel-atively film-free surface for a given material is not very sensitive tothe concentration of CO3
2�, HCO3� and pH, as well as the potential-
scanning rate. In the potential range for the active-to-passive tran-sition, the anodic dissolution behavior depends heavily on thesolution chemistry. The peak current potential itself relies alsoon the solution chemistry and temperature. The reduced concen-tration of CO3
2�, HCO3� , lower pH and temperature will result in
a high peak current potential.Owing to the technical difficulties, it is still hard to measure the
exact values of t0 and eF. The value of t0 is commonly in the order of10�2 s. According to experimental data reported by Ford [6], eF is ina range from 5 � 10�4 to 5 � 10�3. eF = 1 � 10�3 to 3 � 10�3 shouldbe reasonable approximations for the film rupture ductility basedon our best knowledge current available.
Some important factors influencing the high pH SCC of pipelinesteels will be discussed individually in the following sections.
4.1. Mass transfer in crack
The electrochemical reaction kinetics at crack tip should be clo-sely related to the local solution chemistry. To understand the localsolution chemistry evolution at crack tip during crack propagation,the coupling process of mass transfer and electrochemicalreactions are numerically simulated for a crack exposed to 0.5 MNa2CO3 + 0.5 M NaHCO3 solution at 75 �C using the modified pro-gram mentioned in the previous section [7]. The results in Fig. 4indicate that, when the crack velocity under the sustained load isnot higher than 1 � 10�9 m/s, the potential drop within the crackwith a depth of several mm is only a few mV owing to the concen-trated chemistry investigated, resulting in a very small drivingforce for electric immigration. The changes of solution chemistry(Fig. 5) and pH (Fig. 6) within the crack are insignificant. Hence,the change of anodic current density on the fresh crack tip surface(i�a) is also negligible (Fig. 7).
It should be mentioned that Parkins’ experiments were con-ducted �0.725 VCSE where the pipeline steel displayed its maxi-mum SCC susceptibility in 0.5 M Na2CO3 + 0.5 M NaHCO3 solutionat 75 �C. During the service, the pipelines are exposed to the catho-dic protection of certain extent and the service temperature maybe lower than 75 �C. These will result in a lower crack velocity.The combined actions of cathodic polarization and evaporationare necessary for the formation of concentrated carbonate/bicar-bonate chemistries with high pH in the crevices under the disbond-ed coating [48,44]. The average crack velocity observed in the field

Fig. 4. The potential drop in crack during crack propagation.
Fig. 5. The change of concentration of Fe2+ during crack propagation.
Fig. 6. The change of pH in crack during crack propagation.
Fig. 7. The change of anodic current density on the crack tip surface soon afterpassive film rupture during crack propagation (the anodic current density isnormalized by its initial value).
B.T. Lu et al. / Corrosion Science 52 (2010) 4064–4072 4069
is normally below 10�11 m/s, much lower than the crack velocitydata shown in Figs. 3 and 4. Therefore, the potential drop andthe mass transfer in crack will not be important factors to be con-
sidered in modeling crack growth. In this study, the following sim-plifications will be adopted in the crack velocity prediction,
(1) Ecracktip = Ecrackmounth.(2) The chemical composition of solution at the crack tip is the
same as that of bulk solution.(3) The anodic current density on the bare metal surface at crack
tip can be estimated from the polarization curve measuredby the fast potential scanning (1 V/min) when the potentialat the crack mouth is known.
In Fig. 2, the estimated crack velocities under the sustained loadwith and without considering the potential drop/mass transfer inthe crack are compared. It seems to be a reasonably good approxima-tion to ignore the effects of potential drop and mass transfer in crack.
4.2. Electrochemical potential and anodic current density i�a
In accordance with the film rupture model, the potential affectsthe SCC development mainly via the anodic current density i�a,which is a function of potential depicted by the fine dotted lineon top of Fig. 8. The typical dependence of crack velocity on theelectrochemical potential is illustrated in Fig. 8 where the solidlines represent the crack velocity under cyclic load ( _a). It can beseen that pipeline steel displays the maximum crack velocity atthe potential where the polarization curve shows an anodic currentpeak and the crack velocity declines as i�a is reduced. This phenom-enon has been observed experimentally [1,54].
To demonstrate the different impacts of CTSR produced by cracktip advance and cyclic load in crack velocity, in Fig. 8 the crackvelocity under the sustained load (the dashed lines: _as) and thecrack velocity component caused purely by the cyclic load (thedotted–dashed line: _ac) are presented. They are given by the fol-lowing equations
_as ¼ A _en_a
¼_a�
1� n
� � 11�n t0
eF
� � n1�n 2N
N � 1bry
r0E
� � n1�n
InKmax2 � K2
ISCC
3pr0r2y
!" #Nþ1N�1
n1�n
ð24Þ
_ac ¼ A _en_K ¼
_a�
1� n
� �t0
eF
� �n
½nðK2max � K2
ISCCÞ�n ð25Þ
Fig. 8. Effect of potential on crack growth rate (the open circles represent the sumof _as þ _ac). Fig. 9. _a� vs. _a= _a� (the open circles represent the sum of _as þ _ac).
Fig. 10. Effect of repassivation kinetics exponent on crack growth rates.
4070 B.T. Lu et al. / Corrosion Science 52 (2010) 4064–4072
_ac is a linear function of i�a and the crack velocity under sustainedload is a power function of i�a with an exponent of 1/(1 � n). The factof n < 1 implies that the crack velocity under sustained load is moresensitive to i�a or the change of potential, compared with the crackgrowth behavior under cyclic load. As a result, the significant crackgrowth under sustained load is only observed within a narrowrange of potential (about 0.1 V). This agrees with the commonknowledge that the corrosion fatigue can occur at the potentialswhere SCC does not.
The dependence of crack velocity on corrosion kinetics is moreclearly shown in Fig. 9, where the crack velocity is normalized bythe upper limited growth rate ð _a= _a� ¼ i�aM=zFqÞ and is plottedagainst _a� in the log–log scale. The line representing _as= _a� is astraight line with a slope of n/(1 � n). _ac= _a� is a group of straightlines parallel to the x-coordinate because it is independent of _a�._a= _a� ¼ 1 corresponds to the crack velocity produced by fully activedissolution of film-free crack tip. Therefore, as the parameter n ex-ceeds certain critical value. The effect of the corrosive mediuminvestigated will tend to be saturated because the crack tip is notable to be passivated due to the high CTSR. According to Fig. 9,the critical value of n � 5 � 10�6 MPa�2 m�1s, corresponding load-ing frequency will be about 0.1 Hz when R = 0.5. This predictionagrees with the experimental observations reported by Wei andChou [55] who measured the corrosion fatigue crack velocity ofX70 steel in quiescent solution of 0.5 M Na2CO3 + 0.5 M NaHCO3
when DK = 40 MPa and Rr = 0.1 within the range of cyclic loadingfrequency from 0.03 to 10 Hz (the corresponding value of n > 3 �10�6 MPa�2 m�1 s).
In Fig. 9, the lines representing _a ¼ 2� 10�12 and _a ¼ 2�10�11 m/s are also depicted. The former corresponds the crackgrowth life around 50 years, i.e., a crack will take 50 years to pen-etrate 50% thickness of pipe wall (w = 0.37500 � 10 mm) [56], andthe latter will stand for the 5 year crack growth life. The averagecrack velocities observed in field fall between these two extremevalues. It is shown that the contribution of cyclic load can beapproximately ignored in the service life prediction whenn < 3 � 10�10 MPa�2 m�1 s. For pipelines transporting liquids, theR-ratio can be as low as 0.6 and the loading frequency may be high-er than 10�3 Hz, corresponding n P 3 � 10�8 MPa�2 m�1 s. In thiscase, the cyclic load may play an important role.
Eq. (22) does not give the crack velocity explicitly. It is not veryconvenient in application. The data in Figs. 8 and 9 suggest that thecrack growth rates produced by the SCC mechanism can be approx-imately expressed as a sum of two components. Numeric calcula-tions indicate that the following equations give the approximateprediction of Eq. (22) with error less than 15% within the crack
velocity range of interested ( _a ¼ 1012 � 10�9 m/s; n = 10�11�3� 10�8 MPa�2 m�1 s�1; Kmax 6 60 MPam/m1/2), as the examplesshown in Figs. 8 and 9,
_a � _as þ _ac ð26Þ
4.3. Repassivation kinetics
The repassivation kinetics is one of important aspects has to beconsidered to access the crack growth behavior that is dominatedby film rupture mechanism. The repassivation exponent n is theparameter characterizing the repassivation. When i�a and tf ¼ eF= _ect
are held unchanged, the electric charge passing through the cracktip, and hence the crack velocity, will be reduced with an increaseof n, as demonstrated by the dependence of crack velocity under sus-tained load on the repassivation kinetic exponent n (Fig. 10).
When Kmax is held constant, the effect of cyclic load on crackvelocity will enhanced with an increase of n value since the ratioof _ac as measured with different n values (n1, n2, for example) willproportional to (n2/n1)n, as predicted by Eq. (25). The repassivationkinetics is strongly affected by environmental factors, such aswater chemistry, temperature and potential [6], as well as thecompositions and microstructures of steels. However, it is still hardto evaluate quantitatively the effects of environmental variables onthe repassivation kinetics when experimental data are lack.

B.T. Lu et al. / Corrosion Science 52 (2010) 4064–4072 4071
4.4. Cyclic load
The impacts of cyclic load on the crack propagation of pipelinesteel in the high pH chemistry are related to the following threeaspects
(1) enhancing exchange of the liquid in the crack with bulksolution;
(2) affecting the crack tip strain rate via _e _K ;(3) producing fatigue damage.
The pumping action produced by the repeated opening andclosing under cyclic load will enhance the exchange of the localchemistry in the crack and bulk solution [35]. When exposed toconcentrated carbonate–bicarbonate solution, the mass transferin crack is fast, so that the impacts produced by cyclic loads withvery low frequencies on the local solution chemistry in crack canbe ignored.
In accordance with Eqs. (21) and (22), the CSTR is a linear func-tion of n. An increase of loading frequency and a decrease of stressratio will lead to an increase of CTSR and promote crack growth.This predicted has been demonstrated by the experimental datain Fig. 3. The crack growth rate component _ac results from the cyc-lic load-enhanced anodic dissolution at the crack tip. If corrosivemedium is absent, i�a ¼ 0 and, as a result, _ac ¼ 0.
As long as DK > DKth, a crack will propagate without the aid ofcorrosive environment, simply owing to mechanical fatigue. Whenfatigue and SCC mechanisms coexist, the cracking behavior isnamed as corrosion fatigue. According to ASME boiler and pressurevessel code, Section XI [57], the corrosion fatigue crack growth rateis estimated using the linear superposition model proposed by Wei[58],
_aCF ¼ _aF þ _a � fdadN
� �F
þ _as þ _ac ð27Þ
In Eq. (27), _aCF is the crack velocity produced by corrosion fatigueand (da/dN)F is fatigue crack growth rate; the crack velocity dueto SCC is _a � _as þ _ac . The fatigue crack growth rate of pipeline steelsin air can be approximately formulated by Paris’ law
dadN
� �F¼ CDKm ð28Þ
m = 3.97 and C = 2.03 � 10�14 + 5.4 � 1013 Rr (MPa�3.97 m�0.985) totake the effect of stress ratio into account [33]. The unit of da
dN
� �F is
Eq. (28) is m/cycle. In ASME boiler and pressure vessel code, Sec-tion XI [57], the impact of loading frequency on fatigue crackgrowth is approximately ignored. The effect of loading frequencyon SCC has been demonstrated in Figs. 8 and 9. In the service ofpipelines, the cyclic loads are produced by the low frequent fluctu-ations of internal pressures. The relative contributions of fatigueand SCC depend on the anodic dissolution rate of crack tip and cyc-lic loads. The maximum loading frequencies in pipeline operationare normally less than 5 � 10�3 Hz. For the pipelines transportinggas, the typical stress ratio is large than 0.9 and the minimum stressratio is not less than 0.8. The maximum crack velocity producedpurely by fatigue in Kmax range of interest (25–50 MPam1/2), accord-ing to Eq. (28), will be 1.3 � 10�13 to 2.1 � 10�12 m/s, much lowerthan the crack velocities experimentally measured (Fig. 3). Actually,the loading frequency of the gas line is low than 5 � 10�3 Hz, result-ing in an even low crack velocity. Hence the contribution of fatigueto the crack growth can be ignored in the life prediction for gaslines. However, for the pipelines transporting liquid, the minimumstress ratio can be as low as 0.6, giving rise to a maximum fatiguecracking velocity ranging from 1.0 � 10�12 to 1.6 � 10�11 m/s. Inthis case, the contribution of fatigue mechanism may be compara-
ble with that of SCC, depending on the loading spectra of pipelineand the local environments at the external pipe surface below thedisbonded coating. Therefore, depending on operation conditions,the fatigue crack growth rate may be a factor to be considered inthe life prediction.
5. Summary
A predictive model is proposed for the crack growth of pipelinesexposed to the concentrated carbonate–bicarbonate solution basedon the following assumptions.
(1) The crack growth is dominated by the repeated film ruptureat the crack tip.
(2) The crack tip strain rate due to crack advance can be esti-mated by Eq. (15) or (16).
(3) The crack tip strain rate induced by the cyclic load is domi-nated by the alternative crack tip opening displacement.
(4) The anodic dissolution rate over the bare metal surface pro-duced by the rupture of passive film can be estimated fromthe polarization curve of pipeline steel measured in the bulksolution with a potential scanning velocity of 1 V/min.
After pre-determining some important parameters (r0 = 10�6 mand n = 0.667), the proposed model can provide reasonable predic-tion for the experimental data reported in literature.
In accordance with the proposed model, pipeline steels will dis-play the maximum crack velocity at the potential where anodiccurrent peak appears. When the CTSR is governed by cyclic defor-mation, the crack velocity a linear function of the anodic currentdensity over the bare metal surface i�a. When CTSR is mainly pro-duced by the crack tip advance, the crack velocity is a power func-tion of i�a with an exponent equal to 1/(1 � n). When the crackvelocity is lower than 1 � 10�9 m/s, the effects of mass transferin crack can be ignored in concentrated Na2CO3–NaHCO3 solutions.
Acknowledgements
The project was conducted under DOT Contract DTPH 56-08-T-000001. James Merritt of PHMSA/DOT provided management over-sight for the project. This work is co-sponsored by CANMET Mate-rials Laboratory of the Natural Resources of Canada (WinstonRevie), Williams Pipeline Company (Sergio Limon), and TransCana-da Pipeline Company (Richard Kania and Robert Worthingham) fortheir support. The project also benefited from the input of Dr. Ray-mond R. Fessler of BIZTEK Consulting Inc. earlier in this program.
References
[1] R.N. Parkins, Corrosion 46 (1990) 178–189.[2] R.N. Parkins, Corrosion 52 (1996) 363–374.[3] D.A. Vermilyea, J. Electrochem. Soc. 119 (1972) 405–407.[4] R.W. Staehle, Prediction and experimental verification of the slip-dissolution
model for stress corrosion cracking of low strength alloys, in: R.W. Stahler, J.Hochmann, R.D. McCright, J.E. Slates (Eds.), Stress Corrosion Cracking andHydrogen Embrittlement of Iron-Based Alloys, NACE, Huston, 1977, pp. 180–205.
[5] J.C. Scully, Corros. Sci. 15 (1975) 207–224.[6] F.P. Ford, Corrosion 52 (1996) 375–395.[7] F.M. Song, Corros. Sci. 51 (2009) 2657–2674.[8] R.W. Staehle, Corros. Sci. 49 (2007) 7–19.[9] D.A. Jones, Corrosion 52 (1996) 356.
[10] M.M. Hall Jr., Corros. Sci. 50 (2008) 2902–2905.[11] W.W. Gerberich, D.L. Davidson, M. Kaczoroski, J. Mech. Phys. Solids 38 (1990)
87–113.[12] T. Shoji, Quantitative prediction of environmentally-assisted cracking based on
crack tip strain rate, in: Proc. ASME-PVP Symposium, Predictive Capacities inEnvironmentally-Assisted Cracking, Miami, Nov., 1985, pp. 127–142.
[13] Y.C. Gao, K.C. Hwang, Elastic–plastic crack tip fields in steady crack growth in astrain hardening material, in: D. Francois (Ed.), Advances in FractureMechanics, vol. 2, 5th Intern. Conf. on Fracture, 1981, pp. 669–682.

4072 B.T. Lu et al. / Corrosion Science 52 (2010) 4064–4072
[14] Q.J. Peng, J. Kwon, T. Shoji, J. Nucl. Mater. 324 (2004) 52–61.[15] Y.C. Gao, X.T. Zhang, K.C. Hwang, Int. J. Fract. 21 (1983) 301–317.[16] W. Ramberg, W.D. Osgood, NACA TN 902, Washington, DC, 1943.[17] T. Shoji, Z.P. Lu, H. Murakami, Corros. Sci. 52 (2010) 769–779.[18] Y.T. Fan, M.A. Sutton, L.X. Zhang, Int. J. Fract. 86 (1997) 327–341.[19] Y.C. Gao, Theor. Appl. Fract. Mech. 25 (1996) 179–186.[20] J.W. Hutchinson, J. Mech. Phys. Solids 16 (1968) 13–31.[21] J.R. Rice, C.F. Rosengren, J. Mech. Phys. Solids 16 (1968) 1–12.[22] J.R. Rice, W.J. Dugan, T.L. Sham, Elastic–plastic analysis of growing
cracks, in: Fracture Mechanics, 12th Conference, ASTM 700, 1980, pp.189–221.
[23] D.P.G. Lidbury, Estimation of crack tip strain rate parameters characterisingenvironmental assisted crack growth data, in: R.P. Gangloff (Ed.),Embrittlement by the Localized Crack Environment, Proc. Conf. AIME, 1984,pp. 140–172.
[24] C.F. Shih, J. Mech. Phys. Solids 29 (1981) 305–326.[25] S.J. Hudak, Jr., D.L. Davidson, R.A. Page, On Role of Crack Tip Deformation in
Corrosion, in: R.P. Gangloff (Ed.), Embrittlement by the Localized CrackEnvironment, Proc. Conf. AIME, 1984, pp. 172–196.
[26] W. Dietzel, Mater. Sci. 40 (2004) 749–755.[27] R.O. Ritchie, Int. J. Fract. 100 (1982) 55–83.[28] R.J. Donahue, H.M. Clark, P. Atanmo, R. Kumble, A.J. McEvily, Int. J. Fract. Mech.
8 (1984) 209–219.[29] K.S. Jian, J.L. Tzou, R.O. Ritchie, Metall. Trans. A 18A (1987) 1613–
1627.[30] J. Petit, C. Sarrazin-Baudoux, Int. J. Fatigue 32 (2009) 962–970.[31] A.J. McEvily, On the Quantitative Analysis of Fatigue Crack Propagation, ASTM
Special Technical Publication, 1984. pp. 283–312.[32] R.N. Parkins, P.M. Singh, Corrosion 46 (1990) 486–499.[33] A.K. Pilkey, S.B. Lambert, A. Plumtree, Corrosion 51 (1994) 91–96.[34] R.N. Parkins, Corrosion 43 (1987) 130–139.[35] A. Turnbull, Review of the electrochemical conditions in cracks with particular
reference to corrosion fatigue of structural steels in sea water, Rev. CoatingCorros. 5 (1982) 43–111.
[36] H. Tata, P. Paris, G. Irwin, The Stress Analysis of Cracks Handbook, second ed.,1985, pp. 2.10–2.12.
[37] J.M. Sutcliffe, R.R. Fessler, W.K. Boyd, R.N. Parkins, Corrosion 28 (1972) 313–320.
[38] J. Been, F. King, L. Fenyvesi, R. Sutherby, A Modeling Approach to High pHEnvironmentally Assisted Cracking, Proc. Inter. Pipeline Conf, 2004, paper #IPC04-361.
[39] R.N. Parkins, B.S. Greenwell, Met. Sci. 11 (1977) 405–413.[40] M. Yunovich, Z. Xia, Z. Szklarska-Smialowska, Corrosion 54 (1998) 154–161.[41] B.T. Lu, J.L. Luo, D. Ivey, Metall. Mater. Trans. A 41 (2010) 2538–2547.[42] J. Been, R.R. Fessler, S. Keane, W. Kresic, History of pressure fluctuations related
to severity of near-neutral pH SCC, Inter. Pipeline Conf. IPC2006-10412, Sept.25–29, 2006, Calgary, Alberta, Canada.
[43] J. Beavers, C.J. Maier, C.E. Jaske, Methodology for ranking SCC susceptibility ofpipeline segments based on the pressure cycle history, Corrosion ‘2007, paper128, 2007.
[44] F. Song, Predicting the chemistry and corrosion rate of steel in a crevice ofvariable gap, Paper presented to Corrosion 2010, San Antonio, TX, 2010.
[45] D.H. Davies, G.T. Burstein, Corrosion 36 (1980) 416–422.[46] J.H. Dong, T. Nishimura, T. Kodoma, Mater. Res. Soc. Symp. Proc. 713 (2002)
105–112.[47] R.N. Parkins, Controlling parameters in stress corrosion cracking, 5th Symp.
Line Pipe Researchm Pipeline Research of AGA, America Gas Association, Inc.1515 Wilson Boulevard, Arlington VA 22209, Catalog No. L30174, Paper U,1974.
[48] E.A. Charles, R.N. Parkins, Corrosion 51 (1995) 519–527.[49] M.S. Yan, J.Q. Wang, E.H. Han, W. Ke, Corros. Sci. 50 (2008) 1331–1399.[50] R.R. Fessler, A.J. Markworth, R.N. Parkins, Corrosion 39 (1983) 20–25.[51] F. Song, N. Sridhar, Corros. Sci. 50 (2008) 70–83.[52] R.N. Parkins, S. Zhou, Corros. Sci. 39 (1997) 159–173.[53] R.N. Parkins, S. Zhou, Corros. Sci. 39 (1997) 175–191.[54] J. Beavers, C.L. Durr, B.S. Delanky, High-pH SCC: temperature and potential
dependence for cracking in field environments, Intern. Pipeline Conf. IPC 1998,Calgary, AB, Canada, 1998, 423–437.
[55] R.P. Wei, S. Chou, Eng. Fract. Mech. 41 (1992) 463–473.[56] J.A., Beavers, Near-neutral pH SCC: dormancy and re-initiation of stress
corrosion cracks, Final Report for Gas Research Institute, GPI-05/0009, Aug.2004.
[57] Rules for In-Service Inspection of Nuclear Power Plant Components, in ASMEBoiler and Pressure Vessel Code, Section XI, Div. 1 (New York, NY: ASME,1994).
[58] R.P. Wei, Fatigue Fract. Eng. Mater. Struct. 25 (2002) 845–854.