COST MODELLING OF RAPID MANUFACTURING BASED ...
243
COST MODELLING OF RAPID MANUFACTURING BASED MASS CUSTOMISATION SYSTEM FOR FABRICATION OF CUSTOM FOOT ORTHOSES By Jumani Muhammad Saleh Submitted in accordance with the requirements for the degree of Doctor of Philosophy University of Newcastle School of Mechanical and Systems Engineering June 2013
-
Upload
khangminh22 -
Category
Documents
-
view
2 -
download
0
Transcript of COST MODELLING OF RAPID MANUFACTURING BASED ...
COST MODELLING OF RAPID MANUFACTURING
BASED MASS CUSTOMISATION SYSTEM FOR
FABRICATION OF CUSTOM FOOT ORTHOSES
By
Jumani Muhammad Saleh
Submitted in accordance with the requirements for the degree of
Doctor of Philosophy
University of Newcastle
School of Mechanical and Systems Engineering
June 2013

i
DEDICATED TO ALL THE TEACHERS IN MY LIFE
ii
ABSTRACT
Solid freeform fabrication (SFF) or Additive manufacturing (AM) techniques have
emerged in recent years as advanced manufacturing techniques. These techniques have
demonstrated advantages particularly in situations where the demands for unique
geometrical structured customer-specific products are high and the time to market is
very short. Applications of these techniques in the medical sector in combination with
the latest medical digital imaging technologies are growing quickly. The techniques
have inherent advantages of compatibility with the output information of medical
digitising techniques.
Foot orthoses are medical devices used as shoe inserts in the treatment of foot disorders,
injuries and diseases such as diabetes, rheumatoid arthritis, congenital defects and other
foot related injuries. Currently custom foot orthoses are fabricated through
manufacturing techniques which involve costly and based on lengthy trial and error
manufacturing process. These techniques have limitations in terms of fabricating
required geometries and incorporating complex design features in the custom-made
orthoses.
The novelty of this research is to explore the commercial scale application of rapid
manufacturing techniques and to assess a rapid manufacturing based design and
fabrication system for production of custom foot orthoses. The developed system is
aimed at delivering the custom made orthoses at mass scale with improved fit,
consistency, accuracy and increased product quality.
The traditional design and fabrication process for production of custom foot orthoses
was investigated and modelled with IDEF0 modelling methodology. The developed
IDEF0 model was re-modelled and then the rapid manufacturing approach was
integrated in the design and fabrication process. The main functions of foot geometry
capture, orthoses design and manufacture of orthoses were modelled and evaluated
individually with respect to time and cost and quality of the final product.
iii
Different well-established rapid manufacturing techniques were integrated in the current
design and fabrication process. The results showed that the techniques have significant
impacts on the overall design and fabrication process in terms of increased process
efficiency, low lead-time, increased productivity and improved quality of the final
product.
An orthosis model was fabricated on an experimental basis using different well
established rapid manufacturing techniques. The techniques were separately investigated
and analysed in terms of orthoses fabrication cost and build time. The cost and lead-time
in different techniques were modelled, analysed and evaluated for evaluation of
commercial scale applications. The analysis and evaluation of the cost and lead-time
modelled for different rapid manufacturing techniques showed that selective laser
sintering technique is the better option for integrating the technique in fabrication of
custom foot orthoses and that it has the potential to compete with conventional
techniques.
iv
AFFIRMATION
The work presented in this thesis is original in its contents, thus it can be said that
barring the referenced knowledge given in the thesis, the unreferenced part of this thesis
is my own work, which has not previously been submitted for any other degree.
Signature:
Jumani Muhammad Saleh.
Student ID: a79040024
School of Mechanical and Systems Engineering
Newcastle University, UK
v
ACKNOWLEDGEMENT
Driven purely by four years of PhD training both as explicit as daylight and as implicit
as the darkness of the night in absence of moonshine, its stress and strain and by
unlocking the mind’s thinking capability store and getting to know about its application;
the author of this thesis can’t be thankful enough to the ultimate creator The Almighty
Allah, my ever-caretaking parents and my conscientious supervisor. While being here in
Newcastle, UK, I am and will always be sincerely grateful to my supervisor, Prof. Dr. K
W Dalgarno for his thought-provoking assistance in the form of clear directions that he
provided during the discussions about the work and its progress, his useful and timely
comments about my writing drafts and patience and logical hearing to my raw
viewpoints. Thank you Prof. for valuable discussions about the PhD thesis and its
structure I am thankful to Dr Javier Munguia Valenzuela (Research staff) and Dr. Jari H
Pallari, Materialise HQ, Belgium. This leads me to thanking my colleagues for their
help. I am particularly and will eternally be grateful to my family, who all have seen
very little of me in these four years.
vi
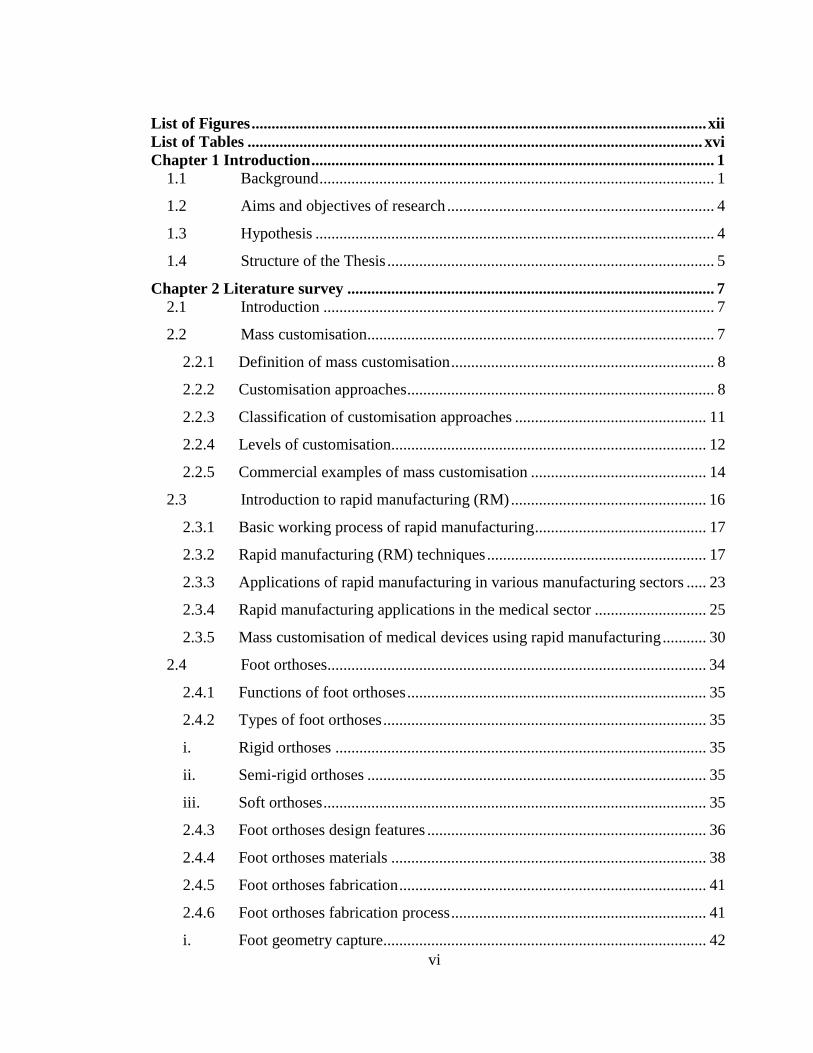
List of Figures .................................................................................................................. xii List of Tables .................................................................................................................. xvi
Chapter 1 Introduction ..................................................................................................... 1 1.1 Background ................................................................................................... 1
1.2 Aims and objectives of research ................................................................... 4
1.3 Hypothesis .................................................................................................... 4
1.4 Structure of the Thesis .................................................................................. 5
Chapter 2 Literature survey ............................................................................................ 7 2.1 Introduction .................................................................................................. 7
2.2 Mass customisation....................................................................................... 7
2.2.1 Definition of mass customisation .................................................................. 8
2.2.2 Customisation approaches ............................................................................. 8
2.2.3 Classification of customisation approaches ................................................ 11
2.2.4 Levels of customisation............................................................................... 12
2.2.5 Commercial examples of mass customisation ............................................ 14
2.3 Introduction to rapid manufacturing (RM) ................................................. 16
2.3.1 Basic working process of rapid manufacturing ........................................... 17
2.3.2 Rapid manufacturing (RM) techniques ....................................................... 17
2.3.3 Applications of rapid manufacturing in various manufacturing sectors ..... 23
2.3.4 Rapid manufacturing applications in the medical sector ............................ 25
2.3.5 Mass customisation of medical devices using rapid manufacturing ........... 30
2.4 Foot orthoses............................................................................................... 34
2.4.1 Functions of foot orthoses ........................................................................... 35
2.4.2 Types of foot orthoses ................................................................................. 35
i. Rigid orthoses ............................................................................................. 35
ii. Semi-rigid orthoses ..................................................................................... 35
iii. Soft orthoses ................................................................................................ 35
2.4.3 Foot orthoses design features ...................................................................... 36
2.4.4 Foot orthoses materials ............................................................................... 38
2.4.5 Foot orthoses fabrication ............................................................................. 41
2.4.6 Foot orthoses fabrication process ................................................................ 41
i. Foot geometry capture................................................................................. 42
vii
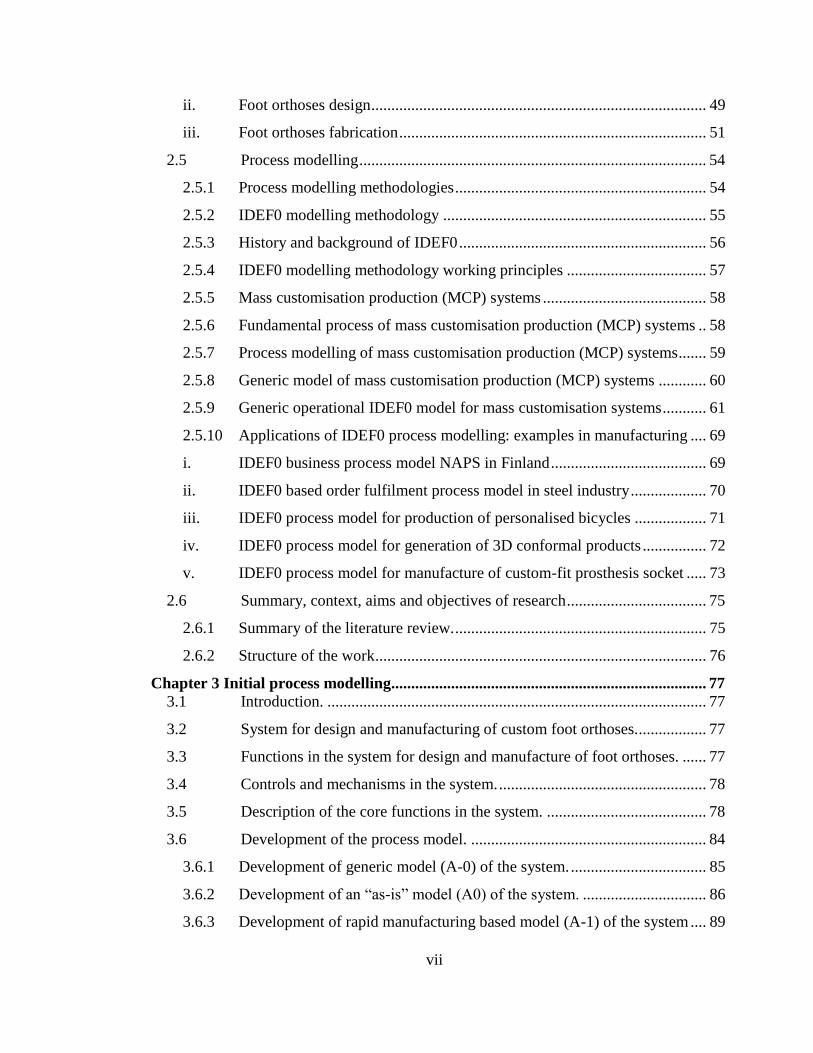
ii. Foot orthoses design .................................................................................... 49
iii. Foot orthoses fabrication ............................................................................. 51
2.5 Process modelling ....................................................................................... 54
2.5.1 Process modelling methodologies ............................................................... 54
2.5.2 IDEF0 modelling methodology .................................................................. 55
2.5.3 History and background of IDEF0 .............................................................. 56
2.5.4 IDEF0 modelling methodology working principles ................................... 57
2.5.5 Mass customisation production (MCP) systems ......................................... 58
2.5.6 Fundamental process of mass customisation production (MCP) systems .. 58
2.5.7 Process modelling of mass customisation production (MCP) systems ....... 59
2.5.8 Generic model of mass customisation production (MCP) systems ............ 60
2.5.9 Generic operational IDEF0 model for mass customisation systems ........... 61
2.5.10 Applications of IDEF0 process modelling: examples in manufacturing .... 69
i. IDEF0 business process model NAPS in Finland ....................................... 69
ii. IDEF0 based order fulfilment process model in steel industry ................... 70
iii. IDEF0 process model for production of personalised bicycles .................. 71
iv. IDEF0 process model for generation of 3D conformal products ................ 72
v. IDEF0 process model for manufacture of custom-fit prosthesis socket ..... 73
2.6 Summary, context, aims and objectives of research ................................... 75
2.6.1 Summary of the literature review. ............................................................... 75
2.6.2 Structure of the work ................................................................................... 76
Chapter 3 Initial process modelling............................................................................... 77 3.1 Introduction. ............................................................................................... 77
3.2 System for design and manufacturing of custom foot orthoses. ................. 77
3.3 Functions in the system for design and manufacture of foot orthoses. ...... 77
3.4 Controls and mechanisms in the system. .................................................... 78
3.5 Description of the core functions in the system. ........................................ 78
3.6 Development of the process model. ........................................................... 84
3.6.1 Development of generic model (A-0) of the system. .................................. 85
3.6.2 Development of an “as-is” model (A0) of the system. ............................... 86
3.6.3 Development of rapid manufacturing based model (A-1) of the system .... 89
viii
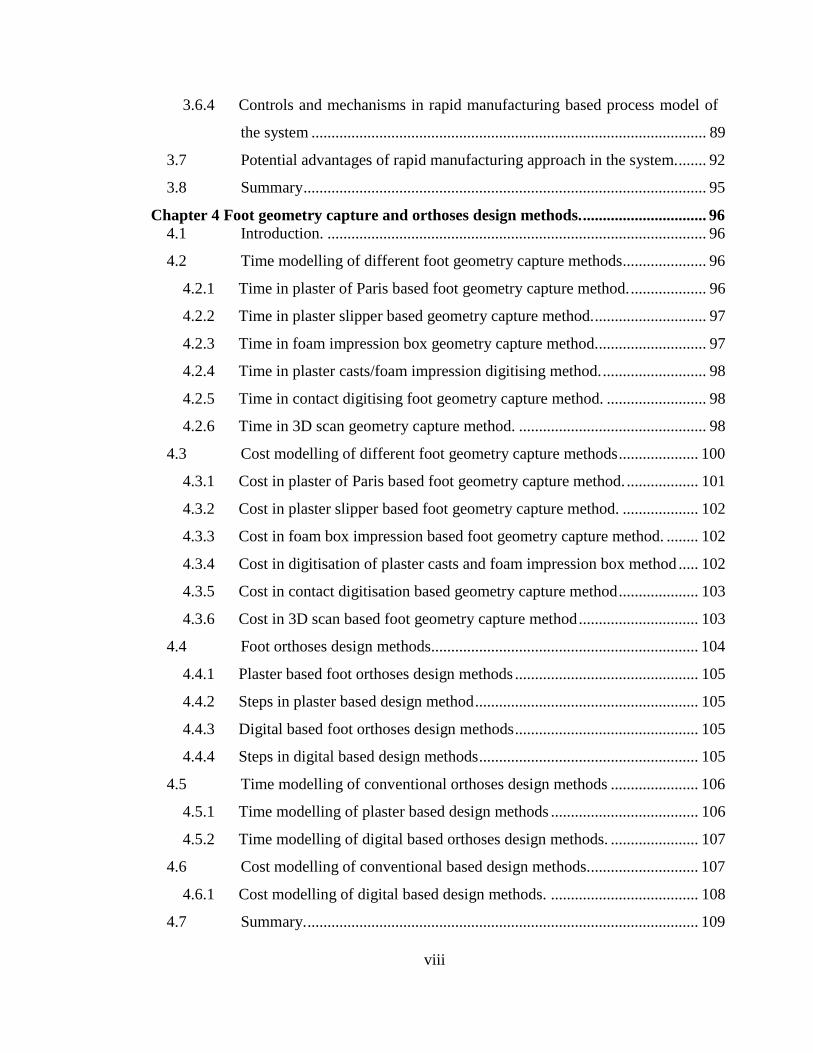
3.6.4 Controls and mechanisms in rapid manufacturing based process model of
the system ................................................................................................... 89
3.7 Potential advantages of rapid manufacturing approach in the system. ....... 92
3.8 Summary ..................................................................................................... 95
Chapter 4 Foot geometry capture and orthoses design methods. ............................... 96 4.1 Introduction. ............................................................................................... 96
4.2 Time modelling of different foot geometry capture methods ..................... 96
4.2.1 Time in plaster of Paris based foot geometry capture method. ................... 96
4.2.2 Time in plaster slipper based geometry capture method. ............................ 97
4.2.3 Time in foam impression box geometry capture method............................ 97
4.2.4 Time in plaster casts/foam impression digitising method. .......................... 98
4.2.5 Time in contact digitising foot geometry capture method. ......................... 98
4.2.6 Time in 3D scan geometry capture method. ............................................... 98
4.3 Cost modelling of different foot geometry capture methods .................... 100
4.3.1 Cost in plaster of Paris based foot geometry capture method. .................. 101
4.3.2 Cost in plaster slipper based foot geometry capture method. ................... 102
4.3.3 Cost in foam box impression based foot geometry capture method. ........ 102
4.3.4 Cost in digitisation of plaster casts and foam impression box method ..... 102
4.3.5 Cost in contact digitisation based geometry capture method .................... 103
4.3.6 Cost in 3D scan based foot geometry capture method .............................. 103
4.4 Foot orthoses design methods................................................................... 104
4.4.1 Plaster based foot orthoses design methods .............................................. 105
4.4.2 Steps in plaster based design method ........................................................ 105
4.4.3 Digital based foot orthoses design methods .............................................. 105
4.4.4 Steps in digital based design methods ....................................................... 105
4.5 Time modelling of conventional orthoses design methods ...................... 106
4.5.1 Time modelling of plaster based design methods ..................................... 106
4.5.2 Time modelling of digital based orthoses design methods. ...................... 107
4.6 Cost modelling of conventional based design methods............................ 107
4.6.1 Cost modelling of digital based design methods. ..................................... 108
4.7 Summary. .................................................................................................. 109
ix
Chapter 5 Foot orthoses fabrication methods ............................................................ 111 5.1 Introduction .............................................................................................. 111
5.2 Selection of rapid manufacturing techniques for orthoses fabrication ..... 111
5.2.1 Requirement of the process ....................................................................... 111
5.2.2 Selection of materials ................................................................................ 112
5.3 Fabrication of the orthosis model. ............................................................ 117
5.4 Rapid manufacturing systems used in orthosis model fabrication. .......... 118
5.5 Summary. .................................................................................................. 120
Chapter 6 Cost and lead-time modelling .................................................................... 121 6.1 Introduction. ............................................................................................. 121
6.2 Cost modelling in rapid manufacturing .................................................... 121
6.3 Development of cost models .................................................................... 122
6.3.1 Calculating production volume per year ................................................... 124
6.3.2 Calculating machine cost .......................................................................... 124
6.3.3 Calculating material cost ........................................................................... 125
6.3.4 Calculation of overheads ........................................................................... 126
6.3.5 Calculation of labour cost ......................................................................... 127
6.4 Mathematical calculations for cost modelling .......................................... 128
6.4.1 Cost and lead-time modelling ................................................................... 129
6.4.2 Cost and lead-time modelling for SLS technique using spro SD system . 129
6.4.3 Cost and lead-time modelling for SLA technique using ipro system ....... 136
6.4.4 Cost and lead-time modelling for polyjet technique using Connex 500
system ....................................................................................................... 143
6.4.5 Cost and lead-time modelling for 3DP technique using V-Flash system . 150
6.4.6 Cost and lead-time modelling for FDM technique using Dimension SST
768 system ................................................................................................ 157
6.4.7 Cost and lead-time modelling for FDM technique using Dimension uPrint
system ....................................................................................................... 164
6.4.8 Cost and lead-time modelling for CAD/CAM using Amfit system ......... 171
6.5 Summary ................................................................................................... 176
Chapter 7 Discussion and conclusions ........................................................................ 179 7.1 Introduction. ............................................................................................. 179
x
7.2 Discussion ................................................................................................. 179
7.2.1 Design of rapid manufacturing based process model through IDEF0. ..... 179
7.2.2 Digital foot geometry capture. .................................................................. 180
7.2.3 CAD design of orthoses. ........................................................................... 181
7.2.4 Rapid manufacturing techniques in fabrication of orthoses. ..................... 182
7.2.5 Orthoses materials ..................................................................................... 183
7.2.6 Cost and lead-time modelling ................................................................... 183
7.3 Key features of rapid manufacturing based design and fabrication system
for production of custom-made foot orthoses. .......................................... 183
7.3.1 Lead-time modelling ................................................................................. 184
7.3.2 Total estimated design and fabrication lead-time and total estimated cost
per pair in different rapid manufacturing based systems. ......................... 184
7.3.3 Total estimated customer lead-time and total estimated overall cost per
pair in different rapid manufacturing techniques based systems .............. 187
7.3.4 Total estimated design and fabrication lead-time and total estimated cost
per pair in conventional resources based methods. .................................. 189
7.3.5 Total estimated customer lead-time in conventional techniques system. . 192
7.4 Comparison of “best case” rapid manufacturing based system with
conventional resources based system. ...................................................... 194
7.5 Key reasons for application of rapid manufacturing techniques in
fabrication of custom-made foot orthoses. ............................................... 197
7.6 Summary ................................................................................................... 198
7.7 Conclusions .............................................................................................. 199
7.8 Future work............................................................................................... 200
xi
Abbreviations
CAD Computer Aided Design
CIM Computer Integrated Manufacturing
CODP Customer Order Decoupling Point
FDM Fused Deposition Modelling
FMS Flexible Manufacturing System
LM Layer Manufacturing
MCP Mass Customisation
MRI Magnetic Resonance Imaging
NC Numerical Control
NBIC National Bicycle Industrial Company
SFF Solid Free Form
SLS Selective Laser Sintering
SLA Stereolithography Apparatus
3DP Three Dimensional Printing
POS Panasonic Order System
xii
List of Figures
Figure 1:1 Foot orthoses ................................................................................................... 3
Figure 2:1 Customisation stratgies in the value chain ...................................................... 9
Figure 2:2 Operationalised configuration model ............................................................ 11
Figure 2:3 Customer involvement and modularity in production cycle ....................... 13
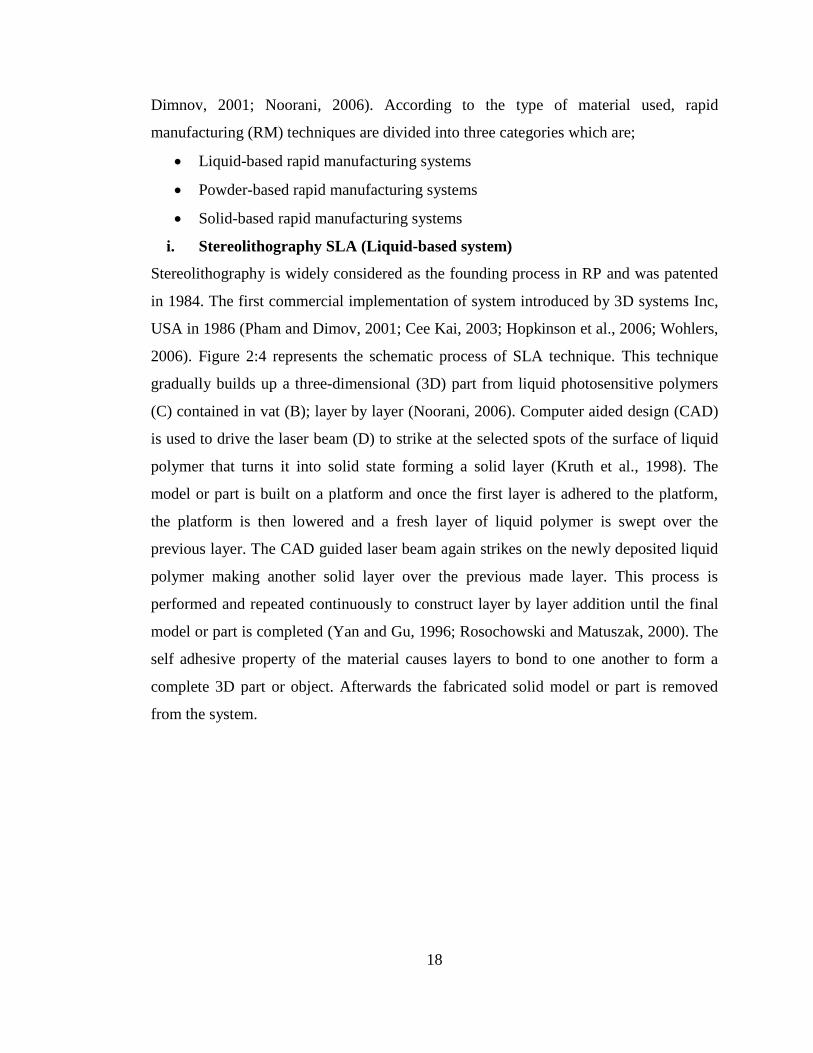
Figure 2:4 Schematic of Stereolithography (SLA) technique ......................................... 19
Figure 2:5 Schematic of 3D liquid based printing (3DP) technique ............................... 20
Figure 2:6 Schematic of Selective Laser Sintering (SLS) technique .............................. 21
Figure 2:7 Schematic of (3DP) powder based printing technique .................................. 22
Figure 2:8 Schematic of Fused Deposition Modelling (FDM) technique ...................... 23
Figure 2:9 Aircraft duct (a) original design with 16 parts (b) consolidated design ........ 24
Figure 2:10 (a) Building construction panels, (b) library building models and (d) 3D
model of a house ............................................................................................................. 25
Figure 2:11 Images of medical parts using different colored RM systems. (a) 3DP based
skull with vascular tracks in a darker color. (b) A bone tumor highlighted using ABS
material. (c) Human organ fabricated through polyjet technique showing vascularity
inside the organ ............................................................................................................... 26
Figure 2:12 Scaffolds fabricated using SLS technique ................................................... 27
Figure 2:13 Jawbone with drill guides fabricated using SLA technique ........................ 28
Figure 2:14 Lower limb prosthesis socket fabricated using SLS technique ................... 30
Figure 2:15 In-the-ear hearing aids, Phonak.com and Siemens.com .............................. 31
Figure 2:16 Transparent dental aligners .......................................................................... 32
Figure 2:17 “assassin” fully customised soccer shoe ..................................................... 33
Figure 2:18 Foot orthosis ................................................................................................ 34
Figure 2:19 Orthoses with arch support (a) and (b) Schematice of arch support ........... 36
Figure 2:20 Heel lift/cupping/cushion in the orthoses shell ........................................... 37
Figure 2:21 Schematic of foot poronation (a) and (b) orthoses with medial flange ....... 37
Figure 2:22 Posts or wedges in orthoses shell ................................................................ 38
Figure 2:23 Metatarsal pad/dome in orthosis shell ......................................................... 38
Figure 2:24 Foot geometry capturing in plaster of Paris based process ......................... 43
xiii
Figure 2:25 Foot geometry capturing in plaster slipper sock based process .................. 44
Figure 2:26 Foot geometry capturing in foam impression box based process ................ 46
Figure 2:27 CAD/CAM orthosis fabrication ................................................................ 47
Figure 2:28 Foot impression capturing technique by contact digitiser ........................... 48
Figure 2:29 Foam impression box cast (a) and (b) impress scanner ............................. 49
Figure 2:30 Impression capturing technique in 3D digital scanner ................................ 49
Figure 2:31 Manual corrections process in positive mould (a) and (b) corrected positive
mould with arch fill design feature ................................................................................. 50
Figure 2:32 “Correct & confirm” design software (a) and (b) CAD designed model .... 51
Figure 2:33 Thermoplastic piece (a) and (b) heated sheet draped over positive mould . 52
Figure 2:34 Vacuum press and moulded orthoses shell .................................................. 52
Figure 2:35 Foot contour digitiser (a) and (b) insole fabrication system ........................ 54
Figure 2:36 IDEF0 basic digram ..................................................................................... 56
Figure 2:37 IDEF0 reference diagram of mass customisation system ............................ 61
Figure 2:38 Individual subsystem for capturing customer requirement in MCP system 63
Figure 2:39 Individual subsystem for processing customer order in MCP system ........ 64
Figure 2:40 Individual subsystem for generating design of product in MCP system .... 64
Figure 2:41 Individual subsystem for generating plan for manufacturing in MCP system
......................................................................................................................................... 65
Figure 2:42 Individual subsystem for production of final product in MCP system. ..... 66
Figure 2:43 Individual subsystem for delivering final product in MCP system ............. 66
Figure 2:44 Generic operational IDEF0 model for mass customisation systems ........... 68
Figure 2:45 NAPS business process model in IDEF0 diagram .................................... 70
Figure 2:46 Order fulfilment model in steel industry ..................................................... 71
Figure 2:47 IDEF0 process model for personalised bicycles at NBIC Japan ................. 72
Figure 2:48 Process model for design and fabrication of custom-specific products ...... 73
Figure 2:49 Process model for fabrication of custom made lower limb prosthesis ........ 74
Figure 3:1 IDEF0 diagram of initial consultation and foot assessment function ............ 79
Figure 3:2 IDEF0 diagram of diagnoses function ........................................................... 80
Figure 3:3 IDEF0 diagram of function of design of orthoses ......................................... 81
Figure 3:4 IDEF0 diagram of function of planning for manufacturing .......................... 82
xiv
Figure 3:5 IDEF0 diagram of function of orthoses manufacturing................................ 83
Figure 3:6 IDEF0 diagram.of function of delivery of orthoses ...................................... 84
Figure 3:7 Generic model (A-0) of design and fabrication system for custom foot
orthoses. .......................................................................................................................... 86
Figure 3:8 An “as-is” model (A0) of the system the in existing operate-base state. ...... 88
Figure 3:9 An “as-to-be” model (A-1) of the system with rapid manufacturing approach
(A5 block) in the system ................................................................................................. 90
Figure 5:1 Relative bending stiffness in traditional materials ...................................... 117
Figure 5:2 Relative bending stiffness in RM materials ................................................. 117
Figure 5:3 Orthosis 3D file used as benchmark part across all RM techniques ........... 118
Figure 6:1 Cost categories in initial operating model based on 220 working days per
year ................................................................................................................................ 132
Figure 6:2 Cost categories in initial operating model based on 365 working days per
year ................................................................................................................................ 133
Figure 6:3 Cost categories in “best case” SLS based cost model ................................. 136
Figure 6:4 Cost categories in initial operating model based on 220 working days per
year ................................................................................................................................ 139
Figure 6:5 Cost categories in initial operating model based on 365 working days per
year ................................................................................................................................ 140
Figure 6:6 Cost categories in “best case” SLA based cost model................................. 143
Figure 6:7 Cost categories in initial operating model based on 220 working days per
year ................................................................................................................................ 146
Figure 6:8 Cost categories in initial operating model based on 365 working days per
year ................................................................................................................................ 147
Figure 6:9 Cost categories in “best case” polyjet based cost model ............................. 150
Figure 6:10 Cost categories in initial operating model based on 220 working days per
year ................................................................................................................................ 153
Figure 6:11 Cost categories in initial operating model based on 365 working days per
year ................................................................................................................................ 154
Figure 6:12 Cost categories in “best case” V-Flash based cost model ......................... 157
Figure 6:13 Cost categories in initial operating model based on 220 working days per
xv
year ................................................................................................................................ 160
Figure 6:14 Cost categories in initial operating model based on 365 working days per
year ................................................................................................................................ 161
Figure 6:15 Cost categories in “best case” Dimension 768 SST FDM based cost model
....................................................................................................................................... 164
Figure 6:16 Cost categories in initial operating model based on 220 working days per
year ................................................................................................................................ 167
Figure 6:17 Cost categories in initial operating model based on 365 working days per
year ................................................................................................................................ 168
Figure 6:18 Cost categories in “best case” uPrint FDM based cost model .................. 170
Figure 6:19 Cost categories in initial operating cost model based on 220 working days
per year .......................................................................................................................... 173
Figure 6:20 Cost categories in initial operating model based on 365 days per year ..... 174
Figure 6:21 Cost categories in “best case” Amfit CAD/CAM system based cost model
....................................................................................................................................... 176
Figure 6:22 Fabrication lead-time and cost per pair in “best case” developed models 178
Figure 6:23 Cost per pair and productivity per hour in “best case” developed models 178
Figure 7:1 Design and fabrication lead-time and cost per pair in RM based systems .. 186
Figure 7:2 Productivity in hours and cost per pair in RM based systems ..................... 187
Figure 7:3 Total estimated delivery lead-time and total estimated cost per pair in RM
based systems ................................................................................................................ 189
Figure 7:4 Estimated design and fabrication cost per pair in conventional resources
based systems ................................................................................................................ 192
Figure 7:5 Total estimated delivery lead-time and cost per pair in conventional ......... 194
xvi
List of Tables
Table 4:1 Foot assessment time obtained from leading orthotic clinics in UK and USA.
......................................................................................................................................... 97
Table 4:2 Time required in different foot geometry capture methods ........................... 99
Table 4:3 Foot geometry capturing cost involved in the different methods ................. 104
Table 4:4 Time in conventional methods base designing ............................................ 106
Table 4:5 Design time in digital based methods ........................................................... 107
Table 4:6 Design cost in plaster based methods ........................................................... 108
Table 4:7 Design cost in digital based methods ............................................................ 108
Table 5:1 Mechanical properties of traditional materials ............................................. 113
Table 5:2 Relative bending stiffness in traditional material (2 to 4 mm thicknesses) .. 114
Table 5:3 Relative bending stiffness in RM material (2 mm to 4 mm thicnesses) ....... 115
Table 5:4 Measurements of fabricated orthosis model accorss all RM techniques ...... 118
Table 6:1 Activities associated with rapid manufacturing ............................................ 121
Table 6:2 Assumptions in the cost modelling process .................................................. 123
Table 6:3 Calculation of production volume per year .................................................. 124
Table 6:4 Calculation of machine cost per year. ........................................................... 124
Table 6:5 Calculation of material costs for RM techniques .......................................... 126
Table 6:6 Calculation of production overhead .............................................................. 127
Table 6:7 Calculation of administrative overhead ........................................................ 127
Table 6:8 Cost calcualtion using ipro SD 60 SLS sytem .............................................. 131
Table 6:9 Total cost per pair in initial operating model based on 365 working days per
year ................................................................................................................................ 133
Table 6:10 Machine labour hours/year and technicians labour hour/year in “best case”
cost model ..................................................................................................................... 134
Table 6:11 Total estimated fabrication cost per pair in “best case” SLS cost model ... 135
Table 6:12 Cost calcualtion per pair using spro SLA sytem ........................................ 138
Table 6:13 Total cost per pair in intial operating model based on 365 working days per
year ................................................................................................................................ 140
Table 6:14 Machine labour hours/year and technicians labour hour/year in “best case”
xvii
cost mode ...................................................................................................................... 141
Table 6:15 Total estimated fabrication cost per pair in “best case” SLA based cost model
....................................................................................................................................... 142
Table 6:16 Cost calculation per pair using Connex 500 polyjet technique .................. 145
Table 6:17 Total cost per pair in initial operating model based on 365 working days per
year ................................................................................................................................ 147
Table 6:18 Machine labour hours/year and technicians labour hour/year in “best case”
cost model ..................................................................................................................... 148
Table 6:19 Total estimated fabrication cost per pair in “best case” polyjet based cost
model ............................................................................................................................. 149
Table 6:20 Calculations of cost per pair using V-Flash system in 3DP technique. ...... 152
Table 6:21 Total cost per pair in intial operating model based on 365 working days per
year ................................................................................................................................ 154
Table 6:22 Machine labour hours/year and technicians labour hour/year in “best case”
cost model ..................................................................................................................... 155
Table 6:23 Total estimated fabrication cost per pair in “best case” V-Flash based cost
model ............................................................................................................................. 156
Table 6:24 Calculation of cost per pair using SST 768 system in FDM technique ...... 159
Table 6:25 Total cost per pair in intial operating model based on 365 working days per
year ................................................................................................................................ 161
Table 6:26 Machine labour hours/year and technicians labour hour/year in “best case”
cost model ..................................................................................................................... 162
Table 6:27 Total estimated fabrication cost per pair in “best case” SST 768 FDM cost
model ............................................................................................................................. 163
Table 6:28 Calculations of cost per pair using uPrint system in FDM technique ......... 166
Table 6:29 Total cost per pair in intial operating model based on 365 working days per
year ................................................................................................................................ 168
Table 6:30 Total estimated fabrication cost per pair in “best case” uPrint FDM based
cost model ..................................................................................................................... 170
Table 6:31 Calculations of cost per pair using Amfit CAD/CAM milling technique .. 172
Table 6:32 Total estimated cost per pair in initial operating model based on 365 days per
xviii
year ................................................................................................................................ 173
Table 6:33 Machine labour hours/year and technicians labour hour/year in “best case”
cost model ..................................................................................................................... 175
Table 6:34 Total estimated fabrication cost per pair in “best case”CAD/CAM based cost
model ............................................................................................................................. 176
Table 7:1 Total estimated design and fabrication lead-time in different RM based
systems .......................................................................................................................... 185
Table 7:2 Total estimated design and fabrication cost per pair in different RM based
systems .......................................................................................................................... 185
Table 7:3 Estimated productivity in hours per pair in different RM based systems ..... 186
Table 7:4 Total estimated customer delivery lead-time in different RM based systems
....................................................................................................................................... 188
Table 7:5 Total estimated overall cost per pair in different RM based systems ........... 188
Table 7:6 Total estimated design and fabrication lead-time in conventional resouces
based systems ................................................................................................................ 190
Table 7:7 Total estimated design and fabrication cost per pair in conventional ........... 191
Table 7:8 Total estimated delivery lead-time in conventional based systems .............. 193
Table 7:9 Estimated overall total cost per pair in conventional resources based systems
....................................................................................................................................... 194
Table 7:10 Comparison of conventional and SLS based system modeles .................... 195
Table 7:11 Total estimated fabrication cost per pair by reuse of unsintered material in
SLS technique ............................................................................................................... 196
Table 7:12 Actual material cost and assumed projected cost giving total estimated cost
per pair .......................................................................................................................... 197
1
Chapter 1 Introduction
1.1 Background
In view of worldwide increased competition in manufacturing business, companies are
under pressure to adopt new manufacturing approaches and strategies in order to
respond quickly to their customers for providing high variety, high quality and cost-
effective personalised products (Piller and Stotko, 2002). This requires reorganisation
and introduction of new manufacturing approaches combined with integration of
information technology (IT) resources and efficient supply chains systems to meet the
challenges of increased demand for product variety and personalisation to satisfy the
changing customer demands without compromising the lead-time, cost and quality of
products (Pine, 1993; Lebovitiz and Graban, 2001).
Recently in manufacturing engineering, applications of new approaches such as agile
manufacturing, lean manufacturing, rapid manufacturing and mass customisation have
received much attention in literature. Mass customisation is an approach which is
believed to offer solutions for provision of individualisation and customisation in the
products at a mass scale (Pine, 1993; Piller, 2003). This new approach of mass
customisation can be widely observed across the manufacturing sectors in automotives,
computers, telecommunication, electronics, textile, sports, consumer and medical
products (Tseng and Piller, 2003; McCarthy and Brabazon, 2003; Selldurai, 2004). In
medical sector production of custom-made devices, implants and tailored treatments
have a long history and the need for custom-made products/devices and personalised
rehabilitation aids are more explicit in this sector (Kumar et al., 1996; Dalgarno et al.,
2006).
Solid free form fabrication (SFF) or Additive manufacturing (AM) techniques have
emerged in recent years as advanced manufacturing techniques. These techniques have
great advantages particularly in situations where the demands for unique geometrical
structured customer-specific products and the time to market are very short. Additive
2
manufacturing techniques are based on an additive approach where parts are built
gradually by adding material layer by layer to create three dimensional geometrical parts
specified by a computer aided design (CAD) system. There are many commercial rapid
manufacturing techniques based systems available in the market such as selective laser
sintering (SLS), stereolithography (SLA), fused deposition modelling (FDM) and 3D
printing (3DP) systems (Noorani, 2006, Gibson et al., 2010).
Applications of rapid manufacturing techniques in the medical sector in combination
with the latest medical digital imaging technologies such as computerised tomography
(CT) and magnetic resonance imaging (MRI) are growing quickly. Rapid manufacturing
techniques have the inherent advantages of increased design freedom, the ability to
fabricate unique geometrical structures/parts and the compatibility of these techniques
with the output information of medical digitising techniques. These factors have
significantly increased the role of rapid manufacturing techniques for the fabrication of
customised/tailored devices, implants and rehabilitation aids in the medical sector
(Cormier et al., 2003; Kruth et al., 2005; Tukuru et al., 2008).
Foot orthoses are medical devices used as shoe inserts in the treatment of biomechanical
foot disorders, injuries and diseases such as diabetes and rheumatoid arthritis. Foot
orthoses are prescribed for the treatment of medical conditions developed in rheumatoid
arthritis (Woodburn et al., 2002; Magalaheas et al., 2006; Bellamy, 2007), diabetes (Bus
et al., 2004; Muller et al., 2006; Frykberg et al., 2006; Paton et al., 2007), congenital
defects and numerous foot disorders and injuries to reduce stresses, provide comfort to
painful areas, preventing deformity and disability and promoting improved gait in the
patients (Pratt, 1994; Hunter et al., 1995; Nigg et al., 1999; Nicolopoulos et al., 2000).
The significant challenges in the foot related problems are growing deterioration in the
pathological conditions such as increasing pain and joint destruction in rheumatoid
arthritis (Helliwell et al., 2007) and progressing foot ulceration in diabetes which
quickly changes the state of diseases (Paton et al., 2007). In order to prevent these
progressing problems and conditions, custom foot orthoses are prescribed for correcting
the foot alignment to support abnormal foot structure and transferring and redistributing
3
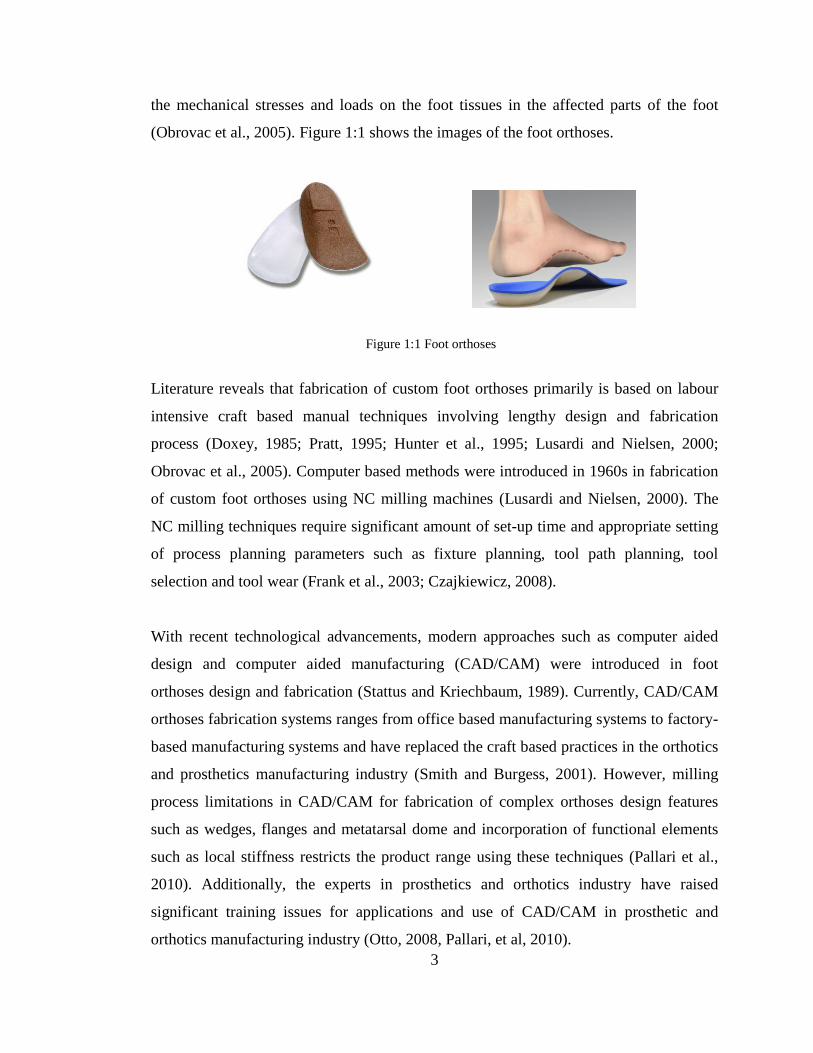
the mechanical stresses and loads on the foot tissues in the affected parts of the foot
(Obrovac et al., 2005). Figure 1:1 shows the images of the foot orthoses.
Literature reveals that fabrication of custom foot orthoses primarily is based on labour
intensive craft based manual techniques involving lengthy design and fabrication
process (Doxey, 1985; Pratt, 1995; Hunter et al., 1995; Lusardi and Nielsen, 2000;
Obrovac et al., 2005). Computer based methods were introduced in 1960s in fabrication
of custom foot orthoses using NC milling machines (Lusardi and Nielsen, 2000). The
NC milling techniques require significant amount of set-up time and appropriate setting
of process planning parameters such as fixture planning, tool path planning, tool
selection and tool wear (Frank et al., 2003; Czajkiewicz, 2008).
With recent technological advancements, modern approaches such as computer aided
design and computer aided manufacturing (CAD/CAM) were introduced in foot
orthoses design and fabrication (Stattus and Kriechbaum, 1989). Currently, CAD/CAM
orthoses fabrication systems ranges from office based manufacturing systems to factory-
based manufacturing systems and have replaced the craft based practices in the orthotics
and prosthetics manufacturing industry (Smith and Burgess, 2001). However, milling
process limitations in CAD/CAM for fabrication of complex orthoses design features
such as wedges, flanges and metatarsal dome and incorporation of functional elements
such as local stiffness restricts the product range using these techniques (Pallari et al.,
2010). Additionally, the experts in prosthetics and orthotics industry have raised
significant training issues for applications and use of CAD/CAM in prosthetic and
orthotics manufacturing industry (Otto, 2008, Pallari, et al, 2010).
Figure 1:1 Foot orthoses
4
1.2 Aims and objectives of research
The aim of this study is to assess the cost and lead-time of a rapid manufacturing based
mass customisation system for fabrication of custom foot orthoses.
To achieve the aims of the study, the following objectives have been determined;
i. To summarise and evaluate existing research in the area of rapid
manufacturing in the medical field, mass customisation, foot orthoses
fabrication and process modelling.
ii. To develop a process model for rapid manufacturing based fabrication
system for production of custom foot orthoses.
iii. To use the developed model to evaluate the set of mass customisation
systems based on varying conditions and constraints for different rapid
manufacturing techniques.
iv. To evaluate and compare the cost and lead-time of different rapid
manufacturing based fabrication systems with conventional resources based
fabrication system.
1.3 Hypothesis
In medical sector rapid prototyping (RP) and its more mature form rapid manufacturing
(RM) techniques have revolutionised the way the parts are fabricated. These techniques
have the advantages of creating the parts directly from 3D CAD information layer by
layer without tooling and moulding and have greater design freedom in production of
geometrically complex parts and components. This creates the viability of rapid
manufacturing techniques in the medical sector for fabrication of custom-made devices,
parts, rehabilitation aids, dental, prosthesis and orthotics. The RM techniques have
shown successful commercial scale applications for mass customisation of in-the-ear
canal hearing aids and custom-made dental braces.
5
Fabrication of custom-made foot orthoses involves traditional CAD/CAM techniques
that have limitations in fabricating the required orthosis design features such as wedges,
flanges and metatarsal dome. Additionally, CAD/CAM techniques have shown
difficulties in incorporating the orthoses functional elements such as integration of local
stiffness at specific sites in the orthoses shell. These limitations of CAD/AM techniques
restrict the product range. Rapid manufacturing techniques have advantages over the
conventional manufacturing techniques in terms of fabricating the complex geometrical
design features with accuracy, consistency, low lead-time and overall improved quality
product. Rapid manufacturing techniques combined with medical digitising technologies
can generate a digital design and fabrication system for mass scale production of
custom-made foot orthoses.
The integration of rapid manufacturing approach in the traditional orthoses design and
fabrication process can improve the current process by replacing the traditional
functions of manual foot geometry capture and orthoses design methods that involve
longer time and increased cost in the process. The applications of rapid manufacturing
techniques in design and fabrication system can generate effective solution for
production of cost-effective custom-made foot orthoses with low lead-time at
commercial scale.
1.4 Structure of the Thesis
The main part of this thesis begins with the Chapter 2 which introduces the areas of
research from which this work is based. In this chapter an extensive literature review has
been conducted which consists mass customisation, rapid manufacturing techniques,
medical applications of rapid manufacturing, process modelling techniques and
fabrication of custom foot orthoses. Further, the chapter discusses the medical
applications of rapid manufacturing techniques for mass customisation in order to
evaluate the applications of these techniques at commercial scale production of custom
foot orthoses.
6
Chapter 3 covers modelling of design and fabrication process for custom foot orthoses
and an initial process model was designed for rapid manufacturing based design and
fabrication of custom foot orthoses. Chapter 4 presents the methods for foot geometry
capture and orthoses design. Different foot geometry capture and orthoses design
methods are analysed and evaluated in terms of cost, lead-time, accuracy and
consistency.
Chapter 5 discusses orthoses fabrication methods and various rapid manufacturing
techniques used for fabrication of orthoses are discussed. In chapter 6, analysis and
evaluation of cost and lead-time is presented for fabrication of custom-made foot
orthoses through different rapid manufacturing techniques. Chapter 7 presents the
overall discussion with conclusions and recommendations and finally at the end of
chapter future work is outlined.
7
Chapter 2 Literature survey
2.1 Introduction
The last two decades have remained periods of tremendous upheaval and rapid change
in the field of manufacturing engineering. The applications of rapid prototyping (RP)
and its more mature form, rapid manufacturing (RM) together with advancements in
medical digital techniques have grown significantly in the production of customised
products, implants and devices in the medical sector (Heiu et al., 2003; Brown et al.,
2003; Gibson et al., 2004; Winder and Bibb, 2005). These techniques have shown
successful commercial applications in mass customisation of personalised in-the-ear
hearing aids and dental braces (Tongola et al., 2003; Gibson et al., 2010).
In this chapter, a literature survey is reported which has been conducted in the context of
the aims and objectives of the research study. This addresses mass customisation, rapid
manufacturing techniques and medical applications of rapid manufacturing techniques,
custom foot orthoses design and fabrication process, process modelling methodologies
and IDEF0 process modelling technique.
2.2 Mass customisation
Mass customisation (MC) was once considered a paradox to be resolved in the future
but has become everyday reality for many companies because of applications of
advanced manufacturing technologies (AMT) (Pine et al., 1993; Kotha, 1995; Lau,
1995; Eastwood, 1996), product modularity (Pine, 1993; McCutcheon et al., 1994;
Baldwin and Clark, 1994; Pine et al., 1995) and extensive applications of information
technologies (Piller et al., 2004) in manufacturing for customisation. Advanced
manufacturing technologies such as computer-aided design (CAD), computer-aided
manufacturing (CAM), flexible manufacturing systems (FMS) and computer integrated
manufacturing (CIM) are considered as enabling technologies in manufacturing for mass
customisation. Some researchers consider these technologies as fundamental enablers
for mass customisation manufacturing; offering potential in reducing the tradeoffs
between variety and productivity (Ahlstrom and Westbrook, 1999; Kotha, 1995). The
8
flexibility of these technologies enables manufactures to produce quickly a variety of
products cost-effectively and in lot sizes as small as one.
The term “Mass Customisation” was initially anticipated by Alvin Toffler in 1970 in his
book “Future Shock” (Toffler, 1970) and later on coined by Stanley Davis in 1987 in his
book “Future Perfect” (Davis, 1987). Later on in the year 1993, Joseph Pine has
popularised mass customisation as new manufacturing strategy in his influential book
“Mass Customisation” (Pine, 1993). The important objective of mass customisation is to
achieve economies of scope that makes customised products as affordable as mass
produced products (McCarthy et al., 2003).
2.2.1 Definition of mass customisation
There are many definitions for mass customisation in the literature. Three of which the
author considers well founded are;
Mass customisation can be defined as provision of customised products and
services, using stable business and processes at a cost and fulfilment similar to
standard or mass produced products (Ross, 1996).
Mass customisation is a combination of producing customised products at a mass
scale with the ability to provide customisation to satisfy the individual customers
at reasonable cost with small lead-time (Pine et al., 1993).
Mass customisation is the competitive manufacturing ability to produce
customised products or services in high volume at reasonably low costs within
short lead-time (Silveira et al., 2001).
2.2.2 Customisation approaches
In MC literature, a number of writers have presented the frameworks for customisation
process. Coates and Wolf (Coates and Wolf, 1995) described customisation as a
manufacturing practice and termed customisation as “soft” and “hard”. According to
9
them, customisation is “soft” when the customers are not involved in the manufacturing
process, while in the “hard” customisation, customers are involved in the manufacturing
process.
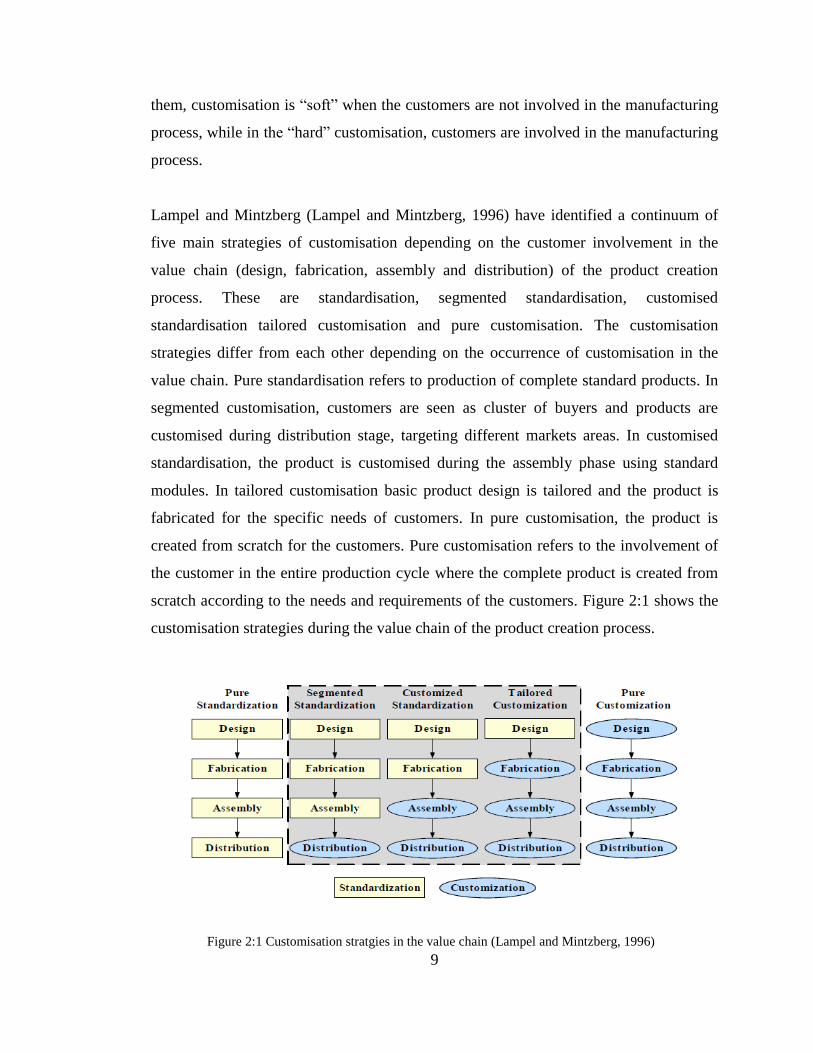
Lampel and Mintzberg (Lampel and Mintzberg, 1996) have identified a continuum of
five main strategies of customisation depending on the customer involvement in the
value chain (design, fabrication, assembly and distribution) of the product creation
process. These are standardisation, segmented standardisation, customised
standardisation tailored customisation and pure customisation. The customisation
strategies differ from each other depending on the occurrence of customisation in the
value chain. Pure standardisation refers to production of complete standard products. In
segmented customisation, customers are seen as cluster of buyers and products are
customised during distribution stage, targeting different markets areas. In customised
standardisation, the product is customised during the assembly phase using standard
modules. In tailored customisation basic product design is tailored and the product is
fabricated for the specific needs of customers. In pure customisation, the product is
created from scratch for the customers. Pure customisation refers to the involvement of
the customer in the entire production cycle where the complete product is created from
scratch according to the needs and requirements of the customers. Figure 2:1 shows the
customisation strategies during the value chain of the product creation process.
Figure 2:1 Customisation stratgies in the value chain (Lampel and Mintzberg, 1996)
10
Spira, (Spira, 1996) presented a customisation framework based on four types of
customisation from customised packaging, customised services and additional custom
work to a modular assembly for realisation of customisation.
Gilmore and Pine (Gilmore and Pine, 1997) have identified four distinct approaches for
customisation based on the empirical observations. These are collaborative, adaptive,
cosmetic, and transparent customisation. In collaborative customisation, the customers
select from pre-determined product configuration options and interact with manufacturer
before the product is customised. In adaptive customisation, the standard products are
customisable during their use by the customer. In cosmetic customisation, the standard
products are packed especially for the specific customers. In transparent customisation,
standard products are customised to fulfil the need of individual customer.
Silveira and associates (Silveira et al., 2001) developed eight generic approaches of
customisation ranging from pure customisation to pure standardisation based on
different frameworks presented by the researchers.
Duray and colleagues (Duray et al., 2000) combined customisation approach developed
by Lampel and Mintzberg with the type of product modularity and categorised the
customising companies according to the way they achieve mass customisation
(discussed in Section 2.2.3). They categorised the customising companies in groups of
fabricators, involvers, modularisers and assemblers. Figure 2:2 represents the
configuration model of customising companies developed by Duray and associates
(Duray et al, 2000). The fabricators group involve the customer at an early stage of the
product creation process for fabrication of unique products; which closely resemble pure
customisation. The involvers group involve the customer in product design during the
design and fabrication stage in which standard product modules are combined according
to customer requirements. The modularisers group involve the customer during
assembly and delivery and use modularity at an earlier stage in the manufacturing
process which is used by the customer at product usage stage. The assemblers group
offers to the customers a wide range of selectable options using modular components
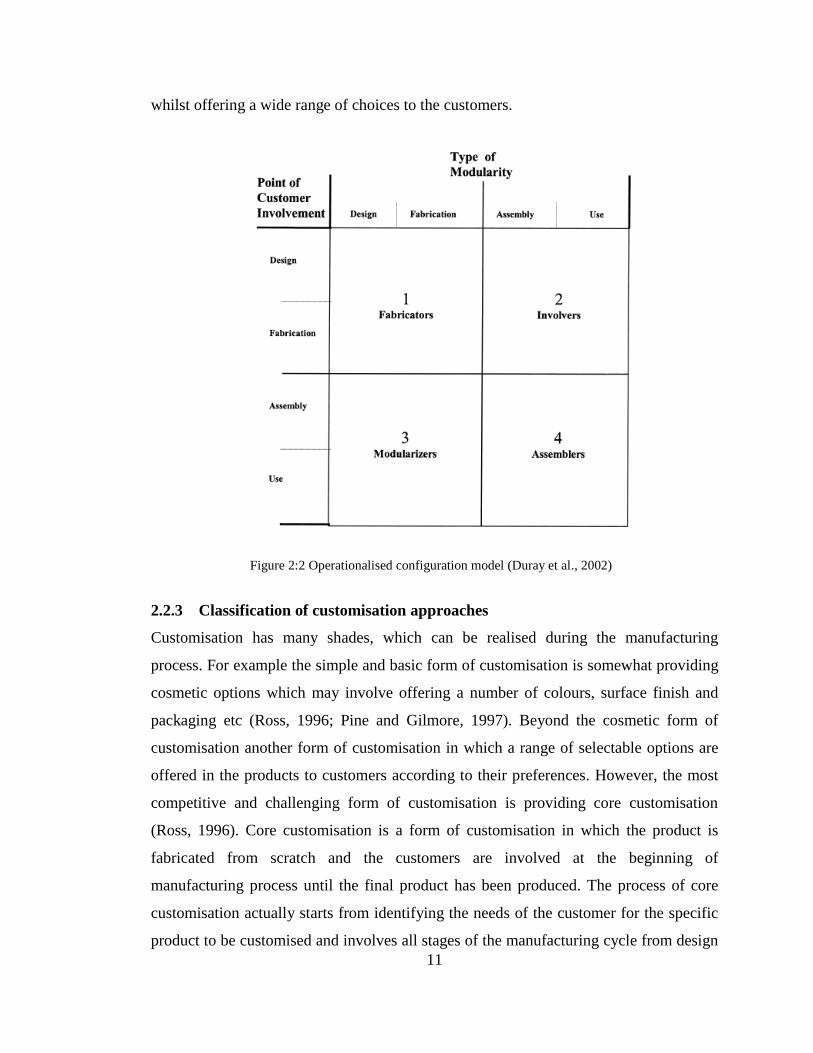
11
whilst offering a wide range of choices to the customers.
2.2.3 Classification of customisation approaches
Customisation has many shades, which can be realised during the manufacturing
process. For example the simple and basic form of customisation is somewhat providing
cosmetic options which may involve offering a number of colours, surface finish and
packaging etc (Ross, 1996; Pine and Gilmore, 1997). Beyond the cosmetic form of
customisation another form of customisation in which a range of selectable options are
offered in the products to customers according to their preferences. However, the most
competitive and challenging form of customisation is providing core customisation
(Ross, 1996). Core customisation is a form of customisation in which the product is
fabricated from scratch and the customers are involved at the beginning of
manufacturing process until the final product has been produced. The process of core
customisation actually starts from identifying the needs of the customer for the specific
product to be customised and involves all stages of the manufacturing cycle from design
Figure 2:2 Operationalised configuration model (Duray et al., 2002)
12
to a complete final product (Ross, 1996; Alford et al., 2000; Duray et al., 2000; Squire et
al., 2006).
2.2.4 Levels of customisation
Customisation level is mainly determined by two factors; product modularity and point
of customer involvement.
i. Product modularity
To achieve mass customisation, product modularity is often applied to create product
variety. Modularity is seen as key for the realisation of mass customisation (Pine, 1993;
Pine et al., 1995). Modularity is the process of enabling a product to be manufactured
from standardised plug and play modules or components which are capable of being
assembled to a final product bringing high product variety. Ulrich and Tung (Ulrich and
Tung, 1991) developed the typology of modularity which can be applied in the
manufacturing cycle for bringing customisation into practice. These are cut-to-fit
modularity, bus modularity, component swapping modularity, mixed modularity,
sectional modularity and component sharing modularity.
Example of production of lower limb prosthesis shown in Figure 2.15 in Section 2.3.4 is
an example of customisation in the products achieved through product modularity. The
lower limb prosthesis is based on product modular structure comprise of residual limb
socket and other parts of the leg. The socket for residual limb is fabricated individually
and customised according to required size and measurements of the residual limb of the
patients whereas all the other components and parts are included from product modular
structure.
ii. Point of customer involvement
The point of customer involvement is the point in customisation process where
customers interact during the manufacturing cycle of a product. This is achieved through
established forms of communications with the customers in order to change, alter or
modify the product according to their requirements and preferences (Duray et al., 1999;
Duray, et al., 2000; Duray, 2002). This is a very important step in the mass
customisation process and termed as “value creation” process during manufacturing
13
cycle. Customers take part during the value chain of manufacturing activities such as
design, fabrication, assembly and distribution and eventually become co-producer or
prosumer (Toffler, 1970).
As the product or service during manufacturing has to pass through several transforming
stages from design stage to a finished customised product, customisation can occur at
any point in the value chain (Lampel and Mintzberg, 1996). The point of customer
involvement also known as Customer Order Decoupling Point (CODP) determines the
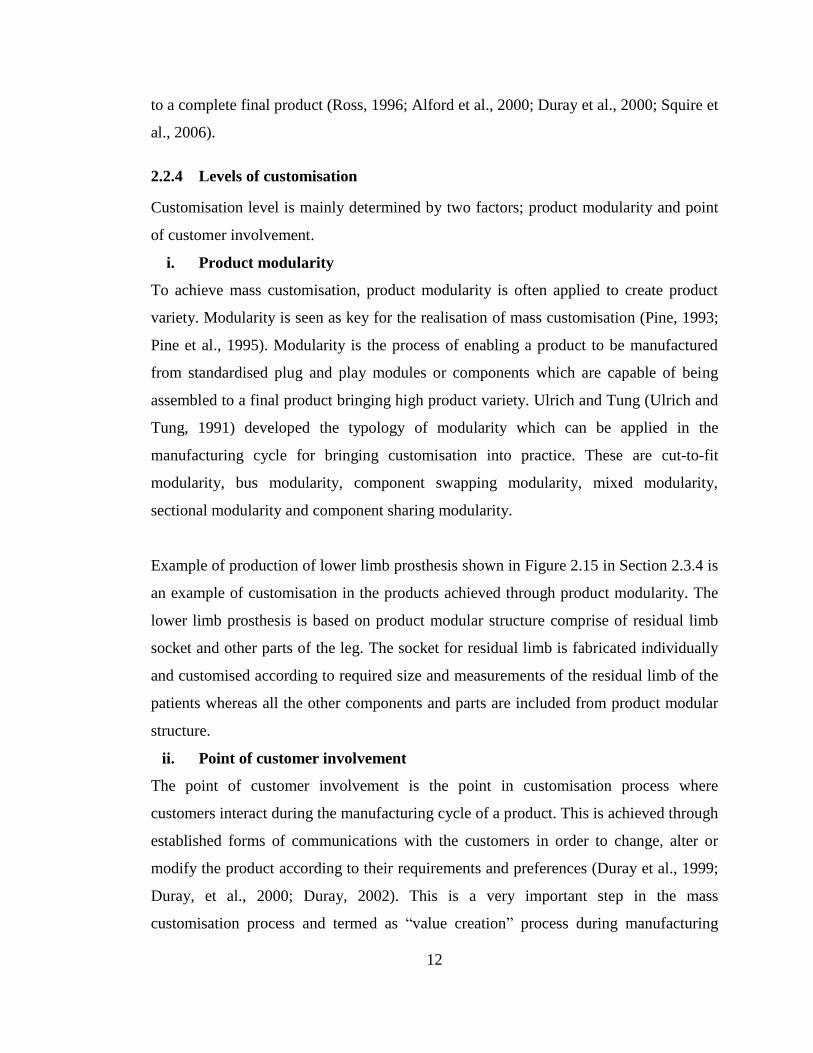
degree of customisation level in the products (Skipworth and Harrison, 2004). Figure
2:3 represents the levels of customisation in the product creation value chain and the
types of modularity applied in the customisation process. Early customer involvement in
the manufacturing cycle using component sharing and cut-to-fit modularity results in a
higher level or degree of customisation in the products. Customer involvement at the
later stage in the production cycle using component swapping, mix, bus and sectional
modularity result in lower degree of customisation in the products (Duray et al., 2000).
Figure 2:3 Customer involvement and modularity in production cycle (Duray et al., 2000)
14
2.2.5 Commercial examples of mass customisation
i. Dell mass customisation
Dell is one of the most recognised brands of computers in the world. Dell produce and
distribute servers, storage devices, printing and imaging systems, workstations,
notebooks and desktop personal computers, networking products as well as PDAs,
software and peripheral products. In year 1996, Dell began selling computers via its
website (www.dell.com), offering a customisation option in their products (Lebovitz and
Graban, 2001). This strategy was successful and by the year 1997, Dell was one of the
top five computer manufacturer/supplier in the world using the build-to-order
manufacturing strategy. The company now ships more than ten million systems every
quarter.
The Dell mass customisation system works through the strategy of establishing a direct
contact with customer. Direct relationship with customers is the main successful factor
and creates “valuable information” for the company regarding customer choices and
preferences (Kraemer et al., 2000). Customers are able to customise the products
through the Dell website according to their requirements and preferences within range of
selectable options and choices offered by company. In Dell, the product is manufactured
only after the customer has placed the order. Once the order for the product is placed, a
highly flexible manufacturing system supported with efficient supply chain is used to
customise and provide the custom made product within short period of time (Pollard,
2008).
ii. mi-adidas shoes mass customisation
Adidas Saloman AG (Adidas) company started mass customisation in their products by
the year 2001 under the name of “mi-adidas” for providing customised athletic sports
shoes. The program is for customisation of running shoes to be fitter, high performance,
choice of colours and designs; all services which were once only available to top
athletes (Berger, 2003). By providing custom shoes the company has established “mi-
adidas” sales points either within the selected stores or in mobile units which travel
between top sports events. The customisation process in “mi-adidas” involves three
steps in customisation process. In the first step a profile of the customer is created which
15
includes the information including the type of sports he/she play, nature of ground
surface (hard or soft), type of socks and required degree of grip of the shoes.
In the next step dynamic scanning of the foot measurements are taken which includes
the measurement of the foot, pressure points distribution and some other unique physical
attributes. In the third and last step the customers are able to select different design
variations and colour combinations for the shoes. Once this process is completed the
order is transferred to the manufacturing facility for final production of customised
shoes. An extensive supply chain system is used in order to deliver the customised
products within minimum delivery time to the customers (Moser et al., 2006).
iii. National Bicycle Industrial Company (NBIC)
Panasonic is also a famous name in bicycles along with other consumer electronics in
Japan. The company provides customised bicycles to the customers in Japan with a two
week delivery time. This delivery time is expanded to three weeks for provision of
customised bicycles worldwide. In the year 1987, company started the customisation of
bicycles by establishing a new plant near to its mass production plant and introduced a
new production system named “Panasonic Order System” (POS).
In (POS) customisation process customers can customise the bicycle by visiting a
nearby dealer where they can choose from eight million different combinations
comprising the type, colour, frame sizes, and other features of bicycle. At the shop
various measurements of the customer are taken in terms of torso length, leg length, arm
length and style of riding such as racing, touring, or off-road riding. This requires
different frame angles, frame dimensions, and tube gauges for optimum performance.
The customer has further options to select from the range of bicycle components such as
gears, pedals, brakes, handle bars and accessories according to their requirements and
preferences. Once the order is completed, it is then transferred to the factory having
highly flexible manufacturing system for production of the final customised bicycle
(Kotha, 1996).
16
The examples of product customisation showed that customisation is mainly achieved
through modular structure of the products and with the customer involvement during the
production cycle. As previously discussed in Section 2.2.4 modularity in the product
structure facilitates manufacturing of the products with some degree of distinctiveness
and differentiation which is achieved through combination of different plug and play
product modules (Ulrich, 1995; Pine, 1993; Pine et al., 1995). Thus, modularity is used
as a key feature for achieving higher scale in mass customisation; as the modular
approach offers increased range of end products (Pine, 1993; Baldwin and Clark, 1994).
However, in its actual concept pure customisation is to provide the products which
accommodate all the requirements made by individual customer where the each product
is created entirely from scratch. This concept of customisation is really challenging and
most competitive. The manufacturing companies offering customisation must have
ability to understand the customer requirements and must have the capability of
providing the pure customised products (Ross, 1996).
The important point in the customisation process is that there must be customer
involvement in the product customisation process that distinguishes the customised
products from mass produced products. Early or later stage involvement by the customer
during the product production cycle shows the level or degree of the customisation in
the product whereas product modularity contributes to alleviate the customisation
responsiveness, speed and shortened lead-times (McCutcheon et al., 1994).
2.3 Introduction to rapid manufacturing (RM)
Rapid Manufacturing (RM) is natural extension of rapid prototyping (RP) and has
evolved from the rapid prototyping technologies which have emerged over last two
decades (Hague et al, 2003). Rapid manufacturing is defined as the direct creation of
parts or components using parts designs created in a CAD system through a layer by
layer or additive manufacturing process. Rapid manufacturing processes require no
tooling or moulding and offer a greater design freedom in fabrication of highly complex
parts (Phillip and Wendell, 1997; Kruth et al., 1998; Levy et al., 2002).
17
In rapid manufacturing a virtual model of the part is designed through computer aided
design (CAD) and is converted to .stl file format which is de-facto industry standard file
format for rapid manufacturing systems (Pham and Dimnov, 2001; Gibson, 2005, Cee
Kai, 2003; Noorani, 2006; Hopkinson et al., 2006). The designed data is then sent to
rapid manufacturing systems for the creation of the parts.
Rapid manufacturing techniques have profound impacts on design and manufacturing
with the advantages of creating complex geometrical parts, tool less manufacturing and
digital manufacturing process. The development of rapid manufacturing techniques is
closely related with developments and advancements in computer technologies and
wider applications of computers in the manufacturing industry.
2.3.1 Basic working process of rapid manufacturing
There are five basic steps involved in a rapid manufacturing process.
Creating a CAD based model of design.
Converting the CAD model into .stl file format.
Slicing the .stl file into thin cross-sectional layers.
Fabrication of the model layer by layer on rapid manufacturing system.
Clean and finish the fabricated model or part (post processing).
There are many rapid manufacturing techniques commercially available and these
techniques are called solid freeform fabrication (SFF), additive manufacturing (AM) or
layer manufacturing (LM). For small production runs or one-off products with
complicated and complex geometrical designs features application of rapid
manufacturing techniques can be the quick and cost effective manufacturing processes
(Pham and Dimnov, 2001; Hopkinson and Dickens, 2003).
2.3.2 Rapid manufacturing (RM) techniques
Rapid manufacturing techniques can be categorised in different ways depending on the
nature of the fabrication process such as laser, printer technology and extrusion
technology (Gibson et al., 2010) or type of materials used (Kruth et al., 1998; Pham and
18
Dimnov, 2001; Noorani, 2006). According to the type of material used, rapid
manufacturing (RM) techniques are divided into three categories which are;
Liquid-based rapid manufacturing systems
Powder-based rapid manufacturing systems
Solid-based rapid manufacturing systems
i. Stereolithography SLA (Liquid-based system)
Stereolithography is widely considered as the founding process in RP and was patented
in 1984. The first commercial implementation of system introduced by 3D systems Inc,
USA in 1986 (Pham and Dimov, 2001; Cee Kai, 2003; Hopkinson et al., 2006; Wohlers,
2006). Figure 2:4 represents the schematic process of SLA technique. This technique
gradually builds up a three-dimensional (3D) part from liquid photosensitive polymers
(C) contained in vat (B); layer by layer (Noorani, 2006). Computer aided design (CAD)
is used to drive the laser beam (D) to strike at the selected spots of the surface of liquid
polymer that turns it into solid state forming a solid layer (Kruth et al., 1998). The
model or part is built on a platform and once the first layer is adhered to the platform,
the platform is then lowered and a fresh layer of liquid polymer is swept over the
previous layer. The CAD guided laser beam again strikes on the newly deposited liquid
polymer making another solid layer over the previous made layer. This process is
performed and repeated continuously to construct layer by layer addition until the final
model or part is completed (Yan and Gu, 1996; Rosochowski and Matuszak, 2000). The
self adhesive property of the material causes layers to bond to one another to form a
complete 3D part or object. Afterwards the fabricated solid model or part is removed
from the system.
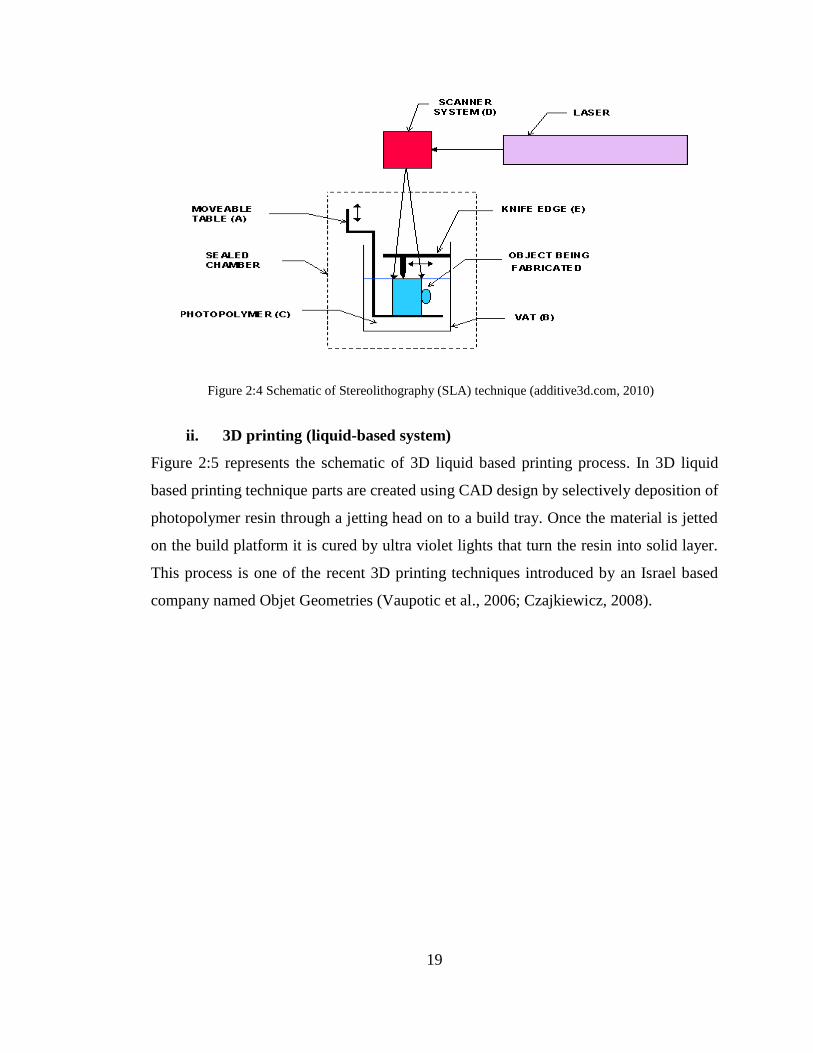
19
ii. 3D printing (liquid-based system)
Figure 2:5 represents the schematic of 3D liquid based printing process. In 3D liquid
based printing technique parts are created using CAD design by selectively deposition of
photopolymer resin through a jetting head on to a build tray. Once the material is jetted
on the build platform it is cured by ultra violet lights that turn the resin into solid layer.
This process is one of the recent 3D printing techniques introduced by an Israel based
company named Objet Geometries (Vaupotic et al., 2006; Czajkiewicz, 2008).
Figure 2:4 Schematic of Stereolithography (SLA) technique (additive3d.com, 2010)
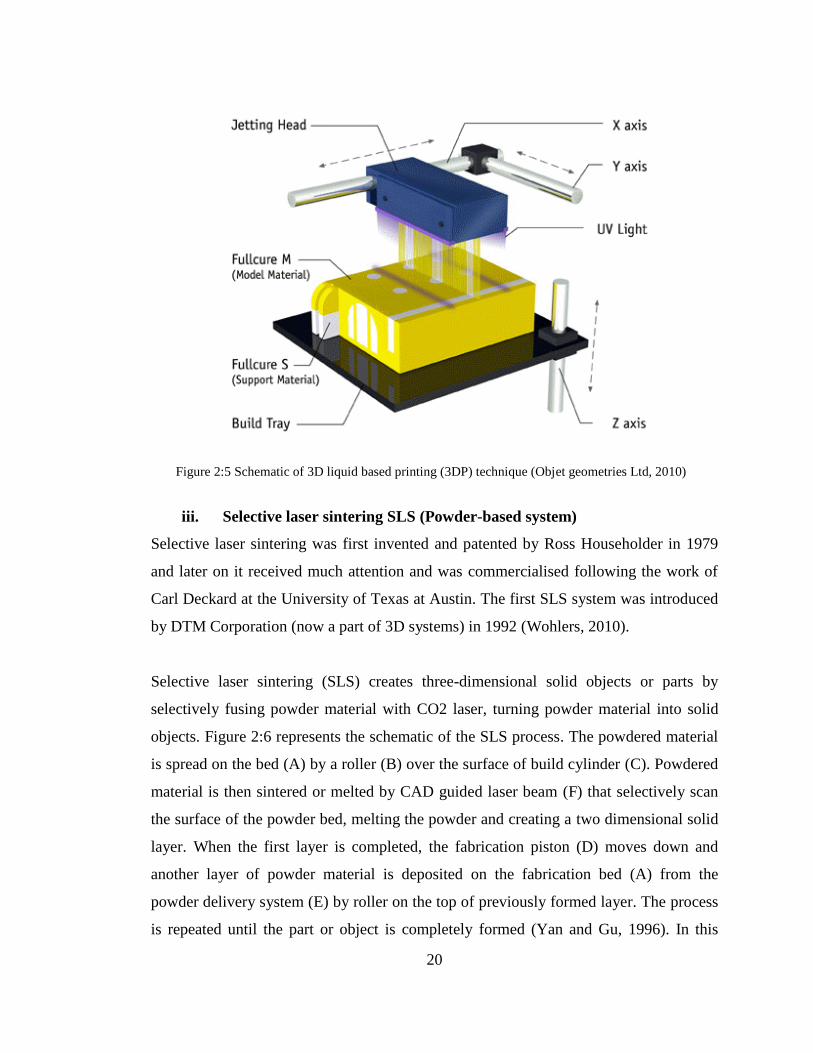
20
iii. Selective laser sintering SLS (Powder-based system)
Selective laser sintering was first invented and patented by Ross Householder in 1979
and later on it received much attention and was commercialised following the work of
Carl Deckard at the University of Texas at Austin. The first SLS system was introduced
by DTM Corporation (now a part of 3D systems) in 1992 (Wohlers, 2010).
Selective laser sintering (SLS) creates three-dimensional solid objects or parts by
selectively fusing powder material with CO2 laser, turning powder material into solid
objects. Figure 2:6 represents the schematic of the SLS process. The powdered material
is spread on the bed (A) by a roller (B) over the surface of build cylinder (C). Powdered
material is then sintered or melted by CAD guided laser beam (F) that selectively scan
the surface of the powder bed, melting the powder and creating a two dimensional solid
layer. When the first layer is completed, the fabrication piston (D) moves down and
another layer of powder material is deposited on the fabrication bed (A) from the
powder delivery system (E) by roller on the top of previously formed layer. The process
is repeated until the part or object is completely formed (Yan and Gu, 1996). In this
Figure 2:5 Schematic of 3D liquid based printing (3DP) technique (Objet geometries Ltd, 2010)
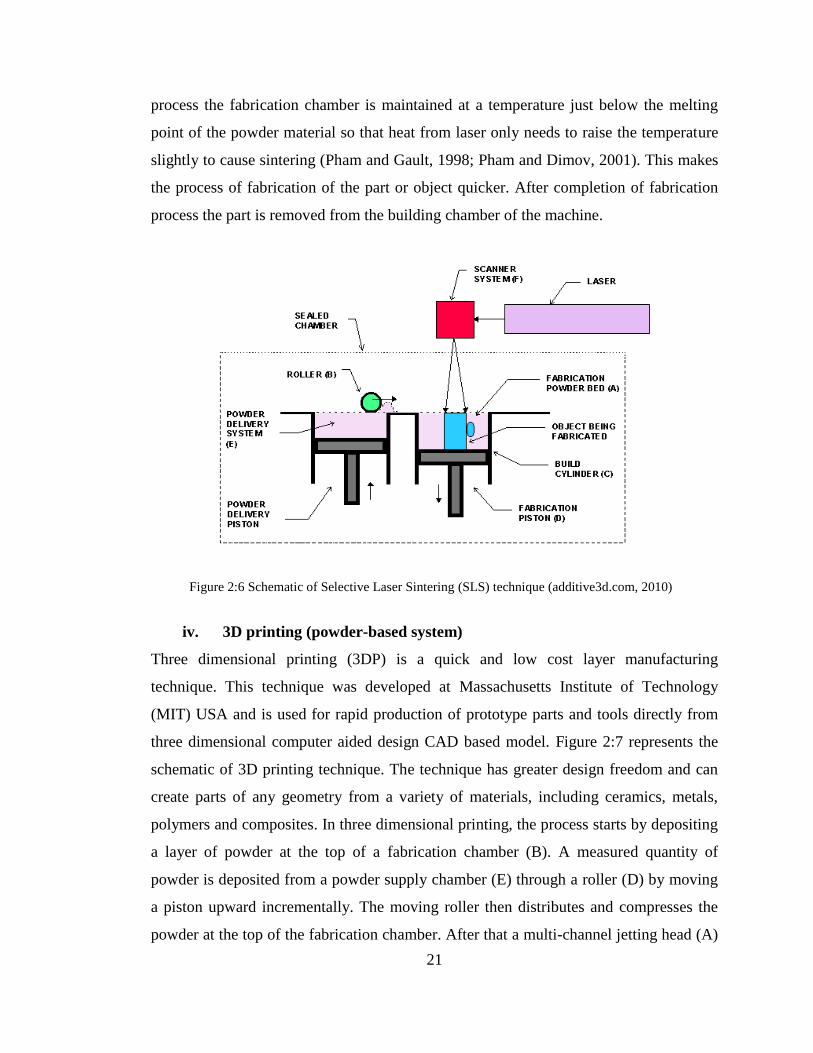
21
process the fabrication chamber is maintained at a temperature just below the melting
point of the powder material so that heat from laser only needs to raise the temperature
slightly to cause sintering (Pham and Gault, 1998; Pham and Dimov, 2001). This makes
the process of fabrication of the part or object quicker. After completion of fabrication
process the part is removed from the building chamber of the machine.
iv. 3D printing (powder-based system)
Three dimensional printing (3DP) is a quick and low cost layer manufacturing
technique. This technique was developed at Massachusetts Institute of Technology
(MIT) USA and is used for rapid production of prototype parts and tools directly from
three dimensional computer aided design CAD based model. Figure 2:7 represents the
schematic of 3D printing technique. The technique has greater design freedom and can
create parts of any geometry from a variety of materials, including ceramics, metals,
polymers and composites. In three dimensional printing, the process starts by depositing
a layer of powder at the top of a fabrication chamber (B). A measured quantity of
powder is deposited from a powder supply chamber (E) through a roller (D) by moving
a piston upward incrementally. The moving roller then distributes and compresses the
powder at the top of the fabrication chamber. After that a multi-channel jetting head (A)
Figure 2:6 Schematic of Selective Laser Sintering (SLS) technique (additive3d.com, 2010)
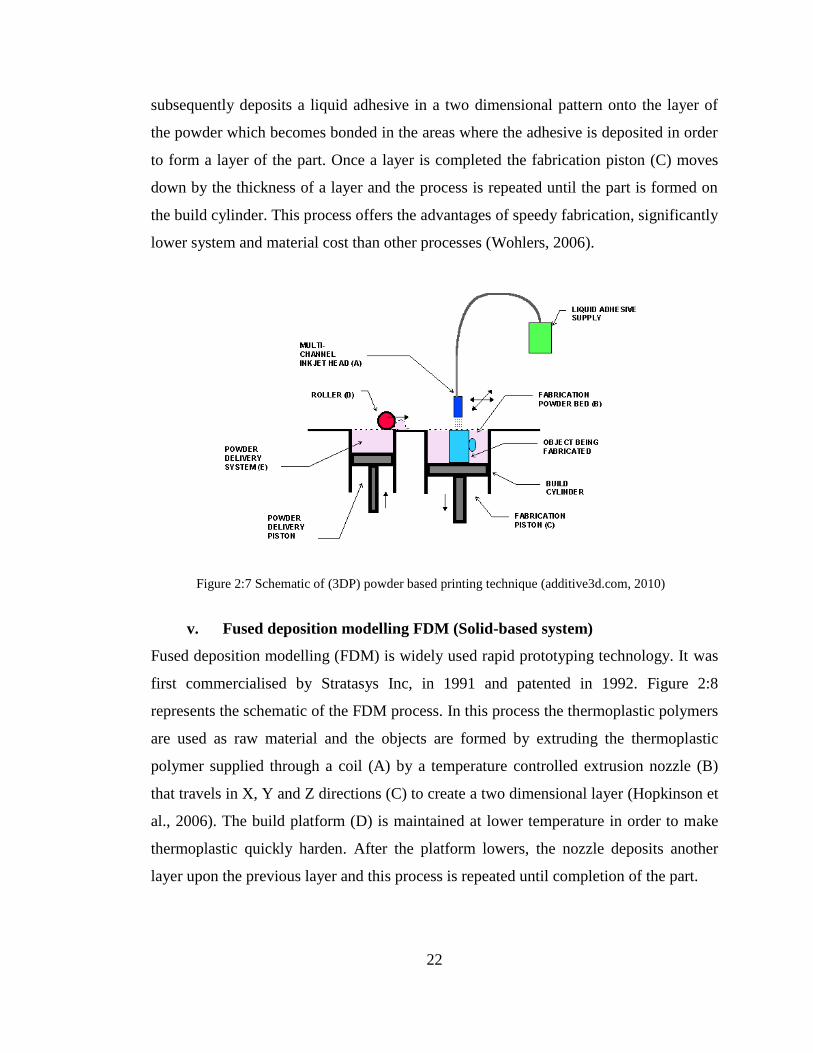
22
subsequently deposits a liquid adhesive in a two dimensional pattern onto the layer of
the powder which becomes bonded in the areas where the adhesive is deposited in order
to form a layer of the part. Once a layer is completed the fabrication piston (C) moves
down by the thickness of a layer and the process is repeated until the part is formed on
the build cylinder. This process offers the advantages of speedy fabrication, significantly
lower system and material cost than other processes (Wohlers, 2006).
v. Fused deposition modelling FDM (Solid-based system)
Fused deposition modelling (FDM) is widely used rapid prototyping technology. It was
first commercialised by Stratasys Inc, in 1991 and patented in 1992. Figure 2:8
represents the schematic of the FDM process. In this process the thermoplastic polymers
are used as raw material and the objects are formed by extruding the thermoplastic
polymer supplied through a coil (A) by a temperature controlled extrusion nozzle (B)
that travels in X, Y and Z directions (C) to create a two dimensional layer (Hopkinson et
al., 2006). The build platform (D) is maintained at lower temperature in order to make
thermoplastic quickly harden. After the platform lowers, the nozzle deposits another
layer upon the previous layer and this process is repeated until completion of the part.
Figure 2:7 Schematic of (3DP) powder based printing technique (additive3d.com, 2010)
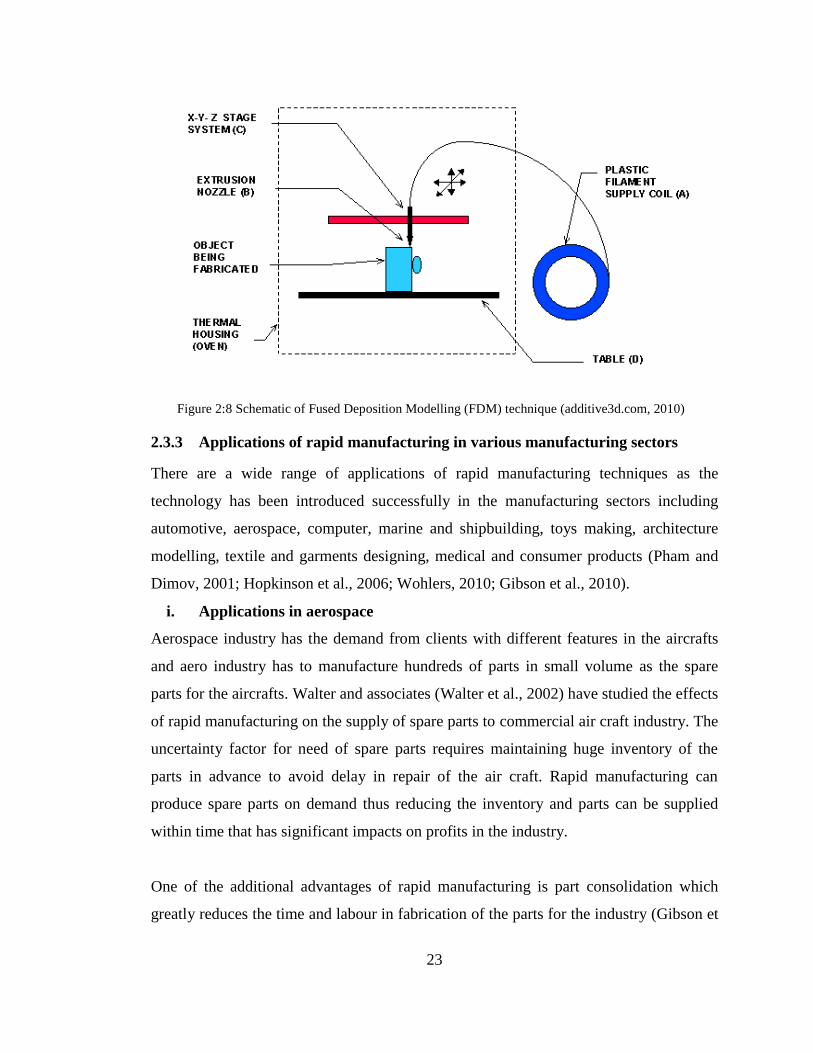
23
2.3.3 Applications of rapid manufacturing in various manufacturing sectors
There are a wide range of applications of rapid manufacturing techniques as the
technology has been introduced successfully in the manufacturing sectors including
automotive, aerospace, computer, marine and shipbuilding, toys making, architecture
modelling, textile and garments designing, medical and consumer products (Pham and
Dimov, 2001; Hopkinson et al., 2006; Wohlers, 2010; Gibson et al., 2010).
i. Applications in aerospace
Aerospace industry has the demand from clients with different features in the aircrafts
and aero industry has to manufacture hundreds of parts in small volume as the spare
parts for the aircrafts. Walter and associates (Walter et al., 2002) have studied the effects
of rapid manufacturing on the supply of spare parts to commercial air craft industry. The
uncertainty factor for need of spare parts requires maintaining huge inventory of the
parts in advance to avoid delay in repair of the air craft. Rapid manufacturing can
produce spare parts on demand thus reducing the inventory and parts can be supplied
within time that has significant impacts on profits in the industry.
One of the additional advantages of rapid manufacturing is part consolidation which
greatly reduces the time and labour in fabrication of the parts for the industry (Gibson et
Figure 2:8 Schematic of Fused Deposition Modelling (FDM) technique (additive3d.com, 2010)
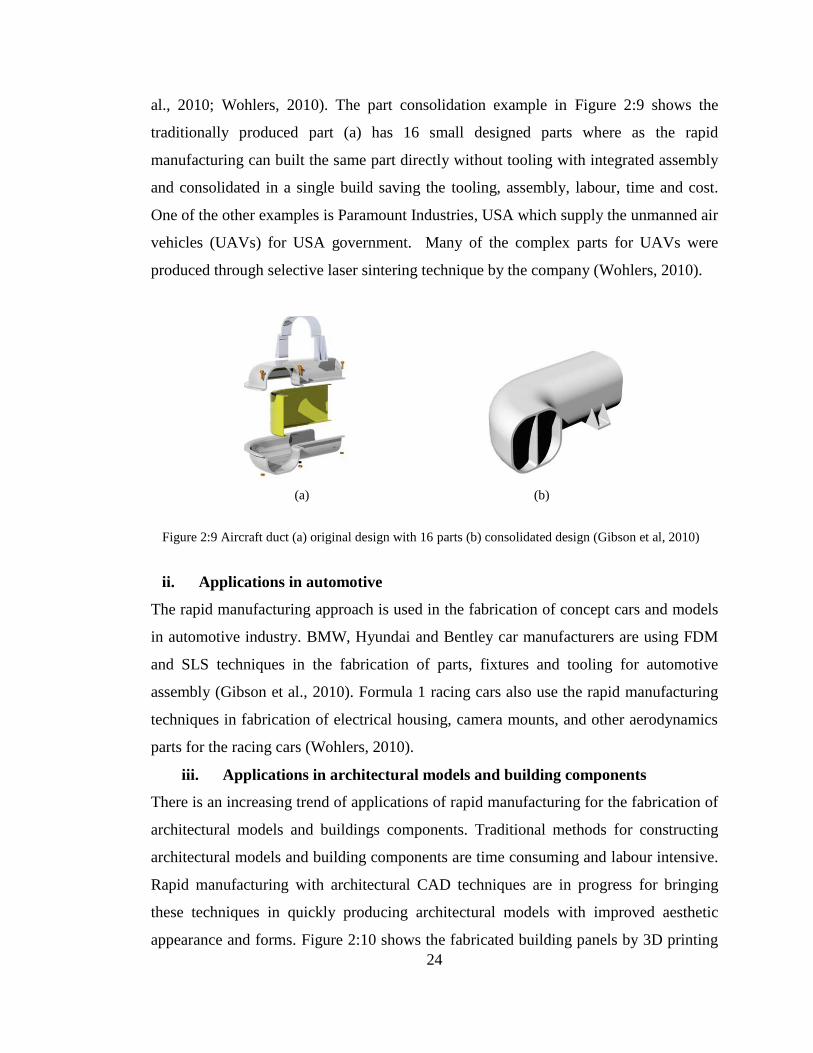
24
al., 2010; Wohlers, 2010). The part consolidation example in Figure 2:9 shows the
traditionally produced part (a) has 16 small designed parts where as the rapid
manufacturing can built the same part directly without tooling with integrated assembly
and consolidated in a single build saving the tooling, assembly, labour, time and cost.
One of the other examples is Paramount Industries, USA which supply the unmanned air
vehicles (UAVs) for USA government. Many of the complex parts for UAVs were
produced through selective laser sintering technique by the company (Wohlers, 2010).
(a) (b)
ii. Applications in automotive
The rapid manufacturing approach is used in the fabrication of concept cars and models
in automotive industry. BMW, Hyundai and Bentley car manufacturers are using FDM
and SLS techniques in the fabrication of parts, fixtures and tooling for automotive
assembly (Gibson et al., 2010). Formula 1 racing cars also use the rapid manufacturing
techniques in fabrication of electrical housing, camera mounts, and other aerodynamics
parts for the racing cars (Wohlers, 2010).
iii. Applications in architectural models and building components
There is an increasing trend of applications of rapid manufacturing for the fabrication of
architectural models and buildings components. Traditional methods for constructing
architectural models and building components are time consuming and labour intensive.
Rapid manufacturing with architectural CAD techniques are in progress for bringing
these techniques in quickly producing architectural models with improved aesthetic
appearance and forms. Figure 2:10 shows the fabricated building panels by 3D printing
Figure 2:9 Aircraft duct (a) original design with 16 parts (b) consolidated design (Gibson et al, 2010)
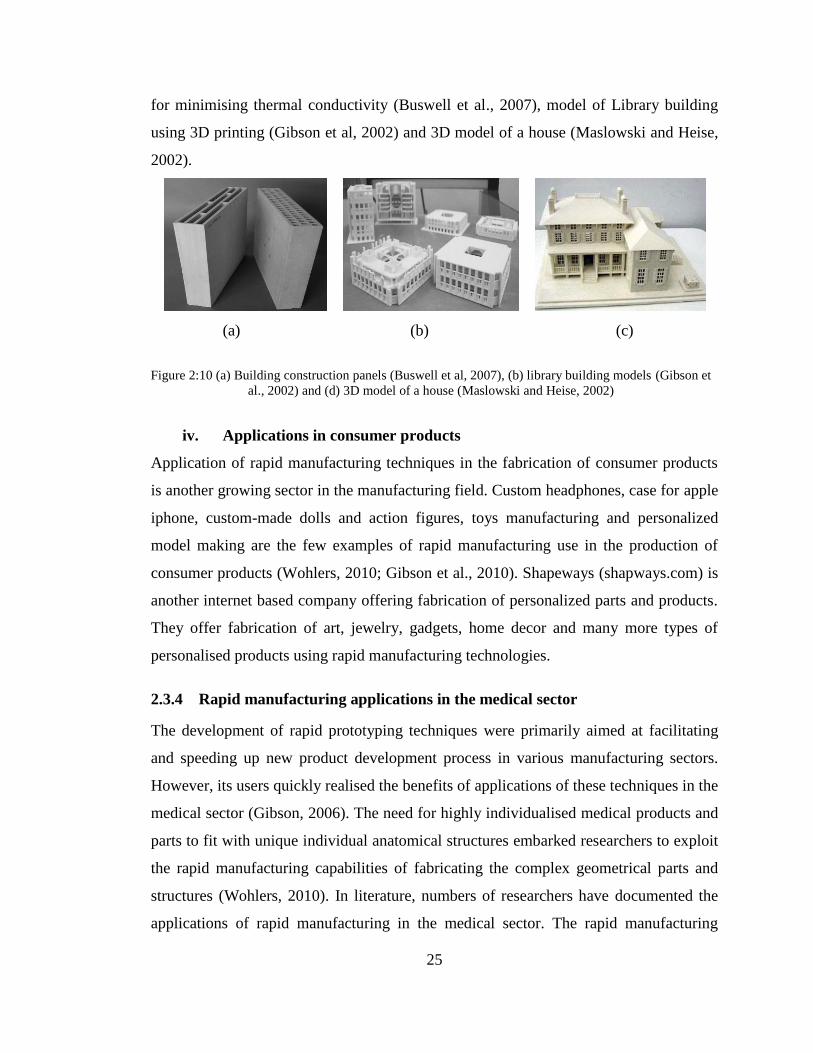
25
for minimising thermal conductivity (Buswell et al., 2007), model of Library building
using 3D printing (Gibson et al, 2002) and 3D model of a house (Maslowski and Heise,
2002).
(a) (b) (c)
iv. Applications in consumer products
Application of rapid manufacturing techniques in the fabrication of consumer products
is another growing sector in the manufacturing field. Custom headphones, case for apple
iphone, custom-made dolls and action figures, toys manufacturing and personalized
model making are the few examples of rapid manufacturing use in the production of
consumer products (Wohlers, 2010; Gibson et al., 2010). Shapeways (shapways.com) is
another internet based company offering fabrication of personalized parts and products.
They offer fabrication of art, jewelry, gadgets, home decor and many more types of
personalised products using rapid manufacturing technologies.
2.3.4 Rapid manufacturing applications in the medical sector
The development of rapid prototyping techniques were primarily aimed at facilitating
and speeding up new product development process in various manufacturing sectors.
However, its users quickly realised the benefits of applications of these techniques in the
medical sector (Gibson, 2006). The need for highly individualised medical products and
parts to fit with unique individual anatomical structures embarked researchers to exploit
the rapid manufacturing capabilities of fabricating the complex geometrical parts and
structures (Wohlers, 2010). In literature, numbers of researchers have documented the
applications of rapid manufacturing in the medical sector. The rapid manufacturing
Figure 2:10 (a) Building construction panels (Buswell et al, 2007), (b) library building models (Gibson et
al., 2002) and (d) 3D model of a house (Maslowski and Heise, 2002)
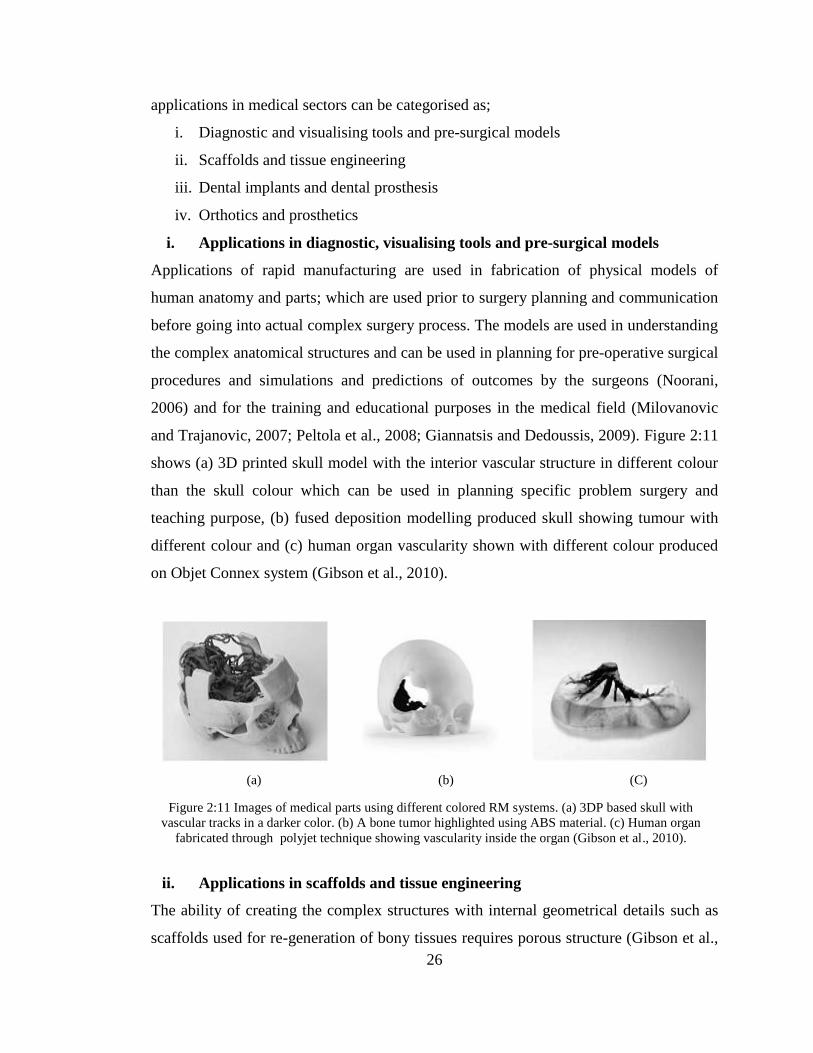
26
applications in medical sectors can be categorised as;
i. Diagnostic and visualising tools and pre-surgical models
ii. Scaffolds and tissue engineering
iii. Dental implants and dental prosthesis
iv. Orthotics and prosthetics
i. Applications in diagnostic, visualising tools and pre-surgical models
Applications of rapid manufacturing are used in fabrication of physical models of
human anatomy and parts; which are used prior to surgery planning and communication
before going into actual complex surgery process. The models are used in understanding
the complex anatomical structures and can be used in planning for pre-operative surgical
procedures and simulations and predictions of outcomes by the surgeons (Noorani,
2006) and for the training and educational purposes in the medical field (Milovanovic
and Trajanovic, 2007; Peltola et al., 2008; Giannatsis and Dedoussis, 2009). Figure 2:11
shows (a) 3D printed skull model with the interior vascular structure in different colour
than the skull colour which can be used in planning specific problem surgery and
teaching purpose, (b) fused deposition modelling produced skull showing tumour with
different colour and (c) human organ vascularity shown with different colour produced
on Objet Connex system (Gibson et al., 2010).
(a) (b) (C)
ii. Applications in scaffolds and tissue engineering
The ability of creating the complex structures with internal geometrical details such as
scaffolds used for re-generation of bony tissues requires porous structure (Gibson et al.,
Figure 2:11 Images of medical parts using different colored RM systems. (a) 3DP based skull with
vascular tracks in a darker color. (b) A bone tumor highlighted using ABS material. (c) Human organ
fabricated through polyjet technique showing vascularity inside the organ (Gibson et al., 2010).
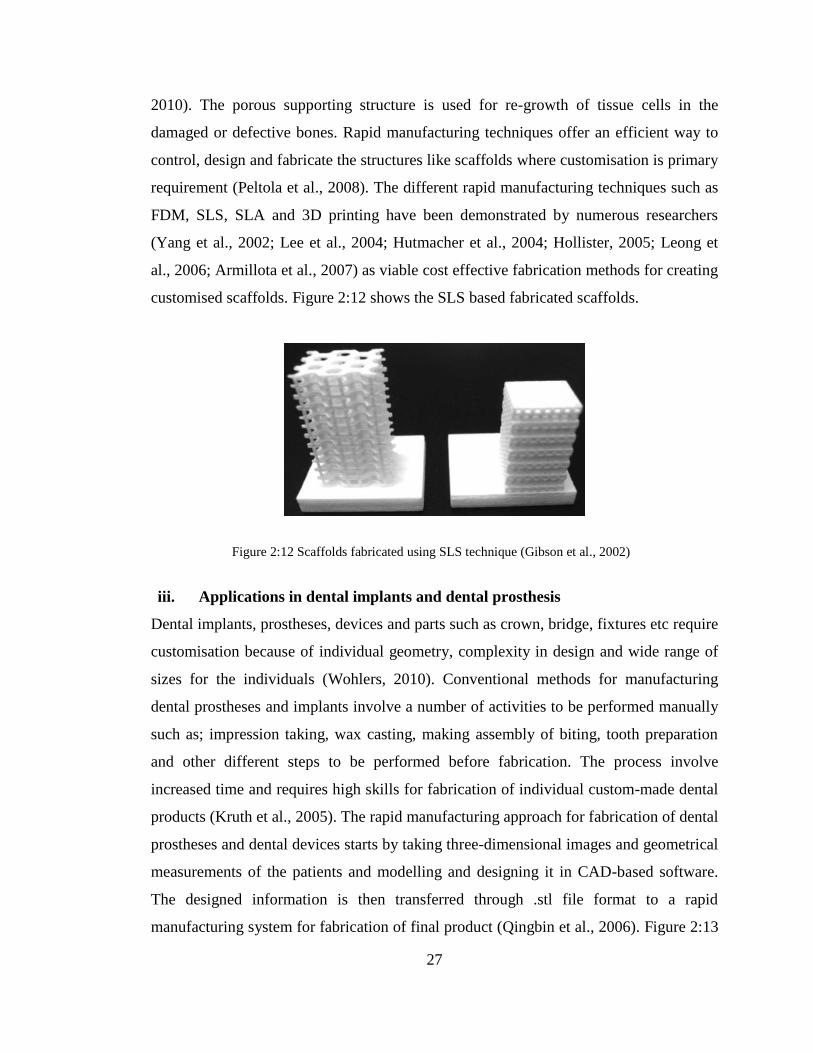
27
2010). The porous supporting structure is used for re-growth of tissue cells in the
damaged or defective bones. Rapid manufacturing techniques offer an efficient way to
control, design and fabricate the structures like scaffolds where customisation is primary
requirement (Peltola et al., 2008). The different rapid manufacturing techniques such as
FDM, SLS, SLA and 3D printing have been demonstrated by numerous researchers
(Yang et al., 2002; Lee et al., 2004; Hutmacher et al., 2004; Hollister, 2005; Leong et
al., 2006; Armillota et al., 2007) as viable cost effective fabrication methods for creating
customised scaffolds. Figure 2:12 shows the SLS based fabricated scaffolds.
iii. Applications in dental implants and dental prosthesis
Dental implants, prostheses, devices and parts such as crown, bridge, fixtures etc require
customisation because of individual geometry, complexity in design and wide range of
sizes for the individuals (Wohlers, 2010). Conventional methods for manufacturing
dental prostheses and implants involve a number of activities to be performed manually
such as; impression taking, wax casting, making assembly of biting, tooth preparation
and other different steps to be performed before fabrication. The process involve
increased time and requires high skills for fabrication of individual custom-made dental
products (Kruth et al., 2005). The rapid manufacturing approach for fabrication of dental
prostheses and dental devices starts by taking three-dimensional images and geometrical
measurements of the patients and modelling and designing it in CAD-based software.
The designed information is then transferred through .stl file format to a rapid
manufacturing system for fabrication of final product (Qingbin et al., 2006). Figure 2:13
Figure 2:12 Scaffolds fabricated using SLS technique (Gibson et al., 2002)
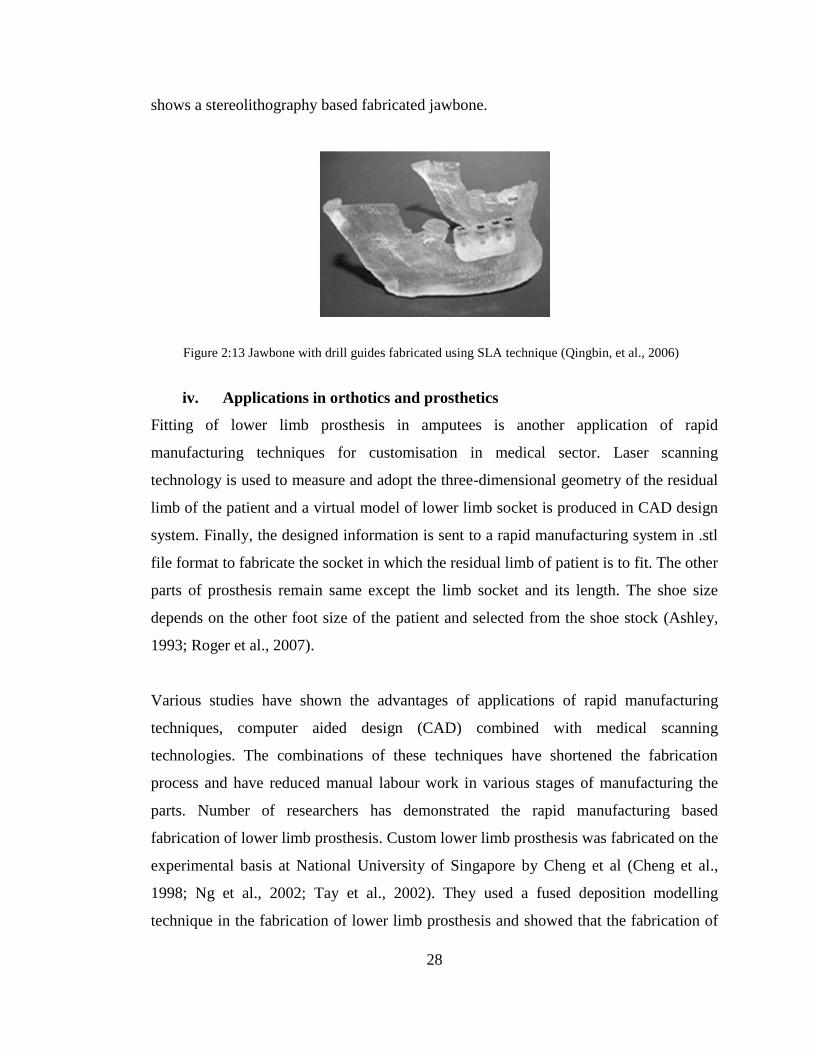
28
shows a stereolithography based fabricated jawbone.
iv. Applications in orthotics and prosthetics
Fitting of lower limb prosthesis in amputees is another application of rapid
manufacturing techniques for customisation in medical sector. Laser scanning
technology is used to measure and adopt the three-dimensional geometry of the residual
limb of the patient and a virtual model of lower limb socket is produced in CAD design
system. Finally, the designed information is sent to a rapid manufacturing system in .stl
file format to fabricate the socket in which the residual limb of patient is to fit. The other
parts of prosthesis remain same except the limb socket and its length. The shoe size
depends on the other foot size of the patient and selected from the shoe stock (Ashley,
1993; Roger et al., 2007).
Various studies have shown the advantages of applications of rapid manufacturing
techniques, computer aided design (CAD) combined with medical scanning
technologies. The combinations of these techniques have shortened the fabrication
process and have reduced manual labour work in various stages of manufacturing the
parts. Number of researchers has demonstrated the rapid manufacturing based
fabrication of lower limb prosthesis. Custom lower limb prosthesis was fabricated on the
experimental basis at National University of Singapore by Cheng et al (Cheng et al.,
1998; Ng et al., 2002; Tay et al., 2002). They used a fused deposition modelling
technique in the fabrication of lower limb prosthesis and showed that the fabrication of
Figure 2:13 Jawbone with drill guides fabricated using SLA technique (Qingbin, et al., 2006)
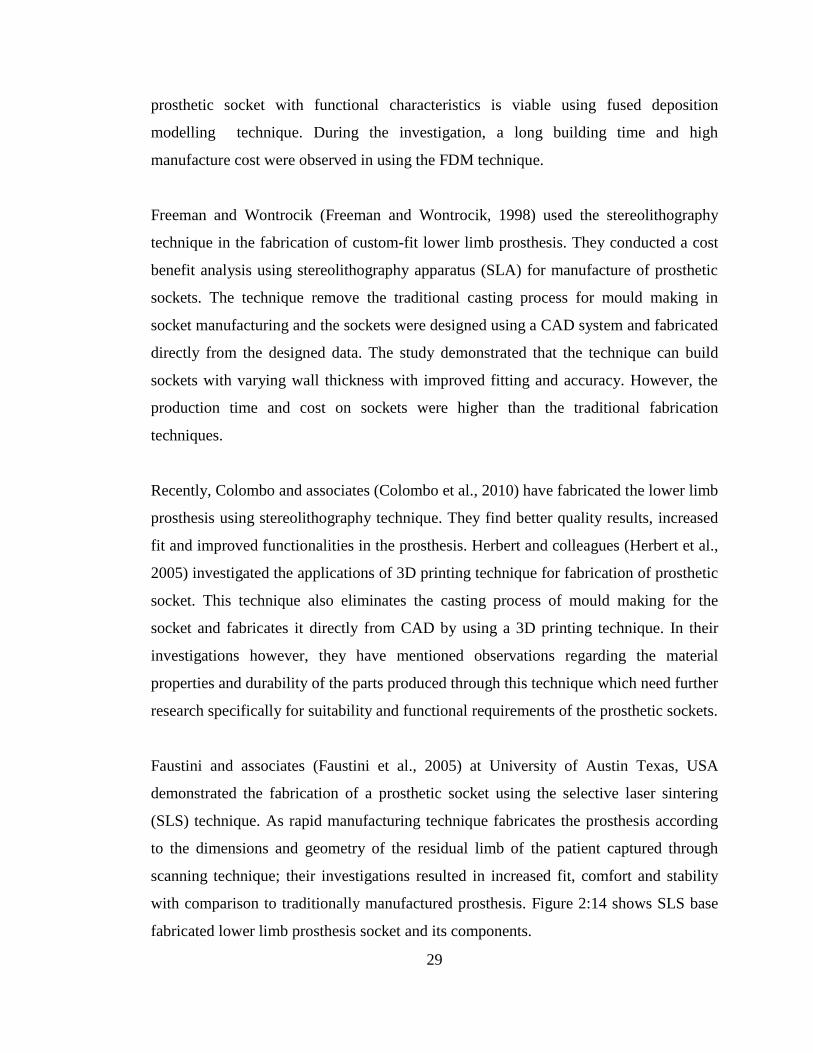
29
prosthetic socket with functional characteristics is viable using fused deposition
modelling technique. During the investigation, a long building time and high
manufacture cost were observed in using the FDM technique.
Freeman and Wontrocik (Freeman and Wontrocik, 1998) used the stereolithography
technique in the fabrication of custom-fit lower limb prosthesis. They conducted a cost
benefit analysis using stereolithography apparatus (SLA) for manufacture of prosthetic
sockets. The technique remove the traditional casting process for mould making in
socket manufacturing and the sockets were designed using a CAD system and fabricated
directly from the designed data. The study demonstrated that the technique can build
sockets with varying wall thickness with improved fitting and accuracy. However, the
production time and cost on sockets were higher than the traditional fabrication
techniques.
Recently, Colombo and associates (Colombo et al., 2010) have fabricated the lower limb
prosthesis using stereolithography technique. They find better quality results, increased
fit and improved functionalities in the prosthesis. Herbert and colleagues (Herbert et al.,
2005) investigated the applications of 3D printing technique for fabrication of prosthetic
socket. This technique also eliminates the casting process of mould making for the
socket and fabricates it directly from CAD by using a 3D printing technique. In their
investigations however, they have mentioned observations regarding the material
properties and durability of the parts produced through this technique which need further
research specifically for suitability and functional requirements of the prosthetic sockets.
Faustini and associates (Faustini et al., 2005) at University of Austin Texas, USA
demonstrated the fabrication of a prosthetic socket using the selective laser sintering
(SLS) technique. As rapid manufacturing technique fabricates the prosthesis according
to the dimensions and geometry of the residual limb of the patient captured through
scanning technique; their investigations resulted in increased fit, comfort and stability
with comparison to traditionally manufactured prosthesis. Figure 2:14 shows SLS base
fabricated lower limb prosthesis socket and its components.
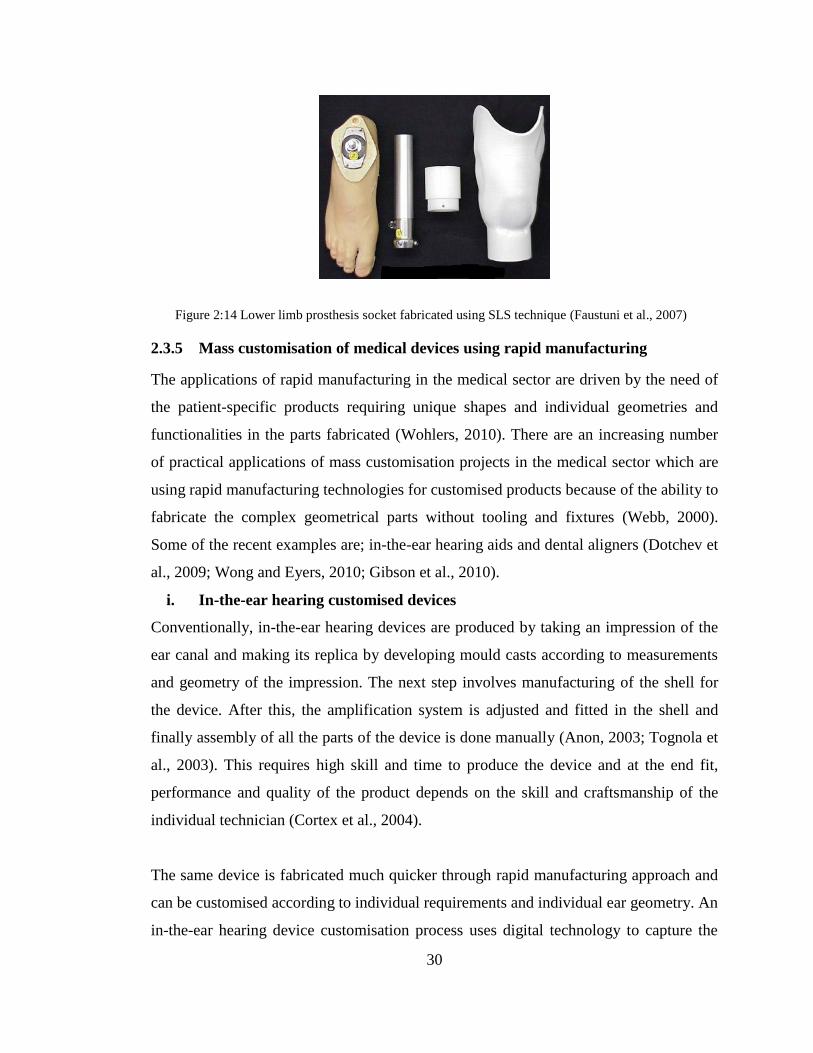
30
2.3.5 Mass customisation of medical devices using rapid manufacturing
The applications of rapid manufacturing in the medical sector are driven by the need of
the patient-specific products requiring unique shapes and individual geometries and
functionalities in the parts fabricated (Wohlers, 2010). There are an increasing number
of practical applications of mass customisation projects in the medical sector which are
using rapid manufacturing technologies for customised products because of the ability to
fabricate the complex geometrical parts without tooling and fixtures (Webb, 2000).
Some of the recent examples are; in-the-ear hearing aids and dental aligners (Dotchev et
al., 2009; Wong and Eyers, 2010; Gibson et al., 2010).
i. In-the-ear hearing customised devices
Conventionally, in-the-ear hearing devices are produced by taking an impression of the
ear canal and making its replica by developing mould casts according to measurements
and geometry of the impression. The next step involves manufacturing of the shell for
the device. After this, the amplification system is adjusted and fitted in the shell and
finally assembly of all the parts of the device is done manually (Anon, 2003; Tognola et
al., 2003). This requires high skill and time to produce the device and at the end fit,
performance and quality of the product depends on the skill and craftsmanship of the
individual technician (Cortex et al., 2004).
The same device is fabricated much quicker through rapid manufacturing approach and
can be customised according to individual requirements and individual ear geometry. An
in-the-ear hearing device customisation process uses digital technology to capture the
Figure 2:14 Lower limb prosthesis socket fabricated using SLS technique (Faustuni et al., 2007)
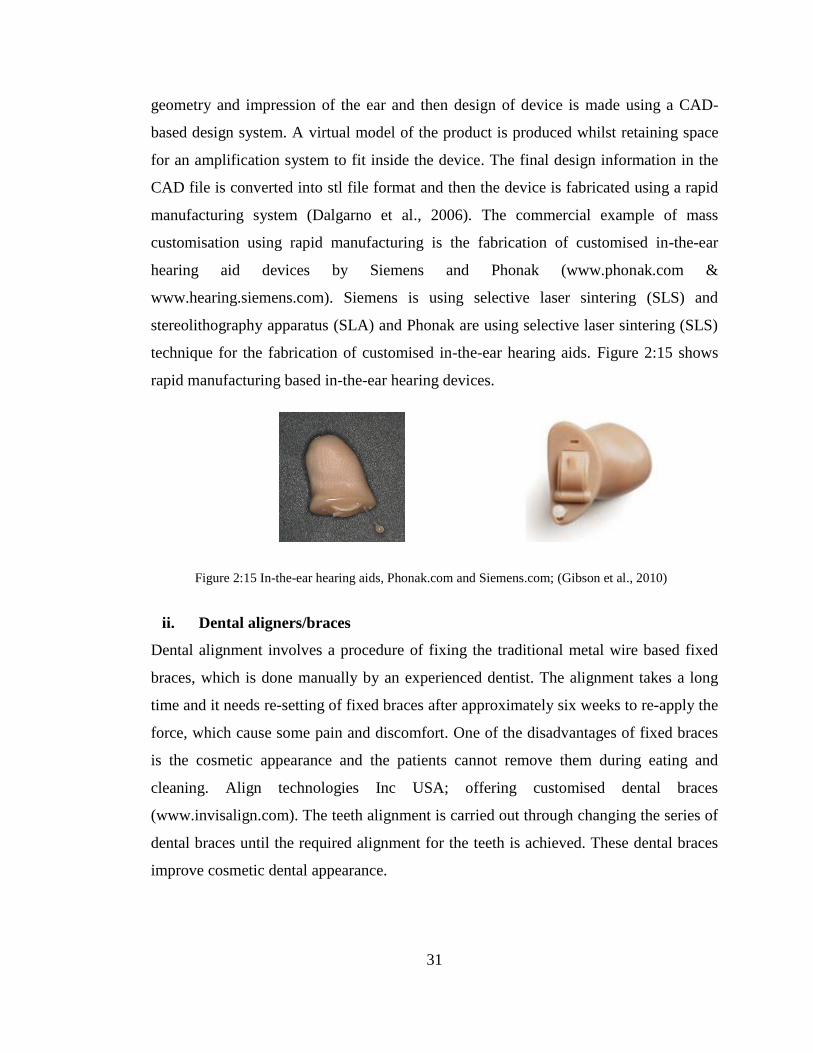
31
geometry and impression of the ear and then design of device is made using a CAD-
based design system. A virtual model of the product is produced whilst retaining space
for an amplification system to fit inside the device. The final design information in the
CAD file is converted into stl file format and then the device is fabricated using a rapid
manufacturing system (Dalgarno et al., 2006). The commercial example of mass
customisation using rapid manufacturing is the fabrication of customised in-the-ear
hearing aid devices by Siemens and Phonak (www.phonak.com &
www.hearing.siemens.com). Siemens is using selective laser sintering (SLS) and
stereolithography apparatus (SLA) and Phonak are using selective laser sintering (SLS)
technique for the fabrication of customised in-the-ear hearing aids. Figure 2:15 shows
rapid manufacturing based in-the-ear hearing devices.
ii. Dental aligners/braces
Dental alignment involves a procedure of fixing the traditional metal wire based fixed
braces, which is done manually by an experienced dentist. The alignment takes a long
time and it needs re-setting of fixed braces after approximately six weeks to re-apply the
force, which cause some pain and discomfort. One of the disadvantages of fixed braces
is the cosmetic appearance and the patients cannot remove them during eating and
cleaning. Align technologies Inc USA; offering customised dental braces
(www.invisalign.com). The teeth alignment is carried out through changing the series of
dental braces until the required alignment for the teeth is achieved. These dental braces
improve cosmetic dental appearance.
Figure 2:15 In-the-ear hearing aids, Phonak.com and Siemens.com; (Gibson et al., 2010)
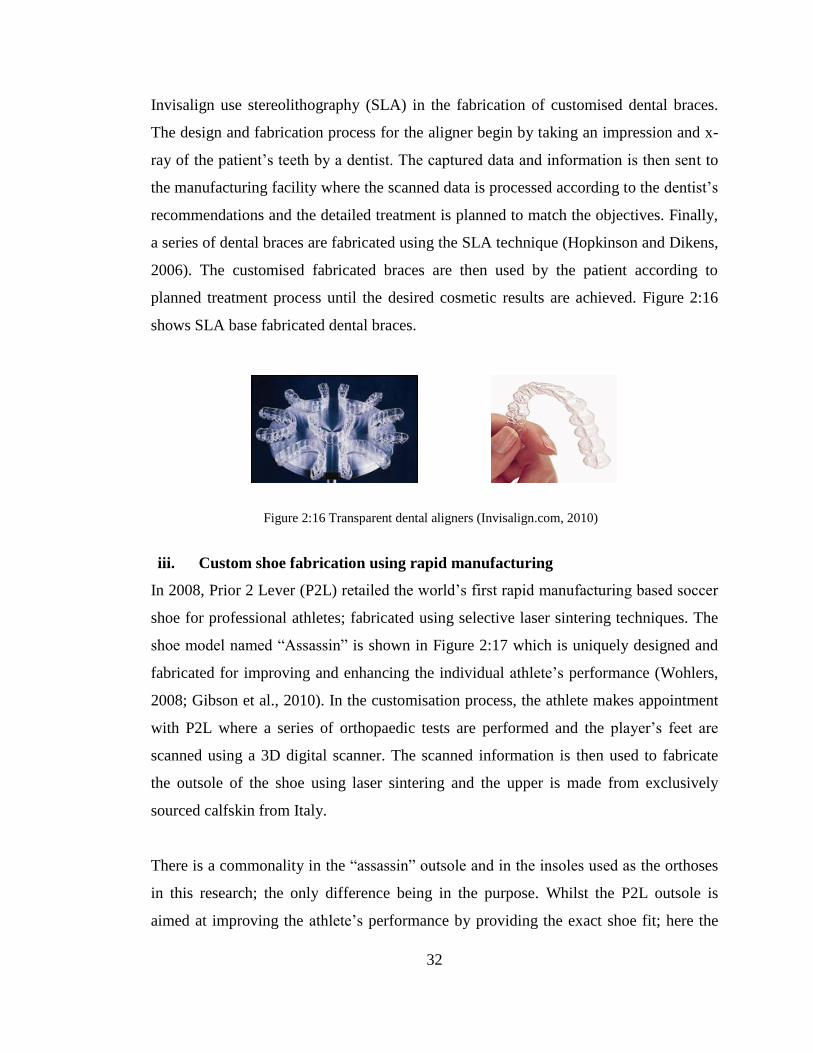
32
Invisalign use stereolithography (SLA) in the fabrication of customised dental braces.
The design and fabrication process for the aligner begin by taking an impression and x-
ray of the patient’s teeth by a dentist. The captured data and information is then sent to
the manufacturing facility where the scanned data is processed according to the dentist’s
recommendations and the detailed treatment is planned to match the objectives. Finally,
a series of dental braces are fabricated using the SLA technique (Hopkinson and Dikens,
2006). The customised fabricated braces are then used by the patient according to
planned treatment process until the desired cosmetic results are achieved. Figure 2:16
shows SLA base fabricated dental braces.
iii. Custom shoe fabrication using rapid manufacturing
In 2008, Prior 2 Lever (P2L) retailed the world’s first rapid manufacturing based soccer
shoe for professional athletes; fabricated using selective laser sintering techniques. The
shoe model named “Assassin” is shown in Figure 2:17 which is uniquely designed and
fabricated for improving and enhancing the individual athlete’s performance (Wohlers,
2008; Gibson et al., 2010). In the customisation process, the athlete makes appointment
with P2L where a series of orthopaedic tests are performed and the player’s feet are
scanned using a 3D digital scanner. The scanned information is then used to fabricate
the outsole of the shoe using laser sintering and the upper is made from exclusively
sourced calfskin from Italy.
There is a commonality in the “assassin” outsole and in the insoles used as the orthoses
in this research; the only difference being in the purpose. Whilst the P2L outsole is
aimed at improving the athlete’s performance by providing the exact shoe fit; here the
Figure 2:16 Transparent dental aligners (Invisalign.com, 2010)
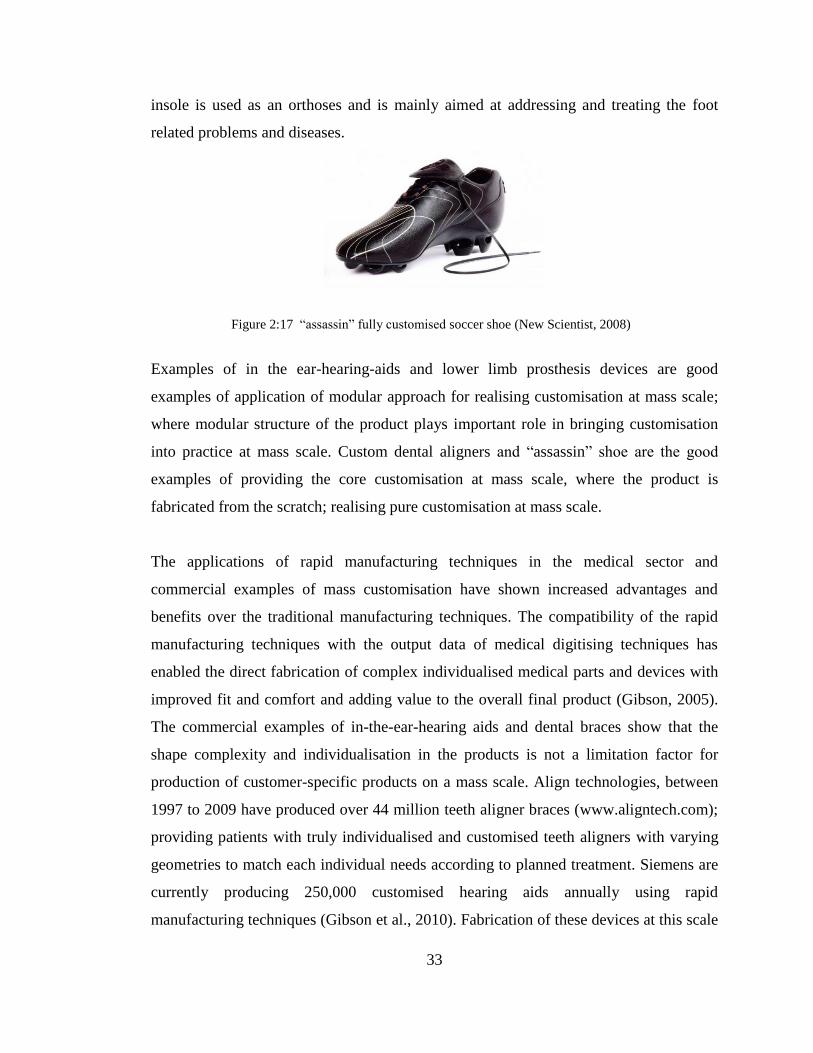
33
insole is used as an orthoses and is mainly aimed at addressing and treating the foot
related problems and diseases.
Examples of in the ear-hearing-aids and lower limb prosthesis devices are good
examples of application of modular approach for realising customisation at mass scale;
where modular structure of the product plays important role in bringing customisation
into practice at mass scale. Custom dental aligners and “assassin” shoe are the good
examples of providing the core customisation at mass scale, where the product is
fabricated from the scratch; realising pure customisation at mass scale.
The applications of rapid manufacturing techniques in the medical sector and
commercial examples of mass customisation have shown increased advantages and
benefits over the traditional manufacturing techniques. The compatibility of the rapid
manufacturing techniques with the output data of medical digitising techniques has
enabled the direct fabrication of complex individualised medical parts and devices with
improved fit and comfort and adding value to the overall final product (Gibson, 2005).
The commercial examples of in-the-ear-hearing aids and dental braces show that the
shape complexity and individualisation in the products is not a limitation factor for
production of customer-specific products on a mass scale. Align technologies, between
1997 to 2009 have produced over 44 million teeth aligner braces (www.aligntech.com);
providing patients with truly individualised and customised teeth aligners with varying
geometries to match each individual needs according to planned treatment. Siemens are
currently producing 250,000 customised hearing aids annually using rapid
manufacturing techniques (Gibson et al., 2010). Fabrication of these devices at this scale
Figure 2:17 “assassin” fully customised soccer shoe (New Scientist, 2008)
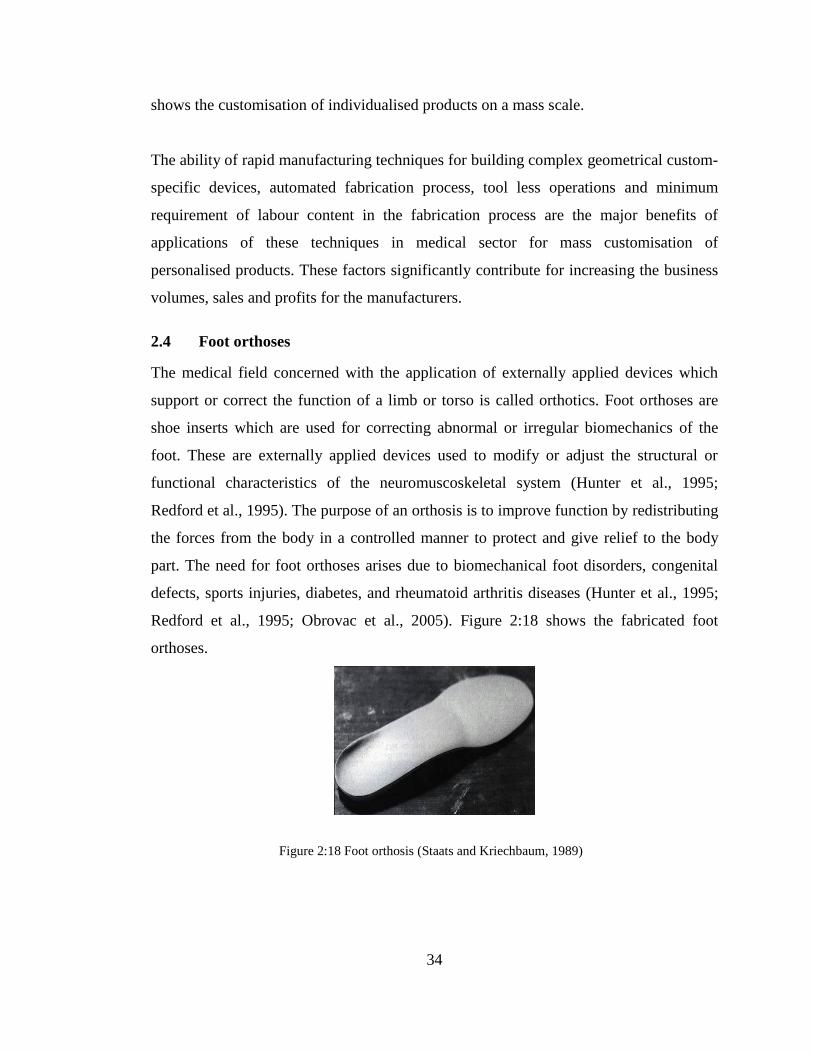
34
shows the customisation of individualised products on a mass scale.
The ability of rapid manufacturing techniques for building complex geometrical custom-
specific devices, automated fabrication process, tool less operations and minimum
requirement of labour content in the fabrication process are the major benefits of
applications of these techniques in medical sector for mass customisation of
personalised products. These factors significantly contribute for increasing the business
volumes, sales and profits for the manufacturers.
2.4 Foot orthoses
The medical field concerned with the application of externally applied devices which
support or correct the function of a limb or torso is called orthotics. Foot orthoses are
shoe inserts which are used for correcting abnormal or irregular biomechanics of the
foot. These are externally applied devices used to modify or adjust the structural or
functional characteristics of the neuromuscoskeletal system (Hunter et al., 1995;
Redford et al., 1995). The purpose of an orthosis is to improve function by redistributing
the forces from the body in a controlled manner to protect and give relief to the body
part. The need for foot orthoses arises due to biomechanical foot disorders, congenital
defects, sports injuries, diabetes, and rheumatoid arthritis diseases (Hunter et al., 1995;
Redford et al., 1995; Obrovac et al., 2005). Figure 2:18 shows the fabricated foot
orthoses.
Figure 2:18 Foot orthosis (Staats and Kriechbaum, 1989)
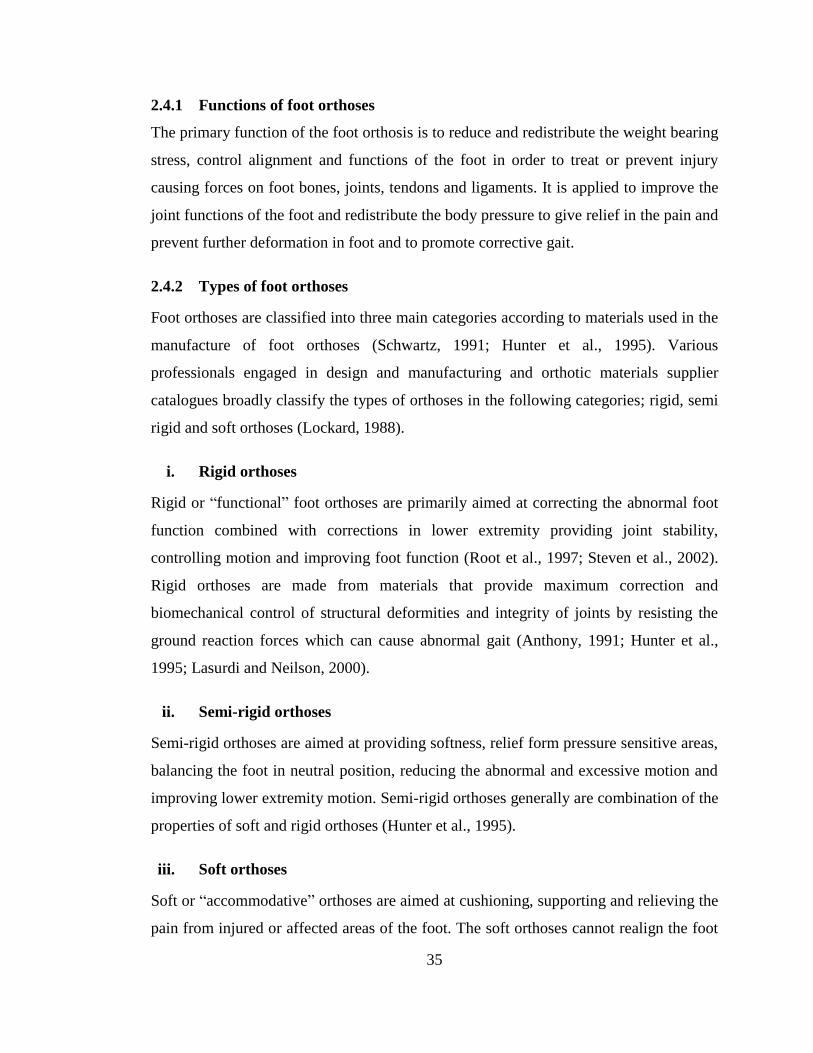
35
2.4.1 Functions of foot orthoses
The primary function of the foot orthosis is to reduce and redistribute the weight bearing
stress, control alignment and functions of the foot in order to treat or prevent injury
causing forces on foot bones, joints, tendons and ligaments. It is applied to improve the
joint functions of the foot and redistribute the body pressure to give relief in the pain and
prevent further deformation in foot and to promote corrective gait.
2.4.2 Types of foot orthoses
Foot orthoses are classified into three main categories according to materials used in the
manufacture of foot orthoses (Schwartz, 1991; Hunter et al., 1995). Various
professionals engaged in design and manufacturing and orthotic materials supplier
catalogues broadly classify the types of orthoses in the following categories; rigid, semi
rigid and soft orthoses (Lockard, 1988).
i. Rigid orthoses
Rigid or “functional” foot orthoses are primarily aimed at correcting the abnormal foot
function combined with corrections in lower extremity providing joint stability,
controlling motion and improving foot function (Root et al., 1997; Steven et al., 2002).
Rigid orthoses are made from materials that provide maximum correction and
biomechanical control of structural deformities and integrity of joints by resisting the
ground reaction forces which can cause abnormal gait (Anthony, 1991; Hunter et al.,
1995; Lasurdi and Neilson, 2000).
ii. Semi-rigid orthoses
Semi-rigid orthoses are aimed at providing softness, relief form pressure sensitive areas,
balancing the foot in neutral position, reducing the abnormal and excessive motion and
improving lower extremity motion. Semi-rigid orthoses generally are combination of the
properties of soft and rigid orthoses (Hunter et al., 1995).
iii. Soft orthoses
Soft or “accommodative” orthoses are aimed at cushioning, supporting and relieving the
pain from injured or affected areas of the foot. The soft orthoses cannot realign the foot
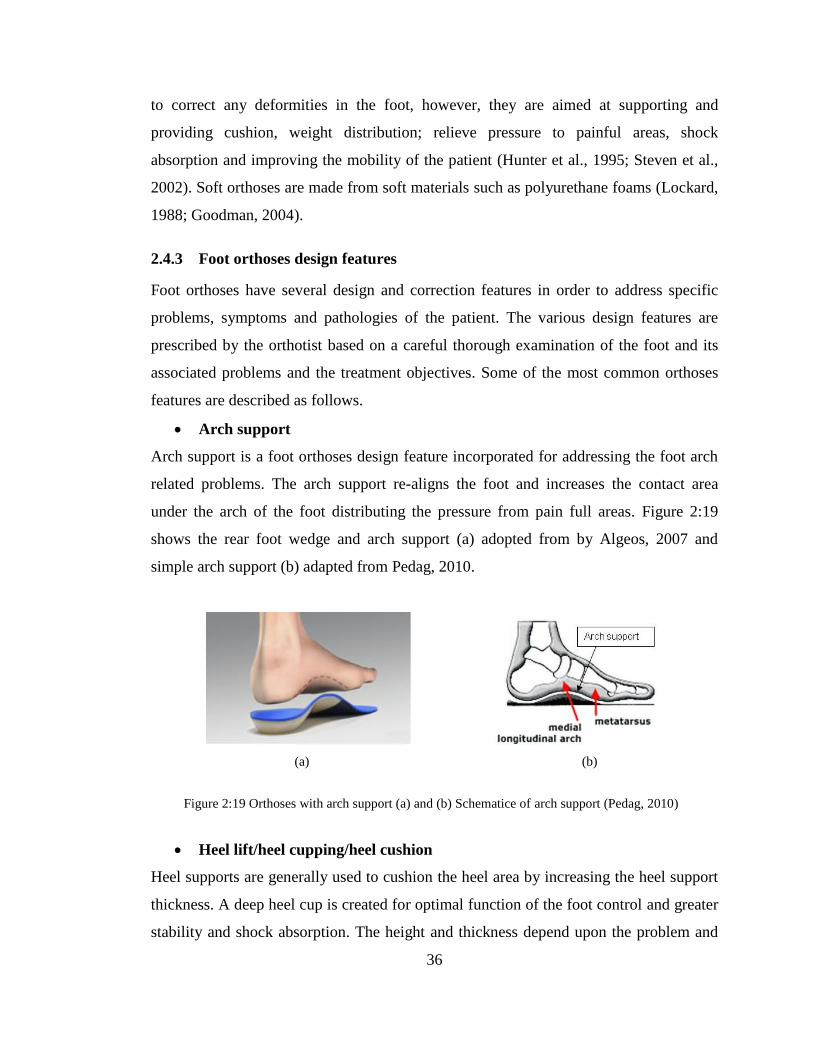
36
to correct any deformities in the foot, however, they are aimed at supporting and
providing cushion, weight distribution; relieve pressure to painful areas, shock
absorption and improving the mobility of the patient (Hunter et al., 1995; Steven et al.,
2002). Soft orthoses are made from soft materials such as polyurethane foams (Lockard,
1988; Goodman, 2004).
2.4.3 Foot orthoses design features
Foot orthoses have several design and correction features in order to address specific
problems, symptoms and pathologies of the patient. The various design features are
prescribed by the orthotist based on a careful thorough examination of the foot and its
associated problems and the treatment objectives. Some of the most common orthoses
features are described as follows.
Arch support
Arch support is a foot orthoses design feature incorporated for addressing the foot arch
related problems. The arch support re-aligns the foot and increases the contact area
under the arch of the foot distributing the pressure from pain full areas. Figure 2:19
shows the rear foot wedge and arch support (a) adopted from by Algeos, 2007 and
simple arch support (b) adapted from Pedag, 2010.
(a) (b)
Heel lift/heel cupping/heel cushion
Heel supports are generally used to cushion the heel area by increasing the heel support
thickness. A deep heel cup is created for optimal function of the foot control and greater
stability and shock absorption. The height and thickness depend upon the problem and
Figure 2:19 Orthoses with arch support (a) and (b) Schematice of arch support (Pedag, 2010)
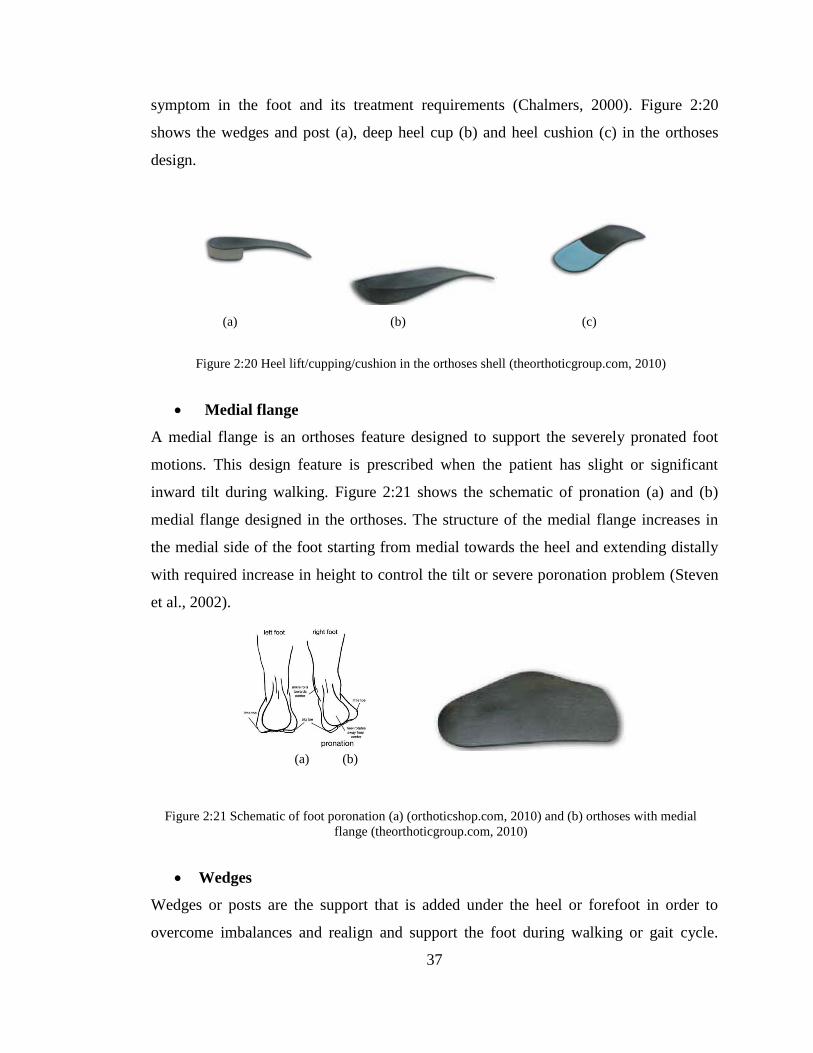
37
symptom in the foot and its treatment requirements (Chalmers, 2000). Figure 2:20
shows the wedges and post (a), deep heel cup (b) and heel cushion (c) in the orthoses
design.
(a) (b) (c)
Medial flange
A medial flange is an orthoses feature designed to support the severely pronated foot
motions. This design feature is prescribed when the patient has slight or significant
inward tilt during walking. Figure 2:21 shows the schematic of pronation (a) and (b)
medial flange designed in the orthoses. The structure of the medial flange increases in
the medial side of the foot starting from medial towards the heel and extending distally
with required increase in height to control the tilt or severe poronation problem (Steven
et al., 2002).
(a) (b)
Wedges
Wedges or posts are the support that is added under the heel or forefoot in order to
overcome imbalances and realign and support the foot during walking or gait cycle.
Figure 2:20 Heel lift/cupping/cushion in the orthoses shell (theorthoticgroup.com, 2010)
Figure 2:21 Schematic of foot poronation (a) (orthoticshop.com, 2010) and (b) orthoses with medial
flange (theorthoticgroup.com, 2010)
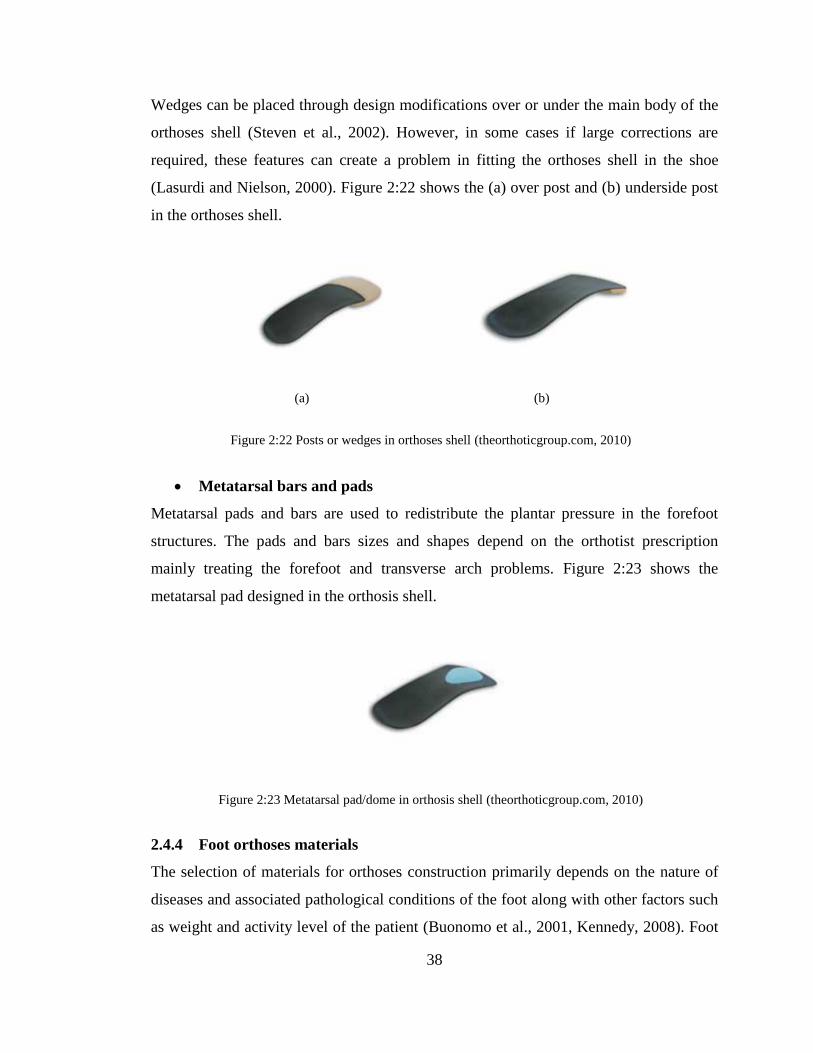
38
Wedges can be placed through design modifications over or under the main body of the
orthoses shell (Steven et al., 2002). However, in some cases if large corrections are
required, these features can create a problem in fitting the orthoses shell in the shoe
(Lasurdi and Nielson, 2000). Figure 2:22 shows the (a) over post and (b) underside post
in the orthoses shell.
(a) (b)
Metatarsal bars and pads
Metatarsal pads and bars are used to redistribute the plantar pressure in the forefoot
structures. The pads and bars sizes and shapes depend on the orthotist prescription
mainly treating the forefoot and transverse arch problems. Figure 2:23 shows the
metatarsal pad designed in the orthosis shell.
2.4.4 Foot orthoses materials
The selection of materials for orthoses construction primarily depends on the nature of
diseases and associated pathological conditions of the foot along with other factors such
as weight and activity level of the patient (Buonomo et al., 2001, Kennedy, 2008). Foot
Figure 2:22 Posts or wedges in orthoses shell (theorthoticgroup.com, 2010)
Figure 2:23 Metatarsal pad/dome in orthosis shell (theorthoticgroup.com, 2010)
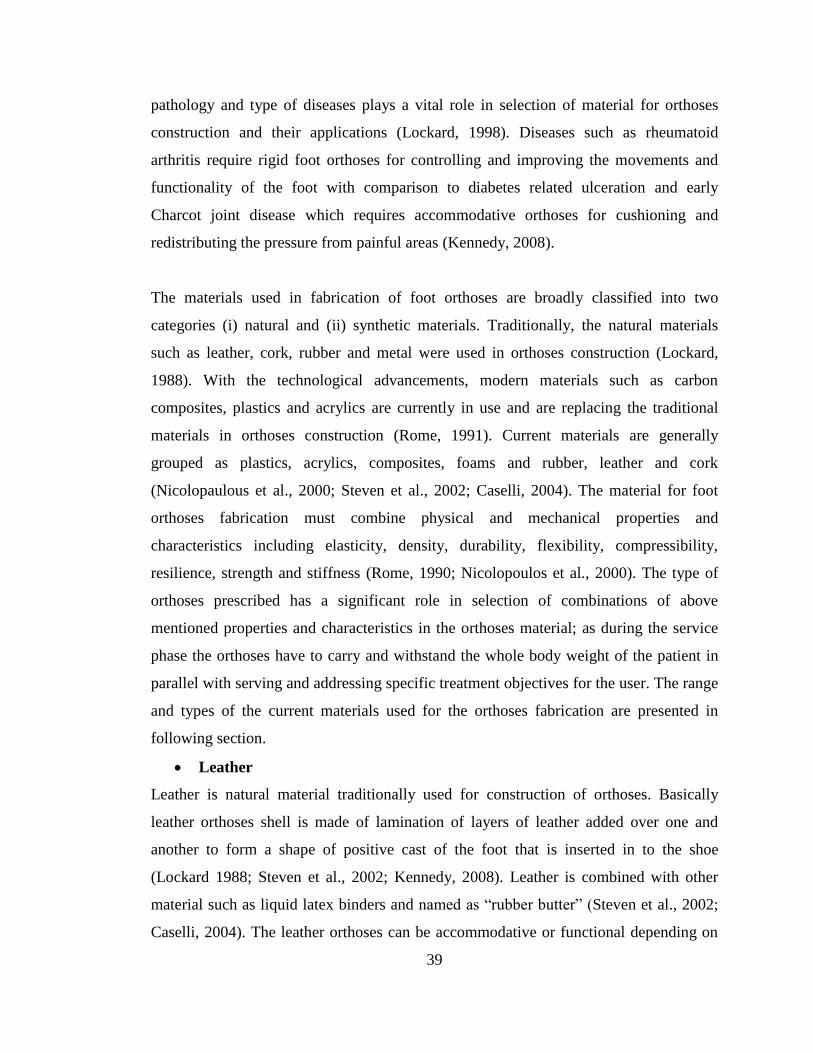
39
pathology and type of diseases plays a vital role in selection of material for orthoses
construction and their applications (Lockard, 1998). Diseases such as rheumatoid
arthritis require rigid foot orthoses for controlling and improving the movements and
functionality of the foot with comparison to diabetes related ulceration and early
Charcot joint disease which requires accommodative orthoses for cushioning and
redistributing the pressure from painful areas (Kennedy, 2008).
The materials used in fabrication of foot orthoses are broadly classified into two
categories (i) natural and (ii) synthetic materials. Traditionally, the natural materials
such as leather, cork, rubber and metal were used in orthoses construction (Lockard,
1988). With the technological advancements, modern materials such as carbon
composites, plastics and acrylics are currently in use and are replacing the traditional
materials in orthoses construction (Rome, 1991). Current materials are generally
grouped as plastics, acrylics, composites, foams and rubber, leather and cork
(Nicolopaulous et al., 2000; Steven et al., 2002; Caselli, 2004). The material for foot
orthoses fabrication must combine physical and mechanical properties and
characteristics including elasticity, density, durability, flexibility, compressibility,
resilience, strength and stiffness (Rome, 1990; Nicolopoulos et al., 2000). The type of
orthoses prescribed has a significant role in selection of combinations of above
mentioned properties and characteristics in the orthoses material; as during the service
phase the orthoses have to carry and withstand the whole body weight of the patient in
parallel with serving and addressing specific treatment objectives for the user. The range
and types of the current materials used for the orthoses fabrication are presented in
following section.
Leather
Leather is natural material traditionally used for construction of orthoses. Basically
leather orthoses shell is made of lamination of layers of leather added over one and
another to form a shape of positive cast of the foot that is inserted in to the shoe
(Lockard 1988; Steven et al., 2002; Kennedy, 2008). Leather is combined with other
material such as liquid latex binders and named as “rubber butter” (Steven et al., 2002;
Caselli, 2004). The leather orthoses can be accommodative or functional depending on
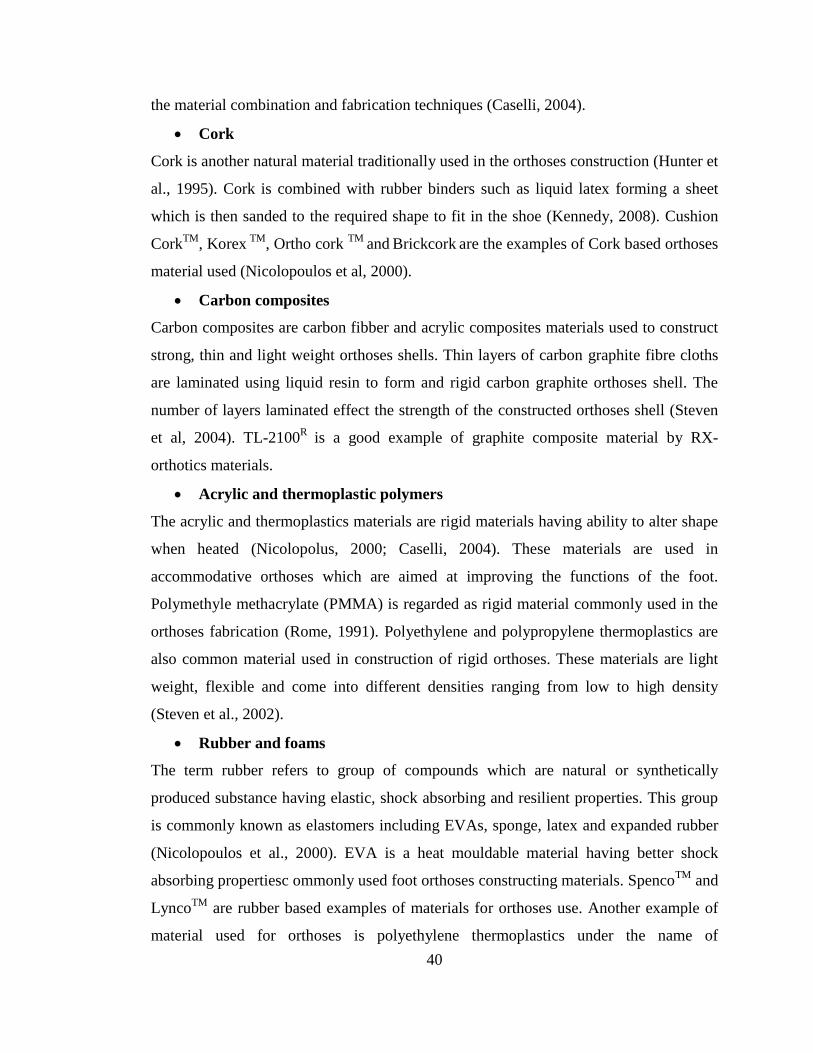
40
the material combination and fabrication techniques (Caselli, 2004).
Cork
Cork is another natural material traditionally used in the orthoses construction (Hunter et
al., 1995). Cork is combined with rubber binders such as liquid latex forming a sheet
which is then sanded to the required shape to fit in the shoe (Kennedy, 2008). Cushion
CorkTM
, Korex TM
, Ortho cork TM
and Brickcork
are the examples of Cork based orthoses
material used (Nicolopoulos et al, 2000).
Carbon composites
Carbon composites are carbon fibber and acrylic composites materials used to construct
strong, thin and light weight orthoses shells. Thin layers of carbon graphite fibre cloths
are laminated using liquid resin to form and rigid carbon graphite orthoses shell. The
number of layers laminated effect the strength of the constructed orthoses shell (Steven
et al, 2004). TL-2100R
is a good example of graphite composite material by RX-
orthotics materials.
Acrylic and thermoplastic polymers
The acrylic and thermoplastics materials are rigid materials having ability to alter shape
when heated (Nicolopolus, 2000; Caselli, 2004). These materials are used in
accommodative orthoses which are aimed at improving the functions of the foot.
Polymethyle methacrylate (PMMA) is regarded as rigid material commonly used in the
orthoses fabrication (Rome, 1991). Polyethylene and polypropylene thermoplastics are
also common material used in construction of rigid orthoses. These materials are light
weight, flexible and come into different densities ranging from low to high density
(Steven et al., 2002).
Rubber and foams
The term rubber refers to group of compounds which are natural or synthetically
produced substance having elastic, shock absorbing and resilient properties. This group
is commonly known as elastomers including EVAs, sponge, latex and expanded rubber
(Nicolopoulos et al., 2000). EVA is a heat mouldable material having better shock
absorbing propertiesc ommonly used foot orthoses constructing materials. SpencoTM
and
LyncoTM
are rubber based examples of materials for orthoses use. Another example of
material used for orthoses is polyethylene thermoplastics under the name of
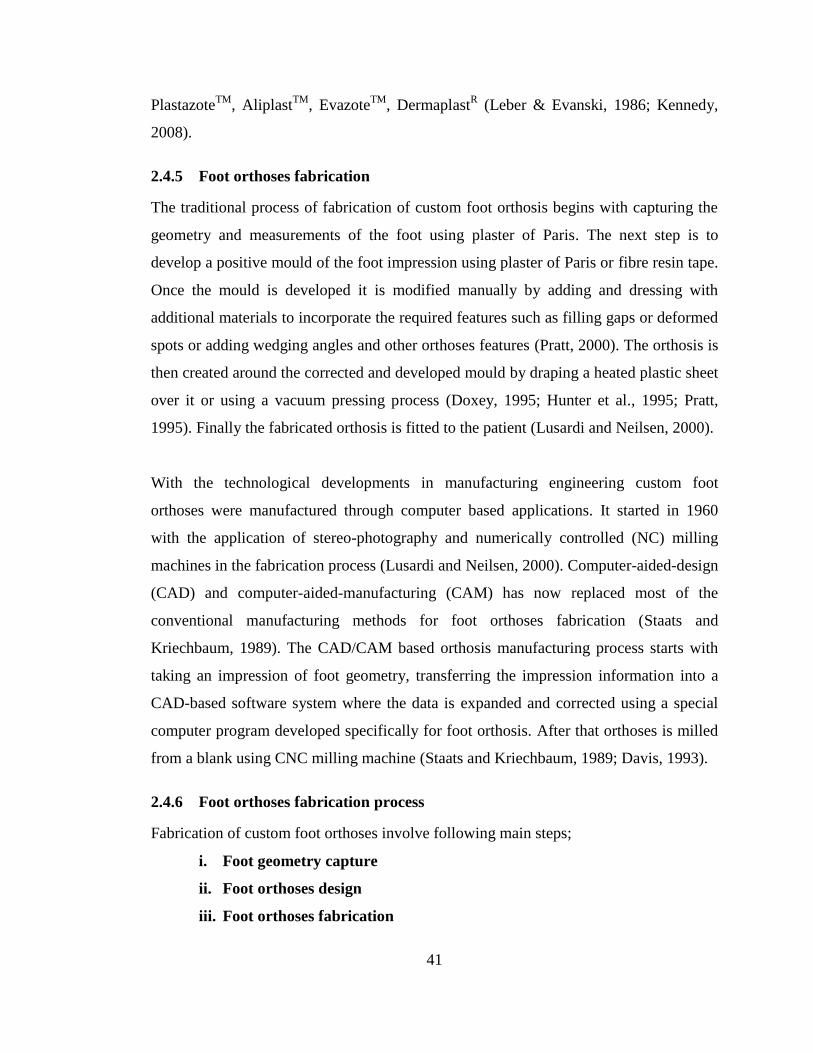
41
PlastazoteTM
, AliplastTM
, EvazoteTM
, DermaplastR (Leber & Evanski, 1986; Kennedy,
2008).
2.4.5 Foot orthoses fabrication
The traditional process of fabrication of custom foot orthosis begins with capturing the
geometry and measurements of the foot using plaster of Paris. The next step is to
develop a positive mould of the foot impression using plaster of Paris or fibre resin tape.
Once the mould is developed it is modified manually by adding and dressing with
additional materials to incorporate the required features such as filling gaps or deformed
spots or adding wedging angles and other orthoses features (Pratt, 2000). The orthosis is
then created around the corrected and developed mould by draping a heated plastic sheet
over it or using a vacuum pressing process (Doxey, 1995; Hunter et al., 1995; Pratt,
1995). Finally the fabricated orthosis is fitted to the patient (Lusardi and Neilsen, 2000).
With the technological developments in manufacturing engineering custom foot
orthoses were manufactured through computer based applications. It started in 1960
with the application of stereo-photography and numerically controlled (NC) milling
machines in the fabrication process (Lusardi and Neilsen, 2000). Computer-aided-design
(CAD) and computer-aided-manufacturing (CAM) has now replaced most of the
conventional manufacturing methods for foot orthoses fabrication (Staats and
Kriechbaum, 1989). The CAD/CAM based orthosis manufacturing process starts with
taking an impression of foot geometry, transferring the impression information into a
CAD-based software system where the data is expanded and corrected using a special
computer program developed specifically for foot orthosis. After that orthoses is milled
from a blank using CNC milling machine (Staats and Kriechbaum, 1989; Davis, 1993).
2.4.6 Foot orthoses fabrication process
Fabrication of custom foot orthoses involve following main steps;
i. Foot geometry capture
ii. Foot orthoses design
iii. Foot orthoses fabrication
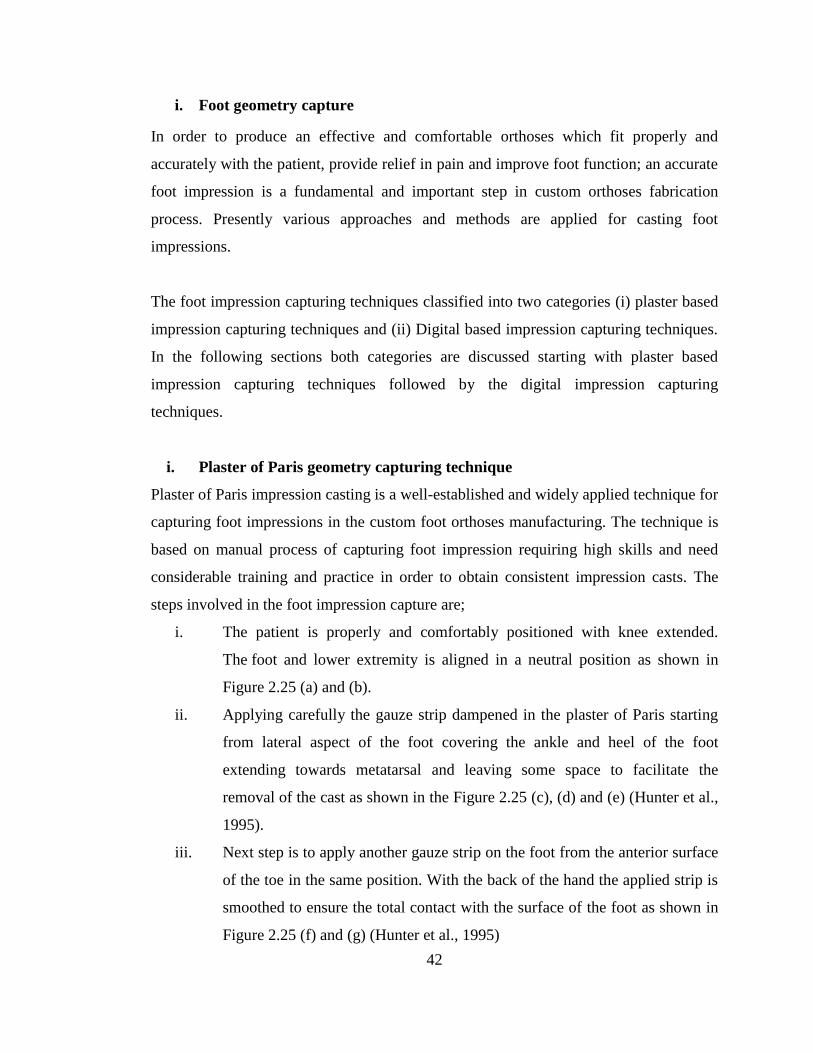
42
i. Foot geometry capture
In order to produce an effective and comfortable orthoses which fit properly and
accurately with the patient, provide relief in pain and improve foot function; an accurate
foot impression is a fundamental and important step in custom orthoses fabrication
process. Presently various approaches and methods are applied for casting foot
impressions.
The foot impression capturing techniques classified into two categories (i) plaster based
impression capturing techniques and (ii) Digital based impression capturing techniques.
In the following sections both categories are discussed starting with plaster based
impression capturing techniques followed by the digital impression capturing
techniques.
i. Plaster of Paris geometry capturing technique
Plaster of Paris impression casting is a well-established and widely applied technique for
capturing foot impressions in the custom foot orthoses manufacturing. The technique is
based on manual process of capturing foot impression requiring high skills and need
considerable training and practice in order to obtain consistent impression casts. The
steps involved in the foot impression capture are;
i. The patient is properly and comfortably positioned with knee extended.
The foot and lower extremity is aligned in a neutral position as shown in
Figure 2.25 (a) and (b).
ii. Applying carefully the gauze strip dampened in the plaster of Paris starting
from lateral aspect of the foot covering the ankle and heel of the foot
extending towards metatarsal and leaving some space to facilitate the
removal of the cast as shown in the Figure 2.25 (c), (d) and (e) (Hunter et al.,
1995).
iii. Next step is to apply another gauze strip on the foot from the anterior surface
of the toe in the same position. With the back of the hand the applied strip is
smoothed to ensure the total contact with the surface of the foot as shown in
Figure 2.25 (f) and (g) (Hunter et al., 1995)
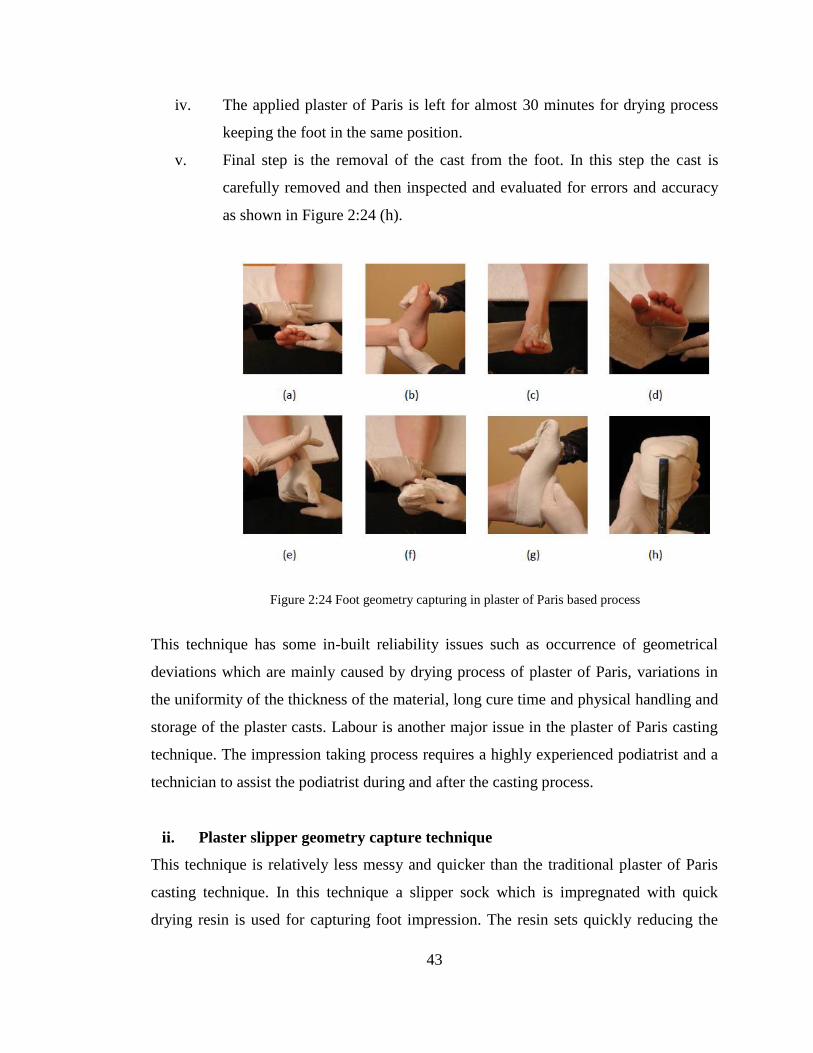
43
iv. The applied plaster of Paris is left for almost 30 minutes for drying process
keeping the foot in the same position.
v. Final step is the removal of the cast from the foot. In this step the cast is
carefully removed and then inspected and evaluated for errors and accuracy
as shown in Figure 2:24 (h).
This technique has some in-built reliability issues such as occurrence of geometrical
deviations which are mainly caused by drying process of plaster of Paris, variations in
the uniformity of the thickness of the material, long cure time and physical handling and
storage of the plaster casts. Labour is another major issue in the plaster of Paris casting
technique. The impression taking process requires a highly experienced podiatrist and a
technician to assist the podiatrist during and after the casting process.
ii. Plaster slipper geometry capture technique
This technique is relatively less messy and quicker than the traditional plaster of Paris
casting technique. In this technique a slipper sock which is impregnated with quick
drying resin is used for capturing foot impression. The resin sets quickly reducing the
Figure 2:24 Foot geometry capturing in plaster of Paris based process
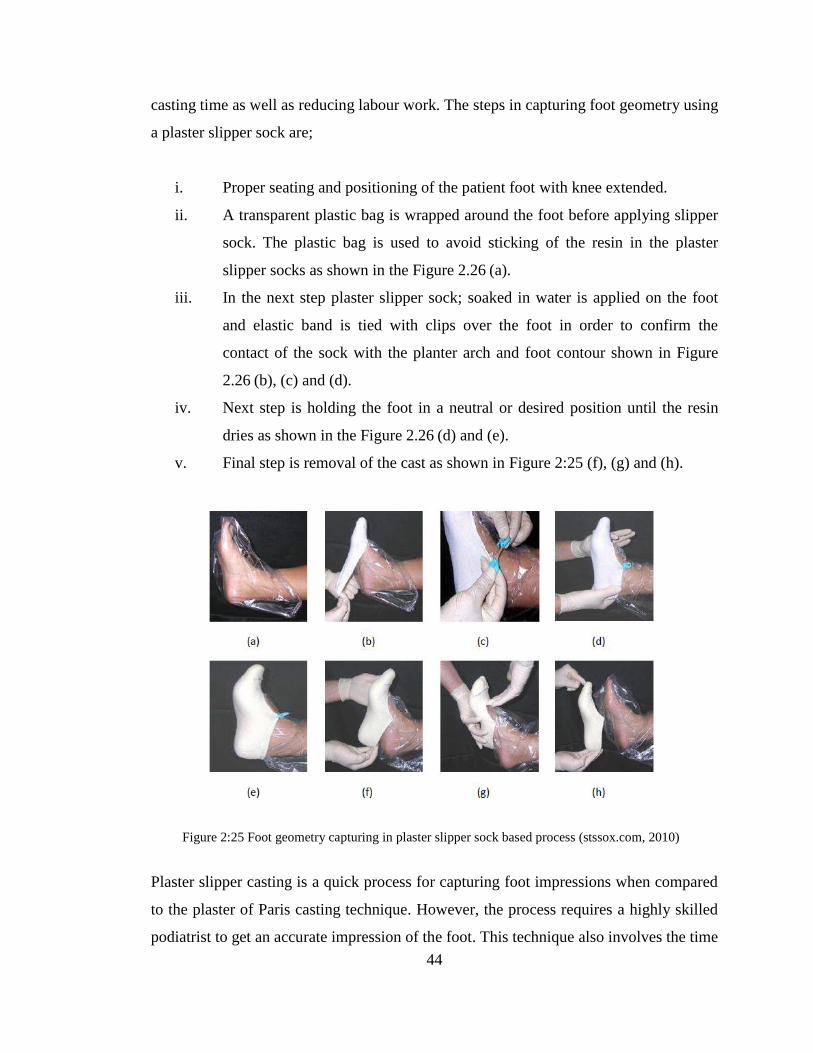
44
casting time as well as reducing labour work. The steps in capturing foot geometry using
a plaster slipper sock are;
i. Proper seating and positioning of the patient foot with knee extended.
ii. A transparent plastic bag is wrapped around the foot before applying slipper
sock. The plastic bag is used to avoid sticking of the resin in the plaster
slipper socks as shown in the Figure 2.26 (a).
iii. In the next step plaster slipper sock; soaked in water is applied on the foot
and elastic band is tied with clips over the foot in order to confirm the
contact of the sock with the planter arch and foot contour shown in Figure
2.26 (b), (c) and (d).
iv. Next step is holding the foot in a neutral or desired position until the resin
dries as shown in the Figure 2.26 (d) and (e).
v. Final step is removal of the cast as shown in Figure 2:25 (f), (g) and (h).
Plaster slipper casting is a quick process for capturing foot impressions when compared
to the plaster of Paris casting technique. However, the process requires a highly skilled
podiatrist to get an accurate impression of the foot. This technique also involves the time
Figure 2:25 Foot geometry capturing in plaster slipper sock based process (stssox.com, 2010)
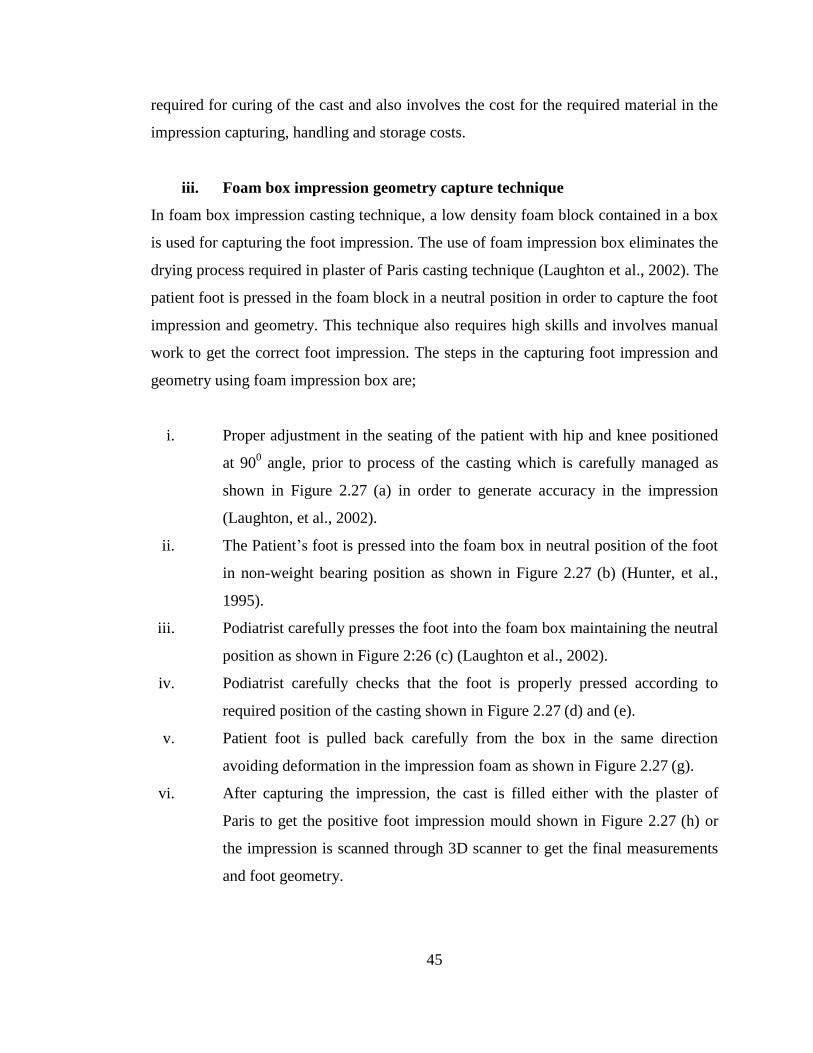
45
required for curing of the cast and also involves the cost for the required material in the
impression capturing, handling and storage costs.
iii. Foam box impression geometry capture technique
In foam box impression casting technique, a low density foam block contained in a box
is used for capturing the foot impression. The use of foam impression box eliminates the
drying process required in plaster of Paris casting technique (Laughton et al., 2002). The
patient foot is pressed in the foam block in a neutral position in order to capture the foot
impression and geometry. This technique also requires high skills and involves manual
work to get the correct foot impression. The steps in the capturing foot impression and
geometry using foam impression box are;
i. Proper adjustment in the seating of the patient with hip and knee positioned
at 900 angle, prior to process of the casting which is carefully managed as
shown in Figure 2.27 (a) in order to generate accuracy in the impression
(Laughton, et al., 2002).
ii. The Patient’s foot is pressed into the foam box in neutral position of the foot
in non-weight bearing position as shown in Figure 2.27 (b) (Hunter, et al.,
1995).
iii. Podiatrist carefully presses the foot into the foam box maintaining the neutral
position as shown in Figure 2:26 (c) (Laughton et al., 2002).
iv. Podiatrist carefully checks that the foot is properly pressed according to
required position of the casting shown in Figure 2.27 (d) and (e).
v. Patient foot is pulled back carefully from the box in the same direction
avoiding deformation in the impression foam as shown in Figure 2.27 (g).
vi. After capturing the impression, the cast is filled either with the plaster of
Paris to get the positive foot impression mould shown in Figure 2.27 (h) or
the impression is scanned through 3D scanner to get the final measurements
and foot geometry.
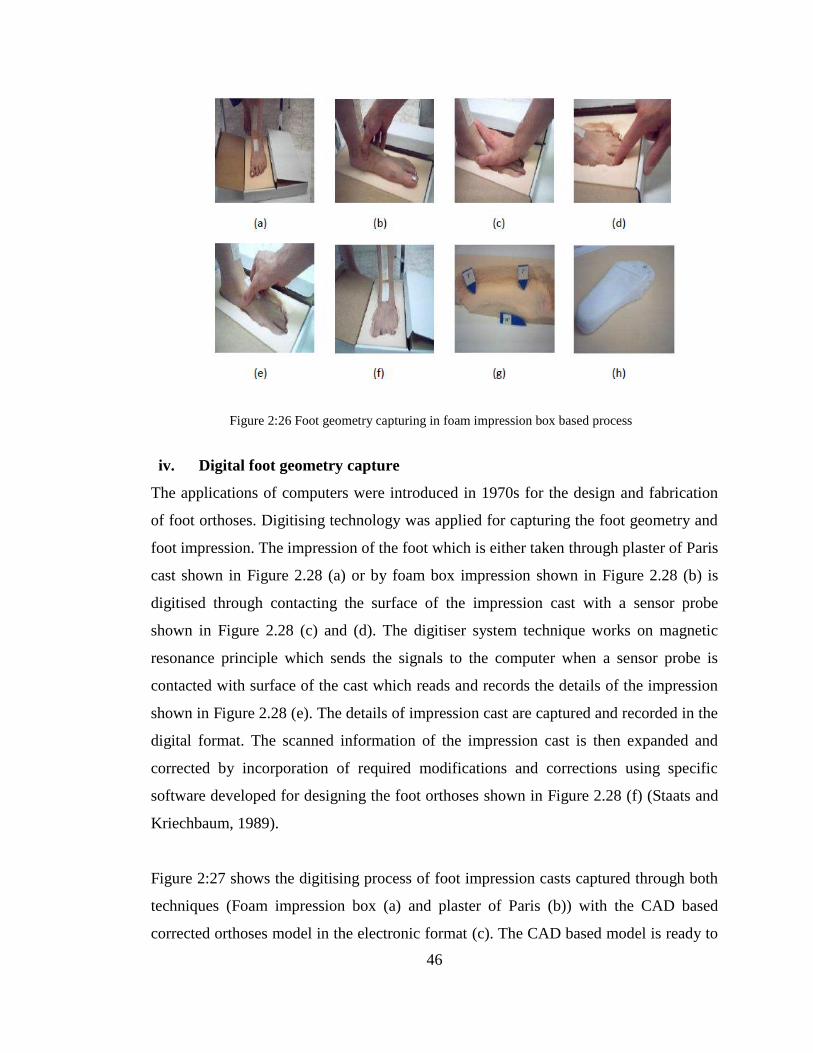
46
iv. Digital foot geometry capture
The applications of computers were introduced in 1970s for the design and fabrication
of foot orthoses. Digitising technology was applied for capturing the foot geometry and
foot impression. The impression of the foot which is either taken through plaster of Paris
cast shown in Figure 2.28 (a) or by foam box impression shown in Figure 2.28 (b) is
digitised through contacting the surface of the impression cast with a sensor probe
shown in Figure 2.28 (c) and (d). The digitiser system technique works on magnetic
resonance principle which sends the signals to the computer when a sensor probe is
contacted with surface of the cast which reads and records the details of the impression
shown in Figure 2.28 (e). The details of impression cast are captured and recorded in the
digital format. The scanned information of the impression cast is then expanded and
corrected by incorporation of required modifications and corrections using specific
software developed for designing the foot orthoses shown in Figure 2.28 (f) (Staats and
Kriechbaum, 1989).
Figure 2:27 shows the digitising process of foot impression casts captured through both
techniques (Foam impression box (a) and plaster of Paris (b)) with the CAD based
corrected orthoses model in the electronic format (c). The CAD based model is ready to
Figure 2:26 Foot geometry capturing in foam impression box based process
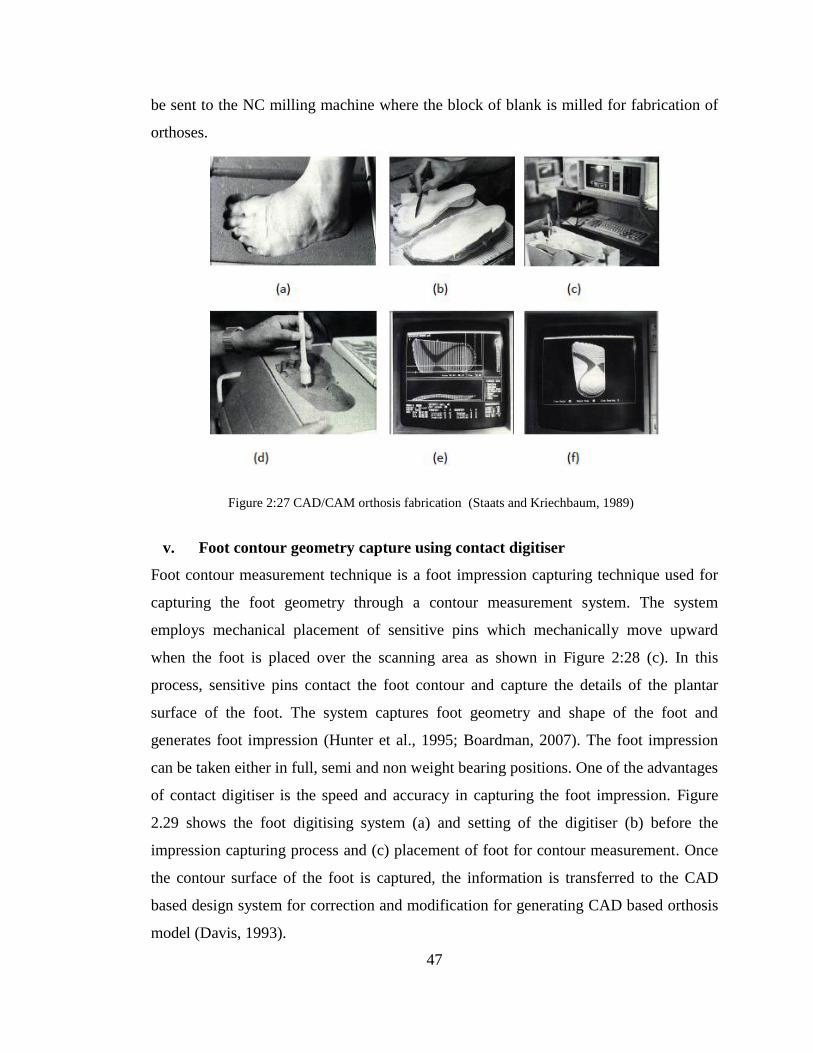
47
be sent to the NC milling machine where the block of blank is milled for fabrication of
orthoses.
v. Foot contour geometry capture using contact digitiser
Foot contour measurement technique is a foot impression capturing technique used for
capturing the foot geometry through a contour measurement system. The system
employs mechanical placement of sensitive pins which mechanically move upward
when the foot is placed over the scanning area as shown in Figure 2:28 (c). In this
process, sensitive pins contact the foot contour and capture the details of the plantar
surface of the foot. The system captures foot geometry and shape of the foot and
generates foot impression (Hunter et al., 1995; Boardman, 2007). The foot impression
can be taken either in full, semi and non weight bearing positions. One of the advantages
of contact digitiser is the speed and accuracy in capturing the foot impression. Figure
2.29 shows the foot digitising system (a) and setting of the digitiser (b) before the
impression capturing process and (c) placement of foot for contour measurement. Once
the contour surface of the foot is captured, the information is transferred to the CAD
based design system for correction and modification for generating CAD based orthosis
model (Davis, 1993).
Figure 2:27 CAD/CAM orthosis fabrication (Staats and Kriechbaum, 1989)
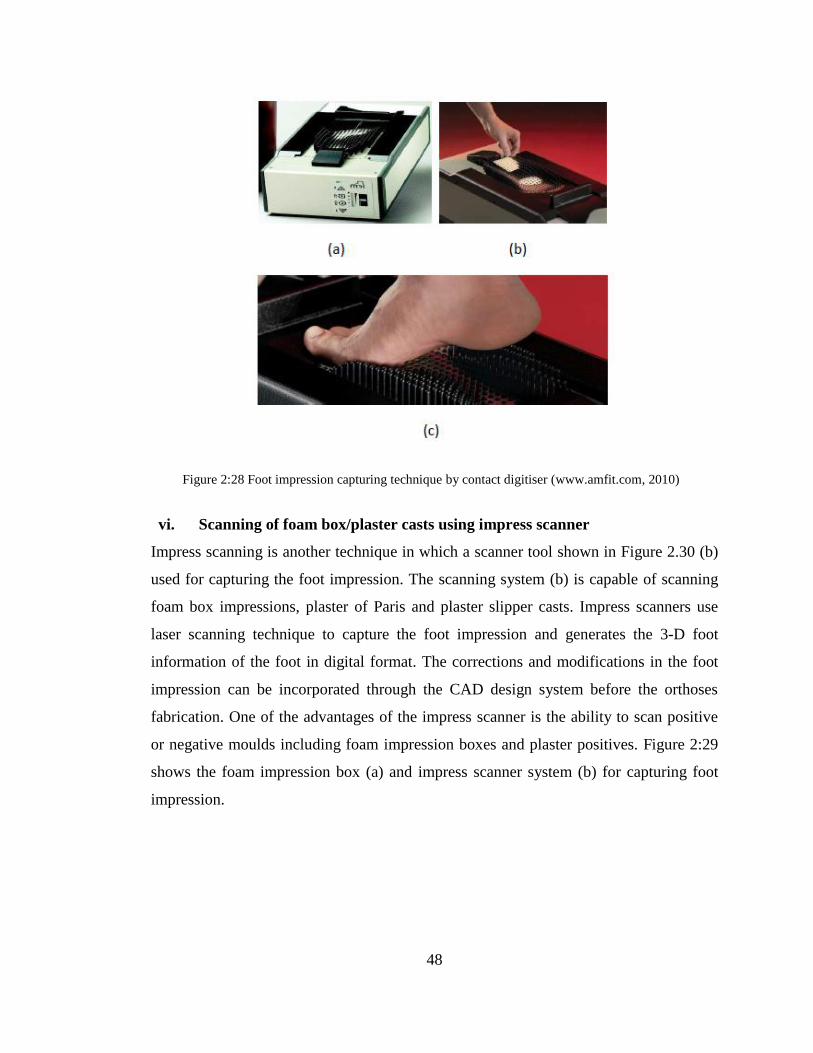
48
vi. Scanning of foam box/plaster casts using impress scanner
Impress scanning is another technique in which a scanner tool shown in Figure 2.30 (b)
used for capturing the foot impression. The scanning system (b) is capable of scanning
foam box impressions, plaster of Paris and plaster slipper casts. Impress scanners use
laser scanning technique to capture the foot impression and generates the 3-D foot
information of the foot in digital format. The corrections and modifications in the foot
impression can be incorporated through the CAD design system before the orthoses
fabrication. One of the advantages of the impress scanner is the ability to scan positive
or negative moulds including foam impression boxes and plaster positives. Figure 2:29
shows the foam impression box (a) and impress scanner system (b) for capturing foot
impression.
Figure 2:28 Foot impression capturing technique by contact digitiser (www.amfit.com, 2010)
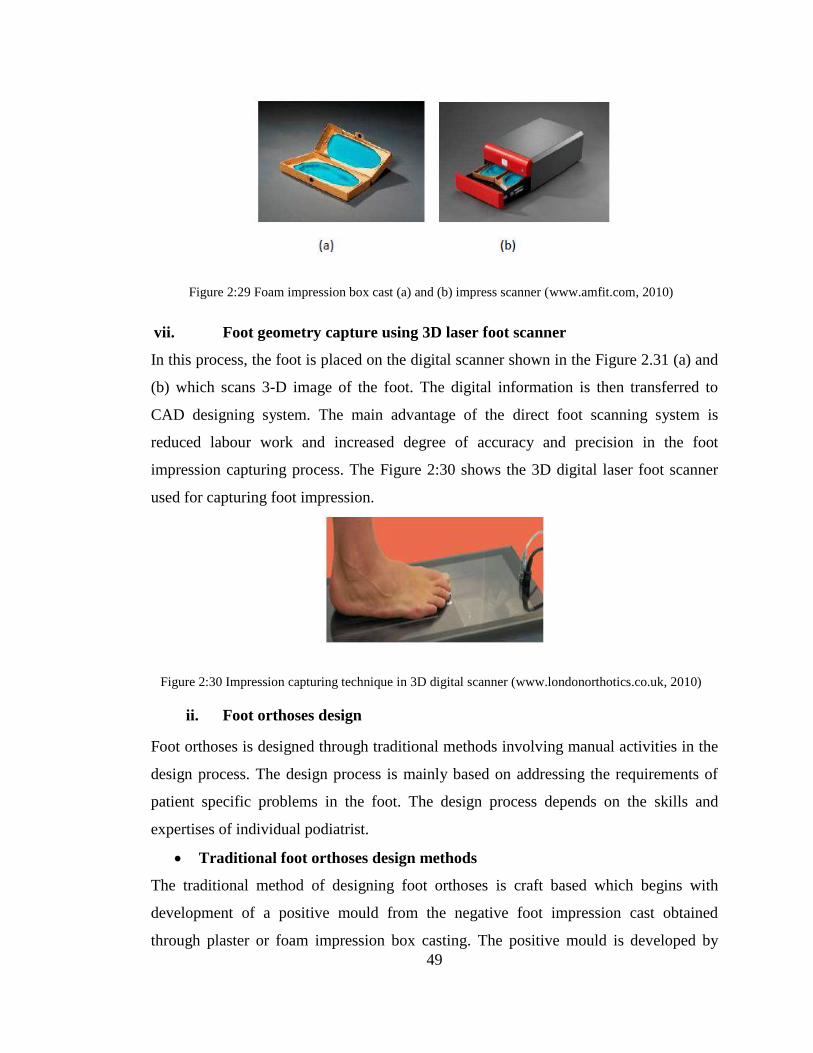
49
vii. Foot geometry capture using 3D laser foot scanner
In this process, the foot is placed on the digital scanner shown in the Figure 2.31 (a) and
(b) which scans 3-D image of the foot. The digital information is then transferred to
CAD designing system. The main advantage of the direct foot scanning system is
reduced labour work and increased degree of accuracy and precision in the foot
impression capturing process. The Figure 2:30 shows the 3D digital laser foot scanner
used for capturing foot impression.
ii. Foot orthoses design
Foot orthoses is designed through traditional methods involving manual activities in the
design process. The design process is mainly based on addressing the requirements of
patient specific problems in the foot. The design process depends on the skills and
expertises of individual podiatrist.
Traditional foot orthoses design methods
The traditional method of designing foot orthoses is craft based which begins with
development of a positive mould from the negative foot impression cast obtained
through plaster or foam impression box casting. The positive mould is developed by
Figure 2:29 Foam impression box cast (a) and (b) impress scanner (www.amfit.com, 2010)
Figure 2:30 Impression capturing technique in 3D digital scanner (www.londonorthotics.co.uk, 2010)
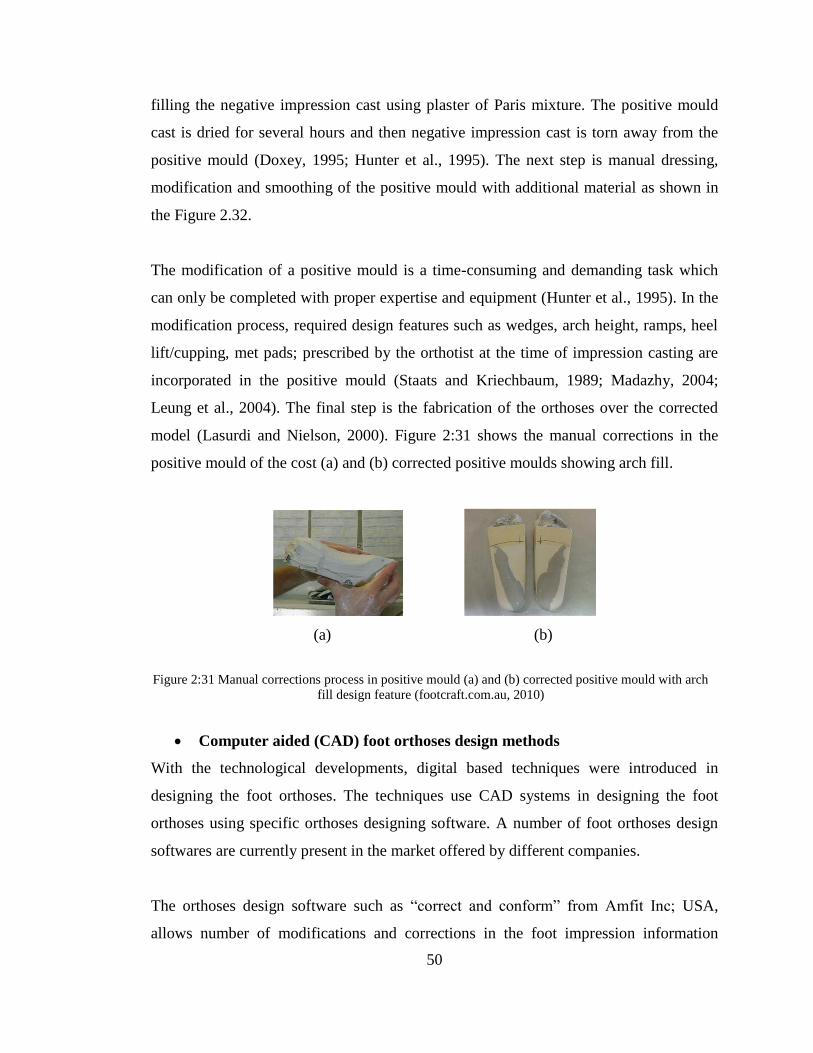
50
filling the negative impression cast using plaster of Paris mixture. The positive mould
cast is dried for several hours and then negative impression cast is torn away from the
positive mould (Doxey, 1995; Hunter et al., 1995). The next step is manual dressing,
modification and smoothing of the positive mould with additional material as shown in
the Figure 2.32.
The modification of a positive mould is a time-consuming and demanding task which
can only be completed with proper expertise and equipment (Hunter et al., 1995). In the
modification process, required design features such as wedges, arch height, ramps, heel
lift/cupping, met pads; prescribed by the orthotist at the time of impression casting are
incorporated in the positive mould (Staats and Kriechbaum, 1989; Madazhy, 2004;
Leung et al., 2004). The final step is the fabrication of the orthoses over the corrected
model (Lasurdi and Nielson, 2000). Figure 2:31 shows the manual corrections in the
positive mould of the cost (a) and (b) corrected positive moulds showing arch fill.
(a) (b)
Computer aided (CAD) foot orthoses design methods
With the technological developments, digital based techniques were introduced in
designing the foot orthoses. The techniques use CAD systems in designing the foot
orthoses using specific orthoses designing software. A number of foot orthoses design
softwares are currently present in the market offered by different companies.
The orthoses design software such as “correct and conform” from Amfit Inc; USA,
allows number of modifications and corrections in the foot impression information
Figure 2:31 Manual corrections process in positive mould (a) and (b) corrected positive mould with arch
fill design feature (footcraft.com.au, 2010)
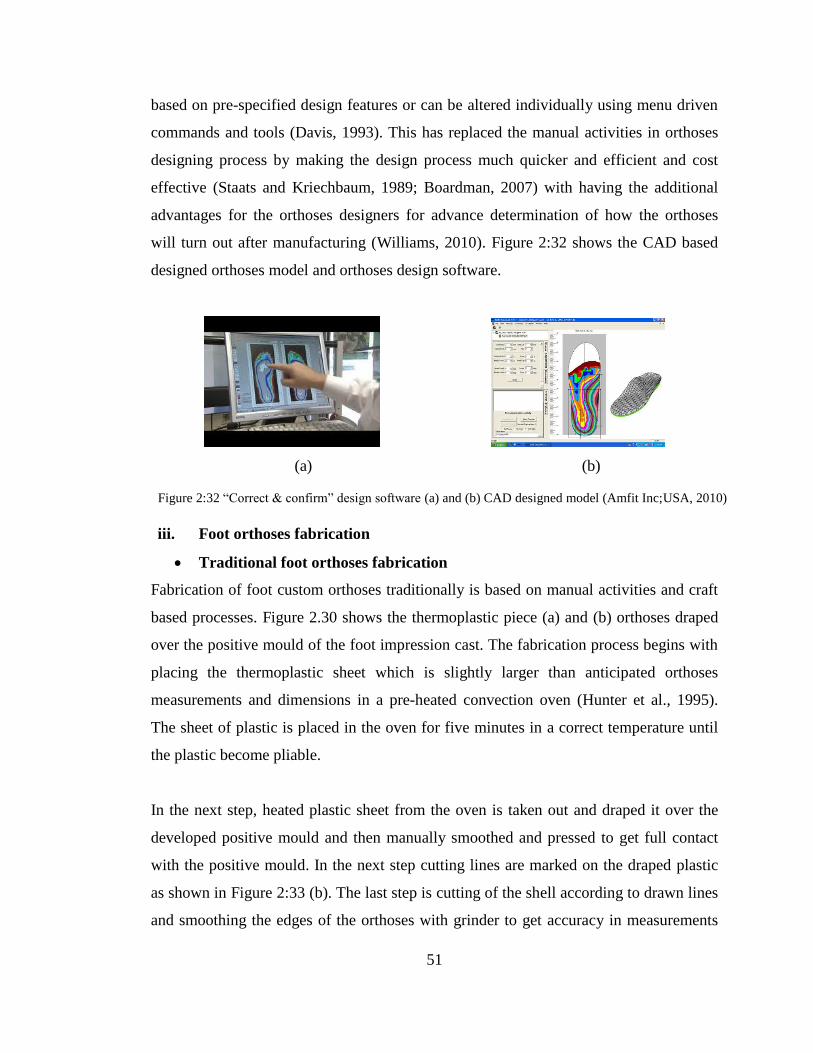
51
based on pre-specified design features or can be altered individually using menu driven
commands and tools (Davis, 1993). This has replaced the manual activities in orthoses
designing process by making the design process much quicker and efficient and cost
effective (Staats and Kriechbaum, 1989; Boardman, 2007) with having the additional
advantages for the orthoses designers for advance determination of how the orthoses
will turn out after manufacturing (Williams, 2010). Figure 2:32 shows the CAD based
designed orthoses model and orthoses design software.
(a) (b)
iii. Foot orthoses fabrication
Traditional foot orthoses fabrication
Fabrication of foot custom orthoses traditionally is based on manual activities and craft
based processes. Figure 2.30 shows the thermoplastic piece (a) and (b) orthoses draped
over the positive mould of the foot impression cast. The fabrication process begins with
placing the thermoplastic sheet which is slightly larger than anticipated orthoses
measurements and dimensions in a pre-heated convection oven (Hunter et al., 1995).
The sheet of plastic is placed in the oven for five minutes in a correct temperature until
the plastic become pliable.
In the next step, heated plastic sheet from the oven is taken out and draped it over the
developed positive mould and then manually smoothed and pressed to get full contact
with the positive mould. In the next step cutting lines are marked on the draped plastic
as shown in Figure 2:33 (b). The last step is cutting of the shell according to drawn lines
and smoothing the edges of the orthoses with grinder to get accuracy in measurements
Figure 2:32 “Correct & confirm” design software (a) and (b) CAD designed model (Amfit Inc;USA, 2010)
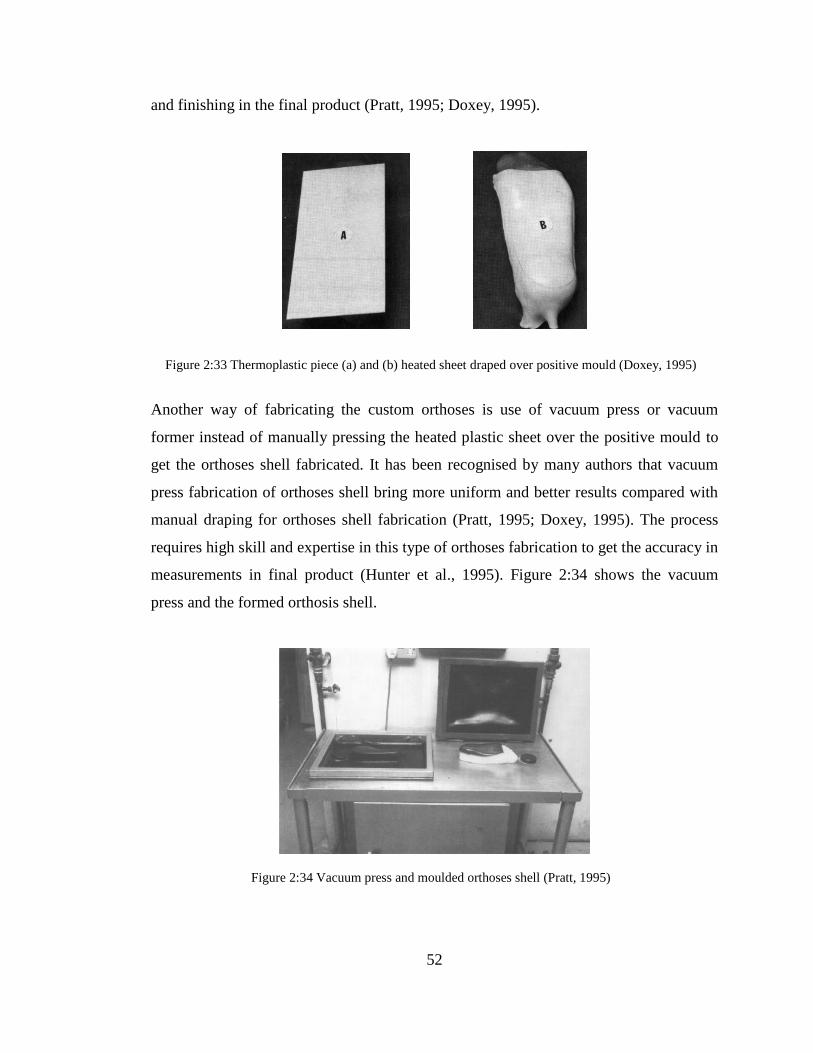
52
and finishing in the final product (Pratt, 1995; Doxey, 1995).
Another way of fabricating the custom orthoses is use of vacuum press or vacuum
former instead of manually pressing the heated plastic sheet over the positive mould to
get the orthoses shell fabricated. It has been recognised by many authors that vacuum
press fabrication of orthoses shell bring more uniform and better results compared with
manual draping for orthoses shell fabrication (Pratt, 1995; Doxey, 1995). The process
requires high skill and expertise in this type of orthoses fabrication to get the accuracy in
measurements in final product (Hunter et al., 1995). Figure 2:34 shows the vacuum
press and the formed orthosis shell.
Figure 2:33 Thermoplastic piece (a) and (b) heated sheet draped over positive mould (Doxey, 1995)
Figure 2:34 Vacuum press and moulded orthoses shell (Pratt, 1995)
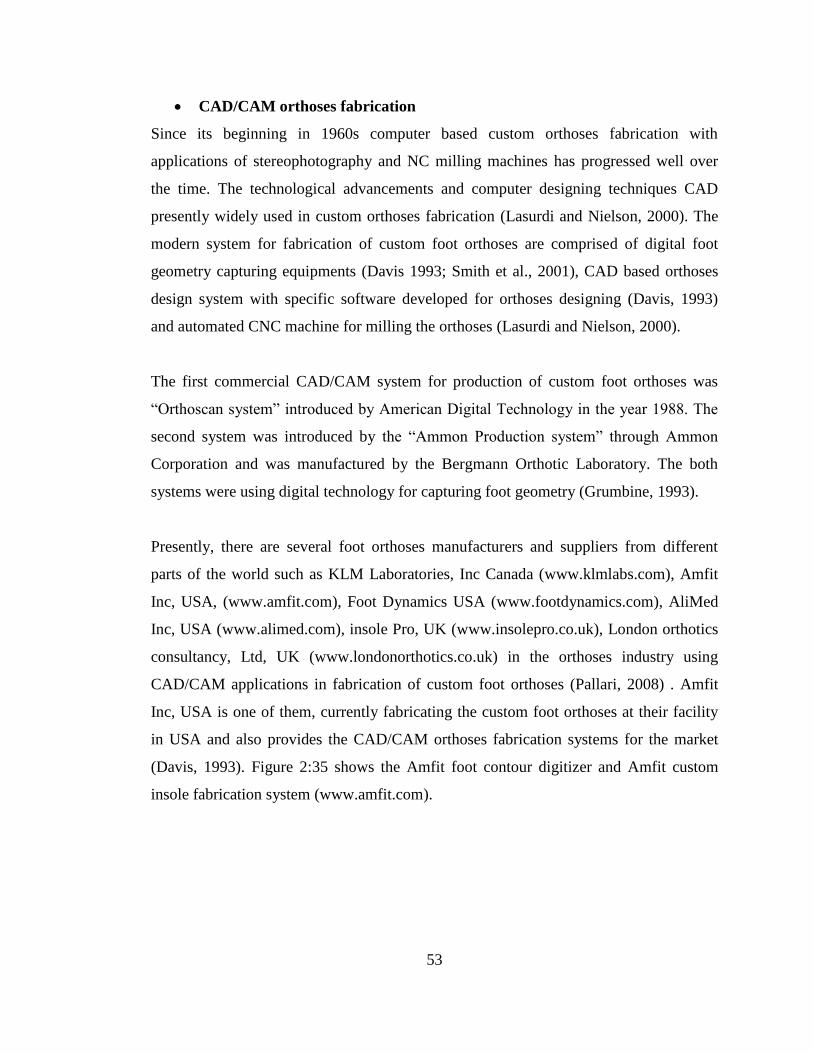
53
CAD/CAM orthoses fabrication
Since its beginning in 1960s computer based custom orthoses fabrication with
applications of stereophotography and NC milling machines has progressed well over
the time. The technological advancements and computer designing techniques CAD
presently widely used in custom orthoses fabrication (Lasurdi and Nielson, 2000). The
modern system for fabrication of custom foot orthoses are comprised of digital foot
geometry capturing equipments (Davis 1993; Smith et al., 2001), CAD based orthoses
design system with specific software developed for orthoses designing (Davis, 1993)
and automated CNC machine for milling the orthoses (Lasurdi and Nielson, 2000).
The first commercial CAD/CAM system for production of custom foot orthoses was
“Orthoscan system” introduced by American Digital Technology in the year 1988. The
second system was introduced by the “Ammon Production system” through Ammon
Corporation and was manufactured by the Bergmann Orthotic Laboratory. The both
systems were using digital technology for capturing foot geometry (Grumbine, 1993).
Presently, there are several foot orthoses manufacturers and suppliers from different
parts of the world such as KLM Laboratories, Inc Canada (www.klmlabs.com), Amfit
Inc, USA, (www.amfit.com), Foot Dynamics USA (www.footdynamics.com), AliMed
Inc, USA (www.alimed.com), insole Pro, UK (www.insolepro.co.uk), London orthotics
consultancy, Ltd, UK (www.londonorthotics.co.uk) in the orthoses industry using
CAD/CAM applications in fabrication of custom foot orthoses (Pallari, 2008) . Amfit
Inc, USA is one of them, currently fabricating the custom foot orthoses at their facility
in USA and also provides the CAD/CAM orthoses fabrication systems for the market
(Davis, 1993). Figure 2:35 shows the Amfit foot contour digitizer and Amfit custom
insole fabrication system (www.amfit.com).
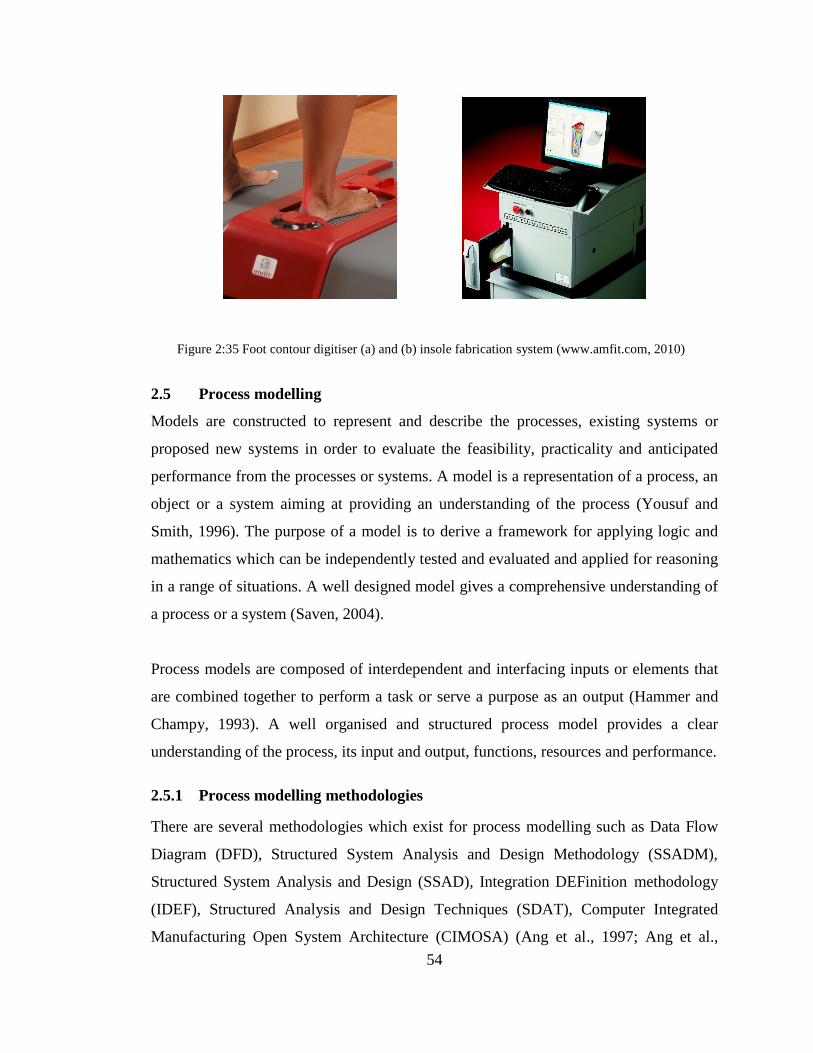
54
2.5 Process modelling
Models are constructed to represent and describe the processes, existing systems or
proposed new systems in order to evaluate the feasibility, practicality and anticipated
performance from the processes or systems. A model is a representation of a process, an
object or a system aiming at providing an understanding of the process (Yousuf and
Smith, 1996). The purpose of a model is to derive a framework for applying logic and
mathematics which can be independently tested and evaluated and applied for reasoning
in a range of situations. A well designed model gives a comprehensive understanding of
a process or a system (Saven, 2004).
Process models are composed of interdependent and interfacing inputs or elements that
are combined together to perform a task or serve a purpose as an output (Hammer and
Champy, 1993). A well organised and structured process model provides a clear
understanding of the process, its input and output, functions, resources and performance.
2.5.1 Process modelling methodologies
There are several methodologies which exist for process modelling such as Data Flow
Diagram (DFD), Structured System Analysis and Design Methodology (SSADM),
Structured System Analysis and Design (SSAD), Integration DEFinition methodology
(IDEF), Structured Analysis and Design Techniques (SDAT), Computer Integrated
Manufacturing Open System Architecture (CIMOSA) (Ang et al., 1997; Ang et al.,
Figure 2:35 Foot contour digitiser (a) and (b) insole fabrication system (www.amfit.com, 2010)
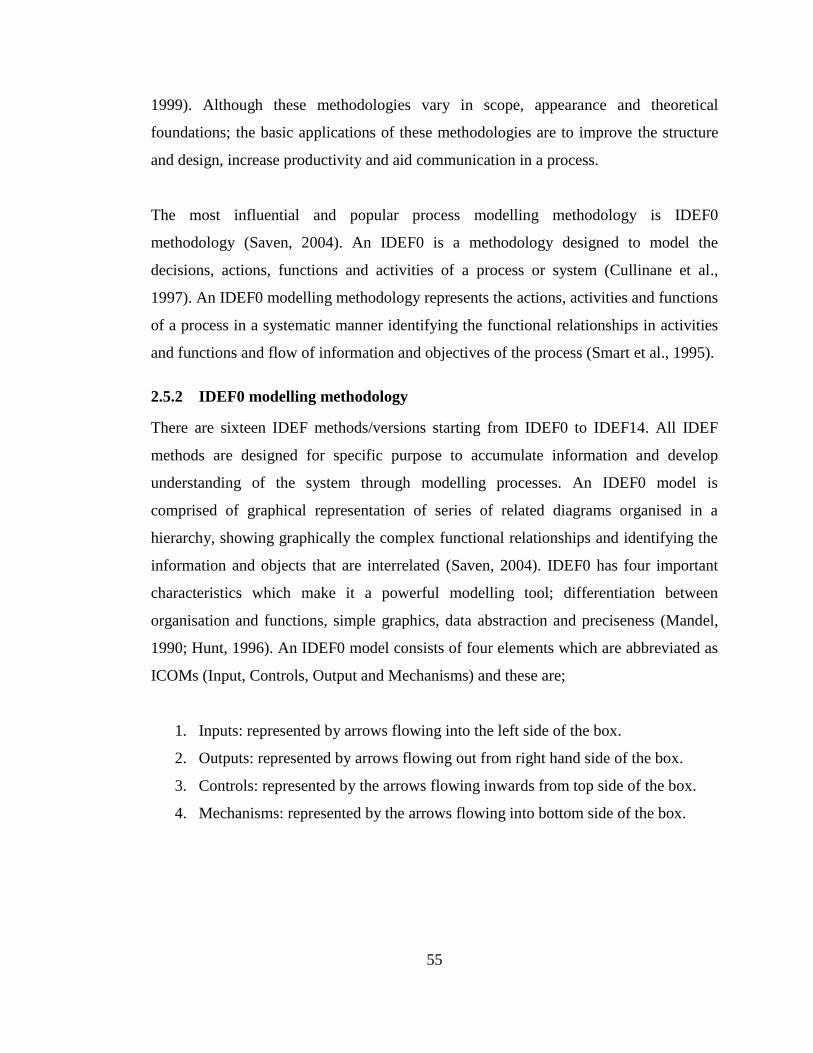
55
1999). Although these methodologies vary in scope, appearance and theoretical
foundations; the basic applications of these methodologies are to improve the structure
and design, increase productivity and aid communication in a process.
The most influential and popular process modelling methodology is IDEF0
methodology (Saven, 2004). An IDEF0 is a methodology designed to model the
decisions, actions, functions and activities of a process or system (Cullinane et al.,
1997). An IDEF0 modelling methodology represents the actions, activities and functions
of a process in a systematic manner identifying the functional relationships in activities
and functions and flow of information and objectives of the process (Smart et al., 1995).
2.5.2 IDEF0 modelling methodology
There are sixteen IDEF methods/versions starting from IDEF0 to IDEF14. All IDEF
methods are designed for specific purpose to accumulate information and develop
understanding of the system through modelling processes. An IDEF0 model is
comprised of graphical representation of series of related diagrams organised in a
hierarchy, showing graphically the complex functional relationships and identifying the
information and objects that are interrelated (Saven, 2004). IDEF0 has four important
characteristics which make it a powerful modelling tool; differentiation between
organisation and functions, simple graphics, data abstraction and preciseness (Mandel,
1990; Hunt, 1996). An IDEF0 model consists of four elements which are abbreviated as
ICOMs (Input, Controls, Output and Mechanisms) and these are;
1. Inputs: represented by arrows flowing into the left side of the box.
2. Outputs: represented by arrows flowing out from right hand side of the box.
3. Controls: represented by the arrows flowing inwards from top side of the box.
4. Mechanisms: represented by the arrows flowing into bottom side of the box.
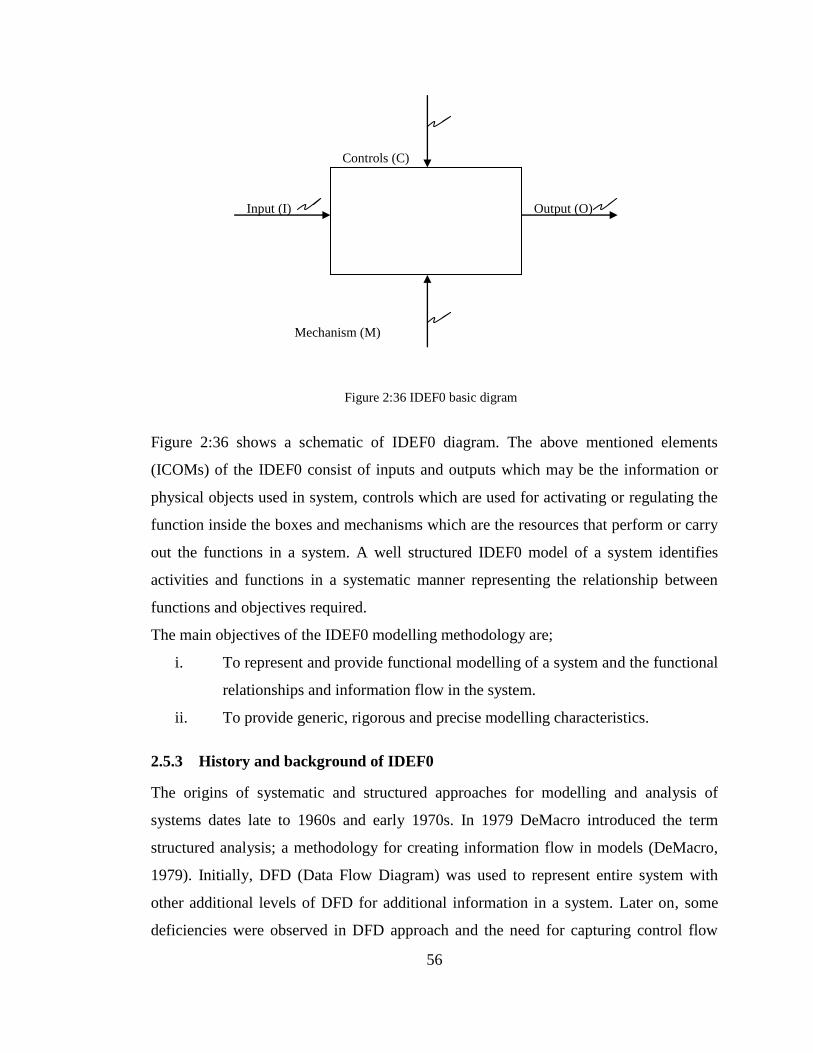
56
Controls (C)
Input (I) Output (O)
Mechanism (M)
Figure 2:36 shows a schematic of IDEF0 diagram. The above mentioned elements
(ICOMs) of the IDEF0 consist of inputs and outputs which may be the information or
physical objects used in system, controls which are used for activating or regulating the
function inside the boxes and mechanisms which are the resources that perform or carry
out the functions in a system. A well structured IDEF0 model of a system identifies
activities and functions in a systematic manner representing the relationship between
functions and objectives required.
The main objectives of the IDEF0 modelling methodology are;
i. To represent and provide functional modelling of a system and the functional
relationships and information flow in the system.
ii. To provide generic, rigorous and precise modelling characteristics.
2.5.3 History and background of IDEF0
The origins of systematic and structured approaches for modelling and analysis of
systems dates late to 1960s and early 1970s. In 1979 DeMacro introduced the term
structured analysis; a methodology for creating information flow in models (DeMacro,
1979). Initially, DFD (Data Flow Diagram) was used to represent entire system with
other additional levels of DFD for additional information in a system. Later on, some
deficiencies were observed in DFD approach and the need for capturing control flow
Figure 2:36 IDEF0 basic digram
57
and control processing information became apparent for modelling real- time systems
(Ward and Mellor, 1985).
For this purpose in 1977 SDAT was developed by Ross and Schoman. SDAT is a
graphical language consists of boxes and arrows that represent system components and
interfaces and capture multiple levels of details in hierarchical manner. In mid 70s Soft
Tech, Inc introduced this well established graphical language to overcome and improve
some of shortcomings of modelling and analysis methods. The United States Air Force
in late 1970s used SDAT as a language to develop the functional modelling method to
support its Integrated Computer Aided Manufacturing (ICAM). IDEF0 was derived
from the SDAT. Since the use and application of SDAT and IDEF0 in aero space
industry in United States air force, IDEF0 modelling methodology has been widely
applied in organisations and industries (Ross, 1985).
2.5.4 IDEF0 modelling methodology working principles
IDEF0 modelling methodology works on hierarchical principles where the modelling
process starts with construction of the highest level diagram showing the purpose or
context of the model; generally called context or reference model and marked as “A-0”
diagram/model. The “A-0” is a one box diagram which determines the subject of the
model and defines the scope of analysis to be included in the model (O’Sullivan, 1991;
IEEE Xplore, 1998).
The developed context or reference model is then decomposed to generate the details of
the model at the required level marked as “as-is” A0 model. The “as-is” A0 model
contains three to six boxes, representing the activities in the system (Yousuf and Smith,
1996). The justification of recommendation of limits of the boxes, in case of less than
three boxes is given that model does not constitute sufficient details for useful
decomposition; whereas the boxes more than six contain details that should be
suppressed within the diagram and unpacked in the decomposition. The relationship
between reference model A-0 and “as-is” A0 model is called parent and child diagrams.
The “as-is” A0 models are analysed and evaluated in order to improve the models or
58
systems from where the new “as-to” be models are created; aiming at modifying or
improving the systems or models efficiency (Ang et al., 1994).
Ross (Ross, 1995) described a structured modelling technique that has become
synonymous with the design and manufacturing systems is the ICAM definition zero
language. IDEF0 is widely used technique for modelling the design and manufacturing
systems. Following section presents some of the examples of IDEF0 modelling in
design and manufacturing systems. Before presenting the IDEF0 examples in design and
manufacturing systems in the context of this research, firstly; introduction to new
manufacturing systems named mass customisation production (MCP) systems is
presented.
2.5.5 Mass customisation production (MCP) systems
Production systems which can deliver one-of-a-kind products or customised products to
individual customers on large or mass scale are named as mass customisation production
(MCP) systems. These systems apply advanced information technologies resources,
highly flexible integrated manufacturing systems and efficient supply chain
management systems (Chinnaiah et al., 1995). From the strategic point of view mass
customisation is the process of differentiation through adding value into the product for
the customers. The value creation process in the realisation of the products differentiates
the mass customised production systems from mass production systems (Cullinane et
al., 1997).
2.5.6 Fundamental process of mass customisation production (MCP) systems
The main objective of the mass customisation system is to realise the customised
products at mass scale within minimum time and at cost near to mass production
systems. These production systems involve complex manufacturing activities in order to
generate a high variety of customised products. These systems involve extensive
applications of the information technology resources, flexible integrated manufacturing
systems and efficient supply chain management systems establishing the direct link
between the key components of the system for realisation of the customised products
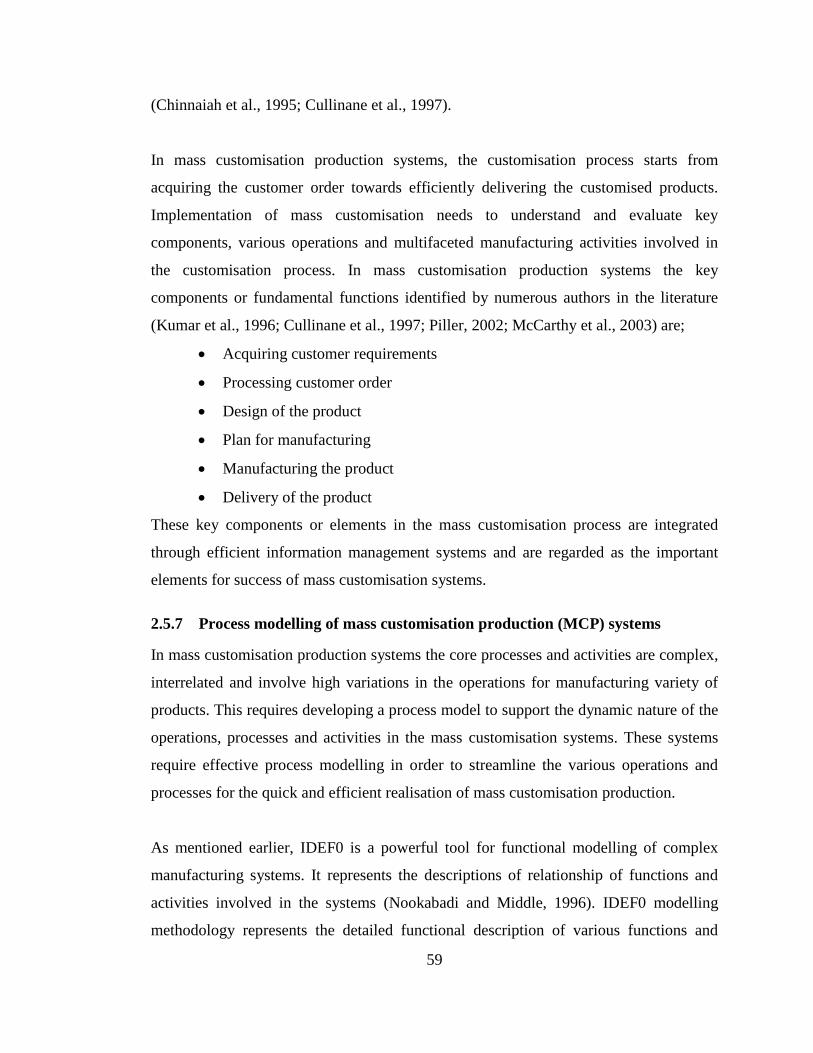
59
(Chinnaiah et al., 1995; Cullinane et al., 1997).
In mass customisation production systems, the customisation process starts from
acquiring the customer order towards efficiently delivering the customised products.
Implementation of mass customisation needs to understand and evaluate key
components, various operations and multifaceted manufacturing activities involved in
the customisation process. In mass customisation production systems the key
components or fundamental functions identified by numerous authors in the literature
(Kumar et al., 1996; Cullinane et al., 1997; Piller, 2002; McCarthy et al., 2003) are;
Acquiring customer requirements
Processing customer order
Design of the product
Plan for manufacturing
Manufacturing the product
Delivery of the product
These key components or elements in the mass customisation process are integrated
through efficient information management systems and are regarded as the important
elements for success of mass customisation systems.
2.5.7 Process modelling of mass customisation production (MCP) systems
In mass customisation production systems the core processes and activities are complex,
interrelated and involve high variations in the operations for manufacturing variety of
products. This requires developing a process model to support the dynamic nature of the
operations, processes and activities in the mass customisation systems. These systems
require effective process modelling in order to streamline the various operations and
processes for the quick and efficient realisation of mass customisation production.
As mentioned earlier, IDEF0 is a powerful tool for functional modelling of complex
manufacturing systems. It represents the descriptions of relationship of functions and
activities involved in the systems (Nookabadi and Middle, 1996). IDEF0 modelling
methodology represents the detailed functional description of various functions and
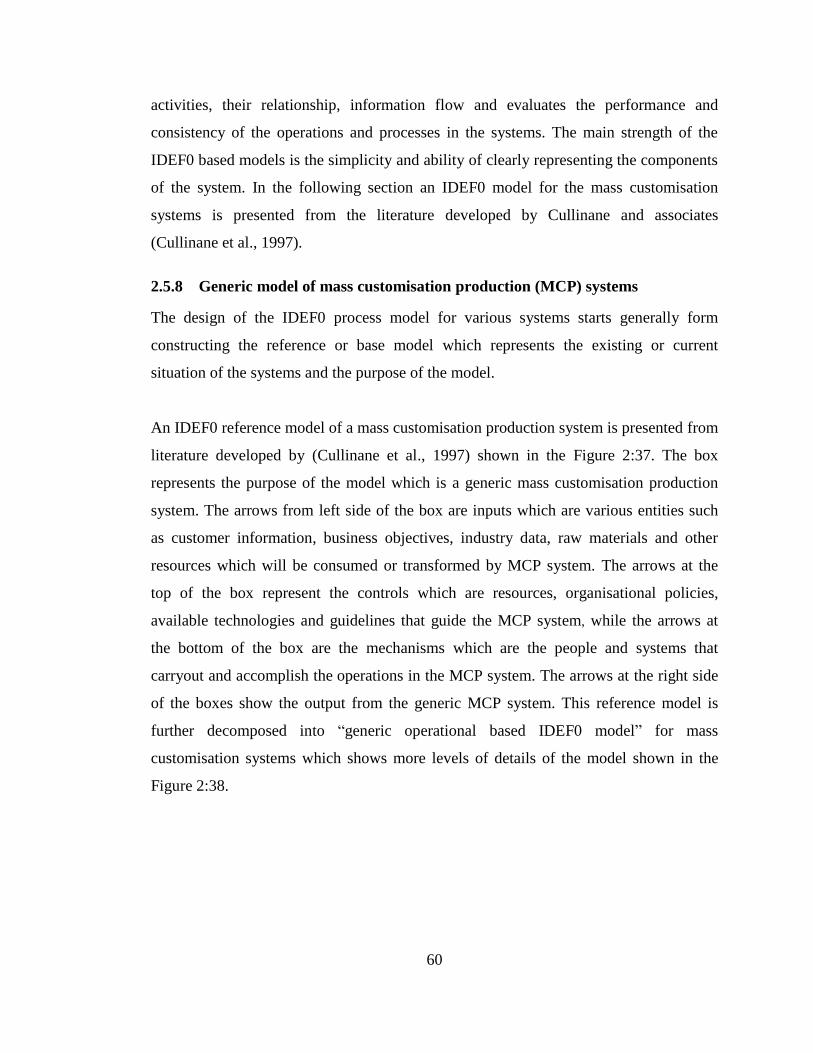
60
activities, their relationship, information flow and evaluates the performance and
consistency of the operations and processes in the systems. The main strength of the
IDEF0 based models is the simplicity and ability of clearly representing the components
of the system. In the following section an IDEF0 model for the mass customisation
systems is presented from the literature developed by Cullinane and associates
(Cullinane et al., 1997).
2.5.8 Generic model of mass customisation production (MCP) systems
The design of the IDEF0 process model for various systems starts generally form
constructing the reference or base model which represents the existing or current
situation of the systems and the purpose of the model.
An IDEF0 reference model of a mass customisation production system is presented from
literature developed by (Cullinane et al., 1997) shown in the Figure 2:37. The box
represents the purpose of the model which is a generic mass customisation production
system. The arrows from left side of the box are inputs which are various entities such
as customer information, business objectives, industry data, raw materials and other
resources which will be consumed or transformed by MCP system. The arrows at the
top of the box represent the controls which are resources, organisational policies,
available technologies and guidelines that guide the MCP system, while the arrows at
the bottom of the box are the mechanisms which are the people and systems that
carryout and accomplish the operations in the MCP system. The arrows at the right side
of the boxes show the output from the generic MCP system. This reference model is
further decomposed into “generic operational based IDEF0 model” for mass
customisation systems which shows more levels of details of the model shown in the
Figure 2:38.
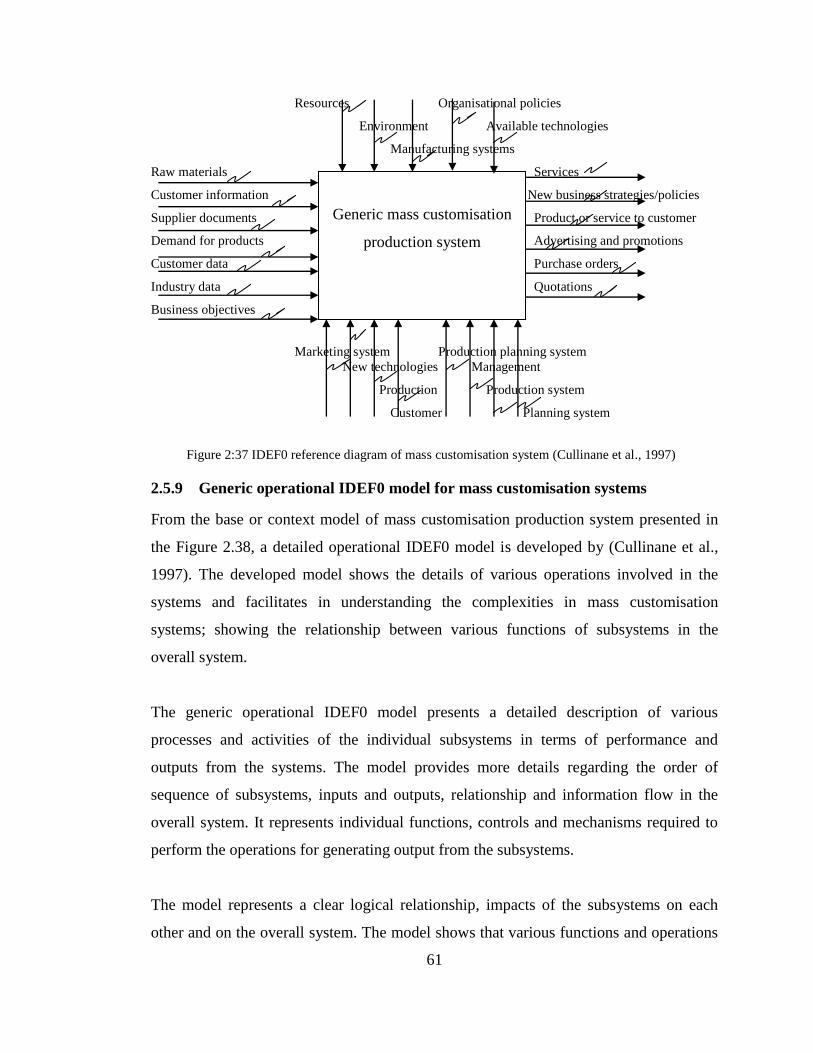
61
Resources Organisational policies
Environment Available technologies
Manufacturing systems
Raw materials Services
Customer information New business strategies/policies
Supplier documents Product or service to customer
Demand for products Advertising and promotions
Customer data Purchase orders
Industry data Quotations
Business objectives
Marketing system Production planning system
New technologies Management
Production Production system
Customer Planning system
2.5.9 Generic operational IDEF0 model for mass customisation systems
From the base or context model of mass customisation production system presented in
the Figure 2.38, a detailed operational IDEF0 model is developed by (Cullinane et al.,
1997). The developed model shows the details of various operations involved in the
systems and facilitates in understanding the complexities in mass customisation
systems; showing the relationship between various functions of subsystems in the
overall system.
The generic operational IDEF0 model presents a detailed description of various
processes and activities of the individual subsystems in terms of performance and
outputs from the systems. The model provides more details regarding the order of
sequence of subsystems, inputs and outputs, relationship and information flow in the
overall system. It represents individual functions, controls and mechanisms required to
perform the operations for generating output from the subsystems.
The model represents a clear logical relationship, impacts of the subsystems on each
other and on the overall system. The model shows that various functions and operations
Figure 2:37 IDEF0 reference diagram of mass customisation system (Cullinane et al., 1997)
Generic mass customisation
production system
62
are interrelated in a systematic hierarchy based on the IDEF0 modelling principles.
From operational aspects for mass customisation production systems; the key operations
and activities in the generic operational IDEF0 model are explained individually
according to hierarchy of the operations involved in the mass customisation
manufacturing systems. The key functions are;
i. Capturing customer requirements
The first step in the customisation process is to capture the needs, requirements and
preferences of the customer for customisation in order to understand, evaluate and
generate the details for the product to be customised. This step differentiates
customisation production from mass production by incorporation of the customer
preferences into the products (McCarthy et al., 2003).
The main objective of representing the activities individually is to evaluate and assess
the required resources such as inputs, controls and mechanisms for performing the
activity. Figure 2.39 shows the activity of capturing customer requirements “A1”. The
function of this activity is to receive, gather and interpret the various inputs and
transforming them into outputs. The inputs such as demand for the product, customer
requirements and preferences, customer data and business objectives which are
transformed into the outputs such as customer order for the product. The mechanisms
are management and other subsystems to carry out the task of analysing the inputs such
as understanding carefully the requirements of the customer for the products and all
other associated information. This activity generates accurate details, attributes and
specifications for the product under guidelines of the controls for the organisation which
are company policy, available resources and available technologies.
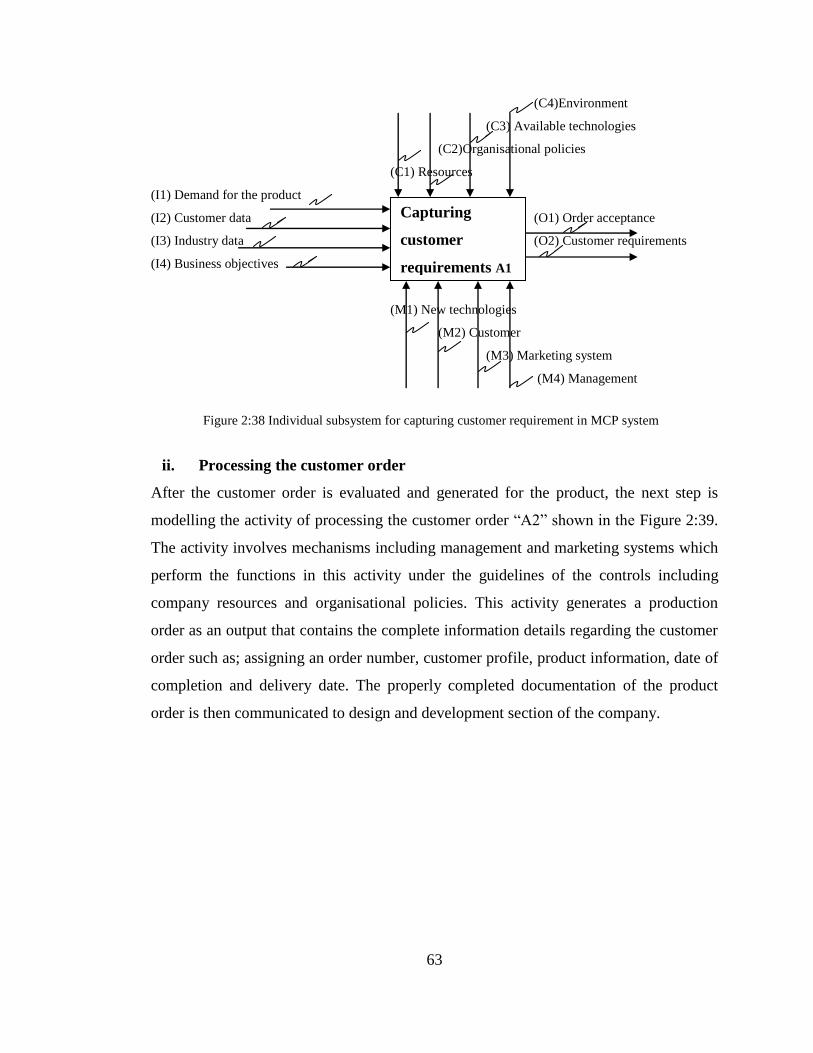
63
(C4)Environment
(C3) Available technologies
(C2)Organisational policies
(C1) Resources
(I1) Demand for the product
(I2) Customer data (O1) Order acceptance
(I3) Industry data (O2) Customer requirements
(I4) Business objectives
(M1) New technologies
(M2) Customer
(M3) Marketing system
(M4) Management
ii. Processing the customer order
After the customer order is evaluated and generated for the product, the next step is
modelling the activity of processing the customer order “A2” shown in the Figure 2:39.
The activity involves mechanisms including management and marketing systems which
perform the functions in this activity under the guidelines of the controls including
company resources and organisational policies. This activity generates a production
order as an output that contains the complete information details regarding the customer
order such as; assigning an order number, customer profile, product information, date of
completion and delivery date. The properly completed documentation of the product
order is then communicated to design and development section of the company.
Figure 2:38 Individual subsystem for capturing customer requirement in MCP system
Capturing
customer
requirements A1
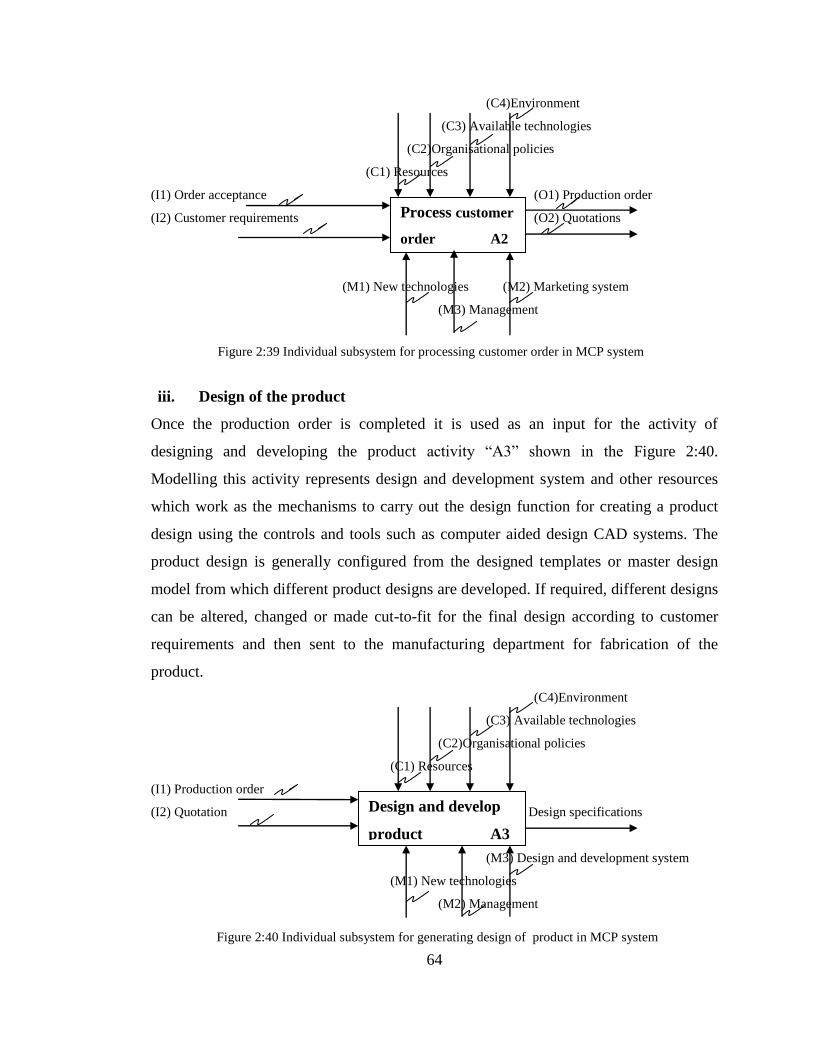
64
(C4)Environment
(C3) Available technologies
(C2)Organisational policies
(C1) Resources
(I1) Order acceptance (O1) Production order
(I2) Customer requirements (O2) Quotations
(M1) New technologies (M2) Marketing system
(M3) Management
iii. Design of the product
Once the production order is completed it is used as an input for the activity of
designing and developing the product activity “A3” shown in the Figure 2:40.
Modelling this activity represents design and development system and other resources
which work as the mechanisms to carry out the design function for creating a product
design using the controls and tools such as computer aided design CAD systems. The
product design is generally configured from the designed templates or master design
model from which different product designs are developed. If required, different designs
can be altered, changed or made cut-to-fit for the final design according to customer
requirements and then sent to the manufacturing department for fabrication of the
product.
(C4)Environment
(C3) Available technologies
(C2)Organisational policies
(C1) Resources
(I1) Production order
(I2) Quotation (O2) Quotations Design specifications
(M3) Design and development system
(M1) New technologies
(M2) Management
Figure 2:39 Individual subsystem for processing customer order in MCP system
Figure 2:40 Individual subsystem for generating design of product in MCP system
Process customer
order A2
Design and develop
product A3
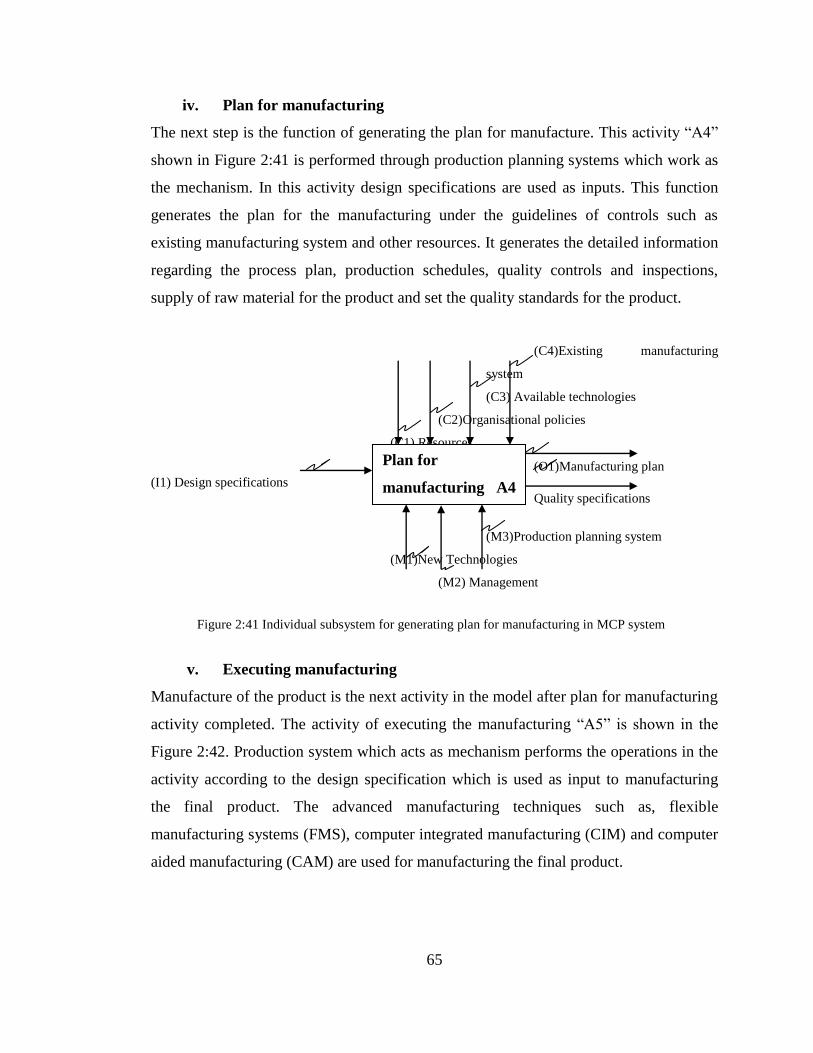
65
iv. Plan for manufacturing
The next step is the function of generating the plan for manufacture. This activity “A4”
shown in Figure 2:41 is performed through production planning systems which work as
the mechanism. In this activity design specifications are used as inputs. This function
generates the plan for the manufacturing under the guidelines of controls such as
existing manufacturing system and other resources. It generates the detailed information
regarding the process plan, production schedules, quality controls and inspections,
supply of raw material for the product and set the quality standards for the product.
(C4)Existing manufacturing
system
(C3) Available technologies
(C2)Organisational policies
(C1) Resources
(O1)Manufacturing plan
(I1) Design specifications
Quality specifications
(M3)Production planning system
(M1)New Technologies
(M2) Management
v. Executing manufacturing
Manufacture of the product is the next activity in the model after plan for manufacturing
activity completed. The activity of executing the manufacturing “A5” is shown in the
Figure 2:42. Production system which acts as mechanism performs the operations in the
activity according to the design specification which is used as input to manufacturing
the final product. The advanced manufacturing techniques such as, flexible
manufacturing systems (FMS), computer integrated manufacturing (CIM) and computer
aided manufacturing (CAM) are used for manufacturing the final product.
Figure 2:41 Individual subsystem for generating plan for manufacturing in MCP system
Plan for
manufacturing A4
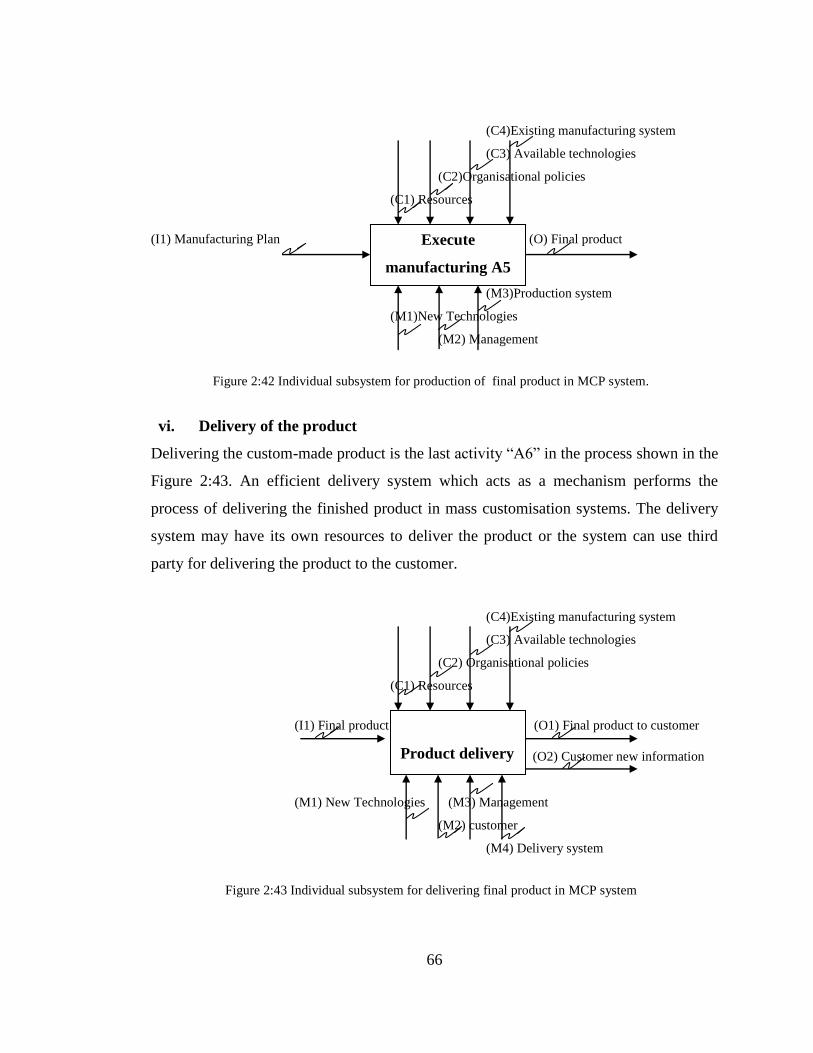
66
(C4)Existing manufacturing system
(C3) Available technologies
(C2)Organisational policies
(C1) Resources
(I1) Manufacturing Plan Quality (O) Final product
(M3)Production system
(M1)New Technologies
(M2) Management
vi. Delivery of the product
Delivering the custom-made product is the last activity “A6” in the process shown in the
Figure 2:43. An efficient delivery system which acts as a mechanism performs the
process of delivering the finished product in mass customisation systems. The delivery
system may have its own resources to deliver the product or the system can use third
party for delivering the product to the customer.
(C4)Existing manufacturing system
(C3) Available technologies
(C2) Organisational policies
(C1) Resources
(I1) Final product (O1) Final product to customer
(O2) Customer new information
(M1) New Technologies (M3) Management
(M2) customer
(M4) Delivery system
Figure 2:42 Individual subsystem for production of final product in MCP system.
Figure 2:43 Individual subsystem for delivering final product in MCP system
Execute
manufacturing A5
Product delivery

67
All the above modelled functions are combined and a generic IDEF0 operational based
model for mass customisation systems is developed. Figure 2:44 shows the generic
operational IDEF0 based process model combined with all the main functions described
above, for mass customisation system.
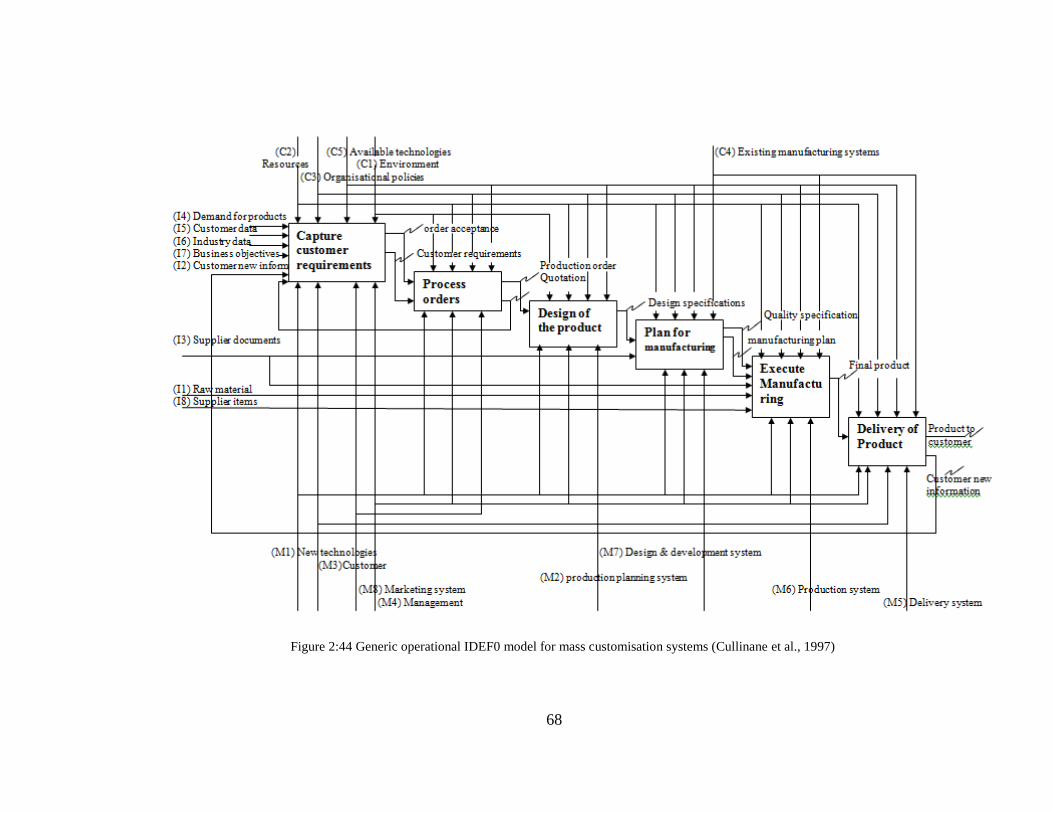
68
Figure 2:44 Generic operational IDEF0 model for mass customisation systems (Cullinane et al., 1997)
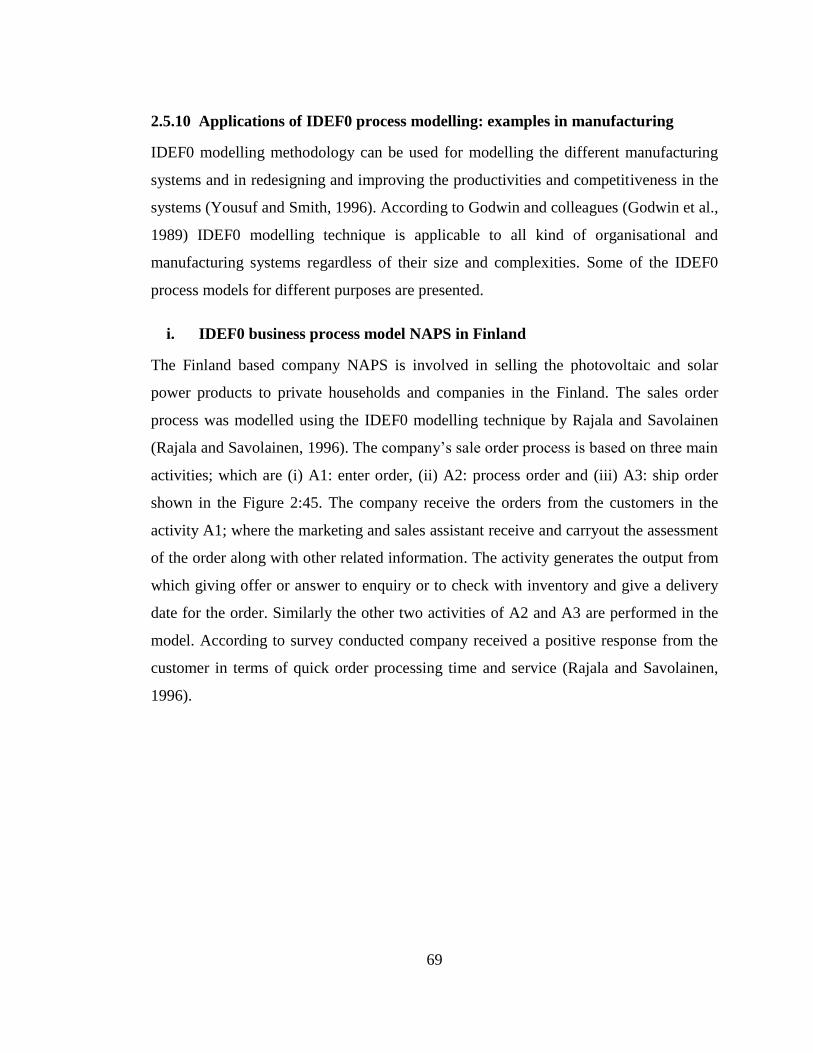
69
2.5.10 Applications of IDEF0 process modelling: examples in manufacturing
IDEF0 modelling methodology can be used for modelling the different manufacturing
systems and in redesigning and improving the productivities and competitiveness in the
systems (Yousuf and Smith, 1996). According to Godwin and colleagues (Godwin et al.,
1989) IDEF0 modelling technique is applicable to all kind of organisational and
manufacturing systems regardless of their size and complexities. Some of the IDEF0
process models for different purposes are presented.
i. IDEF0 business process model NAPS in Finland
The Finland based company NAPS is involved in selling the photovoltaic and solar
power products to private households and companies in the Finland. The sales order
process was modelled using the IDEF0 modelling technique by Rajala and Savolainen
(Rajala and Savolainen, 1996). The company’s sale order process is based on three main
activities; which are (i) A1: enter order, (ii) A2: process order and (iii) A3: ship order
shown in the Figure 2:45. The company receive the orders from the customers in the
activity A1; where the marketing and sales assistant receive and carryout the assessment
of the order along with other related information. The activity generates the output from
which giving offer or answer to enquiry or to check with inventory and give a delivery
date for the order. Similarly the other two activities of A2 and A3 are performed in the
model. According to survey conducted company received a positive response from the
customer in terms of quick order processing time and service (Rajala and Savolainen,
1996).
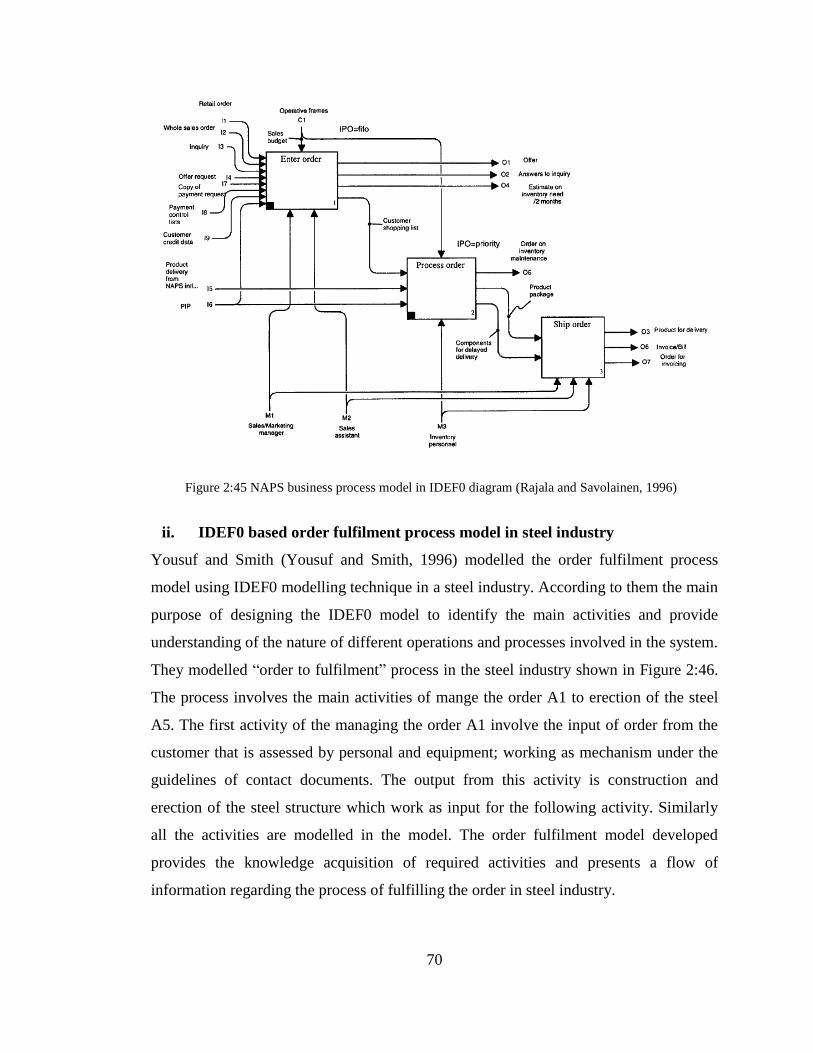
70
ii. IDEF0 based order fulfilment process model in steel industry
Yousuf and Smith (Yousuf and Smith, 1996) modelled the order fulfilment process
model using IDEF0 modelling technique in a steel industry. According to them the main
purpose of designing the IDEF0 model to identify the main activities and provide
understanding of the nature of different operations and processes involved in the system.
They modelled “order to fulfilment” process in the steel industry shown in Figure 2:46.
The process involves the main activities of mange the order A1 to erection of the steel
A5. The first activity of the managing the order A1 involve the input of order from the
customer that is assessed by personal and equipment; working as mechanism under the
guidelines of contact documents. The output from this activity is construction and
erection of the steel structure which work as input for the following activity. Similarly
all the activities are modelled in the model. The order fulfilment model developed
provides the knowledge acquisition of required activities and presents a flow of
information regarding the process of fulfilling the order in steel industry.
Figure 2:45 NAPS business process model in IDEF0 diagram (Rajala and Savolainen, 1996)
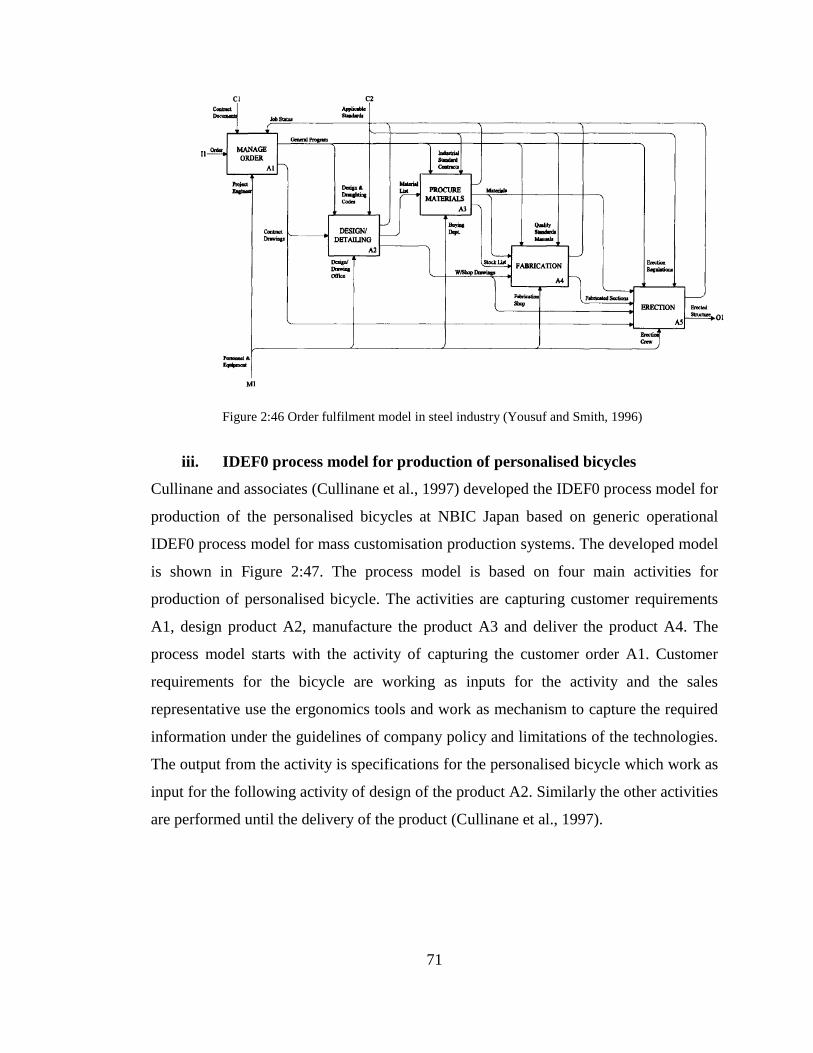
71
iii. IDEF0 process model for production of personalised bicycles
Cullinane and associates (Cullinane et al., 1997) developed the IDEF0 process model for
production of the personalised bicycles at NBIC Japan based on generic operational
IDEF0 process model for mass customisation production systems. The developed model
is shown in Figure 2:47. The process model is based on four main activities for
production of personalised bicycle. The activities are capturing customer requirements
A1, design product A2, manufacture the product A3 and deliver the product A4. The
process model starts with the activity of capturing the customer order A1. Customer
requirements for the bicycle are working as inputs for the activity and the sales
representative use the ergonomics tools and work as mechanism to capture the required
information under the guidelines of company policy and limitations of the technologies.
The output from the activity is specifications for the personalised bicycle which work as
input for the following activity of design of the product A2. Similarly the other activities
are performed until the delivery of the product (Cullinane et al., 1997).
Figure 2:46 Order fulfilment model in steel industry (Yousuf and Smith, 1996)
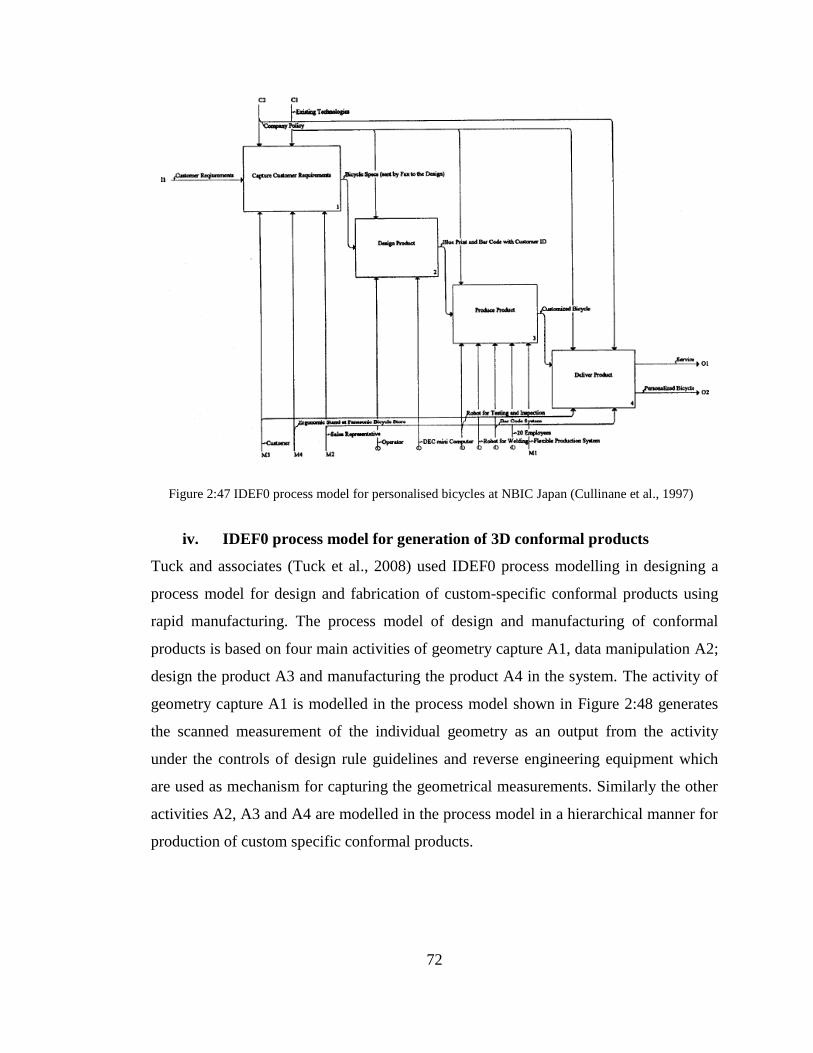
72
iv. IDEF0 process model for generation of 3D conformal products
Tuck and associates (Tuck et al., 2008) used IDEF0 process modelling in designing a
process model for design and fabrication of custom-specific conformal products using
rapid manufacturing. The process model of design and manufacturing of conformal
products is based on four main activities of geometry capture A1, data manipulation A2;
design the product A3 and manufacturing the product A4 in the system. The activity of
geometry capture A1 is modelled in the process model shown in Figure 2:48 generates
the scanned measurement of the individual geometry as an output from the activity
under the controls of design rule guidelines and reverse engineering equipment which
are used as mechanism for capturing the geometrical measurements. Similarly the other
activities A2, A3 and A4 are modelled in the process model in a hierarchical manner for
production of custom specific conformal products.
Figure 2:47 IDEF0 process model for personalised bicycles at NBIC Japan (Cullinane et al., 1997)
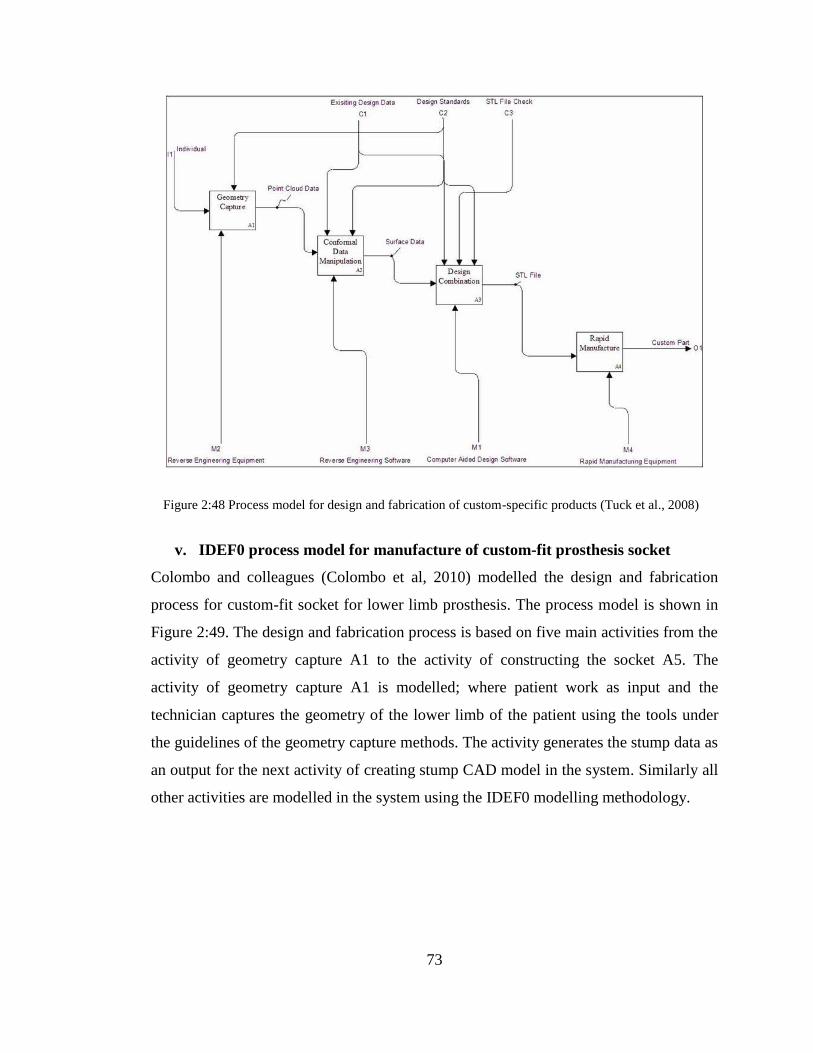
73
v. IDEF0 process model for manufacture of custom-fit prosthesis socket
Colombo and colleagues (Colombo et al, 2010) modelled the design and fabrication
process for custom-fit socket for lower limb prosthesis. The process model is shown in
Figure 2:49. The design and fabrication process is based on five main activities from the
activity of geometry capture A1 to the activity of constructing the socket A5. The
activity of geometry capture A1 is modelled; where patient work as input and the
technician captures the geometry of the lower limb of the patient using the tools under
the guidelines of the geometry capture methods. The activity generates the stump data as
an output for the next activity of creating stump CAD model in the system. Similarly all
other activities are modelled in the system using the IDEF0 modelling methodology.
Figure 2:48 Process model for design and fabrication of custom-specific products (Tuck et al., 2008)
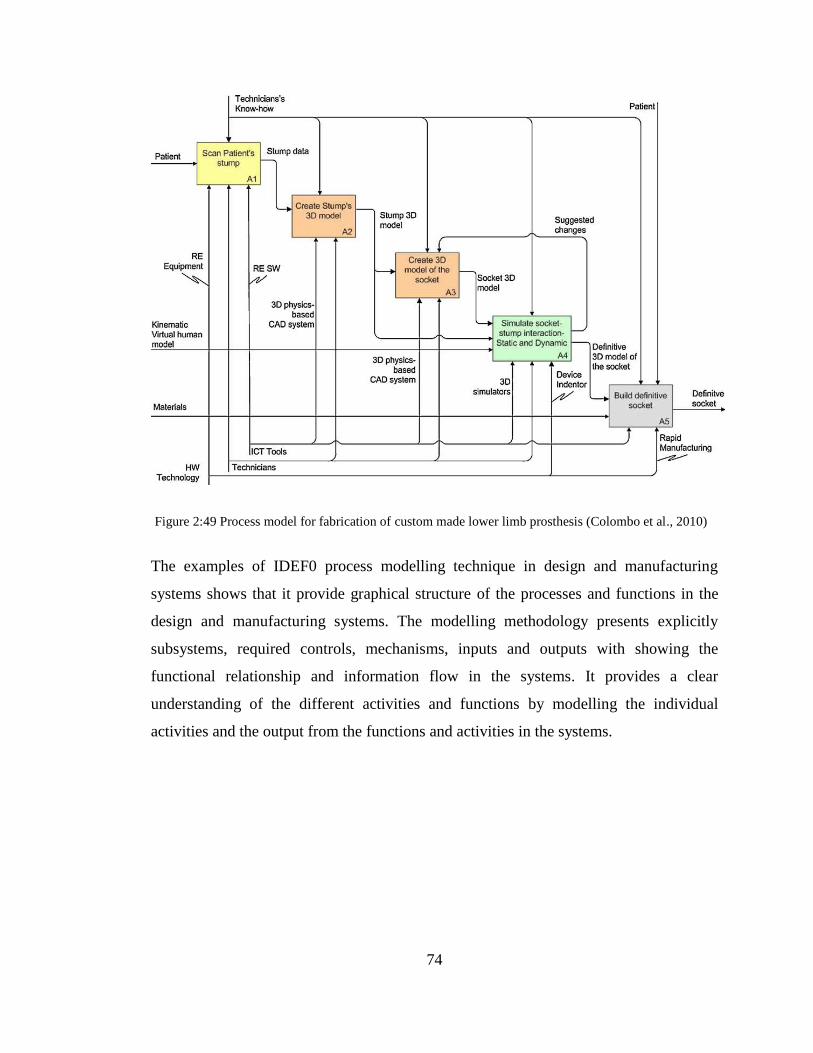
74
The examples of IDEF0 process modelling technique in design and manufacturing
systems shows that it provide graphical structure of the processes and functions in the
design and manufacturing systems. The modelling methodology presents explicitly
subsystems, required controls, mechanisms, inputs and outputs with showing the
functional relationship and information flow in the systems. It provides a clear
understanding of the different activities and functions by modelling the individual
activities and the output from the functions and activities in the systems.
Figure 2:49 Process model for fabrication of custom made lower limb prosthesis (Colombo et al., 2010)
75
2.6 Summary, context, aims and objectives of research
2.6.1 Summary of the literature review.
Custom foot orthoses are recognised and established as a non-invasive treatment in foot
related problems and diseases including rheumatoid arthritis, diabetes and associated
pathological complications of these diseases. The main characteristic of the custom
orthoses fabrication and provision is the ability of providing the orthoses with prescribed
required features and functional elements. The literature review has explored that
conventional design and manufacturing practices and techniques are applied in the
custom orthoses manufacturing. These techniques have limitations in incorporating the
functional elements such as integration of local stiffness and complex design features
including metatarsal pads and domes discussed in Section 2.4.2. These factors limit the
range of product using the conventional techniques in the fabrication process.
Rapid manufacturing techniques have greater design freedom and ability in creating the
complex geometrical structures with required design features and functional elements.
These factors indicate that this approach has increased potential in production of custom
made parts and products. The commercial examples of in-the- ear hearing aids and
dental braces along with other medical applications examples have shown the
advantages of these techniques. The developments in fabrication of prosthesis sockets
using rapid manufacturing techniques have shown advantages of these techniques in
creation of custom-specific parts with increased accuracy and improved fit.
The novelty of this research is the integration of rapid manufacturing techniques in
design and fabrication process of custom foot orthoses. The main objectives are; the
assessment of the rapid manufacturing approach in design and fabrication system which
delivers improved quality orthoses with reduced lead-time and enables the production
and delivery of custom-made orthoses at mass scale. The research addresses the issues
in applications of rapid manufacturing techniques in design and manufacturing process
for custom foot orthoses. The design and manufacturing costs and lead-time associated
with the applications of different rapid manufacturing techniques are investigated and
76
evaluated. The research establishes the platform in evaluation of different commercially
available rapid manufacturing techniques in custom foot orthoses fabrication at
commercial scale.
2.6.2 Structure of the work
The research is structured as follows;
1. Current design and manufacturing processes for custom foot orthoses is
modelled and described. The modelling is based on the main activities and
functions involved in the system. IDEF0 is used in modelling the activities and
functions in the process. The main purpose of modelling the activities was to
understand the functions and activities in current design and manufacturing
process. In the next step rapid manufacturing approach was integrated in the
process of design and fabrication for custom-made foot orthoses. A new process
model based on IDEF0 was developed with integration of rapid manufacturing
techniques in fabrication process. The developed model showed the impacts of
rapid manufacturing techniques in the upstream and downstream activities in the
design and fabrication process; representing the relationships in the functions
and activities and overall improvements in the process.
2. The main functions including foot geometry capture and orthoses design were
evaluated and analysed in the developed rapid manufacturing based IDEF0
process model in terms of cost, lead time, efficiency and overall productivity.
3. Different commercially established rapid manufacturing techniques were used in
the experimental work for fabrication of the foot orthosis model. The cost and
lead-time in different rapid manufacturing techniques were analysed and
evaluated.
4. Based on the varying initial conditions and constraints, a set of mass
customisation systems are proposed.
77
Chapter 3 Initial process modelling
3.1 Introduction.
In this chapter, analysis of the functions and activities involved in the design and
fabrication of custom foot orthoses is carried out in order to understand and evaluate the
design and manufacture process. IDEF0 process modelling methodology was used in the
construction of a function based process model to illustrate the structured
representations of the individual functions and activities in the system. The main
objective was to assess and characterise the existing functions and carryout a functional
analysis of the activities in the process of design and fabrication of custom foot orthoses.
3.2 System for design and manufacturing of custom foot orthoses.
Manufacturing systems have a value chain in the production cycle based on a set of
generic functions. In conventional production systems the value chain of a production
system starts from the generic functions of design, fabrication, assembly and distribution
(Alford et al., 2000). However, in production systems aimed at customisation, the value
chain starts from function of capturing the customer requirements. All the other
functions in value chain are driven by this function in production of custom made
products (Cullinane et al., 1997).
3.3 Functions in the system for design and manufacture of foot orthoses.
A value chain is developed based on the core functions involved in the system for
design and fabrication of custom foot orthoses (Obrovac et al., 2005; Pallari et al.,
2010). The developed value chain is based on the main functions in the production
systems for mass customisation described in Section 2.5.6. A series of core functions
identified in the value chain of custom foot orthoses fabrication are; (i) initial
consultation and foot assessment, (ii) diagnosis, (iii) design of orthoses, (iv) plan for
manufacture, (v) fabrication of orthoses and (vi) delivery of orthoses. In the following
section, the core functions in the system are modelled in IDEF0 diagrams which will be
used in constructing the IDEF0 process model of the existing system.
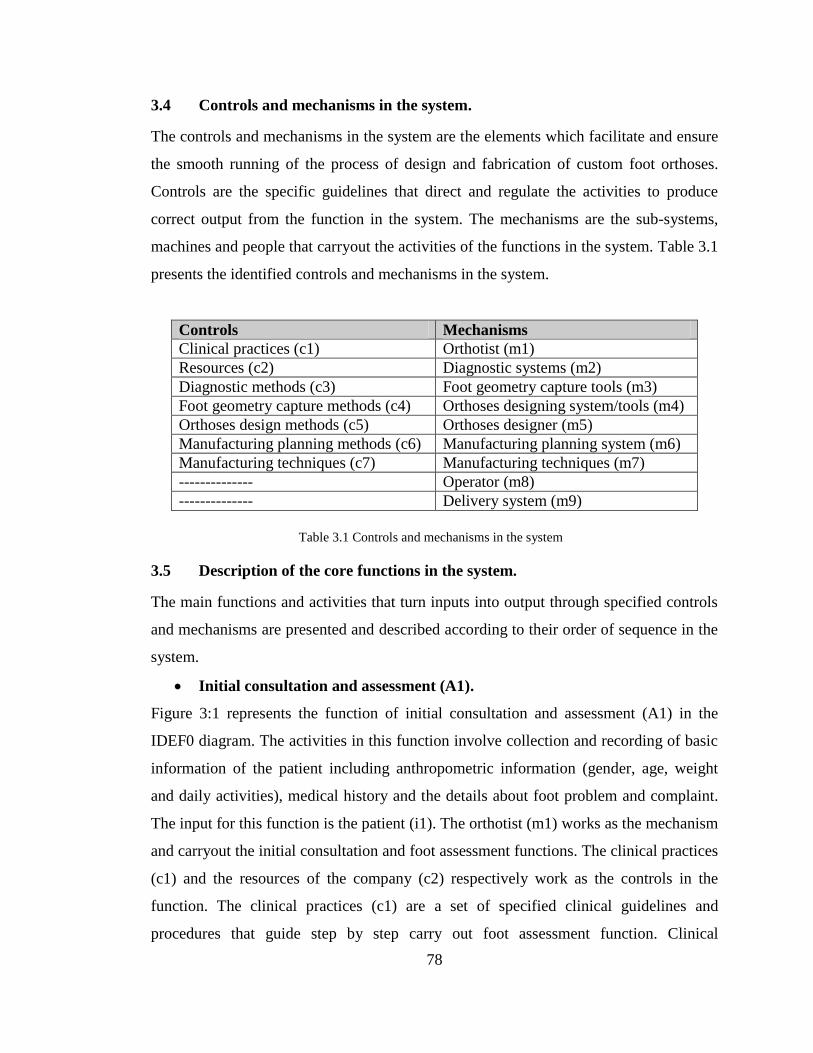
78
3.4 Controls and mechanisms in the system.
The controls and mechanisms in the system are the elements which facilitate and ensure
the smooth running of the process of design and fabrication of custom foot orthoses.
Controls are the specific guidelines that direct and regulate the activities to produce
correct output from the function in the system. The mechanisms are the sub-systems,
machines and people that carryout the activities of the functions in the system. Table 3.1
presents the identified controls and mechanisms in the system.
Controls Mechanisms
Clinical practices (c1) Orthotist (m1)
Resources (c2) Diagnostic systems (m2)
Diagnostic methods (c3) Foot geometry capture tools (m3)
Foot geometry capture methods (c4) Orthoses designing system/tools (m4)
Orthoses design methods (c5) Orthoses designer (m5)
Manufacturing planning methods (c6) Manufacturing planning system (m6)
Manufacturing techniques (c7) Manufacturing techniques (m7)
-------------- Operator (m8)
-------------- Delivery system (m9)
3.5 Description of the core functions in the system.
The main functions and activities that turn inputs into output through specified controls
and mechanisms are presented and described according to their order of sequence in the
system.
Initial consultation and assessment (A1).
Figure 3:1 represents the function of initial consultation and assessment (A1) in the
IDEF0 diagram. The activities in this function involve collection and recording of basic
information of the patient including anthropometric information (gender, age, weight
and daily activities), medical history and the details about foot problem and complaint.
The input for this function is the patient (i1). The orthotist (m1) works as the mechanism
and carryout the initial consultation and foot assessment functions. The clinical practices
(c1) and the resources of the company (c2) respectively work as the controls in the
function. The clinical practices (c1) are a set of specified clinical guidelines and
procedures that guide step by step carry out foot assessment function. Clinical
Table 3.1 Controls and mechanisms in the system
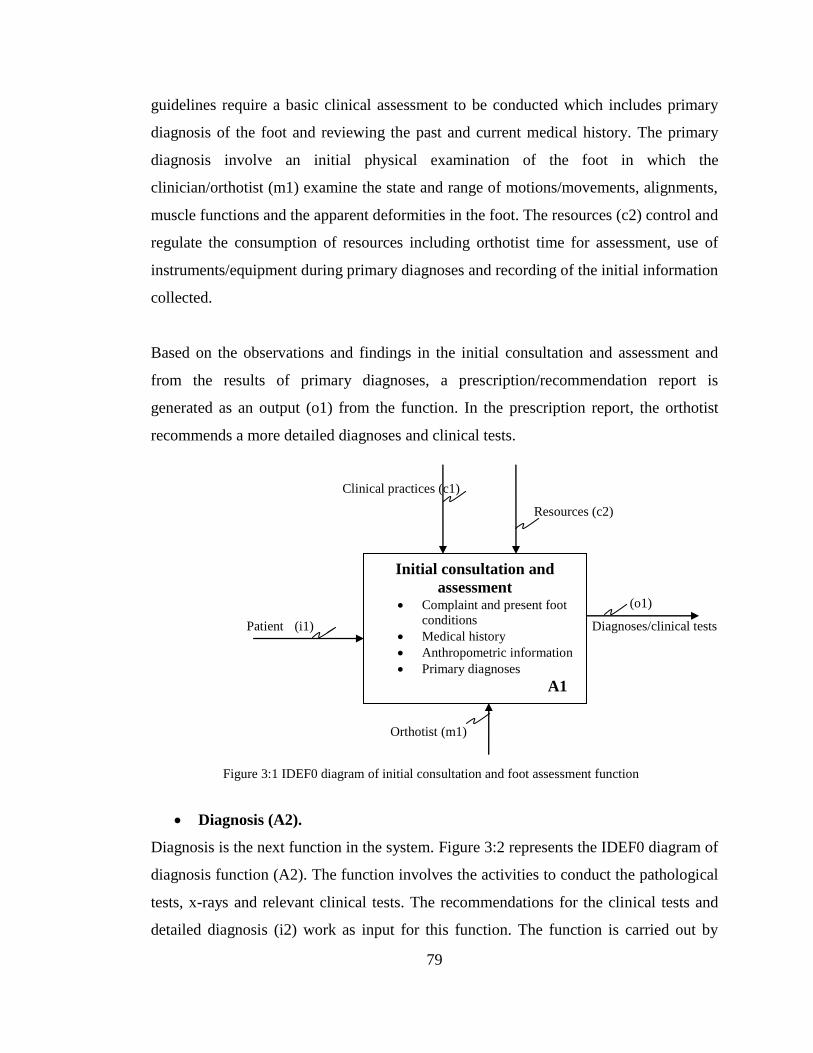
79
guidelines require a basic clinical assessment to be conducted which includes primary
diagnosis of the foot and reviewing the past and current medical history. The primary
diagnosis involve an initial physical examination of the foot in which the
clinician/orthotist (m1) examine the state and range of motions/movements, alignments,
muscle functions and the apparent deformities in the foot. The resources (c2) control and
regulate the consumption of resources including orthotist time for assessment, use of
instruments/equipment during primary diagnoses and recording of the initial information
collected.
Based on the observations and findings in the initial consultation and assessment and
from the results of primary diagnoses, a prescription/recommendation report is
generated as an output (o1) from the function. In the prescription report, the orthotist
recommends a more detailed diagnoses and clinical tests.
Clinical practices (c1)
Resources (c2)
(o1)
Patient (i1) Diagnoses/clinical tests
Orthotist (m1)
Diagnosis (A2).
Diagnosis is the next function in the system. Figure 3:2 represents the IDEF0 diagram of
diagnosis function (A2). The function involves the activities to conduct the pathological
tests, x-rays and relevant clinical tests. The recommendations for the clinical tests and
detailed diagnosis (i2) work as input for this function. The function is carried out by
Figure 3:1 IDEF0 diagram of initial consultation and foot assessment function
Initial consultation and
assessment Complaint and present foot
conditions
Medical history
Anthropometric information
Primary diagnoses
A1
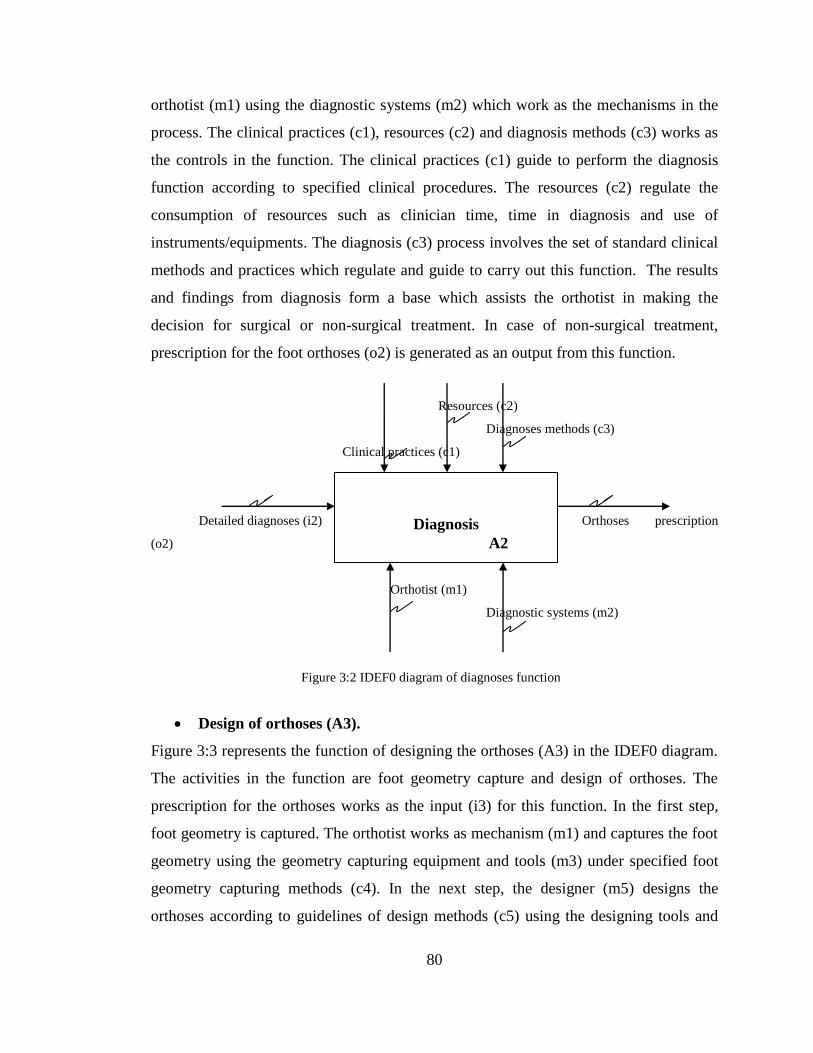
80
orthotist (m1) using the diagnostic systems (m2) which work as the mechanisms in the
process. The clinical practices (c1), resources (c2) and diagnosis methods (c3) works as
the controls in the function. The clinical practices (c1) guide to perform the diagnosis
function according to specified clinical procedures. The resources (c2) regulate the
consumption of resources such as clinician time, time in diagnosis and use of
instruments/equipments. The diagnosis (c3) process involves the set of standard clinical
methods and practices which regulate and guide to carry out this function. The results
and findings from diagnosis form a base which assists the orthotist in making the
decision for surgical or non-surgical treatment. In case of non-surgical treatment,
prescription for the foot orthoses (o2) is generated as an output from this function.
Resources (c2)
Diagnoses methods (c3)
Clinical practices (c1)
Detailed diagnoses (i2) Orthoses prescription
(o2)
Orthotist (m1)
Diagnostic systems (m2)
Design of orthoses (A3).
Figure 3:3 represents the function of designing the orthoses (A3) in the IDEF0 diagram.
The activities in the function are foot geometry capture and design of orthoses. The
prescription for the orthoses works as the input (i3) for this function. In the first step,
foot geometry is captured. The orthotist works as mechanism (m1) and captures the foot
geometry using the geometry capturing equipment and tools (m3) under specified foot
geometry capturing methods (c4). In the next step, the designer (m5) designs the
orthoses according to guidelines of design methods (c5) using the designing tools and
Figure 3:2 IDEF0 diagram of diagnoses function
Diagnosis
A2
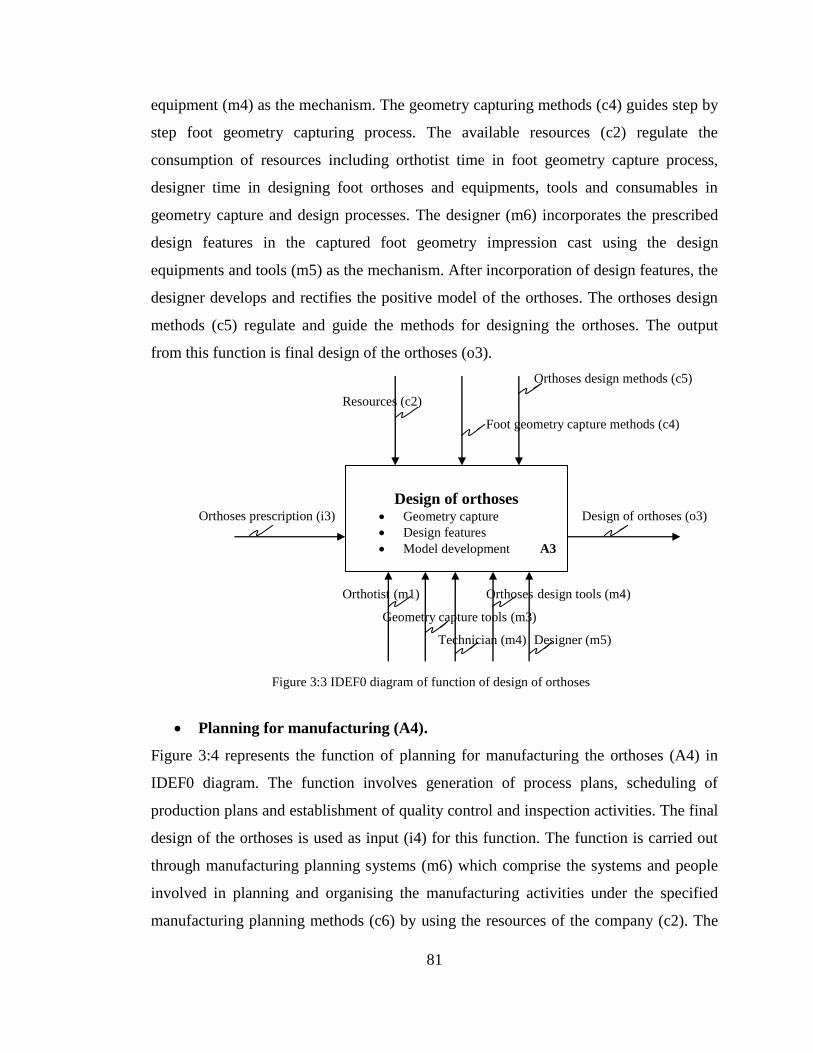
81
equipment (m4) as the mechanism. The geometry capturing methods (c4) guides step by
step foot geometry capturing process. The available resources (c2) regulate the
consumption of resources including orthotist time in foot geometry capture process,
designer time in designing foot orthoses and equipments, tools and consumables in
geometry capture and design processes. The designer (m6) incorporates the prescribed
design features in the captured foot geometry impression cast using the design
equipments and tools (m5) as the mechanism. After incorporation of design features, the
designer develops and rectifies the positive model of the orthoses. The orthoses design
methods (c5) regulate and guide the methods for designing the orthoses. The output
from this function is final design of the orthoses (o3).
Orthoses design methods (c5)
Resources (c2)
Foot geometry capture methods (c4)
Orthoses prescription (i3) Design of orthoses (o3)
Orthotist (m1) Orthoses design tools (m4)
Geometry capture tools (m3)
Technician (m4) Designer (m5)
Planning for manufacturing (A4).
Figure 3:4 represents the function of planning for manufacturing the orthoses (A4) in
IDEF0 diagram. The function involves generation of process plans, scheduling of
production plans and establishment of quality control and inspection activities. The final
design of the orthoses is used as input (i4) for this function. The function is carried out
through manufacturing planning systems (m6) which comprise the systems and people
involved in planning and organising the manufacturing activities under the specified
manufacturing planning methods (c6) by using the resources of the company (c2). The
Figure 3:3 IDEF0 diagram of function of design of orthoses
Design of orthoses Geometry capture
Design features
Model development A3
A3
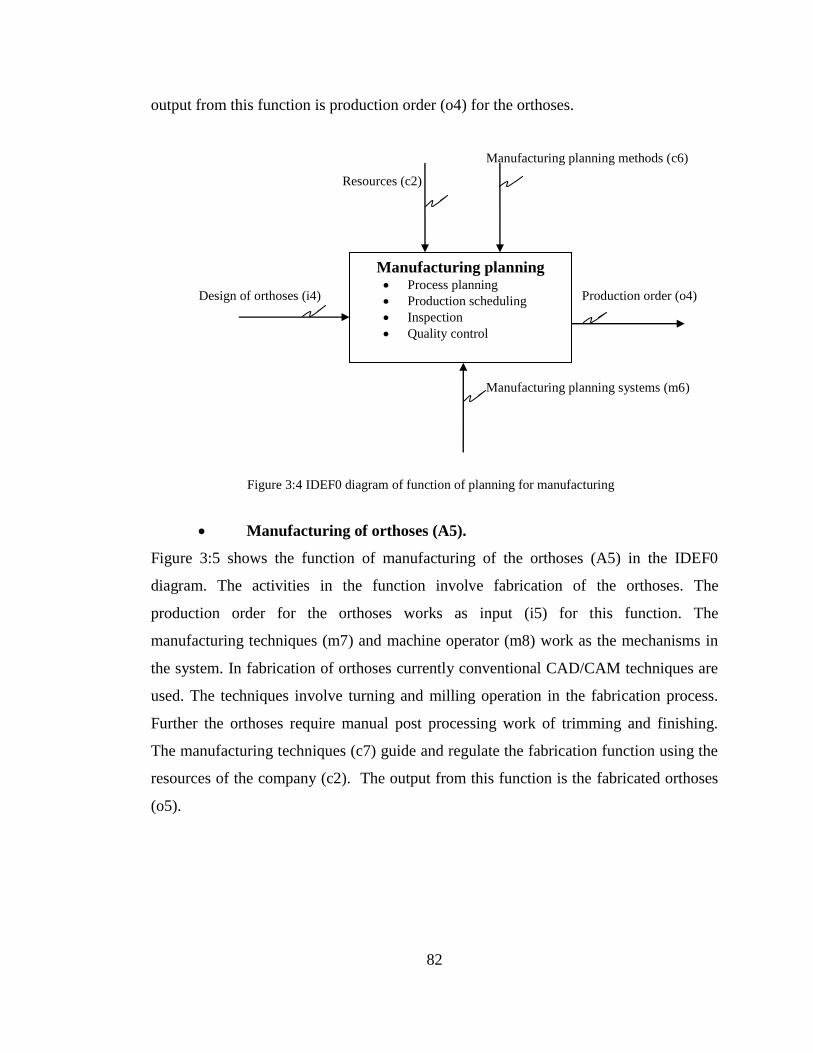
82
output from this function is production order (o4) for the orthoses.
Manufacturing planning methods (c6)
Resources (c2)
Design of orthoses (i4) Production order (o4)
Manufacturing planning systems (m6)
Manufacturing of orthoses (A5).
Figure 3:5 shows the function of manufacturing of the orthoses (A5) in the IDEF0
diagram. The activities in the function involve fabrication of the orthoses. The
production order for the orthoses works as input (i5) for this function. The
manufacturing techniques (m7) and machine operator (m8) work as the mechanisms in
the system. In fabrication of orthoses currently conventional CAD/CAM techniques are
used. The techniques involve turning and milling operation in the fabrication process.
Further the orthoses require manual post processing work of trimming and finishing.
The manufacturing techniques (c7) guide and regulate the fabrication function using the
resources of the company (c2). The output from this function is the fabricated orthoses
(o5).
Figure 3:4 IDEF0 diagram of function of planning for manufacturing
Manufacturing planning Process planning
Production scheduling
Inspection
Quality control
A4
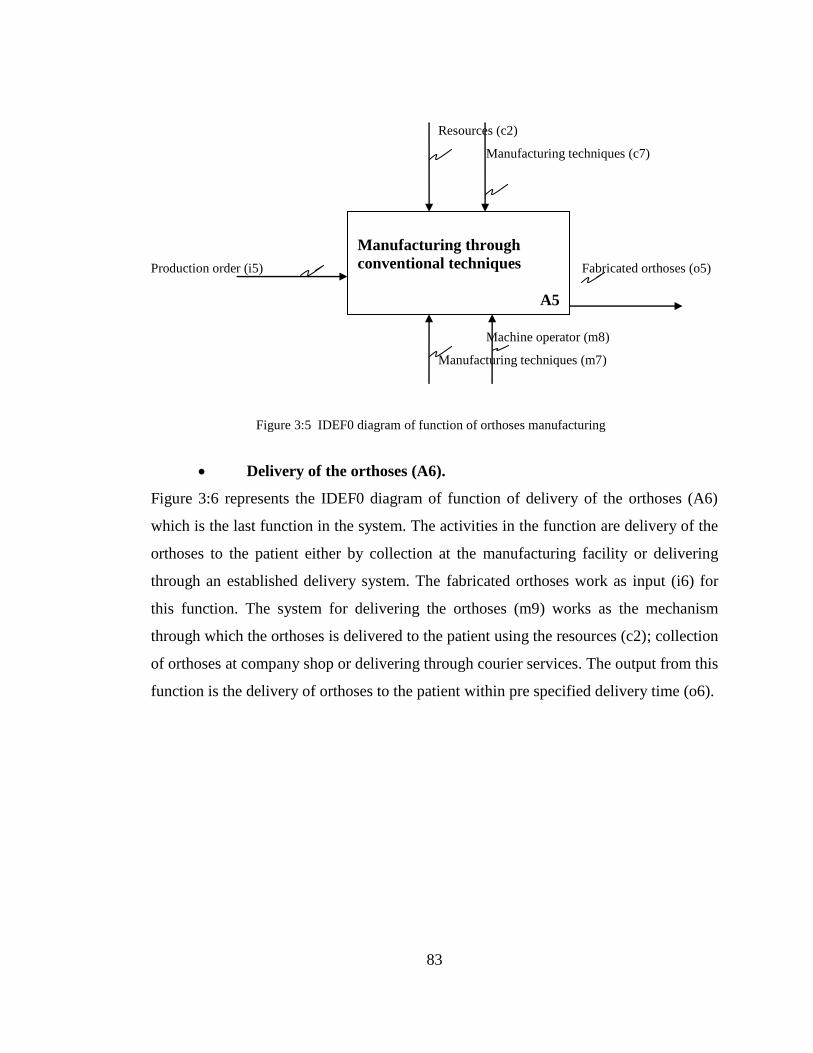
83
Resources (c2)
Manufacturing techniques (c7)
Production order (i5) Fabricated orthoses (o5)
Machine operator (m8)
Manufacturing techniques (m7)
Delivery of the orthoses (A6).
Figure 3:6 represents the IDEF0 diagram of function of delivery of the orthoses (A6)
which is the last function in the system. The activities in the function are delivery of the
orthoses to the patient either by collection at the manufacturing facility or delivering
through an established delivery system. The fabricated orthoses work as input (i6) for
this function. The system for delivering the orthoses (m9) works as the mechanism
through which the orthoses is delivered to the patient using the resources (c2); collection
of orthoses at company shop or delivering through courier services. The output from this
function is the delivery of orthoses to the patient within pre specified delivery time (o6).
Figure 3:5 IDEF0 diagram of function of orthoses manufacturing
Manufacturing through
conventional techniques
A5
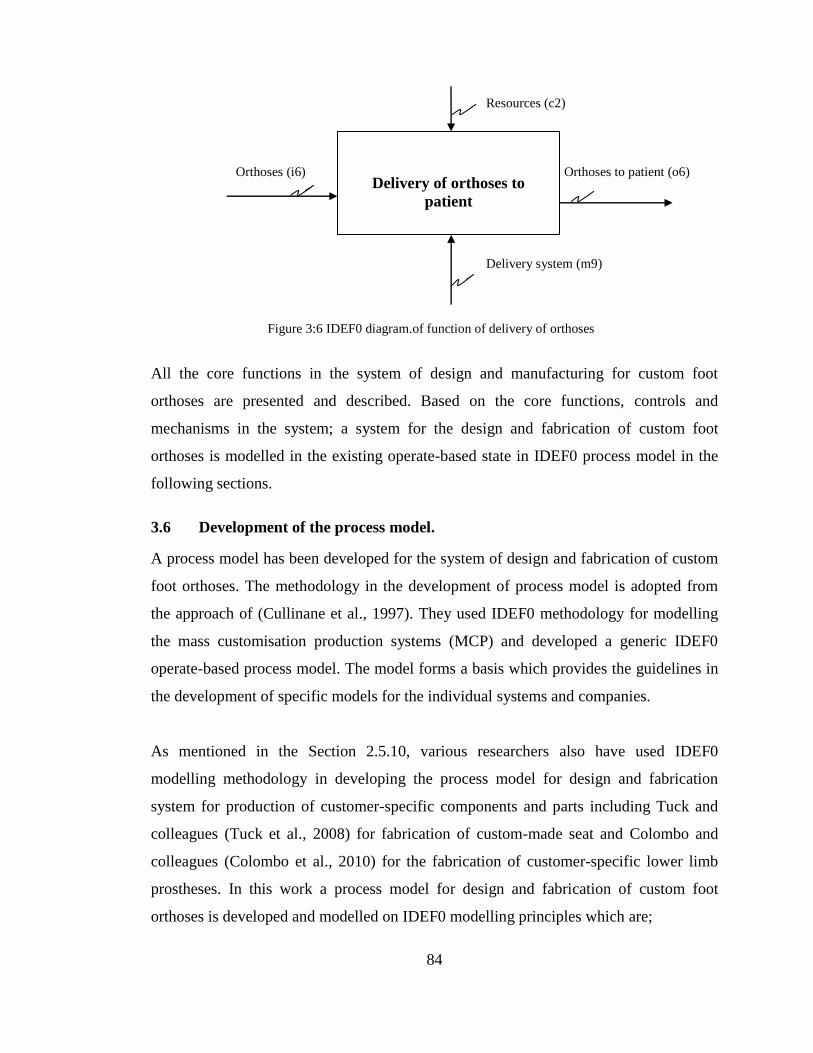
84
Resources (c2)
Orthoses (i6) , Orthoses to patient (o6)
Delivery system (m9)
All the core functions in the system of design and manufacturing for custom foot
orthoses are presented and described. Based on the core functions, controls and
mechanisms in the system; a system for the design and fabrication of custom foot
orthoses is modelled in the existing operate-based state in IDEF0 process model in the
following sections.
3.6 Development of the process model.
A process model has been developed for the system of design and fabrication of custom
foot orthoses. The methodology in the development of process model is adopted from
the approach of (Cullinane et al., 1997). They used IDEF0 methodology for modelling
the mass customisation production systems (MCP) and developed a generic IDEF0
operate-based process model. The model forms a basis which provides the guidelines in
the development of specific models for the individual systems and companies.
As mentioned in the Section 2.5.10, various researchers also have used IDEF0
modelling methodology in developing the process model for design and fabrication
system for production of customer-specific components and parts including Tuck and
colleagues (Tuck et al., 2008) for fabrication of custom-made seat and Colombo and
colleagues (Colombo et al., 2010) for the fabrication of customer-specific lower limb
prostheses. In this work a process model for design and fabrication of custom foot
orthoses is developed and modelled on IDEF0 modelling principles which are;
Figure 3:6 IDEF0 diagram.of function of delivery of orthoses
Delivery of orthoses to
patient
A6
85
Development of “context” model (A-0) of the system.
Development of “as-is” model (A0) of the system in existing operate-based state.
Development of “as-to-be” (A-1) rapid manufacturing based model of the
system.
3.6.1 Development of generic model (A-0) of the system.
In the first step, a generic model (A-0) of the system is developed in which the purpose
of the system is stated. The generic model (A-0) presents the generic view of the entire
system. In IDEF0 modelling methodology the generic models are decomposed to a
required level for capturing the details of the systems. Decomposition is a starting point
in order to construct the detailed models generally called “as-is” models of the systems.
An “as-is” model (A0) of the system represents the system in its existing “as-is” state
and provides basis for functional analysis of the activities and functions involved in the
systems (Ang et al., 1994). In Figure 3:7 a generic IDEF0 model (A-0) of the system of
design and fabrication of custom foot orthoses is developed which shows all the
required inputs, outputs, controls and mechanisms in the system.
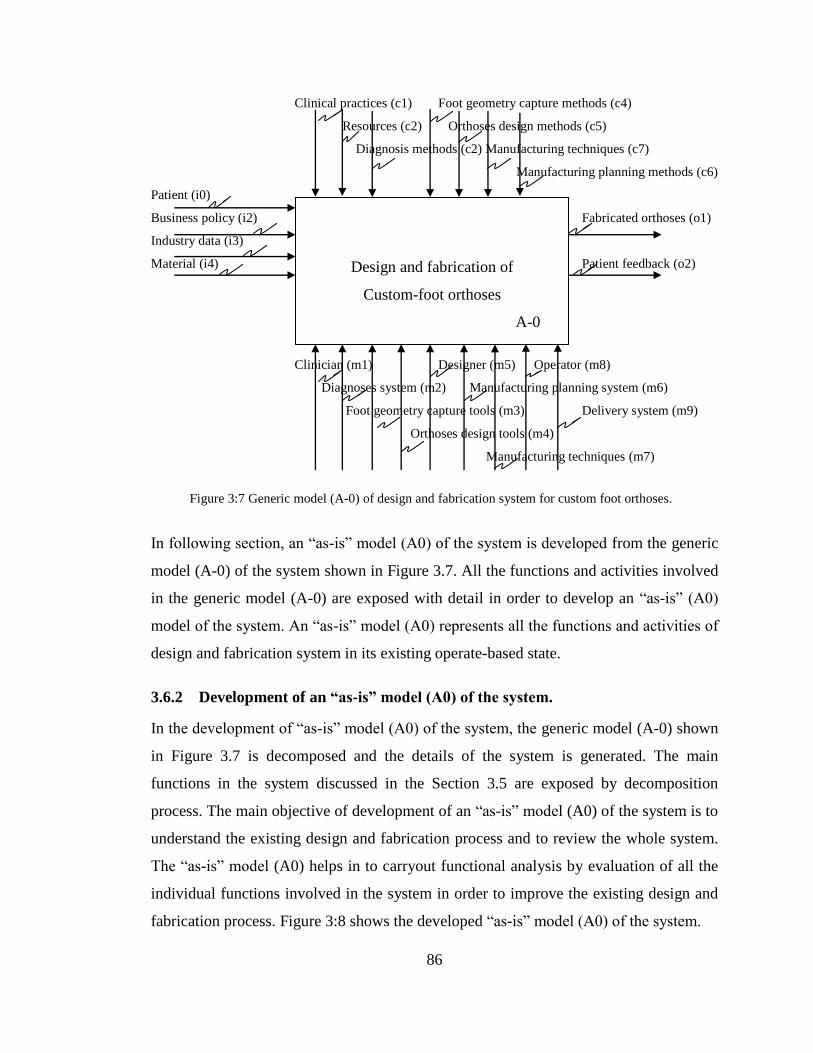
86
Clinical practices (c1) Foot geometry capture methods (c4)
Resources (c2) Orthoses design methods (c5)
Diagnosis methods (c2) Manufacturing techniques (c7)
Manufacturing planning methods (c6)
Patient (i0)
Business policy (i2) Fabricated orthoses (o1)
Industry data (i3)
Material (i4) Patient feedback (o2)
Clinician (m1) Designer (m5) Operator (m8)
Diagnoses system (m2) Manufacturing planning system (m6)
Foot geometry capture tools (m3) Delivery system (m9)
Orthoses design tools (m4)
Manufacturing techniques (m7)
In following section, an “as-is” model (A0) of the system is developed from the generic
model (A-0) of the system shown in Figure 3.7. All the functions and activities involved
in the generic model (A-0) are exposed with detail in order to develop an “as-is” (A0)
model of the system. An “as-is” model (A0) represents all the functions and activities of
design and fabrication system in its existing operate-based state.
3.6.2 Development of an “as-is” model (A0) of the system.
In the development of “as-is” model (A0) of the system, the generic model (A-0) shown
in Figure 3.7 is decomposed and the details of the system is generated. The main
functions in the system discussed in the Section 3.5 are exposed by decomposition
process. The main objective of development of an “as-is” model (A0) of the system is to
understand the existing design and fabrication process and to review the whole system.
The “as-is” model (A0) helps in to carryout functional analysis by evaluation of all the
individual functions involved in the system in order to improve the existing design and
fabrication process. Figure 3:8 shows the developed “as-is” model (A0) of the system.
Figure 3:7 Generic model (A-0) of design and fabrication system for custom foot orthoses.
Design and fabrication of
Custom-foot orthoses
A-0
87
In the “as-is” model (A0), all the functions shown in the system turn inputs into outputs
through specified mechanisms under the guidelines of specified controls in the system.
The functions in the systems generally are analysed and evaluated by the performance
analysis of the functions. The performance measurement is a process of quantifying the
effectiveness and efficiency of a function (Slack, 2001; Tangen, 2003). The performance
of a function is generally stated in terms of cost, time, speed, quality, satisfaction and
additional value (Zhang, 2000). The level of performance of a function in the system is a
key factor in decision making for redesigning or replacing the existing function in order
to improve the overall performance of the system (Xiao et al., 2004).
The “as-is” model (A0) of the existing design and fabrication system for custom foot
orthoses is shown in Figure 3.8 which represents the core functions of; initial foot
assessment, diagnosis, orthoses design, manufacturing planning, orthoses fabrication
and orthoses delivery functions. All the specified controls and mechanisms used in the
existing process of the system are shown in detail. The “as-is” model (A0) process
model of the system provides the basis for improvements in the system by redesigning
the existing design and fabrication process by integration of rapid manufacturing
techniques in the system.
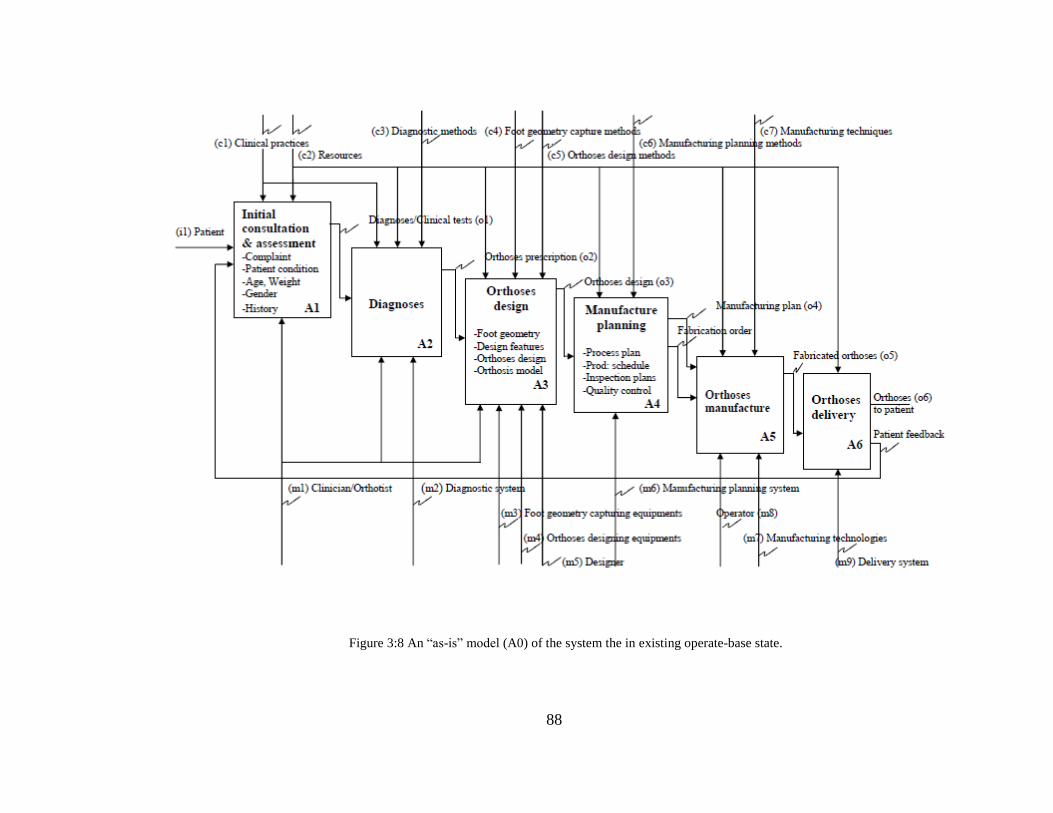
88
Figure 3:8 An “as-is” model (A0) of the system the in existing operate-base state.
89
3.6.3 Development of rapid manufacturing based model (A-1) of the system
An “as-is” (A0) model of the system is redesigned in order to integrate the rapid
manufacturing approach in the system of design and fabrication of custom foot orthoses.
A potential rapid manufacturing based “as-to-be” model (A-1) of the system is
developed which shows the applications of rapid manufacturing approach in the system.
Figure 3:9 represent the developed potential rapid manufacturing based “as-to-be”
model (A-1) of the system.
3.6.4 Controls and mechanisms in rapid manufacturing based process model of
the system
In the potential rapid manufacturing based design and fabrication system for custom foot
orthoses, the identified controls and mechanisms in the system are listed in Table 3.2.
Controls Mechanisms
Clinical practices (c1) Clinician (m1)
Resources (c2) Diagnostic system (m2)
Diagnostic methods (c3) Foot scanning system (m3)
Foot scanning software (c4) CAD orthoses design system (m4)
CAD orthoses design software (c5) Orthoses designer (m5)
Manufacturing planning (c6) Manufacturing planning system (6)
Rapid manufacturing techniques (c7) Rapid manufacturing system (m7)
-------- Operator (m8)
-------- Delivery system (m9)
The application of rapid manufacturing approach has changed the system of design and
manufacture of custom foot orthoses. As mentioned in Section 2.3, fabrication process
in rapid manufacturing techniques use digital data which require the design of orthoses
in the digital format. For this purpose a digital foot scanning system (m3) and a CAD
system (m4) respectively are included as the mechanisms for performing the functions
of foot geometry capture and orthoses design. The foot scanning software (c4) and CAD
based orthoses designing software (c5) work as the controls and regulate and guide the
digital impression capturing and CAD based orthoses designing functions in the system.
Table 3.2 Controls and mechanisms in the system
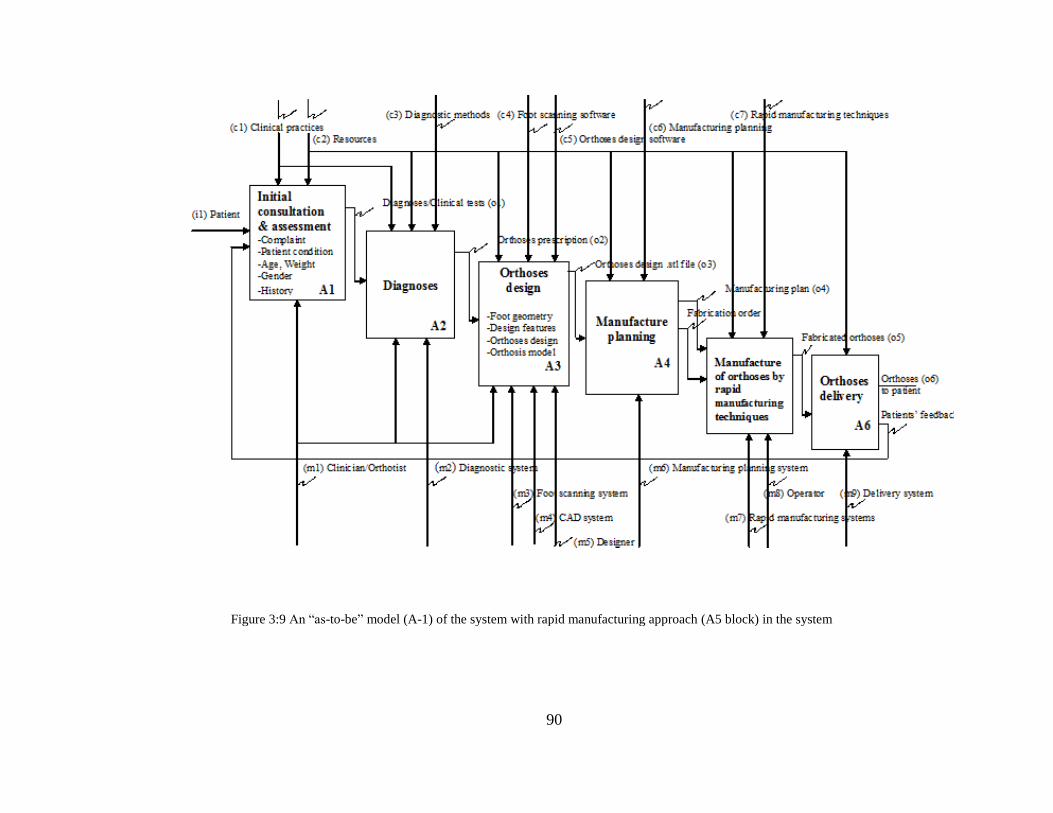
90
Figure 3:9 An “as-to-be” model (A-1) of the system with rapid manufacturing approach (A5 block) in the system
91
The developed IDEF0 based process models shown in Figure 3.8 and Figure 3.9
represents the “as-is” process model (A0) in its existing state and a proposed “as-to-be”
model (A-1) of the system. In both models, step (i) and step (ii) involve same functions.
However, in the proposed “as-to-be” model (A-1) the integration of rapid manufacturing
approach has changed the functions and activities in the step (iii) and step (iv) in the
system.
Step (iii) is the function of designing the orthoses (A3) in the “as-is” model (A-0) where
the traditional foot geometry capture function is replaced by the digital geometry capture
technique in which a 3D digital foot scanner is used. The function of orthoses design is
replaced by the CAD system where the orthoses is designed and modelled at one place
(i.e. through CAD system). This has removed the traditional manual laborious activities
in the functions of foot geometry capture and orthoses design.
In step (iv) in the “as-is” model (A-0), the applications of rapid manufacturing approach
reduces the traditional activities involved in the function of planning for the
manufacturing (A4). The traditional activities of process planning, in process inspection
and maintaining quality control requires relevant resources such as systems and software
and labour work in performing the function of planning for manufacturing (A3) in the
system. As discussed in the literature review in Section 2.3, rapid manufacturing
techniques directly fabricate the parts designed through CAD based systems. The
manufacturing preparation process (process planning) in rapid manufacturing techniques
is simple and straight forward. The rapid manufacturing fabrication process consist one
stage process chain; from product design to the final product. This reduces the need of
process planning, in process inspection and in process quality control in comparison to
traditional activities in function of planning for manufacturing in conventional
production systems.
The step (v) in “as-is” model (A-0), rapid manufacturing approach has replaced the
conventional manufacturing techniques such as computerised numerical controlled
(CNC) for manufacturing of the orthoses (A5). The conventional techniques include
92
both turning and milling operations. Based on the subtractive processes the techniques
have limitations in the fabrication of complex geometrical parts and structures (Frank et
al., 2003). Besides, the techniques require re-setting cutting tools for adjusting the
varying shapes and prescribed features in the orthoses.
The rapid manufacturing approach in the system has several advantages in improving
the design and manufacturing process for custom foot orthoses. The techniques are
based on the additive manufacturing processes where the parts are directly fabricated
from CAD based design information. This removes the requirement of tooling, moulds
and equipment in the manufacturing process (Kruth et al., 1998; Pham and Dimnov,
2001; Levy et al., 2003; Tuck and Hague, 2006). In conventional manufacturing
techniques, there is a direct link between complexity of the part and cost of
manufacturing. The ability of rapid manufacturing techniques in the fabrication of
complex geometrical parts reduces the manufacturing cost of the complex structured
parts. Rapid manufacturing techniques only require raw material and digital design of
parts in the fabrication process which minimise the requirements of high skilled
operators (Tuck and Hague, 2006).
3.7 Potential advantages of rapid manufacturing approach in the system.
The main advantages of rapid manufacturing approach in the design and manufacturing
process of custom foot orthoses identified are;
Reduced lead-time.
Reduced cost.
Improved foot orthoses.
Reduced lead-time
The digital foot geometry capture through digital scanning process is a quick method for
capturing 3D foot impression which reduces the time in foot impression capturing
process. The foot impression capturing time was reduced from 6 hours per pair in
traditional methods to 1 hour 5 minutes per pair in the digital design methods mentioned
in Section 4.2. The main advantage of the digital scanning process is increased accuracy
and repeatability in the foot impressions capturing process (Boardman, 2007; Payne,
93
2007; Williams, 2010). Additionally, the scanning technique generates the 3D foot
impressions in the digital format which can be easily stored and transferred
electronically to different places for the fabrication.
The design of the orthoses using the CAD based systems is another advantage which
improves the efficiency of the process and reduces the lead-time in the system. The
orthoses design time was reduced from 5 hours 45 minutes per pair in traditional
methods to 5 minutes per pair in digital methods mentioned in Section 4.5. The orthoses
corrections and modifications can be digitally incorporated through CAD based
designing system. The CAD system facilitates more control to the designer in designing
and integrating digitally the required features in the orthoses as compared to manual
incorporation of the design features in the orthoses. One of the main advantages of CAD
design system is the digital incorporation of the features in the orthoses such as wedges,
ramps, arch support and heel cupping which can be seen on the screen and viewed from
various angles until the final model of the orthoses is designed according to required
design prescription (Boardman, 2007; Williams, 2010).
Reduced cost.
The rapid manufacturing approach in the system generates the digital design and
manufacturing process for fabrication of custom foot orthoses. The use of various
equipment, tooling and materials combined with extensive labour work during the
different stages in fabrication of custom orthoses are replaced by digital design and
manufacturing process which subsequently improve the efficiency of the process and
increase the overall performance of the system.
In foot geometry capture process digital foot geometry capture method removes the
traditional labour and cost intensive geometry capturing method. The cost benefit
analysis study conducted by Payne (Payne, 2007) for foot impression casts through
plaster of Paris and optical scanning has shown significant reduction in the impression
capturing cost and lead-time through optical scanning. The impression capturing cost is
reduced from £98 per pair to £56 per pair as mentioned in Section 4.3. Additionally, the
digital scanning saves the cost for handling and storage of the foot impressions for the
94
future use as compared to traditional storage of plaster of Paris casts and other type of
impression casts.
In design stage of foot orthoses, the process involves CAD based designing system
which replaces the traditional methods of designing the orthoses in which the positive
moulds of the orthoses are developed from the negative casts involving labour work,
tooling and materials. The traditional method involves manual corrections,
modifications in designing the orthoses positive moulds (Madazahy, 2004). The manual
corrections and modifications process is replaced by CAD design system. This has
reduced the orthoses design cost from £18 per pair in conventional based methods to £2
per pair in digital based design method as mentioned in Section 4.6. In the fabrication
stage, conventional fabrication techniques require high skill labour which is a major
factor in increasing the manufacturing cost of the parts. However, in the rapid
manufacturing techniques the burden of high skill labour cost is transferred to the
technology itself i.e., the rapid manufacturing systems (Tuck and Hague, 2006). The
rapid manufacturing systems involve minimum human interferences during the
fabrication process due to the automated fabrication process and have the advantage of
minimal requirements of skills and labour of the operator in the operations of the
systems (Gibson et al., 2010). All these factors subsequently contribute in reducing the
high skilled labour costs and overall manufacturing costs in the system.
Improved foot orthoses.
The process involve digital techniques and digital systems in the design and
manufacturing process that will result in increased accuracy in measurements of the foot
geometry, digital incorporation of orthoses features reduces errors during the correction
and modifications process and digital fabrication minimise the part errors, subsequently
producing accurate and improved fit foot orthoses. The examples discussed in Section
2.3.5 of rapid manufacturing based hearing aids by Phonak and Siemens (Gibson et al.,
2010), Dental braces by Invisalign and Dental bridges and Dental crowns by Sirona
Dental Systems (Strub et al., 2006) have shown key advantages and benefits in terms of
improved fit, easy repeatability and increased product performance and comfort in
fabrication of custom made parts in comparison with the traditional fabrication process.
95
3.8 Summary
The rapid manufacturing based “as-to-be” process model (A-1) in Figure 3.9 shows that
rapid manufacturing approach have significant advantages in the system especially in
reducing the labour intensive time and cost activities. The rapid manufacturing
techniques can be integrated in order to automate the system of design and fabrication of
custom foot orthoses. The proposed “as-to-be” model is designed to integrate the rapid
manufacturing approach in the system that will subsequently facilitate in improving the
efficiency of the process and the clinical services to the patients.
The main functions in the proposed design and fabrication process model are based on
digital foot geometry capturing, CAD based orthoses designing and digital fabrication
through rapid manufacturing techniques. This results in development of a seamless
digital design and manufacturing process for fabrication of customised foot orthoses.
Overall, the automated fabrication process in rapid manufacturing systems without the
need of tooling and equipments, continuous fabrication process, minimal involvement of
labour and increased accuracy in the part development are the potential advantages and
benefits of the rapid manufacturing approach in the design and fabrication of system for
customised foot orthoses. The developed rapid manufacturing based “as-to-be” process
model (A-1) will be used for the development of an automated, cost effective system
with low lead-time for fabrication of custom foot orthoses. The main functions shown in
“as-to-be” process model (A-1) of the system will be investigated and evaluated in detail
in terms of cost, lead-time, efficiency of the individual functions and activities and their
effects on performance of the overall system.
96
Chapter 4 Foot geometry capture and orthoses design methods.
4.1 Introduction.
In this chapter, assessment of foot geometry capture and orthoses design methods is
presented. The efficiency, accuracy and reliability of different foot geometry capture
and orthoses design methods are analysed and evaluated. The time and cost involved in
using different foot geometry capturing and orthoses design methods for a pair of
orthoses are modelled, evaluated and compared. At the end of chapter, the overall
advantages and significance of the applications of 3D digital scanning method for foot
geometry capture and design of orthoses using CAD system is discussed.
4.2 Time modelling of different foot geometry capture methods
Foot geometry capture time for different methods was gathered first hand by industry
visits to four different orthotic manufacturers. (i) Peacocks Medical group, Newcastle
UK, (ii) London Orthotics Consultancy UK, (iii) The Foot Clinic UK and (iv) The Barn
Podiatry Clinic UK. Geometry capture time was cross-checked among those
manufacturers using a similar manufacturing process for custom foot orthoses. The
information regarding foot geometry capture time and orthoses design time was further
discussed with USA based orthotic manufacturer and suppliers, Seamus Kennedy, from
Hersco Ortho Labs, USA and Melanie Shelton, Amfit, Inc, USA; through personal
communication. Data obtained covers both geometry capture and orthoses design times.
The time required in different foot geometry capture methods was approximated through
considering the time made up of (i) time required for assessment of one pair of feet by
the podiatrist and (ii) time required in foot geometry capture process. In the following
sections, modelling of the time required in different foot geometry capture methods is
analysed and modelled.
4.2.1 Time in plaster of Paris based foot geometry capture method.
The steps involved in using plaster of Paris to obtain the foot impression casts are (i)
assessment of the feet, (ii) impression casting and (iii) drying and curing of the
impression cast. Step (i) approximately takes 1 hour of time and is assumed to involve a
podiatrist. The assessment time was obtained through personal communication with
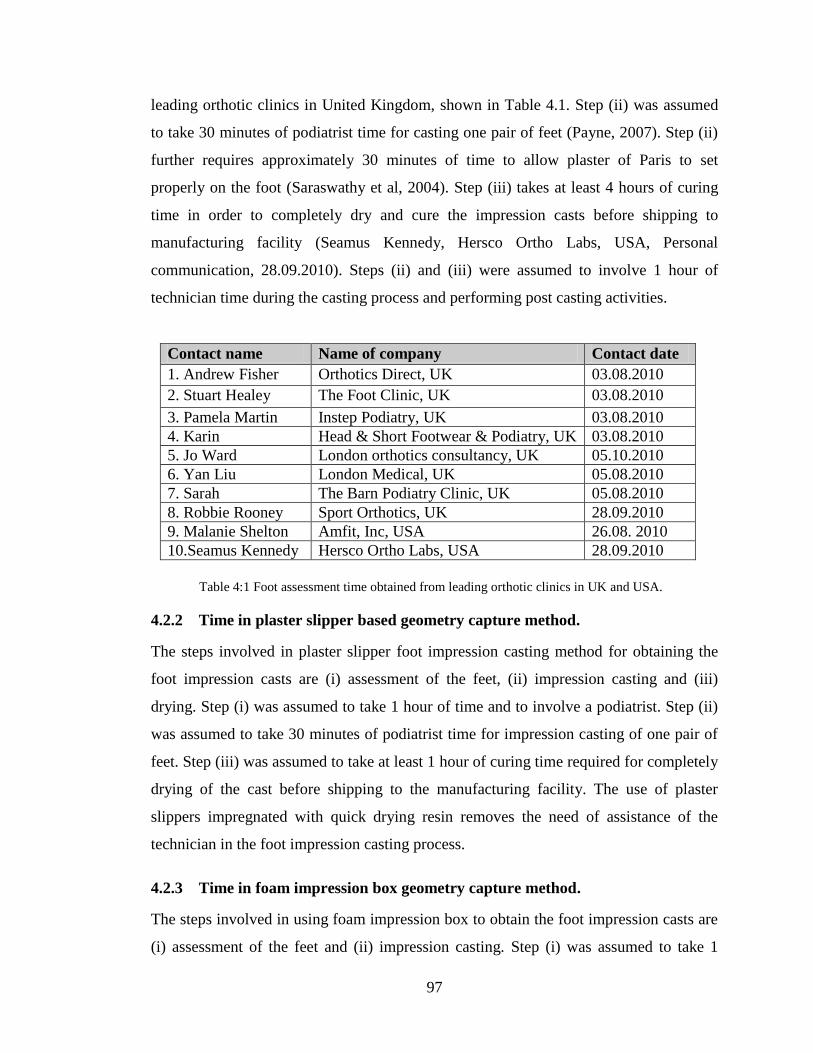
97
leading orthotic clinics in United Kingdom, shown in Table 4.1. Step (ii) was assumed
to take 30 minutes of podiatrist time for casting one pair of feet (Payne, 2007). Step (ii)
further requires approximately 30 minutes of time to allow plaster of Paris to set
properly on the foot (Saraswathy et al, 2004). Step (iii) takes at least 4 hours of curing
time in order to completely dry and cure the impression casts before shipping to
manufacturing facility (Seamus Kennedy, Hersco Ortho Labs, USA, Personal
communication, 28.09.2010). Steps (ii) and (iii) were assumed to involve 1 hour of
technician time during the casting process and performing post casting activities.
Contact name Name of company Contact date
1. Andrew Fisher Orthotics Direct, UK 03.08.2010
2. Stuart Healey The Foot Clinic, UK 03.08.2010
3. Pamela Martin Instep Podiatry, UK 03.08.2010
4. Karin Head & Short Footwear & Podiatry, UK 03.08.2010
5. Jo Ward London orthotics consultancy, UK 05.10.2010
6. Yan Liu London Medical, UK 05.08.2010
7. Sarah The Barn Podiatry Clinic, UK 05.08.2010
8. Robbie Rooney Sport Orthotics, UK 28.09.2010
9. Malanie Shelton Amfit, Inc, USA 26.08. 2010
10.Seamus Kennedy Hersco Ortho Labs, USA 28.09.2010
4.2.2 Time in plaster slipper based geometry capture method.
The steps involved in plaster slipper foot impression casting method for obtaining the
foot impression casts are (i) assessment of the feet, (ii) impression casting and (iii)
drying. Step (i) was assumed to take 1 hour of time and to involve a podiatrist. Step (ii)
was assumed to take 30 minutes of podiatrist time for impression casting of one pair of
feet. Step (iii) was assumed to take at least 1 hour of curing time required for completely
drying of the cast before shipping to the manufacturing facility. The use of plaster
slippers impregnated with quick drying resin removes the need of assistance of the
technician in the foot impression casting process.
4.2.3 Time in foam impression box geometry capture method.
The steps involved in using foam impression box to obtain the foot impression casts are
(i) assessment of the feet and (ii) impression casting. Step (i) was assumed to take 1
Table 4:1 Foot assessment time obtained from leading orthotic clinics in UK and USA.
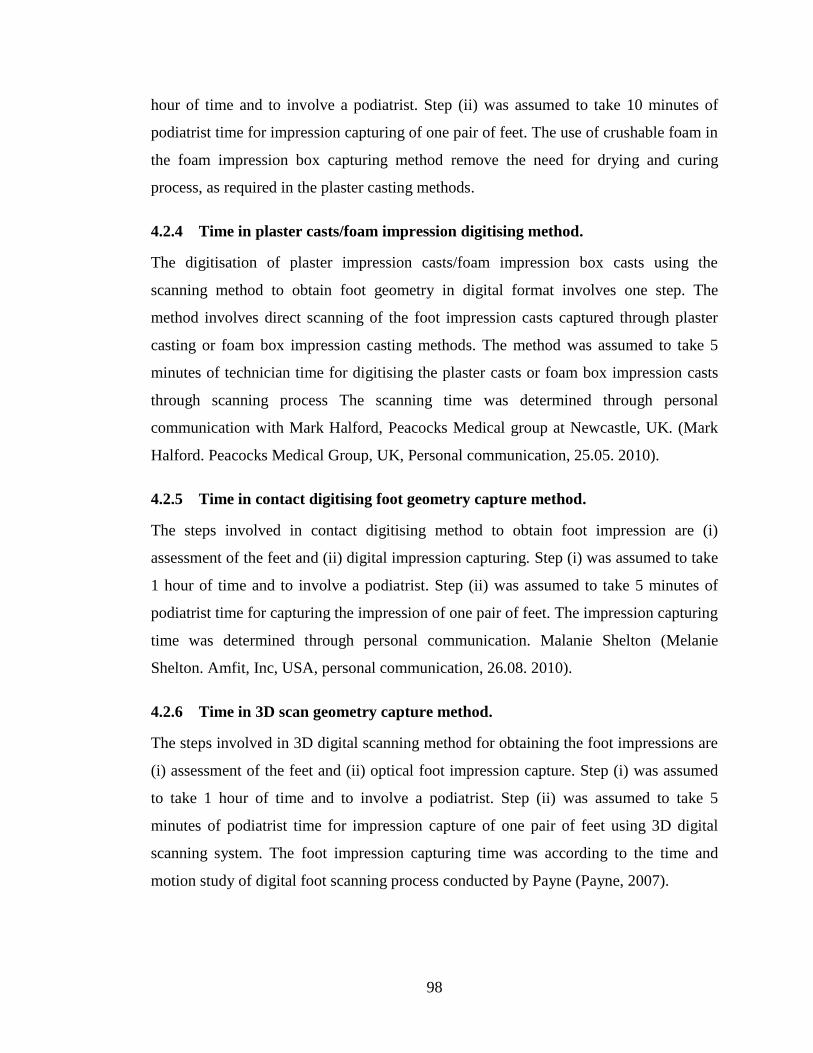
98
hour of time and to involve a podiatrist. Step (ii) was assumed to take 10 minutes of
podiatrist time for impression capturing of one pair of feet. The use of crushable foam in
the foam impression box capturing method remove the need for drying and curing
process, as required in the plaster casting methods.
4.2.4 Time in plaster casts/foam impression digitising method.
The digitisation of plaster impression casts/foam impression box casts using the
scanning method to obtain foot geometry in digital format involves one step. The
method involves direct scanning of the foot impression casts captured through plaster
casting or foam box impression casting methods. The method was assumed to take 5
minutes of technician time for digitising the plaster casts or foam box impression casts
through scanning process The scanning time was determined through personal
communication with Mark Halford, Peacocks Medical group at Newcastle, UK. (Mark
Halford. Peacocks Medical Group, UK, Personal communication, 25.05. 2010).
4.2.5 Time in contact digitising foot geometry capture method.
The steps involved in contact digitising method to obtain foot impression are (i)
assessment of the feet and (ii) digital impression capturing. Step (i) was assumed to take
1 hour of time and to involve a podiatrist. Step (ii) was assumed to take 5 minutes of
podiatrist time for capturing the impression of one pair of feet. The impression capturing
time was determined through personal communication. Malanie Shelton (Melanie
Shelton. Amfit, Inc, USA, personal communication, 26.08. 2010).
4.2.6 Time in 3D scan geometry capture method.
The steps involved in 3D digital scanning method for obtaining the foot impressions are
(i) assessment of the feet and (ii) optical foot impression capture. Step (i) was assumed
to take 1 hour of time and to involve a podiatrist. Step (ii) was assumed to take 5
minutes of podiatrist time for impression capture of one pair of feet using 3D digital
scanning system. The foot impression capturing time was according to the time and
motion study of digital foot scanning process conducted by Payne (Payne, 2007).
99
Foot impression
casting method
Required time/pair
(Assessment + casting)
Total
Time/pair
Transportation
Time for casts
Plaster of Paris casting
-1 hour and 30 minutes
-30 minutes for setting
-4 hours for cure time
6 hours
24 to 48 hours
through courier.
Plaster slipper casting -1 hour and 30 minutes
-1 hour cure time
2 hours and
30 minutes
24 to 48 hours
through courier
Foam impression box -1 hour
-10 minutes
1 hour and
10 minutes
24 to 48 hours
through courier
Digitisation of
plaster/foam box casts
-1 hour
-5 minutes.
1 hour and
5 minutes
24 to 48 hours
through courier
Contact digitising -1 hour
-5 minutes
1 hour and
5 minutes
Electronic
3D scanning -1 hour
-5 minutes
1 hour and
5 minutes
Electronic
Table 4.2 shows that the traditional foot impression capturing methods involve increased
time to obtain the foot impression casts. The plaster of Paris casting method is labour
intensive and involves manual activities in the casting process which results in increased
casting time. Additionally, the methods require curing time and handling and
transportation time for shipment of casts to the manufacturing facility. The plaster
slipper casting method also involves manual activities in the impression capturing
process and requires curing and physical transportation time for sending the casts to the
manufacturing facility. In the foam box impression method the impression capturing
time is lower than the plaster casting methods, as the method does not involve any
liquids in the impression capturing process. However, the foam impression box casting
method involves manual activities which increase the impression casting time.
Additionally, the method requires transportation time for sending the foam impression
box casts to the manufacturing facility.
Table 4:2 Time required in different foot geometry capture methods
100
The digitising of plaster casts and foam impression box using a scanning system involve
5 minutes of time in digitising the impression casts. However, the plaster impression
casts and foam impression box casts consume significant amount of time in obtaining
the foot impressions and the method requires additional time for shipment of the casts to
the manufacturing facility.
The contact digitising method involves three steps process to obtain the foot
impressions, which are (i) pin-up, (ii) lock and (iii) digitisation. In the first step, the
mechanical pins are allowed to move upward in order to completely come in contact
with plantar surface of the foot. In the next step, the mechanical moving pins are locked
at the same position. In the third step, the positions of the pins are scanned in order to
capture the digital impression of the foot. Although the contact digitisation method takes
5 minutes of time in obtaining the impressions of the feet and has the advantages of
eliminating the manual activities and transportation time. However, the contact digitisers
have limitations in capturing the posterior heel of the foot and it only captures the
geometry of the plantar of the foot (Huppin, 2009).
The optical means for capturing the foot geometry in 3D scanning eliminates the labour
work and other manual activities. The impression capturing is performed through direct
scanning of the feet. The impression capturing process takes approximately 5 minutes of
time per pair. The 3D optical scanning method is simple and one step process which
significantly contribute in reducing the impression capturing time and eliminates the
time for shipment and transportation of the casts.
4.3 Cost modelling of different foot geometry capture methods
The cost modelling of the different foot geometry capturing methods were approximated
through considering the cost as made up of (i) cost of podiatrist labour time (ii) cost of
technician labour time, (iii) cost of materials consumed and (iv) cost of equipment. The
following costs were assumed in the cost modelling of foot geometry capture methods.
Podiatrist labour cost: £50 per hour (Payne, 2007).
Technician labour cost: £20 per hour (Peacocks Medical Group, UK, 2010).
101
Plaster of Paris casting: £3 per pair (Payne, 2007)
Plaster slipper casting: £4 per pair (STS Company, Synthetic Tubular Sock
Impression Products, USA).
Foam box impression casting: £2 per pair (A. Algeo Ltd, UK).
Cost of plaster/foam impression box scanning system: £5150 (Amfit Inc, USA).
Cost of contact digitiser system: £10,000 (Amfit Inc, USA).
Cost of 3D scanning system: £10,000 (Precision 3D Limited, UK).
The costs for podiatrist labour time and plaster of Paris foot impression casting was
adopted form the work of Payne (Payne, 2007) in his work for “cost benefit comparison
of plaster casts and optical scans of the foot for manufacture of foot orthoses”. Labour
cost per hour for the technician was obtained from Peacocks Medical Group, UK. The
cost for Plaster slipper socks and foam box impression were obtained from generic
orthotic material suppliers STS Company, Synthetic Tubular Sock Impression Products,
USA and A. Algeo Ltd, UK, respectively. The cost for plaster/foam impression box
scanning system, contact digitising system and 3D scanning system were obtained
through email communication with Amfit Inc, USA and Precision 3D Limited, UK as
their selling price for the equipment, materials and systems.
4.3.1 Cost in plaster of Paris based foot geometry capture method.
In the foot geometry capture method using plaster of Paris, the assessment of one pair of
feet was assumed to take 1 hour of podiatrist time for assessment followed by the 30
minutes of time in the impression capturing process. This makes the podiatrist labour
cost at the rate of £75 per pair in the process. The cost of consumables in the plaster of
Paris casting was approximated at £3 per pair (Payne, 2007). The method also require 1
hour of time of technician labour at the rate of £20 per hour for assisting the podiatrist in
the impression capturing process and packaging and shipment the impression casts to
the manufacturing faculty. The total impression capturing cost using plaster of Paris
geometry capturing method is approximated at £98 per pair.
102
4.3.2 Cost in plaster slipper based foot geometry capture method.
In the plaster slipper geometry capturing method, the assessment of one pair of feet was
assumed to take 1 hour podiatrist time followed by the 30 minutes of time in the
impression capturing process. This makes the podiatrist labour cost in the process at the
rate of £75 per pair. The cost of consumables in the plaster slipper casting was
approximated at £4 per pair (STS Company, Synthetic Tubular Sock Impression
Products, USA, 2010). The total impression capturing cost using plaster slipper
geometry capturing method was approximated at £79 per pair.
4.3.3 Cost in foam box impression based foot geometry capture method.
In the foam box impression geometry capturing method, the assessment of one pair of
feet was assumed to take 1 hour of podiatrist time followed by the 10 minutes of time in
foot impression capturing process. This makes the podiatrist labour cost in the process at
the rate of £58 per pair. The cost of the consumables was approximated at £2 per pair
(A. Algeo Ltd, UK, 2010). The total impression capturing cost using foam impression
box geometry capture method was approximated at £60 per pair.
4.3.4 Cost in digitisation of plaster casts and foam impression box method
The digitisation of the plaster and foam impression box casts is assumed to involve less
time in the foot geometry capture process. However, the plaster casts and foam box
impression casts consume significant amount of time and cost in obtaining the plaster
based and foam box based foot impression casts. The digitisation of the impression casts
was assumed to take 5 minutes of technician time at the rate of £2 per pair. The
technique does not involve any physical material in the digitisation of the impression
casts. The method involves one-off cost of £5000 for the digitisation system (Amfit Inc,
USA, 2010). The annual depreciation cost for digitising system is assumed at the rate of
£1000 per year, considering the 5 years as a life span for digitising system. As the
digitisation of one pair of impression casts takes 5 minutes of time, it is assumed that
based on 220 working days per year 21120 pairs per year can be digitised at the
depreciation cost of £1000 per year. This makes the digitisation cost per pair negligible
in the process. The total digitisation cost for the plaster of Paris, plaster slipper and foam
impression box casts were approximated at £100, £81 and £60 per pair, respectively.
103
The cost includes the impression capturing cost through plaster casting and foam
impression box casting methods and the cost for digitisation of one pair of impression
casts.
4.3.5 Cost in contact digitisation based geometry capture method
The contact digitisation method involve less time in the impression capturing process.
The digitisation of one pair of feet takes 5 minutes of time and assumed to involve
podiatrist labour cost at the rate of £5 per pair in the process. The contact digitisation
technique does not involve any physical material in the impression capturing process;
however, the method involves one-off cost of £10,000 for the contact digitising system
(Amfit Inc, USA, 2010). The annual depreciation cost for a contact digitising system is
assumed at the rate of £2000 per year, considering the 5 years life span for a contact
digitiser system. As the assessment of one pair of the feet is assumed to take 1 hour of
time, the orthotist can assess 1760 patients per year based on 220 working days per year.
At the depreciation cost of £2000 per year, 1760 pairs per year can be digitised, which
makes the impression capture cost approximately at the rate of £1 per pair. The total
impression capturing cost in the contact digitisation method is approximated at £56 per
pair which includes the assessment, foot impression capturing and equipment costs.
4.3.6 Cost in 3D scan based foot geometry capture method
The 3D digital scanning for foot geometry capturing is quick process and involve less
time in impression capturing. The scanning of one pair of feet takes 5 minutes of time
and assumed to involve podiatrist labour cost at the rate of £5 per pair. The technique
involves one-off cost of £10,000 for the scanning system (Precision 3D Limited, UK,
2010). The annual depreciation cost for a 3D digital scanner was assumed at the rate of
£2000 per year, considering the 5 years life span for a 3D digital scanner. As the
assessment of one pair of feet is assumed to take 1 hour of time, the orthotist can assess
1760 patients per year, based on the 220 working days per year. At the depreciation cost
of £2000 per year, 1760 pairs per year can be scanned using the 3D digital scanner. This
makes the impression capture cost approximately at the rate of £1 per pair. The total
impression capturing cost in the 3D digital scanning method was approximated at £56
per pair which includes the assessment, impression capturing and equipment costs.
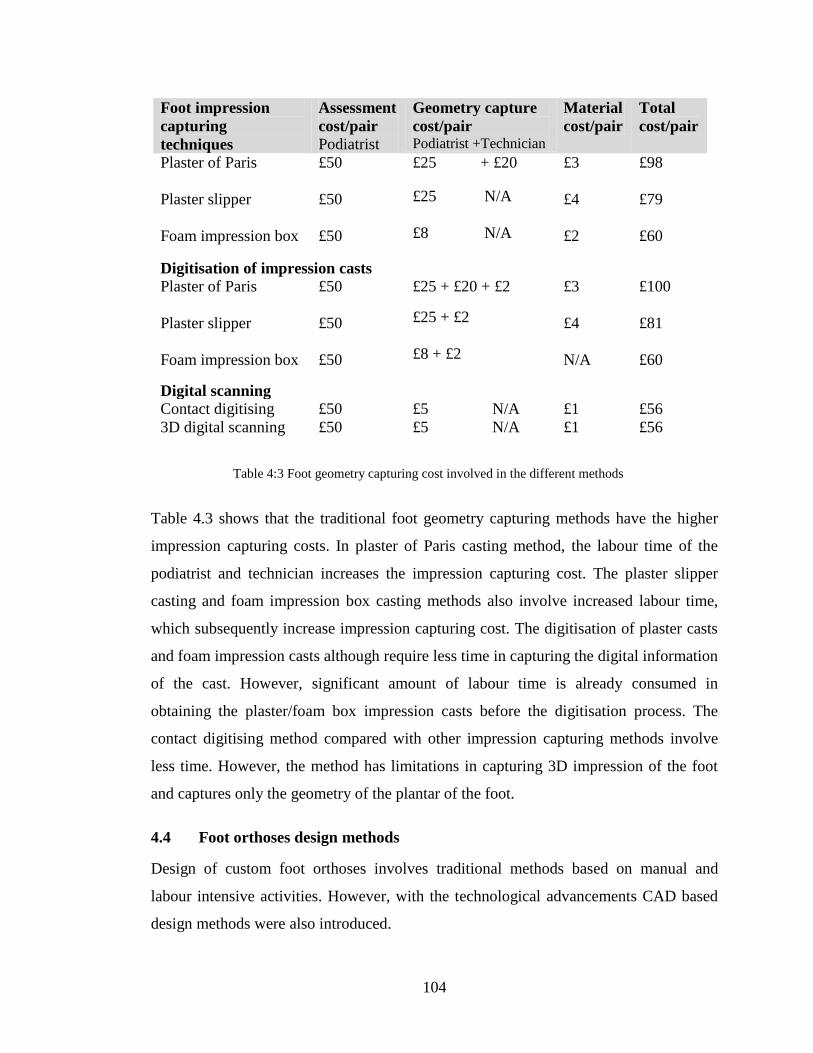
104
Table 4.3 shows that the traditional foot geometry capturing methods have the higher
impression capturing costs. In plaster of Paris casting method, the labour time of the
podiatrist and technician increases the impression capturing cost. The plaster slipper
casting and foam impression box casting methods also involve increased labour time,
which subsequently increase impression capturing cost. The digitisation of plaster casts
and foam impression casts although require less time in capturing the digital information
of the cast. However, significant amount of labour time is already consumed in
obtaining the plaster/foam box impression casts before the digitisation process. The
contact digitising method compared with other impression capturing methods involve
less time. However, the method has limitations in capturing 3D impression of the foot
and captures only the geometry of the plantar of the foot.
4.4 Foot orthoses design methods
Design of custom foot orthoses involves traditional methods based on manual and
labour intensive activities. However, with the technological advancements CAD based
design methods were also introduced.
Foot impression
capturing
techniques
Assessment
cost/pair
Podiatrist
Geometry capture
cost/pair Podiatrist +Technician
Material
cost/pair
Total
cost/pair
Plaster of Paris
Plaster slipper
Foam impression box
£50
£50
£50
£25 + £20
£25 N/A
£8 N/A
£3
£4
£2
£98
£79
£60
Digitisation of impression casts Plaster of Paris
Plaster slipper
Foam impression box
£50
£50
£50
£25 + £20 + £2
£25 + £2
£8 + £2
£3
£4
N/A
£100
£81
£60
Digital scanning
Contact digitising £50 £5 N/A £1 £56
3D digital scanning £50 £5 N/A £1 £56
Table 4:3 Foot geometry capturing cost involved in the different methods
105
4.4.1 Plaster based foot orthoses design methods
Traditionally, orthoses design has been based on physically modifying the casts of the
feet. The process requires development of a positive model of the impression cast using
the plaster of Paris powder. The positive model is developed from negative impression
cast, obtained through plaster casting method or foam impression box casting method
(Hunter et al, 1995; Madazhy, 2004), as described in Section 2.4.6.
4.4.2 Steps in plaster based design method
The plaster based orthoses design process is based on two steps; (i) development of the
positive model from negative impression cast and (ii) incorporation of design features in
the positive model. Step (i) requires developing a positive mould by casting the plaster
of Paris in the negative impression casts; creating a master model (Staats and
Kriechbaum, 1989). The developed master model is then modified and corrected in
order to incorporate the required design features such as adding wedges, arch height,
ramps, heel lift/cupping, met pads etc to create the orthosis over it (Hunter, et al, 1995;
Lasurdi and Nielson, 2000).
4.4.3 Digital based foot orthoses design methods
Digital based design process uses the CAD techniques in the orthoses design that has
better efficiency, time and cost saving in the orthoses design process (Staats and
Kriechbaum, 1989; Boardman, 2007, Williams, 2010). The CAD based design
techniques remove the manual activities and minimises the labour work; as required in
the plaster based designing methods.
4.4.4 Steps in digital based design methods
Digital based orthoses design is based on one step process in which a digital
representation of the foot impressions/casts is used for designing the orthoses through
CAD system. The orthoses design features such as wedges, ramps, arch support, met
pads and heel lift/cupping are digitally incorporated in the digital representation of foot
impression/casts using the specific orthosis design software.
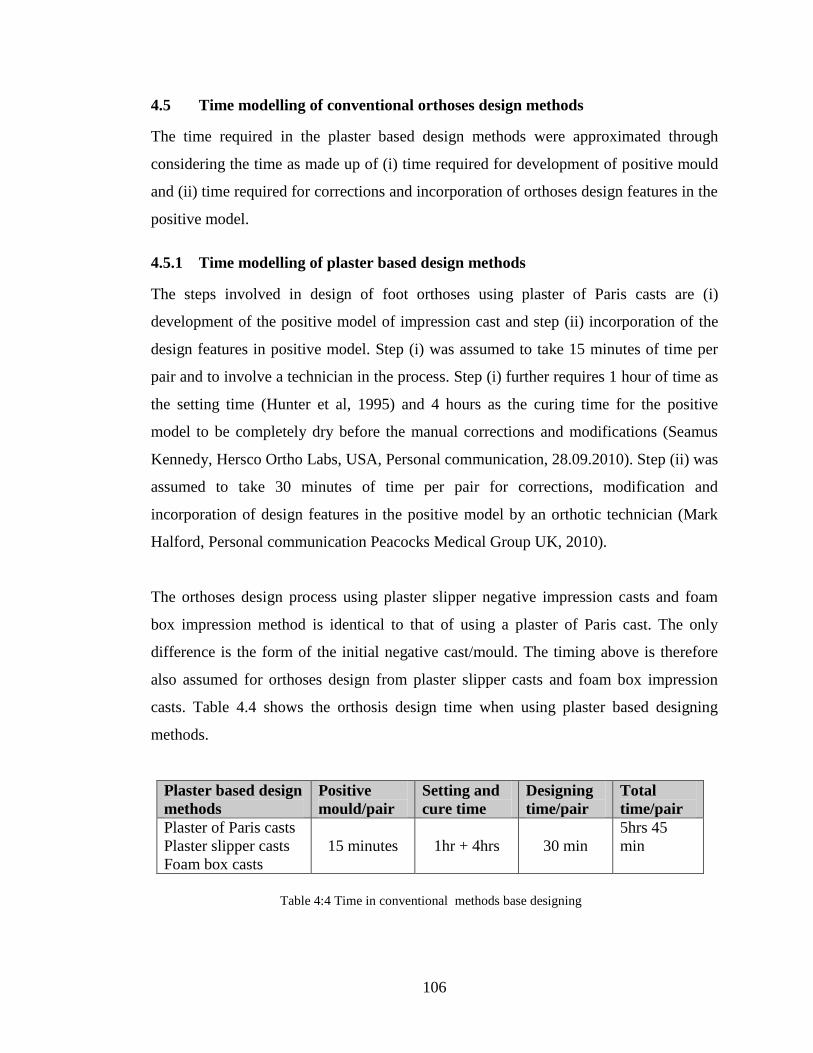
106
4.5 Time modelling of conventional orthoses design methods
The time required in the plaster based design methods were approximated through
considering the time as made up of (i) time required for development of positive mould
and (ii) time required for corrections and incorporation of orthoses design features in the
positive model.
4.5.1 Time modelling of plaster based design methods
The steps involved in design of foot orthoses using plaster of Paris casts are (i)
development of the positive model of impression cast and step (ii) incorporation of the
design features in positive model. Step (i) was assumed to take 15 minutes of time per
pair and to involve a technician in the process. Step (i) further requires 1 hour of time as
the setting time (Hunter et al, 1995) and 4 hours as the curing time for the positive
model to be completely dry before the manual corrections and modifications (Seamus
Kennedy, Hersco Ortho Labs, USA, Personal communication, 28.09.2010). Step (ii) was
assumed to take 30 minutes of time per pair for corrections, modification and
incorporation of design features in the positive model by an orthotic technician (Mark
Halford, Personal communication Peacocks Medical Group UK, 2010).
The orthoses design process using plaster slipper negative impression casts and foam
box impression method is identical to that of using a plaster of Paris cast. The only
difference is the form of the initial negative cast/mould. The timing above is therefore
also assumed for orthoses design from plaster slipper casts and foam box impression
casts. Table 4.4 shows the orthosis design time when using plaster based designing
methods.
Plaster based design
methods
Positive
mould/pair
Setting and
cure time
Designing
time/pair
Total
time/pair
Plaster of Paris casts
Plaster slipper casts
Foam box casts
15 minutes
1hr + 4hrs
30 min
5hrs 45
min
Table 4:4 Time in conventional methods base designing
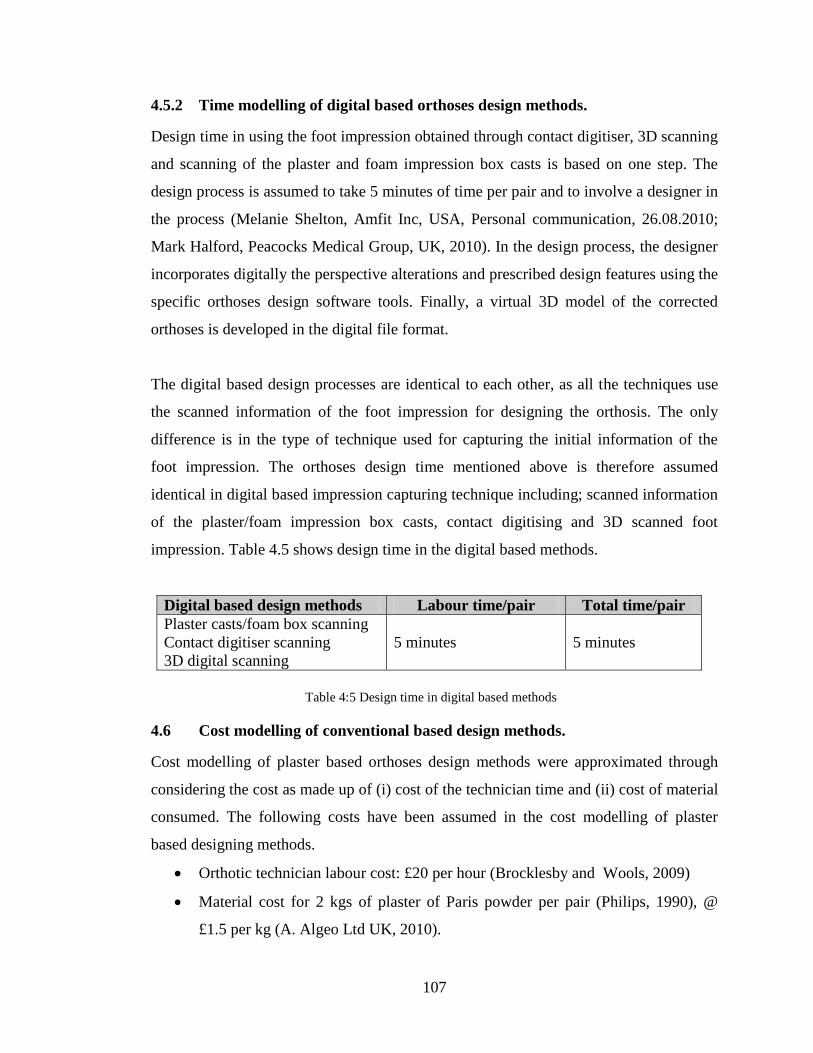
107
4.5.2 Time modelling of digital based orthoses design methods.
Design time in using the foot impression obtained through contact digitiser, 3D scanning
and scanning of the plaster and foam impression box casts is based on one step. The
design process is assumed to take 5 minutes of time per pair and to involve a designer in
the process (Melanie Shelton, Amfit Inc, USA, Personal communication, 26.08.2010;
Mark Halford, Peacocks Medical Group, UK, 2010). In the design process, the designer
incorporates digitally the perspective alterations and prescribed design features using the
specific orthoses design software tools. Finally, a virtual 3D model of the corrected
orthoses is developed in the digital file format.
The digital based design processes are identical to each other, as all the techniques use
the scanned information of the foot impression for designing the orthosis. The only
difference is in the type of technique used for capturing the initial information of the
foot impression. The orthoses design time mentioned above is therefore assumed
identical in digital based impression capturing technique including; scanned information
of the plaster/foam impression box casts, contact digitising and 3D scanned foot
impression. Table 4.5 shows design time in the digital based methods.
Digital based design methods Labour time/pair Total time/pair
Plaster casts/foam box scanning
Contact digitiser scanning
3D digital scanning
5 minutes
5 minutes
4.6 Cost modelling of conventional based design methods.
Cost modelling of plaster based orthoses design methods were approximated through
considering the cost as made up of (i) cost of the technician time and (ii) cost of material
consumed. The following costs have been assumed in the cost modelling of plaster
based designing methods.
Orthotic technician labour cost: £20 per hour (Brocklesby and Wools, 2009)
Material cost for 2 kgs of plaster of Paris powder per pair (Philips, 1990), @
£1.5 per kg (A. Algeo Ltd UK, 2010).
Table 4:5 Design time in digital based methods
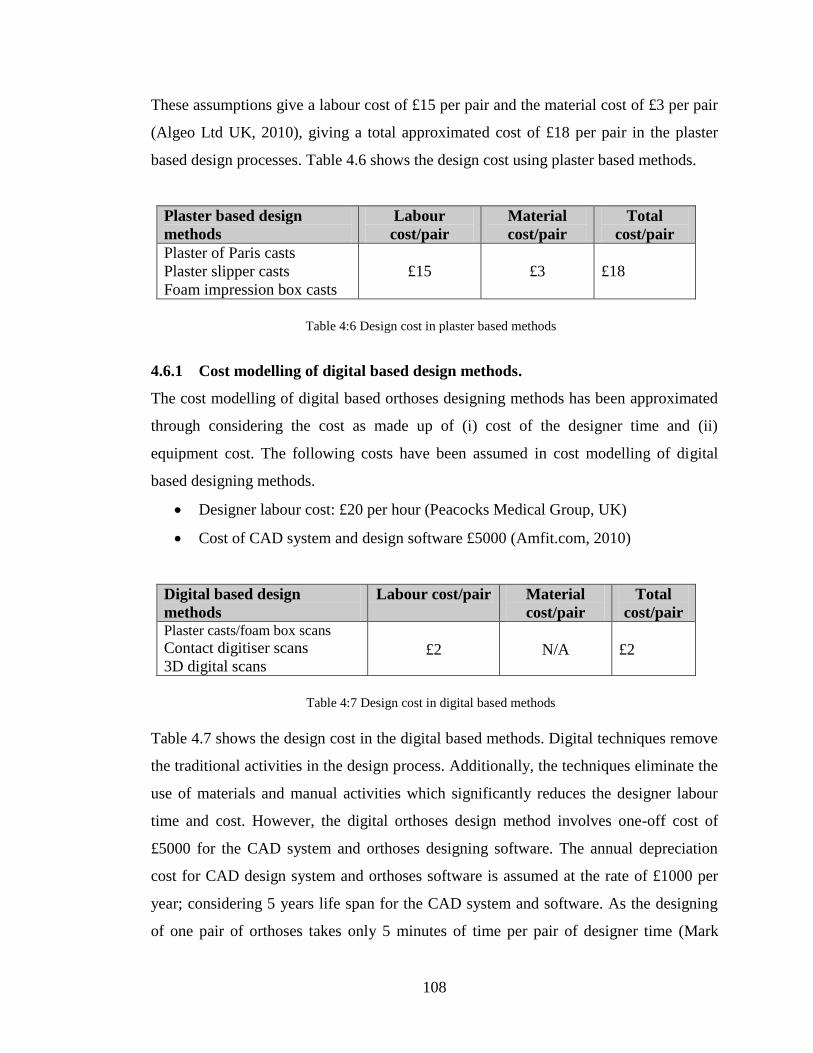
108
These assumptions give a labour cost of £15 per pair and the material cost of £3 per pair
(Algeo Ltd UK, 2010), giving a total approximated cost of £18 per pair in the plaster
based design processes. Table 4.6 shows the design cost using plaster based methods.
Plaster based design
methods
Labour
cost/pair
Material
cost/pair
Total
cost/pair
Plaster of Paris casts
Plaster slipper casts
Foam impression box casts
£15
£3
£18
4.6.1 Cost modelling of digital based design methods.
The cost modelling of digital based orthoses designing methods has been approximated
through considering the cost as made up of (i) cost of the designer time and (ii)
equipment cost. The following costs have been assumed in cost modelling of digital
based designing methods.
Designer labour cost: £20 per hour (Peacocks Medical Group, UK)
Cost of CAD system and design software £5000 (Amfit.com, 2010)
Digital based design
methods
Labour cost/pair Material
cost/pair
Total
cost/pair Plaster casts/foam box scans
Contact digitiser scans
3D digital scans
£2
N/A
£2
Table 4.7 shows the design cost in the digital based methods. Digital techniques remove
the traditional activities in the design process. Additionally, the techniques eliminate the
use of materials and manual activities which significantly reduces the designer labour
time and cost. However, the digital orthoses design method involves one-off cost of
£5000 for the CAD system and orthoses designing software. The annual depreciation
cost for CAD design system and orthoses software is assumed at the rate of £1000 per
year; considering 5 years life span for the CAD system and software. As the designing
of one pair of orthoses takes only 5 minutes of time per pair of designer time (Mark
Table 4:6 Design cost in plaster based methods
Table 4:7 Design cost in digital based methods
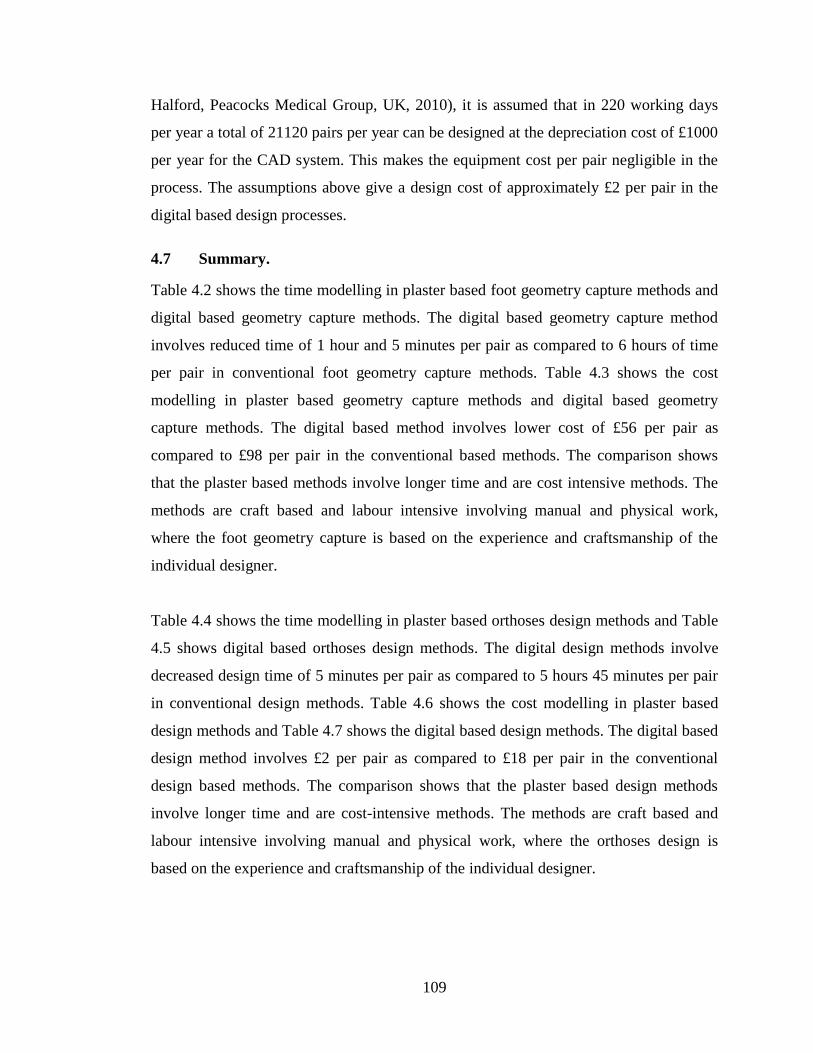
109
Halford, Peacocks Medical Group, UK, 2010), it is assumed that in 220 working days
per year a total of 21120 pairs per year can be designed at the depreciation cost of £1000
per year for the CAD system. This makes the equipment cost per pair negligible in the
process. The assumptions above give a design cost of approximately £2 per pair in the
digital based design processes.
4.7 Summary.
Table 4.2 shows the time modelling in plaster based foot geometry capture methods and
digital based geometry capture methods. The digital based geometry capture method
involves reduced time of 1 hour and 5 minutes per pair as compared to 6 hours of time
per pair in conventional foot geometry capture methods. Table 4.3 shows the cost
modelling in plaster based geometry capture methods and digital based geometry
capture methods. The digital based method involves lower cost of £56 per pair as
compared to £98 per pair in the conventional based methods. The comparison shows
that the plaster based methods involve longer time and are cost intensive methods. The
methods are craft based and labour intensive involving manual and physical work,
where the foot geometry capture is based on the experience and craftsmanship of the
individual designer.
Table 4.4 shows the time modelling in plaster based orthoses design methods and Table
4.5 shows digital based orthoses design methods. The digital design methods involve
decreased design time of 5 minutes per pair as compared to 5 hours 45 minutes per pair
in conventional design methods. Table 4.6 shows the cost modelling in plaster based
design methods and Table 4.7 shows the digital based design methods. The digital based
design method involves £2 per pair as compared to £18 per pair in the conventional
design based methods. The comparison shows that the plaster based design methods
involve longer time and are cost-intensive methods. The methods are craft based and
labour intensive involving manual and physical work, where the orthoses design is
based on the experience and craftsmanship of the individual designer.
110
The digital based foot geometry capture and CAD based orthoses design methods have
the additional advantages of increased accuracy, reliability and repeatability if
necessary. Holding 3D foot geometry and CAD based orthoses designs in digital format
also reduces the time and cost required for storage and handling of casts and designed
orthoses. Based on the number of factors mentioned, it is concluded that digital based
geometry capture and CAD based orthoses design offer significant benefits to the
industry. However, for these to be realised, the downstream processes in fabrication of
foot orthoses must be capable of operating with digital information.
111
Chapter 5 Foot orthoses fabrication methods
5.1 Introduction
In this chapter build-time and material consumption in fabrication of custom foot
orthosis model through different rapid manufacturing techniques is presented.
Commercially established rapid manufacturing techniques including (i) Fused
deposition modelling (FDM) using Dimension SST 768 system and uPrint system by
Stratasys, Inc, USA, (ii) PolyJet 3DP using ConnexTM
500 system by Objet Geometries,
Israel, (iii) Stereolithography using ipro 8000 SLA system, (iv) V-Flash 3D system and
(v) Selective laser sintering using spro SD 60 SLS system by 3D systems Inc. USA, for
fabrication of foot orthosis model.
5.2 Selection of rapid manufacturing techniques for orthoses fabrication
The selection of rapid manufacturing techniques for fabrication of foot orthoses was
based on various medical applications of RM techniques discussed in Section 2.3.4 for
fabrication of surgical and diagnostic aids, tissue engineering and scaffolds, prosthetic
fabrication and medical models (Gibson et al, 2010, Wohlers, 2010). The significant
advantages of the rapid manufacturing techniques are; ease in the fabrication of custom-
specific complex geometrical parts and devices, increased accuracy and consistency in
final parts with the additional advantage of repeatability for custom-specific
personalised parts and products.
5.2.1 Requirement of the process
Low lead-time as the objective is to get custom made orthoses within 24 hours of
time after initial foot assessment process and prescription of orthoses.
Fabrication of complex orthoses design features with increased accuracy, and
consistency.
Established and seamless manufacturing process to minimise complications in
the production.
Increased automation in design and fabrication process.
Reduced finishing and trimming time and manual labour.
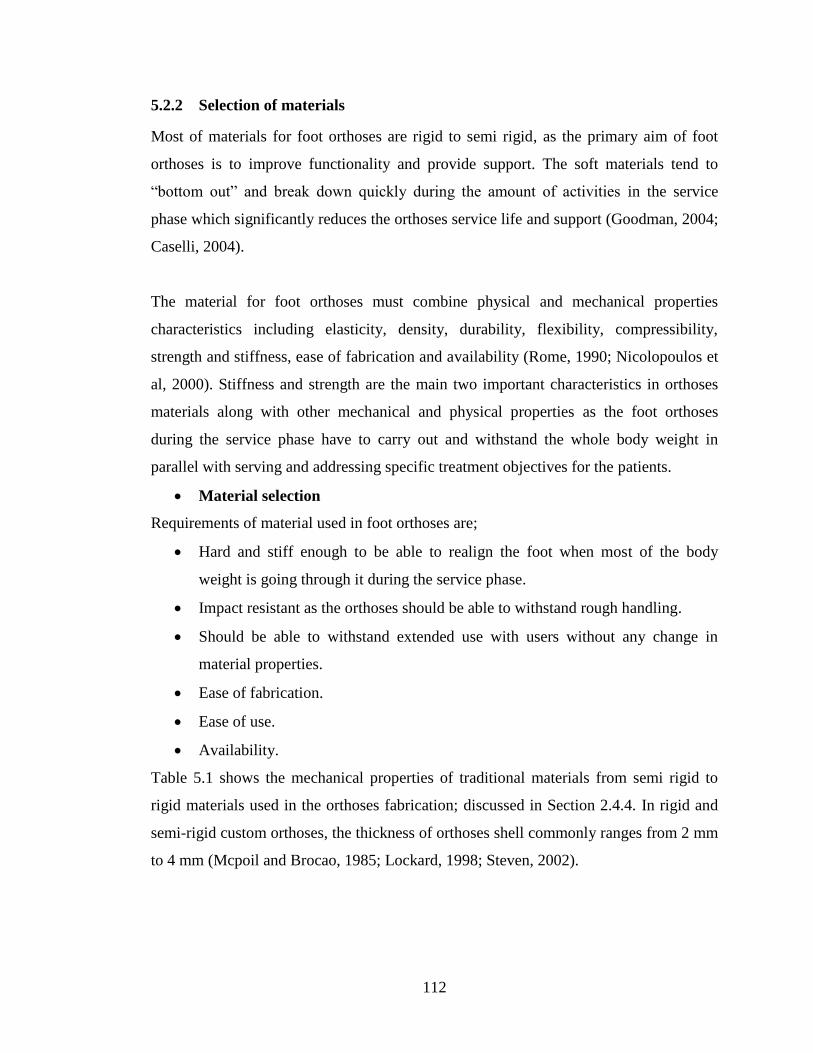
112
5.2.2 Selection of materials
Most of materials for foot orthoses are rigid to semi rigid, as the primary aim of foot
orthoses is to improve functionality and provide support. The soft materials tend to
“bottom out” and break down quickly during the amount of activities in the service
phase which significantly reduces the orthoses service life and support (Goodman, 2004;
Caselli, 2004).
The material for foot orthoses must combine physical and mechanical properties
characteristics including elasticity, density, durability, flexibility, compressibility,
strength and stiffness, ease of fabrication and availability (Rome, 1990; Nicolopoulos et
al, 2000). Stiffness and strength are the main two important characteristics in orthoses
materials along with other mechanical and physical properties as the foot orthoses
during the service phase have to carry out and withstand the whole body weight in
parallel with serving and addressing specific treatment objectives for the patients.
Material selection
Requirements of material used in foot orthoses are;
Hard and stiff enough to be able to realign the foot when most of the body
weight is going through it during the service phase.
Impact resistant as the orthoses should be able to withstand rough handling.
Should be able to withstand extended use with users without any change in
material properties.
Ease of fabrication.
Ease of use.
Availability.
Table 5.1 shows the mechanical properties of traditional materials from semi rigid to
rigid materials used in the orthoses fabrication; discussed in Section 2.4.4. In rigid and
semi-rigid custom orthoses, the thickness of orthoses shell commonly ranges from 2 mm
to 4 mm (Mcpoil and Brocao, 1985; Lockard, 1998; Steven, 2002).
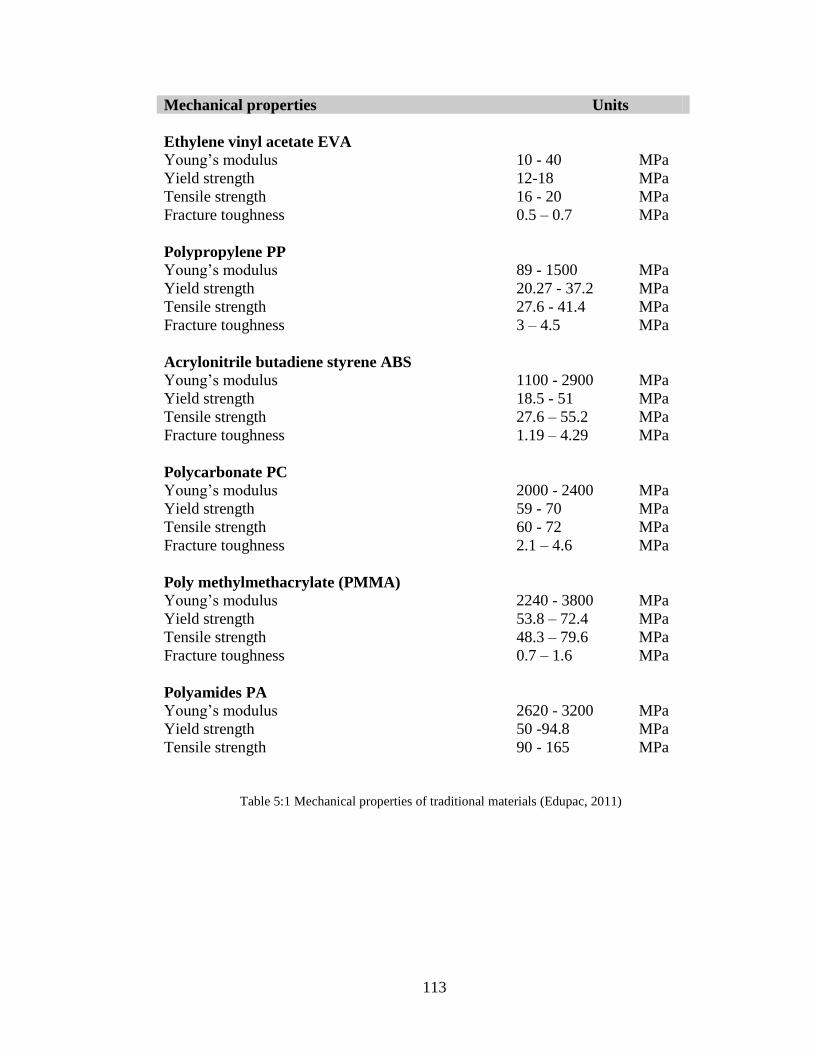
113
Mechanical properties Units
Ethylene vinyl acetate EVA
Young’s modulus 10 - 40 MPa
Yield strength 12-18 MPa
Tensile strength 16 - 20 MPa
Fracture toughness 0.5 – 0.7 MPa
Polypropylene PP
Young’s modulus 89 - 1500 MPa
Yield strength 20.27 - 37.2 MPa
Tensile strength 27.6 - 41.4 MPa
Fracture toughness 3 – 4.5 MPa
Acrylonitrile butadiene styrene ABS
Young’s modulus 1100 - 2900 MPa
Yield strength 18.5 - 51 MPa
Tensile strength 27.6 – 55.2 MPa
Fracture toughness 1.19 – 4.29 MPa
Polycarbonate PC
Young’s modulus 2000 - 2400 MPa
Yield strength 59 - 70 MPa
Tensile strength 60 - 72 MPa
Fracture toughness 2.1 – 4.6 MPa
Poly methylmethacrylate (PMMA)
Young’s modulus 2240 - 3800 MPa
Yield strength 53.8 – 72.4 MPa
Tensile strength 48.3 – 79.6 MPa
Fracture toughness 0.7 – 1.6 MPa
Polyamides PA Young’s modulus 2620 - 3200 MPa
Yield strength 50 -94.8 MPa
Tensile strength 90 - 165 MPa
Table 5:1 Mechanical properties of traditional materials (Edupac, 2011)
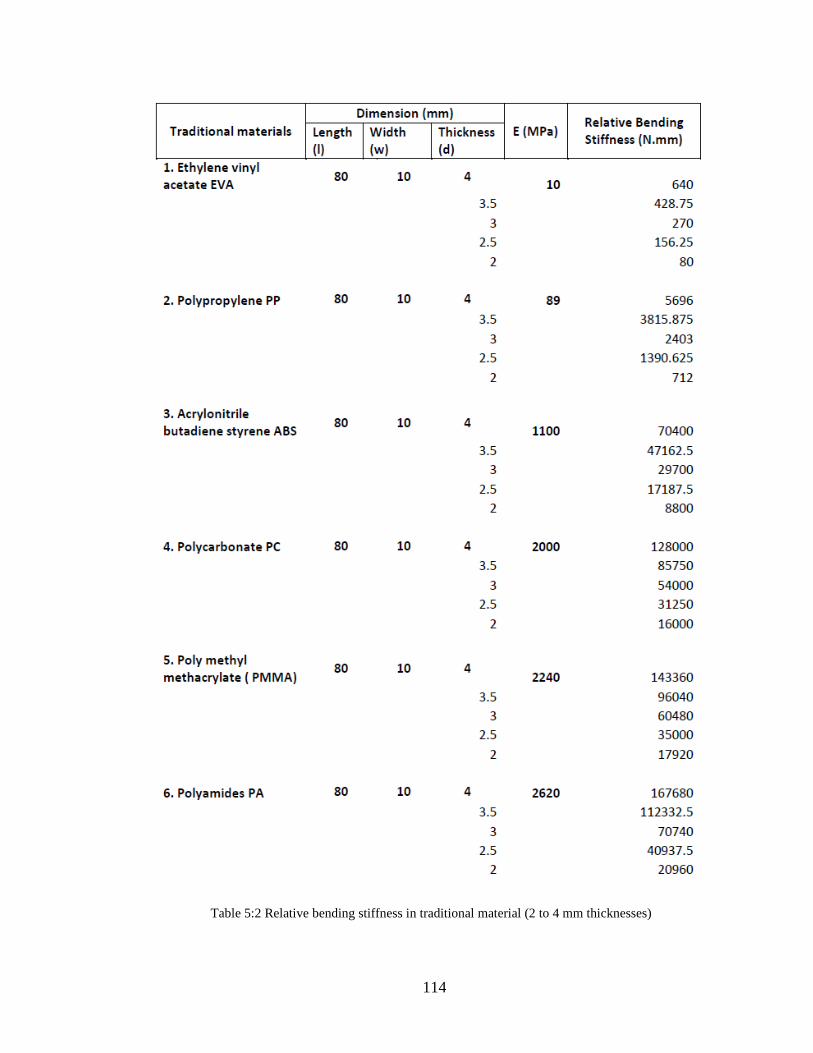
114
Table 5:2 Relative bending stiffness in traditional material (2 to 4 mm thicknesses)
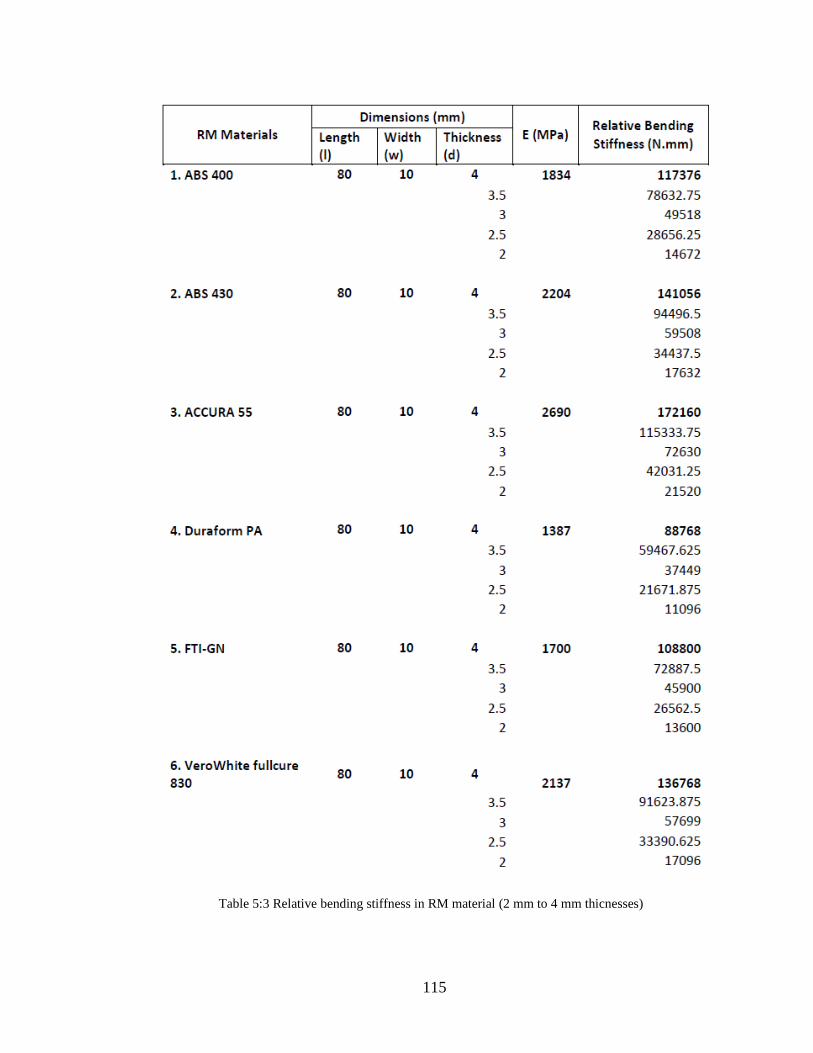
115
Table 5:3 Relative bending stiffness in RM material (2 mm to 4 mm thicnesses)
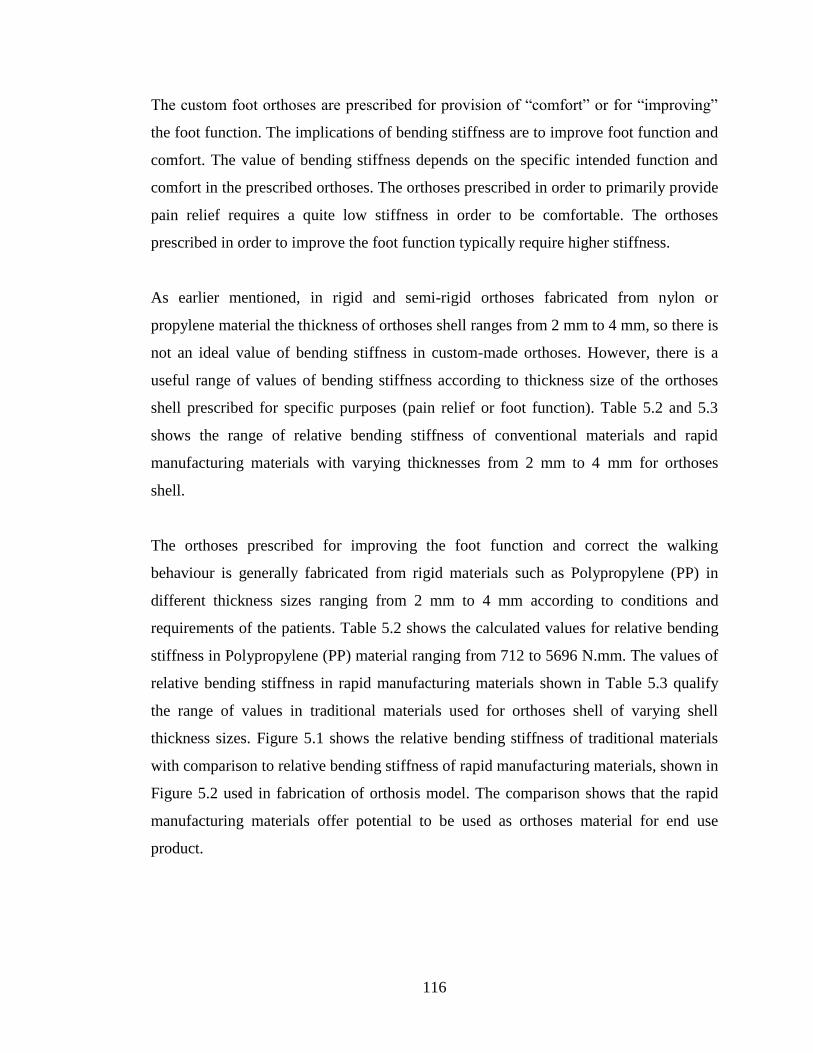
116
The custom foot orthoses are prescribed for provision of “comfort” or for “improving”
the foot function. The implications of bending stiffness are to improve foot function and
comfort. The value of bending stiffness depends on the specific intended function and
comfort in the prescribed orthoses. The orthoses prescribed in order to primarily provide
pain relief requires a quite low stiffness in order to be comfortable. The orthoses
prescribed in order to improve the foot function typically require higher stiffness.
As earlier mentioned, in rigid and semi-rigid orthoses fabricated from nylon or
propylene material the thickness of orthoses shell ranges from 2 mm to 4 mm, so there is
not an ideal value of bending stiffness in custom-made orthoses. However, there is a
useful range of values of bending stiffness according to thickness size of the orthoses
shell prescribed for specific purposes (pain relief or foot function). Table 5.2 and 5.3
shows the range of relative bending stiffness of conventional materials and rapid
manufacturing materials with varying thicknesses from 2 mm to 4 mm for orthoses
shell.
The orthoses prescribed for improving the foot function and correct the walking
behaviour is generally fabricated from rigid materials such as Polypropylene (PP) in
different thickness sizes ranging from 2 mm to 4 mm according to conditions and
requirements of the patients. Table 5.2 shows the calculated values for relative bending
stiffness in Polypropylene (PP) material ranging from 712 to 5696 N.mm. The values of
relative bending stiffness in rapid manufacturing materials shown in Table 5.3 qualify
the range of values in traditional materials used for orthoses shell of varying shell
thickness sizes. Figure 5.1 shows the relative bending stiffness of traditional materials
with comparison to relative bending stiffness of rapid manufacturing materials, shown in
Figure 5.2 used in fabrication of orthosis model. The comparison shows that the rapid
manufacturing materials offer potential to be used as orthoses material for end use
product.
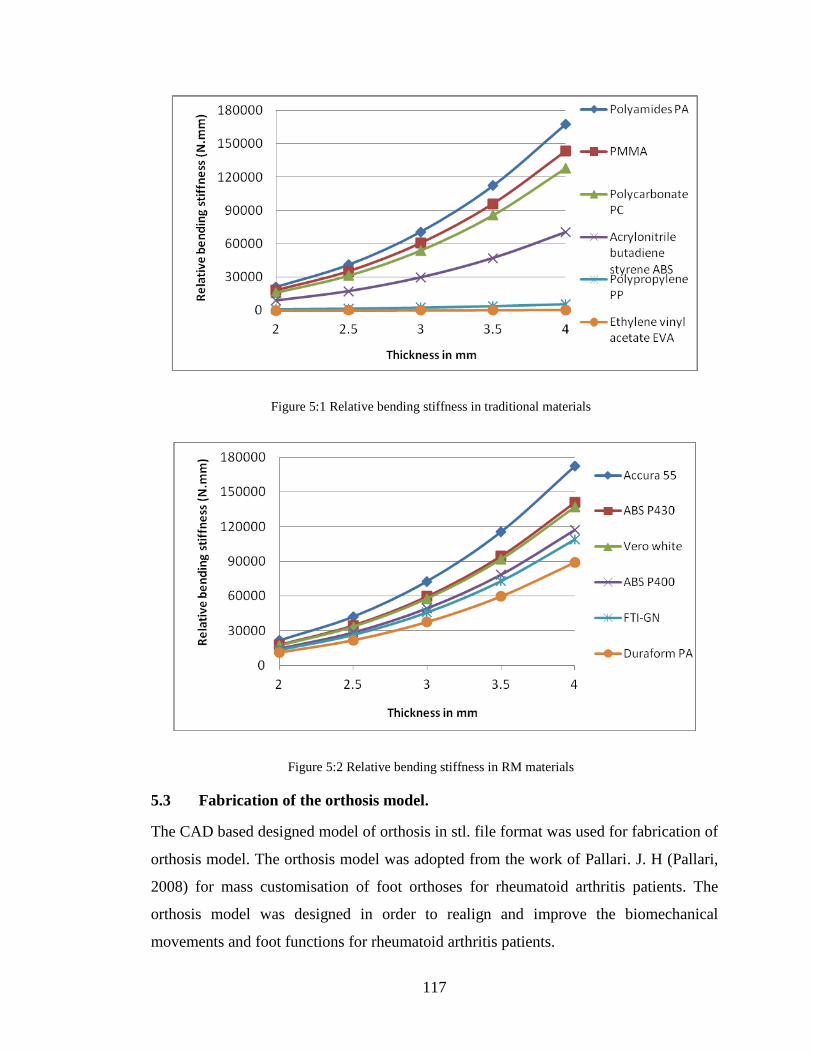
117
5.3 Fabrication of the orthosis model.
The CAD based designed model of orthosis in stl. file format was used for fabrication of
orthosis model. The orthosis model was adopted from the work of Pallari. J. H (Pallari,
2008) for mass customisation of foot orthoses for rheumatoid arthritis patients. The
orthosis model was designed in order to realign and improve the biomechanical
movements and foot functions for rheumatoid arthritis patients.
Figure 5:1 Relative bending stiffness in traditional materials
Figure 5:2 Relative bending stiffness in RM materials
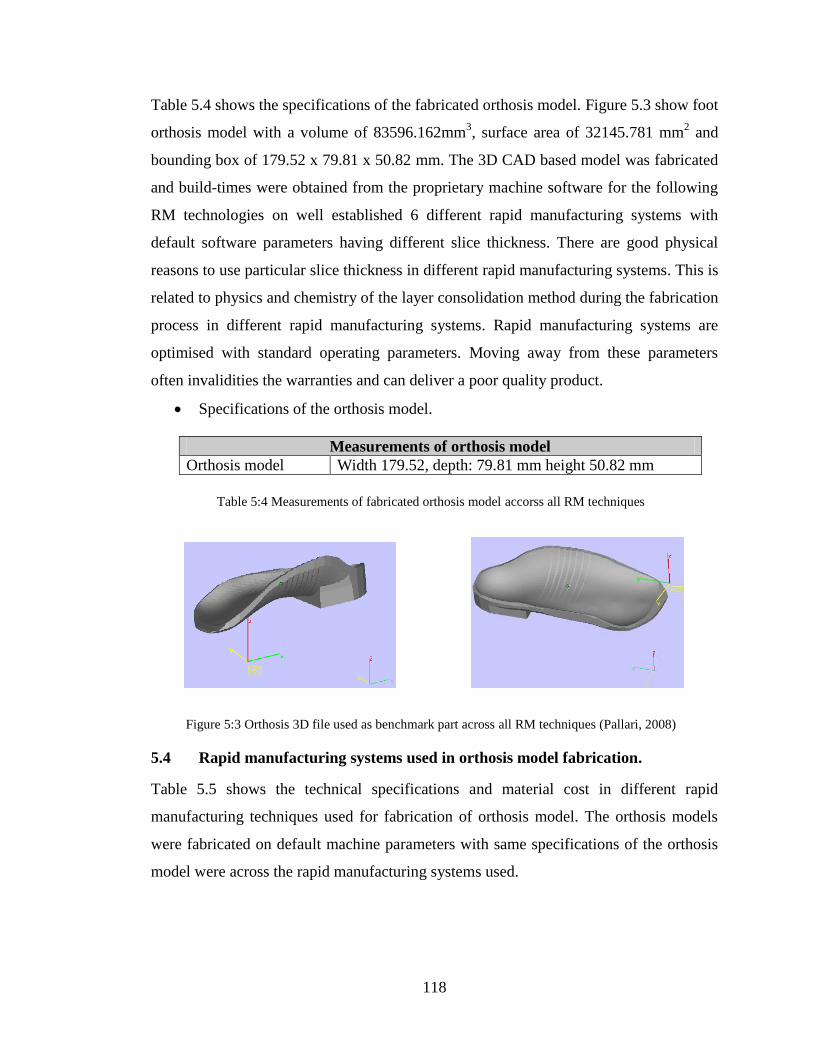
118
Table 5.4 shows the specifications of the fabricated orthosis model. Figure 5.3 show foot
orthosis model with a volume of 83596.162mm3, surface area of 32145.781 mm
2 and
bounding box of 179.52 x 79.81 x 50.82 mm. The 3D CAD based model was fabricated
and build-times were obtained from the proprietary machine software for the following
RM technologies on well established 6 different rapid manufacturing systems with
default software parameters having different slice thickness. There are good physical
reasons to use particular slice thickness in different rapid manufacturing systems. This is
related to physics and chemistry of the layer consolidation method during the fabrication
process in different rapid manufacturing systems. Rapid manufacturing systems are
optimised with standard operating parameters. Moving away from these parameters
often invalidities the warranties and can deliver a poor quality product.
Specifications of the orthosis model.
Measurements of orthosis model
Orthosis model Width 179.52, depth: 79.81 mm height 50.82 mm
5.4 Rapid manufacturing systems used in orthosis model fabrication.
Table 5.5 shows the technical specifications and material cost in different rapid
manufacturing techniques used for fabrication of orthosis model. The orthosis models
were fabricated on default machine parameters with same specifications of the orthosis
model were across the rapid manufacturing systems used.
Table 5:4 Measurements of fabricated orthosis model accorss all RM techniques
Figure 5:3 Orthosis 3D file used as benchmark part across all RM techniques (Pallari, 2008)
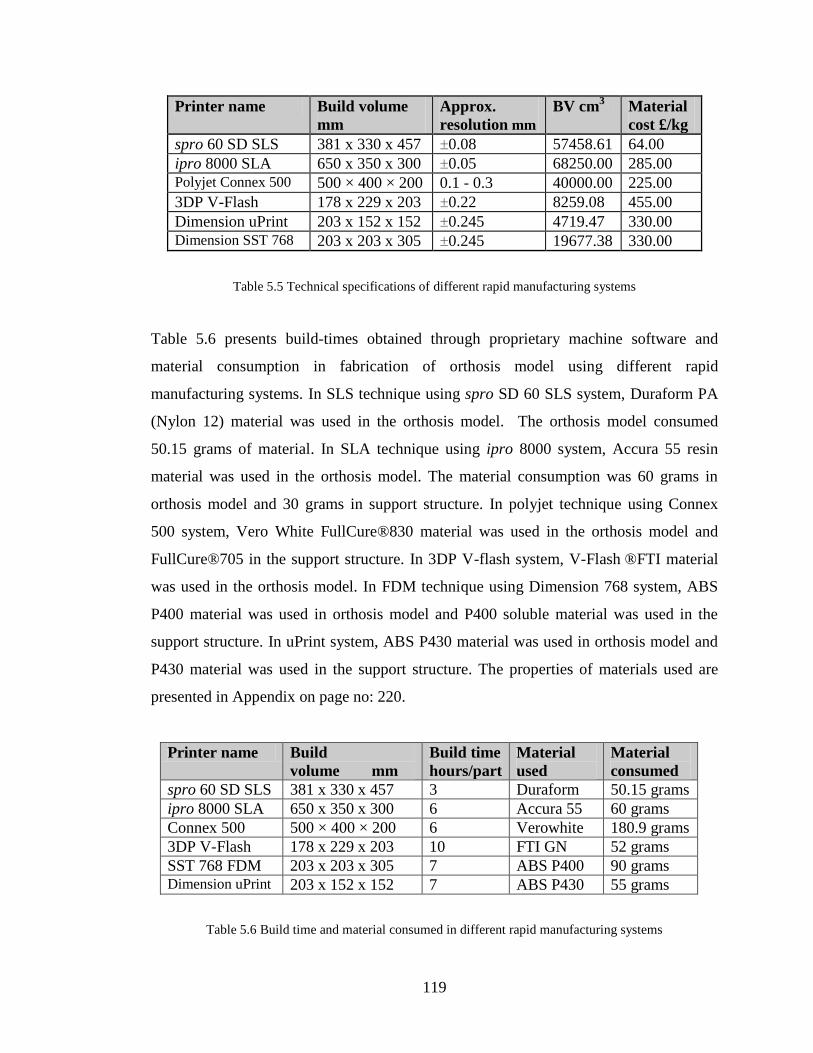
119
Printer name Build volume
mm
Approx.
resolution mm
BV cm3 Material
cost £/kg
spro 60 SD SLS 381 x 330 x 457 ±0.08 57458.61 64.00
ipro 8000 SLA 650 x 350 x 300 ±0.05 68250.00 285.00
Polyjet Connex 500 500 × 400 × 200 0.1 - 0.3 40000.00 225.00
3DP V-Flash 178 x 229 x 203 ±0.22 8259.08 455.00
Dimension uPrint 203 x 152 x 152 ±0.245 4719.47 330.00
Dimension SST 768 203 x 203 x 305 ±0.245 19677.38 330.00
Table 5.5 Technical specifications of different rapid manufacturing systems
Table 5.6 presents build-times obtained through proprietary machine software and
material consumption in fabrication of orthosis model using different rapid
manufacturing systems. In SLS technique using spro SD 60 SLS system, Duraform PA
(Nylon 12) material was used in the orthosis model. The orthosis model consumed
50.15 grams of material. In SLA technique using ipro 8000 system, Accura 55 resin
material was used in the orthosis model. The material consumption was 60 grams in
orthosis model and 30 grams in support structure. In polyjet technique using Connex
500 system, Vero White FullCure®830 material was used in the orthosis model and
FullCure®705 in the support structure. In 3DP V-flash system, V-Flash
®FTI material
was used in the orthosis model. In FDM technique using Dimension 768 system, ABS
P400 material was used in orthosis model and P400 soluble material was used in the
support structure. In uPrint system, ABS P430 material was used in orthosis model and
P430 material was used in the support structure. The properties of materials used are
presented in Appendix on page no: 220.
Printer name Build
volume mm
Build time
hours/part
Material
used
Material
consumed
spro 60 SD SLS 381 x 330 x 457 3 Duraform 50.15 grams
ipro 8000 SLA 650 x 350 x 300 6 Accura 55 60 grams
Connex 500 500 × 400 × 200 6 Verowhite 180.9 grams
3DP V-Flash 178 x 229 x 203 10 FTI GN 52 grams
SST 768 FDM 203 x 203 x 305 7 ABS P400 90 grams Dimension uPrint 203 x 152 x 152 7 ABS P430 55 grams
Table 5.6 Build time and material consumed in different rapid manufacturing systems
120
5.5 Summary.
Foot orthosis model was fabricated on 6 different commercially established rapid
manufacturing systems using the default fabrication parameters established by
proprietary software on the systems. In the orthosis model fabrication, different build-
times were obtained due to different fabrication processes and materials used. The
comparison of range of bending stiffness in rapid manufacturing based materials with
range of bending stiffness in traditional materials showed that RM based materials
qualify and can be used in the fabrication of custom foot orthosis shell. In the next
Chapter, analyses of the cost and build time on different rapid manufacturing systems is
presented.
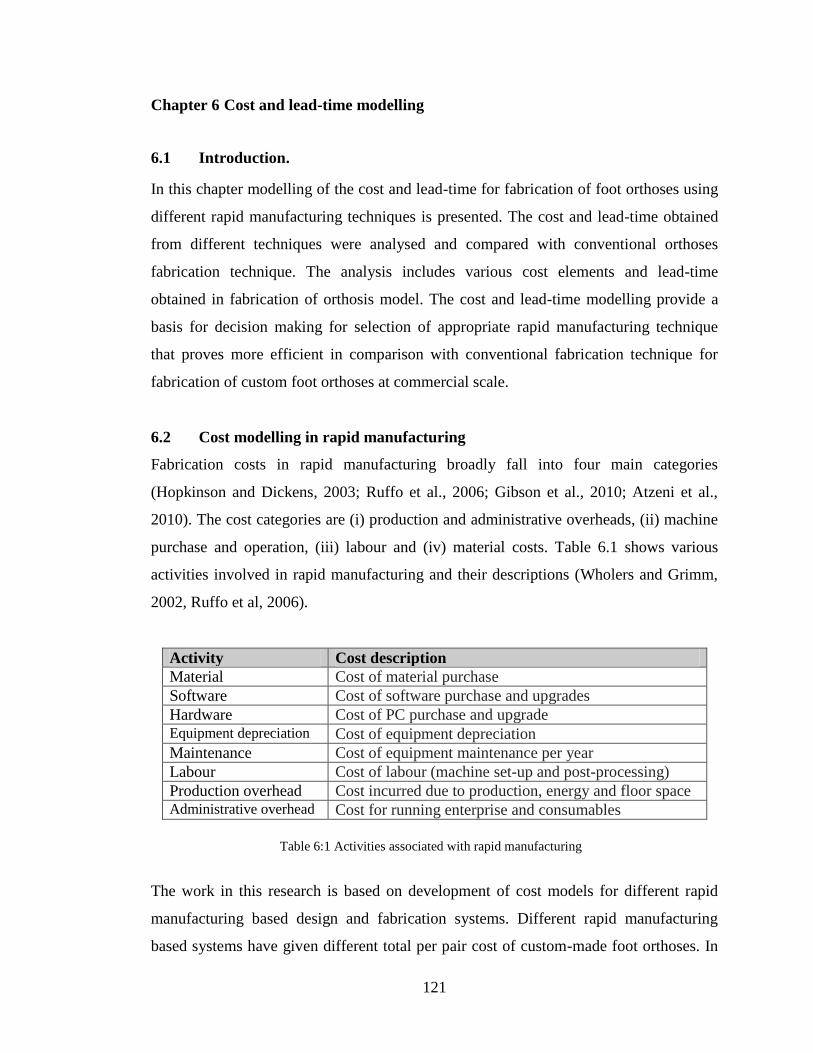
121
Chapter 6 Cost and lead-time modelling
6.1 Introduction.
In this chapter modelling of the cost and lead-time for fabrication of foot orthoses using
different rapid manufacturing techniques is presented. The cost and lead-time obtained
from different techniques were analysed and compared with conventional orthoses
fabrication technique. The analysis includes various cost elements and lead-time
obtained in fabrication of orthosis model. The cost and lead-time modelling provide a
basis for decision making for selection of appropriate rapid manufacturing technique
that proves more efficient in comparison with conventional fabrication technique for
fabrication of custom foot orthoses at commercial scale.
6.2 Cost modelling in rapid manufacturing
Fabrication costs in rapid manufacturing broadly fall into four main categories
(Hopkinson and Dickens, 2003; Ruffo et al., 2006; Gibson et al., 2010; Atzeni et al.,
2010). The cost categories are (i) production and administrative overheads, (ii) machine
purchase and operation, (iii) labour and (iv) material costs. Table 6.1 shows various
activities involved in rapid manufacturing and their descriptions (Wholers and Grimm,
2002, Ruffo et al, 2006).
Activity Cost description
Material Cost of material purchase
Software Cost of software purchase and upgrades
Hardware Cost of PC purchase and upgrade Equipment depreciation Cost of equipment depreciation
Maintenance Cost of equipment maintenance per year
Labour Cost of labour (machine set-up and post-processing)
Production overhead Cost incurred due to production, energy and floor space Administrative overhead Cost for running enterprise and consumables
The work in this research is based on development of cost models for different rapid
manufacturing based design and fabrication systems. Different rapid manufacturing
based systems have given different total per pair cost of custom-made foot orthoses. In
Table 6:1 Activities associated with rapid manufacturing
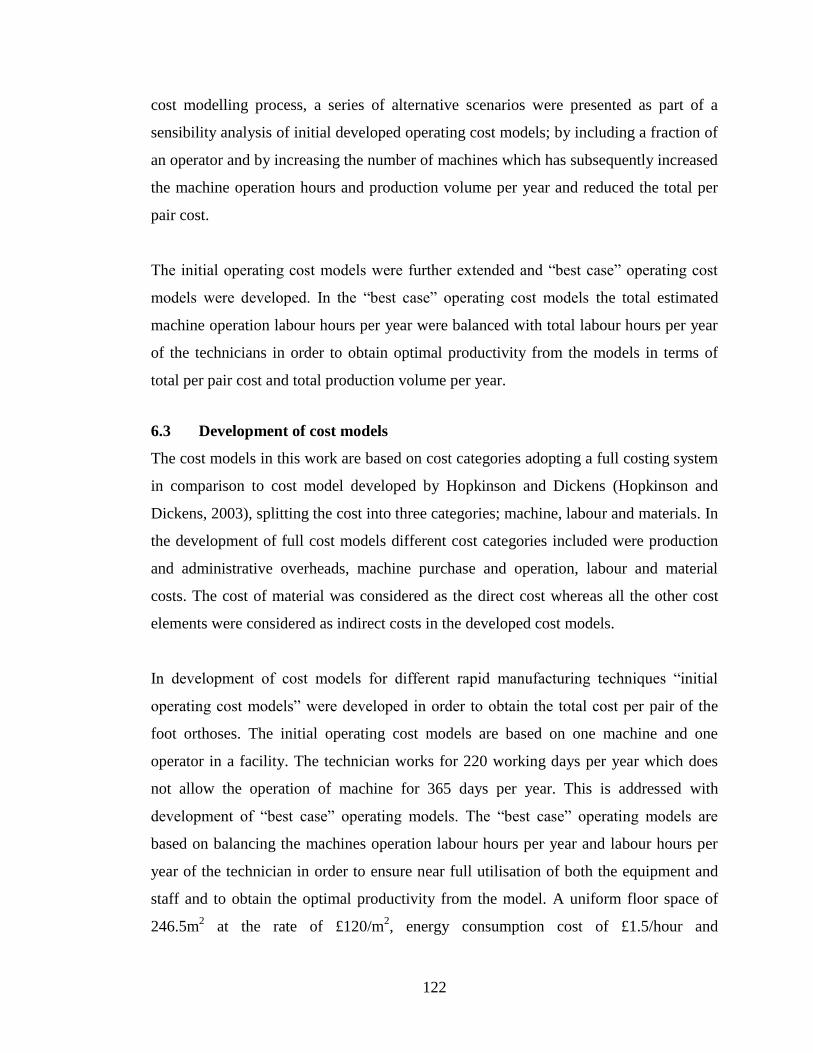
122
cost modelling process, a series of alternative scenarios were presented as part of a
sensibility analysis of initial developed operating cost models; by including a fraction of
an operator and by increasing the number of machines which has subsequently increased
the machine operation hours and production volume per year and reduced the total per
pair cost.
The initial operating cost models were further extended and “best case” operating cost
models were developed. In the “best case” operating cost models the total estimated
machine operation labour hours per year were balanced with total labour hours per year
of the technicians in order to obtain optimal productivity from the models in terms of
total per pair cost and total production volume per year.
6.3 Development of cost models
The cost models in this work are based on cost categories adopting a full costing system
in comparison to cost model developed by Hopkinson and Dickens (Hopkinson and
Dickens, 2003), splitting the cost into three categories; machine, labour and materials. In
the development of full cost models different cost categories included were production
and administrative overheads, machine purchase and operation, labour and material
costs. The cost of material was considered as the direct cost whereas all the other cost
elements were considered as indirect costs in the developed cost models.
In development of cost models for different rapid manufacturing techniques “initial
operating cost models” were developed in order to obtain the total cost per pair of the
foot orthoses. The initial operating cost models are based on one machine and one
operator in a facility. The technician works for 220 working days per year which does
not allow the operation of machine for 365 days per year. This is addressed with
development of “best case” operating models. The “best case” operating models are
based on balancing the machines operation labour hours per year and labour hours per
year of the technician in order to ensure near full utilisation of both the equipment and
staff and to obtain the optimal productivity from the model. A uniform floor space of
246.5m2 at the rate of £120/m
2, energy consumption cost of £1.5/hour and
123
administration overheads at the rate of £2320 has been assumed for all cases in the cost
modelling process which are based on UK trade and information enquiry services
(www.ukti.gov.uk, 2010) and research work of Ruffo and colleagues (Ruffo et al, 2006).
In “best case” developed models, the floor space for additional machines is included
according to required space for machine installation, recommended by the suppliers.
This has subsequently increased the production and administration over heads in the
“best case” models. Table 6.2 shows the main assumptions used in the cost modelling
process.
Cost elements and assumptions in development of cost models
Machine operation hours per year Total build time/run and total no: of runs/year
Floor space cost 246.5 m2
@£120/m2
Machine space for SLS and SLA 20m2/machine
Machine space for Connex 500, V-
Flash, SST 768, uPrint and Amfit.
6m2/machine scaled according to space
recommended from equipment suppliers.
Depreciation time for machines 5 years
Machine energy consumption cost £1.5/hour
Administration overheads £2320/year/machine
Technician labour cost/annum £39980/year or £22.71/hour
An important assumption was made for the productivity of machines per year.
Hopkinson and Dickens in their cost modelling have assumed 7884 machine operation
hours per year; utilisation of 90% of machine operation time per year. Gibson and
associates have assumed 8332 machine operation hours per year; utilisation of 95% of
machine operation time per year; whereas, Ruffo and colleagues have assumed 5000
machine operation hours per year; utilisation of 57% of machine operation time per
year. In this work, the productivity assumption for machine operation time per year is
based on total number of machine operation hours per year which was calculated on the
basis of;
(i) Total build time per run
(ii) Total estimated number of runs per year.
Another important assumption was made regarding the useful life span of machines
which was set for 5 years, as both the worst case and most realistic. Hopkinson and
Table 6:2 Assumptions in the cost modelling process
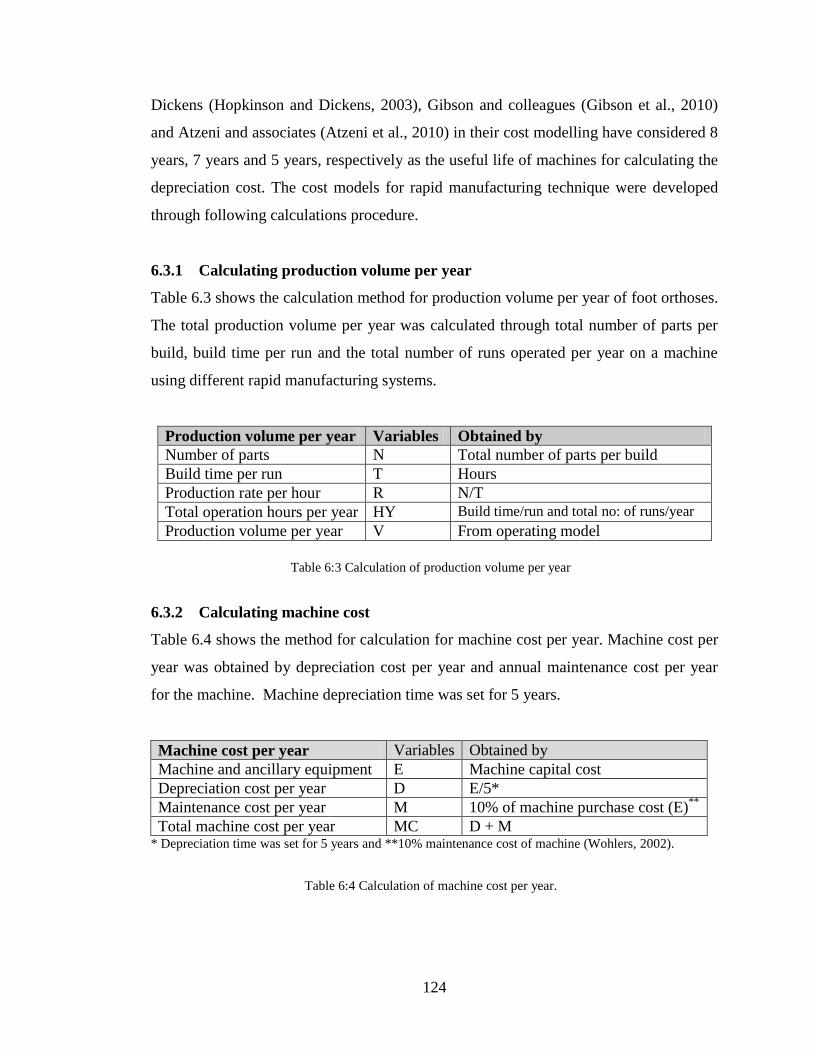
124
Dickens (Hopkinson and Dickens, 2003), Gibson and colleagues (Gibson et al., 2010)
and Atzeni and associates (Atzeni et al., 2010) in their cost modelling have considered 8
years, 7 years and 5 years, respectively as the useful life of machines for calculating the
depreciation cost. The cost models for rapid manufacturing technique were developed
through following calculations procedure.
6.3.1 Calculating production volume per year
Table 6.3 shows the calculation method for production volume per year of foot orthoses.
The total production volume per year was calculated through total number of parts per
build, build time per run and the total number of runs operated per year on a machine
using different rapid manufacturing systems.
Production volume per year Variables Obtained by
Number of parts N Total number of parts per build
Build time per run T Hours
Production rate per hour R N/T
Total operation hours per year HY Build time/run and total no: of runs/year
Production volume per year V From operating model
6.3.2 Calculating machine cost
Table 6.4 shows the method for calculation for machine cost per year. Machine cost per
year was obtained by depreciation cost per year and annual maintenance cost per year
for the machine. Machine depreciation time was set for 5 years.
Machine cost per year Variables Obtained by
Machine and ancillary equipment E Machine capital cost
Depreciation cost per year D E/5*
Maintenance cost per year M 10% of machine purchase cost (E)**
Total machine cost per year MC D + M * Depreciation time was set for 5 years and **10% maintenance cost of machine (Wohlers, 2002).
Table 6:3 Calculation of production volume per year
Table 6:4 Calculation of machine cost per year.
125
6.3.3 Calculating material cost
The method for calculation of material cost in rapid manufacturing techniques is
different due to the nature of fabrication processes in different techniques (Gibson et al.,
2010). In stereolithography SLA, FDM, Polyjet and V-flash techniques, material cost is
calculated by weighing the finished part including the material consumed in the support
structure then multiplying these with the associated cost of the material (Hopkinson and
Dickens, 2003). The method for calculating the cost of material in selective laser
sintering technique SLS is slightly different. In SLS techniques material cost is
calculated in terms of sintered material (weighing the finished parts) and unsintered
material by calculating the volume of unsintered material. In SLS technique, according
to the material manual by 3D systems Inc: USA unsintered material can be reused with
the virgin material with ratio not exceeding to 67% of the total material per build (Ruffo
et al., 2006). Table 6.5 shows the calculation method for material costs in different rapid
manufacturing techniques.
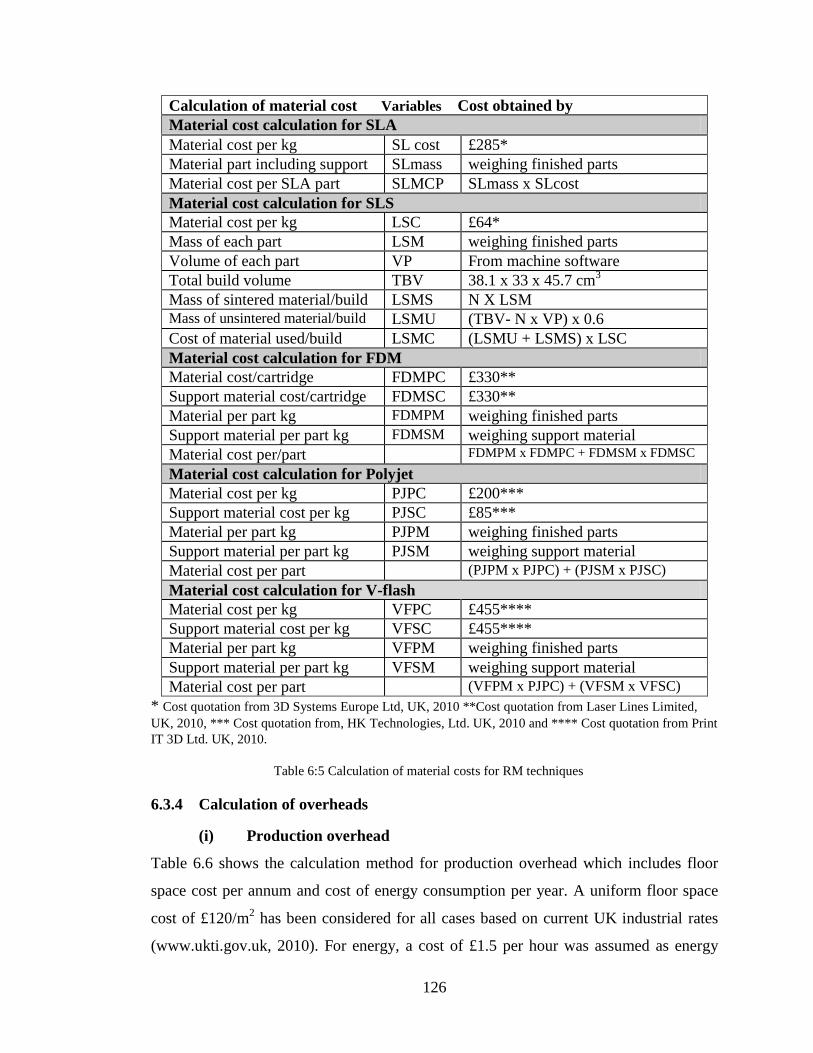
126
Calculation of material cost Variables Cost obtained by
Material cost calculation for SLA
Material cost per kg SL cost £285*
Material part including support SLmass weighing finished parts
Material cost per SLA part SLMCP SLmass x SLcost
Material cost calculation for SLS
Material cost per kg LSC £64*
Mass of each part LSM weighing finished parts
Volume of each part VP From machine software
Total build volume TBV 38.1 x 33 x 45.7 cm3
Mass of sintered material/build LSMS N X LSM
Mass of unsintered material/build LSMU (TBV- N x VP) x 0.6
Cost of material used/build LSMC (LSMU + LSMS) x LSC
Material cost calculation for FDM
Material cost/cartridge FDMPC £330**
Support material cost/cartridge FDMSC £330**
Material per part kg FDMPM weighing finished parts
Support material per part kg FDMSM weighing support material
Material cost per/part FDMPM x FDMPC + FDMSM x FDMSC
Material cost calculation for Polyjet
Material cost per kg PJPC £200***
Support material cost per kg PJSC £85***
Material per part kg PJPM weighing finished parts
Support material per part kg PJSM weighing support material
Material cost per part (PJPM x PJPC) + (PJSM x PJSC)
Material cost calculation for V-flash
Material cost per kg VFPC £455****
Support material cost per kg VFSC £455****
Material per part kg VFPM weighing finished parts
Support material per part kg VFSM weighing support material
Material cost per part (VFPM x PJPC) + (VFSM x VFSC)
* Cost quotation from 3D Systems Europe Ltd, UK, 2010 **Cost quotation from Laser Lines Limited,
UK, 2010, *** Cost quotation from, HK Technologies, Ltd. UK, 2010 and **** Cost quotation from Print
IT 3D Ltd. UK, 2010.
6.3.4 Calculation of overheads
(i) Production overhead
Table 6.6 shows the calculation method for production overhead which includes floor
space cost per annum and cost of energy consumption per year. A uniform floor space
cost of £120/m2 has been considered for all cases based on current UK industrial rates
(www.ukti.gov.uk, 2010). For energy, a cost of £1.5 per hour was assumed as energy
Table 6:5 Calculation of material costs for RM techniques
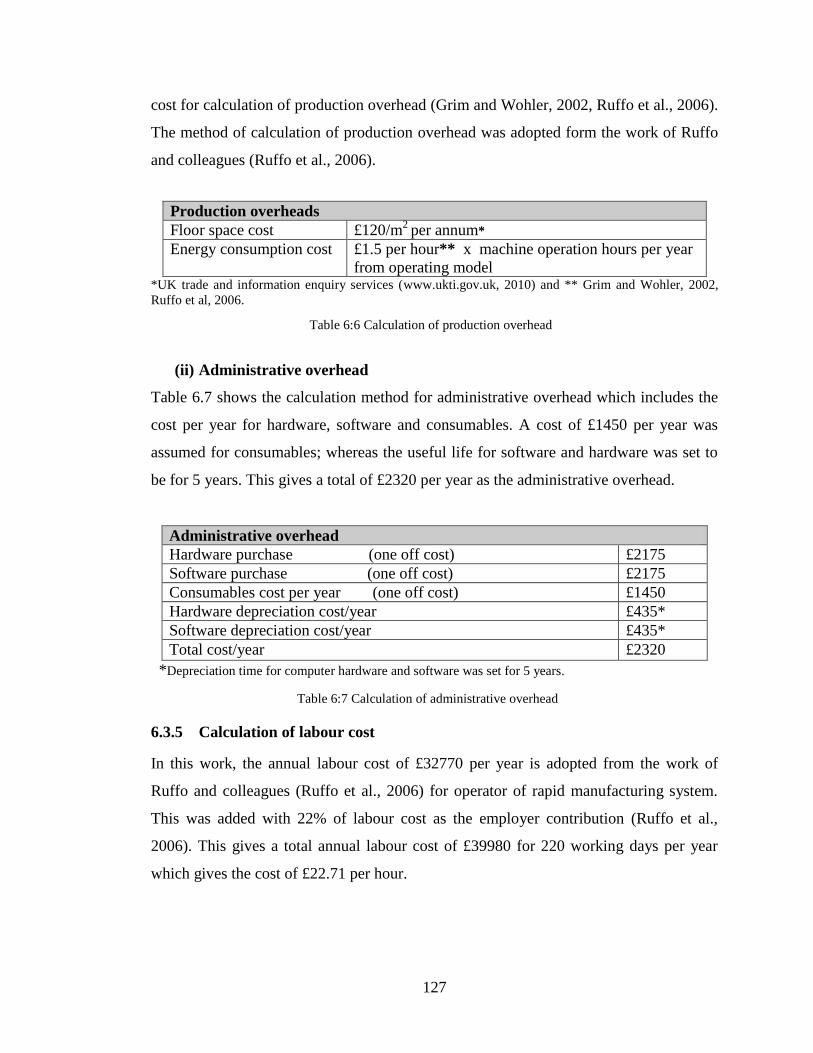
127
cost for calculation of production overhead (Grim and Wohler, 2002, Ruffo et al., 2006).
The method of calculation of production overhead was adopted form the work of Ruffo
and colleagues (Ruffo et al., 2006).
Production overheads
Floor space cost £120/m2
per annum*
Energy consumption cost £1.5 per hour** x machine operation hours per year
from operating model *UK trade and information enquiry services (www.ukti.gov.uk, 2010) and ** Grim and Wohler, 2002,
Ruffo et al, 2006.
(ii) Administrative overhead
Table 6.7 shows the calculation method for administrative overhead which includes the
cost per year for hardware, software and consumables. A cost of £1450 per year was
assumed for consumables; whereas the useful life for software and hardware was set to
be for 5 years. This gives a total of £2320 per year as the administrative overhead.
Administrative overhead
Hardware purchase (one off cost) £2175
Software purchase (one off cost) £2175
Consumables cost per year (one off cost) £1450
Hardware depreciation cost/year £435*
Software depreciation cost/year £435*
Total cost/year £2320
*Depreciation time for computer hardware and software was set for 5 years.
6.3.5 Calculation of labour cost
In this work, the annual labour cost of £32770 per year is adopted from the work of
Ruffo and colleagues (Ruffo et al., 2006) for operator of rapid manufacturing system.
This was added with 22% of labour cost as the employer contribution (Ruffo et al.,
2006). This gives a total annual labour cost of £39980 for 220 working days per year
which gives the cost of £22.71 per hour.
Table 6:6 Calculation of production overhead
Table 6:7 Calculation of administrative overhead
128
6.4 Mathematical calculations for cost modelling
The method for calculation of fabrication costs is presented in the following section.
C total = C machine + C material + C overheads + C labour Eq (6.1)
Where C total is the estimated total cost per year which is the sum of cost of machine
including depreciation and maintenance cost per year, C material is the estimated cost of
material consumed in model and support structure, C overheads is the estimated cost of
production and administration overheads per year and C labour is the labour cost per year.
The first term in equation 6.1, cost of machine per year (C machine) is estimated using
equation (6.2).
C machine = E/5 + M Eq (6.2)
Where, E is the capital cost of machine which is divided by 5 years in order to obtain
depreciation cost per year. The maintenance cost (M) for RM system depends on
individual agreement between system supplier and buyer. However, as a rule about 10%
of purchase price of the machine was budgeted for a full annual maintenance cost of the
system (Grim and Wohler, 2002). The second term in equation 6.1, cost of material per
year (C material) is calculated using equation (6.3)
C material = V mod: + V sup: x (material cost £/kg) Eq (6.3)
Where V mod: is material consumed in the model and V supp: is material consumed in the
support structure. This is multiplied with the associated cost of material per kg. The
third term in equation 6.1, overheads per year (C overheads) is obtained by equation (6.4).
C overheads = C prod: overhead + C admin: overhead Eq (6.4)
Where, C prod: is for production overhead per year which is added with the C admin:
administrative overhead per year. The fourth term in equation 6.1, cost of labour (C
labour) is included as annual salary of technician per year.
C labour = Annual salary of technician.
The cost per pair of orthoses is calculated from following equation.
C per pair = C total / total number of pairs produced Eq (6.5)
Where C total is total cost in the fabrication of orthoses per year divided by total number
of pairs produced per year in the operating cost model.
129
6.4.1 Cost and lead-time modelling
For modelling of the cost and lead-time, initial operating cost models were developed
based on one operator working with one machine in a facility. The models were based
on total estimated production volume per year of foot orthoses using ipro SD 60 SLS,
spro SLA, Connex 500 polyjet, V-flash 3DP, Dimension 768 SST, uPrint and Amfit
CAD/CAM systems. In following section detailed breakdown of the cost and lead-time
models developed for all the techniques used are presented. The cost models include
machine purchase and operation, material, production and administration overheads and
labour costs. A uniform cost of cost of £2320 as the administration overhead per year
and a cost of £39980 per year as the labour cost per year was standardised as annual
salary of the technician per year in all the developed models.
6.4.2 Cost and lead-time modelling for SLS technique using spro SD system
In SLS technique using spro 60 SD SLS system one machine was assumed to work for
one run of 16 hours of build time per day working for 220 days per year. Production
volume per year was calculated by estimating the total production volume per year from
the model. It was estimated that from one run of 200 mm build height on average 30
parts or 15 pairs of orthoses can be fitted. The build time of 16 hours per run was given
by the build setupTM
machine controlling software. The machine was assumed to work
for 220 days per year which gives a total of 3520 machine operation hours per year;
approximately 40% of machine utilisation time per year.
Table 6.8 shows the estimated total cost of £363360 for fabrication of 3300 pairs per
year at the rate of £110.10 per pair. Machine cost per year was calculated by
depreciation cost of machine and 10% of actual cost of machine as the maintenance cost
per year. The depreciation time for machine was set for 5 years. This gives an estimated
total of £75000 as the machine cost per year. Material cost per pair was calculated in
terms of sintered material per build by weighing the fabricated parts and unsintered
material per build by calculating the volume of unused material and multiplying it by
unsintered material density. This gives an estimated material cost of £64 per pair.
Production overhead per year was calculated by floor space cost at the rate of £120/m2
130
per year. This cost was added with cost of energy for machine at the rate of £1.5 per
hour (Ruffo et al, 2006). This gives an estimated total of £34860 per year as production
overhead. A uniform administrative overhead per year at the cost of £2320 was included
in the model.
Labour cost was calculated by required labour time for operation of machine; based on
one hour of time for setting of machine and loading of material and 2 hours of time for
cleaning the fabricated parts. The operation of one run on spro SD 60 SLS system
requires 3 hours of labour time of the technician. However, in initial cost model, labour
cost of £39980 is included as the annual salary of the technician.
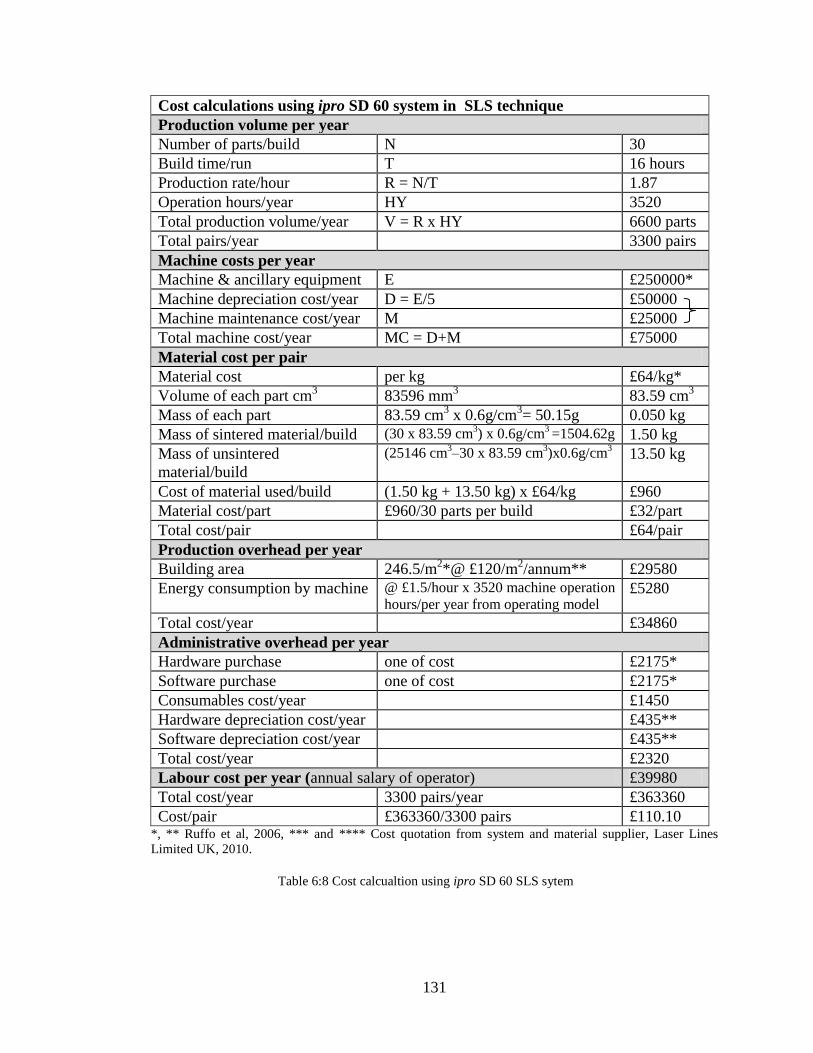
131
Cost calculations using ipro SD 60 system in SLS technique
Production volume per year
Number of parts/build N 30
Build time/run T 16 hours
Production rate/hour R = N/T 1.87
Operation hours/year HY 3520
Total production volume/year V = R x HY 6600 parts
Total pairs/year 3300 pairs
Machine costs per year
Machine & ancillary equipment E £250000*
Machine depreciation cost/year D = E/5 £50000
Machine maintenance cost/year M £25000
Total machine cost/year MC = D+M £75000
Material cost per pair
Material cost per kg £64/kg*
Volume of each part cm3 83596 mm
3 83.59 cm
3
Mass of each part 83.59 cm3 x 0.6g/cm
3= 50.15g 0.050 kg
Mass of sintered material/build (30 x 83.59 cm3) x 0.6g/cm
3 =1504.62g 1.50 kg
Mass of unsintered
material/build
(25146 cm3–30 x 83.59 cm
3)x0.6g/cm
3 13.50 kg
Cost of material used/build (1.50 kg + 13.50 kg) x £64/kg £960
Material cost/part £960/30 parts per build £32/part
Total cost/pair £64/pair
Production overhead per year
Building area 246.5/m2*@ £120/m
2/annum** £29580
Energy consumption by machine @ £1.5/hour x 3520 machine operation
hours/per year from operating model £5280
Total cost/year £34860
Administrative overhead per year
Hardware purchase one of cost £2175*
Software purchase one of cost £2175*
Consumables cost/year £1450
Hardware depreciation cost/year £435**
Software depreciation cost/year £435**
Total cost/year £2320
Labour cost per year (annual salary of operator) £39980
Total cost/year 3300 pairs/year £363360
Cost/pair £363360/3300 pairs £110.10 *, ** Ruffo et al, 2006, *** and **** Cost quotation from system and material supplier, Laser Lines
Limited UK, 2010.
Table 6:8 Cost calcualtion using ipro SD 60 SLS sytem
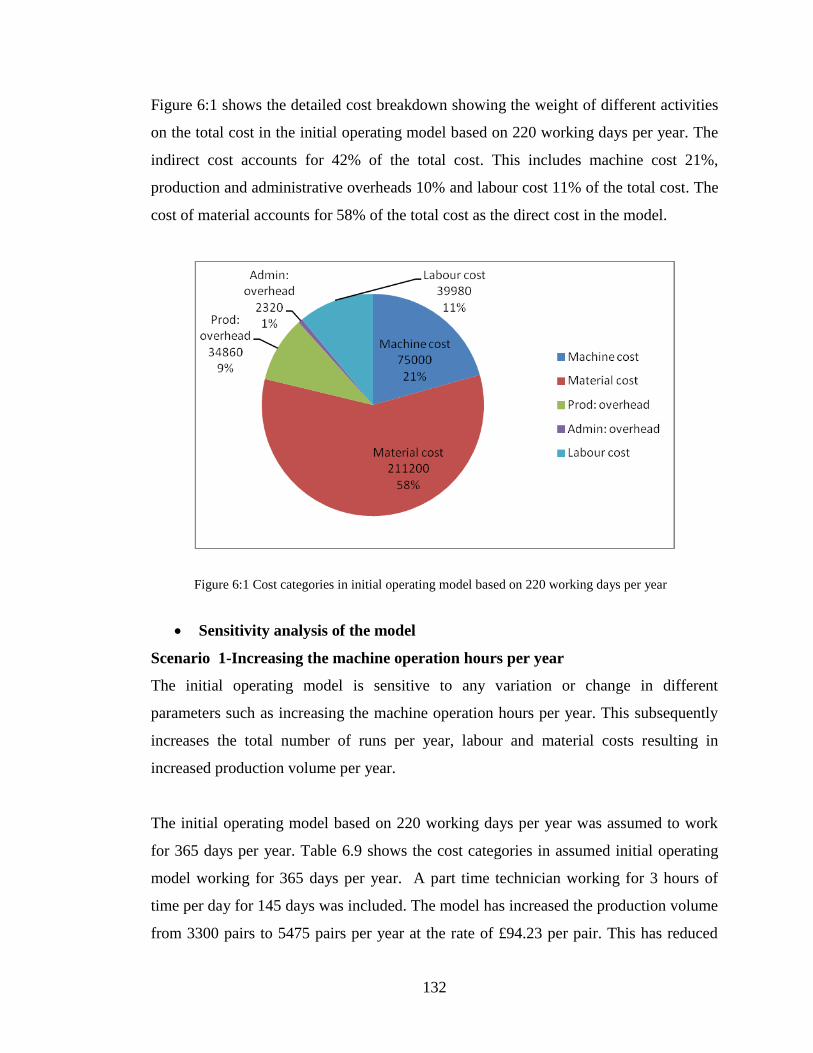
132
Figure 6:1 shows the detailed cost breakdown showing the weight of different activities
on the total cost in the initial operating model based on 220 working days per year. The
indirect cost accounts for 42% of the total cost. This includes machine cost 21%,
production and administrative overheads 10% and labour cost 11% of the total cost. The
cost of material accounts for 58% of the total cost as the direct cost in the model.
Sensitivity analysis of the model
Scenario 1-Increasing the machine operation hours per year
The initial operating model is sensitive to any variation or change in different
parameters such as increasing the machine operation hours per year. This subsequently
increases the total number of runs per year, labour and material costs resulting in
increased production volume per year.
The initial operating model based on 220 working days per year was assumed to work
for 365 days per year. Table 6.9 shows the cost categories in assumed initial operating
model working for 365 days per year. A part time technician working for 3 hours of
time per day for 145 days was included. The model has increased the production volume
from 3300 pairs to 5475 pairs per year at the rate of £94.23 per pair. This has reduced
Figure 6:1 Cost categories in initial operating model based on 220 working days per year
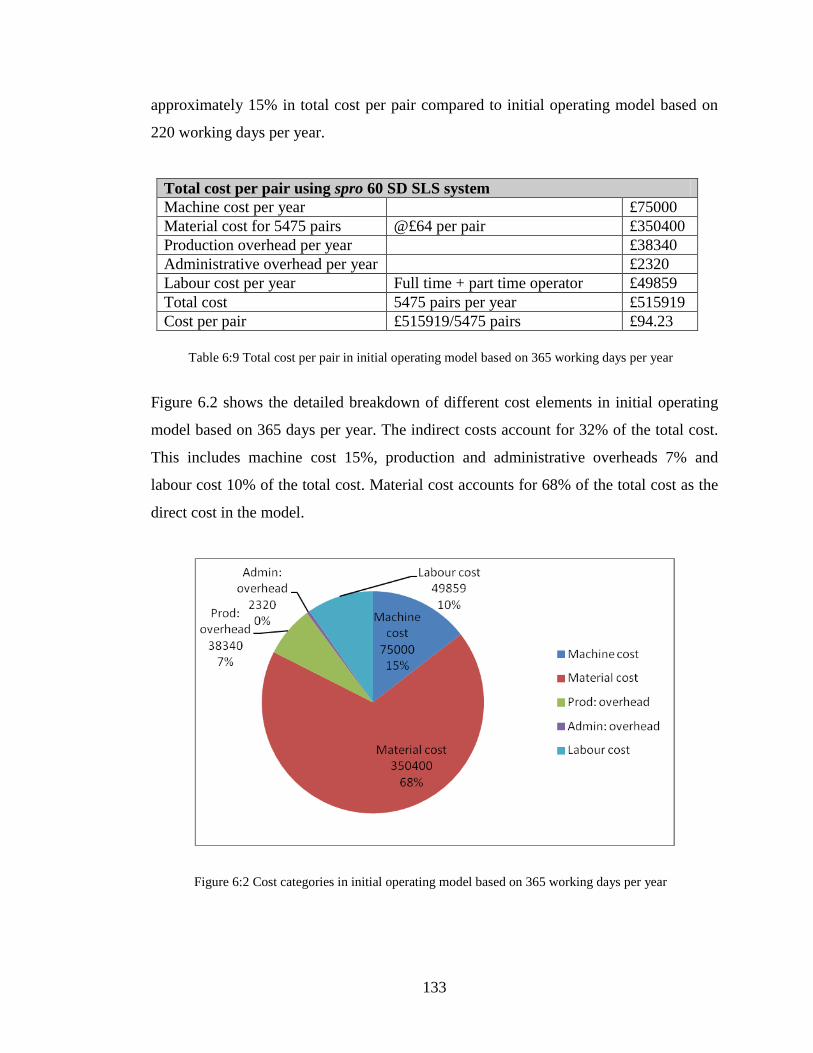
133
approximately 15% in total cost per pair compared to initial operating model based on
220 working days per year.
Total cost per pair using spro 60 SD SLS system
Machine cost per year £75000
Material cost for 5475 pairs @£64 per pair £350400
Production overhead per year £38340
Administrative overhead per year £2320
Labour cost per year Full time + part time operator £49859
Total cost 5475 pairs per year £515919
Cost per pair £515919/5475 pairs £94.23
Figure 6.2 shows the detailed breakdown of different cost elements in initial operating
model based on 365 days per year. The indirect costs account for 32% of the total cost.
This includes machine cost 15%, production and administrative overheads 7% and
labour cost 10% of the total cost. Material cost accounts for 68% of the total cost as the
direct cost in the model.
Table 6:9 Total cost per pair in initial operating model based on 365 working days per year
Figure 6:2 Cost categories in initial operating model based on 365 working days per year
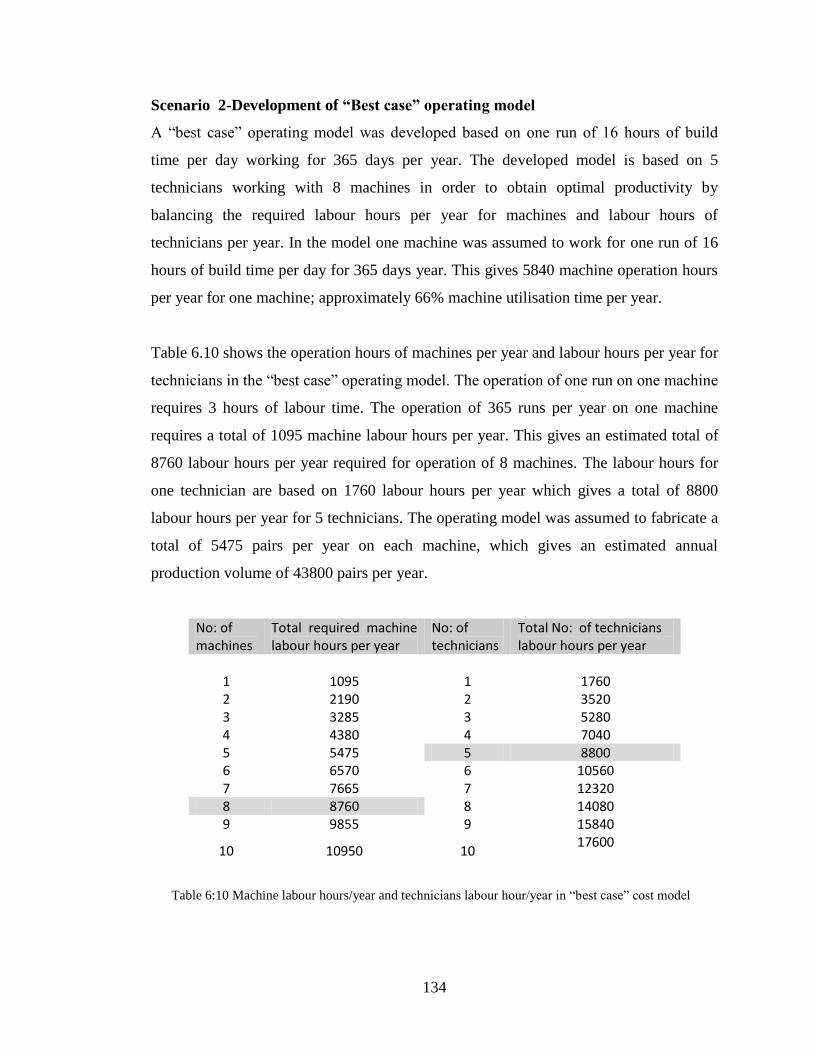
134
Scenario 2-Development of “Best case” operating model
A “best case” operating model was developed based on one run of 16 hours of build
time per day working for 365 days per year. The developed model is based on 5
technicians working with 8 machines in order to obtain optimal productivity by
balancing the required labour hours per year for machines and labour hours of
technicians per year. In the model one machine was assumed to work for one run of 16
hours of build time per day for 365 days year. This gives 5840 machine operation hours
per year for one machine; approximately 66% machine utilisation time per year.
Table 6.10 shows the operation hours of machines per year and labour hours per year for
technicians in the “best case” operating model. The operation of one run on one machine
requires 3 hours of labour time. The operation of 365 runs per year on one machine
requires a total of 1095 machine labour hours per year. This gives an estimated total of
8760 labour hours per year required for operation of 8 machines. The labour hours for
one technician are based on 1760 labour hours per year which gives a total of 8800
labour hours per year for 5 technicians. The operating model was assumed to fabricate a
total of 5475 pairs per year on each machine, which gives an estimated annual
production volume of 43800 pairs per year.
No: of machines
Total required machine labour hours per year
No: of technicians
Total No: of technicians labour hours per year
1 1095 1 1760 2 2190 2 3520 3 3285 3 5280 4 4380 4 7040 5 5475 5 8800 6 6570 6 10560 7 7665 7 12320 8 8760 8 14080 9 9855 9 15840
10 10950 10 17600
Table 6:10 Machine labour hours/year and technicians labour hour/year in “best case” cost model
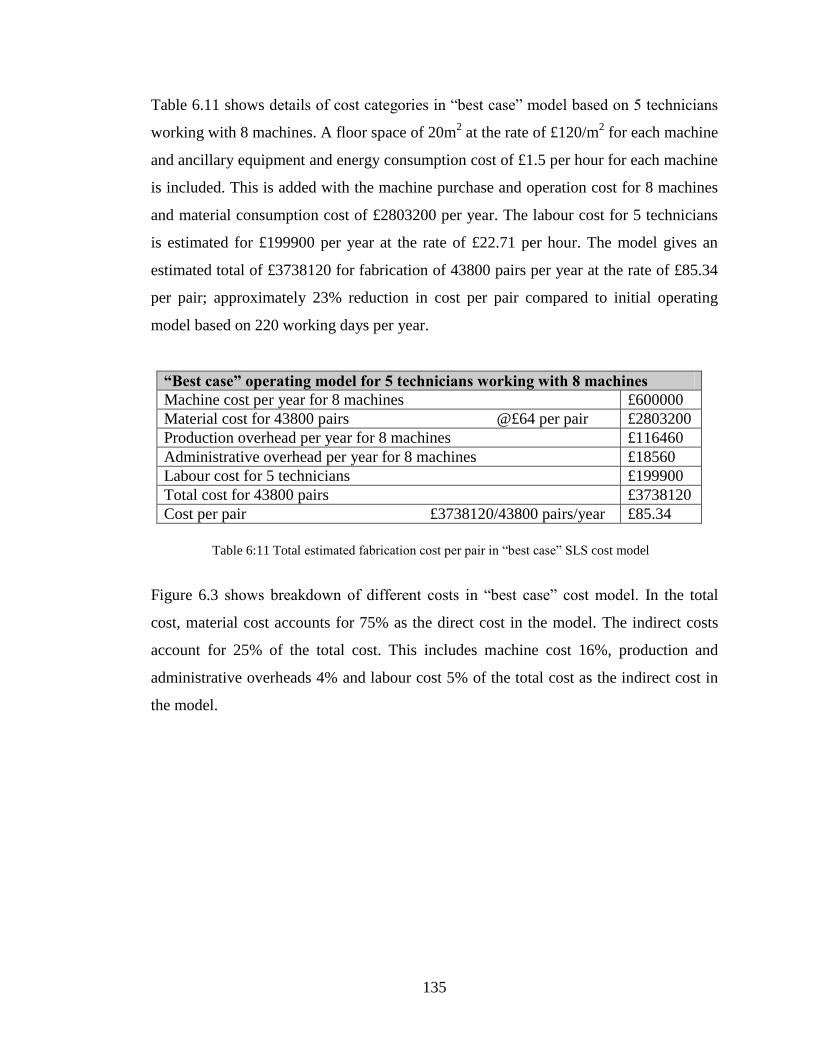
135
Table 6.11 shows details of cost categories in “best case” model based on 5 technicians
working with 8 machines. A floor space of 20m2 at the rate of £120/m
2 for each machine
and ancillary equipment and energy consumption cost of £1.5 per hour for each machine
is included. This is added with the machine purchase and operation cost for 8 machines
and material consumption cost of £2803200 per year. The labour cost for 5 technicians
is estimated for £199900 per year at the rate of £22.71 per hour. The model gives an
estimated total of £3738120 for fabrication of 43800 pairs per year at the rate of £85.34
per pair; approximately 23% reduction in cost per pair compared to initial operating
model based on 220 working days per year.
“Best case” operating model for 5 technicians working with 8 machines
Machine cost per year for 8 machines £600000
Material cost for 43800 pairs @£64 per pair £2803200
Production overhead per year for 8 machines £116460
Administrative overhead per year for 8 machines £18560
Labour cost for 5 technicians £199900
Total cost for 43800 pairs £3738120
Cost per pair £3738120/43800 pairs/year £85.34
Figure 6.3 shows breakdown of different costs in “best case” cost model. In the total
cost, material cost accounts for 75% as the direct cost in the model. The indirect costs
account for 25% of the total cost. This includes machine cost 16%, production and
administrative overheads 4% and labour cost 5% of the total cost as the indirect cost in
the model.
Table 6:11 Total estimated fabrication cost per pair in “best case” SLS cost model
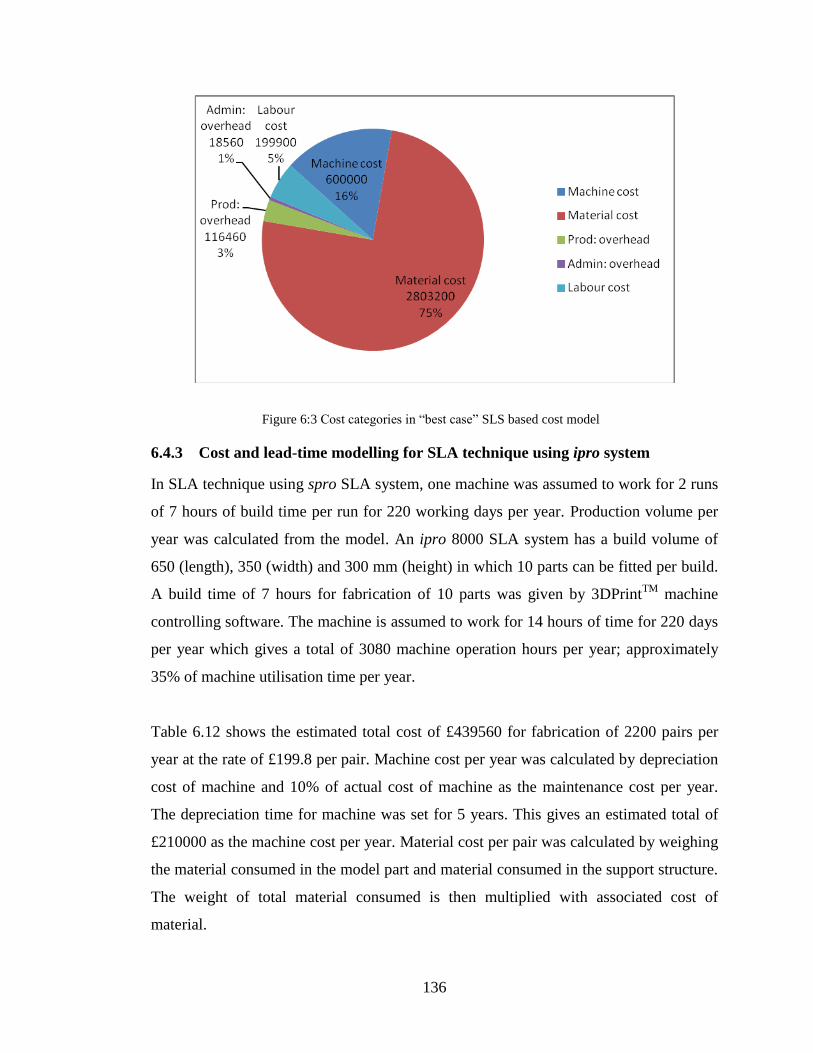
136
6.4.3 Cost and lead-time modelling for SLA technique using ipro system
In SLA technique using spro SLA system, one machine was assumed to work for 2 runs
of 7 hours of build time per run for 220 working days per year. Production volume per
year was calculated from the model. An ipro 8000 SLA system has a build volume of
650 (length), 350 (width) and 300 mm (height) in which 10 parts can be fitted per build.
A build time of 7 hours for fabrication of 10 parts was given by 3DPrintTM
machine
controlling software. The machine is assumed to work for 14 hours of time for 220 days
per year which gives a total of 3080 machine operation hours per year; approximately
35% of machine utilisation time per year.
Table 6.12 shows the estimated total cost of £439560 for fabrication of 2200 pairs per
year at the rate of £199.8 per pair. Machine cost per year was calculated by depreciation
cost of machine and 10% of actual cost of machine as the maintenance cost per year.
The depreciation time for machine was set for 5 years. This gives an estimated total of
£210000 as the machine cost per year. Material cost per pair was calculated by weighing
the material consumed in the model part and material consumed in the support structure.
The weight of total material consumed is then multiplied with associated cost of
material.
Figure 6:3 Cost categories in “best case” SLS based cost model
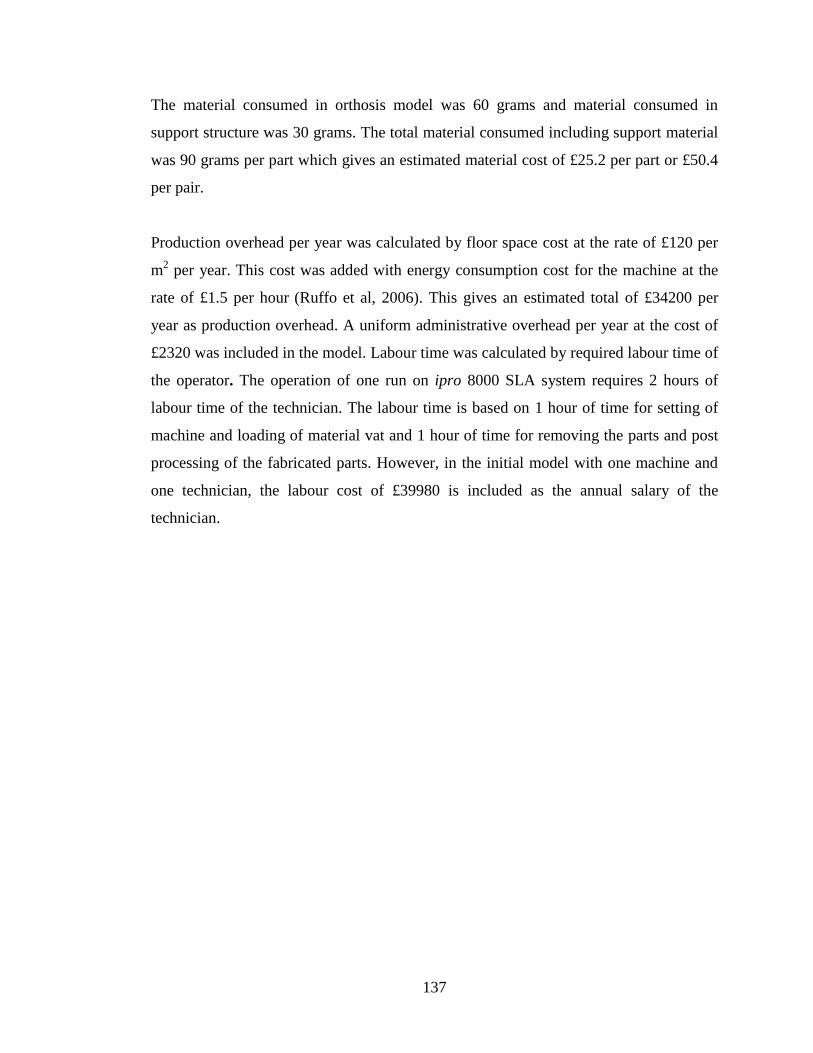
137
The material consumed in orthosis model was 60 grams and material consumed in
support structure was 30 grams. The total material consumed including support material
was 90 grams per part which gives an estimated material cost of £25.2 per part or £50.4
per pair.
Production overhead per year was calculated by floor space cost at the rate of £120 per
m2 per year. This cost was added with energy consumption cost for the machine at the
rate of £1.5 per hour (Ruffo et al, 2006). This gives an estimated total of £34200 per
year as production overhead. A uniform administrative overhead per year at the cost of
£2320 was included in the model. Labour time was calculated by required labour time of
the operator. The operation of one run on ipro 8000 SLA system requires 2 hours of
labour time of the technician. The labour time is based on 1 hour of time for setting of
machine and loading of material vat and 1 hour of time for removing the parts and post
processing of the fabricated parts. However, in the initial model with one machine and
one technician, the labour cost of £39980 is included as the annual salary of the
technician.
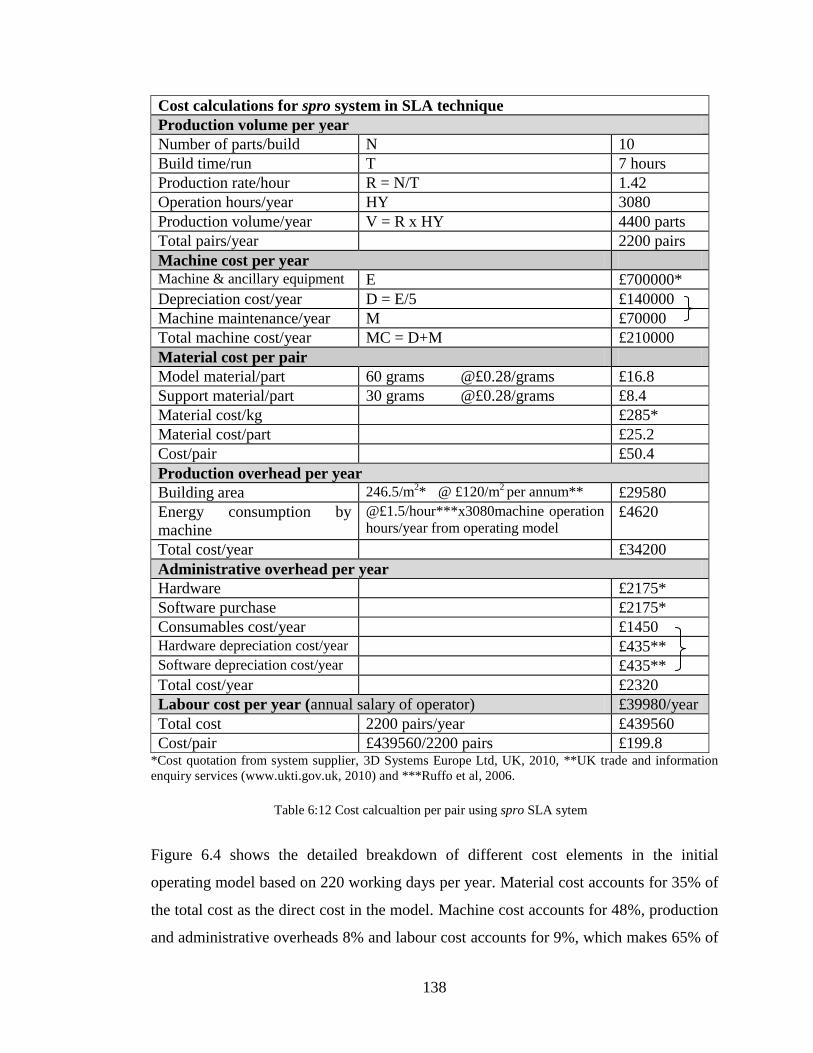
138
Cost calculations for spro system in SLA technique
Production volume per year
Number of parts/build N 10
Build time/run T 7 hours
Production rate/hour R = N/T 1.42
Operation hours/year HY 3080
Production volume/year V = R x HY 4400 parts
Total pairs/year 2200 pairs
Machine cost per year
Machine & ancillary equipment E £700000*
Depreciation cost/year D = E/5 £140000
Machine maintenance/year M £70000
Total machine cost/year MC = D+M £210000
Material cost per pair
Model material/part 60 grams @£0.28/grams £16.8
Support material/part 30 grams @£0.28/grams £8.4
Material cost/kg £285*
Material cost/part £25.2
Cost/pair £50.4
Production overhead per year
Building area 246.5/m2*
@ £120/m
2 per annum** £29580
Energy consumption by
machine
@£1.5/hour***x3080machine operation
hours/year from operating model £4620
Total cost/year £34200
Administrative overhead per year
Hardware £2175*
Software purchase £2175*
Consumables cost/year £1450
Hardware depreciation cost/year £435**
Software depreciation cost/year £435**
Total cost/year £2320
Labour cost per year (annual salary of operator) £39980/year
Total cost 2200 pairs/year £439560
Cost/pair £439560/2200 pairs £199.8 *Cost quotation from system supplier, 3D Systems Europe Ltd, UK, 2010, **UK trade and information
enquiry services (www.ukti.gov.uk, 2010) and ***Ruffo et al, 2006.
Figure 6.4 shows the detailed breakdown of different cost elements in the initial
operating model based on 220 working days per year. Material cost accounts for 35% of
the total cost as the direct cost in the model. Machine cost accounts for 48%, production
and administrative overheads 8% and labour cost accounts for 9%, which makes 65% of
Table 6:12 Cost calcualtion per pair using spro SLA sytem
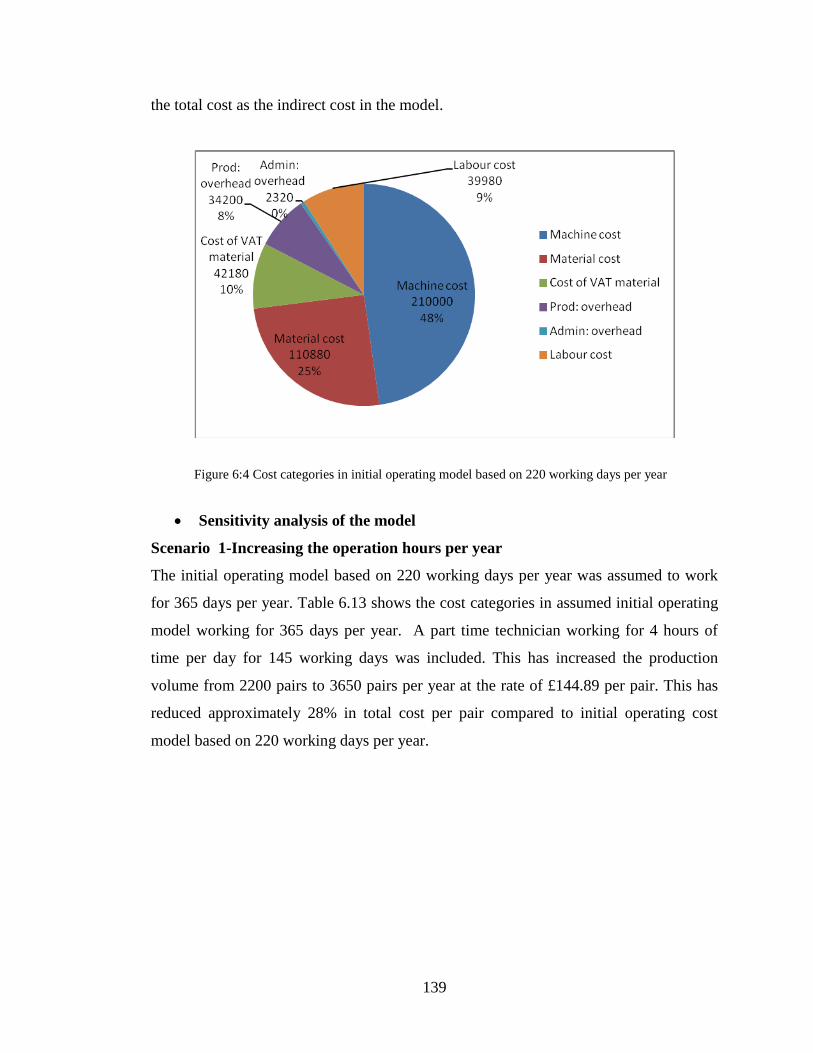
139
the total cost as the indirect cost in the model.
Sensitivity analysis of the model
Scenario 1-Increasing the operation hours per year
The initial operating model based on 220 working days per year was assumed to work
for 365 days per year. Table 6.13 shows the cost categories in assumed initial operating
model working for 365 days per year. A part time technician working for 4 hours of
time per day for 145 working days was included. This has increased the production
volume from 2200 pairs to 3650 pairs per year at the rate of £144.89 per pair. This has
reduced approximately 28% in total cost per pair compared to initial operating cost
model based on 220 working days per year.
Figure 6:4 Cost categories in initial operating model based on 220 working days per year
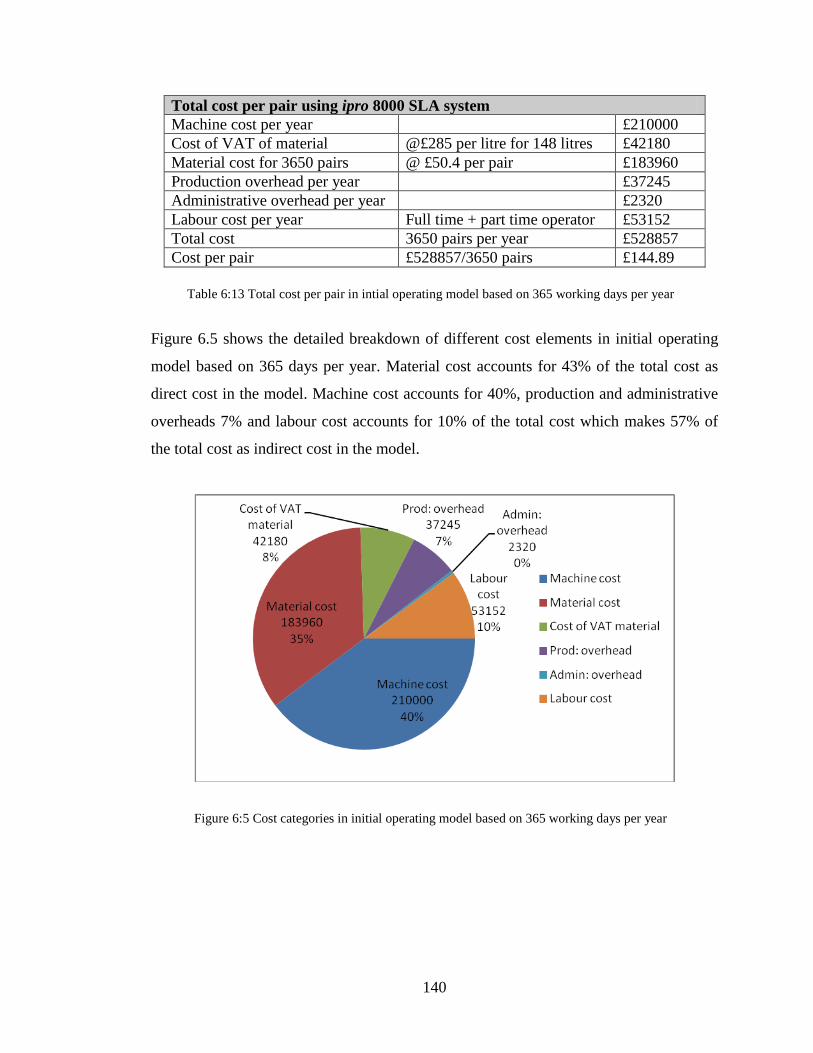
140
Total cost per pair using ipro 8000 SLA system
Machine cost per year £210000
Cost of VAT of material @£285 per litre for 148 litres £42180
Material cost for 3650 pairs @ £50.4 per pair £183960
Production overhead per year £37245
Administrative overhead per year £2320
Labour cost per year Full time + part time operator £53152
Total cost 3650 pairs per year £528857
Cost per pair £528857/3650 pairs £144.89
Figure 6.5 shows the detailed breakdown of different cost elements in initial operating
model based on 365 days per year. Material cost accounts for 43% of the total cost as
direct cost in the model. Machine cost accounts for 40%, production and administrative
overheads 7% and labour cost accounts for 10% of the total cost which makes 57% of
the total cost as indirect cost in the model.
Table 6:13 Total cost per pair in intial operating model based on 365 working days per year
Figure 6:5 Cost categories in initial operating model based on 365 working days per year
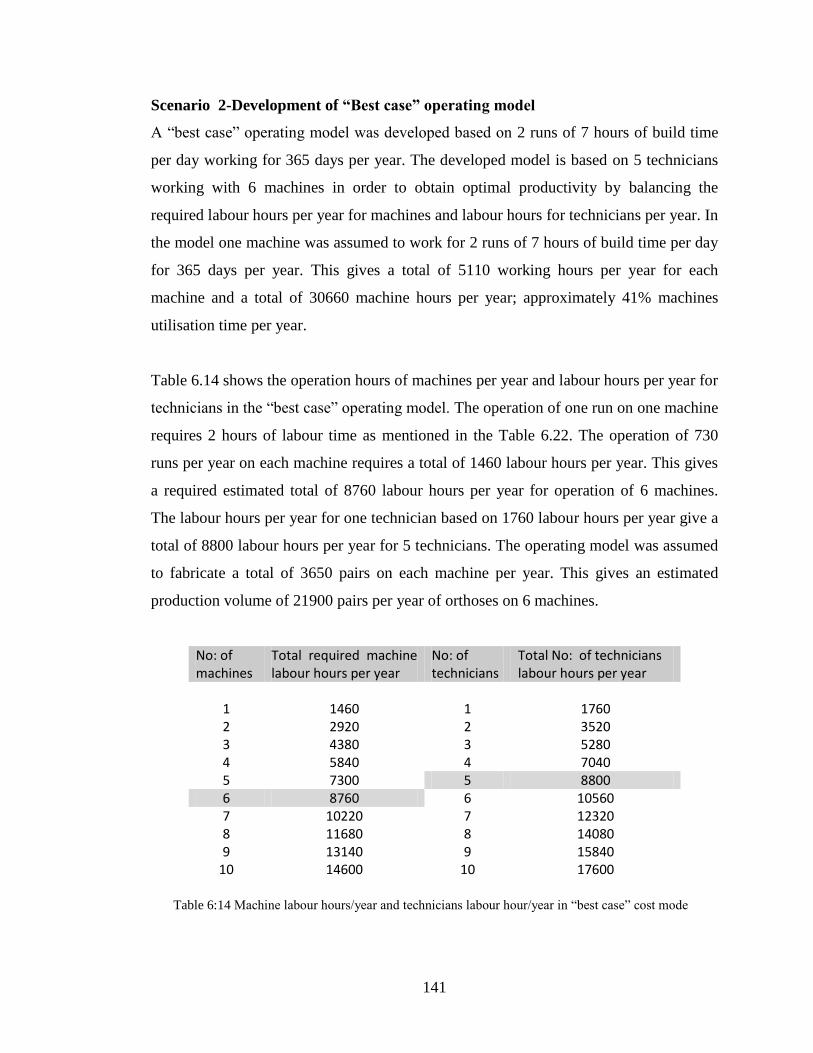
141
Scenario 2-Development of “Best case” operating model
A “best case” operating model was developed based on 2 runs of 7 hours of build time
per day working for 365 days per year. The developed model is based on 5 technicians
working with 6 machines in order to obtain optimal productivity by balancing the
required labour hours per year for machines and labour hours for technicians per year. In
the model one machine was assumed to work for 2 runs of 7 hours of build time per day
for 365 days per year. This gives a total of 5110 working hours per year for each
machine and a total of 30660 machine hours per year; approximately 41% machines
utilisation time per year.
Table 6.14 shows the operation hours of machines per year and labour hours per year for
technicians in the “best case” operating model. The operation of one run on one machine
requires 2 hours of labour time as mentioned in the Table 6.22. The operation of 730
runs per year on each machine requires a total of 1460 labour hours per year. This gives
a required estimated total of 8760 labour hours per year for operation of 6 machines.
The labour hours per year for one technician based on 1760 labour hours per year give a
total of 8800 labour hours per year for 5 technicians. The operating model was assumed
to fabricate a total of 3650 pairs on each machine per year. This gives an estimated
production volume of 21900 pairs per year of orthoses on 6 machines.
No: of machines
Total required machine labour hours per year
No: of technicians
Total No: of technicians labour hours per year
1 1460 1 1760 2 2920 2 3520 3 4380 3 5280 4 5840 4 7040 5 7300 5 8800 6 8760 6 10560 7 10220 7 12320 8 11680 8 14080 9 13140 9 15840
10 14600 10 17600
Table 6:14 Machine labour hours/year and technicians labour hour/year in “best case” cost mode
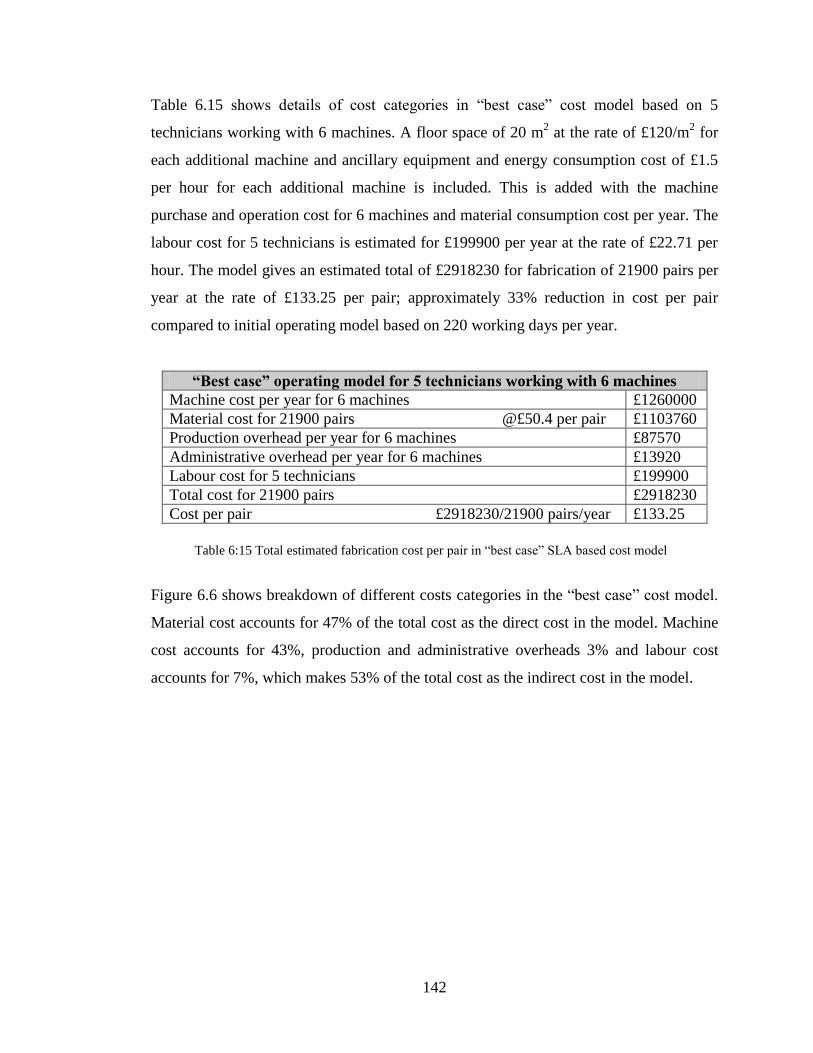
142
Table 6.15 shows details of cost categories in “best case” cost model based on 5
technicians working with 6 machines. A floor space of 20 m2 at the rate of £120/m
2 for
each additional machine and ancillary equipment and energy consumption cost of £1.5
per hour for each additional machine is included. This is added with the machine
purchase and operation cost for 6 machines and material consumption cost per year. The
labour cost for 5 technicians is estimated for £199900 per year at the rate of £22.71 per
hour. The model gives an estimated total of £2918230 for fabrication of 21900 pairs per
year at the rate of £133.25 per pair; approximately 33% reduction in cost per pair
compared to initial operating model based on 220 working days per year.
“Best case” operating model for 5 technicians working with 6 machines
Machine cost per year for 6 machines £1260000
Material cost for 21900 pairs @£50.4 per pair £1103760
Production overhead per year for 6 machines £87570
Administrative overhead per year for 6 machines £13920
Labour cost for 5 technicians £199900
Total cost for 21900 pairs £2918230
Cost per pair £2918230/21900 pairs/year £133.25
Figure 6.6 shows breakdown of different costs categories in the “best case” cost model.
Material cost accounts for 47% of the total cost as the direct cost in the model. Machine
cost accounts for 43%, production and administrative overheads 3% and labour cost
accounts for 7%, which makes 53% of the total cost as the indirect cost in the model.
Table 6:15 Total estimated fabrication cost per pair in “best case” SLA based cost model
143
6.4.4 Cost and lead-time modelling for polyjet technique using Connex 500
system
In polyjet technique using Connex 500 system one machine was assumed to work for
one run of 30 hours of build time for 220 working days per year. Production volume per
year was calculated from the model. Connex 500 system has a build volume of 500
(length), 400 (width) and 200 mm (height) in which 10 parts can be fitted per build. A
build time of 30 hours per run for fabrication of 10 parts was given by Objet Studio™
machine controlling software. The machine was assumed to work for 220 days per year
in which a total of 110 runs can be operated. This gives a total of 3300 hours per year at
the rate of 30 hours of build time per run; utilisation of 37% of machine time per year.
Table 6.16 shows an estimated total cost of £190755 for fabrication of 550 pairs per year
at the rate of £346.82 per pair. Machine cost per year was calculated by depreciation
cost of machine and 10% of actual cost of machine as the maintenance cost per year.
The depreciation time for machine was set for 5 years. This gives an estimated total of
£57000 as the machine cost per year. Material was cost calculated by weighing the
material consumed in the model part and material consumed in support structure.
Figure 6:6 Cost categories in “best case” SLA based cost model.
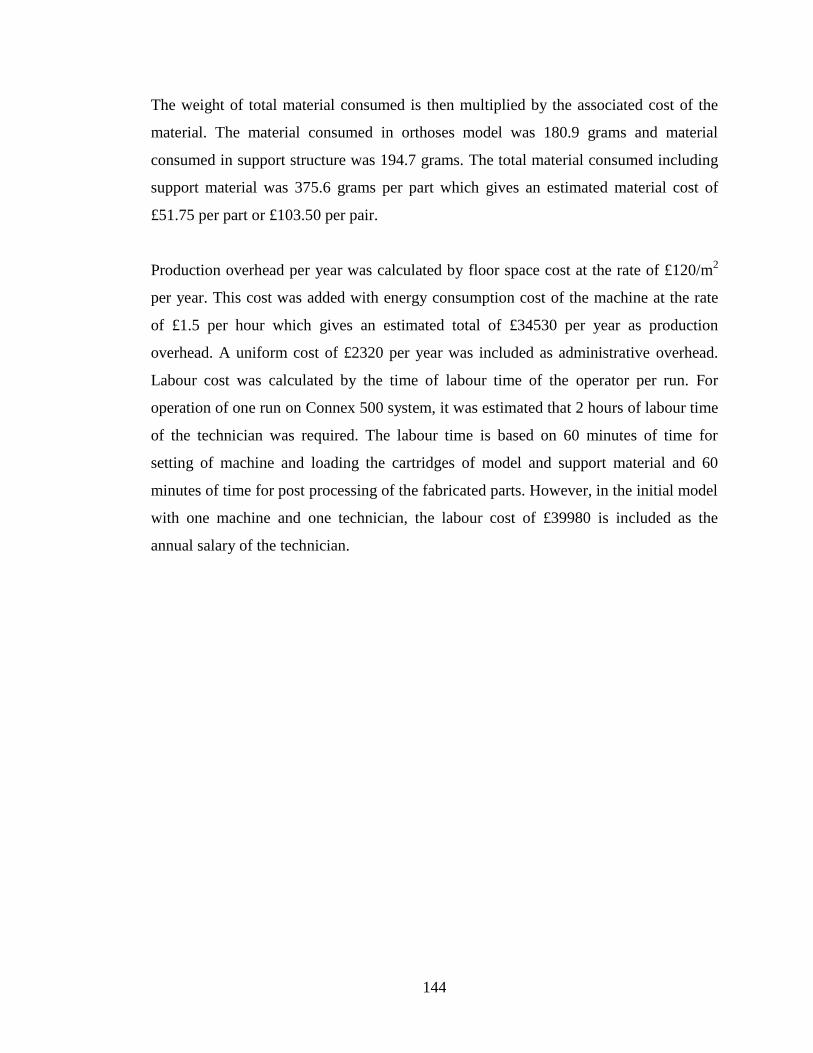
144
The weight of total material consumed is then multiplied by the associated cost of the
material. The material consumed in orthoses model was 180.9 grams and material
consumed in support structure was 194.7 grams. The total material consumed including
support material was 375.6 grams per part which gives an estimated material cost of
£51.75 per part or £103.50 per pair.
Production overhead per year was calculated by floor space cost at the rate of £120/m2
per year. This cost was added with energy consumption cost of the machine at the rate
of £1.5 per hour which gives an estimated total of £34530 per year as production
overhead. A uniform cost of £2320 per year was included as administrative overhead.
Labour cost was calculated by the time of labour time of the operator per run. For
operation of one run on Connex 500 system, it was estimated that 2 hours of labour time
of the technician was required. The labour time is based on 60 minutes of time for
setting of machine and loading the cartridges of model and support material and 60
minutes of time for post processing of the fabricated parts. However, in the initial model
with one machine and one technician, the labour cost of £39980 is included as the
annual salary of the technician.
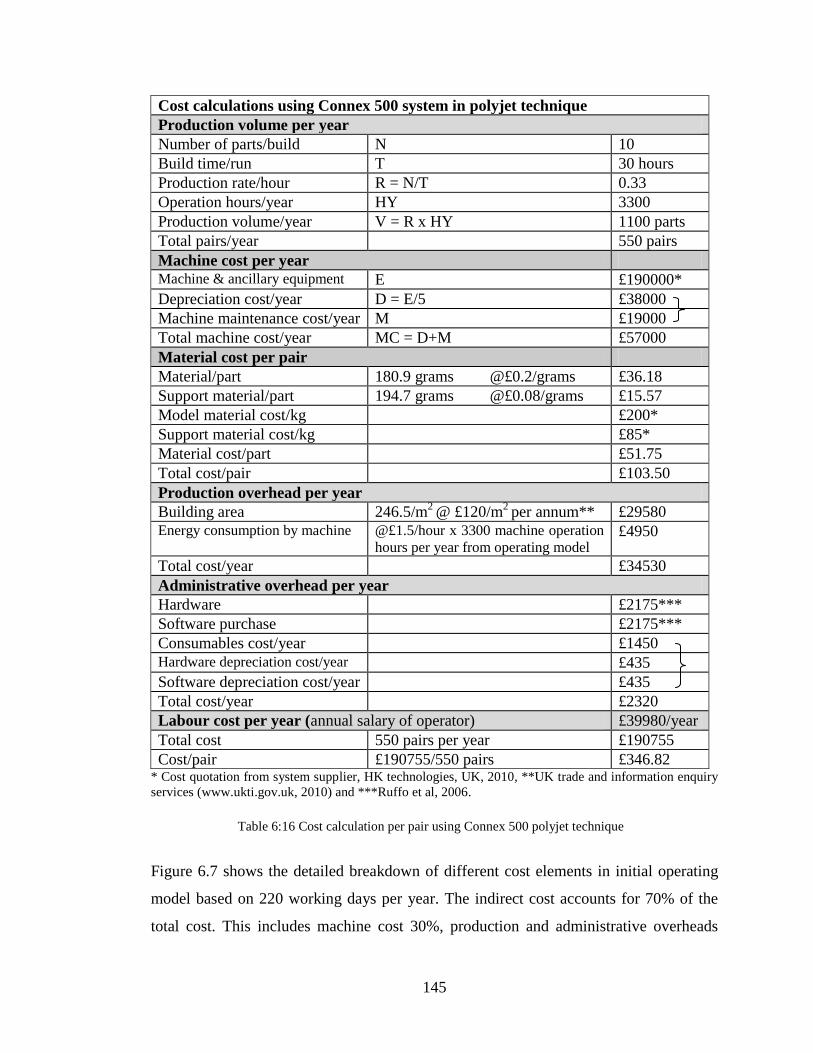
145
Cost calculations using Connex 500 system in polyjet technique
Production volume per year
Number of parts/build N 10
Build time/run T 30 hours
Production rate/hour R = N/T 0.33
Operation hours/year HY 3300
Production volume/year V = R x HY 1100 parts
Total pairs/year 550 pairs
Machine cost per year
Machine & ancillary equipment E £190000*
Depreciation cost/year D = E/5 £38000
Machine maintenance cost/year M £19000
Total machine cost/year MC = D+M £57000
Material cost per pair
Material/part 180.9 grams @£0.2/grams £36.18
Support material/part 194.7 grams @£0.08/grams £15.57
Model material cost/kg £200*
Support material cost/kg £85*
Material cost/part £51.75
Total cost/pair £103.50
Production overhead per year
Building area 246.5/m2
@ £120/m2
per annum** £29580
Energy consumption by machine @£1.5/hour x 3300 machine operation
hours per year from operating model £4950
Total cost/year £34530
Administrative overhead per year
Hardware £2175***
Software purchase £2175***
Consumables cost/year £1450
Hardware depreciation cost/year £435
Software depreciation cost/year £435
Total cost/year £2320
Labour cost per year (annual salary of operator) £39980/year
Total cost 550 pairs per year £190755
Cost/pair £190755/550 pairs £346.82 * Cost quotation from system supplier, HK technologies, UK, 2010, **UK trade and information enquiry
services (www.ukti.gov.uk, 2010) and ***Ruffo et al, 2006.
Figure 6.7 shows the detailed breakdown of different cost elements in initial operating
model based on 220 working days per year. The indirect cost accounts for 70% of the
total cost. This includes machine cost 30%, production and administrative overheads
Table 6:16 Cost calculation per pair using Connex 500 polyjet technique
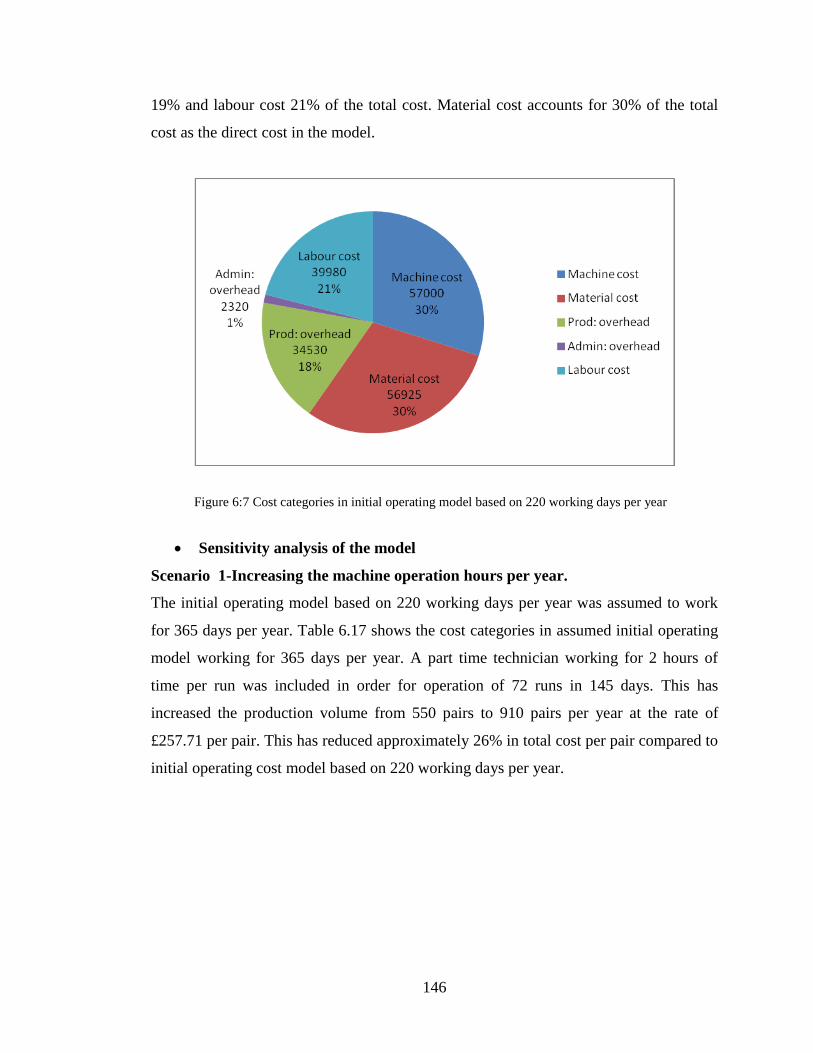
146
19% and labour cost 21% of the total cost. Material cost accounts for 30% of the total
cost as the direct cost in the model.
Sensitivity analysis of the model
Scenario 1-Increasing the machine operation hours per year.
The initial operating model based on 220 working days per year was assumed to work
for 365 days per year. Table 6.17 shows the cost categories in assumed initial operating
model working for 365 days per year. A part time technician working for 2 hours of
time per run was included in order for operation of 72 runs in 145 days. This has
increased the production volume from 550 pairs to 910 pairs per year at the rate of
£257.71 per pair. This has reduced approximately 26% in total cost per pair compared to
initial operating cost model based on 220 working days per year.
Figure 6:7 Cost categories in initial operating model based on 220 working days per year
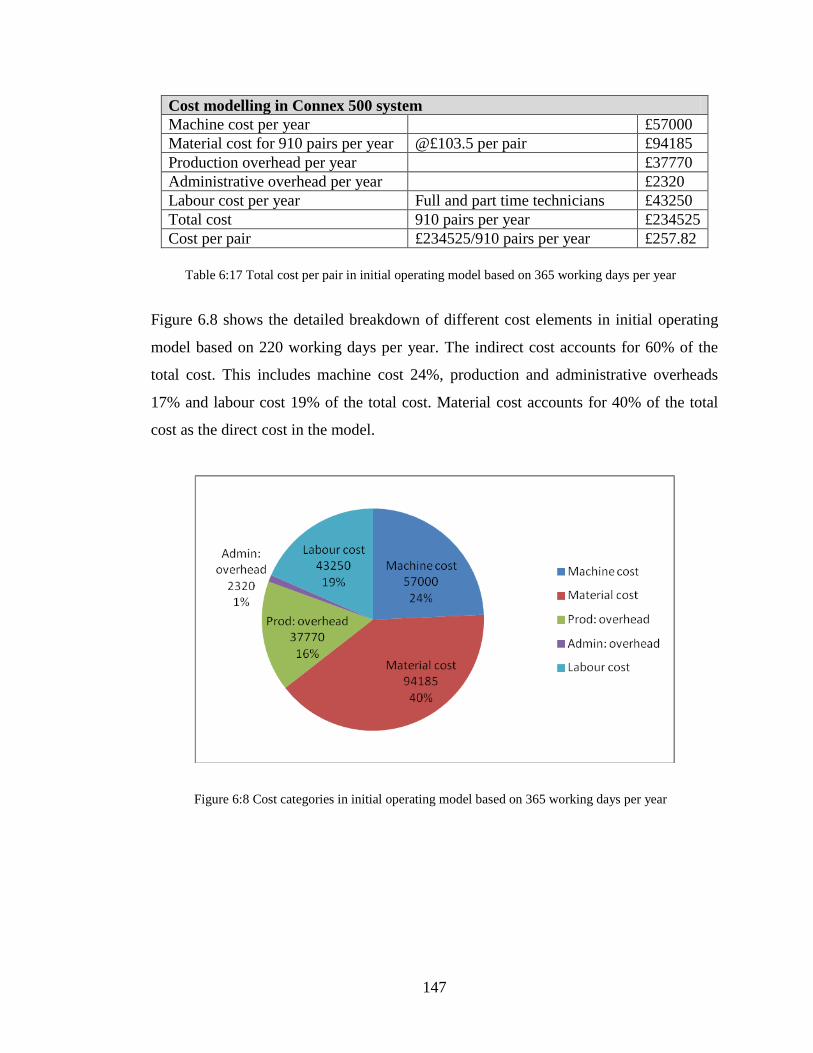
147
Cost modelling in Connex 500 system
Machine cost per year £57000
Material cost for 910 pairs per year @£103.5 per pair £94185
Production overhead per year £37770
Administrative overhead per year £2320
Labour cost per year Full and part time technicians £43250
Total cost 910 pairs per year £234525
Cost per pair £234525/910 pairs per year £257.82
Figure 6.8 shows the detailed breakdown of different cost elements in initial operating
model based on 220 working days per year. The indirect cost accounts for 60% of the
total cost. This includes machine cost 24%, production and administrative overheads
17% and labour cost 19% of the total cost. Material cost accounts for 40% of the total
cost as the direct cost in the model.
Table 6:17 Total cost per pair in initial operating model based on 365 working days per year
Figure 6:8 Cost categories in initial operating model based on 365 working days per year
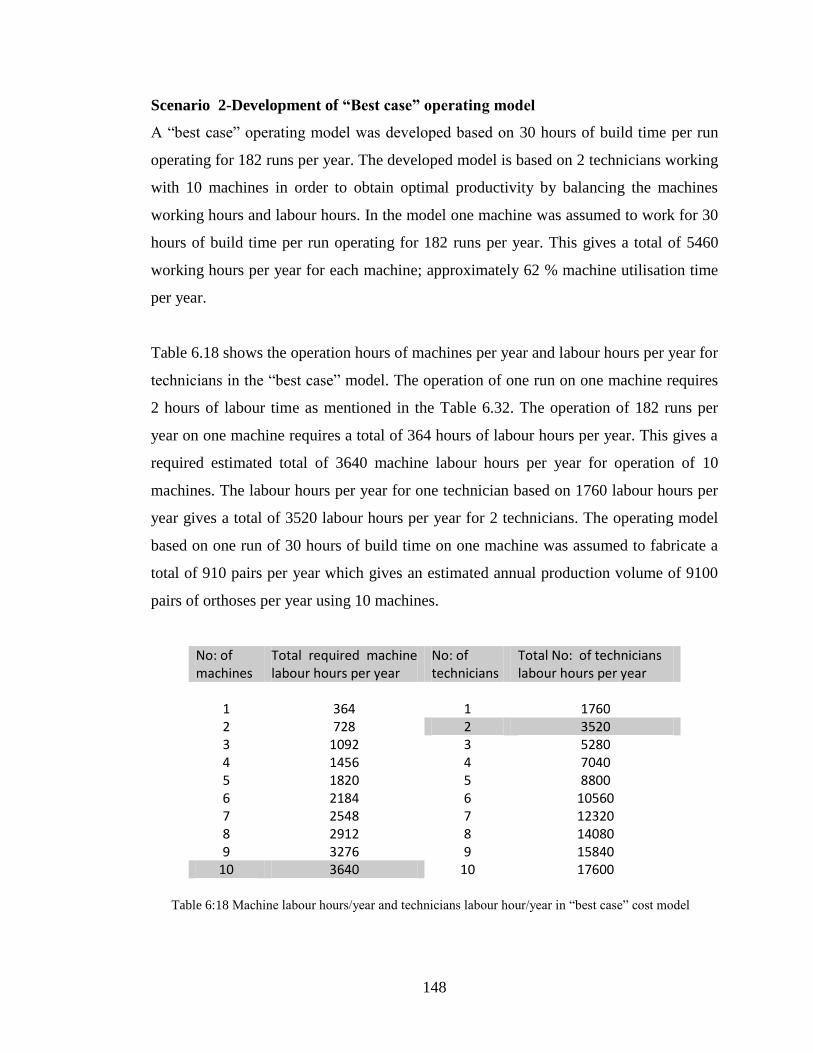
148
Scenario 2-Development of “Best case” operating model
A “best case” operating model was developed based on 30 hours of build time per run
operating for 182 runs per year. The developed model is based on 2 technicians working
with 10 machines in order to obtain optimal productivity by balancing the machines
working hours and labour hours. In the model one machine was assumed to work for 30
hours of build time per run operating for 182 runs per year. This gives a total of 5460
working hours per year for each machine; approximately 62 % machine utilisation time
per year.
Table 6.18 shows the operation hours of machines per year and labour hours per year for
technicians in the “best case” model. The operation of one run on one machine requires
2 hours of labour time as mentioned in the Table 6.32. The operation of 182 runs per
year on one machine requires a total of 364 hours of labour hours per year. This gives a
required estimated total of 3640 machine labour hours per year for operation of 10
machines. The labour hours per year for one technician based on 1760 labour hours per
year gives a total of 3520 labour hours per year for 2 technicians. The operating model
based on one run of 30 hours of build time on one machine was assumed to fabricate a
total of 910 pairs per year which gives an estimated annual production volume of 9100
pairs of orthoses per year using 10 machines.
No: of machines
Total required machine labour hours per year
No: of technicians
Total No: of technicians labour hours per year
1 364 1 1760 2 728 2 3520 3 1092 3 5280 4 1456 4 7040 5 1820 5 8800 6 2184 6 10560 7 2548 7 12320 8 2912 8 14080 9 3276 9 15840
10 3640 10 17600
Table 6:18 Machine labour hours/year and technicians labour hour/year in “best case” cost model
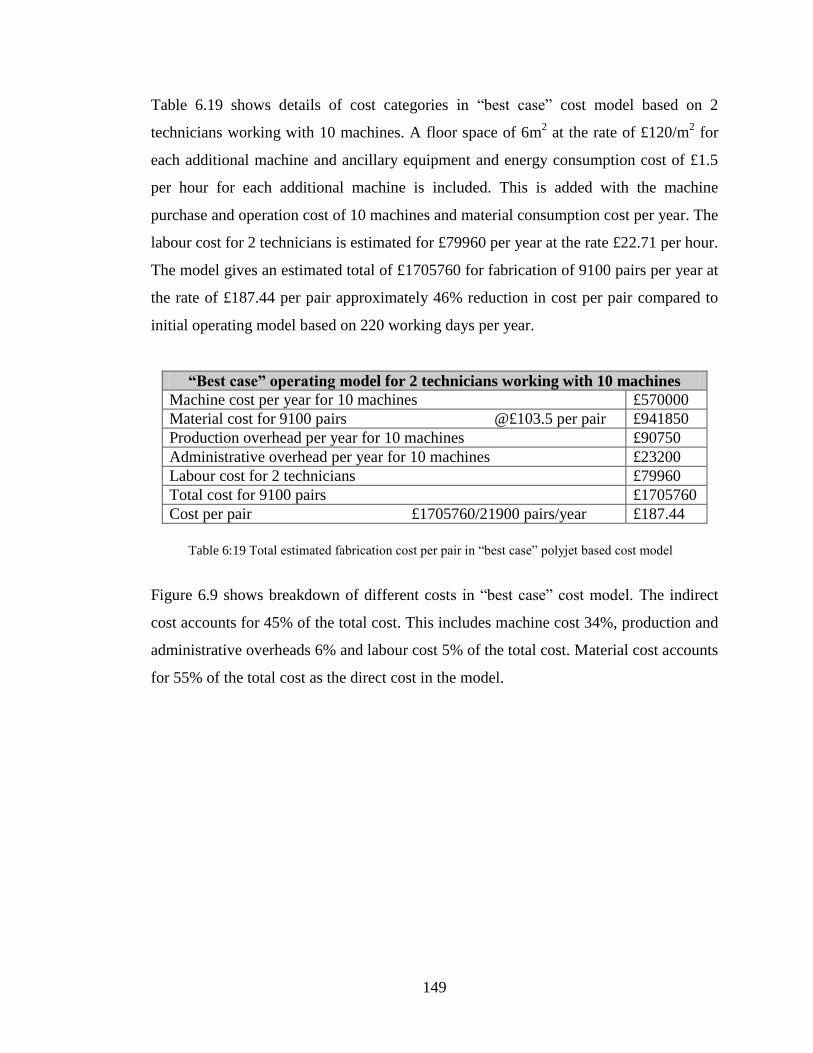
149
Table 6.19 shows details of cost categories in “best case” cost model based on 2
technicians working with 10 machines. A floor space of 6m2 at the rate of £120/m
2 for
each additional machine and ancillary equipment and energy consumption cost of £1.5
per hour for each additional machine is included. This is added with the machine
purchase and operation cost of 10 machines and material consumption cost per year. The
labour cost for 2 technicians is estimated for £79960 per year at the rate £22.71 per hour.
The model gives an estimated total of £1705760 for fabrication of 9100 pairs per year at
the rate of £187.44 per pair approximately 46% reduction in cost per pair compared to
initial operating model based on 220 working days per year.
“Best case” operating model for 2 technicians working with 10 machines
Machine cost per year for 10 machines £570000
Material cost for 9100 pairs @£103.5 per pair £941850
Production overhead per year for 10 machines £90750
Administrative overhead per year for 10 machines £23200
Labour cost for 2 technicians £79960
Total cost for 9100 pairs £1705760
Cost per pair £1705760/21900 pairs/year £187.44
Figure 6.9 shows breakdown of different costs in “best case” cost model. The indirect
cost accounts for 45% of the total cost. This includes machine cost 34%, production and
administrative overheads 6% and labour cost 5% of the total cost. Material cost accounts
for 55% of the total cost as the direct cost in the model.
Table 6:19 Total estimated fabrication cost per pair in “best case” polyjet based cost model
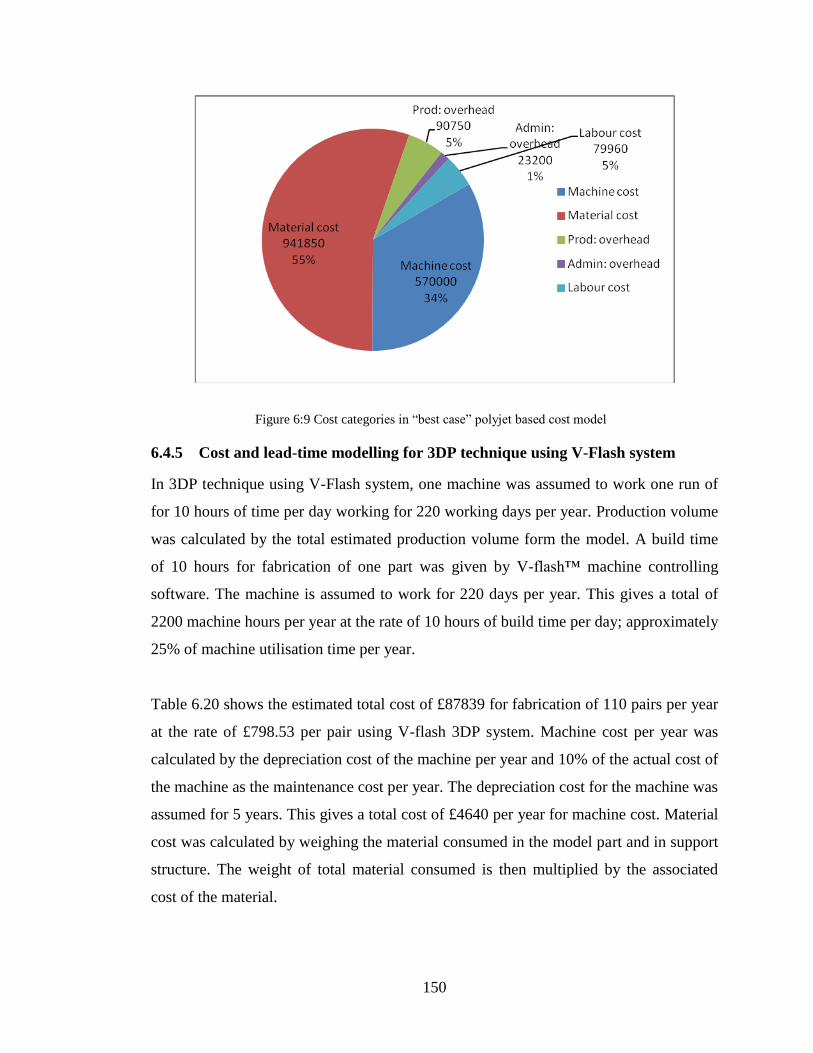
150
6.4.5 Cost and lead-time modelling for 3DP technique using V-Flash system
In 3DP technique using V-Flash system, one machine was assumed to work one run of
for 10 hours of time per day working for 220 working days per year. Production volume
was calculated by the total estimated production volume form the model. A build time
of 10 hours for fabrication of one part was given by V-flash™ machine controlling
software. The machine is assumed to work for 220 days per year. This gives a total of
2200 machine hours per year at the rate of 10 hours of build time per day; approximately
25% of machine utilisation time per year.
Table 6.20 shows the estimated total cost of £87839 for fabrication of 110 pairs per year
at the rate of £798.53 per pair using V-flash 3DP system. Machine cost per year was
calculated by the depreciation cost of the machine per year and 10% of the actual cost of
the machine as the maintenance cost per year. The depreciation cost for the machine was
assumed for 5 years. This gives a total cost of £4640 per year for machine cost. Material
cost was calculated by weighing the material consumed in the model part and in support
structure. The weight of total material consumed is then multiplied by the associated
cost of the material.
Figure 6:9 Cost categories in “best case” polyjet based cost model
151
The material consumed in the fabrication of orthoses model was 52 grams and material
consumed in support structure was 29 grams. The total material consumed including
support material was 81 grams per part. This gives an estimated material cost of £36.45
per part or £72.90 per pair cost. Production overhead per year was calculated by floor
space cost at the rate of £120/m2 per year. This cost was added with energy consumption
cost of the machine at the rate of £1.5 per hour. This gives an estimated total of £32880
per year as production overhead. A uniform cost of £2320 per year was included as
administrative overhead.
Labour cost was calculated by the required labour time for operation of machine. For the
operation of one run using V-Flash system, it was estimated that one hour of labour time
of the technician was required. The labour time is based on 30 minutes of the time for
setting of the machine and loading material cartridge and 30 minutes of time for
removing the part and post processing the fabricated part. However, in the initial model
with one machine and one technician, the labour cost of £39980 was included as the
annual salary of the technician.
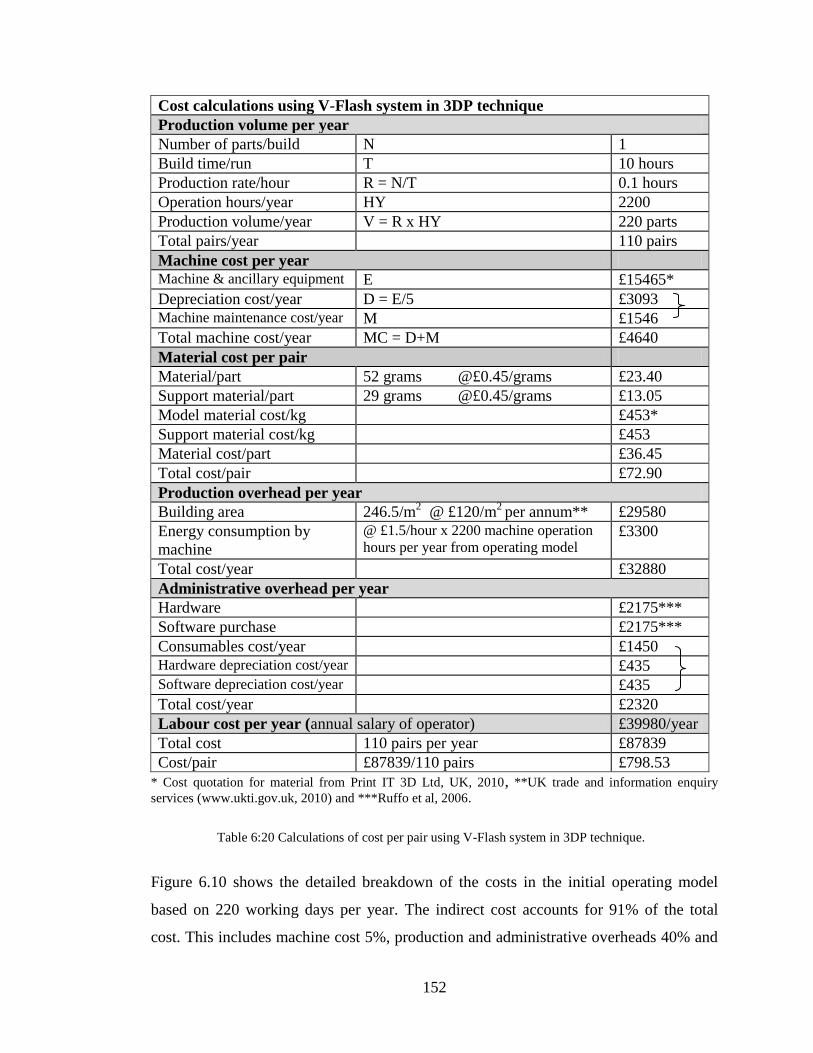
152
Cost calculations using V-Flash system in 3DP technique
Production volume per year
Number of parts/build N 1
Build time/run T 10 hours
Production rate/hour R = N/T 0.1 hours
Operation hours/year HY 2200
Production volume/year V = R x HY 220 parts
Total pairs/year 110 pairs
Machine cost per year
Machine & ancillary equipment E £15465*
Depreciation cost/year D = E/5 £3093
Machine maintenance cost/year M £1546
Total machine cost/year MC = D+M £4640
Material cost per pair
Material/part 52 grams @£0.45/grams £23.40
Support material/part 29 grams @£0.45/grams £13.05
Model material cost/kg £453*
Support material cost/kg £453
Material cost/part £36.45
Total cost/pair £72.90
Production overhead per year
Building area 246.5/m2
@ £120/m2
per annum** £29580
Energy consumption by
machine
@ £1.5/hour x 2200 machine operation
hours per year from operating model £3300
Total cost/year £32880
Administrative overhead per year
Hardware £2175***
Software purchase £2175***
Consumables cost/year £1450
Hardware depreciation cost/year £435
Software depreciation cost/year £435
Total cost/year £2320
Labour cost per year (annual salary of operator) £39980/year
Total cost 110 pairs per year £87839
Cost/pair £87839/110 pairs £798.53
* Cost quotation for material from Print IT 3D Ltd, UK, 2010, **UK trade and information enquiry
services (www.ukti.gov.uk, 2010) and ***Ruffo et al, 2006.
Figure 6.10 shows the detailed breakdown of the costs in the initial operating model
based on 220 working days per year. The indirect cost accounts for 91% of the total
cost. This includes machine cost 5%, production and administrative overheads 40% and
Table 6:20 Calculations of cost per pair using V-Flash system in 3DP technique.
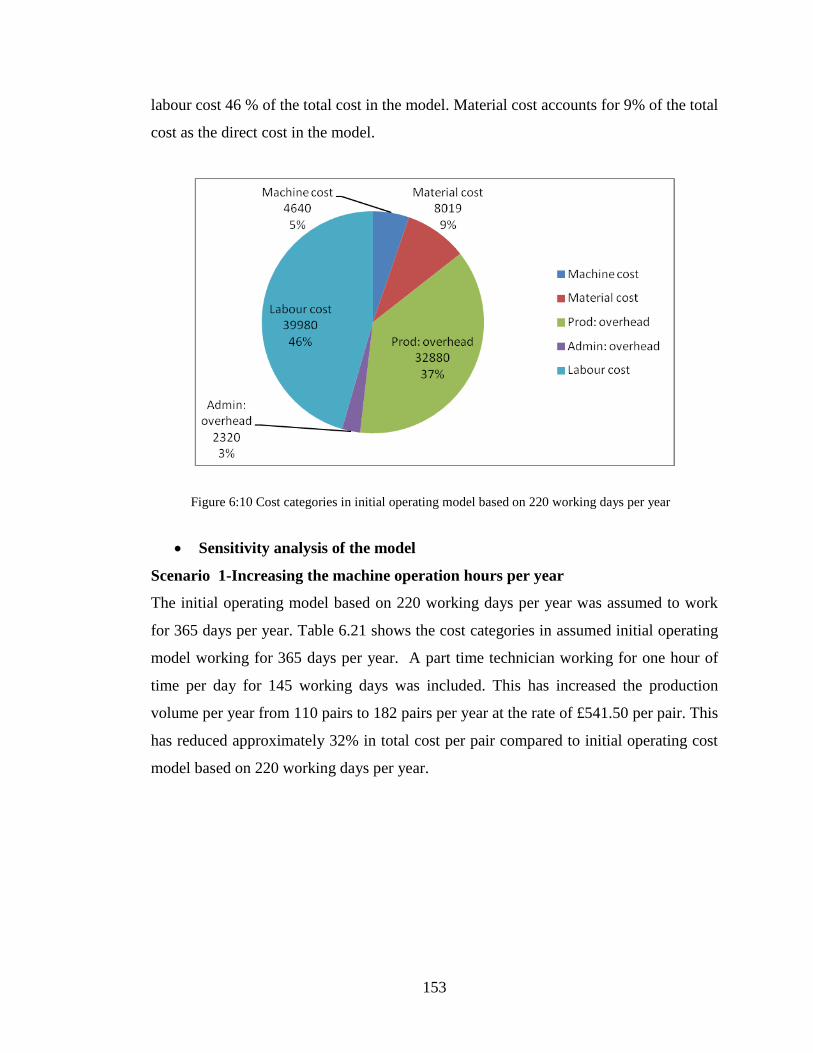
153
labour cost 46 % of the total cost in the model. Material cost accounts for 9% of the total
cost as the direct cost in the model.
Sensitivity analysis of the model
Scenario 1-Increasing the machine operation hours per year
The initial operating model based on 220 working days per year was assumed to work
for 365 days per year. Table 6.21 shows the cost categories in assumed initial operating
model working for 365 days per year. A part time technician working for one hour of
time per day for 145 working days was included. This has increased the production
volume per year from 110 pairs to 182 pairs per year at the rate of £541.50 per pair. This
has reduced approximately 32% in total cost per pair compared to initial operating cost
model based on 220 working days per year.
Figure 6:10 Cost categories in initial operating model based on 220 working days per year
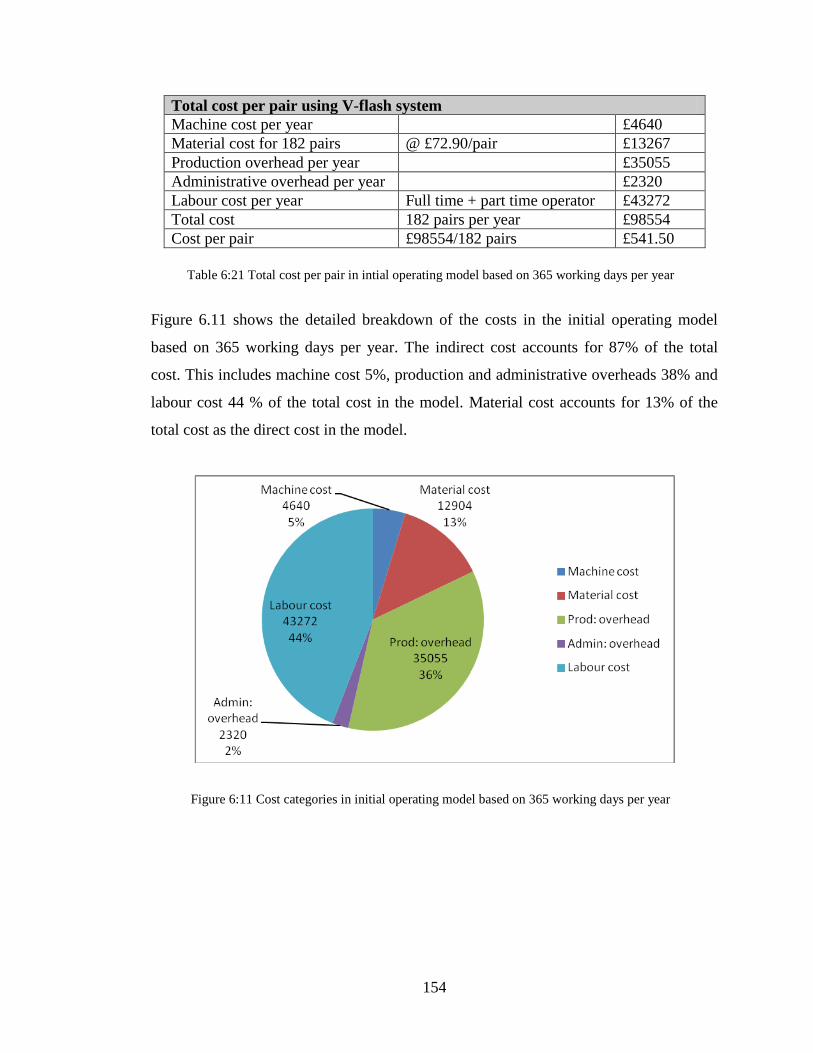
154
Total cost per pair using V-flash system
Machine cost per year £4640
Material cost for 182 pairs @ £72.90/pair £13267
Production overhead per year £35055
Administrative overhead per year £2320
Labour cost per year Full time + part time operator £43272
Total cost 182 pairs per year £98554
Cost per pair £98554/182 pairs £541.50
Figure 6.11 shows the detailed breakdown of the costs in the initial operating model
based on 365 working days per year. The indirect cost accounts for 87% of the total
cost. This includes machine cost 5%, production and administrative overheads 38% and
labour cost 44 % of the total cost in the model. Material cost accounts for 13% of the
total cost as the direct cost in the model.
Table 6:21 Total cost per pair in intial operating model based on 365 working days per year
Figure 6:11 Cost categories in initial operating model based on 365 working days per year
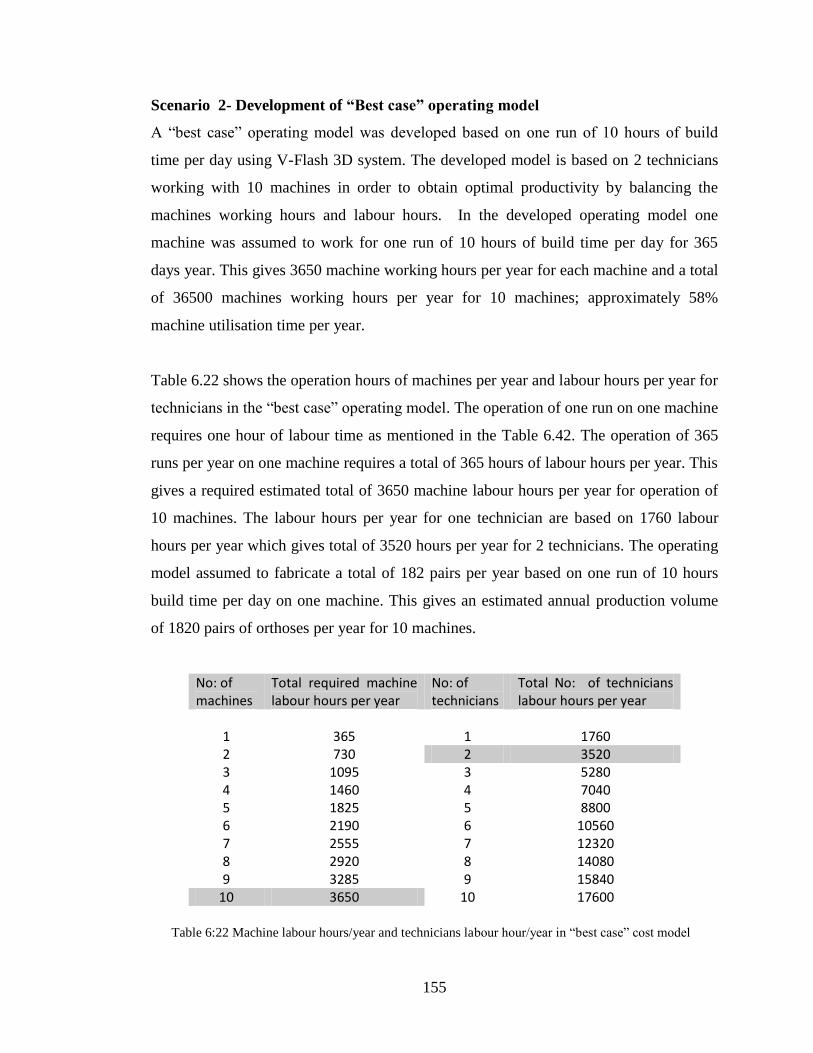
155
Scenario 2- Development of “Best case” operating model
A “best case” operating model was developed based on one run of 10 hours of build
time per day using V-Flash 3D system. The developed model is based on 2 technicians
working with 10 machines in order to obtain optimal productivity by balancing the
machines working hours and labour hours. In the developed operating model one
machine was assumed to work for one run of 10 hours of build time per day for 365
days year. This gives 3650 machine working hours per year for each machine and a total
of 36500 machines working hours per year for 10 machines; approximately 58%
machine utilisation time per year.
Table 6.22 shows the operation hours of machines per year and labour hours per year for
technicians in the “best case” operating model. The operation of one run on one machine
requires one hour of labour time as mentioned in the Table 6.42. The operation of 365
runs per year on one machine requires a total of 365 hours of labour hours per year. This
gives a required estimated total of 3650 machine labour hours per year for operation of
10 machines. The labour hours per year for one technician are based on 1760 labour
hours per year which gives total of 3520 hours per year for 2 technicians. The operating
model assumed to fabricate a total of 182 pairs per year based on one run of 10 hours
build time per day on one machine. This gives an estimated annual production volume
of 1820 pairs of orthoses per year for 10 machines.
No: of machines
Total required machine labour hours per year
No: of technicians
Total No: of technicians labour hours per year
1 365 1 1760 2 730 2 3520 3 1095 3 5280 4 1460 4 7040 5 1825 5 8800 6 2190 6 10560 7 2555 7 12320 8 2920 8 14080 9 3285 9 15840
10 3650 10 17600
Table 6:22 Machine labour hours/year and technicians labour hour/year in “best case” cost model
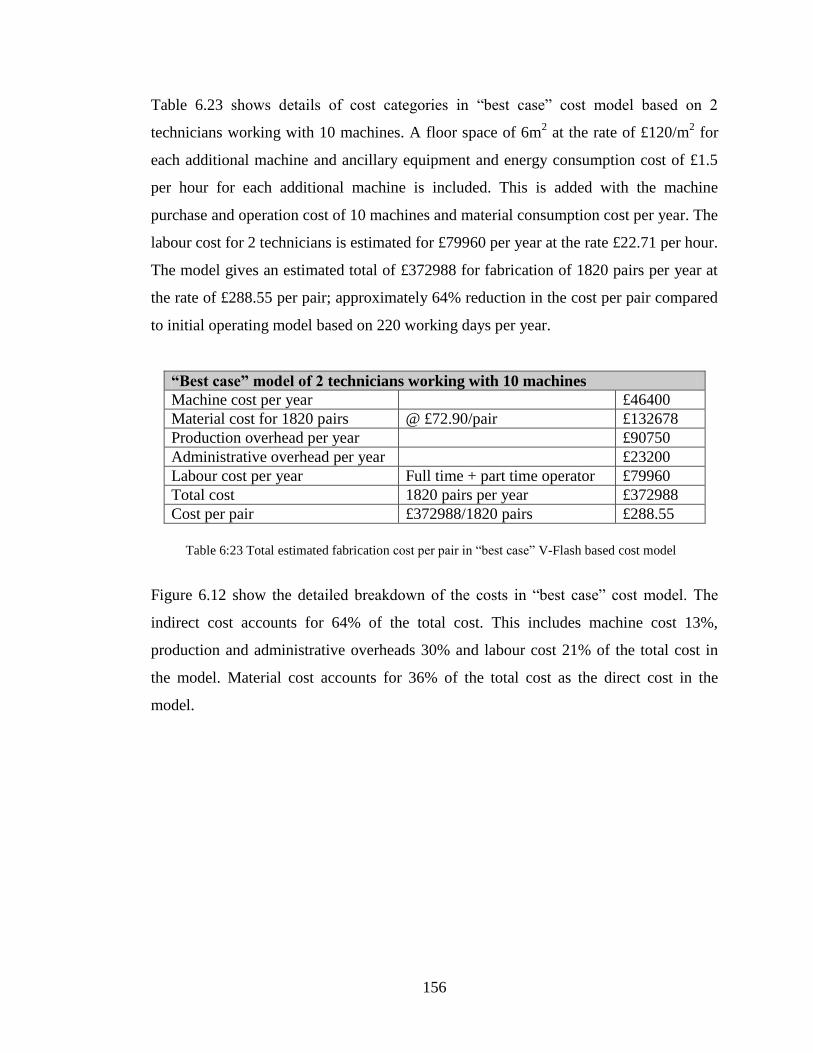
156
Table 6.23 shows details of cost categories in “best case” cost model based on 2
technicians working with 10 machines. A floor space of 6m2 at the rate of £120/m
2 for
each additional machine and ancillary equipment and energy consumption cost of £1.5
per hour for each additional machine is included. This is added with the machine
purchase and operation cost of 10 machines and material consumption cost per year. The
labour cost for 2 technicians is estimated for £79960 per year at the rate £22.71 per hour.
The model gives an estimated total of £372988 for fabrication of 1820 pairs per year at
the rate of £288.55 per pair; approximately 64% reduction in the cost per pair compared
to initial operating model based on 220 working days per year.
“Best case” model of 2 technicians working with 10 machines
Machine cost per year £46400
Material cost for 1820 pairs @ £72.90/pair £132678
Production overhead per year £90750
Administrative overhead per year £23200
Labour cost per year Full time + part time operator £79960
Total cost 1820 pairs per year £372988
Cost per pair £372988/1820 pairs £288.55
Figure 6.12 show the detailed breakdown of the costs in “best case” cost model. The
indirect cost accounts for 64% of the total cost. This includes machine cost 13%,
production and administrative overheads 30% and labour cost 21% of the total cost in
the model. Material cost accounts for 36% of the total cost as the direct cost in the
model.
Table 6:23 Total estimated fabrication cost per pair in “best case” V-Flash based cost model
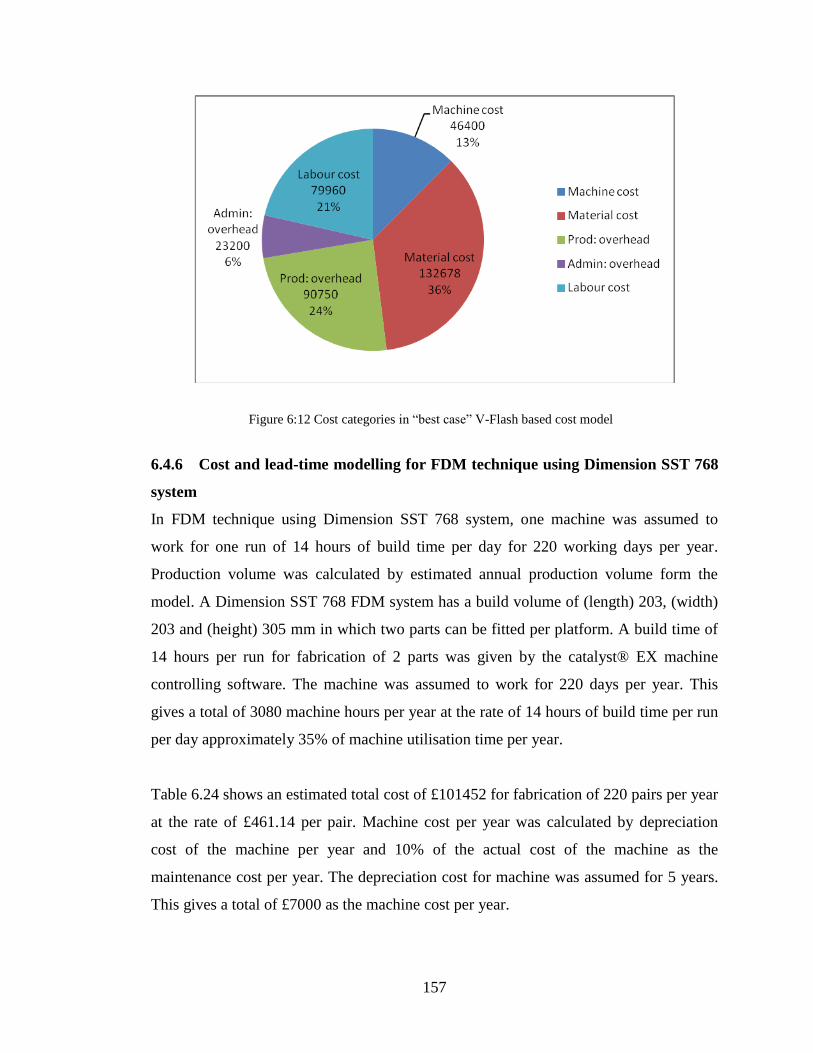
157
6.4.6 Cost and lead-time modelling for FDM technique using Dimension SST 768
system
In FDM technique using Dimension SST 768 system, one machine was assumed to
work for one run of 14 hours of build time per day for 220 working days per year.
Production volume was calculated by estimated annual production volume form the
model. A Dimension SST 768 FDM system has a build volume of (length) 203, (width)
203 and (height) 305 mm in which two parts can be fitted per platform. A build time of
14 hours per run for fabrication of 2 parts was given by the catalyst® EX machine
controlling software. The machine was assumed to work for 220 days per year. This
gives a total of 3080 machine hours per year at the rate of 14 hours of build time per run
per day approximately 35% of machine utilisation time per year.
Table 6.24 shows an estimated total cost of £101452 for fabrication of 220 pairs per year
at the rate of £461.14 per pair. Machine cost per year was calculated by depreciation
cost of the machine per year and 10% of the actual cost of the machine as the
maintenance cost per year. The depreciation cost for machine was assumed for 5 years.
This gives a total of £7000 as the machine cost per year.
Figure 6:12 Cost categories in “best case” V-Flash based cost model
158
Material cost was calculated by weighing the material consumed in model part and
material consumed in support structure. The weight of total material consumed was then
multiplied by associated cost of the material. The material consumed in fabrication of
orthoses model was 90 grams and material consumed in support structure was 30 grams.
The total material consumed was 120 grams per part which gives an estimated material
cost of £40.80 per part or cost of £81.60 per pair. Production overhead per year was
calculated by floor space cost at the rate of £120/m2 per year. This cost was added with
energy consumption cost of the machine at the rate of £1.5 per hour. This gives an
estimated total of £34200 per year as production overhead. A uniform cost of £2320 per
year was included as administrative overhead.
Labour cost was calculated by required labour time for operation of machine. For
operation of one run using Dimension SST 768 FDM system it was estimated that 2
hours of labour time of the technician was required. The labour time is based on 60
minutes of time for setting of machine and loading the cartridges of model and support
material and 60 minutes of time for post processing of fabricated parts. However, in the
initial model with one machine and one technician, the labour cost of £39980 per year is
included as the annual salary of the technician for 1760 labour hours per year, based on
220 working days per year.
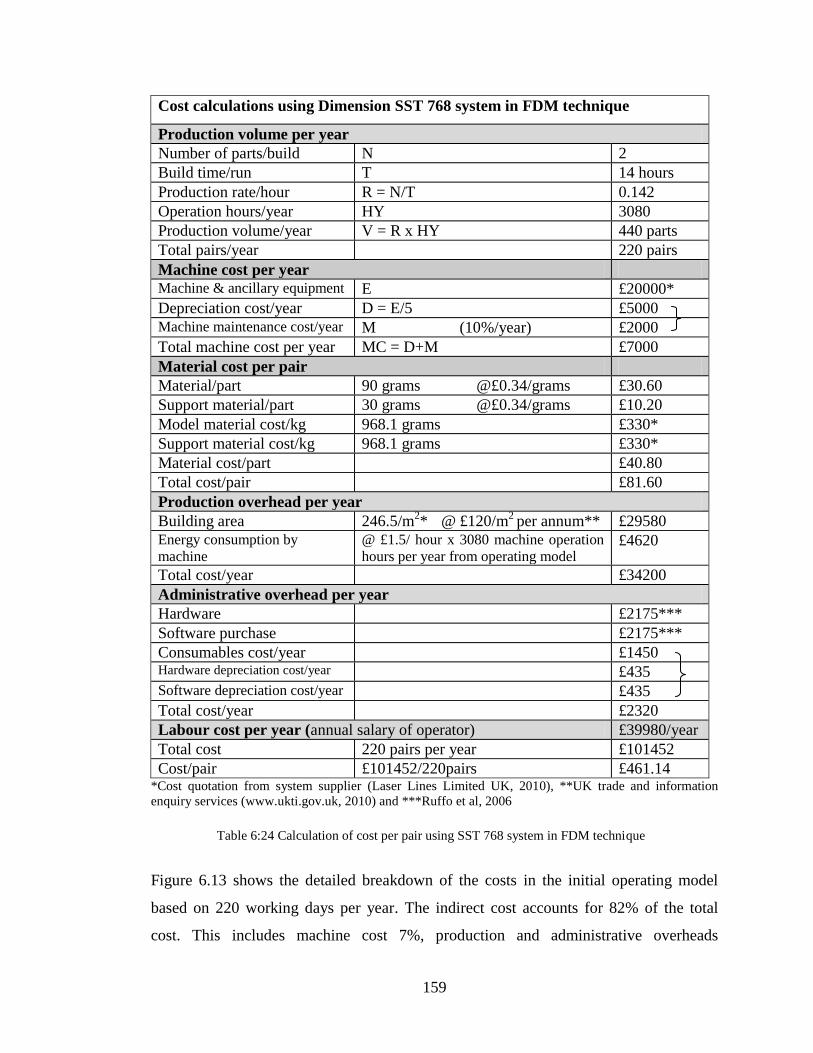
159
Cost calculations using Dimension SST 768 system in FDM technique
Production volume per year
Number of parts/build N 2
Build time/run T 14 hours
Production rate/hour R = N/T 0.142
Operation hours/year HY 3080
Production volume/year V = R x HY 440 parts
Total pairs/year 220 pairs
Machine cost per year
Machine & ancillary equipment E £20000*
Depreciation cost/year D = E/5 £5000
Machine maintenance cost/year M (10%/year) £2000
Total machine cost per year MC = D+M £7000
Material cost per pair
Material/part 90 grams @£0.34/grams £30.60
Support material/part 30 grams @£0.34/grams £10.20
Model material cost/kg 968.1 grams £330*
Support material cost/kg 968.1 grams £330*
Material cost/part £40.80
Total cost/pair £81.60
Production overhead per year
Building area 246.5/m2*
@ £120/m
2 per annum** £29580
Energy consumption by
machine
@ £1.5/ hour x 3080 machine operation
hours per year from operating model £4620
Total cost/year £34200
Administrative overhead per year
Hardware £2175***
Software purchase £2175***
Consumables cost/year £1450 Hardware depreciation cost/year £435
Software depreciation cost/year £435
Total cost/year £2320
Labour cost per year (annual salary of operator) £39980/year
Total cost 220 pairs per year £101452
Cost/pair £101452/220pairs £461.14 *Cost quotation from system supplier (Laser Lines Limited UK, 2010), **UK trade and information
enquiry services (www.ukti.gov.uk, 2010) and ***Ruffo et al, 2006
Figure 6.13 shows the detailed breakdown of the costs in the initial operating model
based on 220 working days per year. The indirect cost accounts for 82% of the total
cost. This includes machine cost 7%, production and administrative overheads
Table 6:24 Calculation of cost per pair using SST 768 system in FDM technique
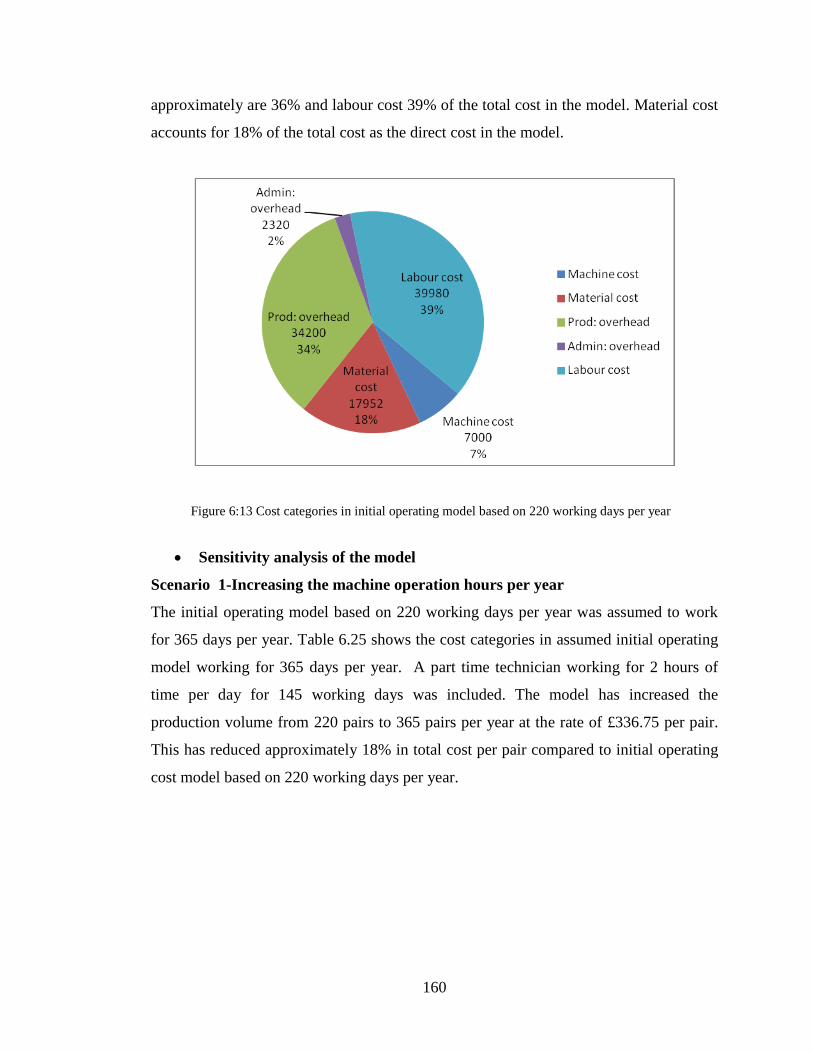
160
approximately are 36% and labour cost 39% of the total cost in the model. Material cost
accounts for 18% of the total cost as the direct cost in the model.
Sensitivity analysis of the model
Scenario 1-Increasing the machine operation hours per year
The initial operating model based on 220 working days per year was assumed to work
for 365 days per year. Table 6.25 shows the cost categories in assumed initial operating
model working for 365 days per year. A part time technician working for 2 hours of
time per day for 145 working days was included. The model has increased the
production volume from 220 pairs to 365 pairs per year at the rate of £336.75 per pair.
This has reduced approximately 18% in total cost per pair compared to initial operating
cost model based on 220 working days per year.
Figure 6:13 Cost categories in initial operating model based on 220 working days per year
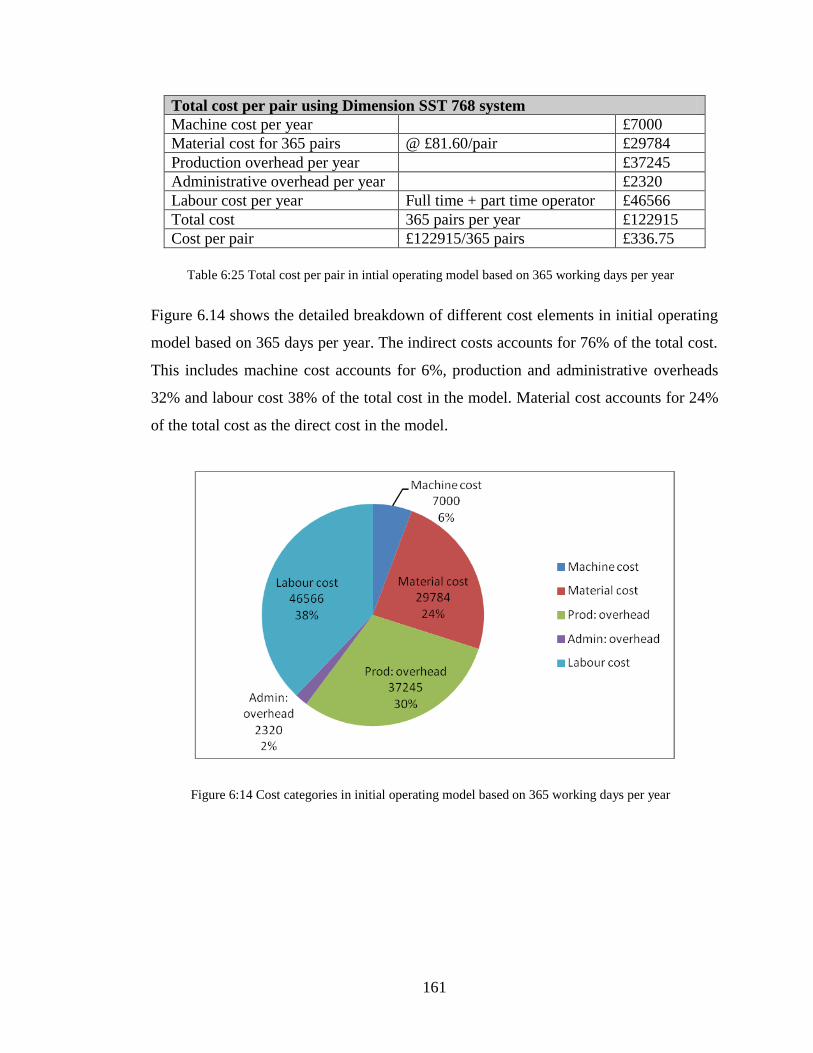
161
Total cost per pair using Dimension SST 768 system
Machine cost per year £7000
Material cost for 365 pairs @ £81.60/pair £29784
Production overhead per year £37245
Administrative overhead per year £2320
Labour cost per year Full time + part time operator £46566
Total cost 365 pairs per year £122915
Cost per pair £122915/365 pairs £336.75
Figure 6.14 shows the detailed breakdown of different cost elements in initial operating
model based on 365 days per year. The indirect costs accounts for 76% of the total cost.
This includes machine cost accounts for 6%, production and administrative overheads
32% and labour cost 38% of the total cost in the model. Material cost accounts for 24%
of the total cost as the direct cost in the model.
Table 6:25 Total cost per pair in intial operating model based on 365 working days per year
Figure 6:14 Cost categories in initial operating model based on 365 working days per year
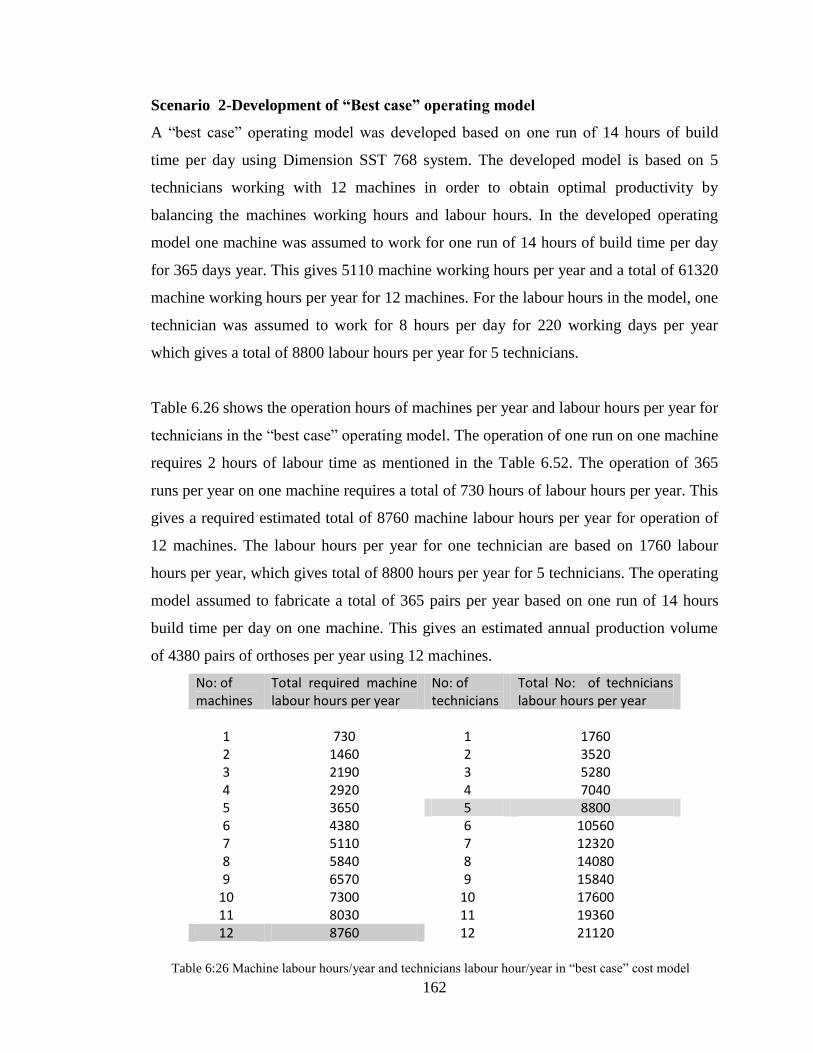
162
Scenario 2-Development of “Best case” operating model
A “best case” operating model was developed based on one run of 14 hours of build
time per day using Dimension SST 768 system. The developed model is based on 5
technicians working with 12 machines in order to obtain optimal productivity by
balancing the machines working hours and labour hours. In the developed operating
model one machine was assumed to work for one run of 14 hours of build time per day
for 365 days year. This gives 5110 machine working hours per year and a total of 61320
machine working hours per year for 12 machines. For the labour hours in the model, one
technician was assumed to work for 8 hours per day for 220 working days per year
which gives a total of 8800 labour hours per year for 5 technicians.
Table 6.26 shows the operation hours of machines per year and labour hours per year for
technicians in the “best case” operating model. The operation of one run on one machine
requires 2 hours of labour time as mentioned in the Table 6.52. The operation of 365
runs per year on one machine requires a total of 730 hours of labour hours per year. This
gives a required estimated total of 8760 machine labour hours per year for operation of
12 machines. The labour hours per year for one technician are based on 1760 labour
hours per year, which gives total of 8800 hours per year for 5 technicians. The operating
model assumed to fabricate a total of 365 pairs per year based on one run of 14 hours
build time per day on one machine. This gives an estimated annual production volume
of 4380 pairs of orthoses per year using 12 machines.
No: of machines
Total required machine labour hours per year
No: of technicians
Total No: of technicians labour hours per year
1 730 1 1760 2 1460 2 3520 3 2190 3 5280 4 2920 4 7040 5 3650 5 8800 6 4380 6 10560 7 5110 7 12320 8 5840 8 14080 9 6570 9 15840
10 7300 10 17600 11 8030 11 19360 12 8760 12 21120
Table 6:26 Machine labour hours/year and technicians labour hour/year in “best case” cost model
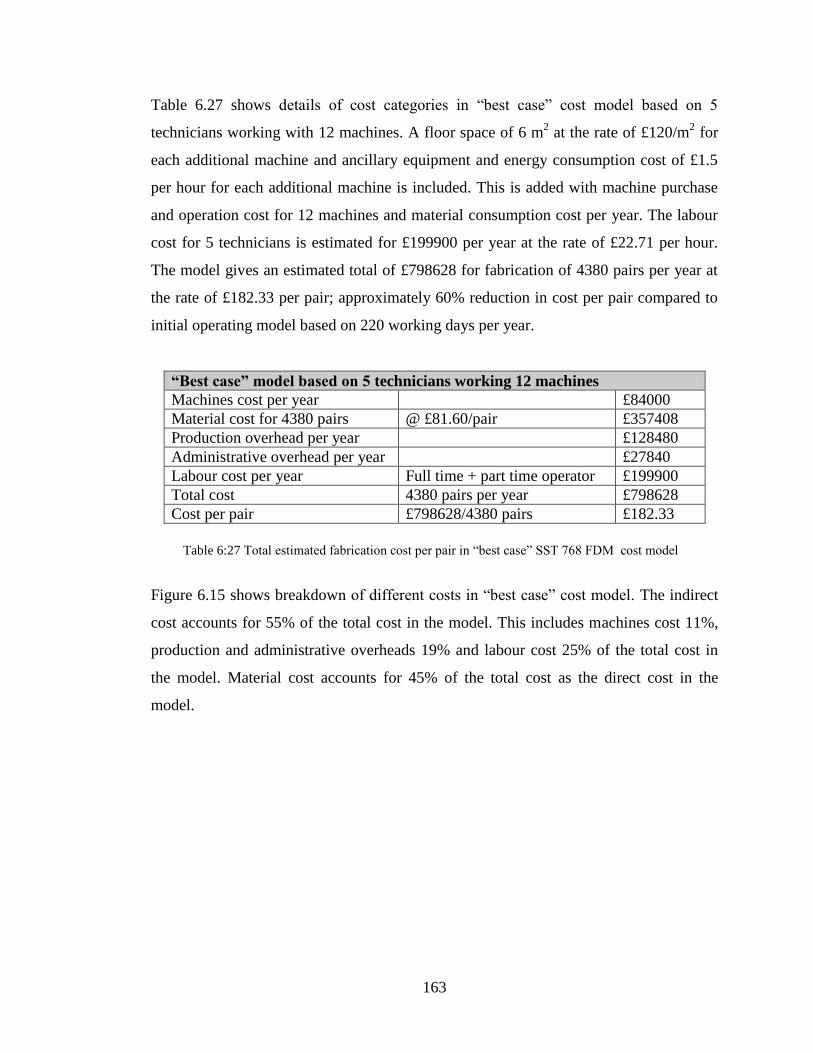
163
Table 6.27 shows details of cost categories in “best case” cost model based on 5
technicians working with 12 machines. A floor space of 6 m2 at the rate of £120/m
2 for
each additional machine and ancillary equipment and energy consumption cost of £1.5
per hour for each additional machine is included. This is added with machine purchase
and operation cost for 12 machines and material consumption cost per year. The labour
cost for 5 technicians is estimated for £199900 per year at the rate of £22.71 per hour.
The model gives an estimated total of £798628 for fabrication of 4380 pairs per year at
the rate of £182.33 per pair; approximately 60% reduction in cost per pair compared to
initial operating model based on 220 working days per year.
“Best case” model based on 5 technicians working 12 machines
Machines cost per year £84000
Material cost for 4380 pairs @ £81.60/pair £357408
Production overhead per year £128480
Administrative overhead per year £27840
Labour cost per year Full time + part time operator £199900
Total cost 4380 pairs per year £798628
Cost per pair £798628/4380 pairs £182.33
Figure 6.15 shows breakdown of different costs in “best case” cost model. The indirect
cost accounts for 55% of the total cost in the model. This includes machines cost 11%,
production and administrative overheads 19% and labour cost 25% of the total cost in
the model. Material cost accounts for 45% of the total cost as the direct cost in the
model.
Table 6:27 Total estimated fabrication cost per pair in “best case” SST 768 FDM cost model
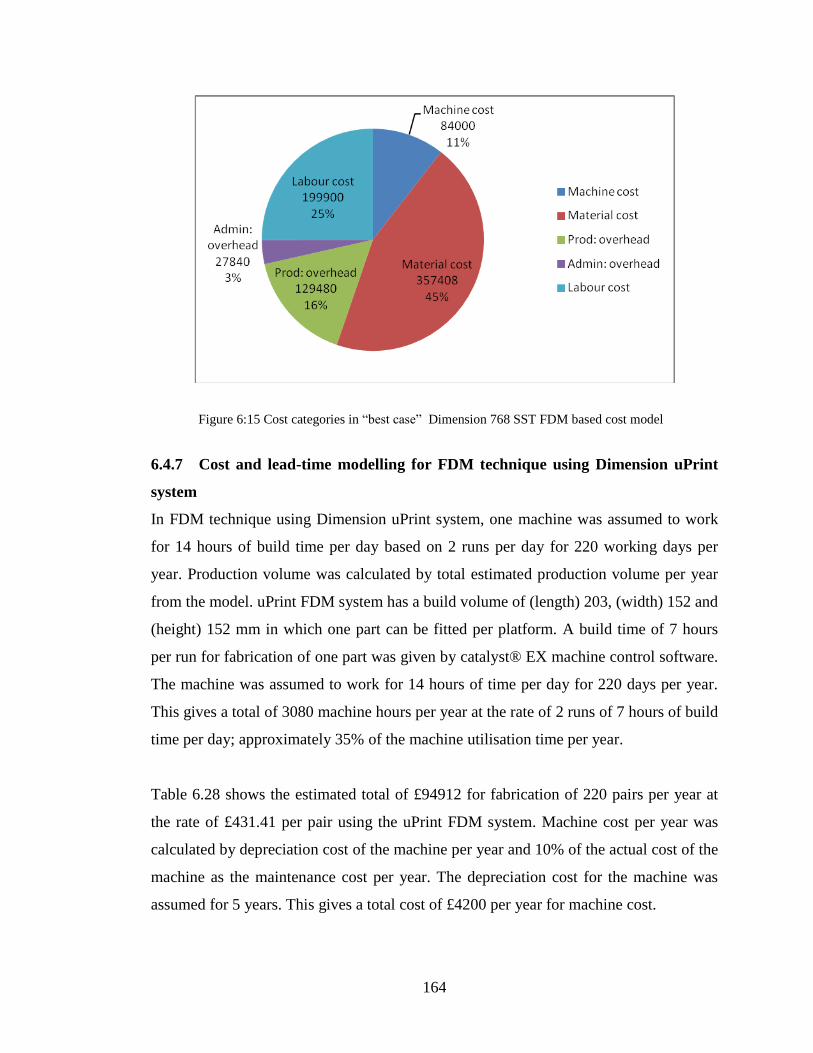
164
6.4.7 Cost and lead-time modelling for FDM technique using Dimension uPrint
system
In FDM technique using Dimension uPrint system, one machine was assumed to work
for 14 hours of build time per day based on 2 runs per day for 220 working days per
year. Production volume was calculated by total estimated production volume per year
from the model. uPrint FDM system has a build volume of (length) 203, (width) 152 and
(height) 152 mm in which one part can be fitted per platform. A build time of 7 hours
per run for fabrication of one part was given by catalyst® EX machine control software.
The machine was assumed to work for 14 hours of time per day for 220 days per year.
This gives a total of 3080 machine hours per year at the rate of 2 runs of 7 hours of build
time per day; approximately 35% of the machine utilisation time per year.
Table 6.28 shows the estimated total of £94912 for fabrication of 220 pairs per year at
the rate of £431.41 per pair using the uPrint FDM system. Machine cost per year was
calculated by depreciation cost of the machine per year and 10% of the actual cost of the
machine as the maintenance cost per year. The depreciation cost for the machine was
assumed for 5 years. This gives a total cost of £4200 per year for machine cost.
Figure 6:15 Cost categories in “best case” Dimension 768 SST FDM based cost model
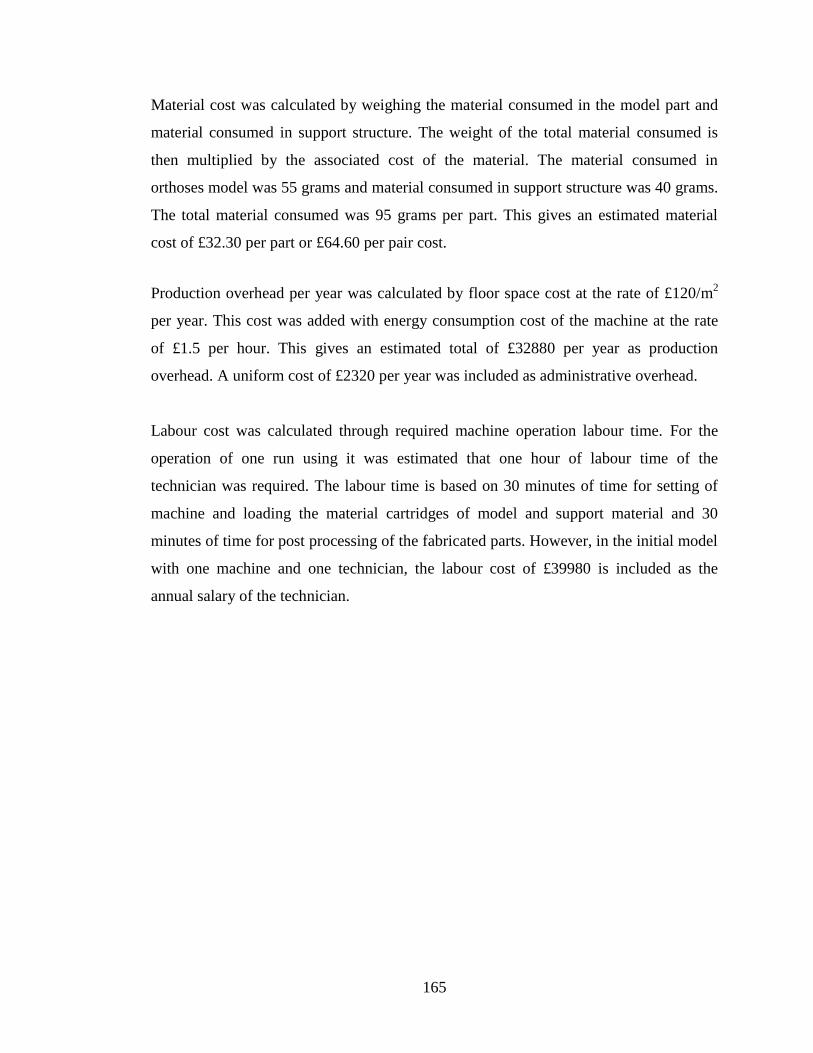
165
Material cost was calculated by weighing the material consumed in the model part and
material consumed in support structure. The weight of the total material consumed is
then multiplied by the associated cost of the material. The material consumed in
orthoses model was 55 grams and material consumed in support structure was 40 grams.
The total material consumed was 95 grams per part. This gives an estimated material
cost of £32.30 per part or £64.60 per pair cost.
Production overhead per year was calculated by floor space cost at the rate of £120/m2
per year. This cost was added with energy consumption cost of the machine at the rate
of £1.5 per hour. This gives an estimated total of £32880 per year as production
overhead. A uniform cost of £2320 per year was included as administrative overhead.
Labour cost was calculated through required machine operation labour time. For the
operation of one run using it was estimated that one hour of labour time of the
technician was required. The labour time is based on 30 minutes of time for setting of
machine and loading the material cartridges of model and support material and 30
minutes of time for post processing of the fabricated parts. However, in the initial model
with one machine and one technician, the labour cost of £39980 is included as the
annual salary of the technician.

166
Cost calculations using Dimension uPrint system in FDM technique
Production volume per year
Number of parts/build N 1
Build time/run T 7 hours
Production rate/hour R = N/T 0.142
Operation hours/year HY 3080
Production volume/year V = R x HY 440 parts
Total pairs/year 220 pairs
Machine cost per year
Machine & ancillary equipment E £14000*
Depreciation cost/year E/5 £2800
Machine maintenance cost/year M (10% /year) £1400
Total machine cost/year MC = D+M £4200
Material cost per pair
Material/part 55 grams @£0.34/grams £18.70
Support material/part 40 grams @£0.34/grams £13.60
Model material cost/kg 968.1 grams £330*
Support material cost/kg 968.1 grams £330*
Material cost/part £32.30
Total cost/pair £64.60
Production overhead per year
Building area 246.5/m2*
@ £120/m
2 per annum** £29580
Energy consumption by
machine
@ £1.5/hour x 3080 machine operation
hours per year from operating model £4620
Total cost/year £34200
Administrative overhead per year
Hardware £2175***
Software purchase £2175***
Consumables cost/year £1450
Hardware depreciation cost/year £435 Software depreciation cost/year £435
Total cost/year £2320
Labour cost per year (annual salary of operator) £39980/year
Total cost £94912
Cost/pair £94912/220 pairs £431.41 *Cost quotation from system supplier (Laser Lines Limited UK, 2010), **UK trade and information
enquiry services (www.ukti.gov.uk, 2010) and ***Ruffo et al, 2006
Figure 6.16 shows the detailed breakdown of the costs in the initial operating mode
based on 220 working days per year. The indirect cost accounts for 85% of the total
cost. This includes the production and administrative overheads 39%, labour cost 42%
Table 6:28 Calculations of cost per pair using uPrint system in FDM technique
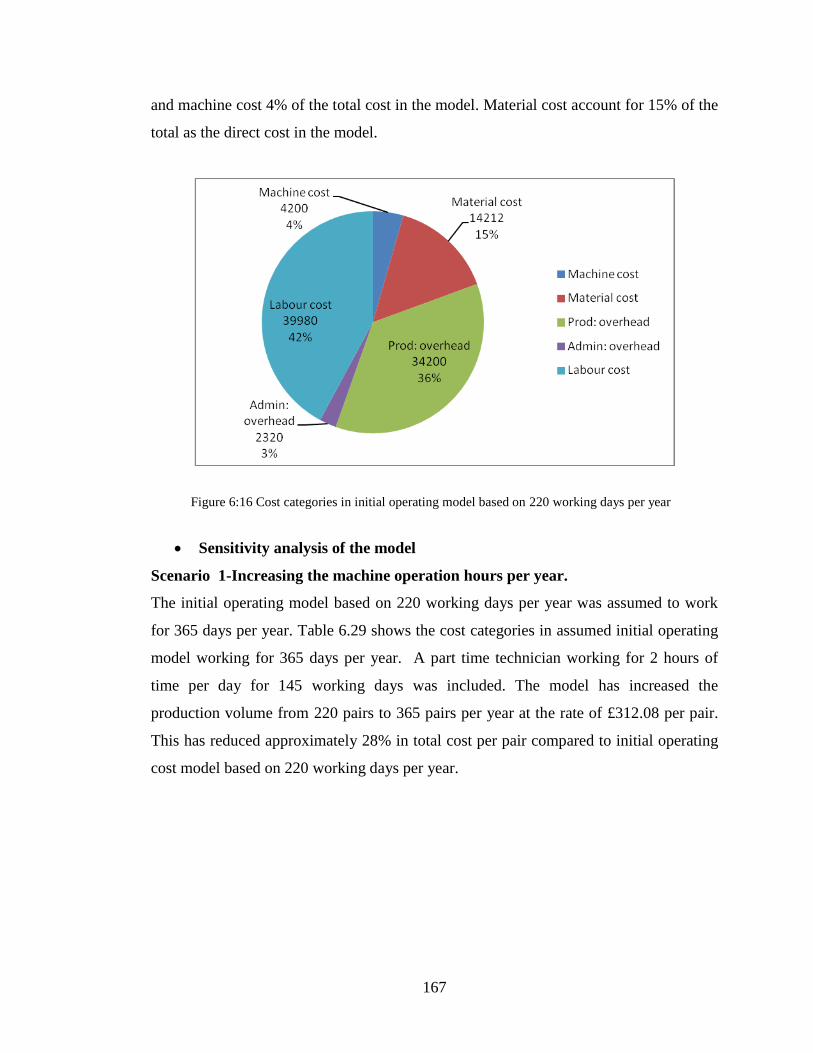
167
and machine cost 4% of the total cost in the model. Material cost account for 15% of the
total as the direct cost in the model.
Sensitivity analysis of the model
Scenario 1-Increasing the machine operation hours per year.
The initial operating model based on 220 working days per year was assumed to work
for 365 days per year. Table 6.29 shows the cost categories in assumed initial operating
model working for 365 days per year. A part time technician working for 2 hours of
time per day for 145 working days was included. The model has increased the
production volume from 220 pairs to 365 pairs per year at the rate of £312.08 per pair.
This has reduced approximately 28% in total cost per pair compared to initial operating
cost model based on 220 working days per year.
Figure 6:16 Cost categories in initial operating model based on 220 working days per year
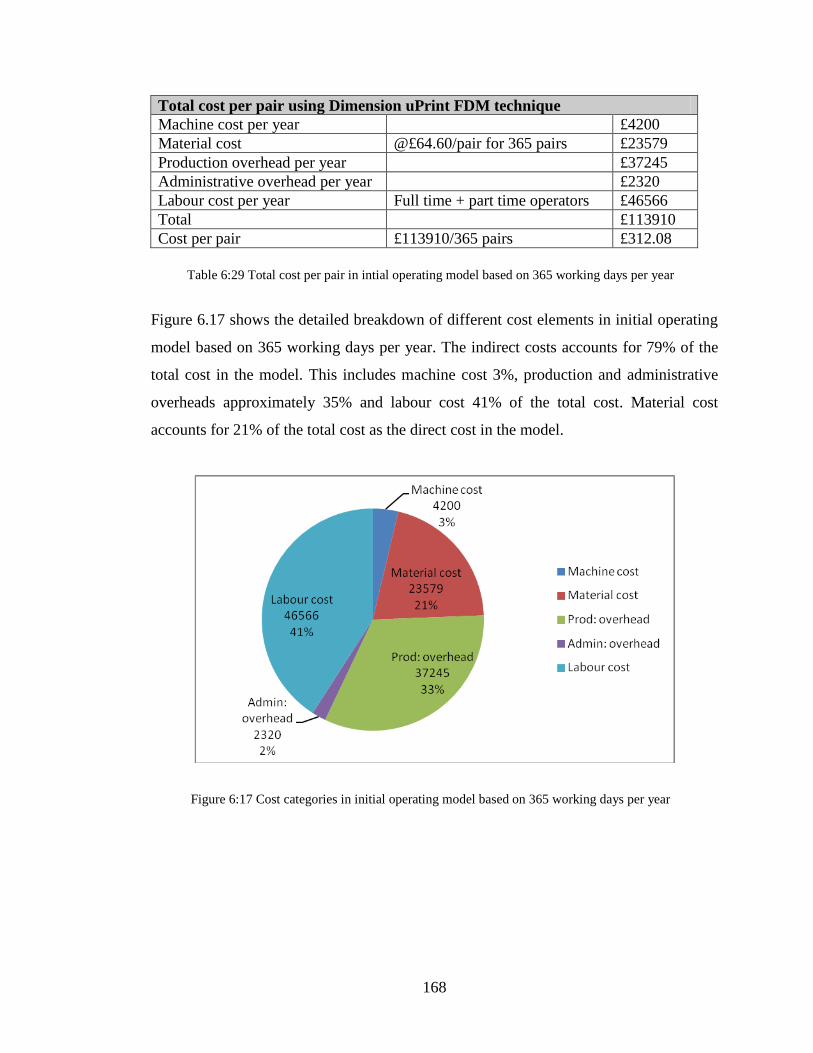
168
Total cost per pair using Dimension uPrint FDM technique
Machine cost per year £4200
Material cost @£64.60/pair for 365 pairs £23579
Production overhead per year £37245
Administrative overhead per year £2320
Labour cost per year Full time + part time operators £46566
Total £113910
Cost per pair £113910/365 pairs £312.08
Figure 6.17 shows the detailed breakdown of different cost elements in initial operating
model based on 365 working days per year. The indirect costs accounts for 79% of the
total cost in the model. This includes machine cost 3%, production and administrative
overheads approximately 35% and labour cost 41% of the total cost. Material cost
accounts for 21% of the total cost as the direct cost in the model.
Table 6:29 Total cost per pair in intial operating model based on 365 working days per year
Figure 6:17 Cost categories in initial operating model based on 365 working days per year
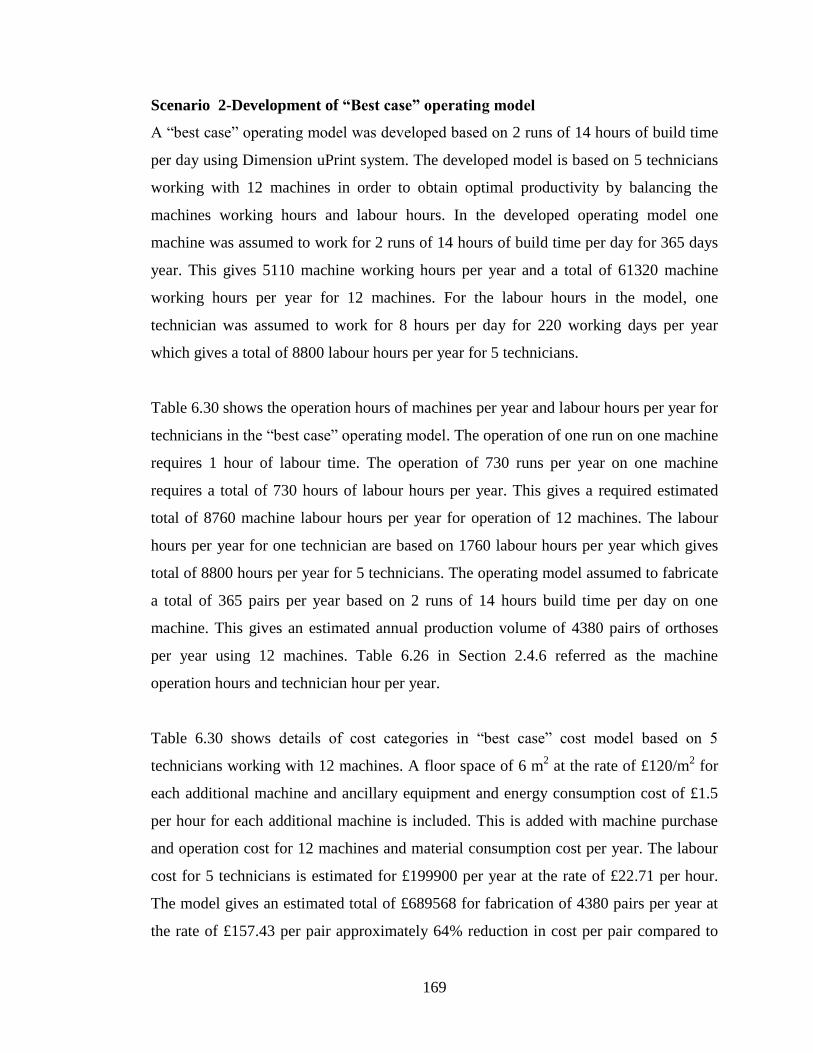
169
Scenario 2-Development of “Best case” operating model
A “best case” operating model was developed based on 2 runs of 14 hours of build time
per day using Dimension uPrint system. The developed model is based on 5 technicians
working with 12 machines in order to obtain optimal productivity by balancing the
machines working hours and labour hours. In the developed operating model one
machine was assumed to work for 2 runs of 14 hours of build time per day for 365 days
year. This gives 5110 machine working hours per year and a total of 61320 machine
working hours per year for 12 machines. For the labour hours in the model, one
technician was assumed to work for 8 hours per day for 220 working days per year
which gives a total of 8800 labour hours per year for 5 technicians.
Table 6.30 shows the operation hours of machines per year and labour hours per year for
technicians in the “best case” operating model. The operation of one run on one machine
requires 1 hour of labour time. The operation of 730 runs per year on one machine
requires a total of 730 hours of labour hours per year. This gives a required estimated
total of 8760 machine labour hours per year for operation of 12 machines. The labour
hours per year for one technician are based on 1760 labour hours per year which gives
total of 8800 hours per year for 5 technicians. The operating model assumed to fabricate
a total of 365 pairs per year based on 2 runs of 14 hours build time per day on one
machine. This gives an estimated annual production volume of 4380 pairs of orthoses
per year using 12 machines. Table 6.26 in Section 2.4.6 referred as the machine
operation hours and technician hour per year.
Table 6.30 shows details of cost categories in “best case” cost model based on 5
technicians working with 12 machines. A floor space of 6 m2 at the rate of £120/m
2 for
each additional machine and ancillary equipment and energy consumption cost of £1.5
per hour for each additional machine is included. This is added with machine purchase
and operation cost for 12 machines and material consumption cost per year. The labour
cost for 5 technicians is estimated for £199900 per year at the rate of £22.71 per hour.
The model gives an estimated total of £689568 for fabrication of 4380 pairs per year at
the rate of £157.43 per pair approximately 64% reduction in cost per pair compared to
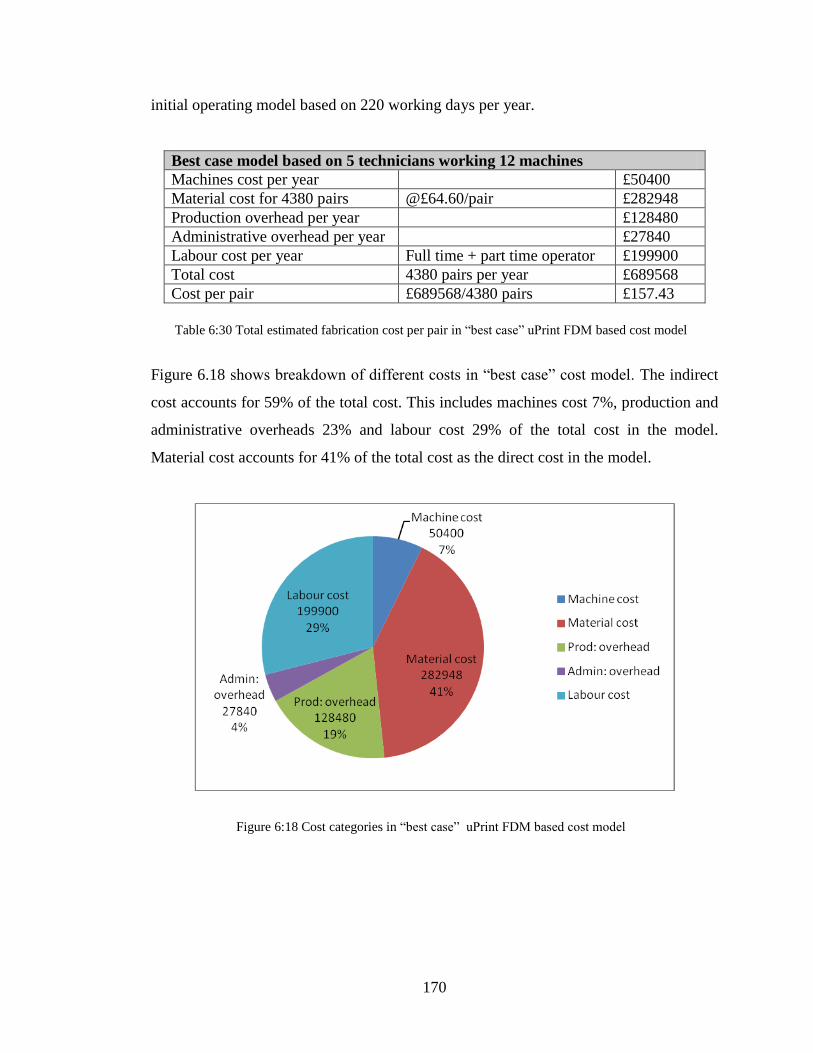
170
initial operating model based on 220 working days per year.
Best case model based on 5 technicians working 12 machines
Machines cost per year £50400
Material cost for 4380 pairs @£64.60/pair £282948
Production overhead per year £128480
Administrative overhead per year £27840
Labour cost per year Full time + part time operator £199900
Total cost 4380 pairs per year £689568
Cost per pair £689568/4380 pairs £157.43
Figure 6.18 shows breakdown of different costs in “best case” cost model. The indirect
cost accounts for 59% of the total cost. This includes machines cost 7%, production and
administrative overheads 23% and labour cost 29% of the total cost in the model.
Material cost accounts for 41% of the total cost as the direct cost in the model.
Table 6:30 Total estimated fabrication cost per pair in “best case” uPrint FDM based cost model
Figure 6:18 Cost categories in “best case” uPrint FDM based cost model
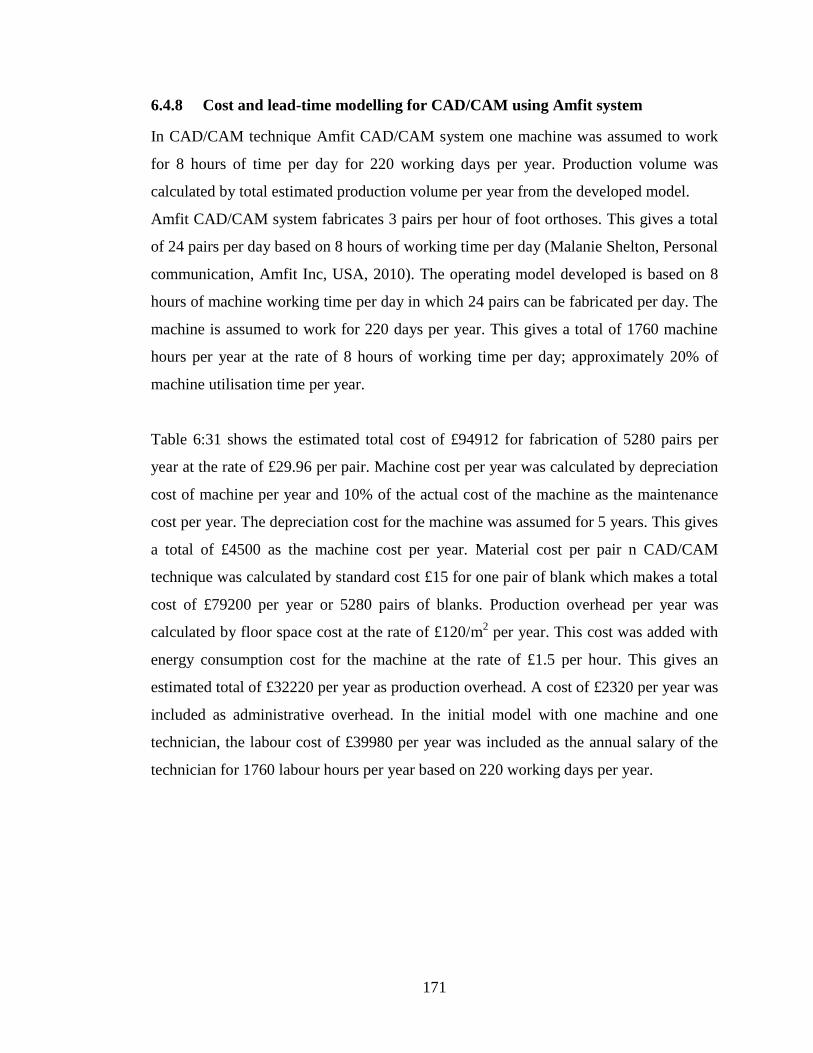
171
6.4.8 Cost and lead-time modelling for CAD/CAM using Amfit system
In CAD/CAM technique Amfit CAD/CAM system one machine was assumed to work
for 8 hours of time per day for 220 working days per year. Production volume was
calculated by total estimated production volume per year from the developed model.
Amfit CAD/CAM system fabricates 3 pairs per hour of foot orthoses. This gives a total
of 24 pairs per day based on 8 hours of working time per day (Malanie Shelton, Personal
communication, Amfit Inc, USA, 2010). The operating model developed is based on 8
hours of machine working time per day in which 24 pairs can be fabricated per day. The
machine is assumed to work for 220 days per year. This gives a total of 1760 machine
hours per year at the rate of 8 hours of working time per day; approximately 20% of
machine utilisation time per year.
Table 6:31 shows the estimated total cost of £94912 for fabrication of 5280 pairs per
year at the rate of £29.96 per pair. Machine cost per year was calculated by depreciation
cost of machine per year and 10% of the actual cost of the machine as the maintenance
cost per year. The depreciation cost for the machine was assumed for 5 years. This gives
a total of £4500 as the machine cost per year. Material cost per pair n CAD/CAM
technique was calculated by standard cost £15 for one pair of blank which makes a total
cost of £79200 per year or 5280 pairs of blanks. Production overhead per year was
calculated by floor space cost at the rate of £120/m2 per year. This cost was added with
energy consumption cost for the machine at the rate of £1.5 per hour. This gives an
estimated total of £32220 per year as production overhead. A cost of £2320 per year was
included as administrative overhead. In the initial model with one machine and one
technician, the labour cost of £39980 per year was included as the annual salary of the
technician for 1760 labour hours per year based on 220 working days per year.
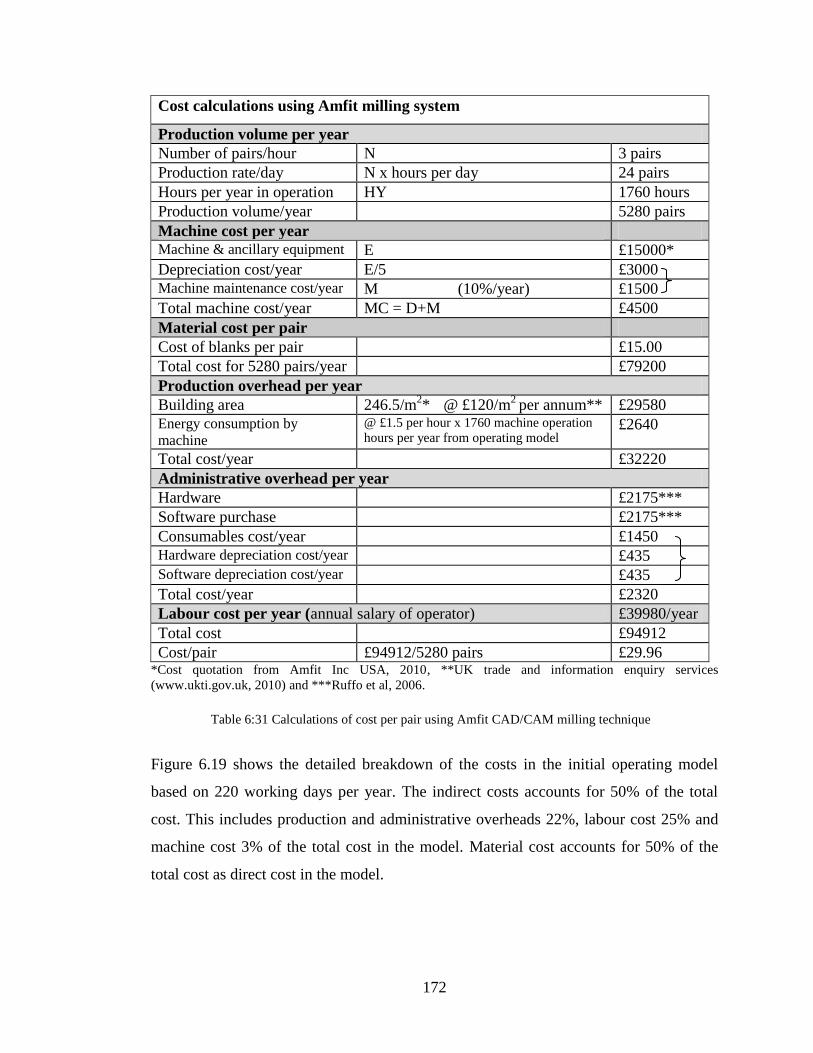
172
Cost calculations using Amfit milling system
Production volume per year
Number of pairs/hour N 3 pairs
Production rate/day N x hours per day 24 pairs
Hours per year in operation HY 1760 hours
Production volume/year 5280 pairs
Machine cost per year
Machine & ancillary equipment E £15000*
Depreciation cost/year E/5 £3000
Machine maintenance cost/year M (10%/year) £1500
Total machine cost/year MC = D+M £4500
Material cost per pair
Cost of blanks per pair £15.00
Total cost for 5280 pairs/year £79200
Production overhead per year
Building area 246.5/m2*
@ £120/m
2 per annum** £29580
Energy consumption by
machine
@ £1.5 per hour x 1760 machine operation
hours per year from operating model £2640
Total cost/year £32220
Administrative overhead per year
Hardware £2175***
Software purchase £2175***
Consumables cost/year £1450
Hardware depreciation cost/year £435
Software depreciation cost/year £435
Total cost/year £2320
Labour cost per year (annual salary of operator) £39980/year
Total cost £94912
Cost/pair £94912/5280 pairs £29.96 *Cost quotation from Amfit Inc USA, 2010, **UK trade and information enquiry services
(www.ukti.gov.uk, 2010) and ***Ruffo et al, 2006.
Figure 6.19 shows the detailed breakdown of the costs in the initial operating model
based on 220 working days per year. The indirect costs accounts for 50% of the total
cost. This includes production and administrative overheads 22%, labour cost 25% and
machine cost 3% of the total cost in the model. Material cost accounts for 50% of the
total cost as direct cost in the model.
Table 6:31 Calculations of cost per pair using Amfit CAD/CAM milling technique
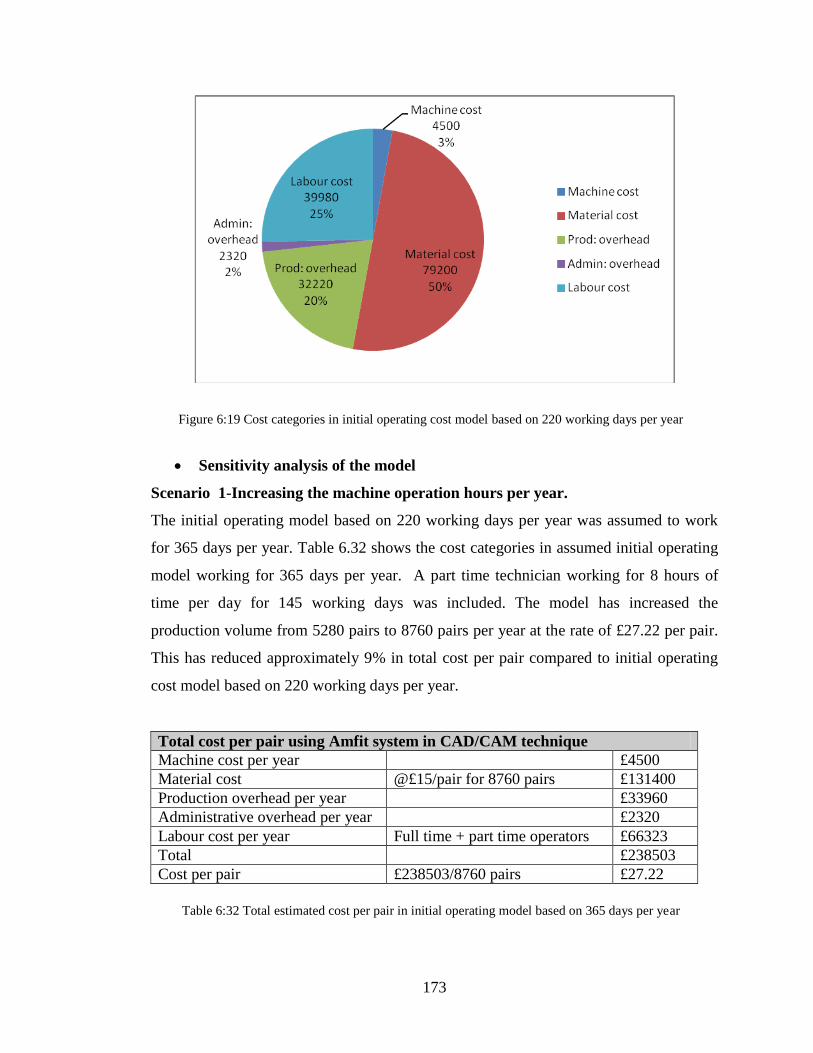
173
Sensitivity analysis of the model
Scenario 1-Increasing the machine operation hours per year.
The initial operating model based on 220 working days per year was assumed to work
for 365 days per year. Table 6.32 shows the cost categories in assumed initial operating
model working for 365 days per year. A part time technician working for 8 hours of
time per day for 145 working days was included. The model has increased the
production volume from 5280 pairs to 8760 pairs per year at the rate of £27.22 per pair.
This has reduced approximately 9% in total cost per pair compared to initial operating
cost model based on 220 working days per year.
Total cost per pair using Amfit system in CAD/CAM technique
Machine cost per year £4500
Material cost @£15/pair for 8760 pairs £131400
Production overhead per year £33960
Administrative overhead per year £2320
Labour cost per year Full time + part time operators £66323
Total £238503
Cost per pair £238503/8760 pairs £27.22
Figure 6:19 Cost categories in initial operating cost model based on 220 working days per year
Table 6:32 Total estimated cost per pair in initial operating model based on 365 days per year
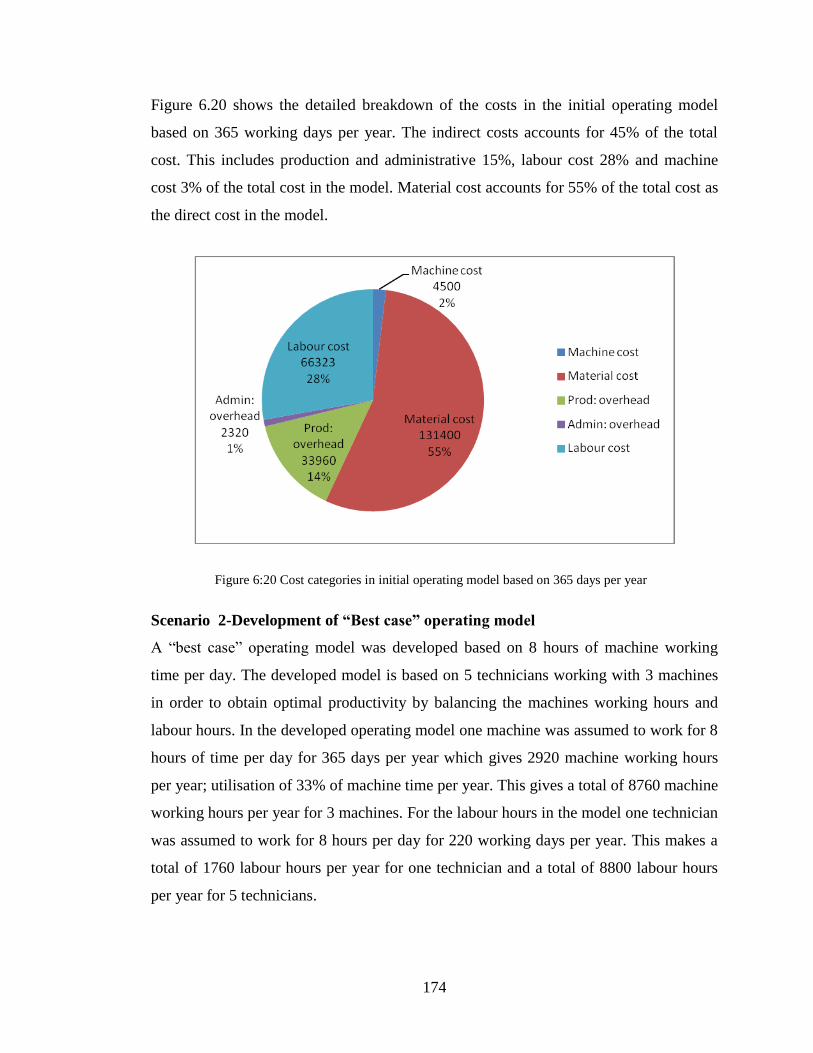
174
Figure 6.20 shows the detailed breakdown of the costs in the initial operating model
based on 365 working days per year. The indirect costs accounts for 45% of the total
cost. This includes production and administrative 15%, labour cost 28% and machine
cost 3% of the total cost in the model. Material cost accounts for 55% of the total cost as
the direct cost in the model.
Scenario 2-Development of “Best case” operating model
A “best case” operating model was developed based on 8 hours of machine working
time per day. The developed model is based on 5 technicians working with 3 machines
in order to obtain optimal productivity by balancing the machines working hours and
labour hours. In the developed operating model one machine was assumed to work for 8
hours of time per day for 365 days per year which gives 2920 machine working hours
per year; utilisation of 33% of machine time per year. This gives a total of 8760 machine
working hours per year for 3 machines. For the labour hours in the model one technician
was assumed to work for 8 hours per day for 220 working days per year. This makes a
total of 1760 labour hours per year for one technician and a total of 8800 labour hours
per year for 5 technicians.
Figure 6:20 Cost categories in initial operating model based on 365 days per year
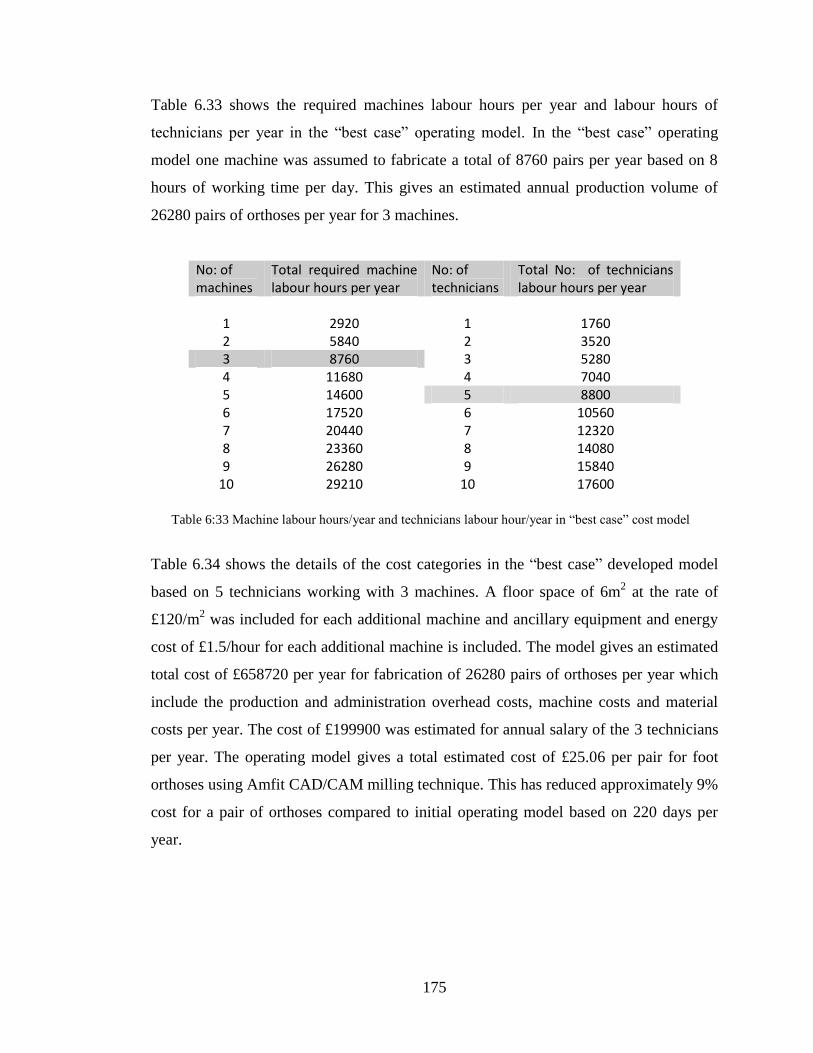
175
Table 6.33 shows the required machines labour hours per year and labour hours of
technicians per year in the “best case” operating model. In the “best case” operating
model one machine was assumed to fabricate a total of 8760 pairs per year based on 8
hours of working time per day. This gives an estimated annual production volume of
26280 pairs of orthoses per year for 3 machines.
No: of machines
Total required machine labour hours per year
No: of technicians
Total No: of technicians labour hours per year
1 2920 1 1760 2 5840 2 3520 3 8760 3 5280 4 11680 4 7040 5 14600 5 8800 6 17520 6 10560 7 20440 7 12320 8 23360 8 14080 9 26280 9 15840
10 29210 10 17600
Table 6.34 shows the details of the cost categories in the “best case” developed model
based on 5 technicians working with 3 machines. A floor space of 6m2 at the rate of
£120/m2 was included for each additional machine and ancillary equipment and energy
cost of £1.5/hour for each additional machine is included. The model gives an estimated
total cost of £658720 per year for fabrication of 26280 pairs of orthoses per year which
include the production and administration overhead costs, machine costs and material
costs per year. The cost of £199900 was estimated for annual salary of the 3 technicians
per year. The operating model gives a total estimated cost of £25.06 per pair for foot
orthoses using Amfit CAD/CAM milling technique. This has reduced approximately 9%
cost for a pair of orthoses compared to initial operating model based on 220 days per
year.
Table 6:33 Machine labour hours/year and technicians labour hour/year in “best case” cost model
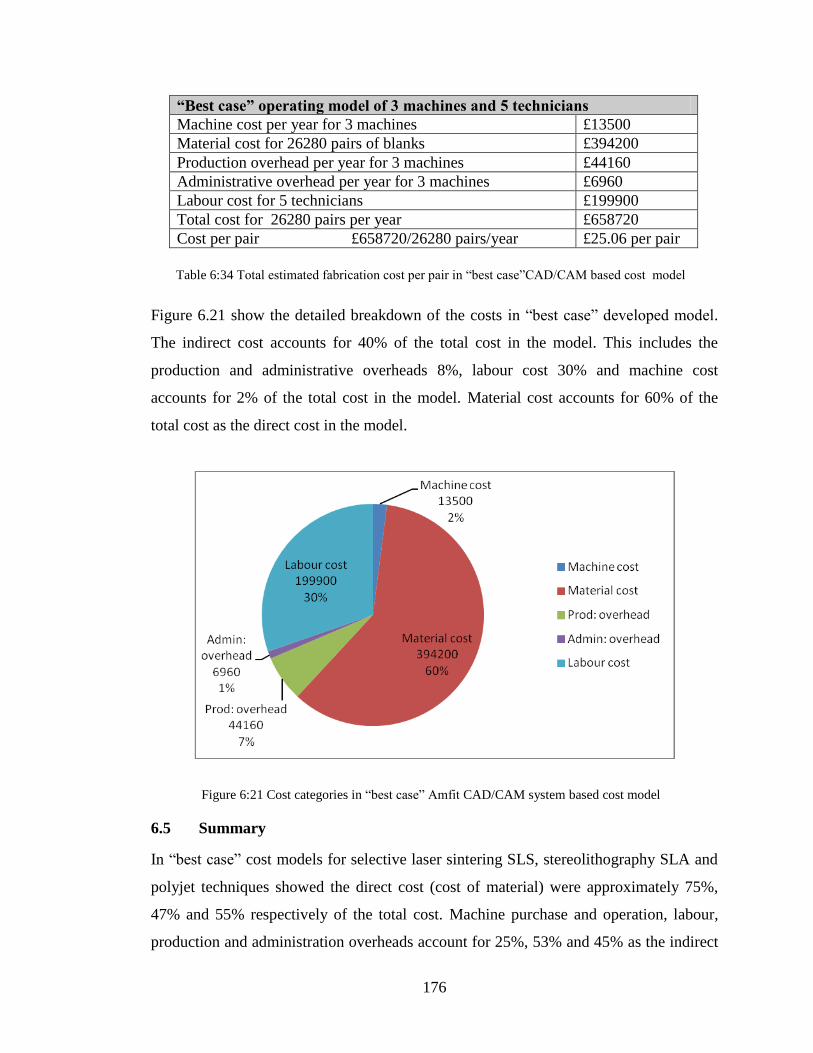
176
“Best case” operating model of 3 machines and 5 technicians
Machine cost per year for 3 machines £13500
Material cost for 26280 pairs of blanks £394200
Production overhead per year for 3 machines £44160
Administrative overhead per year for 3 machines £6960
Labour cost for 5 technicians £199900
Total cost for 26280 pairs per year £658720
Cost per pair £658720/26280 pairs/year £25.06 per pair
Figure 6.21 show the detailed breakdown of the costs in “best case” developed model.
The indirect cost accounts for 40% of the total cost in the model. This includes the
production and administrative overheads 8%, labour cost 30% and machine cost
accounts for 2% of the total cost in the model. Material cost accounts for 60% of the
total cost as the direct cost in the model.
6.5 Summary
In “best case” cost models for selective laser sintering SLS, stereolithography SLA and
polyjet techniques showed the direct cost (cost of material) were approximately 75%,
47% and 55% respectively of the total cost. Machine purchase and operation, labour,
production and administration overheads account for 25%, 53% and 45% as the indirect
Table 6:34 Total estimated fabrication cost per pair in “best case”CAD/CAM based cost model
Figure 6:21 Cost categories in “best case” Amfit CAD/CAM system based cost model
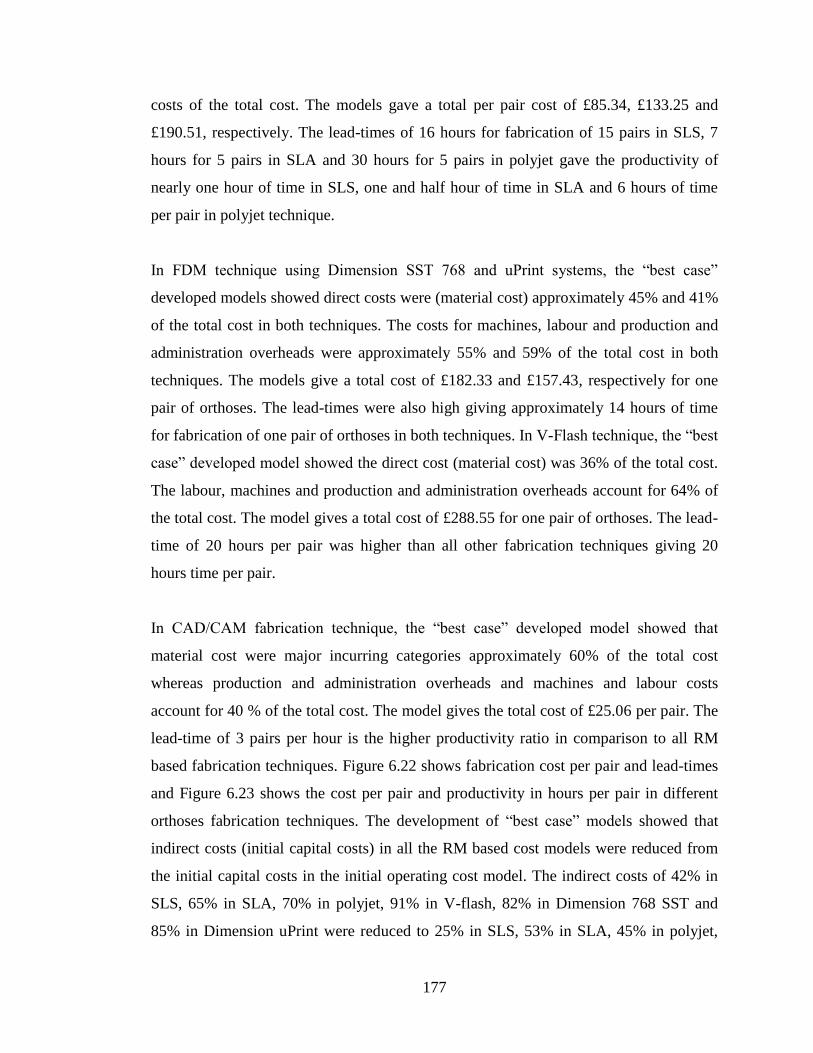
177
costs of the total cost. The models gave a total per pair cost of £85.34, £133.25 and
£190.51, respectively. The lead-times of 16 hours for fabrication of 15 pairs in SLS, 7
hours for 5 pairs in SLA and 30 hours for 5 pairs in polyjet gave the productivity of
nearly one hour of time in SLS, one and half hour of time in SLA and 6 hours of time
per pair in polyjet technique.
In FDM technique using Dimension SST 768 and uPrint systems, the “best case”
developed models showed direct costs were (material cost) approximately 45% and 41%
of the total cost in both techniques. The costs for machines, labour and production and
administration overheads were approximately 55% and 59% of the total cost in both
techniques. The models give a total cost of £182.33 and £157.43, respectively for one
pair of orthoses. The lead-times were also high giving approximately 14 hours of time
for fabrication of one pair of orthoses in both techniques. In V-Flash technique, the “best
case” developed model showed the direct cost (material cost) was 36% of the total cost.
The labour, machines and production and administration overheads account for 64% of
the total cost. The model gives a total cost of £288.55 for one pair of orthoses. The lead-
time of 20 hours per pair was higher than all other fabrication techniques giving 20
hours time per pair.
In CAD/CAM fabrication technique, the “best case” developed model showed that
material cost were major incurring categories approximately 60% of the total cost
whereas production and administration overheads and machines and labour costs
account for 40 % of the total cost. The model gives the total cost of £25.06 per pair. The
lead-time of 3 pairs per hour is the higher productivity ratio in comparison to all RM
based fabrication techniques. Figure 6.22 shows fabrication cost per pair and lead-times
and Figure 6.23 shows the cost per pair and productivity in hours per pair in different
orthoses fabrication techniques. The development of “best case” models showed that
indirect costs (initial capital costs) in all the RM based cost models were reduced from
the initial capital costs in the initial operating cost model. The indirect costs of 42% in
SLS, 65% in SLA, 70% in polyjet, 91% in V-flash, 82% in Dimension 768 SST and
85% in Dimension uPrint were reduced to 25% in SLS, 53% in SLA, 45% in polyjet,
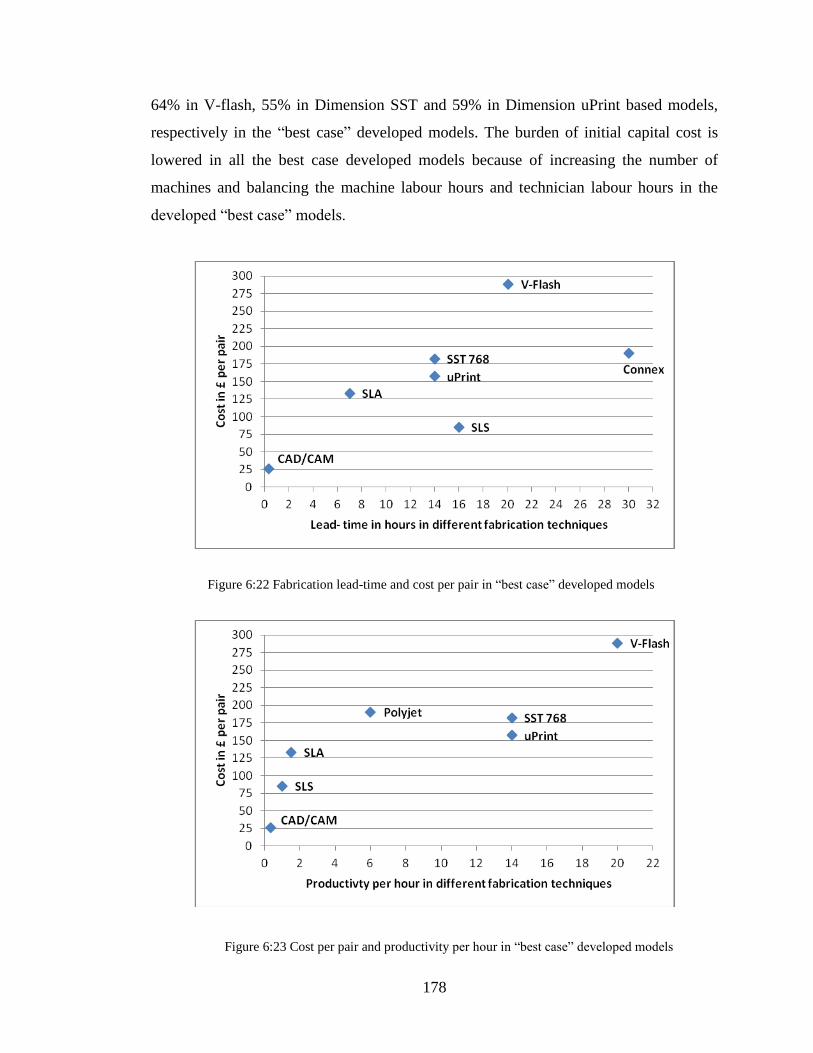
178
64% in V-flash, 55% in Dimension SST and 59% in Dimension uPrint based models,
respectively in the “best case” developed models. The burden of initial capital cost is
lowered in all the best case developed models because of increasing the number of
machines and balancing the machine labour hours and technician labour hours in the
developed “best case” models.
Figure 6:22 Fabrication lead-time and cost per pair in “best case” developed models
Figure 6:23 Cost per pair and productivity per hour in “best case” developed models
179
Chapter 7 Discussion and conclusions
7.1 Introduction.
The aim of this work was to assess the potential for rapid manufacturing techniques in
the design and fabrication of custom-made foot orthoses. The main objective was to
evaluate the application of rapid manufacturing techniques for production of cost
effective custom-made foot orthoses at a commercial scale with low lead-time. The
previous work had demonstrated the feasibility of rapid manufacturing techniques in
fabrication of custom-made foot orthoses (Pallari, 2008; Pallari et al, 2010). In the
following sections step by step research findings from this work is discussed.
7.2 Discussion
7.2.1 Design of rapid manufacturing based process model through IDEF0.
In Chapter 3, Section 3.6 “rapid manufacturing” approach in the design and fabrication
process has shown significant advantages in reducing the traditional manual activities in
orthoses fabrication process. The automated fabrication processes in rapid
manufacturing without the need of moulding, tooling and equipment; requiring minimal
labour intervention during the fabrication process. Re-modelling of the process of design
and fabrication of custom foot orthoses showed improvements and increased the process
efficiency by applications of rapid manufacturing approach in the system. Different
commercially established rapid manufacturing techniques integrated in the process have
demonstrated the transformation and shift from the conventional design and fabrication
functions to a digital design and fabrication process.
In IDEF0 based “as-to-be” process model (A-1) of the system, the main functions and
activities are based on digital foot geometry capture, CAD based orthoses design and
digital fabrication process; using rapid manufacturing techniques. This has resulted in
development of a seamless digital design and fabrication process for production of
custom-made foot orthoses. The analysis of main functions in the developed rapid
manufacturing based process model has demonstrated significant improvements in the
main functions. Applications of digital foot geometry capture and CAD techniques in
180
design of orthoses replaced the traditional time, cost and labour intensive activities in
functions of foot geometry capture and orthoses design. The developed model further
showed that the function of “planning for manufacturing” in the system require less
work after integration of rapid manufacturing techniques in the design and fabrication
process.
7.2.2 Digital foot geometry capture.
The application of digital foot geometry capture method has shown significant
improvements in terms of time and cost in comparison to traditional foot geometry
capturing methods (Payne, 2007; Boardman, 2007; Williams, 2010). Digital foot
geometry capture generates the output information in a digital format which is a
requirement for the rapid manufacturing based design and fabrication system.
Digital foot geometry capturing method removes the steps involved in traditional foot
geometry capturing methods which require time for setting and drying of the impression
cast and efforts for physical shipment of casts to manufacturing facility. The main
advantages of digital based geometry capture are removing the need of physical material
in foot impression casting and manual labour work in the process which has
subsequently reduced the geometry capture time and cost.
In Chapter 4, Sections 4.2 and 4.3, time and cost modelling of different geometry
capturing methods showed that the 3D digital foot geometry capturing method
significantly reduced the time and cost in foot impression capturing process. Digital
geometry capturing method reduced the estimated cost of foot geometry capturing from
£48 per pair in plaster based methods to £6 per pair in digital based methods. The
estimated time in foot geometry capture process was also reduced from 5 hours of time
in plaster based methods to 5 minutes of time per pair in digital foot geometry capture
methods.
Digital foot geometry capture methods have additional advantages of removing the need
for managing and storing physical inventories of foot impression casts, material and
181
waste generation in impression capturing process. Overall, it is concluded that digital
foot geometry capture offers significant benefits to the industry. However, for these to
be realised, the downstream processes in fabrication of orthoses must be capable of
operating with digital information.
7.2.3 CAD design of orthoses.
In designing of the orthoses, applications of CAD have shown increased advantages
over the plaster based designing methods particularly in reducing the designing time and
cost, labour. CAD based designing methods have shown several advantages over the
plaster based designing methods. The required orthoses design features, corrections and
modifications (such as adding wedging angles, heel cupping, ramps, etc.) can be
incorporated accurately and can be viewed and reviewed on the CAD system.
The significant advantage in CAD based orthoses design is elimination of manual errors
in the designing process where the designer can view on screen the designed orthosis
features which facilitate determining the appearance and final shape of the product after
actual fabrication of the orthoses. One of the other additional advantages of CAD based
design method is removing the need of physical storage of designed foot impression
casts and material in the orthoses design process. The CAD based design method
facilitates in managing the data base and electronic storage of the orthoses designs
where the designs can be easily stored and quickly transferred to manufacturing facility
which makes the orthoses design and fabrication process faster and reliable. Efficient
data base management of digital records of orthoses designs eliminates the cost and time
in handling the physical inventory and transferring and shipping of the designed
orthoses.
In Chapter 4, Sections 4.5 and 4.6, time and cost modelling of the different orthoses
design methods showed that an estimated orthosis design cost of £18 per pair in plaster
based design methods was reduced to cost of £2 per pair in the CAD based design
methods. The orthoses design time of 5 hours and 45 minutes in plaster based designing
methods was also reduced by CAD based designing methods; consuming only 5 minutes

182
of time per pair in design of the orthoses. The comparison of plaster based and CAD
based orthoses design methods showed that the plaster based design methods involve
higher time and are cost intensive. The methods are craft based and labour intensive
involving manual and physical work, where the orthoses design is based on the
experience and craftsmanship of the designer. The accuracy and conformance of the
design features depend on the individual expertise rather than the systematic engineering
design principles.
In CAD based design methods the designers have increased control in incorporating the
orthoses design features which has the potential to reduce dependency on individual
skills and craftsmanship and show advantages in terms of increased precision accuracy
and consistency. The CAD based designing method simplifies and speed up the orthoses
designing process. The method facilitates the orthoses designer with increased control in
design alterations and in adding and incorporating the prescribed design features more
effectively and accurately. The designing process is expected to be more effective, quick
and consistent with increased accuracy. One of the additional advantages of CAD based
orthoses design is the easy repeatability of the design of the orthoses if required.
Overall, CAD based designing methods have increased advantages over the plaster
based designing methods in terms of reduced design time and cost. The method has
increased process efficiency, control, precision, repeatability and advantages of reduced
dependency on the individual skills, which have significant impacts on the consistency
and quality in the final orthoses product.
7.2.4 Rapid manufacturing techniques in fabrication of orthoses.
In the fabrication of orthoses, feasibility of various rapid manufacturing techniques were
investigated in terms of cost, lead-time and production of complex geometries and
design features in custom-made foot orthoses. Conventional fabrication techniques have
shown limitations in incorporating and fabricating the required complex design features
at specific sites in the orthoses; such as fabrication of metatarsal dome and supporting
wedges in the custom-made foot orthoses. Rapid manufacturing techniques are based on
183
additive manufacturing process where the parts are fabricated layer by layer without
tooling and equipments. The main advantages of rapid manufacturing techniques are
increased design freedom, ability to fabricate complex geometrical features with
increased accuracy, consistency and overall quality improved product.
The significant advantages of rapid manufacturing techniques are; ease in fabrication of
custom-specific complex geometrical parts and devices, increased accuracy and
consistency with the key advantage of repeatability for custom-specific personalised
parts and products (Gibson et al, 2010, Wohlers, 2010). In fabrication of orthoses these
techniques have shown advantages of fabricating complex geometrical design features
with increased accuracy and consistency in comparison to conventional milling
techniques (Pallari et al, 2010).
7.2.5 Orthoses materials
In Section 5.2.2 analysis of mechanical and other properties of traditional orthoses
materials used for fabrication of custom foot orthoses with the potential rapid
manufacturing materials showed that currently commercially available rapid
manufacturing materials could be used in the orthoses fabrication as an end use product
material.
7.2.6 Cost and lead-time modelling
The cost and lead-time modelling in chapter 6 showed that RM based systems are still
expensive; giving higher per pair cost in comparison to conventional fabrication
technique. However; with progressing developments in RM machines and materials, the
cost of raw materials and systems are falling down which could bring the RM
fabrication processes competitive with conventional fabrication techniques.
7.3 Key features of rapid manufacturing based design and fabrication system
for production of custom-made foot orthoses.
In rapid manufacturing based design and fabrication systems the functions of foot
geometry capture and design of orthoses are digital based and are identical. However,
fabrication lead-time and fabrication costs are different in different rapid manufacturing
184
techniques used.
7.3.1 Lead-time modelling
The method for estimation of lead-time in different rapid manufacturing techniques was
obtained through equation no 1.
T lead-time = T gc+ T od + T fab Eq (7.1)
Where T lead-time is the estimated total lead-time per pair, which is the sum of foot
geometry capture time per pair (T gc), orthoses design time per pair (Tod) and orthoses
fabrication time per pair (T fab) in different rapid manufacturing techniques.
7.3.2 Total estimated design and fabrication lead-time and total estimated cost
per pair in different rapid manufacturing based systems.
In the following section (i) Total estimated design and fabrication lead-time (ii) Total
estimated design and fabrication cost and (iii) total estimated productivity in hours in
different rapid manufacturing techniques based systems are presented.
i. Total estimated design and fabrication lead-time
The total estimated design and fabrication lead-time is made up of (i) time in foot
geometry capture, (ii) time in orthoses design and (iii) time in fabrication of orthoses. As
earlier mentioned that foot geometry capture and orthoses design times are identical in
all the systems and were estimated to take 5 minutes of time for each function,
respectively. However, orthoses fabrication lead-time is different due to different build
time given by the rapid manufacturing systems.
Table 7.1 shows the total estimated design and fabrication lead-time in different rapid
manufacturing techniques based systems. In selective laser sintering technique, using
spro SLS system gave the total estimated design and fabrication lead-time of 18 hours
and 30 minutes for 15 pairs of orthoses. In stereolithography technique, using ipro 8000
system gave total estimated design and fabrication lead-time of 7 hours and 50 minutes
for 5 pairs of orthoses. In Polyjet technique, using Connex 500 system gave total
estimated design and fabrication lead-time of 30 hours and 50 minutes for 5 pairs of
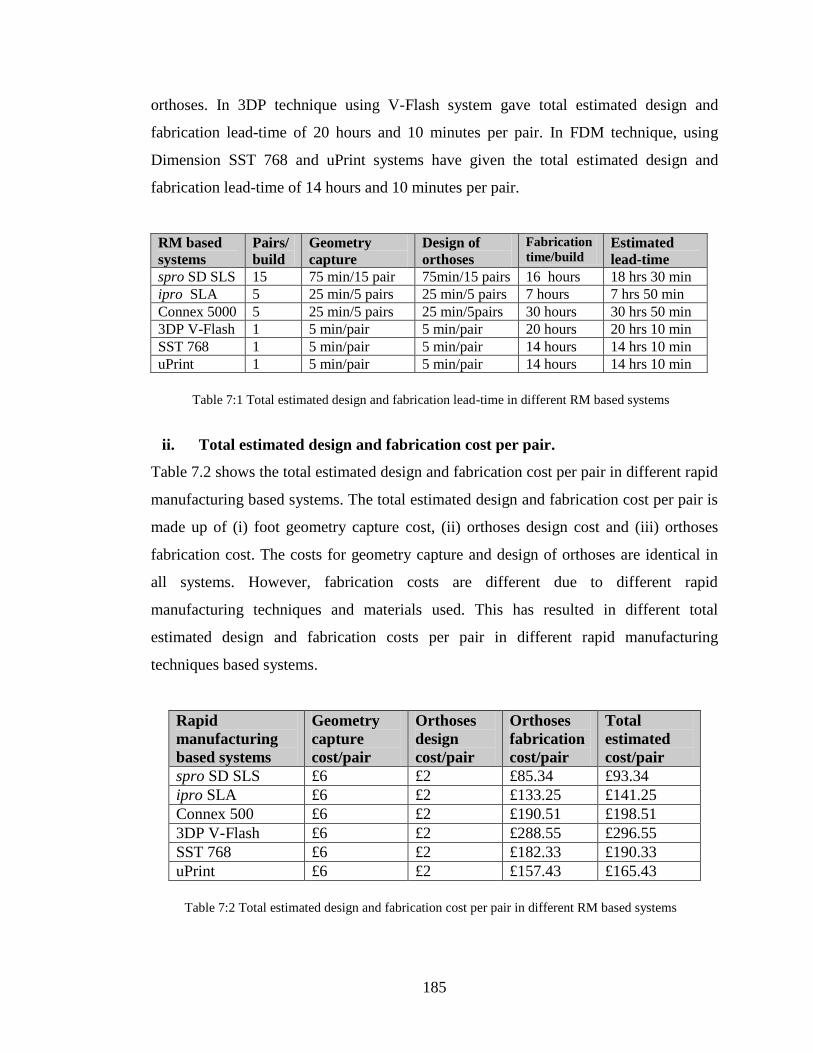
185
orthoses. In 3DP technique using V-Flash system gave total estimated design and
fabrication lead-time of 20 hours and 10 minutes per pair. In FDM technique, using
Dimension SST 768 and uPrint systems have given the total estimated design and
fabrication lead-time of 14 hours and 10 minutes per pair.
RM based
systems
Pairs/
build
Geometry
capture
Design of
orthoses
Fabrication
time/build Estimated
lead-time
spro SD SLS 15 75 min/15 pair 75min/15 pairs 16 hours 18 hrs 30 min
ipro SLA 5 25 min/5 pairs 25 min/5 pairs 7 hours 7 hrs 50 min
Connex 5000 5 25 min/5 pairs 25 min/5pairs 30 hours 30 hrs 50 min
3DP V-Flash 1 5 min/pair 5 min/pair 20 hours 20 hrs 10 min
SST 768 1 5 min/pair 5 min/pair 14 hours 14 hrs 10 min
uPrint 1 5 min/pair 5 min/pair 14 hours 14 hrs 10 min
ii. Total estimated design and fabrication cost per pair.
Table 7.2 shows the total estimated design and fabrication cost per pair in different rapid
manufacturing based systems. The total estimated design and fabrication cost per pair is
made up of (i) foot geometry capture cost, (ii) orthoses design cost and (iii) orthoses
fabrication cost. The costs for geometry capture and design of orthoses are identical in
all systems. However, fabrication costs are different due to different rapid
manufacturing techniques and materials used. This has resulted in different total
estimated design and fabrication costs per pair in different rapid manufacturing
techniques based systems.
Rapid
manufacturing
based systems
Geometry
capture
cost/pair
Orthoses
design
cost/pair
Orthoses
fabrication
cost/pair
Total
estimated
cost/pair
spro SD SLS £6 £2 £85.34 £93.34
ipro SLA £6 £2 £133.25 £141.25
Connex 500 £6 £2 £190.51 £198.51
3DP V-Flash £6 £2 £288.55 £296.55
SST 768 £6 £2 £182.33 £190.33
uPrint £6 £2 £157.43 £165.43
Table 7:1 Total estimated design and fabrication lead-time in different RM based systems
Table 7:2 Total estimated design and fabrication cost per pair in different RM based systems
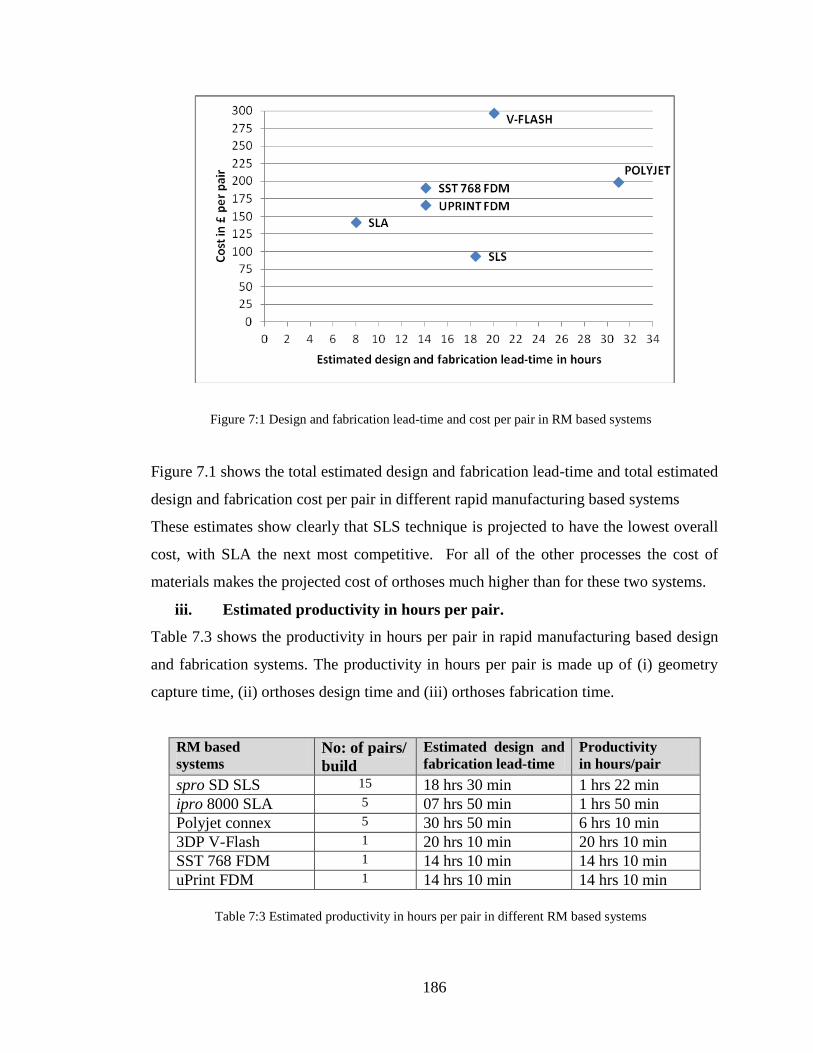
186
Figure 7.1 shows the total estimated design and fabrication lead-time and total estimated
design and fabrication cost per pair in different rapid manufacturing based systems
These estimates show clearly that SLS technique is projected to have the lowest overall
cost, with SLA the next most competitive. For all of the other processes the cost of
materials makes the projected cost of orthoses much higher than for these two systems.
iii. Estimated productivity in hours per pair.
Table 7.3 shows the productivity in hours per pair in rapid manufacturing based design
and fabrication systems. The productivity in hours per pair is made up of (i) geometry
capture time, (ii) orthoses design time and (iii) orthoses fabrication time.
RM based
systems No: of pairs/
build
Estimated design and
fabrication lead-time
Productivity
in hours/pair
spro SD SLS 15 18 hrs 30 min 1 hrs 22 min
ipro 8000 SLA 5 07 hrs 50 min 1 hrs 50 min
Polyjet connex 5 30 hrs 50 min 6 hrs 10 min
3DP V-Flash 1 20 hrs 10 min 20 hrs 10 min
SST 768 FDM 1 14 hrs 10 min 14 hrs 10 min
uPrint FDM 1 14 hrs 10 min 14 hrs 10 min
Figure 7:1 Design and fabrication lead-time and cost per pair in RM based systems
Table 7:3 Estimated productivity in hours per pair in different RM based systems
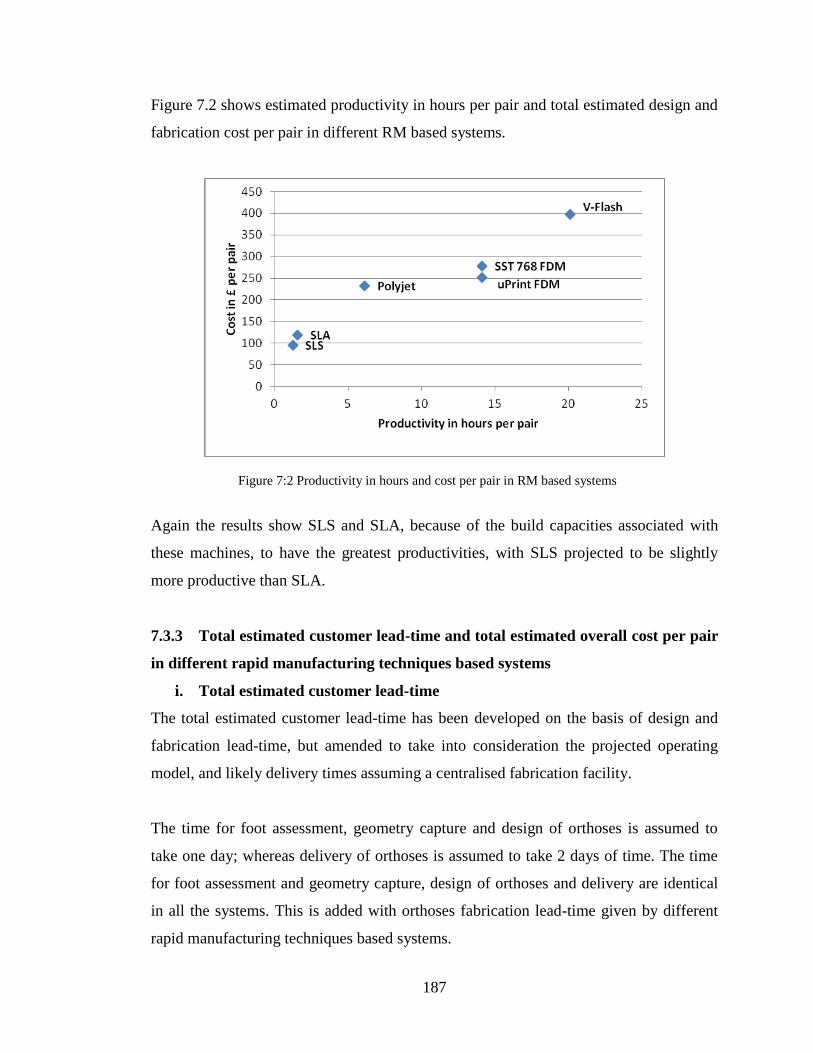
187
Figure 7.2 shows estimated productivity in hours per pair and total estimated design and
fabrication cost per pair in different RM based systems.
Again the results show SLS and SLA, because of the build capacities associated with
these machines, to have the greatest productivities, with SLS projected to be slightly
more productive than SLA.
7.3.3 Total estimated customer lead-time and total estimated overall cost per pair
in different rapid manufacturing techniques based systems
i. Total estimated customer lead-time
The total estimated customer lead-time has been developed on the basis of design and
fabrication lead-time, but amended to take into consideration the projected operating
model, and likely delivery times assuming a centralised fabrication facility.
The time for foot assessment, geometry capture and design of orthoses is assumed to
take one day; whereas delivery of orthoses is assumed to take 2 days of time. The time
for foot assessment and geometry capture, design of orthoses and delivery are identical
in all the systems. This is added with orthoses fabrication lead-time given by different
rapid manufacturing techniques based systems.
Figure 7:2 Productivity in hours and cost per pair in RM based systems
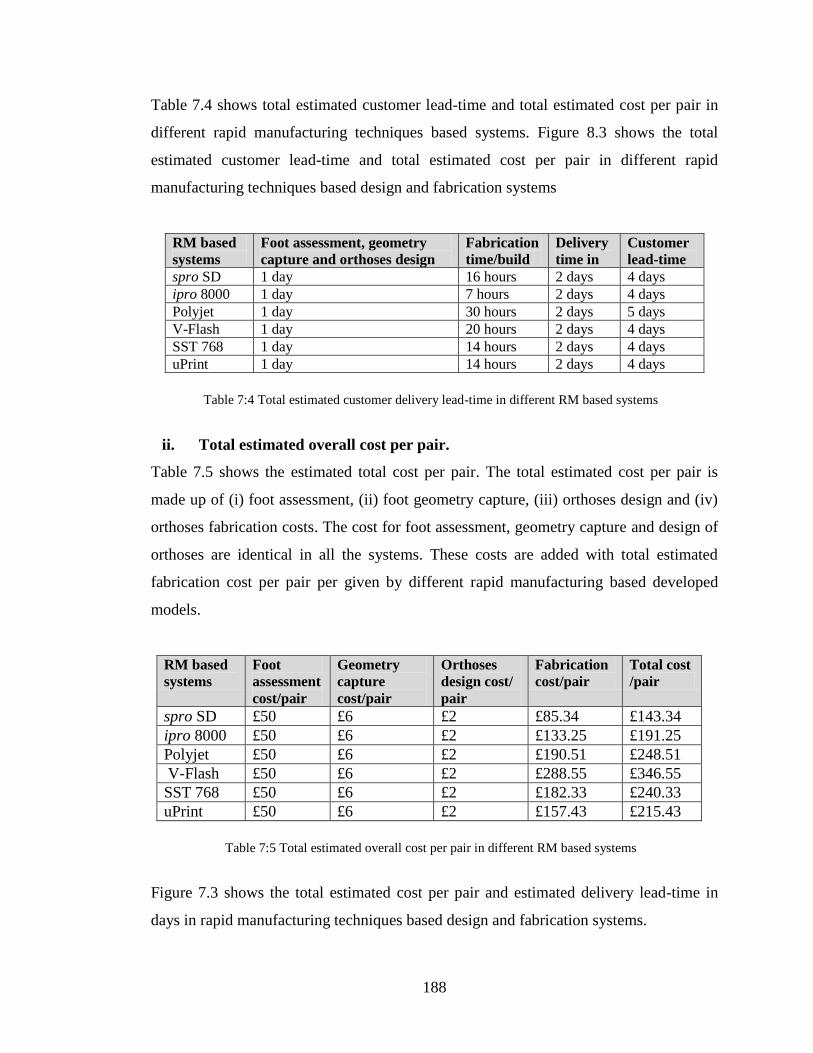
188
Table 7.4 shows total estimated customer lead-time and total estimated cost per pair in
different rapid manufacturing techniques based systems. Figure 8.3 shows the total
estimated customer lead-time and total estimated cost per pair in different rapid
manufacturing techniques based design and fabrication systems
RM based
systems
Foot assessment, geometry
capture and orthoses design
Fabrication
time/build
Delivery
time in
Customer
lead-time
spro SD 1 day 16 hours 2 days 4 days
ipro 8000 1 day 7 hours 2 days 4 days
Polyjet 1 day 30 hours 2 days 5 days
V-Flash 1 day 20 hours 2 days 4 days
SST 768 1 day 14 hours 2 days 4 days
uPrint 1 day 14 hours 2 days 4 days
ii. Total estimated overall cost per pair.
Table 7.5 shows the estimated total cost per pair. The total estimated cost per pair is
made up of (i) foot assessment, (ii) foot geometry capture, (iii) orthoses design and (iv)
orthoses fabrication costs. The cost for foot assessment, geometry capture and design of
orthoses are identical in all the systems. These costs are added with total estimated
fabrication cost per pair per given by different rapid manufacturing based developed
models.
RM based
systems
Foot
assessment
cost/pair
Geometry
capture
cost/pair
Orthoses
design cost/
pair
Fabrication
cost/pair
Total cost
/pair
spro SD £50 £6 £2 £85.34 £143.34
ipro 8000 £50 £6 £2 £133.25 £191.25
Polyjet £50 £6 £2 £190.51 £248.51
V-Flash £50 £6 £2 £288.55 £346.55
SST 768 £50 £6 £2 £182.33 £240.33
uPrint £50 £6 £2 £157.43 £215.43
Figure 7.3 shows the total estimated cost per pair and estimated delivery lead-time in
days in rapid manufacturing techniques based design and fabrication systems.
Table 7:4 Total estimated customer delivery lead-time in different RM based systems
Table 7:5 Total estimated overall cost per pair in different RM based systems
189
Again it is clear that SLS and SLA are the most competitive processes, with SLS
estimated to be more cost competitive than SLA with comparison to other rapid
manufacturing based systems.
7.3.4 Total estimated design and fabrication lead-time and total estimated cost
per pair in conventional resources based methods.
i. Total estimated design and fabrication lead-time
Table 7.6 shows the total estimated design and fabrication lead-time in conventional
systems having different geometry capture methods and using digital means of orthoses
design and CAD/CAM fabrication techniques. The total estimated lead-time is made up
of (i) time in foot assessment (ii) time in geometry capture, (iii) time in orthoses design
and (v) time in orthoses fabrication.
In conventional design and fabrication systems, orthosis is designed through CAD
systems and fabricated by milling process where a block of material is milled using
CAD/CAM milling machine. The time in foot assessment, orthoses design and orthoses
fabrication is identical in all conventional resources based methods. However, total
estimated lead-time is different due to different foot geometry capture methods.
Figure 7:3 Total estimated delivery lead-time and total estimated cost per pair in RM based systems
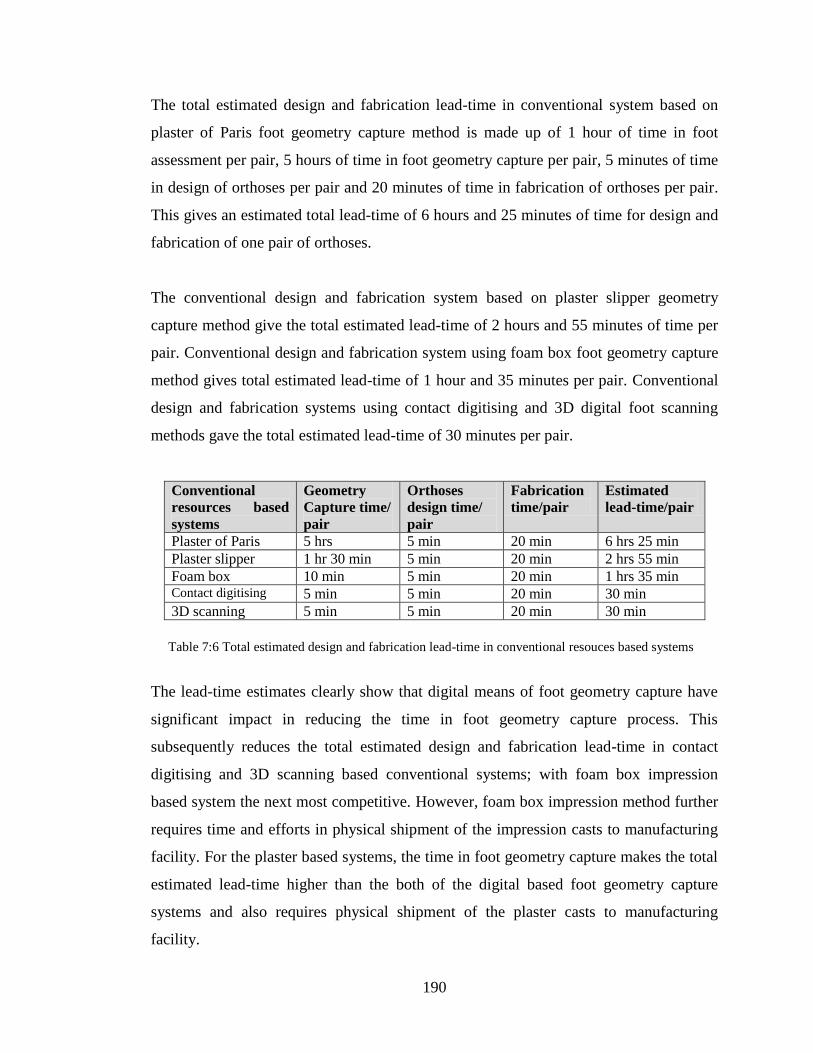
190
The total estimated design and fabrication lead-time in conventional system based on
plaster of Paris foot geometry capture method is made up of 1 hour of time in foot
assessment per pair, 5 hours of time in foot geometry capture per pair, 5 minutes of time
in design of orthoses per pair and 20 minutes of time in fabrication of orthoses per pair.
This gives an estimated total lead-time of 6 hours and 25 minutes of time for design and
fabrication of one pair of orthoses.
The conventional design and fabrication system based on plaster slipper geometry
capture method give the total estimated lead-time of 2 hours and 55 minutes of time per
pair. Conventional design and fabrication system using foam box foot geometry capture
method gives total estimated lead-time of 1 hour and 35 minutes per pair. Conventional
design and fabrication systems using contact digitising and 3D digital foot scanning
methods gave the total estimated lead-time of 30 minutes per pair.
Conventional
resources based
systems
Geometry
Capture time/
pair
Orthoses
design time/
pair
Fabrication
time/pair
Estimated
lead-time/pair
Plaster of Paris 5 hrs 5 min 20 min 6 hrs 25 min
Plaster slipper 1 hr 30 min 5 min 20 min 2 hrs 55 min
Foam box 10 min 5 min 20 min 1 hrs 35 min Contact digitising 5 min 5 min 20 min 30 min
3D scanning 5 min 5 min 20 min 30 min
The lead-time estimates clearly show that digital means of foot geometry capture have
significant impact in reducing the time in foot geometry capture process. This
subsequently reduces the total estimated design and fabrication lead-time in contact
digitising and 3D scanning based conventional systems; with foam box impression
based system the next most competitive. However, foam box impression method further
requires time and efforts in physical shipment of the impression casts to manufacturing
facility. For the plaster based systems, the time in foot geometry capture makes the total
estimated lead-time higher than the both of the digital based foot geometry capture
systems and also requires physical shipment of the plaster casts to manufacturing
facility.
Table 7:6 Total estimated design and fabrication lead-time in conventional resouces based systems
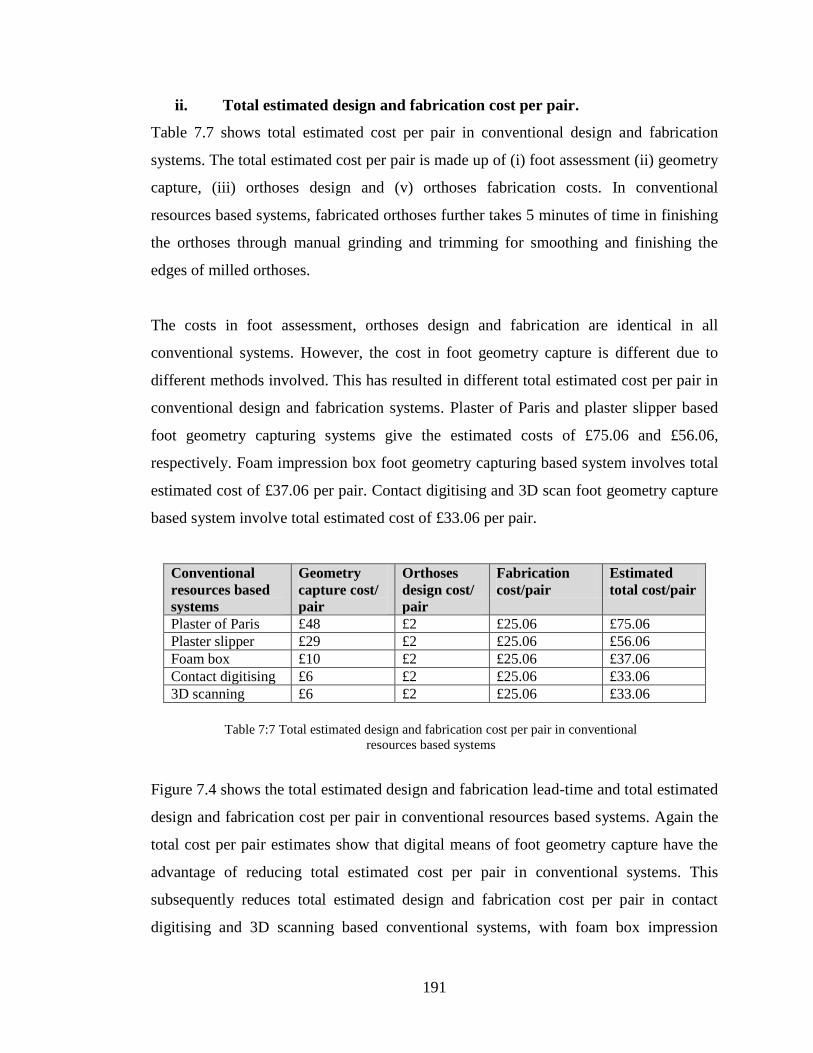
191
ii. Total estimated design and fabrication cost per pair.
Table 7.7 shows total estimated cost per pair in conventional design and fabrication
systems. The total estimated cost per pair is made up of (i) foot assessment (ii) geometry
capture, (iii) orthoses design and (v) orthoses fabrication costs. In conventional
resources based systems, fabricated orthoses further takes 5 minutes of time in finishing
the orthoses through manual grinding and trimming for smoothing and finishing the
edges of milled orthoses.
The costs in foot assessment, orthoses design and fabrication are identical in all
conventional systems. However, the cost in foot geometry capture is different due to
different methods involved. This has resulted in different total estimated cost per pair in
conventional design and fabrication systems. Plaster of Paris and plaster slipper based
foot geometry capturing systems give the estimated costs of £75.06 and £56.06,
respectively. Foam impression box foot geometry capturing based system involves total
estimated cost of £37.06 per pair. Contact digitising and 3D scan foot geometry capture
based system involve total estimated cost of £33.06 per pair.
Conventional
resources based
systems
Geometry
capture cost/
pair
Orthoses
design cost/
pair
Fabrication
cost/pair
Estimated
total cost/pair
Plaster of Paris £48 £2 £25.06 £75.06
Plaster slipper £29 £2 £25.06 £56.06
Foam box £10 £2 £25.06 £37.06
Contact digitising £6 £2 £25.06 £33.06
3D scanning £6 £2 £25.06 £33.06
Figure 7.4 shows the total estimated design and fabrication lead-time and total estimated
design and fabrication cost per pair in conventional resources based systems. Again the
total cost per pair estimates show that digital means of foot geometry capture have the
advantage of reducing total estimated cost per pair in conventional systems. This
subsequently reduces total estimated design and fabrication cost per pair in contact
digitising and 3D scanning based conventional systems, with foam box impression
Table 7:7 Total estimated design and fabrication cost per pair in conventional
resources based systems
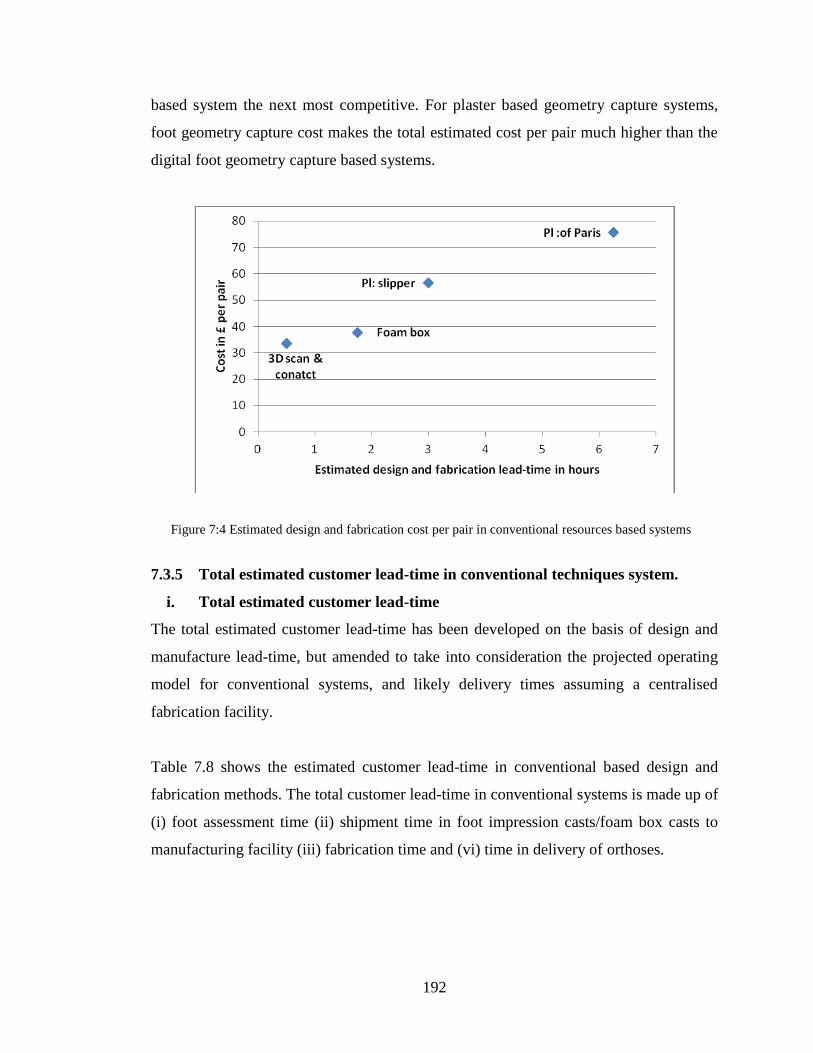
192
based system the next most competitive. For plaster based geometry capture systems,
foot geometry capture cost makes the total estimated cost per pair much higher than the
digital foot geometry capture based systems.
7.3.5 Total estimated customer lead-time in conventional techniques system.
i. Total estimated customer lead-time
The total estimated customer lead-time has been developed on the basis of design and
manufacture lead-time, but amended to take into consideration the projected operating
model for conventional systems, and likely delivery times assuming a centralised
fabrication facility.
Table 7.8 shows the estimated customer lead-time in conventional based design and
fabrication methods. The total customer lead-time in conventional systems is made up of
(i) foot assessment time (ii) shipment time in foot impression casts/foam box casts to
manufacturing facility (iii) fabrication time and (vi) time in delivery of orthoses.
Figure 7:4 Estimated design and fabrication cost per pair in conventional resources based systems
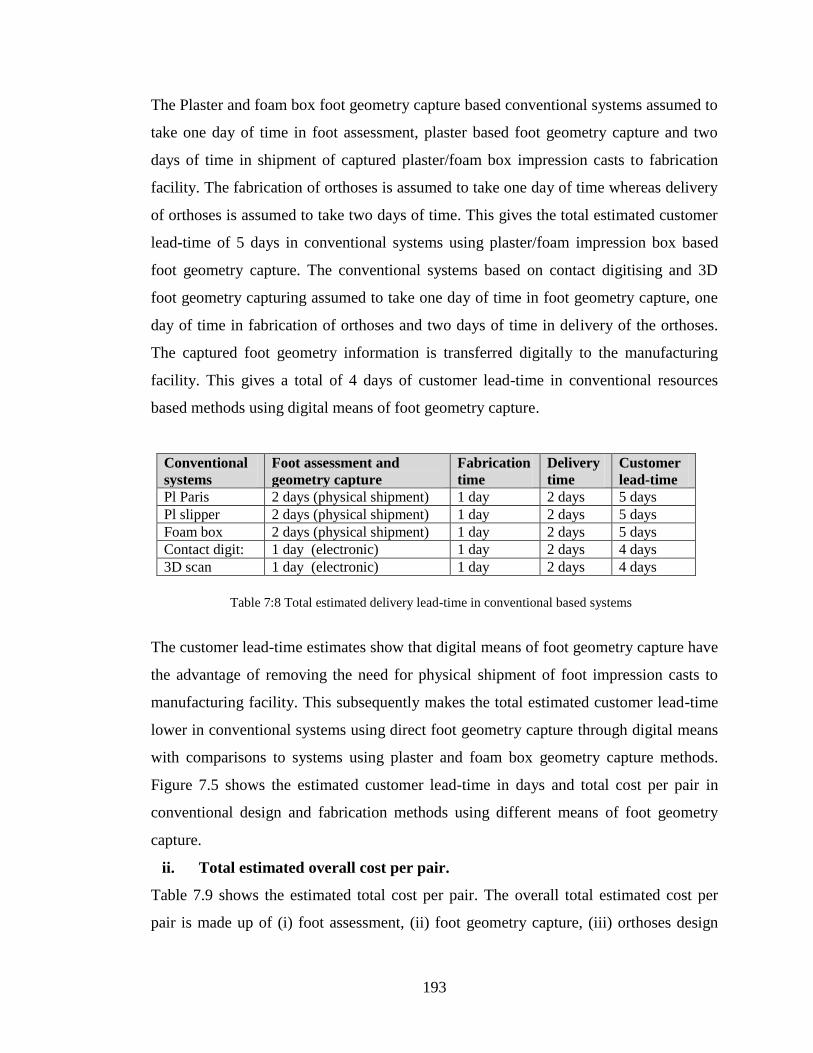
193
The Plaster and foam box foot geometry capture based conventional systems assumed to
take one day of time in foot assessment, plaster based foot geometry capture and two
days of time in shipment of captured plaster/foam box impression casts to fabrication
facility. The fabrication of orthoses is assumed to take one day of time whereas delivery
of orthoses is assumed to take two days of time. This gives the total estimated customer
lead-time of 5 days in conventional systems using plaster/foam impression box based
foot geometry capture. The conventional systems based on contact digitising and 3D
foot geometry capturing assumed to take one day of time in foot geometry capture, one
day of time in fabrication of orthoses and two days of time in delivery of the orthoses.
The captured foot geometry information is transferred digitally to the manufacturing
facility. This gives a total of 4 days of customer lead-time in conventional resources
based methods using digital means of foot geometry capture.
Conventional
systems
Foot assessment and
geometry capture
Fabrication
time
Delivery
time
Customer
lead-time
Pl Paris 2 days (physical shipment) 1 day 2 days 5 days
Pl slipper 2 days (physical shipment) 1 day 2 days 5 days
Foam box 2 days (physical shipment) 1 day 2 days 5 days
Contact digit: 1 day (electronic) 1 day 2 days 4 days
3D scan 1 day (electronic) 1 day 2 days 4 days
The customer lead-time estimates show that digital means of foot geometry capture have
the advantage of removing the need for physical shipment of foot impression casts to
manufacturing facility. This subsequently makes the total estimated customer lead-time
lower in conventional systems using direct foot geometry capture through digital means
with comparisons to systems using plaster and foam box geometry capture methods.
Figure 7.5 shows the estimated customer lead-time in days and total cost per pair in
conventional design and fabrication methods using different means of foot geometry
capture.
ii. Total estimated overall cost per pair.
Table 7.9 shows the estimated total cost per pair. The overall total estimated cost per
pair is made up of (i) foot assessment, (ii) foot geometry capture, (iii) orthoses design
Table 7:8 Total estimated delivery lead-time in conventional based systems
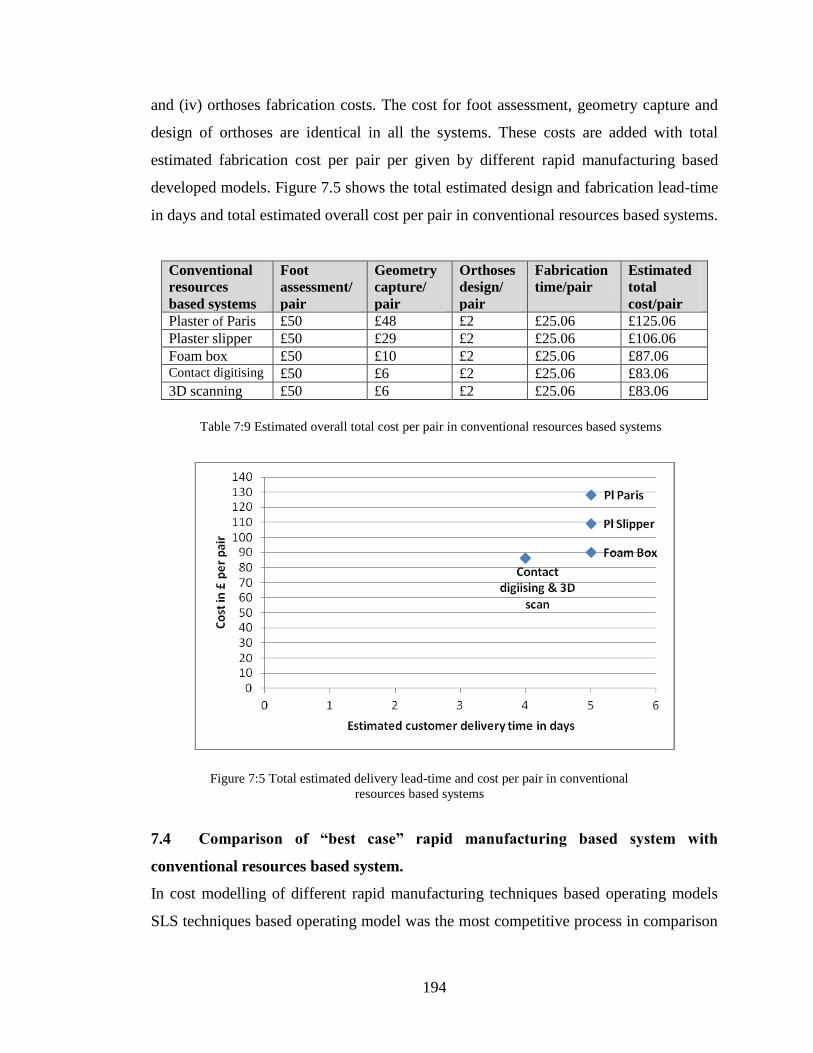
194
and (iv) orthoses fabrication costs. The cost for foot assessment, geometry capture and
design of orthoses are identical in all the systems. These costs are added with total
estimated fabrication cost per pair per given by different rapid manufacturing based
developed models. Figure 7.5 shows the total estimated design and fabrication lead-time
in days and total estimated overall cost per pair in conventional resources based systems.
Conventional
resources
based systems
Foot
assessment/
pair
Geometry
capture/
pair
Orthoses
design/
pair
Fabrication
time/pair
Estimated
total
cost/pair
Plaster of Paris £50 £48 £2 £25.06 £125.06
Plaster slipper £50 £29 £2 £25.06 £106.06
Foam box £50 £10 £2 £25.06 £87.06 Contact digitising £50 £6 £2 £25.06 £83.06
3D scanning £50 £6 £2 £25.06 £83.06
7.4 Comparison of “best case” rapid manufacturing based system with
conventional resources based system.
In cost modelling of different rapid manufacturing techniques based operating models
SLS techniques based operating model was the most competitive process in comparison
Table 7:9 Estimated overall total cost per pair in conventional resources based systems
Figure 7:5 Total estimated delivery lead-time and cost per pair in conventional
resources based systems
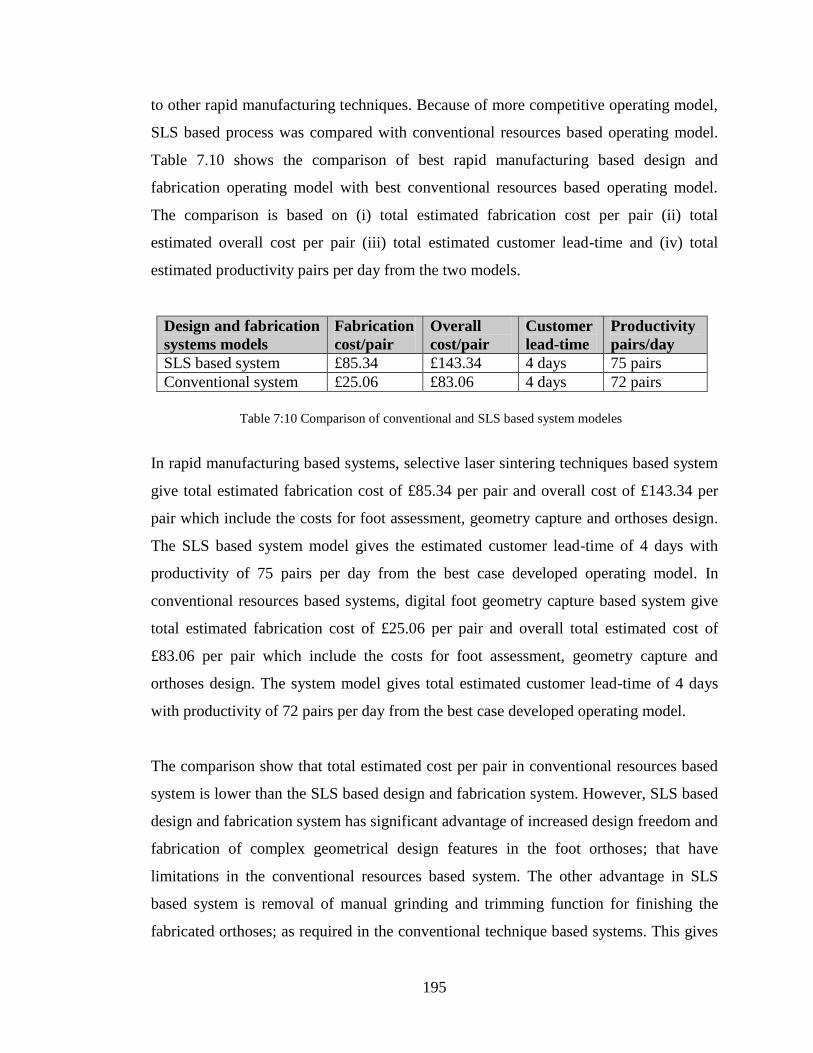
195
to other rapid manufacturing techniques. Because of more competitive operating model,
SLS based process was compared with conventional resources based operating model.
Table 7.10 shows the comparison of best rapid manufacturing based design and
fabrication operating model with best conventional resources based operating model.
The comparison is based on (i) total estimated fabrication cost per pair (ii) total
estimated overall cost per pair (iii) total estimated customer lead-time and (iv) total
estimated productivity pairs per day from the two models.
Design and fabrication
systems models
Fabrication
cost/pair
Overall
cost/pair
Customer
lead-time
Productivity
pairs/day
SLS based system £85.34 £143.34 4 days 75 pairs
Conventional system £25.06 £83.06 4 days 72 pairs
In rapid manufacturing based systems, selective laser sintering techniques based system
give total estimated fabrication cost of £85.34 per pair and overall cost of £143.34 per
pair which include the costs for foot assessment, geometry capture and orthoses design.
The SLS based system model gives the estimated customer lead-time of 4 days with
productivity of 75 pairs per day from the best case developed operating model. In
conventional resources based systems, digital foot geometry capture based system give
total estimated fabrication cost of £25.06 per pair and overall total estimated cost of
£83.06 per pair which include the costs for foot assessment, geometry capture and
orthoses design. The system model gives total estimated customer lead-time of 4 days
with productivity of 72 pairs per day from the best case developed operating model.
The comparison show that total estimated cost per pair in conventional resources based
system is lower than the SLS based design and fabrication system. However, SLS based
design and fabrication system has significant advantage of increased design freedom and
fabrication of complex geometrical design features in the foot orthoses; that have
limitations in the conventional resources based system. The other advantage in SLS
based system is removal of manual grinding and trimming function for finishing the
fabricated orthoses; as required in the conventional technique based systems. This gives
Table 7:10 Comparison of conventional and SLS based system modeles
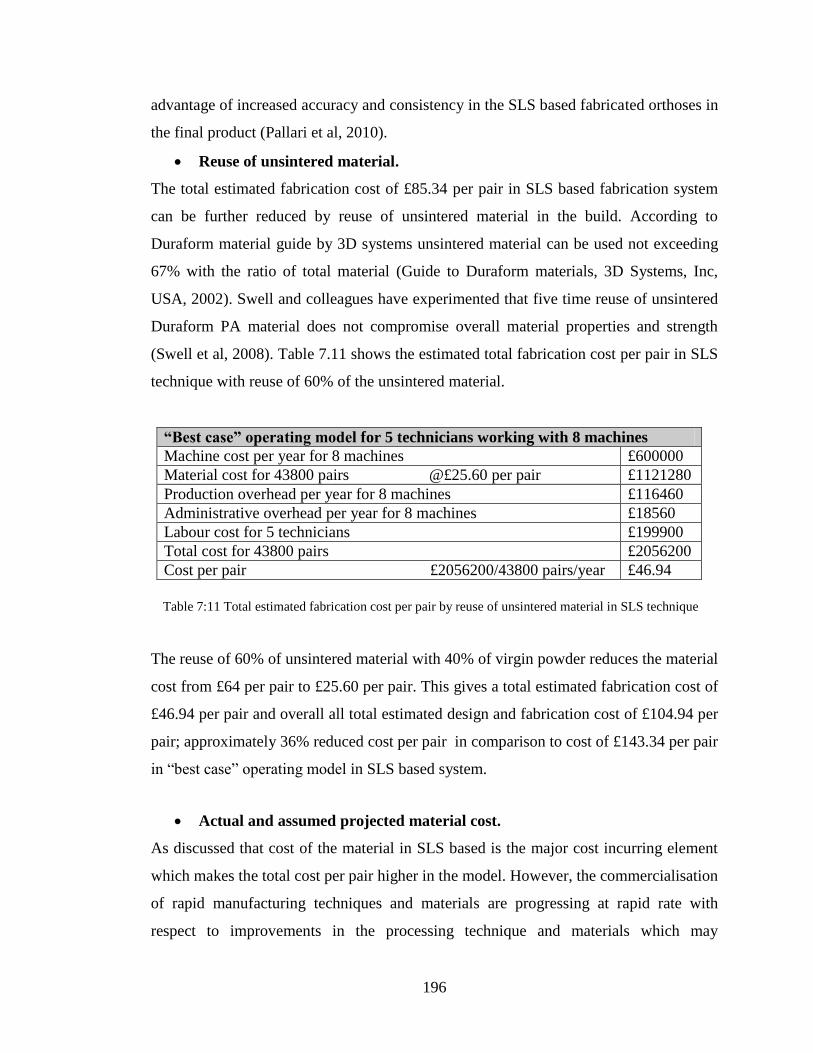
196
advantage of increased accuracy and consistency in the SLS based fabricated orthoses in
the final product (Pallari et al, 2010).
Reuse of unsintered material.
The total estimated fabrication cost of £85.34 per pair in SLS based fabrication system
can be further reduced by reuse of unsintered material in the build. According to
Duraform material guide by 3D systems unsintered material can be used not exceeding
67% with the ratio of total material (Guide to Duraform materials, 3D Systems, Inc,
USA, 2002). Swell and colleagues have experimented that five time reuse of unsintered
Duraform PA material does not compromise overall material properties and strength
(Swell et al, 2008). Table 7.11 shows the estimated total fabrication cost per pair in SLS
technique with reuse of 60% of the unsintered material.
“Best case” operating model for 5 technicians working with 8 machines
Machine cost per year for 8 machines £600000
Material cost for 43800 pairs @£25.60 per pair £1121280
Production overhead per year for 8 machines £116460
Administrative overhead per year for 8 machines £18560
Labour cost for 5 technicians £199900
Total cost for 43800 pairs £2056200
Cost per pair £2056200/43800 pairs/year £46.94
The reuse of 60% of unsintered material with 40% of virgin powder reduces the material
cost from £64 per pair to £25.60 per pair. This gives a total estimated fabrication cost of
£46.94 per pair and overall all total estimated design and fabrication cost of £104.94 per
pair; approximately 36% reduced cost per pair in comparison to cost of £143.34 per pair
in “best case” operating model in SLS based system.
Actual and assumed projected material cost.
As discussed that cost of the material in SLS based is the major cost incurring element
which makes the total cost per pair higher in the model. However, the commercialisation
of rapid manufacturing techniques and materials are progressing at rapid rate with
respect to improvements in the processing technique and materials which may
Table 7:11 Total estimated fabrication cost per pair by reuse of unsintered material in SLS technique
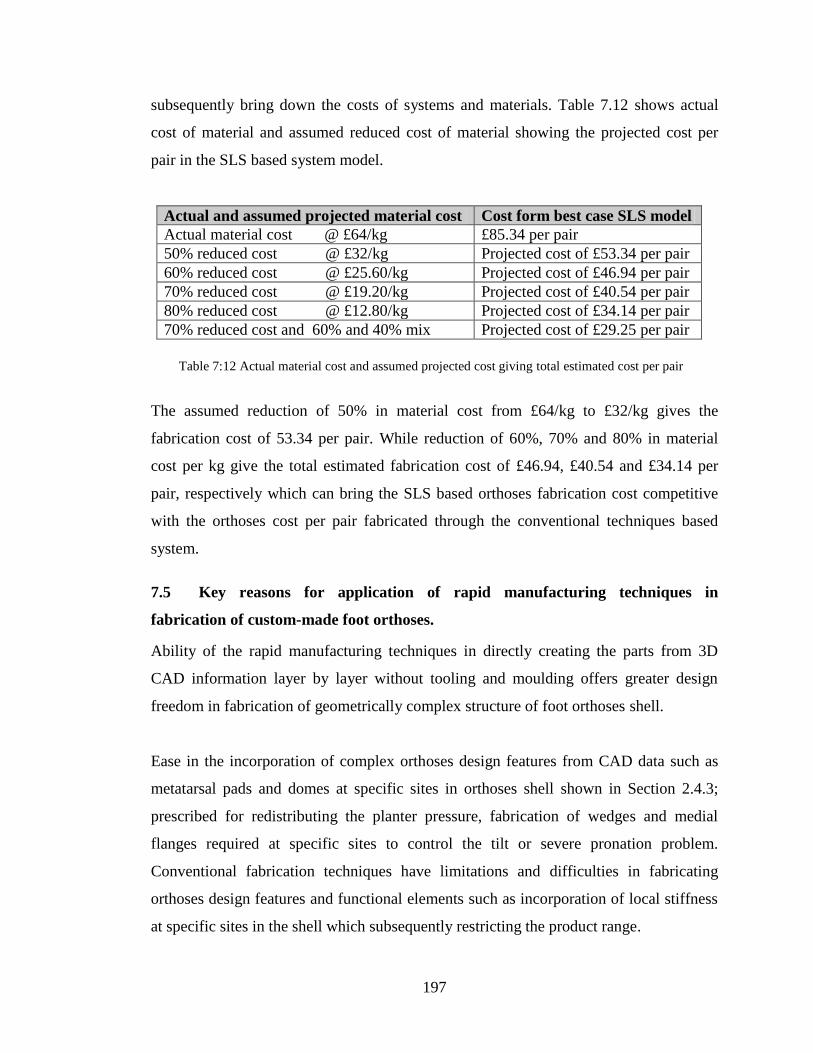
197
subsequently bring down the costs of systems and materials. Table 7.12 shows actual
cost of material and assumed reduced cost of material showing the projected cost per
pair in the SLS based system model.
Actual and assumed projected material cost Cost form best case SLS model
Actual material cost @ £64/kg £85.34 per pair
50% reduced cost @ £32/kg Projected cost of £53.34 per pair
60% reduced cost @ £25.60/kg Projected cost of £46.94 per pair
70% reduced cost @ £19.20/kg Projected cost of £40.54 per pair
80% reduced cost @ £12.80/kg Projected cost of £34.14 per pair
70% reduced cost and 60% and 40% mix Projected cost of £29.25 per pair
The assumed reduction of 50% in material cost from £64/kg to £32/kg gives the
fabrication cost of 53.34 per pair. While reduction of 60%, 70% and 80% in material
cost per kg give the total estimated fabrication cost of £46.94, £40.54 and £34.14 per
pair, respectively which can bring the SLS based orthoses fabrication cost competitive
with the orthoses cost per pair fabricated through the conventional techniques based
system.
7.5 Key reasons for application of rapid manufacturing techniques in
fabrication of custom-made foot orthoses.
Ability of the rapid manufacturing techniques in directly creating the parts from 3D
CAD information layer by layer without tooling and moulding offers greater design
freedom in fabrication of geometrically complex structure of foot orthoses shell.
Ease in the incorporation of complex orthoses design features from CAD data such as
metatarsal pads and domes at specific sites in orthoses shell shown in Section 2.4.3;
prescribed for redistributing the planter pressure, fabrication of wedges and medial
flanges required at specific sites to control the tilt or severe pronation problem.
Conventional fabrication techniques have limitations and difficulties in fabricating
orthoses design features and functional elements such as incorporation of local stiffness
at specific sites in the shell which subsequently restricting the product range.
Table 7:12 Actual material cost and assumed projected cost giving total estimated cost per pair
198
7.6 Summary
At present the orthotics industry is predominantly made up of small companies, who do
not always have access to large amounts of capital. A low initial capital cost would help
industrial uptake. Around £100 million is spent annually on the provision of orthotics
services through the NHS, and the bulk of this is for foot related orthoses (Hutton and
Hurry, 2009). Orthotic Service in the NHS: Improving Service Provision (York Health
Economics Consortium).
The work in this research was on the cost and lead-time modelling and estimation of
total cost per pair of orthoses using rapid manufacturing techniques based design and
fabrication system. The cost estimations presented in this work are based on a ‘full
costing’ concept and includes labour, machine absorption, production, and
administrative overheads and material costs. The indirect costs were assigned to the
components on the machines working-time basis. The output from the cost models
developed is a scalable production unit, which can be scaled to a specific market
demand. Based on the cost modelling estimations in this work, the business models for
different rapid manufacturing based design and fabrication systems can be generated.
The return on investment (ROI) can be calculated from the business model; however
generation of the business model was out of the scope of this research study.
The total market size for additive manufacturing was $1.068 billion by 2009, only
accounting for directly associated products and services (Wohlers, 2010). With the
recent growth in desktop printer sales nearly 20% increases from 2009- (Wholers 2010)
and the constant reduction in materials costs. However there was a significant gap in the
literature for the analysis of RM versus conventional processing technologies when it
comes to fabricating final-functional parts. Until now adoption of RM was studied from
a design perspective highlighting the opportunities of freedom of design; however the
factors that ultimately will influence decision makers in the organisations remain purely
productive economic-related. The cost and lead-time modelling in this work assessed the
productivity considerations for various RM technologies for the fabrication of custom-
made foot orthoses.
199
7.7 Conclusions
1. This thesis has presented the first in-depth analysis of technical and commercial
potential for rapid manufacturing techniques to be used for commercial scale
fabrication of custom-made foot orthoses.
2. Process modelling of design and fabrication system for custom-made foot
orthoses using IDEF0 modelling methodology showed that rapid manufacturing
techniques can be integrated in the current orthoses design and fabrication
process in order to develop the mass customisation production systems.
3. In digital means of foot geometry capture 3D scanning is the better method for
foot geometry capture regardless of the fabrication techniques. The pin-tool
based contact digitisers have limitations in capturing the posterior heel of the
foot as pin-tool digitising system only captures the geometry of the plantar of the
foot in geometry capture process.
4. Analysis and evaluation of the cost and lead-time through cost modelling
identified the most appropriate operating models for fabrication of custom-made
foot orthoses using rapid manufacturing techniques.
5. From the current commercial rapid manufacturing techniques, selective laser
sintering SLS based system is the most competitive for custom-made foot
orthoses fabrication among all other rapid manufacturing based systems, having
lowest cost per pair and more build capacities and overall productivity.
6. Selective laser sintering SLS fabricated custom-made foot orthoses are estimated
to cost more than conventionally fabricated orthoses. On the basis of using 100%
virgin powder; SLS based pair of orthoses is estimated to be 233.88% more
expensive in terms of total estimated fabrication cost and 71.54% more
expensive in terms of total estimated overall cost. On the basis of using 60%
reuse of unsintered and 40% virgin powder it is estimated to be 83.64% more
200
expensive in terms of total estimated fabrication cost and 25.58% in terms of
total estimated overall cost.
7. In order to cost the SLS based fabricated orthoses same as conventionally
fabricated orthoses, the raw material cost would have to be reduced by 70% at
the rate of 19.20/kg and assuming that 40% virgin and 60% unsintered powder
were re-used. This gives the total estimated fabrication cost at the rate of £29.25
per pair and overall cost of £87.25 per pair in SLS based design and fabrication
system. The fabrication and overall costs are 10% and 4%, respectively
expensive in comparison to cost per pair of orthoses produced through
conventional techniques.
7.8 Future work
Reuse of unsintered material for fabrication of orthoses may be further investigated in
order to determine that material can be used for fabrication without compromising the
material properties and quality of the final product.
Duraform PA (Nylon 12) is a suitable material and could be used in the orthoses
fabrication as the end use product material. However, beside the other mechanical
properties, fatigue behaviour of the material may be investigated for long periods of
service time. Fatigue under a large number of cycles could be investigated as materials
gets degradation during service life phase over the time.
In SLS based fabricated orthoses, cushioning layer may be required for orthoses shell.
Creating a layer over the main body of orthoses shell in order to increases comfort may
be investigated. The sole of the shoe in which orthoses shell has to fit in must be
considered and investigated for increased resilience in order to promote the gait,
improve mobility and over all comfort to the patient. Additionally, large scale clinical
trials should be performed for satisfaction of patients and practicing medical personals
and orthotist.
201
References
Ahlstrom P, and R. Westbrook, (1999), Implications of mass customization for
operations management: An exploratory survey, International Journal of
Operations and Production Management, Volume 19, Number 3, pp 262-274.
Alford D, Sackett P, and Nelder G, (2000). Mass customization an automotive
perspective, International Journal of Production Economics, Volume
65, Number 1, pp 99-110.
Ang, C. L., Luo, M, and Gay K L, (1994). Automatic generation of IDEF0 models,
Journal of Intelligent Manufacturing, Volume, 5, Number 2, pp 79-92.
Ang C. L.;M. Luo and R. K. L. Gay (1997). A knowledge-based approach to the
generation of IDEF0 models, International Journal of Production Research,
Volume 35, Number. 5, 1385-1412.
Ang, C. L., Khoo, L. P, and Gay, R. K. L. IDEF, (1999), A comprehensive modelling
methodology for the development of manufacturing enterprise systems.
International Journal of Production Research, Volume 37, Number 17, pp 3839-
3858.
Anthony J, Raymond (1991), Manufacture and Use of the Functional Foot Orthosis -
ISBN 3-8055-5298-X, Karger AG, Basle & New York.
Ashley (1993), “Rapid prototyping for artificial body parts”, The Journal of American
Society of Mechanical Engineers, Volume 115, Number 5, pp 50-53.
Armillotta, A., Bonhoeffer, P., Dubini, G., Ferragina, S., Migliavacca, F., Sala, G. &
Schievano, S. (2007). Use of rapid prototyping models in the planning of
percutaneous pulmonary valved stent implantation. Proceedings of the Institution
of Mechanical Engineers, Part H, Journal of Engineering in Medicine, Volume
221, Number 4, pp 407-416.
Atzeni Eleonora, Luca Iuliano, Paolo Minetola, Alessandro Salmi, (2010) "Redesign
and cost estimation of rapid manufactured plastic parts", Rapid Prototyping
Journal, Volume. 16, Number 5, pp. 308-317.
Baldwin, C.Y., Clark, K.B., (1994). Modularity-in-design: an analysis based on the
theory of real options. Working Paper, Harvard Business School, Boston, USA.
Bellamy, L. (2007), Exploratory survey of foot orthoses prescribing practices for
202
patients with rheumatoid arthritis British Journal of Podiatry, Volume 10,
Number 1, pages 8-11.
Berger, C., Moslein, K., Piller, F. and Reichwald, R. (2005), Co-designing Modes of
Cooperation at the Customer Interface: learning from exploratory research.
European Management Review, Volume 2, Number 1, pp 70-87.
Berger Christoph (2003), Mass Customization - an adidas perspective, The institution of
Electrical Engineers. IEEE, Savoy Place, London, WCPR OBL. UK, pp 2/1-2/4.
Bibb, R., Eggbeer, D, and Williams, R. (2006), Rapid manufacture of removable partial
denture frameworks. Rapid Prototyping Journal, Volume 12, Number 2, pp 95-
99.
Blais, F., Bisson, J.A., Williams, S., Robertson, N., Rozin, S., Nelson, A., (2000), The
shape grabber foot scanner: a low cost high accuracy 3-D system for the
acquisition of human feet. In: Corner, B.D., Nurre, J.H. (Eds.), Three-
Dimensional Image Capture and Applications, vol. III. Proceedings of the SPIE,
Volume, 3958, pp. 178-186.
Boardman Sara (2007): The economic case for CAD/CAM custom foot orthoses,
Podiatry Now, April 2007.
Brown George A., Keikhosrow Firoozbakhsh, Thomas A. DeCoster, Jose R. Reyna, Jr.,
and Moheb Moneim, (2003), Rapid Prototyping: The Future of Trauma Surgery?
The American Journal of Bone and Joint Surgery, Volume 85: Number 4, pp 49-
55.
Brocklesby S, Wooles C. (2009). Cost comparison: Orthoses an audit. In-house
manufacture from sheet materials vs prefabricated orthoses. Podiatry Now,
Volume 6, pp 17-23.
Buonomo L, Klein J, and Keiper T. (2001), Custom-made, pre-fabricated and material
selection. Foot and Ankle Clinics, Volume 6, Number 2, pp 249-252.
Bus SA, Ulbrecht JS, Cavanagh PR. (2004), Pressure relief and load redistribution by
custom-made insoles in diabetic patients with neuropathy and foot deformity,
Clinical Biomechanical, Volume.19, Number 6, pp 629-38.
203
Buswell R.A., R.C. Soar, A.G.F. Gibb, and A. Thorpe, (2007), Freeform Construction:
Mega-scale Rapid Manufacturing for construction, Automation in Construction,
Volume 16, Number 2, pp 224–231.
Caselli MA (2004). Orthoses, materials, and foot function. Podiatry Management,
Volume 23, Number 7, pp 131-138.
Cee Kai, Chua, K. F. Leong, C.S., Lim. (2003). Rapid Prototyping: Principles and
Applications. New Jersey, World Scientific.
Chalmers AC, Busby C, Goyert J, Porter B and Schulzer M, (2000), “Metatarsalgia and
rheumatoid arthritis- A randomized, single blind, sequential trial comparing 2
types of foot orthoses and supportive shoes”. Journal of Rheumatolog, Volume
27, Number 7, pp 1643-1647.
Chen Y. H., Ng C. T. and Wang Y. Z. (1999), Generation of an STL File from 3D
Measurement Data with User-Controlled Data Reduction, International Journal
of Advance Manufacturing Technology, Volume 15, Number 2, pp 127-131.
Cheng Tan Kim, Peter Lee Vee Sin, Tam Kock Fye and Lye Sau Lin, (1998),
Automation of Prosthetic socket design and fabrication using computer aided-
design/computer-aided Engineering and rapid prototype techniques, First
National symposium of prosthetic and orthotics, Singapore.
Chinnaiah, P.S.S., Kamarthi, S.V. and Cullinane, T.P., (1995) Characterization and
Analysis of Mass-customized Production Systems - submitted to IEEE Trans. on
Eng. Management.
Coates, J. F. and Wolff, M. F. (1995), “Customization promises sharp competitive
edge”, Research Technology Management, Volume 38, Number 6, pp. 6-7.
Colombo Giorgio , Stefano Filipp, Caterina Rizzi and Federico Rotini, (2010). A new
design paradigm for the development of custom-fit soft sockets for lower limb
prostheses Computers in Industry, Volume 61, Number 6, pp 513-523.
Cormier Denis, Ola Harrison and Tushar Mahale (2003) Rapid Manufacturing in the 21st
Century, Journal of the Chinese Institute of Industrial Engineers, Volume. 20,
Number 3, pp. 193-202.
204
Cortex, R., Dinulescu, N., Skafte, K., Olson, B., Keenan, D., and Kuk, F., (2004)
Changing with the Times: Applying Digital Technology to Hearing Aid Shell
Manufacturing. Hearing Review, Volume 11, Number 3, pp. 30-38.
Cullinane, Thomas P, Pratap S. S. Chinnaiah, Naken Wongvasu and Saga V. Kamarthi
(1997) A Generic IDEFO Model of a Production System for Mass
Customization, Innovation in Technology Management - The Key to Global
Leadership. PICMET: Portland International Conference on Management and
Technology.
Czajkiewicz Zbigniew J. (2008) Direct Digital Manufacturing, New Product
Development and Production Technology, Economics and Organization of
Enterprise, Volume 2 Number 2, pp. 29-37.
Dalgarno, K. W, J. H. Pallari, J. Woodburn, K. Xiao, D. J. Wood, R. D. Goodridge
and C. Ohtsuki, (2006), Mass customization of medical devices and implants:
state of the art and future directions. Virtual and Physical Prototyping, Volume.
1, Number 3, pp 137-145.
Davis Stanley, (1989), From future perfect: Mass customizing, Planning Review,
Volume 17, Number 2, pp 16-21.
Davis Frank M, (1993), In-office computerized fabrication of custom foot supports: The
Amfit system, Journal of Clinics in podiatry Medicine and Surgery, Volume 10,
Number, 3 pp 393-401.
DeMarco, T., (1979), Structured Analysis and System Specification (New York:
Yourdon Computing Series: Yourdon Press).
Dimitrov D., K. Schreve, N. de Beer, (2006) "Advances in three dimensional printing –
state of the art and future perspectives", Rapid Prototyping Journal, Volume 12,
Number 3, pp.136-147.
Dotchev Krassimir, Ivan Popov, Daniel Eyers, (2009), Rapid Manufacturing and
Reverse Engineering: Key Issues For Mass Customisation, International
Conference General Machine Design October 15-th – 16-th, University of Ruse.
Doxey, Gordon E. (1985) Clinical Use and Fabrication of Molded Thermoplastic Foot
Orthotic Devices Volume 65, Number 11, pp 1679-1682.
205
Duray R, Ward P.T, Milligan G.W, Berry W.L (2000) Approaches to mass
customization: configurations and empirical validation, Journal of Operations
Management, Volume 18, Number 6, pp 605-625.
Duray Rebecca, (2002) Mass customization origins: mass or custom manufacturing
International Journal of Operations & Production Management Volume 22,
Number 3, pp 314-328.
Eastwood M, (1996) Implementing mass customization, Computers in Industry, Volume
30, Number 3, pp 171-174.
Faustini MC, Neptune RR, Crawford RM, Rogers WE and Bosker G. (2005), “Selective
laser sintering of passive dynamic ankle-foot orthoses”, Transactions of the
ASME 946 / Volume. 127, November 2005.
Frank Matthew, Sanjay b. Joshi and Richard A. Wysk (2003) Rapid prototyping as an
integrated product/process development tool an overview of issues and
economics journal of the Chinese institute of industrial engineers, Volume. 20,
umber. 3, pp. 240-246.
Freeman Donald and Leslie Wontrorcik, (1998) Stereolithography and Prosthetic test
socket manufacture: A cost benefit analysis, Journal of Prosthetic and Orthotics,
Volume 10, Number. 1 pp 17-20
Frykberg RG, Zgonis T, Armstrong DG, (2006), Diabetic foot disorders, A clinical
practice guideline revision. J Foot Ankle Surg. Sep-Oct 45 (Suppl): S1-66.
Gartner, H., Lavoie, J.F., Vermette, E., Houle, P.S., (1999). Multiple structured light
system for the 3D-measurement of feet. In: Proceedings of Three-dimensional
Image Capture and Applications II (IS&T/ SPIE) Conference, San Jose, CA,
January 1999, SPIE, Volume, 3640, pp. 104-114.
Giannatsis J., Dedoussis V, D. Karalekas (2002). Architectural scale modelling using
stereolithography, Rapid Prototyping Journal, Volume 3, Number 3, pp 200-207.
Gibson I (2005), Rapid Prototyping: A Tool for Product Development Computer-Aided
Design & Applications, Volume. 2, Number. 6, pp 785-793.
Gibson I, (2006) Rapid prototyping: from product development to medicine and beyond,
Journal of Virtual and Physical Prootyping, Volume, 1, Number, 1 pp 31-42.
206
Gibson I., L.K. Cheung, S.P. Chow, W.L. Cheung, S.L. Beh, M. Savalani, S.H. Lee,
(2006) "The use of rapid prototyping to assist medical applications", Rapid
Prototyping Journal, Volume. 12, Number 1, pp.53-58.
Gibson l D. W. Rosen l B. Stucker, (2010), Additive Manufacturing Technologies Rapid
Prototyping to Direct Digital Manufacturing, Springer.
Gilmore J., and Pine J., (1997), The four faces of mass customization, Harvard Business
Review, Volume 75, Number 1, pp 91-101.
Goodman, Ashley, (2004), Foot Orthoses in Sports MedicineSouthern Medical Journal:
Volume 97 - Issue 9 - pp 867-870
Godwin, A., Gleeson, J. and Gwillian, D. (1989). An assessment of the IDEF notations
as descriptive tools. Information Systems, Volume 14, number 1, pp 13-28.
Grimm, T. and Terry Wohlers, The real cost of RP, Time compression technologies,
March/April, 2002.
Grumbine N. (1993). Computer-generated orthoses. A review. Clinical Podiatry
Medicine Surgery, Volume 10, Number 3, pp 377-391.
Hague R, Campbell I, and Dickens P, (2003) “Implications on design of rapid
manufacturing”, Journal of Mechanical Engineering Science, Part C, Proc. Inst
Mech. Engrs, Volume 217, Part c.
Hammer M., and J. Champy. (1993) Reengineering the Corporation, New York Harper
Collins.
Hart, C. (1995) Mass Customization: Conceptual Underpinnings, Opportunities and
Limits. International Journal of Service Industry Management, Volume 6,
Number 2, pp 36-45.
Hearon, K., Lee, J., and Marich, K. (2008). Comparison of 3D digital contact casting
versus manual foam casting of the feet for the design and fabrication of custom
foot orthoses. Journal of Vertebral Subluxation Research, Volume 10 Number 1,
pp 1-5.
Helliwell P, Woodburn J, Redmond A, Turner D and Davys H, (2007) “The Foot and
Ankle in Rheumatoid Arthritis – A Comprehensive guide”, Churchill
Livingstone Elsevier, 2007, ISBN 0443101108.
207
Herbert Nicholas, David Simpson, William D Spence and William Ion, (2005), A
preliminary investigation into the development of 3-D printing of prosthetic
sockets, Journal of Rehabilitation Research and Development, Volume 42,
Number 2, pp 141-146.
Hieu, L.C., Bohez, E., Vander Sloten, J., Phien, H.N., Vatcharaporn, E., Binh, P.H., An,
P.V. & Oris, P. (2003). Case Study: Design for medical rapid prototyping of
cranioplasty implants. Rapid Prototyp Journal, Volume 9, Number 3, pp. 175-
186.
Hollister, S. (2005). Porous scaffold design for tissue engineering. Nature Materials,
Volume 4, Number 7, pp 518-524.
Hopkinson, N and Dickens, P. (2001). Rapid prototyping for direct manufacture, Rapid
Prototyping Journal, Volume 7, Number 4, pp 197-202.
Hopkinson, N. and P. Dickens (2003). "Analysis of rapid manufacturing-using layer
manufacturing process for production." Proceedings of IMechE, Part C, Journal
of Mechanical Engineering Science 217, Number 1, pp 31-39.
Hopkinson, N., Hague, R., Dickens, P. (2006). "Introduction to Rapid Manufacturing" in
Rapid manufacturing: an industrial revolution for the digital age, editors:
Hopkinson, N., Hague R. J. M., Dickens, P.M., Chichester, England, John
Wiley.
Houle, P.S., Beaulieu, E., Liu, Z., (1997). Novel fully integrated computer system for
custom footwear: from 3D digitization to manufacturing. Proceedings of Three-
dimensional Image Capture and Applications, SPIE, Volume. 3313, San Jose,
CA, pp. 65-73.
Hutmacher, D.W., Sittinger, M. & Risbud M.V. (2004). Scaffold-based tissue
engineering: rationale for computer-aided design and solid free-form fabrication
systems. Trends in Biotechnology, Volume 22, Number 7, pp 354-362.
Hunt,V.D., (1996), Process Mapping: How to Reengineer Your Business Processes
(Wiley).
Hunter S, Dolan MG, Davis JM. (1995) Foot orthotics in therapy and sport, Champaign,
IL: Human Kinetics.
208
Huppin Larry, (2009), Technology: Choosing a digital foot scanner, Lower Extremity
review, August 2009.
J. M. Saleh and K. W. Dalgarno (2009), “Cost and benefit analysis of fused deposition
modelling (FDM) technique and selective laser sintering (SLS) for fabrication of
customised foot orthoses,” in Proc. 4th Int. Conf. Adv. Res. Virtual Rapid
Manuf., Innovative Dev. Des. Manuf., Leiria, Portugal, Oct. 6–10, 2009, pp.
187–192, ISBN 978-0-415-87307-9.
Kennedy Séamus (2008), Material Choices in Foot Orthotic Design, The O&P EDGE
February 2008.
Kotha, S. (1995), Mass customization: implementing the emerging paradigm for
competitive advantage, Strategic Management Journal, Volume. 16, Number 1,
pp 21-42.
Kotha, S. (1996), From mass production to mass customization: The case of the
National Industrial Bicycle Company of Japan, European Management Journal,
Volume 14, Number 5, .pp 442-450.
Kraemer Kenneth L., Dedrick Jason, and Yamashiro Sandra (2000). Refning and
extending the business model with Information Technology: Dell Computer
Corporation, International Journal of Information Society, Volume 16,
Number,1, pp 5–21.
Kruth, J. P., Leu, M.C., Nakawa, T. (1998). "Progress in Additive Manufacturing and
Rapid Prototyping." CIRP Annals - Manufacturing Technology, Volume 47
Number 2, pp 525-540.
Kruth J.P., B. Vandenbroucke, J. Van Vaerenbergh, and I. Naert (2005). Digital
manufacturing of biocompatible metal frameworks for complex dental
prostheses by means of SLS/SLM In Virtual Prototyping and Rapid
Manufacturing, Advanced research in virtual and Rapid Prototyping, Taylor &
Francis, London, pp 139–146.
Kumar Vijay, Ruzena Bajcsy, William Harwin, and Patrick Harker (1996) Rapid Design
and Prototyping of Customized Rehabilitation Aids, Communications of the
Acm, Volume. 39, Number 2, pp 55-61.
Lampel, J., and Mintzberg, H., (1996) Customizing customization. Sloan Management
209
Review, Volume 38, Number 1, pp 21-30.
Lau R., (1995), Mass customization: The next industrial revolution, Industrial
Management, Volume 37, Number 5, pp18-19.
Laughton C, McClay Davis I, Williams DS: (2002), A comparison of four methods of
obtaining a negative impression of the foot. Journal of American Podiatric Med
Assoc, Volume 92, Number 5, pp 261-268.
Leber C. and P. M. Evanski, (1986), A comparison of shoe insole materials in plantar
pressure relief, Prosthetics and Orthotics International, Volume10, Number 3,
pp135-138.
Lebovitz Richard and Graban Mark (2001), The Journey Toward Demand Driven
Manufacturing, Proceedings 2nd International Workshop on Engineering
Management for Applied Technology, 2001. EMAT 2001. Pp 29-35.
Lee Chang, C.C., M.Y., Wang, S.H. (2006), Digital denture manufacturing- An
integrated technologies of abrasive computer tomography, CNC machining and
rapid prototyping. International Journal of Advance Manufacturing Technology,
Volume 31, Number 1-2, pp 41-49.
Leong, K.F., Chua, C.K., Gui, W.S. & Verani (2006), Building porous biopolymeric
microstructures for controlled drug delivery devices using selective laser
sintering. International Journal of Advanced Manufacturing Technologies,
Volume 31, Number 5-6, pp 483-489.
Leung A. K. L., Cheng J. C. Y. and Mak A. F. T. (2004), Orthotic design and foot
impression procedures to control foot alignment, Prosthetics and Orthotics
International, Volume 28, Number 3, pp 254-262.
Leung Ki SW, AK, Li AN. (2008), Comparison of plantar pressure distribution patterns
between foot orthosis provided by the CAD-CAM and foam impression
methods. Prosthetics and Orthotics International, Volume 32, Number 3, pp 356-
362.
Levy, G. N., Schindel, R. (2002). "Overview of layer manufacturing technologies,
opportunities, options and applications for rapid tooling". Proc. Inst. Mech.
Engrs Part B: Journal Engineering Manufacture, Volume 216, Number 12, pp
1621-1634.
210
Lockard MA. (1998), Foot orthoses, Physical therapy, Volume 68, Number 12, pp 1866-
73.
Lusardi, M.M, & Nielsen, (2000) C.C, “Orthotics and prosthetics in rehabilitation”,
Butterworth- Heinmann, 2000, ISBN 0750698071.
Mandel, K, (1990), Graphical process description views and diagrams. International
Journal of Computer Integrated Manufacturing Systems, Volume 3, Number 5,
pp 314-327.
McCarthy, (2003), Understanding Customization in Mass Customization The Institution
of Electrical Engineers, IEE, Savoy Place, London,
McCarthy, Barbazon and Bramham, (2003), Fundamental modes of operation for mass
customisation, International Journal of Production Economics, 3, Volume 85,
Number 3, pp 289-304.
MacCarthy and Philip Brabazon: In the business of mass customization, (2003), IEE
Manufacturing Engineer August/September, pp 30-33.
McPoil TG, Schuit D, Knecht HG. (1989), Comparison of three methods used to obtain
a neutral plaster foot impression. Physical Therapy, Volume 69, Number 6, pp
448-52.
Madazhy Rajeev, (2004), Automated Capture of 3D Foot Geometry For Custom
Orthoses, 2004 ME Graduate Student Conference, Louisiana State University,
USA.
Magalhaes ED, Davitt M, Filho DJ, Battistella LR, Bertolo MB. (2006), The effect of
foot orthoses in rheumatoid arthritis. Rheumatology, Volume 45, Number 4, pp
449-553.
Maslowski, E. and Heise, S. (2002), “President’s house 3D model”, available at:
http://mu3d.ummu.umich.edu/ projects/president house/index.html
McCutcheon, D.M., Raturi, A.S., Meredith, J.R., (1994), The customization
responsiveness squeeze. Sloan Management Review, Volume 35, Number 2, pp
89-99.
Milovanovic J, M. Trajanović, (2007), Medical Applications of Rapid Prototyping,
Facta Universitatis Series: Mechanical Engineering, Volume. 5, Number 1, pp.
79-85
211
Moser, K., Muller, M. and Piller, F.T., (2006), Transforming mass customisation from a
marketing instrument to a sustainable business model at Adidas, International
Journal of Mass Customisation, Volume 1, Number 4, pp 463- 479
Mueller, M.J., Lott, D.J., Hastings, M.K., Commean, P.K., Smith, K.EPilgram, T.K.,
(2006), Efficacy and mechanism of orthotic devices to unload the metatarsal
heads in people with diabetes and a history of plantar ulcer. Physical Therapy
Volume 86, Number 6, pp 833-842.
Nicolopoulos C. S, J. Black, E. and G. Anderson (2000), Foot orthoses materials, The
Foot, Volume 10, Number 1, pp 1-3.
Ng P., P.S.V. Lee, J.C.H. Goh, (2002), "Prosthetic sockets fabrication using rapid
prototyping technology", Rapid Prototyping Journal, Volume. 8, Number 1,
pp.53-59
Nigg BM, Nurse MA, and Stefanyshyn DJ. (1999), Shoe inserts and orthotics for sport
and physical applications, Journal of Medicine and Science in Sports and
Exercise, Volume 21, Number 7, pp 421-8.
Nookabadi A. S. and John E. Middle, (1996), A Generic IDEF0 Model of Quality
Assurance information systems for the design to order manufacturing
environments, IEEE Transactions on Components, Packaging, and
Manufacturing Technology-part c, Volume. 19, Number. 2, pp 78-84.
Noorani, Rafiq (2006), Rapid prototyping Principles and Applications New Jersey: John
Wiley & sons, Inc.
Obrovac, Karlo; Udiljak, Toma; and Mihoci, Kristijan. (2005), CAD/ CAM in
Production of the Foot Orthoses Transactions of FAMENA, Volume 29, Number
1, pp 49-60.
OSullivan, (1991), Project management in manufacturing using IDEFO, International
Journal of Project Management, Volume 9, Number 3, pp 162-168.
Otto J. P.. (2008, Sep.), A Good CAD-CAM Education is Hard to Find [Online].
Gainesville, FL: The O&P Edge. Available: http://www.oandp.
com/articles/2008-09-13.asp.
Pallari J., (2008) “Mass customisation of foot orthoses for rheumatoid arthritis,” Ph.D.
Thesis, Dept. Mech. Eng., Univ. Leeds, Leeds, U.K.,
212
Pallari Jari H. P., Kenneth W. Dalgarno, and James Woodburn (2010) Mass
Customization of Foot Orthoses for Rheumatoid Arthritis Using Selective Laser
Sintering, IEEE Transactions on Biomedical Engineering, Volume 57, Number
7, pp 1750-56
Paton, J. (2007), The physical characteristics of materials used in the manufacture of
orthoses for patient with diabetes. Foot & Ankle International, 28 (10), 1057–
1063.
Payne CB. (2007), Cost benefit comparison of plaster casts and optical scans of the foot
for the manufacture of foot orthoses. Australian Journal of Podiatric Medicine,
Volume 41, Issue 2, pp 29-31.
Peltola Sanna M., Ferry P. W. Melchels, Dirk W. Grijpma Minna Kelloma Ki, (2008),
A Review of Rapid Prototyping Techniques for Tissue Engineering Purposes,
Annals of Medicine, Volume 40, Number 4, pp 268-280.
Pham D.T and R.S Gault (1998), A comparison of rapid prototyping technologies,
International Journal of Machine Tools and Manufacture Volume 38, Number
10-11, pp 1257-1287
Pham, D. T. and S. S. Dimov (2001), Rapid manufacturing : the technologies and
applications of rapid prototyping and rapid tooling. London, Berlin, Heidelberg,
Springer.
Pham, D. T. and S. S. Dimov (2003), Rapid prototyping and rapid tooling- the key
enablers for rapid manufacturing, Proceedings of the Institution of Mechanical
Engineers, Part C: Journal of Mechanical Engineering Science, Volume 217,
Number, 1 pp 1-23.
Phillip W. Balsmeier, Wendell J. Voisin (1997), Rapid prototyping: State-of-the-art
manufacturing, Industrial Management, Volume. 39, Number 1.
Phillips J W (1990), The Functional Foot Orthoses, New York: Chrchilhill Livingstone.
Piller FT and Stotko CM (2002), Mass customization: four approaches to deliver
customized products and services with mass production efficiency, in TS
Durrani, ed., Proceedings of the IEEE International Engineering Management
Conference (IEMC-2002). Cambridge University, UK, pp 773-778
213
Piller (2003), The customer as co-designer: how to master mass customization’s most
demanding challenge Mass Customization: Turning Customer Differences into
Business Advantages, IEE Seminar, pp 6/1-6/5
Piller FT, Moeslein K, Stotko CM (2004), Does mass customization pay? An economic
approach to evaluate customer integration, Production Planning and Control,
Volume 15, number 4, pp 435-444
Pine, B.J. Mass Customization: (1993), The New Frontier in Business Competition,
Harvard Business School Press, Boston, MA.
Pine J., (1993), Mass customizing products and services, Planning Review, Volume 21,
Number 4, pp 6-55.
Pine, B.J. II, Victor, B., Boyton, A.C., (1993), Making mass customization work.
Harvard Business Review 71, pp 108-119
Pine, B.J. II, Peppers, D., and Rogers, M., (1995), Do you want to keep your customers
forever? Harvard Business Review, 72, pp 103-114.
Pine J, and J. Gilmore, (1997), The four faces of mass customization, Harvard Business
Review, Volume 75, Number 1, pp 91-101.
Pollard Dennis, Shirley Chuo Fullerton and Lee Brian (2008), Strategies for Mass
Customization, Journal of Business and Economics Research, Volume 6,
Number 7, pp 77-84
Pratt, DJ (2000 a), A critical review of the literature on foot orthoses Journal of the
American Podiatric Medical Association, Volume 90, Number 7, pp. 339-341.
Pratt DJ (2000 b), Dynamic foot orthoses, Principles and applications, Journal of the
American Podiatric Medical Association, Volume 90, Number 1, pp 24-29.
Pratt D J, (1994), Some aspects of modern orthotics, Physiological Measurements,
Volume 15, Number 1, pp 1-27.
Pratt D J (1995), Functional foot orthoses, The Foot, Volume 5, pp 101-110
Qingbin Liu, Ming C. Leu, Stephen and M. Schmitt, (2006), Rapid prototyping in
dentistry: technology and application, International Journal of Advance
Manufacturing Technology, Volume 29, Number 3-4, pp 317-335.
214
Rajala Mikko and Tapani Savolainen (1996), A framework for customer oriented
business process modeling Computer oriented manufacturing systems, Volume
9, Number 3, pp 127-135
Redford JB, Basmajian JV, and Trautman P, “Orthotics (1995), clinical practice and
rehabilitation technology”, Churchill Livingstone, ISBN 0443089922.
Rogers Bill , Gordon W. Bosker, Richard H. Crawford, Mario c. Faustini Richard R.
Neptune, Gail Walden, and Andrew J. Gitter , (2007), Advanced trans-tibial
socket fabrication using selective laser sintering International Journal of
Prosthetics and Orthotics, Volume 3, Number 1, pp 88-100
Rome K: (1990), Behaviour of orthotic materials in chiropody. Journal of the American
Podiatric Medical Association Volume 80, Number 9, pp 471-478.
Rome, K., (1991), A study of the properties of materials used in podiatry. Journal of the
American Podiatric Medical Association, Volume 81, number 2, pp 73–83.
Ross A (1996), Selling Uniqueness, Manufacturing Engineering, Volume 75, Number 6,
pp 260-263
Ross, T.R. (1985), Applications and extensions of SADT, IEEE Computer, pp. 25-34
Rosochowski A, and Matuszak A, (2000), Rapid tooling: the state of the art, Journal of
Materials Processing Technology, Volume 106, Number 1, pp 191-198.
Ruffo M, C Tuck, and R Hague, (2006), Cost estimation for rapid manufacturing – laser
sintering production for low to medium volumes, Proc. IMechE, Volume. 220
Part B: Journal of Engineering Manufacture.
Saraswathy G., Gautham Gopalakrishna, B.N. Das, (2004) New material for recording
impression of foot for customized footwear applications, The Foot, Volume 14,
Number 4, pp 192-197
Saven Aguilar, R.S, (2004), Business process modeling: review and framework,
International Journal of Production Economics, Volume 90, Number, 2, pp 129-
149
Schwartz, R. (1991), Foot orthoses and materials. In M. Jahss (Ed.), Disorders of the
foot and ankle (pp. 2866-2878). Philadelphia: Saunders
Selldurai R S (2004), Mass customization in operations management: oxymoron or
reality? Omega, Volume 32, Number 4, pp 295-300.
215
Sewell, N. T., M. Felstead, M. R. Sloan and M. A. Jenkins, (2008), "A Study of the
Degradation of Duraform PA Due to Cyclic Processing," International
Conference on Advanced Research in Virtual and Rapid Prototyping, Leiria,
Portugal, pp. 299-304.
Silveira, Borenstien, and Fogliatto, (2001), Mass customization: Literature review and
research directions International Journal of Production Economics, Volume 72,
Number 1, pp 1-13.
Skipworth and A. Harrison, (2004), Implications of form postponement to
manufacturing a customised product, International Journal of Production
Research, Volume. 44, Number 8, pp1627-1652.
Slack, N., Chambers, S., Johnston, R. (2001), Operations Management, 3rd
edition,
Pearson Education Limited, U.K., ISBN 0273-64657-5.
Smith D and Burgess EM, (2001) “The use of CAD/CAM technology in prosthetics and
orthotics – Current clinical models and a view to the future”, Journal of
Rehabilitation Research and Development, Volume 38, Number 3, pp 327-334.
Spira J, (1993), Mass customization through training at Lutron Electronics, Strategy and
Leadership, Volume 21, Number 4, pp 23-24.
Squire, Brown, Readman and Bessant, (2006), The impact of Mass Customisation on
Manufacturing trade-offs, Production and Operations Management, Volume 15,
Number 1, pp 10-21.
Staats Timothy B and Kriechbaum Michael P, (1989), Computer Aided Design and
Computer Aided Manufacturing of Foot Orthosis. Journal of Prosthetic and
Orthotics, Volume 1, Number 3, pp 182-186.
Steven J. Levitz., and Ellen Sobel, (2002), Prescribing Foot Orthoses, Podiatry
Management, pp 103-116
Strub Joerg R, Rekow E. Dianne and Witkowski Siegbert, (2006), Computer-aided
design and fabrication of dental restorations: Current systems and future
possibilities, Journal of American Dental Association, Voulme 137, Number 9,
pp1289-1296
Tangen, S. (2003), “An overview of frequently used performance measures”, Work
Study, Volume 52, Number. 7, pp. 347-54.
216
Tangen Stefan (2004), Performance measurement: from philosophy to practice,
International Journal of Productivity and Performance Management, Volume 53,
Number. 8, pp. 726-737
Tay Francis E.H., M.A. Manna, L.X. Liu, (2002), "A CASD/CASM method for
prosthetic socket fabrication using the FDM technology", Rapid Prototyping
Journal, Volume. 8, Number: 4, pp.258-262.
Toffler, A. (1970), Future Shock, Random House, New York
Tognola G, Parazzini M, Svelto C, Ravazzani P and Grandori F, (2003), “Three-
dimensional laser scanning and reconstruction of ear canal impressions for
optimal design of hearing aid shells”, Proc. SPIE, Volume. 5009, pp 19-26.
Tseng Mitchell M. and Piller Frank T (2003), The Customer Centric Enterprises:
Advances in mass customization and personalization, Springer.
Tuck C.J., Hague R.J.M (2006), The pivotal role of rapid manufacturing in the
production of cost-effective customised products, International Journal of Mass
Customisation, Volume.1, Number. 2/3, pp 360-373.
Tuck C.J., Hague R.J.M., Ruffo, M. Ransley M. and Adams P., (2008), Rapid
manufacturing facilitated customisation, International Journal of Computer
Integrated Manufacturing, Volume 21, Number 3, pp 245 - 258
Tukuru Nagarjan, Shivalinge Gowda KP, Syed Mansoor Ahmed and S Badami, (2008),
Rapid Prototype Technique in Medical Field, Research Journal of Pharm. and
Tech. Volume 1, Number 4, pp 341-344.
Ulrich, K. and Tung, K., (1991), Fundamentals of product modularity, Proceedings of
ASME Winter Annual Meeting Symposium on Design and Manufacturing
Integration, Atlanta, USA,
Ulrich, K., (1995), The role of product architecture in the manufacturing firm, Journal of
Research Policy, Volume 24, pp 419-440.
Ulrich, K., Eppinger, S., 1995. Product Design and Development, McGraw-Hill, New
York, USA.
Vaupotic B., M. Brezocnik, J. Balic (2006), Use of PolyJet technology in manufacture
of new product. Journal of Achievements in Materials and Manufacturing
Engineering Volume 18, Number 1-2, pp 319-322.
217
Walter, M., Holmstrom, J., and Tuomi, H., (2002), Rapid manufacturing and its impact
on supply chain management, Proceedings of the Logistics Research Networks,
Annual conference, Dublin, Ireland.
Ward P T and Mellor S J, (1985), Structured development of Real-Time Systems,
Prentice-Hall Inc, USA.
Webb P A., (2000), A review of rapid prototyping (RP) techniques in the medical and
biomedical sector, Journal of Medical Engineering & Technology, Volume 24,
Number 4, pp 149-153.
Williams Bruce (2010), Key Insights on Digital Casting Techniques, Volume: 23,
Number 1, pp 11-15.
Winder and Bib (2005), Medical Rapid Prototyping Technologies: State of the Art and
Current Limitations for Application in Oral and Maxillofacial Surgery, Journal
of Oral and Maxillofacial Surgery Volume, 63, Number 7, pp 1006-1015
Woodburn J, Helliwell PS, and Barker S, (2002), “A randomized controlled trial of foot
orthoses in rheumatoid arthritis”, Journal of Rheumatology, Volume 29, Number
7, pp 1377-1383.
Wohlers Terry, (2006), Rapid Prototyping and Manufacturing: State of the Industry,
Annual worldwide progress report, Wohlers associates Inc, USA
Wohlers Terry, (2010), Additive Manufacturing: State of the Industry, Wohlers
associates Inc, USA.
Wong Hartanto and Daniel Eyers (2010), Enhancing Responsiveness for Mass
Customization Strategies through the Use of Rapid Manufacturing Technologies,
International Handbooks on Information Systems, Springer-Verlag Berlin
Heidelberg, pp 205-226.
Xiao Yan-ling Xu Fu-Yxi Hu Wen-bo, (2004), Business Process Reengineering Based
on IDEF Methods, Information Reuse and Integration, 2004. IRI 2004.
Proceedings of IEEE International Conference
8-10 Noveber 2004, pp 265-270.
Yan Xue and P Gu (1996), A review of rapid prototyping technologies and systems
Journal of Computer-Aided Design, Volume 28, Number 4, pp 307-318.
218
Yang, S., Leong, K. F., Du, Z. H., and Chua, C. K. (2002), Design of scaffolds for use in
tissue engineering. Part II: Tissue Engineering, Volume 8, Number 1, pp 1-11.
Yusuf KO and Smith NJ, (1996), Modeling business processes in steel fabrication,
International Journal of Project Management, Volume 14, Number 6, pp 367-
371.
Zhang Ren-qian, (2000), “Analysis of Business Cost in the BPR”, Industry Engineering,
China, Volume 3, Number.4, pp. 15-19.
Weblink resources
http://www.additive3d.com/sla_int.htm [accessed July, 2010]
http://www.additive3d.com/fdm_int.htm [accessed July, 2010]
http://www.additive3d.com/3dp_int.htm
http://www.additive3d.com/sls_int.htm
http://www.algeos.com/acatalog/Algeos_Online_Foot_Orthotics Insoles_28.html
http://www.alimed.com/Alimed/catalog/Orthopedics,249.htm
http://www.aligntech.com/Pages/Home.aspx
http://www.amfit.com/
http://www.dimensionprinting.com/
http://www.footdynamics.com/
http://www.footcraft.com.au/
http://www.hearing.siemens.com/en/03-home/index-en.jsp
http://www.insolepro.co.uk/
http://www.invisalign.com/Pages/default.aspx
http://www.klmlabs.com/
http://www.londonorthotics.co.uk/
http://www.precision3d.co.uk/index.htm
http://www.pedag.co.uk/index1.htm

219
http://www.phonak.com/uk/b2c/en/home.htmlw.objet.com/PRODUCTS/PolyJet_Techn
ology
http://www.shapeways.com/
http://www.saumadesign.net/P2Lshoe.htm
http://www.theorthoticgroup.com/
http://www.stssox.com/
http://www.printin3d.com/3d-printers/v-flash-personal-3d-printer
http://www.3dsystems.com/products/sla/iPro/index.asp
http://www.3dsystems.com/products/sls/index.asp
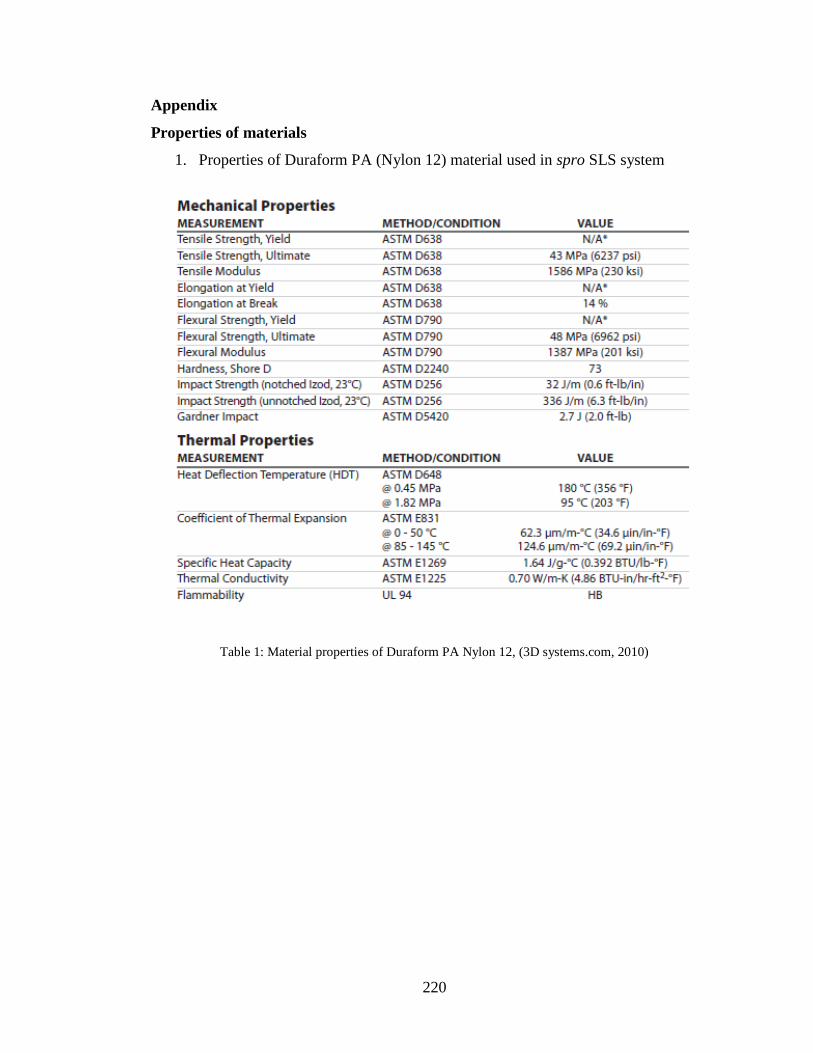
220
Appendix
Properties of materials
1. Properties of Duraform PA (Nylon 12) material used in spro SLS system
Table 1: Material properties of Duraform PA Nylon 12, (3D systems.com, 2010)
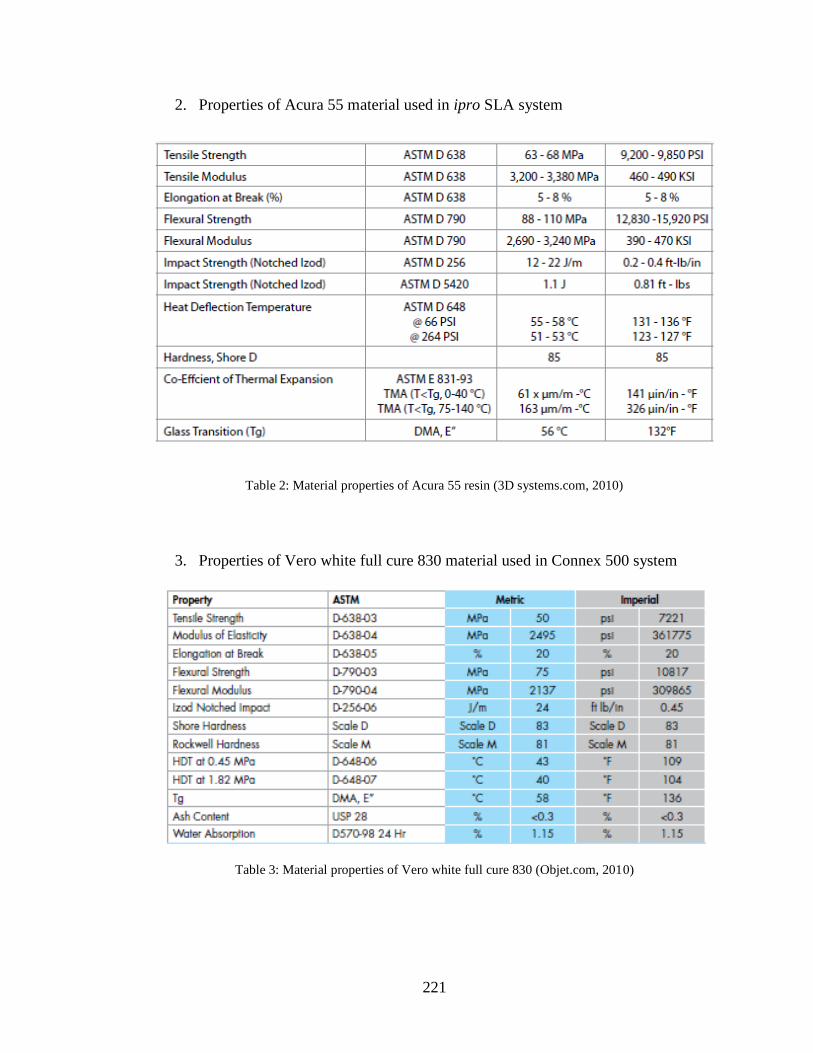
221
2. Properties of Acura 55 material used in ipro SLA system
Table 2: Material properties of Acura 55 resin (3D systems.com, 2010)
3. Properties of Vero white full cure 830 material used in Connex 500 system
Table 3: Material properties of Vero white full cure 830 (Objet.com, 2010)
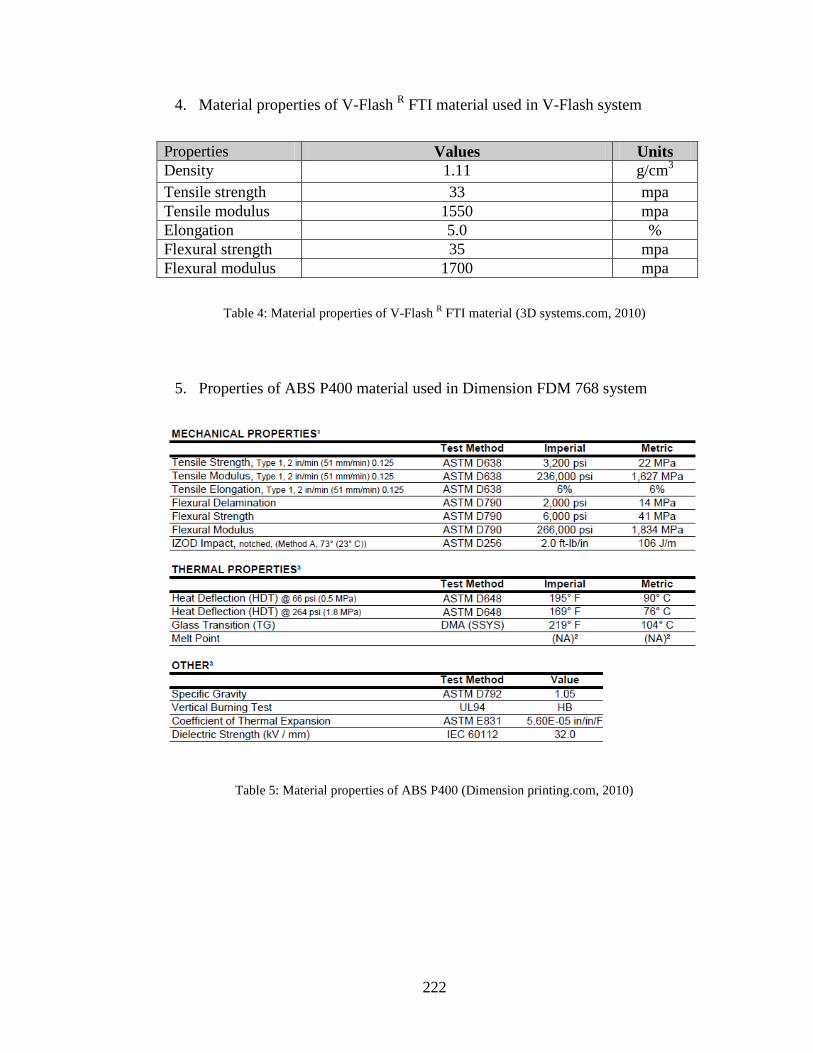
222
4. Material properties of V-Flash R FTI material used in V-Flash system
Properties Values Units
Density 1.11 g/cm3
Tensile strength 33 mpa
Tensile modulus 1550 mpa
Elongation 5.0 %
Flexural strength 35 mpa
Flexural modulus 1700 mpa
Table 4: Material properties of V-Flash R FTI material (3D systems.com, 2010)
5. Properties of ABS P400 material used in Dimension FDM 768 system
Table 5: Material properties of ABS P400 (Dimension printing.com, 2010)
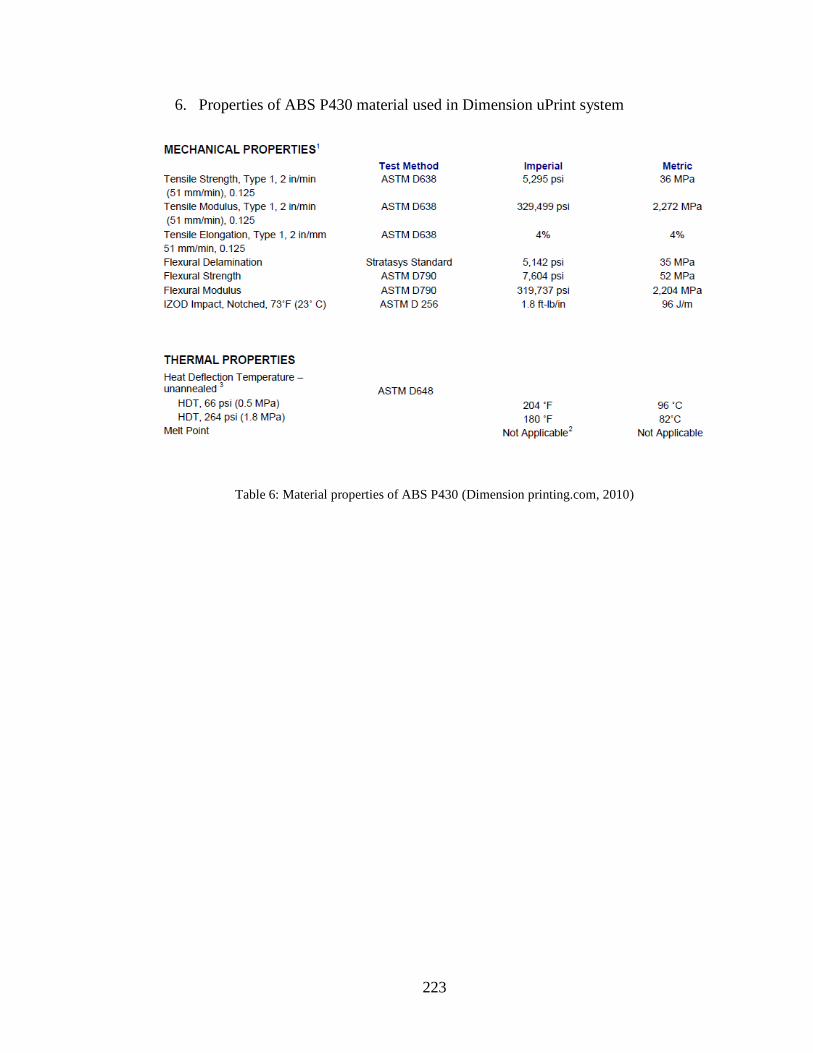
223
6. Properties of ABS P430 material used in Dimension uPrint system
Table 6: Material properties of ABS P430 (Dimension printing.com, 2010)
224
Papers presented in international conferences.
1. J.M. Saleh and K. W. Dalgarno (2009), “Cost and benefit analysis of fused
deposition modelling (FDM) technique and selective laser sintering (SLS) for
fabrication of customised foot orthoses,” in Proc. 4th Int. Conf. Adv. Res.
Virtual Rapid Manuf., Innovative Dev. Des. Manuf., Leiria, Portugal, Oct. 6–10,
2009, pp. 187–192, ISBN 978-0-415-87307-9.
2. J.M. Saleh and K. W. Dalgarno (2009), Fused deposition modelling
technique in foot orthoses fabrication: A cost benefit analysis, 33 Japan Rapid
Prototyping symposium, Tokyo Japan, June (2009).
3. Jari Pallari, Muhammad Jumani, Kenny Dalgarno and Jim Woodburn (2009)
Rapid manufacturing of orthotics and prosthetics – is it a good idea? The 5th
International Conference on Mass Customization and Personalization - Match
Making, Helsinki, Finland, October, (2009).
4. J.M. Saleh and K. W. Dalgarno (2008), Development of Rapid
Manufacturing Based Mass Customisation System for Foot Orthoses, 32nd Japan
Rapid Prototyping Symposium, Tokyo, Japan, June (2008).
5. J.M Saleh and K W Dalgarno (2008), Process modelling of rapid
manufacturing based mass customisation system for foot orthoses, 9th National
Conference on Rapid Design, Prototyping, and Manufacturing (RDPM),
Lancaster Product Development Unit, Lancaster University, UK, June (2008).