Numerical Simulation of Laser Rapid Manufacturing of Multi-Layer Thin Wall Using Improved Mass...
26
NUMERICAL SIMULATION OF LASER RAPID MANUFACTURING OF MULTI-LAYER THIN WALL USING AN IMPROVED MASS ADDITION APPROACH Atul Kumar 1 , C. P. Paul 1 , A. S. Padiyar 2 , P. Bhargava 1 , G. Mundra 2 , and L. M. Kukreja 1 1 Laser Material Processing Division, Raja Ramanna Centre for Advanced Technology, Indore, India 2 Accelerator Component Design and Fabrication Section, Raja Ramanna Centre for Advanced Technology, Indore, India An improved mass addition approach based on enthalpy balance is used for the numerical simulation of the temperature distributions and geometries during laser rapid manufacturing (LRM) of a multi-layered thin-wall. The approach involves the estimation of the local track height at every node along the track width on the substrate/ previously deposited layer by simultaneous balancing of the excessive enthalpies above solidus temperature about the laser axis and the material interface at the substrate/ previously deposited layer for material addition during the laser rapid manufacturing of a multi-layer thin wall. It takes laser power, laser beam size, scan-speed, powder feed rate, powder stream diameter, and time-delay between the deposition of two subsequent tracks as user-defined input, and com- putes the temperature distributions and the geometries of the deposited layers across the process domain in a dynamic fashion. In the present study, the laser rapid manufacturing of five layered thin walls of SS 304L on a work piece of the same material was simulated for various combinations of processing parameters and compared with experimental results. The percentage errors in simulated and corresponding experimental cumulative track heights along with track width were calculated and compared with those of other existing models and the results of present approach were found to be the least. The result indicates that the height and width of the layer under deposition depends on the geometry and tem- perature distribution of previously deposited layer and, consequently, governed the final geometry of thin wall. 1. INTRODUCTION Laser rapid manufacturing (LRM) is one of the advanced additive manufacturing processes that enable the fabrication of custom objects with novel properties directly from computer data [1]. The basic operation of the LRM system Received 12 August 2013; accepted 13 September 2013. The authors wish to acknowledge the skillful technical support extended by Mr. S. K. Mishra and Mr. C. H. Prem Singh for experimental verification of the modeling results. Address correspondence to C. P. Paul, Laser Material Processing Division Raja Ramanna Centre for Advanced Technology, Indore 452 013, India. E-mail: [email protected] Color versions of one or more of the figures in the article can be found online at www.tandfonline.com/unht. Numerical Heat Transfer, Part A, 65: 885–910, 2014 Copyright # Taylor & Francis Group, LLC ISSN: 1040-7782 print=1521-0634 online DOI: 10.1080/10407782.2013.850968 885 Downloaded by [Raja Ramanna Ctr Advanced Technology], [C. P. Paul] at 19:12 04 March 2014
-
Upload
independent -
Category
Documents
-
view
3 -
download
0
Transcript of Numerical Simulation of Laser Rapid Manufacturing of Multi-Layer Thin Wall Using Improved Mass...
NUMERICAL SIMULATION OF LASER RAPIDMANUFACTURING OF MULTI-LAYER THIN WALLUSING AN IMPROVED MASS ADDITION APPROACH
Atul Kumar1, C. P. Paul1, A. S. Padiyar2, P. Bhargava1,G. Mundra2, and L. M. Kukreja11Laser Material Processing Division, Raja Ramanna Centre for AdvancedTechnology, Indore, India2Accelerator Component Design and Fabrication Section, Raja RamannaCentre for Advanced Technology, Indore, India
An improved mass addition approach based on enthalpy balance is used for the numerical
simulation of the temperature distributions and geometries during laser rapid manufacturing
(LRM) of a multi-layered thin-wall. The approach involves the estimation of the local
track height at every node along the track width on the substrate/previously deposited layer
by simultaneous balancing of the excessive enthalpies above solidus temperature about the
laser axis and the material interface at the substrate/previously deposited layer for material
addition during the laser rapid manufacturing of a multi-layer thin wall. It takes laser
power, laser beam size, scan-speed, powder feed rate, powder stream diameter, and
time-delay between the deposition of two subsequent tracks as user-defined input, and com-
putes the temperature distributions and the geometries of the deposited layers across the
process domain in a dynamic fashion. In the present study, the laser rapid manufacturing
of five layered thin walls of SS 304L on a work piece of the same material was simulated
for various combinations of processing parameters and compared with experimental results.
The percentage errors in simulated and corresponding experimental cumulative track
heights along with track width were calculated and compared with those of other existing
models and the results of present approach were found to be the least. The result indicates
that the height and width of the layer under deposition depends on the geometry and tem-
perature distribution of previously deposited layer and, consequently, governed the final
geometry of thin wall.
1. INTRODUCTION
Laser rapid manufacturing (LRM) is one of the advanced additivemanufacturing processes that enable the fabrication of custom objects with novelproperties directly from computer data [1]. The basic operation of the LRM system
Received 12 August 2013; accepted 13 September 2013.
The authors wish to acknowledge the skillful technical support extended by Mr. S. K. Mishra and
Mr. C. H. Prem Singh for experimental verification of the modeling results.
Address correspondence to C. P. Paul, Laser Material Processing Division Raja Ramanna Centre
for Advanced Technology, Indore 452 013, India. E-mail: [email protected]
Color versions of one or more of the figures in the article can be found online at
www.tandfonline.com/unht.
Numerical Heat Transfer, Part A, 65: 885–910, 2014
Copyright # Taylor & Francis Group, LLC
ISSN: 1040-7782 print=1521-0634 online
DOI: 10.1080/10407782.2013.850968
885
Dow
nloa
ded
by [
Raj
a R
aman
na C
tr A
dvan
ced
Tec
hnol
ogy]
, [C
. P. P
aul]
at 1
9:12
04
Mar
ch 2
014
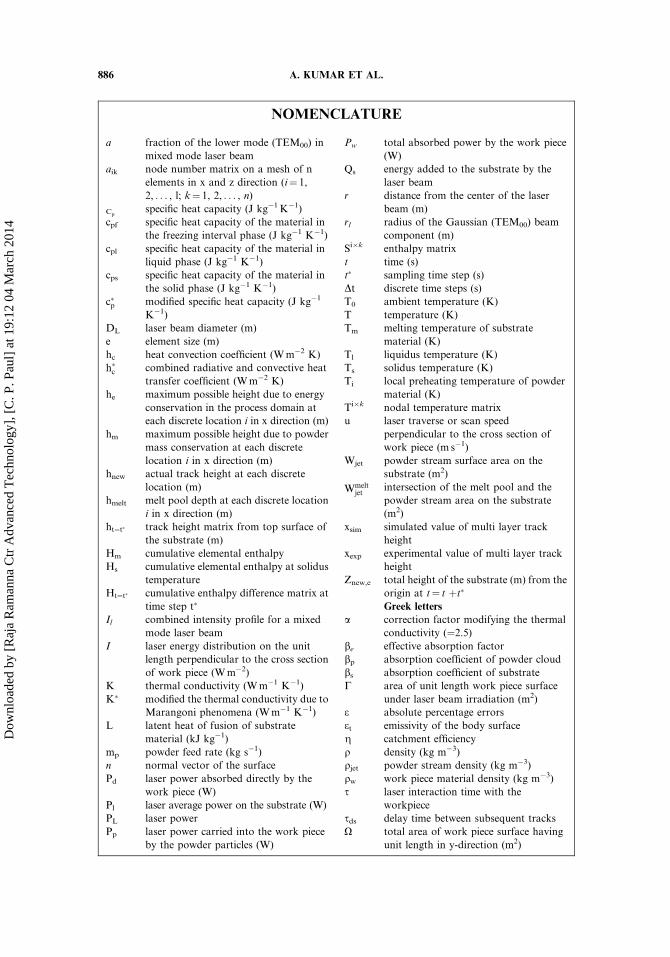
NOMENCLATURE
a fraction of the lower mode (TEM00) in
mixed mode laser beam
aik node number matrix on a mesh of n
elements in x and z direction (i¼ 1,
2, . . . , l; k¼ 1, 2, . . . , n)
Cpspecific heat capacity (J kg�1K�1)
cpf specific heat capacity of the material in
the freezing interval phase (J kg�1 K�1)
cpl specific heat capacity of the material in
liquid phase (J kg�1 K�1)
cps specific heat capacity of the material in
the solid phase (J kg�1 K�1)
c�p modified specific heat capacity (J kg�1
K�1)
DL laser beam diameter (m)
e element size (m)
hc heat convection coefficient (Wm�2 K)
h�c combined radiative and convective heat
transfer coefficient (Wm�2 K)
he maximum possible height due to energy
conservation in the process domain at
each discrete location i in x direction (m)
hm maximum possible height due to powder
mass conservation at each discrete
location i in x direction (m)
hnew actual track height at each discrete
location (m)
hmelt melt pool depth at each discrete location
i in x direction (m)
ht¼t� track height matrix from top surface of
the substrate (m)
Hm cumulative elemental enthalpy
Hs cumulative elemental enthalpy at solidus
temperature
Ht¼t� cumulative enthalpy difference matrix at
time step t�
Il combined intensity profile for a mixed
mode laser beam
I laser energy distribution on the unit
length perpendicular to the cross section
of work piece (Wm�2)
K thermal conductivity (Wm�1 K�1)
K� modified the thermal conductivity due to
Marangoni phenomena (Wm�1 K�1)
L latent heat of fusion of substrate
material (kJ kg�1)
mp powder feed rate (kg s�1)
n normal vector of the surface
Pd laser power absorbed directly by the
work piece (W)
Pl laser average power on the substrate (W)
PL laser power
Pp laser power carried into the work piece
by the powder particles (W)
Pw total absorbed power by the work piece
(W)
Qs energy added to the substrate by the
laser beam
r distance from the center of the laser
beam (m)
rl radius of the Gaussian (TEM00) beam
component (m)
Si�k enthalpy matrix
t time (s)
t� sampling time step (s)
Dt discrete time steps (s)
T0 ambient temperature (K)
T temperature (K)
Tm melting temperature of substrate
material (K)
Tl liquidus temperature (K)
Ts solidus temperature (K)
Ti local preheating temperature of powder
material (K)
Ti�k nodal temperature matrix
u laser traverse or scan speed
perpendicular to the cross section of
work piece (m s�1)
Wjet powder stream surface area on the
substrate (m2)
Wmeltjet
intersection of the melt pool and the
powder stream area on the substrate
(m2)
xsim simulated value of multi layer track
height
xexp experimental value of multi layer track
height
Znew,e total height of the substrate (m) from the
origin at t¼ t þt�
Greek letters
a correction factor modifying the thermal
conductivity (¼2.5)
be effective absorption factor
bp absorption coefficient of powder cloud
bs absorption coefficient of substrate
C area of unit length work piece surface
under laser beam irradiation (m2)
e absolute percentage errors
et emissivity of the body surface
g catchment efficiency
q density (kg m�3)
qjet powder stream density (kg m�3)
qw work piece material density (kg m�3)
s laser interaction time with the
workpiece
sds delay time between subsequent tracks
X total area of work piece surface having
unit length in y-direction (m2)
886 A. KUMAR ET AL.
Dow
nloa
ded
by [
Raj
a R
aman
na C
tr A
dvan
ced
Tec
hnol
ogy]
, [C
. P. P
aul]
at 1
9:12
04
Mar
ch 2
014
consists of slicing a 3-D computer model into thin cross sections, translating theresult into 2-D position information, and using this data for the deposition ofmaterial to shape a new layer fed material by melting a thin layer on the surfaceof the substrate=deposited material. The fed material may be in the form of wireor powder. This process is repeated for each cross section and the object is builtup one layer at a time [2]. LRM eliminates many manufacturing steps such as mate-rials-machine planning, man-machine interaction, intermittent quality checks,assembly and related human errors etc. Therefore, LRM offers many advantagesover conventional subtractive techniques, such as reduced production time, betterprocess control and capability to form functionally graded parts. It is also an attract-ive candidate for refurbishing applications because of low heat input, limited dilutionwith minimal distortion, and capability to fabricate near-net shape components. It isemployed for component repairing and reconditioning [3] and rapid prototyping.Recently, the application is extended to the production of functionally gradedmaterials [4, 5] and porous materials [6, 7].
Various experimental works are going on to improve its technology and com-mercial viability [8–11]. One of the proven methods of augmenting the technology isthe process modelling using various analytical and numerical tools. The knowledgeobtained from such derived models reduces the time and complexity involved inexperimental routines. Various modeling approaches with newer or alternative stra-tegies are being investigated for better process insight and superior understanding ofLRM process [12–35]. Wang et al. developed a two-dimensional thermal model topredict the temperature distribution in the deposited metal for SS316 during theLRM process as a function of time and process parameters [12]. Vasinonta et al. pre-sented process maps to identify a manufacturing strategy for obtaining a consistentmelt pool size while limiting residual stress in thin-walled parts [13]. Peyreet al. useda three-step analytical and numerical approach with a finite element calculation topredict the shapes of manufactured structures and thermal loadings [14]. Laser-induced modification processes of ceramic substrates were numerically analyzed byRohdeet al. [15]. Laser heating of steel and formation of melt pool were numericallyexamined by Shuja and Yilbas [16]. The effect of process parameters on molten pooltransport were numerically analysed by Skouras et al. in Cu-Ni dissimilar laser weldpool [17]. Recently, Ahmed et al. used an analytical model to predict the effect ofbeam shape on melt pool shape and optimized the overlap required for laser surfaceprocessing applications [18]. Toyserkaniet al. studied in their numerical model forpulsed laser cladding, and established the correlation between the track geometryand laser pulse shaping parameters (laser pulse frequency and energy) when the otherprocess parameters were constant [19]. A theoretical model supported by experimentis investigated by Liu et al. of the optimization of process parameters for the fabri-cation of less than 1mm thin wall [20]. A self-consistent three-dimensional modelwas developed by Qi et al. for a coaxial laser powder cladding process, which simu-lates heat transfer, phase changes, and fluid flow in the molten pool [21]. A math-ematical 3-D model was developed by Heet al. to simulate the temperature andcomposition distribution during the laser cladding process of H13 tool steel for laserbeam of TEM00 [22]. The model assumed that the temperature-independent thermo-physical properties and the absorption coefficient of a laser were the same for sub-strate and powder. Yin et al. [23] studied the thermal behavior during LENS
LASER RAPID MANUFACTURING USING MASS ADDITION APPROACH 887
Dow
nloa
ded
by [
Raj
a R
aman
na C
tr A
dvan
ced
Tec
hnol
ogy]
, [C
. P. P
aul]
at 1
9:12
04
Mar
ch 2
014
deposition of 10 layers SS410 using a 2-D transient finite element model. They eval-uated the 2-D model by comparing the results obtained from the 2-D model and apreviously developed 3-D model [24]. Both Yin et al. [23] and Wang et al. [24]validated their models with the experimental data for SS316. Zhang et al. developeda 3-D finite element model to simulate the temperature evolution during the processand studied the influence of thermal history on the final microstructure and micro-hardness distribution of the SS410 thin wall [25]. Paul et al. studied the gravity effecton deposits’ geometries during laser rapid manufacturing on vertical surfaces [26].Alimardaniet al. developed a comprehensive modelto a 3-D dynamic numericalapproach for temperature and thermal stress distributions in multilayer LRM[27–29]. This model is based on conservation of mass within the process domain formaterial addition. It predicts local track height by incorporating catchment efficiency intopowder feed on the molten substrate surface for each time interval. Hofman et al.developed a FEM based model for the determination of the track geometry and dilutionin laser cladding [30]. An analytical approach for estimating the track characteristics (trackheight and width) was presented byWang et al. based on the mass conservation of powderfeeding stream [31]. The simulation was capable of predicting the track width and heightwith reasonable accuracy at medium powder feed rate. Pinkerton [32] presented math-ematical analysis of the melt pool and establishes mass and energy balances based onone-dimensional heat conduction to the substrate. Hao and Sun [33] presented, a FEMmodel for simulating temperature field in coaxial laser cladding of TI6AL4V alloy usingan inverse modelling approach. The relationships between process parameters and thegeometries of cladding layer, as well as the radius of spherical heat source, were alsoderived. A theoretical process map for laser cladding using three dimensional conductionheat transfer model was studied by Kumar and Roy [36]. Among these studies, only a fewhave reported on 2-D and 3-D modeling of the multilayer deposition process [19, 27–33].Moreover, in these reported modelling approaches, the geometry of the deposited materi-als are defined in advance (i.e., a thin wall with a rectangular cross section), or in adynamic fashion, a new group of elements at each time step is activated to build up a thinwall with a rectangular cross section. Recently, Kumar et al. developed a finer approachfor estimating the temperature distribution and prediction of the single track geometryduring LRM [37]. This approach involved the calculation of excessive enthalpies abovemelting point for all nodal points in the process domain, and using those for the compu-tation of local track height at every node along the track width on the substrate.
In this article, an improved mass addition approach based on enthalpy balanceis used under Eulerian method of description for the numerical simulation of thetemperature distributions and geometries during laser rapid manufacturing (LRM)of multi layered thin-wall. This approach uses the user-defined input parameters withappropriate initial and boundary conditions as input and solved the heat conductionand constitutive equations throughout the process domain using a FE method forobtaining the temperature distribution at the substrate=previously deposited layer.The temperature values are used for the estimation of the local track height at everynode along the track width on the substrate=previously deposited layer by simul-taneous balancing of the excessive enthalpies above melting point about the laseraxis and the material interface at the substrate=previously deposited layer formaterial addition during the laser rapid manufacturing of multi-layer thin wall. Vari-ous combinations of processing parameters are used for simulation of temperature
888 A. KUMAR ET AL.
Dow
nloa
ded
by [
Raj
a R
aman
na C
tr A
dvan
ced
Tec
hnol
ogy]
, [C
. P. P
aul]
at 1
9:12
04
Mar
ch 2
014
distribution and deposited geometry during LRM of a five layered thin wall of SS304L on a work piece. The simulation results are verified experimentally andcompared with that of other existing models.
2. MATHEMATICAL MODELING
This section describes the mathematical modeling approach that was usedto simulate the transient temperature field and subsequent geometries of depositsduring laser rapid manufacturing of multilayer SS304L thin wall.
2.1. Assumptions
To simplify the calculations, the following assumptions are made for themodel.
To consider the effect of laser-material interaction into the modeling, a methoddeveloped by Picasso et al. [38] is followed. Based on this method, the total absorbedpower by the work piece Pw (W) can be defined as follows
Pw ¼ Pd þ Pp ¼ be Pl ð1Þ
Where Pd(W) is the laser power absorbed directly by the work piece, Pp(W) is thelaser power carried into the work piece by the powder particles, Pl(W) is the totalpower of the laser, and be is the effective absorption factor.
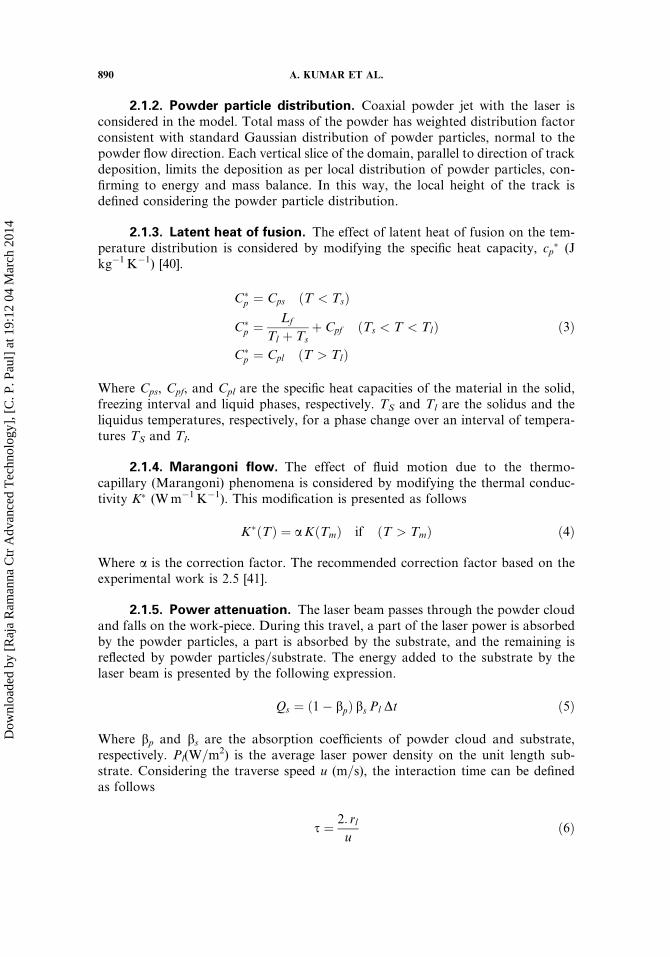
2.1.1. Laser energy distribution. The laser beam is assumed to be a mixtureof the first two fundamental modes, 40% of TEM00 and 60% of TEM01, which givesa near flat top beam profile (refer to Figure 1). The combined intensity profile for amixed mode laser beam is given by Kumar et al.[39], as follows.
IlðrÞ ¼2Pl
p r2laþ ð1� aÞ 2 r
2
r2l
� �� �exp � 2 r2
r2l
� �; ð2Þ
Where rl(m) is the radius of the Gaussian (TEM00) beam component, r (m) is thedistance from the centre of the laser beam, and Pl is the laser average power, anda is the fraction of the lower mode.
Figure 1. Laser beam intensity profile.
LASER RAPID MANUFACTURING USING MASS ADDITION APPROACH 889
Dow
nloa
ded
by [
Raj
a R
aman
na C
tr A
dvan
ced
Tec
hnol
ogy]
, [C
. P. P
aul]
at 1
9:12
04
Mar
ch 2
014
2.1.2. Powder particle distribution. Coaxial powder jet with the laser isconsidered in the model. Total mass of the powder has weighted distribution factorconsistent with standard Gaussian distribution of powder particles, normal to thepowder flow direction. Each vertical slice of the domain, parallel to direction of trackdeposition, limits the deposition as per local distribution of powder particles, con-firming to energy and mass balance. In this way, the local height of the track isdefined considering the powder particle distribution.
2.1.3. Latent heat of fusion. The effect of latent heat of fusion on the tem-perature distribution is considered by modifying the specific heat capacity, cp
� (Jkg�1K�1) [40].
C�p ¼ Cps ðT < TsÞ
C�p ¼ Lf
Tl þ Tsþ Cpf ðTs < T < TlÞ
C�p ¼ Cpl ðT > TlÞ
ð3Þ
Where Cps, Cpf, and Cpl are the specific heat capacities of the material in the solid,freezing interval and liquid phases, respectively. TS and Tl are the solidus and theliquidus temperatures, respectively, for a phase change over an interval of tempera-tures TS and Tl.
2.1.4. Marangoni flow. The effect of fluid motion due to the thermo-capillary (Marangoni) phenomena is considered by modifying the thermal conduc-tivity K� (Wm�1K�1). This modification is presented as follows
K�ðTÞ ¼ aKðTmÞ if ðT > TmÞ ð4Þ
Where a is the correction factor. The recommended correction factor based on theexperimental work is 2.5 [41].
2.1.5. Power attenuation. The laser beam passes through the powder cloudand falls on the work-piece. During this travel, a part of the laser power is absorbedby the powder particles, a part is absorbed by the substrate, and the remaining isreflected by powder particles=substrate. The energy added to the substrate by thelaser beam is presented by the following expression.
Qs ¼ ð1� bpÞ bs Pl Dt ð5Þ
Where bp and bs are the absorption coefficients of powder cloud and substrate,respectively. Pl(W=m2) is the average laser power density on the unit length sub-strate. Considering the traverse speed u (m=s), the interaction time can be definedas follows
s ¼ 2: rlu
ð6Þ
890 A. KUMAR ET AL.
Dow
nloa
ded
by [
Raj
a R
aman
na C
tr A
dvan
ced
Tec
hnol
ogy]
, [C
. P. P
aul]
at 1
9:12
04
Mar
ch 2
014
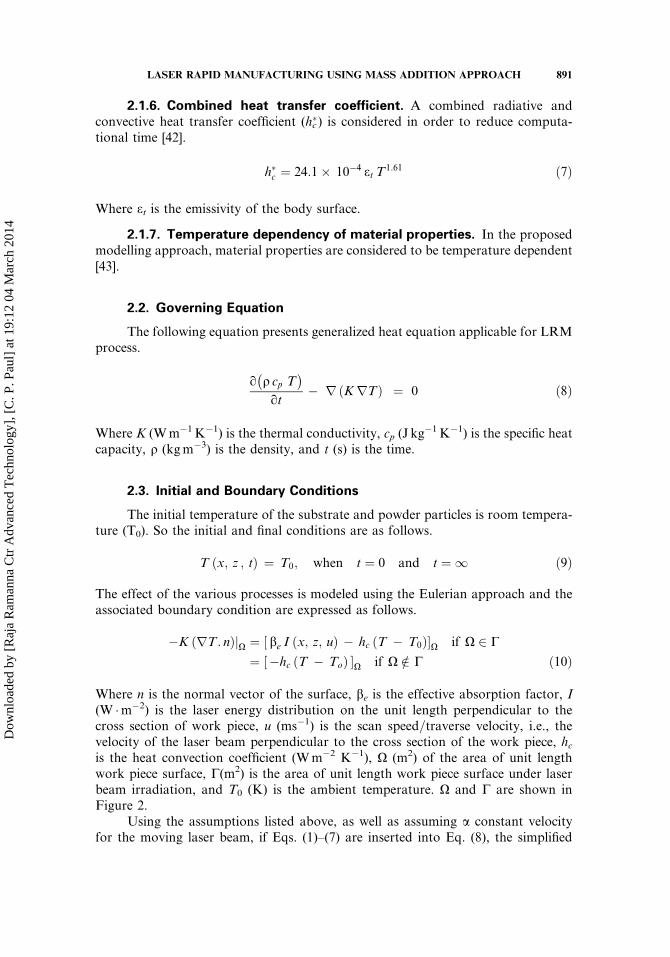
2.1.6. Combined heat transfer coefficient. A combined radiative andconvective heat transfer coefficient (hc
�) is considered in order to reduce computa-tional time [42].
h�c ¼ 24:1� 10�4 et T1:61 ð7Þ
Where et is the emissivity of the body surface.
2.1.7. Temperature dependency of material properties. In the proposedmodelling approach, material properties are considered to be temperature dependent[43].
2.2. Governing Equation
The following equation presents generalized heat equation applicable for LRMprocess.
q q cp T� �
qt� r K rTð Þ ¼ 0 ð8Þ
Where K (Wm�1K�1) is the thermal conductivity, cp (J kg�1K�1) is the specific heat
capacity, q (kgm�3) is the density, and t (s) is the time.
2.3. Initial and Boundary Conditions
The initial temperature of the substrate and powder particles is room tempera-ture (T0). So the initial and final conditions are as follows.
T ðx; z ; tÞ ¼ T0; when t ¼ 0 and t ¼ 1 ð9Þ
The effect of the various processes is modeled using the Eulerian approach and theassociated boundary condition are expressed as follows.
�K rT : nð ÞjX ¼ ½ be I ðx; z; uÞ � hc ðT � T0Þ�X if X 2 C
¼ ½�hc ðT � ToÞ �X if X =2 C ð10Þ
Where n is the normal vector of the surface, be is the effective absorption factor, I(W �m�2) is the laser energy distribution on the unit length perpendicular to thecross section of work piece, u (ms�1) is the scan speed=traverse velocity, i.e., thevelocity of the laser beam perpendicular to the cross section of the work piece, hcis the heat convection coefficient (Wm�2 K�1), X (m2) of the area of unit lengthwork piece surface, C(m2) is the area of unit length work piece surface under laserbeam irradiation, and T0 (K) is the ambient temperature. X and C are shown inFigure 2.
Using the assumptions listed above, as well as assuming a constant velocityfor the moving laser beam, if Eqs. (1)–(7) are inserted into Eq. (8), the simplified
LASER RAPID MANUFACTURING USING MASS ADDITION APPROACH 891
Dow
nloa
ded
by [
Raj
a R
aman
na C
tr A
dvan
ced
Tec
hnol
ogy]
, [C
. P. P
aul]
at 1
9:12
04
Mar
ch 2
014
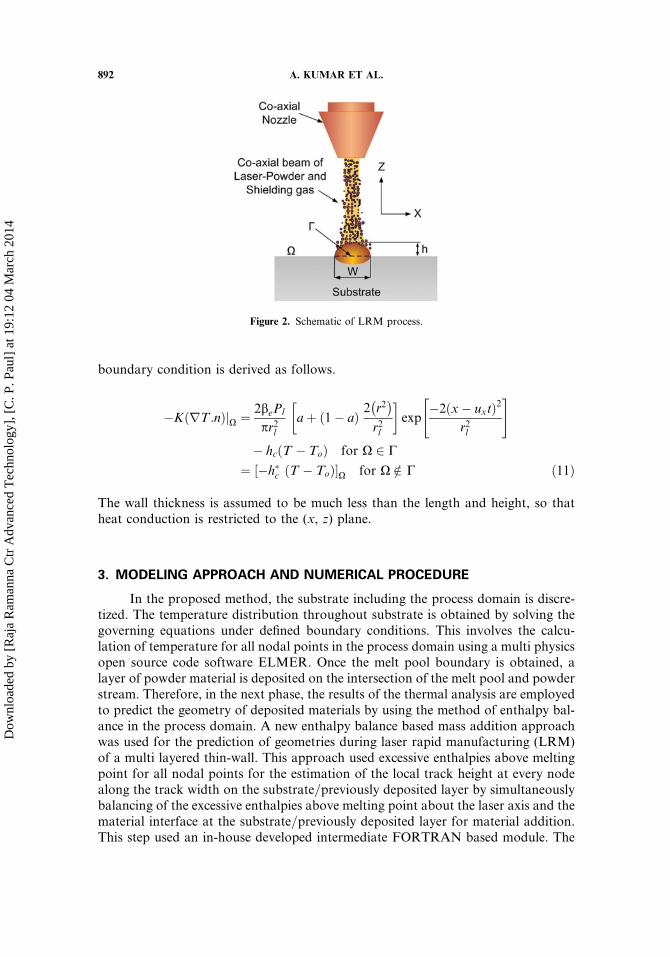
boundary condition is derived as follows.
�K rT :nð ÞjX ¼ 2bePl
pr2laþ ð1� aÞ
2 r2� �r2l
� �exp
�2ðx� uxtÞ2
r2l
" #
� hcðT � ToÞ for X 2 C
¼ ½�h�c ðT � ToÞ�X for X =2 C ð11Þ
The wall thickness is assumed to be much less than the length and height, so thatheat conduction is restricted to the (x, z) plane.
3. MODELING APPROACH AND NUMERICAL PROCEDURE
In the proposed method, the substrate including the process domain is discre-tized. The temperature distribution throughout substrate is obtained by solving thegoverning equations under defined boundary conditions. This involves the calcu-lation of temperature for all nodal points in the process domain using a multi physicsopen source code software ELMER. Once the melt pool boundary is obtained, alayer of powder material is deposited on the intersection of the melt pool and powderstream. Therefore, in the next phase, the results of the thermal analysis are employedto predict the geometry of deposited materials by using the method of enthalpy bal-ance in the process domain. A new enthalpy balance based mass addition approachwas used for the prediction of geometries during laser rapid manufacturing (LRM)of a multi layered thin-wall. This approach used excessive enthalpies above meltingpoint for all nodal points for the estimation of the local track height at every nodealong the track width on the substrate=previously deposited layer by simultaneouslybalancing of the excessive enthalpies above melting point about the laser axis and thematerial interface at the substrate=previously deposited layer for material addition.This step used an in-house developed intermediate FORTRAN based module. The
Figure 2. Schematic of LRM process.
892 A. KUMAR ET AL.
Dow
nloa
ded
by [
Raj
a R
aman
na C
tr A
dvan
ced
Tec
hnol
ogy]
, [C
. P. P
aul]
at 1
9:12
04
Mar
ch 2
014
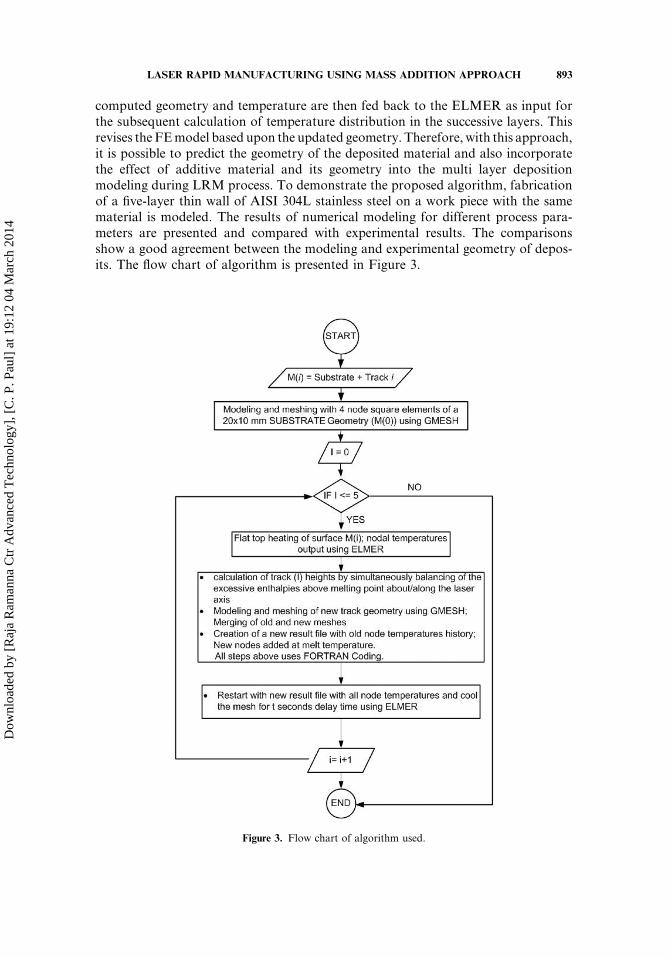
computed geometry and temperature are then fed back to the ELMER as input forthe subsequent calculation of temperature distribution in the successive layers. Thisrevises the FEmodel based upon the updated geometry. Therefore, with this approach,it is possible to predict the geometry of the deposited material and also incorporatethe effect of additive material and its geometry into the multi layer depositionmodeling during LRM process. To demonstrate the proposed algorithm, fabricationof a five-layer thin wall of AISI 304L stainless steel on a work piece with the samematerial is modeled. The results of numerical modeling for different process para-meters are presented and compared with experimental results. The comparisonsshow a good agreement between the modeling and experimental geometry of depos-its. The flow chart of algorithm is presented in Figure 3.
Figure 3. Flow chart of algorithm used.
LASER RAPID MANUFACTURING USING MASS ADDITION APPROACH 893
Dow
nloa
ded
by [
Raj
a R
aman
na C
tr A
dvan
ced
Tec
hnol
ogy]
, [C
. P. P
aul]
at 1
9:12
04
Mar
ch 2
014
3.1. Computation Steps and Procedure
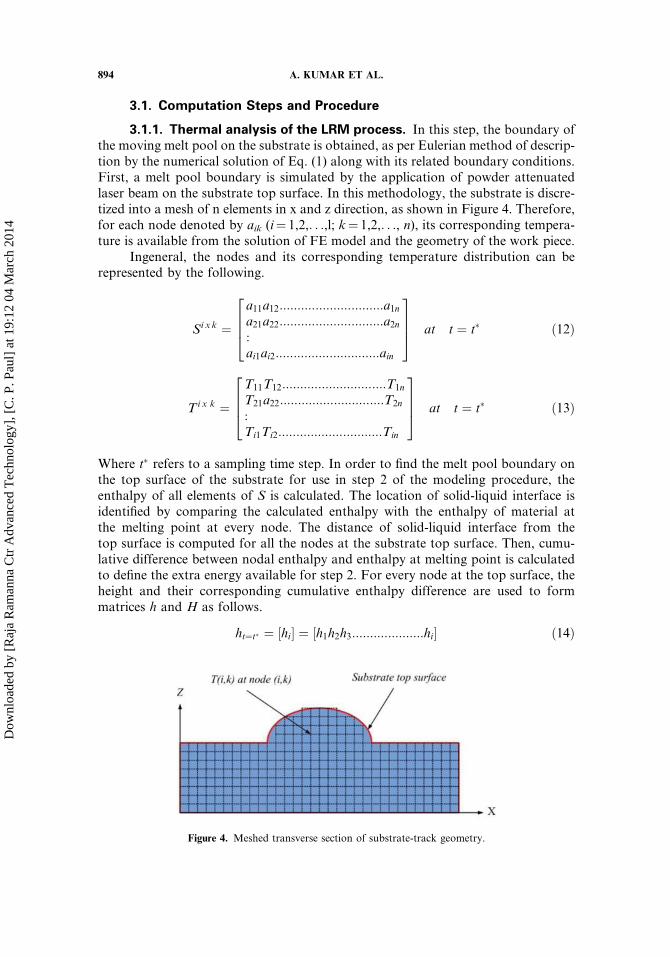
3.1.1. Thermal analysis of the LRM process. In this step, the boundary ofthe moving melt pool on the substrate is obtained, as per Eulerian method of descrip-tion by the numerical solution of Eq. (1) along with its related boundary conditions.First, a melt pool boundary is simulated by the application of powder attenuatedlaser beam on the substrate top surface. In this methodology, the substrate is discre-tized into a mesh of n elements in x and z direction, as shown in Figure 4. Therefore,for each node denoted by aik (i¼ 1,2,. . .,l; k¼ 1,2,. . ., n), its corresponding tempera-ture is available from the solution of FE model and the geometry of the work piece.
Ingeneral, the nodes and its corresponding temperature distribution can berepresented by the following.
Si x k ¼
a11a12:::::::::::::::::::::::::::::a1na21a22:::::::::::::::::::::::::::::a2n:ai1ai2:::::::::::::::::::::::::::::ain
2664
3775 at t ¼ t� ð12Þ
Ti x k ¼
T11T12:::::::::::::::::::::::::::::T1n
T21a22:::::::::::::::::::::::::::::T2n
:Ti1Ti2:::::::::::::::::::::::::::::Tin
2664
3775 at t ¼ t� ð13Þ
Where t� refers to a sampling time step. In order to find the melt pool boundary onthe top surface of the substrate for use in step 2 of the modeling procedure, theenthalpy of all elements of S is calculated. The location of solid-liquid interface isidentified by comparing the calculated enthalpy with the enthalpy of material atthe melting point at every node. The distance of solid-liquid interface from thetop surface is computed for all the nodes at the substrate top surface. Then, cumu-lative difference between nodal enthalpy and enthalpy at melting point is calculatedto define the extra energy available for step 2. For every node at the top surface, theheight and their corresponding cumulative enthalpy difference are used to formmatrices h and H as follows.
ht¼t� ¼ ½hi� ¼ ½h1h2h3::::::::::::::::::::hi� ð14Þ
Figure 4. Meshed transverse section of substrate-track geometry.
894 A. KUMAR ET AL.
Dow
nloa
ded
by [
Raj
a R
aman
na C
tr A
dvan
ced
Tec
hnol
ogy]
, [C
. P. P
aul]
at 1
9:12
04
Mar
ch 2
014
Ht¼t� ¼ ½Hi� ¼ ½H1H2H3:::::::::::::::::::Hi� ð15Þ
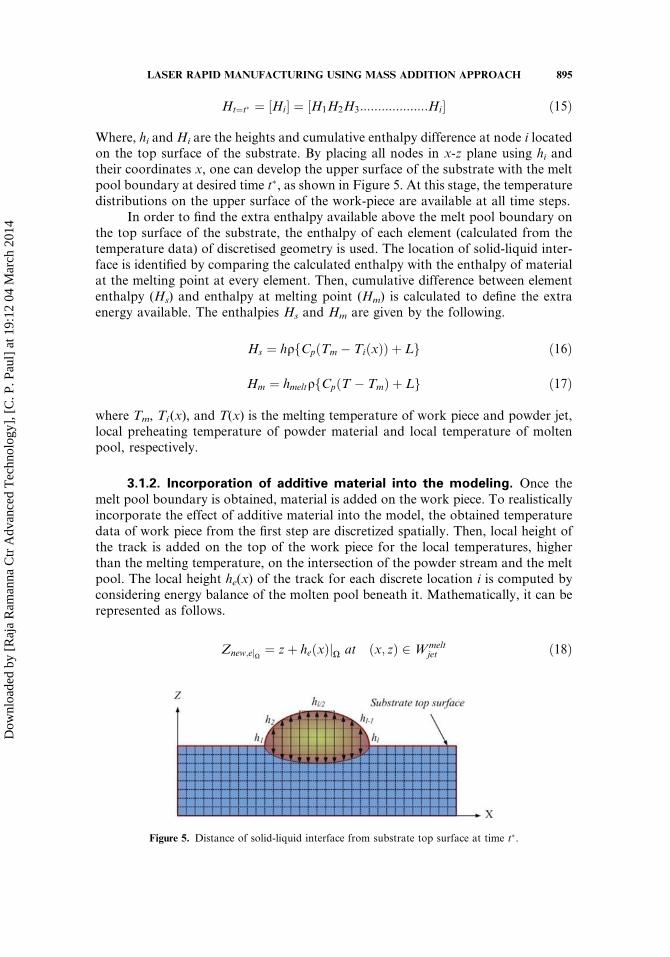
Where, hi andHi are the heights and cumulative enthalpy difference at node i locatedon the top surface of the substrate. By placing all nodes in x-z plane using hi andtheir coordinates x, one can develop the upper surface of the substrate with the meltpool boundary at desired time t�, as shown in Figure 5. At this stage, the temperaturedistributions on the upper surface of the work-piece are available at all time steps.
In order to find the extra enthalpy available above the melt pool boundary onthe top surface of the substrate, the enthalpy of each element (calculated from thetemperature data) of discretised geometry is used. The location of solid-liquid inter-face is identified by comparing the calculated enthalpy with the enthalpy of materialat the melting point at every element. Then, cumulative difference between elemententhalpy (Hs) and enthalpy at melting point (Hm) is calculated to define the extraenergy available. The enthalpies Hs and Hm are given by the following.
Hs ¼ hqfCpðTm � TiðxÞÞ þ Lg ð16Þ
Hm ¼ hmeltqfCpðT � TmÞ þ Lg ð17Þ
where Tm, Ti(x), and T(x) is the melting temperature of work piece and powder jet,local preheating temperature of powder material and local temperature of moltenpool, respectively.
3.1.2. Incorporation of additive material into the modeling. Once themelt pool boundary is obtained, material is added on the work piece. To realisticallyincorporate the effect of additive material into the model, the obtained temperaturedata of work piece from the first step are discretized spatially. Then, local height ofthe track is added on the top of the work piece for the local temperatures, higherthan the melting temperature, on the intersection of the powder stream and the meltpool. The local height he(x) of the track for each discrete location i is computed byconsidering energy balance of the molten pool beneath it. Mathematically, it can berepresented as follows.
Znew;ejX ¼ zþ heðxÞjX at ðx; zÞ 2 Wmeltjet ð18Þ
Figure 5. Distance of solid-liquid interface from substrate top surface at time t�.
LASER RAPID MANUFACTURING USING MASS ADDITION APPROACH 895
Dow
nloa
ded
by [
Raj
a R
aman
na C
tr A
dvan
ced
Tec
hnol
ogy]
, [C
. P. P
aul]
at 1
9:12
04
Mar
ch 2
014
Wmeltjet ¼ x; zð ÞjTðxÞ � Tm 2 Wmelt½ � \ ½ðx; zÞ 2 Wjet�
� �ð19Þ
heðxÞ ¼hmeltðxÞ � qw½Cp � ðTðxÞ � TmÞ þ L�w
qjet � ½Cp � ðTðxÞ � TmÞ þ L�jetð20Þ
Here,Wjet is the powder stream surface, andWmeltjet is the intersection of the melt pool
and the powder stream area on the substrate.The effect of powder flow rate and its local distribution is incorporated in the
model by calculating local track height hm(x) and using the conservation of mass, asrepresented by the following mathematical expressions.
hmðxÞ ¼gmp
Wjet � qjet � uð21Þ
Finally,
hnew ¼ he \ hm ð22Þ
Actual track height hnew is minimum of the two heights, i.e., he and hm; he ismaximum possible height due to energy conservation in the process domain, whilehm is maximum possible height due to powder mass conservation at each discretelocation. It may be noted that the proposed methodology carries out the mass andenergy balance at the end of each time steps and calculate the geometry of depositedmaterial during that time step. This deposited geometry is meshed and used it for thesubsequent computational steps.
As the Eulerian method of description is used, the laser-material interactiontime at the observation plane will be limited to interaction time (s). Therefore, theinteraction time is divided into finite time steps (Dt) to simulate the temporaltemperature distribution and track geometry.
3.1.3. Revision of FE model based upon the updated geometry. The FEmodel is updated after the deposition of each layer incorporating the newlydeposited geometry. The updated FE model is then used for the next numericalanalysis to determine the thermal distribution and, hence, to obtain the boundaryof the melt pool for the subsequent layer geometry and the prediction of thegeometry in subsequent layer. The temperature of the deposited material is thenrevised to melting point considering overall enthalpy balance. Since the materialdeposition in the process domain brings extra energy to the system, a new method-ology for material addition is adopted. This new methodology employs the enthalpybalance along horizontal (x-axis) and vertical axis (z-axis).
3.2. Numerical Computation
To verify the method proposed in the previous section, a five-layer thin wallbuilt up using LRM was modelled. Modeling of Laser rapid manufacturing in2-D is done in several steps. Three different tools have been used for different pur-poses such as GMESH, ELMER, and in house developed FORTRAN 77 programfor material addition. A domain with the size of 20� 10mm2 was originally
896 A. KUMAR ET AL.
Dow
nloa
ded
by [
Raj
a R
aman
na C
tr A
dvan
ced
Tec
hnol
ogy]
, [C
. P. P
aul]
at 1
9:12
04
Mar
ch 2
014
considered as substrate and it is discretizedwithfour-node rectangular elements withGMESH for FE analysis. The mesh consists of 80,000 square elements with asize of 50 mm� 50 mm at the substrate. The temperature distribution for each discretestep for the interaction time period in the process domain was computed usingELMER Multi-physics open source code (www.elmer.com) which solve the govern-ing equations and their corresponding boundary conditions introduced in the pre-vious section. A time- dependent solver (Conjugate gradients), which is an implicitdifferential–algebraic equation (DAE) solver with automatic step size control, is used.The solver supports second-order time derivatives as well as iterative solutions, and issuitable for multi physics problems. Using temperature distribution through the sub-strate, the melt pool boundary was estimated using constant enthalpy method, wheresingle equation is applicable for the both solid and liquid process domains. Thus com-puted cumulative enthalpy difference between nodal enthalpy and enthalpy at meltingpoint was used forthe prediction of the track geometry by applying the conservationof energy. To implement the proposed method for the incorporation of the additivematerial into the modeling scheme, a combined code was developed using ELMERand the interface between FORTRAN code and ELMER.
The temperature-dependent material properties of SS304L steel [43] were con-sideredfor both the substrate and powder particles. The selection of material proper-ties as per local temperature is incorporated in the developed code. Elements used todiscretize the process domain were 4-node rectangular. Prior to implementation ofthe proposed model, the mesh size independency was checked using standard tech-nique of employing least geometric dimension (DL) of the model and element size(e). It was observed that the temperature difference in successive runs of reducedelement size by a factor two becomes less than 10�3 for DL=e> 30. In present simula-tion study, DL=e¼ 40 is used and it corresponds to an element size of �50microns[37]. In addition, all required element quality checks of the FE model were per-formed by the software automatically.
Since in the experimental process, a finite time is required to turn off the laserand return it to its home position for the next layer deposition, to make the numeri-cal analysis identical to the experimental process, the simulation for the build-up ofeach layer was performed for laser interaction time span in which the laser is on andoff for consecutive fixed intervals (i.e., 5 s, 10 s, 20 s, and 40 s). The temperature dis-tribution of the last time step of each simulation pass was considered as the initialcondition for the next simulation pass. The effect of time span on the height andgeometry of the layers are also simulated. The geometrical results obtained fromthe simulation are shown in Figures 7, 10, and 11 in the following sections.
4. EXPERIMENTAL
To validate the simulation results, the experiments were planned using a 2 kWfiber laser based rapid manufacturing system [2]. A laser beam of spot diameter 2mmwas used to deposit multi-layer of SS 304L powder on sand-blasted SS 304L sub-strate (size: 20mm� 10mm) at various processing parameters. The laser intensitydistribution was mixed mode and near flat. The spot point of the laser beam was2mm under the focal point, with a diameter of 2mm on the surface of the workpiece.Table 1 presents the processing parameters used for model validation.
LASER RAPID MANUFACTURING USING MASS ADDITION APPROACH 897
Dow
nloa
ded
by [
Raj
a R
aman
na C
tr A
dvan
ced
Tec
hnol
ogy]
, [C
. P. P
aul]
at 1
9:12
04
Mar
ch 2
014
Using the setup described above, a wall with five layers was deposited on theworkpiece. For the evaluation of track geometry, the deposited multi tracks werecut normal to the track traverse direction and prepared using standard metallo-graphic techniques. The track geometry was measured using optical microscopy.Thus, obtained experimental results were compiled and compared with simulatedresults. A geometrical comparison between the simulation and experimental resultsafter each layer deposition is also presented in the following section.
5. RESULTS AND DISCUSSION
5.1. Effect of Laser Power
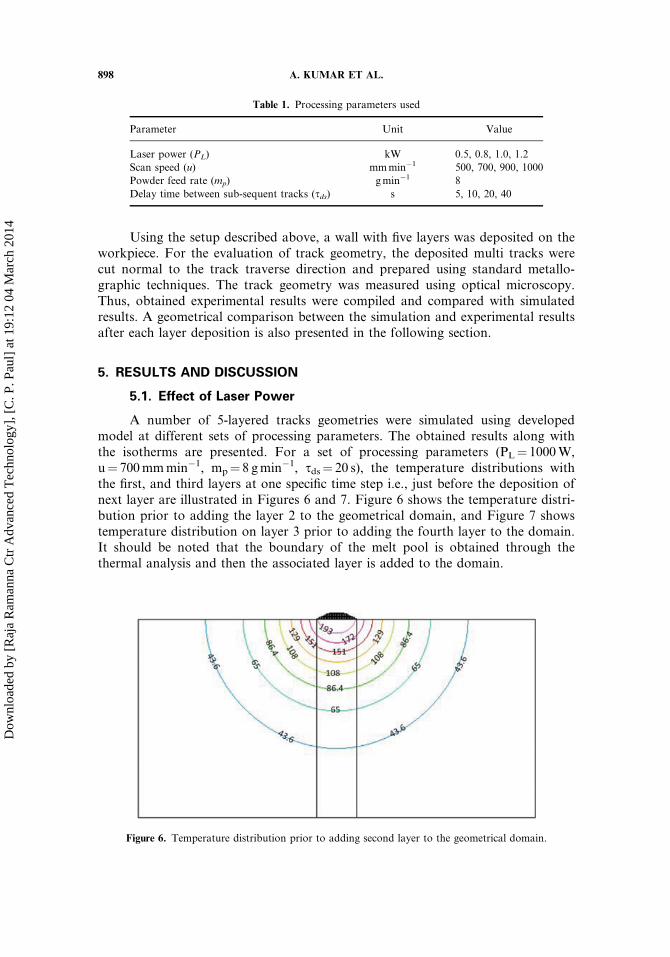
A number of 5-layered tracks geometries were simulated using developedmodel at different sets of processing parameters. The obtained results along withthe isotherms are presented. For a set of processing parameters (PL¼ 1000W,u¼ 700mmmin�1, mp¼ 8 gmin�1, sds¼ 20 s), the temperature distributions withthe first, and third layers at one specific time step i.e., just before the deposition ofnext layer are illustrated in Figures 6 and 7. Figure 6 shows the temperature distri-bution prior to adding the layer 2 to the geometrical domain, and Figure 7 showstemperature distribution on layer 3 prior to adding the fourth layer to the domain.It should be noted that the boundary of the melt pool is obtained through thethermal analysis and then the associated layer is added to the domain.
Table 1. Processing parameters used
Parameter Unit Value
Laser power (PL) kW 0.5, 0.8, 1.0, 1.2
Scan speed (u) mmmin�1 500, 700, 900, 1000
Powder feed rate (mp) gmin�1 8
Delay time between sub-sequent tracks (sds) s 5, 10, 20, 40
Figure 6. Temperature distribution prior to adding second layer to the geometrical domain.
898 A. KUMAR ET AL.
Dow
nloa
ded
by [
Raj
a R
aman
na C
tr A
dvan
ced
Tec
hnol
ogy]
, [C
. P. P
aul]
at 1
9:12
04
Mar
ch 2
014
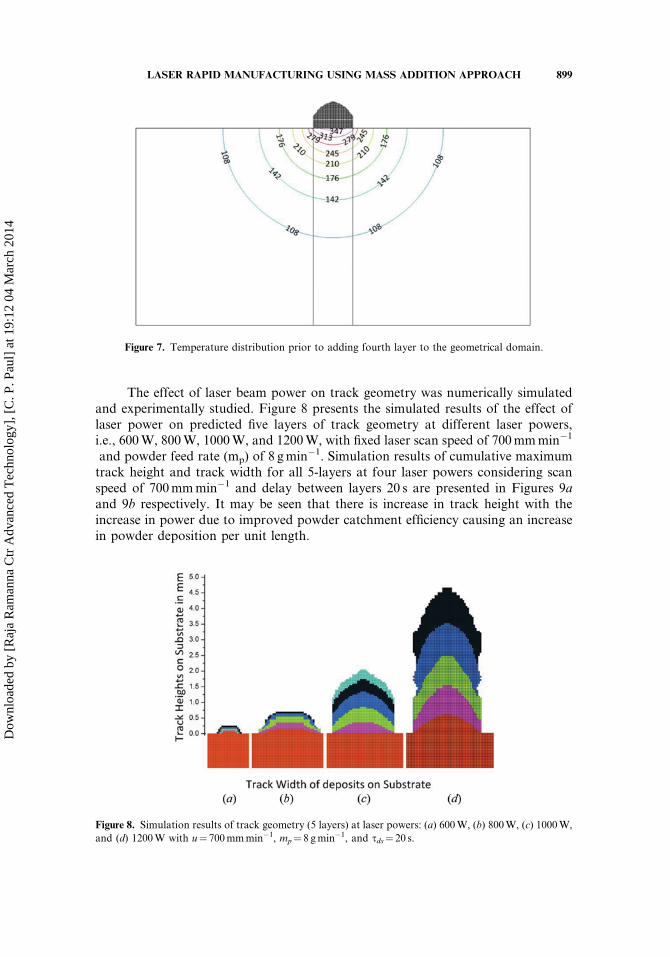
The effect of laser beam power on track geometry was numerically simulatedand experimentally studied. Figure 8 presents the simulated results of the effect oflaser power on predicted five layers of track geometry at different laser powers,i.e., 600W, 800W, 1000W, and 1200W, with fixed laser scan speed of 700mmmin�1
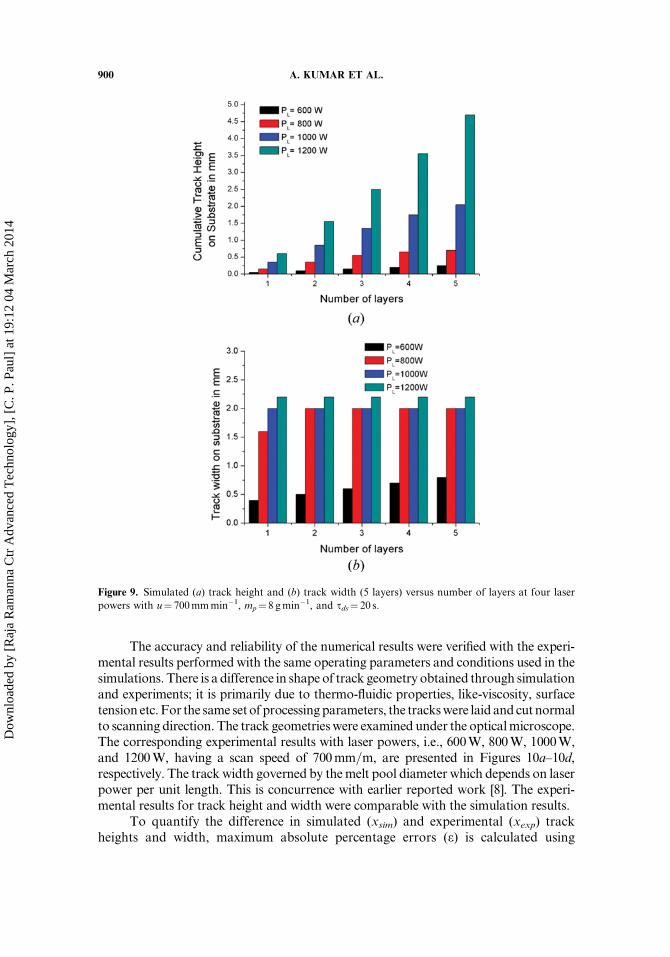
and powder feed rate (mp) of 8 gmin�1. Simulation results of cumulative maximumtrack height and track width for all 5-layers at four laser powers considering scanspeed of 700mmmin�1 and delay between layers 20 s are presented in Figures 9aand 9b respectively. It may be seen that there is increase in track height with theincrease in power due to improved powder catchment efficiency causing an increasein powder deposition per unit length.
Figure 7. Temperature distribution prior to adding fourth layer to the geometrical domain.
Figure 8. Simulation results of track geometry (5 layers) at laser powers: (a) 600W, (b) 800W, (c) 1000W,
and (d) 1200W with u¼ 700mmmin�1, mp¼ 8 gmin�1, and sds¼ 20 s.
LASER RAPID MANUFACTURING USING MASS ADDITION APPROACH 899
Dow
nloa
ded
by [
Raj
a R
aman
na C
tr A
dvan
ced
Tec
hnol
ogy]
, [C
. P. P
aul]
at 1
9:12
04
Mar
ch 2
014
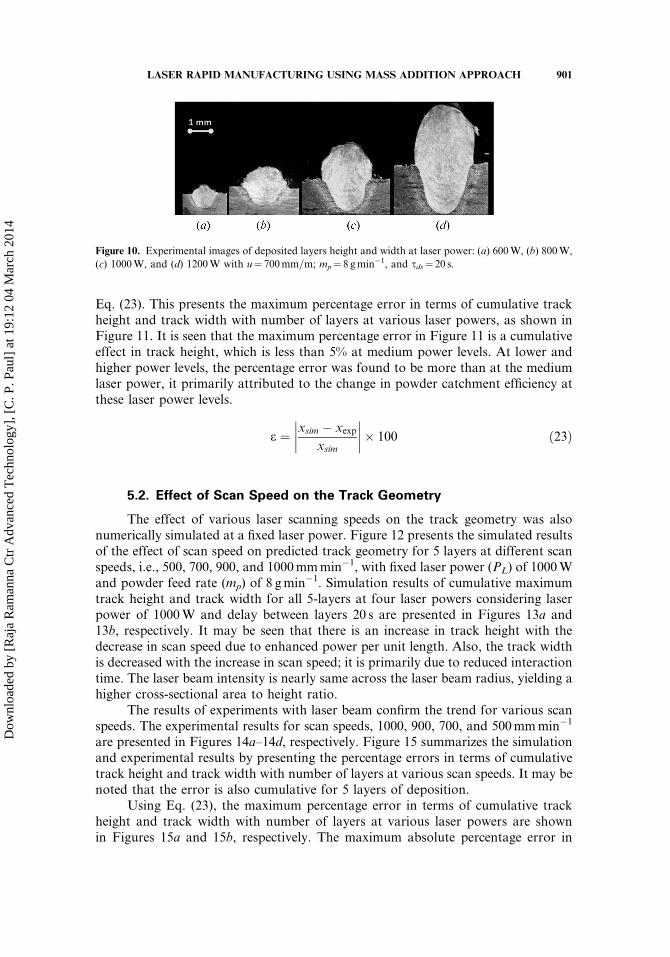
The accuracy and reliability of the numerical results were verified with the experi-mental results performed with the same operating parameters and conditions used in thesimulations. There is a difference in shape of track geometry obtained through simulationand experiments; it is primarily due to thermo-fluidic properties, like-viscosity, surfacetension etc.For the same setof processingparameters, the trackswere laid and cutnormalto scanning direction. The track geometrieswere examined under the opticalmicroscope.The corresponding experimental results with laser powers, i.e., 600W, 800W, 1000W,and 1200W, having a scan speed of 700mm=m, are presented in Figures 10a–10d,respectively. The track width governed by themelt pool diameter which depends on laserpower per unit length. This is concurrence with earlier reported work [8]. The experi-mental results for track height and width were comparable with the simulation results.
To quantify the difference in simulated (xsim) and experimental (xexp) trackheights and width, maximum absolute percentage errors (e) is calculated using
Figure 9. Simulated (a) track height and (b) track width (5 layers) versus number of layers at four laser
powers with u¼ 700mmmin�1, mp¼ 8 gmin�1, and sds¼ 20 s.
900 A. KUMAR ET AL.
Dow
nloa
ded
by [
Raj
a R
aman
na C
tr A
dvan
ced
Tec
hnol
ogy]
, [C
. P. P
aul]
at 1
9:12
04
Mar
ch 2
014
Eq. (23). This presents the maximum percentage error in terms of cumulative trackheight and track width with number of layers at various laser powers, as shown inFigure 11. It is seen that the maximum percentage error in Figure 11 is a cumulativeeffect in track height, which is less than 5% at medium power levels. At lower andhigher power levels, the percentage error was found to be more than at the mediumlaser power, it primarily attributed to the change in powder catchment efficiency atthese laser power levels.
e ¼ xsim � xexpxsim
� 100 ð23Þ
5.2. Effect of Scan Speed on the Track Geometry
The effect of various laser scanning speeds on the track geometry was alsonumerically simulated at a fixed laser power. Figure 12 presents the simulated resultsof the effect of scan speed on predicted track geometry for 5 layers at different scanspeeds, i.e., 500, 700, 900, and 1000mmmin�1, with fixed laser power (PL) of 1000Wand powder feed rate (mp) of 8 gmin�1. Simulation results of cumulative maximumtrack height and track width for all 5-layers at four laser powers considering laserpower of 1000W and delay between layers 20 s are presented in Figures 13a and13b, respectively. It may be seen that there is an increase in track height with thedecrease in scan speed due to enhanced power per unit length. Also, the track widthis decreased with the increase in scan speed; it is primarily due to reduced interactiontime. The laser beam intensity is nearly same across the laser beam radius, yielding ahigher cross-sectional area to height ratio.
The results of experiments with laser beam confirm the trend for various scanspeeds. The experimental results for scan speeds, 1000, 900, 700, and 500mmmin�1
are presented in Figures 14a–14d, respectively. Figure 15 summarizes the simulationand experimental results by presenting the percentage errors in terms of cumulativetrack height and track width with number of layers at various scan speeds. It may benoted that the error is also cumulative for 5 layers of deposition.
Using Eq. (23), the maximum percentage error in terms of cumulative trackheight and track width with number of layers at various laser powers are shownin Figures 15a and 15b, respectively. The maximum absolute percentage error in
Figure 10. Experimental images of deposited layers height and width at laser power: (a) 600W, (b) 800W,
(c) 1000W, and (d) 1200W with u¼ 700mm=m; mp¼ 8 gmin�1, and sds¼ 20 s.
LASER RAPID MANUFACTURING USING MASS ADDITION APPROACH 901
Dow
nloa
ded
by [
Raj
a R
aman
na C
tr A
dvan
ced
Tec
hnol
ogy]
, [C
. P. P
aul]
at 1
9:12
04
Mar
ch 2
014
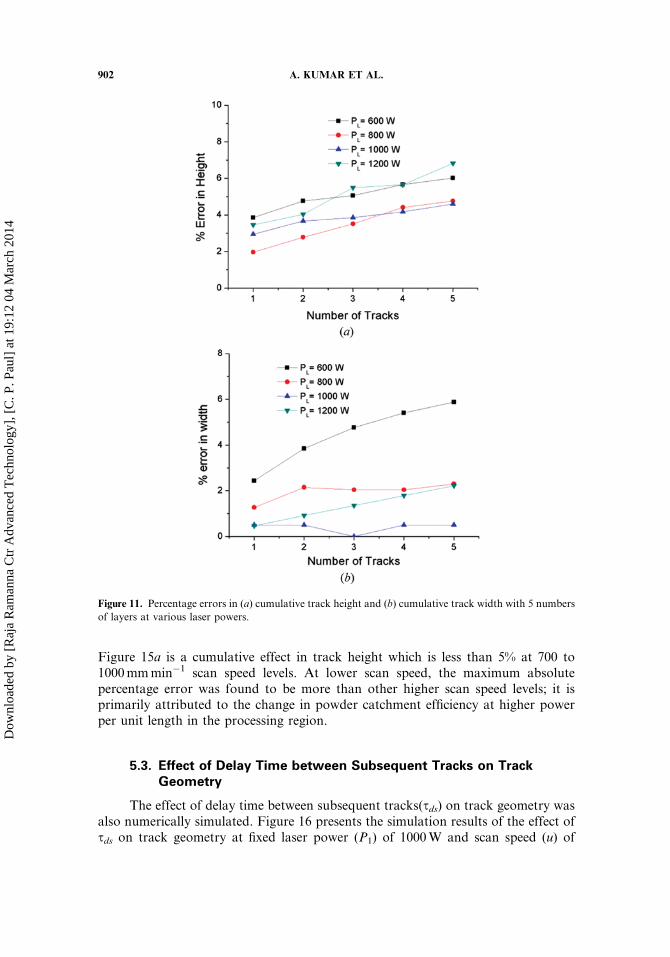
Figure 15a is a cumulative effect in track height which is less than 5% at 700 to1000mmmin�1 scan speed levels. At lower scan speed, the maximum absolutepercentage error was found to be more than other higher scan speed levels; it isprimarily attributed to the change in powder catchment efficiency at higher powerper unit length in the processing region.
5.3. Effect of Delay Time between Subsequent Tracks on TrackGeometry
The effect of delay time between subsequent tracks(sds) on track geometry wasalso numerically simulated. Figure 16 presents the simulation results of the effect ofsds on track geometry at fixed laser power (P1) of 1000W and scan speed (u) of
Figure 11. Percentage errors in (a) cumulative track height and (b) cumulative track width with 5 numbers
of layers at various laser powers.
902 A. KUMAR ET AL.
Dow
nloa
ded
by [
Raj
a R
aman
na C
tr A
dvan
ced
Tec
hnol
ogy]
, [C
. P. P
aul]
at 1
9:12
04
Mar
ch 2
014
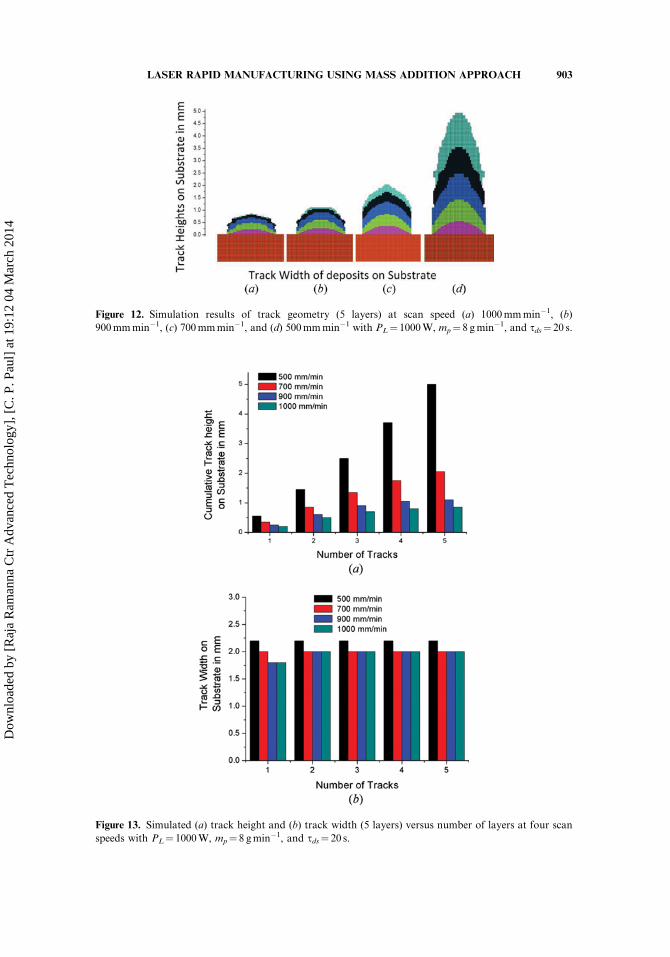
Figure 12. Simulation results of track geometry (5 layers) at scan speed (a) 1000mmmin�1, (b)
900mmmin�1, (c) 700mmmin�1, and (d) 500mmmin�1 with PL¼ 1000W, mp¼ 8 gmin�1, and sds¼ 20 s.
Figure 13. Simulated (a) track height and (b) track width (5 layers) versus number of layers at four scan
speeds with PL¼ 1000W, mp¼ 8 gmin�1, and sds¼ 20 s.
LASER RAPID MANUFACTURING USING MASS ADDITION APPROACH 903
Dow
nloa
ded
by [
Raj
a R
aman
na C
tr A
dvan
ced
Tec
hnol
ogy]
, [C
. P. P
aul]
at 1
9:12
04
Mar
ch 2
014
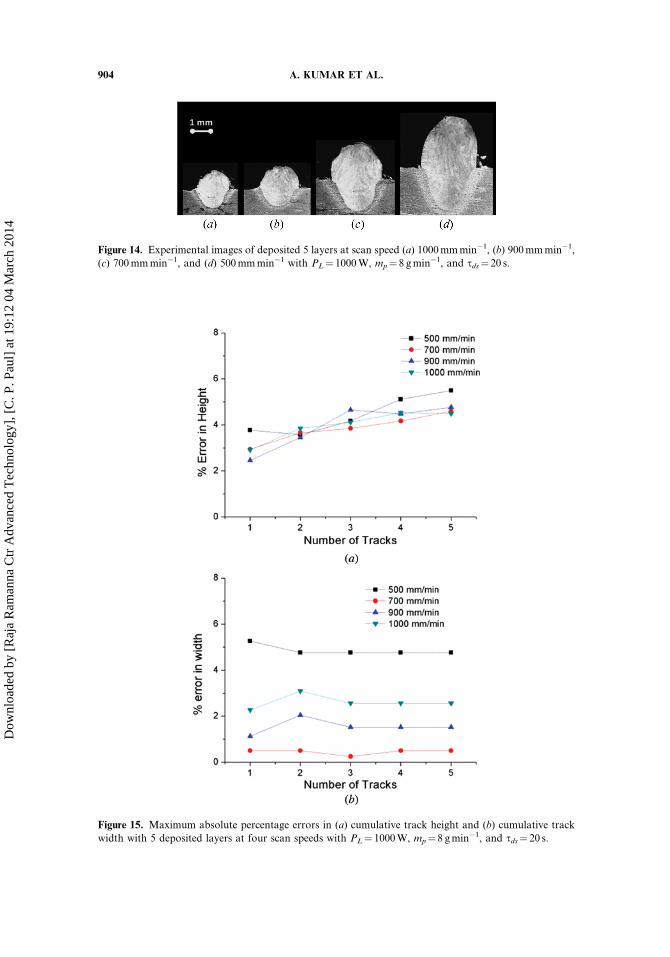
Figure 14. Experimental images of deposited 5 layers at scan speed (a) 1000mmmin�1, (b) 900mmmin�1,
(c) 700mmmin�1, and (d) 500mmmin�1 with PL¼ 1000W, mp¼ 8 gmin�1, and sds¼ 20 s.
Figure 15. Maximum absolute percentage errors in (a) cumulative track height and (b) cumulative track
width with 5 deposited layers at four scan speeds with PL¼ 1000W, mp¼ 8 gmin�1, and sds¼ 20 s.
904 A. KUMAR ET AL.
Dow
nloa
ded
by [
Raj
a R
aman
na C
tr A
dvan
ced
Tec
hnol
ogy]
, [C
. P. P
aul]
at 1
9:12
04
Mar
ch 2
014
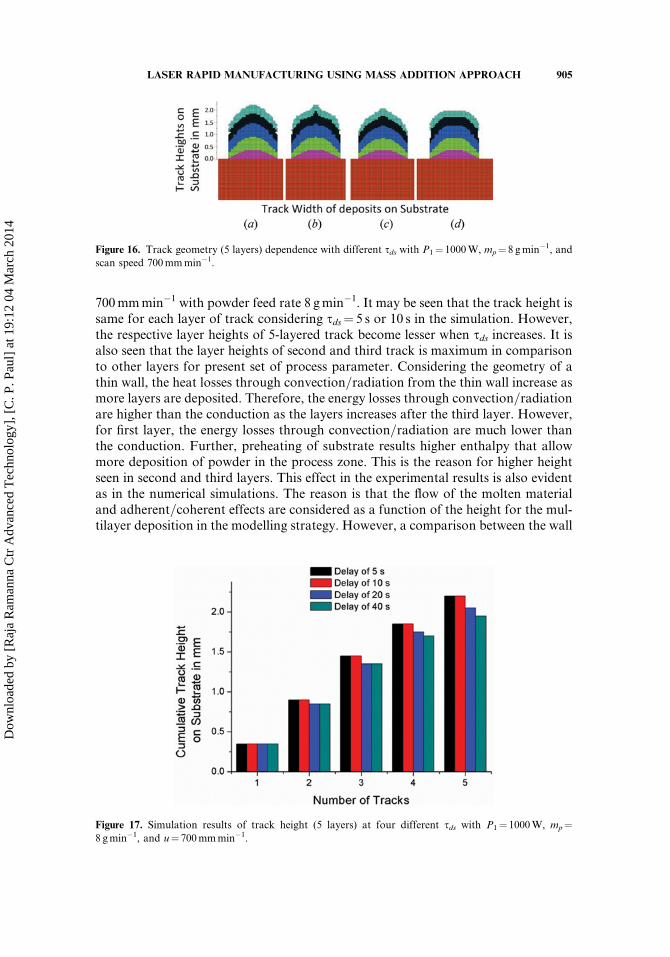
700mmmin�1 with powder feed rate 8 gmin�1. It may be seen that the track height issame for each layer of track considering sds¼ 5 s or 10 s in the simulation. However,the respective layer heights of 5-layered track become lesser when sds increases. It isalso seen that the layer heights of second and third track is maximum in comparisonto other layers for present set of process parameter. Considering the geometry of athin wall, the heat losses through convection=radiation from the thin wall increase asmore layers are deposited. Therefore, the energy losses through convection=radiationare higher than the conduction as the layers increases after the third layer. However,for first layer, the energy losses through convection=radiation are much lower thanthe conduction. Further, preheating of substrate results higher enthalpy that allowmore deposition of powder in the process zone. This is the reason for higher heightseen in second and third layers. This effect in the experimental results is also evidentas in the numerical simulations. The reason is that the flow of the molten materialand adherent=coherent effects are considered as a function of the height for the mul-tilayer deposition in the modelling strategy. However, a comparison between the wall
Figure 16. Track geometry (5 layers) dependence with different sds with P1¼ 1000W, mp¼ 8 gmin�1, and
scan speed 700mmmin�1.
Figure 17. Simulation results of track height (5 layers) at four different sds with P1¼ 1000W, mp¼8 gmin�1, and u¼ 700mmmin�1.
LASER RAPID MANUFACTURING USING MASS ADDITION APPROACH 905
Dow
nloa
ded
by [
Raj
a R
aman
na C
tr A
dvan
ced
Tec
hnol
ogy]
, [C
. P. P
aul]
at 1
9:12
04
Mar
ch 2
014
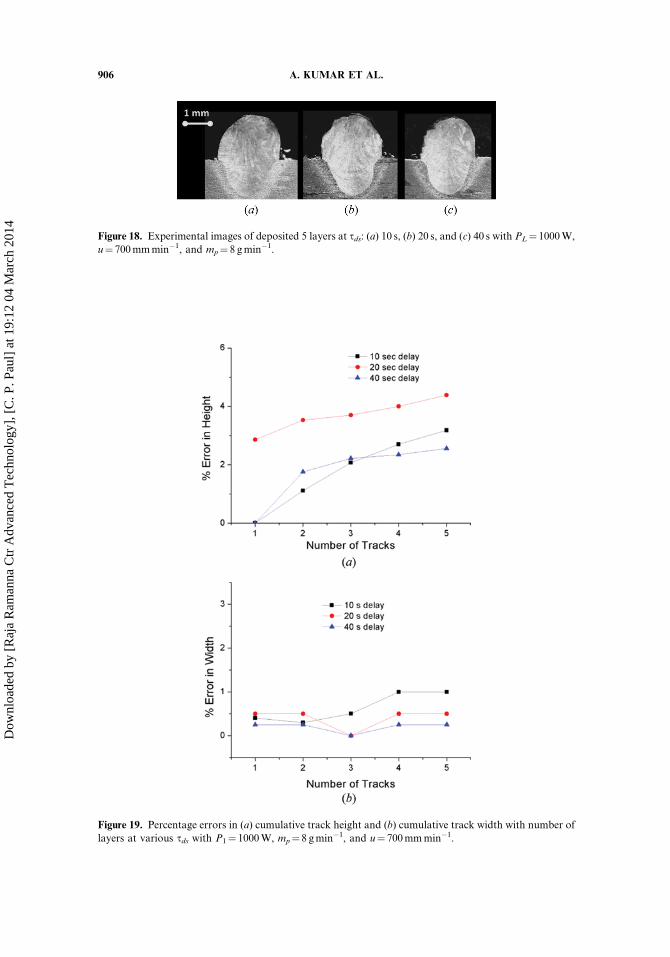
Figure 18. Experimental images of deposited 5 layers at sds: (a) 10 s, (b) 20 s, and (c) 40 s with PL¼ 1000W,
u¼ 700mmmin�1, and mp¼ 8 gmin�1.
Figure 19. Percentage errors in (a) cumulative track height and (b) cumulative track width with number of
layers at various sds with P1¼ 1000W, mp¼ 8 gmin�1, and u¼ 700mmmin�1.
906 A. KUMAR ET AL.
Dow
nloa
ded
by [
Raj
a R
aman
na C
tr A
dvan
ced
Tec
hnol
ogy]
, [C
. P. P
aul]
at 1
9:12
04
Mar
ch 2
014
cross sections obtained numerically and experimentally shows that in the wall fabri-cated experimentally, more material is deposited in the second and three layers. Thisfact is evident from the wall height throughout the build up process, as shown inFigure 16. Figure 17 summarizes the simulation results presented in Figure 16 interms of maximum height and width of all the layers at different sds.
The results of experiments with laser beam confirm the trend for various delaysbetween layers. The experimental results for the delay between deposited layers arepresented in Figures 18a–18c, respectively. Figure 19 summarizes the simulation andexperimental results by presenting the maximum absolute percentage errors calcu-lated from Eq. (23) in terms of cumulative track height and track width with numberof layers at various sds.
5.4. Comparison of Present Model with Other Existing Models
A comparison between the average heights of each layer obtained from experi-mental and the numerical model developed for material deposition by Alimardaniet al. shows that the predicted geometry of the deposits throughout the depositionprocess had a maximum average relative error of 9.29% [27], or more than 23%[29]. The model suggested by Pinkerton [32] observed the mean absolute differencesbetween modeled and actual measured values are 8% and 17% for 316L and H13,respectively, at various process parameters. Recently, Hao and Sun [33] proposeda FEM model using an inverse modelling approach predicted errors in claddingwidth and height within 7% for single track deposition.
6. CONCLUSION
A 2-D transient numerical approach has been developed to model the multi-layer LRM process. Using this modeling approach, the geometry of the depositedmaterials as well as temperature can be predicted throughout the fabrication process.The capability of the developed algorithm was demonstrated by depositing singletrack on SS 304L work-pieces using powder of the same material at simulated pro-cess parameters. The effect of various processing parameters on the laser depositgeometry was evaluated and experimentally verified. The studies showed that therewas an increase in track height with the increase in power due to improved powdercatchment efficiency causing an increase in powder deposition per unit length. Theeffect of scan speed indicated that there was an increase in track height with thedecrease in scan speed due to enhanced power per unit length. Also, the track widthwas decreased with the increase in scan speed; it is primarily due to reduced interac-tion time. The effect of time delay between the subsequent layers showed thedecrease in cumulative layer height after five layers with increase in time delaybetween subsequent layers. This is primarily due to reduced pre-heating effect withhigher heat diffusion at higher time delay between the subsequent layers. The verifi-cation of performance and accuracy of the model showed that the maximum percent-age error in predicting in track height was less than 5% at medium power levels. Atlower and higher power levels, the percentage error was found to be more primarilydue to the change in powder catchment efficiency. The verification indicated that thepercentage error was found to be least as compared to other existing models.
LASER RAPID MANUFACTURING USING MASS ADDITION APPROACH 907
Dow
nloa
ded
by [
Raj
a R
aman
na C
tr A
dvan
ced
Tec
hnol
ogy]
, [C
. P. P
aul]
at 1
9:12
04
Mar
ch 2
014
REFERENCES
1. J. Lawrence, D. K. Y. Low, J. Pou, and E. Toyserkani, Advances in Laser MaterialsProcessing Technology, CRC Press, Boca Raton, FL, 2010.
2. C. P. Paul, P. Bhargava, A. Kumar, A. K. Pathak, and L. M. Kukreja, Laser RapidManufacturing: Technology, Applications, Modelling and Future Prospects, in Lasersin Manufacturing, Ed. J. Paulo Davim, Wiley-ISTE, London, UK, 2012.
3. R. Vilar, Laser Cladding, J. Laser. Appl., vol. 11, pp. 64–79, 1999.4. P. Ganesh, R. Kaul, S. K. Mishra, P. Bhargava, C. P. Paul, C. H. P. Singh, P. Tiwari,
S. M. Oak, and R. C. Prasad, Laser Rapid Manufacturing of Bi-Metallic Tube withStellite-21 and Austenitic Stainless Steel, Trans. Indian Inst. Met., vol. 62, pp. 169–174,2009.
5. W. Liu and J. N. DuPont, Fabrication of Functionally Graded TiC=Ti Composites byLaser Engineered Net Shaping, Scr. Mater., vol. 48, pp. 1337–1342, 2003.
6. M. Naveed Ahsan, C. P. Paul, L. M. Kukreja, and A. J. Pinkerton, Porous StructuresFabrication by Continuous, and Pulsed Laser Metal Deposition for Biomedical Applica-tions, Modelling and Experimental Investigation, J. Mater. Process. Technol., vol. 211,pp. 602–609, 2011.
7. C. P. Paul, S. K. Mishra, C. H. Premsingh, P. Bhargava, P. Tiwari, and L. M. Kukreja,Studies on Laser Rapid Manufacturing of Cross-Thin-Walled Porous Structures ofInconel 625, Int. J. Adv. Manuf. Tech., vol. 61, pp. 757–770, 2012.
8. C. P. Paul and A. Khajepour, Automated Laser Fabrication of Cemented CarbideComponents, Opt. Laser. Technol., vol. 40, pp. 735–741, 2008.
9. S. J. Davis, K. G. Watkins, G. Dearden, E. Fearon, and J. Zeng, Optimum DepositionParameters for the Direct Laser Fabrication (DLF) of Quasi-Hollow Structures, Proc.Photon Conf. Manchester, P3.14, 2006.
10. X. He, G. Yu, and J. Mazumder, Temperature, and Composition Profile duringDouble-Track Laser Cladding of H13 Tool Steel, J. Phys. D: Appl. Phys., vol. 43,pp. 015502, 2010.
11. R. J. Moat, A. Pinkerton, L. Li, P. J. Withers, and M. Preuss, Crystallographic Textureand Microstructure of Pulsed Diode Laser-Deposited Waspaloy, Acta Mater., vol. 5,pp. 1220–1229, 2009.
12. L. Wang and S. Felicelli, Analysis of Thermal Phenomena in LENSTM Deposition,Mater. Sci. Eng. A, vol. 435–436, pp. 625–631, 2006.
13. A. Vasinonta, J. L. Beuth, and M. L. Grifith, A Process Map for Consistent BuildCondition in the Solid Free Form Fabrication of Thin-Walled Structures, J. Manuf.Sci. Eng., vol. 123, pp. 615–622, 2001.
14. P. Peyre, P. Aubry, R. Fabbro, R. Neveu, and A. Longuet, Analytical, and NumericalModeling of the Direct Metal Deposition Laser Process, J. Phys. D: Appl. Phys.,vol. 41, pp. 025403, 2008.
15. M. Rohde, O. Baldus, D. Dimitrova, and S. Schreck, Numerical Simulation of Laser-Induced Modification Processes of Ceramic Substrates, Numer. Heat Transfer A, vol. 50,pp. 835–849, 2006.
16. S. Z. Shuja and B. S. Yilbas, Laser Heating and Flow Field Developed in the Melt Pool,Numer. Heat Transfer A, vol. 59, pp. 970–987, 2011.
17. A. K. Skouras, N. Chakraborty, S. Chakraborty, Computational Analysis of the Effectsof Process Parameters on Molten Pool Transport in Cu-Ni Dissimilar Laser Weld Pool,Numer. Heat Transfer A, vol. 58, pp. 272–294, 2010.
18. N. Ahmed, K. T. Voisey, and D. G. McCartney, Investigation into the Effect of BeamShape on Melt Pool Characteristics using Analytical Modelling, Opt. Laser. Eng., vol.48, pp. 548–554, 2010.
908 A. KUMAR ET AL.
Dow
nloa
ded
by [
Raj
a R
aman
na C
tr A
dvan
ced
Tec
hnol
ogy]
, [C
. P. P
aul]
at 1
9:12
04
Mar
ch 2
014
19. E. Toyserkani, A. Khajepour, and S. F. Corbin, 3-D Finite Element Modeling of LaserCladding by Powder Injection: Effects of Laser Pulse Shaping on the Process, Opt. LaserEng., vol. 41, pp. 849–867, 2004.
20. J. Liu and L. Li, Direct Fabrication of Thin-Wall Parts by Laser Cladding, J. Manuf.Processes, vol. 8, pp. 1–7, 2006.
21. H. Qi, J. Mazumder, and H. Ki, Numerical Simulation of Heat Transfer, and Fluid Flowin Coaxial Laser Cladding Process for Direct Metal Deposition, J. Appl. Phys., vol. 100,pp. 024903, 2006.
22. X. He, G. Yu, and J. Mazumder, Temperature, and Composition Profile DuringDouble-Track Laser Cladding of H13 Tool Steel, J. Phys. D: Appl. Phys., vol. 43,pp. 015502, 2010.
23. H. Yin, L. Wang, and S. Felicelli, Comparison of Two-Dimensional and Three-Dimensional Thermal Models of the LENS Process. J. Heat Transfer, vol. 130, pp. 1–7,2008.
24. L. Wang, S. Felicelli, Y. Gooroochurn, P. T. Wang, and M. F. Horstemeyer, Optimiza-tion of the LENS Process for Steady Molten Pool Size, Mater. Sci. Eng. A, vol. 474,pp. 148–156, 2008.
25. Y. Zhang, G. Yu, X. He, W. Ning, and C. Zheng, Numerical and ExperimentalInvestigation of Multilayer SS410 Thin Wall Built by Laser Direct Metal Deposition,J. Materials Proc. Tech., vol. 212, pp. 106–112, 2012.
26. C. P. Paul, S. K. Mishra, Atul Kumar, and L. M. Kukreja, Laser Rapid Manufacturingon Vertical Surfaces: Analytical and Experimental Studies, Surf. and Coatings Tech.,vol. 224, pp. 18–28, 2013.
27. M. Alimardani, E. Toyserkani, J. P. Huissoon, A 3-D Dynamic Numerical Approachfor Temperature and Thermal Stress Distributions in Multilayer Laser Solid FreeformFabrication Process, Opt. Lasers Eng., vol. 45, pp. 1115–1130, 2007.
28. M. Alimardani, E. Toyserkani, J. P. Huissoon, and C. P. Paul, On the Delamination andCrack Formation in a Thin Wall Fabricated using Laser Solid Freeform Fabrication Pro-cess: An Experimental–Numerical Investigation, Opt. Lasers Eng., vol. 47, pp. 1160–1168,2009.
29. M. Alimardani, E. Toyserkani, and J. P. Huissoon, Three-Dimensional NumericalApproach for Geometrical Prediction of Multilayer Laser Solid Freeform FabricationProcess, J. Laser Applications, vol. 19, pp. 14–25, 2007.
30. J. T. Hofman, D. F. de Lange, B. Pathiraj, and J. Meijer, FEM Modeling and Experi-mental Verification for Dilution Control in Laser Cladding, J. Mater. Process. Technol.,vol. 211, pp. 187–196, 2011.
31. Z. Wang, S. Dong, B. Xu, and W. Xia, Laser Clad Geometry: Experimental Observationand Geometric Modeling, Adv. Mater. Research, vol. 148–149, pp. 628–632, 2011.
32. A. J. Pinkerton and L. Li, Modelling the Geometry of a Moving Laser Melt Pool andDeposition Track via Energy and Mass Balances, J. Phys. D: Appl. Phys., vol. 37,pp. 1885–1895, 2004.
33. M. Hao and Y. Sun, A FEM Model for Simulating Temperature Field in Coaxial LaserCladding of TI6AL4V Alloy using an Inverse Modeling Approach, Int. J. Heat and MassTransfer, vol. 64, pp. 352–360, 2013.
34. S. Safdar, A. J. Pinkerton, L. Li, M. A. Sheikh, and P. J. Withers, An AnisotropicEnhanced Thermal Conductivity Approach for Modelling Laser Melt Pools for Ni-BaseSuper Alloys, Appl. Math. Modelling, vol. 37, pp. 1187–1195, 2013.
35. F. K. Mirzade, V. G. Niziev, V. Y. Panchenko, M. D. Khomenko, R. V. Grishaev, S.Pityana, and C. V. Rooyen, Kinetic Approach in Numerical Modelling of Melting andCrystallization at Laser Cladding with Powder Injection, Physica B, vol. 423, pp. 69–76, 2013.
LASER RAPID MANUFACTURING USING MASS ADDITION APPROACH 909
Dow
nloa
ded
by [
Raj
a R
aman
na C
tr A
dvan
ced
Tec
hnol
ogy]
, [C
. P. P
aul]
at 1
9:12
04
Mar
ch 2
014
36. S. Kumar and S. Roy, Development of a Theoretical Process Map for Laser Claddingusing a Three-Dimensional Conduction Heat Transfer Model, Numer. Heat Transfer A,vol. 56, pp. 478–496, 2009.
37. A. Kumar, C. P. Paul, A. K. Pathak, P. Bhargava, and L. M. Kukreja, A Finer ModelingApproach for Numerically Predicting Single Track Geometry in Two Dimensions duringLaser Rapid Manufacturing, Opt. Laser Tech., vol. 44, pp. 555–65, 2012.
38. M. Picasso, C. F. Marsden, J. D. Wagniere, A. Frend, and M. Rappaz, A Simple butRealistic Model for Laser Cladding, J. Metall. Mater. Trans. B, vol. 25, pp. 281–291,1994.
39. S. Kumar, S. Roy, C. P. Paul, and A. K. Nath, Three-Dimensional Conduction HeatTransfer Model for Laser Cladding Process, Numer. Heat Transfer B, vol. 53, pp. 271–287, 2008.
40. R. W. Lewis, P. Nithiarasu, and K. N. Seetharamu, Fundamentals of the Finite ElementMethod for Heat and Fluid Flow, pp. 164–166, John Wiley & Sons Ltd., Chichester,England, 2004.
41. C. Lampa, A. F. H. Kaplan, J. Powell, C. Magnusson, Analytical Thermodynamic Modelof Laser Welding, J. Phys. D: Appl. Phys., vol. 30, pp. 1293–1299, 1997.
42. L. X. Yang, X. F. Peng, and B. X. Wang, Numerical Modeling and ExperimentalInvestigation on the Characteristics of Molten Pool during Laser Processing, Int. J. Heat.Mass Transfer, vol. 44, pp. 4465–4473, 2001.
43. K. R. Balasubramanian, N. Siva Shanmugam, G. Buvanashekaran, and K.Sankaranarayanasamy, Numerical and Experimental Investigation of Laser Beam Weld-ing of AISI 304 Stainless Steel Sheet, Adv. Prod. Eng. Manage., vol. 3, pp. 93–105, 2008.
910 A. KUMAR ET AL.
Dow
nloa
ded
by [
Raj
a R
aman
na C
tr A
dvan
ced
Tec
hnol
ogy]
, [C
. P. P
aul]
at 1
9:12
04
Mar
ch 2
014