The Possible Role of Penning Ionization Processes in Planetary Atmospheres
Upload
independentCategory
view
0download
0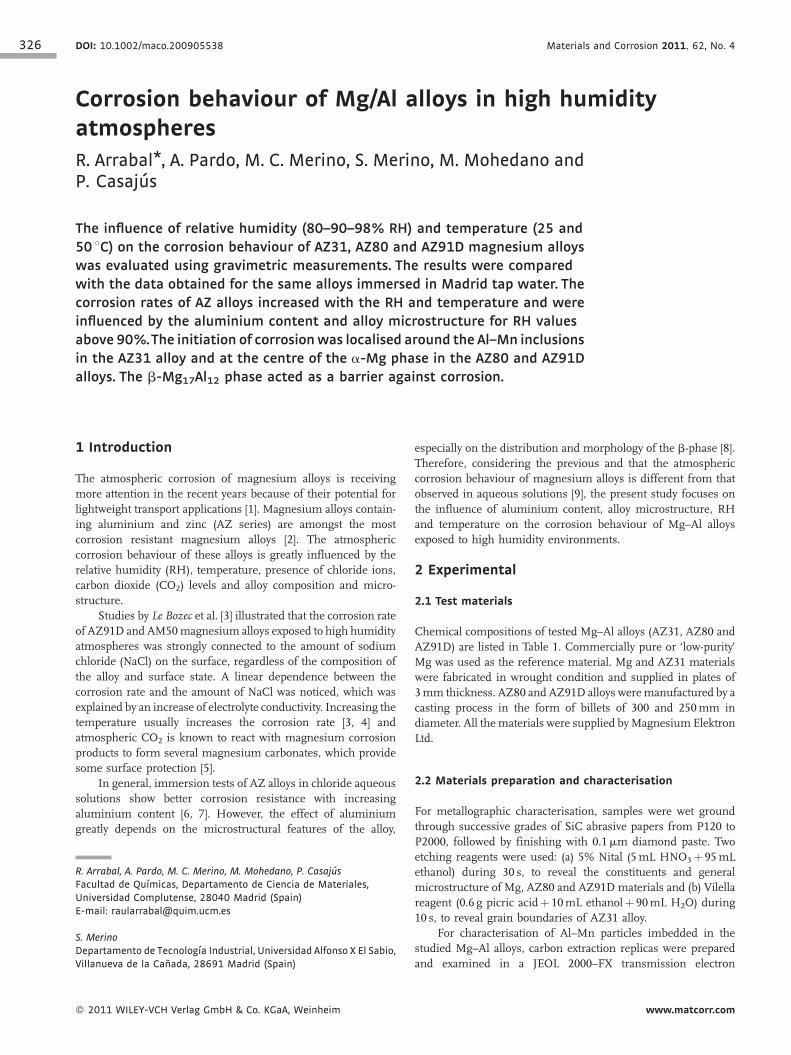
326 DOI: 10.1002/maco.200905538 Materials and Corrosion 2011, 62, No. 4
Corrosion behaviour of Mg/Al alloys in high humidityatmospheres
R. Arrabal*, A. Pardo, M. C. Merino, S. Merino, M. Mohedano andP. Casajus
The influence of relative humidity (80–90–98% RH) and temperature (25 and
50 8C) on the corrosion behaviour of AZ31, AZ80 and AZ91D magnesium alloys
was evaluated using gravimetric measurements. The results were compared
with the data obtained for the same alloys immersed in Madrid tap water. The
corrosion rates of AZ alloys increased with the RH and temperature and were
influenced by the aluminium content and alloy microstructure for RH values
above 90%.The initiation of corrosionwas localised around the Al–Mn inclusions
in the AZ31 alloy and at the centre of the a-Mg phase in the AZ80 and AZ91D
alloys. The b-Mg17Al12 phase acted as a barrier against corrosion.
1 Introduction
The atmospheric corrosion of magnesium alloys is receiving
more attention in the recent years because of their potential for
lightweight transport applications [1]. Magnesium alloys contain-
ing aluminium and zinc (AZ series) are amongst the most
corrosion resistant magnesium alloys [2]. The atmospheric
corrosion behaviour of these alloys is greatly influenced by the
relative humidity (RH), temperature, presence of chloride ions,
carbon dioxide (CO2) levels and alloy composition and micro-
structure.
Studies by Le Bozec et al. [3] illustrated that the corrosion rate
of AZ91D and AM50magnesium alloys exposed to high humidity
atmospheres was strongly connected to the amount of sodium
chloride (NaCl) on the surface, regardless of the composition of
the alloy and surface state. A linear dependence between the
corrosion rate and the amount of NaCl was noticed, which was
explained by an increase of electrolyte conductivity. Increasing the
temperature usually increases the corrosion rate [3, 4] and
atmospheric CO2 is known to react with magnesium corrosion
products to form several magnesium carbonates, which provide
some surface protection [5].
In general, immersion tests of AZ alloys in chloride aqueous
solutions show better corrosion resistance with increasing
aluminium content [6, 7]. However, the effect of aluminium
greatly depends on the microstructural features of the alloy,
R. Arrabal, A. Pardo, M. C. Merino, M. Mohedano, P. Casajus
Facultad de Quımicas, Departamento de Ciencia de Materiales,
Universidad Complutense, 28040 Madrid (Spain)
E-mail: [email protected]
S. Merino
Departamento de Tecnologıa Industrial, Universidad Alfonso X El Sabio,
Villanueva de la Canada, 28691 Madrid (Spain)
� 2011 WILEY-VCH Verlag GmbH & Co. KGaA, Weinheim
especially on the distribution and morphology of the b-phase [8].
Therefore, considering the previous and that the atmospheric
corrosion behaviour of magnesium alloys is different from that
observed in aqueous solutions [9], the present study focuses on
the influence of aluminium content, alloy microstructure, RH
and temperature on the corrosion behaviour of Mg–Al alloys
exposed to high humidity environments.
2 Experimental
2.1 Test materials
Chemical compositions of tested Mg–Al alloys (AZ31, AZ80 and
AZ91D) are listed in Table 1. Commercially pure or ‘low-purity’
Mg was used as the reference material. Mg and AZ31 materials
were fabricated in wrought condition and supplied in plates of
3mm thickness. AZ80 and AZ91D alloys weremanufactured by a
casting process in the form of billets of 300 and 250mm in
diameter. All the materials were supplied byMagnesium Elektron
Ltd.
2.2 Materials preparation and characterisation
For metallographic characterisation, samples were wet ground
through successive grades of SiC abrasive papers from P120 to
P2000, followed by finishing with 0.1mm diamond paste. Two
etching reagents were used: (a) 5% Nital (5mL HNO3þ 95mL
ethanol) during 30 s, to reveal the constituents and general
microstructure of Mg, AZ80 and AZ91D materials and (b) Vilella
reagent (0.6 g picric acidþ 10mL ethanolþ 90mL H2O) during
10 s, to reveal grain boundaries of AZ31 alloy.
For characterisation of Al–Mn particles imbedded in the
studied Mg–Al alloys, carbon extraction replicas were prepared
and examined in a JEOL 2000–FX transmission electron
www.matcorr.com

Materials and Corrosion 2011, 62, No. 4 Corrosion behaviour of Mg/Al alloys 327
Table 1. Nominal composition of test materials
Material Elements (wt%)
Al Zn Mn Si Cu Fe Ni Ca Zr Others
Mg (99.9%) 0.006 0.014 0.03 0.019 0.001 0.004 <0.001
AZ31 3.1 0.73 0.25 0.02 <0.001 0.005 <0.001 <0.01 <0.001 <0.30
AZ80 8.2 0.46 0.13 0.01 <0.001 0.004 <0.30
AZ91D 8.8 0.68 0.30 0.01 <0.001 0.004 <0.008 <0.30
microscope (TEM) operating at 200 kV and equipped with Oxford
link EDX microanalysis hardware.
Surface potential maps of polished specimens were obtained
with a MultiMode scanning probe microscope (Veeco–Digital
Instruments) working in tapping mode. A silicon tip with a
platinum coating of 20 nm thickness was used for simultaneous
acquisition of topographic and surface potential images. The
AFM tip was calibrated by performing a potential ramp on a
reference sample consisting of aluminium coated with a thin gold
layer. The tip to sample distance was kept constant at 100 nm
using a two-pass technique, where the height data is recorded in
tappingmode during the first pass and, in the second pass, the tip
lifts above the surface to an adjustable lift height and scans the
same line while following the height profile recorded in the first
pass. All measurements were made at room temperature with a
RH in the range of 40–65%.
2.3 Gravimetric measurements
Prior to corrosion tests, specimens with a working area of
�15 cm2 were ground to a P1200 SiC finish, degreased in
isopropyl alcohol in an ultrasonic bath and dried in warm air.
High RH tests consisted of 24 h cycles performed in a
saturated water vapour at various RH values (80–90–98% RH)
and temperatures (25–50� 1 8C) during 672 h (28 days) simu-
lated by a humidity condensation cabinet CCK 300 (Dycometal).
Temperature and humidity were verified using digitals thermo-
meter and hygrometer. At the end of the tests, the specimens were
Figure 1. Optical micrographs of test materials: (a) Mg; (b) AZ31;(c) AZ80 and (d) AZ91D
www.matcorr.com
rinsed with deionised water and dried in warm air. The
specimens were weighed before and after the tests using a
Sartorius BP 211D scale with an accuracy of 0.00001 g. Mass
changes per unit of surface area were calculated according to the
expression (Mf �Mi)/A, whereMf is the final mass,Mi the initial
mass and A the exposed surface area.
A comparative study was conducted with the same
magnesium materials immersed in Madrid tap water (pH 8;
100–200mS/cm conductivity at 20 8C; 5.8–34.8mg/L Ca; 1.3–
4.3mg/L Mg; 4–20mg/L Na; zero free chlorine and 1–1.5mg/L
combined chlorine for disinfection). Duplicated tests were
conducted for each specimen to ensure reproducible test results.
2.4 Characterisation of corrosion products
Tested specimens were examined by scanning electronmicroscopy
(SEM) using a JEOL JSM–6400 microscope equipped with Oxford
Link energy-dispersive X-ray (EDX) microanalysis hardware in
Figure 2. Bright field TEM micrographs and electron diffraction
patterns of some of the Al–Mn inclusions in the (a) AZ80 and (b) AZ91Dalloys
� 2011 WILEY-VCH Verlag GmbH & Co. KGaA, Weinheim

328 Arrabal, Pardo, Merino, Merino, Mohedano, and Casajus Materials and Corrosion 2011, 62, No. 4
order to study themorphology and evolution of corrosion products
formed on the surfaces of the alloys. The composition of the
corrosion products was determined by low angle X-ray diffraction
(XRD) using a Philips X’Pert diffractometer (CuKa¼ 1.54056 A).
3 Results
3.1 Microstructural characterisation
3.1.1 SEM/TEM
Plan view optical micrographs of studied materials are presented
in Fig. 1. Commercially pure Mg and the AZ31 alloy consist
of equiaxial grains with dimensions in the range of 40–50 and 5–
100mm, respectively (Fig. 1a and b). The AZ80 and AZ91D
casting alloys show two different solidification microstructures.
The AZ80 alloy reveals a biphasic microstructure with a-Mg
grains and grains with precipitation of a fine lamellar aggregate,
Figure 3. Topographic images, surface potential maps and potential prof
� 2011 WILEY-VCH Verlag GmbH & Co. KGaA, Weinheim
a-MgRb-Mg17Al12 (Fig. 1c). The AZ91D alloy consists of a-Mg
primary dendrites and a partially divorced eutectic a-Mg/b-
Mg17Al12, with the b-phase in the form of coarse particles at the
interdendritic regions (Fig. 1d). The presence of manganese in
the AZ alloys favoured the formation of Al–Mn intermetallic
inclusions with various stoichiometries (Al2Mn, Al3Mn,
Al4Mn, Al11Mn4, Al8Mn5, Al19Mn4 and Al10Mn3) according to
TEM characterisation (Fig. 2). The size of these particles varied
from 1 to 15mm.
3.1.2 Surface potential maps
Topographic images and surface potential maps of the Al–Mn
inclusions and b-phase indicated that both constituents are
cathodic with respect to the magnesium matrix (Fig. 3). The
potential profile across these phases revealed variations above
200mVand below 100mV for the Al–Mn inclusions and b-phase,
respectively. These values suggested a stronger galvanic couple at
iles of (a) AZ31 and (b) AZ91D alloys
www.matcorr.com
Materials and Corrosion 2011, 62, No. 4 Corrosion behaviour of Mg/Al alloys 329
-0.10
-0.05
0.00
0.05
0.10
0.15
-0.10
-0.05
0.00
0.05
0.10
0.00
0.20
0.40
282420161284
2824201612840-0.60
-0.40
-0.20
0.00
0.20
0.40
0.60
Mas
s gai
n (m
g/cm
2 )
Mg AZ31 AZ80 AZ91D
CC 80% RH 25ºC CC 80% RH 50 ºC
Mas
s gai
n (m
g/cm
2 ) CC 90% RH 50 ºCCC 90% RH 25 ºC
Madrid water 22 ºC
Mas
s gai
n (m
g/cm
2 )
CC 98% RH 25 ºC
Time (d)
CC 98% RH 50 ºC
Mas
s gai
n (m
g/cm
2 )
Time (d)
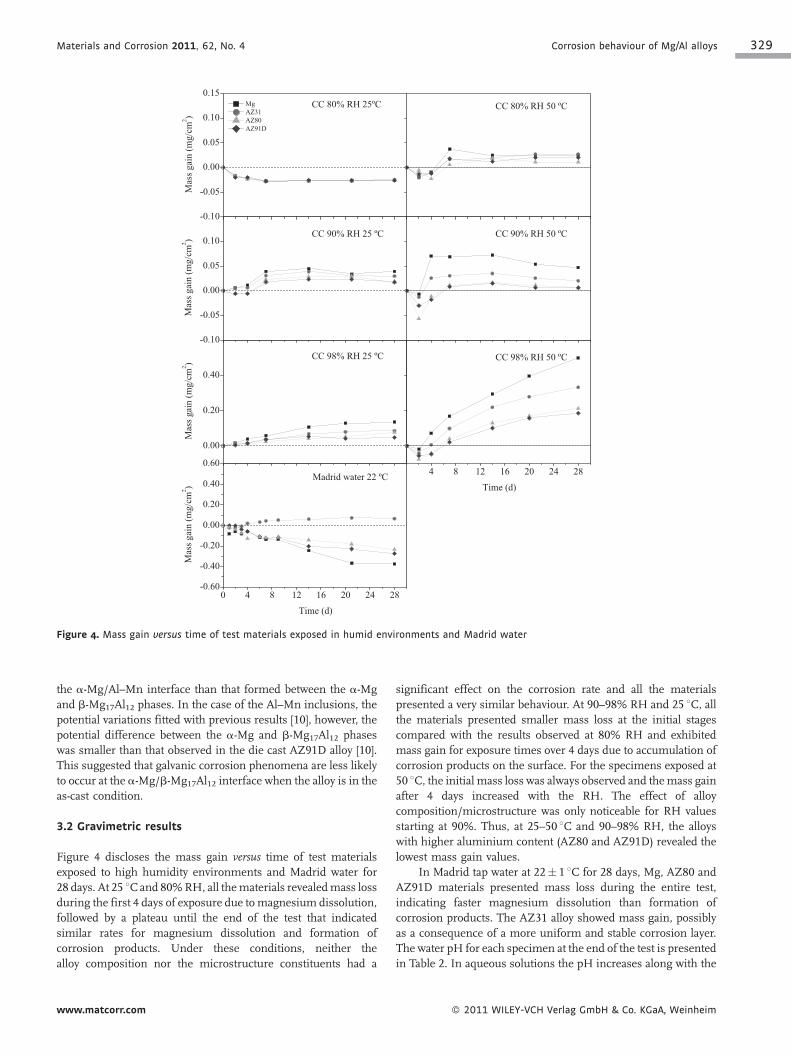
Figure 4. Mass gain versus time of test materials exposed in humid environments and Madrid water
the a-Mg/Al–Mn interface than that formed between the a-Mg
and b-Mg17Al12 phases. In the case of the Al–Mn inclusions, the
potential variations fitted with previous results [10], however, the
potential difference between the a-Mg and b-Mg17Al12 phases
was smaller than that observed in the die cast AZ91D alloy [10].
This suggested that galvanic corrosion phenomena are less likely
to occur at the a-Mg/b-Mg17Al12 interface when the alloy is in the
as-cast condition.
3.2 Gravimetric results
Figure 4 discloses the mass gain versus time of test materials
exposed to high humidity environments and Madrid water for
28 days. At 25 8Cand 80%RH, all thematerials revealedmass loss
during the first 4 days of exposure due to magnesium dissolution,
followed by a plateau until the end of the test that indicated
similar rates for magnesium dissolution and formation of
corrosion products. Under these conditions, neither the
alloy composition nor the microstructure constituents had a
www.matcorr.com
significant effect on the corrosion rate and all the materials
presented a very similar behaviour. At 90–98% RH and 25 8C, allthe materials presented smaller mass loss at the initial stages
compared with the results observed at 80% RH and exhibited
mass gain for exposure times over 4 days due to accumulation of
corrosion products on the surface. For the specimens exposed at
50 8C, the initial mass loss was always observed and themass gain
after 4 days increased with the RH. The effect of alloy
composition/microstructure was only noticeable for RH values
starting at 90%. Thus, at 25–50 8C and 90–98% RH, the alloys
with higher aluminium content (AZ80 and AZ91D) revealed the
lowest mass gain values.
In Madrid tap water at 22� 1 8C for 28 days, Mg, AZ80 and
AZ91D materials presented mass loss during the entire test,
indicating faster magnesium dissolution than formation of
corrosion products. The AZ31 alloy showed mass gain, possibly
as a consequence of a more uniform and stable corrosion layer.
The water pH for each specimen at the end of the test is presented
in Table 2. In aqueous solutions the pH increases along with the
� 2011 WILEY-VCH Verlag GmbH & Co. KGaA, Weinheim
330 Arrabal, Pardo, Merino, Merino, Mohedano, and Casajus Materials and Corrosion 2011, 62, No. 4
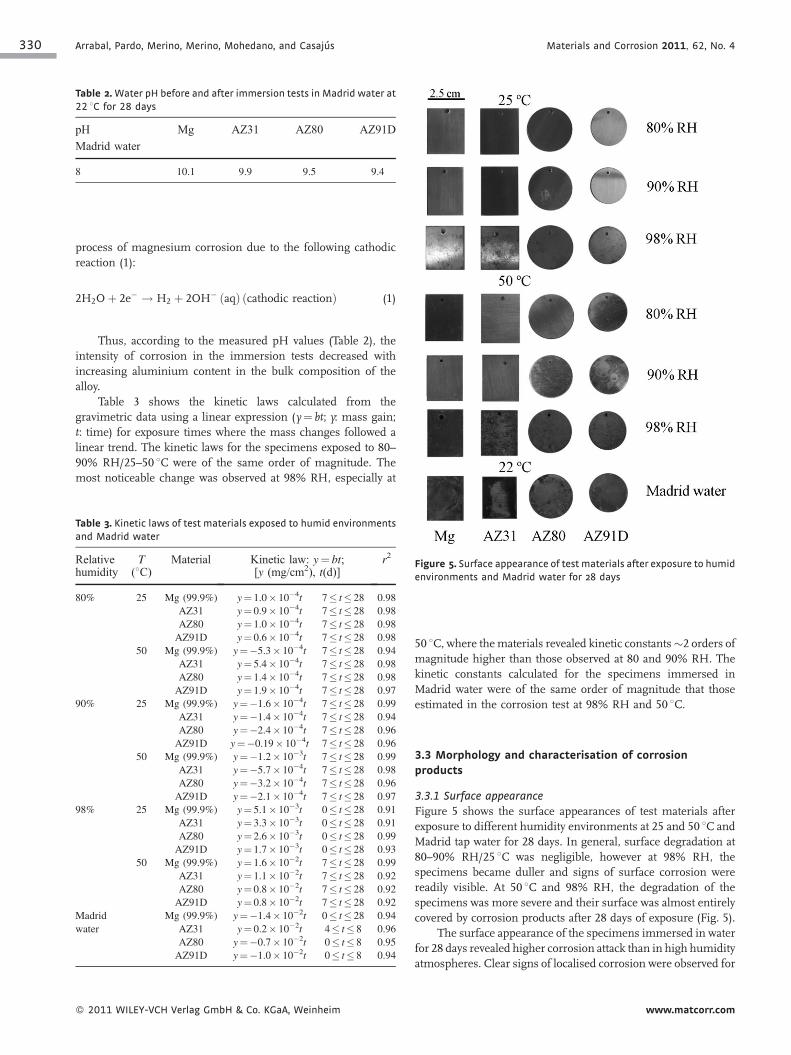
Table 2. Water pH before and after immersion tests in Madrid water at
22 8C for 28 days
pH Mg AZ31 AZ80 AZ91D
Madrid water
8 10.1 9.9 9.5 9.4
process of magnesium corrosion due to the following cathodic
reaction (1):
2H2Oþ 2e� ! H2 þ 2OH� ðaqÞ ðcathodic reactionÞ (1)
Thus, according to the measured pH values (Table 2), the
intensity of corrosion in the immersion tests decreased with
increasing aluminium content in the bulk composition of the
alloy.
Table 3 shows the kinetic laws calculated from the
gravimetric data using a linear expression (y¼ bt; y: mass gain;
t: time) for exposure times where the mass changes followed a
linear trend. The kinetic laws for the specimens exposed to 80–
90% RH/25–50 8C were of the same order of magnitude. The
most noticeable change was observed at 98% RH, especially at
Figure 5. Surface appearance of test materials after exposure to humid
environments and Madrid water for 28 days
Table 3. Kinetic laws of test materials exposed to humid environments
and Madrid water
Relativehumidity
T(8C)
Material Kinetic law: y¼ bt;[y (mg/cm2), t(d)]
r2
80% 25 Mg (99.9%) y¼ 1.0� 10�4t 7� t� 28 0.98
AZ31 y¼ 0.9� 10�4t 7� t� 28 0.98
AZ80 y¼ 1.0� 10�4t 7� t� 28 0.98
AZ91D y¼ 0.6� 10�4t 7� t� 28 0.98
50 Mg (99.9%) y¼�5.3� 10�4t 7� t� 28 0.94
AZ31 y¼ 5.4� 10�4t 7� t� 28 0.98
AZ80 y¼ 1.4� 10�4t 7� t� 28 0.98
AZ91D y¼ 1.9� 10�4t 7� t� 28 0.97
90% 25 Mg (99.9%) y¼�1.6� 10�4t 7� t� 28 0.99
AZ31 y¼�1.4� 10�4t 7� t� 28 0.94
AZ80 y¼�2.4� 10�4t 7� t� 28 0.96
AZ91D y¼�0.19� 10�4t 7� t� 28 0.96
50 Mg (99.9%) y¼�1.2� 10�3t 7� t� 28 0.99
AZ31 y¼�5.7� 10�4t 7� t� 28 0.98
AZ80 y¼�3.2� 10�4t 7� t� 28 0.96
AZ91D y¼�2.1� 10�4t 7� t� 28 0.97
98% 25 Mg (99.9%) y¼ 5.1� 10�3t 0� t� 28 0.91
AZ31 y¼ 3.3� 10�3t 0� t� 28 0.91
AZ80 y¼ 2.6� 10�3t 0� t� 28 0.99
AZ91D y¼ 1.7� 10�3t 0� t� 28 0.93
50 Mg (99.9%) y¼ 1.6� 10�2t 7� t� 28 0.99
AZ31 y¼ 1.1� 10�2t 7� t� 28 0.92
AZ80 y¼ 0.8� 10�2t 7� t� 28 0.92
AZ91D y¼ 0.8� 10�2t 7� t� 28 0.92
Madrid
water
Mg (99.9%) y¼�1.4� 10�2t 0� t� 28 0.94
AZ31 y¼ 0.2� 10�2t 4� t� 8 0.96
AZ80 y¼�0.7� 10�2t 0� t� 8 0.95
AZ91D y¼�1.0� 10�2t 0� t� 8 0.94
� 2011 WILEY-VCH Verlag GmbH & Co. KGaA, Weinheim
50 8C, where thematerials revealed kinetic constants�2 orders of
magnitude higher than those observed at 80 and 90% RH. The
kinetic constants calculated for the specimens immersed in
Madrid water were of the same order of magnitude that those
estimated in the corrosion test at 98% RH and 50 8C.
3.3 Morphology and characterisation of corrosion
products
3.3.1 Surface appearance
Figure 5 shows the surface appearances of test materials after
exposure to different humidity environments at 25 and 50 8C and
Madrid tap water for 28 days. In general, surface degradation at
80–90% RH/25 8C was negligible, however at 98% RH, the
specimens became duller and signs of surface corrosion were
readily visible. At 50 8C and 98% RH, the degradation of the
specimens was more severe and their surface was almost entirely
covered by corrosion products after 28 days of exposure (Fig. 5).
The surface appearance of the specimens immersed in water
for 28 days revealed higher corrosion attack than in high humidity
atmospheres. Clear signs of localised corrosion were observed for
www.matcorr.com
Materials and Corrosion 2011, 62, No. 4 Corrosion behaviour of Mg/Al alloys 331
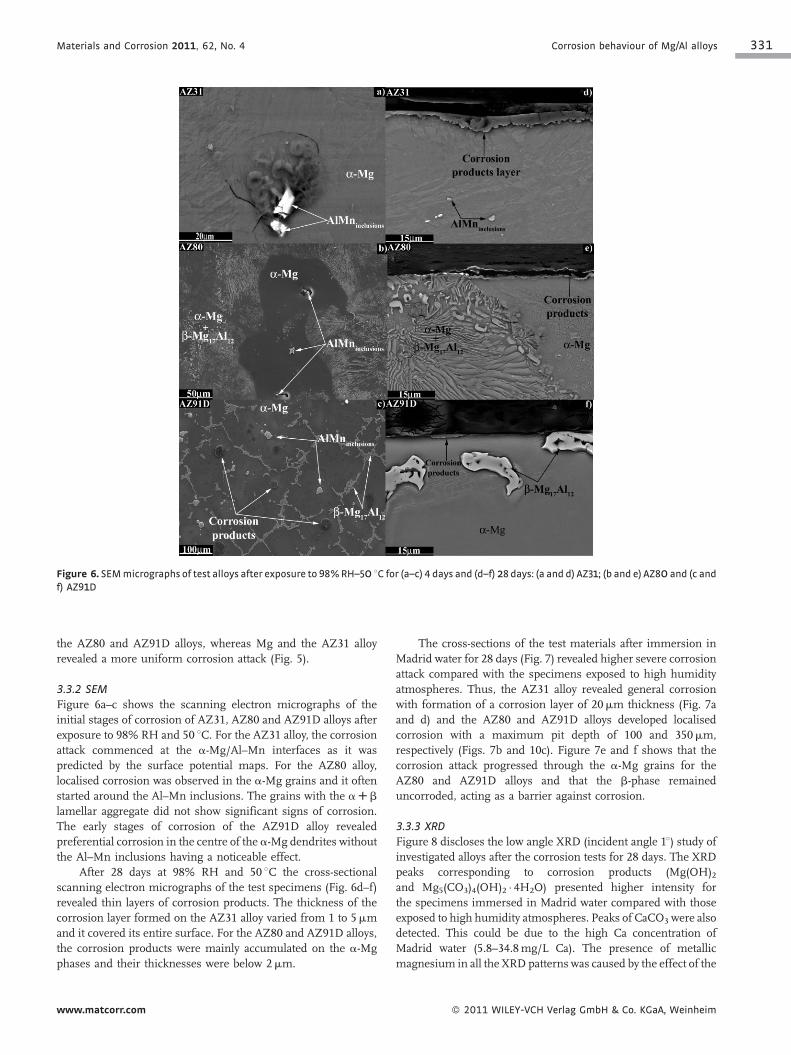
Figure 6. SEMmicrographs of test alloys after exposure to 98%RH–50 8C for (a–c) 4 days and (d–f) 28 days: (a and d) AZ31; (b and e) AZ80 and (c and
f) AZ91D
the AZ80 and AZ91D alloys, whereas Mg and the AZ31 alloy
revealed a more uniform corrosion attack (Fig. 5).
3.3.2 SEM
Figure 6a–c shows the scanning electron micrographs of the
initial stages of corrosion of AZ31, AZ80 and AZ91D alloys after
exposure to 98% RH and 50 8C. For the AZ31 alloy, the corrosionattack commenced at the a-Mg/Al–Mn interfaces as it was
predicted by the surface potential maps. For the AZ80 alloy,
localised corrosion was observed in the a-Mg grains and it often
started around the Al–Mn inclusions. The grains with the aRb
lamellar aggregate did not show significant signs of corrosion.
The early stages of corrosion of the AZ91D alloy revealed
preferential corrosion in the centre of the a-Mg dendrites without
the Al–Mn inclusions having a noticeable effect.
After 28 days at 98% RH and 50 8C the cross-sectional
scanning electron micrographs of the test specimens (Fig. 6d–f)
revealed thin layers of corrosion products. The thickness of the
corrosion layer formed on the AZ31 alloy varied from 1 to 5mm
and it covered its entire surface. For the AZ80 and AZ91D alloys,
the corrosion products were mainly accumulated on the a-Mg
phases and their thicknesses were below 2mm.
www.matcorr.com
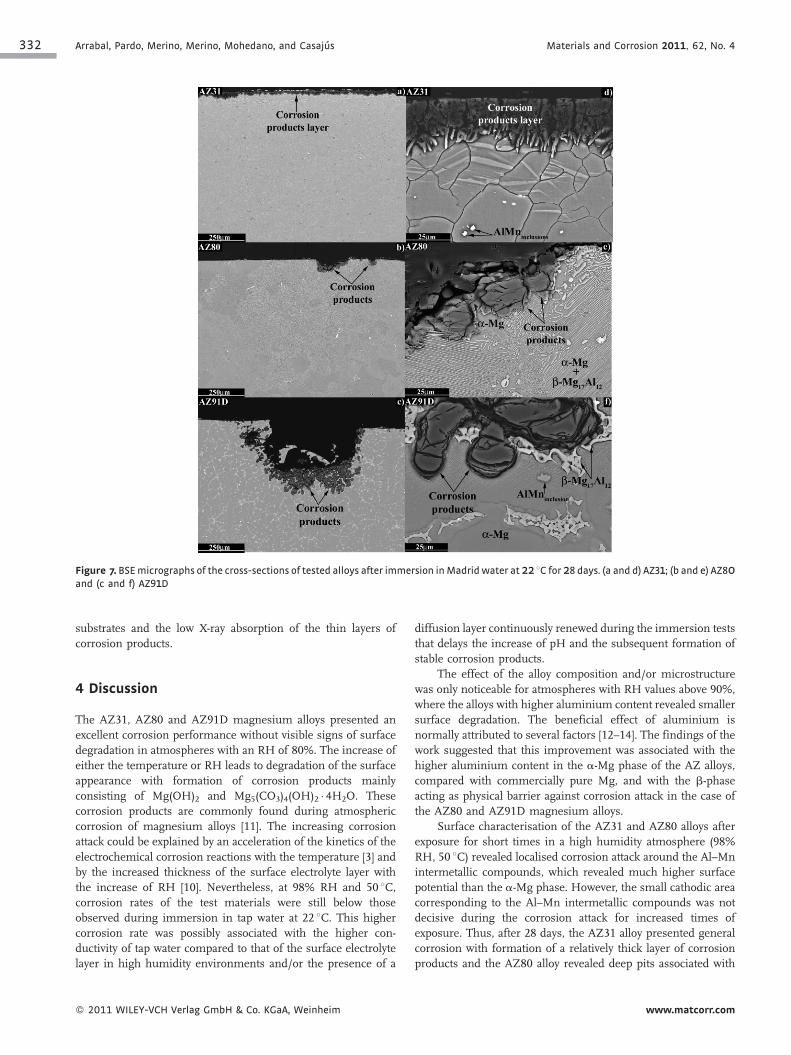
The cross-sections of the test materials after immersion in
Madrid water for 28 days (Fig. 7) revealed higher severe corrosion
attack compared with the specimens exposed to high humidity
atmospheres. Thus, the AZ31 alloy revealed general corrosion
with formation of a corrosion layer of 20mm thickness (Fig. 7a
and d) and the AZ80 and AZ91D alloys developed localised
corrosion with a maximum pit depth of 100 and 350mm,
respectively (Figs. 7b and 10c). Figure 7e and f shows that the
corrosion attack progressed through the a-Mg grains for the
AZ80 and AZ91D alloys and that the b-phase remained
uncorroded, acting as a barrier against corrosion.
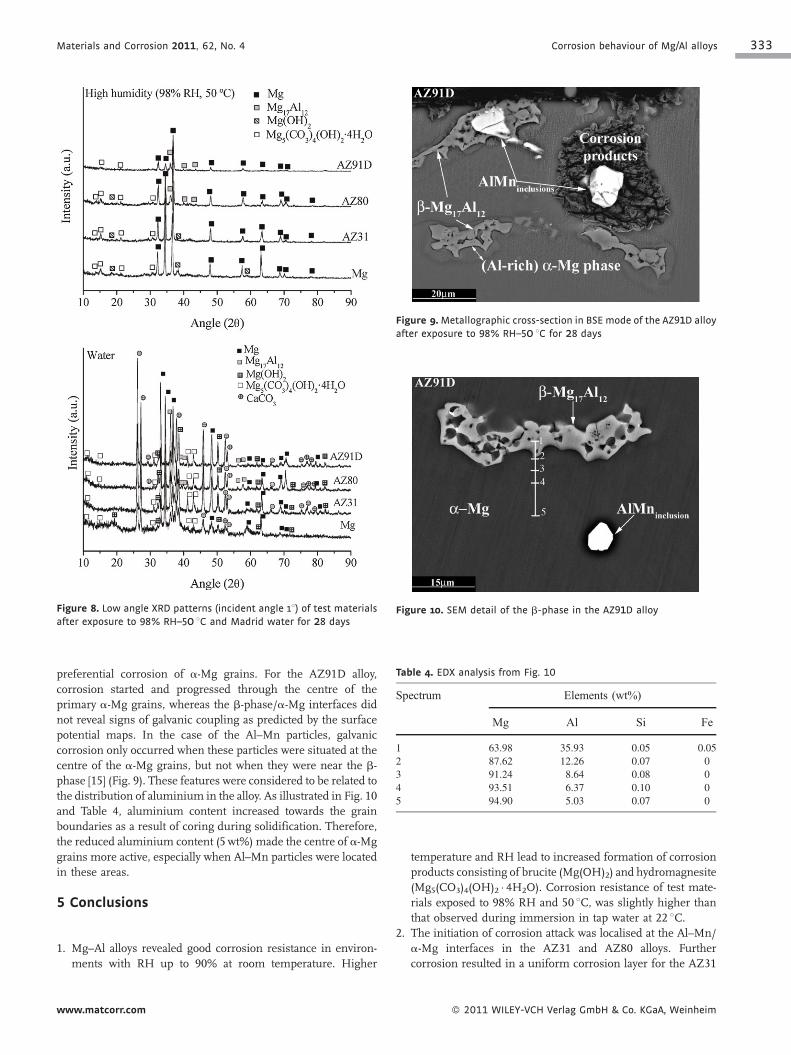
3.3.3 XRD
Figure 8 discloses the low angle XRD (incident angle 18) study ofinvestigated alloys after the corrosion tests for 28 days. The XRD
peaks corresponding to corrosion products (Mg(OH)2and Mg5(CO3)4(OH)2 � 4H2O) presented higher intensity for
the specimens immersed in Madrid water compared with those
exposed to high humidity atmospheres. Peaks of CaCO3 were also
detected. This could be due to the high Ca concentration of
Madrid water (5.8–34.8mg/L Ca). The presence of metallic
magnesium in all the XRD patterns was caused by the effect of the
� 2011 WILEY-VCH Verlag GmbH & Co. KGaA, Weinheim
332 Arrabal, Pardo, Merino, Merino, Mohedano, and Casajus Materials and Corrosion 2011, 62, No. 4
Figure 7. BSEmicrographs of the cross-sections of tested alloys after immersion inMadrid water at 22 8C for 28 days. (a and d) AZ31; (b and e) AZ80and (c and f) AZ91D
substrates and the low X-ray absorption of the thin layers of
corrosion products.
4 Discussion
The AZ31, AZ80 and AZ91D magnesium alloys presented an
excellent corrosion performance without visible signs of surface
degradation in atmospheres with an RH of 80%. The increase of
either the temperature or RH leads to degradation of the surface
appearance with formation of corrosion products mainly
consisting of Mg(OH)2 and Mg5(CO3)4(OH)2 � 4H2O. These
corrosion products are commonly found during atmospheric
corrosion of magnesium alloys [11]. The increasing corrosion
attack could be explained by an acceleration of the kinetics of the
electrochemical corrosion reactions with the temperature [3] and
by the increased thickness of the surface electrolyte layer with
the increase of RH [10]. Nevertheless, at 98% RH and 50 8C,corrosion rates of the test materials were still below those
observed during immersion in tap water at 22 8C. This higher
corrosion rate was possibly associated with the higher con-
ductivity of tap water compared to that of the surface electrolyte
layer in high humidity environments and/or the presence of a
� 2011 WILEY-VCH Verlag GmbH & Co. KGaA, Weinheim
diffusion layer continuously renewed during the immersion tests
that delays the increase of pH and the subsequent formation of
stable corrosion products.
The effect of the alloy composition and/or microstructure
was only noticeable for atmospheres with RH values above 90%,
where the alloys with higher aluminium content revealed smaller
surface degradation. The beneficial effect of aluminium is
normally attributed to several factors [12–14]. The findings of the
work suggested that this improvement was associated with the
higher aluminium content in the a-Mg phase of the AZ alloys,
compared with commercially pure Mg, and with the b-phase
acting as physical barrier against corrosion attack in the case of
the AZ80 and AZ91D magnesium alloys.
Surface characterisation of the AZ31 and AZ80 alloys after
exposure for short times in a high humidity atmosphere (98%
RH, 50 8C) revealed localised corrosion attack around the Al–Mn
intermetallic compounds, which revealed much higher surface
potential than the a-Mg phase. However, the small cathodic area
corresponding to the Al–Mn intermetallic compounds was not
decisive during the corrosion attack for increased times of
exposure. Thus, after 28 days, the AZ31 alloy presented general
corrosion with formation of a relatively thick layer of corrosion
products and the AZ80 alloy revealed deep pits associated with
www.matcorr.com
Materials and Corrosion 2011, 62, No. 4 Corrosion behaviour of Mg/Al alloys 333
Figure 8. Low angle XRD patterns (incident angle 18) of test materials
after exposure to 98% RH–50 8C and Madrid water for 28 days
Figure 9.Metallographic cross-section in BSE mode of the AZ91D alloy
after exposure to 98% RH–50 8C for 28 days
Figure 10. SEM detail of the b-phase in the AZ91D alloy
Table 4. EDX analysis from Fig. 10
Spectrum Elements (wt%)
Mg Al Si Fe
1 63.98 35.93 0.05 0.05
2 87.62 12.26 0.07 0
3 91.24 8.64 0.08 0
4 93.51 6.37 0.10 0
5 94.90 5.03 0.07 0
preferential corrosion of a-Mg grains. For the AZ91D alloy,
corrosion started and progressed through the centre of the
primary a-Mg grains, whereas the b-phase/a-Mg interfaces did
not reveal signs of galvanic coupling as predicted by the surface
potential maps. In the case of the Al–Mn particles, galvanic
corrosion only occurred when these particles were situated at the
centre of the a-Mg grains, but not when they were near the b-
phase [15] (Fig. 9). These features were considered to be related to
the distribution of aluminium in the alloy. As illustrated in Fig. 10
and Table 4, aluminium content increased towards the grain
boundaries as a result of coring during solidification. Therefore,
the reduced aluminium content (5wt%) made the centre of a-Mg
grains more active, especially when Al–Mn particles were located
in these areas.
5 Conclusions
1. M
ww
g–Al alloys revealed good corrosion resistance in environ-
ments with RH up to 90% at room temperature. Higher
w.matcorr.com
temperature and RH lead to increased formation of corrosion
products consisting of brucite (Mg(OH)2) and hydromagnesite
(Mg5(CO3)4(OH)2 � 4H2O). Corrosion resistance of test mate-
rials exposed to 98% RH and 50 8C, was slightly higher than
that observed during immersion in tap water at 22 8C.
2. T he initiation of corrosion attack was localised at the Al–Mn/a-Mg interfaces in the AZ31 and AZ80 alloys. Further
corrosion resulted in a uniform corrosion layer for the AZ31
� 2011 WILEY-VCH Verlag GmbH & Co. KGaA, Weinheim
334 Arrabal, Pardo, Merino, Merino, Mohedano, and Casajus Materials and Corrosion 2011, 62, No. 4
�
alloy and deep pits for the AZ80 alloy due to dissolution of
a-Mg grains. For the AZ91D alloy, corrosion attack progressed
through the centre of a-Mg grains without considerable
galvanic corrosion at the a-Mg/b-Mg17Al12 interfaces. Intense
galvanic couples around the Al–Mn inclusions were only
found in areas with low aluminium content.
3. T
he AZ80 and AZ91D alloys revealed the highest corrosionresistance of all tested materials due to higher aluminium
content in the composition of the alloy and to the b-Mg17Al12phase acting as physical barrier against corrosion.
Acknowledgements: The authors wish to thank MCYT (Project
MAT2006-13179-C02-01-02) and Comunidad deMadrid (ESTRU-
MAT_CM/MAT/77) for the financial support given to this work.
6 References
[1] H. Friedrich, S. Schumann, J. Mater. Process. Technol. 2001,117, 276.
[2] A. Froats, T. K. Aune, D. Hawke, W. Unsworth, J. E. Hillis,Corrosion of Magnesium and Magnesium alloys, Metal Hand-
2011 WILEY-VCH Verlag GmbH & Co. KGaA, Weinheim
book, 9th edn., Vol. 13, ASM International, Materials Park,Ohio, USA, 1987.
[3] N. Le Bozec, M. Jonsson, D. Thierry, Corrosion 2004, 60, 356.[4] P. V. Strekalov, Prot. Met. 1993, 29, 673.[5] M. Jonsson, D. Persson, D. Thierry, Corros. Sci. 2007, 49,
1540.[6] A. Pardo, M. C. Merino, A. E. Coy, R. Arrabal, F. Viejo, E.
Matykina, Corros. Sci. 2008, 50, 823.[7] A. Pardo, M. C. Merino, A. E. Coy, F. Viejo, R. Arrabal, S.
Feliu, Jr., Electrochim. Acta 2008, 53, 7890.[8] D. Eliezer, P. Uzan, E. Aghion, J. Mater. Sci. 2003, 419–422,
857.[9] N. D. Tomashov, Theory and Protection of Metals: The Science
of Corrosion, The Macmillan Company, New York, 1966.[10] M. Jonsson, D. Persson, R. Gubner, J. Electrochem. Soc. 2007,
154, C684.[11] S. Feliu, Jr., M. C. Merino, R. Arrabal, A. E. Coy, E. Matykina,
Surf. Interface Anal. 2009, 41, 143.[12] M. Liu, P. J. Uggowitzer, A. V. Nagasekhar, P. Schmutz, M.
Easton, G. Song, A. Atrens, Corros. Sci. 2009, 51, 602.[13] R. Ambat, N. N. Aung, W. Zhou, Corros. Sci. 2000, 42, 1433.[14] S. J. Splinter, N. S. McIntyre, Surf. Sci. 1994, 314, 157.[15] M. Jonsson, D. Persson, C. Leygraf, Corros. Sci. 2008, 50,
1406.
(Received: September 29, 2009)
(Accepted: October 26, 2009)
W5538
www.matcorr.com
Copyright © 2022 FDOKUMEN