Correcting for bias in estimation of quantitative trait loci effects
ARTICLE
Correcting for Purifying Selection:An Improved Human Mitochondrial Molecular Clock
Pedro Soares,1 Luca Ermini,1,2 Noel Thomson,3 Maru Mormina,1,4 Teresa Rito,5 Arne Rohl,6
Antonio Salas,7 Stephen Oppenheimer,8 Vincent Macaulay,3 and Martin B. Richards1,*
There is currently no calibration available for the whole human mtDNA genome, incorporating both coding and control regions.
Furthermore, as several authors have pointed out recently, linear molecular clocks that incorporate selectable characters are in any
case problematic. We here confirm a modest effect of purifying selection on the mtDNA coding region and propose an improved mole-
cular clock for dating human mtDNA, based on a worldwide phylogeny of > 2000 complete mtDNA genomes and calibrating against
recent evidence for the divergence time of humans and chimpanzees. We focus on a time-dependent mutation rate based on the entire
mtDNA genome and supported by a neutral clock based on synonymous mutations alone. We show that the corrected rate is further
corroborated by archaeological dating for the settlement of the Canary Islands and Remote Oceania and also, given certain phylogeo-
graphic assumptions, by the timing of the first modern human settlement of Europe and resettlement after the Last Glacial Maximum.
The corrected rate yields an age of modern human expansion in the Americas at ~15 kya that—unlike the uncorrected clock—matches
the archaeological evidence, but continues to indicate an out-of-Africa dispersal at around 55–70 kya, 5–20 ky before any clear archaeo-
logical record, suggesting the need for archaeological research efforts focusing on this time window. We also present improved rates for
the mtDNA control region, and the first comprehensive estimates of positional mutation rates for human mtDNA, which are essential for
defining mutation models in phylogenetic analyses.
Introduction
The use of genetic data to discern aspects of human prehis-
tory, known as archaeogenetics,1 is becoming increasingly
important in unravelling the human past. For phylogeo-
graphic analysis, which combines phylogenetic and
geographic evidence, the nonrecombining mtDNA and Y
chromosome play a pivotal role, albeit most successfully
in combination with other lines of evidence within
a model-defined framework.2 One important aspect of
the phylogeographic approach in both haploid marker
systems is the inclusion of a time frame based on the
molecular clock, which makes it possible to estimate the
age of lineages and often their dispersal times, without
the need for an assumed demographic scenario.3
In recent years, the sequencing of complete mtDNA
genomes has resulted in a huge increase in the resolution
of the worldwide mtDNA tree, and in the potential
concomitant power of phylogeographic analyses.4,5 The
tree topology confirmed that all human mtDNAs coalesce
in Africa6,7 and that all lineages that evolved outside Africa
descend from two branches, referred to as haplogroups M
and N, of the African haplogroup L3.6–8 It also shed further
light on the ‘‘out of Africa’’ dispersal process and the first
colonization of each region through the detection of
region-specific basal M and N lineages along the ‘‘southern
coastal route’’6,7,9–18 and also on subsequent (and much
740 The American Journal of Human Genetics 84, 740–759, June 12,
more recent) prehistoric migrations.19–23 However, many
of the conclusions drawn depend to a considerable extent
on the aforementioned molecular clock.
The most commonly used mutation rate for human
mtDNA genomes in recent years has been a coding-region
substitution rate (positions 577 to 16023 in the reference
sequence24) of 1.26 3 10�8 base substitution per nucleo-
tide per year of Mishmar et al.25 This mutation rate
assumes a linear relation between the accumulation of
substitutions and time, independent of any selection.
One problem with this rate is that it omits a significant
fraction of useful information from the noncoding parts
of the molecules (about a third of the variation), which
could be usefully employed to increase the precision of
age estimates. However, the most important issue that
has recently come to the fore has been the effect of selec-
tion.26–29
The mtDNA phylogeny seems to show a higher propor-
tion of synonymous mutations in ancient than in young
branches—i.e., young branches present a higher propor-
tion of nonsynonymous mutations in protein-coding
genes and substitutions in RNA genes.30–32 The most plau-
sible explanation for this trend is purifying selection acting
gradually over time on weakly deleterious characters, or
a recent relaxation of selective constraints.30,31 The muta-
tion rate and the substitution rate are expected to be equal
under neutral evolution,33 but slightly deleterious
1Institute of Integrative and Comparative Biology, Faculty of Biological Sciences, University of Leeds, Leeds LS2 9JT, UK; 2Laboratorio di Archeo-Antropo-
logia molecolare/DNA antico, Universita di Camerino, Camerino 62032, Italy; 3Department of Statistics, University of Glasgow, Glasgow G12 8QQ, UK;4Leverhulme Centre for Human Evolutionary Studies, University of Cambridge, Cambridge CB2 1QH, UK; 5Liverpool School of Tropical Medicine, Univer-
sity of Liverpool, Liverpool L3 5QA, UK; 6Fluxus Technology, Clare, Suffolk CO10 8NN, UK; 7Unidade de Xenetica, Instituto de Medicina Legal, and
Departamento de Anatomıa Patologica y Ciencias Forenses, Facultad de Medicina de la Universidad de Santiago de Compostela, A Coruna, Santiago de
Compostela 15782, Galicia, Spain; 8School of Anthropology, University of Oxford, Oxford OX2 6PN, UK
*Correspondence: [email protected]
DOI 10.1016/j.ajhg.2009.05.001. ª2009 by The American Society of Human Genetics. All rights reserved.
2009
mutations can persist for some time in the population with
a lower fixation probability, elevating the transient muta-
tion rate over the long-term substitution rate. (Confus-
ingly, a misinterpretation of the same trend resulted in
a proposal that the excess of nonsynonymous mutations
in young branches was related to climatic adaptations,25
but in fact the excess occurs in all young clades indepen-
dently of location.31)
The potential time dependency of the mutation rate in
evolutionary systems has also been discussed by Ho
et al.34–36 and Penny,37 who argued that the mutation
rate presents a vertically translated exponential decay
curve34 or a ‘‘J-shaped curve’’37. In other words, the muta-
tion rate accelerates from a long-term rate in interspecific
phylogenetic relationships to a higher rate nearer the
present. A similar phenomenon was also proposed to
explain the differences between the faster pedigree rates
and the rate obtained from phylogenetic studies in the
control region of mtDNA.38 However, the shape of the
curve may also be explained by saturation and even
sequencing errors.34
A possible consequence of this is that the age of young
clades could be overestimated because of their higher
proportion of nonsynonymous and other selectable char-
acters. A new calibration for human mtDNA genomes
has therefore been proposed, based on the rate of accumu-
lation of synonymous mutations, thereby avoiding the
selection drawback.31 However, this rate uses an even
smaller fraction of the mtDNA genome, reducing the preci-
sion even further. Moreover, the lack of fit between this
rate and a number of well-established phylogeographic
patterns, such as those set up in Europe at the end of the
last glaciation, leads to the suspicion that it may be an
overestimate.
Endicott and Ho39 recently attempted a recalibration
using Bayesian estimation but assuming several highly
debatable intraspecific calibration points, therefore incor-
porating assumptions into the estimation that a calibrated
rate would preferably be employed to test. They did not
analyze the time dependency of the rate, they did not
provide either a time-dependent rate or an estimate of
the rate for the whole mtDNA molecule, and neither their
assumption that it is necessary to analyze different parti-
tions separately when estimating divergence times nor
their stipulation of intraspecific calibration points stands
up to scrutiny. Even more recently, Henn et al.40 made
the first attempt to characterize the mutation-rate curve
of human mtDNA, although this suffers from the same
weakness regarding calibration-point assumptions.
A calibration that corrects for the evident time depen-
dency of the mtDNA mutation rate is urgently needed in
order to re-establish the credibility of mtDNA in human
evolutionary research, and we therefore addressed this
need in this study. We first reconstructed the global
mtDNA tree by using > 2000 complete mtDNA genomes
and assessed the variation of different classes of mutation
at different time depths, in order to test the time depen-
The Am
dency of the mutation rate. We then recalibrated the
mtDNA molecular clock by accounting for the effect of
time depth (without any prior assumption on intraspecific
calibration points), incorporating the most recent fossil
evidence for the time of the Homo-Pan split. We also inde-
pendently estimated new synonymous mutation and
control-region rates for comparison and an internal
control. Finally, we reassessed a number of phylogeo-
graphic aspects of human evolution in order to cross-check
the new chronology.
Material and Methods
Data SetWe compiled a database containing published complete mtDNA
sequences from NCBI with the Geneious software. These included
the complete mtDNA sequences from several papers6–9,11–25,41–52
and several deposited by Family Tree. We excluded some sets of
sequences available at the beginning of this analysis10,53 because
some probably contained errors12,54 and one was not entirely
produced by direct sequencing.55 Additionally, we added 176
unpublished sequences produced by the authors when we began
this work, some of which have been subsequently published.56 A
list of the published complete mtDNA genomes used is shown
in Table S1, available online. A total of 2196 complete mitochon-
drial genomes were used in the final analyses.
For comparative and calibration purposes, we used two
sequences of Pan troglodytes,57,58 one of Pan paniscus,58 and two
of Gorilla.58,59 Additionally, all of the available complete mtDNA
genomes from primates were retrieved from NCBI, again with
the Geneious software. A list is shown in Table S2. We later
included the complete mtDNA sequence of the Neanderthal for
comparison.60
Phylogenetic ReconstructionWe constructed phylogenetic trees by using the reduced-median
algorithm61 of the Network 4 software and using all the substitu-
tion information in the molecule (except for 16182C, 16183C,
and 16194C in polycytosine tracts containing the 16189C variant
because they are inconsistently reported in the literature). The
9 bp deletion was also included. We built three trees indepen-
dently, corresponding to macrohaplogroups M, N, and remaining
African L sequences, because of the size of the data set.
After an initial run, we summed the statistics (counts of each
mutation) obtained for each tree and used them to weight the
characters from 1 to 99 with an inverted linear relation against
the number of occurrences in the statistics, where a weight of 1
corresponded to the most common character in the statistics
(16519) and a weight of 99 to the singletons.
We used the values of the statistics to decide which mutations
happened multiple times in the reticulations. Additionally, we
calculated values of r62 for the hypothetical clades or paragroups
in the vertices of the reticulation in order to decide which one
was likely to be older and thereby the polarity of the mutation
(parallelism versus reversion).
We excluded some sequences that generated major reticulations
(probably as a result of mixing fragments between samples). The
errors in some of those sequences have since been confirmed by
resequencing.63 Combining the three trees yielded a final single
tree of 2196 sequences.
erican Journal of Human Genetics 84, 740–759, June 12, 2009 741
Classification of MutationsAfter the phylogenetic reconstruction, we classified all the muta-
tions in the tree as control region (all the mutations present
outside the coding region, encompassing positions 16024–576),
12S rDNA, 16S rDNA, tDNA, synonymous transition, synonymous
transversion, nonsynonymous mutation (this class also included
the synonymous/nonsynonymous mutations in the overlapping
genes ATP8 and ATP6 because evolutionarily they would have
been selected on the basis of the amino acid change), and other
(all remaining noncoding positions not placed into any of the
previous categories).
Diversity Plots for the Comparison of the
Accumulation of Synonymous and Total MutationsFor each of the nodes in the final tree, we calculated a diversity
value (with the r statistic62) for each category of mutation. This
allowed us to compare the accumulation of one type of mutation
with any other kind for the same time depth (i.e., diverging from
the same nodes). The synonymous clock, because it should not be
affected to any great extent by selection effects, should approach
linearity. We compared the values of r for every node in the tree
with the proportion of the overall r represented by synonymous
mutations (‘‘the synonymous r proportion’’: synonymous r
divided by overall r). If the overall clock is evolving neutrally,
this latter proportion will be constant on average (for all values
of overall r). (We excluded mutations at position 16519, because
the mutation rate at this site was so disproportionately fast in
comparison with the rest of the molecule that its evolutionary
history was sometimes difficult to track.) We modeled in R64 the
average synonymous r proportion as a Gompertz function of
the overall r with least-squares. However, the data for the different
nodes are correlated and the variance is not constant, so a grouping
procedure was employed in an attempt to deal with this. Data
points were sorted by overall r and averaged, from high overall
r downward, so as to limit (below a threshold) the variance in
the synonymous r proportion as estimated assuming we were
estimating a binomial proportion with independent draws.
Saturation CurvesThe absolute frequencies for each position that we obtained
by counting occurrences on the tree can help us to shed light
on the processes of saturation along long branches. All of the
mutations we counted would correspond to independent
mutation events in a tree where the level of saturation is low. If
saturation were high, there would be many undetectable ‘‘hidden
mutations,’’65 which could account (entirely or in part) for the
‘‘J-shaped curve’’ that has been attributed to purifying selection.
To test the extent of saturation, we randomly selected substitu-
tions from the pool of total mutations, simulating the occurrence
of mutations in the mitochondrial genome, according to their
relative mutation rates. We assumed that the absolute frequencies
of occurrences of each mutation in the tree reflected the relative
mutation rate of that specific position. Ne mutations selected
randomly in a specific order would reflect Ne mutations expected
to occur on the evolution of a given mitochondrial sequence.
Because of the rapid evolution of the mitochondrial genome,
recurrences at a specific position should be frequent, and
a specific substitution could occur n times in the total Ne substi-
tutions.
A transition at a given nucleotide position occurring twice
within the evolution of a single sequence—that is, an occurrence
742 The American Journal of Human Genetics 84, 740–759, June 12,
and a reversion of the position back into its original state—results
in two hidden mutations in the evolution of the sequence. Given
that Ne is the total number of mutations occurring in the simula-
tions, then No is the observed number of mutations, so that Ne >
No. This theoretical relation can be expressed mathematically for
different values of Ne and No. Then, given Ne we can find No, and
vice versa. Saturation-rate curves ( y ¼ a$x/(bþx)) presented the
best fit for the data and were obtained with the CurveExpert
v1.3 software.
Variation at each position is not always binary, because there
are four possible bases in each position, and substitutions can be
transitions or transversions. This was taken into account by
considering that if a position underwent a transversion and then
a transition (or vice versa) in the simulation, we would only count
it as one occurrence, because we would only be able to trace the
transversion when comparing the initial sequence (state 0) and
the final sequence (state N). The same would happen if the posi-
tion underwent a transversion and more than one transition (we
would still be able to trace only one transversion).
We performed the simulations independently for different
classes of mutations, for two reasons: one was that we made
different assumptions in defining the portion of the mutation
pool that we used (see below), and the second, more important,
was related to the fact that we are mainly interested in observing
the diverging variation, due to saturation, of the branch length
for different classes of mutations in time. For simulations on
rDNAs, tDNAs, nonsynonymous mutations, and control-region
mutations, we used only mutations that were older than an overall
r ¼ 4, to avoid the proposed preponderance of weakly deleterious
mutations in young branches, and younger than r ¼ 18 (broadly
corresponding to the age in mutations of macrohaplogroups M
and N), to avoid a possible high degree of saturation in the deeper
parts of the tree. For synonymous mutations, we used mutations
that were younger than r ¼ 18, because selection should not be
an issue for these. We performed all of the simulations for each
type of mutation at least six times, until the shape of the curve
did not change with further analyses.
Is this procedure justified? Although some saturation exists in
the selected part of the tree, the relative mutation rate per position
obtained there should not be very misleading; however, it can be
relevant for the fastest sites. Considering the fastest site in the
analysis, 152 (we excluded position 16519, the fastest of all,
from the main analyses), the relative mutation rate is relatively
stable, whatever the portion of the tree considered, even when
comparing substitutions in regions where saturation should be
an issue (the older, longer branches) with substitutions within
young nodes. The frequency of mutations at the 152 position
within the total pool of control-region mutations is 4.59%
in the total tree, 4.54% considering nodes with r < 20, 4.53% in
r < 15, 4.51% in r < 10, 4.44% in r < 5, and 4.54% in nodes
with r < 3. Using the relative mutation rate obtained, we can
calculate a probability that a given mutation happens more than
once per branch in a specific branch length. We used a section
comprising branches between a r of 4 and 18 (an average of
14 mutations per branch). The probability that a substitution in
position 152 happens more than once in a branch length of
14 mutations is a low 1.3 in 100—and this value does not take
into account the fact that the majority of the branches are sub-
structured. Considering that this is the position where saturation
should be felt the most strongly, it seems unlikely that the relative
mutation rates and the proportions in the pool of mutations are
highly underestimated for the fast sites.
2009
We applied the saturation curves (providing a value for expected
mutations from the value of observed mutations) to the split
between the modern human sequences and the Neanderthal,
and, with due caution, to the split between the bonobo and the
chimpanzee. (The relative mutation rates at each position are
unlikely to be exactly the same but, considering the similarity of
their mtDNA genomes, it seems reasonable to assume the curves
as general models of saturation.)
Maximum-Likelihood Analysis
and Calibration PointsWe used a set of 193 human complete mtDNA sequences selected
from the previous tree to represent all of the main branches both
within and outside Africa, with two chimpanzee sequences and
a bonobo sequence, to construct a maximum likelihood (ML) tree
and estimate the rate of the mtDNA clock. We used PAML 3.13,66
assuming the HKY85 mutation model with gamma-distributed
rates (approximated by a discrete distribution with 32 categories)
and eight partitions. Additionally, we performed the analysis
with the TN93 model to test for a significant improvement in their
performance. The partitions were the following: one corresponded
to the rDNA sequences (12S and 16S rDNA), one to the tDNA
sequences, one to the first and second positions of the codons of
the protein-coding genes (broadly similar to the nonsynonymous
mutations), one to the third position of the codons (broadly equiv-
alent to the synonymous mutations), and one to noncoding
regions outside the control region; finally, the control region was
divided into three sections: hypervariable segment-I (HVS-I) (posi-
tions 16051 to 16400), HVS-II (positions 68 to 263), and remainder.
As in the classification of mutations, the overlapping region
between ATP8 and ATP6 was integrated in the nonsynonymous
partition. We performed the analysis in two ways: (1) by using
the entire molecule, and (2) by using only the coding region but
including the Gorilla sequences where the alignment of some
stretches of the control region was not completely reliable.
For an estimation of the synonymous clock, we used PAML to
calculate a mutation rate per possible synonymous mutation
under the mitochondrial genetic code, assuming a single value
for the dN/dS ratio (ratio of nonsynonymous to synonymous
mutations) and using an alignment containing only the protein-
coding genes, with the ND6 gene readjusted to present the same
reading direction as the other genes. In order for nonsynonymous
mutations not to interfere with the calculation of the synonymous
clock (as a result of differential distribution across the tree), we
manually excluded the nonsynonymous substitutions from the
alignment and replaced them with the ancestral base pair.
For our calibration point, we used the Homo-Pan divergence.
Recent calibrations have assumed a species split of 6 mya, with
an additional 0.5 My for lineage coalescence.25,31 In the last few
years, however, fossil evidence has mounted for a split time closer
to 7 mya, with an approximate age of 6.5–7.4 mya for Sahelanthro-
pus tchadensis,67–69 5.7–6.2 mya for Orrorin tugenensis,70,71 and
5.2–5.8 mya for Ardipithecus kadabba,72,73 all of which have been
argued to be either early hominins or close in time to the homi-
nin-chimp split on a sister branch.74–77 On the basis of the age
of Sahelanthropus tchadensis, Benton and Donoghue78 have recom-
mended that 7 mya be taken as a recommended lower bound. (The
discoverers of Orrorin tugenensis in fact claim an age for the split of
considerably earlier than 7 mya,71 raising questions regarding
older estimates of 10.5–13.5 mya obtained when nonprimate
calibration points were used in molecular data,79 but the weight
The Am
of the molecular evidence argues against this.) The consensus of
molecular evidence for a split 5–6 mya80 therefore seems increas-
ingly likely to be slightly too recent,76,81 and can be at least in
part explained by the predominant use of minimal estimates (or
underestimates) for fossil divergence times deeper in the primate
phylogeny, because of the nature of the fossil record.78 Recent esti-
mates based on large-scale genome sequencing that use more real-
istic divergence times (e.g., for Homo-Pongo) estimate Homo-Pan
to > 6.3 mya, albeit with a possible hybridization event a little
more recently.82 The discovery of a possible fossil gorilla ancestor,
Chororapithecusabyssinicus,datingto~10–10.5mya83 andapossible
independent line diverging from this ancestor, Nakalipithecus
nakayamai, dating to 8.7–9.6 mya,84 also, by implication, make
more likely a split in the Pan-Homo branch of ~6–7 mya, rather
than 5–6 mya.
For our calibration, we therefore assumed a human-chimpanzee
species split of 6.5 mya, with an additional estimated 0.5 My for
mtDNA lineage coalescence. In order to check the impact of
such an age on the split time of other nodes in the primate
phylogeny, we built a coding-region mtDNA tree containing 31
sequences of 23 different primate species, with MrBayes 3.12,85
and we applied the same parameters we used to calculate the
molecular clock on this tree in PAML.
Human mtDNA Trees and ML Age EstimatesIn order to date all of the nodes in the human mtDNA tree, we built
six mtDNA trees from published data by using the reduced median
(RM) algorithm of Network 4.5, and performed the ML branch-
length analysis in PAML 3.1366 with the eight partitions defined
before and the HKY85 mutation model with gamma-distributed
rates (approximated by a discrete distribution with 32 categories).
The first tree contained all the African L sequences (including the
North African haplogroups U6 and M1), as well as some additional
M, N, R, and U sequences to help establish the branching structure.
The second mainly contained East Asian haplogroup M sequences.
The third contained all Asian N (including R) sequences. The fourth
contained all Native American haplogroups along with the closest
related northeast Asian sequences in the data set. The fifth con-
tained all M, N, and R basal haplogroups from South Asia. The sixth
contained the European data set (excluding North American data).
As for the first, each of the remaining five trees included a few addi-
tional sequences from missing haplogroups to help establish the
branching structure.
Results
Worldwide mtDNA Tree
The topology of our worldwide mtDNA tree matched pub-
lished trees in most respects, with certain minor excep-
tions of detail. Within haplogroup N, the only instance
of a different branching structure was in the separation
of the putative haplogroup B6 from other members of hap-
logroup B (defined by a transition at the fast site 16189 and
a 9 bp deletion in the COII-tRNALys intergenic region;86
instead, it grouped with R11 through 16189 and 12950,
because 12950 is much slower (three occurrences) in the
tree than the 9 bp deletion (16 occurrences).
Within haplogroup M, M219 lost one of the subbranches
of M21b that shared the M21-defining mutation, at posi-
tion 11482, as well as mutations at positions 709, 15924,
erican Journal of Human Genetics 84, 740–759, June 12, 2009 743
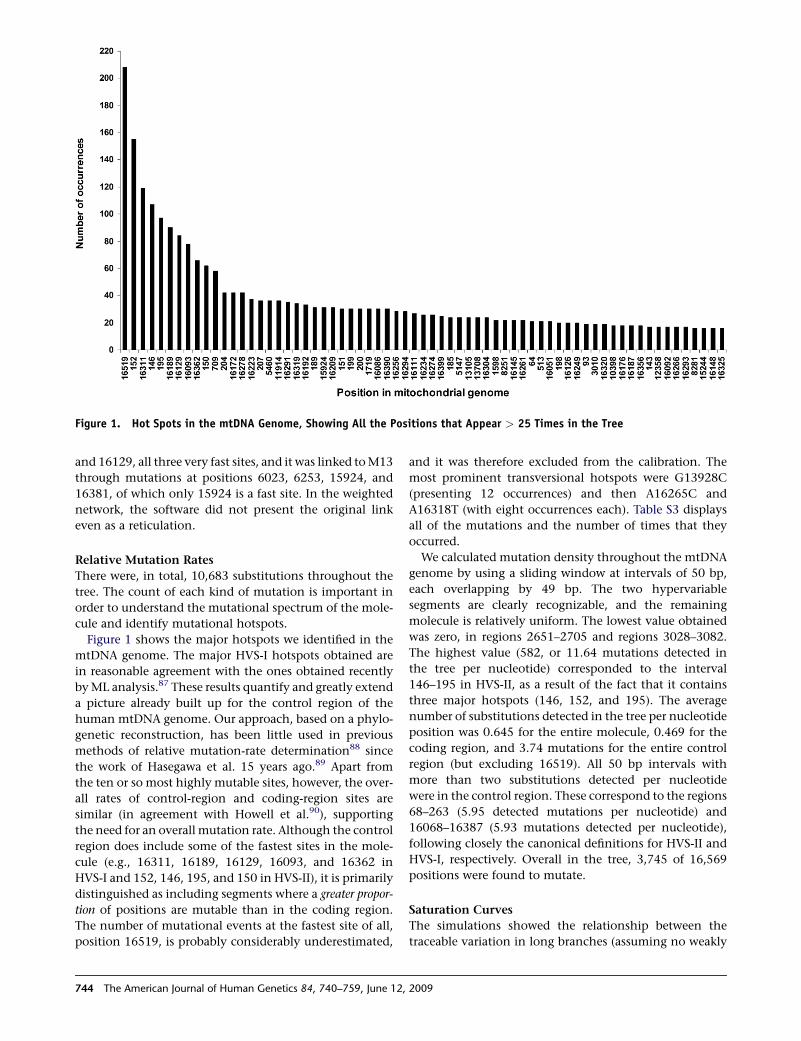
Figure 1. Hot Spots in the mtDNA Genome, Showing All the Positions that Appear > 25 Times in the Tree
and 16129, all three very fast sites, and it was linked to M13
through mutations at positions 6023, 6253, 15924, and
16381, of which only 15924 is a fast site. In the weighted
network, the software did not present the original link
even as a reticulation.
Relative Mutation Rates
There were, in total, 10,683 substitutions throughout the
tree. The count of each kind of mutation is important in
order to understand the mutational spectrum of the mole-
cule and identify mutational hotspots.
Figure 1 shows the major hotspots we identified in the
mtDNA genome. The major HVS-I hotspots obtained are
in reasonable agreement with the ones obtained recently
by ML analysis.87 These results quantify and greatly extend
a picture already built up for the control region of the
human mtDNA genome. Our approach, based on a phylo-
genetic reconstruction, has been little used in previous
methods of relative mutation-rate determination88 since
the work of Hasegawa et al. 15 years ago.89 Apart from
the ten or so most highly mutable sites, however, the over-
all rates of control-region and coding-region sites are
similar (in agreement with Howell et al.90), supporting
the need for an overall mutation rate. Although the control
region does include some of the fastest sites in the mole-
cule (e.g., 16311, 16189, 16129, 16093, and 16362 in
HVS-I and 152, 146, 195, and 150 in HVS-II), it is primarily
distinguished as including segments where a greater propor-
tion of positions are mutable than in the coding region.
The number of mutational events at the fastest site of all,
position 16519, is probably considerably underestimated,
744 The American Journal of Human Genetics 84, 740–759, June 12
and it was therefore excluded from the calibration. The
most prominent transversional hotspots were G13928C
(presenting 12 occurrences) and then A16265C and
A16318T (with eight occurrences each). Table S3 displays
all of the mutations and the number of times that they
occurred.
We calculated mutation density throughout the mtDNA
genome by using a sliding window at intervals of 50 bp,
each overlapping by 49 bp. The two hypervariable
segments are clearly recognizable, and the remaining
molecule is relatively uniform. The lowest value obtained
was zero, in regions 2651–2705 and regions 3028–3082.
The highest value (582, or 11.64 mutations detected in
the tree per nucleotide) corresponded to the interval
146–195 in HVS-II, as a result of the fact that it contains
three major hotspots (146, 152, and 195). The average
number of substitutions detected in the tree per nucleotide
position was 0.645 for the entire molecule, 0.469 for the
coding region, and 3.74 mutations for the entire control
region (but excluding 16519). All 50 bp intervals with
more than two substitutions detected per nucleotide
were in the control region. These correspond to the regions
68–263 (5.95 detected mutations per nucleotide) and
16068–16387 (5.93 mutations detected per nucleotide),
following closely the canonical definitions for HVS-II and
HVS-I, respectively. Overall in the tree, 3,745 of 16,569
positions were found to mutate.
Saturation Curves
The simulations showed the relationship between the
traceable variation in long branches (assuming no weakly
, 2009

Figure 2. mtDNA Saturation Curves(A) Control-region mutations.(B) Synonymous mutations.
deleterious mutations) (No) and total hypothetical varia-
tion, including the hidden variation in those branches
(Ne). Saturation-rate curves were selected from the Curve
Expert v1.3 software and corresponded to the following:
No ¼ 139.555 3 Ne / (162.432 þ Ne), with R2 ¼ 0.9990,
for the control region obtained in the range of 0–100
observed mutations (No) (Figure 2A);
No ¼ 242.70155 3 Ne / (241.82115 þ Ne), with R2 ¼0.9983, for the nonsynonymous mutations obtained
in the range of 0–100 observed mutations (No);
No ¼ 260.05817 3 Ne / (326.27167 þ Ne), with R2 ¼0.9990, for the rDNA mutations obtained in the range
of 0–70 observed mutations (No);
No ¼ 106.85678 3 Ne / (106.02999þNe), with R2 ¼0.9990, for the tDNA mutations obtained in the range
of 0–50 observed mutations (No);
No ¼ 1900.7636 3 Ne / (2030.1489 þ Ne), with R2 ¼0.9997, for the synonymous mutations obtained in
the range of 0–1000 observed mutations (No)
(Figure 2B).
These saturation curves allowed us to test the effect of
saturation on the increase or decrease in variation of
each class of mutation and the overall number of hidden
mutations in r calculations, as described in the next
section.
Diversity and Purifying Selection: The Change
in the Fraction of Synonymous Mutations over Time
Only one class of mutation is likely not to be under signif-
icant selection: the synonymous mutations. All other
classes of mutation can be expected to present some
combination of neutral and weakly deleterious mutations.
Therefore, any value of present variation is likely to include
both a neutral fraction and a fraction that is undergoing
The Am
purifying selection. The neutral fraction (rN) can be
defined as rN ¼ ð%synþ%neuÞ3r0, where rN is the value
of neutral variation of a specific observed variation (r0),
considering the proportion of synonymous mutations
(%syn) and the proportion that are neutral or nearly
neutral with a high possibility of fixation (%neu), or,
rN ¼ ð100%�%delÞ3r0, where %del is the percentage of
weakly deleterious, nonfixable mutations. However,
considering these three proportions, only the proportion
of synonymous mutations can be measured directly.
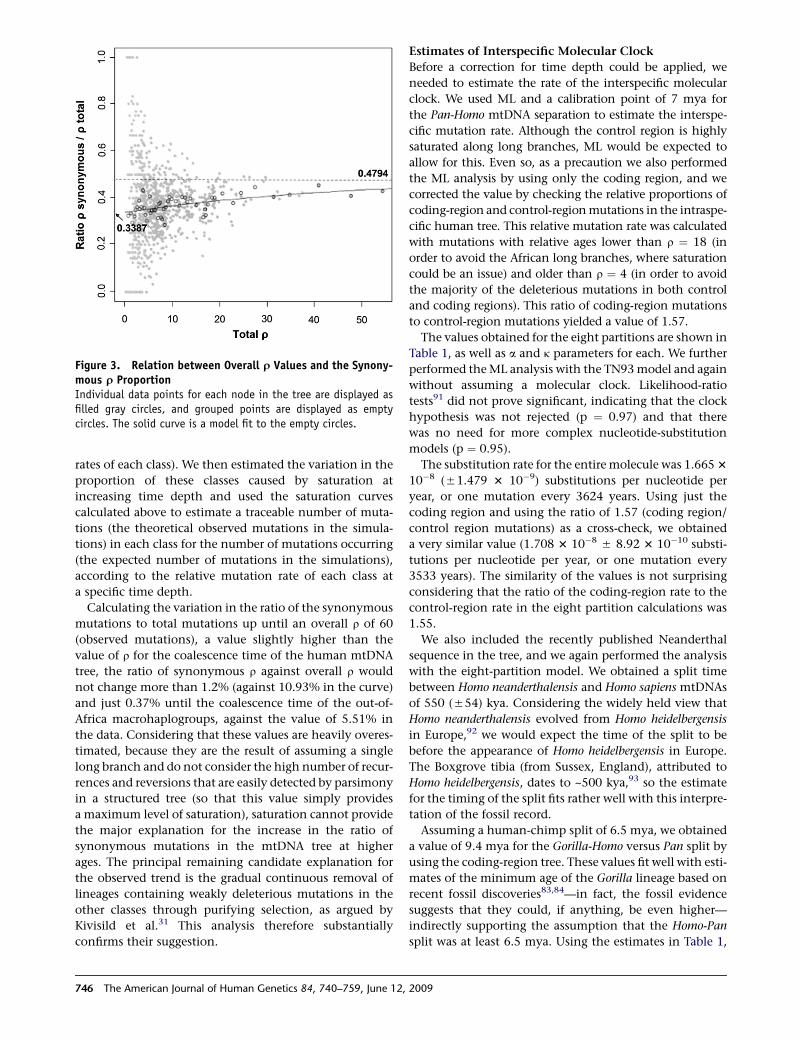
We plotted the synonymous r proportion against
the overall r for each node to ascertain to what extent the
proportion varies with time (Figure 3, filled circles). The
trend is obscured because the variance in synonymous
r proportion varies dramatically for different r values, but
the average proportion seems to approach an asymptote
for older branches. To control variance (and also to some
extent the correlation of different observations), we grouped
the data points as described above (Figure 3, hollow circles).
This showed that the synonymous r proportion increases
with higher values of r, but that the rate of increase
decreases with r, plausibly tending to a constant. To capture
this behavior, we fitted a Gompertz function to the grouped
data yielding this fit: average synonymous r proportion ¼0.479 exp(�exp[�0.0263(overall rþ40.28)]) (Figure 3, solid
line). The average synonymous r proportion varies from
0.3387 when r ¼ 0 to 0.4794 at r ¼ N. The former corre-
sponds to an estimate of the ratio of instantaneous synony-
mous-to-total-mutation rate.
To test whether this trend could partially be explained by
uneven saturation of the different classes (a plausible
scenario when considering the complete genome varia-
tion, because it includes the fast-evolving control region),
we used a region of the tree where saturation was low (over-
all r < 3) to obtain the proportion of mutations in each
class (which should relate directly to the relative mutation
erican Journal of Human Genetics 84, 740–759, June 12, 2009 745
rates of each class). We then estimated the variation in the
proportion of these classes caused by saturation at
increasing time depth and used the saturation curves
calculated above to estimate a traceable number of muta-
tions (the theoretical observed mutations in the simula-
tions) in each class for the number of mutations occurring
(the expected number of mutations in the simulations),
according to the relative mutation rate of each class at
a specific time depth.
Calculating the variation in the ratio of the synonymous
mutations to total mutations up until an overall r of 60
(observed mutations), a value slightly higher than the
value of r for the coalescence time of the human mtDNA
tree, the ratio of synonymous r against overall r would
not change more than 1.2% (against 10.93% in the curve)
and just 0.37% until the coalescence time of the out-of-
Africa macrohaplogroups, against the value of 5.51% in
the data. Considering that these values are heavily overes-
timated, because they are the result of assuming a single
long branch and do not consider the high number of recur-
rences and reversions that are easily detected by parsimony
in a structured tree (so that this value simply provides
a maximum level of saturation), saturation cannot provide
the major explanation for the increase in the ratio of
synonymous mutations in the mtDNA tree at higher
ages. The principal remaining candidate explanation for
the observed trend is the gradual continuous removal of
lineages containing weakly deleterious mutations in the
other classes through purifying selection, as argued by
Kivisild et al.31 This analysis therefore substantially
confirms their suggestion.
Figure 3. Relation between Overall r Values and the Synony-mous r ProportionIndividual data points for each node in the tree are displayed asfilled gray circles, and grouped points are displayed as emptycircles. The solid curve is a model fit to the empty circles.
746 The American Journal of Human Genetics 84, 740–759, June 12
Estimates of Interspecific Molecular Clock
Before a correction for time depth could be applied, we
needed to estimate the rate of the interspecific molecular
clock. We used ML and a calibration point of 7 mya for
the Pan-Homo mtDNA separation to estimate the interspe-
cific mutation rate. Although the control region is highly
saturated along long branches, ML would be expected to
allow for this. Even so, as a precaution we also performed
the ML analysis by using only the coding region, and we
corrected the value by checking the relative proportions of
coding-region and control-region mutations in the intraspe-
cific human tree. This relative mutation rate was calculated
with mutations with relative ages lower than r ¼ 18 (in
order to avoid the African long branches, where saturation
could be an issue) and older than r ¼ 4 (in order to avoid
the majority of the deleterious mutations in both control
and coding regions). This ratio of coding-region mutations
to control-region mutations yielded a value of 1.57.
The values obtained for the eight partitions are shown in
Table 1, as well as a and k parameters for each. We further
performed the ML analysis with the TN93 model and again
without assuming a molecular clock. Likelihood-ratio
tests91 did not prove significant, indicating that the clock
hypothesis was not rejected (p ¼ 0.97) and that there
was no need for more complex nucleotide-substitution
models (p ¼ 0.95).
The substitution rate for the entire molecule was 1.665 3
10�8 (51.479 3 10�9) substitutions per nucleotide per
year, or one mutation every 3624 years. Using just the
coding region and using the ratio of 1.57 (coding region/
control region mutations) as a cross-check, we obtained
a very similar value (1.708 3 10�85 8.92 3 10�10 substi-
tutions per nucleotide per year, or one mutation every
3533 years). The similarity of the values is not surprising
considering that the ratio of the coding-region rate to the
control-region rate in the eight partition calculations was
1.55.
We also included the recently published Neanderthal
sequence in the tree, and we again performed the analysis
with the eight-partition model. We obtained a split time
between Homo neanderthalensis and Homo sapiens mtDNAs
of 550 (554) kya. Considering the widely held view that
Homo neanderthalensis evolved from Homo heidelbergensis
in Europe,92 we would expect the time of the split to be
before the appearance of Homo heidelbergensis in Europe.
The Boxgrove tibia (from Sussex, England), attributed to
Homo heidelbergensis, dates to ~500 kya,93 so the estimate
for the timing of the split fits rather well with this interpre-
tation of the fossil record.
Assuming a human-chimp split of 6.5 mya, we obtained
a value of 9.4 mya for the Gorilla-Homo versus Pan split by
using the coding-region tree. These values fit well with esti-
mates of the minimum age of the Gorilla lineage based on
recent fossil discoveries83,84—in fact, the fossil evidence
suggests that they could, if anything, be even higher—
indirectly supporting the assumption that the Homo-Pan
split was at least 6.5 mya. Using the estimates in Table 1,
, 2009
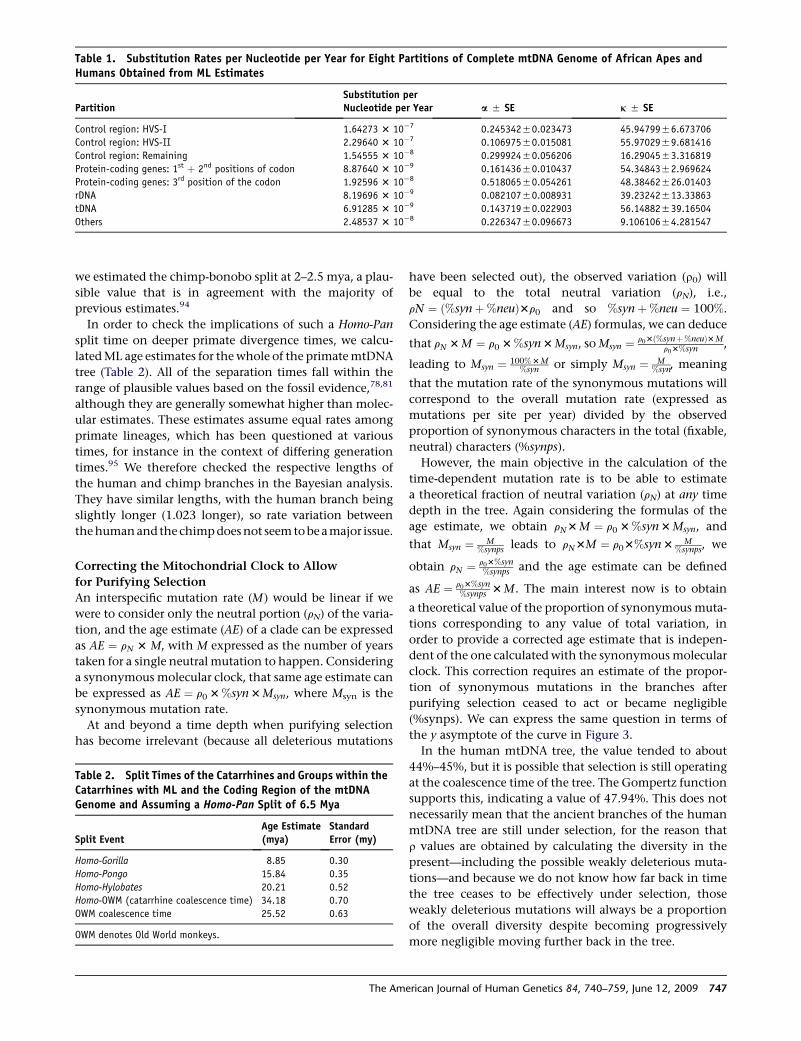
Table 1. Substitution Rates per Nucleotide per Year for Eight Partitions of Complete mtDNA Genome of African Apes andHumans Obtained from ML Estimates
PartitionSubstitution perNucleotide per Year a 5 SE k 5 SE
Control region: HVS-I 1.64273 3 10�7 0.24534250.023473 45.9479956.673706
Control region: HVS-II 2.29640 3 10�7 0.10697550.015081 55.9702959.681416
Control region: Remaining 1.54555 3 10�8 0.29992450.056206 16.2904553.316819
Protein-coding genes: 1st þ 2nd positions of codon 8.87640 3 10�9 0.16143650.010437 54.3484352.969624
Protein-coding genes: 3rd position of the codon 1.92596 3 10�8 0.51806550.054261 48.38462526.01403
rDNA 8.19696 3 10�9 0.08210750.008931 39.23242513.33863
tDNA 6.91285 3 10�9 0.14371950.022903 56.14882539.16504
Others 2.48537 3 10�8 0.22634750.096673 9.10610654.281547
we estimated the chimp-bonobo split at 2–2.5 mya, a plau-
sible value that is in agreement with the majority of
previous estimates.94
In order to check the implications of such a Homo-Pan
split time on deeper primate divergence times, we calcu-
lated ML age estimates for the whole of the primate mtDNA
tree (Table 2). All of the separation times fall within the
range of plausible values based on the fossil evidence,78,81
although they are generally somewhat higher than molec-
ular estimates. These estimates assume equal rates among
primate lineages, which has been questioned at various
times, for instance in the context of differing generation
times.95 We therefore checked the respective lengths of
the human and chimp branches in the Bayesian analysis.
They have similar lengths, with the human branch being
slightly longer (1.023 longer), so rate variation between
the human and the chimp does not seem to be a major issue.
Correcting the Mitochondrial Clock to Allow
for Purifying Selection
An interspecific mutation rate (M ) would be linear if we
were to consider only the neutral portion (rN) of the varia-
tion, and the age estimate (AE) of a clade can be expressed
as AE ¼ rN 3 M, with M expressed as the number of years
taken for a single neutral mutation to happen. Considering
a synonymous molecular clock, that same age estimate can
be expressed as AE ¼ r0 3 %syn 3 Msyn, where Msyn is the
synonymous mutation rate.
At and beyond a time depth when purifying selection
has become irrelevant (because all deleterious mutations
Table 2. Split Times of the Catarrhines and Groups within theCatarrhines with ML and the Coding Region of the mtDNAGenome and Assuming a Homo-Pan Split of 6.5 Mya
Split EventAge Estimate(mya)
StandardError (my)
Homo-Gorilla 8.85 0.30
Homo-Pongo 15.84 0.35
Homo-Hylobates 20.21 0.52
Homo-OWM (catarrhine coalescence time) 34.18 0.70
OWM coalescence time 25.52 0.63
OWM denotes Old World monkeys.
The Am
have been selected out), the observed variation (r0) will
be equal to the total neutral variation (rN), i.e.,
rN ¼ ð%synþ%neuÞ3r0 and so %synþ%neu ¼ 100%.
Considering the age estimate (AE) formulas, we can deduce
that rN 3 M ¼ r0 3 %syn 3 Msyn, so Msyn ¼ r03ð%synþ%neuÞ3 Mr03%syn ,
leading to Msyn ¼ 100% 3 M%syn or simply Msyn ¼ M
%syn, meaning
that the mutation rate of the synonymous mutations will
correspond to the overall mutation rate (expressed as
mutations per site per year) divided by the observed
proportion of synonymous characters in the total (fixable,
neutral) characters (%synps).
However, the main objective in the calculation of the
time-dependent mutation rate is to be able to estimate
a theoretical fraction of neutral variation (rN) at any time
depth in the tree. Again considering the formulas of the
age estimate, we obtain rN3 M ¼ r0 3 %syn 3 Msyn, and
that Msyn ¼ M%synps leads to rN3M ¼ r03%syn 3 M
%synps, we
obtain rN ¼ r03%syn%synps and the age estimate can be defined
as AE ¼ r03%syn%synps 3 M. The main interest now is to obtain
a theoretical value of the proportion of synonymous muta-
tions corresponding to any value of total variation, in
order to provide a corrected age estimate that is indepen-
dent of the one calculated with the synonymous molecular
clock. This correction requires an estimate of the propor-
tion of synonymous mutations in the branches after
purifying selection ceased to act or became negligible
(%synps). We can express the same question in terms of
the y asymptote of the curve in Figure 3.
In the human mtDNA tree, the value tended to about
44%–45%, but it is possible that selection is still operating
at the coalescence time of the tree. The Gompertz function
supports this, indicating a value of 47.94%. This does not
necessarily mean that the ancient branches of the human
mtDNA tree are still under selection, for the reason that
r values are obtained by calculating the diversity in the
present—including the possible weakly deleterious muta-
tions—and because we do not know how far back in time
the tree ceases to be effectively under selection, those
weakly deleterious mutations will always be a proportion
of the overall diversity despite becoming progressively
more negligible moving further back in the tree.
erican Journal of Human Genetics 84, 740–759, June 12, 2009 747
We can compare the value of the synonymous r/overall
r ratio in the modern human-Neanderthal split. This
yielded the value of 55%, although it is in a time range
where saturation would play an important part. Applying
the saturation curves obtained above for each class brought
the value down to 51.0%, close to our theoretical plateau.
Beyond the coalescence time of Homo sapiens with Homo
neanderthalensis mtDNAs, the nearest node we can use for
comparison is the split between the bonobo and the
common chimp. The bonobo-chimp branch showed an
obviously higher value for the proportion of synonymous
mutations (56.1%), although this should be mainly caused
by uneven saturation of the different classes. Acknowl-
edging that several assumptions are necessary, because
the model was estimated with human mutation patterns,
we can nevertheless obtain a heuristic value for compar-
ison by using the saturation curves obtained. In this way,
we retrieved the value of 46.6%. Once again, the value
approximates our theoretical plateau value of 47.94%.
We can therefore adapt our molecular clock to any time
depth, by correcting the observed overall diversity to the
theoretical diversity after purifying selection has acted to
remove lineages carrying deleterious mutations. This can
be done through the previous formulation:
AE ¼ r03%syn%synps 3 M or, assuming the Gompertz curve for
%synonymous versus overall variation and the y asymp-
tote value of 47.94%, we obtain:
AE ¼ 0:4794 3 e�e�0:0263 3 ðroþ40:2789Þ
0:47943 r0 3 3624,
or simply
AE ¼ e�e�0:0263 3 ðroþ40:2789Þ3 r0 3 3624:
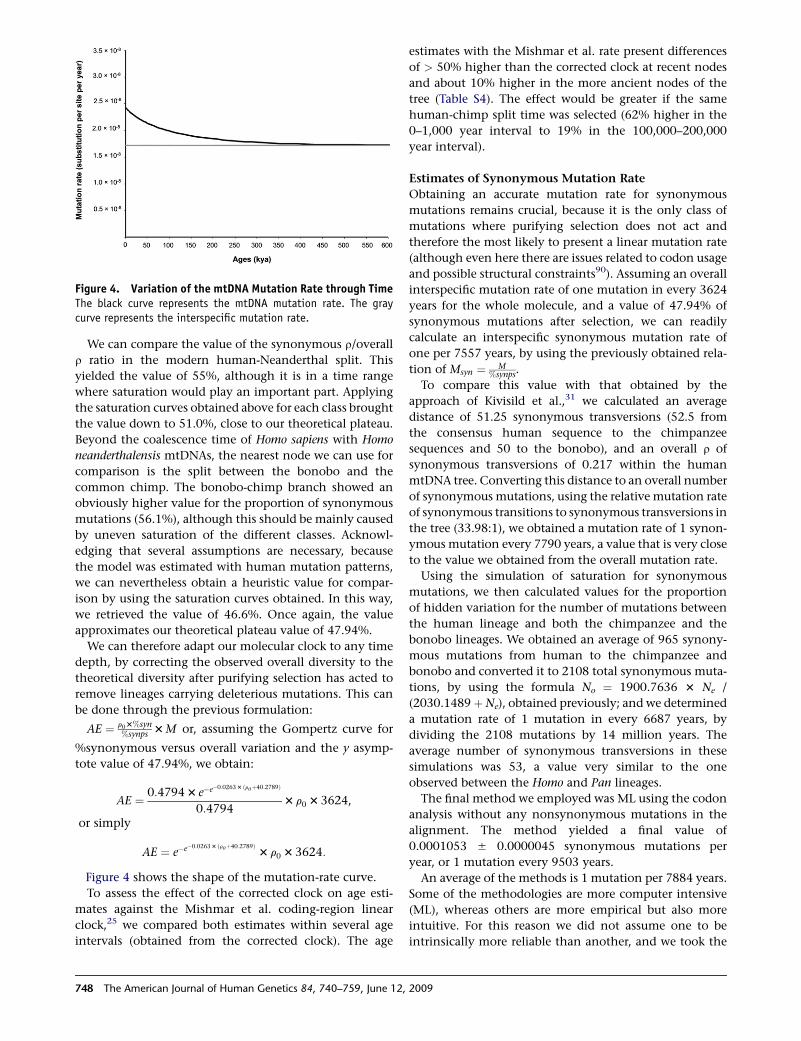
Figure 4 shows the shape of the mutation-rate curve.
To assess the effect of the corrected clock on age esti-
mates against the Mishmar et al. coding-region linear
clock,25 we compared both estimates within several age
intervals (obtained from the corrected clock). The age
Figure 4. Variation of the mtDNA Mutation Rate through TimeThe black curve represents the mtDNA mutation rate. The graycurve represents the interspecific mutation rate.
748 The American Journal of Human Genetics 84, 740–759, June 12
estimates with the Mishmar et al. rate present differences
of > 50% higher than the corrected clock at recent nodes
and about 10% higher in the more ancient nodes of the
tree (Table S4). The effect would be greater if the same
human-chimp split time was selected (62% higher in the
0–1,000 year interval to 19% in the 100,000–200,000
year interval).
Estimates of Synonymous Mutation Rate
Obtaining an accurate mutation rate for synonymous
mutations remains crucial, because it is the only class of
mutations where purifying selection does not act and
therefore the most likely to present a linear mutation rate
(although even here there are issues related to codon usage
and possible structural constraints90). Assuming an overall
interspecific mutation rate of one mutation in every 3624
years for the whole molecule, and a value of 47.94% of
synonymous mutations after selection, we can readily
calculate an interspecific synonymous mutation rate of
one per 7557 years, by using the previously obtained rela-
tion of Msyn ¼ M%synps.
To compare this value with that obtained by the
approach of Kivisild et al.,31 we calculated an average
distance of 51.25 synonymous transversions (52.5 from
the consensus human sequence to the chimpanzee
sequences and 50 to the bonobo), and an overall r of
synonymous transversions of 0.217 within the human
mtDNA tree. Converting this distance to an overall number
of synonymous mutations, using the relative mutation rate
of synonymous transitions to synonymous transversions in
the tree (33.98:1), we obtained a mutation rate of 1 synon-
ymous mutation every 7790 years, a value that is very close
to the value we obtained from the overall mutation rate.
Using the simulation of saturation for synonymous
mutations, we then calculated values for the proportion
of hidden variation for the number of mutations between
the human lineage and both the chimpanzee and the
bonobo lineages. We obtained an average of 965 synony-
mous mutations from human to the chimpanzee and
bonobo and converted it to 2108 total synonymous muta-
tions, by using the formula No ¼ 1900.7636 3 Ne /
(2030.1489þNe), obtained previously; and we determined
a mutation rate of 1 mutation in every 6687 years, by
dividing the 2108 mutations by 14 million years. The
average number of synonymous transversions in these
simulations was 53, a value very similar to the one
observed between the Homo and Pan lineages.
The final method we employed was ML using the codon
analysis without any nonsynonymous mutations in the
alignment. The method yielded a final value of
0.0001053 5 0.0000045 synonymous mutations per
year, or 1 mutation every 9503 years.
An average of the methods is 1 mutation per 7884 years.
Some of the methodologies are more computer intensive
(ML), whereas others are more empirical but also more
intuitive. For this reason we did not assume one to be
intrinsically more reliable than another, and we took the
, 2009
average as the consensus. Additionally, we subsequently
tested the rate against several archaeological calibration
points in order to check its reliability (see below).
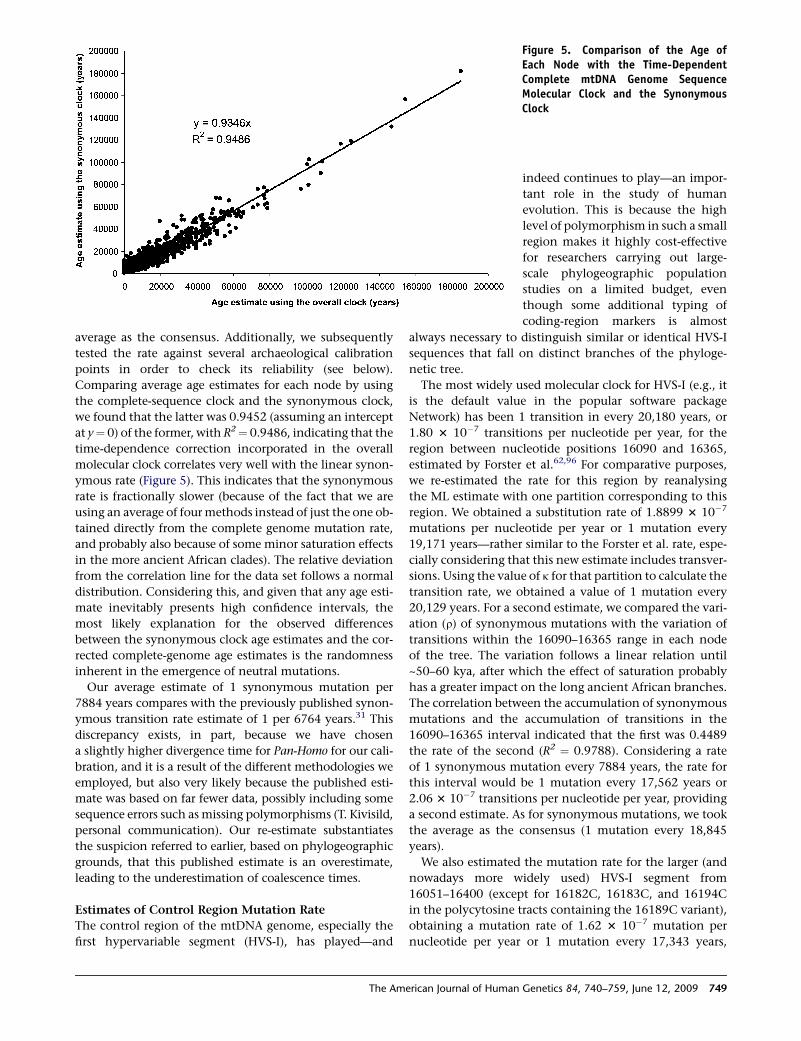
Comparing average age estimates for each node by using
the complete-sequence clock and the synonymous clock,
we found that the latter was 0.9452 (assuming an intercept
at y¼ 0) of the former, with R2¼ 0.9486, indicating that the
time-dependence correction incorporated in the overall
molecular clock correlates very well with the linear synon-
ymous rate (Figure 5). This indicates that the synonymous
rate is fractionally slower (because of the fact that we are
using an average of four methods instead of just the one ob-
tained directly from the complete genome mutation rate,
and probably also because of some minor saturation effects
in the more ancient African clades). The relative deviation
from the correlation line for the data set follows a normal
distribution. Considering this, and given that any age esti-
mate inevitably presents high confidence intervals, the
most likely explanation for the observed differences
between the synonymous clock age estimates and the cor-
rected complete-genome age estimates is the randomness
inherent in the emergence of neutral mutations.
Our average estimate of 1 synonymous mutation per
7884 years compares with the previously published synon-
ymous transition rate estimate of 1 per 6764 years.31 This
discrepancy exists, in part, because we have chosen
a slightly higher divergence time for Pan-Homo for our cali-
bration, and it is a result of the different methodologies we
employed, but also very likely because the published esti-
mate was based on far fewer data, possibly including some
sequence errors such as missing polymorphisms (T. Kivisild,
personal communication). Our re-estimate substantiates
the suspicion referred to earlier, based on phylogeographic
grounds, that this published estimate is an overestimate,
leading to the underestimation of coalescence times.
Estimates of Control Region Mutation Rate
The control region of the mtDNA genome, especially the
first hypervariable segment (HVS-I), has played—and
Figure 5. Comparison of the Age ofEach Node with the Time-DependentComplete mtDNA Genome SequenceMolecular Clock and the SynonymousClock
indeed continues to play—an impor-
tant role in the study of human
evolution. This is because the high
level of polymorphism in such a small
region makes it highly cost-effective
for researchers carrying out large-
scale phylogeographic population
studies on a limited budget, even
though some additional typing of
coding-region markers is almost
always necessary to distinguish similar or identical HVS-I
sequences that fall on distinct branches of the phyloge-
netic tree.
The most widely used molecular clock for HVS-I (e.g., it
is the default value in the popular software package
Network) has been 1 transition in every 20,180 years, or
1.80 3 10�7 transitions per nucleotide per year, for the
region between nucleotide positions 16090 and 16365,
estimated by Forster et al.62,96 For comparative purposes,
we re-estimated the rate for this region by reanalysing
the ML estimate with one partition corresponding to this
region. We obtained a substitution rate of 1.8899 3 10�7
mutations per nucleotide per year or 1 mutation every
19,171 years—rather similar to the Forster et al. rate, espe-
cially considering that this new estimate includes transver-
sions. Using the value of k for that partition to calculate the
transition rate, we obtained a value of 1 mutation every
20,129 years. For a second estimate, we compared the vari-
ation (r) of synonymous mutations with the variation of
transitions within the 16090–16365 range in each node
of the tree. The variation follows a linear relation until
~50–60 kya, after which the effect of saturation probably
has a greater impact on the long ancient African branches.
The correlation between the accumulation of synonymous
mutations and the accumulation of transitions in the
16090–16365 interval indicated that the first was 0.4489
the rate of the second (R2 ¼ 0.9788). Considering a rate
of 1 synonymous mutation every 7884 years, the rate for
this interval would be 1 mutation every 17,562 years or
2.06 3 10�7 transitions per nucleotide per year, providing
a second estimate. As for synonymous mutations, we took
the average as the consensus (1 mutation every 18,845
years).
We also estimated the mutation rate for the larger (and
nowadays more widely used) HVS-I segment from
16051–16400 (except for 16182C, 16183C, and 16194C
in the polycytosine tracts containing the 16189C variant),
obtaining a mutation rate of 1.62 3 10�7 mutation per
nucleotide per year or 1 mutation every 17,343 years,
The American Journal of Human Genetics 84, 740–759, June 12, 2009 749
with the partition in the ML analysis. Scaling this region
against the synonymous accumulation, we obtained the
value of 1 mutation per 16,011 years, or 1.784 3 10�7
substitutions per nucleotide per year. An average value
would be 1 mutation every 16,677 years.
We similarly estimated a mutation rate of 2.279 3 10�7
mutations per nucleotide per year or one mutation
every 22,388 years for the HVS-II (positions 68–263), and
9.883 3 10�8 mutations per nucleotide per year or 1
mutation every 9058 years for the whole of the control
region.
The virtually linear relation between the accumulation
of synonymous mutations and control-region mutations
suggests that the control region cannot be greatly affected
by purifying selection, although some possible functional
constraints are still to be found.97 The decrease in the
proportion of control-region mutations compared to
synonymous mutations as the time depth increases is
more likely explained by a combination of saturation of
control-region positions at higher time depths where the
tree is less densely branching (because of the loss of
many lineages by drift), with perhaps some weak effect
of purifying selection. An implication of the finding that
the mutation rate is approximately constant for lower
ages is that some of the issues that have arisen concerning
time dependency of control-region molecular clocks35 are
more likely caused by problematic data sets, as suggested
by Bandelt.98
Calculator
We have provided a calculator to convert r values (from
complete mtDNA sequences, synonymous counts, HVS-I,
and the entire control region), and ML estimates (from
complete mtDNA sequences) to age estimates (see Docu-
ment S2 in the Supplemental Data).
Discussion
Phylogeographic Cross-Checking:
Dispersal out of Africa
Using the synonymous mutation rate of Kivisild et al.31
reduces many coalescence times previously estimated
with the coding-region rate of Mishmar et al.25 (see Ban-
delt et al.99 for a critique of other coding-region rates on
the market). This reduction is often by about one-quarter,
but sometimes by up to three-quarters, of the value.
Thus, it estimates the coalescence time of the mtDNA
tree overall at ~160,000 kya, L3 (the clade that evolved
within Africa and gave rise to the three major non-African
haplogroups—sometimes termed ‘‘macrohaplogroups’’—
M, N, and R) at 65 kya, and M, N, and R themselves at
40–50 kya. The latter in particular has implications for
the timing of the out-of-Africa dispersal: a dispersal and
settlement of Asia and Australasia at ~45 kya would be in
agreement with the ‘‘short chronology’’ for the arrival in
Australia and intervening points (based on uncontroversial
750 The American Journal of Human Genetics 84, 740–759, June 12
rather than contested archaeological evidence),100 whereas
the ages implied by the Mishmar et al. rate suggested an
earlier dispersal along the southern coastal route 60–70
kya.9
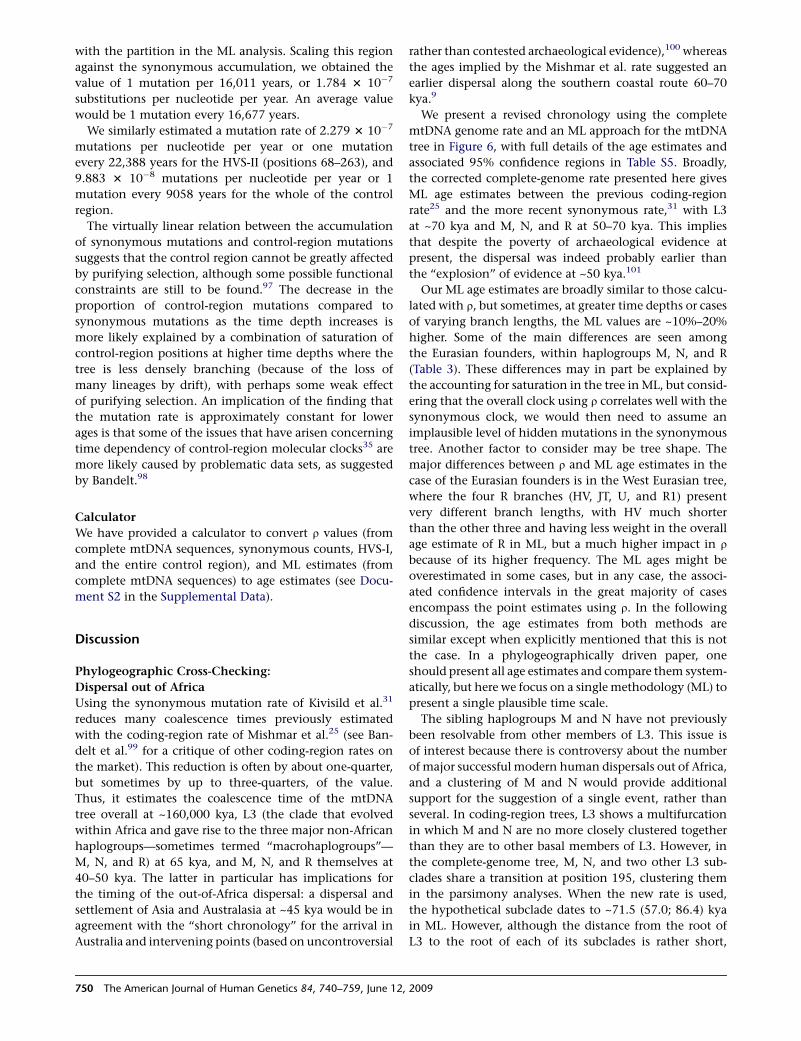
We present a revised chronology using the complete
mtDNA genome rate and an ML approach for the mtDNA
tree in Figure 6, with full details of the age estimates and
associated 95% confidence regions in Table S5. Broadly,
the corrected complete-genome rate presented here gives
ML age estimates between the previous coding-region
rate25 and the more recent synonymous rate,31 with L3
at ~70 kya and M, N, and R at 50–70 kya. This implies
that despite the poverty of archaeological evidence at
present, the dispersal was indeed probably earlier than
the ‘‘explosion’’ of evidence at ~50 kya.101
Our ML age estimates are broadly similar to those calcu-
lated with r, but sometimes, at greater time depths or cases
of varying branch lengths, the ML values are ~10%–20%
higher. Some of the main differences are seen among
the Eurasian founders, within haplogroups M, N, and R
(Table 3). These differences may in part be explained by
the accounting for saturation in the tree in ML, but consid-
ering that the overall clock using r correlates well with the
synonymous clock, we would then need to assume an
implausible level of hidden mutations in the synonymous
tree. Another factor to consider may be tree shape. The
major differences between r and ML age estimates in the
case of the Eurasian founders is in the West Eurasian tree,
where the four R branches (HV, JT, U, and R1) present
very different branch lengths, with HV much shorter
than the other three and having less weight in the overall
age estimate of R in ML, but a much higher impact in r
because of its higher frequency. The ML ages might be
overestimated in some cases, but in any case, the associ-
ated confidence intervals in the great majority of cases
encompass the point estimates using r. In the following
discussion, the age estimates from both methods are
similar except when explicitly mentioned that this is not
the case. In a phylogeographically driven paper, one
should present all age estimates and compare them system-
atically, but here we focus on a single methodology (ML) to
present a single plausible time scale.
The sibling haplogroups M and N have not previously
been resolvable from other members of L3. This issue is
of interest because there is controversy about the number
of major successful modern human dispersals out of Africa,
and a clustering of M and N would provide additional
support for the suggestion of a single event, rather than
several. In coding-region trees, L3 shows a multifurcation
in which M and N are no more closely clustered together
than they are to other basal members of L3. However, in
the complete-genome tree, M, N, and two other L3 sub-
clades share a transition at position 195, clustering them
in the parsimony analyses. When the new rate is used,
the hypothetical subclade dates to ~71.5 (57.0; 86.4) kya
in ML. However, although the distance from the root of
L3 to the root of each of its subclades is rather short,
, 2009
Figure 6. A New Chronology for theHuman mtDNA TreeThe tree was obtained by combining sixtrees constructed separately, with branchlengths estimated with maximum likeli-hood and the time-dependent molecularclock. Number and presence of clades isdependent on availability of data and noton worldwide frequencies. Ages are ex-pressed in kya.
The American Journal of Human Genetics 84, 740–759, June 12, 2009 751
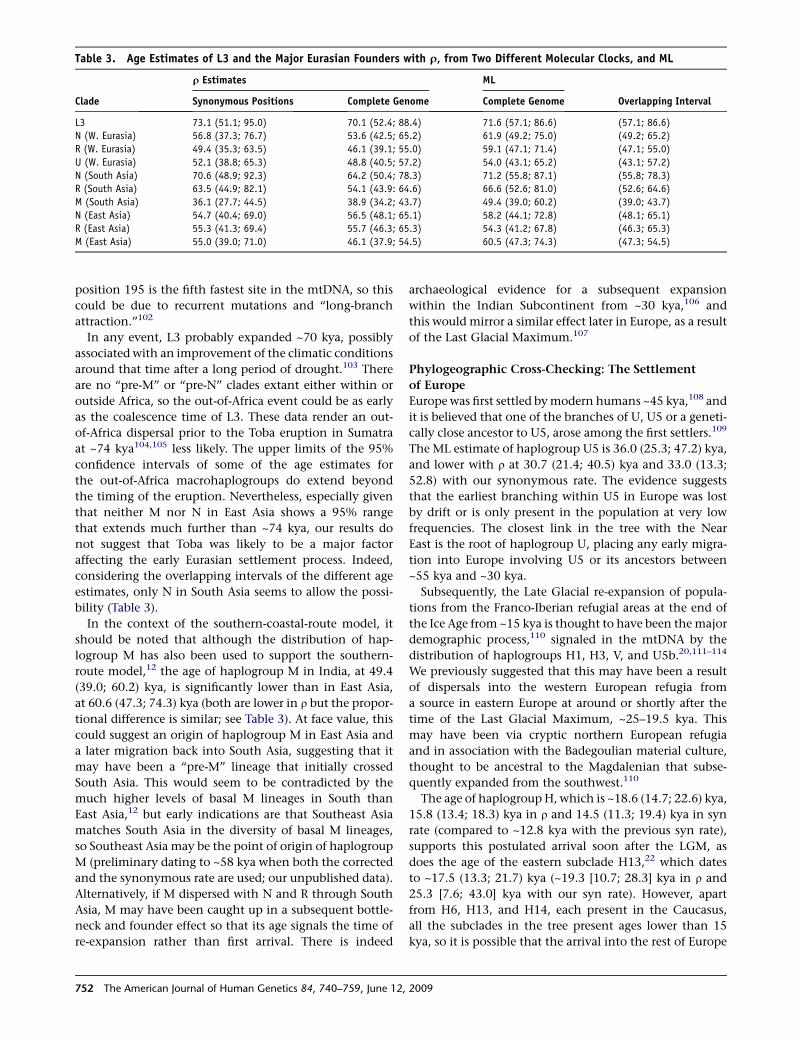
Table 3. Age Estimates of L3 and the Major Eurasian Founders with r, from Two Different Molecular Clocks, and ML
Clade
r Estimates ML
Overlapping IntervalSynonymous Positions Complete Genome Complete Genome
L3 73.1 (51.1; 95.0) 70.1 (52.4; 88.4) 71.6 (57.1; 86.6) (57.1; 86.6)
N (W. Eurasia) 56.8 (37.3; 76.7) 53.6 (42.5; 65.2) 61.9 (49.2; 75.0) (49.2; 65.2)
R (W. Eurasia) 49.4 (35.3; 63.5) 46.1 (39.1; 55.0) 59.1 (47.1; 71.4) (47.1; 55.0)
U (W. Eurasia) 52.1 (38.8; 65.3) 48.8 (40.5; 57.2) 54.0 (43.1; 65.2) (43.1; 57.2)
N (South Asia) 70.6 (48.9; 92.3) 64.2 (50.4; 78.3) 71.2 (55.8; 87.1) (55.8; 78.3)
R (South Asia) 63.5 (44.9; 82.1) 54.1 (43.9: 64.6) 66.6 (52.6; 81.0) (52.6; 64.6)
M (South Asia) 36.1 (27.7; 44.5) 38.9 (34.2; 43.7) 49.4 (39.0; 60.2) (39.0; 43.7)
N (East Asia) 54.7 (40.4; 69.0) 56.5 (48.1; 65.1) 58.2 (44.1; 72.8) (48.1; 65.1)
R (East Asia) 55.3 (41.3; 69.4) 55.7 (46.3; 65.3) 54.3 (41.2; 67.8) (46.3; 65.3)
M (East Asia) 55.0 (39.0; 71.0) 46.1 (37.9; 54.5) 60.5 (47.3; 74.3) (47.3; 54.5)
position 195 is the fifth fastest site in the mtDNA, so this
could be due to recurrent mutations and ‘‘long-branch
attraction.’’102
In any event, L3 probably expanded ~70 kya, possibly
associated with an improvement of the climatic conditions
around that time after a long period of drought.103 There
are no ‘‘pre-M’’ or ‘‘pre-N’’ clades extant either within or
outside Africa, so the out-of-Africa event could be as early
as the coalescence time of L3. These data render an out-
of-Africa dispersal prior to the Toba eruption in Sumatra
at ~74 kya104,105 less likely. The upper limits of the 95%
confidence intervals of some of the age estimates for
the out-of-Africa macrohaplogroups do extend beyond
the timing of the eruption. Nevertheless, especially given
that neither M nor N in East Asia shows a 95% range
that extends much further than ~74 kya, our results do
not suggest that Toba was likely to be a major factor
affecting the early Eurasian settlement process. Indeed,
considering the overlapping intervals of the different age
estimates, only N in South Asia seems to allow the possi-
bility (Table 3).
In the context of the southern-coastal-route model, it
should be noted that although the distribution of hap-
logroup M has also been used to support the southern-
route model,12 the age of haplogroup M in India, at 49.4
(39.0; 60.2) kya, is significantly lower than in East Asia,
at 60.6 (47.3; 74.3) kya (both are lower in r but the propor-
tional difference is similar; see Table 3). At face value, this
could suggest an origin of haplogroup M in East Asia and
a later migration back into South Asia, suggesting that it
may have been a ‘‘pre-M’’ lineage that initially crossed
South Asia. This would seem to be contradicted by the
much higher levels of basal M lineages in South than
East Asia,12 but early indications are that Southeast Asia
matches South Asia in the diversity of basal M lineages,
so Southeast Asia may be the point of origin of haplogroup
M (preliminary dating to ~58 kya when both the corrected
and the synonymous rate are used; our unpublished data).
Alternatively, if M dispersed with N and R through South
Asia, M may have been caught up in a subsequent bottle-
neck and founder effect so that its age signals the time of
re-expansion rather than first arrival. There is indeed
752 The American Journal of Human Genetics 84, 740–759, June 12
archaeological evidence for a subsequent expansion
within the Indian Subcontinent from ~30 kya,106 and
this would mirror a similar effect later in Europe, as a result
of the Last Glacial Maximum.107
Phylogeographic Cross-Checking: The Settlement
of Europe
Europe was first settled by modern humans ~45 kya,108 and
it is believed that one of the branches of U, U5 or a geneti-
cally close ancestor to U5, arose among the first settlers.109
The ML estimate of haplogroup U5 is 36.0 (25.3; 47.2) kya,
and lower with r at 30.7 (21.4; 40.5) kya and 33.0 (13.3;
52.8) with our synonymous rate. The evidence suggests
that the earliest branching within U5 in Europe was lost
by drift or is only present in the population at very low
frequencies. The closest link in the tree with the Near
East is the root of haplogroup U, placing any early migra-
tion into Europe involving U5 or its ancestors between
~55 kya and ~30 kya.
Subsequently, the Late Glacial re-expansion of popula-
tions from the Franco-Iberian refugial areas at the end of
the Ice Age from ~15 kya is thought to have been the major
demographic process,110 signaled in the mtDNA by the
distribution of haplogroups H1, H3, V, and U5b.20,111–114
We previously suggested that this may have been a result
of dispersals into the western European refugia from
a source in eastern Europe at around or shortly after the
time of the Last Glacial Maximum, ~25–19.5 kya. This
may have been via cryptic northern European refugia
and in association with the Badegoulian material culture,
thought to be ancestral to the Magdalenian that subse-
quently expanded from the southwest.110
The age of haplogroup H, which is ~18.6 (14.7; 22.6) kya,
15.8 (13.4; 18.3) kya in r and 14.5 (11.3; 19.4) kya in syn
rate (compared to ~12.8 kya with the previous syn rate),
supports this postulated arrival soon after the LGM, as
does the age of the eastern subclade H13,22 which dates
to ~17.5 (13.3; 21.7) kya (~19.3 [10.7; 28.3] kya in r and
25.3 [7.6; 43.0] kya with our syn rate). However, apart
from H6, H13, and H14, each present in the Caucasus,
all the subclades in the tree present ages lower than 15
kya, so it is possible that the arrival into the rest of Europe
, 2009
occurred later. To test this, we calculated a founder age for
the European data. We obtained an age of 14.6 (11.7; 17.6)
kya, indicating a likely entrance after the LGM.
The Magdalenian expansion from the southwest refugia
began ~15 kya110 and, on the basis of their geographic
distribution, it has been proposed that H1 and H3 (as
well as V) are markers for this expansion, having evolved
in the western refugium.20,113 If this holds, their ages
should then not be less than the start of the expansion
(~14 kya at the latest). H1 dates with ML to 12.2 (9.1;
15.4) kya and H3 to 11.8 (8.4; 15.4) kya. Considering their
confidence intervals, these ages could be in reasonable
agreement with the phylogeographic interpretation and
the archaeological record. However, the point estimates
are even lower when estimated with r, rather than ML,
at 11–12 kya, and, in the case of H3, even lower when
our syn rate is used (6.9 [3.4; 10.4] kya). This might suggest
a possible expansion for one or both of these two lineages
at the end of the Younger Dryas, 11.5 kya, rather than in
the Late Glacial, although there is little archaeological
evidence for a major expansion at this time.115 (The age
estimate of H1 with the published synonymous rate is
~9 ky, which is less readily reconcilable archaeologically
with the west-east cline displayed by the clade.) This might
be an issue of sampling from across the entire area of the
expansion, and the result could be caused by founder
effects subsequent to the one under investigation.112
Given that our estimate of the arrival of H in Europe (an
estimate that includes H1 and H3 data) dates to 14.6 kya,
it is perhaps improbable, albeit not impossible, that H1
and H3 expanded very shortly after (14 kya) from the
southwest refugia. The ancestry of haplogroup H merits
further detailed study at the complete-genome level to
resolve these issues, but it is worth noting that the issue
that arises is that the recalibrated rate seems, if anything,
a little too fast to accommodate the most plausible phylo-
geographic interpretation (taking into account the archae-
ological evidence) in this case (i.e., a large-scale Late Glacial
expansion). Note also that an age of 18 kya for both H1 and
H3, as assumed by Endicott and Ho,39 would not fit with
any plausible rate; it is too early even for the uncorrected
coding-region rate of Mishmar et al., which is at variance
with their suggestion of a much faster rate overall.
The sister clade of H, haplogroup V, indeed dates to ~13.6
(9.1; 18.2) kya (13.7 [12.1; 15.2] kya in r and 12.2 [10.0;
14.3] kya in syn rate), fitting better the time of expansion
from the Franco-Cantabrian glacial refuge. Furthermore,
haplogroup V presents ancestry in Europe with its direct
ancestor dating to 15.6 kya. This provides some additional
corroboration for the corrected rate in the 10–20 kya time
window.
Archaeological Calibration Points:
Island Colonizations
Endicott and Ho39 have recently argued that the human-
chimp divergence is not sufficiently well known to be
useful as a calibration point, and that instead we should
The Am
rely upon archaeologically well-dated episodes within the
time frame of modern human evolution. The suggestion
that the ideal calibration points should be within the
time frame of interest is clearly sensible given the
nonlinear behavior of the clock. However, in practice there
is a severe shortage of such uncontroversial episodes that
can be unambiguously tied to particular instances of
mtDNA variation. The episodes that they propose are
either archaeologically controversial (as in the case of the
first settlement of Australasia, or Sahul, which they tie to
haplogroup P), or not sufficiently well linked to mtDNA
lineages—an example being H1 and H3, already alluded
to above, which they surprisingly date to the Last Glacial
Maximum (rather than the Late Glacial) without any clear
justification. These calibration points were also adopted by
Henn and colleagues.40 There are indeed a few such cases
that can be used, but unfortunately only at very recent
time depths. Nevertheless, these do have some value,
because it is at very recent time depths that the impact of
purifying selection is greatest on the mtDNA age estimates.
One of the few clear-cut archaeologically based calibra-
tion points that we can indeed use to corroborate the new
rate is the settlement of Remote Oceania, which is readily
dated archaeologically because it was a recent expansion—
within the last 3.5 ky—into previously unsettled terri-
tory.116 A subclade of haplogroup B, B4a1a1a, known as
the ‘‘Polynesian motif,’’ can be regarded as originating
from a single founder type107 with an origin to the east of
Wallace’s line in Island Southeast Asia.117 The islands of
Vanuatu in the western Pacific were first settled ~3.2 kya
from the Bismarck Archipelago to the north of New
Guinea,118 and (by using our unpublished data) we esti-
mated a founder age for the Polynesian motif in Vanuatu
of 3.45 (2.6; 4.3) kya (and 3.3 [2.5; 4.0] kya with our syn
rate). This helps to corroborate the corrected rate for the
mid-Holocene time frame, which is crucial also for the
dating of Neolithic dispersals in other parts of the world.
Note, though, that even this example is not watertight:
interisland contacts probably continued until 2.9 kya
(M. Spriggs, personal communication), so it is not impos-
sible that additional diversity from the Bismarck Archi-
pelago was brought to Vanuatu in the preceding 300 years.
However, becausewe aredealingwith a single major founder
lineage in this case, the coalescence time most likely esti-
mates the arrival time of the first settlers. Furthermore, the
archaeological date is necessarily a minimum estimate,
and may well increase by one or two hundred years or so.
Another fairly well-established case of first settlement is
the modern human arrival in the Canary Islands. One of
the subbranches of U6, U6b, presents a clade unique to the
Canary Islands, U6b1b1. The population hardly presents
any other subclade of U6b, suggesting that U6b1b1 emerged
around the time of the first colonization. The earliest
evidence for the human settlement of the Canary Islands
is ~2.2–2.4 kya119 so this provides a further test for the
new calibration in the 0–5000 year range. The age estimate
of the clade is 2.95 (2.1; 3.7) kya and 2.25 (1.7; 2.9) kya
erican Journal of Human Genetics 84, 740–759, June 12, 2009 753
with the syn rate (our unpublished data). Again, a slightly
earlier point estimate does not necessarily imply a rate that
is too slow because, in the absence of a complete record,
archaeological estimates are (like palaeontological esti-
mates) almost inevitably underestimates. Clearly, in both
cases, larger mtDNA sample sizes are also highly desirable.
Henn and colleagues40 suggested the age of M7a as
another well-defined point, this time for the first coloniza-
tion of Japan by modern humans, which dates to at least
32 kya.120 In our calibration, M7a dates to 27.5 (17.3;
38.2) kya, and so encompasses the age of the first human
remains in the archipelago (then part of the mainland).
M7a presents a northeast Asian distribution, with the two
branches (M7a1 and M7a2) both present in Japan42 and
with the latter found so far only in the archipelago, making
an origin of the clade there probable. The problem with M7a
as a calibration point is similar to the one described with U5
and the possibility of a lost nearest ancestor. The closest link
of the clade to its sister clades is via the root of M7, which
dates to nearly 55 kya, opening a large window of opportu-
nities within which the migration might have occurred.
Archaeological Calibration Points:
The Case of the Americas
A further case in which archaeological dating could
be useful has proven more problematic in the past: the
new rate sheds fresh light on the debate concerning
the first colonization of the Americas. Previous HVS-I
estimates for the founding process date to ~20 kya or
more,62 whereas there is no generally accepted archaeolog-
ical evidence for settlement—or certainly, at least, for
a major transcontinental expansion—before 15 kya.121,122
Application of the published synonymous rate yields ages
of ~13.9 kya for the major complete mtDNA founders,123
a little late in view of the recent analysis of human copro-
lites from ~14.3 kya from Oregon124 and evidence of
marine-resource use in Chile from ~14.6 kya.121 On the
other hand, the use of the Mishmar et al. coding-region
rate yields estimates of ~19 kya, which are difficult to
explain archaeologically without assuming coalescence
among Beringian founder lineages that have subsequently
become extinct.125 Although dispersal into the continent
via the Pacific coastal corridor remains a possibility, the
timing of the opening of the coastal route itself remains
unclear, and may not be much more than 15 kya. Our anal-
ysis of recently deposited complete genome sequences
belonging to typical Native American haplogroups52
confirmed the extremely star-like pattern in the major
Native American haplogroups, probably reflecting the
major expansion through the continent, with all of the
American-specific clades dating to ~13.5–15 kya (except
for C1c, dating to ~9 [4.6; 13.6] kya, and X2a, dating to
12.8 [6.1; 19.9] kya). The average age of 14.2 kya supports
a dramatic range and population expansion at around that
time and is in line with the archaeological dating. This is
similar to (though slightly later than) the recent estimate
(~16 ky) using a consensus of the published synonymous
754 The American Journal of Human Genetics 84, 740–759, June 12
and Mishmar et al. rates, where evidence of distinct coastal
and inland routes is also provided.126 The poverty of
inland sites in the period before the Clovis expansion
~13.5 kya, combined with the highly star-like mtDNA
phylogenies suggesting major expansions, might indeed
be reconciled by a Pacific coastal dispersal from Beringia
to South America ~14–15 kya, prior to the opening of the
‘‘ice-free corridor’’ through central Canada,127 paralleling
the recolonization of northern Europe in the Late Glacial.
An estimate of the arrival time itself, however, would
require a more detailed assessment of each likely founder
lineage. Such an analysis might not rule out an entry of
small groups at ~16 kya or even earlier, as suggested for
a few archaeological sites, such as the Meadowcroft Rock-
shelter,128 because the coalescence of the American clades
in East Asia is 17.1 (12.0; 22.5) kya for haplogroup C1
and > 20 kya for A2, B2, D1, and X2a. Similar to the situ-
ation we encountered for the first settlement of Europe
and Japan, the arrival of the first pioneers in America might
have been at any point between the Asian coalescence time
and the expansion of the Native American lineages.
Ancient DNA suggests the possibility of an alternative,
nonphylogeographic approach to archaeological cross-
checking, and indeed, quite recently, the first complete
mtDNA genomes from ancient human remains have been
obtained.129,130 Unfortunately, though, the two genomes
published to date tell us little more calibration-wise than
the minimal age for the haplogroup to which they belong.
The Tyrolean Iceman, at 5.35–5.1 ky old, belongs to a basal
lineage within K1, which dates to > 20 kya. The Paleo-
Eskimo sample, at 4.5–3.4 ky old, is slightly more informa-
tive, falling within a much younger clade dating to 6.5 (5.1;
8.0) kya (with the corrected clock) or 4.7 (3.8; 5.7) kya (with
the syn clock).
Conclusions
We have confirmed that the accumulation of mutations in
human mtDNA has indeed been nonlinear, most likely as
a result of purifying selection (and, to a considerably
smaller extent, and mainly in the control region, satura-
tion), as predicted by Kivisild and colleagues.31 As a result,
coalescence times near the tips of the tree have indeed
been overestimated to some extent by methods that have
assumed a linear coding-region clock.
However, the extent of this overestimation is less than
has generally been asserted.31,34,37 Bayesian approaches to
the problem, as advocated by some researchers, are difficult
to evaluate because of the opaque nature of Markov-Chain
Monte Carlo simulation, but recent ‘‘relaxed-clock’’ esti-
mates39 provide values that seem to be mutually contradic-
tory and make little intuitive sense. This may be because
they have been based on relatively few rather unrepresenta-
tive sequences, a model for sequence evolution that
includes only six rate categories and, in particular, the
implausible assumptions about calibration points referred
to above. The calibration points chosen (the European
LGM and the colonization of Sahul) would stretch the
, 2009
diversity within haplogroup H (H1 and H3 dated to ~12 kya
in our time-dependent clock) while contracting that within
haplogroup P (which dates to 58 [49.3; 66.8] kya with our
corrected clock), producing an effect opposite to our correc-
tion for overestimation at lower time depths. Indeed, it also
runs in the opposite direction from the previous time-
dependent mutation-rate curve proposed by one of its
authors.34–36 Moreover, saturation is likely to have been
overestimated, because it is measured as a function of
pairwise incompatibility, which does not necessarily indi-
cate saturation, but simply (usually resolvable) recurrent
mutation.
Here we have instead taken the approach of estimating
empirically the level of selected versus unselected variation
at any time depth within the tree and using this to correct
the estimates from the linear clock. This demonstrates
that—contra Endicott and Ho39—it is possible to combine
data from throughout the mtDNA genome, with the use of
the chimpanzee-human split as the primary calibration
point, to provide reliable time-depth estimates for the
entire window of anatomically modern human evolution,
without making any a priori assumption regarding age of
clades that should be tested rather than taken as given39,40
and avoiding the issue of circularity. The results mean that
disperal-time estimates using mtDNA can be set on a new
and more reliable footing. However, they also show that,
contrary to the alarmist claims made in recent years, the
outcome does not require a wholesale re-evaluation of
the chronology of human mtDNA evolution.
Supplemental Data
Supplemental Data include five tables and our r and ML genetic
distance value conversion calculator and can be found with this
article online at http://www.ajhg.org/.
Acknowledgments
We thank Toomas Kivisild, Hans-Jurgen Bandelt, Matthew Spriggs,
Jacob Morales, Colin Groves, Stanley Ambrose, Yan Wong, and
Marie-Anne Shaw for invaluable advice and suggestions and Sturla
Ellingvag (of Explico) for the Canarian samples. P.S. was supported
by a Marie Curie Early Stage Training Grant, and we thank the
European Union and the Bradshaw Foundation for financial
support. Arne Rohl is a founder of Genetic Ancestor Ltd. and
a member of its scientific advisory board.
Received: February 11, 2009
Revised: April 20, 2009
Accepted: May 1, 2009
Published online: June 4, 2009
Web Resources
The URLs for data presented herein are as follows:
Geneious, http://www.geneious.com
Network 4, http://www.fluxus-engineering.com/sharenet.htm
Timetree database, http://www.timetree.org
The Am
References
1. Amorim, A. (1999). Archaeogenetics. Journal of Iberian
Archaeology 1, 15–25.
2. Richards, M., Macaulay, V., and Bandelt, H.-J. (2002).
Analyzing genetic data in a model-based framework: Infer-
ences about European prehistory. In Examining the
language-farming dispersal hypothesis, P. Bellwood and
C. Renfrew, eds. (Cambridge: McDonald Institute for
Archaeological Research), pp. 459–466.
3. Bandelt, H.-J., Macaulay, V., and Richards, M. (2002). What
molecules can’t tell us about the spread of languages and the
Neolithic. In Examining the language-farming dispersal
hypothesis, P. Bellwood and C. Renfrew, eds. (Cambridge:
McDonald Institute for Archaeological Research), pp. 99–107.
4. Richards, M., and Macaulay, V. (2001). The mitochondrial
gene tree comes of age. Am. J. Hum. Genet. 68, 1315–1320.
5. Macaulay, V., and Richards, M. (2008). Mitochondrial
genome sequences and their phylogeographic interpreta-
tion. Encyclopedia of Life Sciences (ELS) (Chichester: John
Wiley & Sons, Ltd).
6. Maca-Meyer, N., Gonzalez, A.M., Larruga, J.M., Flores, C.,
and Cabrera, V.M. (2001). Major genomic mitochondrial
lineages delineate early human expansions. BMC Genet.
2, 13.
7. Ingman, M., Kaessmann, H., Paabo, S., and Gyllensten, U.
(2000). Mitochondrial genome variation and the origin of
modern humans. Nature 408, 708–713.
8. Torroni, A., Achilli, A., Macaulay, V., Richards, M., and
Bandelt, H.-J. (2006). Harvesting the fruit of the human
mtDNA tree. Trends Genet. 22, 339–343.
9. Macaulay, V., Hill, C., Achilli, A., Rengo, C., Clarke, D.,
Meehan, W., Blackburn, J., Semino, O., Scozzari, R.,
Cruciani, F., et al. (2005). Single, rapid coastal settlement
of Asia revealed by analysis of complete human mitochon-
drial genomes. Science 308, 1034–1036.
10. Thangaraj, K., Chaubey, G., Kivisild, T., Reddy, A.G., Singh,
V.K., Rasalkar, A.A., and Singh, L. (2005). Reconstructing
the origin of Andaman Islanders. Science 308, 996.
11. Palanichamy, M.G., Sun, C., Agrawa, S., Bandelt, H.-J., Kong,
Q.-P., Khan, F., Wang, C.-Y., Chaudhuri, T.P., Palla, V., and
Zhang, Y.-P. (2004). Phylogeny of mitochondrial DNA macro-
haplogroup N in India based on complete sequencing: Impli-
cations for the peopling of South Asia. Am. J. Hum. Genet.
75, 966–978.
12. Sun, C., Kong, Q.-P., Palanichamy, M., Agrawal, S., Bandelt,
H.-J., Yao, Y.-G., Khan, F., Zhu, C.-L., Chaudhuri, T.K., and
Zhang, Y.-P. (2006). The dazzling array of basal branches in
the mtDNA macrohaplogroup M from India as inferred
from complete genomes. Mol. Biol. Evol. 23, 683–690.
13. Thangaraj, K., Chaubey, G., Singh, V.K., Thanseem, I., Reddy,
A.G., and Singh, L. (2006). In situ origin of deep rooting line-
ages of mitochondrial macrohaplogroup ‘M’ in India. BMC
Genomics 7, 151.
14. Kong, Q.-P., Yao, Y.-G., Sun, C., Bandelt, H.-J., Zhu, C.-L., and
Zhang, Y.-P. (2003). Phylogeny of East Asian mitochondrial
DNA linerages inferred from complete sequences. Am. J.
Hum. Genet. 73, 671–676.
15. Kong, Q.-P., Bandelt, H.-J., Sun, C., Yao, Y.-G., Salas, A.,
Achilli, A., Wang, C.-Y., Zhong, L., Zhu, C.-L., Wu, S.-F.,
et al. (2006). Updating the East Asian mtDNA phylogeny: A
erican Journal of Human Genetics 84, 740–759, June 12, 2009 755
prerequisite for the identification of pathogenic mutations.
Hum. Mol. Genet. 15, 2076–2086.
16. Ingman, M., and Gyllensten, U. (2003). Mitochondrial
genome variation and evolutionary history of Australian
and New Guinean aborigines. Genome Res. 13, 1600–1606.
17. van Holst Pellekaan, S.M., Ingman, M., Roberts-Thomson, J.,
and Harding, R.M. (2006). Mitochondrial genomics identifies
major haplogroups in Aboriginal Australians. Am. J. Phys.
Anthrop. 131, 282–294.
18. Merriwether, D.A., Hodgson, J.A., Friedlaender, F.R., Allaby,
R., Cerchio, S., Koki, G., and Friedlaender, J.S. (2005). Ancient
mitochondrial M haplogroups identified in the Southwest
Pacific. Proc. Natl. Acad. Sci. USA 102, 13034–13039.
19. Trejaut, J.A., Kivisild, T., Loo, J.H., Lee, C.L., He, C.L., Hsu,
C.J., Li, Z.Y., and Lin, M. (2005). Traces of archaic mitochon-
drial lineages persist in Austronesian-speaking Formosan
populations. PLoS Biol. 3, e247.
20. Achilli, A., Rengo, C., Magri, C., Battaglia, V., Olivieri, A.,
Scozzari, R., Cruciani, F., Zeviani, M., Briem, E., Carelli, V.,
et al. (2004). The molecular dissection of mtDNA haplogroup
H confirms that the Franco-Cantabrian glacial refuge was
a major source for the European gene pool. Am. J. Hum.
Genet. 75, 910–919.
21. Achilli, A., Rengo, C., Battaglia, V., Pala, M., Olivieri, A.,
Fomarino, S., Magri, C., Scozzari, R., Babudri, N., Santa-
chiara-Benerecetti, A.S., et al. (2005). Saami and Berbers—
An unexpected mitochondrial DNA link. Am. J. Hum. Genet.
76, 883–886.
22. Roostalu, U., Kutuev, I., Loogvali, E.L., Metspalu, E., Tambets,
K., Reidla, M., Khusnutdinova, E., Usanga, E., Kivisild, T., and
Villems, R. (2007). Origin and expansion of haplogroup H,
the dominant human mitochondrial DNA lineage in west
Eurasia: The Near Eastern and Caucasian perspective. Mol.
Biol. Evol. 24, 436–448.
23. Olivieri, A., Achilli, A., Pala, M., Battaglia, V., Fornarino, S.,
Al-Zahery, N., Scozzari, R., Cruciani, F., Behar, D.M., Dugou-
jon, J.-M., et al. (2006). The mtDNA legacy of the Levantine
Early Upper Palaeolithic in Africa. Science 314, 1767–1770.
24. Andrews, R.M., Kubacka, I., Chinnery, P.F., Lightowlers, R.,
Turnbull, D., and Howell, N. (1999). Reanalysis and revision
of the Cambridge reference sequence for human mitochon-
drial DNA. Nat. Genet. 23, 147.
25. Mishmar, D., Ruiz-Pesini, E., Golik, P., Macaulay, V., Clark,
A.G., Hosseini, S., Brandon, M., Easley, K., Chen, E., Brown,
M.D., et al. (2003). Natural selection shaped regional mtDNA
variation in humans. Proc. Natl. Acad. Sci. USA 100,
171–176.
26. Gerber, A.S., Loggins, R., Kumar, S., and Dowling, T.E. (2001).
Does nonneutral evolution shape observed patterns of DNA
variation in animal mitochondrial genomes? Annu. Rev.
Genet. 35, 539–566.
27. Nachman, M.W., Brown, W.M., Stoneking, M., and Aquadro,
C.F. (1996). Nonneutral mitochondrial DNA variation in
humans and chimpanzees. Genetics 142, 953–963.
28. Torroni, A., Rengo, C., Guida, V., Cruciani, F., Sellitto, D.,
Coppa, A., Calderon, F.L., Simionati, B., Valle, G., Richards,
M., et al. (2001). Do the four clades of the mtDNA hap-
logroup L2 evolve at different rates? Am. J. Hum. Genet.
69, 1348–1356.
29. Howell, N., Elson, J.L., Turnbull, D.M., and Herrnstadt, C.
(2004). African haplogroup L mtDNA sequences show viola-
tions of clock-like evolution. Mol. Biol. Evol. 21, 1843–1854.
756 The American Journal of Human Genetics 84, 740–759, June 12,
30. Elson, J.L., Turnbull, D.M., and Howell, N. (2004). Compara-
tive genomics and the evolution of human mitochondrial
DNA: Assessing the effects of selection. Am. J. Hum. Genet.
74, 239–248.
31. Kivisild, T., Shen, P., Wall, D.P., Do, B., Sung, R., Davis, K.,
Passarino, G., Underhill, P.A., Scharfe, C., Torroni, A., et al.
(2006). The role of selection in the evolution of human mito-
chondrial genomes. Genetics 172, 373–387.
32. Ruiz-Pesini, E., and Wallace, D.C. (2006). Evidence for adap-
tive selection acting on the tRNA and rRNA genes of human
mitochondrial DNA. Hum. Mutat. 27, 1072–1081.
33. Kimura, M. (1983). The neutral theory of molecular evolu-
tion (Cambridge: Cambridge University Press).
34. Ho, S.Y., Phillips, M., Cooper, A., and Drummond, A.J.
(2005). Time dependency of molecular rate estimates and
systematic overestimation of recent divergence times. Mol.
Biol. Evol. 22, 1561–1568.
35. Ho, S.Y., and Larson, G. (2006). Molecular clocks: When
times are a-changin’. Trends Genet. 22, 79–83.
36. Ho, S.Y., Shapiro, B., Phillips, M., Cooper, A., and Drum-
mond, A.J. (2007). Evidence for time dependency of molec-
ular rate estimates. Syst. Biol. 56, 515–522.
37. Penny, D. (2005). Relativity for molecular clocks. Nature 436,
183–184.
38. Howell, N., Smejkal, C.B., Mackey, D.A., Chinnery, P.F., Turn-
bull, D.M., and Herrnstadt, C. (2003). The pedigree rate of
sequence divergence in the human mitochondrial genome:
There is a difference between phylogenetic and pedigree
rates. Am. J. Hum. Genet. 72, 659–670.
39. Endicott, P., and Ho, S.Y.W. (2008). A Bayesian evaluation of
human mitochondrial substitution rates. Am. J. Hum. Genet.
82, 895–902.
40. Henn, B.M., Gignoux, C.R., Feldman, M.W., and Mountain,
J.L. (2009). Characterizing the time dependency of human
mitochondrial DNA mutation rate estimates. Mol. Biol.
Evol. 26, 217–230.
41. Coble, M.D., Just, R.S., O’Callaghan, J.E., Letmanyi, I.H.,
Peterson, C.T., Irwin, J.A., and Parsons, T.J. (2004). Single
nucleotide polymorphisms over the entire mtDNA genome
that increase the power of forensic testing in Caucasians.
Int. J. Legal Med. 118, 137–146.
42. Tanaka, M., Cabrera, V.M., Gonzalez, A.M., Larruga, J.M.,
Takeyasu, T., Fuku, N., Guo, L.-J., Hirose, R., Fujita, Y., Kurata,
M., et al. (2004). Mitochondrial genome variation in Eastern
Asia and the peopling of Japan. Genome Res. 14, 1832–1850.
43. Maca-Meyer, N., Gonzalez, A.M., Pestano, J., Flores, C.,
Larruga, J.M., and Cabrera, V.M. (2003). Mitochondrial
DNA transit between West Asia and North Africa inferred
from U6 phylogeography. BMC Genet. 4, 15.
44. Friedlaender, J., Schurr, T., Gentz, F., Koki, G., Friedlaender, F.,
Horvat, G., Babb, P., Cerchio, S., Kaestle, F., Schanfield, M.,
et al. (2005). Expanding Southwest Pacific mitochondrial
haplogroups P and Q. Mol. Biol. Evol. 22, 1506–1517.
45. Starikovskaya, Y.B., Sukernik, R.I., Derbeneva, O.A., Volodko,
N.V., Torroni, A., Ruiz-Pesini, E., Brown, M.D., Lott, M.T.,
Hosseini, S.H., Huoponen, K., et al. (2005). Mitochondrial
DNA diversity in indigenous populations of the southern
extent of Siberia, and the origins of native American hap-
logroups. Ann. Hum. Genet. 69, 67–89.
46. Behar, D.M., Metspalu, E., Kivisild, T., Achilli, A., Hadid, Y.,
Tzur, S., Pereira, L., Amorim, A., Quintana-Murci, L., Maja-
maa, K., et al. (2006). The matrilineal ancestry of Ashkenazi
2009
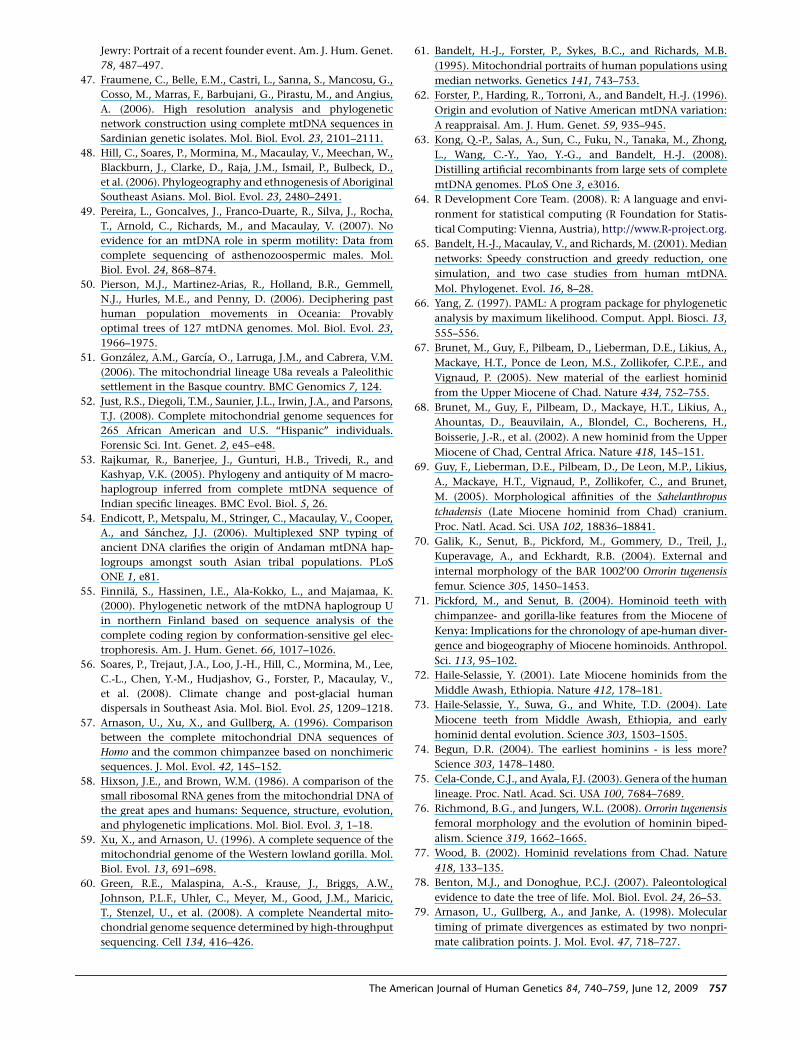
Jewry: Portrait of a recent founder event. Am. J. Hum. Genet.
78, 487–497.
47. Fraumene, C., Belle, E.M., Castri, L., Sanna, S., Mancosu, G.,
Cosso, M., Marras, F., Barbujani, G., Pirastu, M., and Angius,
A. (2006). High resolution analysis and phylogenetic
network construction using complete mtDNA sequences in
Sardinian genetic isolates. Mol. Biol. Evol. 23, 2101–2111.
48. Hill, C., Soares, P., Mormina, M., Macaulay, V., Meechan, W.,
Blackburn, J., Clarke, D., Raja, J.M., Ismail, P., Bulbeck, D.,
et al. (2006). Phylogeography and ethnogenesis of Aboriginal
Southeast Asians. Mol. Biol. Evol. 23, 2480–2491.
49. Pereira, L., Goncalves, J., Franco-Duarte, R., Silva, J., Rocha,
T., Arnold, C., Richards, M., and Macaulay, V. (2007). No
evidence for an mtDNA role in sperm motility: Data from
complete sequencing of asthenozoospermic males. Mol.
Biol. Evol. 24, 868–874.
50. Pierson, M.J., Martinez-Arias, R., Holland, B.R., Gemmell,
N.J., Hurles, M.E., and Penny, D. (2006). Deciphering past
human population movements in Oceania: Provably
optimal trees of 127 mtDNA genomes. Mol. Biol. Evol. 23,
1966–1975.
51. Gonzalez, A.M., Garcıa, O., Larruga, J.M., and Cabrera, V.M.
(2006). The mitochondrial lineage U8a reveals a Paleolithic
settlement in the Basque country. BMC Genomics 7, 124.
52. Just, R.S., Diegoli, T.M., Saunier, J.L., Irwin, J.A., and Parsons,
T.J. (2008). Complete mitochondrial genome sequences for
265 African American and U.S. ‘‘Hispanic’’ individuals.
Forensic Sci. Int. Genet. 2, e45–e48.
53. Rajkumar, R., Banerjee, J., Gunturi, H.B., Trivedi, R., and
Kashyap, V.K. (2005). Phylogeny and antiquity of M macro-
haplogroup inferred from complete mtDNA sequence of
Indian specific lineages. BMC Evol. Biol. 5, 26.
54. Endicott, P., Metspalu, M., Stringer, C., Macaulay, V., Cooper,
A., and Sanchez, J.J. (2006). Multiplexed SNP typing of
ancient DNA clarifies the origin of Andaman mtDNA hap-
logroups amongst south Asian tribal populations. PLoS
ONE 1, e81.
55. Finnila, S., Hassinen, I.E., Ala-Kokko, L., and Majamaa, K.
(2000). Phylogenetic network of the mtDNA haplogroup U
in northern Finland based on sequence analysis of the
complete coding region by conformation-sensitive gel elec-
trophoresis. Am. J. Hum. Genet. 66, 1017–1026.
56. Soares, P., Trejaut, J.A., Loo, J.-H., Hill, C., Mormina, M., Lee,
C.-L., Chen, Y.-M., Hudjashov, G., Forster, P., Macaulay, V.,
et al. (2008). Climate change and post-glacial human
dispersals in Southeast Asia. Mol. Biol. Evol. 25, 1209–1218.
57. Arnason, U., Xu, X., and Gullberg, A. (1996). Comparison
between the complete mitochondrial DNA sequences of
Homo and the common chimpanzee based on nonchimeric
sequences. J. Mol. Evol. 42, 145–152.
58. Hixson, J.E., and Brown, W.M. (1986). A comparison of the
small ribosomal RNA genes from the mitochondrial DNA of
the great apes and humans: Sequence, structure, evolution,
and phylogenetic implications. Mol. Biol. Evol. 3, 1–18.
59. Xu, X., and Arnason, U. (1996). A complete sequence of the
mitochondrial genome of the Western lowland gorilla. Mol.
Biol. Evol. 13, 691–698.
60. Green, R.E., Malaspina, A.-S., Krause, J., Briggs, A.W.,
Johnson, P.L.F., Uhler, C., Meyer, M., Good, J.M., Maricic,
T., Stenzel, U., et al. (2008). A complete Neandertal mito-
chondrial genome sequence determined by high-throughput
sequencing. Cell 134, 416–426.
The Am
61. Bandelt, H.-J., Forster, P., Sykes, B.C., and Richards, M.B.
(1995). Mitochondrial portraits of human populations using
median networks. Genetics 141, 743–753.
62. Forster, P., Harding, R., Torroni, A., and Bandelt, H.-J. (1996).
Origin and evolution of Native American mtDNA variation:
A reappraisal. Am. J. Hum. Genet. 59, 935–945.
63. Kong, Q.-P., Salas, A., Sun, C., Fuku, N., Tanaka, M., Zhong,
L., Wang, C.-Y., Yao, Y.-G., and Bandelt, H.-J. (2008).
Distilling artificial recombinants from large sets of complete
mtDNA genomes. PLoS One 3, e3016.
64. R Development Core Team. (2008). R: A language and envi-
ronment for statistical computing (R Foundation for Statis-
tical Computing: Vienna, Austria), http://www.R-project.org.
65. Bandelt, H.-J., Macaulay, V., and Richards, M. (2001). Median
networks: Speedy construction and greedy reduction, one
simulation, and two case studies from human mtDNA.
Mol. Phylogenet. Evol. 16, 8–28.
66. Yang, Z. (1997). PAML: A program package for phylogenetic
analysis by maximum likelihood. Comput. Appl. Biosci. 13,
555–556.
67. Brunet, M., Guy, F., Pilbeam, D., Lieberman, D.E., Likius, A.,
Mackaye, H.T., Ponce de Leon, M.S., Zollikofer, C.P.E., and
Vignaud, P. (2005). New material of the earliest hominid
from the Upper Miocene of Chad. Nature 434, 752–755.
68. Brunet, M., Guy, F., Pilbeam, D., Mackaye, H.T., Likius, A.,
Ahountas, D., Beauvilain, A., Blondel, C., Bocherens, H.,
Boisserie, J.-R., et al. (2002). A new hominid from the Upper
Miocene of Chad, Central Africa. Nature 418, 145–151.
69. Guy, F., Lieberman, D.E., Pilbeam, D., De Leon, M.P., Likius,
A., Mackaye, H.T., Vignaud, P., Zollikofer, C., and Brunet,
M. (2005). Morphological affinities of the Sahelanthropus
tchadensis (Late Miocene hominid from Chad) cranium.
Proc. Natl. Acad. Sci. USA 102, 18836–18841.
70. Galik, K., Senut, B., Pickford, M., Gommery, D., Treil, J.,
Kuperavage, A., and Eckhardt, R.B. (2004). External and
internal morphology of the BAR 1002000 Orrorin tugenensis
femur. Science 305, 1450–1453.
71. Pickford, M., and Senut, B. (2004). Hominoid teeth with
chimpanzee- and gorilla-like features from the Miocene of
Kenya: Implications for the chronology of ape-human diver-
gence and biogeography of Miocene hominoids. Anthropol.
Sci. 113, 95–102.
72. Haile-Selassie, Y. (2001). Late Miocene hominids from the
Middle Awash, Ethiopia. Nature 412, 178–181.
73. Haile-Selassie, Y., Suwa, G., and White, T.D. (2004). Late
Miocene teeth from Middle Awash, Ethiopia, and early
hominid dental evolution. Science 303, 1503–1505.
74. Begun, D.R. (2004). The earliest hominins - is less more?
Science 303, 1478–1480.
75. Cela-Conde, C.J., and Ayala, F.J. (2003). Genera of the human
lineage. Proc. Natl. Acad. Sci. USA 100, 7684–7689.
76. Richmond, B.G., and Jungers, W.L. (2008). Orrorin tugenensis
femoral morphology and the evolution of hominin biped-
alism. Science 319, 1662–1665.
77. Wood, B. (2002). Hominid revelations from Chad. Nature
418, 133–135.
78. Benton, M.J., and Donoghue, P.C.J. (2007). Paleontological
evidence to date the tree of life. Mol. Biol. Evol. 24, 26–53.
79. Arnason, U., Gullberg, A., and Janke, A. (1998). Molecular
timing of primate divergences as estimated by two nonpri-
mate calibration points. J. Mol. Evol. 47, 718–727.
erican Journal of Human Genetics 84, 740–759, June 12, 2009 757
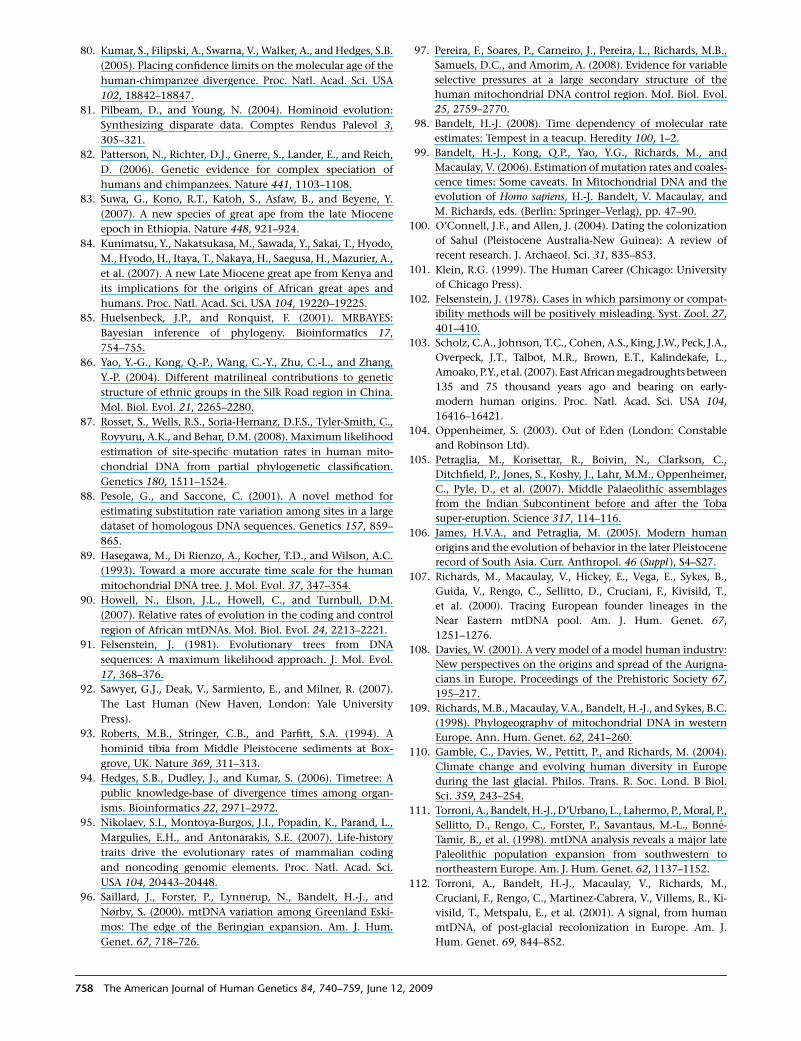
80. Kumar, S., Filipski, A., Swarna, V., Walker, A., and Hedges, S.B.
(2005). Placing confidence limits on the molecular age of the
human-chimpanzee divergence. Proc. Natl. Acad. Sci. USA
102, 18842–18847.
81. Pilbeam, D., and Young, N. (2004). Hominoid evolution:
Synthesizing disparate data. Comptes Rendus Palevol 3,
305–321.
82. Patterson, N., Richter, D.J., Gnerre, S., Lander, E., and Reich,
D. (2006). Genetic evidence for complex speciation of
humans and chimpanzees. Nature 441, 1103–1108.
83. Suwa, G., Kono, R.T., Katoh, S., Asfaw, B., and Beyene, Y.
(2007). A new species of great ape from the late Miocene
epoch in Ethiopia. Nature 448, 921–924.
84. Kunimatsu, Y., Nakatsukasa, M., Sawada, Y., Sakai, T., Hyodo,
M., Hyodo, H., Itaya, T., Nakaya, H., Saegusa, H., Mazurier, A.,
et al. (2007). A new Late Miocene great ape from Kenya and
its implications for the origins of African great apes and
humans. Proc. Natl. Acad. Sci. USA 104, 19220–19225.
85. Huelsenbeck, J.P., and Ronquist, F. (2001). MRBAYES:
Bayesian inference of phylogeny. Bioinformatics 17,
754–755.
86. Yao, Y.-G., Kong, Q.-P., Wang, C.-Y., Zhu, C.-L., and Zhang,
Y.-P. (2004). Different matrilineal contributions to genetic
structure of ethnic groups in the Silk Road region in China.
Mol. Biol. Evol. 21, 2265–2280.
87. Rosset, S., Wells, R.S., Soria-Hernanz, D.F.S., Tyler-Smith, C.,
Royyuru, A.K., and Behar, D.M. (2008). Maximum likelihood
estimation of site-specific mutation rates in human mito-
chondrial DNA from partial phylogenetic classification.
Genetics 180, 1511–1524.
88. Pesole, G., and Saccone, C. (2001). A novel method for
estimating substitution rate variation among sites in a large
dataset of homologous DNA sequences. Genetics 157, 859–
865.
89. Hasegawa, M., Di Rienzo, A., Kocher, T.D., and Wilson, A.C.
(1993). Toward a more accurate time scale for the human
mitochondrial DNA tree. J. Mol. Evol. 37, 347–354.
90. Howell, N., Elson, J.L., Howell, C., and Turnbull, D.M.
(2007). Relative rates of evolution in the coding and control
region of African mtDNAs. Mol. Biol. Evol. 24, 2213–2221.
91. Felsenstein, J. (1981). Evolutionary trees from DNA
sequences: A maximum likelihood approach. J. Mol. Evol.
17, 368–376.
92. Sawyer, G.J., Deak, V., Sarmiento, E., and Milner, R. (2007).
The Last Human (New Haven, London: Yale University
Press).
93. Roberts, M.B., Stringer, C.B., and Parfitt, S.A. (1994). A
hominid tibia from Middle Pleistocene sediments at Box-
grove, UK. Nature 369, 311–313.
94. Hedges, S.B., Dudley, J., and Kumar, S. (2006). Timetree: A
public knowledge-base of divergence times among organ-
isms. Bioinformatics 22, 2971–2972.
95. Nikolaev, S.I., Montoya-Burgos, J.I., Popadin, K., Parand, L.,
Margulies, E.H., and Antonarakis, S.E. (2007). Life-history
traits drive the evolutionary rates of mammalian coding
and noncoding genomic elements. Proc. Natl. Acad. Sci.
USA 104, 20443–20448.
96. Saillard, J., Forster, P., Lynnerup, N., Bandelt, H.-J., and
Nørby, S. (2000). mtDNA variation among Greenland Eski-
mos: The edge of the Beringian expansion. Am. J. Hum.
Genet. 67, 718–726.
758 The American Journal of Human Genetics 84, 740–759, June 12,
97. Pereira, F., Soares, P., Carneiro, J., Pereira, L., Richards, M.B.,
Samuels, D.C., and Amorim, A. (2008). Evidence for variable
selective pressures at a large secondary structure of the
human mitochondrial DNA control region. Mol. Biol. Evol.
25, 2759–2770.
98. Bandelt, H.-J. (2008). Time dependency of molecular rate
estimates: Tempest in a teacup. Heredity 100, 1–2.
99. Bandelt, H.-J., Kong, Q.P., Yao, Y.G., Richards, M., and
Macaulay, V. (2006). Estimation of mutation rates and coales-
cence times: Some caveats. In Mitochondrial DNA and the
evolution of Homo sapiens, H.-J. Bandelt, V. Macaulay, and
M. Richards, eds. (Berlin: Springer–Verlag), pp. 47–90.
100. O’Connell, J.F., and Allen, J. (2004). Dating the colonization
of Sahul (Pleistocene Australia-New Guinea): A review of
recent research. J. Archaeol. Sci. 31, 835–853.
101. Klein, R.G. (1999). The Human Career (Chicago: University
of Chicago Press).
102. Felsenstein, J. (1978). Cases in which parsimony or compat-
ibility methods will be positively misleading. Syst. Zool. 27,
401–410.
103. Scholz, C.A., Johnson, T.C., Cohen, A.S., King, J.W., Peck, J.A.,
Overpeck, J.T., Talbot, M.R., Brown, E.T., Kalindekafe, L.,
Amoako, P.Y., et al. (2007). East Africanmegadroughts between
135 and 75 thousand years ago and bearing on early-
modern human origins. Proc. Natl. Acad. Sci. USA 104,
16416–16421.
104. Oppenheimer, S. (2003). Out of Eden (London: Constable
and Robinson Ltd).
105. Petraglia, M., Korisettar, R., Boivin, N., Clarkson, C.,
Ditchfield, P., Jones, S., Koshy, J., Lahr, M.M., Oppenheimer,
C., Pyle, D., et al. (2007). Middle Palaeolithic assemblages
from the Indian Subcontinent before and after the Toba
super-eruption. Science 317, 114–116.
106. James, H.V.A., and Petraglia, M. (2005). Modern human
origins and the evolution of behavior in the later Pleistocene
record of South Asia. Curr. Anthropol. 46 (Suppl ), S4–S27.
107. Richards, M., Macaulay, V., Hickey, E., Vega, E., Sykes, B.,
Guida, V., Rengo, C., Sellitto, D., Cruciani, F., Kivisild, T.,
et al. (2000). Tracing European founder lineages in the
Near Eastern mtDNA pool. Am. J. Hum. Genet. 67,
1251–1276.
108. Davies, W. (2001). A very model of a model human industry:
New perspectives on the origins and spread of the Aurigna-
cians in Europe. Proceedings of the Prehistoric Society 67,
195–217.
109. Richards, M.B., Macaulay, V.A., Bandelt, H.-J., and Sykes, B.C.
(1998). Phylogeography of mitochondrial DNA in western
Europe. Ann. Hum. Genet. 62, 241–260.
110. Gamble, C., Davies, W., Pettitt, P., and Richards, M. (2004).
Climate change and evolving human diversity in Europe
during the last glacial. Philos. Trans. R. Soc. Lond. B Biol.
Sci. 359, 243–254.
111. Torroni, A., Bandelt, H.-J., D’Urbano, L., Lahermo, P., Moral, P.,
Sellitto, D., Rengo, C., Forster, P., Savantaus, M.-L., Bonne-
Tamir, B., et al. (1998). mtDNA analysis reveals a major late
Paleolithic population expansion from southwestern to
northeastern Europe. Am. J. Hum. Genet. 62, 1137–1152.
112. Torroni, A., Bandelt, H.-J., Macaulay, V., Richards, M.,
Cruciani, F., Rengo, C., Martinez-Cabrera, V., Villems, R., Ki-
visild, T., Metspalu, E., et al. (2001). A signal, from human
mtDNA, of post-glacial recolonization in Europe. Am. J.
Hum. Genet. 69, 844–852.
2009
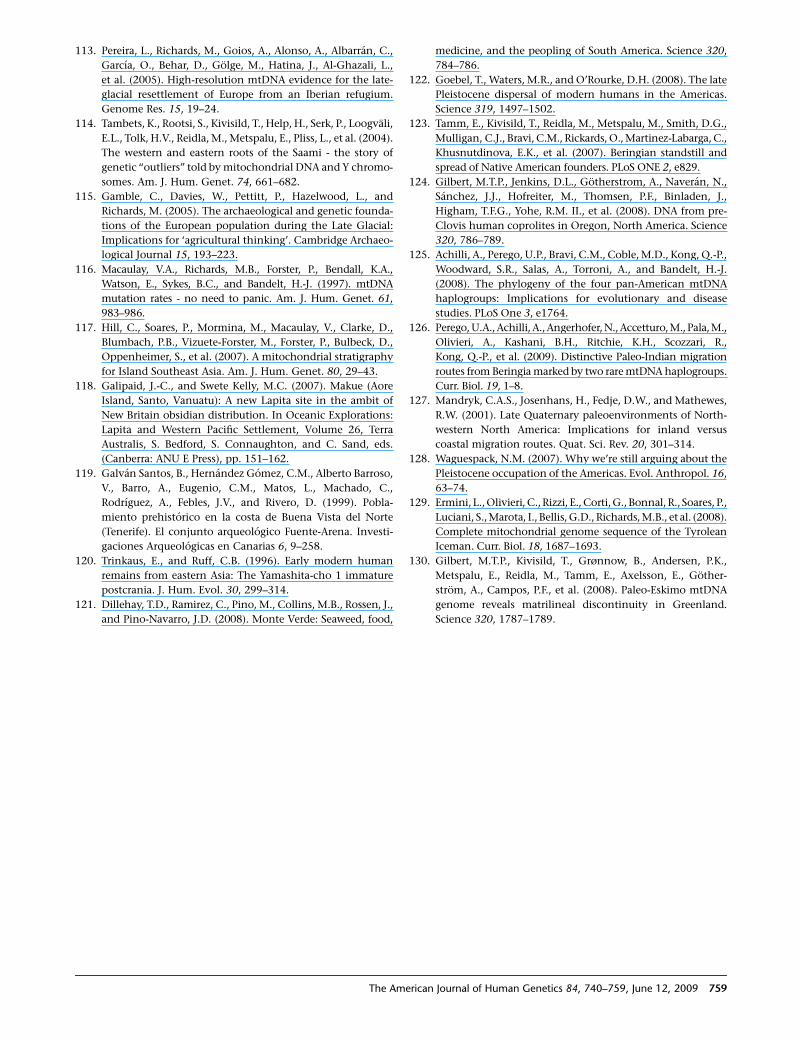
113. Pereira, L., Richards, M., Goios, A., Alonso, A., Albarran, C.,
Garcıa, O., Behar, D., Golge, M., Hatina, J., Al-Ghazali, L.,
et al. (2005). High-resolution mtDNA evidence for the late-
glacial resettlement of Europe from an Iberian refugium.
Genome Res. 15, 19–24.
114. Tambets, K., Rootsi, S., Kivisild, T., Help, H., Serk, P., Loogvali,
E.L., Tolk, H.V., Reidla, M., Metspalu, E., Pliss, L., et al. (2004).
The western and eastern roots of the Saami - the story of
genetic ‘‘outliers’’ told by mitochondrial DNA and Y chromo-
somes. Am. J. Hum. Genet. 74, 661–682.
115. Gamble, C., Davies, W., Pettitt, P., Hazelwood, L., and
Richards, M. (2005). The archaeological and genetic founda-
tions of the European population during the Late Glacial:
Implications for ‘agricultural thinking’. Cambridge Archaeo-
logical Journal 15, 193–223.
116. Macaulay, V.A., Richards, M.B., Forster, P., Bendall, K.A.,
Watson, E., Sykes, B.C., and Bandelt, H.-J. (1997). mtDNA
mutation rates - no need to panic. Am. J. Hum. Genet. 61,
983–986.
117. Hill, C., Soares, P., Mormina, M., Macaulay, V., Clarke, D.,
Blumbach, P.B., Vizuete-Forster, M., Forster, P., Bulbeck, D.,
Oppenheimer, S., et al. (2007). A mitochondrial stratigraphy
for Island Southeast Asia. Am. J. Hum. Genet. 80, 29–43.
118. Galipaid, J.-C., and Swete Kelly, M.C. (2007). Makue (Aore
Island, Santo, Vanuatu): A new Lapita site in the ambit of
New Britain obsidian distribution. In Oceanic Explorations:
Lapita and Western Pacific Settlement, Volume 26, Terra
Australis, S. Bedford, S. Connaughton, and C. Sand, eds.
(Canberra: ANU E Press), pp. 151–162.
119. Galvan Santos, B., Hernandez Gomez, C.M., Alberto Barroso,
V., Barro, A., Eugenio, C.M., Matos, L., Machado, C.,
Rodrıguez, A., Febles, J.V., and Rivero, D. (1999). Pobla-
miento prehistorico en la costa de Buena Vista del Norte
(Tenerife). El conjunto arqueologico Fuente-Arena. Investi-
gaciones Arqueologicas en Canarias 6, 9–258.
120. Trinkaus, E., and Ruff, C.B. (1996). Early modern human
remains from eastern Asia: The Yamashita-cho 1 immature
postcrania. J. Hum. Evol. 30, 299–314.
121. Dillehay, T.D., Ramirez, C., Pino, M., Collins, M.B., Rossen, J.,
and Pino-Navarro, J.D. (2008). Monte Verde: Seaweed, food,
The Am
medicine, and the peopling of South America. Science 320,
784–786.
122. Goebel, T., Waters, M.R., and O’Rourke, D.H. (2008). The late
Pleistocene dispersal of modern humans in the Americas.
Science 319, 1497–1502.
123. Tamm, E., Kivisild, T., Reidla, M., Metspalu, M., Smith, D.G.,
Mulligan, C.J., Bravi, C.M., Rickards, O., Martinez-Labarga, C.,
Khusnutdinova, E.K., et al. (2007). Beringian standstill and
spread of Native American founders. PLoS ONE 2, e829.
124. Gilbert, M.T.P., Jenkins, D.L., Gotherstrom, A., Naveran, N.,
Sanchez, J.J., Hofreiter, M., Thomsen, P.F., Binladen, J.,
Higham, T.F.G., Yohe, R.M. II., et al. (2008). DNA from pre-
Clovis human coprolites in Oregon, North America. Science
320, 786–789.
125. Achilli, A., Perego, U.P., Bravi, C.M., Coble, M.D., Kong, Q.-P.,
Woodward, S.R., Salas, A., Torroni, A., and Bandelt, H.-J.
(2008). The phylogeny of the four pan-American mtDNA
haplogroups: Implications for evolutionary and disease
studies. PLoS One 3, e1764.
126. Perego, U.A.,Achilli, A.,Angerhofer, N.,Accetturo, M., Pala, M.,
Olivieri, A., Kashani, B.H., Ritchie, K.H., Scozzari, R.,
Kong, Q.-P., et al. (2009). Distinctive Paleo-Indian migration
routes from Beringia marked by two rare mtDNA haplogroups.
Curr. Biol. 19, 1–8.
127. Mandryk, C.A.S., Josenhans, H., Fedje, D.W., and Mathewes,
R.W. (2001). Late Quaternary paleoenvironments of North-
western North America: Implications for inland versus
coastal migration routes. Quat. Sci. Rev. 20, 301–314.
128. Waguespack, N.M. (2007). Why we’re still arguing about the
Pleistocene occupation of the Americas. Evol. Anthropol. 16,
63–74.
129. Ermini, L., Olivieri, C., Rizzi, E., Corti, G., Bonnal, R., Soares, P.,
Luciani, S., Marota, I., Bellis, G.D., Richards, M.B., et al. (2008).
Complete mitochondrial genome sequence of the Tyrolean
Iceman. Curr. Biol. 18, 1687–1693.
130. Gilbert, M.T.P., Kivisild, T., Grønnow, B., Andersen, P.K.,
Metspalu, E., Reidla, M., Tamm, E., Axelsson, E., Gother-
strom, A., Campos, P.F., et al. (2008). Paleo-Eskimo mtDNA
genome reveals matrilineal discontinuity in Greenland.
Science 320, 1787–1789.
erican Journal of Human Genetics 84, 740–759, June 12, 2009 759
Copyright © 2022 FDOKUMEN