Controls on the East Asian monsoon during the last glacial cycle, based on comparison between Hulu...
12
Controls on the East Asian monsoon during the last glacial cycle, based on comparison between Hulu Cave and polar ice-core records E.J. Rohling a, * , Q.S. Liu b , A.P. Roberts a , J.D. Stanford a , S.O. Rasmussen c , P.L. Langen c , M. Siddall d a School of Ocean and Earth Science, University of Southampton, National Oceanography Centre, European Way, Southampton SO14 3ZH, UK b Paleomagnetism and Geochronology Laboratory (SKL-LE), Institute of Geology and Geophysics, Chinese Academy of Sciences, Beijing 100029, People’s Republic of China c Centre for Ice and Climate, Niels Bohr Institute, University of Copenhagen, Juliane Maries Vej 30, 2100 Copenhagen O, Denmark d Department of Earth Science, University of Bristol, Queen’s Road, Bristol BS8 1RJ, UK article info Article history: Received 5 December 2008 Received in revised form 8 September 2009 Accepted 14 September 2009 abstract Previous studies have suggested a sound chronological correlation between the Hulu Cave record (East Asian monsoon) and Greenland ice-core records, which implies a dominant control of northern hemi- sphere climate processes on monsoon intensity. We present an objective, straightforward statistical evaluation that challenges this generally accepted paradigm for sub-orbital variability. We propose a more flexible, global interpretation, which takes into account a broad range of variability in the signal structures in the Hulu Cave and polar ice-core records, rather than a limited number of major transitions. Our analysis employs the layer-counted Greenland Ice-Core Chronology 2005 (GICC05), which was developed for Greenland records and has since been applied – via methane synchronisation – to the high-resolution d 18 O ice series from EPICA Dronning Maud Land (EDML). The GICC05 chronology allows these ice-core records to be compared to the U–Th dated Hulu Cave record within relatively narrow (w3%) bounds of age uncertainty. Following previous suggestions, our proposed interpretation suggests that the East Asian monsoon is influenced by a combination of northern hemisphere ‘pull’ (which is more intense during boreal warm periods), and southern hemisphere ‘push’ (which is more intense monsoon during austral cold periods). Our analysis strongly suggests a dominant control on millennial-scale monsoon variability by southern hemisphere climate changes during glacial times when the monsoon is weak overall, and control by northern hemisphere climate changes during deglacial and interglacial times when the monsoon is strong. The deduced temporally variable relationship with southern hemisphere climate records offers a statistically more plausible reason for the apparent coincidence of major East Asian monsoon transitions with northern hemisphere (Dansgaard–Oeschger, DO) climate events during glacial times, than the traditional a priori interpretation of strict northern hemisphere control. Ó 2009 Elsevier Ltd. All rights reserved. 1. Introduction Since publication of the intensively U–Th dated speleothem d 18 O record of the last glacial cycle from Hulu and Dongge Caves in Southern China (Fig. 1)(Wang et al., 2001; Yuan et al., 2004), there has been considerable interest in the general similarity of the millennial-scale signal structure of Chinese speleothem records with that of Greenland ice-core d 18 O ice records (e.g., Wang et al., 2001, 2004; Shackleton et al., 2004; Denton et al., 2005; Clement and Peterson, 2008; Siddall et al., 2008; Skinner, 2008; Zhou et al., 2008). A new layer-counted timescale (GICC05) has become available for the Greenland DYE-3, GRIP and NGRIP ice-cores for the interval between the present and 60 thousand years ago (ka BP) (Andersen et al., 2006; Rasmussen et al., 2006; Vinther et al., 2006; Svensson et al., 2008), which allows temporal comparison with much reduced uncertainty between the Hulu Cave and Greenland climate proxy records. This comparison can now include Antarctic climate proxy records, because the new high-resolution d 18 O ice series from EPICA Dronning Maud Land (EDML) is synchronised in detail to the GICC05-based Greenland d 18 O ice records via methane concentration in air bubbles trapped within the ice (EPICA Community Members, 2006). The locations of the key records discussed in this paper are indicated in Fig. 1 . The composite Hulu Cave speleothem d 18 O record comprises data from several individual speleothems (Fig. 2)(Wang et al., 2001; Yuan et al., 2004). It is considered to reflect variations in the * Corresponding author. E-mail address: [email protected] (E.J. Rohling). Contents lists available at ScienceDirect Quaternary Science Reviews journal homepage: www.elsevier.com/locate/quascirev 0277-3791/$ – see front matter Ó 2009 Elsevier Ltd. All rights reserved. doi:10.1016/j.quascirev.2009.09.007 Quaternary Science Reviews 28 (2009) 3291–3302
Transcript of Controls on the East Asian monsoon during the last glacial cycle, based on comparison between Hulu...

Controls on the East Asian monsoon during the last glacial cycle, basedon comparison between Hulu Cave and polar ice-core records
E.J. Rohling a,*, Q.S. Liu b, A.P. Roberts a, J.D. Stanford a, S.O. Rasmussen c, P.L. Langen c, M. Siddall d
a School of Ocean and Earth Science, University of Southampton, National Oceanography Centre, European Way, Southampton SO14 3ZH, UKb Paleomagnetism and Geochronology Laboratory (SKL-LE), Institute of Geology and Geophysics, Chinese Academy of Sciences, Beijing 100029, People’s Republic of ChinacCentre for Ice and Climate, Niels Bohr Institute, University of Copenhagen, Juliane Maries Vej 30, 2100 Copenhagen O, DenmarkdDepartment of Earth Science, University of Bristol, Queen’s Road, Bristol BS8 1RJ, UK
a r t i c l e i n f o
Article history:Received 5 December 2008Received in revised form8 September 2009Accepted 14 September 2009
a b s t r a c t
Previous studies have suggested a sound chronological correlation between the Hulu Cave record (EastAsian monsoon) and Greenland ice-core records, which implies a dominant control of northern hemi-sphere climate processes on monsoon intensity. We present an objective, straightforward statisticalevaluation that challenges this generally accepted paradigm for sub-orbital variability. We proposea more flexible, global interpretation, which takes into account a broad range of variability in the signalstructures in the Hulu Cave and polar ice-core records, rather than a limited number of major transitions.Our analysis employs the layer-counted Greenland Ice-Core Chronology 2005 (GICC05), which wasdeveloped for Greenland records and has since been applied – via methane synchronisation – to thehigh-resolution d18Oice series from EPICA Dronning Maud Land (EDML). The GICC05 chronology allowsthese ice-core records to be compared to the U–Th dated Hulu Cave record within relatively narrow(w3%) bounds of age uncertainty. Following previous suggestions, our proposed interpretation suggeststhat the East Asian monsoon is influenced by a combination of northern hemisphere ‘pull’ (which is moreintense during boreal warm periods), and southern hemisphere ‘push’ (which is more intense monsoonduring austral cold periods). Our analysis strongly suggests a dominant control on millennial-scalemonsoon variability by southern hemisphere climate changes during glacial times when the monsoon isweak overall, and control by northern hemisphere climate changes during deglacial and interglacialtimes when the monsoon is strong. The deduced temporally variable relationship with southernhemisphere climate records offers a statistically more plausible reason for the apparent coincidence ofmajor East Asian monsoon transitions with northern hemisphere (Dansgaard–Oeschger, DO) climateevents during glacial times, than the traditional a priori interpretation of strict northern hemispherecontrol.
! 2009 Elsevier Ltd. All rights reserved.
1. Introduction
Since publication of the intensively U–Th dated speleothem d18Orecord of the last glacial cycle from Hulu and Dongge Caves inSouthern China (Fig. 1) (Wang et al., 2001; Yuan et al., 2004), therehas been considerable interest in the general similarity of themillennial-scale signal structure of Chinese speleothem recordswith that of Greenland ice-core d18Oice records (e.g., Wang et al.,2001, 2004; Shackleton et al., 2004; Denton et al., 2005; Clementand Peterson, 2008; Siddall et al., 2008; Skinner, 2008; Zhou et al.,2008). A new layer-counted timescale (GICC05) has become
available for the Greenland DYE-3, GRIP and NGRIP ice-cores for theinterval between the present and 60 thousand years ago (ka BP)(Andersen et al., 2006; Rasmussen et al., 2006; Vinther et al., 2006;Svensson et al., 2008), which allows temporal comparison withmuch reduced uncertainty between the Hulu Cave and Greenlandclimate proxy records. This comparison can now include Antarcticclimate proxy records, because the new high-resolution d18Oiceseries from EPICA Dronning Maud Land (EDML) is synchronised indetail to the GICC05-based Greenland d18Oice records via methaneconcentration in air bubbles trapped within the ice (EPICACommunity Members, 2006). The locations of the key recordsdiscussed in this paper are indicated in Fig. 1.
The composite Hulu Cave speleothem d18O record comprisesdata from several individual speleothems (Fig. 2) (Wang et al.,2001; Yuan et al., 2004). It is considered to reflect variations in the
* Corresponding author.E-mail address: [email protected] (E.J. Rohling).
Contents lists available at ScienceDirect
Quaternary Science Reviews
journal homepage: www.elsevier .com/locate/quascirev
0277-3791/$ – see front matter ! 2009 Elsevier Ltd. All rights reserved.doi:10.1016/j.quascirev.2009.09.007
Quaternary Science Reviews 28 (2009) 3291–3302

East Asian summer monsoon intensity. This view is supported byother East Asian speleothem records (Cosford et al., 2008), whichreveal good overall signal similarity with some superimposeddifferences. The monsoon influences the regional d18O of precipi-tation (and so speleothem carbonate) through the so-called‘amount effect’, which causes lighter (more negative) d18O withenhanced precipitation/monsoon intensity (see Wang et al., 2001;Yuan et al., 2004). The high temporal resolution and detailed U–Thdating of the Hulu Cave record provides an excellent template fordeveloping understanding of millennial-scale controls on the Asianmonsoon. Based on results from the GISS climate model, whichincludes d18O simulation in the hydrological cycle, Schmidt (2007)suggested that monsoon region d18O variations are not necessarilya function of regional monsoon climate (near the study site), but
that there is a strong component associated with general low-latitude d18O changes in the ‘global’ monsoon.
Northern hemisphere climate variability is a much-exploredcontrol on the Asian monsoon (see, among many others: Schulzet al., 1998; Wang et al., 2001, 2004; Burns et al., 2003, 2004;Rohling et al., 2003; Yuan et al., 2004; Ivanochko et al., 2005;Weldeab et al., 2007; Cosford et al., 2008; and references therein).Greenland ice-core d18Oice records document a sequence of sharpDansgaard–Oeschger (DO)warming events followed by cooling thatis gradual at first and that then progresses abruptly, yielding a DOcycle with a distinct square-wave (or ‘top-hat’) character (Dans-gaard et al., 1993; Grootes et al., 1993) (red in Fig. 3a). The warm DOinterstadials loosely cluster into groups of progressively smalleramplitude and shorter duration (Bond et al.,1993).Marine sediment
Fig. 1. Map of the sites discussed in the present paper, constructed with the GMT online map creation tool (Martin Weinelt, Kiel: http://www.aquarius.ifm-geomar.de/make_map.html). Site locations plotted are (Longitude, Latitude, Name): 119.2!E, 32. 5!N, Hulu Cave; 108.08!E, 25.28!N, Dongge Cave; 42.30!W, 75.001!N, NGRIP; 37.5!W, 72.5!N, GRIP;0.0684!E, 75.0025!W, EDML.
Fig. 2. The original Hulu and Dongge Cave data as available on the NCDC speleothem data server (http://www.ncdc.noaa.gov/paleo/speleothem.html) (Wang et al., 2001; Yuan et al.,2004). The different colours indicate individual speleothem datasets (see legend). The legend also indicates the typical (2s) dating uncertainties reported for the source records. Ageand d18O offsets between the different speleothem datasets are evident in this presentation. The black record is the composite record used for further analyses in the present paper.
E.J. Rohling et al. / Quaternary Science Reviews 28 (2009) 3291–33023292

cores reveal that, at the cold culmination of each cluster, there isa pronounced DO stadial (sometimes called a ‘Heinrich stadial’),which contains a so-called Heinrich event of massive ice-rafteddebris (IRD) deposition in the North Atlantic (see review inHemming et al., 2004). The Heinrich events took place duringparticularly intense cold episodes, with impacts throughout thenorthern hemisphere and possibly even on a wider scale (foroverviews, see Voelker, 2002; Rohling et al., 2003; Hemming, 2004).
Proxy records attributed to monsoon variability are commonlycorrelated to the Greenland DO cycles (e.g., Schulz et al., 1998;Wang et al., 2001, 2004; Burns et al., 2003, 2004; Rohling et al.,2003; Yuan et al., 2004; Ivanochko et al., 2005; Weldeab et al.,2007; Cosford et al., 2008), where warmer Greenland conditionsrelate to intensified summer monsoons, and colder Greenlandconditions relate to weaker summer monsoons. This inference isreasonable (especially on super-annual timescales) because theduration and intensity of winter snow cover over Asia exertsimportant control on the intensity of the summermonsoon (Meehl,1994, 1997; Overpeck et al., 1996; Barnett et al., 1988). The above-cited monsoon records all have good initial radiometric chrono-logical control, and comparison with the GICC05 chronology forGreenland d18Oice records seems to support correlation betweenthe monsoon records and the DO cycles observed in Greenland andin the layer-counted Cariaco Basin grey-scale record (Lea et al.,2003). However, combined uncertainties in the radiometric datingof monsoon records and in the layer-counted age models of theGreenland and Cariaco records preclude firm conclusions regardingthe accuracy of temporal correlations on centennial time scales.
Chronological uncertainties highlight the importance of chal-lenging the common paradigm whereby monsoon records, such asthe Hulu Cave record, are correlated to Greenland ice-core recordswith respect to millennial-scale climate fluctuations. Alternativeexplanations should be tested and any such alternative solutionshould, given the radiometric age constraints, be similar in absolutetiming to the common paradigm, but could nevertheless haveimportant consequences for understanding processes that controlmonsoon intensity variations. It should also be noted that the U–Th
dating of Hulu Cave is being used to ‘anchor’ other chronologies(e.g., Shackleton et al., 2004; Skinner, 2008), and even to constrainradiocarbon calibration (Weninger and Joris, 2008). Any change inthe correlation paradigm, even if only by a few centuries, maytherefore affect our understanding of radiocarbon calibrationthrough time.
The present study was motivated by Cai et al. (2006), whosuggested that the monsoon-related d18O changes in XiaobailongCave (SW China) may contain information regarding tele-connections with southern hemisphere climate variations. Thoseauthors relate their suggestion to previous work that focused onthe importance of cross-equatorial airflow for monsoon intensity(Clemens et al., 1996; An, 2000; Cai et al., 2006). Unfortunately, Caiet al. (2006) studied only a limited time interval (53–36 ka BP), andmade a brief qualitative case based only on visual comparison usingold ice-core chronologies. Nevertheless, their study marks animportant re-direction of focus to a potential alternative ‘driver’ ofmillennial-scale monsoon variability that has received dispropor-tionately little attention.
The concept of southern hemisphere influences on cross-equa-torial airflow, which thenmodulates monsoon intensity, is not new.Early work on a monsoon intensity index suggested that, even onorbital (multi-millennial) timescales, there might exist not onlya northern temperature control (‘pull’ on the monsoon), but alsoa control from the temperature contrast between the southern andnorthern tropics (‘push’ on the monsoon) (Rossignol-Strick, 1985).The ‘push’ would relate to an enhanced pole to equator tempera-ture gradient in the southern hemisphere, leading to intensifiedtrade wind surges that enhance and intensify the boreal summermonsoon intensity and its northward penetration (see overviews inPedelaborde, 1963; Rossignol-Strick, 1985). Teleconnectionsbetween the Indian monsoon system and middle and uppertropospheric flow patterns in the southern hemisphere have beenfrequently reported (Krishnamurti and Bhalme, 1976; Ramaswamyand Pareek, 1978; Rodwell, 1997). Xue et al. (2004) corroboratedthis observation, and extended the concept to include the EastAsian monsoon.
Fig. 3. Key data sets discussed in the present paper. (a) Composite Hulu Cave d18O time series on its original U–Th based chronology (grey); NGRIP d18Oice series on the GICC05timescale (red); and –EDML d18Oice series on the GICC05 chronology (blue). The timings of Heinrich Events are indicated relative to NGRIP d18Oice based on the position ofsignificant dust anomalies in GISP2 relative to the GISP2 d18Oice record (Rohling et al., 2003). (b) Summer insolation changes at 60!N, 30!N, 30!S, and 60!S (Berger and Loutre,1991; Berger, 1992).
E.J. Rohling et al. / Quaternary Science Reviews 28 (2009) 3291–3302 3293

Onmonthly timescales (30–60 day oscillation), southerly surgescaused important intensification of the boreal summer monsoon inthe Indian and Pacific regions during 1979–1983 (Shresta andMurakami, 1988). Similar (related) oscillations appear to affect theEast Asian monsoon (Love, 1985; Xue et al., 2004). On multi-annualtimescales, a positive correlation exists between cold/high phasesof the Southern Oscillation Index and enhanced intensity of theIndian summer monsoon (Hastenrath, 1991). On multi-decadaltimescales, early work suggested a correlation between 2 to 4!
displacements of 40-year average latitudes of the main atmo-spheric circulation features in the southern Indian Ocean andAustralasian sector, and variations in the strength of the east Asianmonsoon (Lamb, 1972, p. 300). Rohling et al. (2003) proposed thatsouthern hemisphere cooling may have intensified boreal summermonsoons on centennial–millennial timescales as well, and thatmonsoon-related interhemispheric latent heat transfer might(partially) explain the anomalously long durations of DO intersta-dials that coincided with marked Antarctic cooling events (espe-cially interstadials 12, 8, and 1: Blunier et al., 1998; Marchal et al.,1999; Shackleton et al., 2000; EPICA Community Members, 2006).The Xiaobailong Cave record (Cai et al., 2006) supports this notion.Further support comes from a detailed study of the (end of the)Younger Dryas in Africa (Talbot et al., 2007).
The above discussion illustrates that some sort of ‘push’ mech-anism could be important for the boreal summer monsoon. Inaddition, it is possible that oscillations on short (seasonal to inter-annual) timescales do not portray the complete potential depen-dence of the monsoon on southern hemisphere processesassociated with sustained (millennial-scale) global climate change.In this paper, we adopt a ‘diagnostic’ approach, using a key record ofmillennial-scale monsoon variability to investigate whether itcontains statistically significant signs of variability that correspondwith well-established southern hemisphere climate fluctuations.Specifically, we evaluate whether there are any indications thata ‘push’ mechanism may have affected boreal summer monsoonintensity on millennial timescales by comparing (using straight-forward and transparent statistics) the Hulu Cave d18O record withthe most recent high-resolution EPICA Dronning Maud Land(EDML) d18Oice record from Antarctica (EPICA CommunityMembers, 2006) and the high-resolution NGRIP d18Oice record fromGreenland (NGRIP members, 2004) (Fig. 3). These ice-core recordsare ‘methane synchronised’ to within a few centuries (EPICAcommunity Members, 2006), and are both presented on the sameGICC05 timescale. However, in such a comparison, it is important toconsider the correct sense for comparing boreal monsoon recordswith Antarctic ice-core records, so that colder Antarctic conditions(stronger ‘push’) correspond to intensified monsoons, and warmerAntarctic conditions (weaker ‘push’) correspond to weakermonsoons. Consequently, we consider an ‘inverted’ form of theEDML record for comparison with the Hulu Cave record (indicatedas –EDML) (Fig. 3).
It has been convincingly suggested that the long-term changesat Hulu Cave closely record orbital insolation changes (Wang et al.,2008), and we will not focus on that aspect again. Instead, we aimto characterise the relative importance of ‘pull’ and ‘push’ on short-term (millennial-scale) variations in the boreal monsoon throughtime, by quantifying to what extent variance in the Hulu Cavespeleothem d18O record during the Lateglacial and deglaciation(42–10 ka BP) can be ascribed to variance in Greenland andAntarctic d18Oice records, respectively. Our chosen time period isdelimited by the availability of uninterrupted high-resolution dataon the GICC05 timescale for both ice cores.We limit our focus to thelast 42 kyr to avoid problems associated with a ‘gap’ in the high-resolution Antarctic data series (EPICA Community Members,2006), and because GICC05 age uncertainties exceed 4% prior to
about 40 ka BP (i.e., they become roughly twice the uncertainty ofU–Th ages; see discussion in the following sections). We also avoidthe Holocene interglacial because we are primarily concerned withmonsoon variations within the large-amplitude abrupt climatechanges of the last glacial cycle.
Our study is intended as a ‘proof of concept’ analysis to explorethe hypothesis that there may be important (temporally variable)contributions of southern ‘push’ to themillennial-scale fluctuationsin monsoon intensity. The selected interval of time offers a suitabletest-bed for this analysis because it covers three climaticallydifferent episodes, namely: (1) the last deglaciation, with massiveabrupt climate variations superimposed on a rapid reduction ofglobal ice volume and general warming into the Holocene inter-glacial; (2) the interval between about 28 and 16 ka BP, whichbrackets the Last Glacial Maximum (LGM), and which containsrelatively minor millennial-scale variability; and (3) the periodbefore about 28 ka BP, which was a time during the last glacial cyclethat was marked by distinct millennial-scale climate variability.
2. Hulu Cave comparison with ice-core and ‘Hybrid Ice-Core’(HIC) records
The chosen study interval spans many rapid climate changesthat have distinctly different expressions in Greenland andAntarctic ice-core records. Variability in NGRIP d18Oice is alsosufficiently dissimilar from that in –EDML d18Oice to allow distinc-tion between both potential drivers of the monsoon variations(Fig. 3). Nevertheless, it is also important to emphasise that high-resolution comparison of Greenland and Antarctic ice-core records– which has become possible with the NGRIP d18Oice and –EDMLd18Oice data – reveals close relationships between the signalstructures even on short millennial time scales, which agree wellwith the so-called bipolar see-saw model (Stocker and Johnsen,2003; EPICA Community Members, 2006). The Hulu Cave speleo-them d18O record is shown in Figs. 2 and 3 (grey shading) on its ownU–Th based timescale.
Given that the GICC05 timescale is layer-counted, and that theHulu Cave record is extensively U–Th dated, there should be goodagreement within uncertainty bands of several centuries. Theuncertainty limits increase with age because errors in the GICC05timescale are cumulative, amounting to about 0.9% at around 12 kaBP to about 3.5% at around 32 ka BP (Rasmussen et al., 2006;Andersen et al., 2006). The U–Th age uncertainties in the Hulu Caverecord also increase with age, but typically remain around 1.5%(with amaximumof 2.5%; Fig. 2) (e.g., Wang et al., 2001, 2004; Yuanet al., 2004). Visual inspection of the records in Fig. 3 revealsdistinct similarities between the Hulu Cave and NGRIP records, ashas been explored before (Shackleton et al., 2004). This is especiallythe case through the last deglaciation, in the post-15.8 ka BP sectionof the composite record, even though a prominent feature like thepeak Bølling warm event between about 14.7 and 14.0 ka BP is notwell represented in Hulu Cave (Figs. 2 and 3).
Despite the above similarities, considerable – and apparentlynon-systematic – timing offsets and structural differences betweenthe NGRIP d18Oice series (on GICC05) and the (U–Th dated) HuluCave speleothem d18O record are evident in Fig. 3. First, between 30and 40 ka BP, correlation of the Hulu Cave record with NGRIPrequires larger temporal adjustments than correlation with the–EDML series. Also, the signal structure of the Hulu Cave record ismuch more similar to –EDML than to NGRIP, showing broader andmore symmetrical features. Second, there is a minimum in the HuluCave record at around 24 ka BP that has no equivalent in the NGRIPrecord (there is an interval of lighter values at this time in GISP2,e.g., Cosford et al., 2008), but which is prominently present in the–EDML series. This interval broadly coincides with the double-peak
E.J. Rohling et al. / Quaternary Science Reviews 28 (2009) 3291–33023294

eolian dust maximum in Greenland ice cores that has been corre-lated to Heinrich Event 2 (Rohling et al., 2003). Third, there isa distinct gradual shift in the Hulu Cave record from about 20 to17 ka BP, which is not evident at all in NGRIP, but which is alsoobvious in –EDML. In short, the Hulu Cave record is considerablysimilar to the –EDML series, which has not been previously rec-ognised or explored.
A peculiarity of the Hulu Cave record (32!300N, 119!100E, 140 mabove sea level, ASL) is an apparent shift in the mean at 28.6 ka BP(Fig. 3), which has no equivalent in NGRIP, and which is opposite toany equivalent changes in –EDML. The 41–28.6 ka BP values seemto peak at similar levels as the Bølling and Early Holocene, which isnot a common structure in the climate proxy records, or in globalsea level/ice volume records (e.g., Shackleton et al., 2000; Wael-broeck et al., 2002; Siddall et al., 2003). This shift is not seen instalagmite X3 from Xianshui Cave (25!150 N, 110!550E, 380 m ASL),and it is weakly represented only in stalagmite YB1 from YaobaCave (28!480 N, 109!500E, 420 m ASL) (Cosford et al., 2008). Thedescription of the Hulu Cave speleothem sampling does not offerany explanation because the shift does not coincide with a splicepoint between sample series (Fig. 2). The offset might be consid-ered in view of the long-term response of the Hulu Cave record toinsolation (Wang et al., 2008). However, we note that such anexplanation would not agree with the aforementioned absence, oronly weak presence, of the offset in other high-resolution speleo-them records from the East Asian monsoon region. Regardless, weformulate our arguments on the basis of the original Hulu Caverecord (Fig. 3a). We develop our statistical comparisons with ice-core records over the intervals 10.00–15.80, 15.85–28.55, and28.60–41.00 ka BP (original Hulu Cave U–Th chronology). Thissubdivision ensures that any isotope shift at around 28.6 will onlyaffect the intercept of the regressions, which can then be objec-tively evaluated for any systematic offset (or not).
Overall, the millennial-scale variability seems to be sharper andmore pronounced in the Hulu Cave record than in the –EDMLrecord, yet it is less sharp and pronounced than in NGRIP (Fig. 3).Although differences between the Hulu Cave and NGRIP recordsmight be attributed to differences in resolution (Fig. 2), this doesnot account for signal comparison between Hulu Cave and –EDML.We propose that the signal differences should be evaluated usinga more diagnostic approach. Our approach considers ‘mixed’combinations of the NGRIP and –EDML records, using simpleaddition of the two synchronised ice-core records in differentproportions (100:0, 90:10, 80:20,. 0:100). These synthetic ‘HybridIce-Core’ records (HICs) are made using the actual d18Oice values(inverted for EDML), so that the HICs properly account for the realamplitude differences between NGRIP and –EDML. The variousHICs are distinguished using a subscript that indicates the relativeproportion of the NGRIP contribution, so that HIC20 represents anaddition of NGRIP and –EDML in 20:80 proportions. Our analysisfocuses on variance comparisons, so we remove the complexitiesassociated with scaling absolute values between records by nor-malising each HIC into unit standard deviation changes arounda zero mean, using (x"m)/swhere m is the mean and s the standarddeviation, as determined over the entire series. A similar normal-isation is performed on the Hulu Cave record, and the normalisedrecords are then compared (Fig. 4). All records are interpolated atequally spaced 0.05-kyr intervals, to allow point-to-pointcomparison (in cross-plots used later in this paper).
To account for potential dating-related temporal offsetsbetween the HICs and the Hulu Cave record, we perform a simplesynchronisation between the HIC (on the GICC05 time scale) andHulu Cave chronologies. We perform an initial tuning of the HuluCave chronology to that of HIC50 (the 50:50 case, which ensuresthat no preference was given to the Greenland or Antarctic signal
structure), while ensuring the least possible distortion to theoriginal Hulu Cave U–Th chronology (Fig. 5). In contrast to thecorrelation proposed by Shackleton et al. (2004), we refrain fromassuming that either the U–Th chronology of Hulu Cave or GICC05would need ‘correction’, and that the other would not. Instead, wetuned the Hulu Cave chronology using GICC05 as the ‘reference’,because errors in layer-counted age models (GICC05) should becumulative rather than random, and we wanted to avoid suchconstraints when determining the smallest (random) adjustmentsthat would result in a reasonable synchronisation. Adjustments arekept well within the combined age uncertainties of the Hulu Caveand GICC05 chronologies, as discussed below under chronologicalimplications (Table 1, Fig. 6). The visually selected tie points used forsynchronisation are indicated along with HIC50 in Fig. 5. The ‘tuned’Hulu Cave record was re-interpolated at equally spaced 0.05 kyrintervals, to allow point-to-point comparison.
3. Results
The coefficient of determination (R2) is shown in Fig. 7a forcorrelations between the original (normalised) Hulu Cave recordand the various (normalised) HIC records, as portrayed in Fig. 4.This reveals clearly that during the last 15.8 kyr, the Hulu Caverecord correlates best with HIC100 (i.e., the pure NGRIP record).However, in the intervals 28.55–15.85 ka BP and older than 28.6 kaBP, the Hulu Cave record correlates best with HIC0 (i.e., the pure–EDML record). Especially in the latter interval, the coefficient ofdetermination is low, but it can be seen in Figs. 3 and 4 that this lowcoefficient is likely due to minor disagreements between the agemodels of the Hulu Cave and ice-core records, rather than toa difference in signal structure. Chronological ‘fine-tuning’ (Fig. 5)allows us to investigate how chronology affects the coefficients ofdetermination.
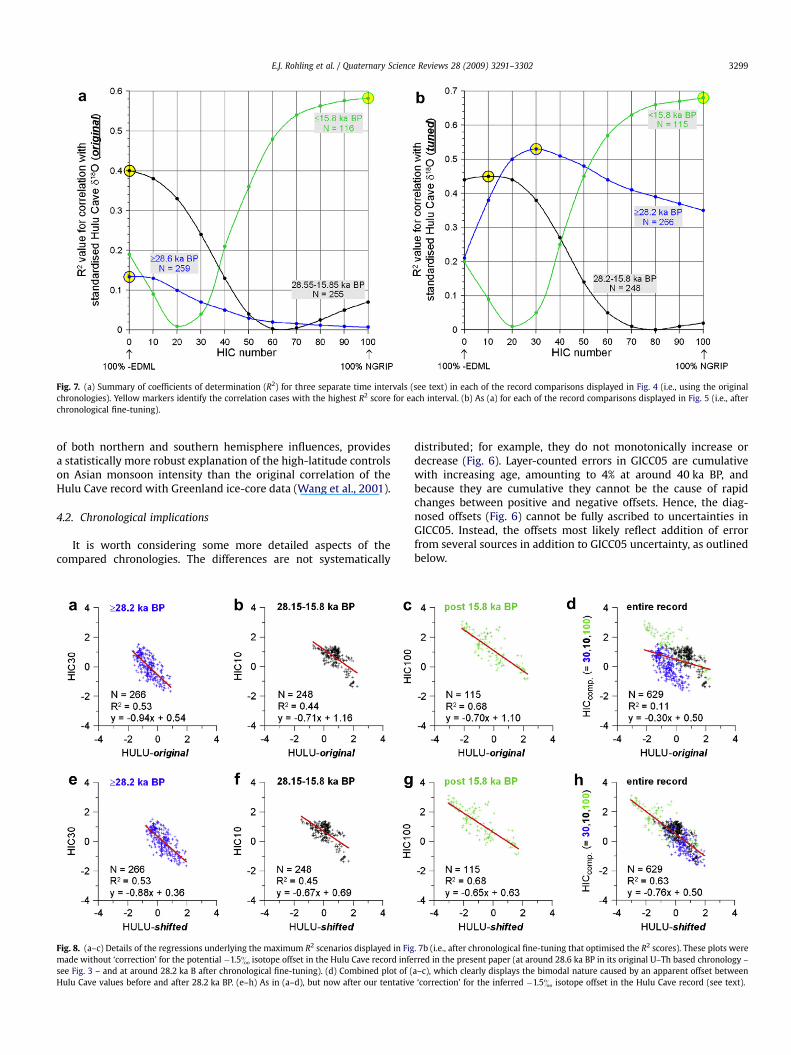
The coefficient of determination is shown in Fig. 7b for thecorrelations between the records in Fig. 5, after chronological tuningto HIC50. Note that the tuning has slightly shifted the age of the plotinterval boundary from 28.6 ka BP in the original Hulu Cave chro-nology to 28.2 ka BP. In Fig. 7b, as in Fig. 7a, the interval younger than15.8 ka BP correlates best with HIC100 (i.e., the pure NGRIP record).The interval between 28.2 and 15.8 ka BP reveals a best correlationof the Hulu Cave record with HIC10, and the interval older than28.2 ka BP correlates best with HIC30. Relative to the case withoutchronological tuning (Fig. 7a), where correlations prior to 15.8 ka BPwere weak but entirely dominated by the –EDML signal, the casewith chronological tuning (Fig. 7b) reveals correlations prior to15.8 ka BP that suggest weak influence of the NGRIP signature inaddition to a dominant influence of the –EDML signature.
In Figs. 8–d, we show the regression plots that underlie the R2
maxima identified in Fig. 7b (i.e., after chronological tuning). Theslopes of the regressions in Figs. 8a–c are all similar, but theintercept changes across 28.2 ka BP (i.e., 28.6 ka BP in the originalU–Th chronology). In Figs. 8e–h, we show the same plots, but afterapplying a correction for our suggested "1.5& isotope shift at28.2 ka BP, which effectively ‘flattens’ the long-term trend in theHulu Cave record similar to that in the Xiangshui Cave record(Cosford et al., 2008). This tentative ‘correction’ clearly changes theregression characteristics for the overall 41–10 ka BP comparisonbetween the Hulu Cave and ice-core records from bimodal (Fig. 8d)to unimodal (Fig. 8h). At this stage, our suggestion of a shift is nomore than a suspicionwith support from other speleothem records(Cosford et al., 2008); further work is needed to determinewhetherit can be validated. The main point of our work is independent fromthe existence (or not) of this apparent offset.
The R2 summary in Fig. 7b (after chronological fine-tuning)strongly corroborates the best correlations found between the
E.J. Rohling et al. / Quaternary Science Reviews 28 (2009) 3291–3302 3295
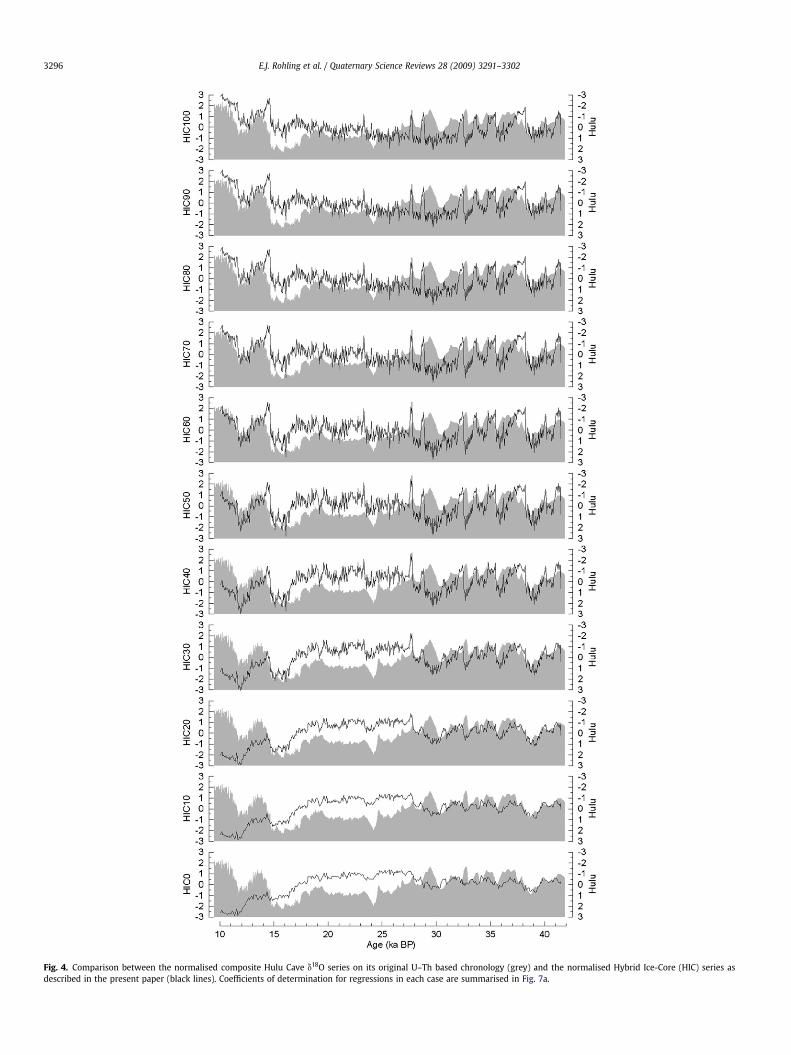
Fig. 4. Comparison between the normalised composite Hulu Cave d18O series on its original U–Th based chronology (grey) and the normalised Hybrid Ice-Core (HIC) series asdescribed in the present paper (black lines). Coefficients of determination for regressions in each case are summarised in Fig. 7a.
E.J. Rohling et al. / Quaternary Science Reviews 28 (2009) 3291–33023296

Fig. 5. Comparison between the normalised Hybrid Ice-Core series (HIC; black lines) and the normalised composite Hulu Cave d18O series (grey) after chronological fine-tuning ofthe Hulu Cave record to HIC50 as discussed in the present paper, and summarised in Fig. 6. Coefficients of determination for regressions in each case are summarised in Fig. 7b.
E.J. Rohling et al. / Quaternary Science Reviews 28 (2009) 3291–3302 3297

original (untuned) Hulu Cave record and the various HICs (Fig. 7a),as well as the visual observation that there are distinct similaritiesbetween the Hulu Cave record and –EDML (Figs. 3–5). The HuluCave record appears to represent a mix between northern andsouthern hemisphere signals, and the proportions of this mix arenot stationary through time.
4. Discussion
4.1. Northern and Southern controls on monsoon variability
During the last deglaciation and the Holocene, variation in themonsoon intensity record appears to have been dominated byvariation in northern hemisphere conditions (Figs. 7 and 8). Giventhat this was a time of dramatic climate change and widespreadnorthern hemisphere deglaciation, it is not surprising that these
major adjustments dominated monsoon variations. The wide-spread abrupt warming and deglaciation events that characterisedthe post-15.8 ka BP interval would have caused major fluctuationsin the monsoon ‘pull’. Through the same time interval, an under-lying increase in orbitally induced insolation on the northernhemisphere (Fig. 3b) caused a strong long-term trend of increasingglobal monsoon intensity towards the early Holocene maximum(Kutzbach and Street-Perrott, 1985; Rossignol-Strick, 1985; Kutz-bach and Guetter, 1986; Prell and Kutzbach, 1987; COHMAPMembers, 1988; Kutzbach and Gallimore, 1988). It is therefore notsurprising to find that northern hemisphere processes dominatedmonsoon variability after 15.8 ka BP; any potential southernhemisphere influences would have been swamped by majornorthern hemisphere changes from the end of the LGM through tothe deglaciation and the early Holocene monsoon maximum.
Before 15.8 ka BP in general, and between 28.2 and 15.8 ka BP inparticular, we infer (Figs. 7 and 8) that millennial-scale monsoonvariability was dominated by southern hemisphere processes, sothat enhanced monsoon intensity (‘push’) coincided with coldintervals in Antarctic climate records. From 28.2 to 15.8 ka BP, theabsence of major DO fluctuations, the enormously increased global(mostly northern hemisphere) LGM ice volumewith sea level 120 mor more below the present (e.g., Fairbanks, 1989; Bard et al., 1996;Rohling et al., 1998; Yokoyama et al., 2000; Siddall et al., 2003;Peltier and Fairbanks, 2006), and a long-term northern hemisphereinsolationminimum (Fig. 3b), seem to have collectively negated anynorthern hemisphere ‘pull’ on the monsoon. This was a period ofweak overall boreal summer monsoon activity, with a globallydistinct southward displacement of the intertropical convergencezone (ITCZ) (e.g., Arz et al., 1998; Peterson et al., 2000; Baker et al.,2001; Koutavas et al., 2002; Wang et al., 2004, 2006; Peterson andHaug, 2006; Weldeab et al., 2007). Whatever residual variabilitythere was in the boreal monsoon seems to have been dominated bysouthern hemisphere processes between 28.2 and 15.8 ka BP.
Prominent DO fluctuations in the pre-28.2 ka BP intervalresulted in a non-negligible northern hemisphere influence on themonsoon, although southern processes appear to have been moreimportant, given that the best correlation is found with HIC30 (Figs.7 and 8). With global sea level between "60 and "90 m relative topresent during this interval (Siddall et al., 2003, 2008 and refer-ences therein), the northern hemispherewould still have had an icevolume that was roughly equivalent to that of the modern Antarcticice-sheets. Although less so than during the LGM, this period wastherefore still in the grip of an ice age, with the ITCZ in a generallymore southward position, especially during cold periods (e.g., Arzet al., 1998; Peterson et al., 2000; Baker et al., 2001; Koutavas et al.,2002; Burns et al., 2003, 2004; Wang et al., 2004, 2006; Petersonand Haug, 2006; Weldeab et al., 2007). Although higher thanduring the LGM, boreal summer insolation was low during the pre-28.2 ka BP interval (Fig. 3b), with consequently reduced long-termglobal monsoon activity relative to the strong insolation maximumof the early Holocene. Glaciation and/or persistent snow cover inthe Himalayas/Tibetan Plateau would have severely weakened anymonsoon ‘pull’ (e.g., Meehl, 1994, 1997; Overpeck et al., 1996;Barnett et al., 1988). Although the distinct DO cycles of the pre-28.2 ka BP interval appear to have imposed some detectableinfluences, the generally weak monsoon pull during this periodseems to have allowed southern hemisphere processes to appearmore prominent in modulating monsoon intensity.
Based on the results outlined above (Figs. 7 and 8), we nowformulate a new composite HIC (HICcomp.), which consists of HIC30in the pre-28.2 ka BP interval, HIC10 in the 28.2–15.8 ka BP interval,and HIC100 in the post-15.8 ka BP interval. HICcomp. is plottedalongside the (chronologically tuned; Fig. 6) Hulu Cave record(Fig. 9). We propose that HICcomp, with its temporally variable mix
Table 1Tie points for chronological tuning of Hulu Cave ages to GICC05 ages.
HULU age U–Th (ka BP) HIC50 age GICC05 (ka BP) Hulu-HIC50 Dage (kyr)
10.193 10.173 0.02011.557 11.677 "0.12015.240 15.380 "0.14016.896 16.475 0.42123.322 23.296 0.02627.855 27.681 0.17429.409 28.778 0.63131.333 30.672 0.66132.768 32.423 0.34533.775 33.671 0.10435.580 35.854 "0.27437.323 38.214 "0.89138.764 39.037 "0.27339.755 40.089 "0.33441.857 41.464 0.393
Fig. 6. Details of the chronological fine-tuning between the normalised compositeHulu Cave d18O series and HIC50. Red lines indicate zero change. Crosses indicate the tiepoints as shown in Fig. 5 and detailed in Table 1. Lower panels are plots of the inferredHulu-HIC50 offsets from the (red) zero-line, in terms of age (kyr), and in terms ofpercentage relative to the GICC05 age of the tie point, respectively.
E.J. Rohling et al. / Quaternary Science Reviews 28 (2009) 3291–33023298
of both northern and southern hemisphere influences, providesa statistically more robust explanation of the high-latitude controlson Asian monsoon intensity than the original correlation of theHulu Cave record with Greenland ice-core data (Wang et al., 2001).
4.2. Chronological implications
It is worth considering some more detailed aspects of thecompared chronologies. The differences are not systematically
distributed; for example, they do not monotonically increase ordecrease (Fig. 6). Layer-counted errors in GICC05 are cumulativewith increasing age, amounting to 4% at around 40 ka BP, andbecause they are cumulative they cannot be the cause of rapidchanges between positive and negative offsets. Hence, the diag-nosed offsets (Fig. 6) cannot be fully ascribed to uncertainties inGICC05. Instead, the offsets most likely reflect addition of errorfrom several sources in addition to GICC05 uncertainty, as outlinedbelow.
Fig. 7. (a) Summary of coefficients of determination (R2) for three separate time intervals (see text) in each of the record comparisons displayed in Fig. 4 (i.e., using the originalchronologies). Yellow markers identify the correlation cases with the highest R2 score for each interval. (b) As (a) for each of the record comparisons displayed in Fig. 5 (i.e., afterchronological fine-tuning).
Fig. 8. (a–c) Details of the regressions underlying the maximum R2 scenarios displayed in Fig. 7b (i.e., after chronological fine-tuning that optimised the R2 scores). These plots weremade without ‘correction’ for the potential "1.5& isotope offset in the Hulu Cave record inferred in the present paper (at around 28.6 ka BP in its original U–Th based chronology –see Fig. 3 – and at around 28.2 ka B after chronological fine-tuning). (d) Combined plot of (a–c), which clearly displays the bimodal nature caused by an apparent offset betweenHulu Cave values before and after 28.2 ka BP. (e–h) As in (a–d), but now after our tentative ‘correction’ for the inferred "1.5& isotope offset in the Hulu Cave record (see text).
E.J. Rohling et al. / Quaternary Science Reviews 28 (2009) 3291–3302 3299

U–Th dated series (Hulu Cave) tend to have two sources ofrandom age uncertainties. First, there is the external precision ofthe datings, which in the reported Hulu Cave data ranges mostlyfrom 0.5 to 1.5%, although 2.5% uncertainties are apparent in theages reported for the PD stalagmite (2s level) (Fig. 2). Second, thereis unavoidable bias associated with assumptions about the rate ofstalagmite growth between dating points. Overall, typical ageoffsets of about 1.5% are apparent between the chronologies ofdifferent speleothem records used to compose the Hulu Caverecord (Fig. 2). The tuning between the Hulu Cave and (GICC05) ice-core series that is applied here (Figs. 5 and 6; Table 1) also containsa level of subjectivity during tie point selection, and concerning theassumed (linear) interpolation between tie points. Finally, there isuncertainty in the methane synchronisation of the NGRIP andEDML ice-core records. This uncertainty may amount up to about250–500 years (EPICA Community Members, 2006; Ahn and Brook,2007; Loulergue et al., 2007), and introduces slight uncertaintyabout the fine structure of the various HIC records compiled in thepresent paper. Despite these sources of bias, we find an exceptionaloverall dating agreement between two entirely independentrecords, with a maximum range of disagreement of only #2.5%(Table 1; Fig. 6). These inferred age offsets remain numericallywithin the combined age uncertainties and other sources ofassumption and uncertainty, although there remains room forimprovement in intervals where the signal agreement between theHulu Cave and HIC records is weakest – notably between 29.4 and27.9 ka BP on the Hulu Cave chronology (Table 1, Fig. 6). Overall,however, we consider our level of chronological ‘tuning’ to bewarranted within the chronological constraints.
Our re-interpretation of the high-latitude controls on monsoonintensity does not significantly affect the ages of the major
transitions (Fig. 9b), given the combined dating uncertainties,relative to the major transitions in the 100% NGRIP record (Fig. 6).Adoption of our re-interpretation would therefore not affect HuluCave U–Th age assignments to the major transitions in the ice-corerecords. Notably, however, our results improve our understandingof chronological relationships across the LGM, where correlationbetween Hulu Cave and HIC100 is hindered by a lack of signalstructure agreement. Overall, therefore, our new correlation doesnot alter the accepted chronological coincidences between theHulu Cave record and the NGRIP record, but it does two importantthings: (a) it offers a sound comparison between the GICC05 ice-core timescale and the U–Th Hulu Cave chronology in the interval16–27 ka BP; and (b) it reveals new arguments about the reasons(mechanisms) why the Hulu Cave and NGRIP records seem to agreewithin the combined chronological uncertainties.
5. Conclusions
Although previous work has found (except across the LGM)a sound chronological correlation between the Hulu Cave recordand Greenland ice-core records, the correlations may have beenbased upon fundamentally incorrect assumptions. Our analysischallenges the previous assumption that East Asian monsoonrecords reflect DO cycles due to some control by northern hemi-sphere processes alone, and suggests that it should be replaced bya more flexible, global interpretation, which takes into account allaspects of the various signal structures, rather than just a fewmajortransitions. We propose a new interpretation that includes domi-nant control on monsoon variability by southern hemisphereclimate changes during glacial times when the monsoon is weakoverall, and control by northern hemisphere climate changes
Fig. 9. (a) Comparison of the composite HIC record (HICcomp) with the normalised Hulu Cave d18O series (grey). HICcomp comprises HIC100 in the post-15.8 ka BP interval (green),HIC10 between 28.2 and 15.8 ka BP (black), and HIC30 in the pre-28.2 ka BP period (blue). The composite records are based on the optimum correlations found in Figs. 7b and 8. In(a), the original (normalised) composite Hulu Cave series is used (after chronological fine-tuning – see Figs. 5, 6, and 7b). (b) Comparison between HICcomp (grey) and the pure NGRIP(red) and pure –EDML (blue) time series. Note that the use of HICcomp does not imply changes in the ages of major transitions relative to the traditional use of pure NGRIP asa correlation target.
E.J. Rohling et al. / Quaternary Science Reviews 28 (2009) 3291–33023300

during deglacial and interglacial times when the monsoon isstrong. Southern hemisphere control on the monsoon is recognisedby taking the inverse of the southern hemisphere climate vari-ability, so that increased monsoon intensity coincides with coldphases in the Antarctic climate records, as was suggested by Caiet al. (2006). Our statistical analysis suggests that this temporallyvariable relationship with the inverse of southern hemisphereclimate records is a more likely reason for the apparent coincidenceof major East Asianmonsoon transitions with northern hemisphere(DO) climate events during glacial times, than the traditionalinterpretation of strict northern hemisphere control.
Acknowledgements
This paper contributes to the objectives of projects NE/C003152/1, NE/D001773/1, and NE/E01531X/1 of the UK Natural Environ-ment Research Council. Qingsong Liu was supported by EC MarieCurie Fellowship 7555. Mark Siddall was supported by an RCUKFellowship from the University of Bristol and previously by LamontDoherty Earth Observatory. Sune Olander Rasmussen gratefullyacknowledges support from the Centre for Ice and Climate/DanishNational Research Foundation. We thank J. Luterbacher, K. Tren-berth, and G. Meehl for valuable discussions.
References
Ahn, J., Brook, E.J., 2007. Atmospheric CO2 and climate from 65 to 30 ka B.P.Geophysical Research Letters 34, L10703,. doi:10.1029/2007GL029551.
An, Z.S., 2000. The history and variability of the East Asian palaeomonsoon climate.Quaternary Science Reviews 19, 171–187.
Andersen, K.K., Svensson, A., Johnsen, S.J., Rasmussen, S.O., Bigler, M.,Rothlisberger, R., Ruth, U., Siggaard-Andersen, M.-L., Steffensen, J.P., Dhal-Jensen, D., Vinther, B.M., Clausen, H.B., 2006. The Greenland Ice Core Chro-nology 2005, 15–42 ka. Part 1: constructing the time scale. Quaternary ScienceReviews 25, 3246–3257.
Arz, H.W., Patzold, J., Wefer, G., 1998. Correlated millennial-scale changes in surfacehydrography and terrigenous sediment yield inferred from last-glacial marinedeposits off Brazil. Quaternary Research 50, 157–166.
Baker, P.A., Rigsby, C.A., Seltzer, G.O., Fritz, S.C., Lowenstein, T.K., Bacher, N.P.,Veliz, C., 2001. Tropical climate changes at millennial and orbital timescales onthe Bolivian Altiplano. Nature 409, 698–700.
Bard, E., Hamelin, B., Arnold, M., Montaggioni, L., Cabioch, G., Faure, G., Rougerie, F.,1996. Sea level record from Tahiti corals and the timing of deglacial meltwaterdischarge. Nature 382, 241–244.
Barnett, T.P., Dumenil, L., Schlese, U., Roeckner, E., 1988. The effect of Eurasian snowcover on global climate. Science 239, 504–507.
Berger, A., 1992. Orbital Variations and Insolation Database. IGBP PAGES/World DataCenter for Paleoclimatology Data Contribution Series # 92-007. NOAA/NGDCPaleoclimatology Program, Boulder CO, USA.
Berger, A., Loutre, M.F., 1991. Insolation values for the climate of the last 10 millionyears. Quaternary Science Reviews 10, 297–317.
Blunier, T., Chapellaz, J., Schwander, J., Dallenbach, A., Stauffer, B., Stocker, T.F.,Raynaud, D., Jouzel, J., Clausen, H.B., Hammer, C.U., Johnsen, S.J., 1998. Asyn-chrony of Antarctic and Greenland climate change during the last glacial period.Nature 394, 739–743.
Bond, G., Broecker, W.S., Johnsen, S., McManus, J., Labeyrie, L., Jouzel, J., Bonani, G.,1993. Correlations between climate records from North Atlantic sediments andGreenland ice. Nature 365, 143–147.
Burns, S.J., Fleitmann, D., Matter, A., Kramers, J., Al-Subbary, A.A., 2003. IndianOcean climate and an absolute chronology over Dansgaard/Oeschger Events 9to 13. Science 301, 1365–1367.
Burns, S.J., Fleitmann, D., Matter, A., Kramers, J., Al-Subbary, A.A., 2004. IndianOcean climate and an absolute chronology over Dansgaard/Oeschger events 9to 13: correction. Science 305, 1567.
Cai, Y., An, Z., Cheng, H., Edwards, L.R., Kelly, M.J., Liu, W., Wang, X., Shen, C.C., 2006.High-resolution absolute-dated Indian Monsoon record between 53 and 36 kafrom Xiaobailong Cave, southwestern China. Geology 34, 621–624.
Clemens, S.C., Murray, D.W., Prell, W.L., 1996. Nonstationary phase of the Plio-Pleistocene Asian Monsoon. Science 274, 943–948.
Clement, A.C., Peterson, L.C., 2008. Mechanisms of abrupt climate change of the lastglacial period. Reviews of Geophysics 46, RG4002,. doi:10.1029/2006RG000204.
Members, C.O.H.M.A.P., 1988. Climatic changes of the last 18,000 years: obser-vations and model simulations. Science 241, 1043–1052.
Cosford, J., Qing, H., Yuan, D., Zhang, M., Holmden, C., Patterson, W., Hai, C., 2008.Millennial-scale variability in the Asian monsoon: evidence from oxygenisotope records from stalagmites in China. Palaeogeography, Palaeoclimatology.Palaeoecology 266, 3–12.
Dansgaard, W., Johnsen, S.J., Clausen, H.B., Dahl-Jensen, D., Gundestrup, N.S.,Hammer, C.U., Hvidberg, C.S., Steffensen, J.P., Sveinbjornsdottir, A.E., Jouzel, J.,Bond, G., 1993. Evidence for general instability of past climate from a 250 kyr icecore. Nature 364, 218–219.
Denton, G.H., Alley, R.B., Comer, G.C., Broecker, W.S., 2005. The role of seasonality inabrupt climate change. Quaternary Science Reviews 24, 1159–1182.
EPICA community Members, 2006. One-to-one coupling of glacial climate vari-ability in Greenland and Antarctica. Nature 444, 195–197.
Fairbanks, R.G., 1989. A 17,000-year glacio-eustatic sea level record: influence ofglacial melting rates on the Younger Dryas event and deep-ocean circulation.Nature 342, 637–642.
Grootes, P.M., Stuiver, M., White, J.W.C., Johnsen, S., Jouzel, J., 1993. Comparison ofoxygen isotope records from the GISP2 and GRIP Greenland ice cores. Nature366, 552–554.
Hastenrath, S., 1991. Climate Dynamics of the Tropics. Kluwer Academic Publishers,Dordrecht.
Hemming, S.R., 2004. Heinrich events: massive Late Pleistocene detritus layers ofthe North Atlantic and their global imprint. Reviews of Geophysics 42, 1–43.
Ivanochko, T.S., Ganeshram, R.S., Brummer, G.J.A., Ganssen, G., Jung, S.J.A.,Moreton, S.G., Kroon, D., 2005. Variations in tropical convection as an amplifierof global climate change at the millennial scale. Earth and Planetary ScienceLetters 235, 302–314.
Koutavas, A., Lynch-Stieglitz, J., Marchitto, T.M., Sachs, J.P., 2002. El Nino-like patternin ice age tropical Pacific sea surface temperature. Science 297, 226–230.
Krishnamurti, T.N., Bhalme, H.N., 1976. Oscillation of a monsoon system, Part I:observational aspects. Journal of Atmospheric Sciences 33, 1937–1954.
Kutzbach, J.E., Gallimore, R.G., 1988. Sensitivity of a coupled atmosphere/mixedlayer ocean model to changes in orbital forcing at 9000 years BP. Journal ofGeophysical Research 93, 803–821.
Kutzbach, J.E., Guetter, P.J., 1986. The influence of changing orbital parameters andsurface boundary conditions on climate simulations for the past 18,000 years.Journal of Atmospheric Sciences 43, 1726–1759.
Kutzbach, J.E., Street-Perrott, F.A., 1985. Milankovitch forcing in the level of tropicallakes from 18 to 0 kyr BP. Nature 317, 130–134.
Lamb, H.H., 1972. In: Climate: Present, Past, and Future, Vol. 1. Methuen and Co. Ltd.,London.
Lea, D.W., Pak, D.K., Peterson, L.C., Hughen, K.A., 2003. Synchroneity of tropical andhigh-latitude Atlantic temperatures over the last glacial termination. Science301, 1361–1364.
Loulergue, L., Parrenin, F., Blunier, T., Barnola, J.-M., Spahni, R., Schilt, A.,Raisbeck, G., Chapellaz, J., 2007. New constraints on the gas age-ice agedifference along the EPICA ice cores, 0–50 kyr. Climate of the Past 3, 527–540.
Love, G., 1985. Cross-equatorial influence of winter hemisphere subtropical coldsurges. Monthly Weather Review 113, 1487–1498.
Marchal, O., Stocker, T.F., Joos, F., 1999. Physical and biogeochemical responses tofreshwater-induced thermohaline variability in a zonally averaged oceanmodel. In: Clark, P.U., Webb, R.S., Keigwin, L.D. (Eds.), Mechanisms of GlobalClimate Change at Millennial Time Scales. AGU Geophysical Monograph 112.American Geophysical Union, Washington DC, pp. 263–284.
Meehl, G.A., 1994. Influence of the land surface in the Asian summer monsoon:external conditions versus internal feedbacks. Journal of Climate 7,1033–1049.
Meehl, G.A., 1997. The south Asian monsoon and the tropospheric biennial oscil-lation. Journal of Climate 10, 1921–1943.
NGRIP members, 2004. High-resolution record of Northern Hemisphere climateextending into the last interglacial period. Nature 431, 147–151.
Overpeck, J., Anderson, D., Trumbore, S., Prell, W., 1996. The Southwest IndianMonsoon over the Last 18,000 Years. Climate Dynamics 12, 213–225.
Pedelaborde, P., 1963. The Monsoon. Methuen and Co. Ltd., London.Peltier, W.R., Fairbanks, R.G., 2006. Global ice volume and Last Glacial Maximum
duration from an extended Barbados sea-level record. Quaternary ScienceReviews 25, 3322–3337.
Peterson, L.C., Haug, G.H., 2006. Variability in the mean latitude of the AtlanticIntertropical Convergence Zone as recorded by riverine input of sediments tothe Cariaco Basin (Venezuela). Palaeogeography, Palaeoclimatology. Palae-oecology 234, 97–113.
Peterson, L.C., Haug, G.H., Hughen, K.A., Rohl, U., 2000. Rapid changes in thehydrologic cycle of the tropical Atlantic during the last glacial. Science 290,1947–1951.
Prell, W.L., Kutzbach, J.E., 1987. Monsoon variability over the past 150,000 years.Journal of Geophysical Research 92, 8411–8425.
Ramaswamy, C., Pareek, R.S., 1978. The south-west monsoon over Indian and itsteleconnections with the middle and upper tropospheric flow patterns over theSouthern Hemisphere. Tellus 30, 126–135.
Rasmussen, S.O., Andersen, K.K., Svensson, A.M., Steffensen, J.P., Vinther, B.M.,Clausen, H.B., Siggaard-Andersen, M.-L., Johnsen, S.J., Larsen, L.B., Dahl-Jensen, D., Bigler, M., Rothlisberger, R., Fischer, H., Goto-Azuma, K.,Hansson, M.E., Ruth, U., 2006. A new Greenland ice core chronology for the lastglacial termination. Journal of Geophysical Research 111, D06102. doi:10.1029/2005JD006079.
Rodwell, M.J., 1997. Breaks in the Asian monsoon: the influence of SouthernHemisphere weather systems. Journal of Atmospheric Sciences 54, 2597–2611.
Rohling, E.J., Fenton, M., Jorissen, F.J., Bertrand, P., Ganssen, G., Caulet, J.P., 1998.Magnitudes of sea-level lowstands of the past 500,000 years. Nature 394,162–165.
E.J. Rohling et al. / Quaternary Science Reviews 28 (2009) 3291–3302 3301

Rohling, E.J., Mayewski, P.A., Challenor, P., 2003. On the timing and mechanism ofmillennial-scale climate variability during the last glacial cycle. ClimateDynamics 20, 257–267.
Rossignol-Strick, M., 1985. Mediterranean Quaternary sapropels, an immediateresponse of the African monsoon to variation of insolation. Palaeogeography,Palaeoclimatology. Palaeoecology 49, 237–263.
Schmidt, G.A., 2007. Tropical Hydrological Cycle. In: Abstracts of the 9th Interna-tional Conference on Paleoceanography, 3–7 September 2007, Shanghai, China,p. 130.
Schulz, H., Von Rad, U., Erlenkeuser, H., 1998. Correlation between Arabian Sea andGreenland climate oscillations of the past 110,000 years. Nature 393, 54–57.
Shackleton, N.J., Hall, M.A., Vincent, E., 2000. Phase relationships between millen-nial-scale events 64,000–24,000 years ago. Paleoceanography 15, 565–569.
Shackleton, N.J., Fairbanks, R.G., Chiu, T.C., Parrenin, F., 2004. Absolute calibration ofthe Greenland time scale: implications for Antarctic time scales and for D14C.Quaternary Science Reviews 23, 1513–1522.
Shresta, M.L., Murakami, T., 1988. Intraseasonal fluctuations in low-level meridionalwinds over the Indian Ocean and monsoonal convection over South Asia. Tellus40A, 120–132.
Siddall, M., Rohling, E.J., Almogi-Labin, A., Hemleben, Ch., Meischner, D.,Schmeltzer, I., Smeed, D.A., 2003. Sea-level fluctuations during the last glacialcycle. Nature 423, 853–858.
Siddall, M., Rohling, E.J., Thompson, W.G., Waelbroeck, C., 2008. Marine isotopestage 3 sea level fluctuations: data synthesis and new outlook. Reviews ofGeophysics 46, RG4003,. doi:10.1029/2007RG000226.
Skinner, L.C., 2008. Revisiting the absolute calibration of the Greenland ice-coreage-scales. Climate of the Past 4, 295–302.
Stocker, T.F., Johnsen, S.J., 2003. A minimum model for the bipolar seesaw. Paleo-ceanography 18, PA1087,. doi:10.1029/2003PA000920.
Svensson, A., Andersen, K.K., Bigler, M., Clausen, H.B., Dahl-Jensen, D., Davies, S.M.,Johnsen, S.J., Muscheler, R., Parrenin, F., Rasmussen, S.O., Rothlisberger, R.,Seierstad, I., Steffensen, J.P., Vinther, B.M., 2008. A 60000 year Greenlandstratigraphic ice core chronology. Climate of the Past 4, 47–57.
Talbot, M.R., Filippi, M.L., Jensen, N.B., Tiercelin, J.-J., 2007. An abrupt change in theAfrican monsoon at the end of the Younger Dryas. Geochemistry GeophysicsGeosystems 8, Q03005. doi:10.1029/2006GC001465.
Vinther, B.M., Clausen, H.B., Johnsen, S.J., Rasmussen, S.O., Andersen, K.K.,Buchardt, S.L., Seierstad, I.K., Siggaard-Andersen, M.-L., Steffensen, J.P.,Svensson, A.M., 2006. A synchronized dating of three Greenland ice cores
throughout the Holocene. Journal of Geophysical Research 111, D13102,.doi:10.1029/2005JD006921.
Voelker, A.H.L., 2002. Global distribution of centennial-scale records for MarineIsotope Stage (MIS) 3: a database. Quaternary Science Reviews 21, 1185–1212.
Waelbroeck, C., Labeyrie, L., Michel, E., Duplessy, J.C., McManus, J.F., Lambeck, K.,Balbon, E., Labracherie, M., 2002. Sea-level and deep water temperaturechanges derived from benthonic foraminifera isotopic records. QuaternaryScience Reviews 21, 295–305.
Wang, Y.J., Cheng, H., Edwards, R.L., An, Z.S., Wu, J.Y., Shen, C.-C., Dorale, J.A., 2001.A high-resolution absolute-dated late Pleistocene monsoon record from HuluCave, China. Science 294, 2345–2348.
Wang, X.F., Auler, A.S., Edwards, R.L., Cheng, H., Cristalli, P.S., Smart, P.L.,Richards, D.A., Shen, C.-C., 2004. Wet periods in northeastern Brazil over thepast 210 kyr linked to distant climate anomalies. Nature 432, 740–743.
Wang, X.F., Auler, A.S., Edwards, R.L., Cheng, H., Ito, E., Solheid, M., 2006. Inter-hemispheric anti-phasing of rainfall during the last glacial period. QuaternaryScience Reviews 25, 3391–3403.
Wang, Y.J., Cheng, H., Edwards, R.L., Kong, X., Shao, X., Chen, S., Wu, J., Jiang, X.,Wang, X., An, Z., 2008. Millennial- and orbital-scale changes in the east Asianmonsoon over the past 224,000 years. Nature 451, 1090–1093.
Weldeab, S., Lea, D.W., Schneider, R.R., Andersen, N., 2007. 155,000 years of WestAfrican monsoon and ocean thermal evolution. Science 316, 1303–1307.
Weninger, B., Joris, O., 2008. A 14C age calibration curve for the last 60 ka: theGreenland-Hulu U/Th timescale and its impact on understanding the Middle toUpper Paleolithic transition in Western Eurasia. Journal of Human Evolution 55,772–781.
Xue, F., Wang, H., He, J., 2004. Interannual variability of Mascarene High andAustralian High and their influences on East Asian summer monsoon. Journal ofthe Meteorological Society of Japan 82, 1173–1186.
Yokoyama, Y., Lambeck, K., De Deckker, P., Johnston, P., Fifield, L.K., 2000. Timingof the Last Glacial Maximum from observed sea-level minima. Nature 406,713–716.
Yuan, D., Cheng, H., Edwards, R.L., Dykoski, C.A., Kelly, M.J., Zhang, M., Qing, J., Lin, Y.,Wang, Y., Wu, J., Dorale, J.A., An, Z., Cai, Y., 2004. Timing, duration, and transi-tions of the last interglacial Asian Monsoon. Science 304, 575–578.
Zhou, H., Zhao, J., Feng, Y., Gagan, M.K., Zhou, G., Yan, J., 2008. Distinct climatechange synchronous with Heinrich event one, recorded by stable oxygen andcarbon isotopic compositions in stalagmites from China. Quaternary Research69, 306–315.
E.J. Rohling et al. / Quaternary Science Reviews 28 (2009) 3291–33023302