Controlled organization of cell fates in spatially confined stem ...
141
Controlled organization of cell fates in spatially confined stem cell populations by Joel Ö STBLOM A theisis submitted in conformity with the requirements for the degree of Doctor of Philosophy Institute of Biomaterials and Biomedical Engineering University of Toronto c Copyright by Joel Östblom 2020
-
Upload
khangminh22 -
Category
Documents
-
view
3 -
download
0
Transcript of Controlled organization of cell fates in spatially confined stem ...

Controlled organization of cell fatesin spatially confined stem cell populations
by
Joel ÖSTBLOM
A theisis submitted in conformity with the requirementsfor the degree of Doctor of Philosophy
Institute of Biomaterials and Biomedical EngineeringUniversity of Toronto
c© Copyright by Joel Östblom 2020
Controlled organization of cell fatesin spatially confined stem cell populations
Joel Östblom
Doctor of Philosophy
Institute of Biomaterials and Biomedical Engineering
University of Toronto
2020
Abstract
During embryonic development, cells divide and differentiate over space and time as
instructed by their environment to create complex, functionally diverse tissues. Our
understanding of the underlying orchestrating rules is incomplete, but recent stud-
ies have started to reveal how to instruct cultured pluripotent cell populations to
undergo similar developmental-like organizational events. Here, we induce spatially
polarized cell fate organization in micropatterned colonies, previously only reported
for non-adherent or locally induced cell populations. Underlying this discovery was
the augmentation of our micropatterning high-throughput platform through the de-
velopment of analytical frameworks to automate the quantification of heterogeneous
cell responses. These developments enabled rapid hypotheses generation and testing,
ii

which enabled new insights into the underlying biology of how and when cell fate
organization occurs.
Specifically, we developed analytical frameworks to accurately identify colonies of cells
within an image and localization of positively expressing regions within these, which
enabled automatic quantification of spatial fate organization. We show that when
mouse pluripotent stem cells are differentiated on micropatterns towards gastrulation-
like fates, their normally symmetrical spatial organization of cell fates can be modified
by changing the micropattern diameter and cell density. By differentiating cells at
low to medium density on circular micropatterns of 200-300 um in diameter, we
induce polarized organization of primitive streak-like and anterior epiblast-like cells,
reminiscent of how these populations are localized during development. We study the
emergence of this organization using live imaging and found that polarization occurs
largely due to reorganization within the colony post-induction.
Overall, our results show that system size, both in terms of colony geometry and cell
number at the time of differentiation, is critical for polarized cell fate organization.
We hypothesize that this could indicate a need for developmentally relevant system
sizes in polarization of micropatterned colonies, and that it might be driven by initial
heterogeneities in colony morphology or cell fate distribution, or minor fluctuation
that are allowed to amplify and perturb a homogeneous state. These insights on how
to control and quantify fate organization in cell populations can advance both our
understanding of developmental processes and how to create complex tissues with
regenerative engineering.
iii

To my familyfor always supporting me
iv

Acknowledgments
During my PhD, I have learnt so many things. Naturally, most pertaining to myarea of research, but also about how to uphold high standard scientific practices,the wonderful world of programming and data analysis, the joy and art of teaching,friendship, and myself. Throughout this journey there are many people who havesupported me, without whom I would not have been able to complete my travels.Through their support, these people have also changed me, not only indirectly or in ametaphorical sense, but also directly through the formation of synaptic connectionsin my brain from our interactions. As such, I am literally who I am today becauseof these people, and for that I will forever be grateful.
First, I want to direct my gratitude to my supervisor Peter Zandstra, for his scientificsupport throughout the years in the form of giving discussions, exciting exchange ofideas, challenges to always perform better, and for his openness to accept me intothe lab as a masters student without an engineering or computational backgroundto work on a project that required both. I want to thank my scientific advisorycommittee: Penney Gilbert, Chris Yip, and Sid Goyal, for their greatly helpful andinsightful comments, feedback and support of my work over the years.
I am grateful to all my collaborators, most notably Emanuel who mentored me asan unassuming new student in the lab, Mukul who I worked closely with throughoutmost of my PhD, Daniel who I have had many educational and supportive discussionswith, and also Ayako, Kento, and Dominika. Lately, I have also experienced the otherend of mentorship with Mona who have contributed enormously to my work for overa year and Nico who kept adding to my project long after his summer research periodended. A special thanks to my colleagues who directly contributed to the productionof this thesis with their advice and support: Shreya, Daniel, Mona, Nico, Andrew,
v

and Yale.
I also want to thank all my lab friends that I have not collaborated with scientificallybut in many ways have been at least as important for my mental sanity during theseyears. I have never previously experienced such personal growth as during my PhDperiod, predominantly thanks to my fantastic colleagues and friends. Especially,Shreya, Nims, and Chuck, whom I spent many many many hours together withboth in and outside the lab, and who have supported me throughout my PhD andmade me a more complete human being. Jen, Curtis, Elia, Nika, Ken, Sam, Nick,Weijia, Yonatan, Stan, and Geoff for making my PhD more fun, educational, andinspiring. Ting, Monica, Celine, Cynthia, Carla, and Marianne for ensuring that thelab functions on a daily basis and helping me with all kinds of questions.
I am very grateful to have been part of the UofT Coders community during most ofmy PhD, thank you Luke, Maddy, Lina, Elliott, Sara, Nil, Ahmed, and Lindsay. I hadfantastic collaborative work experiencing with you and hope we will work togetheragain in the future.
I want to direct a special thanks to everyone working for openly sharing science andcode. During my PhD, I saw the formation of the bioRxiv preprint service and thepossibility to access scientific knowledge without temporal or financial restrictions hasbeen tremendously helpful for me in my PhD. To everyone developing and sharingcode, (especially to the scientific Python community): thank you for your fantasticand tireless work of making science better, more reproducible, and more equallyaccessible for people around the world.
From back home in Sweden, I want to thank my previous scientific mentors Theresa,Michael, Petra, Abe, and Håkan for setting me on this path. Not to forget, thegreat teachers I have had since the very beginning, who have inspired and enabledme to reach to where I am today. I also want to thank all my friends that have beensupporting me over the years I have spent overseas. There are too many to mention,but I want to highlight some of them: Kajsa for being supportive and for sharingand diffusing our imposter syndromes together; Rene and Mondi for being inspiringand engaging in intriguing conversations; Alex, Mårten, and Oskar for taking me outon white water backside front flip canoeing adventures; Sahar for always listening;Ana for sharing the burden of PhD life through mutual complaining =); Sofie for
vi

always saying unexpected things that still makes sense and showing how to conductan awesome defense; Sophia, Jonna, Neshmil, and Rebecca for always being fun tospend time with; Oscar for having interesting discussions about everything; Fredrikfor always being ready to go on nature adventures (or eat Indian food); David, Linus,and Odin for hanging out like I never left; Robin, Jacke, and Natta for always havinginteresting things to talk about together and making it feel like we still haven’t quitegrown up =) Thank you all for supporting me in so many different ways!
Last and most importantly, I want to thank my family for supporting my growthin all imaginable scenarios. My brother Mattias for simultaneously being a fantasticplaymate and a formidable opponent, and for constantly making me work harderbecause I would think “if he is that good already, he will be much better than mewhen he is my age”. And also for bringing Jenny and Luna into our lives, as constantrays of sun (and moon) shine. My father Göran for evoking in me an unquenchableintellectual curiosity, imprinting on me the mindset of a logician, and teaching me thevalue of hard work both inside and outside of academia. My mother Sylvie for herwarm, unyielding support and belief in me in all possible and impossible situations,her inspiring bravery to undaunted commence new adventures while taking on anychallenges in her way, and teaching me that there is more to life than academicpursuit.
vii

Contents
Abstract ii
Acknowledgments v
Contents viii
List of figures xi
List of abbreviations xiii
List of publications xv
1 Introduction 11.1 Pluripotency . . . . . . . . . . . . . . . . . . . . . . . . . . . . . . . 1
1.1.1 The derivation of pluripotent stem cells . . . . . . . . . . . . 21.2 Unorganized heterogeneity as a confounding factor during in vitro dif-
ferentiation . . . . . . . . . . . . . . . . . . . . . . . . . . . . . . . . 71.2.1 Refinement of culture conditions . . . . . . . . . . . . . . . . 71.2.2 Transcriptional heterogeneity in pluripotent populations . . . 91.2.3 Dynamic transitions between cell states . . . . . . . . . . . . 101.2.4 The pluripotency continuum . . . . . . . . . . . . . . . . . . . 12
1.3 Organized heterogeneity as a developmental necessity in vivo . . . . . 141.3.1 The 2 - 4 cell stage . . . . . . . . . . . . . . . . . . . . . . . . 141.3.2 The 8 - 32 cells stage . . . . . . . . . . . . . . . . . . . . . . . 151.3.3 The early blastocyst . . . . . . . . . . . . . . . . . . . . . . . 161.3.4 The gastrula . . . . . . . . . . . . . . . . . . . . . . . . . . . 17
viii

1.4 Organized heterogeneity as a developmental model system in vitro . . 211.4.1 Embryo-like cell aggregates . . . . . . . . . . . . . . . . . . . 221.4.2 In vitro differentiation in controlled microenvironments . . . . 24
1.5 Rapid query and robust quantification of organized cell fate acquisitions 291.6 Thesis motivation, hypothesis and approach . . . . . . . . . . . . . . 32
1.6.1 Motivation . . . . . . . . . . . . . . . . . . . . . . . . . . . . 321.6.2 Hypothesis . . . . . . . . . . . . . . . . . . . . . . . . . . . . 331.6.3 Approach . . . . . . . . . . . . . . . . . . . . . . . . . . . . . 34
2 Context-explorer: Analysis of spatially organized protein expressionin high-throughput screens 362.1 Abstract . . . . . . . . . . . . . . . . . . . . . . . . . . . . . . . . . . 372.2 Introduction . . . . . . . . . . . . . . . . . . . . . . . . . . . . . . . . 37
2.2.1 Design and Implementation . . . . . . . . . . . . . . . . . . . 392.3 Results . . . . . . . . . . . . . . . . . . . . . . . . . . . . . . . . . . . 43
2.3.1 Colony classification . . . . . . . . . . . . . . . . . . . . . . . 432.3.2 Investigating the behavior of hPSCs in micropatterned colonies 442.3.3 Analysis of spatial trends in protein expression within hPSC
colonies . . . . . . . . . . . . . . . . . . . . . . . . . . . . . . 472.3.4 Conclusions . . . . . . . . . . . . . . . . . . . . . . . . . . . . 502.3.5 Availability and Future Directions . . . . . . . . . . . . . . . . 50
2.4 Supplementary Methods . . . . . . . . . . . . . . . . . . . . . . . . . 512.4.1 Microcontact printing . . . . . . . . . . . . . . . . . . . . . . 512.4.2 UV lithography . . . . . . . . . . . . . . . . . . . . . . . . . . 512.4.3 hPSCs culture and seeding onto patterned substrates . . . . . 522.4.4 mPSCs culture and seeding onto patterned surfaces . . . . . . 522.4.5 Immunocytochemistry . . . . . . . . . . . . . . . . . . . . . . 532.4.6 High-content image analysis . . . . . . . . . . . . . . . . . . . 532.4.7 Statistical analysis . . . . . . . . . . . . . . . . . . . . . . . . 53
3 System size-dependent spatial polarization of cell fate organizationin adherent mPSCs 543.1 Intro . . . . . . . . . . . . . . . . . . . . . . . . . . . . . . . . . . . . 553.2 Results . . . . . . . . . . . . . . . . . . . . . . . . . . . . . . . . . . . 56
3.2.1 Establishing a platform with minimal uncontrolled perturbations 56
ix
3.2.2 Ligand concentration and cell density controls the extent ofcell fate acquisition . . . . . . . . . . . . . . . . . . . . . . . . 62
3.2.3 Seeding density controls polarization of Bra and Sox2 expression 663.2.4 Polarized marker expression only occurs in colonies of develop-
mentally relevant sizes . . . . . . . . . . . . . . . . . . . . . . 703.2.5 Marker polarization arises via displacement rather than induc-
tion at the poles . . . . . . . . . . . . . . . . . . . . . . . . . 733.3 Methods . . . . . . . . . . . . . . . . . . . . . . . . . . . . . . . . . . 76
3.3.1 In vitro methodology . . . . . . . . . . . . . . . . . . . . . . . 763.3.2 Analytic pipeline development . . . . . . . . . . . . . . . . . . 79
3.4 Discussion . . . . . . . . . . . . . . . . . . . . . . . . . . . . . . . . . 893.4.1 System size as a control parameter for polarization . . . . . . 903.4.2 Pre-existing spatial organization . . . . . . . . . . . . . . . . 94
4 Conclusions and future directions 964.1 Summary of results . . . . . . . . . . . . . . . . . . . . . . . . . . . . 964.2 Impact . . . . . . . . . . . . . . . . . . . . . . . . . . . . . . . . . . . 984.3 Limitations . . . . . . . . . . . . . . . . . . . . . . . . . . . . . . . . 994.4 Future directions . . . . . . . . . . . . . . . . . . . . . . . . . . . . . 101
4.4.1 Elucidating the impact of input population heterogeneity . . . 1014.4.2 Understanding spatially organized cell migration properties . 1024.4.3 Investigating the role of substrate properties on cell fate deter-
mination . . . . . . . . . . . . . . . . . . . . . . . . . . . . . 1044.4.4 Exploring three dimensional substrate geometries . . . . . . . 1054.4.5 Interrogating mechanisms for marker displacement . . . . . . 1064.4.6 Introducing localized and inducible signalling sources . . . . . 1074.4.7 Studying signalling dynamics in entire cell populations . . . . 108
References 110
x

List of figures
1.1 Schematics of embryo-derived PSCs . . . . . . . . . . . . . . . . . . . 51.2 The pluripotency continuum . . . . . . . . . . . . . . . . . . . . . . . 131.3 Heterogeneities in early development . . . . . . . . . . . . . . . . . . 171.4 Signalling during gastrulation . . . . . . . . . . . . . . . . . . . . . . 191.5 Colony fate patterning . . . . . . . . . . . . . . . . . . . . . . . . . . 261.6 Time and concentration dependent differentiation . . . . . . . . . . . 271.7 Symmetric and asymmetric fate induction . . . . . . . . . . . . . . . 33
2.1 Background schematic and CE workflow . . . . . . . . . . . . . . . . 402.2 Classification of cells into colonies . . . . . . . . . . . . . . . . . . . . 452.3 Quantification of colony count precision and OCT4 expression data . 462.4 Quantification of radial expression trends . . . . . . . . . . . . . . . . 48
3.1 Spatial organization of Bra occus in LS but not in NB2iL . . . . . . . 603.2 Spatial organization of Bra occus in LS but not in NB2iL (sup) . . . 613.3 Signal concentration determines the extent of Bra expression . . . . . 633.4 Seeding density and induction time changes absolute levels and spatial
organization of Bra . . . . . . . . . . . . . . . . . . . . . . . . . . . . 653.5 A critical range of cell densities support polarized expression of Bra
and Sox2 . . . . . . . . . . . . . . . . . . . . . . . . . . . . . . . . . . 693.6 A critical range of colony diameters support polarized expression of
Bra and Sox2 . . . . . . . . . . . . . . . . . . . . . . . . . . . . . . . 723.7 Different ligand concentrations show the same trend in marker expres-
sion over varying colony diameters. . . . . . . . . . . . . . . . . . . . 733.8 Bra region distance from colony centroid increases gradually over 48
h of differentiation . . . . . . . . . . . . . . . . . . . . . . . . . . . . 75
xi

3.9 Parameter optimization for colony identification . . . . . . . . . . . . 833.10 Quality control plot for identified colonies . . . . . . . . . . . . . . . 843.11 Semi-automatic intensity thresholding . . . . . . . . . . . . . . . . . 873.12 Visualization of colony metrics . . . . . . . . . . . . . . . . . . . . . . 89
4.1 Tensile ring of Bra . . . . . . . . . . . . . . . . . . . . . . . . . . . . 107
xii

List of abbreviations
AP Anterior-PosteriorAVE Anterior Visceral EndodermBMP Bone Morphogenic ProteinBRA BRACHYURYBSA Bovine Serum AlbuminCER CERBERUSdpc days post coitumDVE Distal Visceral EndodermECC Embryonic Carcinoma CellEMT Epithelial to Mesenchymal TransitionEpiLC Epiblast-like Stem CellEpiSC Epiblast Stem CellESC Embryonic Stem CellExE EXtraembryonic EctodermFGF Fibroblast Growth FactorFST FollistatinHCS High Content ScreeninghPSC human Pluripotent Stem CellHTP High ThroughPutICM Inner Cell MassLIF Leukemia Inhibitory FactorLS LIF + SerummPSC mouse Pluripotent Stem CellPS Primitive StreakPSC Pluripotent Stem Cell
xiii

XEN eXtraembryonic ENdodermTE TrophEctodermTSC Trophoblast Stem CellVE Visceral Endoderm
xiv

List of publications
Of the references in this thesis, I have contributed to the following publications.
Ostblom et al. Context-explorer: Analysis of spatially organized protein expressionin high-throughput screens, PLOS Computational Biology, 2019, DOI: 10.1371/jour-nal.pcbi.1006384. Awarded “editor’s pick” among all PLOS journals in the opensource toolkit section.
Tewary, Dziedzicka, Ostblom et al. High-throughput micropatterning plat-form reveals Nodal-dependent bisection of peri-gastrulation–associated versuspreneurulation-associated fate patterning, PLOS Biology, 2019, DOI: 10.1371/jour-nal.pbio.3000081.
Yachie-Kinoshita, Onishi, Ostblom et al. Modeling signaling-dependent pluripotentcell states with boolean logic can predict cell fate transitions, Molecular SystemsBiology, 2018, DOI: 10.15252/msb.20177952.
Tewary, Ostblom et al. A stepwise model of Reaction-Diffusion and Positional-Information governs self-organized human peri-gastrulation-like patterning, Devel-opment, 2017, DOI: 10.1242/dev.149658.
Nazareth, Ostblom et al. High-throughput finger-printing of human pluripotent stemcell fate responses & lineage bias, Nature Methods, 2013, DOI: 10.1038/nmeth.2684.
xv

Chapter 1
Introduction
1.1 PluripotencyThe creation of multicellular life forms, either through aggregation of unicellularorganisms such as slime molds or through cellular proliferation as in embryonic de-velopment, relieves cells from the constraint of needing to fill all functions necessaryfor survival. Instead, individual cells can rely on each other for certain functionality,and take on specialized roles to better meet the demands from unique challengesin their immediate environment. As an organism develops in space and time, cellsexist in increasingly unique milieus, stimulating them to differ more and more fromcells at other positions in space and time. Over generations of such differentiation infunctionality, cells become specialized to the point where they lose the capability todivide and give rise to other cell types. This successive reduction in the functional di-versity of a cell’s offspring is referred to as a decrease in cell potency or developmentalpotential.
Cell potency is defined over a range from totipotency (total potency) where cells canbecome any other type of cell, to unipotency (single potency) where a cell can onlygive rise to a single cell type. A complete loss of the ability to proliferate and give riseto other cell types defines highly specialized cells that are referred to as terminallydifferentiated. It is important to note that these terms are defined within the contextof an organism’s normal developmental environment and that acute environmentalabruption can cause cells to reduce their specialization and revert back to a more
1

potent state. This reversal is termed dedifferentiation when it is confined to celltypes of the same lineage (Wolff 1895) and reprogramming when it crosses lineageboundaries (Briggs and King 1952, Gurdon 1962). Cells that are capable of givingrise to all other cells in an organism, but not extraembryonic tissue, are defined aspluripotent (having a plurality of, but not total, potency). This cell state has highsignificance as it has been easier to isolate than other states of similar developmentalpotential and thus been more accessible for experimental manipulation, while stillretaining sufficient potency to generate cell and tissue types of great use both forresearch and clinical therapies.
1.1.1 The derivation of pluripotent stem cells
It has long been known that cells give rise to increasingly specialized progeny duringthe development of multicellular organisms, and the term “stem cell” was introducedabout 150 years ago by Ernst Haeckel (Haeckel 1868, Ramalho-Santos and Willen-bring 2007). He coined it in an evolutionary sense to describe the unicellular ancestorof multicellular life and later also used in a development sense to refer to the fertilizedegg (Haeckel 1877). This semantic parallelism in the use of evolutionary and devel-opmental nomenclature reflects Haeckel’s affection for recapitulation theory, a fasci-nating postulate suggesting that that during the course of development the embryomimics evolutionary progression from unicellular to multicellular life forms. Whilethis theory has since passed on to the realm of biological mythology, the word “stemcell” remained in developmental biology where it was used to describe other cell types,such as primordial germ cells (Häcker 1892, Weismann 1885, Wilson 1896).
Another notable development during this period was the introduction of the unitar-ian model of hematopoiesis, which proposed that cells of the blood lineage shareda common progenitor (Ehrlich 1879). While multiple names were suggested for thiscell type, scientists increasingly often came to refer to them as hematopoietic stemcells (Maximow 1906, 1909, Neumann 1912, Pappenheim 1896). However, the obser-vation and defining characteristics of these progenitor cells remained elusive until theearly 1960’s. It was then that University of Toronto scientists Till and McCullochdeveloped a novel method to assess the radiation sensitivity of marrow cell’s prolif-erative capacity, and noted curious nodules in the spleens of their mice consistingof undifferentiated and differentiated hematopoietic cells (Till and McCulloch 1961).
2

They later concluded that these colonies were clonal in nature (Becker et al. 1963)and classified the cells of origin as hematopoietic stem cells, which they defined asas being able to proliferate extensively, self-renew, and differentiate (the former twoproperties now often grouped together as one) (Siminovitch et al. 1963)
Around the same time, the study of pluripotency in vitro was about to get unexpectedhelp from a serendipitous discovery at The Jackson Laboratory, where a mouse strainoriginally acquired to study maternal environmental factors, showed unusually highincidence (~1%) of spontaneously developed testicular teratocarcinomas (tumors con-taining cells of multiple lineages) from germ cell origin (Stevens 1959, Stevens andLittle 1954). The findings were highlighted mainly for their utility in the study ofteratocarcinomas, which at the time was hampered by the longer life length of largermodel organisms. But, in their concluding paragraph, Stevens and Little hinted atwhat the future would bring, although unbeknownst to them at the time:
It is pointed out that an inbred strain of mice in which a relatively largepercentage of males develop testicular teratomas may be an important toolin the study of some hitherto unexplored aspects of the biology of theseinteresting growths.
Fifteen years later, those “unexplored aspects” come to include the first isolation ofpluripotent cells, initially from spontaneously developed testicular teratocarcinomas(Kahan and Ephrussi 1970, Rosenthal et al. 1970), and later from the implantation ofearly embryos into the adult testes (Evans 1972). It had previously been shown thatsingle cells from the teratocarcinomas could give rise to multiple lineages (Pierce et al.1959) and it was soon proven that they could contribute to chimaeric developmentwhen injected into blastocysts (where, remarkably, the host’s embryonal environmenthalted the malign autonomous proliferation of the teratocarcinoma cells) (Brinster1974). Due to their origin, these pluripotent cells come to be referred to as embryonalcarcinoma cells (ECCs).
It would take several additional years before pluripotent cells were derived directlyfrom an embryonic origin through their isolation from mouse pre-implantation em-bryos (Fig. 1.1) (Evans and Kaufman 1981, Martin 1981). Interestingly, these twostudies exploited different properties of the mouse system to establish pluripotentembryonic cell lines in vitro. Martin built directly from previous teratocarcinomastudies by hypothesizing that in vitro maintenance of ECCs was possible due to en-
3

dogenously secreted factors, and that embryonically derived cells of similar potencywould survive in the presence of the same factors. She extracted blastocysts frommice 3.5 days post coitum (dpc) and grew them in vitro overnight, after which sheisolated cells from the inner cell mass (ICM) and successfully cultured these in mediaconditioned by ECCs. Martin also demonstrated that once isolated ICM cells reachcritical mass, ECC-conditioned media was no longer required, presumably due thehigher amount of endogenously secreted factors from the embryonic cells themselves.She coined the term “embryonic stem cells” (ESCs) and one of her motivations fordeveloping this in vitro model was to facilitate the study of the origin of teratocar-cinoma cells. At the time it was not known whether these underwent neoplastictransformation or were of normal embryonic potential but divided abnormally in theabsence of the constraints imposed by the embryonic signalling environment. She wasalso keen on introducing genetic manipulations into ESCs to advance developmentalresearch, as noted in the final remarks of her publication:
Given these results, it seems likely that there will soon be available pluripo-tent, embryo-derived cell lines with specific genetic alterations that shouldmake possible a variety of new approaches to the study of early mammaliandevelopment.
While Evans and Kaufman also noted the need for an appropriate medium to cul-ture embryonically derived pluripotent cells, they emphasized that it was criticalto isolate embryonic cells at the same developmental stage as the ECCs to maxi-mize in vitro survivability. Their data indicated that this stage would be the earlypost-implantation blastocyst (5.5 dpc), but unfortunately embryos at this stage aredifficult to isolate. To facilitate derivation of embryonic cells with similar potency asECCs, they induced pregnant mice to enter diapause and successfully cultured cellsisolated from their blastocysts without the need of ECC-conditioned medium.
Diapause is a state of suspended animation, where the embryo does not proceed toimplant into the uterine wall after it has hatched from the zona pellucida and dis-tinctly separated the hypoblast from the epiblast (Nichols and Smith 2011). Diapauseis normally initiated by rodent and marsupial embryos when environmental signalsindicate unfavorable conditions for pregnancy, such as a pre-existing litter, to max-imize survival for both mother and embryos. When conditions improve, increasedoestrogen signals to the embryo to continue development. Diapaused blastocysts
4

Figure 1.1: Schematics of embryo-derived PSCs. Strikingly similar schematicsopened both publications on the first embryo-derived PSCs indicating how the missinglink in the pluripotency mesh had been found. Martin (left, dotted line) and Evans &Kaufman (right, bold arrow). Reproduced with permission.
have been shown to increase the efficiency of ESC derivation from mouse strains thatare normally not permissive to this derivation (Brook and Gardner 1997, Kawase etal. 1994), and it is possible that the successful stabilization of a pluripotent statein vitro is facilitated in species where there exists a stable pluripotent state in vivo,such as diapause in mice. It took almost a decade until similar cells were isolatedfrom animals without diapause, but after that new species were added in rapid suc-cession with pig and bovine in 1990 (Evans et al. 1990), sheep in 1991 (Notarianniet al. 1991), mink in 1992 (Sukoyan et al. 1992), rabbit in 1993 (Graves and More-adith 1993), significantly from non-human primates in 1995 (Thomson et al. 1995),and three years later also from human primates tweaking the primate protocol andapplying it on embryos donated from in vitro fertilization clients (Thomson et al.1998).
A note on strain 129
While diapause increases the probability of successful ESC derivation from otherwisereticent strains of mice, the efficiency of such derivations remained poor compared to
5

the curiously permissive 129 strain (Gardner and Brook 1997), until the developmentof a new media formulation decades later (Ying et al. 2008). Together with thestrain’s unique teratocarcinoma characteristics described above (possibly stemmingfrom the same genetic mutation that increases ESC derivation efficiency) this empha-sizes the paramount importance of the 129 strain for the establishment of pluripotentcell lines and the initial progression of the entire field was significantly acceleratedby the availability of these mice. For these reasons, I wish to briefly tell the story ofhow they came to be.
While the breeding of mice for desirable traits existed already in 18th century Japan(Royer), the mouse entered the scientific scene first in the early 1900s thanks toAbbie Lathrop, a previous schoolteacher who bred animals for educational uses inEngland (Shimkin 1975). Lathrop both conducted experiments on cancer inheritanceherself and sold mice to geneticist William Castle at Harvard, whose undergraduatestudent C.C. Little later started the now renowned Jackson Laboratory based onhis work with these and other strains (McNeill 2018). The popularity of the mousefor research during this time stemmed from the rediscovery of Mendelian geneticsand the interest in cancer inheritance, for which the small, relatively easily handledrodents soon became the model system of choice. The creation of the 129 strainoccurred in 1928 when geneticist LC Dunn was investigating the inheritance of coatcoloration by creating this inbred strain from stock he had received from Castle(Staats 1976). These mice were not referred to as “strain 129” until almost 20 yearslater when Dunn sent them to The Jackson Laboratory where they were recordedas “stock 129” in an investigation of the maternal environment’s role on offspringphenotype (Russell and Hurst 1945). In 1947, the lab and all its stock strains weredestroyed in a forest fire, nearly relegating strain 129 to a mere historical footnote(Simpson et al. 1997). This could have had catastrophic implications for the yet tobe established field of pluripotency research, but fortunately, the strain had alreadybeen distributed to other research groups at the time and could be reestablished atThe Jackson Laboratory shortly thereafter, enabling Stevens and Little to conducttheir testicular teratocarcinomas studies a few years later (Stevens and Little 1954).
I have chosen to highlight this story not just as an interesting historical anecdote,but to emphasize the importance of general scientific curiosity and the developmentof useful tools and models that can have profound impact for areas unimaginable
6
at their time of inception. This anecdote also exemplifies the humble beginningsof many scientific fields, highlights the value of revisiting existing work from a newperspective, and stresses the importance of off-site backups.
1.2 Unorganized heterogeneity as a confoundingfactor during in vitro differentiation
1.2.1 Refinement of culture conditions
Maintaining a population of cells with the developmental potential to differentiateinto any lineage in undefined culture conditions proved challenging, perhaps due to ahigh degree of batch to batch variation, from the use of teratocarcinoma-conditionedmedia and a fibroblast feeder layer. It is therefore not surprising that early at-tempts to grow pluripotent cells in vitro yielded heterogeneous cell populations withdiverse morphological phenotypes (Kahan and Ephrussi 1970, Rosenthal et al. 1970).The push to understand which signals were required for the maintenance of pluripo-tency lead to the development of increasingly defined culture conditions, which alsohelped advance the characterization of cell-to-cell heterogeneity within populationsof pluripotent stem cells (PSCs).
Initially, all ESC lines and most ECC lines were observed to maintain pluripotencyonly when cultured on feeder layers of growth-arrested embryonic fibroblasts. It waslater discovered that feeder-conditioned medium could sustain PSC proliferation inthe absence of a feeder layer of fibroblasts (Koopman and Cotton 1984, Smith andHooper 1983) and that media conditioned by alternative feeder cells were even moreeffective in maintaining pluripotency (Smith and Hooper 1987). Subsequently, itwas revealed that the differentiation inhibiting activity of these media was conferredthrough secretion of the soluble polypeptide Leukemia Inhibitory Factor (LIF) and itsaddition to non-conditioned medium was sufficient to support self-renewal of ESCs(Smith et al. 1988, Williams et al. 1988). This serves to illustrate the context-dependent activity of signalling molecules; LIF was named for its ability to inhibitproliferation and induce differentiation of myeloid leukemic cells in vitro (Gearing et al.1987), but had the opposite effect on PSCs. Soon thereafter, it was demonstrated thatfibroblasts with the LIF gene knocked-out could not act as self-renewal supporting
7

feeder cells and that LIF was essential for the implantation of the blastocyst in theuterine wall (Stewart et al. 1992). Interestingly, LIF is produced in two forms withmarkedly different effect on pluripotent cells: only the matrix-bound LIF (mLIF) cansupport the pluripotency and proliferation while the diffusible LIF (dLIF) cannot(Conquet et al. 1992, Rathjen et al. 1990, Robertson et al. 1993). LIF signalsvia a receptor complex consisting of a low affinity LIF receptor (LIFR𝛽) and theglycoprotein receptor subunit gp130. When activated, the intracellular domain ofgp130 stimulates a self-renewal program through its activation of the JAK/STATpathway (Matsuda et al. 1999).
To replace the undefined fetal calf serum in traditional self-renewal media cocktails, aserum-free replacement was developed consisting of N2 (containing transferrin and in-sulin to increase cell viability, and BSA to increase cell attachment) and B27 (primar-ily for its antioxidative properties) (Ying and Smith 2003, Ying et al. 2008). WhileN2B27 + LIF could sustain pluripotency for a few passages, proliferation would thenslow down as cells differentiated towards neural fates (Ying and Smith 2003). Sinceneural fates are found in the anterior part of epiblast during development, a poste-riorizing signal, BMP-activity, was tested as a counterweight for this fate induction.Combining N2B27, LIF, and BMP4 managed to prevent neural differentiation andbalance cells in the pluripotent state. The self-renewal capacity of BMP4 was foundto convey its effect through the induction of inhibitor of differentiation (Id) proteins,which are also upregulated by serum (Ying et al. 2003).
As media conditions became increasingly defined, it also became apparent that prop-agation of mouse and human cells did not rely on the same signalling moleculesto support self-renewal in vitro. LIF was already known to be non-essential whenderiving primate PSCs from embryos (Thomson et al. 1995), and it was soon demon-strated that cultured hPSCs did not have active LIF signalling (Dahéron et al. 2004,Humphrey et al. 2004) and differentiated towards trophectoderm when stimulatedwith BMP (Xu et al. 2002). Instead, to fill the same function as BMP for mousepluripotent stem cells (mPSCs) and block neural differentiation, NODAL/ACTIVINA signalling could be used in hPSC culture (Vallier et al. 2004). Stimulation of thispathway alone could not maintain self-renewal beyond a few passages, but togetherwith FGF2 it was sufficient to propagate hPSCs indefinitely under serum-free, feeder-free conditions (Vallier et al. 2005). This might initially appear contradictory, as
8

FGF signalling is known as a differentiating factor for mPSCs, both in vitro and invivo. However, rather than thinking of signalling molecules as unidirectionally im-pacting differentiation regardless of cell state, it can be instructive to depict them asa gravitational forces pulling cells towards attractor states and preventing them fromescaping once they arrive, conceptually not unlike how celestial bodies act on travel-ling astronomical objects such as comets and meteors. For FGF, this attractor statein the pluripotency continuum appears to be the late blastocyst as it was shown thatembryonic mouse cells derived from this state (so called epiblast stem cells, EpiSCs)could be propagated in vitro with exogenous FGF and ACTIVIN/NODAL signalling(Brons et al. 2007, Tesar et al. 2007), and that the same signals could also transitionmPSCs into EpiSCs (Guo et al. 2009).
1.2.2 Transcriptional heterogeneity in pluripotent popula-tions
The increasingly defined media conditions vastly improved our understanding ofwhich signals support the pluripotent stem cell state in vitro, and revealed at leasttwo distinct pluripotent states: one similar to the early pre-implantation blastocystand one more alike the late post-implantation blastocyst. However, this progress didnot explain how PSCs grown together in the same culture could elicit heterogene-ity in their expression of key pluripotency and differentiation associated genes. Theexpression of these genes could vary greatly, giving rise to either bimodal or long-tailed distributions within the same population of PSCs. Within multimodal geneexpression distributions, a distinction can be made between two levels of transcrip-tional heterogeneity: smaller variations within a single expression peak, and largervariation between multiple peaks within wide, long-tailed distributions. Previouslylaid down terminology refers to the smaller scale variations as “microheterogeneity”,and the larger variations as “macroheterogeneity” (Huang 2009). Microheterogeneityis often explained by transcriptional and translational bursting (Raj and van Oude-naarden 2008, Singer et al. 2014), while macroheterogeneity in many cases is ofunknown origins, but has shown to to be indicative of phenotypic differences (Grafand Stadtfeld 2008, Huang 2009). Within the context of this thesis, any mention oftranscriptional heterogeneity refers to macroheterogeneity, unless otherwise specified.
Of the genes that are bimodally expressed among mPSCs, the transcription factors
9

NANOG and REX1 are the most thoroughly investigated. Both proteins are essentialfor the maintenance of pluripotency, and are co-regulated with the core pluripotencytranscription factors OCT4 and SOX2 (Shi et al. 2006, Yates and Chambers 2005).By classifying mPSCs into subpopulations according to their REX1 and NANOGexpression levels, several studies have probed the functional properties of the respec-tive subpopulations. These two subpopulations elicit distinct phenotypes in terms oftheir ability to differentiate into multiple lineages in vitro (Hayashi et al. 2008, Markset al. 2012), and unequal potential to integrate into mouse blastocysts (Toyooka etal. 2008). Likewise, Stella (Dppa3) and Hex heterogeneity divides mPSCs into twosubpopulations with functional differences. Stella/Pecam double negative cells rarelyformed embryoid bodies and were more primed to undergo retinoic acid induced neu-ral differentiation when compared to mPSCs positive for both markers. In addition,mPSCs expressing either high or low levels of the endodermal marker Hex showed dis-tinct differentiation potentials when introduced back into mouse blastocysts, wherecells high in Hex expression would contribute less to the epiblast and more to theextraembryonic tissues (Canham et al. 2010). By revealing how the differences inmRNA and protein abundances affects functional mPSC characteristics, these stud-ies have motivated further probing of the mechanisms behind this phenomena, andits role in pluripotency.
1.2.3 Dynamic transitions between cell states
Isolation of cells expressing either high or low levels of REX1, showed that the originalbimodal population level expression distribution emerged from either subpopulationafter five days of culture in LIF + Serum (LS) (Toyooka et al. 2008). This suggestedthat single cells could transition between the two subpopulations, rather than beingconfined to a single cell state, which was also confirmed with clonal experiments. Morerecently, single cell tracking and lineage analyses have shown that individual mPSCscan spend many cell cycles in one expression state and then, seemingly stochastically,switch to the opposite state (Singer et al. 2014). This ability to transition between cellstates has provoked speculations that such dynamic heterogeneity is fundamental topluripotent populations (MacArthur and Lemischka 2013, Toyooka et al. 2008), andthe behavior has been suggested to arise either from regular oscillations or stochasticfluctuations (Herberg et al. 2016, Singer et al. 2014).
10

However, combinatorial inhibition of FGF signalling and stimulation of the WNTpathway (through dual small molecule inhibition of ERK and GSK3-𝛽, respectively),consolidates otherwise bimodally expressed pluripotency associated genes into asuper-high unimodal expression state (Singer et al. 2014, Xu et al. 2014, Ying etal. 2008). mPSCs cultured in this inhibitor combination (2i) remain pluripotentand differentiate with similar dynamics as the REX1-high population in LS, whilethe REX1-low population is biased toward mesoderm differentiation (Marks et al.2012). Both the REX1-high and the 2i population have similar expression profilesto the pluripotent epiblast in the early blastocyst (Boroviak et al. 2014, 2015).While inhibition of the FGF signalling pathway alone is sufficient to prevent mPSCdifferentiation (consistent with the capability of paracrine FGF-signalling to inducedifferentiation in mPSC cultures and the early embryo (Kang et al. 2013, Kunathet al. 2007, Morris et al. 2013, Stavridis et al. 2007)), it fails to sustain mPSC self-renewal and single-cell survival without the addition of LIF and GSK3-𝛽 inhibitor(which also reduces neural differentiation), either as single factors or in combinationfor additive effects (Ying et al. 2008). Interestingly, while the substitution ofWNT3A for GSK3-𝛽 inhibitor limits neural differentiation it does not confer thesame proliferative advantage, indicating that either the small molecule has effectsunrelated to the WNT pathway or cells interact with the developmentally relevantWNT-ligand in a way that is not possible with synthetic molecules. Together,these data suggest that expression bimodality and dynamic state transitions are notfundamental properties of the pluripotent state, but rather characteristics of partlydifferentiated pluripotent populations, such as mPSCs maintained in LS.
As for mPSCs, transcriptional heterogeneity within the same population has also beenobserved for EpiSCs. Subpopulations within EpiSC cultures show different expressionof SOX1, which correlates with the propensity to differentiate into neuronal cells fates,and when isolating a subset of EpiSCs high in BRA from a mixed population, thesecells will reestablish the mixed population of cells when cultured (Tsakiridis et al.2014), reminiscent of behavior seen in REX+/- mPSCs. Further, EpiSCs also shownoticeable transcriptional heterogeneity between cell lines in the dynamics of theirmarker regulation when induced to differentiate, both for the pluripotency markerNANOG, the neuroectoderm markers PAX6 and SOX1, and the primitive streakmarkers BRA and MIXL1 (Kojima et al. 2014).
11

1.2.4 The pluripotency continuum
These heterogeneous populations of stem cells at different stages of pluripotency in-dicate that there is a broad spectrum of transcriptional states that fit the criteria ofpluripotency. While the developmental ordering of these states is difficult to deci-pher from their inter-transitional behavior in vitro, in vivo observations suggest thatembryonic stem cells travel along a continuum of decreasing potency during earlydevelopment. This has led to the prevailing view that pluripotency defines a rangeon this potency continuum, and that there are several unique states in this rangethat can be stabilized in vitro.
In mouse development, the range of pluripotency spans about four and a half days,and it is only during diapause that there exists a stable self-renewing pluripotentcell type. This entails that the stabilized states in vitro might unavoidably acquiresome culture specific properties as they are being kept under a constant signallingenvironment unlike what exists during their continuously progressing developmentaltrajectory. This also hints at that it might be possible to isolate a plethora of suchstates by slightly tweaking signalling molecule concentrations and combinations. Al-ready, at least eight such states have been isolated and propagated in vitro (Morganiet al. 2017), the most notable being the naive mPSCs, the primed EpiSCs, and anintermediate between the two: the formative epiblast like cells (EpiLCs). mPSCscan be derived from the early epiblast at embryonic day 3.5 - 4.5, and EpiSCs can bederived from the late blastocyst at day 5.5 - 8.0 (Fig. 1.2). EpiLCs have not beenderived directly from embryos, but arise as a transient state when mPSCs are beingtransitioned towards an EpiSC state with FGF and ACTIVIN A. This intermediatestate has similarities with the pre-gastrulating mouse embryo and with hPSCs, and ithas proven valuable in the generation of primordial germ cell in vitro (Hayashi et al.2011) and when inducing mPSCs to differentiate in spatially confined environments(Morgani et al. 2018).
12

Figure 1.2: The pluripotency continuum. Pluripotent cells a different embryonicstages in the mouse embryo (top) and three isolated in vitro pluripotency stages fromdifferent stages of the pluripotency continuum (bottom). TE = Trophetoderm, PrE =Primitive endoderm, PS = Primitive streak, NE = Neurectoderm. Pr = Proximal, D =Distal, A = Anterior, P = Posterior. E = Emryonic day. Reproduced unmodified fromoriginal work (Morgani et al. 2017) licensed under CC-BY 4.0.
13
1.3 Organized heterogeneity as a developmentalnecessity in vivo
While transcriptional heterogeneity is often viewed as a hurdle for efficient targeteddifferentiation of PSCs in vitro, it is a necessity for multicellular developmental sys-tems, where genetically identical cells must diverge phenotypically to create complexorganisms. Organization of this heterogeneity unfolds continuously throughout de-velopment, mediated by long and short range signals, and feedback loops betweenindividual cells. Observational hallmarks of mammalian developmental organizationinclude the transition to a bilaminar structure in the early blastocyst, and gastrula-tion, where cell migration transforms the embryo into a trilaminar organism. How-ever, differences between cells at varying spatial locations arise much earlier, startingalready at the division of the zygote. The onset of these developmental events mayinitially appear to be stochastic, but have gradually been revealed to be coordinatedby an intricate balance of inherent transcriptional variation arising from asymmetri-cal cell divisions and acquired differences induced from the local microenvironmentas developmental progresses (Chazaud et al. 2006, Meilhac et al. 2009, Plusa et al.2008).
1.3.1 The 2 - 4 cell stage
The first division in the mouse embryo creates two morphologically identical, butphenotypically distinct daughter cells. The axis of the division is biased (but notconclusively determined) by the sperm entry position in the egg, which also indicateswhich daughter cell will give rise to predominately vegetal and the predominantlyanimal portion of the embryo, as well as their order of division (Piotrowska andZernicka-Goetz 2001). Although both daughter cells can contribute to all blastocystlineages, they favor either extraembryonic or embryonic contribution (Gardner 2001,Piotrowska and Zernicka-Goetz 2001, Piotrowska et al. 2001).
At the 4-cell stage, the blastomeres in the embryo show heterogeneity in arginineH3-methylation (Torres-Padilla et al. 2007), PRDM14 gene expression (Burton et al.2013), OCT4 gene expression kinetics (Plachta et al. 2011), and SOX2 DNA-bindingdynamics (White et al. 2016). Variation in these parameters are indicative of cell fatespecification into either the ICM or extraembryonic tissue. The developmental po-
14

tential of cells in the 4-cell stage has also been linked to their orientation with respectto the animal-vegetal axis of the embryo (Fig. 1.3). The blastomere constitutingthe most vegetal portion of the embryo form extraembryonic lineages to a higher de-gree than the other cells (Piotrowska-Nitsche and Zernicka-Goetz 2005, Piotrowska-Nitsche et al. 2005), and chimaeras constructed from only vegetal 4-cell blastomeresdie shortly after implantation while the animal-vegetal located blastomeres have thehighest chimera contribution (Piotrowska-Nitsche et al. 2005). Differences in the4-cell stage are also predictive of postimplantation contribution where progeny fromspecific 4-cell blastomeres can contribute exclusively to either the epiblast or extraem-bryonic tissue (Tabansky et al. 2013).
1.3.2 The 8 - 32 cells stage
Organized heterogeneity is observed during the transition from an 8-cell to 16-cellembryo when cells pack tightly together in an event called compaction. Beforecompaction, all cells in the embryo are polarized along the apical-basal axis (cor-responding to the outside and inside of the embryo) since they are asymmetricallysurrounded by other cells. After compaction however, cells that are internalizedin the embryo will be symmetrically surrounded by the outside cells and thereforelose polarization. The mechanism by which cells lose polarity is mediated throughE-CADHERIN junctions and E-CADHERIN null mutants are polarized regardlessof their position within the embryo (Stephenson et al. 2010). When present, E-CADHERIN forms a complex with 𝛼-CATENIN, 𝛽-CATENIN, and NF2 which ap-pears associated with the AMOT/AMOTL complex (Gladden et al. 2010, Yi et al.2011). AMOT/AMOTL was discovered to sequester YAP/TAZ to the cytoplasmand (Leung and Zernicka-Goetz 2013) and thus inhibits TEAD4 activation of CDX2expression, which otherwise is a hallmark of TE fated cells as CDX2 inhibits OCT4while positively reinforcing its own expression (Niwa et al. 2005). Cell polarizationcauses accumulation of PAR3, PAR6 and atypical protein kinase C (aPKC), whichrestricts the AMOT/AMOTL complex to the apical part of the cell (Stephenson etal. 2010) and allows for unphosphorylated YAP/TAZ to localize to the nucleus andupregulate CDX2. However, the outer polarized cells in the embryo can still give riseto inner cell mass blastomeres through asymmetrical division. A suggested mecha-nism for this is that most of the CDX2 mRNA is apically localized in the cell and
15

thus predominantly absent from the inner daughter cell after mitosis (Skamagki etal. 2013).
Thus, the early embryo uses internalization as a protective mechanism from uniformpolarization and thereby increases the heterogeneity amongst cells in the morula. Asimilar impact of the microenvironment on cell fate is clear also in vitro, where iso-lated cells from the inner cell mass can become re-polarized and can give rise to TEcells at higher frequencies than in vivo (Hogan and Tilly 1978). The separation ofembryonic and extraembryonic cells at this stage can be distinguished by transcrip-tional differences: trophectoderm cells have high levels of CDX2 (Niwa et al. 2005),EOMES (Russ et al. 2000), and GATA3 (Ralston et al. 2010), while pluripotent cellsexpress OCT4 (Nichols et al. 1998), Nanog (Mitsui et al. 2003), and SOX2 (Avilionet al. 2003). The morphological differences between these cell types becomes evidentat the 32-cell stage of the early blastocyst, where trophectoderm cells organize in aring structure around the inner cell mass (Fig. 1.3).
1.3.3 The early blastocyst
Another striking developmental example of organization of transcriptionally diversecells, is the sorting of the “salt and pepper”-like expression of NANOG and GATA6that becomes apparent at the 64-cell stage of the embryo. This mosaic expressionwas initially hypothesized to arise from stochastic transcriptional changes amongindividual cells in the ICM, but was shown to be linked to transcriptional differences inthe cells derived from the 8-16 and 16-32 cell divisions. Specifically, cells arising fromthe 8-16 cell division have high Fibroblast Growth Factor 4 (FGF4) secretion, andcells from the 16-32 division, have upregulated levels of the FGF4-receptor FibroblastGrowth Factor Receptor 2 (FGFR2) (Morris et al. 2013, Ohnishi et al. 2014). Thebinding of FGF4 to FGFR2 activates the transcription factor Gata6 by inhibiting theNanog transcription factor, which would otherwise repress Gata6 expression (Kang etal. 2013). ICM cells at the 32-cell stage initially elicit high expression of both thesegenes, but upon downregulation of either NANOG or GATA6, the embryo transitionsinto a bilaminar structure with a thin layer of GATA6+ hypoblast cells and a ballof NANOG+ epiblast cells sitting on top (Fig. 1.3) (Bin et al. 2014, Chazaud etal. 2006). Mechanistically, the resolution of salt-and-pepper expression is facilitatedboth by actin-dependent cell sorting and positional induction (Meilhac et al. 2009).
16
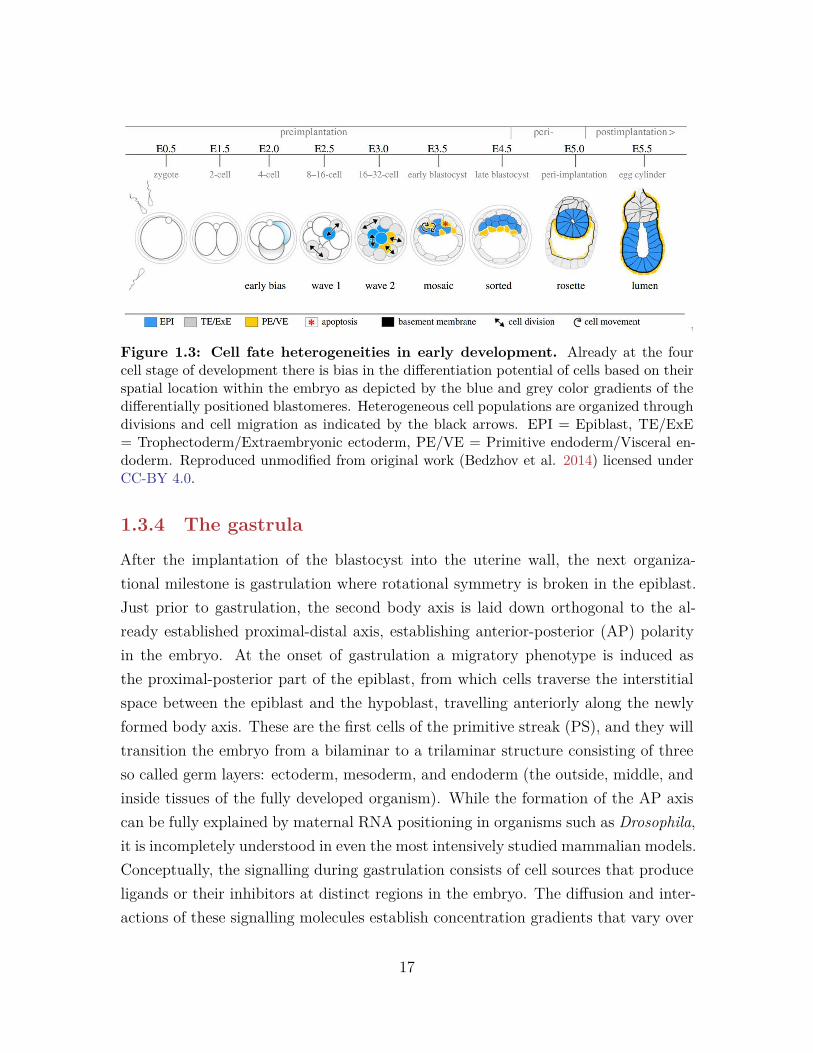
Figure 1.3: Cell fate heterogeneities in early development. Already at the fourcell stage of development there is bias in the differentiation potential of cells based on theirspatial location within the embryo as depicted by the blue and grey color gradients of thedifferentially positioned blastomeres. Heterogeneous cell populations are organized throughdivisions and cell migration as indicated by the black arrows. EPI = Epiblast, TE/ExE= Trophectoderm/Extraembryonic ectoderm, PE/VE = Primitive endoderm/Visceral en-doderm. Reproduced unmodified from original work (Bedzhov et al. 2014) licensed underCC-BY 4.0.
1.3.4 The gastrula
After the implantation of the blastocyst into the uterine wall, the next organiza-tional milestone is gastrulation where rotational symmetry is broken in the epiblast.Just prior to gastrulation, the second body axis is laid down orthogonal to the al-ready established proximal-distal axis, establishing anterior-posterior (AP) polarityin the embryo. At the onset of gastrulation a migratory phenotype is induced asthe proximal-posterior part of the epiblast, from which cells traverse the interstitialspace between the epiblast and the hypoblast, travelling anteriorly along the newlyformed body axis. These are the first cells of the primitive streak (PS), and they willtransition the embryo from a bilaminar to a trilaminar structure consisting of threeso called germ layers: ectoderm, mesoderm, and endoderm (the outside, middle, andinside tissues of the fully developed organism). While the formation of the AP axiscan be fully explained by maternal RNA positioning in organisms such as Drosophila,it is incompletely understood in even the most intensively studied mammalian models.Conceptually, the signalling during gastrulation consists of cell sources that produceligands or their inhibitors at distinct regions in the embryo. The diffusion and inter-actions of these signalling molecules establish concentration gradients that vary over
17

space and time, and instruct cellular decision making (Child 1941, Wolpert 1969).But how are these gradients established in the early gastrulating embryo?
Shortly after implantation, there is already proximal to distal asymmetry in the em-bryo, with the trophectoderm (extraembryonic ectoderm, ExE) expanding at the siteof implantation. At this stage, pro-NODAL is homogeneously expressed throughoutthe epiblast, which stimulates both the production of BMP4 from the ExE (Winnieret al. 1995, Ying and Zhao 2001) and the expression of NODAL homogeneouslythroughout the epiblast. BMP4 ligand concentration will thus be the highest in theproximal part of the epiblast and the BMP-pathway is activated in this region asgastrulation initiates (Di-Gregorio et al. 2007, Hayashi et al. 2002), but inactive inthe distal epiblast (Okamura et al. 2005). BMP4 ligand binds to several receptors(BMPR2, ACTR2A, and ACTR2B) and its signal activity is transduced via phospho-rylation of SMAD1, SMAD5, and SMAD9 which dimerize with SMAD4 and localizedto the nucleus.
In the epiblast, BMP-signalling acts to induce the expression of WNT3 (Ben-Haimet al. 2006, Miura et al. 2010), which positively autoregulates its on expression andfurther enhances NODAL signalling (Fig. 1.4) (Ben-Haim et al. 2006, Norris etal. 2002) WNT ligand binding to Frizzled and LRP5/6 receptors which causes thedegradation of the GSK3-𝛽 destruction complex. When intact, this complex bindsand prevents 𝛽-CATENIN from translocating to the nucleus, where it would initiatetranscription of WNT target genes. Notably, WNT3 elicit AP-polarized expressionin the embryo already at the onset of gastrulation, as it is expressed in the visceralendoderm close to future location of the PS (Fig. 1.4) (Rivera-Pérez and Magnuson2005).
Like BMP, NODAL is a member of the TGF-𝛽 superfamily and transduces its sig-nalling via receptors SMADs, namely SMAD2 and SMAD3, which dimerize withSMAD4 and translocate to the nucleus. NODAL also binds the same receptors asBMP, ACTR2A and ACTR2B, but additionally requires the CRIPTO co-receptor.During gastrulation, NODAL signalling is gradually localized to the node in the distaltip of the embryo, and later directs the left-right asymmetries of the embryo (Brennanet al. 2001).
To prevent that the positive feedback loop between these signals causes them to flood
18

Figure 1.4: Signalling during gastrulation. Localized signalling networks duringearly gastrulation illustrate the how ti signalling activity of BMP4, WNT3, and NODALis restricted to the posterior part of the embryo via the inhibitors secreted from the AVE.A-Epi = Anterior Epiblast, P-Epi = Posterior Epiblast, AVE = Anterior visceral endoderm,VE = visceral endoderm, PS = primitive streak, ExE = Extraembryonic ectoderm. Pr =Proximal, D = Distal, A = Anterior, P = Posterior. Reproduced unmodified from originalwork (Morgani et al. 2018) licensed under CC-BY 4.0.
19

the entire epiblast and induce cells to all acquire the same fate, a source of inhibitorsrestricts the signal activity to the posterior proximal region of the epiblast, where thefirst primitive streak cells are formed. The inhibitors are secreted by cells within theanterior visceral endoderm (AVE), which is instrumental to robust AP-axis formation.After implantation, the AVE emerges in the most distal region of the cup-shapedembryo, where a group of cells in the visceral endoderm is induced to upregulatethe canonical inhibitors secreted by the AVE (CER1 and LEFTY1 against BMP,and DKK1 against WNT) (Fig. 1.4). This induction is thought to largely follow asa consequence of the positioning of these distal-most cells, the furthest away fromthe BMP-secreting, proximally positioned ExE. The subsequent migration of theAVE from the distal tip to what becomes the anterior side of the embryo is guidedby cells expressing the highest levels of the inhibitors to the typical posteriorizingsignals, which are positioned slightly off-center on the distal tip already at the startof migration (Takaoka et al. 2011). The migration is initiated and propagated byconsorted cell divisions in the visceral endoderm opposite the direction of migration,suggesting that there are already established asymmetries in the embryo at this point(Antonica et al. 2019).
Although the canonical source of cells forming AVE originate in the VE, there isalso evidence suggesting that some epiblast cells show expression of typical AVEsecreted inhibitors already prior to implantation and that these cells form part ofthe AVE where they aid its migration (Takaoka et al. 2006, 2011). While suchcross germ layer transitions might seem unexpected, it has also been observed duringgastrulation when cells from the prospective definitive endoderm intercalate into thevisceral endoderm, creating a cell population of mixed origins that later forms thegut endoderm (Kwon et al. 2008, Nowotschin et al. 2019, Viotti et al. 2014). Thesefindings underscore the importance of both cell fate trajectory and the immediatelocal microenvironment in instructing a cell’s current fate decision. Unless cells arehighly diverse phenotypically, they can take on similar fates when exposed to thesame microenvironment.
The formation of the two body axes and a third germ layer are not just developmentalmilestones but also evolutionary hallmarks. The orthogonal body axes are necessaryfor the establishment of bilateral symmetry which allows several key advantages overamorphous and radially symmetrical organisms. Bilateral organisms are capable of
20

actively directing their movement instead of being confined to drifting or stationarylife cycles, which also guarantees that the same end of the organism is consistentlyfacing the direction of movement. This is believed to have given rise to cephaliza-tion among bilaterals, where the sensory organs are concentrated near the forwardfacing body part, which yielded superior predator and prey detection, and gave riseto complex neuronal structures in close proximity to improve the processing speedof the increasingly complex sensory information (Brusca et al. 2016). The bilateralclade is highly successful in evolutionary terms, as it comprises over 99% of extantanimal species although it arose relatively recently (Niehrs 2010). However, bilat-eralism alone likely does not explain the evolutionary success of this lineage, sincethere are also Cnidarians (such as some sea anemones) that possess orthogonally po-sitioned body axes (Finnerty et al. 2004). Rather, it is the combination of bilateralbody symmetry with a trilaminar structure that uniquely identifies this clade. Themesoderm germ layer is believed to have developed around 40 million years after theectoderm and endoderm germ layers and allowed the formation of diverse tissues suchas muscle and bone (Stainier 2005). It is tightly linked to the formation of the APbody axis, both developmentally and evolutionary (Technau and Scholz 2003).
1.4 Organized heterogeneity as a developmentalmodel system in vitro
Given the paramount developmental and evolutionary significance of organized spa-tial heterogeneity, it is a scientifically intriguing process to study. In addition toproviding insight into such fundamental topics, research on this topic holds greatpromise for regenerative therapies and the treatment of developmental disease. Mostof our understanding about the processes that create and organize heterogeneouspopulations during development come from in vivo studies of embryos. By definition,this is the ideal system for investigating the impact of experimental modificationson embryonic development. However, the complexity of the embryo brings abouttechnical limitations and makes it difficult to disentangle the impact of any singlemechanism since it plays out in a complex embryonic context. Just as one mightconsider interplay between components in order to understand the behavior of a sys-tem, reducing complexity can be a useful strategy to elucidate the rules that govern
21
individual components of a system.
For processes that occur during or after implantation, such as gastrulation, the in-accessibility of the embryo at these stages is an additional hurdle. There are alsoethical considerations to studying these advanced stages of development, and in pri-mates the regulations directly prevent it, further emphasizing the need for useful invitro models. Ultimately, it will likely be the combination of holistic in vivo studiesand reductionist in vitro studies that yield the most profound insights into how devel-opmental mechanisms work. Here, I will describe the available in vitro platforms forstudying developmental processes while employing an engineering focus on systemsthat construct in vivo like assays from individual components, rather than the ex vivogrowth of embryos isolated from in vivo development.
1.4.1 Embryo-like cell aggregates
The most faithful developmental model would consist of the same embryonic andextraembryonic cell types that are present in vivo. Such models have recently beencreated in the form of so called ETX-embryos where PSCs, trophoblast stem cells(TSCs), and visceral endoderm (XEN) cells are aggregated together and frequentlyself-organize into structures that resemble the early embryo to a remarkable degree(Sozen et al. 2018). ETX-embryos undergo gastrulation-like events such as EMTand migration of PS-like cells, and formation of mesoderm and definitive endoderm.The distal-most XEN cells in these embryo-like structures upregulate LEFTY1 andmigrate proximally to the side of the PSC-region opposite the induction site forthe primitive streak-like cells, reminiscent of the anteriorly located AVE in vivo.Replacing the XEN layer with a basement membrane made from Matrigel still allowedaggregates of TSCs and PSCs to fuse and develop into an embryo-like structure thatinduce a primitive streak like population of cells at one end of the embryo, but fail toundergo EMT (Harrison et al. 2017), indicating that instruction from the VE/XEN-cells might be necessary for complete EMT. Notably, multiple induction sites of BRAcould occur in these embryo-like structures indicating that inhibitors from the AVEare primarily stabilizing the induction site of PS to a single location, similar to invivo-findings that mesoderm induction is more widespread in the absence of an AVEin vivo.
An interesting finding from studies on embryo-like systems in vitro is that in the
22

absence of both TSCs and XEN cells, aggregates consisting only of PSCs occasionallyexpressed the PS-marker BRA in a polarized manner (Harrison et al. 2017). Tightcontrol over the number of cells per aggregate (~300) provided robust single regionlocalization of BRA and CDX2 expression as well as elongation of the aggregates(Turner et al. 2017). This is notable since BMP signalling from the ExE and secretedinhibitors from the AVE are thought to be key in localizing PS induction to a singlesite in vivo, but such polarized induction can apparently be obtained without thesecomponents in vitro. Endogenous WNT and NODAL signalling is integral to theinduction of BRA in mPSCs (Morgani et al. 2018, Turner et al. 2017) and exogenoussupplementation of activators for these pathways has been shown to enhance bothpatterning localization reproducibility and shape elongation (Turner et al. 2017).These elongated aggregates lack anterior structures, and the expression localizationis similar to what is seen in the caudal regions of the embryo at the onset of PSformation and indicates the presence of an anterior-posterior axis in the aggregates.Similar, but less pronounced, phenomena have also been observed in PSC and ECCaggregates in previous studies (Berge et al. 2008, Marikawa et al. 2009).
In the absence of the regionalized signalling centers, which factors could be influencingthe spatial fate organization in PSC populations? As elaborated upon in previoussections, there are several microenvironmental factors that organize transcriptionalheterogeneity in vivo, including varying cell densities, cell-to-cell contact, and localcytokine variation. Encouragingly, similar mechanisms are involved in cellular fatespecification in vitro (McBeath et al. 2004, Snijder and Pelkmans 2011), wherespatial heterogeneity of these factors leads to variability in efficiency of endocytosisand the vulnerability to viral infection (Snijder et al. 2009), influences epithelial tissuegrowth (Kim et al. 2009), impacts the expression of angiogenic factors in tumor cells(Kumar et al. 1998), and influences the differentiation potential of mouse and humanPSCs (Davey and Zandstra 2006, Peerani et al. 2007). While spatially varyingfactors have shown to be indicative of cellular fate regulation, some cell-intrinsicvariables appear not to be as critical. For example, recording NANOG expressionover time in individual mPSCs, revealed that transitions between expression statesare uncorrelated between sister cells (Singer et al. 2014), implying that they do notarise from heritable traits. Similarly, drastic transcriptional changes could arise fromthe process of cell division, which in theory could lead to differential segregation
23

of important cellular molecules. However, at least for abundant mRNA molecules(>200 transcripts/cell), such division differences are minor, and transcripts tend tobe evenly distributed between sister cells (Shi et al. 2015).
1.4.2 In vitro differentiation in controlled microenviron-ments
Given the impact of a cell’s microenvironment on population heterogeneity, modifyingit could yield direct control over the organization of cell fates and further insightinto what underpins these organizational processes. Micropatterning of cells intoconfined spatial regions provides such environmental control and can be performedeither via microcontact printing where ECM is deposited into the well using a stamp(Ruiz and Chen 2007), or via UV-lithography where a photo-sensitive coating isfunctionalized by UV-light at selected regions where ECM can attach (Azioune et al.2009). When applied to 96-well plates, this type of micropatterning proved effectivein controlling microenvironmental variation between wells in high-throughput (HTP)screening assays and reduced variation in cell response to exogenous cues (Nazarethet al. 2013)
Previous efforts to elucidate the effect of microenvironmental variation on spatiallydistinct regions within stem cell colonies, include analyses of spatial gene expressionin self-formed substrate-adherent colonies of mPSCs under pluripotency-maintainingconditions (Davey and Zandstra 2006). This study revealed that high expression ofOCT4 and NANOG localizes to the colony center, and gradually decreases towardsthe edge of the colony, a trend that was later also observed in the expression of OCT4and SOX2 for micropatterned human PSCs (hPSCs) (Ostblom et al. 2019).
When circular micropatterned hPSC colonies are induced to differentiate for 48 h withBMP4, which induces posterior fates during gastrulation, they display heterogeneousdifferentiation organized in three centrosymmetric annular segments (Fig. 1.5A-C)(Warmflash et al. 2014). These three segments displayed markers indicative of differ-ent developmental regions starting with CDX2 in the outermost cells along the edgeof the colony, a ring of BRA inside the outermost segment, and the SOX2 in the cen-ter of the colony. The developmental correspondences of these regions were initiallyreported as trophectoderm (CDX2+), PS (BRA+), and epiblast (SOX2+). Careful
24

combinatorial marker mapping between similar differentiating micropatterned mouseEpiLCs and the mouse embryo, determined similar developmental identities definingthe SOX+ region as posterior epiblast, the BRA+ region as PS, and the CDX2+region as embryonic and extraembryonic mesoderm (Morgani et al. 2018). RNA-sequencing of the CDX2+ hPSCs show that they indeed appear to be most similar toExE tissue in human embryos (Chhabra et al. 2019), indicating a species-dependentvariation in these developmental assays possibly stemming from the different timingsat which extraembryonic mesoderm can be derived during development for primatesand mice (Enders and King 1988, Kinder et al. 1999, Luckett 1978). The cellsin the Bra positive region also elicit migratory features such as active cytoskeletalmodulation and upregulation of the EMT marker SNAIL (Tewary et al. 2017, Warm-flash et al. 2014), and switches from epithelial-like expression of E-CADHERIN tomesenchymal-like expression of N-CADHERIN (Morgani et al. 2018), similar to thePS in vivo.
It was found that the induction and extent of these regions were dependent on the sizeof the colony: smaller colonies (~200 um) would lose the innermost fates and showlargely homogeneous or seemingly unorganized differentiation while larger colonies(~1000 um) would display three distinct differentiating regions (Fig. 1.5) (Morganiet al. 2018, Tewary et al. 2017, Warmflash et al. 2014). This indicates that sig-nalling niches in small colonies are similar to those close to the edges of large colonieswhile the central signalling niches of large colonies are not present in small colonies.It was also demonstrated that the cell response could be modulated by tuning theconcentration of the inducing ligands and the time colonies differentiated (Fig. 1.6)(Tewary et al. 2017), which is consistent with the current understanding of how cellfates pattern according to positional information (Briscoe and Small 2015, Green andSharpe 2015). Specifically, longer time of differentiation and higher ligand concen-tration would promote the fates of the outer region of 1000 um colonies suggestingthat the outside of colonies experience higher levels of these signals in general.
In agreement with the location-dependent fate induction, it was shown that the abun-dance of phosphorylated SMAD1 (pSMAD1), an effector in the BMP signalling path-way, was the highest at the colony edge in both human (Tewary et al. 2017) andmouse colonies (Morgani et al. 2018). A possible explanation for this variation inBMP activity throughout the colony would be the presence of BMP-inhibitors se-
25

A B C
A B C
D
Figure 1.5: Spatial fate patterning. A) A signalling gradient can induce different fate(A, B, C) and different concentrations. B) A radially uniform signalling gradient wouldlead to radially uniform fate patterning as in C). D) Center fates are expanded in biggercolonies, and reduced in smaller colonies as the signalling gradient is either shorter or longerthan the colony radius. as higher concentrations are .
26

Figure 1.6: Time and concentration dependent differentiation. 1000 um micropat-terns of hPSCs differentiated in varying concentrations of BMP4 (vertical axis) and forvarious time (horizontal axis) demonstrate how both increasing time and increasing activa-tor concentation induce more enhanced cell differentiation in a spatially organized manner.Colors represent germ layer markers BMP4 (green), SOX2 (blue) and CDX2 (red). Scalebar is 200 µm. Reproduced unmodified from original work (Tewary et al. 2017) licensedunder CC-BY 3.0.
27

creted from the colony which would be highest in the colony center as they diffusefrom the edge into the media. Inhibitors for BMP and NODAL (including CHORDIN,NOGGIN, FST, CER1, LEFTY1 and GDF3) has been shown to be expressed by hP-SCs (Besser 2004, Vallier et al. 2004, Yang et al. 2015), and were found to beupregulated by hPSCs micropatterned colonies in response to BMP4 (Etoc et al.2016, Tewary et al. 2017). Both hPSCs and mPSCs have been shown to secrete alarger amount of such inhibitors at higher cell densities (Blin et al. 2018, Kempf etal. 2016). Consistent with these observations, treating hPSCs with siRNA againsteither CHORDIN and NOGGIN or against LEFTY1 and CER1 caused expansion ofthe mesoderm region centrally (Etoc et al. 2016, Warmflash et al. 2014). Lendingfurther support to the role of secreted inhibitors, it was shown that blocking diffusionof inhibitors from the colony edge by growing colonies in microwells did not give riseto either of the BRA+ or CDX2+ regions (Warmflash et al. 2014). If signallingsources are simulated by flowing ligand from one side of the colony via microfluidics,the concentration gradient will pattern posterior to anterior fates starting at the lo-cation of the inflow, similar to how cells react to signalling sources in vivo (Manfrinet al. 2019).
In addition to possible interplay between ligands and inhibiting molecules secretedby the colony, the cellular localization of BMP and ACTIVIN A receptors have beenshown to affect the responsiveness of cells grown on micropatterns. hPSCs on mi-cropatterns grow as a polarized epithelium where receptors are localized basolaterallyand blocked from binding ligands on the apical, medium-facing side by tight junctions(Etoc et al. 2016). When cells are grown at less than confluence or tight junctions aredisrupted, cells in the center of patterns can also sense ligands and fate acquisitionsare more homogeneous throughout the colony. Intriguingly, similar receptor localiza-tion has been found in vivo during gastrulation, where it is suggested to function asa buffer mechanism preventing sudden fluctuations in signalling (Zhang et al. 2019).In the gastrulating mouse embryo the receptors of epiblast cells face the visceral en-doderm and ligands are let through from the amniotic cavity at the interface of theExE and the epiblast where tight junctions are missing.
Investigation of micropatterned mouse EpiLCs support the idea that cell feedbackmodulates the activating ligand concentration. It was shown that when micropat-terned mouse EpiLCs are differentiated with a synthetic small molecule (CHIR) in-
28
stead of a developmentally relevant ligand (WNT) inner fates are lost and outer fatesextend throughout the colony (Morgani et al. 2018). This may be attributable to thesmall molecule’s ability to freely diffuse across the colony, unaffected by WNT-relatedinhibitors and receptors.
The organization of these differentiation events do not appear to reach a steady stateduring the first 72 h, and elicit interesting temporal dynamics during this period.Upon addition of WNT3A and BMP4, colonies differentiated to a ring of PS-likefates on the outside, and a disk of posterior epiblast fates on the inside after 24 hours(Morgani et al. 2018). This outer ring of PS-like cells was increasingly internalizedat 48 h and 72 h forming a segment between the centralized epiblast-like cells andthe edge of the colony where cells differentiated towards extraembryonic mesoderm.This is similar to the reports on hPSCs where BRA emerges at the edge of thecolony edge around 24 h (or later at lower BMP concentrations) and is internalizedas differentiation proceeds (Tewary et al. 2017). The internalization of the PS-likeregion in hPSCs was shown to follow a wave of internalizing signalling of endogenousWNT and NODAL, which was observed to propagate intercellularly as it could notbe explained by directed cell migration or differential cell division (Chhabra et al.2019). Continuous activation of the BMP-signalling pathway is necessary for thisinternalization (Chhabra et al. 2019), and although BMP is initially activated ho-mogeneously throughout the colony (Heemskerk et al. 2019, Tewary et al. 2017), itbecomes restricted to the colony edge around 6 - 12 h after differentiation precedingthe initial expression of BRA in this region (Etoc et al. 2016, Morgani et al. 2018,Tewary et al. 2017).
1.5 Rapid query and robust quantification of or-ganized cell fate acquisitions
Micropatterning platforms were introduced using low throughput stamping technol-ogy. Our lab pioneered the transition of micropatterning into high throughput plat-forms (Nazareth et al. 2013, Tewary et al. 2019) and used it for applications suchas small molecule screening (Nazareth et al. 2016) and hemogenic niche engineering(Rahman et al. 2017). We have also employed this technique to study the spatial or-ganization of cell fate (Ostblom et al. 2019, Tewary et al. 2017, 2019), which allowed
29

us to query these events at unprecedented throughput. In general, high-throughputplatforms bring several benefits over lower-throughput assays, including faster queryof experimental conditions and increasing number of replicates, which enable morethorough searches of system parameter spaces and higher reproducibility of results.The increasing affordability of high throughput screening instruments, emergenceof core screening facilities, and technological advancements, has enabled a broaderuptake of HTP instruments in academic settings (Xia and Wong 2012), and is trans-forming biological fields into large-scale data-driven enterprises (Mattiazzi Usaj et al.2016).
Importantly, increasing the number of replicates also allows us to reduce our relianceon traditional statistical testing, since statistical significance is readily achieved withlarge sample sizes even at small effect sizes (Haney et al. 2014). While statisticaltesting certainly has its merits (especially in studies with few replicates), it is oftenmisunderstood and misapplied in biomedical research (Belia et al. 2005, Strasak et al.2007, Thiese et al. 2015, Weissgerber et al. 2016). For example, statistical testingin the form of t-tests and p-values can only reveal how likely we are to observe aparticular outcome by chance but is in reality often used as support for far strongerstatements. Moving away from this over-reliance on p-values would mitigate seriousstatistical issues in the biomedical community, such as p-hacking where tests arechosen and manipulated in order to obtain “significance” rather than based on theirsuitability to the tested data (Head et al. 2015), and graphical misrepresentationswhere visualization decisions are taken on the basis of what makes differences betweengroups appear as large as possible rather than on how to most clearly describe thedata Weissgerber et al. (2015)]. Liberating scientists from this narrow, misdirectedfocus, would promote gaining a deeper understanding of the data and considering themagnitude of any differences and their potential biological impact.
Central in both the fight against statistical misuse and the struggles to keep up withquantification of large amounts of data, are readily available software tools that es-tablish sound default analysis workflows and facilitate their broad use in the scientificcommunity. This is especially important for imaging based high throughput assays,which are also referred to as high content screening (HCS), due to the heaps of datathat is generated from automated microscopy platforms imaging continuously forhours. HCS of organized cell fate acquisitions additionally requires rapid and pre-
30
cise quantification of the patterns that arise when cells organize their fates spatially.Pattern recognition is an area where the human visual cortex excels as it has beensharpened over evolutionary timescales for this purpose, and it is instantly available.There is also great variation in the techniques for converting microscopy image datato statistical graphs, which renders it difficult to reconstruct image data cognitivelywhen viewing summary plots in a publication and significant effort is spent on under-standing how data points are generated from images in unfamiliar plots. For thesereasons, many microscopy scientists subscribe to the “seeing is believing” paradigmand traditionally microscopy images have been assayed qualitatively and shown as“representative images” in publications.
While biological pattern recognition implementations can still outperform their com-putational counterparts when detecting patterns in individual images, aggregation ofsuch patterns and identification of general trends in multiple images (1000s per HCSexperiment) is far from trivial. Additionally, multiple uncontrolled factors introducevariation in human performance when qualifying images, reducing the reproducibil-ity of consistent repeated pattern classification. Finally, prohibitively large amountsof scientists’ time would be spent on image analyses without the aid of automatedanalysis pipelines.
Fortunately, there exists many capable software solutions (both open source andcommercial), for analyzing features of imaged cells. (Eliceiri et al. 2012, Jones et al.2008, McQuin et al. 2018, Misselwitz et al. 2010), and open communities providehelp on how to use these (Rueden et al. 2019). While commercial software solution forinstrument control can provide benefits in terms of the integration with proprietaryhardware components, there are no such concerns when it comes to data analysis.In this area, the choice of open, freely available tools is preferred as it increasestransparency, facilitates analysis protocol sharing, and standardizes analysis withinfields leading to easier comparisons between studies (Caicedo et al. 2017).
While programming languages such as R and Python provide ideal environmentsfor data analysis, they are sometimes intimidating for beginners and can requiresignificant experience to set up more complex image analysis pipelines. Combiningthese powerful environments with graphical widgets offer both intuitive familiar userinterfaces and access to the full power of the underlying languages when needed.Leveraging existing platforms like Jupyter Notebooks allows these pipelines to run
31
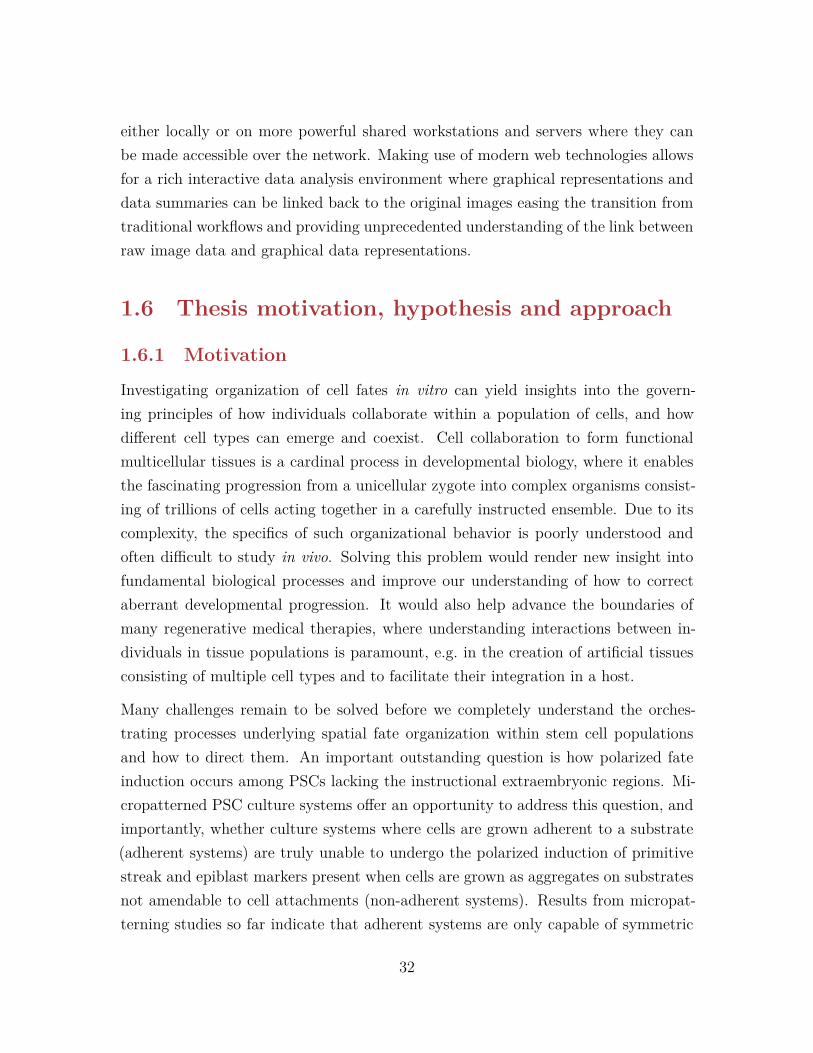
either locally or on more powerful shared workstations and servers where they canbe made accessible over the network. Making use of modern web technologies allowsfor a rich interactive data analysis environment where graphical representations anddata summaries can be linked back to the original images easing the transition fromtraditional workflows and providing unprecedented understanding of the link betweenraw image data and graphical data representations.
1.6 Thesis motivation, hypothesis and approach
1.6.1 Motivation
Investigating organization of cell fates in vitro can yield insights into the govern-ing principles of how individuals collaborate within a population of cells, and howdifferent cell types can emerge and coexist. Cell collaboration to form functionalmulticellular tissues is a cardinal process in developmental biology, where it enablesthe fascinating progression from a unicellular zygote into complex organisms consist-ing of trillions of cells acting together in a carefully instructed ensemble. Due to itscomplexity, the specifics of such organizational behavior is poorly understood andoften difficult to study in vivo. Solving this problem would render new insight intofundamental biological processes and improve our understanding of how to correctaberrant developmental progression. It would also help advance the boundaries ofmany regenerative medical therapies, where understanding interactions between in-dividuals in tissue populations is paramount, e.g. in the creation of artificial tissuesconsisting of multiple cell types and to facilitate their integration in a host.
Many challenges remain to be solved before we completely understand the orches-trating processes underlying spatial fate organization within stem cell populationsand how to direct them. An important outstanding question is how polarized fateinduction occurs among PSCs lacking the instructional extraembryonic regions. Mi-cropatterned PSC culture systems offer an opportunity to address this question, andimportantly, whether culture systems where cells are grown adherent to a substrate(adherent systems) are truly unable to undergo the polarized induction of primitivestreak and epiblast markers present when cells are grown as aggregates on substratesnot amendable to cell attachments (non-adherent systems). Results from micropat-terning studies so far indicate that adherent systems are only capable of symmetric
32
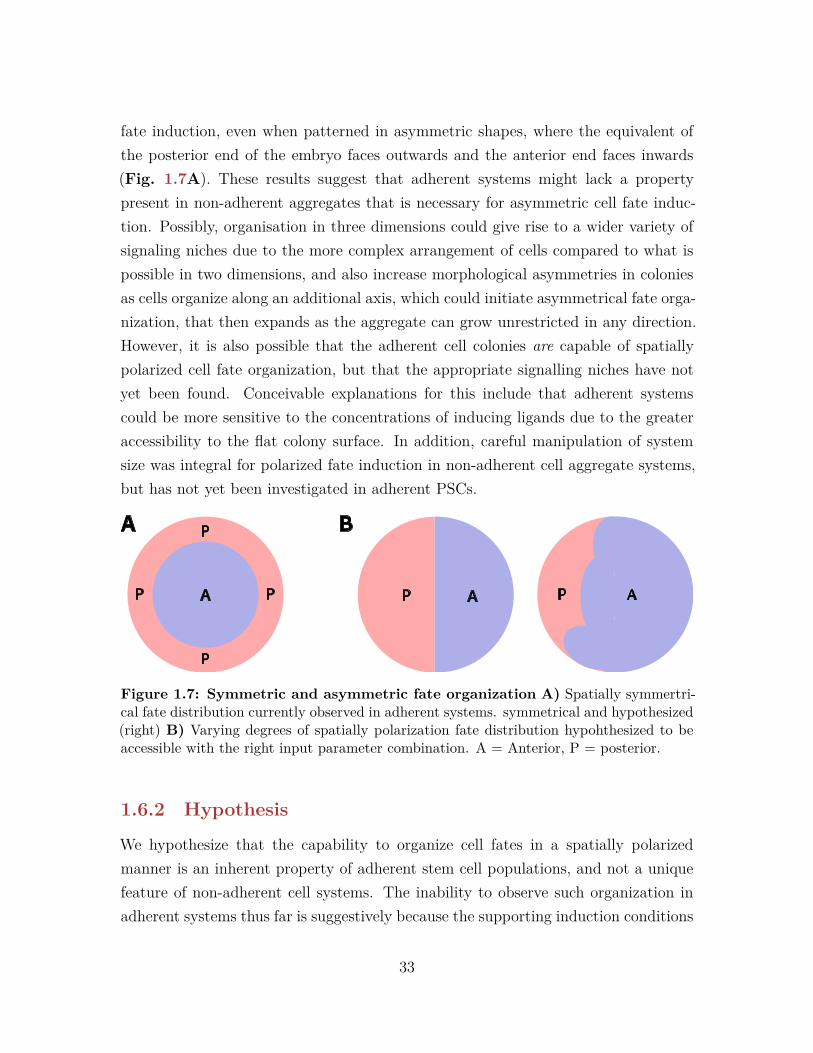
fate induction, even when patterned in asymmetric shapes, where the equivalent ofthe posterior end of the embryo faces outwards and the anterior end faces inwards(Fig. 1.7A). These results suggest that adherent systems might lack a propertypresent in non-adherent aggregates that is necessary for asymmetric cell fate induc-tion. Possibly, organisation in three dimensions could give rise to a wider variety ofsignaling niches due to the more complex arrangement of cells compared to what ispossible in two dimensions, and also increase morphological asymmetries in coloniesas cells organize along an additional axis, which could initiate asymmetrical fate orga-nization, that then expands as the aggregate can grow unrestricted in any direction.However, it is also possible that the adherent cell colonies are capable of spatiallypolarized cell fate organization, but that the appropriate signalling niches have notyet been found. Conceivable explanations for this include that adherent systemscould be more sensitive to the concentrations of inducing ligands due to the greateraccessibility to the flat colony surface. In addition, careful manipulation of systemsize was integral for polarized fate induction in non-adherent cell aggregate systems,but has not yet been investigated in adherent PSCs.
AP AP
A B
A
P
P
PP
Figure 1.7: Symmetric and asymmetric fate organization A) Spatially symmertri-cal fate distribution currently observed in adherent systems. symmetrical and hypothesized(right) B) Varying degrees of spatially polarization fate distribution hypohthesized to beaccessible with the right input parameter combination. A = Anterior, P = posterior.
1.6.2 Hypothesis
We hypothesize that the capability to organize cell fates in a spatially polarizedmanner is an inherent property of adherent stem cell populations, and not a uniquefeature of non-adherent cell systems. The inability to observe such organization inadherent systems thus far is suggestively because the supporting induction conditions
33
have not been identified. Specifically, we believe that this feature could be unlockedwith careful manipulation of system size (both in terms of colony diameter and cellnumber). Identifying suitable system size input conditions would enable polarizedorganization of the anterior and posterior poles within the micropattern, reminiscentof the organization of these regions in vivo (Fig. 1.7B). Central to this hypothesis isthat the development of HTP assays and analytical frameworks is necessary to be ableto effectively query the combinatorial parameter spaces for the conditions that couldgive rise to polarized fate induction in adherent systems, and that the time-consumingwork involved in assaying and analysing input parameters in low-throughput systems,has so far prevented systematic exploration of these parameters.
1.6.3 Approach
In addition to answering a fundamental biological question, developing an adherentplatform to study polarized organization of cell fates would have several practicaladvantages over current non-adherent assays, including
• Higher experimental throughput using multiple micropatterns per well in 96-well plates.
• Faster collection of experimental data while preserving spatial informationthrough already established automated high throughput microscopy platforms.
• More rapid and robust quantification due to the relative ease of analyzing thin-ner sections of cells.
• Lesser variation between colony sizes due to tight control of micropattern di-ameters.
• Simpler interrogation and modelling of signalling molecule diffusion due to theless complex colony morphology.
We therefore sought to establish an adherent HTP platform that can recapitulate de-velopmentally relevant symmetry breaking events with the goal of providing insightinto the underlying processes by which cell fates are organized at the population level.Towards this aim, we used a previously developed UV-lithography micropatterningassay that gives precise and flexible control over colony geometry. To extend thisplatform, we developed analytic techniques for rapid and robust analysis of imagesacquired from automated high-throughput microscopy. We designed these softwaretools specifically for the analysis of spatial organization in gene expression and de-
34

veloped graphical interfaces to facilitate broad uptake in an effort to promote soundstatistical analysis methods in this rapidly developing field.
35

Chapter 2
Context-explorer: Analysis ofspatially organized proteinexpression in high-throughputscreens
This chapter was originally published in a peer reviewed journal (Ostblom et al. 2019) andhas been modified to fit the format of this thesis.
Author contributionsCo-authors include Emanuel J.P. Nazareth, Mukul Tewary, and Peter W. Zandstra. J.O.developed the software, analyzed the data, and performed the UV-lithography experimentsfor mPSCs. E.J.P.N. designed and performed the microcontact printing experiments. M.T.designed and performed the UV-lithography experiments for hPSCs. J.O., E.J.P.N. andP.W.Z. designed the project and wrote the manuscript.
AcknowledgementsJ.O is grateful to Gålöstiftelsen and NSERC M3 for supporting his work. We thank CélineBauwens for critical reading and editing of the manuscript. This work was supported bya Canadian Institutes for Health Research grant to P.W.Z, and by Medicine by Design, aCanada First Research Excellence Program at the University of Toronto.
36

2.1 AbstractA growing body of evidence highlights the importance of the cellular microenviron-ment as a regulator of phenotypic and functional cellular responses to perturbations.We have previously developed cell patterning techniques to control population con-text parameters, and here we demonstrate context-explorer (CE), a software tool toimprove investigation cell fate acquisitions through community level analyses. Wedemonstrate the capabilities of CE in the analysis of human and mouse pluripotentstem cells (hPSCs, mPSCs) patterned in colonies of defined geometries in multi-wellplates.
CE employs a density-based clustering algorithm to identify cell colonies. Using thisautomatic colony classification methodology, we reach accuracies comparable to man-ual colony counts in a fraction of the time, both in micropatterned and unpatternedwells. Classifying cells according to their relative position within a colony enables sta-tistical analysis of spatial organization in protein expression within colonies. Whenapplied to colonies of hPSCs, our analysis reveals a radial gradient in the expressionof the transcription factors SOX2 and OCT4. We extend these analyses to coloniesof different sizes and shapes and demonstrate how the metrics derived by CE can beused to assess the patterning fidelity of micropatterned plates.
We have incorporated a number of features to enhance the usability and utility ofCE. To appeal to a broad scientific community, all of the software’s functionalityis accessible from a graphical user interface, and convenience functions for severalcommon data operations are included. CE is compatible with existing image analysisprograms such as CellProfiler and extends the analytical capabilities already providedby these tools. Taken together, CE facilitates investigation of spatially heterogeneouscell populations for fundamental research and drug development validation programs.
2.2 IntroductionEmerging pieces of evidence stress the importance of a cell’s local microenvironmentas a regulator of cellular phenotype and gene expression heterogeneity within cellpopulations. Microenvironmental parameters such as mechanical forces, cell to cellcontact and endogenous signaling, all vary between cells at different positions in a well
37

(McBeath et al. 2004, Peerani et al. 2007). The spatial heterogeneity of these factorsleads to variability in efficiency of endocytosis and the vulnerability to viral infection(Snijder et al. 2009), influences epithelial tissue growth (Kim et al. 2009), impacts theexpression of angiogenic factors in tumor cells (Kumar et al. 1998) and influences thedifferentiation potential of mouse and human pluripotent stem cells (mPSCs, hPSCs)(Davey and Zandstra 2006, Peerani et al. 2007). Microenvironmental heterogeneityis also a potential confounding factor behind contradictory findings in the responseof different cell types to key signaling pathway activity (Akopian et al. 2010, Jong etal. 2009, Snijder et al. 2012) and could limit the interpretation and reproducibilityof experiments.
A comparative analysis (Haibe-Kains et al. 2013) of two large scale pharmacogenomicstudies, the Cancer Genome Project (Garnett et al. 2012) and Cancer Cell line En-cyclopedia (Barretina et al. 2012), revealed a surprisingly poor correlation betweencell line drug response phenotypes between laboratories, which prevented meaning-ful extraction of drug-gene relationships. Correlation remained low even when usingmatched protocols and cell lines with highly correlated gene expression profiles. Al-though the exact source of variation in this study is unknown, a separate analysisof single cell data from 45 high-throughput (HTP) screens revealed that populationcontext is indeed a ubiquitous source of variation between screens, and accountingfor population context can improve experimental reproducibility between cell linesand laboratories (Snijder et al. 2012). Although it is acknowledged that understand-ing population heterogeneity is critical in biomedical research (Altschuler and Wu2010, Pelkmans 2012), the scientific community has been slow to adopt approachesto reduce heterogeneity, such as controlling microenvironmental variables.
The increasing affordability of high content screening instruments, emergence of corescreening facilities and technological advancements such as micropatterning in multi-well plates (Azioune et al. 2009), enable investigation of population context depen-dent variables with unprecedented throughput and veracity (Xia and Wong 2012).By patterning extracellular matrix (ECM) proteins on a tissue culture surface, cellscan be restricted to adhere to an array of spots of predefined shapes and sizes (Finket al. 2007, Folch et al. 2000). An advantage of such patterning is enhanced controlover microenvironmental variation within each well and improved assay robustness(Nazareth et al. 2013, 2016). Growing cells in colonies of defined size and shape
38

facilitates analyses of inter- and intra-colony variation in protein expression. Forexample, we observe that hPSCs growing in such patterned colonies express vary-ing levels of pluripotency markers, including SOX2 and OCT4, depending on colonysize (Nazareth et al. 2013, Peerani et al. 2007). Elucidating the impact of thepopulation context dependent variables on cellular phenotype will not only add toour understanding of fundamental cell biology, but will also allow us to optimizeculture conditions and cell assays, provide possible explanations for current seem-ingly conflicting research and inform in silico models. These aspects are critical tonext-generation drug development strategies and systems biology approaches.
We have previously developed an HTP platform for micropatterning of cells on ECMspots of defined shapes in multi-well plates (Nazareth et al. 2013, Tewary et al. 2017).To augment this platform, we here present a computational tool, context-explorer(CE), which facilitates colony level analyses and cell patterning quality control. TheCE software is meant to extend the functionality of currently available software so-lutions, both open source and commercial, for analyzing features of imaged cells(Carpenter et al. 2006, Jones et al. 2008, Misselwitz et al. 2010). While someimplementations already exist that can be used to identify arrays of cells on glassslides (Bauer et al. 2012) or to study differential gene expression of cells in differentspatial locations within the same colony (Gorman et al. 2014), our software aims toimprove the HTP workflow for analysing cells in micropatterned multi-well plates byfacilitating evaluation of patterning fidelity, enabling identification of colonies withina well, and improving spatial analyses of heterogeneous protein expression withincolonies. As HTP technologies become more widespread, it is increasingly impor-tant to provide user friendly data analysis software targeted towards these platforms(Fig. 2.1A). Here, we demonstrate the utility of CE by investigating the impact ofintra-colony location on hPSC pluripotency marker expression.
2.2.1 Design and Implementation
Designed to complement existing imaging software, CE fits into the analysis pipelinefollowing the extraction of cellular features from microscope images (Fig. 2.1B). Theinput to CE is a CSV-file, which contains single cell xy-coordinates and at least oneother measurement of interest, such as protein fluorescent intensity values. Thesesingle cell coordinates can be clustered into colonies within which spatial trends for
39

Figure 2.1: Background schematic and CE workflow overview. A) Studying cellsin isolation disregards the effects of community interactions, which are known to directcell fate decisions (left). Powerful micropatterning in vitro assays increase control over thecellular microenvironment and facilitate the study of context dependent cell fate acquisitions(middle). Our analysis software enhances these assays by allowing researchers to analyze cellbehavior within its population context instead of as independent isolated events (right). B)CE fits into existing image analysis pipelines after initial measurements have been extractedfrom the images. C) Overview of the CE workflow, each step is described in detail in themethods section.
40

the measurements of interest can be visualized (Fig. 2.1C). By leveraging existingimage extraction software and processing the resulting text files, CE has low systemrequirements and runs smoothly on modern laptop computers. CE is implemented inPython, and utilizes the scientific open source ecosystem SciPy (Jones et al. 2001).Specifically, NumPy (van der Walt et al. 2011) and Pandas (McKinney 2010) areused for array manipulations, while Matplotlib (Hunter 2007) and Seaborn (Waskomet al. 2016) generate the graphical visualizations. To make CE easily accessible toa broad scientific community of various technical backgrounds, all functionality isavailable via a graphical user interface designed in Qt.
To interrogate organized cell behavior within colonies, the concept of cellular coloniesmust first be introduced by classifying closely positioned cells as belonging to thesame colony. Manually labeling individual cells is infeasible in HTP assays that of-ten include millions of cells. There are many existing algorithms for automaticallyidentifying dense clusters of data points (Rui Xu and Wunsch 2010) and CE em-ploys the Density-Based Spatial Clustering of Applications with Noise (DBSCAN)algorithm (Ester et al. 1996), as implemented in the scikit-learn Python package(Pedregosa et al. 2011), to identify sets of points at high two dimensional density.Clustering cells into colonies based on local cell density is similar to how these com-munities are defined biologically since cellular communication is restricted by thedistance between cells. The DBSCAN algorithm is capable of identifying colonies ofany geometrical shape and performs well on any cell constellation where the distancebetween neighboring cells within a colony is shorter than the distance between neigh-boring colonies. DBSCAN scan also has the advantage that it has a notion of outliers,cells far away from any colony, and can classify such cells as noise rather than tryingto force all cells to belong to a colony as many other cluster algorithms would do.DBSCAN performs unsupervised clustering and does not require prior knowledge ofthe number of colonies within each well, only specification of the neighborhood searchradius (Eps) and the minimum number of points (MinPts) within the neighborhoodto start propagating a cluster. For each point found within the Eps neighbourhoodof the starting point, a search for additional points will be performed. If the numberof points found within a point’s Eps neighborhood is greater or equal to MinPts, thatpoint is considered a core point of the cluster. Points that fail to meet this criteria,but that are density reachable from a core point, are considered border points and
41

are classified as part of the colony. Points that fail to meet either of these two criteriaare labelled as noise and not part of any colony.
While there are implementations of DBSCAN that automate parameter optimization,these increase time complexity (Ankerst et al. 1999, Karami and Johansson 2014). Asan alternative to automatic parameter estimation, CE allows for the Eps and MinPtsparameters to be adjusted via the graphical user interface while viewing the resultingcolony identification accuracy. The immediate visual feedback enables intuitive andaccurate colony classification and decreases the time it takes to optimize Eps andMinPts. DBSCAN clustering is deterministic for the core cells of each cluster andonly border points which are density reachable from more than one cluster core canbe assigned to different clusters between runs. Colonies in ECM patterned wellsrarely grow close enough for border cells to be density reachable from more than onecolony, so for this application cells are routinely clustered deterministically. To furtherincrease colony identification accuracy, CE includes filters for colony size, density androundness, which refine the colony identification procedure and are particularly usefulto deal with imaging artefacts and overgrown colonies. These filters are controlled viasliders in the GUI and the resulting colony identification is immediately visualizedfor the selected well.
Each cluster of points returned by DBSCAN corresponds to cells growing togetherin a colony. To define colony attributes, CE utilizes the geometric analyses packageShapely (Gillies and others 2007). Generally, the polygonal boundary area of a colonycan be defined as either the convex or concave hull of its cells. CE uses the convex hullalgorithm as it is less expensive to compute than the concave hull and performs wellwith commonly used micropatterned spot shapes. By finding the colony boundingarea, additional geometric attributes such as colony diameter, circumference, areaand cell density can be calculated for each colony. Additionally, each cell can beassigned Cartesian coordinates relative to the colony’s centroid or the closest edgeof the colony’s boundary area. These relative cell coordinates can be used to groupcells at similar positions from multiple colonies into concentric bins. The process forgrouping cells is initiated by deriving an aggregated value of all the cells in a colonythat are within the same location bin. These colony values are then aggregated formultiple colonies and the error estimation reported describes the variation betweencolonies rather than between cells within one colony. The visualizations built into
42

CE further facilitates the analyses of spatial trends within colonies. Cells can alsobe grouped according to a hexagonal grid, which aggregates cells from all colonies inthe same bin within the grid.
2.3 Results
2.3.1 Colony classification
To demonstrate the colony classification process, we patterned mouse PSCs on cir-cular ECM spots 500 µm in diameter in a 96-well plate using an in-house HTPUV-lithography method (Tewary et al. 2017). To enable extraction of cellular co-ordinates within the well, cell nuclei were labelled with DAPI and analysed by aprimary image analysis program, such as CellProfiler. After imaging and extractionof single cell features, the resulting CSV-file was processed by CE to classify cells intocolonies. Cells robustly adhered to the patterned regions, and were grown for 48 hin pluripotent conditions (LIF and Serum, see Supplementary Methods for detailedculture conditions). These micropatterned, well-separated clusters of cells were eas-ily identified by CE as separate colonies. However, cells occasionally bridge adjacentconfluent colonies, effectively merging two or more colonies together. Such colonieswould still be classified as valid clusters by DBSCAN, since all the cells are densityreachable from each other. Another important caveat is that the imaging hardwaremay not allow the entire well to be captured, resulting in partial images of many ofthe colonies. Including either of these merged or partial colonies in the downstreamanalyses could confound the interpretation of the underlying biology.
When limited to only the default DBSCAN parameters MinPts and Eps, partialand merged colonies are difficult to discriminate from colonies of desired shape andsize. We found that an efficient way to eliminate these undesired colonies, was toapply a set of filtering criteria to the colonies detected by DBSCAN. Filtering oncolony roundness and size were the most effective criteria to exclude merged andpartial colonies from the DBSCAN output (Fig. 2.2A). The effect of applying sizeand roundness filters was striking when comparing the number of cells per colonybefore and after filtering. Prior to filtering, several clusters of colony sizes weredetected, including bigger merged colonies and smaller partial colonies cut off by theimaging limitations (Fig. 2.2B). These colonies were omitted from the final analyses
43

as they would skew the calculations of both the mean number of cells per colony andspatial trends within the colonies. After excluding colonies of undesirable size andshape, we observed only one cluster of colony sizes and the mean number of cells percolonies was notably consistent between wells, indicating reproducible patterning ofcells (Fig. 2.2C). The result of the filtering in CE was almost identical to manuallyidentifying merged and partial colonies (406 of 412 colonies were correctly classified,Fig. 2.3A-B).
Another useful metric for assessing patterning fidelity is the number of colonies perwell, which is also computed by CE. Comparing the number of filtered and unfil-tered colonies identifies wells containing many fused and partial colonies that weredetected by DBSCAN, but then excluded by the filters. The filtered count was nearlyidentical to the counts obtained from visually inspecting the images from each well(Fig. 2.2D), and were computed in a fraction of the time of manual counting. CEcan also accurately identify clusters of cells growing in micro-patterned ECM spots ofdifferent sizes within the same well, cells patterned in non-circular colony shapes, andcolonies in unpatterned wells (Fig. 2.2E). The flexibility of the parameter and filteradjustments makes it possible to identify colonies within unpatterned wells with highaccuracy (the mean difference from a manual colony count was 2.6% (sd 1.3%) forten wells with around 100 colonies in each, Fig Fig. 2.3C-D). These results demon-strate the capacity for CE to semi-automatically identify colonies of a wide array ofgeometries both in patterned and unpatterned wells with an accuracy similar to thatof visual image inspection.
2.3.2 Investigating the behavior of hPSCs in micropatternedcolonies
To apply CE to hPSCs analysis, we first patterned hPSCs in 200 µm diametercolonies in 96-well plates using microcontact-printing. While most cells adhere tothe ECM spots in the patterned plates, there is also limited non-specific cell adhe-sion in-between patterned ECM spots. Compared to UV-lithography, microcontactprinting has a higher proportion of cells growing in tiny colonies and as single cellsoutside patterned ECM spots, which makes this technology suitable for comparingthe behavior of cells outside and inside micropatterned colonies. To test whethercells that adhere non-specifically display differences in protein expression compared
44
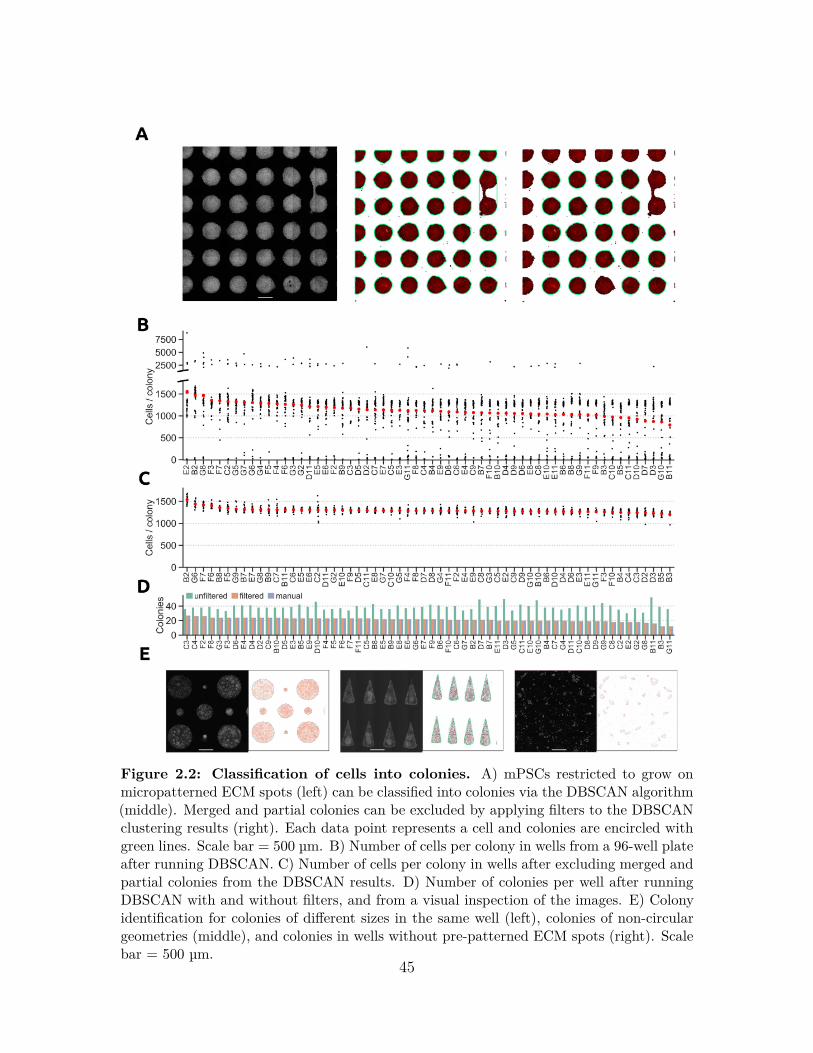
Figure 2.2: Classification of cells into colonies. A) mPSCs restricted to grow onmicropatterned ECM spots (left) can be classified into colonies via the DBSCAN algorithm(middle). Merged and partial colonies can be excluded by applying filters to the DBSCANclustering results (right). Each data point represents a cell and colonies are encircled withgreen lines. Scale bar = 500 µm. B) Number of cells per colony in wells from a 96-well plateafter running DBSCAN. C) Number of cells per colony in wells after excluding merged andpartial colonies from the DBSCAN results. D) Number of colonies per well after runningDBSCAN with and without filters, and from a visual inspection of the images. E) Colonyidentification for colonies of different sizes in the same well (left), colonies of non-circulargeometries (middle), and colonies in wells without pre-patterned ECM spots (right). Scalebar = 500 µm.
45

Figure 2.3: Quantification of colony count precision and OCT4 expression data.A) 412 colonies from ten wells plotted according to their roundness and the number of cellsin each colony. Misclassified colonies are highlighted with differently shaped and coloredscatter markers. B) Quantification of the number of correctly and incorrectly classifiedcolonies in panel A. C) CE colony identification in an unpatterned well with clusteringparameters optimized for small colonies (left), large colonies (middle) or a mix of small andmedium sized colonies (right). D) Well-wise comparison of the number of colonies identifiedby manual count or automatically by CE. The mean difference in the count was 2.6% (sd1.3%). E) Differences in OCT4 expression level among cells inside or outside colonies. F)Hexbin and line plot averages for OCT4 expression levels in SF+BMP4 and CM.
46

to cells within colonies, we assessed cellular response 42 h after treatment with serumfree medium containing BMP4 (SF+BMP4, induces trophectoderm and primitiveendoderm (Vallier et al. 2009, Xu et al. 2002)), or MEF conditioned medium (CM,maintains pluripotency (Xu et al. 2001)). Expression of the pluripotency-associatedtranscription factors SOX2 and OCT4 was analyzed to quantify cellular differences.As expected, in SF+BMP4 medium, pluripotency signals were repressed and no dif-ference was observed in SOX2 and OCT4 expression between cells inside and outsidecolonies (Fig. 2.4A & Fig. 2.3E). In contrast, CM induces the expression of SOX2and OCT4 in cells within colonies, while cells outside colonies express the marker toa lesser extent (Fig. 2.4A & Fig. 2.3E). This is visible both as a change of shapesand a shift in means of the protein expression distributions. These differences sug-gest that cells inside and outside colonies do not respond similarly to added factorsin the medium, further highlighting the importance of controlling for microenviron-mental parameters such as population context when assessing cellular responses toexperimental conditions.
2.3.3 Analysis of spatial trends in protein expression withinhPSC colonies
In addition to facilitating inter-colony analyses, CE allows for investigation of intra-colony variation in protein expression. Radial gradients of protein expression havepreviously been reported in non-patterned and patterned colonies of hPSCs (Daveyand Zandstra 2006, Peerani et al. 2007, Tewary et al. 2017, Warmflash et al. 2014).Analysing these trends through visual inspection and manual data analyses is feasiblein a low throughput platform, but becomes error-prone and time-consuming in HTPsystems with hundreds or thousands of colonies. To visualize spatially biased proteinexpression, CE can automatically aggregate colonies within replicate wells and displaya heatmap of spatial protein expression variation within these colonies (Fig. 2.4B).This analysis can be applied to colonies of various sizes and shapes.
When investigating colonies of hPSCs grown in either CM or SF+BMP4, we observeddistinct radial gradients of SOX2 and OCT4 expression between the two conditions(Fig. 2.4C & Fig. 2.3F). To distinguish differences attributed to local spatial factorsfrom those attributed to exogenous factors, all intensities were normalized relative tothe expression at the centroid of the colony. In hPSCs grown in CM, SOX2-expression
47
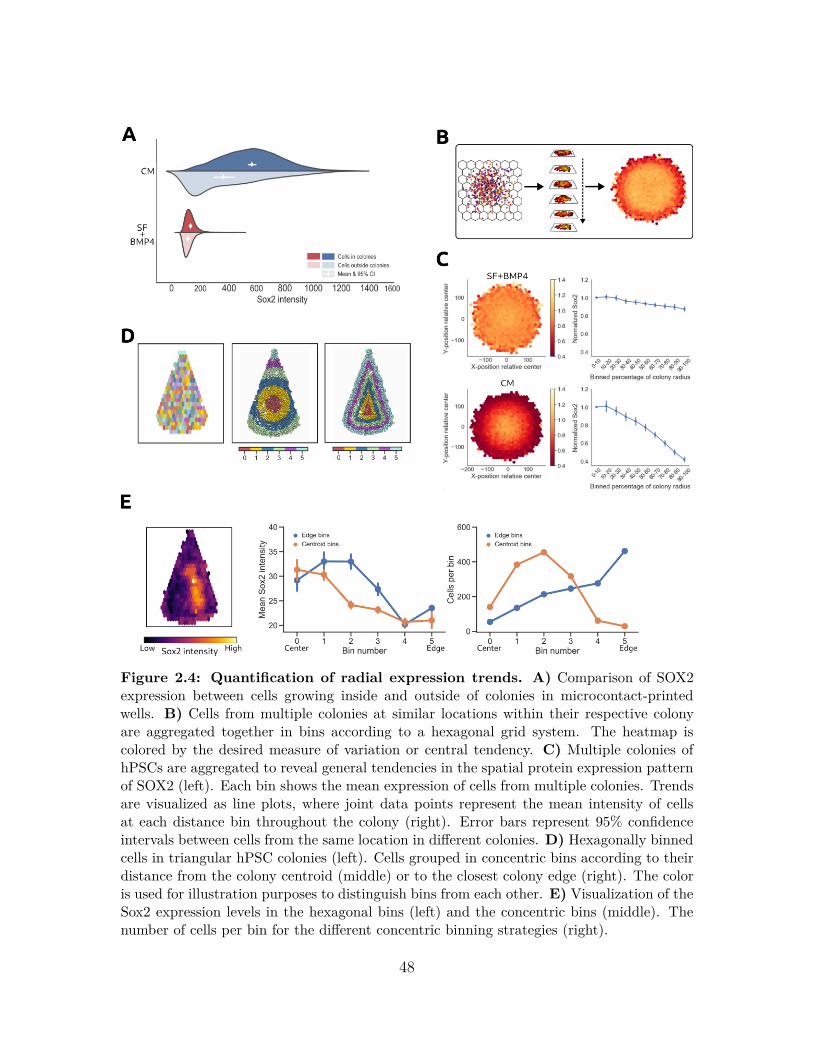
Figure 2.4: Quantification of radial expression trends. A) Comparison of SOX2expression between cells growing inside and outside of colonies in microcontact-printedwells. B) Cells from multiple colonies at similar locations within their respective colonyare aggregated together in bins according to a hexagonal grid system. The heatmap iscolored by the desired measure of variation or central tendency. C) Multiple colonies ofhPSCs are aggregated to reveal general tendencies in the spatial protein expression patternof SOX2 (left). Each bin shows the mean expression of cells from multiple colonies. Trendsare visualized as line plots, where joint data points represent the mean intensity of cellsat each distance bin throughout the colony (right). Error bars represent 95% confidenceintervals between cells from the same location in different colonies. D) Hexagonally binnedcells in triangular hPSC colonies (left). Cells grouped in concentric bins according to theirdistance from the colony centroid (middle) or to the closest colony edge (right). The coloris used for illustration purposes to distinguish bins from each other. E) Visualization of theSox2 expression levels in the hexagonal bins (left) and the concentric bins (middle). Thenumber of cells per bin for the different concentric binning strategies (right).
48

decreased in a linear fashion towards the edge of the colony, with cells at the colonyborder only displaying half the fluorescence intensity of cells near the colony centroid.Meanwhile, cells grown in SF+BMP4, exhibited low SOX2 expression throughout theentire colony, which can be attributed to BMP4 inducing differentiation and over-riding any local pluripotency supporting signals. OCT4 expression followed similarpatterns in both CM and SF+BMP4.
Quantitative evaluation of protein expression levels relative to the location of a cellwithin a colony was performed by aggregating cells in radial bins according to theirdistance from the colony centroid rather than their relative xy-coordinates. Themean or median expression values could then be compared between ring-shaped binsacross multiple colonies. This analysis technique highlights the spatial trends ofSOX2-expression for hPSCs grown in CM (Fig. 2.4C), where expression of SOX2was highest in cells at the center of the colony and linearly decreased toward the colonyedge. Statistical significance at p=0.01 can be roughly inferred from non-overlappingpairs of 95% confidence intervals (Cumming 2009). However, it should be notedthat statistical significance is easily achieved with sample sizes this large, even atsmall effect sizes (Haney et al. 2014), so it is important to assess the magnitude ofthe differences. In hPSCs cultured in SF+BMP4, a weak radial gradient of SOX2expression emerged exhibiting no more than a 10% difference in expression levelbetween cells at the centroid and the edge of the colony. In contrast, hPSCs culturedin CM exhibit more than double the level of SOX2 expression at the center of thecolony compared to the edge.
For cells grown on ECM patterns of non-circular geometries, we evaluated how group-ing cells into bins based either on the distance from the colony border or the colonycentroid affected our interpretation of spatial trends in protein expression. To illus-trate the different biological interpretations that could arise from these two metrics,we investigated the SOX2 expression of hPSC colonies grown on triangular ECMpatterns in SF+BMP4.
In addition to aggregating cells in hexagonal bins as previously described, colonieswere segmented into concentric annular or colony-shaped (in this case triangular)bins (Fig. 2.4D). The annular and triangular segmentations were created basedon the distance from the colony centroid or the closest colony border, respectively.When the intensity was visualized based on the hexagonal binning strategy a clear
49

spatial bias in SOX2 expression was revealed (Fig. 2.4E). To further quantify thisorganized expression, the average expression levels of cells grouped according to theannular and triangular bins was compared. Importantly, the choice of binning metriccould influence the interpretation of the resulting protein expression trends. In thisexample, SOX2 expression decreased more rapidly as a function of the distance fromthe colony centroid compared to from the colony edge (Fig. 2.4E). Depending onthe binning strategy, cells were grouped to different bins and the number of cells ineach bins differed greatly (Fig. 2.4E).
2.3.4 Conclusions
There is overwhelming evidence that increased control and monitoring of populationcontext parameters is needed to improve assay reproducibility and to understandheterogeneous responses between cells in the same population. However, address-ing this challenge has proven difficult in the broader biomedical community. Toaugment the power of HTP analysis of population context parameters in the cellularmicroenvironment, we previously developed cell patterning techniques to control pop-ulation context parameters, and here we demonstrate a software tool for improvedmonitoring of microenvironmental variables and interrogation of community drivencell fate acquisitions in HTP assays. In this study, CE was utilized to explore andquantify radial spatial trends in SOX2 and OCT4 expression within micropatternedhPSC colonies of various shapes and sizes. We observed that the protein expressionlevels vary as a function of cells’ location within a colony, further highlighting theimportance of understanding variation in population context dependent factors.
2.3.5 Availability and Future Directions
CE is compatible with existing HTP imaging software and standard fluorescent mi-croscopy based assays. By developing a GUI-driven workflow and releasing it underan open source license, we provide a solution to facilitate colony-level analysis fora wide scientific community. Members of our group regularly use CE for colonylevel analyses as evidenced in previously published and ongoing studies (Nazarethet al. 2013, 2016, Rahman et al. 2017, Tewary et al. 2017). To further broadenthe utility and applications of the software, there are built-in visualizations to assistwith fluorescent intensity thresholding and pattern fidelity assessment, and there are
50

interface components for assigning wells to treatment groups. To lower the thresh-old for wide adoption, CE is distributed as a Python package through the condaand pip package managers, and runs under Linux, OS X and Windows. The setupprocess does not require any use of the command line and can be done entirelyfrom the Anaconda Navigator GUI. The source code is distributed under the opensource BSD 3-clause license, which enables incorporation of its features into exist-ing image analysis pipelines. Source code and installation instructions are availableonline at https://gitlab.com/stemcellbioengineering/context-explorer, and the docu-mentation can be found at https://contextexplorer.readthedocs.io.
2.4 Supplementary Methods
2.4.1 Microcontact printing
We previously developed a method for patterning proteins in standard 96-well platesusing microcontact printing (Nazareth et al. 2013). The PDMS stamps were fab-ricated using standard soft lithography techniques, with the exception that liquidPDMS was cast into a Teflon mould before curing, allowing control of the shape ofthe PDMS stamp. Microcontact printing was carried out according to our previouslypublished protocol (Peerani et al. 2007). Briefly, the ECM solution (Matrigel diluted1:30 in phosphate buffered saline) was deposited onto the patterned surface of ethanolsterilized PDMS stamps for 4 h at room temperature. Stamps were rinsed withddH2O, dried gently with N2 gas, placed into tissue-culture treated 96-well plates,and incubated in the 96-well plates for 7-10 min in a humidity chamber (Relativehumidity 55-70%). The stamps were then removed and substrates were passivatedwith 5% weight Pluronic F-127 (Sigma-Aldrich) in ddH20 for 1 h.
2.4.2 UV lithography
We recently developed an alternative method to microcontact printing using UV-lithography to pattern proteins in standard 96-well (Tewary et al. 2017). Briefly,glass cover-slips were activated in a plasma cleaner and rinsed in ddH2O. Patternsof predefined size and shape were created on the cover-slip by photo-oxidizing se-lect regions of the substrate using Deep UV exposure. The patterned slides wereassembled to bottomless 96-well plates to produce plates with patterned cell culture
51

surfaces. Prior to seeding cells onto the plates, the wells were activated with N-(3-Dimethylaminopropyl)-N-ethylcarbodiimide hydrochloride (Sigma #03450), andN-Hydroxysuccinimide (Sigma #130672) for 20 minutes. Before seeding cells, theplates were incubated with Geltrex (for hPSC) or 12.5 µg / ml fibronectin in gelatin(for mPSCs) and washed with ddH2O.
2.4.3 hPSCs culture and seeding onto patterned substrates
We obtained the H9 hESC line (WA09) from the WiCell Research Institute. H9 cellswere routinely cultured on feeder layers of irradiated murine embryonic fibroblast(MEF) feeders in knockout (KO)-Dulbecco’s modified Eagle’s medium (DMEM) (In-vitrogen) with 20% KO-serum replacement (Invitrogen) (KO-DMEM) supplementedwith 4 ng mL–1 FGF-2 (PeproTech). Cells were passaged at 1:4 to 1:6 split ratios ev-ery 4-5 days by dissociating colonies with 0.1% collagenase IV (Invitrogen) into smallclumps. All cell line stocks were confirmed negative for mycoplasma contamination.
The hPSCs were dissociated using TrypLE™ for three min. TrypLE™was inactivatedby adding media containing 20% KO-SR. Cells were centrifuged and resuspendedin Nutristem® hESC XF (Biological Industries #05-100-1A) and 10 µM ROCK in-hibitor Y-27632 (Tocris). The SF medium contains DMEM/F12, 1x Nonessentialamino acids, 50 U/mL Penicillin, 50 µg/mL Streptomycin, 10 µg/mL bovine Trans-ferrin, 0.1 mM ß-Mercaptoethanol (all Invitrogen), 2% fatty acid-free Cohn’s fractionV BSA (Serologicals), 1x Trace Elements A, B & C (Mediatech), 50 µg/mL AscorbicAcid (Sigma) and 7 µg/mL recombinant human insulin. Cells were seeded at 105 cellsper well (or as described in text) and incubated. After 6 h, cells were washed twicewith PBS and incubated for another 42 h in fresh medium (either SF supplementedwith factors or CM).
2.4.4 mPSCs culture and seeding onto patterned surfaces
For culture and experiments, R1 mPSCs were kept in media containing 15% heat-inactivated FBS (900-108, Gemini), 500 pM LIF (R&D systems #8878-LF-025), 100AM h-mercaptoethanol (Gibco #21985023), 2 mM L-glutamine (Gibco #21051024),0.1 mM nonessential amino acids (Gibco #11140050), 1 mM sodium pyruvate (Gibco#11360070), 100 U/mL penicillin (Gibco #15140122), and 100 Ag/mL streptomycin
52

(Gibco #15140022) in high-glucose DMEM (Gibco #11965092). In culture, cells weregrown on gelatin-coated (0.2%) tissue-culture flasks and for experiments cells weregrown on micropatterned 96-well plates coated with 12.5 µg / ml fibronectin in 0.2%gelatin. 50 * 104 cells were seeded per well.
2.4.5 Immunocytochemistry
Plates were fixed for 30 min in 3.7% formaldehyde and permeabilized for 3 min in100% methanol. Next the plates were incubated overnight at 4°C with primary anti-bodies (SOX2 (1:400, R&D Systems #MAB2018) and OCT4 (1:400, BD Biosciences#611203)) in 10% FBS in PBS. Finally, the plates were incubated with AlexaFluorsecondary antibodies (1:200; Molecular Probes) and Hoechst 33342 (Sigma #861405)or DAPI (Sigma #D9542) for 1 h 20 min at room temperature in 10% FBS in PBS.
2.4.6 High-content image analysis
Plates were imaged and analyzed using the Cellomics Arrayscan VTI platform andTarget Activation protocol (Thermo Scientific). This protocol generates nuclearmasks, provides single cell average nuclear intensity values for protein expressionand DNA content, as well as spatial xy-coordinates of the nuclei centroids. Singlecell xy-coordinates and fluorescent intensity data were exported as CSV-files andimported into CE for exploration of colony level details.
2.4.7 Statistical analysis
Error bars on plots represent 95% confidence intervals (CI) of replicates except whereindicated differently. CIs are calculated by resampling the original distribution 1000times as implemented in Seaborn.
53

Chapter 3
System size-dependent spatialpolarization of cell fateorganization in adherent mPSCs
This chapter is under preparation for a submission to a peer reviewed journal in a modifiedformat.
Author contributionsAdditional contributors to the work in this chapter include Mona Siu, Daniel Hidalgo, NicoWerschler, Mukul Tewary, Benjamin McMaster, and Peter W. Zandstra. J.O. designed theproject, developed the software, analyzed the data, performed experiments, imaging, andwrote the chapter. M.S. performed experiments, imaging, provided feedback on the chaptercontent, and contributed to the writing. D.H. provided feedback on the chapter content,and a theoretical basis for the experimental observations. N.W. performed experiments,imaging, and contributed to the writing. M.T. assisted in adapting the micropatterning tomPSCs. B.M. provided feedback on the analytical framework. P.W.Z. designed the projectand provided feedback on the chapter content.
AcknowledgementsDuring this work, J.O was supported by the international student award from the instituteof biomaterials and biomedical engineering.
54
3.1 IntroBoth mPSCs and hPSCs have been shown to organize cell fates in spatially distinctregions when induced to differentiate on micropatterned colonies. Specifically, wheninduced to differentiate with BMP and WNT (morphogens that specify posterior em-bryonic fates during gastrulation), extraembryonic fates are located along the colonyedges (as marked by CDX2 expression), followed by primitive-streak fates in an an-nular segment just inside (as marked by Bra), and epiblast-like fates in a disk inthe center of the colony (as marked by Sox2). In hPSCs, cell fate organization onmicropatterned colonies depends on an interplay between activating signals in themedia and inhibiting signals secreted from the cells as well as differential spatial lo-calization of signalling receptors (Etoc et al. 2016, Tewary et al. 2017, Warmflashet al. 2014). This receptor localization has been shown to be affected by cell density(Etoc et al. 2016), while the amount of inhibitors secreted from PSCs is known toincrease with increased cell density, both in human (Kempf et al. 2016) and mouse(Blin et al. 2018). Due to these links of cell density to the mechanisms underlyingcell fate organization, we next set out to probe the impact of differentiating micropat-terned mPSCs at varying seeding cell densities and assessed how this influenced thespatial organization of cell fates.
In addition to the aforementioned studies exploring system parameters in adherentsystems (assays where cells adhere to substrate), several recent studies have exploredspatial organization of cells fates in non-adherent systems (where cells are grown asaggregates, not attached to a surface), such as aggregates of cells with or withoutsurrounding ECM (Beccari et al. 2018, Brink et al. 2014, Simunovic et al. 2019,Turner et al. 2017). One of these in vitro platforms have been capable of recapit-ulating in vivo cell fate acquisition and morphological progression to a remarkableextent by combining PSCs with TSCs and either XEN cells or Matrigel as a basallamina. This includes hallmarks such as the breaking of rotational symmetry in thecup-shaped mouse embryo and gastrulation-like cell fate acquisition and migrationof cells at the posterior end of the embryo (Harrison et al. 2017, Sozen et al. 2018).Such symmetry breaking events also occur within seemingly symmetrical aggregatesof PSCs alone, without extraembryonic cell types (Beccari et al. 2018, Harrison etal. 2017, Turner et al. 2017).
55

These studies provoke the question of whether there is a fundamental difference be-tween non-adherent cell aggregates which can undergo polarized developmental eventsand the flat, adherent micropatterned colonies where cell fate changes hitherto haveonly been observed in symmetric, annular segments. A conceivable theoretical ex-planation to this difference, would be that cell populations growing as aggregatessupport a higher number of local signalling niches than adherent populations due totheir more complex morphology. This would entail that in a single global media con-dition effectively queries a wider array of local signalling conditions in non-adherentaggregates compared to systems with less complex morphologies such as those of ad-herent systems. In addition, studies on non-adherent aggregates revealed that cellseeding density was critical and only a narrow range of this parameter promoted suc-cessful aggregation, elongation, and polarization of the cell aggregates. In adherentmicropatterned systems, these input parameters have not been explored simultane-ously in a systematic manner and it is possible that polarization of adherent systemscan occur, but it might only supported by a narrow range of input conditions, none ofwhich has been found so far. Equipped with our previously developed HTP assay andthe analytic framework presented in this thesis, we were ideally positioned to rapidlysweep these input parameters in a systematic manner, which provided an solid foun-dation on which to test the hypothesis laid out above and explore if polarization ispossible in fine-tuned adherent systems.
3.2 Results
3.2.1 Establishing a platform with minimal uncontrolled per-turbations
To investigate the potential of adherent mPSCs to organize cell fates in a spatiallypolarized fashion, we employed a published protocol for inducing micropatternedmPSCs to differentiate towards germ layer fates in annular segments (Morgani etal. 2018). In this protocol, mPSCs are transitioned from naive culture conditionsinto an N2B27 based medium (NB) with FGF and ACTIVIN A (NBFA) for 48 hin culture and 24 h on the micropatterns (with added KOSR to support survivaland attachment). This transition coaxes mPSCs to exit naive pluripotency and en-ter a formative EpiLC state before being induced to differentiate with the addition
56

of the posteriorizing gastrulation signals WNT and BMP to the priming medium(NBFAWB) (Fig. 3.1A). During the priming period, unpatterned mPSCs downregu-lated the naive marker KLF4 and upregulated the primed marker OCT6, as expected(Fig. 3.2A). An adjustment in our implementation of the published protocol is theuse of fibronectin (20 ng/ul) instead of sarcoma-secreted laminins as the ECM sub-strate on the micropatterned plates. We made this adjustment as we noted superiorattachment of cells on this substrate, possibly due to the different plate-making pro-cedure where we use an in-house UV-patterning procedure to prepare the cell phobicand ECM attachable regions of the tissue culture glass (Tewary et al. 2019).
Since we hypothesized that there might be a narrow parameter space supporting po-larized fate organization we wanted to minimize uncontrolled perturbations in thesystem, including eliminating variation in the input population arising from cell cul-ture. While LIF + serum supports murine naive pluripotency, populations grown inthis signalling environment elicit widespread transcriptional heterogeneity indicativeof functional differences (Singer et al. 2014, Toyooka et al. 2008). In alignment withthese reports, we observed that micropatterned mPSC colonies kept in LS for 48h had a higher Bra+Sox2- proportion compared to colonies grown in N2B27-basedmedium containing LIF + inhibitors for ERK and GSK3-𝛽 (NB2iL, (Fig. 3.1B),which is known to constrain mPSCs in a state that is nearly homogeneously highin pluripotency markers Oct4, Sox2, and Nanog (Ying et al. 2008). Accordingly,NB2iL supported homogeneously high Sox2 expression in the micropatterned mPSCscolonies, while colonies grown in LS showed a lower Bra-Sox2+ proportion comparedto LS (Fig. 3.1B). We also observed differences in the differentiation potential ofcells kept in either NB2iL or LS during culture (Fig. 3.1B). Our results indicate thatmPSCs cultured in NB2iL before priming and differentiation respond more effectivelyto differentiation cues as can be seen in their higher Bra+Sox2- proportion comparedto cells cultured in LS before priming and differentiation (Fig. 3.1B).
Fluorescence microscopy images indicated differences in the spatial organization ofexpression, which varied based on the assayed marker and the media condition. Thisincluded the upregulation of Bra around the edges of colonies in LS, and uniformhigh expression of Sox2 in NB2iL in contrast to the spatially heterogeneous Sox2-expression in LS (Fig. 3.1C). To robustly assess these differences, we quantifiedthe spatial expression organization of multiple 1000 um colonies by averaging the
57
pixel intensities at the corresponding xy-coordinates from colonies within the samecondition. This creates heatmaps of marker expression which show that in the differ-entiation conditions with upregulated Bra the expression was confined to the edgesof colonies appearing as concentric annular regions in the heatmaps (Fig. 3.1D) aspreviously reported when differentiating both mouse and human PSCs (Morgani etal. 2018, Tewary et al. 2017, Warmflash et al. 2014). These rings were notably widerin cell colonies grown in NB2iL before priming and differentiation compared to thosecultured in LS.
We also observed that Bra expression in LS colonies was arranged in a similar edge-confined annular segment, in alignment with previous reports indicating that pluripo-tency markers are low close to colony edges of micropatterned and unpatterned hPSCsin pluripotency conditions (Ostblom et al. 2019, Peerani et al. 2007). This is notablesince previous studies have consistently reported that the cell fate closest to the edgeof the colony is induced directly by activating molecules in the surrounding media,e.g. primitive streak and extraembryonic fates from posteriorizing ligands such asWNT and BMP. However, as LS supports pluripotency, the same mechanisms can-not explain how cells at the edges of these colonies upregulate the differentiationmarker Bra. This observation suggests a role for other organizational cues, such ascontact-based and secreted cell-to-cell communication within the colony, that actsto direct cell fate induction and positioning in addition to a externally imposed dif-ferentiation inducing gradient along the colony radius. This highlights that cell fatepreorganization can occur in conditions that support heterogeneous states of pluripo-tency. It still remains to be investigated how early these organized heterogeneitiesare present and whether they affect how these cells organize when they differentiateor if differentiating signals dominate any preexisting spatial organization. In additionto the increased Bra+ region extent reported here, this could be investigated furtherin future studies by careful titration of differentiation and priming signals followingspatially uniform and non-uniform initial conditions.
Additionally, we observed that the variation in the spatial profile between differentLS-grown colonies is greater than that between different colonies grown in NB2iL(Fig. 3.2B-C). These changes cannot be explained by differential cell densities, asnuclear staining shows the same spatial profiles for all conditions (Fig. 3.2D). Havingestablished that spatially organized fate induction is present in LS and that micropat-
58

terned mPSCs in NB2iL remains uniformly high in Sox2 after 48 h on micropatterns,we selected NB2iL as the culture condition for our studies in order to eliminate anypotential confounding effect from input population heterogeneity.
59

DAPI Sox2 Bra
LS
LS ->NBFABW
NB2iL
NB2iL ->NBFABW
A
B
C D1
0.5
0
Figure 3.1: Spatial organization of Bra occus in LS but not in NB2iL. A)Experimental protocol schematic. B) The proportion of positive pixels within each colonyfor the Bra+Sox2- (left) and Bra-Sox2+ (right) pehenotypes. The culture media (outer),seeding density (middle), and induction media (inner) are indicated as nested x-axis labels.Different colors indicate different induction media, the same as the inner x-axis label. Blackdots represents averages and error bars indicate 95% confidense intervals, where significanceat p<0.01 can be inferred roughly from non-overlapping error bars and at p<0.05 fromerror bars that overlap by a quarter of their total length. C) Representative flurescencemicroscopy images for the conditions in B showing spatial organization in marker expression.D) Image intensities from multiple colonies represented as heatmaps of average intensity forpixels at the same locations across colonies. Intensities are normalized from 0 to 1 for eachmarker and number of analyzed colonies are parenthesized in the title of each heatmap.
60

A B
C NB2iL NB2iL normalized
0 0.1 0.2 0.3 0.4 0.5 0.6
0
0.2
0.4
0.6
0.8
1
LS LS normalized
0 0.1 0.2 0.3 0.4 0.5 0.6
0
0.2
0.4
0.6
0.8
1
NB2iL NBFAWB
0 0.1 0.2 0.3 0.4 0.5 0.6
0
0.05
0.1
0.15
0.2
0.25
0.3
NB2iL NB2iL
0 0.1 0.2 0.3 0.4 0.5 0.6
0
0.05
0.1
0.15
0.2
0.25
0.3
LS NBFAWB
0 0.1 0.2 0.3 0.4 0.5 0.6
0
0.05
0.1
0.15
0.2
0.25
0.3
LS NBFAWB
0 0.1 0.2 0.3 0.4 0.5 0.6
0
0.1
0.2
0.3
0.4
NB2iL NB2iL
0 0.1 0.2 0.3 0.4 0.5 0.6
0
0.1
0.2
0.3
0.4
NB2iL NBFAWB
0 0.1 0.2 0.3 0.4 0.5 0.6
0
0.1
0.2
0.3
0.4
NB2iL NBFAWB
0 0.1 0.2 0.3 0.4 0.5 0.6
0
0.1
0.2
0.3
0.4
NB2iL NB2iL
0 0.1 0.2 0.3 0.4 0.5 0.6
0
0.1
0.2
0.3
0.4
LS NBFAWB
0 0.1 0.2 0.3 0.4 0.5 0.6
0
0.1
0.2
0.3
0.4
LS LS
0 0.1 0.2 0.3 0.4 0.5 0.6
0
0.1
0.2
0.3
0.4
LS LS
0 0.1 0.2 0.3 0.4 0.5 0.6
0
0.1
0.2
0.3
0.4
LS LS
0 0.1 0.2 0.3 0.4 0.5 0.6
0
0.05
0.1
0.15
0.2
0.25
0.3
LS
LS ->NBFABW
NB2iL
NB2iL ->NBFABW
DAPI Sox2 Bra
Figure 3.2: Spatial organization of Bra occus in LS but not in NB2iL (sup-plemental information). A) Representative images for the naive marker Klf4 and theprimed marker Oct6 in Serum + 2iL (top), and after 1 (middle) and 3 (bottom) days ofpriming in unpatterned tissue culture plates. B) Radial trends of the marker expressionshown in Fig. 3.1D. Each line represents a single colony’s intensity averaged over 30 binsalong its radius, and plotted from the colony center (x = 0) to the colony edge (x = 0.65).The y-axis represents intensity values normalized 0-1 for individual pixels and then averagedwithin each bin along the radius. C) Sox2 marker expression of colonies in the pluripotentconditions from panel B with intensities within each colonies normalized to its highest pointin order to facilitate comparison of the spatial profile’s shape and its consistency betweencolonies within each condition.
61

3.2.2 Ligand concentration and cell density controls the ex-tent of cell fate acquisition
To further probe the behavior of NB2iL micropatterned colonies, we varied the con-centration of the inducing ligands in the media, the cell seeding density, and the timeof induction.
First we investigated the effect of different ligand concentrations, by preparing dif-ferentiation media containing a quarter or half the concentration of 2i, LIF, FGF,ACTIVIN A, BMP, and WNT together with the full concentration of the remainingmedia components (glutamax, NEAA, BME, penstrep, sodium pyruvate). mPSCsthat remained in NB2iL as a control condition showed no differences in the propor-tion of either Bra+Sox2- or Bra-Sox2+ at different ligand concentrations (Fig. 3.3A),indicating that the small molecules are potent inducers of pluripotency also well be-low their standard concentrations. Cells cultured in NBFA showed elevated Sox2expression at 0.25x, and no differences in Bra expression. In contrast, cells grown inNBFAWB elicited gradually decreasing Bra-Sox2+ proportion at higher concentra-tions with around a 12-fold difference between the 0.25x and 1x conditions, and aopposite trend for the increasing Bra+Sox2- proportion with around a 9-fold differ-ence between the 0.25x and 1x conditions (Fig. 3.3A).
Investigating the spatial organization of the marker expression revealed that Braexpression was confined to the edges of the colony, either as disjoint segments at thelowest ligand concentration or full rings along the edge of the entire colony at higherligand concentrations (Fig. 3.3B-C). The increased Bra expression in 1x versus 0.5xmanifested as thicker annular segments extending further towards the center of thecolony. As these Bra segments extended further towards the colony center, the Sox2expression was increasingly confined to the center of the colony, highlighting thatthe different fates indicated by these markers don’t occupy the same region of thedifferentiating colonies (Fig. 3.3B-C). These trends were not present in the DAPIexpression, suggesting that they are not predominantly an effect from differential celldensities.
Next, we explored the effect of density and time of induction by seeding cells on mi-cropatterns at three different densities, 25k, 50k, or 100k cells per well, and inducedthem to differentiate for either 48h or 72h. As a control, colonies in NB2iL remained
62

A
B C
Sox2
Bra
DAPI
0
0.5
1
0.25x 0.5x 1x
Figure 3.3: Signal concentration determines the extent of Bra expression. A)The proportion of positive pixels within each colony for the Bra-Sox2+ (left) and Bra+Sox2-(right) pehenotypes. The induction media (outer), seeding density (middle), and inductionmedia concentration (inner) are indicated as nested x-axis labels. Different colors indicatedifferent induction media, the same as the inner x-axis label. Black dots represents av-erages and error bars indicate 95% confidense intervals, where significance at p<0.01 canbe inferred roughly from non-overlapping error bars and at p<0.05 from error bars thatoverlap by a quarter of their total length. B) Representative flurescence microscopy imagesfor NBFAWB showing spatial organization in marker expression at different concentrations.C) Heatmaps of multiple colonies showing the average intensity of positive pixels acrosscolonies for NBFAWB. Intensities are normalized from 0 to 1 for each marker and the num-ber of analyzed colonies are parenthesized in the title of each heatmap. The ghosting inthe low concetrations of Bra stems from slighly differently sized colonies due to shrinkingof the colony during the differentiation at low concetrations.
63

uniformly high in their Bra-Sox2 proportion for all three densities at both timepoints(Fig. 3.4A). Cells maintained in NBFA also showed low Bra+Sox2- proportion for allthree densities and both time points. In both NBFA and NBFAWB, the Bra-Sox2+proportion increased with increasing cell densities, as previously reported for hPSCs(Etoc et al. 2016). For cells differentiated in NBFAWB for 48h the Bra+Sox2- propor-tion was markedly reduced with increasing cell density, and the difference between25k and 100k / cells per well was about 4-fold (Fig. 3.4A). Interestingly, at 72hthe Bra+Sox2- proportion was low for all densities (Fig. 3.4A), which is consistentwith previous data indicating that Bra expression peaks at 48h in micropatternedmPSCs (Morgani et al. 2018). Possibly, the effect of seeding density in NBFAWBat 72h becomes negligible when there is no to little Bra expression overall, as for theBra+Sox2- proportion in NBFA at 48h and 72h.
Quantification of the spatial organization of these cell fates revealed that at 50kand 100k cells/well, Bra+Sox2- population was confined to the edges of the patternswhile the Bra-Sox2+ population was confined to the region of the colony inside thisouter ring (Fig. 3.4B), similar to what we report in the figures above. However,at the lowest seeding density, the Bra+Sox2- population was present throughout thecolony (Fig. 3.4B), and there was a lower Bra-Sox2+ proportion both at 48h and72h. This is reminiscent of the expression pattern in low density hPSCs, where thefailure to form a confluent epithelial layer with tight junctions between cells allowsexternally provided ligand to reach in between cells and bind to receptors that arenot accessible after the tightly linked epithelium is formed. Notably we don’t see anyinternalization of Bra reported previously for hPSCs and mSPCs. The reason thatthe regions appear thinner in these colonies compared to the NB2iL colonies above,could be slight differences in seeding densities due to human error when counting,which would allows a bigger part of the colony periphery to differentiate.
These results show that micropatterned mPSCs grown in NB2iL respond similarlyto changes in input parameters as previous micropatterning studies of hPSCs andmPSCs maintained in LS. In summary, higher ligand concentrations extends theBra+ region at the edge inwards towards the colony center, whereas low cell seedingdensity allows the otherwise edge restricted Bra+Sox2- fate to spread throughout thecolony. An induction time over 48 h decreases the Bra+Sox2- proportion.
64
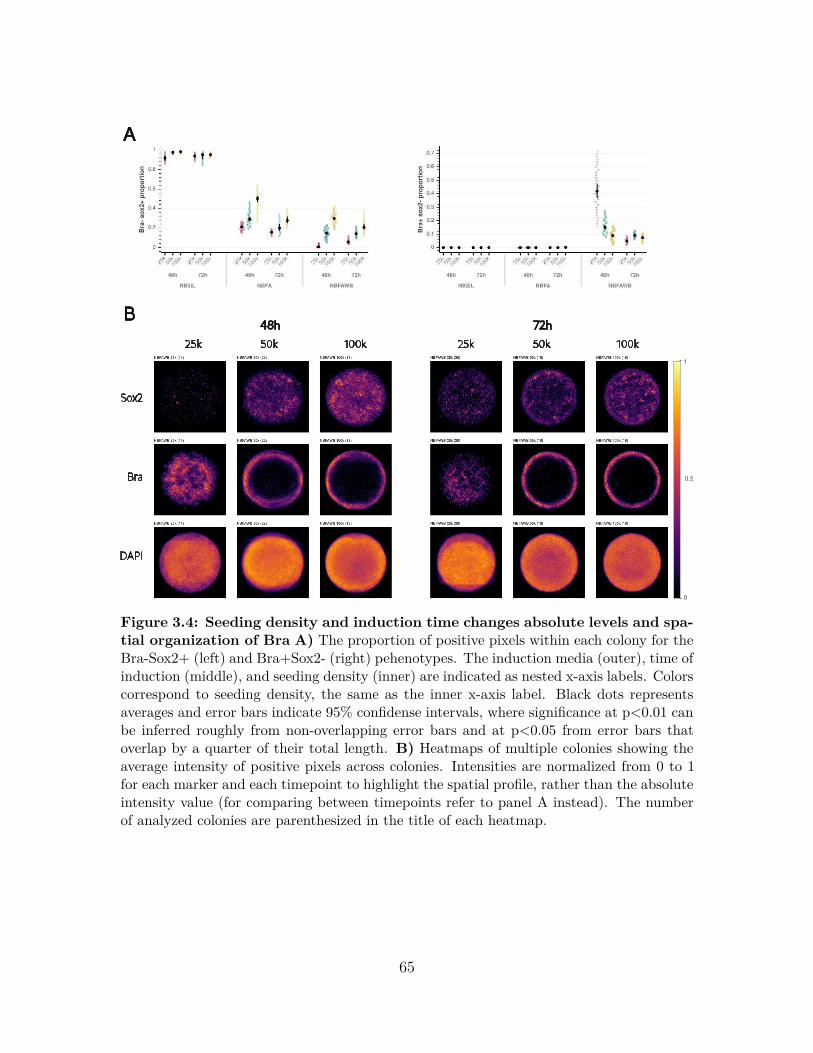
Sox2
Bra
DAPI
25k 50k 100k 25k 50k 100k
48h 72h
A
B
0
0.5
1
Figure 3.4: Seeding density and induction time changes absolute levels and spa-tial organization of Bra A) The proportion of positive pixels within each colony for theBra-Sox2+ (left) and Bra+Sox2- (right) pehenotypes. The induction media (outer), time ofinduction (middle), and seeding density (inner) are indicated as nested x-axis labels. Colorscorrespond to seeding density, the same as the inner x-axis label. Black dots representsaverages and error bars indicate 95% confidense intervals, where significance at p<0.01 canbe inferred roughly from non-overlapping error bars and at p<0.05 from error bars thatoverlap by a quarter of their total length. B) Heatmaps of multiple colonies showing theaverage intensity of positive pixels across colonies. Intensities are normalized from 0 to 1for each marker and each timepoint to highlight the spatial profile, rather than the absoluteintensity value (for comparing between timepoints refer to panel A instead). The numberof analyzed colonies are parenthesized in the title of each heatmap.
65
3.2.3 Seeding density controls polarization of Bra and Sox2expression
After establishing the cell fate organization of EpiLCs from NB2iL-cultured mPSCsduring symmetrical differentiation in 1000 um micropatterns, we next sought to usethis system to investigate the possibilities of asymmetrical induction of cell fates inadherent cell populations.
As previous investigations have highlighted cell seeding density as critical for success-ful aggregation and polarization of non-adherent cell populations, we chose this asone of the initial parameters to explore. Notably, while the number of cells is the onlyparameter governing the system size for cell aggregates, adherent populations are alsorestricted by the size of the micropatterned region. While aggregate studies showedthat around 300 cells were optimal for initial aggregation before differentiation, 1000um patterns support many more cells than that if they are near confluent. Therefore,we reduced the system size to 200 um and explored different seeding densities fromnear confluent to past confluency at the onset of differentiation.
In addition to varying seeding density, we also explored how different priming timesaffects spatial cell fate organization as this period is critical to transition naive mPSCsto a state similar to the posterior epiblast at the onset of gastrulation, which is poisedto respond to the differentiation cues present in the embryo around this time. Whencomparing micropatterned mPSCs differentiated for 48 h in NBFAWB after beingprimed for either 1 or 2 days in the 96-well plate (a total of 3 or 4 days priming sincecells are also primed for 2 days before seeding onto the micropatterns) we noticedstriking differences in both the extent of marker expression and its spatial organi-zation (Fig. 3.5A). The proportion of the Bra+Sox2- region increased with lowerseeding density and shorter priming time, and was the highest in seeding densitieslower than 80k in 1 day priming and lower than 20k for 2 day priming (Fig. 3.5B).This trend indicates that conditions that have similar marker expression and a oneday difference in priming time are offset with about two steps in seeding densities,aligning with a doubling time to mPSCs around 12 h (Liu et al. 2019, Waismanet al. 2019). This indicates that the effect of prolonged priming time on cell fateorganization might predominantly be carried out via increased cell numbers ratherthan further specialization of cell fate.
66
Previously it has been shown that for ligand concentrations that induce rings of cellfates in 1000 um colonies, 250 um colonies are patterned uniformly with the edge-fateof big colonies. Reducing the ligand concentration allows all three fates to be estab-lished in 250 um colonies of hPSCs (Tewary et al. 2017). In contrast, 225 um coloniesof mouse EpiLCs show annular expression of germ layer markers when induced todifferentiate with the same ligand concentrations as what creates ring-like patterningin 1000 um colonies (Morgani et al. 2018). The same study revealed that smallercolonies of ~100 um in diameter showed disorganized expression of differentiation andpluripotency markers. Here, we report that in colonies of 200 um diameter, while theBra+ and Sox+ regions occupy different regions of the colonies, they rarely organizeas a centered cluster of Sox2+ cells with a surrounding region of Bra+ cells along theedge. Rather, regions positive for either Bra or Sox2 often localize at different polesof the colonies. The marker expression was quantified by classifying pixels of the im-ages as either positive or negative via a semi-automated thresholding procedure andmeasuring the distance of the centers of mass for each respective positive region tothe centroid of the nuclear stain of the colony (Fig. 3.5C). This revealed that whilehigh proportions of either marker combinations are evenly distributed throughout thecolony they localize away from the centroid of the colony when the region shrinks,rather than constituting a centrally positioned area, but remain as a compact clusteron one side of the colony rather than a ring like segment extending along the entirecolony edge (Fig. 3.5A,C).
As expected, colony size after 48 h is a function of the initial cell seeding densityand the time the colony has to grow (Fig. 3.5D). When exploring the correlationbetween the colony area and marker expression, we find that an increase in colony cellnumbers follows a similar trend as the increase of the Bra-Sox2+ region and the offsetof the Bra+Sox2- from the colony centroid (Fig. 3.5D). In other words, colony sizecorrelates positively with the Bra+ offset from the colony center, and negatively withthe Sox2+ offset, so that Bra expression becomes localizes in large colonies, whileSox2 expression becomes localization in small colonies. There was not any notablesystematic changes in the average aspect ratio between conditions (measured as anobject’s major axis divided by its minor axis and thus defined from 1 (a circle) and up(more elongated shapes)), as expected since the area between colonies are not coatedwith ECM and there is little possibility for cells to expand beyond the borders of the
67

micropatterned ECM spots(Fig. 3.5D).
Overall, we show that polarized expression patterns can arise in adherent populationssuch as micropatterned colonies of EpiLCs. Our findings suggest that seeding densityand system size are the main driving effects of this phenomena and that it can occur atdifferent priming times if these are density matched according to the cell proliferationrate.
68

1d prime
2d prime
3d prime
5k 10k 20k 40k 80k 160kA
B
C
D
200 um Bra Sox2
Figure 3.5: A crititcal range of cell densities support polarized expression of Braand Sox2. A) Representative microscopy images of colonies 200 um in diameter primedfor either 1, 2, or 3 days from different seeding densities followed by 48 h differentiationin NBFAWB. Bra is shown in red and Sox2 in cyan. The scale bar in the top left imagerepresents 200 um and the side of each image is 1350 um. B) The Bra+Sox2- (left) and Bra-Sox2+ (right) proportion per colony. C) The offset from the colony centroid of the centerof mass for the Bra+Sox2- (left) and Bra-Sox2+ (right) proportion per colony (normalizedto the colony diameter). The area (in um, left) and the aspect ratio (the major axis dividedby the minor axis) for each colony. For all plots, the priming time and media conditionis indicated as nested x-axis labels. different colors indicate different densities along thex-axis. Black dots represents averages and error bars indicate 95% confidense intervals,where significance at p<0.01 can be inferred roughly from non-overlapping error bars andat p<0.05 from error bars that overlap by a quarter of their total length.
69

3.2.4 Polarized marker expression only occurs in colonies ofdevelopmentally relevant sizes
Next, we sought to explore if differential seeding densities could also promote po-larization in colonies larger or smaller than 200 um. We primed mPSCs for 2-daysafter transferring them to 96-well plates containing micropatterns of 100 - 800 um indiameter in separate wells. These cells were differentiated in NBFAWB for 48 h andstained for Sox2 and Bra, as in the previous figure.
The smallest colonies of 100 um diameter showed high variation in spatial organizationof markers with some colonies being entirely Sox2+, some entirely Bra+, and someexpressing both markers, but at opposite ends of the colony. Similar variation haspreviously only been reported for much smaller colonies of hPSCs, where “micro-colonies” consisting of no more than eight cells undergo all or nothing responses toinducing ligands rather than patterning fates unevenly within the colony (Nemashkaloet al. 2017). In 200-300 um colonies, we observed the polarized expression illustratedin (Fig. 3.6A-B), while at 400-500 um the Sox2+ region becomes centrally locatedin the colony and the Bra+ region starts to spread out along the edge of the colony(Fig. 3.6A-B). These organizational events were more pronounced in bigger colonies,as can be seen for the 700 um colonies. These organizational events did not occur ifthe seeding density was too low, where the Bra+ region instead spread throughoutthe colony, as can be seen for the 800 um colonies at 8k seeding density (Fig. 3.6B).
Quantifying this localized expression by measuring the distance between the colonycentroid and the center of mass for positive pixels of each marker revealed that theBra+Sox2- region is the most offset from the centroid in 200 - 300 um colonies, whilethe Sox2 is the most offset in 100 - 200 um colonies (Fig. 3.6C). These trends arethe same for 4k and 8k seeding, although the magnitude of the offset is greater in 8kfor Bra+Sox2- and greater in 4k for the Bra-Sox2+ region (Fig. 3.6C), consistentwith that the Bra+Sox2- proportion is lower in 8k and the Bra-Sox2+ proportionis lower in 4k (Fig. 3.7). When differently sized colonies were grown in either 1xor 0.5x of activating ligands in the media, we observed the same trends in offsetfor the different cell fates, where the Bra+Sox2- proportion was slightly larger inthe 1x media condition and vice versa for the Bra-Sox2+ proportion (Fig. 3.7),similar to our previous observation of how ligand concentration influences phenotype
70

proportions in large patterns with symmetrical cell fate organization.
71

A B
C
100 μm 300 μm
700 μm 1000 μm
Sox2 Bra
Figure 3.6: A crititcal range of colony diameters support polarized expressionof Bra and Sox2. A) Maximum intensity projections of confocal slices from fluroes-cently stained micropatterned colonies of 200 um diameter. Green = Sox2, Red = Bra.B) Heatmaps of Sox2 and Bra expression representing averages of the same location inmultiple colonies. The pattern size, seeding cell density, and number of aggregated coloniesis represented in the title of each subplot. The intensities are normalized from 0-1. Thenumber of analyzed colonies are parenthesized in the title of each heatmap. C) Maximumintensity projections of confocal slices from fluroescently stained micropatterned coloniesof 100, 300, 700, and 1000 um diameter. D) The distance between the centers of mass ofthe Bra+ and Sox+ pixels in each image stratified by colony diameter and seeding density.Each dot represents a colony laid out according to kernel density estimate of the under-lying distribution. Black dots represents averages and error bars indicate 95% confidenseintervals, where significance at p<0.01 can be inferred roughly from non-overlapping errorbars and at p<0.05 from error bars that overlap by a quarter of their total length.
72

Figure 3.7: Different ligand concentrations show the same trend in markerexpression over varying colony diameters. Proportion of Bra+Sox2- (upper) andBra-Sox2+ (lower) pixels stratified by colony diameter, seeding density, and ligand con-centration. Each dot represents a colony laid out according to kernel density estimate ofthe underlying distribution. Black dots represents averages, and error bars indicate 95%confidense intervals, so significance at p<0.01 can be inferred roughly from non-overlappingerror bars and at p<0.05 from error bars that overlap by a quarter of their total length.
3.2.5 Marker polarization arises via displacement ratherthan induction at the poles
After having defined conditions where polarization of Bra+Sox2- and Bra-Sox2+ re-gions occurs robustly, we set out to investigate the kinetics of this process. At oneextreme, polarization could be due to random induction followed by sorting into sepa-rate poles of the aggregate. At the other extreme, different cell fates could be inducedin place at opposing poles of the colony and not mixing afterwards. To investigate ifone of these scenarios was a good approximation for how polarization occurs in ourplatform we followed the progression of colonies over time by seeding cells at highand low density and assaying them at 12 h intervals over two days. Intriguingly,in colony sizes <= 500 um in diameter, the distance between the Bra+Sox2- regionand the colony centroid increased gradually over time, starting already from the 12h to 24 h timepoint (Fig. 3.8A). This indicates that the Bra+Sox2- region is notinduced in place, and simply increases in cell number over time, but rather alters itslocation over time progressively moving away from the centroid of the colony. Whenmeasuring the change in the cell fate proportions over time, we observed that the
73

Bra+Sox2- was the highest around the 36 h and 48 h timepoints, both at high andlow seeding density (Fig. 3.8B). The Bra-Sox2+ region decreased gradually overtime for the low seeding density and reached the lowest levels at the 48 h timepoint,while at the high density, it remained at a relatively constant level for most colonysizes (Fig. 3.8B).
To evaluate the displacement of the Bra+ region relative to the colony center over afiner time resolution, we used live imaging of a Bra-GFP reporter line to assess thehourly change in Bra expression over a 48 h period. These experiments show that Braexpression in small colonies are present in a seemingly disorganized pattern beforebeing displaced to one pole of the colony, which aligns with our observations from thetime course data above (Fig. 3.8C). In contrast, in colonies of larger diameter whereBra forms an annular segment at the edge of the colony, the cells seem to be inducedin place along the border of the colony, although not necessarily at the same pointin time throughout the entire edge (Fig. 3.8D), aligning with the lack of systematicchange for large sizes in the time course data.
Overall, our results suggest that the temporal progression of cell fates’ spatial orga-nization in smaller polarized colonies occur largely through displacement after induc-tion. This is fundamentally different from the cell fate organization taking place inbigger colonies where Bra+ regions are induced in largely symmetrical patterns alongthe edge of the colonies and do not change their location after induction.
74

A
B
C D
Figure 3.8: Bra region distance from colony centroid increases gradually over 48h of differentiation. A) The distance between the centers of mass of the Bra+ and Sox+pixels in each image stratified by colony diameter, seeding density and time of differentiation.B) Proportion of Bra+Sox2- (upper) and Bra-Sox2+ (lower) pixels stratified by colonydiameter, seeding density, and time of differentiation. Each dot represents a colony laid outaccording to kernel density estimate of the underlying distribution. Black dots representsaverages, and error bars indicate 95% confidense intervals, so significance at p<0.01 canbe inferred roughly from non-overlapping error bars and at p<0.05 from error bars thatoverlap by a quarter of their total length. C) Image sequence from live imaging experimentsshowing expression of Bra-GFP construct overlaid with T-PMT. Images are of 200 umcolonies and spaced equally in time. D) Image sequence from live imaging experimentsshowing expression of Bra-GFP construct overlaid with T-PMT. Images are of 600 um(upper) and 800 um (lower) colonies and spaced equally in time.
75

3.3 Methods
3.3.1 In vitro methodology
Mouse embryonic stem cell culture maintenance
Cell lines used in this work include R1 (Nagy et al. 1993) and BraGFP/+ (Fehling etal. 2003) mESC lines. For routine culture, mESCs were maintained in flat bottom tis-sue culture plates (Falcon, Tewksbury, MA) coated with 0.2% gelatin. mESCs werecultured using N2B27-based medium with additional of LIF and inhibitors for GSK3-beta and ERK (NB2iL) comprised of 48% Neurobasal Medium (Gibco, Gaithers-burg, MD), 48% Dulbecco’s Modified Eagle Medium: Nutrient Mixture F-12 (Gibco,Gaithersburg, MD), 1% B-27 Plus Serum Free Supplements (Gibco, Gaithersburg,MD), 1% Glutamax, 1% 55mM 2-mercaptoethanol (Gibco, Gaithersburg, MD), 0.5%100x N-2 Supplement (Gibco, Gaithersburg, MD), 0.5% Pen/Strep, 0.025% Bovineserum albumin (BSA, Wisent Bioproducts), 0.005% 200ng/ul LIF, 0.01% 30mMCHIR99021 (Tocris Bioscience), and 0.01% 10mM PD0325901 (STEMCELL Tech-nologies). Medium was changed daily and mESCs were passaged every 2 days (80%confluency) by exposing cells to Trypsin-EDTA (Gibco, Gaithersburg, MD) for 3 min.
Priming of mESCs
To convert naive mESC to a transient EpiLC state prior to differentiation, mESCswere cultured in a priming medium (NBFAK) for two days before plating on micropat-terns. Briefly, naive ESCs suspension were collected by applying 1ml/well of Trypsin-EDTA (Gibco, Gaithersburg, MD) to ESCs grown in NB2iL medium and incubatingthem at 37˚C for 3 minutes. 2mL of serum-containing medium was then added toneutralize trypsin activity. ESCs were gently pipetted up and down to dissociate intoa single cell suspension. Cells were collected at 900 rpm for 3 min and resuspendedin NBFAK medium containing 48% Neurobasal Medium (Gibco, Gaithersburg, MD),48% Dulbecco’s Modified Eagle Medium: Nutrient Mixture F-12 (Gibco, Gaithers-burg, MD), 1% B-27 Plus Serum Free Supplements (Gibco, Gaithersburg, MD), 1%Glutamax, 1% 55mM 2-mercaptoethanol (Gibco, Gaithersburg, MD), 0.5% 100x N-2Supplement (Gibco, Gaithersburg, MD), 0.5% Pen/Strep, 0.025% Bovine serum al-bumin (Wisent Bioproducts),12 ng/ml FGF2 (Peprotech, Rocky Hills, NJ), 20 ng/mlACTIVIN A (Peprotech, Rocky Hills, NJ) and 1% KnockOut Serum Replacement
76
(Gibco). Cells were counted and 200,000 cells were plated onto each well within a6-well tissue culture plate (Falcon, Tewksbury, MA) coated with 0.2% gelatin. Cellswere grown in NBFAK medium for 48 hours and medium was changed everyday.
Preparation of micropatterned plates
We followed our previously-developed method to create micropatterns using UV-lithography with glass slides and bottomless 96-well plates (Tewary et al. 2019).Briefly, glass cover-slips were cleaned with isopropanol and coated with a photo sen-sitive cell-phobic polymer using a spin coater at 2000rpm for 30s. 20 minutes of deepUV exposure was applied to the glass slide through a Quartz photomask with pre-defined micropatterns in a UV-Ozone cleaner (Jelight, Irvine, California) to photo-oxidize selected regions of the functionalized coating. Patterned glass slides wereattached to bottomless 96-well plates using medical Epoxy (Henkel) with 4 hour curetime (in conventional oven at 54 degree celsius) to produce plates with patterned cellculture surfaces.
Micropatterned mESC colony plate preparation
Prior to seeding cells onto the plates, 100ul of ddH2O was added to each well followedby 25ul of 50mg/ml N-(3-Dimethylaminopropyl)-N-ethylcarbodiimide hydrochloride(Sigma, St Louis, Missouri) and 25ul of 50mg/ml N-Hydroxysuccinimide (Sigma, StLouis, Missouri) for 20 minutes to activate the wells. The wells were washed withddH2O for 3 times and incubated with 100ul/well of 10µg/ml fibronectin bovineplasma (Sigma-Aldrich) in 0.1% gelatin for 2 hours on an orbital shaker at roomtemperature. The long incubation allowed for deposition and saturation of the extra-cellular matrix onto the functionalized regions of the glass. Wells were washed thricewith ddH2O prior to seeding to rid any passively absorbed ECM on non-functionalizedregions. 50µL of ddH2O was pipetted into each well to ensure the ECM remains hy-drated during preparation of the cell seeding suspension. It is recommended that theECM-coated plates not be stored for more than 8 hours between plate preparationand seeding, as stability of the functionalized surface has not been tested past thispoint.
77

Cell seeding and induction of gastrulation-like differentiation events inmPSC micropatterns
After 48 hour priming in NBFAK medium, single cell suspension of EpiLCs were col-lected by trypsinization as described above. Cells were centrifuged at 900 rpm for 3mins and resuspended in NBFAK medium supplemented with 10 µM Rho-associatedkinase inhibitor Y-27632 (ROCKi, Tocris Bioscience, UK). Cells were counted andseeded at 20 000 cells per well (or as described in the text) in 100ul/well of NBFAKwith ROCKi. Plates were maintained in the tissue culture hood for 30 minutes afterplating to allow time for cells to more evenly settle on the functionalized micropatternsurface before moving to the incubator. After 24 hours, the medium was replacedwith 200ul/well of fresh NBFAK medium (without ROCKi). After 48 hours uponcell seeding, the medium was changed to 200ul/well of NBFAWB medium contain-ing 48% Neurobasal Medium, 48% Dulbecco’s Modified Eagle Medium: NutrientMixture F-12, 1% B-27 Plus Serum Free Supplements, 1% Glutamax, 1% 55mM 2-mercaptoethanol, 0.5% 100x N-2 Supplement, 0.5% Pen/Strep, 0.025% Bovine serumalbumin,12 ng/ml FGF2, 20 ng/ml ACTIVIN A, 200ng/ml murine WNT3A (Pepro-tech, Rocky Hills, NJ), and 50ng/ml murine BMP4 (Peprotech, Rocky Hills, NJ).Cells were maintained in NBFAWB medium for up to 48 hours (or as described inthe text) and medium was changed daily.
Fixing and immunofluorescence staining of differentiated mPSCs on mi-cropatterns
Staining followed a protocol previously developed to stain tumor spheres (Weiswaldet al. 2010) to ensure sufficient penetration even in thick colonies. Micropatternedcolonies were fixed with 4% paraformaldehyde in PBS containing 1% Triton-X(Sigma) (PBST) for 2 hours at 4°C . Cells were then washed thrice with PBSand blocked in 0.1% PBST supplemented with 2% BSA (Wisent Bioproducts) for30 minutes at room temperature. Cells were then immunostained overnight at4°C with primary antibodies (SOX2 (1:1200, Invitrogen #14-9811-82) and BRA(1:400, R&D #AF2085)) diluted in 0.1% PBST. Cells were washed thrice with 0.1%PBST on the following day, and were then immunostained overnight at 4°C withsecondary antibodies (1:200, Donkey anti Goat IgG (H+L) Secondary Antibody,Alexa Fluor 647, Invitrogen; 1:200, Donkey anti Rat IgG (H+L) Highly Cross
78
Adsorbed Secondary Antibody, Alexa Fluor 488, Invitrogen) and DAPI (1:1000,Sigma #D9542) diluted in 0.1% PBST. On the following day, cells were washedthrice with 0.1% PBST and stored at 4°C with PBS. Micropatterned plates wereimaged using an automated imaging pipeline on the Zeiss LSM800 confocal with a20x 0.8 NA air objective acquiring five z-slices per imaged field, and imaging around90% of each well. Images were reduced the maximum intensity projects beforeanalysis.
3.3.2 Analytic pipeline development
Motivation and design goals
Our lab pioneered the transition of micropatterning from low throughput to highthroughput platforms (Nazareth et al. 2013, Tewary et al. 2019), which we haveemployed to study the spatial organization of cell fate at unprecedented throughput(Ostblom et al. 2019, Tewary et al. 2017, 2019). In general, high-throughput plat-forms bring several benefits over lower-throughput assays, mainly centered aroundfaster query of experimental conditions and increasing number of replicates, whichenable more thorough searches of system parameter spaces and higher reproducibilityof results.
To be able to analyze this wealth of data in a statistically sound and systematicmanner, we developed software tailored for this purpose. First a package to worktogether with commonly used image processing pipeline for extraction of single celldata, and here without the need to rely on single cell features, and instead workdirectly with the images in a high or low throughput setting. The design goals of thisplatform, was to build a semi-automated approach to quantify cell fate organizationin colonies of cells, and to create this software framework in an environment thatis both easy to use for scientist without significant computational training whileallowing great flexibility and power for experienced users.
As we wanted to make this platform extendible and available to as many scientistsas possible without restrictions, we have implemented all parts of the frameworkusing open source software and released it under an open license. We believe it isparamount for scientists to rely on open tools to the greatest possible extent as theseincrease transparency, reproducibility, and accessibility to research. While many
79

hurdles persists for the larger research community to transition from obsolete modelsof closed software and article publishing, every software and publication that is madeopenly available is a small step towards advancing science in a direction which leadsto time-savings and increased resource availability for researchers.
Plot and widget interactivity
To meet our design goals, we implemented our framework as a set of graphical widgetsin an open programmable environment. Specifically, we used Jupyter Notebooks(Kluyver et al. 2016, Pérez and Granger 2007) via JupyterLab, as they allow fordisplay of rich content inline with code in the same browser-based interface. Thisallowed us to leverage web technologies such as HTML and Javascript to createinteractive widgets via Panel (Rudiger et al. 2020) and Param (Stevens et al. 2020),and interactive plots using Bokeh (Bokeh Development Team 2020) and Holoviews(Rudiger et al. 2020). Interactivity is a central component of our analytical frameworkas widgets makes it widely accessible to a large number of scientists and speedsup parameter optimization as users can see changes represented in the microscopyimages in real time when they drag sliders or in other ways update the widgets. Theinclusion of interactive plots provides rich information on individual data points andthrough the display of images for selected data points, this allows scientist to directlyrelate relate measurements back to microscopy images, combining the strengths ofextracted quantitative image metrics with the pattern recognition capabilities of thehuman visual system. Importantly, this also contributes to the ease of use of theplatform since for every data points it is easy to view the image of the cell colony,which simplifies the intuitive understanding of how metrics are derived and reducesthe risk of introducing unseen errors.
Notably, while interactivity and rendering of thousands of data points can makeperformance suffer Bokeh allows easy use of client side GPU-accelerated renderingvia WebGL to improve performance and smoothly render hundreds of thousands ofinteractive data points. Our choice of software ecosystem allows this to be extendedto hundreds of millions points when needed via Datashader (Bednar et al. 2020)which seamlessly re-bins pixel data to push high-level, dynamically updated imagerepresentations to the browser instead of all individual data points, an approach we’recurrently using to display large high quality images of stitched wells without slowing
80

down browser performance. Although the main focus of this framework is interactivedata visualization, we recognize the need to incorporate state data representationinto traditional publishing formats, which is here achieved through the use of analternative rendering engine to optionally export plots as scalable vector graphics(.svg files) as they are rendered in the browser.
As Jupyter Notebooks are rendered by browser engines without required specializedsoftware on the client machine, this make the transition to a separate server andclient machine seamless. A Jupyter kernel can be started on a powerful workstation,and when set up via JupyterHub or SSH, users can access it via a web address on thenetwork. This offers not only a major increase in performance, since computationsare carried out on the server, but avoids error prone copying of data to personallaptops, and frees up time to use workstations in person, while still allowing clientside interactivity and easy access to saved files.
Framework architecture
Our analytical framework relies on several well-established scientific Python packagesto perform the quantification of image data. Specifically, we use pandas (Reback et al.2020, Wes McKinney 2010) as the backbone for storing and operating on data usingdataframes, scikit-image (van der Walt et al. 2014) and numpy (van der Walt et al.2011) for image processing, statsmodels (Seabold and Perktold 2010), scipy(Joneset al. 2001), scikit-learn (Pedregosa et al. 2011), and scikits-bootstrap for derivingstatistical quantities of data, joblib (Joblib Development Team 2020) and pandarallelto increase performance through parallel computing, and numba (Lam et al. 2015)to further speed up computations by compiling custom Python functions at runtime.While we’re currently relying on storing the image data in memory to maximizeperformance, the architecture allows for easy enhancement using external memoryalgorithms as implemented in Dask and Ray possible via Modin. This would allowlarge imaging dataset to be processed even on personal laptops, albeit at the cost ofa performance decrease.
Analysis workflow
There are three main steps involves in the analysis process, first colonies of cells areidentified in microscopy images, which requires the use of a nuclear dye to stain all
81

cells in the colony (future versions aim to also allow identification via use brightfieldimages). Identified colonies can be filtered based on their area, circularity, solidity(area ratio to their bounding box), and proximity to the image border (Fig. 3.9).To identify suitable thresholds for these parameters, we use scatter plots similar tohow subpopulations are identified using gating in flow cytometry (Fig. 3.10). Sinceit is not immediately obvious where a certain threshold should lie just from the datapoints in the plot, selection of data points displays the corresponding microscopyimages to facilitate the decision whether these data points should be included orexcluded from the analysis (Fig. 3.10B-F).
82

Figure 3.9: Parameter optimization for colony identification. Graphical interfacefor the colony identification widget showing the code run in the input cell at the top, thedisplayed widget with sliders used to adjust the colony filters. and the image plot whereidentified colonies are rendered in magenta, cyan, and yellow. Three different colors werechosen to give increased dissolving power over one color for neighboring aggregates, butavoiding the visual noise from using unique colors for each colony.
83

A
C
E
B
D
F
Figure 3.10: Quality control plot for identified colonies. A) Plotting the circularityversus area (also encoded as marker size) of each colony allows interactive exploration ofdifferent set of colonies by selecting the plotted markers. Marker color indicates densitywhere dense regions are colored yellow and sparse regions pruple. Here, several differentselections made on the same plot are shown in the different panels, where the unselectedcolonies are made increasinly transparent to empasize the selection. For each of the selectedcolonies, an image is displayed for that colony’s nucelar stain. The panels show a selectionof B) very large colonies C) large colonies with low circularity D) colonies of around twicethe area and lower circularity than the densest population, similar to flow cytometry, theseare “duplets” where colonies have fused together, E) small, non-circular colonies, F) circularsingle colonies, the population of interest. 84

The next step is to set a threshold for which pixels are classified as positive and whichare negative. This is optional and enables the calculation of additional metrics suchas proportion of pixel phenotypes per colony which is a more meaningful metric thanan average intensity value of arbitrary units and easier to compare between screens.The thresholding widget allows for the display of individual colonies cropped out ofthe original images where multiple colonies might be in the same image. A numberof parameters such as minimum threshold area, smoothing image preprocessing, andthe maximum number of separate threshold regions can be specified (Fig. 3.11A).
While the threshold value can be set manually using visual inspection or stained pos-itive and negative controls, there is also an automated threshold estimation, whichsamples a configurable number of pixels from all colonies (500,000 by default) anduses the first derivative of the kernel density estimate of the pixel intensity distribu-tion to find suitable areas for setting a threshold. The reason for using the kerneldensity estimate is to provide a smooth, gradually increasing and decreasing curvewithout local variation leading to the detection of false peaks and valleys. Usingthe rate of change of a smoothened curve is commonly used to identify minima andmaxima, i.e. locations where the first derivative changes sign, however, in our expe-rience working with immunofluorescence imaging data, fluorophore intensities rarelyform curves with clear minima close to the ideal thresholding range (where thresholdswould have been put by manual inspection of images). Rather, positive pixel valuesstretch over a wide range, which has the effect that intensity curves often graduallyflatten out as the negative pixel distribution transitions into the positive. In our expe-rience, the ideal threshold value is close to this flattening after the first intensity peakwhich we here refer to as a “flatima” and corresponds to where the first derivativeof the intensity profile approaches, but don’t necessary reach, zero. Setting a fixeddistance for the tolerance of how close to zero the first derivative need to reach inorder to define a flatima, is not feasible, since the variation of the first derivative candiffer greatly between distributions (Fig. 3.11B). Instead, we define the toleranceinterval as relative to the standard deviation of first derivative, more precisely as
𝑡𝑜𝑙 = (1 + 𝑠𝑑)1/5 − 1where 𝑠𝑑 refers to the standard deviation of the first derivative of the intensity profile.
85

In addition, we disregard flatimas within one standard deviation of the peak from thenegative pixel distribution to avoid that the threshold is put on regions soon after amaxima where the rate of change is also low.
As should be clear from the presentation by now, these are empirically derived def-initions, but they allow us to consistently define thresholds between experimentsand plates, instead of risking the inclusion of errors from variation in human per-formance when setting thresholds. The exponent in the tolerance formula and themaximas’ proximity distance can be tweaked to suitable values depending on theprotein expression profiles, fluorophore intensities, and laser configuration. It shouldbe noted that we tried several well establish image thresholding and clustering meth-ods before developing our own approach, including Otsu thresholding, Li (entropy)based thresholding, Yen thresholding, Gaussian mixture models, Bayesian Gaussianmixture models, and K-means clustering. None of these performed as well for ourparticular purpose as the method we developed.
In addition to using the intensity threshold for defining pixel phenotypes, it will alsoimpact the location of the center of mass each phenotype region. This is becauseonly positive pixels are considered when calculating the center of mass to reduce theeffect of background staining which would otherwise pull all centers artificially closerto the colony centroid (Fig. 3.11C).
86

A B
C
Figure 3.11: Semi-automatic intensity thresholding A) The graphical user interfaceof the thresholding widget. B) A kernel density estimate for a pixel intensity distribution(blue curve and underlying histogram) with high (top) and low (bottom) variation in thefirst dierivate of the profile (orange curve). The grey horizontal band denotes the tolerancelevel around zero, and the dotted grey line is where the threshold is set, which is where thefirst derivative is inside the tolerance level (the orange curve touches the grey band). Theleft y-axis show the count of pixels, the right y-axis show the change in the first derivative,and the x-axis show the normalized intensity values. C) A colony intensity image with(left) and without (right) background staining. In both images, the magenta-colored dotrepresents the center of mass for only the positive pixels (calculated from the intensityimage to the right) whereas the cyan dot represents the center of mass when backgroundstaining is included (calculated from the intensity image to the left).
87

After defining appropriate thresholds, several colony metrics are calculated, includingshape properties such as area, aspect ratio (elongation), solidity, and circularity whichallows us to stratify colonies by shape in assays where this is of interest. We plan toadd calculation of these characteristics also for the positive pixel areas in the future.For the pixel intensities, we calculate the center of mass for positive pixel regions, anduse subtract background staining from images so that these can be overlaid togetherin heatmaps of average intensity expression for multiple colonies in the same condition(as in Fig. 3.1D). The distance between the center of mass for different markers canthen be used to determine its offset from the colony centroid, which is a measure ofthe degree of asymmetrical expression in the colony.
To interactively work with the data and all these metrics, we use the same widgetand plotting strategy as after the colony identification (Fig. 3.12A). Importantly,multiple plotting panels for different measures can be shown simultaneously and byselecting cells in one plotting panel, they will be highlighted in the other panels aswell, showing how a population of cells score for several different metrics in the sameview. If a categorical variable (such as treatment condition) is used to color theplots, trend lines can be added using scatterplot smoothing (LOWESS) that helpdistinguish the overall pattern between conditions. When not comparing two contin-uous variable, the plotting interface allows for up to three levels of nested categoricalvariables on the x-axis, which facilitates comparisons between multiple variables overcreating separate plots for different categories and the trying to compare betweenplots. To create the most representative visual semantics and allow for the mostaccurate comparison of colonies between conditions, we developed a variation of scat-ter plots where points are laid out according to the kernel density distribution of allpoints in the same group. The shape of this distribution is analogous to a violin plot,but does not have the drawbacks of masking the number of observations, and makingsmall distributions appear unnaturally smooth. In comparison to a swarm/hive plot,our modification has the advantages of avoiding issues with binning based on markersize (similar to a KDE curve versus a histogram), not having to deal with saturationonce the plot grows too wide, performing better for big datasets, and being based ona commonly used statistical property. The minimal appearance of this plot with justthe points allows for the easy addition of population statistics as graphical annota-tion without making the plot too busy. The framework currently allows the addition
88

of a measure of central tendency such as the mean or median, together with a 95%confidence interval using bootstrapping with replacement. 95 % confidence intervalsare convenient tools to approximate the chance by which observations might haveappeared by chance as non-overlapping intervals indicate a p-value of around 0.01and those overlapping by 25% of their total length indicate a p-value around 0.05.This rough indication of statistical significance also promotes a sound mental modelwhich deemphasize the reliance of reaching exactly p<0.05.
4k
8k
4k
8k
4k
8k
4k
8k
4k
8k
4k
8k
8k
16k
8k
16k
2d 2d 2d 2d 2d 2d 2d 2d
100 200 300 400 500 600 700 800
0
0.1
0.2
0.3
0.4
Bra
+ s
ox2-
pro
po
rtio
n
Figure 3.12: Visualization of colony metrics. Graphical interface for the visualizationof colony metrics. Several x and y variables can be plotted simultaneously in multiple plots,and plot asthetics can also be controlled from the widget.
3.4 DiscussionSpatial organization of cell fates in micropatterns has been reported since 2014, butso far micropatterning studies have focused on symmetrical induction of cell fatesin annular or disk-shaped segments, whereas studies of non-adherent cell aggregates
89

have reported asymmetrical localization of these fates to one pole of the colony. Ithas been suggested that adherent colonies cannot undergo such polarized inductionof cell fates and will always differentiate symmetrically with the posterior cell fatesfacing outwards and the interior once inwards (when the induction media containsposteriorizing morphogens). However, whether micropatterns can undergo polarizedfate inductions has not been investigated in detail, so it is also possible that a suit-able combination of input parameters is yet to be found. Notably, while it has beenreported that the number of cells is critical for the successful aggregation and po-larization of non-adherent aggregates, the impact of simultaneous modifications topattern size and cell density have not been investigated in adherent systems. Herewe demonstrate that by exploring these two parameters in combination, we observespatial organization of cell fates ranging from uniform Bra expression, to Bra andSox2 expression at opposite ends of the colony, to uniform expression of Sox2.
It should be noted that non-annular cell fate organization in micropatterns has beenobserved previously, including as intermixed individual cells in 250 um hPSC coloniesat specific concentrations of ligands stimulating posterior gastrulation fates (Tewaryet al. 2017), as mixed small compact regions of cells of the same fate in 80 um -140 um mouse EpiLCs colonies differentiated with WNT and BMP (Morgani et al.2018), as incomplete annular segments in 200 um hPSCs colonies differentiated to-wards ectoderm fates (Xie et al. 2020), and as compact localized populations in 240um diameter elliptical micropatterns of mPSCs maintained in LS (Blin et al. 2018).However, these studies did not focus on exploring to which extend this cell fate orga-nization recapitulates what has been reported for non-adherent aggregates, and didtherefore not investigate experimental conditions that would support robust polar-ized organization of the Bra and Sox2 expressing domains. Our study builds uponthis previous work by increasing our understanding for how these input parametercan be tuned to reproducibly give rise to polarized expression of Bra and Sox2.
3.4.1 System size as a control parameter for polarization
Several mechanisms have been proposed to play a role in the formation of the symmet-rical spatial organization of cell fates in micropatterns including an interplay betweendiffusing activators and inhibitors (Etoc et al. 2016, Tewary et al. 2017, Warmflashet al. 2014), basolateral receptor localization and tight junctions between cells in an
90

epithelial layer (Etoc et al. 2016), mechanical forces (Blin et al. 2018), and oscil-latory Turing patterns from differential activator and inhibitor diffusivities (Tewaryet al. 2017, 2019). Mechanical forces have been suggested to regulate patterningof neuroectoderm fates in micropatterned hPSCs (Xue et al. 2018) and to predictthe locus of Bra expression in symmetry-breaking non-adherent aggregates of mPSCs(Sagy et al. 2019). However, studies have also reported spot-like expression in largemicro-patterned colonies going through neural differentiation (Tewary et al. 2019)and the re-occurrence of the edge phenotype in the colony center during ectodermdifferentiation (Xie et al. 2020). Repeating fate patterns suggest a role for signaloscillations, which have previously been proposed to organize cell fates as spots insidevery large (3000 um) colonies at high ligand concentrations (Tewary et al. 2017), akinto what one would expect from an oscillatory mechanisms with a period shorter thanthe colony diameter. Our observations of cell fates that organize in a polarized geom-etry, rather than a concentric edge-to-center progression, adds to the growing bodyof evidence suggesting that complex combinatorial mechanisms regulate fate patternsrather than only simple mechanical or chemical gradients, since these alone are notable to explain repeating patterns or switching between polarized and concentric fatepatterning in colonies of symmetrical geometries.
Specifically, the polarized patterns we report here point to the ability of the system’ssize and density to change the system properties in a manner that allows for non-symmetrical distribution of cell fates. Similar to how very large colonies have beensuggested to disrupt annular fate organization by fitting multiple signal oscillationswithin the system size, very small colonies might interfere with symmetrical annularpatterning through a mismatch of system size and the length scale of the morphogenconcentration gradient, such that the signal oscillation period is longer than the sizeof the system. Suggestively, smaller colonies might not provide sufficient space tocentrally stabilize the expression patterns given the length scales over which thesignalling molecules act, so that small initial offsets in fate regions can be magnifiedover time. Asymmetrically positioned cell fates provide asymmetrically distributedligand sources and sinks and their differential interaction with the inducing ligandsin the bulk effectively establishes asymmetrical conditions in the colony that couldfurther perpetuate any initial offset. In a system which is unable to stabilize fatescentrosymmetrically, there needs not be an active mechanism initiating the offset that
91

leads to polarization, which instead could originate from uncontrolled fluctuations,similar to how distal visceral endoderm cells are pushed off the distal tip of theembryo through cell division forces originating as the posterior side of the embryo(Antonica et al. 2019), or how a chemical system can lose symmetry due to statisticalfluctuations creating instabilities that are allowed to grow (Turing 1952).
Precisely which colony sizes are permissive to polarized fate organization has not beeninvestigated in detail, but the threshold appears to be close to 200 um in diameter forboth mouse and human as symmetrical fate induction has previously been reporteddown to 250 um colonies of hPSCs (Tewary et al. 2017) and 225 um colonies formPSCs (Morgani et al. 2018), but not seen in colonies of 140 um for mouse (Mor-gani et al. 2018). Intriguingly, these length scales are close to size of the mouseepiblast in vivo, which grows from around 200 um just before the onset of gastrula-tion at E5.5-E6, to about 800 um at the end of gastrulation at E7-E7.5 (Morgani etal. 2018). The length of the epiblast is in this case measured from its anterioproxi-mal end, around the distal tip of the cup-shaped embryo, to the posterior-proximalend of the epiblast. While the cup-shaped geometry of the mouse embryo entailsthat molecules diffusing inside the amniotic cavity can reach cells via shorter pathsthan traversing the curvature of the epiblast (which would posit that even shorterlength scales are more developmentally relevant), a recent in vivo study showed thatmouse epiblast cells localize their receptors for diffusing BMP4 ligands basolaterallytowards the cavity between the epiblast and the visceral endoderm and block sig-nalling molecules from penetrating the epiblast via the formation of an epitheliallayer linked via apically located tight junctions (Zhang et al. 2019), similar to whatwas previously reported for micropatterned hPSCs (Etoc et al. 2016). These findingsdemonstrate that BMP-ligands do indeed diffuse across the curved lumen betweenthe epiblast and the visceral endoderm, and thus the measured lengths of this regionis the developmentally relevant distance over which morphogens similar to BMP4act.
Further support for system size as a critical symmetry breaking parameter canbe found in recent studies presenting the theoretical foundations for how reaction-diffusion driven symmetry breaking could be coupled to developmental milestonesusing system size as a control mechanism and therefore suggesting that critical a sys-tem size range are unique in allowing for system polarization (Cornwall Scoones et al.
92
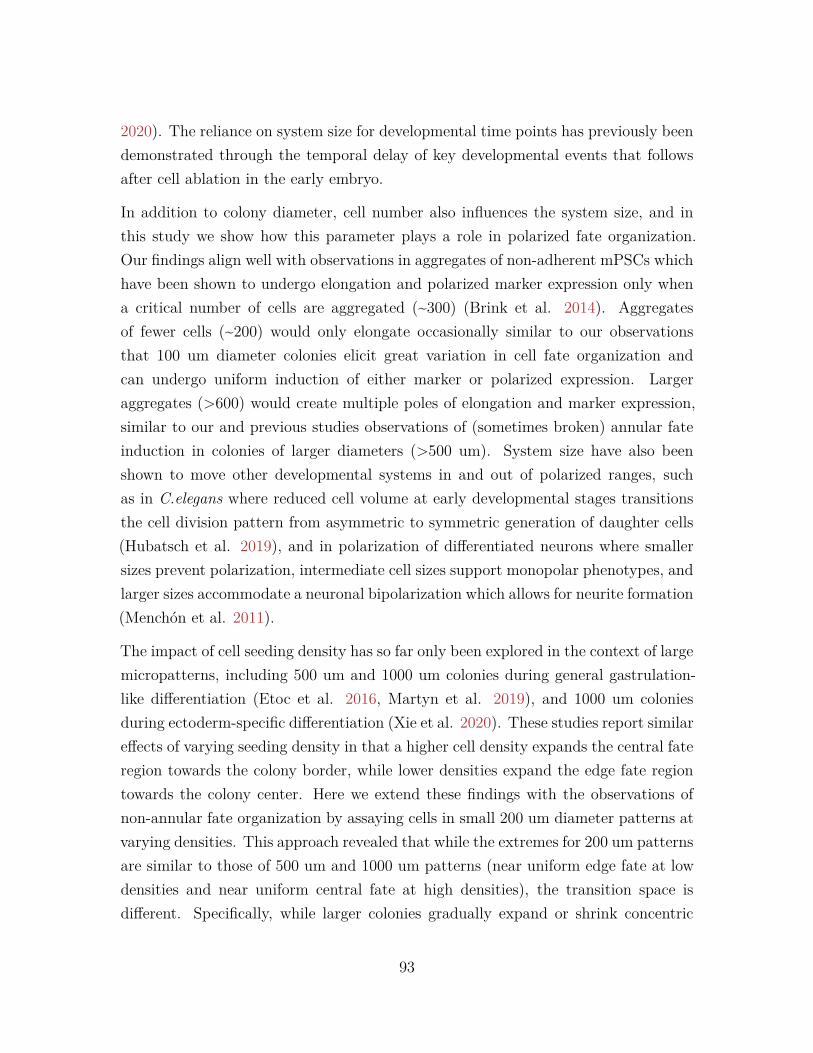
2020). The reliance on system size for developmental time points has previously beendemonstrated through the temporal delay of key developmental events that followsafter cell ablation in the early embryo.
In addition to colony diameter, cell number also influences the system size, and inthis study we show how this parameter plays a role in polarized fate organization.Our findings align well with observations in aggregates of non-adherent mPSCs whichhave been shown to undergo elongation and polarized marker expression only whena critical number of cells are aggregated (~300) (Brink et al. 2014). Aggregatesof fewer cells (~200) would only elongate occasionally similar to our observationsthat 100 um diameter colonies elicit great variation in cell fate organization andcan undergo uniform induction of either marker or polarized expression. Largeraggregates (>600) would create multiple poles of elongation and marker expression,similar to our and previous studies observations of (sometimes broken) annular fateinduction in colonies of larger diameters (>500 um). System size have also beenshown to move other developmental systems in and out of polarized ranges, suchas in C.elegans where reduced cell volume at early developmental stages transitionsthe cell division pattern from asymmetric to symmetric generation of daughter cells(Hubatsch et al. 2019), and in polarization of differentiated neurons where smallersizes prevent polarization, intermediate cell sizes support monopolar phenotypes, andlarger sizes accommodate a neuronal bipolarization which allows for neurite formation(Menchón et al. 2011).
The impact of cell seeding density has so far only been explored in the context of largemicropatterns, including 500 um and 1000 um colonies during general gastrulation-like differentiation (Etoc et al. 2016, Martyn et al. 2019), and 1000 um coloniesduring ectoderm-specific differentiation (Xie et al. 2020). These studies report similareffects of varying seeding density in that a higher cell density expands the central fateregion towards the colony border, while lower densities expand the edge fate regiontowards the colony center. Here we extend these findings with the observations ofnon-annular fate organization by assaying cells in small 200 um diameter patterns atvarying densities. This approach revealed that while the extremes for 200 um patternsare similar to those of 500 um and 1000 um patterns (near uniform edge fate at lowdensities and near uniform central fate at high densities), the transition space isdifferent. Specifically, while larger colonies gradually expand or shrink concentric
93

fate regions we observe the off-center localization of these regions at the right seedingdensities, and the fate organization resembles an inner disc and outer ring patternonly at high densities when the central fate region occupies most of the colony.
3.4.2 Pre-existing spatial organization
An additional consideration for spatial fate organization after differentiation is therole of initial heterogeneities affecting endpoint organization. Pre-organization beforedifferentiation has been reported for hPSCs in 1000 um colonies, and is apparentlyinduced by the colony boundaries already before induction media is added (Etoc etal. 2016). As it is symmetrically distributed, it is difficult to disentangle its effectfrom the effect of the symmetrically distributed However, recent studies applied flowover colonies showed that the signals in the media were capable of overriding anypre-existing organization and colonies differentiated with edge fates the closest to theligand source rather than all around according to the pre-existing organization andthe region of the outer fates is also not always confined to the narrow region of thepre-organized edge cells (Manfrin et al. 2019). In polarized colonies, the role forpre-existing organization is not yet fully uncovered. Previous literature suggest thatpreexisting heterogeneities and cell density govern organization of Bra+ regions inelliptical patterns, suggesting a possible effect of heterogeneous seeding conditions onfinal patterns (Blin et al. 2018).
Here, we removed the possibility of heterogeneous seeding populations contributing tothe polarized cell fate patterning by growing cells in a homogeneous culture conditions.Therefore, the origins of polarized expression must occur either during the priming ordifferentiation. Our efforts to elucidate this by priming cells solely on micropatternshave so far been inconclusive due to the technical challenges in allowing for a sufficientpriming period after colonies reach confluency while differentiating them at densitiesmatched with the seeding densities of colonies with polarized cell fate organization. Ineither case this points to the capability of populations of uniform cell fates to developpolarized cell fate organization as they differentiate, either from a naive pluripotentto a primed pluripotent state, or from a primed pluripotent to a primitive streaklike fate. While there is variation in cell fate organization between colonies withinthe same well, suggesting that the initial seeding cell attachment might play a rolein this process, (especially as the variation is the greatest in the smallest patterns
94

where uncontrolled variation in the number of cells that adhere per colony wouldhave the greatest proportional impact), this variation is dominated by variation ininput parameters such as cell seeding density, pattern size, and ligand concentration.
In summary, we have employed a comprehensive query of relevant system input pa-rameters which revealed a critical role for system size, both in terms of colony diam-eter and cell seeding density, in transitioning adherent systems between parameterspaces supporting either suggesting complex combinatorial mechanisms regulatingspatial fate organization in differentiation PSCs, and adds to our understanding ofhow biological systems can break symmetry.
95

Chapter 4
Conclusions and future directions
4.1 Summary of resultsThe research on gastrulation-like in vitro systems experienced two significant advancesin 2014 with the discovery of cell fate organization in a spatially polarized manner innon-adherent hPSC aggregates and as concentric annular segments in micropatternshPSC colonies (Brink et al. 2014, Warmflash et al. 2014), building upon previousreports of polarized expression patterns for PSC and EC aggregates (Berge et al. 2008,Marikawa et al. 2009), and the recent developments of micropatterning platforms(Bauwens et al. 2008, Peerani et al. 2007, Sakai et al. 2011) Since then, numerouspapers have been published which further describe the behavior of these systems andprovide mechanisms and models to explain the underlying processes directing theobserved spatial cell fate organization. Here we contribute to this rapidly growingbody of literature, by providing insight into how adherent systems can elicit polarizedfate organization, and which system parameters governs this process. This workalso advances the means through which we quantify microscopy data of cell colonies,by providing simple to use analytical frameworks, which complement representativeimages in both analysis and communication of imaging data.
Chapter 2 describes a software package for quantifying spatially heterogeneousmarker expression from single cell data derived from microscopy images. Spatiallyheterogeneous factors assert differential effects on cells at different positionswithin colonies so that these experience varying degrees of influence from such
96

environmental cues. In vitro assays often do not allow control over environmentalvariables and there is a lack of easy to use software to investigate the effect of spatialvariation in these factors. Our software package addresses this gap and facilitatethe quantification of spatially heterogeneous cell responses. It accurately identifiescolonies of cells within a well and individual cells can be grouped according totheir position within these colonies, which enables quantification of cell responseas a function of cellular location. To support broad scientific accessibility, thefull functionality of the software is available through a graphical user interface.Using this software to analyze data from a screening-optimized micropatterningplatform, we show that human pluripotent stem cell-derived colonies grown eitherunder pluripotency maintenance or differentiation-inducing conditions exhibit cellresponses that are dependent on spatial organization. This technology shouldenable more accurate and predictive context-dependent drug screening and cell-fateinvestigation.
Chapter 3 advances our understanding of how cell fates are organized spatially aspopulations of cells exit pluripotency. Specifically, we show that when differenti-ating micropatterned mouse EpiLCs towards posterior gastrulation-like fates, theEpiLC colonies organize cell fates either symmetrically or in a polarized manner, de-pendent on the size of the system. System size can be tuned via two parameters:the diameter of the micropatterned region and the cell seeding density, and by sys-tematically searching combinations of these parameters, we identify a critical rangeof colony diameters and seeding densities where cell fates do not organize in annularsegments, challenging the predominant view that adherent systems cannot undergopolarized cell fate patterning. Importantly, to efficiently search for conditions sup-porting pluripotency, we adapted a previously developed high-throughput protocolfor micropatterning 96-well plates using UV-light. We complemented this experi-mental assay with the development of an analytical framework for analysis of cellcolonies directly from microscopy images without the need to first extract single celldata, which can be error prone for very dense colonies. This analytical framework,was implemented as a set of widgets in a open programming environment, combiningthe strengths of graphical user interfaces and programming-based software to increaseaccessibility for scientists without computational training while enabling more expe-rienced analysts to perform powerful customized computations.
97

4.2 ImpactCell behavior is influenced by cues that cells receive from their surrounding environ-ment such as signals secreted from other cells and cell-to-cell contact. These factorsare spatially heterogeneous and cells at different positions within a population willthus experience varying degrees of influence from such environmental cues. Appre-ciation of the importance of spatially heterogeneous signalling niches and efficientways to interrogate their impact on cell fate decisions is paramount both for ourunderstanding of developmental processes where cells organize according to local sig-nalling niches created from spatially varying morphogen gradients, to advance theboundaries of many regenerative medical therapies where understanding interactionsbetween individuals in tissue populations is necessary to create complex tissues invitro, for generating selected cell types at high specificity, and for correctly interpret-ing results from any biological assay with varying spatial contexts within and betweentreatment groups which could confound outputs if not controlled for, and contributeto low reproducibility between large, costly screening assays.
We contribute to these areas through our findings of how developmental-like in vitrosystems use size-based mechanisms to distribute fates either symmetrically or in apolarized manner, and through our development and distribution of analytical toolsto facilitate and standardize the analysis of spatially organized population level phe-notypes. Together with our previously developed high-throughput micropatterningassay, we provide a powerful platform to swiftly and robustly measure and analyseorganization of cell fate. The observation that also adherent systems can break sym-metry also has beneficial practical implications for researchers as adherent systems areideal for automated imaging on standard microscopy setups, without requiring lightsheet-capable instruments and custom built fluidics platforms for high-throughputimaging. Being able to study polarization of cell fate organization in both adherentand non-adherent systems will allow researchers to draw on the strengths of bothsystems, ranging from more intricate aggregate models including multiple embryonicand extraembryonic cell types to create the most developmental-like environment pos-sible in vitro, to geometrically and phenotypically simpler adherent systems whichallows greater ability to study separate processes in isolation. Together, these plat-forms constitute a powerful framework that can enable us to reach a new level ofinsight into how cell fate is acquired and organized in cell populations.
98

4.3 LimitationsIn these studies, we have presented data from maximum intensity projections ofmicropatterned colonies and focused on the organization of cell fate in the xy-plane,without discussing the impact of cells’ location along the z-axis. Previous studies haveshown that cells at different depth in colonies can acquire different cell fates as theyare induced to differentiate, where cells that have migratory EMT-like phenotypes arefound in the bottom layer, closest to the glass slide (Morgani et al. 2018, Tewary et al.2017, Warmflash et al. 2014). There are at least two inherent obstacles to studyingthe effect of z-depth in high-throughput assays, the first and most important is thatall colonies will not have their bottom cell layer imaged in the same z-slice, whichmeans manual intervention would be required to align and relabel z-stacks relative toeach colony. This is partly due to curvature of the glass bottom of the 96-well plate,which we tried to resolve by modelling the curvature of the glass via the imagingsoftware, but we found that the assigned focus points did still not capture coloniesat the same z-plane throughout the entire plate, so we switched to autofocusing onevery field which rendered the most robust results, but even with this time consumingmethod the bottom layer of all colonies was not observed in the same slice of the z-stack, possibly due to slight variation in ECM deposition around the plate. Thesecond hurdle is that careful interrogation of the effect of depth would require thatthe resolution along the z-axis approached the xy-resolution, which necessitates aninhibitory large number of z-slices to be acquired in terms of completing imaging of96-well plates in less than several days. It is possible that hardware advances, ormachine learning reconstruction solutions, will make this a viable approach in thefuture, but here we chose to focus on the high throughput aspect of the platformwhile ensuring that we still recorded information from all z-planes when imaging,enabling for future investigation of the same of the dataset when there are softwareapproaches addresses the problems outlines above.
The z-slices that we did collect, were captured over a range of around 30-35 um, whichcovered the height (z-axis extent) of colonies in all diameters and densities tested. In-dividual measurements of colonies during during imaging indicate that small andlarge colonies have similar height of around 25-30 um (a few cell layers) when seededat medium - high densities. Cell seeding density had a more notable effect on colonyheight than the colony diameter and cells at lower seeding densities would appear no-
99

tably flatter (sometimes as a monolayer) than colonies seeded at the higher densities.As the height was relatively constant for varying colony diameters, smaller diametercolonies was bulkier with a higher height to width ratio, which is more similar tothe geometries of the non-adherent cell aggregates previously reported to break sym-metry. Indeed, such bulky morphologies have been suggested to explain previouslyobserved asymmetrical fate organization in small micropatterns (Morgani et al. 2018)by being more amenable to morphological unevenness which could mediate the sym-metry breaking process. This would be an important mechanisms to study furthersince uneven morphology is a readily available fluctuating mechanisms for biologicalsystems via small geometric perturbations that regularly occur as cells divide thatcould be leveraged to initiate the marker expression offset from the colony centroid,which can then be propagated and stabilized as a polarized pattern, through themechanisms discussed in chapter 3.
Due to practical challenges in acquiring depth data in high-throughput, we decidednot to extend the analytical capabilities in this direction, so while z-stacks currentlycan be analyzed as separate image batches there is not any functionality to work withthem directly as different z-locations of the same xy-field. The analytical platformhas also not yet been extended to work with live imaging data, which is why the liveimaging data in chapter 3 is presented as representative frames without quantifiedmetrics, but this is something we plan to add in the future. In the live imaging ex-periments, we also chose to work with a tried and tested single reporter line, insteadof creating a new line which could have included constructs for several proteins ofinterest. For future studies, the use of further genetically engineered cell lines wouldincrease the information derived from the live imaging experiments. Similarly, inchapter 3 we chose to focus on two markers with well-known expression patternsboth in vivo and in vitro. As previous mouse micropatterning studies have shown,this limits the precision with which we can narrow down an exact phenotype foreach of these regions (Morgani et al. 2018), but was a suitable choice to interrogatethe polarization capabilities of micropatterned colonies in high-throughput. Futurestudies could extend our investigation in this area, and by using software-based spec-tral unmixing and/or more flexible wavelength gating, it should be possible to queryaround 6-7 markers simultaneously. Selection of narrow band fluorophores and pri-mary or DNA-oligo conjugated antibody panels could increase this number above 10
100

simultaneously interrogated proteins locations, increasing the information density ofthe platform several-fold.
4.4 Future directions
4.4.1 Elucidating the impact of input population heterogene-ity
As the research into gastrulation-like in vitro systems is experiencing a growth spurt,there are many intriguing avenues that are currently being explored by groups aroundthe world, including how patterning could scale to different system sizes, speciesdifferences, capability of further developmental progression, and the role of maternaltissues in directing cell fate organization and morphogenesis. Importantly, the impactof initial heterogeneities on cell fate organization is still incompletely understood, andcould prove to be an important piece of understanding how patterning is initiated.Previously, it has been suggested that sorting of already heterogeneous populationscould play an important role in polarized fate organization since mPSCs that showmixed expression of the marker Bra, will organize cells high in this marker to theregions of lowest cell density in elliptical patterns (Blin et al. 2018).
In our studies, we also observe Bra expression in mPSCs grown in LS, but eliminatethe possibility of this being the driver of later cell fate organization by growing mPSCsin NB2iL during culture which maintains cells in a near uniformly high expressionstate for pluripotency markers. However, we did not eliminate the possibility thatheterogeneities which arose during the priming stage would be differentially localizedwhen primed cells were seeded on micropatterns. It seems unlikely that this is aprincipal contributing mechanism to polarized expression since colonies of large sizeswould be exposed to the same heterogeneous seeding population, but it is possiblethat it could influence cell fate organization by acting in tandem with size dependentmechanisms that could stabilize the expression concentrically in larger colonies butnot smaller as discussed in chapter three. It would be interesting to investigate therole of priming heterogeneities by exploring if there is spatial cell fate acquisitionduring priming of NB2iL mPSCs on micropatterns and staining for the loss of naivemarkers, such as Klf4 and Nanog and the gain of primed markers such as Oct6
101

and Otx2. Another approach to investigate this phenomena would be to identifyconditions that creates stable homogeneous populations of EpiLCs through the use ofsmall molecule inhibitors which diffuse freely and cannot be regulated by cells throughinhibition or receptor re-localization. Here there is an opportunity to use networkmodelling approaches to identify suitable pathways to target as such approaches havepreviously been successful in predicting transition between mPSC and EpiSC states(Yachie-Kinoshita et al. 2018).
4.4.2 Understanding spatially organized cell migration prop-erties
Whether cells are seeded as a heterogeneous or homogeneous population, they willbe exposed to systematically heterogeneous niches as they populate the micropat-terned colonies. For example, some cells will sit along the edges of colonies and havefew neighbors while others occupy areas in the middle surrounded by neighboringcells. Such inside versus outside localization has a known role during early embry-onic development where it determines whether cells at the 8-16 cell stage becometrophectoderm or inner cells mass through the modulations of cell polarity (as de-scribed in the introductory section The 8 - 32 cells stage). It has also been shownthat hPSCs on the outside of micropatterned colonies have a flatter morphology, api-cal BMP-receptor localization (Etoc et al. 2016), lower E-CADHERIN expression(Martyn et al. 2019), and higher levels of pluripotency markers before differentiation(Warmflash et al. 2014). It seems like the inducing external ligands dominate thisedge versus inside pre-patterning as high concentrations of ligands (or small colonysizes) induce the same cell fate in cells inside the outer edge (Tewary et al. 2017,Warmflash et al. 2014) and a localized ligand source induce the primitive streak likecell fate only in cells close to the ligand source rather than all around the colony(Manfrin et al. 2019). However, there are still several aspects that would be in-teresting to pursue regarding this pre-patterned edge fate including whether thesecells are migratory and if so, how their migration trajectory is shaped, whether thephenotype is induced by an edge sensing mechanism based on paracrine signalling,cell-to-cell contact, or mechanical properties, and exactly what impact asymmetricaldistribution of such niches have on cell fate organization.
To explore whether these outside cells possess enhanced cell migration properties,
102

it would be instructive to allow them to expand beyond an initial confined regionafter they reach confluency. This could involve a two-step ECM deposition protocol,which functionalizes areas between colonies as a second step, or a degradable cell-phobic substrate that dissolves or is degraded by the cells after a tunable period.A more mechanical solution, would include using robotics to carefully seed cells inmedia micro-droplets on ECM coated material, and expand droplets as colonies grow.Another, mechanically simpler, approach involves using micro-tubes on standardstissue culture plates and once cells are confluent these tubes could be removed andcells allowed to expand.
A similar method to the micro-tubes confine-and-release strategy was recently appliedto the confinement of hPSCs in very large circular colonies of 3 mm diameter, with thehelp of 3D-printed guides through which cells are seeded onto the substrate (Muncieet al. 2020). This study revealed that Bra+ cells on the outside of colonies do indeedmigrate when releaased from their confinement, but it remains inconclusive whetherthis was a direct effect of the edge conditions or another mechanisms such as sorting ofexisting heterogeneities. Earlier studies have proposed that the migratory propertiesof cells can be directly affected by the reduced number of cell-to-cell interactions, since𝛽-catenin can bind adherence junctions together with E-cadherin, and with less suchjunctions, there will be more free 𝛽-catenin for WNT pathway activation (Martynet al. 2019, Przybyla et al. 2016). These mechanisms do not explain why polarizednon-adherent aggregates mainly elongate in one region rather than at all locationsof similar cell-to-cell interactions. Although edge conditions are different in non-adherent colonies compared to micropatterned adherent colonies, cells at the surfacestill experience less cell-to-cell contact than cells in the inner regions, which arguablywould lead to increase WNT signalling evenly around the surface of the colony. Toincrease our understanding for how edge conditions affect both Bra expression andcell migrations it would be highly informative to investigate how cell migration occursin polarized micropatterns, and if edge conditions differ between the Bra-expressingand Sox2-expressing poles of the colony (e.g. in terms of their cadherin expressionand traction forces).
103

4.4.3 Investigating the role of substrate properties on cellfate determination
In addition to relieving confinement constraints, the substrate’s stiffness also appearsto play a key role in the migratory properties (Muncie et al. 2020) and it would be keyto investigate its role in migration for polarized colonies. Further, the chemical com-position of the ECM differs between studies, and has so far incuded laminin-purified(Morgani et al. 2018) and non-purified sarcoma-secretions (Tewary et al. 2017, Warm-flash et al. 2014), laminin-521 (Deglincerti et al. 2016, Etoc et al. 2016), collagen IV(Smith et al. 2018), gelatin (Blin et al. 2018), vitronectin (Xie et al. 2020), and herefibronectin mixed in gelatin. Although substrate composition is known to affect cellphenotype, sometimes drastically (Domogatskaya et al. 2009, Rodin et al. 2014), nostudy has systematically investigated the impact of these different substrates in thecontext of micropatterning and cell fate organization, and thus ECM compositionsremains a potential confounding factor between current studies.
Basal membrane signalling is important for several key developmental mechanismsand is integral to create embryo-like structures in vitro, either as externally providedECM or secreted by cells (Harrison et al. 2017, Simunovic et al. 2019, Sozen etal. 2018). In addition, it was recently revealed that the mechanical properties ofthe basement membrane are actively remodeled by the embryo through increasedperforations created by matrix metalloproteinases which facilitate embryo growth(Kyprianou et al. 2020). This process is tightly linked to gastrulation signals suchas Nodal and the localization of these morphogens during gastrulation concentratesbasal membrane perforations to the posterior side of the embryo allowing for theextension of the primitive streak as the first Bra+ cells emanate from this area duringgastrulation (Kyprianou et al. 2020). Adherent in vitro assays have demonstratedhow to leverage some of the instructive characteristics of basement membranes whileretaining the practical advantages of adherent cell assays through the addition ofa top layer of ECM which allows adherent cells to acquire 3D morphology whilestill being fixed in a single plane (Lee et al. 2007). These ECM sandwhich assaysprovide yet another tool to tease apart similarities and difference between adherentand non-adherent cultures and could provide an important “in-between” system wheninvestigating gastrulation-like polarization in vitro. In our initial attempts towardsestablishing such an assay, we tried adding Matrigel on top of fibronectin coated pates,
104

and observed localization of Bra expression to one pole of several colonies. However,colonies underwent substantial morphogenesis during these conditions and were moresusceptible to dislodging from the plate during washing and staining so it has beendifficult to develop a robust high-throughput platform with automated imaging usingthis technique.
4.4.4 Exploring three dimensional substrate geometries
More elaborate changes to colony geometries would involve construction of 3D shapessimilar to those found in the body during this time of gastrulation. In vitro embryo-like platforms have demonstrated morphologies resembling those formed in vivo in-cluding changes in shape and size over time, but require the aggregation of differentembryonic cell types (Harrison et al. 2017, Sozen et al. 2018). To complement thispowerful technique, and disentangle the role of morphological changes from othermechanisms governing cell fate acquisitions, it would be instructive to develop plat-forms with static geometric scaffolds (similar to how micropatterns allow us to peekinto mechanisms that are hard to interrogate non-adherent cell aggregates). 3D print-ing approaches are already used to create such scaffolds at the macro-scale, usingmaterials such as biocompatible plastics onto which cells are seeded and can acquireregionalized phenotypes. With increases in the resolution of 3D-printers, it is possi-ble that much of this knowledge can be transfered to the microscale where it wouldenable a new angle from which to investigate the role of differential embryo morphol-ogy in the development of the respective organisms. Of special interest would be toelucidate the impact of the cup-shaped rodent embryo on fate acquisition and spatialfate organization as this morphology differs from the disk-shaped epiblast found inhumans (and other model organisms such as rabbits and chicks), and our understand-ing of how to map information from mouse development to the human embryo is stillincomplete. One could hypothesize that these geometrical differences are not criticalto gastrulation itself, since both adherent and non-adherent in vitro platforms showsimilar spatial fate organization in mouse and human cells when these are inducedto differentiate in the same geometries.
Excitingly, a recent study observes a mechanism that limits the diffusion of ligandsduring gastrulation to progress over an essentially flat surface through the narrowinterstitial space between the epiblast and the visceral endoderm regardless of the
105
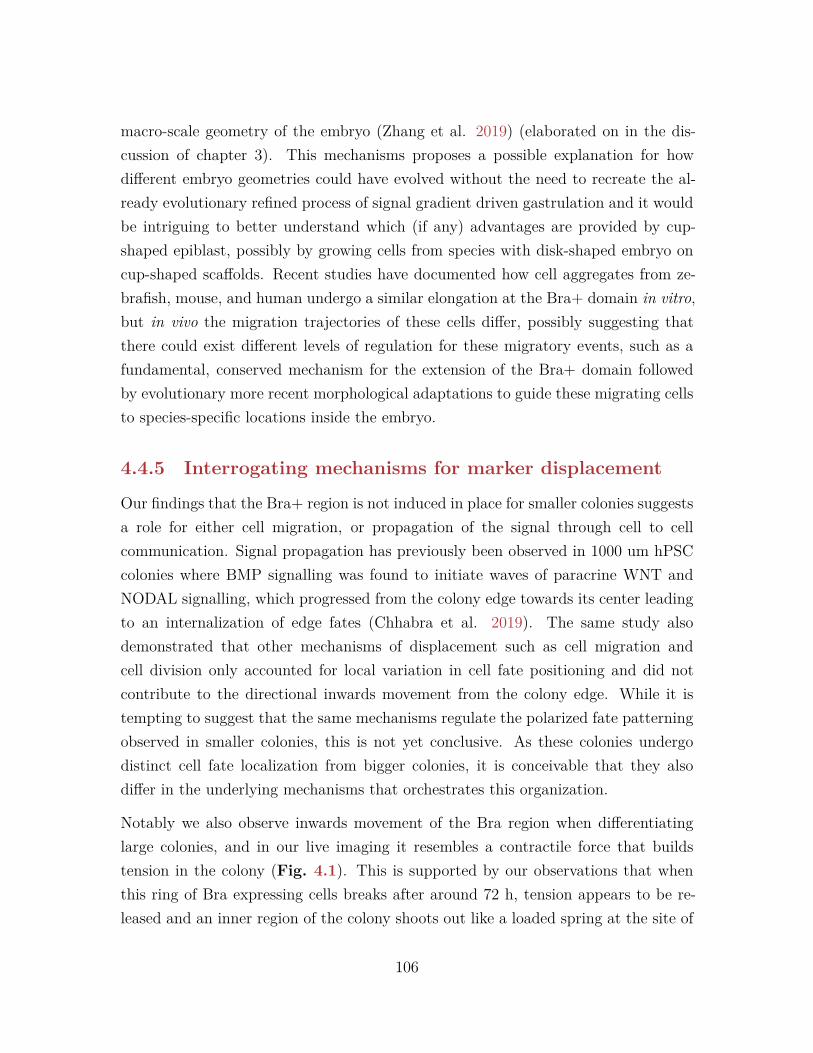
macro-scale geometry of the embryo (Zhang et al. 2019) (elaborated on in the dis-cussion of chapter 3). This mechanisms proposes a possible explanation for howdifferent embryo geometries could have evolved without the need to recreate the al-ready evolutionary refined process of signal gradient driven gastrulation and it wouldbe intriguing to better understand which (if any) advantages are provided by cup-shaped epiblast, possibly by growing cells from species with disk-shaped embryo oncup-shaped scaffolds. Recent studies have documented how cell aggregates from ze-brafish, mouse, and human undergo a similar elongation at the Bra+ domain in vitro,but in vivo the migration trajectories of these cells differ, possibly suggesting thatthere could exist different levels of regulation for these migratory events, such as afundamental, conserved mechanism for the extension of the Bra+ domain followedby evolutionary more recent morphological adaptations to guide these migrating cellsto species-specific locations inside the embryo.
4.4.5 Interrogating mechanisms for marker displacement
Our findings that the Bra+ region is not induced in place for smaller colonies suggestsa role for either cell migration, or propagation of the signal through cell to cellcommunication. Signal propagation has previously been observed in 1000 um hPSCcolonies where BMP signalling was found to initiate waves of paracrine WNT andNODAL signalling, which progressed from the colony edge towards its center leadingto an internalization of edge fates (Chhabra et al. 2019). The same study alsodemonstrated that other mechanisms of displacement such as cell migration andcell division only accounted for local variation in cell fate positioning and did notcontribute to the directional inwards movement from the colony edge. While it istempting to suggest that the same mechanisms regulate the polarized fate patterningobserved in smaller colonies, this is not yet conclusive. As these colonies undergodistinct cell fate localization from bigger colonies, it is conceivable that they alsodiffer in the underlying mechanisms that orchestrates this organization.
Notably we also observe inwards movement of the Bra region when differentiatinglarge colonies, and in our live imaging it resembles a contractile force that buildstension in the colony (Fig. 4.1). This is supported by our observations that whenthis ring of Bra expressing cells breaks after around 72 h, tension appears to be re-leased and an inner region of the colony shoots out like a loaded spring at the site of
106
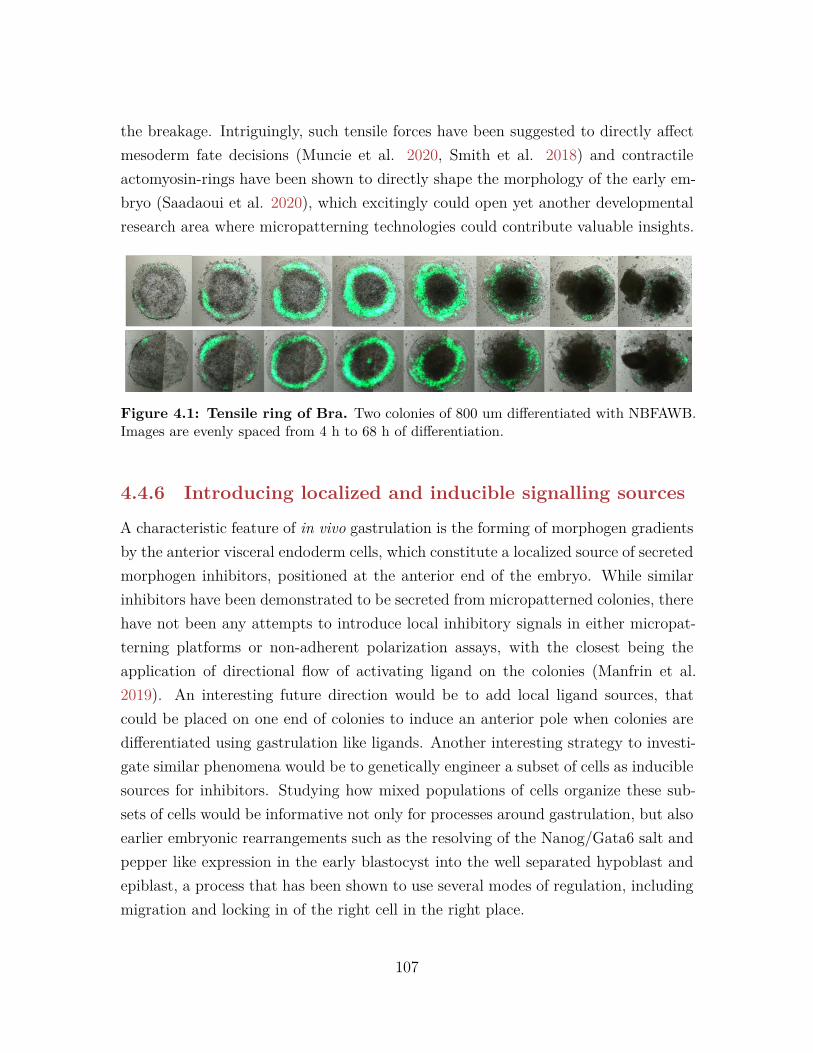
the breakage. Intriguingly, such tensile forces have been suggested to directly affectmesoderm fate decisions (Muncie et al. 2020, Smith et al. 2018) and contractileactomyosin-rings have been shown to directly shape the morphology of the early em-bryo (Saadaoui et al. 2020), which excitingly could open yet another developmentalresearch area where micropatterning technologies could contribute valuable insights.
Figure 4.1: Tensile ring of Bra. Two colonies of 800 um differentiated with NBFAWB.Images are evenly spaced from 4 h to 68 h of differentiation.
4.4.6 Introducing localized and inducible signalling sources
A characteristic feature of in vivo gastrulation is the forming of morphogen gradientsby the anterior visceral endoderm cells, which constitute a localized source of secretedmorphogen inhibitors, positioned at the anterior end of the embryo. While similarinhibitors have been demonstrated to be secreted from micropatterned colonies, therehave not been any attempts to introduce local inhibitory signals in either micropat-terning platforms or non-adherent polarization assays, with the closest being theapplication of directional flow of activating ligand on the colonies (Manfrin et al.2019). An interesting future direction would be to add local ligand sources, thatcould be placed on one end of colonies to induce an anterior pole when colonies aredifferentiated using gastrulation like ligands. Another interesting strategy to investi-gate similar phenomena would be to genetically engineer a subset of cells as induciblesources for inhibitors. Studying how mixed populations of cells organize these sub-sets of cells would be informative not only for processes around gastrulation, but alsoearlier embryonic rearrangements such as the resolving of the Nanog/Gata6 salt andpepper like expression in the early blastocyst into the well separated hypoblast andepiblast, a process that has been shown to use several modes of regulation, includingmigration and locking in of the right cell in the right place.
107

Using genetic engineering, we could also explore how plastic cell rearrangements arethrough inducible circuits depending on current cell fates, for example switching theexpression domains of Bra and Sox2 through an inducible element that is conditionalon the current cell expression to study if and how cells rearrange the original spatialfate organization (similar to how subsets of transcriptionally distinct cells can createtranscriptionally heterogeneous populations) or find a new stable spatial configura-tion. Beyond using synthetic biology to understand developmental biology, geneticengineering could also be used to replace the need for specific niches by directly tar-geting the genes that are normally induced by a niche, circumventing the need forsignalling from the environment. In the development of such platforms, a deeper un-derstanding for how cells make niche-specific decisions is needed and platforms sucha micropatterning assays are likely to play a key role.
4.4.7 Studying signalling dynamics in entire cell populations
To fully understand how morphogen gradients influence cell fate patterning, oneneeds to measure both the gradient, the location of the pathway activation, as wellas the cell response. Querying the production sites of the activating ligands canbe done via fluorescent in situ hybridization using complementary RNA probes forthe transcripts of interests. While this does not account for post-transcriptionalprocessing of RNA, it is a well established technique that can be used for bothligands and their inhibitors with known RNA sequences. Importantly, this wouldallow for more accurate construction of models of morphogen dynamics, which inturn would generate more informative insights. Extending this technique to probenot only selected morphogen transcripts but thousands of transcripts for morphogens,inhibitors, transcription factors, and more in a non-targeted fashion can be achievedvia the adoption of fluorescence in situ sequencing techniques where the fluorescentlylabeled single nucleotide tags are hybridized to fixed tissue and imaged to reconstructnucleic acid sequences in situ. This approach carries similar advantages as othernon-targeted single-cell sequencing in that it is able to cover a much wider arrayof transcripts than targeted approaches and allows for the discovery of unexpectedrelationships that would not have been queried in hand-picked panels.
Approaching the final frontier, not only in the context of spatial fate organization, isthe simultaneous recording of spatial location and transcriptome or proteome-wide
108

single cell states over time. Advanced DNA recording devices are being built for thispurpose where the cells’ own DNA is used to store information about its transcrip-tional state by incorporating a subset of transcribed RNA-molecules into regions ofthe DNA that are not expressed or otherwise interfering with the normal functionof the cell. These can later be sequenced to receive information about in which or-der transcripts were being expressed by the cell. If cells containing such a recordingsystem are being live imaged with their individual cell trajectories traced using celltracking software, and spatially barcoded at the final timepoint (using spatially bar-coded grids such as those used for spatial transcriptomics), it would be possible toaccount for a cell’s entire transcriptional history together with the location of thecell in the dish at each point in time. While many technical challenges remain inthe construction of these platforms it is beyond doubt that they would constitutea system of unprecedented resolving power in the interrogation of spatial cell fateorganization that could yield outcomes that are currently previously only availablein researchers imaginations. One example of such an outcome would be the ability tocomputationally reconstruct live imaging videos on demand for any of thousands ofindividual markers per experiment, and create intricate, clustered marker migrationmaps that would otherwise take decades of reporter line generation to even comeclose too.
109

References
.Akopian, V., Andrews, P.W., Beil, S., Benvenisty, N., Brehm, J., Christie, M., Ford, A., Fox, V.,
Gokhale, P.J., Healy, L., et al. (2010). Comparison of defined culture systems for feeder cell freepropagation of human embryonic stem cells. In Vitro Cellular & Developmental Biology - Animal46, 247–258.
Altschuler, S.J., and Wu, L.F. (2010). Cellular Heterogeneity: Do Differences Make a Difference?Cell 141, 559–563.
Ankerst, M., Breunig, M.M., Kriegel, H.-p., and Sander, J. (1999). OPTICS: Ordering Points ToIdentify the Clustering Structure. (ACM Press), pp. 49–60.
Antonica, F., Orietti, L.C., Mort, R.L., and Zernicka-Goetz, M. (2019). Concerted cell divisions inembryonic visceral endoderm guide anterior visceral endoderm migration. Developmental Biology.
Avilion, A.A., Nicolis, S.K., Pevny, L.H., Perez, L., Vivian, N., and Lovell-Badge, R. (2003). Multi-potent cell lineages in early mouse development depend on SOX2 function. Genes & Development17, 126–140.
Azioune, A., Storch, M., Bornens, M., Théry, M., and Piel, M. (2009). Simple and rapid process forsingle cell micro-patterning. Lab on a Chip 9, 1640–1642.
Barretina, J., Caponigro, G., Stransky, N., Venkatesan, K., Margolin, A.A., Kim, S., Wilson, C.J.,Lehár, J., Kryukov, G.V., Sonkin, D., et al. (2012). The Cancer Cell Line Encyclopedia enablespredictive modelling of anticancer drug sensitivity. Nature 483, 603–607.
Bauer, M., Kim, K., Qiu, Y., Calpe, B., Khademhosseini, A., Liao, R., and Wheeldon, I. (2012).Spot Identification and Quality Control in Cell-Based Microarrays. ACS Combinatorial Science14, 471–477.
Bauwens, C.L., Peerani, R., Niebruegge, S., Woodhouse, K.A., Kumacheva, E., Husain, M., andZandstra, P.W. (2008). Control of Human Embryonic Stem Cell Colony and Aggregate SizeHeterogeneity Influences Differentiation Trajectories. Stem Cells 26, 2300–2310.
Beccari, L., Moris, N., Girgin, M., Turner, D.A., Baillie-Johnson, P., Cossy, A.-C., Lutolf, M.P.,Duboule, D., and Arias, A.M. (2018). Multi-axial self-organization properties of mouse embryonicstem cells into gastruloids. Nature 562, 272–276.
Becker, A.J., McCulloch, E.A., and Till, J.E. (1963). Cytological Demonstration of the ClonalNature of Spleen Colonies Derived from Transplanted Mouse Marrow Cells. Nature 197, 452–454.
Bednar, J.A., Collins, B., Crail, J., Crist-Harif, J., Rudiger, P., Brener, G., B, C., Mease, J., Signell,J., Stevens, J.-L., et al. (2020). Holoviz/datashader: Version 0.11.0 (Zenodo).
110

Bedzhov, I., Graham, S.J.L., Leung, C.Y., and Zernicka-Goetz, M. (2014). Developmental plasticity,cell fate specification and morphogenesis in the early mouse embryo. Philosophical Transactionsof the Royal Society of London B: Biological Sciences 369, 20130538.
Belia, S., Fidler, F., Williams, J., and Cumming, G. (2005). Researchers Misunderstand ConfidenceIntervals and Standard Error Bars. Psychological Methods 10, 389–396.
Ben-Haim, N., Lu, C., Guzman-Ayala, M., Pescatore, L., Mesnard, D., Bischofberger, M., Naef, F.,Robertson, E.J., and Constam, D.B. (2006). The Nodal Precursor Acting via Activin ReceptorsInduces Mesoderm by Maintaining a Source of Its Convertases and BMP4. Developmental Cell11, 313–323.
Berge, D. ten, Koole, W., Fuerer, C., Fish, M., Eroglu, E., and Nusse, R. (2008). Wnt SignalingMediates Self-Organization and Axis Formation in Embryoid Bodies. Cell Stem Cell 3, 508–518.
Besser, D. (2004). Expression of Nodal, Lefty-A, and Lefty-B in Undifferentiated Human EmbryonicStem Cells Requires Activation of Smad2/3. Journal of Biological Chemistry 279, 45076–45084.
Bin, G.C.L., Muñoz-Descalzo, S., Kurowski, A., Leitch, H., Lou, X., Mansfield, W., Etienne-Dumeau, C., Grabole, N., Mulas, C., Niwa, H., et al. (2014). Oct4 is required for lineagepriming in the developing inner cell mass of the mouse blastocyst. Development 141, 1001–1010.
Blin, G., Wisniewski, D., Picart, C., Thery, M., Puceat, M., and Lowell, S. (2018). Geometricalconfinement controls the asymmetric patterning of brachyury in cultures of pluripotent cells.Development 145.
Bokeh Development Team (2020). Bokeh: Python library for interactive visualization.
Boroviak, T., Loos, R., Bertone, P., Smith, A., and Nichols, J. (2014). The ability of inner-cell-masscells to self-renew as embryonic stem cells is acquired following epiblast specification. Nature CellBiology 16, 513–525.
Boroviak, T., Loos, R., Lombard, P., Okahara, J., Behr, R., Sasaki, E., Nichols, J., Smith, A., andBertone, P. (2015). Lineage-Specific Profiling Delineates the Emergence and Progression of NaivePluripotency in Mammalian Embryogenesis. Developmental Cell 35, 366–382.
Brennan, J., Lu, C.C., Norris, D.P., Rodriguez, T.A., Beddington, R.S.P., and Robertson, E.J.(2001). Nodal signalling in the epiblast patterns the early mouse embryo. Nature 411, 965–969.
Briggs, R., and King, T.J. (1952). Transplantation of living nuclei from blastula cells into enucleatedfrogs’ eggs. Proceedings of the National Academy of Sciences 38, 455–463.
Brink, S.C. van den, Baillie-Johnson, P., Balayo, T., Hadjantonakis, A.-K., Nowotschin, S., Turner,D.A., and Arias, A.M. (2014). Symmetry breaking, germ layer specification and axial organisationin aggregates of mouse embryonic stem cells. Development 141, 4231–4242.
Brinster, R.L. (1974). The effect of cells transferred into the mouse blastocyst on subsequentdevelopment. Journal of Experimental Medicine 140, 1049–1056.
Briscoe, J., and Small, S. (2015). Morphogen rules: Design principles of gradient-mediated embryopatterning. Development 142, 3996–4009.
Brons, I.G.M., Smithers, L.E., Trotter, M.W.B., Rugg-Gunn, P., Sun, B., Chuva de Sousa Lopes,S.M., Howlett, S.K., Clarkson, A., Ahrlund-Richter, L., Pedersen, R.A., et al. (2007). Derivationof pluripotent epiblast stem cells from mammalian embryos. Nature 448, 191–195.
111

Brook, F.A., and Gardner, R.L. (1997). The origin and efficient derivation of embryonic stem cellsin the mouse. Proceedings of the National Academy of Sciences of the United States of America94, 5709–5712.
Brusca, R.C., Moore, W., and Shuster, S.M. (2016). Invertebrates (Sunderland, MassachusettsU.S.A: Sinauer Associates, Inc., Publishers).
Burton, A., Muller, J., Tu, S., Padilla-Longoria, P., Guccione, E., and Torres-Padilla, M.-E. (2013).Single-Cell Profiling of Epigenetic Modifiers Identifies PRDM14 as an Inducer of Cell Fate in theMammalian Embryo. Cell Reports 5, 687–701.
Caicedo, J.C., Cooper, S., Heigwer, F., Warchal, S., Qiu, P., Molnar, C., Vasilevich, A.S., Barry,J.D., Bansal, H.S., Kraus, O., et al. (2017). Data-analysis strategies for image-based cell profiling.Nature Methods 14, 849–863.
Canham, M.A., Sharov, A.A., Ko, M.S.H., and Brickman, J.M. (2010). Functional Heterogeneityof Embryonic Stem Cells Revealed through Translational Amplification of an Early EndodermalTranscript. PLoS Biol 8, e1000379.
Carpenter, A.E., Jones, T.R., Lamprecht, M.R., Clarke, C., Kang, I.H., Friman, O., Guertin, D.A.,Chang, J.H., Lindquist, R.A., Moffat, J., et al. (2006). CellProfiler: Image analysis software foridentifying and quantifying cell phenotypes. Genome Biology 7, R100.
Chazaud, C., Yamanaka, Y., Pawson, T., and Rossant, J. (2006). Early Lineage Segregation be-tween Epiblast and Primitive Endoderm in Mouse Blastocysts through the Grb2-MAPK Pathway.Developmental Cell 10, 615–624.
Chhabra, S., Liu, L., Goh, R., Kong, X., and Warmflash, A. (2019). Dissecting the dynamics ofsignaling events in the BMP, WNT, and NODAL cascade during self-organized fate patterning inhuman gastruloids. PLOS Biology 17, e3000498.
Child, C.M. (1941). Patterns and problems of development (Oxford, England: Univ. ChicagoPress).
Conquet, F., Peyriéras, N., Tiret, L., and Brûlet, P. (1992). Inhibited gastrulation in mouse embryosoverexpressing the leukemia inhibitory factor. Proceedings of the National Academy of Sciences89, 8195–8199.
Cornwall Scoones, J., Banerjee, D.S., and Banerjee, S. (2020). Size-Regulated Symmetry Breakingin Reaction-Diffusion Models of Developmental Transitions. Cells 9, 1646.
Cumming, G. (2009). Inference by eye: Reading the overlap of independent confidence intervals.Statistics in Medicine 28, 205–220.
Dahéron, L., Opitz, S.L., Zaehres, H., Lensch, W.M., Andrews, P.W., Itskovitz-Eldor, J., and Daley,G.Q. (2004). LIF/STAT3 Signaling Fails to Maintain Self-Renewal of Human Embryonic StemCells. STEM CELLS 22, 770–778.
Davey, R.E., and Zandstra, P.W. (2006). Spatial Organization of Embryonic Stem Cell Responsive-ness to Autocrine Gp130 Ligands Reveals an Autoregulatory Stem Cell Niche. STEM CELLS 24,2538–2548.
Deglincerti, A., Etoc, F., Guerra, M.C., Martyn, I., Metzger, J., Ruzo, A., Simunovic, M., Yoney,A., Brivanlou, A.H., Siggia, E., et al. (2016). Self-organization of human embryonic stem cells onmicropatterns. Nature Protocols 11, 2223–2232.
112

Di-Gregorio, A., Sancho, M., Stuckey, D.W., Crompton, L.A., Godwin, J., Mishina, Y., and Ro-driguez, T.A. (2007). BMP signalling inhibits premature neural differentiation in the mouseembryo. Development 134, 3359–3369.
Domogatskaya, A., Rodin, S., Boutaud, A., and Tryggvason, K. (2009). Laminin-511 but Not -332,-111, or -411 Enables Mouse Embryonic Stem Cell Self-Renewal In Vitro. STEM CELLS 26,2800–2809.
Ehrlich, P. (1879). Arch. Anat. U. Physiol 3, 571–579.
Eliceiri, K.W., Berthold, M.R., Goldberg, I.G., Ibáñez, L., Manjunath, B.S., Martone, M.E., Mur-phy, R.F., Peng, H., Plant, A.L., Roysam, B., et al. (2012). Biological imaging software tools.Nature Methods 9, 697–710.
Enders, A.C., and King, B.F. (1988). Formation and differentiation of extraembryonic mesodermin the rhesus monkey. American Journal of Anatomy 181, 327–340.
Ester, M., Kriegel, H.-p., S, J., and Xu, X. (1996). A density-based algorithm for discovering clustersin large spatial databases with noise. (AAAI Press), pp. 226–231.
Etoc, F., Metzger, J., Ruzo, A., Kirst, C., Yoney, A., Ozair, M.Z., Brivanlou, A.H., and Siggia,E.D. (2016). A Balance between Secreted Inhibitors and Edge Sensing Controls Gastruloid Self-Organization. Developmental Cell.
Evans, M.J. (1972). The isolation and properties of a clonal tissue culture strain of pluripotentmouse teratoma cells. Development 28, 163–176.
Evans, M.J., and Kaufman, M.H. (1981). Establishment in culture of pluripotential cells from mouseembryos. Nature 292, 154–156.
Evans, M.J., Notarianni, E., Laurie, S., and Moor, R.M. (1990). Derivation and preliminary char-acterization of pluripotent cell lines from porcine and bovine blastocysts. Theriogenology 33,125–128.
Fehling, H.J., Lacaud, G., Kubo, A., Kennedy, M., Robertson, S., Keller, G., and Kouskoff, V. (2003).Tracking mesoderm induction and its specification to the hemangioblast during embryonic stemcell differentiation. Development 130, 4217–4227.
Fink, J., Théry, M., Azioune, A., Dupont, R., Chatelain, F., Bornens, M., and Piel, M. (2007).Comparative study and improvement of current cell micro-patterning techniques. Lab on a Chip7, 672–680.
Finnerty, J.R., Pang, K., Burton, P., Paulson, D., and Martindale, M.Q. (2004). Origins of BilateralSymmetry: Hox and Dpp Expression in a Sea Anemone. Science 304, 1335–1337.
Folch, A., Jo, B.-H., Hurtado, O., Beebe, D.J., and Toner, M. (2000). Microfabricated elastomericstencils for micropatterning cell cultures. Journal of Biomedical Materials Research 52, 346–353.
Gardner, R.L. (2001). Specification of embryonic axes begins before cleavage in normal mouse.Development 128, 839–847.
Gardner, R.L., and Brook, F.A. (1997). Reflections on the biology of embryonic stem (ES) cells.International Journal of Developmental Biology 41, 235–243.
Garnett, M.J., Edelman, E.J., Heidorn, S.J., Greenman, C.D., Dastur, A., Lau, K.W., Greninger, P.,Thompson, I.R., Luo, X., Soares, J., et al. (2012). Systematic identification of genomic markersof drug sensitivity in cancer cells. Nature 483, 570–575.
113

Gearing, D.P., Gough, N.M., King, J.A., Hilton, D.J., Nicola, N.A., Simpson, R.J., Nice, E.C.,Kelso, A., and Metcalf, D. (1987). Molecular cloning and expression of cDNA encoding a murinemyeloid leukaemia inhibitory factor (LIF). The EMBO Journal 6, 3995–4002.
Gillies, S., and others (2007). Shapely: Manipulation and analysis of geometric objects (tobler-ity.org).
Gladden, A.B., Hebert, A.M., Schneeberger, E.E., and McClatchey, A.I. (2010). The NF2 TumorSuppressor, Merlin, Regulates Epidermal Development through the Establishment of a JunctionalPolarity Complex. Developmental Cell 19, 727–739.
Gorman, B.R., Lu, J., Baccei, A., Lowry, N.C., Purvis, J.E., Mangoubi, R.S., and Lerou, P.H.(2014). Multi-Scale Imaging and Informatics Pipeline for In Situ Pluripotent Stem Cell Analysis.PLoS ONE 9, e116037.
Graf, T., and Stadtfeld, M. (2008). Heterogeneity of Embryonic and Adult Stem Cells. Cell StemCell 3, 480–483.
Graves, K.H., and Moreadith, R.W. (1993). Derivation and characterization of putative pluripo-tential embryonic stem cells from preimplantation rabbit embryos. Molecular Reproduction andDevelopment 36, 424–433.
Green, J.B.A., and Sharpe, J. (2015). Positional information and reaction-diffusion: Two big ideasin developmental biology combine. Development 142, 1203–1211.
Guo, G., Yang, J., Nichols, J., Hall, J.S., Eyres, I., Mansfield, W., and Smith, A. (2009). Klf4reverts developmentally programmed restriction of ground state pluripotency. Development 136,1063–1069.
Gurdon, J.B. (1962). The Developmental Capacity of Nuclei taken from Intestinal Epithelium Cellsof Feeding Tadpoles. Development 10, 622–640.
Häcker, V. (1892). Archiv F. Mikr. Anat. 39, 556–581.
Haeckel, E. (1868). Naturliche Schopfungsgeschichte (Berlin: Georg Reimer).
Haeckel, E. (1877). Anthropogenie, 3rd edn (Leipzig:Wilhelm Engelmann).
Haibe-Kains, B., El-Hachem, N., Birkbak, N.J., Jin, A.C., Beck, A.H., Aerts, H.J.W.L., and Quack-enbush, J. (2013). Inconsistency in large pharmacogenomic studies. Nature 504, 389–393.
Haney, S.A., Guey, L., and Chakravarty, A. (2014). Analyzing Cell-Level Data - An Introductionto High Content Screening. An Introduction to High Content Screening: Imaging Technology,Assay Development, and Data Analysis in Biology and Drug Discovery 145.
Harrison, S.E., Sozen, B., Christodoulou, N., Kyprianou, C., and Zernicka-Goetz, M. (2017). As-sembly of embryonic and extraembryonic stem cells to mimic embryogenesis in vitro. Science 356,eaal1810.
Hayashi, K., Kobayashi, T., Umino, T., Goitsuka, R., Matsui, Y., and Kitamura, D. (2002). SMAD1signaling is critical for initial commitment of germ cell lineage from mouse epiblast. Mechanismsof Development 118, 99–109.
Hayashi, K., Lopes, S.M.C. de S., Tang, F., and Surani, M.A. (2008). Dynamic Equilibrium andHeterogeneity of Mouse Pluripotent Stem Cells with Distinct Functional and Epigenetic States.Cell Stem Cell 3, 391–401.
114

Hayashi, K., Ohta, H., Kurimoto, K., Aramaki, S., and Saitou, M. (2011). Reconstitution of theMouse Germ Cell Specification Pathway in Culture by Pluripotent Stem Cells. Cell 146, 519–532.
Head, M.L., Holman, L., Lanfear, R., Kahn, A.T., and Jennions, M.D. (2015). The Extent andConsequences of P-Hacking in Science. PLOS Biology 13, e1002106.
Heemskerk, I., Burt, K., Miller, M., Chhabra, S., Guerra, M.C., Liu, L., and Warmflash, A. (2019).Rapid changes in morphogen concentration control self-organized patterning in human embryonicstem cells. eLife 8, e40526.
Herberg, M., Glauche, I., Zerjatke, T., Winzi, M., Buchholz, F., and Roeder, I. (2016). Dissect-ing mechanisms of mouse embryonic stem cells heterogeneity through a model-based analysis oftranscription factor dynamics. Journal of the Royal Society Interface 13, 20160167.
Hogan, B., and Tilly, R. (1978). In vitro development of inner cell masses isolated immunosurgicallyfrom mouse blastocysts. II. Inner cell masses from 3.5- to 4.0-day p.c. Blastocysts. Journal ofEmbryology and Experimental Morphology 45, 107–121.
Huang, S. (2009). Non-genetic heterogeneity of cells in development: More than just noise. Devel-opment 136, 3853–3862.
Hubatsch, L., Peglion, F., Reich, J.D., Rodrigues, N.T., Hirani, N., Illukkumbura, R., and Goehring,N.W. (2019). A cell size threshold limits cell polarity and asymmetric division potential. NaturePhysics 15, 1075–1085.
Humphrey, R.K., Beattie, G.M., Lopez, A.D., Bucay, N., King, C.C., Firpo, M.T., Rose-John, S.,and Hayek, A. (2004). Maintenance of Pluripotency in Human Embryonic Stem Cells Is STAT3Independent. STEM CELLS 22, 522–530.
Hunter, J.D. (2007). Matplotlib: A 2D Graphics Environment. Computing in Science & Engineering9, 90–95.
Joblib Development Team (2020). Joblib: Running Python functions as pipeline jobs.
Jones, E., Oliphant, T., Peterson, P., and others (2001). SciPy: Open source scientific tools forPython.
Jones, T.R., Kang, I.H., Wheeler, D.B., Lindquist, R.A., Papallo, A., Sabatini, D.M., Golland, P.,and Carpenter, A.E. (2008). CellProfiler Analyst: Data exploration and analysis software forcomplex image-based screens. BMC Bioinformatics 9, 482.
Jong, D. de, Koster, A., Hagenbeek, A., Raemaekers, J., Veldhuizen, D., Heisterkamp, S., Boer,J.P. de, and Glabbeke, M. van (2009). Impact of the tumor microenvironment on prognosis infollicular lymphoma is dependent on specific treatment protocols. Haematologica 94, 70–77.
Kahan, B.W., and Ephrussi, B. (1970). Developmental Potentialities of Clonal In Vitro Cultures ofMouse Testicular Teratoma. JNCI: Journal of the National Cancer Institute 44, 1015–1036.
Kang, M., Piliszek, A., Artus, J., and Hadjantonakis, A.-K. (2013). FGF4 is required for lineagerestriction and salt-and-pepper distribution of primitive endoderm factors but not their initialexpression in the mouse. Development 140, 267–279.
Karami, A., and Johansson, R. (2014). Choosing DBSCAN Parameters Automatically using Differ-ential Evolution. International Journal of Computer Applications 91, 1–11.
Kawase, E., Hashimoto, K., and Nakatsuji, N. (1994). Strain difference in establishment of mouseembryonic stem (ES) cell lines. The International Journal of Developmental Biology 6.
115

Kempf, H., Olmer, R., Haase, A., Franke, A., Bolesani, E., Schwanke, K., Robles-Diaz, D., Coffee,M., Göhring, G., Dräger, G., et al. (2016). Bulk cell density and Wnt/TGFbeta signallingregulate mesendodermal patterning of human pluripotent stem cells. Nature Communications 7,1–13.
Kim, J.-H., Kushiro, K., Graham, N.A., and Asthagiri, A.R. (2009). Tunable interplay betweenepidermal growth factor and cellCell contact governs the spatial dynamics of epithelial growth.Proceedings of the National Academy of Sciences 106, 11149–11153.
Kinder, S.J., Tsang, T.E., Quinlan, G.A., Hadjantonakis, A.K., Nagy, A., and Tam, P.P. (1999). Theorderly allocation of mesodermal cells to the extraembryonic structures and the anteroposterioraxis during gastrulation of the mouse embryo. Development (Cambridge, England) 126, 4691–4701.
Kluyver, T., Ragan-Kelley, B., Pérez, F., Granger, B., Bussonnier, M., Frederic, J., Kelley, K.,Hamrick, J., Grout, J., Corlay, S., et al. (2016). Jupyter Notebooks a publishing format forreproducible computational workflows. In Positioning and Power in Academic Publishing: Players,Agents and Agendas, F. Loizides, and B. Schmidt, eds. (IOS Press), pp. 87–90.
Kojima, Y., Kaufman-Francis, K., Studdert, J.B., Steiner, K.A., Power, M.D., Loebel, D.A.F., Jones,V., Hor, A., de Alencastro, G., Logan, G.J., et al. (2014). The Transcriptional and FunctionalProperties of Mouse Epiblast Stem Cells Resemble the Anterior Primitive Streak. Cell Stem Cell14, 107–120.
Koopman, P., and Cotton, R.G.H. (1984). A factor produced by feeder cells which inhibits embry-onal carcinoma cell differentiation: Characterization and partial purification. Experimental CellResearch 154, 233–242.
Kumar, R., Kuniyasu, H., Bucana, C.D., Wilson, M.R., and Fidler, I.J. (1998). Spatial and temporalexpression of angiogenic molecules during tumor growth and progression. Oncology Research 10,301–311.
Kunath, T., Saba-El-Leil, M.K., Almousailleakh, M., Wray, J., Meloche, S., and Smith, A. (2007).FGF stimulation of the Erk1/2 signalling cascade triggers transition of pluripotent embryonicstem cells from self-renewal to lineage commitment. Development 134, 2895–2902.
Kwon, G.S., Viotti, M., and Hadjantonakis, A.-K. (2008). The Endoderm of the Mouse EmbryoArises by Dynamic Widespread Intercalation of Embryonic and Extraembryonic Lineages. Devel-opmental Cell 15, 509–520.
Kyprianou, C., Christodoulou, N., Hamilton, R.S., Nahaboo, W., Boomgaard, D.S., Amadei, G.,Migeotte, I., and Zernicka-Goetz, M. (2020). Basement membrane remodelling regulates mouseembryogenesis. Nature 582, 253–258.
Lam, S.K., Pitrou, A., and Seibert, S. (2015). Numba: A LLVM-based Python JIT compiler. InProceedings of the Second Workshop on the LLVM Compiler Infrastructure in HPC, (Austin,Texas: Association for Computing Machinery), pp. 1–6.
Lee, G.Y., Kenny, P.A., Lee, E.H., and Bissell, M.J. (2007). Three-dimensional culture models ofnormal and malignant breast epithelial cells. Nature Methods 4, nmeth1015.
Leung, C.Y., and Zernicka-Goetz, M. (2013). Angiomotin prevents pluripotent lineage differenti-ation in mouse embryos via Hippo pathway-dependent and -independent mechanisms. NatureCommunications 4.
116

Liu, L., Michowski, W., Kolodziejczyk, A., and Sicinski, P. (2019). The cell cycle in stem cellproliferation, pluripotency and differentiation. Nature Cell Biology 21, 1060–1067.
Luckett, W.P. (1978). Origin and differentiation of the yolk sac and extraembryonic mesoderm inpresomite human and rhesus monkey embryos. American Journal of Anatomy 152, 59–97.
MacArthur, B.D., and Lemischka, I.R. (2013). Statistical Mechanics of Pluripotency. Cell 154,484–489.
Manfrin, A., Tabata, Y., Paquet, E.R., Vuaridel, A.R., Rivest, F.R., Naef, F., and Lutolf, M.P.(2019). Engineered signaling centers for the spatially controlled patterning of human pluripotentstem cells. Nature Methods 16, 640–648.
Marikawa, Y., Tamashiro, D.A.A., Fujita, T.C., and Alarcón, V.B. (2009). Aggregated P19 mouseembryonal carcinoma cells as a simple in vitro model to study the molecular regulations of meso-derm formation and axial elongation morphogenesis. Genesis 47, 93–106.
Marks, H., Kalkan, T., Menafra, R., Denissov, S., Jones, K., Hofemeister, H., Nichols, J., Kranz, A.,Francis Stewart, A., Smith, A., et al. (2012). The Transcriptional and Epigenomic Foundationsof Ground State Pluripotency. Cell 149, 590–604.
Martin, G.R. (1981). Isolation of a pluripotent cell line from early mouse embryos cultured inmedium conditioned by teratocarcinoma stem cells. Proceedings of the National Academy ofSciences 78, 7634–7638.
Martyn, I., Brivanlou, A.H., and Siggia, E.D. (2019). A wave of WNT signaling balanced by secretedinhibitors controls primitive streak formation in micropattern colonies of human embryonic stemcells. Development 146.
Matsuda, T., Nakamura, T., Nakao, K., Arai, T., Katsuki, M., Heike, T., and Yokota, T. (1999).STAT3 activation is sufficient to maintain an undifferentiated state of mouse embryonic stem cells.The EMBO Journal 18, 4261–4269.
Mattiazzi Usaj, M., Styles, E.B., Verster, A.J., Friesen, H., Boone, C., and Andrews, B.J. (2016).High-Content Screening for Quantitative Cell Biology. Trends in Cell Biology 26, 598–611.
Maximow, A. (1906). Über experimentelle erzeugung von knochenmarks-gewebe. AnatomischerAnzeiger 28, 24–38.
Maximow, A. (1909). The lymphocyte as a stem cell, common to different blood elements inembryonic development and during the post-fetal life of mammals (Berlin).
McBeath, R., Pirone, D.M., Nelson, C.M., Bhadriraju, K., and Chen, C.S. (2004). Cell Shape,Cytoskeletal Tension, and RhoA Regulate Stem Cell Lineage Commitment. Developmental Cell6, 483–495.
McKinney, W. (2010). Data Structures for Statistical Computing in Python. In Proceedings of the9th Python in Science Conference, S. van der Walt, and J. Millman, eds. pp. 51–56.
McNeill, L. (2018). The History of Breeding Mice for Science Begins With a Woman in a Barn(https://www.smithsonianmag.com/science-nature/history-breeding-mice-science-leads-back-woman-barn-180968441/).
McQuin, C., Goodman, A., Chernyshev, V., Kamentsky, L., Cimini, B.A., Karhohs, K.W., Doan,M., Ding, L., Rafelski, S.M., Thirstrup, D., et al. (2018). CellProfiler 3.0: Next-generation imageprocessing for biology. PLoS Biology 16.
117

Meilhac, S.M., Adams, R.J., Morris, S.A., Danckaert, A., Le Garrec, J.-F., and Zernicka-Goetz, M.(2009). Active cell movements coupled to positional induction are involved in lineage segregationin the mouse blastocyst. Developmental Biology 331, 210–221.
Menchón, S.A., Gärtner, A., Román, P., and Dotti, C.G. (2011). Neuronal (bi)Polarity as a self-organized process enhanced by growing membrane. PloS One 6, e24190.
Misselwitz, B., Strittmatter, G., Periaswamy, B., Schlumberger, M.C., Rout, S., Horvath, P., Kozak,K., and Hardt, W.-D. (2010). Enhanced CellClassifier: A multi-class classification tool for mi-croscopy images. BMC Bioinformatics 11, 30.
Mitsui, K., Tokuzawa, Y., Itoh, H., Segawa, K., Murakami, M., Takahashi, K., Maruyama, M.,Maeda, M., and Yamanaka, S. (2003). The Homeoprotein Nanog Is Required for Maintenance ofPluripotency in Mouse Epiblast and ES Cells. Cell 113, 631–642.
Miura, S., Singh, A.P., and Mishina, Y. (2010). Bmpr1a is required for proper migration of the AVEthrough regulation of Dkk1 expression in the pre-streak mouse embryo. Developmental Biology341, 246–254.
Morgani, S., Nichols, J., and Hadjantonakis, A.-K. (2017). The many faces of Pluripotency: Invitro adaptations of a continuum of in vivo states. BMC Developmental Biology 17, 7.
Morgani, S.M., Metzger, J.J., Nichols, J., Siggia, E.D., and Hadjantonakis, A.-K. (2018). Micropat-tern differentiation of mouse pluripotent stem cells recapitulates embryo regionalized cell fatepatterning. eLife 7, e32839.
Morris, S.A., Graham, S.J.L., Jedrusik, A., and Zernicka-Goetz, M. (2013). The differential re-sponse to Fgf signalling in cells internalized at different times influences lineage segregation inpreimplantation mouse embryos. Open Biology 3, 130104.
Muncie, J.M., Ayad, N.M.E., Lakins, J.N., and Weaver, V.M. (2020). Mechanics regulate humanembryonic stem cell self-organization to specify mesoderm. bioRxiv 2020.02.10.943076.
Nagy, A., Rossant, J., Nagy, R., Abramow-Newerly, W., and Roder, J.C. (1993). Derivation ofcompletely cell culture-derived mice from early-passage embryonic stem cells. Proceedings of theNational Academy of Sciences of the United States of America 90, 8424–8428.
Nazareth, E.J.P., Ostblom, J.E.E., Lücker, P.B., Shukla, S., Alvarez, M.M., Oh, S.K.W., Yin, T.,and Zandstra, P.W. (2013). High-throughput fingerprinting of human pluripotent stem cell fateresponses and lineage bias. Nature Methods 10, 1225–1231.
Nazareth, E.J.P., Rahman, N., Yin, T., and Zandstra, P.W. (2016). A Multi-Lineage Screen RevealsmTORC1 Inhibition Enhances Human Pluripotent Stem Cell Mesendoderm and Blood ProgenitorProduction. Stem Cell Reports 6, 679–691.
Nemashkalo, A., Ruzo, A., Heemskerk, I., and Warmflash, A. (2017). Morphogen and commu-nity effects determine cell fates in response to BMP4 signaling in human embryonic stem cells.Development 144, 3042–3053.
Neumann, E. (1912). Arch. F. Mikrosk. Anatomie Und Entwicklungsgeschichte 207 480–520.
Nichols, J., and Smith, A. (2011). The origin and identity of embryonic stem cells. Development138, 3–8.
Nichols, J., Zevnik, B., Anastassiadis, K., Niwa, H., Klewe-Nebenius, D., Chambers, I., Schöler, H.,and Smith, A. (1998). Formation of Pluripotent Stem Cells in the Mammalian Embryo Dependson the POU Transcription Factor Oct4. Cell 95, 379–391.
118

Niehrs, C. (2010). On growth and form: A Cartesian coordinate system of Wnt and BMP signalingspecifies bilaterian body axes. Development 137, 845–857.
Niwa, H., Toyooka, Y., Shimosato, D., Strumpf, D., Takahashi, K., Yagi, R., and Rossant, J. (2005).Interaction between Oct3/4 and Cdx2 Determines Trophectoderm Differentiation. Cell 123, 917–929.
Norris, D.P., Brennan, J., Bikoff, E.K., and Robertson, E.J. (2002). The Foxh1-dependent autoreg-ulatory enhancer controls the level of Nodal signals in the mouse embryo. Development 129,3455–3468.
Notarianni, E., Galli, C., Laurie, S., Moor, R., and Evans, M. (1991). Derivation of pluripotent,embryonic cell lines from the pig and sheep. Bioscientifica Proceedings.
Nowotschin, S., Hadjantonakis, A.-K., and Campbell, K. (2019). The endoderm: A divergent celllineage with many commonalities. Development 146.
Ohnishi, Y., Huber, W., Tsumura, A., Kang, M., Xenopoulos, P., Kurimoto, K., Oleś, A.K., Araúzo-Bravo, M.J., Saitou, M., Hadjantonakis, A.-K., et al. (2014). Cell-to-cell expression variabilityfollowed by signal reinforcement progressively segregates early mouse lineages. Nature Cell Biology16, 27–37.
Okamura, D., Hayashi, K., and Matsui, Y. (2005). Mouse epiblasts change responsiveness to BMP4signal required for PGC formation through functions of extraembryonic ectoderm. MolecularReproduction and Development 70, 20–29.
Ostblom, J., Nazareth, E.J.P., Tewary, M., and Zandstra, P.W. (2019). Context-explorer: Anal-ysis of spatially organized protein expression in high-throughput screens. PLOS ComputationalBiology 15, e1006384.
Pappenheim, A. (1896). Virchows Arch 145, 587–643.
Pedregosa, F., Varoquaux, G., Gramfort, A., Michel, V., Thirion, B., Grisel, O., Blondel, M.,Prettenhofer, P., Weiss, R., Dubourg, V., et al. (2011). Scikit-learn: Machine Learning inPython. Journal of Machine Learning Research 12, 2825–2830.
Peerani, R., Rao, B.M., Bauwens, C., Yin, T., Wood, G.A., Nagy, A., Kumacheva, E., and Zandstra,P.W. (2007). Niche-mediated control of human embryonic stem cell self-renewal and differentia-tion. The EMBO Journal 26, 4744–4755.
Pelkmans, L. (2012). Using Cell-to-Cell VariabilityA New Era in Molecular Biology. Science 336,425–426.
Pérez, F., and Granger, B.E. (2007). IPython: A system for interactive scientific computing. Com-puting in Science and Engineering 9, 21–29.
Pierce, G.B., Dixon, F.J., and Verney, E. (1959). Testicular teratomas. II. Teratocarcinoma as anascitic tumor. Cancer 12, 584–589.
Piotrowska, K., and Zernicka-Goetz, M. (2001). Role for sperm in spatial patterning of the earlymouse embryo. Nature 409, 517–521.
Piotrowska, K., Wianny, F., Pedersen, R.A., and Zernicka-Goetz, M. (2001). Blastomeres arisingfrom the first cleavage division have distinguishable fates in normal mouse. Development 128,3739–3748.
119

Piotrowska-Nitsche, K., and Zernicka-Goetz, M. (2005). Spatial arrangement of individual 4-cellstage blastomeres and the order in which they are generated correlate with blastocyst pattern inthe mouse embryo. Mechanisms of Development 122, 487–500.
Piotrowska-Nitsche, K., Perea-Gomez, A., Haraguchi, S., and Zernicka-Goetz, M. (2005). Four-cellstage mouse blastomeres have different developmental properties. Development 132, 479–490.
Plachta, N., Bollenbach, T., Pease, S., Fraser, S.E., and Pantazis, P. (2011). Oct4 kinetics predictcell lineage patterning in the early mammalian embryo. Nature Cell Biology 13, 117–123.
Plusa, B., Piliszek, A., Frankenberg, S., Artus, J., and Hadjantonakis, A.-K. (2008). Distinct sequen-tial cell behaviours direct primitive endoderm formation in the mouse blastocyst. Development(Cambridge, England) 135, 3081–3091.
Przybyla, L., Lakins, J.N., and Weaver, V.M. (2016). Tissue Mechanics Orchestrate Wnt-DependentHuman Embryonic Stem Cell Differentiation. Cell Stem Cell 19, 462–475.
Rahman, N., Brauer, P.M., Ho, L., Usenko, T., Tewary, M., Zúñiga-Pflücker, J.C., and Zandstra,P.W. (2017). Engineering the haemogenic niche mitigates endogenous inhibitory signals andcontrols pluripotent stem cell-derived blood emergence. Nature Communications 8.
Raj, A., and van Oudenaarden, A. (2008). Nature, Nurture, or Chance: Stochastic Gene Expressionand Its Consequences. Cell 135, 216–226.
Ralston, A., Cox, B.J., Nishioka, N., Sasaki, H., Chea, E., Rugg-Gunn, P., Guo, G., Robson, P.,Draper, J.S., and Rossant, J. (2010). Gata3 regulates trophoblast development downstream ofTead4 and in parallel to Cdx2. Development 137, 395–403.
Ramalho-Santos, M., and Willenbring, H. (2007). On the Origin of the Term “Stem Cell”. CellStem Cell 1, 35–38.
Rathjen, P.D., Toth, S., Willis, A., Heath, J.K., and Smith, A.G. (1990). Differentiation inhibitingactivity is produced in matrix-associated and diffusible forms that are generated by alternatepromoter usage. Cell 62, 1105–1114.
Reback, J., McKinney, W., Jbrockmendel, Bossche, J.V.D., Augspurger, T., Cloud, P., Gfyoung,Sinhrks, Klein, A., Roeschke, M., et al. (2020). Pandas-dev/pandas: Pandas 1.0.3 (Zenodo).
Rivera-Pérez, J.A., and Magnuson, T. (2005). Primitive streak formation in mice is preceded bylocalized activation of Brachyury and Wnt3. Developmental Biology 288, 363–371.
Robertson, M., Chambers, I., Rathjen, P., Nichols, J., and Smith, A. (1993). Expression of alter-native forms of differentiation inhibiting activity (DIA/LIF) during murine embryogenesis and inneonatal and adult tissues. Developmental Genetics 14, 165–173.
Rodin, S., Antonsson, L., Niaudet, C., Simonson, O.E., Salmela, E., Hansson, E.M., Domogatskaya,A., Xiao, Z., Damdimopoulou, P., Sheikhi, M., et al. (2014). Clonal culturing of human embry-onic stem cells on laminin-521/E-cadherin matrix in defined and xeno-free environment. NatureCommunications 5.
Rosenthal, M.D., Wishnow, R.M., and Sato, G.H. (1970). In Vitro Growth and Differentiationof Clonal Populations of Multipotential Mouse Cells Derived From a Transplantable TesticularTeratocarcinoma. JNCI: Journal of the National Cancer Institute 44, 1001–1014.
Royer, N. AFRMA - The History of Fancy Mice (https://www.afrma.org/historymse.htm).
120

Rudiger, P., XavArtley, Bednar, J.A., B, C., Signell, J., Stevens, J.-L., Liquet, M., Mease, J., Arne,Madsen, M.S., et al. (2020). Holoviz/panel: Version 0.9.6 (Zenodo).
Rudiger, P., Stevens, J.-L., Bednar, J.A., Nijholt, B., Andrew, B, C., Randelhoff, A., Mease, J.,Tenner, V., Maxalbert, et al. (2020). Holoviz/holoviews: Version 1.13.3 (Zenodo).
Rueden, C.T., Ackerman, J., Arena, E.T., Eglinger, J., Cimini, B.A., Goodman, A., Carpenter,A.E., and Eliceiri, K.W. (2019). Scientific Community Image Forum: A discussion forum forscientific image software. PLOS Biology 17, e3000340.
Rui Xu, and Wunsch, D.C. (2010). Clustering Algorithms in Biomedical Research: A Review. IEEEReviews in Biomedical Engineering 3, 120–154.
Ruiz, S.A., and Chen, C.S. (2007). Microcontact printing: A tool to pattern. Soft Matter 3,168–177.
Russ, A.P., Wattler, S., Colledge, W.H., Aparicio, S.A.J.R., Carlton, M.B.L., Pearce, J.J., Barton,S.C., Surani, M.A., Ryan, K., Nehls, M.C., et al. (2000). Eomesodermin is required for mousetrophoblast development and mesoderm formation. Nature 404, 95–99.
Russell, W.L., and Hurst, J.G. (1945). Pure Strain Mice Born to Hybrid Mothers Following OvarianTransplantation. Proceedings of the National Academy of Sciences of the United States of America31, 267–273.
Saadaoui, M., Rocancourt, D., Roussel, J., Corson, F., and Gros, J. (2020). A tensile ring drivestissue flows to shape the gastrulating amniote embryo. Science 367, 453–458.
Sagy, N., Slovin, S., Allalouf, M., Pour, M., Savyon, G., Boxman, J., and Nachman, I. (2019).Prediction and control of symmetry breaking in embryoid bodies by environment and signalintegration. Development 146.
Sakai, Y., Yoshiura, Y., and Nakazawa, K. (2011). Embryoid body culture of mouse embryonicstem cells using microwell and micropatterned chips. Journal of Bioscience and Bioengineering111, 85–91.
Seabold, S., and Perktold, J. (2010). Statsmodels: Econometric and statistical modeling withpython. In 9th Python in Science Conference,
Shi, J., Chen, Q., Li, X., Zheng, X., Zhang, Y., Qiao, J., Tang, F., Tao, Y., Zhou, Q., and Duan,E. (2015). Dynamic transcriptional symmetry-breaking in pre-implantation mammalian embryodevelopment revealed by single-cell RNA-seq. Development 142, 3468–3477.
Shi, W., Wang, H., Pan, G., Geng, Y., Guo, Y., and Pei, D. (2006). Regulation of the PluripotencyMarker Rex-1 by Nanog and Sox2. Journal of Biological Chemistry 281, 23319–23325.
Shimkin, M.B. (1975). A. E. C. Lathrop (1868): Mouse Woman of Granby. Cancer Research 35,1597–1598.
Siminovitch, L., McCulloch, E.A., and Till, J.E. (1963). The distribution of colony-forming cellsamong spleen colonies. Journal of Cellular and Comparative Physiology 62, 327–336.
Simpson, E.M., Linder, C.C., Sargent, E.E., Davisson, M.T., Mobraaten, L.E., and Sharp, J.J.(1997). Genetic variation among 129 substrains and its importance for targeted mutagenesis inmice. Nature Genetics 16, 19–27.
Simunovic, M., Metzger, J.J., Etoc, F., Yoney, A., Ruzo, A., Martyn, I., Croft, G., You, D.S.,Brivanlou, A.H., and Siggia, E.D. (2019). A 3D model of a human epiblast reveals BMP4-driven
121

symmetry breaking. Nature Cell Biology 21, 900–910.
Singer, Z.S., Yong, J., Tischler, J., Hackett, J.A., Altinok, A., Surani, M.A., Cai, L., and Elowitz,M.B. (2014). Dynamic Heterogeneity and DNA Methylation in Embryonic Stem Cells. MolecularCell 55, 319–331.
Skamagki, M., Wicher, K.B., Jedrusik, A., Ganguly, S., and Zernicka-Goetz, M. (2013). AsymmetricLocalization of Cdx2 mRNA during the First Cell-Fate Decision in Early Mouse Development.Cell Reports 3, 442–457.
Smith, A.G., and Hooper, M.L. (1987). Buffalo rat liver cells produce a diffusible activity whichinhibits the differentiation of murine embryonal carcinoma and embryonic stem cells. Develop-mental Biology 121, 1–9.
Smith, T.A., and Hooper, M.L. (1983). Medium conditioned by feeder cells inhibits the differentia-tion of embryonal carcinoma cultures. Experimental Cell Research 145, 458–462.
Smith, A.G., Heath, J.K., Donaldson, D.D., Wong, G.G., Moreau, J., Stahl, M., and Rogers, D.(1988). Inhibition of pluripotential embryonic stem cell differentiation by purified polypeptides.Nature 336, 688–690.
Smith, Q., Rochman, N., Carmo, A.M., Vig, D., Chan, X.Y., Sun, S., and Gerecht, S. (2018). Cy-toskeletal tension regulates mesodermal spatial organization and subsequent vascular fate. Pro-ceedings of the National Academy of Sciences 115, 8167–8172.
Snijder, B., and Pelkmans, L. (2011). Origins of regulated cell-to-cell variability. Nature ReviewsMolecular Cell Biology 12, 119–125.
Snijder, B., Sacher, R., Rämö, P., Damm, E.-M., Liberali, P., and Pelkmans, L. (2009). Populationcontext determines cell-to-cell variability in endocytosis and virus infection. Nature 461, 520–523.
Snijder, B., Sacher, R., Rämö, P., Liberali, P., Mench, K., Wolfrum, N., Burleigh, L., Scott, C.C.,Verheije, M.H., Mercer, J., et al. (2012). Single-cell analysis of population context advances RNAiscreening at multiple levels. Molecular Systems Biology 8, 579.
Sozen, B., Amadei, G., Cox, A., Wang, R., Na, E., Czukiewska, S., Chappell, L., Voet, T., Michel,G., Jing, N., et al. (2018). Self-assembly of embryonic and two extra-embryonic stem cell typesinto gastrulating embryo-like structures. Nature Cell Biology 20, 979–989.
Staats, J. (1976). Standardized Nomenclature for Inbred Strains of Mice: Sixth Listing. CancerResearch 36, 4333–4377.
Stainier, D.Y.R. (2005). No Organ Left Behind: Tales of Gut Development and Evolution. Science307, 1902–1904.
Stavridis, M.P., Lunn, J.S., Collins, B.J., and Storey, K.G. (2007). A discrete period of FGF-inducedErk1/2 signalling is required for vertebrate neural specification. Development 134, 2889–2894.
Stephenson, R.O., Yamanaka, Y., and Rossant, J. (2010). Disorganized epithelial polarity andexcess trophectoderm cell fate in preimplantation embryos lacking E-cadherin. Development 137,3383–3391.
Stevens, L.C. (1959). Embryology of Testicular Teratomas in Strain 129 Mice. JNCI: Journal ofthe National Cancer Institute 23, 1249–1295.
Stevens, L.C., and Little, C.C. (1954). Spontaneous Testicular Teratomas in an Inbred Strain ofMice. Proceedings of the National Academy of Sciences of the United States of America 40,
122

1080–1087.
Stevens, J.-L., B, C., Rudiger, P., Bednar, J.A., Elver, M., Robertson, S., Signell, J., Thomasdeneux,Ossdev07, Bampton, J., et al. (2020). Holoviz/param: Version 1.9.3 (Zenodo).
Stewart, C.L., Kaspar, P., Brunet, L.J., Bhatt, H., Gadi, I., Köntgen, F., and Abbondanzo, S.J.(1992). Blastocyst implantation depends on maternal expression of leukaemia inhibitory factor.Nature 359, 76–79.
Strasak, A.M., Zaman, Q., Marinell, G., Pfeiffer, K.P., and Ulmer, H. (2007). The Use of Statisticsin Medical Research. The American Statistician 61, 47–55.
Sukoyan, M.A., Golubitsa, A.N., Zhelezova, A.I., Shilov, A.G., Vatolin, S.Y., Maximovsky, L.P.,Andreeva, L.E., McWhir, J., Pack, S.D., Bayborodin, S.I., et al. (1992). Isolation and cultivationof blastocyst-derived stem cell lines from american mink (Mustela vison). Molecular Reproductionand Development 33, 418–431.
Tabansky, I., Lenarcic, A., Draft, R.W., Loulier, K., Keskin, D.B., Rosains, J., Rivera-Feliciano, J.,Lichtman, J.W., Livet, J., Stern, J.N.H., et al. (2013). Developmental Bias in Cleavage-StageMouse Blastomeres. Current Biology 23, 21–31.
Takaoka, K., Yamamoto, M., Shiratori, H., Meno, C., Rossant, J., Saijoh, Y., and Hamada, H.(2006). The Mouse Embryo Autonomously Acquires Anterior-Posterior Polarity at Implantation.Developmental Cell 10, 451–459.
Takaoka, K., Yamamoto, M., and Hamada, H. (2011). Origin and role of distal visceral endoderm,a group of cells that determines anteriorPosterior polarity of the mouse embryo. Nature CellBiology 13, 743–752.
Technau, U., and Scholz, C.B. (2003). Origin and evolution of endoderm and mesoderm. Interna-tional Journal of Developmental Biology 9.
Tesar, P.J., Chenoweth, J.G., Brook, F.A., Davies, T.J., Evans, E.P., Mack, D.L., Gardner, R.L.,and McKay, R.D.G. (2007). New cell lines from mouse epiblast share defining features withhuman embryonic stem cells. Nature 448, 196–199.
Tewary, M., Ostblom, J., Prochazka, L., Zulueta-Coarasa, T., Shakiba, N., Fernandez-Gonzalez, R.,and Zandstra, P.W. (2017). A stepwise model of reaction-diffusion and positional informationgoverns self-organized human peri-gastrulation-like patterning. Development 144, 4298–4312.
Tewary, M., Dziedzicka, D., Ostblom, J., Prochazka, L., Shakiba, N., Heydari, T., Aguilar-Hidalgo,D., Woodford, C., Piccinini, E., Becerra-Alonso, D., et al. (2019). High-throughput mi-cropatterning platform reveals Nodal-dependent bisection of peri-gastrulationAssociated versuspreneurulation-associated fate patterning. PLOS Biology 17, e3000081.
Thiese, M.S., Arnold, Z.C., and Walker, S.D. (2015). The misuse and abuse of statistics in biomed-ical research. Biochemia Medica 25, 5–11.
Thomson, J.A., Kalishman, J., Golos, T.G., Durning, M., Harris, C.P., Becker, R.A., and Hearn,J.P. (1995). Isolation of a primate embryonic stem cell line. Proceedings of the National Academyof Sciences 92, 7844–7848.
Thomson, J.A., Itskovitz-Eldor, J., Shapiro, S.S., Waknitz, M.A., Swiergiel, J.J., Marshall, V.S.,and Jones, J.M. (1998). Embryonic Stem Cell Lines Derived from Human Blastocysts. Science282, 1145–1147.
123

Till, J.E., and McCulloch, E.A. (1961). A Direct Measurement of the Radiation Sensitivity ofNormal Mouse Bone Marrow Cells. Radiation Research 14, 213–222.
Torres-Padilla, M.-E., Parfitt, D.-E., Kouzarides, T., and Zernicka-Goetz, M. (2007). Histone argi-nine methylation regulates pluripotency in the early mouse embryo. Nature 445, 214–218.
Toyooka, Y., Shimosato, D., Murakami, K., Takahashi, K., and Niwa, H. (2008). Identification andcharacterization of subpopulations in undifferentiated ES cell culture. Development 135, 909–918.
Tsakiridis, A., Huang, Y., Blin, G., Skylaki, S., Wymeersch, F., Osorno, R., Economou, C., Kara-gianni, E., Zhao, S., Lowell, S., et al. (2014). Distinct Wnt-driven primitive streak-like populationsreflect in vivo lineage precursors. Development 141, 1209–1221.
Turing, A.M. (1952). The chemical basis of morphogenesis. Bulletin of Mathematical Biology 52,153–197.
Turner, D.A., Girgin, M., Alonso-Crisostomo, L., Trivedi, V., Baillie-Johnson, P., Glodowski, C.R.,Hayward, P.C., Collignon, J., Gustavsen, C., Serup, P., et al. (2017). Anteroposterior polarityand elongation in the absence of extra-embryonic tissues and of spatially localised signalling ingastruloids: Mammalian embryonic organoids. Development 144, 3894–3906.
Vallier, L., Reynolds, D., and Pedersen, R.A. (2004). Nodal inhibits differentiation of human embry-onic stem cells along the neuroectodermal default pathway. Developmental Biology 275, 403–421.
Vallier, L., Alexander, M., and Pedersen, R.A. (2005). Activin/Nodal and FGF pathways cooperateto maintain pluripotency of human embryonic stem cells. Journal of Cell Science 118, 4495–4509.
Vallier, L., Touboul, T., Chng, Z., Brimpari, M., Hannan, N., Millan, E., Smithers, L.E., Trotter,M., Rugg-Gunn, P., Weber, A., et al. (2009). Early cell fate decisions of human embryonic stemcells and mouse epiblast stem cells are controlled by the same signalling pathways. PloS One 4,e6082.
van der Walt, S., Colbert, S.C., and Varoquaux, G. (2011). The NumPy Array: A Structure forEfficient Numerical Computation. Computing in Science & Engineering 13, 22–30.
van der Walt, S., Schönberger, J.L., Nunez-Iglesias, J., Boulogne, F., Warner, J.D., Yager, N.,Gouillart, E., and Yu, T. (2014). Scikit-image: Image processing in Python. PeerJ 2, e453.
Viotti, M., Nowotschin, S., and Hadjantonakis, A.-K. (2014). SOX17 links gut endoderm morpho-genesis and germ layer segregation. Nature Cell Biology 16, 1146–1156.
Waisman, A., Sevlever, F., Elías Costa, M., Cosentino, M.S., Miriuka, S.G., Ventura, A.C., andGuberman, A.S. (2019). Cell cycle dynamics of mouse embryonic stem cells in the ground stateand during transition to formative pluripotency. Scientific Reports 9, 8051.
Warmflash, A., Sorre, B., Etoc, F., Siggia, E.D., and Brivanlou, A.H. (2014). A method to reca-pitulate early embryonic spatial patterning in human embryonic stem cells. Nature Methods 11,847–854.
Waskom, M., Botvinnik, O., drewokane, Hobson, P., Halchenko, Y., Lukauskas, S., Warmenhoven,J., Cole, J.B., Hoyer, S., Vanderplas, J., et al. (2016). Seaborn: V0.7.0 (January 2016).
Weismann, A. (1885). Die Continuitat des Keimplasmas als Grundlage einer Theorie der Vererbung(Jena: Gustav Fischer).
Weissgerber, T.L., Milic, N.M., Winham, S.J., and Garovic, V.D. (2015). Beyond Bar and LineGraphs: Time for a New Data Presentation Paradigm. PLOS Biology 13, e1002128.
124

Weissgerber, T.L., Garovic, V.D., Milin-Lazovic, J.S., Winham, S.J., Obradovic, Z., Trzeciakowski,J.P., and Milic, N.M. (2016). Reinventing Biostatistics Education for Basic Scientists. PLOSBiology 14, e1002430.
Weiswald, L.-B., Guinebretière, J.-M., Richon, S., Bellet, D., Saubaméa, B., and Dangles-Marie, V.(2010). In situ protein expression in tumour spheres: Development of an immunostaining protocolfor confocal microscopy. BMC Cancer 10, 106.
Wes McKinney (2010). Data Structures for Statistical Computing in Python. In Proceedings of the9th Python in Science Conference, S. van der Walt, and Jarrod Millman, eds. pp. 56–61.
White, M.D., Angiolini, J.F., Alvarez, Y.D., Kaur, G., Zhao, Z.W., Mocskos, E., Bruno, L., Bissiere,S., Levi, V., and Plachta, N. (2016). Long-Lived Binding of Sox2 to DNA Predicts Cell Fate inthe Four-Cell Mouse Embryo. Cell 165, 75–87.
Williams, R.L., Hilton, D.J., Pease, S., Willson, T.A., Stewart, C.L., Gearing, D.P., Wagner, E.F.,Metcalf, D., Nicola, N.A., and Gough, N.M. (1988). Myeloid leukaemia inhibitory factor maintainsthe developmental potential of embryonic stem cells. Nature 336, 684–687.
Wilson, E.B. (1896). The Cell in Development and Inheritance ((New York: Macmillan)).
Winnier, G., Blessing, M., Labosky, P.A., and Hogan, B.L. (1995). Bone morphogenetic protein-4 is required for mesoderm formation and patterning in the mouse. Genes & Development 9,2105–2116.
Wolff, G. (1895). Entwickelungsphysiologische Studien. Archiv Für Mikroskopische Anatomie 1,380–390.
Wolpert, L. (1969). Positional information and the spatial pattern of cellular differentiation. Journalof Theoretical Biology.
Xia, X., and Wong, S.T. (2012). Concise Review: A High-Content Screening Approach to StemCell Research and Drug Discovery. STEM CELLS 30, 1800–1807.
Xie, T., Kang, J., Pak, C., Yuan, H., and Sun, Y. (2020). Temporal Modulations of NODAL, BMP,and WNT Signals Guide the Spatial Patterning in Self-Organized Human Ectoderm Tissues.Matter S2590238520301831.
Xu, C., Inokuma, M.S., Denham, J., Golds, K., Kundu, P., Gold, J.D., and Carpenter, M.K. (2001).Feeder-free growth of undifferentiated human embryonic stem cells. Nature Biotechnology 19,971–974.
Xu, H., Ang, Y.-S., Sevilla, A., Lemischka, I.R., and Ma’ayan, A. (2014). Construction and Valida-tion of a Regulatory Network for Pluripotency and Self-Renewal of Mouse Embryonic Stem Cells.PLoS Comput Biol 10, e1003777.
Xu, R.-H., Chen, X., Li, D.S., Li, R., Addicks, G.C., Glennon, C., Zwaka, T.P., and Thomson,J.A. (2002). BMP4 initiates human embryonic stem cell differentiation to trophoblast. NatureBiotechnology 20, 1261–1264.
Xue, X., Sun, Y., Resto-Irizarry, A.M., Yuan, Y., Aw Yong, K.M., Zheng, Y., Weng, S., Shao, Y.,Chai, Y., Studer, L., et al. (2018). Mechanics-guided embryonic patterning of neuroectodermtissue from human pluripotent stem cells. Nature Materials 17, 633–641.
Yachie-Kinoshita, A., Onishi, K., Ostblom, J., Langley, M.A., Posfai, E., Rossant, J., and Zandstra,P.W. (2018). Modeling signaling-dependent pluripotency with Boolean logic to predict cell fatetransitions. Molecular Systems Biology 14, e7952.
125

Yang, Y., Adachi, K., Sheridan, M.A., Alexenko, A.P., Schust, D.J., Schulz, L.C., Ezashi, T.,and Roberts, R.M. (2015). Heightened potency of human pluripotent stem cell lines created bytransient BMP4 exposure. Proceedings of the National Academy of Sciences 112, E2337–E2346.
Yates, A., and Chambers, I. (2005). The homeodomain protein Nanog and pluripotency in mouseembryonic stem cells. Biochemical Society Transactions 33, 1518–1521.
Yi, C., Troutman, S., Fera, D., Stemmer-Rachamimov, A., Avila, J.L., Christian, N., Persson, N.L.,Shimono, A., Speicher, D.W., Marmorstein, R., et al. (2011). A Tight Junction-AssociatedMerlin-Angiomotin Complex Mediates Merlin’s Regulation of Mitogenic Signaling and TumorSuppressive Functions. Cancer Cell 19, 527–540.
Ying, Q.-L., and Smith, A.G. (2003). Defined Conditions for Neural Commitment and Differentia-tion. In Methods in Enzymology, (Academic Press), pp. 327–341.
Ying, Y., and Zhao, G.-Q. (2001). Cooperation of Endoderm-Derived BMP2 and ExtraembryonicEctoderm-Derived BMP4 in Primordial Germ Cell Generation in the Mouse. DevelopmentalBiology 232, 484–492.
Ying, Q.-L., Nichols, J., Chambers, I., and Smith, A. (2003). BMP Induction of Id ProteinsSuppresses Differentiation and Sustains Embryonic Stem Cell Self-Renewal in Collaboration withSTAT3. Cell 115, 281–292.
Ying, Q.-L., Wray, J., Nichols, J., Batlle-Morera, L., Doble, B., Woodgett, J., Cohen, P., and Smith,A. (2008). The ground state of embryonic stem cell self-renewal. Nature 453, 519–523.
Zhang, Z., Zwick, S., Loew, E., Grimley, J.S., and Ramanathan, S. (2019). Mouse embryo geometrydrives formation of robust signaling gradients through receptor localization. Nature Communica-tions 10, 1–14.
126