Assessment of slope stability using combined probabilistic ...

Proceedings of World Landslide Forum 3, 2-6 June 2014, Beijing
Contribution of infrared thermography to the slope instability characterization
William Frodella, Stefano Morelli , Giovanni Gigli, Nicola Casagli
Abstract Infrared thermography (IRT), or thermal imaging, is a remote sensing technique capable of mapping the surface temperature pattern evolution, leading to the detection of thermal anomalies within the investigated object. In recent years IRT has undergone a significant increase of applications, thanks to the technological development of portable and cost-effective thermal imaging cameras, as well as the fast measurement and processing times of thermographic data. Nevertheless in the study of slope instability processes, apart from a few interesting experimental studies, IRT is still not widely applied. In this paper we present some applications of IRT, both terrestrial and airborne, in attempt to contribute to a rapid high resolution mapping and to the characterization of slopes affected by instability phenomena. In particular IRT was employed in an integrated approach with other remote sensing techniques, such as terrestrial and aerial laser scanner and photography, in order to detect criticalities in unstable slopes and evaluate the possible hazardous scenarios in emergency management. The potential of IRT for landslide mapping and characterization was explored in different types of critical landscapes (from terrigenous/detrital slopes to rock walls) analyzing the following characteristics: i) pattern of the structural discontinuities and open fractures in rock slopes affected by rock sliding; ii) ephemeral springs and creeks in detrital covers recently affected by debris flow detachment; iii) scarps, moisture and water stagnation areas within large earth flows. Keywords Thermography, slope instability, landslide, mapping. Introduction
Infrared thermography (IRT) is the branch of remote sensing dealing with measuring the radiant temperature of Earth's surface features from a distance (Spampinato et al. 2011). Over the last decade IRT thanks to its capability of providing surface
temperature maps of the investigated scenario, has shown some interesting applications as an ancillary technique for landslide analysis. Wu et al. (2005) combined terrestrial infrared thermography (TIR) with ground penetrating radar surveys in order to detect eroded caves behind shotcrete-protected slopes. Since terrestrial laser scanning (TLS) is capable of providing an accurate 3D geometrical and structural rock mass representation (Slob et al. 2002; Gigli and Casagli, 2011; Gigli et al., 2012), some authors integrated this technique with TIR in order to obtain information about the rock mass fracturing (Squarzoni et al. 2008), and to detect features that could lead to hazardous conditions on rock slopes like: water seepage zones, open fractures and unstable protruding systems (Adorno et al. 2009; Teza et al. 2012; Gigli et al. 2013). Furthermore Adorno and Rizzo (2011) proposed the use of TIR for the detection and monitoring of soil saturation degree, in order to forecast hydraulic conditions and to identify displacements on clay slopes, while Baroň, et al. (2012) applied IRT both from terrestrial and airborne platforms to detect and map open fractures in deep seated rock slides.
The technique
Thermal cameras (or thermal imaging systems) are devices that, thanks to detectors sensible to infrared radiation, are capable of mapping the spatial distribution of the surface temperatures. Modern high resolution thermal cameras, used both in terrestrial (hand-held, tripod-mounted) or airborne based modes, thanks to their portability and easy data collection/processing, represent powerful and costeffective tools for thermal monitoring. The product of a thermographic survey is a thermal image (or thermogram), which after the correction of the sesnsitive parameters (object emissivity, pathlength, air temperature and humidity), constitutes a surface temperature map of the investigated scenario. The rate of heat transfer through a solid body regulates the amount of energy radiated by its surface (Teza et al.

W. Frodella, S. Morelli , G. Gigli, N. Casagli – Contribution of infrared thermography to the slope instability characterization
2
2012). If an inhomogeneity within the material exists, the local radiant temperature will differ from the one of the surrounding areas. Therefore, mapping the radiant temperature can lead to the detection of irregular thermal patterns (thermal anomalies) within the investigated object. In the analysis of slope instability phenomena thermal anomalies can reveal the presence of potential criticalities such as: i) structural discontinuities (due to the cooling/heating effect of air circulating within open fractures; different thermal transfer capacity of the infilling material with respect to the exposed sound rock); ii) moisture or a seepage zones (due to the surface cooling caused by water evaporation). Furthermore, during a daily cycle the slope surface heat transfer differs, due to the aspect and topographic roughness (ledges, niches, scarps), which avoid the heating of some sectors due to shadow effects. Multitemporal thermographic survey can thus lead to the detection of landside scarps, or potentially unstable protruding systems in a rock wall. In this paper a qualitative use of IRT is presented, for a rapid evaluation of landslide scenarios in emergency management, with the final aim of a 2D and 3D mapping and characterization of landslide bodies. To achieve this goal the methodology shown in Fig. 1 was applied.
TERRESTRIAL AND
AERIAL LIDAR SURVEY
POINT CLOUD
DATA CREATION
GEOLOGICAL AND
GEOMECHANICAL FIELD
SURVEYS
TERRESTRIAL AND AERIAL
THERMOGRAPHIC SURVEY
MosaickingRADIOMETRIC IMAGE
CORRECTION, THERMAL
FOCUSING, MOSAICKING
TERRESTRIALAND
AERIAL OPTICAL
IMAGERY
2D AND 3D LANDSLIDE
CHARACTERIZATION
THERMAL ANOMALIES
DETECTION (FRACTURE PATTERN,
SLOPE BREAKS, SEEPAGE AND
MOISTURE ZONES)
DETECTION OF UNSTABLE
MASSES AND VOLUME
CALCULATION
HIGH RESOLUTION
3D SURFACE
RESULTS
RAW DATA
PROCESSING
MANUAL AND SEMI-AUTOMATIC
GEOMECHANICAL DATA
EXTRACTION
DATA COLLECTION
SURFACE TEMPERATURE MAPS,
DIFFERENTIAL THERMOGRAPHY,
IMAGE GEOREFERENCING
DATA ANALYSIS
Fig. 1 Logic scheme of the applied methodology.
The thermographic surveys, both terrestrial and aerial, were performed using a FLIR SC620 thermal camera (FLIR, 2009), characterized by a focal plane array (FPA) microbolometer sensor (Tab. 1). A built-in 3.2 Mpixel digital camera allowed the comparison between the thermographic and the corresponding optical images, in order to improve the interpretation of the surface temperature maps. FLIR dedicated software were employed for the thermogram analysis, thermal focusing, mosaicking and IR video sequence acquisition.
Feature Unit value
Detector size Pixel 640 X 480
Spectral range µm [7.5, 13]
Temperature range C° [40, + 500]
Thermal accuracy C° ± 2
Thermal sensitivity mK 40
Field of view (F.O.V.) Deg. 24 X 18
Spatial resolution mrad 0.65
Minimum focus distance m 0.3
Table 1 FLIR sc620 thermal camera main technical specifications.
Rockslide assessment
TIR multitemporal surveys were performed in correspondence of two steep quarry fronts (Fig. 24), affected by rockslide phenomena (Cruden and Varnes, 1996). TLS surveys were also conducted in order to provide a high resolution 3D surface to be used as topographic reference base. The abovementioned remotely collected data were integrated with field inspections in order to provide a 2D and 3D remote mapping of the key fracture pattern delimiting unstable rock wedges. The first case study is a mainly dolomitic-limestone active quarry (Fig. 2), where field inspections highlighted a low angle dipping mesoscopic fault system, isolating a potentially unstable rock wedge. Thermograms were acquired in correspondence of the analysed rock slope sector during the heating phase at a 500 m distance, leading to a 33 cm spatial resolution.
A B
C D DT (C )
Fig. 2 2D surface temperature maps of the investigated quarry sector acquired at h 08:00 (A) and 13:00 (C) in the month of July. Optical image acquired by the built-in digital camera (B) and 2D differential surface temperature map between A and C (D).
The obtained surface temperature maps revealed a widespread portion of the investigated fracture pattern, represented by cold thermal anomalies (Fig. 2 C), which were not clearly visible in the corresponding optical image (Fig. 2B).
Proceedings of World Landslide Forum 3, 2-6 June 2014, Beijing
3
The differential surface temperature map enhanced loose coarse grained debris cones, characterized by high thermal transfer capacities (Fig. 2D). The fracture pattern was traced on the TLS high resolution georeferenced 3D surface, providing an accurate 3D fracture map (Fig. 3A). Through the latter, a thickness map of the investigated rock wedge was created (Fig. 3B), leading to an estimate of 340.000 m3 of the potentially unstable volumes involved.
Spes
sore
(m)
A
B
Th
ickn
ess (m
)
Fig. 3 Three dimensional maps of the investigated quarry sector: (A) fracture pattern traced on TLS point cloud; (B) thickness of the potentially unstable wedge on high resolution surface.
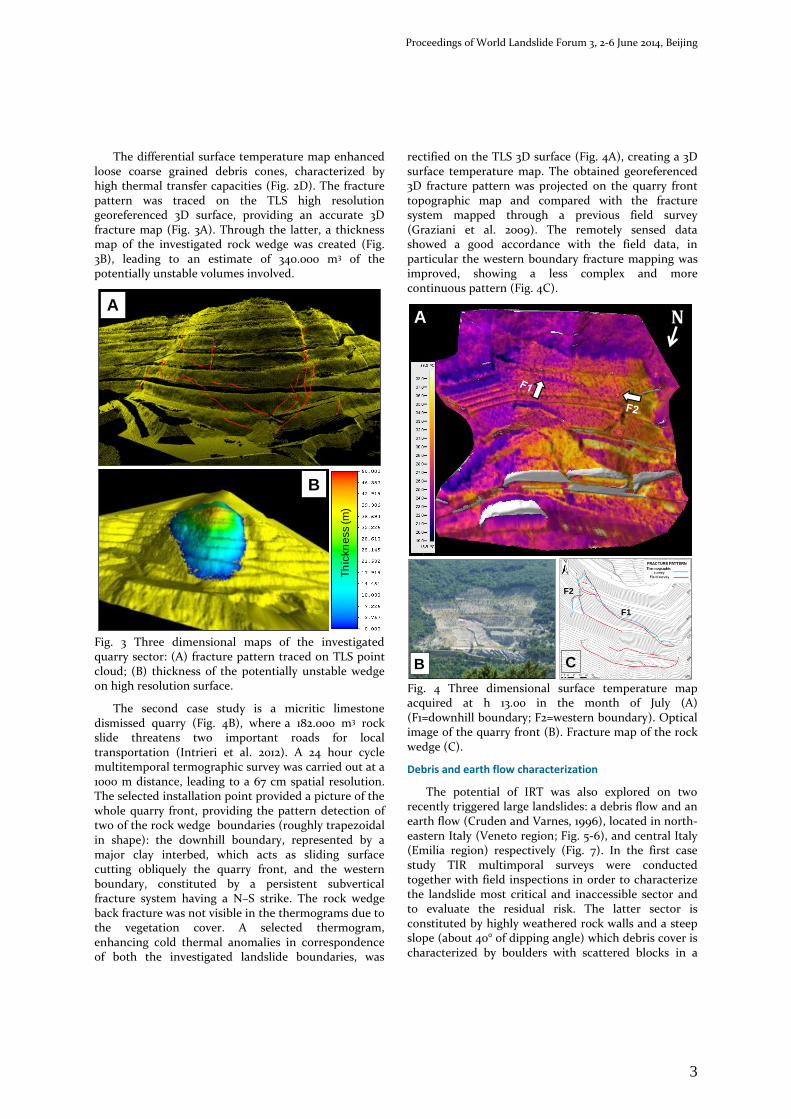
The second case study is a micritic limestone dismissed quarry (Fig. 4B), where a 182.000 m3 rock slide threatens two important roads for local transportation (Intrieri et al. 2012). A 24 hour cycle multitemporal termographic survey was carried out at a 1000 m distance, leading to a 67 cm spatial resolution. The selected installation point provided a picture of the whole quarry front, providing the pattern detection of two of the rock wedge boundaries (roughly trapezoidal in shape): the downhill boundary, represented by a major clay interbed, which acts as sliding surface cutting obliquely the quarry front, and the western boundary, constituted by a persistent subvertical fracture system having a N–S strike. The rock wedge back fracture was not visible in the thermograms due to the vegetation cover. A selected thermogram, enhancing cold thermal anomalies in correspondence of both the investigated landslide boundaries, was
rectified on the TLS 3D surface (Fig. 4A), creating a 3D surface temperature map. The obtained georeferenced 3D fracture pattern was projected on the quarry front topographic map and compared with the fracture system mapped through a previous field survey (Graziani et al. 2009). The remotely sensed data showed a good accordance with the field data, in particular the western boundary fracture mapping was improved, showing a less complex and more continuous pattern (Fig. 4C).
B
N
C
F1
F2
A
Fig. 4 Three dimensional surface temperature map acquired at h 13.00 in the month of July (A) (F1=downhill boundary; F2=western boundary). Optical image of the quarry front (B). Fracture map of the rock wedge (C).
Debris and earth flow characterization
The potential of IRT was also explored on two recently triggered large landslides: a debris flow and an earth flow (Cruden and Varnes, 1996), located in north-eastern Italy (Veneto region; Fig. 5-6), and central Italy (Emilia region) respectively (Fig. 7). In the first case study TIR multimporal surveys were conducted together with field inspections in order to characterize the landslide most critical and inaccessible sector and to evaluate the residual risk. The latter sector is constituted by highly weathered rock walls and a steep slope (about 40° of dipping angle) which debris cover is characterized by boulders with scattered blocks in a

W. Frodella, S. Morelli , G. Gigli, N. Casagli – Contribution of infrared thermography to the slope instability characterization
4
coarse sandy matrix. In this sector concentrated and diffuse erosion, slope waste deposition due to gravity and detrital cover failures take place, representing the feeding area for debris flows (Fig. 5A). The thermographic acquisition point was set at a 900 m distance, leading to a 60 cm spatial resolution; the obtained thermograms were mosaicked in order to picture the whole analyzed sector (Fig. 5B). Cold thermal anomalies, due to moisture zones, were detected in correspondence of the springs within the debris cover (Fig. 5a1) and ephemeral creeks cutting the rock wall in the landslide northern sector (Fig. 5b1).
a
b
a1
b1
A
B
Fig. 5 Optical image of the debris flow analysed area (A); corresponding mosaicked thermographic image (acquired at h 15:00 in the month of may) (B); dashed squares locate the analyzed cold thermal anomalies).
A flow direction modeling was also performed in a GIS environment (Morelli et al. in press) on the landslide post event high resolution aerial Lidar DTM. The resulting drainage network pattern shows a good accordance with the mapped cold thermal anomalies (Fig. 6A, B). In such a topographic and geological context ephemeral springs are high criticalities, which can represent triggering factors for a new debris flow occurrence. In the second case study the employed thermal camera was mounted on an airborne platform, in order to map a recently triggered fast moving earth flow (Fig. 7A). Field and GPS surveys were conducted in order to map the landslide boundaries in the areas not covered by the aerial survey. An IR movie sequence (30 frames/s) was acquired from a mean height of 300 m (leading to a 20 cm spatial resolution). Thermograms were sequentially extracted from the sequence for being analyzed and mosaicked (Fig. 7B). High resolution optical images were also acquired through a
digital camera and mosaicked (Fig. 7A). Both the obtained mosaicks were georeferenced in a GIS environment. The surface temperature map highlighted thermal anomalies in correspondence of the landslide boundaries, scarps, drainage pattern and ponds, also showing the presence of moisture in the landslide toe, with respect to the landslide dry upper sectors (Fig. 7B). The mapped thermal anomalies were compared and integrated with the high resolution mosaicked optical image, the resulting map, shown in Fig. 7C.
A
Fig. 6 Landslide high resolution DTM (A); the red line delimits the whole landslide body, blue lines represent the modelled drainage pattern. The dashed square represents the analysed landslide sector in B; dashed oval enhance the mapped drainage pattern.
Discussions and conclusions
IRT, given the portability and cost-effectiveness of modern thermal cameras, as well as the fast acquisition and processing times of thermographic data, can be profitably applied in the field of landslide analysis, for the remote rapid mapping of surface temperature patterns with high spatial resolution. This can lead to the detection of landslide physiographic potentially hazardous features (structural discontinuities and open fractures, scarps, seepage and moisture zones, landslide ephemeral springs, creeks, ponds), which can be very

Proceedings of World Landslide Forum 3, 2-6 June 2014, Beijing
Fig. 7 Mosaicked high resolution aerial optical image (A) and surface temperature map (B) of the investigated earth flow (a temperature gradient is clearly visible from the dry upper sector (detachment area) to the colder wet toe. Resulting map of the landslide ponds, drainage network and scarps (C).
useful for the fast evaluation of risk scenarios during the emergencies. In rock slide assessment the potential of IRT for fracture mapping can lead to the evaluation of the unstable rock wedges volume (which is one of the main factors controlling the runout in the case of catastrophic failure), in order to plan the proper risk reduction measures (Hungr, 1990 Gigli et al., 2011). Mapping the drainage network in debris and earth
flows can provide a very useful tool for the time planning of the adeguate restoration works. IRT can also be used for landslide monitoring and forecasting, for its capability to analyze the evolution of thermal anomalies connected to instability processes, and to locate areas potentially more subjected to landslide vulnerability.

W. Frodella, S. Morelli , G. Gigli, N. Casagli – Contribution of infrared thermography to the slope instability characterization
6
Nevertheless IRT surveys have logistical and temporal limitations: the acquisition point must be selected in order to obtain the best field of view and spatial resolution of the investigated scenario; and a multi-temporal approach should be more suitable to achieve the scenario surface temperature variability. Furthermore, in order to obtain a more accurate interpretation of the results for landslide analysis, IRT can be profitably used as an ancillary low cost technique through the integration with other ground based remote sensing techniques, such as terrestrial laser scanning and ground based interferometry (GBInSAR) (Antonello et al. 2004). Future
developments should include the application of fixed thermal camera installations for gathering continuous, high-resolution, real-time data to be compared with those of the integrated TLS and GBInSAR monitoring systems.
References
Adorno V, Barnobi L, La Rosa F, Leotta A, Paratore M, (2009) Contributo della tecnologia laser scanner e termografia IR nella caratterizzazione geomeccanica di un costone roccioso. Atti 13a conferenza Asita, Bari 1-4 December 2009 [in italian].
Adorno V, Rizzo A, (2011) The infrared thermography as a tool to predict muddy-debris flow triggering. Proceeding of the Second World Landslide Forum, 3–9 October 2011, Rome.
Antonello G., Tarchi D, Casagli N, Farina P, Guerri L, Leva D, (2004) SAR interferometry monitoring of landslides on the stromboli volcano. European Space Agency, (Special Publication) ESA SP (550): 483-488.
Baroň I, Bečkovský D, Míča L, (2012) Application of infrared thermography for mapping open fractures in deep-seated rockslides and unstable cliffs. Landslides. 1-13.
Cruden DM, Varnes DJ, (1996) Landslides Types and Processes. In: Turner AK, Schuster RL (eds.), Landslides: Investigation and Mitigation. Transportation Research Board Special Report 247. National Academy Press, WA, pp. 36–75.
FLIR (2009) FLIR ThermaCAM SC620 technical specifications URL: http://www.flir.com/cs/emea/en/view/?id=41965.
Gigli G, Casagli N, (2011) Semi-automatic extraction of rock mass structural data from high resolution LIDAR point clouds, International Journal of Rock Mechanics and Mining Sciences, 48 (2): 187-198.
Gigli G, Frodella W, Mugnai F, Tapete D, Cigna F, Fanti R, Intrieri E, Lombardi L (2012) Instability mechanisms affecting cultural heritage sites in the Maltese Archipelago. Nat. Hazards Earth Syst. Sci. 12: 1-21.
Gigli G., Frodella W, Garfagnoli F, Morelli S, Mugnai F, Menna F, Casagli N, (2013) 3-D geomechanical rock mass characterization for the evaluation of rockslide susceptibility scenarios. Landslides. 1-10.
Graziani A, Rotonda T, Tommasi P, (2009) Stability and deformation mode of a rock slide along interbeds reactivated by rainfall. Proceeding of the 1st Italian Workshop on Landslides, Napoli, 8th-10th June 2009, 1, pp. 62–71.
Hungr O, (1990) Mobility of rock avalanches. Report of the International Research Institute for Earth Science and Disaster Prevention, 46, pp. 11–19.
Intrieri E, Gigli G, Mugnai F, Fanti R, Casagli N, (2012) Design and implementation of a landslide early warning system. Engineering Geology, 147-148, 12 October, Pages 124-136.
Morelli S, Battistini A, Catani F (in press.) Preliminary assessment of flood susceptibility in urbanized rivers using digital terrain data. Natural Hazard.
Squarzoni C, Galgaro A, Teza G, Acosta CAT, Pernito MA, Bucceri N (2008) Terrestrial laser scanner and infrared thermography in rock fall prone slope analysis. Geophysical Research Abstracts 10, EGU2008-A-09254, EGU General Assembly 2008.
Slob S, Hack HRGK, Turner K, (2002) Approach to automate discontinuity measurements of rock faces using laser scanning techniques. Proceeding of ISRM EUROCK 2002: Funchal, Portugal, 25-28 November 2002. Lisboa, Sociedade Portuguesa de Geotecnia. pp. 87-94.
Spampinato L, Calvari S, Oppenheimer C, Boschi E, (2011) Volcano surveillance using infrared cameras. Earth-Science Reviews 106: 63-91.
Teza G, Marcato G, Castelli E, Galgaro A (2012) IRTROCK: a matlab toolbox for contactless recognition of surface and shallow weakness traces of a rock mass by infrared thermography. Computers & Geosciences. 45: 109-118.
Wu JH, Lin HM, Lee DH, Fang SC, (2005) Integrity assessment of rock mass behind the shotcreted slope using thermography. Engineering Geology. 80: 164–173.
William Frodella Department of Earth Sciences, University of Firenze, Via G.
La Pira 4, Firenze 50121, Italy. e-mail: [email protected]
Stefano Morelli ( ) Department of Earth Sciences, University of Firenze, Via G.
La Pira 4, Firenze 50121, Italy. e-mail: [email protected]
Giovanni Gigli Department of Earth Sciences, University of Firenze, Via G.
La Pira 4, Firenze 50121, Italy. e-mail: [email protected]
Nicola Casagli Department of Earth Sciences, University of Firenze, Via G.
La Pira 4, Firenze 50121, Italy. e-mail: [email protected]
Copyright © 2022 FDOKUMEN