Use of infrared thermography for monitoring stomatal closure in the field: application to grapevine
Upload
khangminh22Category
view
6download
0
Comparative study between infrared thermography and laser Doppler vibrometry applied to frescoes diagnostic
by S. G. Tavares*,**, A. Agnani**, E. Esposito**, M. Feligiotti**, S. Rocchi**,
R. M. de Andrade*
*Departamento de Engenharia Mecânica – Universidade Federal de Minas Gerais, Belo Horizonte, Brazil **Dipartimento di Meccanica – Università Politecnica delle Marche, Ancona, Italy
Abstract In this work a comparative study between the laser Doppler vibrometry and
the infrared thermography for defect detection in frescoes is presented. Mathematical models were implemented to simulated the physical domain and conditions of the employed test sample and results compared with the experimental ones. The limitations of the laser Doppler vibrometry have been discussed through measurement noise power spectral density and signal-to-noise analysis. In the case of infrared thermography, the evaluation of the uncertainty of measurement has been carried on.
1. Introduction
Extensively presented in several papers as a powerful nondestructive testing
method for the evaluation of non visible faults, humidity and other occurrences in works of art, the experimental results obtained from application of thermography have been rarely correlated to those obtained from other techniques or numerical methods. On the other hand, just a few studies have presented a coherent uncertainty analysis that allows to validate the experimental results under this respect.
However, infrared thermography (IRT) is capable of identifying and characterizing imperfections in frescoes, only if, at least in a situation of recorded maximum thermal contrast, the differential of temperature existing between the flawed and unflawed area will be greater than uncertainty of measurement on that same areas. Methodologies for determining the uncertainty of the temperature as measured by thermal cameras can be found in other papers such as [1] and [2].
By other hand, the development of analytical or mathematical models for describing the temporal evolution of the temperature distribution on the surface of a sample should be the main way to predict and better understand the thermographic results [3]. It is obvious that, for actual validation of the technique, the difference between the values obtained experimentally with the ones obtained by the analytical and/or mathematical model, whether for the flawless or flawed area, must be lower than the uncertainty of measurement in each moment of the analysis.
The comparison with other techniques also represents a valuable tool to the thermographic experiments validation. The use of laser Doppler vibrometry (LDV) to this end has the great advantage of seeing the employment of a technique with a well established experience in the field of works of art diagnostic, as presented in many papers [4-7].
In this work a comparative study between the LDV and IRT to defect detection in frescoes is presented. As previously mentioned, in order to improve the
http://dx.doi.org/10.21611/qirt.2006.039

discernment of the results obtained experimentally by both techniques, mathematical models were implemented to simulate the physical domain and condictions of the employed test sample. The limitations of each metodolgy are also discussed by measurement noise power spectral density (PSD) and signal-to-noise (SNR) analysis, for the case of the LDV, and evaluation of the uncertainty of measurement for IRT.
2. Experimental procedures
Measurement sessions were carried out in the Mechanical and Thermal
Measurements laboratory of the Mechanical Engineering Department of the Università Politecnica delle Marche - Italy.
The employed sample has been made by a Spanish restorer, Eudald Guillamet, and simulates the typical multi-layer of a so called “buon fresco”. The compact and resistant base of the sample has been fabricated in terracotta, while for the arriccio, a mixture of calcium and thick sand (granulometry of 1÷2 mm) has been used with a ratio of 1:3. For the intonaco, the ratio used was of 1:2.5 and layer thicknesses are 10 and 5 millimeters for arriccio and intonaco respectively. Over the intonaco, a decorative geometric pattern has been painted. A void has been created by mean of very thin foils of communion wafers; the contact of this material with the residual humidity of plaster has caused its almost complete destruction, leaving just some traces of white dust, thus realistically simulating the desired type of flaw. The restorers have indicated approximate values of the diameter (80÷100 mm) and the thickness (1.5÷2.5 mm) of the wafers. Figure 1 shows a schematic view of the sample used in the tests which also was used for the mathematical models.
Fig. 1. Fresco sample. The configuration of the thermal bench allows the choice of the distance
between the sample and the source of heating (composed of four lamps, each one with power equal to 1000W) and between the thermal camera and the sample. The thermal camera used in this study was a FLIR ThermaCAMTMS40.
During the thermal experiments, the testing procedure suggested in [8] has been followed. This metodology considers all the diverse variables involved in the measurement process which give origin to the measurement uncertainty.
Both pulsed and modulated thermography were employed. The thermal excitement time used was equal to 10 seconds which allowed the uniform heating of the sample surface at a peak temperature that can be considered harmless for the sample. The acquisition time was equal to 300s for the pulsed thermography and equal to a cicle of the thermal waves for the modulated thermography. The distance between the sample and the thermal camera has been kept to 0.55 m and the
http://dx.doi.org/10.21611/qirt.2006.039

distance between the sample and the thermal font at 0.20 m. The environment temperature, indispensable component for the calculation of the measurement uncertainty, was measured using a thermometer whit uncertainty equal to + 0.4oC. The atmospheric transmissivity was considered equal 0.99+ 0.01. The emissivity of the surface was determined during the adjustment of the thermal camera. This procedure consist in adjust the emissivity in the thermal camera to indicate the same temperature obtained through contact technique of lesser uncertainty. In this case, thermocouples installed on each different pigment have been used. The expanded uncertainty of the set thermocouple/temperature indicator was determined to be + 0.2oC. The thermal characteristics of the materials that constitute the sample, and used in the mathematical model, were considered according to a norm of the ABNT [9] and information supplied by the restorer. As regards the defected area, the thermal properties of air have been considered [10]. Image analysis has been conducted using the ThermaCAM Researcher 2002 and a program developed in MATLAB code.
As regards pulsed thermography, the analysis was based mainly on the determination of maximum thermal contrast.
As regards modulated thermography, a standard testing procedure was carried out, that means using an initial high frequency value, that permits to analyse the more superficial layers of the sample. Gradually, this frequency value has been decreased so that all the thickness of the sample could be analyzed.
In order to ensure the repeatability of the measurement procedure, the tests were repeated 12 times, under identical testing conditions. This procedure allows data uncertainty analysis. Eq. (1) has been used to estimate the combined standard uncertainty of the temperature, uc(Tout), mesasured by the thermal camera:
22
)(2
)(2 ))(())(())(()( inrarbaTroutc uucTucucTu +++= τε τε (1)
where u(εr) is the standard uncertainty of determination of the object effective
emissivity, u(Tba(r)) is the standard uncertainty of determination of the effective background temperature, u(τa(r)) is the standard uncertainty of determination of the effective atmospheric transmittance and cε, cT e cτ, are the sensitivity coefficients equal to partial derivatives of the function Tout (ε, Tba,τa). These partial derivatives describe how the output quantity Tout varies with changes in the value of the input quantities ε, Tba,τa and can be calculated as showed in [1] and [2].
The vibrometric measurements have been conducted using an Ometron VPI
4000 scanning LDV and a horn loudspeaker as the source of the exciting signal. The testing procedure described in [5] has been followed and allowed recognizing the resonance frequencies and the corresponding modes of the sample and of the included defect.
Scanning LDV, to effectively operate as a diagnostic instrument, needs a certain amount of laser light reflected towards the laser head. This reflection depends on surface roughness, type of finishing and surface pigments and it is usually improved using special paints. The artworks surfaces cannot be altered, therefore, in the measurements carried out on the sample, the influence of the different colours of the fresco had to be considered. Operational limits of the vibrometric technique have thus been studied by acquisition of PSD and SNR on two areas of different pigments of the fresco sample, where a defect is present or not respectively. Regarding the acquisition of PSD and SNR, the methodology followed in this work has been
http://dx.doi.org/10.21611/qirt.2006.039
presented in [11]. In order to guarantee the repeatability of the measurement procedure, the tests have been repeated 12 times, under identical testing conditions.
3. Theorical models
The Fourier equation has been used for the mathematical model employed for
the numerical simulation of the thermographic investigations, considering a transient state, without heat generation, in three-dimensional Cartesian coordinates. For pulsed thermography, the initial conditions are as follows:
ζρ pCQ)t,z,y,x(T = for 0<z<ζ and t = 0 (2)
oT)t,z,y,x(T = for z>ζ and t = 0 (3)
where T is the temperature at coordinates x, y, z, and time, t; ρ is the specific
mass of the material; Cp is the specific heat of the material, ζ is the thickness of the last layer of material which covers the surface and absorbs the thermal pulse, and To is the initial temperature of the samples, before thermal excitation. As regards modulated thermography, the same initial conditions are repeated at the start of every cycle.
Because the lateral edges of the sample were isolated during the tests, it was possible to consider a one-dimensional heat flow, in the z direction, and boundary convection conditions for z=0 and z=L (L is the total thickness of the sample). For the convection coefficient, the value 12 W/m2 oC was used, which is, approximately, the average of the values adopted for free gas convection [10]. The ambient temperature used in the numerical simulation, was the average of those obtained during the experimental procedures.
In solving the Fourier equation, the finite-volume numerical technique was used. The solution obtained through this technique provides perfect heat balance for the entire calculation domain. A FORTRAN® program has been developed for solving the problem. The number of finite control volumes was defined from grid test and convergence criterion, based on the comparison of the temperature obtained at each point, by the numerical technique, to the temperature obtained analytically (only differences of less than 10-5 were accepted) where the domain was considered to be a semi-finite solid.
The numerical model of the vibrometric essays was constructed using a Finite Elements Method (FEM), prepared through ANSYS code. In developing a FEM model, it is fundamental to take into account not only the geometrical characteristics of the defects but also the mechanical parameters of materials of the sample. The acquisition of material mechanical characteristics was carried out by a minimally invasive measurement procedure, based on the measurement of the propagation velocity of induced pulses and described in [12].
4. Results
As regards pulsed thermography, a thermal image analysis has been carried
out when the thermal contrast peaked at its maximum value, corresponding to the maximum visibility of the defect. The measured thermal contrast obtained during the test is shown in figure 2, where its maximum value and the moment in which it occours have been put in evidence. The corresponding thermal maps, obtained by
http://dx.doi.org/10.21611/qirt.2006.039

ThermaCAM Researcher 2002 (a) and by MATLAB code (b), can been seen in the figure 3.
Fig. 2. Thermal contrast.
Fig. 3. Temperature maps - pulsed thermography. However, the real characterization of the defect is only possible comparing the
values obtained for the temperature in the flawed and unflawed regions. Figure 4 presents the superficial temperature decay for the two areas, obtained numerically and experimentally. The maximum uncertainty of measurement, expanded to 95% and calculated according to (1), was ±1.06oC.
By comparing the theoretical and experimental results, for the transient considered in the analysis, it can be noticed that the difference in temperature between them, both for the flaw and flawless areas, was much lower than the uncertainty of measurement, which, in principle, validates the proposed model.
a) b)
http://dx.doi.org/10.21611/qirt.2006.039

25,0
26,0
27,0
28,0
29,0
30,0
31,0
32,0
0 50 100 150 200 250 300
Time [s]Te
mpe
ratu
re [o
C]
Flaw experimental Flawless experimental Flaw numerical Flawless numerical Fig. 4. Decay of temperature in flaw and flawless areas – numerical and
experimental results. We can also observe that the cooling curves for flawed and unflawed points
are separated, at the moment of maximum contrast, by a difference greater than double the estimated uncertainty, and maintain this trend during almost all the cooling process. This fact guarantees that the defect may be identified in a very certain way.
Although existing, the emissivity problem was controlled during the whole measuremet process as well as during image treatment, and this permits to calculate the uncertanty component due to this variable. Associated to this, and very common in thermal analysis applied to works of art diagnostics, the colors effect was also considered in the present work. Although it is not feasible to apply such a procedure in situ, in this study, tests were carried out setting up the thermal camera with a average emissivity value and then using an appropriate emissivity value for each pigment during the phase of image analysis. Anyhow, the temperature difference obtained for the two cases was always lower than the measurement uncertainty.
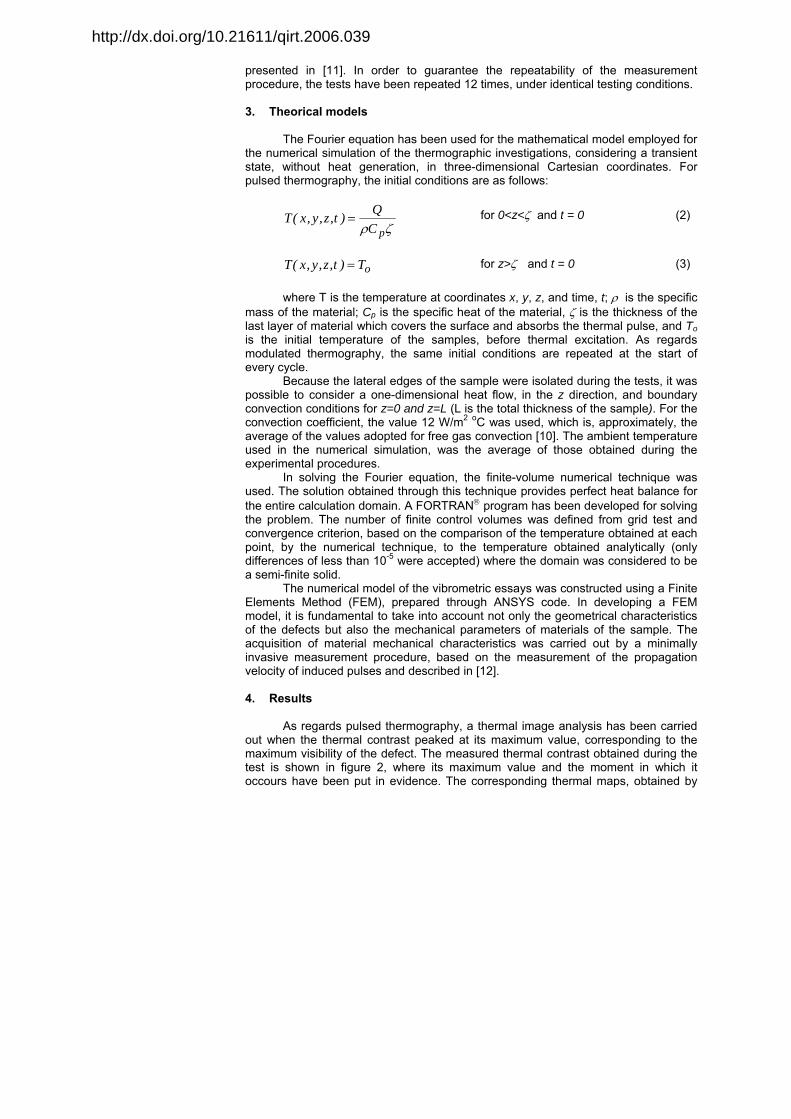
The results obtained by means modulated thermography and treated by means MATLAB program, for the different frequencies employed, can ben seen in figure 5.
The modulated thermography application allowed, beyond the defect identification, to foresee its depth, correlating the frequency of excitement and the intonaco thermal difusivity with the thermal diffusion length. At the frequency of 0.037 Hz, the defect started to be identifiable, since the temperature difference between the area with and without defect was in the order of 2.6°C, while the measurement uncertainty does not exceed ±1.06°C. The decay of the thermal contrast value began at excitation frequencies close to 0.006 Hz. It means that the length of the thermal diffusion started to present values greater than the imperfection depth. These data sets permitted to estimate the depth of the defect at 3.3 mm from the surface and with an approximate air layer thickness of 2.4 mm, and these values compare well with those previously estimated [12] of 2.5 and 2.5 mm respectively by using the LDV/FEM approach.
http://dx.doi.org/10.21611/qirt.2006.039
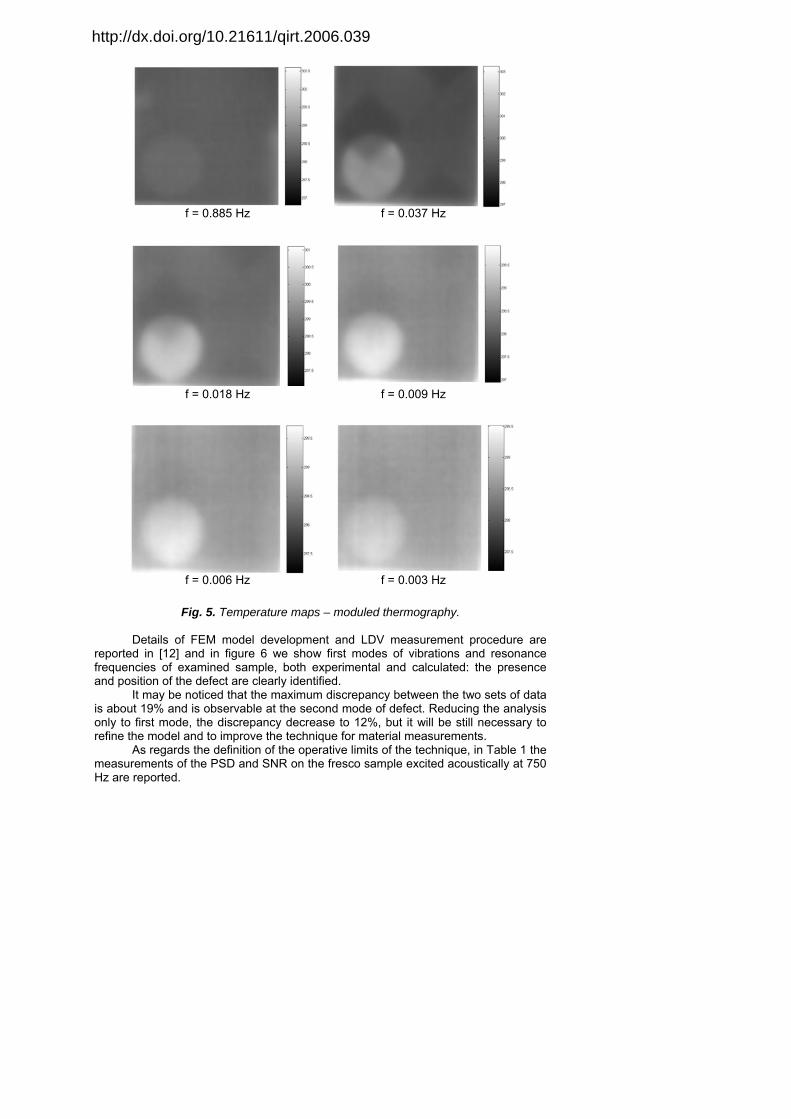
Fig. 5. Temperature maps – moduled thermography. Details of FEM model development and LDV measurement procedure are
reported in [12] and in figure 6 we show first modes of vibrations and resonance frequencies of examined sample, both experimental and calculated: the presence and position of the defect are clearly identified.
It may be noticed that the maximum discrepancy between the two sets of data is about 19% and is observable at the second mode of defect. Reducing the analysis only to first mode, the discrepancy decrease to 12%, but it will be still necessary to refine the model and to improve the technique for material measurements.
As regards the definition of the operative limits of the technique, in Table 1 the measurements of the PSD and SNR on the fresco sample excited acoustically at 750 Hz are reported.
f = 0.885 Hz f = 0.037 Hz
f = 0.018 Hz f = 0.009 Hz
f = 0.006 Hz f = 0.003 Hz
http://dx.doi.org/10.21611/qirt.2006.039

Average values for PSD of 0.443 μm/s/Hz1/2 for non defected area and 0.183 μm/s/Hz1/2 for defected area, with a best value of 0.16 μm/s/Hz1/2 on red and white pigments have been measured. SNR best result has been of 28.23 dB, as measured on a red painted defected area. It can be also observed that defect presence lowers noise contribution, as can be seen in figure 7, where the PSD for two different measurements on the same red area is reported. The evaluation of the PSD is quite important to foresee the possibility of making LDV measurement on a fresco, because it allows setting the noise floor as a function of the fresco pigments. Measured velocity values in the vicinity or even under this threshold would alert the operator not to continue its tests.
a) First defect mode, f=1051 Hz
b) Second defect mode, f=2168 Hz
c) First defect mode, f=925 Hz
d) Second defect mode, f=1750 Hz
Fig. 6. Comparison of simulated (a, b) and measured modes (c, d) of sample.
Table 1. PSD and SNR values for frescoe sample
Colour PSD
(μm/s/Hz1/2) No defect
PSD (μm/s/Hz1/2)
Defect SNR (dB) No defect
SNR (dB) Defect
Red 0.66 0.16 -9.73 28.23 White 0.28 0.16 -1.34 25.82 Ochre 0.39 0.23 -6.28 25.01
Average value 0.443 0.183 3M 0.02 0.06 19.00 36.14
5. Conclusions The aim of this work has been to present a comparative study between the
LDV and IRT to fault detection in frescoes. With this goal experimental testing and mathematical models were implemented. For both techniques operational limits have been explored.
http://dx.doi.org/10.21611/qirt.2006.039
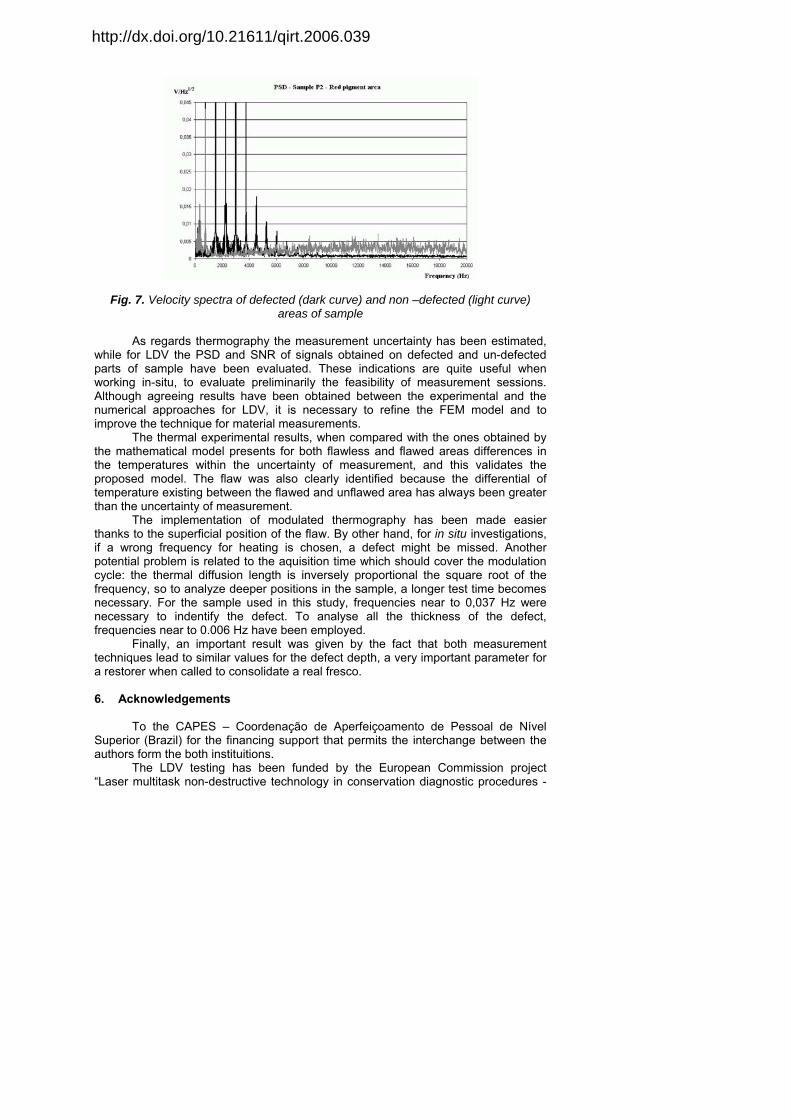
Fig. 7. Velocity spectra of defected (dark curve) and non –defected (light curve) areas of sample
As regards thermography the measurement uncertainty has been estimated,
while for LDV the PSD and SNR of signals obtained on defected and un-defected parts of sample have been evaluated. These indications are quite useful when working in-situ, to evaluate preliminarily the feasibility of measurement sessions. Although agreeing results have been obtained between the experimental and the numerical approaches for LDV, it is necessary to refine the FEM model and to improve the technique for material measurements.
The thermal experimental results, when compared with the ones obtained by the mathematical model presents for both flawless and flawed areas differences in the temperatures within the uncertainty of measurement, and this validates the proposed model. The flaw was also clearly identified because the differential of temperature existing between the flawed and unflawed area has always been greater than the uncertainty of measurement.
The implementation of modulated thermography has been made easier thanks to the superficial position of the flaw. By other hand, for in situ investigations, if a wrong frequency for heating is chosen, a defect might be missed. Another potential problem is related to the aquisition time which should cover the modulation cycle: the thermal diffusion length is inversely proportional the square root of the frequency, so to analyze deeper positions in the sample, a longer test time becomes necessary. For the sample used in this study, frequencies near to 0,037 Hz were necessary to indentify the defect. To analyse all the thickness of the defect, frequencies near to 0.006 Hz have been employed.
Finally, an important result was given by the fact that both measurement techniques lead to similar values for the defect depth, a very important parameter for a restorer when called to consolidate a real fresco.
6. Acknowledgements
To the CAPES – Coordenação de Aperfeiçoamento de Pessoal de Nível
Superior (Brazil) for the financing support that permits the interchange between the authors form the both instituitions.
The LDV testing has been funded by the European Commission project “Laser multitask non-destructive technology in conservation diagnostic procedures -
http://dx.doi.org/10.21611/qirt.2006.039

Laseract”, contract EVK4-CT-2002-00096, Energy, Environment And Sustainable Development - EESD programme of the Research DG.
For the preparation of samples we thank a lot Eudald Guillamet, professional restorer, and Marcel Stefanaggi, from the Laboratoire de Recherche des Monuments Historiques – LRMH, Paris.
REFERENCES
[1] K. Chrzanowski, J. Fischer and R. Matyszkiel. Testing and evaluation of
thermal cameras for absolute temperature measurement, Journal of Optical Engineering, 39, pp. 2535-254, (2000).
[2] S. G. Tavares, R. M. Andrade. Metodologia de ensaio e análise de incerteza na aplicação da termografia, In: III Congresso Brasileiro de Metrologia, Recife, PE, Brasil, (2003).
[3] S. G. Tavares, A. M. C. Silva, R. M. Andrade. Theorical and experimental study of heat diffusion in structures whit internal flaw. In: 18th International Congress of Mechanical Engineering (2005).
[4] P. Castellini, N. Paone and E. P. Tomasini. The Laser Doppler Vibrometer as an Instrument for Non-Intrusive Diagnostic of Works of Art: Application to Fresco Painting, Optics & Lasers in Engineering, 25, 227-246 (1996).
[5] P. Castellini, E. Esposito, N. Paone and E.P. Tomasini. Non-invasive measurements of damage of frescoes paintings and icon by Laser Scanning Vibrometer: experimental results on artificial samples and real works of art, Measurement, 28(1), 33-45 (2000).
[6] P. Castellini, E. Esposito, V. Legoux, M. Stefanaggi and E. P. Tomasini. On field validation of non-invasive Laser Scanning Vibrometer measurement of damaged frescoes: experiments on large walls artificially aged, Journal of Cultural Heritage, 1, 349-356 (2000).
[7] J. F. Vignola, J. Bucaro, B. Lemon, G. W. Adams, A. J. Kurdila , B. Marchetti, E. Esposito, E. P. Tomasini, H. J. Simpson and B. H. Houston. Locating Faults in Wall Paintings at the US Capitol by Shaker-Based Laser Vibrometry, APT (Association for Preservation Technology ) Bulletin, 26(1), 25-33 (2005).
[8] S. G. Tavares, A. M. C. Silva, R. M. Andrade. Methodology for thermography application in evaluation of defects and non-apparent inclusions in materials. In: 18th International Congress of Mechanical Engineering (2005).
[9] Projeto 02:135.07-001/2 – Desempenho térmico de edificações – Parte 2: Métodos de cálculo da transmitância térmica, da capacidade térmica, do atraso térmico e do fator solar de elementos e componentes de edificações. ABNT – Associação Brasileira de Normas Técnicas (2003)
[10] F. P. Incropera, D. P. DeWitt. Fundamentals of heart and mass transfer. Fifth edidtion, John Wiley & Sons, Inc., New York, (2003).
[11] E. Esposito, P. Castellini and E.P. Tomasini. Laser signal dependence on artworks surface characteristics: a study of frescoes and icons samples, Proceedings of LACONA V, Osnabrueck (D), 15-18 September 2003, Springer-Verlag Berlin Heidelberg ISSN 0930-8989, ISBN 3-540-22996-5, 327-332, (2005).
[12] A. Agnani, E. Esposito and M. Feligiotti, Damage characterisation in artworks by Finite Element Method simulations: an application to delaminations in frescos, Proceedings of 8th International Conference on Non-Destructive Investigations and Microanalysis for the Diagnostics and Conservation of the Cultural and Environmental Heritage – ART 05, Lecce (I), 15 - 19 May 2005, published on CD, ISBN 88-89758-01-5.
http://dx.doi.org/10.21611/qirt.2006.039
Copyright © 2022 FDOKUMEN