Frequency measurements of far infrared laser lines by means of MIM point contact diodes
14
International Journal of Infrared and Millimeter Waves, VoL 15, No. 7, 1994 FREQUENCY MEASUREMENTS OF FAR INFRARED LASER LINES BY MEANS OF MIM POINT CONTACT DIODES 1 G. Careili, 1 N. Ioli, A. Moretti, 1 D. Pereira, 2 and F. Strumia 1 1Dipartimento di Fisica dell'Universit~ Piazza Torricelli 2, 56126 Pisa, Italia 2Instituto de Fisica "Gleb Wataghin" UNICAMP 13.083/970, Campinas, S. P., Brasil Received May 17, 1994 ABSTRACT We present frequency measurements of 85 Far Infrared (FIR) laser lines ranging from 2 748 GHz to 421 GHz. We use the heterodyne technique of mixing FIR laser transitions and microwave radiation on MIM point contact diodes to determine the FIR frequencies. Key words: methanol, Far Infrared laser, frequency measurement 1. Work supported by Consiglio Nazionale delle Ricerche -Italia and INFM (Consorzio Interuniversitario di Fisica della Materia) 1347 O195-9271/94/0700q 347507.00/0 0 1994Plenum Publishing Corporation
-
Upload
independent -
Category
Documents
-
view
1 -
download
0
Transcript of Frequency measurements of far infrared laser lines by means of MIM point contact diodes
International Journal o f Infrared and Millimeter Waves, VoL 15, No. 7, 1994
FREQUENCY MEASUREMENTS OF FAR INFRARED LASER LINES BY MEANS OF MIM POINT CONTACT DIODES 1
G. Careili, 1 N. Ioli, A. Moretti, 1 D. Pereira, 2 and F. Strumia 1
1Dipartimento di Fisica dell'Universit~ Piazza Torricelli 2, 56126 Pisa, Italia
2Instituto de Fisica "Gleb Wataghin" UNICAMP 13.083/970, Campinas, S. P., Brasil
Received May 17, 1994
ABSTRACT
We present frequency measurements of 85 Far Infrared (FIR) laser lines
ranging from 2 748 GHz to 421 GHz. We use the heterodyne technique of
mixing FIR laser transitions and microwave radiation on MIM point contact
diodes to determine the FIR frequencies.
Key words: methanol, Far Infrared laser, frequency measurement
1. Work supported by Consiglio Nazionale delle Ricerche -Italia and INFM
(Consorzio Interuniversitario di Fisica della Materia)
1347
O195-9271/94/0700q 347507.00/0 0 1994 Plenum Publishing Corporation
1348 Careili et al.
1. INTRODUCTION
In optically pumped Far Infrared (FIR) lasers polar molecules are used as
active medium. Monochromatic radiation from an Infrared (IR) laser,
generally a CO2 laser, is focused on a low pressure molecular vapor
contained in a cavity resonator. The absorbed IR radiation excites roto-
vibrational transitions and population inversion is thus obtained between
some of the rotational levels of the excited vibrational manifold. In this
way, stimulated emission of radiation can be observed in correspondence of
the allowed transitions from the excited level. The monochromaticity of the
pump source, and the absence of a plasma in the cavity, with its inherent
fluctuations in the index of refraction, make the optically pumped molecular
lasers very similar in principle to a three level maser oscillator. The gain
curve, at the working pressure, is narrower than the linewidth of the
resonator modes, so that frequency stability can be better than 1 part in 109,
making these devices very interesting for applications in several fields of
high precision physics. Examples can be seen in high resolution atomic and
molecular spectroscopy [1,2]: astrophysics, where FIR molecular lasers are
used as local oscillators for heterodyne detection of atoms and molecules in
interstellar space [3,4]; and metrology, where FIR radiation is used in
optical frequency synthesis chains [5,6]. In this sense, frequency
measurements of FIR laser lines play a fundamental role
In 1986, Inguscio et al. [7] presented a review of frequency measurements
of optically pumped lasers from 0.1 to 8 THz. In that work a list of more
than 800 FIR laser lines frequency measured together with a survey of the
techniques of frequency measurement were presented. Since then a number
of new FIR laser frequency measurements were performed by several
groups. In particular, at Pisa, we have measured over 80 FIR laser
frequencies. The main motivation was to investigate possible candidates to
be used in metrological and astrophysical experiments. The frequencies of
all known FIR laser lines with wavelength close to the metastable triplet
transitions 3P0---~3P 1 of Ca (v = 1 563 630.0 MHz) and Mg (v = 601 277.t
MHz); a n d 3P0--)3P 2 of Ca ( V = 3 174 230.0 MHz) and Mg ( v = 1 220
575.1 MHz), and to the transition 3P2---~3P 1 of N + (v = 2 459 370.3 MHz)
were measured. The first ones are transitions suggested to be used in an

Far Infrared Laser Lines 1349
altemative atomic clock [8], with possibility of higher accuracy, precision
and stability than the Cesium atomic clock [9]. The second is an important
transition in astrophysics studies [4]. We present a brief description of the
technique used to perform the frequency measurements, and a Table of all
FIR laser frequencies, pointing out that several of them were previously
reported in specific works
2. EXPERIMENTAL APPARATUS AND RESULTS
We used a heterodyne technique for the frequency measurements: the FIR
laser radiation to be frequency measured is mixed on a Metal-Insulator-
Metal ( MIM ) point contact diode with one or two FIR laser lines
previously known in frequency and the radiation from a microwave (MW)
source. The beat signal, measured by means of a spectrum analyzer, is used
to determine the unknown frequency v L through the relation
V L = nlVL1 + n2VL2 -+ nMWVMW + ~V 1)
where rE1 and rE2 are the known FIR laser frequencies, vMW the
microwave frequency, 8v the beat frequency and n 1 , n 2 and nMW are
integers that define the mixing order.
The microwave source is an HP 8350B sweeper operating in the region 0-
18 GHz. The signal from the diode is fed into a low noise preamplifier and
then sent to a HP 8355A spectrum analyzer to detect the intermediate
frequency.
The scheme of the experimental apparatus is shown in figure 1. We used
three different CO 2 pump lasers [10] and three FIR resonators [11], so that
we could choose the proper couples according to the requirements on the
line to be measured (pump power, pump offset, FIR wavelengths, etc.).
The first of the three CO 2 lasers is 300 MHz tunable in single line single
mode operation, and delivers an output cw power larger than I0 W on
many lines. The second is 200 MHz tunable with an output power of more
than 15 W and the third one is 150 MHz tunable with an output power
larger than 25 W on the strongest lines. All of them can work either in cw
or in synchronized long pulse regime, the latter being obtained by

1350 Careili et aL
electronically chopping the discharge current. In this mode of operation we
obtain pulses from 30 to 100 gs in duration with a repetition rate between 500 and 1000 Hz and peak powers in the range 50-300 W. An acoustooptic
modulator was also used in some cases to get an extension up to 480 MHz of the tuning range of the shortest CO 2 laser [12].
I ii
I Acoustooptic Modulator
4 \
Frequency lJ Counter I
4
I, synShW 'zer I Microwave
Source
){OpenResonator-~-] FIR Laser N~J_.]
>1 1 Waveguide FIR Lasers
-1 ..... I Figure 1- Experimental apparatus
Spectrum I Analyzer 4
0-6 GHz I Preamplifier
MIM Diode
/ ,7
/ ) /
!
2
As FIR resonators we used an open structure nearly confocal Fabry Perot
resonator and two waveguide resonators. A good stability in power as well
as in frequency, is achieved by using a thermally compensated frame. The
Fabry Perot resonator is a 100 cm pyrex cylinder terminated by two gold
coated copper mirrors of 115 cm curvature radius. The FIR power is
coupled out, through a silicon window, using an elliptical mirror obtained
by cutting at 45* a 6 mm diameter copper rode. This mirror can be moved
perpendicularly to the cavity axis, to optimize the output coupling at the

Far Infrared Laser Lines 1351
different wavelengths. The waveguide FIR resonators are pyrex tubes
terminated by plane copper mirrors. The guides are 150 cm long 40 mm
inside diameter and 134 cm long 35 mm i.d. respectively. The mirrors are
supported on a X-Y mount to carefully align the lasers. The CO 2 pump
radiation is coupled to the FIR cavity by a 2 mm axial hole in the input
mirror, while the FIR radiation is coupled out by an off-axis hole, whose
diameter lies in the range 2 - 12 ram, in the output mirror.
The FIR outputs were focused on the mixer diode together with the
microwave radiation. The signal to noise ratio of the beat note was in the
range 10 - 45 dB, depending on the power intensity of the two lines used
and on the order of the harmonic of the MW power. The values of the
frequency of the MW radiation and of the beat note were measured by
means of an HP5343A frequency counter. A good signal to noise ratio is
obtained when the power of the laser line is of the order of some 10 t.tW, at
least, and the MW power slightly saturates the diode. Since we can use few
mW of microwave radiation to saturate the mixer and to obtain a good S/-N
ratio, most of the lines can be measured using an harmonic of the MW.
This is the point that makes this technique very powerful: by using high
order mixing it is possible to measure laser lines tip to 80 GHz apart from
the reference one, making it possible to cover entirely the FIR region.
The value of n 1, n 2, nMw and the + or - sign in equation 1) are determined
experimentally by tuning the FIR laser cavities and the microwave
frequency, in order to get a small shift in the beat note on the spectrum
analyzer.
The lines to be measured were selected from different molecules among
those laser lines whose wavelengths were known to be close to those of
interest. Table I resumes all of our frequency measurements ordered by
increasing wavelength. Columns from 2 to 6 refer to spectroscopic data of
the line to be frequency measured: the second column gives the wavelength,
the third the laser active molecule, the fourth the CO 2 pump line, the fifth
the polarization of the FIR laser line with respect to that of the CO 2 laser,
while the sixth column gives the IR absorption offset relative to the CO 2
laser frequency center measured using the Transferred Lamb Dip technique
[15]. This revealed to be an easy and powerful technique to distinguish
between laser lines of similar frequency from the same pump line. As an

1352 C a r e l l l et al.
example we describe the case of some transitions pumped by the 10R(10)
CO 2 laser line: from the literature two lines of wavelength of 191 gm were known to be pumped by this line and the frequency of one of them had
already been measured. We found that there are three different lines with
very close frequencies but different offsets, at -35 MHz, +45 MHz and
+100 MHz respectively, showing that it is not necessary to perform
frequency measurements to identify them, owing to their different offsets
(see figure-2).
a)
- - - " - - - ' - ' - - - - C )
d)
Fig. 2 - FIR laser lines around 191 gm and pumped by the C O 2
10R10 line: a) CO 2 output power, frequency tuning 300 MHz, b)
FIR laser at 1570160.8 MHz, c) FIR laser at 1564518.7 MHz, d)
FIR laser at 1563897.5 MHz,
Columns seven, eight and nine report data relative to the reference lines: the
seventh gives the laser active molecule, the eighth the CO 2 pump line and
the ninth the frequency. Finally the last column gives the result of the
frequency measurement, The accuracy of the measurements is affected by

Far Infrared Laser Lines 1353
the uncertainty in the setting of the FIR laser cavities at the centre of the
molecular gain width and by the uncertainty in the frequencies of the
reference lines[13]. When each FIR laser is accurately tuned to the
maximum of the FIR output power, the total error of the frequency
measurement lies in the range 0.5 to 1.5 MHz, depending on the laser lines
characteristics.
To check the accuracy of our method we remeasured the frequency of
several FIR laser lines previously determined by other methods [7]. The
well known 118.8 ~m line from CH3OH optically pumped by 9P(36) CO 2
laser line was used to demonstrate the extension of our heterodyne
technique to three FIR laser lines. In a first measurement (number 4 of
Table I), the t 18.8 ~m line was heterodyned with the second harmonic of
the 238.5 I-tm line of 13CH3OH ( 9P12 pump) plus a microwave radiation
of 8 GHz.The beat frequency was at 1 038.8 MHz. Using the known value
of 1 256 871.8 MHz [7] for the frequency of the reference line we get for
the 118.8 I.tm line the value of 2 522 782.4 MHz. The second measurement
(number 5 of Table I) was performed heterodyning the 118.8 ~m line with
the 184.7 t.tm line of CD3OD ( 10R24 pump) plus the 13CD3OH line at
333.3 I.tm ( 10P16 pump). The beat frequency is at 655.47 MHz. Using for
the frequencies of the reference lines the measured values 1 622 555.2 and
899 571.7 MHz 117] we get for the 118.8 ~m line the value of 2 522 782.4
MHz : both measurements are in good agreement with the value of 2 522
782.567 MHz obtained by Tunable FIR Spectroscopy[14].
Comparing the known frequency values of the Ca and Mg triplet metastable
transitions with the frequency values of table I we can see that the lines
closest to those of interest are at minimum 300 MHz apart, a difference too
large for metrological purposes to excite directly the atomic transition, but
suitable to be covered by a sideband modulator. On the other hand with
respect to the N + transition, we have FIR laser lines that can be used as
local oscillator in heterodyne experiments.
3 CONCLUSIONS
We used the heterodyne technique to measure the frequency of 85 FIR laser
lines. Three waveguide CO 2 laser were used to pump three FIR laser

Tab
le I
LIN
E T
O B
E M
EA
SUR
ED
W
avel
engt
h M
olec
ule
Pum
p R
el.
Off
set
(gm
) L
ine
Pol.
(MH
z)
RE
FE
RE
NC
E L
INE
M
olec
ule
Pu
mp
Fr
eque
ncy
Lin
e (M
Hz)
ME
AS
UR
ED
F
RE
QU
EN
CY
(M
Hz)
1 10
9,07
C
H31
8OH
10
R04
//
68
2 11
4,80
D
2180
10
R10
_1
_ -1
65
3 1
18
,55
13
CD
3OH
9R
14
//
-20
4 1
18
,83
C
H3O
H
9P36
_1
_ 24
5
11
8,8
3
CH
3OH
9P
36
_1_
24
6 1
19
,01
~
3CD
3OH
10
P42
]]
5 7
119,
82
CH
318O
H
9P26
//
10
8
122,
30
CD
3OD
10
R28
3_
-5
5 9
122,
40
13C
H3O
H
9P20
//
-1
15
10
122,
88
13C
H3O
H
10R
30 /
/ -1
40
1 1
123,
86
CH
318O
H
9P30
//
60
12
124,
25
13C
D3O
H
10P
24 /
/ 21
13
12
9,41
C
H20
10
R18
_1
_ 20
14
13
2,11
13
CH
2F2
9R28
//
11
7
CH
2F 2
9P24
2.
742.
946,
0 13
CH
3OH
1
0R
16
2.
588.
361,
7 C
H3O
H
9P36
2.
522.
782,
6 13
CH
3OH
9P
12
1.25
6.87
1,8
13C
D3O
H
10
P1
6
899.
571,
7 C
D3O
D
10R
24
+1.6
22.5
55,2
C
H3O
H
9P36
2.
522.
782,
6 C
H3O
H
9P36
2.
522.
782,
6 C
H2F
2 9R
22
2.44
7.96
8,5
CD
3OD
10
R28
2.
451.
203,
1 C
D3O
D
10R
28
2.45
1.20
3,1
CH
2DO
H
10P
34
2.40
9.29
3,3
CH
2DO
H
10P
34
2.40
9.29
3,5
CH
3OH
10
R34
2.
314.
111,
3 C
D3O
H
10R
32
2.27
8.70
3,0
2.74
8.49
9,8
2.61
1.41
8,5
2.52
8.77
3,8
2.52
2.78
2,4
2.52
2.78
2,4
2.51
9.12
2,0
2.50
2.06
5,3
2.45
1.20
2,3
2.44
9.24
5,9
2.43
9.62
3,2
2.42
0.34
1,6
2.41
2.75
7,4
N 2
.316
.525
,9
2.26
9.19
7,5
m

15
16
17
18
19
20
21
22
23
24
25
26
27
28
29
30
31
32
33
34
145,
12
151,
55
153,
54
157,
20
162,
40
176,
37
182,
11
182.
12
188,
97
189,
94
189,
94
189,
94
190,
93
190,
93
190,
99
191,
68
191,
68
191,
70
205,
14
205,
76
Tab
le I
(C
ont.)
CH
3OH
C
H31
8OH
C
H31
8OH
13
CD
3OH
C
H3a
SOH
C
H31
8OH
C
H31
8OH
C
HzF
2 C
D3O
D
CH
3OH
C
H3O
H
CH
3OH
C
H3O
H
CH
3OH
C
H31
8OH
C
H3O
H
CH
3OH
C
H3O
H
CH
3OH
C
H3O
H
10R
20
9P22
9P
36
10R
40
9P38
10
R04
9P
I4
9R32
10
R20
9R
10
9R10
9R
10
10R
10
10R
10
9P42
9R
16
9R16
10
R10
9P
18
9P34
# 2.
// _L
L
± # l # // // // # // // # // # // ±
147
13C
H3O
H
9P10
17
C
H2
DO
H
10R
34
-60
13C
H3O
H
9P12
13
2 13
CH
3OH
9P
12
-20
CH
3OH
10
R38
68
]3
CD
3OD
10
R20
70
C
H2D
OH
9P
10
5 C
H2F
2 9R
32
74
CD
3OH
10
P42
-140
C
H3O
H
10R
10
-140
C
H3O
H
10R
10
-140
C
H3O
H
10R
10
100
CH
2F 2
9P22
10
0 C
H3O
H
10R
10
-72
CH
3OH
10
R10
-8
C
H3O
H
10R
10
-8
CH
3OH
10
R10
-3
5 C
H3O
H
10R
10
163
13C
H3O
H
10R
16
125
13C
H3O
H
10R
16
2.05
2.00
4,1
1.98
7.79
8,9
1.89
8.27
9,9
1.89
8.27
9,9
1.83
8.83
9,3
1.72
6.54
8,5
1.63
2.66
6,9
1.62
6.60
2,6
1.59
1.05
3,2
1.56
4.51
8,7
1.56
3.89
7,5
1.56
4.51
8,7
1.56
2.65
5,9
1.56
4.51
8,7
1.56
4.51
8,7
1.56
4.51
8,7
1.56
3.89
7,5
1.56
4.51
8,7
1.47
2.19
9,3
1.47
2.19
9,3
2.06
5.85
9,4
1.97
8.12
9,4
1.95
2.51
5,3
1.90
7.05
7,8
1.84
6.02
0,5
1.69
9.74
7,1
1.64
6.20
5,8
1.64
6.19
6,6
1.58
6.45
5,2
1.57
8.33
9,6
1.57
8.33
9,4
1.57
8.33
9,6
1.57
0.16
1,2
1.57
0.16
0,3
1.56
9.69
2,5
1.56
4.05
4,7
1.56
4.05
3,6
1.56
3.89
7,5
1.46
1.37
8,7
1.45
7.00
3,7
Q, r

Tab
le I
(C
ont.)
C~
U
rl
35
205,
76
36
205,
96
37
205,
96
38
208,
27
39
208,
27
40
210,
31
41
216,
36
42
218,
56
43
219,
80
44
220,
69
45
221,
86
46
227,
66
47
227,
88
48
232,
79
49
242,
26
50
243,
10
51
243,
38
52
243,
85
53
244,
38
CH
3OH
C
H31
8OH
C
H31
8OH
C
H3O
H
CH
3OH
C
D3O
D
13C
D3O
H
CH
318O
H
CH
318O
H
CH
318O
H
CH
318O
H
13C
H2F
2 13
CD
3OH
C
H3O
H
CH
318O
H
CH
3NH
2 C
D3C
1 C
D20
C
D20
9P34
±
9P
20
H
9P20
ff
9P
34
±
9P34
±
10
P18
# 10
P24
±
9P30
±
10
R20
ff
9P
26
±
9P30
±
9P
18
±
10P2
4 #
9R22
ff
9P
22
ff
10P1
2 ff
9P
32
±
9R24
H
10
P16
±
125 60
60
125
125
-51 21
60
21
10
-15 27
99
15
17
45
30
-80
13C
H3O
H
13C
H3O
H
CH
2DO
H
13C
H3O
H
13C
H3O
H
CH
3OH
C
H3O
D
CH
2DO
H
CH
2DO
H
CH
2DO
H
CH
2DO
H
CD
3OD
CD3OD
CH3O
H CH
3OH
CH3O
H CH
3OH
CH3O
H CH
3OH
10R
16
10R
16
9P14
10
R16
10
R16
10
R04
9R
14
9R24
9R
24
9R24
9R
24
10R
10
10R
10
9R10
10
R32
10
R32
10
R32
10
R32
10
R32
1.47
2.19
9,3
1.47
2.19
9,4
1.45
0.46
3,1
1.47
2.19
9,3
1.47
2.19
9,3
1.41
9.04
9,3
1.39
1.97
2,1
1.36
8.31
5,4
1.36
8.31
5,4
1.36
8.31
5,4
1.36
8.31
5,4
1.31
6.83
8,7
1.31
6.83
8,7
1.28
6.99
9,5
1.23
4.49
0,4
1.23
4.49
0,4
1.23
4.49
0,4
1.23
4.49
0,4
1.23
4.49
0,4
1.45
7.00
0,0
1.45
5.57
5,6
1.45
5.57
5,5
1.43
9.42
2,8
1.43
9.41
9,6
1.42
5.47
3,6
1.38
5.64
5,7
1.37
1.65
5,8
1.36
3.92
5,4
1.35
8.43
8,0
1.35
1.28
9,6
1.31
6.86
0,7
1.31
5.59
4,8
1.28
7.83
2,0
1.23
7.50
4,5
1.23
3.19
4,4
1.23
1.78
0,6
1.22
9.42
1,4
1.22
6.76
0,1
_=

54
244,
38
5 5
245,
06
5 6
246,
33
5 7
246,
46
58
251,
58
5 9
253,
72
60
262,
21
6 1
262,
21
6 2
275,
57
63
280,
18
64
280,
28
65
2813
9 66
28
4.76
67
28
5 27
68
29
091
69
297
63
70
2994
8 71
31
562
72
316.
19
73
327
28
Tab
le I
(C
ont.)
CD
20
CH
3Br
CD
20
CD
3C1
CH
318O
H
CD
3OH
C
H31
8OH
C
H31
8OH
C
H31
8OH
C
H31
8OH
13
CD
3OH
13
CD
3OH
C
H31
8OH
C
H31
8OH
13
CD
3OH
C
D3O
H
13C
H2F
2 13
CH
2F2
13C
D3O
H
13C
D3O
H
10P1
6 _1
_ 9P
28
//
10P2
6 .1_
10
R14
//
9P32
_1
_ 10
R36
/_
9P
26
// 9P
26
# 10
R20
//
9P
38
//
10P2
4 //
10R
08
// 9P
30
//
10R
04
//
10P2
4 //
10R
34
//
9P18
//
9P
20
//
10R
26
//
10R
10
//
-8O
160
-34 90
18
10
10
-30
-20 99
40
6O
68
21
-17 27
4 -2
5 40
CD
3OD
C
H3O
H
CD
20
CH
3OH
C
D3O
H
13C
D3O
H
CH
2F2
CD
20
CD
20
CD
20
CD
20
CD
20
CD
20
CH
2F2
CH
2F 2
CH
2DO
H
CD
3OD
C
D3O
D
CD
3OD
D
CO
OH
10R
28
10R
32
10P1
6 10
R32
IO
R36
10
P08
9P38
10
P08
10P0
8 10
P08
10P0
8 10
P08
10P0
8 9P
24
9R34
10
R34
10
R24
10
R10
10
R10
10
P22
2.45
1.20
3,1
1.23
4.49
0,4
1.22
6.76
0,1
1.23
4.49
0,4
1.18
1.58
9,8
2.36
0.17
4,8
1.14
5.43
0,1
1.07
6.84
2,8
1.07
6.84
2,8
1.07
6.84
2,8
1.07
6.84
2,8
1.07
6.84
2,8
1.07
6.84
2,8
1.03
6.84
4,8
1.04
2.15
0,4
1.01
4.04
7,7
1.00
3.53
6,6
952.
203,
9 95
2.20
3,9
912.
729,
7
1.22
6.76
0,1
1.22
3.31
8,2
1.21
7.03
7,9
1.21
6.39
4,8
1.19
1.64
5,7
1.18
1.58
9,1
1.14
3.32
8,7
1.14
3.32
7,9
1.08
7.88
6,7
1.06
9.99
7,6
1.06
9.61
4,9
1.06
5.40
7,3
1.05
2.80
8,2
1.05
0.90
7,4
1.03
0.53
5,6
N 1
.007
.272
,6
1.00
1.05
4,0
949.
857,
4 94
8.14
1,4
916.
009,
9
o.
,-t i"
C,

Tab
le I
(C
ont.)
tJI
74
75
76
77
78
79
80
81
82
83
84
85
86
87
3282
1 33
2 75
33
7.77
34
3.00
34
3.25
34
5.98
36
113
3636
3 36
3.75
41
9.39
45
419
4960
7 49
615
711,
20
13C
H2F
2 13
CH
2F2
CH
2F2
CD
3OD
C
D3O
D
CD
3OD
C
D3O
D
CH
318O
H
CH
318O
H
13C
D3O
H
CD
3OD
C
H3F
(K=
I)
CH
3F (K
=3)
13C
D3O
H
9P20
9P
38
9R14
10
P18
10R
22
10Pl
0 10
R22
10
R20
10
R20
9P
32
10R
10
9P20
9P
20
9P32
// _1_ // // i
i
i //
//
//
//
i
i
i
-120
11
8 98
-51
-62
-92
-62
-30 21
77
72
-58
208 77
DC
OO
H
DC
OO
H
13C
H3O
H
CD
3OD
C
D3O
D
CD
3OD
C
D20
C
D20
CD
zO
HC
OO
H
HC
OO
H
CH
3F (K
=2)
CH
3F (K
=2)
DC
OO
H
10P2
2 10
P22
9P22
10
R04
10
R04
10
R04
10
P28
10P2
8 10
P28
9R22
9R
38
9P20
9P
20
10R
34
912.
729,
7 91
2.72
9,7
884.
438,
0 86
9.52
2,7
869.
522,
7 86
9.52
2,7
822.
512,
2 82
2.51
2,2
822.
512,
2 71
6.15
6,8
653.
821,
4 60
4.29
7,3
604.
297,
3 42
1.53
2,0
913.
423,
3 90
0.94
6,2
887.
551,
1 87
4.02
8,7
873.
396,
1 86
6.50
0,2
830.
156,
8 82
4.43
3,6
824.
181,
2 71
4.82
4,2
660.
053,
6 60
4.33
4,6
604.
236,
8 42
1.53
2,0
Far Infrared Laser Lines 1359
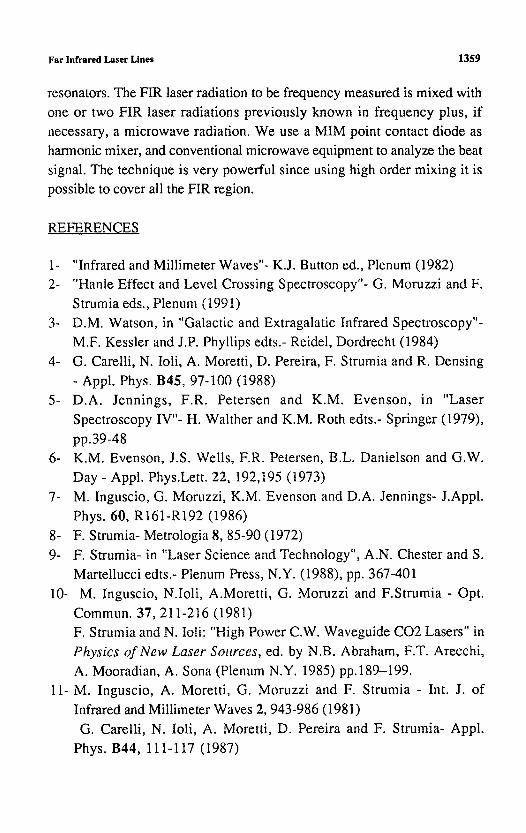
resonators. The FIR laser radiation to be frequency measured is mixed with one or two FIR laser radiations previously known in frequency plus, if necessary, a microwave radiation. We use a MIM point contact diode as harmonic mixer, and conventional microwave equipment to analyze the beat signal. The technique is very powerful since using high order mixing it is possible to cover all the FIR region.
REFERENCES
1- "Infrared and Millimeter Waves"- K.J. Button ed., Plenum (1982) 2- "Hanle Effect and Level Crossing Spectroscopy"- G. Moruzzi and F.
Strumia eds., Plenum (1991) 3- D.M. Watson, in "Galactic and Extragalatic Infrared Spectroscopy"-
M.F. Kessler and J.P. Phyllips edts.- Reidel, Dordrecht (1984) 4- G. Carelli, N. Ioli, A. Moretti, D. Pereira, F. Strumia and R. Densing
- Appl. Phys. B45, 97-100 (1988) 5- D.A. Jennings, F.R. Petersen and K.M. Evenson, in "Laser
Spectroscopy IV"- H. Walther and K.M. Roth edts.- Springer (1979),
pp.39-48 6- K.M. Evenson, J.S. Wells, F.R. Petersen, B.L. Danielson and G.W.
Day - Appl. Phys.Lett. 22, 192,195 (1973) 7- M. Inguscio, G. Moruzzi, K.M. Evenson and D.A. Jennings- J.Appl.
Phys. 60, R161-R192 (1986) 8- F. Strumia- Metrologia 8, 85-90 (1972) 9- F. Strumia- in "Laser Science and Technology", A.N. Chester and S.
Martellucci edts.- Plenum Press, N.Y. (1988), pp. 367-401 10- M. Inguscio, N.Ioli, A.Moretti, G. Moruzzi and F.Strumia - Opt.
Commun. 37,211-216 (1981) F. Strumia and N. loli: "High Power C.W. Waveguide CO2 Lasers" in Physics of New Laser Sources, ed. by N.B. Abraham, F.T. Arecchi, A. Mooradian, A. Sona (Plenum N.Y. 1985) pp.189-199.
1 1 - M. Inguscio, A. Moretti, G. Moruzzi and F. Strumia - Int. J. of
Infrared and Millimeter Waves 2, 943-986 (1981) G. Carelli, N. Ioli, A. Moretti, D. Pereira and F. Strumia- Appl.
Phys. B44, 111-117 (1987)

1360 Carelli et al.
12- G. Carelli, N. Ioli, A. Moretti, G. Moruzzi, D. Pereira and F. Strumia-
Int. J. of Infrared and Millimeter Waves 12, 449-471 (1991)
13- M. Inguscio, N. Ioli, A. Moretti, F. Strumia and F. D'Amato: Appl.
Phys. B40, 165-169 (1986)
14- K.M. Evenson, D.A. Jennings, L.R. Zink and M. Inguscio-Proc. of
the l l th Int. Conf. on Infrared and Millimeter Waves - Pisa (1986),
G.Moruzzi edt. 98-100
15- M. Inguscio, A. Moretti and F. Strumia - Opt. Commun. 30, 355-360
(1979)